Acoustic Noise and Magnetic Resonance Imaging
10
REVIEW ARTICLE Acoustic Noise and Magnetic Resonance Imaging: A Narrative/Descriptive Review Mark J. McJury, PhD * Abstract Magnetic resonance imaging generates unwanted acoustic noise. This review describes the work characterizing the acous- tic noise, and the various solutions to control and attenuate the acoustic noise. There are also discussions about the per- missible limits, and guidance regarding acoustic noise exposure for staff, patients, and volunteers. Level of Evidence: 5 Technical Efficacy Stage: 1 J. MAGN. RESON. IMAGING 2022;55:337–346. Introduction Most imaging procedures on an MR scanner generate unwanted acoustic noise. At low levels, this can generate annoyance, heightened anxiety in patients, and interfere with communication between staff and patients. At high levels, this becomes a more significant issue. Loud MR acoustic noise can affect successful scan rates, and can also become a safety hazard, requiring control and attenuation measures, to avoid potential hearting damage. 1–9 This haz- ard is particularly concerning for specific vulnerable patient groups, such as anesthetized patients, those on certain phar- maceutical drugs or with tinnitus, neonates, and pregnant women. 2–4 The control of MR-related acoustic noise has generated a considerable body of research to characterize the acoustic noise, and a large variety of methods to attenuate and control the acoustic noise levels. Methods include the use of passive ear protection, sequence optimization, antiphase noise, and gradient hardware redesign and retrofitting. This review (an update of an earlier work 10 ) gives a thor- ough overview covering all aspects of MR-related acoustic noise, permissible limits, and control solutions. Interested readers can find our more detailed and comprehensive review here. 11 Hearing and Acoustic Noise Simplistically, we can think of the ear as a wide-band receiver. It can detect sound intensities over a massive range (10 12 and over frequencies which vary by a factor of 10 3 )—approx. 20 Hz to 20 kHz for normal hearing. In comparison, the eye only detects light frequencies that vary by a factor of 2. Our hearing involves a mechanical system (which stim- ulates hairs in the cochlea), sensors that produce action potentials in the auditory nerves, and the auditory cortex (the brain region which decodes signals from the auditory nerves). The ear is not uniformly sensitive over the hearing range (see Fig. 1)—peak sensitivity is in the range of 2–5 kHz. 12 Sensitivity is also age dependent. Typically, as you age the highest frequency you can hear will decrease, and the sound level needed to hear it will increase. Hearing will also deteriorate more quickly if subjected to continuous loud sounds. The loudness of a sound is a mental response to the physical intensity of the sound. Loudness is approximately proportional to the log of intensity, which compresses the wide range of intensities the ear detects. Loudness also depends strongly on frequency. This log relationship leads to the use of the decibel scale, dB, when dealing with sound View this article online at wileyonlinelibrary.com. DOI: 10.1002/jmri.27525 Received Nov 11, 2020, Accepted for publication Jan 8, 2021. *Address reprint requests to: M.J.M., 1345 Govan Road, Glasgow G51 4TF, UK. Email: [email protected] From the Department of Clinical Physics & Bio-Engineering, Level 2, Imaging Centre of Excellence, Queen Elizabeth University Hospital Campus, Glasgow, UK This is an open access article under the terms of the Creative Commons Attribution-NonCommercial License, which permits use, distribution and reproduction in any medium, provided the original work is properly cited and is not used for commercial purposes. © 2021 The Author. Journal of Magnetic Resonance Imaging published by Wiley Periodicals LLC. on behalf of International Society for Magnetic Resonance in Medicine. 337
-
Upload
khangminh22 -
Category
Documents
-
view
0 -
download
0
Transcript of Acoustic Noise and Magnetic Resonance Imaging

REVIEW ARTICLE
Acoustic Noise and Magnetic ResonanceImaging: A Narrative/Descriptive Review
Mark J. McJury, PhD*
AbstractMagnetic resonance imaging generates unwanted acoustic noise. This review describes the work characterizing the acous-tic noise, and the various solutions to control and attenuate the acoustic noise. There are also discussions about the per-missible limits, and guidance regarding acoustic noise exposure for staff, patients, and volunteers.Level of Evidence: 5Technical Efficacy Stage: 1
J. MAGN. RESON. IMAGING 2022;55:337–346.
IntroductionMost imaging procedures on an MR scanner generateunwanted acoustic noise. At low levels, this can generateannoyance, heightened anxiety in patients, and interferewith communication between staff and patients. At highlevels, this becomes a more significant issue. Loud MRacoustic noise can affect successful scan rates, and can alsobecome a safety hazard, requiring control and attenuationmeasures, to avoid potential hearting damage.1–9 This haz-ard is particularly concerning for specific vulnerable patientgroups, such as anesthetized patients, those on certain phar-maceutical drugs or with tinnitus, neonates, and pregnantwomen.2–4
The control of MR-related acoustic noise has generateda considerable body of research to characterize the acousticnoise, and a large variety of methods to attenuate and controlthe acoustic noise levels. Methods include the use of passiveear protection, sequence optimization, antiphase noise, andgradient hardware redesign and retrofitting.
This review (an update of an earlier work10) gives a thor-ough overview covering all aspects of MR-related acoustic noise,permissible limits, and control solutions. Interested readers canfind our more detailed and comprehensive review here.11
Hearing and Acoustic NoiseSimplistically, we can think of the ear as a wide-band receiver.It can detect sound intensities over a massive range (�1012
and over frequencies which vary by a factor of 103)—approx.20 Hz to 20 kHz for normal hearing. In comparison, the eyeonly detects light frequencies that vary by a factor of 2.
Our hearing involves a mechanical system (which stim-ulates hairs in the cochlea), sensors that produce actionpotentials in the auditory nerves, and the auditory cortex (thebrain region which decodes signals from the auditory nerves).
The ear is not uniformly sensitive over the hearingrange (see Fig. 1)—peak sensitivity is in the range of2–5 kHz.12 Sensitivity is also age dependent. Typically, asyou age the highest frequency you can hear will decrease, andthe sound level needed to hear it will increase. Hearing willalso deteriorate more quickly if subjected to continuous loudsounds.
The loudness of a sound is a mental response to thephysical intensity of the sound. Loudness is approximatelyproportional to the log of intensity, which compresses thewide range of intensities the ear detects. Loudness alsodepends strongly on frequency. This log relationship leads tothe use of the decibel scale, dB, when dealing with sound
View this article online at wileyonlinelibrary.com. DOI: 10.1002/jmri.27525
Received Nov 11, 2020, Accepted for publication Jan 8, 2021.
*Address reprint requests to: M.J.M., 1345 Govan Road, Glasgow G51 4TF, UK.Email: [email protected]
From the Department of Clinical Physics & Bio-Engineering, Level 2, Imaging Centre of Excellence, Queen Elizabeth University Hospital Campus, Glasgow, UK
This is an open access article under the terms of the Creative Commons Attribution-NonCommercial License, which permits use, distribution and reproductionin any medium, provided the original work is properly cited and is not used for commercial purposes.
© 2021 The Author. Journal of Magnetic Resonance Imaging published by Wiley Periodicals LLC.on behalf of International Society for Magnetic Resonance in Medicine.
337

intensity. As there is a frequency dependence to hearing sensi-tivity, this decibel scale can be filtered to weight readings forthe ear’s sensitivity. Hence, we often see readings reported indB(A), and dB(C).
The sound levels measured will also depend not only onthe detector used (and weighting) but also on the environmentsurrounding the sound source and detector. Hence, oftensounds levels will be reported as sound pressure level (SPL),which also accounts for the environmental contributions.
Audible noise is often defined as “unwanted” sound. Itis characterized by its intensity, frequency range, mode, andduration. Here, by mode, we mean whether the noise is con-tinuous, intermittent, impulsive, or explosive.
Exposure to loud noise can damage hearing. Transienthearing damage can occur, which can result in temporarythreshold shift (TTS) in hearing. Hearing recovery is gener-ally exponential and rapid following acoustic noise exposure.Brummett et al reported an early study of patients scannedwithout ear protection and noted 43% reported experiencingTTSs.1 If the noise is louder, recovery can take considerablylonger, and for severe exposure, permanent threshold shifts(PTS) can occur, resulting in permanent hearing loss for aspecific frequency range.
In recent years, there has been increasing interest andgrowing concern over “hidden hearing loss” (HHL). Damageto the outer hair cells often results in temporary or permanentthreshold shifts as mentioned above and can be detectedacutely with standard audiological testing. However, damageto the auditory nerve cells and inner hair cells can occur, due,for example, to acoustic noise exposure, but it is not readily
detected by standard audiometric testing and can remain hid-den for months or years.13, 14 While not apparent from mea-surements of hearing thresholds, deficits are found whenassessing aspects of hearing (eg, speech discrimination andintelligibility) in the presence of background noise.
Some research has shown that exposure to moderatelevels of acoustic noise (�100 dB for �2 hours) can produceTTS and also result in HHL in animal models.15 However,at this point, there is much conflicting data, and the charac-teristics and relationship between HHL and acoustic noiseexposure in humans is not clear.
In this review, published data relating to hearing dam-age are based on standard audiometric testing in humans, butthe impact and prevalence of HHL may become increasinglyimportant and may have an impact on future guidanceregarding safe levels of acoustic noise exposure in MR.
MRI-Related Acoustic NoiseIn the MR environment, the main acoustic noise source isthe gradient system. Acoustic noise is generated due to therapidly changing currents in the gradient coils, and in thepresence of large magnetic fields, result in significant Lorentzforces on the coils, which knock against the coil former.Additionally, these forces and gradient designs often result inthe gradient former vibrating and deforming, further increas-ing acoustic noise levels. The various characteristics of thegradient input (wave-form shapes) leads to generation of awide variety of audible sounds familiar to MR workers andpatients.16
Scanner DesignOpen MR scanners generally have a lower static field strengthcompared to superconducting scanners. Their open designalso minimizes potential acoustic noise amplification due toreverberation found in tunnel-configuration magnetic designs.Hence, open scanners have reported comparatively loweracoustic noise levels17 and fewer issues with acoustic noiseexposures. This review will focus mainly on superconductingMR systems.
CharacteristicsThe gradient input will alter not only the character of theaudible noise but also its loudness. Simplistically, acousticnoise should increase with decreases in slice thickness, field ofview (FOV), and echo time (TE).
ACOUSTIC NOISE LEVELS. These are found to be highestfor sequences employing multiple gradients simultaneously(eg, three-dimensional acquisitions), and gradients with rapidrisetimes (fast imaging) or switching times (echo-planar-typeimaging).
Noise levels also show a (nonlinear) dependence onstatic field strength18 and in fact (due to effects such as
FIGURE 1: The frequency response of the human ear. Thedashed line shows the relative frequency response of the humanear and the solid line shows the A-weighted filter approximationto this response.12 Reproduced by permission through theHMSO Open Government License.
338 Volume 55, No. 2
Journal of Magnetic Resonance Imaging

Lorentz damping) acoustic noise levels for some 7 T whole-body scanners are not significantly higher than those gener-ated by lower field scanners.19
FREQUENCY SPECTRUM. Due to the nature of the gradientwaveform and associated vibration of gradient formers, theacoustic noise is found to be pseudo-periodic. Periodicitydepends mainly on the pulse sequence used and the vibra-tional characteristics of the gradient coil and former.20
Conventional imaging tends to generate peak acousticnoise levels at low frequency, typically in the range of 0.2–1.5 kHz.21 Unfortunately, this overlaps significantly with theregion where hearing is most sensitive and prone to damage.
Echo planar imaging (EPI) sequences are very short induration. The majority of the acoustic noise generated is fromthe phase encode “blips,” and as these are very short indeed,and the acoustic noise generated contains a higher proportionof high-frequency components.22
SPATIAL VARIANCE. Acoustic noise will vary along the scan-ner bore, depending significantly on scanner design and con-struction.17The acoustic noise may also vary asymmetricallyalong axial and radial directions due to standing-wave effects.23
SYSTEM LOADING. The presence of the patient in the scan-ner has been reported to cause variations in acoustic noiselevels of up to 10 dB.24
ULTRA-HIGH FIELD MR. Knowing there is a (nonlinear)dependence between acoustic noise level and static magneticfield strength, we might expect ultra-high field (UHF) scanningto generate considerably higher acoustic noise levels. However,due to effects such as Lorentz damping, this is not seen in prac-tice.20 Recent studies have reported similar acoustic noise levelsmeasured at 7 T to those at measured at 3 T.25,26
Permissible LimitsScanner acoustic noise levels have been monitored for decades nowand often form part of scanner QA and acceptance procedures.
Acoustic noise levels of up to 138 dB27 have beenrecorded, and several reports note levels in the range of120–130 dB (23, 28).
The available guidance (depending on your country/region) is similar in nature, being based on chronic exposure,and having similar exposure limits and action levels.
Patients and VolunteersUK guidance is provided by MHRA,29 and the relevantaction levels are shown in Table 1 (based on reference 30). Itsuggests offering hearing protection to all, and this shouldreduce acoustic noise levels at the ear to below 85 dBA.
Internationally, IEC31 and ICRIRP32,33 offer guidance—the latter being based on that from Medicines and HealthcareRegulatory Agency in the United Kingdom.
Staff ExposureUK guidelines are based on noise at work legislation.30 Hear-ing protection should be available for all staff, and wearing ismandatory for acoustic noise levels above the second actionlevel (85 dBA).
In the United States, guidelines are offered by Occupa-tional Safety and Health Authority (OSHA)34 and AmericanCollege of Radiology (ACR)35; the OSHA guidelines havebeen adopted by the FDA.36 OSHA recommend a slightlyhigher action level of 90 dBA (per day or 8-hour average).
Members of the Public/CarersGenerally, this group will not have access to the MR con-trolled area, so risks will be low.
Scanning During Pregnancy and Neonatal ImagingA cautious approach is taken, and imaging during the first tri-mester of pregnancy is generally avoided except in cases ofurgent clinical need.29 Previous studies have assessed theimpact of acoustic noise exposure during pregnancy, but thesehave mostly focused on chronic occupational noise.
The fetus is known to be sensitive to noise and at riskof hearing damage.37 Some previous studies have shown thatthere can be considerable attenuation (around 30 dB) pro-vided by abdominal wall and fluid-filled uterus.38 However,most of the attenuation will be at higher frequencies; lowerfrequencies can experience considerably lower attenuation(down to around 5 dB39) reducing the sound isolation of thefetus. Indeed, some studies have shown that there can evenbe enhancement of the low frequencies rather than attenua-tion, see Fig. 2.40
TABLE 1. Occupational Noise Action Values and Limits(Adapted from reference 30)
Action Level
Daily or WeeklyPersonal ExposuredB(A) (average
value)
Peak SoundPressure(dB)
Lower exposurevalue
80 135
Upper exposurevalue
85 137
Exposure limitvalues
87 140
Reproduced by permission, HMSO (Open GovernmentLicense).
February 2022 339
Mark J. McJury: A review of acoustic noise and MRI

There have been numerous longitudinal studies whichfollowed up children of mothers scanned during pregnancy.There have been no reports of abnormal hearing or develop-ment issues related to MR scanning, including imaging dur-ing the first trimester.41–45
Neonates are also a group sensitive to acoustic noise. Inthe United Kingdom, neonatal intensive care unit (NICU)guidelines46 recommend maintaining acoustic noise levelsbelow 65 dBA to minimize the stress. Solutions for acousticnoise level reduction include the use of dedicated small-borescanners, with lower strength gradients; the use of dual passiveear protection (ear plugs and muffs); and the use of soundmuffling blankets around the neonate in the RF coil.47, 48
Acoustic Noise Control TechniquesPassive ProtectionPassive ear protection can be thought of as a form of personalprotective equipment (PPE). In terms of a solution tounwanted high levels of occupational acoustic noise, the use
of PPE is often thought of as a last resort, after solutionsinvolving engineering controls, equipment substitution, andwork/task rotation have been exhausted.
However, it also represents the easiest, most convenient,lowest cost and most widely used solution. This protectiongenerally comes in two forms, earplugs that are fitted into theear canal and larger earmuffs that fit over and enclose theentire ear. These are generally used for different situations butcan also be used together.
Ear PPE is available generally, often for occupationaluse (many industries involve noisy environments, from min-ing, motor-racing pit crews, to aviation and naval workers).For occupational use, a wider choice of PPE is available,partly due the need for wear over long periods (eg, 8-hourshifts), and for the tailored need to avoid over-protection(wearers may still need to hear warning sirens, on-site motorvehicles, etc.). Many of the more sophisticated custom-fit oractive electronic PPE are not suitable or appropriate for usein an MR unit.
Most MR departments will routinely use disposable ear-plugs or earmuffs. Well-fitting ear plugs or muffs will typi-cally offer noise attenuation of around 10–30 dB (varyingacross frequencies, see Fig. 3). This should generally bringacoustic noise exposure to within allowed limits. Earmuffswith hollow acoustic tubing are often supplied by the MRsystem vendor. These are generally not classified as ear protec-tion but are a communication aid for staff instructing patientsduring scanning. These should not be used in place of equip-ment classified as ear protection. When used, good practicewould be to combine them with earplugs. Due to their place-ment, earplugs tend to have more variable protection due tofit. If well maintained, earmuffs tend to offer more consistentprotection.
Care should always be taken to ensure the device is ingood condition and well-fitting. Take note of the attenuationdata provided with the device and ensure it will provide suffi-cient noise reduction across the entire hearing range. A range
FIGURE 2: Data showing sound transmission to the fetal innerear. Noise floor refers to maternal physiological backgroundnoise. The data are from a model built from existing data onacoustic noise transmission. Reproduced from reference 40.
FIGURE 3: Noise attenuation for several commercial earplugs and ear defenders. Note the significant variability in attenuation at lowfrequencies. Reproduced by permission, the 3M Company. 3M™, E.A.R.™, and Peltor™ are trademarks of the 3M Company.
340 Volume 55, No. 2
Journal of Magnetic Resonance Imaging

of devices may need to be available to cover the size of earcanal for subjects across the age range. Bear in mind, that insome circumstances, dual protection may be required (eg,neonatal imaging, see above), and some patients may expressa preference. Current guidance suggests staff are trained inselection and fitting of ear-protection.29
Be aware that passive devices will offer nonuniform pro-tection over the hearing range, with poorer noise attenuationat lower frequencies and poor attenuation of noise transmit-ted through bone conduction.49
Active Noise ControlMany will be familiar with the current trend for noise-canceling headphones to boost the enjoyment of listening tomusic in noisy environments such as those encountered whentraveling. Essentially, acoustic noise at the ear is monitoredwith a microphone close to the music delivery speaker, andon-the-fly processing analyses background acoustic noise, andproduces antiphase noise, which is delivered to the ear alongwith the music. The systems tend to work best for periodicbackground noise, rather than random or impulsive noise.
Using antiphase acoustic noise is not a new idea, but itis one which not only offers significant noise reduction butdoes so independently, that is, without modifying ordegrading the performance of the MR system gradients orpulse sequences at all. Effective acoustic noise cancelationrequires large amounts of fast processing, but advances in dig-ital signal processing technology have made even these
requirements relatively cheap and widely available on the highstreet.
Early studies showed encouraging results (see Fig. 4),with real-time peak noise reduction levels of 30 dB (over0–700 Hz).50 More recently, using a feed-forward x-LMS-based system, improved results have been reported, withattenuation levels of approximately 55 dB (with an average of30 dBA across the entire hearing range.51, 52
Although speakers and mics can be built into the mag-net inner bore, these active noise control systems work best,when the monitoring is performed at or very close to the ear,that is, in headphones. This leads to an obvious limitation ofthe system, as headphone use is not always possible with headcoils, and standard equipment does not fit all patient groups.These issues have led to comparatively low interest anduptake for these systems in commercial MR systems to date.
Quiet MR SequencesThis approach initially seems unattractive, given the vastnumber of individual sequences on modern commercial scan-ners. Indeed, this fact partly explains why only a small set ofacoustic noise-optimized sequences are generally offered oncommercial scanners. However, it is also true that the major-ity of MR sequences are not excessively noisy and may notneed additional optimization. Sequences with concerninglevels of acoustic noise output are limited mainly to thoseacquiring data with multiple, rapid slew-rate, and high ampli-tude gradient levels (e.g., sequences such as EPI for fMRI,
FIGURE 4: Results of noise cancelation for a typical clinical spin echo pulse sequence. Noise level spectra before (dotted line) andafter cancelation (solid line) are shown for time and frequency domain spectra. A major disadvantage of this technique is that, ifperformed below optimal efficiency, at certain frequencies or in some spatial regions, noise levels may be enhanced rather thanattenuated by the superposition of the additional antinoise.50
February 2022 341
Mark J. McJury: A review of acoustic noise and MRI

diffusion, and fast 3D applications). In recent years, advancesin this approach have generated almost silent imagingsequences, making it the solution of choice for several com-mercial vendors.
There are many approaches that can be used to opti-mize MR sequences to attenuate acoustic noise. Some of themain approaches that have been used alone, or in combina-tion, are discussed below.
BASIC OPTIMIZATION FOR STANDARD SEQUENCES(INC. PARALLEL IMAGING). An understanding of the char-acteristics of MR-related acoustic noise, and scanner design(see above), allow us to make some choices, to reduce theacoustic noise associated with standard imaging.
As a first step, if possible choosing a spin-echo(SE) rather than a gradient-echo (GE) sequence will help.
Next, reduce the level of gradient activity: If possible,change from 3-D to 2-D acquisition and keep gradient ampli-tudes as low as possible. Reducing the gradient rise-time willalso help, but will also increase TE, and affect the max slices,which can be acquired and overall exam time.53 Reducing thenumber of gradient echoes will also help—replace gradientechoes with stimulated echoes, by using techniques such asSTEAM Burst.54, 55
Parallel imaging such as SENSE can also be used toreduce gradient slew-rates due to reduced k-space sampling.56
Acoustic noise attenuation levels of 10–15 dB are typical.
RESHAPING AND RESAMPLING. Acoustic noise is oftenassociated with rapid and abrupt changes in gradient levels.Alongside reducing amplitudes and slew-rates, smoothing thegradient waveform will help, as it reduces the instances ofsharp changes in gradient levels. It often features in sequence
FIGURE 6: (left) Pulse sequence diagram for one repetition of the radial part of the PETRA sequence. Gradients are held constantduring almost an entire TR period and altered only slightly at the end of each repetition without being ramped down. This very lowgradient activity leads to minimal acoustic noise. Tsw is the time required to switch from transmission mode to receive mode.Redrawn from reference 81.
FIGURE 5: Acoustic noise levels for gradient-echo and spin-echopulse sequences measured as a function of echo time (TE,milliseconds) at 3T. The top lines in the graphs correspond tosequences using soft (S) gradient pulses. The middle lines in thegraphs show sequences with linear (L) ramps of maximumduration. The bottom lines in the graphs show standardsequence default settings. The dashed line is the level ofambient room noise from the air-conditioning system.57
Reproduced by permission, Wiley - John Wiley & SonPublishers, NY.
342 Volume 55, No. 2
Journal of Magnetic Resonance Imaging
optimization. This solution involves the replacing trapezoidalwaveforms with sinusoidal ones, maximizing gradient rampduration and minimizing the number of ramps. These adap-tions are sometimes referred to as using “soft” gradientpulses.57 Early results were impressive (up to 45 dBA attenua-tion, see Fig. 5), but the sequences have increased vascularflow sensitivity, and results were poor with fast sequences.Later, this solution was also been applied to fast sequences,58
generating 20–40 dBA acoustic noise attenuation. It con-tinues to be popular.59–65
USING GRADIENT CANCELLATION PULSES. By addingsome additional gradient pulses to the end of a sequence, itshould be possible to cancel some of the Lorentz forces gener-ated by gradient pulses earlier in the sequence—a solutionsimilar to the use of antinoise approach (mentioned in thesection Hearing and Acoustic Noise), but here usingantiphase gradients, not antiphase noise, and so perhaps closerto the source of the problem, as it were. In practice, follow-on gradient pulses would generally aim to reduce the impactof a small set of dominant gradient modes and some of theirharmonics. Initial results based on canceling three gradientsmodes, resulted in modest acoustic noise attenuation of13 dB.66
MINIMIZING THE SCANNER RESPONSE FUNCTION.There is a similarity between the input function (gradientpulse spectrum) and output produced (acoustic noise spec-trum) for an MR system. Knowing this, it is possible to gen-erate a frequency response function (FRF) for an MR system,which will be independent of input and which will then allowus to predict the system response to any input function.24
Tomasi and Ernest 67 investigated the impact on theFRF of varying the switching frequency of the readout gradi-ent (and bandwidth) for an EPI sequence. A frequency shift of200 Hz resulted in acoustic noise reduction of 12 dB. This hasalso been used successfully by several other groups.62, 63, 68, 69
ULTRASHORT AND ZERO TE METHODS. To image tissuewith short T2 values, ultra-short TE (UTE), and zero TE(ZTE) techniques have been developed.70, 71 These tech-niques which are by their nature of short duration, use radialsampling of k-space and as the TRs are short, gradients canbe left on rather than switching off between excitations. Abonus of these sequences is they result in almost silent imag-ing procedures, with acoustic noise levels similar to ambientroom noise.
These sequences have been sufficiently successful, toprovoke considerable interest from commercial MRI vendors.GE quickly implemented a variant of the UTE method(based on the RUFIS sequence72) as the basis for their Silenz/Silent Scan™ acoustic noise solution. Results from a protyperunning on a 3T MR system, produced acoustic noise levels
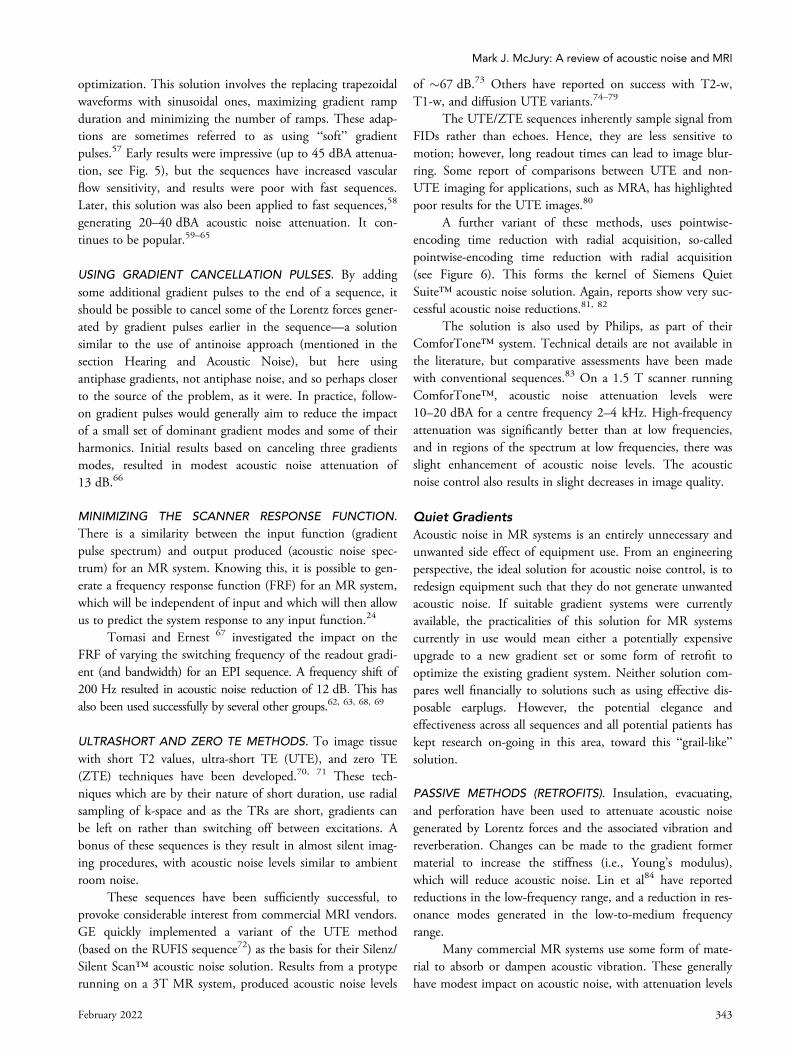
of �67 dB.73 Others have reported on success with T2-w,T1-w, and diffusion UTE variants.74–79
The UTE/ZTE sequences inherently sample signal fromFIDs rather than echoes. Hence, they are less sensitive tomotion; however, long readout times can lead to image blur-ring. Some report of comparisons between UTE and non-UTE imaging for applications, such as MRA, has highlightedpoor results for the UTE images.80
A further variant of these methods, uses pointwise-encoding time reduction with radial acquisition, so-calledpointwise-encoding time reduction with radial acquisition(see Figure 6). This forms the kernel of Siemens QuietSuite™ acoustic noise solution. Again, reports show very suc-cessful acoustic noise reductions.81, 82
The solution is also used by Philips, as part of theirComforTone™ system. Technical details are not available inthe literature, but comparative assessments have been madewith conventional sequences.83 On a 1.5 T scanner runningComforTone™, acoustic noise attenuation levels were10–20 dBA for a centre frequency 2–4 kHz. High-frequencyattenuation was significantly better than at low frequencies,and in regions of the spectrum at low frequencies, there wasslight enhancement of acoustic noise levels. The acousticnoise control also results in slight decreases in image quality.
Quiet GradientsAcoustic noise in MR systems is an entirely unnecessary andunwanted side effect of equipment use. From an engineeringperspective, the ideal solution for acoustic noise control, is toredesign equipment such that they do not generate unwantedacoustic noise. If suitable gradient systems were currentlyavailable, the practicalities of this solution for MR systemscurrently in use would mean either a potentially expensiveupgrade to a new gradient set or some form of retrofit tooptimize the existing gradient system. Neither solution com-pares well financially to solutions such as using effective dis-posable earplugs. However, the potential elegance andeffectiveness across all sequences and all potential patients haskept research on-going in this area, toward this “grail-like”solution.
PASSIVE METHODS (RETROFITS). Insulation, evacuating,and perforation have been used to attenuate acoustic noisegenerated by Lorentz forces and the associated vibration andreverberation. Changes can be made to the gradient formermaterial to increase the stiffness (i.e., Young’s modulus),which will reduce acoustic noise. Lin et al84 have reportedreductions in the low-frequency range, and a reduction in res-onance modes generated in the low-to-medium frequencyrange.
Many commercial MR systems use some form of mate-rial to absorb or dampen acoustic vibration. These generallyhave modest impact on acoustic noise, with attenuation levels
February 2022 343
Mark J. McJury: A review of acoustic noise and MRI

�3 dBA.20,85 Better results were reported by Mechefskeet al,86 who combined damping with use of a scanner bore“endcap.” They measured �20 dB attenuation when runningEPI on a 4T system. Unfortunately, dampening usuallyreduced gradient former stiffness.
Isolating the gradient system from the rest of the MRstructure helps to stop acoustic noise transmission. Edelsteinet al87 reported levels of attenuation �20 dB (peak) whenusing a sealed and evacuated gradient system. Later resultsfrom Katsunuma et al.88 increased attenuation to �30 dB.Toshiba use this approach, combined with insulation, andoptimized “mute” sequences in their Pianissimo™ acousticnoise solution.89 However, there is a dearth of data on its per-formance in the scientific literature to date. These oftenexpensive approaches do not generally work well as retrofits.
An important aspect of research in this area is modeling.Much work has been done to assess the modal characteristicsof gradient coil distortion, flexing, and vibration.19, 90
Recently, further work has been done to develop and refine acomprehensive baseline analytical model (for a shielded cylin-drical gradient coil) and to predict gradient coil behavior.91
Their linear elastodynamic model shows, for example, thatthe same vibrational modes will be excited, irrespective of thespatial distribution of the coil windings, and that the width ofresonances are decreased when there are shielding currentspresent.
ACTIVE METHODS (REDESIGNED COILS). One approach issimilar to the antinoise technique noted above (see sectionHearing and Acoustic Noise). It should be possible to designgradients where Lorentz forces produced by the image acqui-sition are balanced by other equal and opposite forces—theso-called force-balanced designs. Results from a prototypehead-coil gradient set, running an EPI sequence on a 3T sys-tem, reported acoustic noise levels of 102 dB.92, 93
SummaryMRI procedures generate considerable acoustic noise, hinder-ing communication with patients, and at high levels,impacting the success rate for scans and posing safety risks.Management of the risks from acoustic noise exposureinvolves providing protection for patients and staff to bringacoustic noise exposures within safe limits. Research on “hid-den hearing loss”13-15 may have an impact on the safe levelsof acoustic noise exposure used in future for MR imaging.
Much research has been done to characterize the acous-tic noise, and devise solutions to attenuate the noise and min-imize associated risks.
Affordable passive ear protection, if good quality andgood fit, is often sufficient to bring acoustic noise levelswithin safe levels. This can be doubled (wearing ear plugs andmuffs) for sensitive patients to maximize acoustic noise
attenuation, and specialized products are available with differ-ent fittings and sizes for pediatric patients.
Current documents regarding permissible limits vary,but in general set permissible average acoustic noise levels(at the patients’ ear) of 85 dBA.30, 33, 37 Acoustic noise levelsoutside the MR system’s bore are lower and present reducedrisks for an MRI healthcare worker present during the MRIexamination.
There are a large variety of more complex approaches,involving the use of antinoise and antivibration methods,sequence optimization to reduce gradient activity, andredesigned gradient hardware.
Of the available solutions, comparatively recent UTEand ZTE methods (70–82) have generated MR sequenceswhich are virtually silent, producing acoustic noise levels simi-lar to ambient room values. The current “silent” scanningtechniques have also been proven to improve pediatric scansuccess rates.94 These solutions are available for a small rangeof sequences on most modern commercial scanners.
References1. Brummett RE, Talbot JM, Charuhas P. Potential hearing loss resulting
from MR imaging. Radiology 1988;169:539-540.
2. Quirk ME, Letendre AJ, Ciottone RA, Lingley JF. Anxiety in patientsundergoing MR imaging. Radiology 1989;170:463-466.
3. Laurell G. The combined effect of noise and cisplatin. Ann Otol RhinolLaryngol 1992;1001:969-976.
4. Philbin MK, Taber KH, Hayman LA. Preliminary report: Changes in vitalsigns of term newborns during MR. Am J Neurorad 1996;17:1033-1036.
5. Kanal E, Shellock FG, Talagala L. Safety considerations in MR imaging.Radiology 1990;176:593-606.
6. Shellock FG, Kanal E. Policies, guidelines, and recommendations forMR imaging safety and patient management. J Magn Reson Imaging1991;1:97-101.
7. Shellock FG, Litwer CA, Kanal E. Magnetic resonance imaging:bioeffects, safety, and patient management. Magn Reson Q 1992;4:21-63.
8. Kanal E, Shellock FG, Sonnenblick D. MRI clinical site safety survey:Phase I results and preliminary data. Magn Reson Imaging 1988;7:106-112.
9. De Wilde JP, Grainger D, Price DL, Renaud C. Magnetic resonanceimaging safety issues including an analysis of recorded incidents withinthe UK. Prog Nucl Magn Reson Spectr 2007;51:37-48.
10. McJury M, Shellock F. Auditory noise associated with MRI procedures:A review. J Mag Res Imaging 2000;12:37-45.
11. McJury M. Acoustic noise associated with MRI. In: Shellock F, Crues J,editors. MRI bioeffects, safety and patient management: BiomedicalPublishing Group In press.
12. Department of Health. Acoustics: Design considerations, HTM 2045.London: HMSO; 1996.
13. Liberman MC. Hidden hearing loss: Primary neural degeneration in thenoise-damaged and aging cochlea. Acoust Sci Tech 2020;41:59-62.
14. Kohrman DC, Wan G, Cassinotti L, Corfas G. Hidden hearing loss: Adisorder with multiple etiologies and mechanisms. Cold Spring HarbPerspect Med 2020;10:a035493.
15. Hickox AE, Larsen E, Heinz MG, Shinobu L, Whitton JP. Translationalissues in cochlear synaptopathy. Hear Res 2017;349:164-171.
344 Volume 55, No. 2
Journal of Magnetic Resonance Imaging
16. A variety of typical MRI-generated acoustic sounds. AccessedSeptember 01, 2020. Available from: https://www.youtube.com/watch?v=6Aj2QspPf7s.
17. Price DL, De Wilde JP, Papadaki AM, Curran JS, Kitney RI. Investiga-tion of acoustic noise on 15 MRI scanners from 0.2 to 3 T. J MagnReson Imaging 2001;13:288-293.
18. Moelker A, Wielopolski PA, Pattynama PMT. Relationship betweenmagnetic field strength and magnetic resonance-related acoustic noise.Magn Reson Mater Phys Biol 2003;16:52-55.
19. Winkler SA, Schmitt F, Landes H, et al. Gradient and shim technologiesfor ultra high field MRI. Neuroimage 2018;168:59-70.
20. Counter SA, Olofsson A, Grahn HF, Borg E. MRI acoustic noise: Soundpressure and frequency analysis. J Magn Reson Imaging 1997;7:606-611.
21. Prasher D. Estimation of hearing damage from noise exposure. Reportfrom the technical meeting on exposure-response relationships ofnoise on health, Bonn, Germany. Geneva: World Health Organisation;2003. p 82-97.
22. Schmitter S. Entwicklung von geräuscharmen Bildgebungstechniken fürdie funktionelle Magnetresonanztomographie. Doctoral thesis, 2008.
23. More SR, Lim TC, Li M, Holland CK, Boyce SE, Lee JH. Acoustic noisecharacteristics of a 4T MRI scanner. J Magn Reson Imaging 2006;23:388-397.
24. Hedeen RA, Edelstein WA. Characteristics and prediction of gradientacoustic noise in MR imagers. Magn Reson Med 1997;37:7-10.
25. Capstick M, McRobbie D, Hand J, Christ A, Kühn S, Mild KH, et al. Aninvestigation into occupational exposure to electromagnetic fields forpersonnel working with and around medical magnetic resonance imag-ing equipment. 2008. Project Report VT/2007/017. AccessedSeptember 25, 2019. Available from: https://itis.swiss/news-events/news/publications/2008/an-investigation-into-occupational-exposure-to-electromagnetic-fields-for-personnel-working-with-and-around-medical-magnetic-resonance-imaging-equipment/ .
26. Schmitter S, Mueller M, Semmler W, Bock M. Maximum sound pressurelevels at 7 Tesla—what’s all this fuss about? Proc ISMRM 2014;3029.
27. Ravicz ME, Melcher JR, Kiang NYS. Acoustic noise during functionalMRI. J Acoust Soc Am 2000;108:1683-1696.
28. Foster JR, Hall DA, Summerfield AQ, Palmer AR, Bowtell RW. Soundlevel measurements and calculations of safe noise dosage during EPIat 3 T. J Magn Reson Imaging 2000;12:157-163.
29. Medicines and Healthcare Products Regulatory Authority (MHRA).Safety guidelines for magnetic resonance imaging equipment in clinicaluse, 2015.
30. Control of noise at work. London: HMSO; 2005.
31. International Electrotechnical Commission (IEC). Particular requirementsfor the safety of magnetic resonance equipment for medical diagnosis.Geneva: IEC;60601-2-33; 2001.
32. International Commission on Non-Ionizing Radiation (ICNIRP). Guide-lines on limits of static magnetic fields. Health Phys 1994;66:100-106.
33. International Commission on Non-Ionizing Radiation (ICNIRP). State-ment on MR procedures: Protection of patients. Health Phys 2004;87:197-216.
34. Occupational Safety and Health Administration (OSHA). Occupationalnoise exposure. 29 C.F.R. 1988;1910.95.
35. Kanal E, Barkovich AJ, Bell C, et al. ACR guidance document on MRsafe practices: 2013. J Mang Reson Imaging 2013;37:501-530.
36. U.S. Food and Drug Administration. Criteria for significant risk investi-gations of magnetic resonance diagnostic devices. Guidance for indus-try and food and drug administration staff. Rockville, MD: Food andDrug Administration Center for Devices and Radiological Health; 2014.
37. Etzel RA, Balk SJ, Bearer CF, Miller MD, Shea KM, Simon PR. Noise: Ahazard for the fetus and newborn. Paediatrics 1997;100:724-727.
38. Glover P, Hykin J, Gowland P, Wright J, Johnson J, Mansfield PM. Anassessment of the intrauterine sound intensity level during obstetric
echo-planar magnetic resonance imaging. Brit J Rad 1995;68:1090-1094.
39. Gélat P, David AL, Haqhenas SR, et al. Evaluation of fetal exposure toexternal loud noise using a sheep model: Quantification of in uteroacoustic transmission across the human audio range. Am J ObstetGynecol 2019;221:343.e1-343.e11.
40. Gerhardt KJ, Abrams RM. Fetal exposures to soundand vibroacousticstimulation. J Pernat 2000;20:S20-S29.
41. Reeves MJ, Brandreth M, Whitby EH, et al. Neonatal cochlear function:Measurement after exposure to acoustic noise during in utero MRimaging. Radiology 2010;257:802-809.
42. Bouyssi-Kobar M, du Plessis AJ, Robertson RL, Limperopoulos C. Fetalmagnetic resonance imaging: Exposure times and functional outcomesat preschool age. Pediatr Radiol 2015;45:1823-1830.
43. De Vita E, Bainbridge A, Cheong JLY, et al. Magnetic resonance imag-ing of neonatal encephalopathy at 4.7 Tesla: Initial experiences. Pediat-rics 2006;118:e1812-e1821.
44. Jaimes C, Delgado J, Cunnane MB, et al. Does 3-T fetal MRI induceadverse acoustic effects in the neonate? A preliminary study comparingpostnatal auditory test performance of fetuses scanned at 1.5 and 3 T.Pediatr Radiol 2019;49:37-45.
45. Clements H, Duncan KR, Fielding K, Gowland PA, Johnson IR,Baker PN. Infants exposed to MRI in utero have a normal paediatricassessment at 9 months of age. Brit J Radiol 2000;73:190-194.
46. White RD, Smith JA, Shepley MM. Recommended standards for new-born ICU design. J Perinatol 2013;33:S2-S16.
47. Tkach JA, Merhar SL, Kline-Fath BM, et al. MRI in the neonatal ICU: Ini-tial experience using a small-footprint 1.5-T system. Am J Radiol 2013;202:W95-W105.
48. Tzach JA, Li Y, Pratt RG, et al. Characterization of acoustic noise in aneonatal intensive care unit MRI system. Pediatr Radiol 2014;44:1011-1019.
49. Naughton RF. The measurement of hearing by bone conduction. In:Jerger J, editor. Modern developments in audiology. New York, NY:Academic Press; 1963.
50. McJury M, Stewart RW, Crawford D, Toma E. The use of active noisecontrol (ANC) to reduce acoustic noise generated during MRI scanning:Some initial results. Mag Res Imaging 1997;15:319-322.
51. Li M, Rudd B, Lim TC, Lee JH. In situ active control of noise in a 4TMRI scanner. J Magn Reson Imaging 2011;34:662-669.
52. Lee N, Park Y, Lee GW. Frequency-domain active noise control formagnetic resonance imaging acoustic noise. Appl Acoust 2017;118:30-38.
53. Skare S, Nordell B, et al. An incubator and “quiet” pulse sequences forMRI examination of premature neonates. Proc ISMRM 1996;1727.
54. Jakob P, Schlaug MG, Griswold M, et al. Functional burst imaging.Magn Reson Med 1998;40:614-621.
55. Cremillieux Y, Wheeler-Kingshott CA, Briguet A, Doran SJ. STEAM-BURST: A single-shot multi-slice imaging sequence without rapid gradi-ent switching. Mag Res Med 1997;38:645-652.
56. de Zwart JA, Van Gelderen P, Kellman P, Duyn JH. Reduction of gradi-ent acoustic noise in MRI using SENSE-EPI. Neuroimage 2001;16:1151-1155.
57. Hennel F, Giard F, Loenneker T. Silent MRI with soft gradient pulses.Mag Res Med 1999;42:6-10.
58. Hennel F. Fast spin echo and fast gradient echo MRI with low acousticnoise. J Magn Reson Imaging 2001;13:960-966.
59. Loenneker T, Hennel F, Ludwig U, Hennig J. Silent BOLD imaging.Magn Reson Mater Phys Biol Med 2001;13:76-81.
60. Osterle C, Hennel F, Hennig J. Quiet imaging with interleaved spiralread-out. Magn Reson Imaging 2001;19:1333-1337.
February 2022 345
Mark J. McJury: A review of acoustic noise and MRI

61. Schmitter S, Diesch E, Amann M, Kroll A, Moayer M, Schad LR. Silentecho-planar imaging for auditory FMRI. Magn Reson Mater Phys 2008;21:317-325.
62. Schmitter S, Bock M. Acoustic noise-optimized VERSE pulses. MagnReson Med 2010;64:1447-1453.
63. Zapp J, Schmitter S, Schad LR. Sinusoidal echo-planar imaging withparallel acquisition technique for reduced acoustic noise in auditoryfMRI. J Magn Reson Imaging 2012;36:581-588.
64. Heismann B, Ott M, Grodzki D. Sequence-based acoustic noise reduc-tion of clinical MRI scans. Magn Reson Med 2015;73:1104-1109.
65. Fischer S, Grodzki DM, Domschke M, Albrecht M, Bodelle B, Eichler K.Quiet MR sequences in clinical routine: Initial experience in abdominalimaging. Radiol Med 2017;122:194-203.
66. Shou X, Chen X, Derakhshan J, et al. The suppression of selectedacoustic frequencies in MRI. Appl Acoust 2010;71:191-200.
67. Tomasi DG, Ernst T. Echo planar imaging at 4 Tesla with minimumacoustic noise. J Magn Reson Imaging 2003;18:128-130.
68. Segbers M, Rizzo-Sierra CV, Duifhuis H, Hoogduin JM. Shaping andtiming gradient pulses to reduce MRI acoustic noise. Magn Reson Med2010;64:546-553.
69. Ott M, Blaimer M, Grodzki DM, et al. Acoustic-noise-optimizeddiffusion-weighted imaging. Magn Reson Mater Phy 2015;28:511-521.
70. Gatehouse PD, Bydder GM. Magnetic resonance imaging of short T2components in tissue. Clin Radiol 2003;58:1-19.
71. Weiger M, Brunner DO, Dietrich BE, Meuller CF, Pruessmann KP. ZTEImaging in Humans. Magn Reson Med 2013;70:328-332.
72. Madio DP, Lowe IJ. Ultra-fast imaging using low flip angles and FIDs.Magn Reson Med 1995;34:525-529.
73. Alibek S, Vogel M, Sun W, et al. Acoustic noise reduction in MRI usingsilent scan: An initial experience. Diagn Interv Radiol 2014;20:360-363.
74. Ohlmann-Knafo S, Morlo M, Tarnoki DL, et al. Comparison of imagequality characteristics on silent MRversusconventional MR imaging ofbrain lesions at 3 Tesla. Br J Radiol 2016;89:20150801.
75. Solana AB, Menini A, Sacolick LI, Hehn N, Wiesinger F. Quiet anddistortion-free, whole brain BOLD fMRI using T2-prepared RUFIS.Magn Reson Med 2016;75:1402-1412.
76. Wiesinger F, Menini A, Solana AB. Looping star. Magn Reson Med2019;81:57-68.
77. Yuan J, Hu Y, Menini A, et al. Near-silent distortionless DWI usingmagnetization-prepared RUFIS. Mag Res Med 2019;84:170-181.
78. Sandberg JK, Young VA, Syed AB, et al. Near-silent and distortion-freediffusion MRI in pediatric musculoskeletal disorders: Comparison withEcho planar imaging diffusion. J Magn Reson Imaging 2021;53:504-513. https://doi.org/10.1002/jmri.27330.
79. Liu X, Gómez PA, Solana AB, Wiesinger F, Menzel MI, Menze BH.Silent 3D MR sequence for quantitative and multicontrast T1 and pro-ton density imaging. Phys Med Biol 2020;65:185010. https://doi.org/10.1088/1361-6560/aba5e8.
80. Holdsworth SJ, Macpherson SJ, Yeom KW, Wintermark M,Zaharchuk G. Clinical evaluation of silent T1-weighted MRI and silentMR angiography of the brain. Am J Radiol 2018;210:404-411.
81. Ida M, Wakayama T, Nielsen ML, Abe T, Grodzki DM. QuietT1-weighted imaging using PETRA: Initial clinical evaluation in intracra-nial tumor patients. J Magn Reson Imaging 2015;41:447-453.
82. Aida N, Niwa T, Fujii Y, et al. Quiet T1-weighted pointwise encodingtime reduction with radial acquisition for assessing myelination in thepediatric brain. Am J Neuroradiol 2016;37:1528-1534.
83. Yamashiroa T, Moritab K, Nakajimaa K. Evaluation of magnetic reso-nance imaging acoustic noise reduction technology by magnetic gradi-ent waveform control. Mag Reson Imaging 2019;63:170-177.
84. Lin TR, O’Shea P, Mechefske CK. Reducing MRI gradient coil vibrationwith rib stiffeners. Concepts Magn Reson Part B 2009;35B:198-209.
85. Sellers MB, Pavlids JD, Carlberger T. MRI acoustic noise. Int J Neu-roradiol 1996;2:549-560.
86. Mechefske CK, Geris R, Gati JS, Rutt BK. Acoustic noise reduction in a4T MRI scanner. Magn Reson Mater Phys Med Biol 2002;13:172-176.
87. Edelstein WA, Hedeen RA, Mallozzi RP, El-Hamamsy SA,Ackermann RA, Havens TJ. Making MR quieter. Magn Reson Imaging2002;20:155-161.
88. Katsunuma A, Takamori H, Sakakura Y, Hamamura Y, Ogo Y,Katayama R. Quiet MRI with novel acoustic noise reduction. MagnReson Mater Phys Med Biol 2002;13:139-144.
89. Toshiba America Medical Systems Improved auditory fMRI imagingusing Toshiba scanner with pianissimo. MRWP12219US. 2014.
90. Mechefske CK. Vibration in MRI scanners. In: Al-Jumaily A, Alizad A,editors. Biomedical applications of vibration and acoustics in therapy,bioeffects, and modeling. New York, NY: ASME Press; 2008.
91. Sakhr J, Chronik BA. Vibrational response of a MRI gradient coil cylin-der to time-harmonic Lorentz-force excitations: An exact linearelastodynamic model for shielded longitudinal gradient coils. ApplMath Model 2019;74:350-372.
92. Mansfield P, Glover PM, Bowtell RW. Active acoustic screening: Designprinciples for quiet gradient coils in MRI. Meas Sci Technol 1994;5:1021-1025.
93. Mansfield P, Chapman BL, Bowtell R, Glover P, Coxon R, Harvey PR.Active acoustic screening: Reduction of noise in gradient coils byLorentz force balancing. Magn Reson Med 1995;33:276-281.
94. Zhu X, Ye J, Bao Z, et al. Benefits of silent DWI MRI in success rate,image quality, and the need for secondary sedation during brain imag-ing of children of 3–36 months of age. Acad Radiol 2020;27:543-549.
346 Volume 55, No. 2
Journal of Magnetic Resonance Imaging