Microbial diversity of eolian dust sources from saline lake sediments and biological soil crusts in...
11
RESEARCH ARTICLE Microbial diversity of eolian dust sources from saline lake sediments and biological soil crusts in arid Southern Australia Raeid M.M. Abed 1,2 , Alban Ramette 1 , Vera Hu ¨ bner 1 , Patrick De Deckker 3 & Dirk de Beer 1 1 Max-Planck Institute for Marine Microbiology, Bremen, Germany; 2 Biology Department, College of Science, Sultan Qaboos University, Al Khoud, Sultanate of Oman; and 3 Research School of Earth Sciences, The Australian National University, Canberra, Australia Correspondence: Raeid M.M. Abed, Max- Planck Institute for Marine Microbiology, Celsiusstrasse 1, D-28359 Bremen, Germany. Tel.: +49 (0)421 202 8832; fax: +49 (0) 421 202 8690; e-mail: rabed@mpi-bremen. de Received 21 August 2011; revised 11 November 2011; accepted 22 December 2011. Final version published online 17 January 2012. DOI: 10.1111/j.1574-6941.2011.01289.x Editor: Christoph Tebbe Keywords aerosols; ARISA; cyanobacteria; Firmicutes; nutrients; pyrosequencing. Abstract While microbial communities of aerosols have been examined, little is known about their sources. Nutrient composition and microbial communities of potential dust sources, saline lake sediments (SLS) and adjacent biological soil crusts (BSC), from Southern Australia were determined and compared with a previously analyzed dust sample. Multivariate analyses of fingerprinting profiles indicated that the bacterial communities of SLS and BSC were different, and these differences were mainly explained by salinity. Nutrient concentrations varied among the sites but could not explain the differences in microbial diver- sity patterns. Comparison of microbial communities with dust samples showed that deflation selects against filamentous cyanobacteria, such as the Nostocales group. This could be attributed to the firm attachment of cyanobacterial fila- ments to soil particles and/or because deflation occurs mainly in disturbed BSC, where cyanobacterial diversity is often low. Other bacterial groups, such as Actinobacteria and the spore-forming Firmicutes, were found in both dust and its sources. While Firmicutes-related sequences were mostly detected in the SLS bacterial communities (10% of total sequences), the actinobacterial sequences were retrieved from both (11–13%). In conclusion, the potential dust sources examined here show highly diverse bacterial communities and contain nutrients that can be transported with aerosols. The obtained finger- printing and sequencing data may enable back tracking of dust plumes and their microorganisms. Introduction Airborne dust can affect global climate, human health as well as ocean and terrestrial environments (Stoorvogel et al., 1997; Griffin et al., 2001; McTainsh et al., 2005). Dust plumes from the Sahara in Northern Africa, known as the largest source of soil to Earth’s atmosphere, are known to spread over long distances across the Atlantic Ocean and as far as the Caribbean, SE United States and the Amazon basin (Swap et al., 1992; Prospero, 1999; Prospero et al., 2005), whereas Chinese dust, in one occa- sion, was known to have traveled one full circuit around the globe in about 13 days (Uno et al., 2009). Recently, it became evident that aerosols are rich in viable bacterial populations and can act as a carrier for a variety of microorganisms that may impact human health and the environment (Griffin et al., 2001; Prospero et al., 2005; Brodie et al., 2007). In the Southern Hemisphere, Austra- lia is the main source of dust, which exits the continent frequently and deposits into the Tasman Sea and can go as far as New Zealand as well into the eastern Indian Ocean (Bowler, 1976; Hesse, 1994; McGowan et al., 2000; De Deckker et al., 2010). Numerous dust storms have been documented in Australia (Liversidge, 1902; Raupach et al., 1994), including the dust plume that engulfed Canberra in October 2002 (McTainsh et al., 2005; De Deckker et al., 2008) and more recently Sydney in Sep- tember 2009. A detailed characterization of dust samples from the former event showed that the dust was gener- ated from wind erosion of the regolith in arid and semi- arid regions and harbored a large diversity of soil-related microorganisms (De Deckker et al., 2008). Using satellite ª 2011 Federation of European Microbiological Societies FEMS Microbiol Ecol 80 (2012) 294–304 Published by Blackwell Publishing Ltd. All rights reserved MICROBIOLOGY ECOLOGY
-
Upload
independent -
Category
Documents
-
view
0 -
download
0
Transcript of Microbial diversity of eolian dust sources from saline lake sediments and biological soil crusts in...

R E S EA RCH AR T I C L E
Microbial diversity of eolian dust sources from saline lakesediments and biological soil crusts in arid Southern Australia
Raeid M.M. Abed1,2, Alban Ramette1, Vera Hubner1, Patrick De Deckker3 & Dirk de Beer1
1Max-Planck Institute for Marine Microbiology, Bremen, Germany; 2Biology Department, College of Science, Sultan Qaboos University, Al Khoud,
Sultanate of Oman; and 3Research School of Earth Sciences, The Australian National University, Canberra, Australia
Correspondence: Raeid M.M. Abed, Max-
Planck Institute for Marine Microbiology,
Celsiusstrasse 1, D-28359 Bremen, Germany.
Tel.: +49 (0)421 202 8832; fax: +49 (0)
421 202 8690; e-mail: rabed@mpi-bremen.
de
Received 21 August 2011; revised 11
November 2011; accepted 22 December
2011. Final version published online 17
January 2012.
DOI: 10.1111/j.1574-6941.2011.01289.x
Editor: Christoph Tebbe
Keywords
aerosols; ARISA; cyanobacteria; Firmicutes;
nutrients; pyrosequencing.
Abstract
While microbial communities of aerosols have been examined, little is known
about their sources. Nutrient composition and microbial communities of
potential dust sources, saline lake sediments (SLS) and adjacent biological soil
crusts (BSC), from Southern Australia were determined and compared with a
previously analyzed dust sample. Multivariate analyses of fingerprinting profiles
indicated that the bacterial communities of SLS and BSC were different, and
these differences were mainly explained by salinity. Nutrient concentrations
varied among the sites but could not explain the differences in microbial diver-
sity patterns. Comparison of microbial communities with dust samples showed
that deflation selects against filamentous cyanobacteria, such as the Nostocales
group. This could be attributed to the firm attachment of cyanobacterial fila-
ments to soil particles and/or because deflation occurs mainly in disturbed
BSC, where cyanobacterial diversity is often low. Other bacterial groups, such
as Actinobacteria and the spore-forming Firmicutes, were found in both dust
and its sources. While Firmicutes-related sequences were mostly detected in the
SLS bacterial communities (10% of total sequences), the actinobacterial
sequences were retrieved from both (11–13%). In conclusion, the potential
dust sources examined here show highly diverse bacterial communities and
contain nutrients that can be transported with aerosols. The obtained finger-
printing and sequencing data may enable back tracking of dust plumes and
their microorganisms.
Introduction
Airborne dust can affect global climate, human health as
well as ocean and terrestrial environments (Stoorvogel
et al., 1997; Griffin et al., 2001; McTainsh et al., 2005).
Dust plumes from the Sahara in Northern Africa, known
as the largest source of soil to Earth’s atmosphere, are
known to spread over long distances across the Atlantic
Ocean and as far as the Caribbean, SE United States and
the Amazon basin (Swap et al., 1992; Prospero, 1999;
Prospero et al., 2005), whereas Chinese dust, in one occa-
sion, was known to have traveled one full circuit around
the globe in about 13 days (Uno et al., 2009). Recently, it
became evident that aerosols are rich in viable bacterial
populations and can act as a carrier for a variety of
microorganisms that may impact human health and the
environment (Griffin et al., 2001; Prospero et al., 2005;
Brodie et al., 2007). In the Southern Hemisphere, Austra-
lia is the main source of dust, which exits the continent
frequently and deposits into the Tasman Sea and can go
as far as New Zealand as well into the eastern Indian
Ocean (Bowler, 1976; Hesse, 1994; McGowan et al., 2000;
De Deckker et al., 2010). Numerous dust storms have
been documented in Australia (Liversidge, 1902; Raupach
et al., 1994), including the dust plume that engulfed
Canberra in October 2002 (McTainsh et al., 2005; De
Deckker et al., 2008) and more recently Sydney in Sep-
tember 2009. A detailed characterization of dust samples
from the former event showed that the dust was gener-
ated from wind erosion of the regolith in arid and semi-
arid regions and harbored a large diversity of soil-related
microorganisms (De Deckker et al., 2008). Using satellite
ª 2011 Federation of European Microbiological Societies FEMS Microbiol Ecol 80 (2012) 294–304Published by Blackwell Publishing Ltd. All rights reserved
MIC
ROBI
OLO
GY
EC
OLO
GY
imagery and geochemical fingerprinting, the primary
source of this dust was identified to be from inland saline
lake sediments (SLS) and adjacent biological soil crusts
(BSC) of southeastern Australia. Although the microbial
composition of dusts from Australia has been studied
using cultivation and molecular tools (De Deckker et al.,
2008; Munday C & Allison G, unpublished), little is
known about the bacterial community structure of their
sources. It is essential to create a microbiological database
of deflating areas, which erode as a consequence of sand
and dust being removed from SLS and BSC by the wind,
to gain a better understanding of the origin, bacterial
composition and transport pathways of eolian dust.
Inland saline lakes are numerous in Australia, encom-
passing a wide range of salinities (up to 35%) and differ
in their morphometry, geology and degree of permanence
(Williams, 1981b; De Deckker, 1988; De Deckker & Wil-
liams, 1988). The Southern Australian lakes are character-
ized by their semi-arid to arid environments, with a
maximum temperature of > 45 °C reached in some sum-
mers and an annual evaporation rate of well over
1000 mm (Williams, 1981b). These lakes have been
studied for their geology, chemical limnology and biota
(Williams, 1981a, b; De Deckker & Williams, 1988 and
references therein); however, little is known about their
microbial composition. Likewise, the BSC surrounding
these lakes have not been investigated for the diversity of
their microorganisms, although much is known about the
Australian crusts’ eukaryotic diversity (i.e. mosses and
lichen) and their role in soil stability and fertilization
(Eldridge, 2001 and references therein; Eldridge et al.,
2006; Read et al., 2008). We will consider the possibility
that the BSC community near a lake is influenced by the
adjacent lake community because of the deposition of
lake bottom sediment.
The aim of this study is threefold: (1) to create a data-
base of DNA fingerprints and 16S rRNA sequences of
microbial communities in SLS and their adjacent BSC,
identified previously as potential sources of the Canberra
2002 dust plume, (2) to find out the effects of different
environmental parameters on their structure, and (3) to
compare bacterial communities of the dust sample with
those potential sources.
Materials and methods
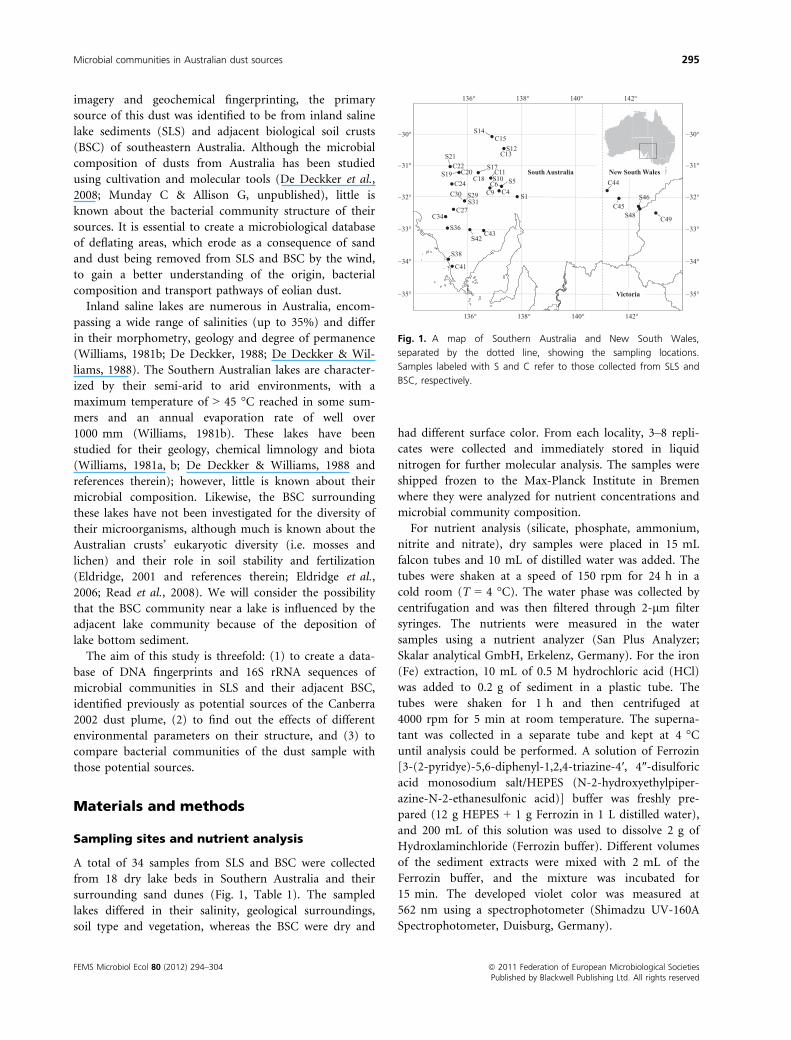
Sampling sites and nutrient analysis
A total of 34 samples from SLS and BSC were collected
from 18 dry lake beds in Southern Australia and their
surrounding sand dunes (Fig. 1, Table 1). The sampled
lakes differed in their salinity, geological surroundings,
soil type and vegetation, whereas the BSC were dry and
had different surface color. From each locality, 3–8 repli-
cates were collected and immediately stored in liquid
nitrogen for further molecular analysis. The samples were
shipped frozen to the Max-Planck Institute in Bremen
where they were analyzed for nutrient concentrations and
microbial community composition.
For nutrient analysis (silicate, phosphate, ammonium,
nitrite and nitrate), dry samples were placed in 15 mL
falcon tubes and 10 mL of distilled water was added. The
tubes were shaken at a speed of 150 rpm for 24 h in a
cold room (T = 4 °C). The water phase was collected by
centrifugation and was then filtered through 2-lm filter
syringes. The nutrients were measured in the water
samples using a nutrient analyzer (San Plus Analyzer;
Skalar analytical GmbH, Erkelenz, Germany). For the iron
(Fe) extraction, 10 mL of 0.5 M hydrochloric acid (HCl)
was added to 0.2 g of sediment in a plastic tube. The
tubes were shaken for 1 h and then centrifuged at
4000 rpm for 5 min at room temperature. The superna-
tant was collected in a separate tube and kept at 4 °Cuntil analysis could be performed. A solution of Ferrozin
[3-(2-pyridye)-5,6-diphenyl-1,2,4-triazine-4′, 4″-disulforicacid monosodium salt/HEPES (N-2-hydroxyethylpiper-
azine-N-2-ethanesulfonic acid)] buffer was freshly pre-
pared (12 g HEPES + 1 g Ferrozin in 1 L distilled water),
and 200 mL of this solution was used to dissolve 2 g of
Hydroxlaminchloride (Ferrozin buffer). Different volumes
of the sediment extracts were mixed with 2 mL of the
Ferrozin buffer, and the mixture was incubated for
15 min. The developed violet color was measured at
562 nm using a spectrophotometer (Shimadzu UV-160A
Spectrophotometer, Duisburg, Germany).
–35° –35°
–34° –34°
–33° –33°
–32° –32°
–31° –31°
–30° –30°
136°
136°
138°
138°
140°
140°
142°
142°
S1C4S5C6
C9
S10C11
S12C13
S17
C18S19 C20
S21C22
C24
C27
S29C30S31
C34S36
S38
C41
S42C43
C44
C45S46
S48 C49
C15S14
South Australia New South Wales
Victoria
Fig. 1. A map of Southern Australia and New South Wales,
separated by the dotted line, showing the sampling locations.
Samples labeled with S and C refer to those collected from SLS and
BSC, respectively.
FEMS Microbiol Ecol 80 (2012) 294–304 ª 2011 Federation of European Microbiological SocietiesPublished by Blackwell Publishing Ltd. All rights reserved
Microbial communities in Australian dust sources 295
Microbial community analysis by automated
rRNA intergenic spacer analysis (ARISA)
The upper 1–2 mm of the samples (ca. 300–500 mg each)
were subjected to DNA extraction using the UltraClean
soil DNA isolation kit (MOBIO laboratories, Inc., Carls-
bad, CA) according to the manufacturer’s instructions.
Polymerase chain reaction (PCR) amplification was per-
formed in triplicate with the same amounts of DNA (as
determined by Nanodrop, Thermo Scientific, Germany)
using the universal primer ITSF and the FAM-labeled
eubacterial ITSReub primer (Cardinale et al., 2004) at
an annealing temperature of 55 °C. The PCR products
were purified using Sephadex G-50 Superfine (Sigma-
Aldrich, Munich, Germany). 150 ng of DNA was then
mixed with 0.5 lL of internal size standard MapMarker
1000 ROX (50–1000 bp; BioVentures Inc., Washington,
DC), and the amplified fragments were discriminated by
capillary electrophoresis on an ABI PRISM 3130xl Genetic
Analyzer (Applied Biosystems, Carlsbad, CA). The ARISA
profiles were analyzed using the GENEMAPPER software v
3.7 (Applied Biosystems). The total peak area per sample
was normalized to one, and only fragments between 100
and 1000 bp were considered. A ‘fixed window’ binning
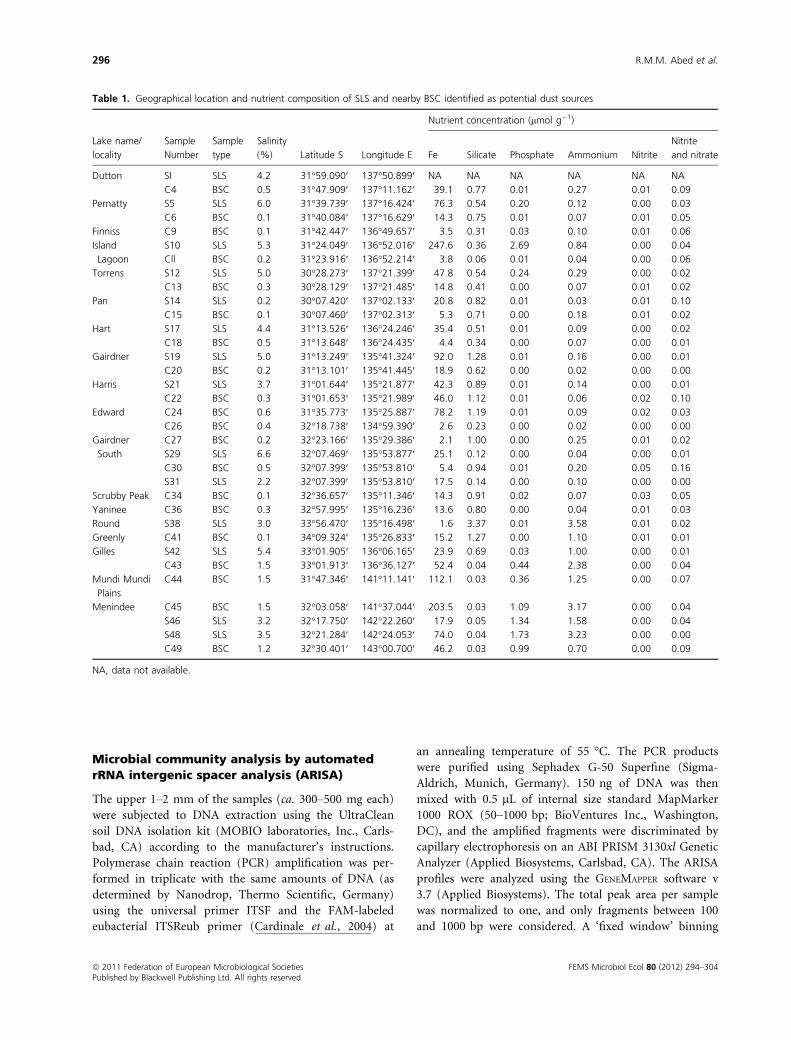
Table 1. Geographical location and nutrient composition of SLS and nearby BSC identified as potential dust sources
Lake name/
locality
Sample
Number
Sample
type
Salinity
(%) Latitude S Longitude E
Nutrient concentration (lmol g�1)
Fe Silicate Phosphate Ammonium Nitrite
Nitrite
and nitrate
Dutton SI SLS 4.2 31°59.090′ 137°50.899′ NA NA NA NA NA NA
C4 BSC 0.5 31°47.909′ 137°11.162′ 39.1 0.77 0.01 0.27 0.01 0.09
Pernatty S5 SLS 6.0 31°39.739′ 137°16.424′ 76.3 0.54 0.20 0.12 0.00 0.03
C6 BSC 0.1 31°40.084′ 137°16.629′ 14.3 0.75 0.01 0.07 0.01 0.05
Finniss C9 BSC 0.1 31°42.447′ 136°49.657′ 3.5 0.31 0.03 0.10 0.01 0.06
Island
Lagoon
S10 SLS 5.3 31°24.049′ 136°52.016′ 247.6 0.36 2.69 0.84 0.00 0.04
Cll BSC 0.2 31°23.916′ 136°52.214′ 3.8 0.06 0.01 0.04 0.00 0.06
Torrens S12 SLS 5.0 30°28.273′ 137°21.399′ 47.8 0.54 0.24 0.29 0.00 0.02
C13 BSC 0.3 30°28.129′ 137°21.485′ 14.8 0.41 0.00 0.07 0.01 0.02
Pan S14 SLS 0.2 30°07.420′ 137°02.133′ 20.8 0.82 0.01 0.03 0.01 0.10
C15 BSC 0.1 30°07.460′ 137°02.313′ 5.3 0.71 0.00 0.18 0.01 0.02
Hart S17 SLS 4.4 31°13.526′ 136°24.246′ 35.4 0.51 0.01 0.09 0.00 0.02
C18 BSC 0.5 31°13.648′ 136°24.435′ 4.4 0.34 0.00 0.07 0.00 0.01
Gairdner S19 SLS 5.0 31°13.249′ 135°41.324′ 92.0 1.28 0.01 0.16 0.00 0.01
C20 BSC 0.2 31°13.101′ 135°41.445′ 18.9 0.62 0.00 0.02 0.00 0.00
Harris S21 SLS 3.7 31°01.644′ 135°21.877′ 42.3 0.89 0.01 0.14 0.00 0.01
C22 BSC 0.3 31°01.653′ 135°21.989′ 46.0 1.12 0.01 0.06 0.02 0.10
Edward C24 BSC 0.6 31°35.773′ 135°25.887′ 78.2 1.19 0.01 0.09 0.02 0.03
C26 BSC 0.4 32°18.738′ 134°59.390′ 2.6 0.23 0.00 0.02 0.00 0.00
Gairdner
South
C27 BSC 0.2 32°23.166′ 135°29.386′ 2.1 1.00 0.00 0.25 0.01 0.02
S29 SLS 6.6 32°07.469′ 135°53.877′ 25.1 0.12 0.00 0.04 0.00 0.01
C30 BSC 0.5 32°07.399′ 135°53.810′ 5.4 0.94 0.01 0.20 0.05 0.16
S31 SLS 2.2 32°07.399′ 135°53.810′ 17.5 0.14 0.00 0.10 0.00 0.00
Scrubby Peak C34 BSC 0.1 32°36.657′ 135°11.346′ 14.3 0.91 0.02 0.07 0.03 0.05
Yaninee C36 BSC 0.3 32°57.995′ 135°16.236′ 13.6 0.80 0.00 0.04 0.01 0.03
Round S38 SLS 3.0 33°56.470′ 135°16.498′ 1.6 3.37 0.01 3.58 0.01 0.02
Greenly C41 BSC 0.1 34°09.324′ 135°26.833′ 15.2 1.27 0.00 1.10 0.01 0.01
Gilles S42 SLS 5.4 33°01.905′ 136°06.165′ 23.9 0.69 0.03 1.00 0.00 0.01
C43 BSC 1.5 33°01.913′ 136°36.127′ 52.4 0.04 0.44 2.38 0.00 0.04
Mundi Mundi
Plains
C44 BSC 1.5 31°47.346′ 141°11.141′ 112.1 0.03 0.36 1.25 0.00 0.07
Menindee C45 BSC 1.5 32°03.058′ 141°37.044′ 203.5 0.03 1.09 3.17 0.00 0.04
S46 SLS 3.2 32°17.750′ 142°22.260′ 17.9 0.05 1.34 1.58 0.00 0.04
S48 SLS 3.5 32°21.284′ 142°24.053′ 74.0 0.04 1.73 3.23 0.00 0.00
C49 BSC 1.2 32°30.401′ 143°00.700′ 46.2 0.03 0.99 0.70 0.00 0.09
NA, data not available.
ª 2011 Federation of European Microbiological Societies FEMS Microbiol Ecol 80 (2012) 294–304Published by Blackwell Publishing Ltd. All rights reserved
296 R.M.M. Abed et al.

strategy with a bin size of 2 bp was applied to the ARISA
data (Ramette, 2009), and the binning frame that offered
the highest pairwise similarities among samples was sub-
jected to multivariate analyses. An operational taxonomic
unit (OTU) was considered present in a given sample
only if it was detected at least twice among the three rep-
licated PCRs from the DNA extracts of that particular
sample (Ramette, 2009).
Statistical analysis of ARISA fingerprints was carried
out using the PAST program (Paleontological Statistics,
ver. 1.47, http://folk.uio.no\ohammer\past). A multivari-
ate analysis of all sites was performed using multidimen-
sional scaling (MDS) based on Bray–Curtis similarities
as described in (Ramette, 2007). Ordination of the Bray
–Curtis similarities was performed using non-metric
MDS, with 100 random restarts, and the results were
plotted in two-dimensions. The consensus ARISA table
containing samples by OTUs was used to calculate
pairwise similarities among samples based on the Bray–Curtis similarity index. Analysis of similarities (ANO-
SIM) was carried out to test for significant differences
between SLS and BSC microbial communities. ANOSIM
produces a sample statistic (R), which represents the
degree of separation between test groups (Clarke, 1993;
Ramette, 2007).
Canonical redundancy analysis (RDA) was used to
investigate the significance of salinity, sample type (SLS
vs. BSC), geographical location, vegetation, soil type, and
rainfall on the shape of microbial communities in SLS
and BSC samples. ARISA profiles were first Hellinger
transformed (Legendre & Gallagher, 2001; Ramette,
2007), and the effect of different parameters was investi-
gated by canonical variation partitioning (Borcard et al.,
1992; Ramette & Tiedje, 2007), where the variation and
covariation of these parameters were partitioned into
pure and covarying fractions. For each response data
model, the most significant variables were selected by
RDA using stepwise selection and by minimizing the
Akaike Information Criterion. Statistical significances
were assessed by 1000 permutation of the reduced mod-
els. All statistical calculations were performed with the R
statistical platform using the VEGAN and MASS packages.
Pyrosequencing and sequence analyses
Purified DNA extracts of 20 representative SLS and BSC
samples (10 each) from different geological provinces
were submitted to the Research and Testing Laboratory
(RTL, Lubbock, TX) for tag pyrosequencing. Bacterial
tag-encoded FLX amplicon pyrosequencing (bTEFAP)
was performed as described before (Dowd et al., 2008a,
b) using the GS FLX titanium sequencing kit XLR70.
One-step PCR was performed using a mixture of hot start
and hot start high fidelity tag polymerases resulting in
amplicons that extend 350–450 bp from the 27F region
(Escherichia coli rRNA numbering). The bTEFAP sequenc-
ing was performed according to the RTL protocols (www.
researchandtesting.com). Obtained sequences were
trimmed; low quality ends and tags were removed and
were checked for chimeras using custom software (Dowd
et al., 2008b) and the Black Box Chimera Check software
B2C2 (freely available at http://www.researchandtesting.
com/B2C2.html). Sequences < 300 bp were excluded
from further analysis, and the rest were checked for high
quality based on criteria utilized by RDP ver 9 (Cole et al.,
2009). These sequences were analyzed and taxonomically
classified using a distributed BLASTN.NET algorithm
(Dowd et al., 2005) against a database of high quality 16S
rRNA gene sequences obtained from NCBI. The outputs
were compiled and validated using taxonomic distance
methods (Dowd et al., 2008a, b). Rarefaction curves,
OTU number, and diversity estimates (Chao 1, ACE)
were calculated using the software ESPRIT (Sun et al.,
2009) available freely at http://www.biotech.ufl.edu/
people/sun/esprit.html. For large sequence datasets, the
average diversity indices were calculated after performing
3–5 randomized selection of 4500 and 3000 sequences for
SLS and BSC samples, using a custom script.
Results
Iron and nutrients composition
The analyzed suite of nutrients was selected because they
have been shown to disperse with dust over large dis-
tances (McTainsh & Strong, 2007). Clear variations were
observed in Fe and nutrient concentrations among the
studied sites (Table 1). Fe concentration ranged from 1.6
to 248 lmol g�1 soil with the lowest values detected in
Round Lake and Lake Gairdner South and highest in
Island Lagoon and the Menindee region. Most samples
collected from near Menindee had higher concentrations
of Fe, phosphate, and ammonium than the other samples,
whereas the concentrations of silicate were lower. Phos-
phate concentration was < 0.2 lmol g�1 in all samples
except in the Menindee samples where it ranged between
0.36 and 1.73 lmol g�1. The SLS had higher phosphate
concentrations than the surrounding BSC. Nitrite and
nitrate concentrations were < 0.16 lmol g�1 in all sam-
ples, while ammonium concentrations ranged from 0.02
to 3.58 lmol g�1. Both SLS and BSC samples from the
Menindee-Broken Hill area showed the highest total
nitrogen concentrations of all samples. The N:P ratio
showed clear variations between sites and ranged from
1 : 1 to 600 : 1, thus some sites were nitrogen-limited
while others were phosphate-limited.
FEMS Microbiol Ecol 80 (2012) 294–304 ª 2011 Federation of European Microbiological SocietiesPublished by Blackwell Publishing Ltd. All rights reserved
Microbial communities in Australian dust sources 297
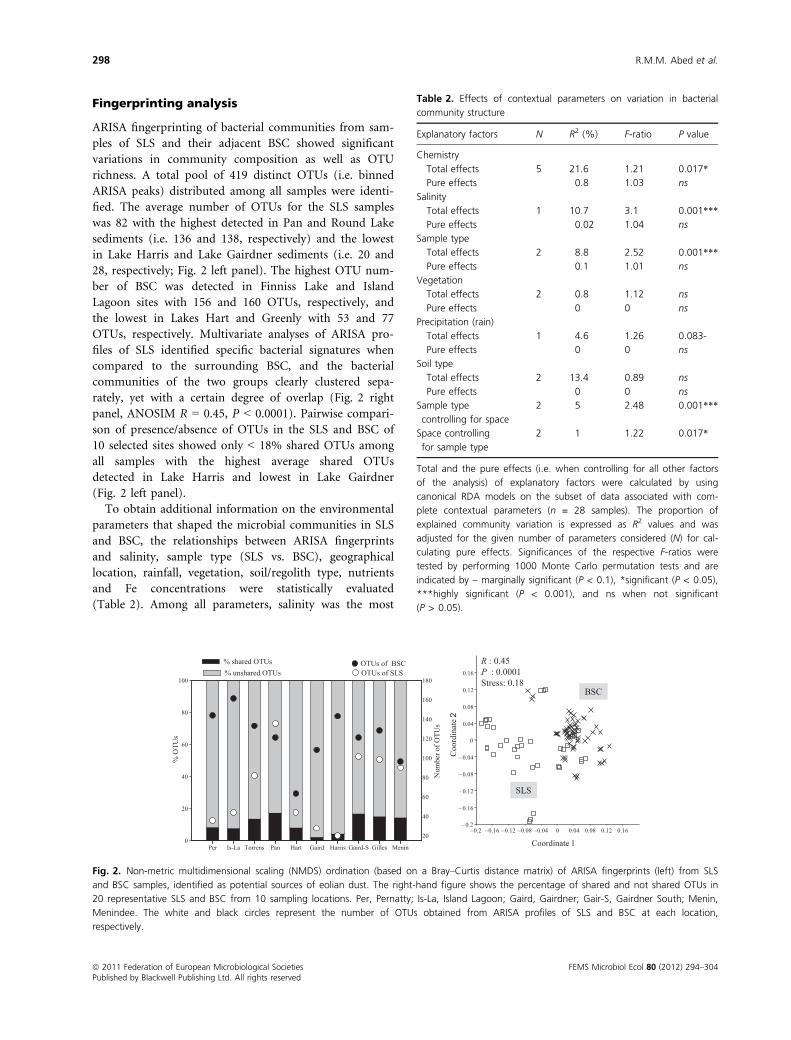
Fingerprinting analysis
ARISA fingerprinting of bacterial communities from sam-
ples of SLS and their adjacent BSC showed significant
variations in community composition as well as OTU
richness. A total pool of 419 distinct OTUs (i.e. binned
ARISA peaks) distributed among all samples were identi-
fied. The average number of OTUs for the SLS samples
was 82 with the highest detected in Pan and Round Lake
sediments (i.e. 136 and 138, respectively) and the lowest
in Lake Harris and Lake Gairdner sediments (i.e. 20 and
28, respectively; Fig. 2 left panel). The highest OTU num-
ber of BSC was detected in Finniss Lake and Island
Lagoon sites with 156 and 160 OTUs, respectively, and
the lowest in Lakes Hart and Greenly with 53 and 77
OTUs, respectively. Multivariate analyses of ARISA pro-
files of SLS identified specific bacterial signatures when
compared to the surrounding BSC, and the bacterial
communities of the two groups clearly clustered sepa-
rately, yet with a certain degree of overlap (Fig. 2 right
panel, ANOSIM R = 0.45, P < 0.0001). Pairwise compari-
son of presence/absence of OTUs in the SLS and BSC of
10 selected sites showed only < 18% shared OTUs among
all samples with the highest average shared OTUs
detected in Lake Harris and lowest in Lake Gairdner
(Fig. 2 left panel).
To obtain additional information on the environmental
parameters that shaped the microbial communities in SLS
and BSC, the relationships between ARISA fingerprints
and salinity, sample type (SLS vs. BSC), geographical
location, rainfall, vegetation, soil/regolith type, nutrients
and Fe concentrations were statistically evaluated
(Table 2). Among all parameters, salinity was the most
–0.2 –0.16 –0.12 –0.08 –0.04 0 0.04 0.08 0.12 0.16
Coordinate 1
– 0.2
– 0.16
– 0.12
– 0.08
– 0.04
0
0.04
0.08
0.12
0.16
Coo
rdin
ate2
BSC
SLS
R : 0.45P : 0.0001Stress: 0.18
Per Is-La Torrens Pan Hart Gaird Harris Gaird-S Gilles Menin
% O
TUs
0
20
40
60
80
100
% shared OTUs
Num
ber o
f OTU
s
20
40
60
80
100
120
140
160
180OTUs of SLSOTUs of BSC
% unshared OTUs
Fig. 2. Non-metric multidimensional scaling (NMDS) ordination (based on a Bray–Curtis distance matrix) of ARISA fingerprints (left) from SLS
and BSC samples, identified as potential sources of eolian dust. The right-hand figure shows the percentage of shared and not shared OTUs in
20 representative SLS and BSC from 10 sampling locations. Per, Pernatty; Is-La, Island Lagoon; Gaird, Gairdner; Gair-S, Gairdner South; Menin,
Menindee. The white and black circles represent the number of OTUs obtained from ARISA profiles of SLS and BSC at each location,
respectively.
Table 2. Effects of contextual parameters on variation in bacterial
community structure
Explanatory factors N R2 (%) F-ratio P value
Chemistry
Total effects 5 21.6 1.21 0.017*
Pure effects 0.8 1.03 ns
Salinity
Total effects 1 10.7 3.1 0.001***
Pure effects 0.02 1.04 ns
Sample type
Total effects 2 8.8 2.52 0.001***
Pure effects 0.1 1.01 ns
Vegetation
Total effects 2 0.8 1.12 ns
Pure effects 0 0 ns
Precipitation (rain)
Total effects 1 4.6 1.26 0.083-
Pure effects 0 0 ns
Soil type
Total effects 2 13.4 0.89 ns
Pure effects 0 0 ns
Sample type
controlling for space
2 5 2.48 0.001***
Space controlling
for sample type
2 1 1.22 0.017*
Total and the pure effects (i.e. when controlling for all other factors
of the analysis) of explanatory factors were calculated by using
canonical RDA models on the subset of data associated with com-
plete contextual parameters (n = 28 samples). The proportion of
explained community variation is expressed as R2 values and was
adjusted for the given number of parameters considered (N) for cal-
culating pure effects. Significances of the respective F-ratios were
tested by performing 1000 Monte Carlo permutation tests and are
indicated by – marginally significant (P < 0.1), *significant (P < 0.05),
***highly significant (P < 0.001), and ns when not significant
(P > 0.05).
ª 2011 Federation of European Microbiological Societies FEMS Microbiol Ecol 80 (2012) 294–304Published by Blackwell Publishing Ltd. All rights reserved
298 R.M.M. Abed et al.
important structuring factor (10.7% of variance
explained, P = 0.001) followed by the SLS or BSC sample
type (Table 2). Some covariation among factors was
detected, and pure effects (i.e. effects because of a single
factor taking all other factors into account) were generally
not significant. All other factors accounted for < 1% of
the variations in ARISA patterns.
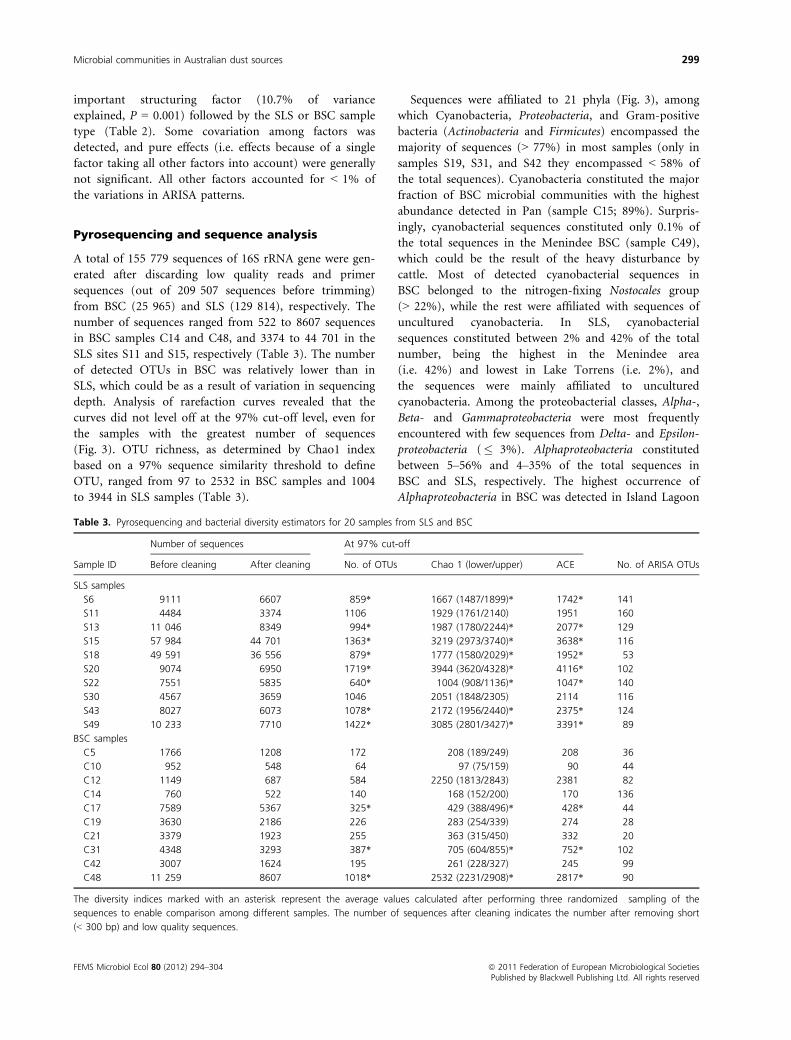
Pyrosequencing and sequence analysis
A total of 155 779 sequences of 16S rRNA gene were gen-
erated after discarding low quality reads and primer
sequences (out of 209 507 sequences before trimming)
from BSC (25 965) and SLS (129 814), respectively. The
number of sequences ranged from 522 to 8607 sequences
in BSC samples C14 and C48, and 3374 to 44 701 in the
SLS sites S11 and S15, respectively (Table 3). The number
of detected OTUs in BSC was relatively lower than in
SLS, which could be as a result of variation in sequencing
depth. Analysis of rarefaction curves revealed that the
curves did not level off at the 97% cut-off level, even for
the samples with the greatest number of sequences
(Fig. 3). OTU richness, as determined by Chao1 index
based on a 97% sequence similarity threshold to define
OTU, ranged from 97 to 2532 in BSC samples and 1004
to 3944 in SLS samples (Table 3).
Sequences were affiliated to 21 phyla (Fig. 3), among
which Cyanobacteria, Proteobacteria, and Gram-positive
bacteria (Actinobacteria and Firmicutes) encompassed the
majority of sequences (> 77%) in most samples (only in
samples S19, S31, and S42 they encompassed < 58% of
the total sequences). Cyanobacteria constituted the major
fraction of BSC microbial communities with the highest
abundance detected in Pan (sample C15; 89%). Surpris-
ingly, cyanobacterial sequences constituted only 0.1% of
the total sequences in the Menindee BSC (sample C49),
which could be the result of the heavy disturbance by
cattle. Most of detected cyanobacterial sequences in
BSC belonged to the nitrogen-fixing Nostocales group
(> 22%), while the rest were affiliated with sequences of
uncultured cyanobacteria. In SLS, cyanobacterial
sequences constituted between 2% and 42% of the total
number, being the highest in the Menindee area
(i.e. 42%) and lowest in Lake Torrens (i.e. 2%), and
the sequences were mainly affiliated to uncultured
cyanobacteria. Among the proteobacterial classes, Alpha-,
Beta- and Gammaproteobacteria were most frequently
encountered with few sequences from Delta- and Epsilon-
proteobacteria (� 3%). Alphaproteobacteria constituted
between 5–56% and 4–35% of the total sequences in
BSC and SLS, respectively. The highest occurrence of
Alphaproteobacteria in BSC was detected in Island Lagoon
Table 3. Pyrosequencing and bacterial diversity estimators for 20 samples from SLS and BSC
Sample ID
Number of sequences At 97% cut-off
No. of ARISA OTUsBefore cleaning After cleaning No. of OTUs Chao 1 (lower/upper) ACE
SLS samples
S6 9111 6607 859* 1667 (1487/1899)* 1742* 141
S11 4484 3374 1106 1929 (1761/2140) 1951 160
S13 11 046 8349 994* 1987 (1780/2244)* 2077* 129
S15 57 984 44 701 1363* 3219 (2973/3740)* 3638* 116
S18 49 591 36 556 879* 1777 (1580/2029)* 1952* 53
S20 9074 6950 1719* 3944 (3620/4328)* 4116* 102
S22 7551 5835 640* 1004 (908/1136)* 1047* 140
S30 4567 3659 1046 2051 (1848/2305) 2114 116
S43 8027 6073 1078* 2172 (1956/2440)* 2375* 124
S49 10 233 7710 1422* 3085 (2801/3427)* 3391* 89
BSC samples
C5 1766 1208 172 208 (189/249) 208 36
C10 952 548 64 97 (75/159) 90 44
C12 1149 687 584 2250 (1813/2843) 2381 82
C14 760 522 140 168 (152/200) 170 136
C17 7589 5367 325* 429 (388/496)* 428* 44
C19 3630 2186 226 283 (254/339) 274 28
C21 3379 1923 255 363 (315/450) 332 20
C31 4348 3293 387* 705 (604/855)* 752* 102
C42 3007 1624 195 261 (228/327) 245 99
C48 11 259 8607 1018* 2532 (2231/2908)* 2817* 90
The diversity indices marked with an asterisk represent the average values calculated after performing three randomized sampling of the
sequences to enable comparison among different samples. The number of sequences after cleaning indicates the number after removing short
(< 300 bp) and low quality sequences.
FEMS Microbiol Ecol 80 (2012) 294–304 ª 2011 Federation of European Microbiological SocietiesPublished by Blackwell Publishing Ltd. All rights reserved
Microbial communities in Australian dust sources 299

and the Menindee area (i.e. 29% and 56%, respectively)
and most of these sequences were phylogenetically affili-
ated to Microvirga flocculans, Skermanella parooensis,
Microvirga subterranea, and Rubellimicrobium thermophi-
lum. In SLS, the sequences were related to the genera
Rhodovibrio, Azospirillum, Defluviicoccus, Roseomonas,
Microvirga, Magnetospirillum, and Rubellimicrobium. The
Beta- and Gammaproteobacteria were more dominant in
SLS samples than in BSC (3–47% vs. 0.2–3%) and con-
tained sequences related to Delftia acidovorans and Pseu-
domonas spp., respectively. Actinobacteria-related
sequences were detected in all studied SLS and BSC with
an abundance of < 20% of total sequences in some sam-
ples (e.g. samples 5, 11, 12, 14, and 49). Sequences from
this high GC group included the radiation-resistant spe-
cies Rubrobacter radiotolerans, Thermoleophilum album,
and Patulibacter minatonensis. The spore-forming Firmi-
cutes group was much more abundant in SLS than in
BSC, where they only formed � 2% of the total
sequences. This group accounted for 70% of the total
sequences detected in Gairdner (sample 19) and con-
tained sequences related to different species of Bacillus,
Clostridium, and Staphylococcus. The remaining less
dominant groups were distributed among Bacteriodetes,
Deinococcus, Sphingobacteria, Planctomycetes, Chloroflexi,
Gemmatimonadetes, Thermomicrobia, Chlorobia, Sparto-
bacteria, Caldilineae, Solibacteres, and Ktedonobacteria.
Discussion
The combination of ARISA and pyrosequencing provided
detailed information on the microbial communities
occurring at the sites identified as potential sources of
eolian dust in Australia. SLS and BSC represent tremen-
dous sources of unconsolidated sediments available for
deflation and eolian transport (Blank et al., 1999; Rey-
nolds et al., 2006; Neff et al., 2008). The investigated
samples from SLS and the surrounding BSC harbored a
wide variety of microorganisms, with a large proportion
of novel types that had no close match in publicly avail-
able 16S rRNA gene databases. The microbiological data
obtained in this study may eventually help back tracking
of regional dust sources.
The differences in microbial communities between SLS
and BSC, shown by ARISA fingerprinting, were further
supported by pyrosequencing. Pyrosequencing provided
greater resolution and a more complete picture of bacte-
rial diversity than ARISA, as indicated by the higher
number of OTUs and the rarefaction curves generated
from pyrosequencing data. The differences of bacterial
communities of SLS and BSC could not be explained by
variation in nutrients, soil type, vegetation, precipitation,
or geology of the region but were mainly attributed to
significant differences in salinity and sample type. Salinity
has been shown to control the diversity and functions of
% of total sequences
0 20 40 60 80 100
Num
ber o
f OTU
s
0
100
200
300
400
500
600
700
C12 (687)
C17 (5367) C31 (3293)
C21 (1923)C19 (2186)C42 (1624)C5 (1208)C14 (522)
C10 (548)
0 20 40 60 80 1000
1000
2000
3000
4000
5000
6000
7000S6 (1368)
S11 (3374)
S20 (2757)S49 (2617)
S13 (1840)
S30 (1046)S43 (1600)
S22 (854)
SLS
BSC
0
20
40
60
80
100
120
CyanobacteriaAlphaproteobacteriaBetaproteobacteriaGammaproteobacteriaDeltaproteobacteriaEpsilonproteobacteriaActinobacteriaBacilli/clostridiumBacteriodetesSphingobacteriaPlanctomycetesDeinococciChloroflexiOthers
Site
Per Is-La Torrens Pan Hart Gaird Harris Gair-S Gilles Menin
Rel
ativ
e ab
unda
nce
(%)
0
20
40
60
80
100
BSC libraries
SLS libraries
S5 S10 S12 S14 S17 S19 S21 S31 S42 S48
C6 C11 C13 C15 C18 C20 C22 C30 C43 C49
Fig. 3. Rarefaction curves of bacterial communities (left panel) and taxonomic affiliation and relative abundance (right panel) of the most
common bacterial groups encountered by pyrosequencing of 20 samples of SLS and BSC. Per, Pernatty; Is-La, Island Lagoon; Gaird, Gairdner;
Gair-S, Gairdner South; Menin, Menindee.
ª 2011 Federation of European Microbiological Societies FEMS Microbiol Ecol 80 (2012) 294–304Published by Blackwell Publishing Ltd. All rights reserved
300 R.M.M. Abed et al.

microbial communities (Casamayor et al., 2002; Abed
et al., 2007; Lozupone & Knight, 2007). The higher water
content, steep chemical gradients of SLS, and limited
exchange between these adjacent biota can also account
for these differences. Our nutrient analysis showed that
SLS and BSC varied in their Fe, P, and N composition,
with some soils limited in P while others were limited in
N. However, it is remarkable that these ambient differ-
ences in these nutrients were not associated with observa-
ble differences in community structure. Bacterial diversity
has been shown to follow a chaotic pattern when species
compete for three or more resources (e.g. nutrients),
which means that diversity of bacterial communities is
not explained only by external factors but also potentially
by other interactions, such as competition among species
(Huisman & Weissing, 1999; Winter et al., 2010). Even in
a stable ecosystem with controlled environmental parame-
ters, bacterial diversity has been shown to change dramat-
ically (Fernandez et al., 1999).
The microbial communities of dust sources studied
here were compared with those of a previously deter-
mined Australian dust sample (De Deckker et al., 2008)
to find common bacterial groups. Although the samples
were analyzed using two different techniques (i.e. pyrose-
quencing and Sanger sequencing), comparison was still
possible because both techniques were previously shown
to yield similar results in spite of their methodological
biases (Tedersoo et al., 2010). Both techniques are simi-
larly based on PCR amplification but differ only in terms
of sequencing depth. The comparison of dust and dust
sources bacterial communities suggests that deflation of
bacteria with dust is a selective process. Although cyano-
bacteria constituted a major fraction of the dust sources
(16% and 56% of the total sequences of SLS and BSC,
respectively), their contribution to the dust sample was
only 2% (De Deckker et al., 2008). Cyanobacterial frac-
tion was also shown to be minor (only 2.7%) in the bac-
terial communities of African dust (Polymenakou et al.,
2008). This low representation of cyanobacteria in dust
could be attributed to their filamentous structure and to
the production of extrapolymeric substances that allow
them to stick firmly to substrate, thus preventing their
dispersal during deflation. It could also be owing to the
fact that disturbed BSC, which normally contain low
abundance of cyanobacterial filaments (Belnap & Eldridge,
2001), are more likely to deflate by wind and thus may be
primary contributors to aerosols. The low detection of cy-
anobacteria in the disturbed BSC of Menindee, a known
deflating area in Australia (McTainsh et al., 2005), sup-
ports this assumption. Cyanobacteria constituted the
major component (20–76%) of the prokaryotic commu-
nity in the studied BSC, most of which belonged to the
known heterocystous nitrogen-fixing Nostocales. This eco-
logically important group of cyanobacteria was found to
be dominant in many BSC in arid and semi-arid environ-
ments worldwide, as their nitrogen fixation is essential for
the surrounding vegetation (Dodds et al., 1995; Potts,
2000; Yeager et al., 2007; Abed et al., 2010). Although No-
stocales includes species that are desiccation-tolerant and
highly adapted to life under strong UV radiation through
the production of the UV sunscreen pigment scytonemin
(Dillon & Castenholz, 2003; Fleming & Castenholz, 2007),
which are advantageous features for the survival of these
microorganisms at higher altitudes, their detection in dust
samples was not common.
Other bacterial groups, on the other hand, identified in
the studied SLS and BSC were similar to those found in
the Canberra dust sample from 2002 (De Deckker et al.,
2008), implying that microorganisms from these ecosys-
tems can be readily transported with dust. For example,
Proteobacteria, Actinobacteria, and Firmicutes were among
the most common groups in dusts and their sources.
Gram-positive bacteria (i.e. Actinobacteria and Firmicutes)
were detected in all the source sediments examined here.
This widespread distribution and the ability of these
bacteria to form spores and tolerate desiccation and high
UV levels explain their prevalence in dust samples (Grif-
fin et al., 2001; De Deckker et al., 2008). Gram-positive
bacteria accounted for 23% of the total microbial
communities in the Australian dust (De Deckker et al.,
2008). This group was also found dominant in African
dusts (Polymenakou et al., 2008). Actinobacteria inhabit
extreme environments like hypersaline lakes, thermal
springs, and arid soils and also include a large number of
spore-forming plant and animal pathogens (Stackebrandt
& Schumann, 2006). Our Actinobacteria sequences were
related to thermal and UV-resistant species like Rubrob-
acter radiotolerans, Thermoleophilum album, but not to
known pathogens. The presence of Firmicutes mainly in
SLS but not in BSC indicates that saline lakes are the
major source of this group in dust samples. This group
of microorganisms constituted 23% of the total 16S
rRNA sequences obtained from the Australian dust (De
Deckker et al., 2008) and related strains were readily
cultured from the same sample (Chris Munday, person.
commun.). While our Firmicutes sequences were related
to 15 different Bacillus species and 2 Clostridium species,
cultured species of this group were mainly affiliated to
the genera Arthrobacter, Bacillus, Planomicrobium, Paeni-
bacillus, Curtobacterium, Macrococcus, and Staphylococcus
(Chris Munday, pers. commun.). The ability to cultivate
spore-forming Firmicutes-related species from aerosols
shows their resilience against the extreme atmospheric
conditions of water scarcity and high levels of UV radia-
tion, with dust probably the important distribution vector
for these microorganisms. Many spores are few microme-
FEMS Microbiol Ecol 80 (2012) 294–304 ª 2011 Federation of European Microbiological SocietiesPublished by Blackwell Publishing Ltd. All rights reserved
Microbial communities in Australian dust sources 301

ters in diameter and could survive within cracks of soil
particles and clay platelets, which would protect them
from UV radiation, or they may also attach to large parti-
cles or clumps (Griffin et al., 2001; Prospero et al., 2005).
Indeed, it was shown that 50% of the UV radiation is
attenuated within large dust plumes through back scatter
(Herman et al., 1999). In our study, no pathogenic
microorganisms were found, although Actinobacteria and
Firmicutes are known to include pathogens (Stackebrandt
& Schumann, 2006; Pakarinen et al., 2008). Interestingly,
a correlation between the predominance of Gram-positive
bacteria in Russian dusts and the occurrence of atopy
(i.e. allergic reactions) was found (Pakarinen et al., 2008).
Conversely, fungi, which were not studied here, are a
major constituent of BSC and can be a major cause of
asthma and fever. Consequently, it is possible that aero-
sols can transfer microorganisums that may be of concern
to human health (Griffin, 2007).
The highest concentrations of Fe, P, and N were
detected in soils from Menindee, an area previously identi-
fied as a major dust source in Australia (McTainsh et al.,
2005; De Deckker et al., 2008). It is likely that ecosystems
downwind from these sites receive nutrients by dust ema-
nating from SLS and BSC of the region as proposed previ-
ously (McTainsh & Strong, 2007). The direct transfer of N
and P from source soils may affect soil formation and fer-
tility (Cattle et al., 2002; Hesse & McTainsh, 2003;
McTainsh & Strong, 2007). For instance, dust was shown
to deposit at an average of 31.4 t km�2 year�1 onto the
upper Namoi River Valley in New South Wales, which is
known to be a very productive agricultural region (Cattle
et al., 2002). P is commonly a limiting nutrient in desert
soils and can govern plant growth and productivity, as well
as affect carbon and nitrogen mineralization rates in
deserts (Reynolds et al., 2006). In theory, the nitrogen-fix-
ing cyanobacteria in BSC, once transported with dust,
could lead to increased fertility of the sink soil. However,
we found low numbers of these organisms in dust, and it is
debatable whether these organisms, adapted to a specific
environment, will proliferate in the sink. Dust may also act
as an agent for the spread of soluble salts, because the stud-
ied saline lakes with salinities up to 22% have been shown
to be highly erodible dust source areas in Australia
(McTainsh et al., 1999). Indeed, soluble salt content of
Australian dusts was found to be between 2.7% and 9.3%
(McTainsh et al., 1999). Iron was also found in high
concentrations in some of our dust source samples. Large-
scale iron fertilization experiments significantly boosted
primary productivity in oceans (Griffin & Kellogg, 2004
and reference therein). However, rarely a clear relation
between the occurrence of phytoplankton blooms and dust
storms has been reported and most dust deposition events
did not result in blooms (McTainsh & Strong, 2007).
In conclusion, our study shows that dust sources are
highly diverse in UV-resistant and spore-forming bacterial
communities and also contains nutrients that can be
transported with the aerosols, thus rendering dust not
only as a medium for long-range transport of viable
microorganisms, but also a periodic source of nutrients
for nutrient-depleted terrestrial and marine environments.
Our work, however, does not preclude the possibility that
dust microorganisms could have been derived from
sources other than those presented in this study, as
microorganisms could be recruited from other ecosystems
into dust plumes during their journey prior to being
deposited. Nonetheless, our study provides a comprehen-
sive molecular baseline that would help in back tracking
microorganisms in dust samples.
Acknowledgements
The authors would like to thank Jan-Berend Stuut, Gwen
Allison, Chris Munday, Nigel Tapper, and Marlene
Bausch for their help during sampling and discussions.
Martina Alisch and Anna Lichtschlag from the Max-
Planck Institute are thanked for their help in the nutrient
analysis. This research was funded by the Australian
Research Council (ARC grant DP0772180) and the Max-
Planck Society.
References
Abed RMM, Kohls K & de Beer D (2007) Effect of salinity
changes on the bacterial diversity, photosynthesis and
oxygen consumption of cyanobacterial mats from an
intertidal flats of the Arabian Gulf. Environ Microbiol 9:
1384–1392.
Abed RMM, Kharusi SA, Schramm A & Robinson MD (2010)
Bacterial diversity, pigments and nitrogen fixation of
biological desert crusts from the Sultanate of Oman. FEMS
Microbiol Ecol 72: 418–428.Belnap J & Eldridge DJ (2001) Disturbance and recovery of
biological soil crusts. Biological Soil Crusts: Structure,
Management and Function (Belnap J & Lange O, eds), pp.
363–383. Springer-Verlag, Berlin, Germany.
Blank RR, Young JA & Allen FL (1999) Aeolian dust in a
saline playa environment, Nevada, U.S.A. J Arid Environ 41:
365–381.Borcard D, Legendre P & Drapeau P(1992) Partialling out the
spatial component of ecological variation. Ecology 73: 1045–1055.
Bowler JM (1976) Aridity in Australia: age, origins and
expressions in aeolian landforms and sediments. Earth-Sci
Rev 12: 279–310.Brodie EL, De Santis TZ, Parker JPM, Zubietta IX, Piceno YM
& Andersen GL (2007) Urban aerosols harbor diverse and
ª 2011 Federation of European Microbiological Societies FEMS Microbiol Ecol 80 (2012) 294–304Published by Blackwell Publishing Ltd. All rights reserved
302 R.M.M. Abed et al.

dynamic bacterial population. P Natl Acad Sci USA 104:
299–304.Cardinale ML, Brusetti Quatrini P, Borin S, Puglia AM, Rizzi
A, Zanardini E, Sorlini C, Corselli C & Daffonchio D (2004)
Comparison of different primer sets for use in automated
intergenic spacer analysis of complex bacterial communities.
Appl Environ Microbiol 70: 6147–6156.Casamayor EO, Massana R, Benlloch S, Øvreas L, Diez B,
Goddard V, Gasol JM, Joint I, Rodrıguez-Valera F &
Pedros-Alio C (2002) Changes in archaeal, bacterial and
eukaryal assemlages along a salinity gradient by comparison
of genetic fingerprinting methods in a mutipond solar
saltern. Environ Microbiol 4: 338–348.
Cattle SR, McTainsh GH & Wagner S (2002) Aeolian dust
contributions to soil of the Namoi Valley, northern NSW,
Australia. Catena 47: 245–264.Clarke KR (1993) Non-parametric multivariate analysis of
changes in community structure. Aust J Ecol 18: 117–143.Cole JR, Wang Q, Cardenas E et al. (2009) The ribosomal
database project: improved alignment and new tools for
rRNA analysis. Nucleic Acids Res 37: D141–D145.De Deckker P (1988) Biological and sedimentary facies of
Australian salt lakes. Palaeogeogr Palaeoclimatol Palaeoecol
62: 237–270.De Deckker P & Williams WD (1988) Physico-chemical
limnology of eleven, mostly saline permanent lakes in
western Victoria, Australia. Hydrobiologia 162: 275–286.De Deckker P, Abed RMM, de Beer D, Hinrichs K-U,
O’Loingsigh T, Schefuß E, Stuut J-B, Tapper NJ & van der
Kaars S (2008) Geochemical and microbiological
fingerprinting of airborne dust that fell in Canberra,
Australia, in October 2002. Geochem Geophys Geosyst 9: 1–22.De Deckker P, Norman M, Goodwin IA, Wain A & Gingele
FX (2010) Lead isotopic evidence for an Australian source
of aeolian dust to Antarctica at times over the last
170,000 years. Palaeogeogr Palaeoclimatol Palaeoecol 285:
205–233.Dillon JG & Castenholz RW (2003) The synthesis of the
UV-screening pigment, scytonemin, and photosynthetic
performance in isolates from closely related natural
populations of cyanobacteria (Calothrix sp.). Environ
Microbiol 5: 484–491.Dodds WK, Gudder DA & Mollenhauer D (1995) The ecology
of Nostoc. J Phycol 31: 2–18.Dowd SE, Zaragoza J, Rodriguez JR, Oliver MJ & Payton PR
(2005) Windows. NET network distributed basic local
alignment search toolkit (W.ND-BLAST). BMC
Bioinformatics 6: 93.
Dowd SE, Sun Y, Wolcott RD, Domingo A & Carroll JA
(2008a) Bacterial tag encoded FLX amplicon pyrosequencing
(bTEFAP) for microbiome studies: bacterial diversity in the
ileum of newly weaned Salmonella-infected pigs. Foodborne
Pathog Dis 5: 459–472.Dowd SE, Callaway TR, Wolcott RD, Sun Y, McKeehan T,
Hagevoort RG & Edrington TS (2008b) Evaluation of the
bacterial diversity in the feces of cattle using 16S rDNA
bacterial tag-encoded FLX amplicon pyrosequencing
(bTEFAP). BMC Microbiol 8: 125.
Eldridge DJ (2001) Biological soil crusts and water relations of
Australian deserts. Biological Soil Crusts: Structure,
Management and Function (Belnap J & Lange O, eds), pp.
315–326. Springer-Verlag, Berlin, Germany.
Eldridge DJ, Freudenberger D & Koen TB (2006) Diversity and
abudance of biological soil crust taxa in relation to fine and
coarse-scale diturbances in a grassy eucalypt woodland in
eastern Australia. Plant Soil 281: 255–268.Fernandez A, Huang S, Seston S, Xing J, Hicky R, Criddle C &
Tiedje J (1999) How stable is stable? function versus
community composition. Appl Environ Microbiol 65: 3697–3704.
Fleming ED & Castenholz RW (2007) Effects of periodic
desiccation on the synthesis of the UV-screening compound,
scytonemin, in cyanobacteria. Environ Microbiol 9: 1448–1455.Griffin DW (2007) Atmospheric movement of microorganisms
in clouds of desert dust and implications for human health.
Clin Microbiol Rev 20: 459–477.Griffin DW & Kellogg CA (2004) Dust storms and their
impact on ocean and human health: dust in Earth’s
atmosphere. EcoHealth 1: 284–295.Griffin DW, Garrison VH, Herman JR & Shinn EA (2001)
African desert dust in the Caribbean atmosphere:
Microbiology and public health. Aerobiologia 17: 203–213.
Herman JR, Krotkov N, Celarier E, Larko D & Labow G
(1999) The distribution of UV radiation at the earth’s
surface from TOMS measured UV backscattered radiances.
J Geophys Res 104: 12059–12076.Hesse PP (1994) The record of continental dust from Australia
in Tasman Sea sediments. Quat Sci Rev 13: 257–272.Hesse PP & McTainsh GH (2003) Australian dust deposits:
modern processes and the Quaternary record. Quat Sci Rev
22: 2007–2035.Huisman J & Weissing FJ (1999) Biodiversity of plankton by
species oscillations and chaos. Nature 402: 407–410.Legendre P & Gallagher ED (2001) Ecologically meaningful
transformation for ordination of species data. Oecologia 129:
271–280.Liversidge A (1902) Meteoric dusts, New South Wales. J Proc
R Soc NSW 36: 241–285.Lozupone CA & Knight R (2007) Global patterns in bacterial
diversity. PNAS 104: 11436–11440.McGowan HA, McTainsh GH & Peyman Z-R (2000)
Identifying regional dust transport pathways: application of
kinematic trajectory modelling to a trans Tasman case.
Earth Surf Proc Land 25: 633–647.McTainsh G & Strong C (2007) The role of aeolian dust in
ecosystems. Geomorphology 89: 39–54.McTainsh GH, Leys JF & Nickling WG (1999) Wind
erodibility of arid lands in the Channel Country of Western
Queensland, Australia. Z Geomorphol 116: 113–130.McTainsh G, Chan Y-C, McGowan H, Leys J & Tews K (2005)
The 23rd October 2002 dust storm in eastern Australia:
FEMS Microbiol Ecol 80 (2012) 294–304 ª 2011 Federation of European Microbiological SocietiesPublished by Blackwell Publishing Ltd. All rights reserved
Microbial communities in Australian dust sources 303
characteristics and meterological conditions. Atmos Environ
39: 1227–1236.Neff JC, Ballantyne AP, Farmer GL, Mahowald NM, Conroy
JL, Landry CC, Overpeck JT, Painter TH, Lawrence CR &
Reynolds RL (2008) Increasing eolian dust deposition in the
western United States linked to human activity. Nat Geosci
1: 189–195.Pakarinen J, Hyvarinen A, Salkinoja-Salonen M, Laitinen S,
Nevalainen A, Makela MJ, Haahtela T & von Hertzen L
(2008) Predominance of Gram-positive bacteria in house
dust in the low-allergy risk Russian Karelia. Environ
Microbiol 10: 3317–3325.Polymenakou PN, Mandalakis M, Stephanou EG & Tselepides
A (2008) Particle size distribution of airborne
microorgansims and pathogens during an intense African
dust event in the Eastern Mediterranean. Environ Health
Perspect 116: 292–296.Potts M (2000) Nostoc. The Ecology of Cyanobacteria (Whitton
BA & Potts M, eds), pp. 465–504. Kluwer Academic
Publishers, Dordrecht, the Netherlands.
Prospero JM (1999) Long-term measurements of the transport
of African mineral dust to the southeastern United States
US: implications for air quality. J Geophys Res 104: 15917–15927.
Prospero JM, Blades E, Mathison G & Naidu R (2005)
Interhemispheric transport of viable fungi and bacteria
from Africa to the Caribbean with soil dust. Aerobiologia 21:
1–19.Ramette A (2007) Multivariate analyses in microbial ecology.
FEMS Microbiol Ecol 62: 142–160.Ramette A (2009) Quantitative community fingerprinting
methods for estimating the abundance of operational
taxonomic units in natural microbial communities. Appl
Environ Microbiol 75: 2495–2505.Ramette A & Tiedje JM (2007) Multiscale responses of
microbial life to spatial distance and environmental
heterogenity in a patchy ecosystem. P Natl Acad Sci USA
104: 2761–2766.Raupach M, McTainsh G & Leys J (1994) Estimates of dust
mass in recent major Australian dust storms. Aust J Soil
Water Conserv 7: 20–24.Read CF, Duncan DH, Vesk PA & Elith J (2008) Biological
soil crust distribution is related to patterns of fragmentation
and landuse in a dryland agricultural landscape of southern
Australia. Landscape Ecol 23: 1093–1105.Reynolds RL, Reheis M, Yount J & Lamothe P (2006)
Composition of aeolian dust in natural traps on isolated
surfaces of the central Mojave Desert-Insight to mixing,
sources and nutrient inputs. J Arid Environ 66: 42–62.Stackebrandt E & Schumann P (2006) Introduction to the
Taxonomy of Actinobacteria. Springer Verlag, New York.
Stoorvogel JJ, Breemen NV & Hanssen BH (1997) The
nutrient input by Harmattan dust to a forest ecosystem in
Cote d’Ivoire, Africa. Biogeochemistry 37: 145–157.Sun Y, Cai Y, Liu L, Yu F, Farrell ML, McKendree W &
Farmerie W (2009) ESPRIT: estimating species richness
using large collections of 16S rRNA pyrosequences. Nucleic
Acids Res 37: e75.
Swap R, Garstang M, Grco S, Talbot R & Kalberg P (1992)
Saharan dust in the Amazon basin. Tellus 44: 133–149.Tedersoo L, Henrik Nilsson R, Abarenkov K, Jairus T, Sadam
A, Saar I, Bahram M, Bechem E, Chuyong G & Koljalg U
(2010) 454 pyrosequencing and Sanger sequencing of
tropical mycorrhizal fungi provide similar results but reveal
substantial methodological biases. New Phytol 188: 291–301.Uno I, Eguchi K, Yumimoto K, Takemura T, Shimizu A,
Uematsu M, Liu Z, Wang Z, Hara Y & Sugimoto (2009)
Asian dust transported one full circuit around the globe.
Nat Geosci 2: 557–560.Williams WD (1981a) Inland salt lakes: an introduction.
Hydobiologia 81: 1–14.Williams WD (1981b) The limnology of saline lakes in
Western Victoria: a review of some recent studies.
Hydrobiologia 82: 233–259.Winter C, Bouvier T, Weinbauer MG & Thingstad TF (2010)
Trade-offs between competition and defence specialists
among unicellular planktonic organisms: killing the winner
hypothesis revisited. Microbiol Mol Biol Rev 74: 42–57.Yeager CM, Kornosky JL, Morgan RE, Cain EC, Garcia-Pichel
F, Housman DC, Belnap J & Kuske CR (2007) Three
distinct clades of cultured heterocystous cyanobacteria
consitute the dominant N2-fixing members of biological soil
crusts of the colorado Plateau, USA. FEMS Microbiol Ecol
60: 85–97.
ª 2011 Federation of European Microbiological Societies FEMS Microbiol Ecol 80 (2012) 294–304Published by Blackwell Publishing Ltd. All rights reserved
304 R.M.M. Abed et al.