Soil OC and N Stocks in the Saline Soil of Tunisian Gataaya ...
16
Citation: Brahim, N.; Ibrahim, H.; Mlih, R.; Bouajila, A.; Karbout, N.; Bol, R. Soil OC and N Stocks in the Saline Soil of Tunisian Gataaya Oasis Eight Years after Application of Manure and Compost. Land 2022, 11, 442. https://doi.org/10.3390/ land11030442 Academic Editor: Evan Kane Received: 12 December 2021 Accepted: 4 February 2022 Published: 20 March 2022 Publisher’s Note: MDPI stays neutral with regard to jurisdictional claims in published maps and institutional affil- iations. Copyright: © 2022 by the authors. Licensee MDPI, Basel, Switzerland. This article is an open access article distributed under the terms and conditions of the Creative Commons Attribution (CC BY) license (https:// creativecommons.org/licenses/by/ 4.0/). land Article Soil OC and N Stocks in the Saline Soil of Tunisian Gataaya Oasis Eight Years after Application of Manure and Compost Nadhem Brahim 1, * , Hatem Ibrahim 2 , Rawan Mlih 3 , Abdelhakim Bouajila 4 , Nissaf Karbout 5,6 and Roland Bol 3,7 1 Laboratoire Plantes, Sols et Environnement LR21ES01, Faculty of Sciences of Tunis, University of Tunis El Manar, El Manar II, Tunis 2092, Tunisia 2 Faculty of Sciences of Bizerte, University of Carthage, Jarzouna 7021, Tunisia; [email protected] 3 Julich Research Center, Institute of Bio-Geoscience, Agrosphere Institute (IBG-3), 52428 Julich, Germany; [email protected] (R.M.); [email protected] (R.B.) 4 Faculty of Sciences of Gabes, University of Gabes, Gabes 6029, Tunisia; [email protected] 5 Eidg. Forschungsanstalt WSL Zürcherstrasse 111, CH-8903 Birmensdorf, Switzerland; [email protected] 6 Institute of Arid Regions, Km 22.5 Route du Djorf, Medenine 4119, Tunisia 7 School of Natural Sciences, Environment Centre Wales, Bangor University, Bangor LL57 2DG, UK * Correspondence: [email protected]; Tel.: +216-23-672-384 Abstract: Soil organic matter plays an important role in improving soil properties, crop productivity and is a key constituent and driver of the global carbon cycle. Nevertheless, relatively limited quantitative information is available on the organic carbon (OC) stocks and the actual potentials for OC and total nitrogen (N) sequestration under arid cropping systems. In this study, we evaluated the immediate and long-term (after eight years) effects of compost or manure additions, at a rate of 100 t ha -1 , on the soil OC and N stocks in the Gataaya oasis in Southern Tunisia. The oasis had been abandoned and no additions had taken place in the 10 years prior to experiment. Soil samples were taken systematically every 10 cm up to a depth of 50 cm. After adding compost (CMP) and manure (MAN) in 2013, the bulk density (BD) decreased in the surface layers, especially at the 0–10 cm soil layer where it declined from 1.53 g cm -3 to 1.38 g cm -3 under compost and 1.41 g cm -3 under manure. Soil OC and N stocks, however, increased after adding compost and manure. Manure contributed more to OC stock increase than compost, with +337 and +241%, respectively. Correspondingly, the N stock increased by + 47 and +12%, respectively, due to manure and compost. After four years, compared to 2013 stocks, the decrease in OC stock was almost identical with -43 (CMP) and -41% (MAN). However, N stock seemed more stable under compost compared to manure, with -2 and -19%, respectively. After eight years, the N stock remained higher in the deepest layer 30–50 cm compared to other layers. This suggested that high gypsum application can inhibit N mineralization. The initial enhanced OC stock after the organic amendment, both for compost and for manure, was very quickly lost and after eight years had virtually returned to the initial OC state by the end of the eight years. Therefore, these oasis ecosystems require a near annual supply of exogenous organic material to maintain OC at an enhanced level. After eight years, manure amendment was found to be better than compost for increasing soil OC (3.16 against 1.86 t/ha, respectively) and for increasing N (0.35 against 0.18 t/ha, respectively). However, the cost and availability make the amendment with compost more interesting in oasis (400 Tunisian dinars/t for compost against 1016 Tunisian dinars/t for manure). Keywords: drylands; Anthroposols; palm date compost; OC and N stocks; continental oasis 1. Introduction Creating oases around fresh water sources in a desert environment is a very old prac- tice. This technique consists of creating a surface horizon (≈50 cm), a so-called ‘anthropic horizon’ [1]. This horizon can be relatively rich in organic matter (>1%), especially in Land 2022, 11, 442. https://doi.org/10.3390/land11030442 https://www.mdpi.com/journal/land
-
Upload
khangminh22 -
Category
Documents
-
view
4 -
download
0
Transcript of Soil OC and N Stocks in the Saline Soil of Tunisian Gataaya ...

�����������������
Citation: Brahim, N.; Ibrahim, H.;
Mlih, R.; Bouajila, A.; Karbout, N.;
Bol, R. Soil OC and N Stocks in the
Saline Soil of Tunisian Gataaya Oasis
Eight Years after Application of
Manure and Compost. Land 2022, 11,
442. https://doi.org/10.3390/
land11030442
Academic Editor: Evan Kane
Received: 12 December 2021
Accepted: 4 February 2022
Published: 20 March 2022
Publisher’s Note: MDPI stays neutral
with regard to jurisdictional claims in
published maps and institutional affil-
iations.
Copyright: © 2022 by the authors.
Licensee MDPI, Basel, Switzerland.
This article is an open access article
distributed under the terms and
conditions of the Creative Commons
Attribution (CC BY) license (https://
creativecommons.org/licenses/by/
4.0/).
land
Article
Soil OC and N Stocks in the Saline Soil of Tunisian GataayaOasis Eight Years after Application of Manure and CompostNadhem Brahim 1,* , Hatem Ibrahim 2, Rawan Mlih 3, Abdelhakim Bouajila 4, Nissaf Karbout 5,6
and Roland Bol 3,7
1 Laboratoire Plantes, Sols et Environnement LR21ES01, Faculty of Sciences of Tunis, University of Tunis ElManar, El Manar II, Tunis 2092, Tunisia
2 Faculty of Sciences of Bizerte, University of Carthage, Jarzouna 7021, Tunisia; [email protected] Julich Research Center, Institute of Bio-Geoscience, Agrosphere Institute (IBG-3), 52428 Julich, Germany;
[email protected] (R.M.); [email protected] (R.B.)4 Faculty of Sciences of Gabes, University of Gabes, Gabes 6029, Tunisia; [email protected] Eidg. Forschungsanstalt WSL Zürcherstrasse 111, CH-8903 Birmensdorf, Switzerland; [email protected] Institute of Arid Regions, Km 22.5 Route du Djorf, Medenine 4119, Tunisia7 School of Natural Sciences, Environment Centre Wales, Bangor University, Bangor LL57 2DG, UK* Correspondence: [email protected]; Tel.: +216-23-672-384
Abstract: Soil organic matter plays an important role in improving soil properties, crop productivityand is a key constituent and driver of the global carbon cycle. Nevertheless, relatively limitedquantitative information is available on the organic carbon (OC) stocks and the actual potentials forOC and total nitrogen (N) sequestration under arid cropping systems. In this study, we evaluatedthe immediate and long-term (after eight years) effects of compost or manure additions, at a rateof 100 t ha−1, on the soil OC and N stocks in the Gataaya oasis in Southern Tunisia. The oasishad been abandoned and no additions had taken place in the 10 years prior to experiment. Soilsamples were taken systematically every 10 cm up to a depth of 50 cm. After adding compost(CMP) and manure (MAN) in 2013, the bulk density (BD) decreased in the surface layers, especiallyat the 0–10 cm soil layer where it declined from 1.53 g cm−3 to 1.38 g cm−3 under compost and1.41 g cm−3 under manure. Soil OC and N stocks, however, increased after adding compost andmanure. Manure contributed more to OC stock increase than compost, with +337 and +241%,respectively. Correspondingly, the N stock increased by + 47 and +12%, respectively, due to manureand compost. After four years, compared to 2013 stocks, the decrease in OC stock was almost identicalwith −43 (CMP) and −41% (MAN). However, N stock seemed more stable under compost comparedto manure, with −2 and −19%, respectively. After eight years, the N stock remained higher in thedeepest layer 30–50 cm compared to other layers. This suggested that high gypsum applicationcan inhibit N mineralization. The initial enhanced OC stock after the organic amendment, bothfor compost and for manure, was very quickly lost and after eight years had virtually returned tothe initial OC state by the end of the eight years. Therefore, these oasis ecosystems require a nearannual supply of exogenous organic material to maintain OC at an enhanced level. After eightyears, manure amendment was found to be better than compost for increasing soil OC (3.16 against1.86 t/ha, respectively) and for increasing N (0.35 against 0.18 t/ha, respectively). However, the costand availability make the amendment with compost more interesting in oasis (400 Tunisian dinars/tfor compost against 1016 Tunisian dinars/t for manure).
Keywords: drylands; Anthroposols; palm date compost; OC and N stocks; continental oasis
1. Introduction
Creating oases around fresh water sources in a desert environment is a very old prac-tice. This technique consists of creating a surface horizon (≈50 cm), a so-called ‘anthropichorizon’ [1]. This horizon can be relatively rich in organic matter (>1%), especially in
Land 2022, 11, 442. https://doi.org/10.3390/land11030442 https://www.mdpi.com/journal/land

Land 2022, 11, 442 2 of 16
comparison with the original soils (generally Lithosols), characterized by a poorly devel-oped, saline surface and gypsum accumulation at depth. These oasis soils are a resultof “soil engineering”, i.e., humans acting to improve a soil. They are therefore classifiedas anthroposols [2], such soil ‘modifications’ can affect part or all the profile. The modi-fications improve soil fertility, allowing for larger food production to feed livestock andthe local population. For oasis systems, they are in the majority of cases essentially theaddition of exogenous organic matter, most often in the form of manure. This ancestral landmanagement technique must be carried out on a (multi-) annual basis in order to preservethe arable anthropic horizon of the soils, thus preserving the oasis environment [3–5].
The irrigated date palms cultivation occupies a strategic key position in the develop-ment and support of life in arid and desert regions [6], and is especially relevant for theTunisian context as its drylands cover about half of its total land area. Most of the new oasesestablished since 2000 are now irrigated by unsustainable deep drilling practices. They areconcentrated on the cultivation of the Deglet Nour date variety mostly in south-westernTunisia. However, it is currently still the best mode of valorization of land in these areas [7]due to the high profitability of this date variety. The Tunisian Deglet Nour date exportsrepresent only 20% of total agriculture production. Overall, these exported Tunisian datesrepresent only 8% of world exports in quantity, but is internationally first placed in termsof its exports value (213 million TD, roughly the equivalent of 76 million US dollars) [6,8].
The present study area of Chott Djerid is in southwest Tunisia. This region is the maingrowing area of Deglet Nour date palm. Beside the growing of dates in the oasis systems,the land is used mainly for extensive livestock grazing by goats and camels. The oasisecosystem located in such desert areas requires copious irrigation and continuous humanmanagement intervention (pollination, fertilization) to maintain production levels [3,9–11].Oasis ecosystem management requires organic amendments, such as manure or alterna-tively compost (from date palm waste) to be made to the soil [3–5,12]. This is a sustainableproduction solution, but for these relatively poor farmers, however, an expensive one.Traditionally, the manure is therefore only applied under the trunks of date palms andamounts to 10 t/ha. The cost of one ton of manure is equivalent to 1016 Tunisian Dinar(TD), almost 10% of the basic cost in relation to the expected income. However, for compostit is much cheaper, at 400 TD/t. The oasis date palm cropping also requires further vitalmanagement expenses, including irrigation water, phytosanitary products, labor for tillage,replacement of dead tree dead trees, date harvesting, and pruning and pollination [13].The oasis soils are known to be very poor in organic matter because of climate conditions,and require a near continuous addition of manure and compost for optimal fertility [3–5].Therefore, it is still necessary to understand the temporal evolution of the organic stock(OC and N) in oasis soil. The aim of this study is to measure OC and N in a highly salineoasis soil. Indeed, the productivity of oasis soils is an integral function of the abundance ofthese two nutrients [14,15]. In this study, we follow the evolution of soil OC stocks and soilN stocks in two adjacent plots, one traditionally amended with manure and the other withcompost made from waste date palm pruning.
2. Materials and Methods2.1. Site Description, Experimental and Sampling Design
The continental oases of Kebili cover an area of 7000 ha. They are the largest palmgroves in southern Tunisia and represent a model situation of land development in SaharanTunisia. The Gataaya oasis (33◦40′45′’N and 8◦52′28′’E) is administratively attached tothe Kebili North and is located about 8 km southwest of the city of Kebili (Figure 1). TheGataaya North oasis, with a total net area of 57 ha, is the oldest and a typical exampleof other oases in the region, it was created in 1933 and Gataaya village is in it. The oasisis limited to the southwest by the Chott Djerid and southeast by the Takodit oasis. Thestudy area is characterized by a desert climate, average precipitation is 102.4 mm yr−1,its potential evapotranspiration is 2750.5 mm yr−1, average temperature 21.4 ◦C, and themaximum summer temperature can exceed 50 ◦C. The soils are saline gypsum soils. In

Land 2022, 11, 442 3 of 16
2012, the three study plots prior to the start of the experiment similar soil profiles areshown (Scheme 1). The oasis soil is relatively deep, with a saltwater table being presentat a 120 cm. This saltwater is related to the Chott Djerid, which is a salty depression. Thesoil color is almost the same throughout the profile. It is yellowish brown (10 YR 6/4), thestructure is grainy and there is a sandy–loamy texture. There is an abundant presence ofthe roots of date palms throughout the profile and the porosity is generally good. Gypsumcrystals are more abundant in the deeper soil horizons. The gypsum increases with depthas it approaches the water table. Beyond two meters, we have a hard accumulation ofreddish-yellow gypsum (7.5 YR 6/8).
Land 2022, 11, x FOR PEER REVIEW 3 of 17
area is characterized by a desert climate, average precipitation is 102.4 mm yr−1, its poten-
tial evapotranspiration is 2750.5 mm yr−1, average temperature 21.4 °C, and the maximum
summer temperature can exceed 50 °C. The soils are saline gypsum soils. In 2012, the three
study plots prior to the start of the experiment similar soil profiles are shown (Scheme 1).
The oasis soil is relatively deep, with a saltwater table being present at a 120 cm. This
saltwater is related to the Chott Djerid, which is a salty depression. The soil color is almost
the same throughout the profile. It is yellowish brown (10 YR 6/4), the structure is grainy
and there is a sandy–loamy texture. There is an abundant presence of the roots of date
palms throughout the profile and the porosity is generally good. Gypsum crystals are
more abundant in the deeper soil horizons. The gypsum increases with depth as it ap-
proaches the water table. Beyond two meters, we have a hard accumulation of reddish-
yellow gypsum (7.5 YR 6/8).
Figure 1. Geographic location maps of the study region and the experimental plots plan. CON: una-
mended control soil; CMP: soil with compost; MAN: soil with manure.
Scheme 1. Typical soil profile at the study site.
Historically, the oasis was abandoned for economic reasons, due to its aging trees
and low yields of dates, and no additions had been added in the 10 years prior to the
formal start of the experiment in 2012. Subsequently, since January 2012, an experiment
was carried out by the GDA Gataaya (i.e., the local agricultural development group of
Gataaya village) to examine the optimal restoration strategies for degraded or abandoned
oases.
The experimental area consisted of three adjacent treatment plots of ~1.5 ha each,
which are: (i) compost amended soil (CMP); (ii) manure amended soil (MAN); and (iii)
Figure 1. Geographic location maps of the study region and the experimental plots plan. CON:unamended control soil; CMP: soil with compost; MAN: soil with manure.
Land 2022, 11, x FOR PEER REVIEW 3 of 17
area is characterized by a desert climate, average precipitation is 102.4 mm yr−1, its poten-
tial evapotranspiration is 2750.5 mm yr−1, average temperature 21.4 °C, and the maximum
summer temperature can exceed 50 °C. The soils are saline gypsum soils. In 2012, the three
study plots prior to the start of the experiment similar soil profiles are shown (Scheme 1).
The oasis soil is relatively deep, with a saltwater table being present at a 120 cm. This
saltwater is related to the Chott Djerid, which is a salty depression. The soil color is almost
the same throughout the profile. It is yellowish brown (10 YR 6/4), the structure is grainy
and there is a sandy–loamy texture. There is an abundant presence of the roots of date
palms throughout the profile and the porosity is generally good. Gypsum crystals are
more abundant in the deeper soil horizons. The gypsum increases with depth as it ap-
proaches the water table. Beyond two meters, we have a hard accumulation of reddish-
yellow gypsum (7.5 YR 6/8).
Figure 1. Geographic location maps of the study region and the experimental plots plan. CON: una-
mended control soil; CMP: soil with compost; MAN: soil with manure.
Scheme 1. Typical soil profile at the study site.
Historically, the oasis was abandoned for economic reasons, due to its aging trees
and low yields of dates, and no additions had been added in the 10 years prior to the
formal start of the experiment in 2012. Subsequently, since January 2012, an experiment
was carried out by the GDA Gataaya (i.e., the local agricultural development group of
Gataaya village) to examine the optimal restoration strategies for degraded or abandoned
oases.
The experimental area consisted of three adjacent treatment plots of ~1.5 ha each,
which are: (i) compost amended soil (CMP); (ii) manure amended soil (MAN); and (iii)
Scheme 1. Typical soil profile at the study site.
Historically, the oasis was abandoned for economic reasons, due to its aging trees andlow yields of dates, and no additions had been added in the 10 years prior to the formalstart of the experiment in 2012. Subsequently, since January 2012, an experiment wascarried out by the GDA Gataaya (i.e., the local agricultural development group of Gataayavillage) to examine the optimal restoration strategies for degraded or abandoned oases.
The experimental area consisted of three adjacent treatment plots of ~1.5 ha each,which are: (i) compost amended soil (CMP); (ii) manure amended soil (MAN); and (iii) un-amended control without any additions (CON). Compost and manure were both ap-plied at an equivalent rate of 100 t/ha all over the whole soil area, but only once from22–24 January 2013 for manure and from 30 January to 1 February 2013 for compost.
The manure (excretal waste of sheep and goats) comes from the herds of the localfarmers living in the oases. The manure characteristics were: pH value 6.2, OC content46.8%, N content 6.2%, and P content 6.3%. For compost, essentially the waste of date palms

Land 2022, 11, 442 4 of 16
when pruning, was processed by small association of agricultural development associationin the oasis. The compost characteristics were: pH value 7.9, OC 37.2%, N 5.8%, and P 4.6%.
For the analysis, three individual samples were taken and analyzed from the wholemanure and compost pile. For the sampling, each treatment plot of ~1.5 ha was split intothree subsections (0.5 ha each). Each plot was subdivided into three sub-plots, each ofwhich had an area of almost 0.5 ha (Figure 1). The choice of locations for the samplingpoints was determined using a metal ring thrown at random in each of the subplots. Thus,from each plot 3 × 3 = 9 soil samples were taken for each sampling layer. The samples forsoil analysis were taken in the halfway between two date palms and for 0–10, 10–20, 20–30,and 30–50 cm depths. The first sampling took place in January 2013 (immediate after), thesecond in December 2016 (ca. 46–47 months after organic residue additions), and the thirdin December 2020 (ca. 94–95 months after initial residue additions).
2.2. Chemical Analysis, Soil OC Stocks and Soil N Stocks
The bulk density (BD) was determined by the cylindrical core method (BD = dry soilweight/cylinder volume). Soil OC content was measured by oxidation method of Walkeyand Black by the mixture of K2Cr2O7–H2SO4 [16]. Soil N was measured by the Kjeldahlmethod [17]. The particle size distribution (i.e., coarse sand, fine sand, coarse silt, fine silt,and clay) reflected that of the whole soil [18]. The soil pH was determined in (1:2.5) inwater suspension. Gypsum percentage was determined using the ammonium carbonatetreatment and precipitation by barium chloride [19]. Carbonates were analyzed accordingto the Scheibler method [20]. The electrical conductivity (EC) was analyzed in a saturatedsoil paste [21]. Sodium adsorption ratio (SAR) is an important parameter to analyze theeffective removal of sodium when dealing with water irrigation, for its elements Ca2+,Mg2+, and Na+ are measured using a high-performance liquid ion chromatograph, model881 (Compact IC). To estimate soil OC stocks in the upper 50 cm, we summed soil OCstocks of the individual layer. The soil OC and N stocks were calculated for each individuallayer using the following equations [22,23]:
Soil OC stock = OC × BD × D (1)
with OC in %, the BD in g cm−3, and sample depth (D) in cm. Soil OC stocks expressedin t C ha−1, then soil OC stock converted into g C m−2. The N stock (g N m−2) was alsocalculated in a similar manner.
2.3. Statistical Analysis
Data were analyzed using the statistical analysis software (IBM SPSS Statistics Version 20).The ANOVA test and the descriptive statistics for the different variables were conducted totest the significance of treatments, soil depth, year, their interaction regarding soil OC andtotal N stocks, and differences of p < 0.05 were considered statistically significant.
3. Results3.1. Pre-Experiment Soil Characteristics
Table 1 shows that the sand (CS+FS) and silt fractions (CSi+FSi) together making up90% of the particle size fractions in the soil texture determination. The soils were of thissandy to sandy–loamy texture throughout the profile. The soil pH values were generallyalkaline (7.5–7.8). The EC was always lowest in the surface (5.1 mS/cm), with highestEC value being observed in the deeper 30–50 cm layer (25.7 mS/cm). Gypsum contentswere higher at greater depth in the profile, i.e., ranging from 1.2% at 0–10 cm to 24.3% at30–50 cm depth. The SAR range in our soils ranged from 1.1 to 6.1, and with the electricalconductivity (EC) was also greater than 5 mS/cm. Soil calcium carbonate (CaCO3) rangedfrom 8.0% at the surface layer (0–10 cm) to 16.0% in the 20–30 cm layer, but it decreasedtowards the deeper layers where the gypsum (CaSO4.2H2O) becomes more dominant.

Land 2022, 11, 442 5 of 16
Table 1. Soil properties in 2012 (Mean ± Standard Error; n = 3).
Depth Particle Size (%)pH
Gypsum CaCO3 ECSAR
(cm) CS FS CSi FSi C (%) (%) (mS/cm)
0–10 33.1 ± 0.2 17.5 ± 0.4 18.1 ± 0.1 29.10 ± 0.2 3.0 ± 0.1 7.51 ± 0.01 1.2 ± 0.2 8.0 ± 0.2 5.1 ± 0.1 1.1 ± 0.110–20 33.1 ± 0.1 12.8 ± 0.1 8.2 ± 0.0 36.0 ± 0.2 9.0 ± 0.1 7.61 ± 0.01 2.0 ± 0.1 15.7 ± 0.2 17.7 ± 0.1 3.1 ± 0.120–30 30.1 ± 0.1 18.0 ± 0.1 5.0 ± 0.2 37.8 ± 0.1 9.0 ± 0.1 7.74 ± 0.09 12.1 ± 0.1 16.0 ± 0.4 15.5 ± 0.2 6.0 ± 0.230–50 31.2 ± 0.2 18.9 ± 0.1 6.0 ± 0.2 35.0 ± 0.1 5.1 ± 0.1 7.76 ± 0.01 24.3 ± 0.4 9.4 ± 0.4 25.7 ± 0.4 6.1 ± 0.0
CS: Coarse Sand (200–2000 µm); FS: Fine Sand (50–200 µm); CSi: Coarse Silt (20–50 µm); FSi: Fine Silt (2–20 µm);C: Clay (<2 µm); EC: Electrical Conductivity; SAR: Sodium adsorption ratio.
3.2. Soil Property Changes in the Field Experimental Plots
The OC after the organic residue amendment was different between CON, CMP, andMAN. The addition of the compost increased the OC contents in the different layers, butthe effect was larger for manure than the compost (Table 2). In three plots, soil OC washigher in the upper part of the soil (0–10 cm) when compared to the lower parts of the soil(30–50 cm) (Table 2). No difference in soil OC for the CON treatment occurred between2013 and 2016 for all soil depths. In 2013, the soil OC increased under CMP and MAN incomparison with CON. In all soils, OC was higher in the upper part (0–10 cm) comparedto lower down in soil profile (30–50 cm) (Table 2). The higher soil OC content of MANled to the manure bringing in more soil OC than the CMP, noticeable in all layers, butespecially in the surface layer (i.e., 16.42 g C kg−1 under MAN against 13.05 g C kg−1 soilOC under CMP). However, in 2016, a reduction in soil OC contents is clear, regardlessof the type of amendment made. For the surface layer 0–10 cm, the observed decreaseunder CMP is 44% from 13.05 to 7.34 g C kg−1; for MAN, the decrease is 42% from 16.42 to9.46 g C kg−1 (Table 2). In 2020, this decrease was very pronounced in all layers and underthe two MAN or CMP modes, for example, the soil OC content of the soil under MANwent from 16.42 g C kg−1 in 2013 to 6.58 g C kg−1 in 2020.
Table 2. Soil properties in the three plots under the three treatments between 2013 and 2020.
Depth OC (g C kg−1) N (g N kg−1) C/N BD (g cm−3) pH
2013
CON
0–10 Mean 4.12 0.29 14.01 1.54 7.50St. Dev. 0.38 0.00 1.05 0.01 0.01
10–20 Mean 3.35 0.38 8.96 1.54 7.47St. Dev. 1.29 0.01 3.54 0.01 0.07
20–30 Mean 1.80 0.86 2.07 1.62 7.43St. Dev. 0.43 0.04 0.41 0.01 0.02
30–50 Mean 1.00 0.63 1.61 1.70 7.44St. Dev. 0.06 0.06 0.26 0.01 0.01
CMP
0–10 Mean 13.05 0.87 15.07 1.48 7.47St. Dev. 0.37 0.01 0.37 0.04 0.02
10–20 Mean 9.66 0.75 12.96 1.53 7.50St. Dev. 2.11 0.00 2.89 0.02 0.07
20–30 Mean 7.38 0.75 9.87 1.65 7.57St. Dev. 0.95 0.00 1.23 0.03 0.09
30–50 Mean 4.20 0.42 9.90 1.74 7.62St. Dev. 0.41 0.00 1.02 0.03 0.05
MAN
0–10 Mean 16.42 1.03 16.02 1.43 7.64St. Dev. 0.53 0.00 0.52 0.04 0.04
10–20 Mean 11.54 0.88 13.10 1.51 7.68St. Dev. 0.18 0.00 0.17 0.05 0.02
20–30 Mean 9.47 0.96 9.96 1.58 7.64St. Dev. 0.42 0.08 1.19 0.08 0.04
30–50 Mean 6.36 0.69 9.14 1.73 7.67St. Dev. 1.45 0.03 1.82 0.03 0.05

Land 2022, 11, 442 6 of 16
Table 2. Cont.
Depth OC (g C kg−1) N (g N kg−1) C/N BD (g cm−3) pH
2016
CON
0–10 Mean 3.06 0.24 12.86 1.53 7.51St. Dev. 0.10 0.00 0.45 0.01 0.03
10–20 Mean 4.59 0.85 5.48 1.49 7.48St. Dev. 2.30 0.05 2.97 0.02 0.04
20–30 Mean 1.57 0.76 2.08 1.61 7.50St. Dev. 0.80 0.05 1.11 0.01 0.04
30–50 Mean 1.06 0.58 1.88 1.70 7.52St. Dev. 0.33 0.07 0.75 0.01 0.06
CMP
0–10 Mean 7.34 0.49 15.10 1.38 7.44St. Dev. 0.35 0.00 0.80 0.02 0.01
10–20 Mean 6.41 0.58 11.02 1.45 7.46St. Dev. 0.79 0.00 1.36 0.04 0.03
20–30 Mean 4.59 0.74 6.28 1.64 7.50St. Dev. 0.55 0.08 1.27 0.04 0.05
30–50 Mean 2.16 0.67 3.24 1.71 7.59St. Dev. 0.14 0.04 0.38 0.03 0.03
MAN
0–10 Mean 9.46 0.63 14.94 1.41 7.60St. Dev. 0.37 0.00 0.54 0.04 0.01
10–20 Mean 6.68 0.68 9.88 1.50 7.59St. Dev. 0.42 0.00 0.67 0.05 0.03
20–30 Mean 5.85 0.78 7.53 1.55 7.59St. Dev. 0.28 0.03 0.38 0.01 0.04
30–50 Mean 3.88 0.67 5.80 1.73 7.64St. Dev. 0.45 0.05 0.83 0.03 0.04
2020
CON
0–10 Mean 2.60 0.21 13.23 1.55 7.59St. Dev. 0.20 0.07 4.96 0.02 0.08
10–20 Mean 2.68 0.22 12.31 1.54 7.52St. Dev. 0.47 0.05 0.86 0.04 0.01
20–30 Mean 1.40 0.22 6.69 1.64 7.55St. Dev. 0.17 0.05 2.06 0.02 0.07
30–50 Mean 0.90 0.32 2.82 1.72 7.56St. Dev. 0.07 0.05 0.28 0.03 0.05
CMP
0–10 Mean 3.32 0.20 17.02 1.53 7.58St. Dev. 0.34 0.04 5.38 0.02 0.07
10–20 Mean 2.98 0.20 14.78 1.55 7.57St. Dev. 0.14 0.03 1.58 0.02 0.07
20–30 Mean 2.24 0.24 9.87 1.65 7.60St. Dev. 0.08 0.05 2.70 0.01 0.06
30–50 Mean 1.49 0.22 6.60 1.74 7.61St. Dev. 0.55 0.02 1.95 0.02 0.05
MAN
0–10 Mean 6.58 0.46 14.27 1.49 7.58St. Dev. 0.23 0.05 1.12 0.01 0.04
10–20 Mean 5.41 0.46 11.74 1.49 7.60St. Dev. 0.54 0.01 0.91 0.01 0.06
20–30 Mean 4.41 0.44 10.19 1.58 7.61St. Dev. 0.34 0.05 1.25 0.06 0.04
30–50 Mean 2.02 0.42 4.91 1.68 7.62St. Dev. 0.31 0.12 0.60 0.05 0.06
CON: unamended control soil; CMP: treatment with compost; MAN: treatment with manure.
The N in the experiment was also different between CON, CMP, and MAN, and itincreased between treatments in that order. The variation in the means of the soil N contentsbetween both plots was significantly different at all soil depths. In general, the contentsof N among soil depths followed the soil OC contents. The concentration was higher inthe upper soil layers and decreased gradually with soil depth (Table 2). The N contentsunder two treatments were different; both plots recorded a sharp increase in N at the upperlayer, where the value reached 1.03 g N kg−1 under MAN and 0.87 g N kg−1 under CMP.The highest N value (1.03 g N kg−1) in MAN was obtained at 0–10 cm depth, whereas thelowest value of 0.42 g N kg−1 was obtained in 30–50 cm at CMP treatment. We noted a 44%decrease in the 0–10 cm layer content for the CMP treatment from 0.87 g N kg−1 in 2013 to0.49 g N kg−1 in 2016. However, an increase in the deep layer of 60%, from 0.42 g N kg−1 in2013 to 0.67 g N kg−1 in 2016, which could be explained by the deep downward transport of

Land 2022, 11, 442 7 of 16
N with percolating irrigation water. For the MAN treatment, the decrease in the N contentconcerned all the layers, and there was a 39% decrease in the 0–10 cm surface layer, from1.03 g N kg−1 in 2013 to 0.63 g N kg−1 in 2016 and a slight decrease of 3% in the 30–50 cmlayer from 0.69 g N kg−1 in 2013 to 0.67 g N kg−1 in 2016. In 2020, the N contents for CONand CMP are almost similar on the order of 0.2 g N kg−1 in all layers. However, underMAN, the TN contents are almost double with 0.4 g N kg−1.
The soil pH values throughout profiles in the three treatments (MAN, CMP, and CON)were alkaline in three, ranging from 7.43 to 7.68 (2013), 7.44 to 7.64 (2016), and from 7.52to 7.62 (2020) (Table 2). Overall, the pH values in the upper 10 cm were generally slightlylower than below 10 cm depth for all three measurement periods. In the three plots, withouttreatment or with the addition of manure and compost, in general, the values of BD increasewith depth, the surface layers have the lowest values. Compaction of soil, especially athigher depths, and inadequate organic matter amendment along with more sandy texturemight have caused the relatively higher BD values. The BD values of the 30–50 cm layerwere independent of the treatment type and always of the order of 1.7 g cm−3. In 2013, wenoted a small improvement in the CMP and MAN compared to the control plot CON. Thisimprovement is more noticeable in 2016. Comparing the BD values in the 0–10 cm surfacelayer, we noted at the CMP level a transition from 1.48 g cm−3 in 2013 to 1.38 g cm−3 in2016. In the MAN plot, we also noted a small improvement from 1.43 g cm−3 in 2013 to1.41 g cm−3 in 2016 (Table 2). The improvement is clear in 2020 only at the level of theMAN treatment where the values of the apparent density are between 1.48 g cm−3 at thesurface and 1.68 g cm−3 at 50 cm depth.
For the C/N ratio under the three treatments and regardless of the years of measure-ments, it is always high at the surface and low under the surface (Table 2).
3.3. Soil OC and N Stocks in Three Experimental Treatments in 2013, 2016 and 2020
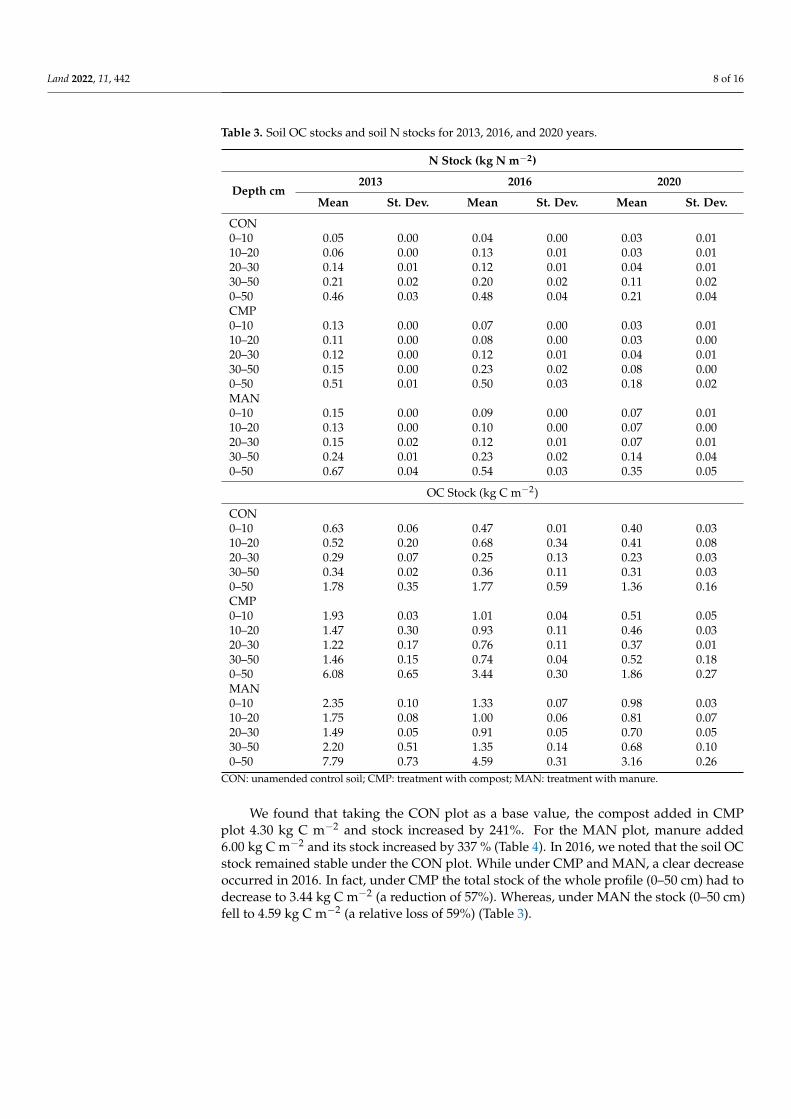
The results demonstrate that soil OC stocks track soil OC levels in each layer and thatthe stock decreases with depth (Figure 2). Comparing the stocks in 2013 at the 0–50 cmdepth between the three plots, we noted a significant increase of the stock under CMP(6.08 kg C m−2) and MAN (7.79 kg C m−2) in comparison with CON (1.78 kg C m−2)(Table 3).
Land 2022, 11, x FOR PEER REVIEW 9 of 17
(A) (B) (C)
Figure 2. Change in soil OC stocks over 8 years under the different treatments for the four sampled
profile depths. ((A–C) are respectively soil OC stocks in 2013, 2016, and 2020).
Table 4. Evolution of soil OC and N stocks between 2013 and 2016.
Depth (0–50 cm) OC Stock (kg C m−2) N Stock (kg N m−2)
Year 2013 2016 2020 2013 2016 2020
CON 1.78 ± 0.20 1.76 ± 0.34 1.36 ± 0.09 0.46 ± 0.02 0.48 ± 0.02 0.22 ± 0.03
CMP 6.08 ± 0.38 3.44 ± 0.17 1.86 ± 0.16 0.51 ± 0.01 0.50 ± 0.02 0.18 ± 0.01
MAN 7.79 ± 0.42 4.59 ± 0.18 3.16 ± 0.15 0.67 ± 0.02 0.55 ± 0.02 0.35± 0.03
CMP 2013‐
CON2013 4.30 (+241%) 0.06 (+12%)
MAN 2013‐
CON2013 6.00 (+337%) 0.21 (+47%)
CMP 2016‐
CON2016 1.67 (+95%) 0.02 (+4%)
MAN 2016‐
CON2016 2.83 (+ 160%) 0.06 (+ 13%)
CMP 2020‐
CON2020 0.50 (+37%) −0.04 (−18%)
MAN2020‐
CON2020 1.80 (+133%) 0.13 (+62%)
CMP 2016‐
CMP2013 −2.65 (−43%) −0.01 (−2%)
MAN 2016‐
MAN2013 −3.20 (−41%) −0.13 (−19%)
CMP 2020‐
CMP2013 −4.23 (−69%) −0.33 (−65%)
MAN 2020‐
MAN2013 −4.62 (−59%) −0.32 (−48%)
In 2020, the soil OC stock has decreased significantly under CMP and MAN. Indeed,
on 0–50 cm of depth, the stock for MAN decreased from 7.79 kg C m−2 in 2013 to 3.16 kg C
m−2 in 2020; for the CMP, the same result is observed, the stock also decreased by 6.08 kg
C m−2 at 1.86 kg C m−2 in 2020. The MAN remains a little advantageous in comparison with
CMP.
For the N stock, we found roughly the same findings as the soil OC stock. On the
depth of 50 cm, for the CON plot, 2013 and 2016 stocks are similar 0.46 and 0.48 kg N m−2,
respectively. This means, referring to the initial CON stock, compost brought 0.04 kg N
m−2 in CMP and manure 0.21 kg N m−2 in MAN. Therefore, overall, more N was found in
MAN than CMP, 0.67 and 0.51 kg N m−2 in 2013 and 0.54 and 0.50 kg N m−2 in 2016, re‐
spectively. Furthermore, only in the MAN, N stock decreased significantly (19%) between
2013 and 2016. In 2020, the soil N stock has the same evolution over time as for the soil
OC stock. However, there is a clear difference between the N stocks at the level of the deep
Figure 2. Change in soil OC stocks over 8 years under the different treatments for the four sampledprofile depths. ((A–C) are respectively soil OC stocks in 2013, 2016, and 2020).
Land 2022, 11, 442 8 of 16
Table 3. Soil OC stocks and soil N stocks for 2013, 2016, and 2020 years.
N Stock (kg N m−2)
Depth cm2013 2016 2020
Mean St. Dev. Mean St. Dev. Mean St. Dev.
CON0–10 0.05 0.00 0.04 0.00 0.03 0.0110–20 0.06 0.00 0.13 0.01 0.03 0.0120–30 0.14 0.01 0.12 0.01 0.04 0.0130–50 0.21 0.02 0.20 0.02 0.11 0.020–50 0.46 0.03 0.48 0.04 0.21 0.04CMP0–10 0.13 0.00 0.07 0.00 0.03 0.0110–20 0.11 0.00 0.08 0.00 0.03 0.0020–30 0.12 0.00 0.12 0.01 0.04 0.0130–50 0.15 0.00 0.23 0.02 0.08 0.000–50 0.51 0.01 0.50 0.03 0.18 0.02MAN0–10 0.15 0.00 0.09 0.00 0.07 0.0110–20 0.13 0.00 0.10 0.00 0.07 0.0020–30 0.15 0.02 0.12 0.01 0.07 0.0130–50 0.24 0.01 0.23 0.02 0.14 0.040–50 0.67 0.04 0.54 0.03 0.35 0.05
OC Stock (kg C m−2)
CON0–10 0.63 0.06 0.47 0.01 0.40 0.0310–20 0.52 0.20 0.68 0.34 0.41 0.0820–30 0.29 0.07 0.25 0.13 0.23 0.0330–50 0.34 0.02 0.36 0.11 0.31 0.030–50 1.78 0.35 1.77 0.59 1.36 0.16CMP0–10 1.93 0.03 1.01 0.04 0.51 0.0510–20 1.47 0.30 0.93 0.11 0.46 0.0320–30 1.22 0.17 0.76 0.11 0.37 0.0130–50 1.46 0.15 0.74 0.04 0.52 0.180–50 6.08 0.65 3.44 0.30 1.86 0.27MAN0–10 2.35 0.10 1.33 0.07 0.98 0.0310–20 1.75 0.08 1.00 0.06 0.81 0.0720–30 1.49 0.05 0.91 0.05 0.70 0.0530–50 2.20 0.51 1.35 0.14 0.68 0.100–50 7.79 0.73 4.59 0.31 3.16 0.26
CON: unamended control soil; CMP: treatment with compost; MAN: treatment with manure.
We found that taking the CON plot as a base value, the compost added in CMPplot 4.30 kg C m−2 and stock increased by 241%. For the MAN plot, manure added6.00 kg C m−2 and its stock increased by 337 % (Table 4). In 2016, we noted that the soil OCstock remained stable under the CON plot. While under CMP and MAN, a clear decreaseoccurred in 2016. In fact, under CMP the total stock of the whole profile (0–50 cm) had todecrease to 3.44 kg C m−2 (a reduction of 57%). Whereas, under MAN the stock (0–50 cm)fell to 4.59 kg C m−2 (a relative loss of 59%) (Table 3).

Land 2022, 11, 442 9 of 16
Table 4. Evolution of soil OC and N stocks between 2013 and 2016.
Depth (0–50 cm) OC Stock (kg C m−2) N Stock (kg N m−2)
Year 2013 2016 2020 2013 2016 2020CON 1.78 ± 0.20 1.76 ± 0.34 1.36 ± 0.09 0.46 ± 0.02 0.48 ± 0.02 0.22 ± 0.03CMP 6.08 ± 0.38 3.44 ± 0.17 1.86 ± 0.16 0.51 ± 0.01 0.50 ± 0.02 0.18 ± 0.01MAN 7.79 ± 0.42 4.59 ± 0.18 3.16 ± 0.15 0.67 ± 0.02 0.55 ± 0.02 0.35± 0.03
CMP 2013-CON2013 4.30 (+241%) 0.06 (+12%)MAN 2013-CON2013 6.00 (+337%) 0.21 (+47%)
CMP 2016-CON2016 1.67 (+95%) 0.02 (+4%)MAN 2016-CON2016 2.83 (+ 160%) 0.06 (+ 13%)
CMP 2020-CON2020 0.50 (+37%) −0.04 (−18%)MAN2020-CON2020 1.80 (+133%) 0.13 (+62%)
CMP 2016-CMP2013 −2.65 (−43%) −0.01 (−2%)MAN 2016-MAN2013 −3.20 (−41%) −0.13 (−19%)
CMP 2020-CMP2013 −4.23 (−69%) −0.33 (−65%)MAN 2020-MAN2013 −4.62 (−59%) −0.32 (−48%)
In 2020, the soil OC stock has decreased significantly under CMP and MAN. Indeed, on0–50 cm of depth, the stock for MAN decreased from 7.79 kg C m−2 in 2013 to 3.16 kg C m−2
in 2020; for the CMP, the same result is observed, the stock also decreased by 6.08 kg C m−2
at 1.86 kg C m−2 in 2020. The MAN remains a little advantageous in comparison with CMP.For the N stock, we found roughly the same findings as the soil OC stock. On the
depth of 50 cm, for the CON plot, 2013 and 2016 stocks are similar 0.46 and 0.48 kg N m−2,respectively. This means, referring to the initial CON stock, compost brought 0.04 kg N m−2
in CMP and manure 0.21 kg N m−2 in MAN. Therefore, overall, more N was found in MANthan CMP, 0.67 and 0.51 kg N m−2 in 2013 and 0.54 and 0.50 kg N m−2 in 2016, respectively.Furthermore, only in the MAN, N stock decreased significantly (19%) between 2013 and2016. In 2020, the soil N stock has the same evolution over time as for the soil OC stock.However, there is a clear difference between the N stocks at the level of the deep layerscompared to the surface layers. In fact, over a depth of 50 cm, almost 1/3 of the N stockresides in the 20–50cm layer (Figure 3).
Land 2022, 11, x FOR PEER REVIEW 10 of 17
layers compared to the surface layers. In fact, over a depth of 50 cm, almost 1/3 of the N stock resides in the 20–50cm layer (Figure 3).
(A) (B) (C)
Figure 3. Change in N stocks over 8 years under the different treatments. ((A–C) are respectively N stocks in 2013, 2016, and 2020).
Table 4 summarizes the main data on OC and N stocks according to the types of organic additions to the soil. Referring to the CON plot, after the addition of compost and manure in 2013 (CMP and MAN 2013), the soil OC stock increased by 241% and 337%, respectively. For N, the respective increases are 12% and 47%. After almost four years, by comparing soil OC and N stocks between 2016 and 2013, the decrease is very clear. Indeed, the loss of the soil OC stock is more than 40% for the two additions compost and manure, respectively 43% and 41%. For N, the respective decrease for CMP and MAN was 2% and 19%. It is remarkable that the N stock of compost has decreased very little compared to the manure. After eight years, comparing OC and N stocks between 2020 and 2013, the decrease is very clear; the loss of soil OC stock is almost 69% for compost and 59% for manure, and for N stock it is 65% and 48%, respectively. Comparing the stocks of 2020 with those of 2016, the N stock of compost fell rapidly from 2 to 65%, while that of manure decreased slowly from 19 to 48%.
Based on the motivating price of compost and especially its availability (obtained from waste the size of date palms), opting for an organic amendment of oasis soils with compost seems a very interesting technique in comparison with organic amendment by manure, which is expensive. Indeed, putting the double quantity in compost would be cheaper than manure and would increase soil OC and N stocks more than manure.
3.4. Evolution of Soil Variables as a Function of Time and Depth The descriptive measures (Table 2) show that the OC content decreases with depth
regardless of the mode of use (CON, CMP, and MAN). However, the N content under CON shows an increase with depth ranging from 0.89 g N kg−1 in the 0–10 cm surface layer to 1.48 g N kg−1 in the layer 30–50 cm. Under CMP, the TN content shows some stability with a content of 1.13 g N kg−1 in 0–10 cm and 1.11 g N kg−1 in the 30–50 cm layer, almost the same with the MAN mode where the values are 2.1 and 1.86 g N kg−1, respec-tively. The values of the BD in the 0–10cm layer decrease under MAN and CMP modes compared to CON, but in all cases the BD increases with depth under the effect of soil compaction.
The stocks of OC and N follow the same pattern as the contents of these two elements, and we notice that the stocks of OC have decreased according to the depth. The N stocks go up in reverse of what we have seen with the OC stocks, for the CON, CMP, and MAN mode going from the surface layer 0–10 cm to the deepest layer 30–50 cm, N stocks are 1.37; 1.69; 3.08 kg N m−2 and 5.08; 3.84; 6.28 kg N m−2.
In the three plots (CON, CMP, and MAN), OC is significantly correlated with the temporal variability (Years) which p-value is 0.00 and Wilks’ Lambda is 0.41, which im-plies that a unit variation in the time variable leads to a decrease in the OC content at a rate of 0.41% (Table 5).
Figure 3. Change in N stocks over 8 years under the different treatments. ((A–C) are respectively Nstocks in 2013, 2016, and 2020).
Table 4 summarizes the main data on OC and N stocks according to the types oforganic additions to the soil. Referring to the CON plot, after the addition of compost andmanure in 2013 (CMP and MAN 2013), the soil OC stock increased by 241% and 337%,respectively. For N, the respective increases are 12% and 47%. After almost four years, bycomparing soil OC and N stocks between 2016 and 2013, the decrease is very clear. Indeed,the loss of the soil OC stock is more than 40% for the two additions compost and manure,respectively 43% and 41%. For N, the respective decrease for CMP and MAN was 2% and19%. It is remarkable that the N stock of compost has decreased very little compared tothe manure. After eight years, comparing OC and N stocks between 2020 and 2013, thedecrease is very clear; the loss of soil OC stock is almost 69% for compost and 59% formanure, and for N stock it is 65% and 48%, respectively. Comparing the stocks of 2020with those of 2016, the N stock of compost fell rapidly from 2 to 65%, while that of manuredecreased slowly from 19 to 48%.

Land 2022, 11, 442 10 of 16
Based on the motivating price of compost and especially its availability (obtained fromwaste the size of date palms), opting for an organic amendment of oasis soils with compostseems a very interesting technique in comparison with organic amendment by manure,which is expensive. Indeed, putting the double quantity in compost would be cheaper thanmanure and would increase soil OC and N stocks more than manure.
3.4. Evolution of Soil Variables as a Function of Time and Depth
The descriptive measures (Table 2) show that the OC content decreases with depthregardless of the mode of use (CON, CMP, and MAN). However, the N content under CONshows an increase with depth ranging from 0.89 g N kg−1 in the 0–10 cm surface layer to1.48 g N kg−1 in the layer 30–50 cm. Under CMP, the TN content shows some stability witha content of 1.13 g N kg−1 in 0–10 cm and 1.11 g N kg−1 in the 30–50 cm layer, almost thesame with the MAN mode where the values are 2.1 and 1.86 g N kg−1, respectively. Thevalues of the BD in the 0–10cm layer decrease under MAN and CMP modes compared toCON, but in all cases the BD increases with depth under the effect of soil compaction.
The stocks of OC and N follow the same pattern as the contents of these two elements,and we notice that the stocks of OC have decreased according to the depth. The N stocksgo up in reverse of what we have seen with the OC stocks, for the CON, CMP, and MANmode going from the surface layer 0–10 cm to the deepest layer 30–50 cm, N stocks are 1.37;1.69; 3.08 kg N m−2 and 5.08; 3.84; 6.28 kg N m−2.
In the three plots (CON, CMP, and MAN), OC is significantly correlated with thetemporal variability (Years) which p-value is 0.00 and Wilks’ Lambda is 0.41, which impliesthat a unit variation in the time variable leads to a decrease in the OC content at a rate of0.41% (Table 5).
Table 5. ANOVA test for year, depth, and mode of treatment factors.
Fixed Factor Dependent Variable p-Value Wilks’ Lambda
Year OC 0.00 *** 0.41N 0.00 ***
Depth OC 0.00 *** 0.52N 0.91
Mode of treatment OC 0.00 *** 0.67N 0.00 ***
Depth ×Mode of treatment OC 0.63 0.93N 0.87
R2 = 0.63
Year N stock 0.00 *** 0.42OC stock 0.00 ***
Depth N stock 0.00 *** 0.51OC stock 0.16
Mode of treatment N stock 0.00 *** 0.67OC stock 0.00 ***
Depth ×Mode of treatment N stock 0.93 0.9OC stock 0.97
R2 = 0.63
Year BD 0.26 0.94pH 0.01 **
Depth BD 0.00 *** 0.12pH 0.01 **
Mode of use BD 0.00 *** 0.37pH 0.00 ***
Depth ×Mode of treatment BD 0.00 *** 0.69pH 0.01 **
R2 = 0.54** p < 0.01 and *** p < 0.001.
Concerning the quality of fit between the two variables OC and N with the depthand year variables, we note that the value of R2 is 0.63. It should be noted that the depth

Land 2022, 11, 442 11 of 16
variable has no effect on the N stock in the soil (p-value 0.91), a finding already advancedin the descriptive statistics (Table 5).
4. Discussion4.1. Physico-Chemical Variables
The pH results were predictable as they are attributed to the high salt contents en-crusted in soil layers which stem from the gypsum crust, resulting from irrigation withsaline water and rises of the underground watertable [24]. The pH in the soils studiedat the Gataaya oasis varies from 7.44 to 7.68. The high pH values could be explained byan upcoming of water from already saline aquifers (3.3 g L−1) of which all of the oasesare irrigated from [12]. Dryland soils in Tunisia are very poor in organic matter; theircontents do not exceed 0.8% [1]. However, at the oasis level, levels exceed 1% in surfacelayers [25,26]. Oasis soils are not considered as pedogenic soils but rather as anthropogenicsoils [27]. Our analyses in the Gataaya oasis corroborate with these results and the soil OClevels under CON are between 0.40 and 1.64%.
For the CMP and MAN treatments (soil with addition of compost and soil with addi-tion of manure), we recorded very high levels of organic matter and soil OC immediatelyafter their addition. The biodegradation of organic compounds depends on the natureof organic inputs, simple compounds, whole debris, and organo–mineral complexes [28].Mineralization of organic matter is greater in coarse and low textured soils [1]. Soil OCcontents (%) are generally higher values in the soil surface layers. Our values showed a de-creasing trend with soil depth. Accumulation of soil OC result from surface organic matteramendments (crop residues mixed with animal manure), applied by most farmers in thisoasis. Nevertheless, the annual temperatures at Gataaya oasis favor a high decompositionrate of organic matter [29].
Outside the Gataaya oasis, at Chott Djerid, the soil OC contents were highly affectedby soil depth. In another study for oases of Balad Seet in Oman, a soil OC content of30.7 g kg−1 in the upper soil layer was reported due to regular application of animalmanure [30]. In contrast, low soil OC contents result from large patches of bare groundbetween small shrubs, with large variations in soil OC density and low carbon input in thesoil [12].
Moreover, adding soil organic matter and sand amendments to the base of the palm bysome farmers in this oasis might have led to higher soil OC concentration especially in nearpalm position [31]. In addition, high salt accumulation requires the oasis to be irrigated;as a result soil OC is leached and easily transported by water to the soil’s surface [32].In a similar oasis agrosystem in the arid region of Northwest China, Li et al. (2013) [33]attributed the high accumulation of soil OC in the upper soil layer to the same reason. Inwarm arid areas, such as the southern Tunisia region, plenty of factors can affect soil OCaccumulation, including soil texture, vegetation type, and climatic conditions. For instance,high temperatures affect soil water use efficiency and thus impact biomass production andlevel of soil OC input [34,35]. Locally, Kebili area characterized by frequent wind blowingand sand dunes which affect soil properties and thus the soil OC concentration in theseareas [34].
The variation in the means of the soil N contents among all three plots followed thesoil OC contents. The concentration was higher in the upper soil layers and decreasedgradually with soil depth, except for CON soil where deeper layers greater than 10 cmwere richer in N, 0.029% to 0–10 cm and 0.063% in 30–50 cm. The soil N results found inthe current study were close to those reported by Mlih et al. (2016) [12] (for Gataaya oasis)of 0.029 to 0.103%; in his study, the content displayed no significant trend with depth butremained high in the most upper soil layers. The higher accumulation of soil N in theupper layer, particularly for oasis soils, is due to high content of soil organic matter in thislayer [36]. Soil containing greater organic matter will have higher microbial activity andthus higher N output. Moreover, Liu et al. (2013) [37] and Gao et al. 2019 [38] indicated thatthe spatial distributions of soil N in a typical oasis ecosystem in the arid region of Northwest
Land 2022, 11, 442 12 of 16
China were influenced by farming practices (e.g., application of chemical fertilizers andorganic manure) and regional soil parent materials. Low N concentration levels, especiallyin Gataaya oasis and the bare lands of Gabes desert and Chott Djerid, could be attributed tolow organic matter input in the soil, water scarcity, and soil erosion [39]. High temperatureand heat waves in these areas may also affect microbial growth and their activity in thesoil [40]. Salinity can reduce the decomposition rate of organic matter, which in turn mayincrease the risk of N immobilization in the deep layer [41]. Loss of N takes many forms,such as volatilization of ammonium or accumulation of nitrate in the soil beyond the rootzones [42].
Based on the results of the BD obtained, it is noted that it is low on the surface, whichshows the abundance of the organic amendment on the surface [43]. This apparent densityincreases as a function of the depth, it is conditioned by the reduction of the organic matteras a function of the depth on the one hand, and on the other hand by the pressure exertedon the soil layers, that is, the settling effect is very pronounced at depth and manifests itselfin high values of BD. The rate of soil organic matter is influenced by the physical propertiesof texture and BD. This result corroborates with BD presented by Abdelbaki (2018) [44].In soils of the three plots, BD ranged from 1.38 to 1.74 g cm−3. Fine textured soils ingeneral have lower BD than sandy soils and thus tend to organize in porous grains; thiscan also be enhanced by adequate organic matter content, which results in pore space andenhanced soil aggregation [45]. Compaction of soil at higher depths may have contributedto increasing BD at depth [46].
4.2. Soil OC and N Stocks
Soil OC stocks are important in organic horizons as mineral horizons; they are influ-enced by the amount of humus and its thickness. The variation of the parameters, whichcharacterize the composition of the soil, organization, and the functioning of the soil, suchas, the particle size, BD, and the pH value, influence the rate of soil OC and thus the soilOC stock. Brahim and Ibrahim (2018) [47] have shown that several landscape factors, suchas drainage, slope position, texture, and humus thickness influence soil OC stockpiles.
The type of soil influences the potential storage of soil OC [48]. For example, inhydromorphic soils, characterized by the presence of the excess of water, the decompositionof the soil organic matter is very slow because of the conditions of anaerobic; this favorsincreasing the soil OC residence time. In contrast, coarse aerated, nutrient rich soils favorthe decomposition of the soil organic matter.
According to the FAO classification, our soils are of type solonchaks. Their soil OCcontents were highest under the amended MAN and CMP compared to CON. Omaret al. (2017) [49] found on the same solonchaks soils, mean soil OC stocks of 0.70 and2.40 kg C m−2 for the 0–5 cm and 0–30 cm depth intervals, respectively. These are valueswhich are very close to our results for the plot without any addition (CON). Our resultscorroborate those for 0–30 cm depth of Tunisian solonchaks soil OC stores, estimatedby Brahim et al. [50], to be on average 2.82 kg C m−2. Our values are close to what ispresented by Batjes [51], where he showed that solonchaks had average stocks of the orderof 2.60 kg C m−2 in the upper 50 cm.
For the two CMP and MAN plots, the carbon stocks are relatively high after theaddition of the amendments, in line with the results observed by Fusillier et al. (2009) [52].In oases soils, high stocks of soil OC were related to organic matter derived from palm dateand careful soil management consisting of a shallow tillage associated with permanentfodder cultivation. Furthermore, this difference may be associated with the dense rootswith high turnover rate in the subsoil [42]. This confirms that arid soils can store OC [50].According to Munoz-Rojas et al. [53], the upper 0–30 cm layer contains the highest soil OCstock because organic matter is preferentially accumulated at this depth.
What is remarkable in our study is that the soil OC stock fell very rapidly after fouryears in MAN and COM, even though the earlier stock levels obtained after the additionof the amendments were at very high levels (CON) compared to the usual stocks in the

Land 2022, 11, 442 13 of 16
solonchaks. We attribute this decrease of nearly 50% to the very high temperature in thisdesert area which accelerates mineralization, and due to the coarse and sandy texture poorin clay which favors the OC sequestration [54]. Furthermore, the good permeability ofthese soils means that OC can be transported by leaching. In fact, soil salinity is a limitingfactor for microbial activity [55,56]. Soil microorganisms, especially fungi, are very sensitiveto salinity [57]. Long-term lime and gypsum amendment increases N fixation in the soiland decreases the abundance of total prokaryotes (archaea and bacteria) related to the Ncycle [58]. Carter (1985) [59] studied the long-term effect of adding gypsum to soil in thefield and his laboratory study showed a reduction in microbial soil N of 10–43%. The resultsshow the direct effect of gypsum on decreased microbial activity and the interrelationshipsbetween changes in soil chemistry, biomass, and microbial activity [59]. Desertification cansignificantly decrease both soil OC storage in the whole 0–30 cm soil profile [60].
The general figure observed for N stock followed the pattern of soil OC stock distribu-tion since most N forms part of the soil organic matter [61,62]. On a depth of 50 cm in thereference C plot, N stock was between 0.46 in 2013 and 0.48 g N m−2 in 2016. This resultcoincides perfectly with the solonchaks values given by Batjes [51], i.e., for 0–50 cm depthequal to 0.44 g N m−2.
What is quite remarkable is that after this stability in the N stock of the CON plot overthe depth of 0.5 m, the stock fell from 0.4 g N m−2 to in 2013 and 2016 to 0.2 g N m−2 in 2020.This same result is observed in the two other plots with MAN and CMP where the totalN stock shows a clear decrease, going for example under MAN of 0.67 and 0.54 g N m−2
respectively for the years 2013 and 2016 to 0.35 g N m−2 for the year 2020. The decrease wasvery pronounced under CMP, stocks dropped 0.51 (2013) and 0.50 (2016) to 0.18 g N m−2
in the year 2020.This could be due to climate changes in the area. Indeed, for measurements from 1985
to 2016, the average annual precipitation (MAP) was 102.4 mm/year and the average annualtemperature (MAT) was 21.4 ◦C, whereas from 2016 to 2020, MAP was 36.8 mm/year andMAT 22.2 ◦C [63].
According to Christensen (1996) [64], clay fraction generally accounts for over 50%of soil organic matter, while silt and clay together (<50 µm) may account for over 90%.Furthermore, the organic matter bound to the fine silt- and clay-sized fractions is morehumified than that associated with the coarse fraction [65,66]. Dominant factors whichexplain soil OC stocks variability are probably due to microclimate drivers within eachsoil type. Altitude and soil temperature significant explained soil OC and N stocks vari-ability [67]. The high-temperature regime in the oasis production systems in the middle ofthe desert, the irrigation, and the rise of the water by capillarity of the water table couldleave the soils always more wet at depth. This observation confirms generally acceptedtemperature and moisture controls on the rate at which biochemical processes occur in soilsof diverse genesis and chemical nature [68,69].
The N Stocks increased after compost and manure were applied, but were more stablefor manure applied soil. The N stocks in CMP at 50 cm depth in 2013 and 2016 are 0.51and 0.50 kg N m−2 and under MAN were 0.67 and 0.54 kg N m−2. In fact, soil in theupper 50 cm varied between 0.50 and 0.60 kg N m−2, but also showed their capacityto sequester N despite salinity and high ambient temperatures. These values (Table 3)place the solonchaks of Tunisia close to the Planosols, Podzoluvisols, Regosols, Luvisols,Ferralsols, and Acrisols, which have an average stock of 0.55, 0.55 0.57, 0.63, 0.64, and0.66 kg N m−2, respectively [51]. The deep layers were the richest in N (Figure 3), explainedby the abundance of gypsum. As according to Raju and Zouggari (1988) [70], a highgypsum content (>10%) decreases N mineralization.
Our results show that in desert soils, the storage of OC and N is temporary butreversible. The soil OC and N sequestration may be therefore possible in saline desert soils,but the rate of increase is of course severely hampered by prevailing major environmentalconstraints, notably the low quantities of clay, high temperatures, and salinity throughout
Land 2022, 11, 442 14 of 16
the profile. Compared to control soil, crop yields and their organic restitution drop by upto 47% in saline soil [71].
5. Conclusions
Manure and compost significantly enhanced soil OC and N after being added com-pared to a non-amended control. However, the initial enhanced OC stocks after the organicamendment, both for compost and manure, were very quickly lost and after eight years thevalues virtually returned to the initial OC state. After eight years, the N stock remainedhigher in the deepest layer 30–50 cm compared to other depth layers, which suggests that ahigh gypsum content can inhibit N mineralization. As livestock numbers are low in oases,local manure is scarce, and costs are high, we recommend using date palm residue-basedcompost as appropriate solution to preserve and restore the soil OC and N stocks in thesefragile ecosystems.
Author Contributions: Conceptualization, N.B., H.I., A.B. and R.B.; methodology, N.B.; software,N.B.; validation, R.B.; formal analysis, H.I.; investigation, N.K.; resources, H.I. and A.B.; data curation,N.B.; writing—original draft preparation, N.B., R.M., N.K. and H.I.; writing—review and editing,N.B. and R.B.; visualization, N.B.; supervision, R.B. and N.B.; project administration, N.B. and R.B.;funding acquisition, R.B. All authors have read and agreed to the published version of the manuscript.
Funding: This research was funded by the Exploratory Grant (STC_TUNGER-006/INTOASES).
Institutional Review Board Statement: Not applicable.
Informed Consent Statement: Not applicable.
Data Availability Statement: Not applicable.
Acknowledgments: The study was supported by the Exploratory Grant (STC_TUNGER-006/INTOASES) as part of the Bilateral Scientific and Technological Cooperation between the Republic of Tunisiaand the Federal Republic of Germany.
Conflicts of Interest: The authors declare no conflict of interest.
References1. Gallali, T. Clés des Sols; Centre de Publication Universitaire: Manouba, Tunis, 2004.2. Food and Agriculture Organization. World Reference Base for Soil Resources 2014. International Soil Classification System for Naming
Soils and Creating Legends for Soil Maps; FAO: Rome, Italy, 2005.3. Renevot, G.; Bouaziz, A.; Ruf, T.; Raki, R. Pratiques d’Irrigation du Palmier Dattier dans les Systèmes Oasiens du Tafi Lalet,
Maroc. In Proceedings of the International Agriculture Durable en Région Méditerranéenne (AGDUMED), Rabat, Morocco,14–16 May 2009; pp. 196–211.
4. Alizadeh, S.; Prasher, S.O.; ElSayed, E.; Qi, Z.; Patel, R.M. Effect of biochar on fate and transport of manure-borne estrogens insandy soil. J. Environ. Sci. 2018, 73, 162–176. [CrossRef] [PubMed]
5. Zhang, Y.; Zhao, W.; Fu, L. Soil macropore characteristics following conversion of native desert soils to irrigated croplands in adesert-oasis ecotone, Northwest China. Soil Tillage Res. 2017, 168, 176–186. [CrossRef]
6. The World Bank. Oases Ecosystems and Livelihoods Project (TOLEP); World Bank: Washington, DC, USA, 2014; p. 114.7. Ministère de l’Environnement et de Développement Durable. Stratégie de développement durable des oasis en Tunisie; Ministère de
l’Environnement et de Développement Durable: Tunis, Tunisie, 2015.8. Chebbi, H.E. Compétences pour le Commerce et la Diversification Economique (STED) en Tunisie: Cas du Secteur de l’Agroalimentaire;
Organisation Internationale du Travail, Ministère de l’Industrie et du Commerce: Tunis, Tunisie, 2016.9. Toutain, G. Le palmier dattier. Cuture et production. Al Awamia 1967, 25, 83–151.10. Ben Abdallah, A. La phoeniciculture. CIHEAM Options Mediterr. 1990, A, 105–120.11. El Khoumsi, W.; Hammani, A.; Bouarfa, S.; Bouaziz, A.; Ben Aïssa, I. Contribution de la nappe phréatique à l’alimentation
hydrique du palmier dattier (Phoenix dactylifera) dans les zones oasiennes. Cah. Agric. 2017, 26, 45005. [CrossRef]12. Mlih, R.; Bol, R.; Amelung, W.; Brahim, N. Soil organic matter amendments in date palm groves of the Middle Eastern and North
African region: A mini-review. J. Arid Land 2016, 8, 77–92. [CrossRef]13. Battesti, V. Les Oasis du Jérid: Des Révolutions Permanentes? Centre de Coopération Internationale en Recherche Agronomique pour
le Développement, Institut national de la recherche agronomique de Tunisie: Tunis, Tunisia, 1997.14. Li, C.; Li, Y.; Xie, J.; Liu, Y.; Wang, Y.; Liu, X. Accumulation of organic carbon and its association with macro-aggregates during
100 years of oasis formation. Catena 2019, 172, 770–780. [CrossRef]

Land 2022, 11, 442 15 of 16
15. Xu, E.; Zhang, H.; Xu, Y. Exploring land reclamation history: Soil organic carbon sequestration due to dramatic oasis agricultureexpansion in arid region of Northwest China. Ecol. Indic. 2020, 108, 105746. [CrossRef]
16. Nelson, D.W.; Sommers, L.E. Total carbon, organic carbon, and organic matter. Methods Soil Anal. 3 Chem. Methods 1996, 5,961–1010.
17. Association Française de Normalisation. Qualité du Sol—Dosage de l’Azote Total—Méthode de Kjeldahl Modifiée; Association Françaisede Normalisation: Paris, France, 1995.
18. Association Française de Normalisation. Qualité du Sol—Détermination de la Distribution Granulométrique des Particules du Sol—Méthode à la Pipette; Association Française de Normalisation: Paris, France, 2003.
19. Vieillefon, J. Contribution à l’amélioration de l’étude des sols gypseux. Cah. ORSTOM Sér. Pédol. 1979, 17, 195–223.20. Sherrod, L.A.; Dunn, G.; Peterson, G.A.; Kolberg, R.L. Inorganic Carbon Analysis by Modified Pressure-Calcimeter Method. Soil
Sci. Soc. Am. J. 2002, 66, 299–305. [CrossRef]21. Association Française de Normalisation. Qualité du Sol—Détermination de la Conductivité Electrique Spécifique; Association Française
de Normalisation: Paris, France, 1994.22. Brahim, N.; Ibrahim, H.; Hatira, A. Tunisian soil organic carbon stock—Spatial and vertical variation. Procedia Eng. 2014, 69,
1549–1555. [CrossRef]23. Yigini, Y.; Panagos, P. Assessment of soil organic carbon stocks under future climate and land cover changes in Europe. Sci. Total
Environ. 2016, 557–558, 838–850. [CrossRef] [PubMed]24. Boulbaba, A.; Marzouk, L.; ben Rabah, R.; Najet, S. Variations of Natural Soil Salinity in an Arid Environment Using Underground
Watertable Effects on Salinization of Soils in Irrigated Perimeters in South Tunisia. Int. J. Geosci. 2012, 3, 1040–1047. [CrossRef]25. Brahim, N.; Blavet, D.; Gallali, T.; Bernoux, M. Application of structural equation modeling for assessing relationships between
organic carbon and soil properties in semiarid Mediterranean region. Int. J. Environ. Sci. Technol. 2011, 8, 305–320. [CrossRef]26. Slama, A. Répartition Spatiale de la Matière Organique dans les Sols de l’Oasis Continentale Guettaya (Kébili); Université de Tunis El
Manar: Tunis, Tunisia, 2014.27. El Fekih, M.; Pouget, M. Les Sols des Oasis Anciennes du Sud Tunisien. In Proceedings of the Conference sur les Sols Mediterranen,
Madrid, Spain, 12–17 September 1966; p. 12.28. Bonneau, M.; Souchier, B. Constituants et propriétés du sol. Rev. Géogr. Alp. 1980, 68, 202–203.29. Davidson, E.A.; Janssens, I.A. Temperature sensitivity of soil carbon decomposition and feedbacks to climate change. Nature 2006,
440, 165–173. [CrossRef]30. Siebert, S. Analysis of Arid Agricultural Systems Using Quantitative Image Analysis, Modeling and Geographical Information Systems;
Kassel University Press: Kassel, Germany, 2005.31. Omrani, N. Dilemma of Fossil Water Management within Southern Tunisia Oases: Vulnerability to Salt under Intensive Use
Context. In Proceedings of the 8th edition of the World Wide Workshop for Young Environmental Scientists, Arcueil, France,2–5 June 2011; p. 8.
32. Lal, R. Soil erosion and the global carbon budget. Environ. Int. 2003, 29, 437–450. [CrossRef]33. Li, M.; Zhang, X.; Pang, G.; Han, F. The estimation of soil organic carbon distribution and storage in a small catchment area of the
Loess Plateau. Catena 2013, 101, 11–16. [CrossRef]34. Lal, R. Soil carbon sequestration impacts on global climate change and food security. Science 2004, 304, 1623–1627. [CrossRef]35. Liang, A.; Zhang, Y.; Zhang, X.; Yang, X.; McLaughlin, N.; Chen, X.; Guo, Y.; Jia, S.; Zhang, S.; Wang, L.; et al. Investigations
of relationships among aggregate pore structure, microbial biomass, and soil organic carbon in a Mollisol using combinednon-destructive measurements and phospholipid fatty acid analysis. Soil Tillage Res. 2018, 185, 94–101. [CrossRef]
36. Schomberg, H.H.; Jones, O.R. Carbon and Nitrogen Conservation in Dryland Tillage and Cropping Systems. Soil Sci. Soc. Am. J.1999, 63, 1359–1366. [CrossRef]
37. Liu, Z.P.; Shao, M.A.; Wang, Y.Q. Spatial patterns of soil total nitrogen and soil total phosphorus across the entire Loess Plateauregion of China. Geoderma 2013, 197–198, 67–78. [CrossRef]
38. Gao, X.; Xiao, Y.; Deng, L.; Li, Q.; Wang, C.; Li, B.; Deng, O.; Zeng, M. Spatial variability of soil total nitrogen, phosphorus andpotassium in Renshou County of Sichuan Basin, China. J. Integr. Agric. 2019, 18, 279–289. [CrossRef]
39. Dregne, H.E. Land degradation in the drylands. Arid Land Res. Manag. 2002, 16, 99–132. [CrossRef]40. Wang, C.; Wan, S.; Xing, X.; Zhang, L.; Han, X. Temperature and soil moisture interactively affected soil net N mineralization in
temperate grassland in Northern China. Soil Biol. Biochem. 2006, 38, 1101–1110. [CrossRef]41. Flavel, T.C.; Murphy, D.V. Carbon and Nitrogen Mineralization Rates after Application of Organic Amendments to Soil. J. Environ.
Qual. 2006, 35, 183–193. [CrossRef]42. Li, C.; Li, Y.; Tang, L. Soil organic carbon stock and carbon efflux in deep soils of desert and oasis. Environ. Earth Sci. 2010, 60,
549–557. [CrossRef]43. Zhang, Y.; Zhao, W. Effects of variability in land surface characteristics on the summer radiation budget across desert-oasis region
in Northwestern China. Theor. Appl. Climatol. 2014, 119, 771–780. [CrossRef]44. Abdelbaki, A.M. Evaluation of pedotransfer functions for predicting soil bulk density for U.S. soils. Ain Shams Eng. J. 2018, 9,
1611–1619. [CrossRef]45. Vereecken, H.; Maes, J.; Feyen, J.; Darius, P. Estimating the soil moisture retention characteristic from texture, bulk density, and
carbon content. Soil Sci. 1989, 148, 389–403. [CrossRef]

Land 2022, 11, 442 16 of 16
46. Da Silva, A.P.; Kay, B.D.; Perfect, E. Management versus inherent soil properties effects on bulk density and relative compaction.Soil Tillage Res. 1997, 44, 81–93. [CrossRef]
47. Brahim, N.; Ibrahim, H. Effect of Land Use on Organic Carbon Distribution in a North African region: Tunisia Case Study. In SoilManagement and Climate Change, 1st ed.; Academic Press: Cambridge, MA, USA, 2018. [CrossRef]
48. Gobat, J.M.; Aragno, M.; Matthey, W. Le Sol Vivant: Bases de Pédologie Biologie des Sols; Presses Polytechniques et UniversitairesRomandes: Laussane, Switzerland, 1998.
49. Omar, Z.; Bouajila, A.; Brahim, N.; Grira, M. Soil property and soil organic carbon pools and stocks of soil under oases in aridregions of Tunisia. Environ. Earth Sci. 2017, 76, 415. [CrossRef]
50. Brahim, N.; Gallali, T.; Bernoux, M. Carbon stock by soils and departments in Tunisia. J. Appl. Sci. 2011, 11, 46–55. [CrossRef]51. Batjes, N.H. Total carbon and nitrogen in the soils of the world. Eur. J. Soil Sci. 1996, 47, 151–163. [CrossRef]52. Fusillier, J.; Hacib, A.; Le Gal, P.Y. Stratégies des Agriculteurs des Oasis du Nefzaoua. Entre Logique Patrimoniale et Productive,
une Mise en Valeur Agricole Orientée vers l’Extension des Palmeraies, Malgré les Risques pour la Durabilité des Oasis. InProceedings of the Gestion des Ressources Naturelles et Développement Durable des Systèmes Oasiens du Nefzaoua, Douz,Tunis, 25–27 February 2009.
53. Munoz-Rojas, M.; Jordan, A.; Zavala, L.M.; De La Rosa, D.; Abd-Elmabod, S.K.; Anaya-Romero, M. Organic carbon stocks inMediterranean soil types under different land uses (Southern Spain). Solid Earth 2012, 3, 375–386. [CrossRef]
54. Chen, L.; Li, C.; Feng, Q.; Wei, Y.; Zhao, Y.; Zhu, M.; Deo, R.C. Direct and indirect impacts of ionic components of saline water onirrigated soil chemical and microbial processes. Catena 2019, 172, 581–589. [CrossRef]
55. Rietz, D.N.; Haynes, R.J. Effects of irrigation-induced salinity and sodicity on soil microbial activity. Soil Biol. Biochem. 2003, 35,845–854. [CrossRef]
56. Wichern, J.; Wichern, F.; Joergensen, R.G. Impact of salinity on soil microbial communities and the decomposition of maize inacidic soils. Geoderma 2006, 137, 100–108. [CrossRef]
57. Gros, R.; Poly, F.; Monrozier, L.J.; Faivre, P. Plant and soil microbial community responses to solid waste leachates diffusion ongrassland. Plant Soil 2003, 255, 445–455. [CrossRef]
58. Bossolani, J.W.; Crusciol, C.A.C.; Merloti, L.F.; Moretti, L.G.; Costa, N.R.; Tsai, S.M.; Kuramae, E.E. Long-term lime and gypsumamendment increase nitrogen fixation and decrease nitrification and denitrification gene abundances in the rhizosphere and soilin a tropical no-till intercropping system. Geoderma 2020, 375, 114476. [CrossRef]
59. Carter, M.R. Microbial biomass and mineralizable nitrogen in solonetzic soils: Influence of gypsum and lime amendments. SoilBiol. Biochem. 1986, 18, 531–537. [CrossRef]
60. An, H.; Li, Q.L.; Yan, X.; Wu, X.Z.; Liu, R.; Fang, Y. Desertification control on soil inorganic and organic carbon accumulation inthe topsoil of desert grassland in Ningxia, northwest China. Ecol. Eng. 2019, 127, 348–355. [CrossRef]
61. Ganuza, A.; Almendros, G. Organic carbon storage in soils of the Basque Country (Spain): The effect of climate, vegetation typeand edaphic variables. Biol. Fertil. Soils 2003, 37, 154–162. [CrossRef]
62. Yimer, F.; Ledin, S.; Abdelkadir, A. Soil organic carbon and total nitrogen stocks as affected by topographic aspect and vegetationin the Bale Mountains, Ethiopia. Geoderma 2006, 135, 335–344. [CrossRef]
63. Institut National de Météorologie de Tunisie. Données Météorologiques de la Ville de Kebili; Institut National de Météorologie deTunisie: Tunis, Tunisia, 2020.
64. Christensen, B.T. Matching Measurable Soil Organic Matter Fractions with Conceptual Pools in Simulation Models of CarbonTurnover: Revision of Model Structure. Eval. Soil Org. Matter. Models 1996, 1, 143–159. [CrossRef]
65. Benoit, P.; Souiller, C.; Madrigal, I.; Pot, V.; Coquet, Y.; Margoum, C.; Laillet, B.; Dutertre, A.; Gril, J.J.; Barriuso, E. Fonctionsenvironnementales des dispositifs enherbés en vue de la gestion et de la maîtrise des impacts d’origine agricole. Cas des pesticides.Étude Gest Sols 2003, 10, 299–312.
66. Schmidt, M.W.I.; Knicker, H.; Kögel-Knabner, I. Organic matter accumulating in Aeh and Bh horizons of a Podzol—Chemicalcharacterization in primary organo-mineral associations. Org. Geochem. 2000, 31, 727–734. [CrossRef]
67. Njeru, C.M.; Ekesi, S.; Mohamed, S.A.; Kinyamario, J.I.; Kiboi, S.; Maeda, E.E. Assessing stock and thresholds detection of soilorganic carbon and nitrogen along an altitude gradient in an east Africa mountain ecosystem. Geoderma Reg. 2017, 10, 29–38.[CrossRef]
68. Bateman, E.J.; Baggs, E.M. Contributions of nitrification and denitrification to N2O emissions from soils at different water-filledpore space. Biol. Fertil. Soils 2005, 41, 379–388. [CrossRef]
69. Leifeld, J.; Bassin, S.; Fuhrer, J. Carbon stocks in Swiss agricultural soils predicted by land-use, soil characteristics, and altitude.Agric. Ecosyst. Environ. 2005, 105, 255–266. [CrossRef]
70. Raju, G.; Zouggari, H. Influence du gypse sur la mineralisation de l’azote dans le sol. Ann. Inst. Natl. Agron. Harrach 1988, 12,169–185.
71. Murtaza, B.; Murtaza, G.; Sabir, M.; Owens, G.; Abbas, G.; Imran, M.; Mustafa Shah, G. Amelioration of saline-sodic soil withgypsum can increase yield and nitrogen use efficiency in rice-wheat cropping system. Arch. Agron. Soil Sci. 2017, 63, 1267–1280.[CrossRef]