Meta-analysis of how well measures of bone mineral density predict occurrence of osteoporotic...
6
Meta-analysis of how well measures of bone mineral density predict occurrence of osteoporotic fractures Deborah Marshall, OlofJohnell, Hans Wedel Abstract Objective-To determine the ability of measure- ments of bone density in women to predict later fractures. Design-Meta-analysis of prospective cohort studies published between 1985 and end of 1994 with a baseline measurement of bone density in women and subsequent follow up for fractures. For comparative purposes, we also reviewed case control studies of hip fractures published between 1990 and 1994. Subjects-Eleven separate study populations with about 90 000 person years of observation time and over 2000 fractures. Main outcome measures-Relative risk of frac- ture for a decrease in bone mineral density of one standard deviation below age adjusted mean. Results-All measuring sites had similar pre- dictive abilities (relative risk 1.5 (95% confidence interval 1.4 to 1.6)) for decrease in bone mineral density except for measurement at spine for predicting vertebral fractures (relative risk 2.3 (1.9 to 2.8)) and measurement at hip for hip frac- tures (2.6 (2.0 to 3.5)). These results are in accor- dance with results of case-control studies. Predic- tive ability of decrease in bone mass was roughly similar to (or, for hip or spine measurements, better than) that of a 1 SD increase in blood pres- sure for stroke and better than a 1 SD increase in serum cholesterol concentration for cardio- vascular disease. Conclusions-Measurements of bone mineral density can predict fracture risk but cannot identify individuals who will have a fracture. We do not recommend a programme of screening menopausal women for osteoporosis by measuring bone density. Swedish Council on Technology Assessment in Health Care, Box 16158, S-10324 Stockholm, Sweden Deborah Marshall, research associate Department of Orthopaedics, Malm6 General Hospital, S-21401 Malmn, Sweden Olof Johnell, professor Department of Epidemiology and Biostatistics, Nordic School of Public Health, Box 12133, S-40242 Gothenburg, Sweden Hans Wedel, professor Correspondence to: Professor Wedel. BMJ 1996;312:1254-59 Introduction Osteoporosis-low bone density leading to fractures after minimal trauma-is a considerable problem in health care because of its potentially severe consequences for both the patient and the health care system if a fracture occurs. Estimates of the prevalence of osteoporosis vary with the specific definition chosen, but the World Health Organisation has estimated that 30% of all women aged over 50 (postmenopausal) have osteoporosis according to a definition of bone mineral density being more than 2.5 standard deviations below the mean for young healthy adult women at any site.' Hip fractures are the most seri- ous and costly potential result of osteoporosis: the 300 000 cases in 1991 in the United States were associated with a total cost of about $5bn in 1990, including fees for nursing homes and private and public care services.2 This is also a major problem in other countries. In Europe the Scandinavian countries currently have the highest prevalence of osteoporotic fractures, and the incidence is increasing more than would be expected from demo- graphic changes in age and sex ratio.3 It is therefore important to find ways of preventing osteoporotic fractures. Measuring bone mineral density has been discussed as one method for early identification of individuals at high risk of a fracture, although it is only one of a number of risk factors for fracture."' Bone density, however, is a continuous vari- able, and it has been criticised as a screening measure because case-control studies of hip fracture showed a large overlap in the bone densities of patients with a fracture and in the densities of those without a fracture.8 The aim of our study was to determine, by a system- atic review of the literature for all prospective studies, if measurements of bone density in women could predict fractures of any type. This was undertaken as one com- ponent for a report on measurements of bone density from the Swedish Council on Technology Assessment in Health Care.9 For comparison, we also reviewed case-control studies of hip fractures. Methods We identified literature for this report by several methods. Computer databases of the medical literature-Medline, EMBASE, and SweMed-were the primary source but were supplemented with reviews of reference lists of selected papers, references provided by colleagues, and known grey literature on this topic. Bone density must have been measured by absorpti- ometry (single or dual energy, photon or x ray), quanti- tative computed tomography, quantitative magnetic resonance imaging, or ultrasound scanning. We did not include studies using roentgenograms or metacarpal measurements. We restricted all searches to articles published from 1985 to 1994. In a preliminary search we found only papers published in English, and we restricted all later searches to articles in English. In an attempt to increase the comparability of the technolo- gies used, methods of measurement, and analytic approaches we excluded articles published before 1985. Bone densitometry with current methods has been per- formed only since the early 1980s. We based our searches on the keywords "bone and bones," "bone density," "bone mineral content," and "densitometry" combined with the different techniques and equip- ments. We identified a total of 1084 articles in this way, and 229 studies fulfilled our requirements. PROSPECTWVE COHORT STUDIES These were prospective studies with a baseline measurement of bone density and subsequent follow up for fractures. Fractures must have occurred after the bone density measurement had been taken. Study sub- jects must not have received treatments for bone or hor- monal related disorders. The subjects may, however, have had previous fractures at the start of the study. We included only studies of adult women. After we had identified potential articles, they were reviewed independently for inclusion in the overview by three people (an expert in osteoporosis, an epidemiologist or biostatistician, and a worker in public health). Any dis- agreements about including a study were resolved through discussion. Before evaluating the results, the reviewers evaluated each paper individually for quality with an instrument developed for our analysis. This considered the potential bias in the study resulting from how the patients were selected, the numbers and types of patients who were lost to follow up, and the method used to identify fractures (the primary outcome in this study). The reviewers then gave each study a quality score, with a maximum possible score of 25. BMJ voLuME 312 18 MAY 1996 1254
Transcript of Meta-analysis of how well measures of bone mineral density predict occurrence of osteoporotic...
Meta-analysis ofhow well measures ofbone mineral densitypredict occurrence of osteoporotic fractures
Deborah Marshall, OlofJohnell, Hans Wedel
AbstractObjective-To determine the ability ofmeasure-
ments of bone density in women to predict laterfractures.Design-Meta-analysis of prospective cohort
studies published between 1985 and end of 1994with a baseline measurement of bone density inwomen and subsequent follow up for fractures.For comparative purposes, we also reviewed casecontrol studies ofhip fractures published between1990 and 1994.Subjects-Eleven separate study populations
with about 90 000 person years ofobservation timeand over 2000 fractures.Main outcome measures-Relative risk of frac-
ture for a decrease in bone mineral density of onestandard deviation below age adjusted mean.Results-All measuring sites had similar pre-
dictive abilities (relative risk 1.5 (95% confidenceinterval 1.4 to 1.6)) for decrease in bone mineraldensity except for measurement at spine forpredicting vertebral fractures (relative risk 2.3(1.9 to 2.8)) and measurement at hip for hip frac-tures (2.6 (2.0 to 3.5)). These results are in accor-dance with results of case-control studies. Predic-tive ability of decrease in bone mass was roughlysimilar to (or, for hip or spine measurements,better than) that of a 1 SD increase in blood pres-sure for stroke and better than a 1 SD increase inserum cholesterol concentration for cardio-vascular disease.Conclusions-Measurements of bone mineral
density can predict fracture risk but cannot identifyindividuals who will have a fracture. We do notrecommend a programme ofscreening menopausalwomen for osteoporosis by measuring bone density.
Swedish Council onTechnology Assessment inHealth Care, Box 16158,S-10324 Stockholm,SwedenDeborah Marshall, researchassociate
Department ofOrthopaedics, Malm6General Hospital, S-21401Malmn, SwedenOlofJohnell, professor
Department ofEpidemiology andBiostatistics, NordicSchool ofPublic Health,Box 12133, S-40242Gothenburg, SwedenHans Wedel, professor
Correspondence to:Professor Wedel.
BMJ 1996;312:1254-59
IntroductionOsteoporosis-low bone density leading to fractures
after minimal trauma-is a considerable problem in healthcare because of its potentially severe consequences forboth the patient and the health care system if a fractureoccurs. Estimates of the prevalence of osteoporosis varywith the specific definition chosen, but the World HealthOrganisation has estimated that 30% of all women agedover 50 (postmenopausal) have osteoporosis according toa definition of bone mineral density being more than 2.5standard deviations below the mean for young healthyadult women at any site.' Hip fractures are the most seri-ous and costly potential result of osteoporosis: the300 000 cases in 1991 in the United States were associatedwith a total cost of about $5bn in 1990, including fees fornursing homes and private and public care services.2 Thisis also a major problem in other countries. In Europe theScandinavian countries currently have the highestprevalence of osteoporotic fractures, and the incidence isincreasing more than would be expected from demo-graphic changes in age and sex ratio.3
It is therefore important to find ways of preventingosteoporotic fractures. Measuring bone mineral densityhas been discussed as one method for earlyidentification of individuals at high risk of a fracture,although it is only one of a number of risk factors forfracture."' Bone density, however, is a continuous vari-
able, and it has been criticised as a screening measurebecause case-control studies of hip fracture showed alarge overlap in the bone densities of patients with afracture and in the densities of those without a fracture.8The aim of our study was to determine, by a system-
atic review of the literature for all prospective studies, ifmeasurements of bone density in women could predictfractures of any type. This was undertaken as one com-ponent for a report on measurements of bone densityfrom the Swedish Council on Technology Assessment inHealth Care.9 For comparison, we also reviewedcase-control studies of hip fractures.
MethodsWe identified literature for this report by several
methods. Computer databases of the medicalliterature-Medline, EMBASE, and SweMed-werethe primary source but were supplemented with reviewsof reference lists of selected papers, references providedby colleagues, and known grey literature on this topic.Bone density must have been measured by absorpti-ometry (single or dual energy, photon or x ray), quanti-tative computed tomography, quantitative magneticresonance imaging, or ultrasound scanning. We did notinclude studies using roentgenograms or metacarpalmeasurements. We restricted all searches to articlespublished from 1985 to 1994. In a preliminary searchwe found only papers published in English, and werestricted all later searches to articles in English. In anattempt to increase the comparability of the technolo-gies used, methods of measurement, and analyticapproaches we excluded articles published before 1985.Bone densitometry with current methods has been per-formed only since the early 1980s. We based oursearches on the keywords "bone and bones," "bonedensity," "bone mineral content," and "densitometry"combined with the different techniques and equip-ments. We identified a total of 1084 articles in this way,and 229 studies fulfilled our requirements.
PROSPECTWVE COHORT STUDIESThese were prospective studies with a baseline
measurement ofbone density and subsequent follow upfor fractures. Fractures must have occurred after thebone density measurement had been taken. Study sub-jects must not have received treatments for bone or hor-monal related disorders. The subjects may, however,have had previous fractures at the start of the study.We included only studies of adult women. After wehad identified potential articles, they were reviewedindependently for inclusion in the overview by threepeople (an expert in osteoporosis, an epidemiologist orbiostatistician, and a worker in public health). Any dis-agreements about including a study were resolvedthrough discussion.
Before evaluating the results, the reviewers evaluatedeach paper individually for quality with an instrumentdeveloped for our analysis. This considered thepotential bias in the study resulting from how thepatients were selected, the numbers and types ofpatients who were lost to follow up, and the methodused to identify fractures (the primary outcome in thisstudy). The reviewers then gave each study a qualityscore, with a maximum possible score of 25.
BMJ voLuME 312 18 MAY 19961254
CalculationsIn most cases, there was more than one publication
for each study population. We sometimes used differentpapers to calculate the predictive value of bone densitymeasured at different sites, but in general we used thepaper with the longest follow up time for eachpopulation as the basis for calculations.As the main outcome measure of our analysis, we
chose relative risk of fracture associated with a decreasein bone density of one standard deviation adjusted forage. This compares the risks for two women of the sameage with a difference of 1 SD in their bone density. Thismeasure is robust in that it is independent ofpopulationcharacteristics and measuring devices, and it could alsobe calculated from all recent studies of good quality.
For pooling study results to a common measure, weused slight modifications of conventional methods.'0Most of the reviewed papers used the Cox proportionalhazards model or logistic analysis for estimating relativerisks or odds ratios adjusted at least for age. The risks inthe reviewed papers were all small, and we consideredrelative risks and odds ratios as equivalent. One papercalculated risks based on fractures and not on individualpeople as the statistical entity. Several fractures in oneindividual do not contribute with independent obser-vations, which underestimates the variance in theanalysis." We therefore estimated the number ofindividuals and recalculated the variance in order tocontrol for this bias.
All risk measures were calculated for a 1 SD decrease inbone density.We then pooled these risks to a common riskratio including all relevant studies and calculated the 95%confidence interval for the pooled risk ratio. Moreformally, let RRi be the observed age adjusted relativerisk for 1 SD decrease in bone density in study numberi. Or let bi = ln(RR3 be the 0 coefficient in the logistic orCox equation from study i and the weights vi defined byvi = [variance (b3]-'. From the observed confidenceinterval for RRi we estimated the variance of bi and alsovi. The weighted sum Ivhb is normally distributed withvariance Evi. The pooled (weighted) estimate from sev-eral studies i = 1, ..., n is exp(X:vhb), and the 95% confi-dence interval for this entity is calculated asexp[Mv,bi ± 1.96 x (Vlvi)]. This method, which is afixed effect model, is asymptotically close to theMantel-Haenszel method.'"As an alternative method for weighting the individual
relative risks, we chose weights proportional to thequality scores described above and calculated thepooled estimates based on scores. We also performedtests of homogeneity at a level of P=0.05.We calculated the sensitivity, specificity, positive
predictive value, and the population attributable riskfraction for a cut point in bone density of 1 SD belowthe age adjusted mean. We chose three different valuesfor the lifetime incidence of fracture: 3%, 15%, and30%. A value of 3% represents a low incidence-agroup of Swedish women with low risk for hip fractures(not more than two risk factors) had a cumulative inci-dence of fractures over 10 years of 3% (O Johnell,unpublished data). A lifetime incidence of 30% ispossible for a group ofwomen at high risk based on pre-dictors other than bone density (such as tendency tofall). The population attributable risk fraction is theproportion of disease in the population that theoreti-cally could be eliminated if those people with bone den-sity below a certain cut point could be treated to restorenormal bone density. The population attributable riskfraction is defined as (I-IO)II where I is the incidence inthe population and Io is the incidence in the groupabove the cut point (that is, with "normal" bone densityvalues).
In addition, we compared the ability of bone densitymeasurements to predict fractures with the predictiveabilities of blood pressure for stroke (data from
Sehmer'2) and of smoking and serum cholesterolconcentration for heart disease (from H Wedel, unpub-lished data). In order to compare these risk factors fordifferent endpoints, we calculated the relative risk for achange of 1 SD of each risk factor.
CASE-CONTROL STUDIESThese were case-control studies published since 1990
that compared the bone mineral density in women withhip fracture with that in age matched controls who rep-resented the normal population. The measurement ofbone density in cases must have occurred within 14days of fracture. We excluded studies published before1990 because these have been reviewed elsewhere.5 8 13
In order to compare the results from the cohort andcase-control studies, we translated difference in bonemineral density between cases and controls into oddsratios. Since the bone mineral density can beapproximated- by normal distributions in both cases andcontrols with the same variance, we used exp(AB) as theodds ratio for a difference of 1 SD in bone mineral den-sity, where AB is the standardised difference in bonemineral density between cases and controls with thevariance in controls being used for standardisation. Wepooled the results of the studies after using the size ofeach study for weighting.
ResultsPROSPECTIVE COHORT STUDIES
Table 1 give details ofthe 11 study populations, consist-ing of about 90 000 person years of observation and morethan 2000 fractures, that were suitable for inclusion in ouranalysis.""3' Follow up ranged from 1.8 to 24 years. Wefound no association between the relative risk for decreasein bone density of 1 SD and the length of follow up. Theaverage total scores for quality of the studies ranged from1 1.7 to 19.3 out of a possible score of 25. The quality scorewas not related to the size ofthe study measured by personyears of follow up.We divided the pooled estimates from the meta-analysis
bytype offracture-forearm (distal end ofthe radius), hip,vertebral, and all types-and by measurement site-proximal radius, distal radius, hip lumbar spine, calcaneus,and all sites (overall estimate). The results of this analysisshow that most measuring sites had virtually the same pre-dictive ability for a decrease of 1 SD in bone density (table2). There were two exceptions to this general observation.Measurement at the spine seemed to have a better predic-tive ability for spine fractures (relative risk 2.3 (95% confi-dence interval 1.9 to 2.8)), while measurement at the hipwas better for predicting hip fractures (relative risk 2.6 (2.0to 3.5)). The test of homogeneity was rejected formeasurements of bone density at the proximal and distalradius and hip for all types of fracture.Weighting for qual-ity scores gave similar results so no further analysis wasdone in this respect.
Table 3 shows the sensitivity, specificity, positivepredictive value, and the population attributable riskfraction for a cut point in bone density of 1 SD belowthe age adjusted mean. In this case the odds ratiobetween those below the cut point compared with thoseabove was 4.4. The sensitivity and population attribut-able risk decreased with increasing lifetime incidence offractures. The positive predictive value was large for thehigher lifetime incidences.
Table 4 shows the predictive ability of bone densitymeasurements in comparison with that of risk factorsfor stroke and heart disease. A 1 SD decrease in bonemass was roughly similar to (or, for hip measurement,better than) the predictive ability of a 1 SD increase inblood pressure for stroke and better than a 1 SDincrease in serum cholesterol concentration forcardiovascular disease.
BMJ VOLUME 312 18 MAY 1996 1255
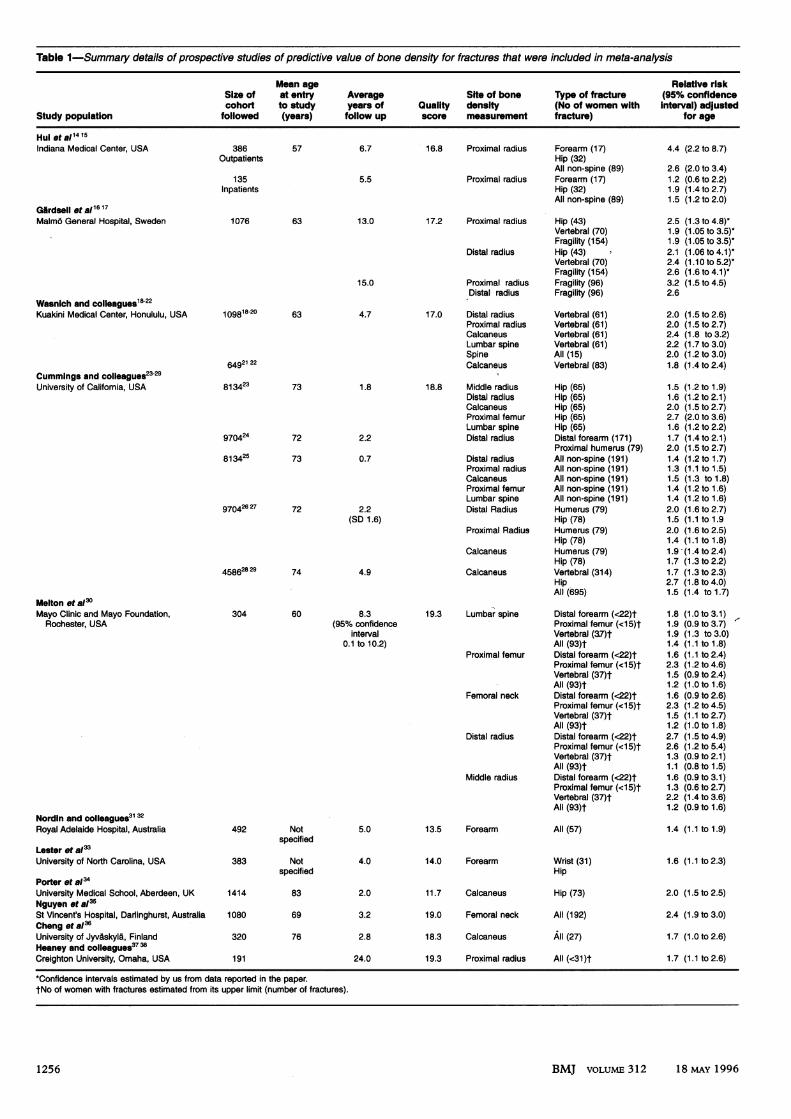
Table 1-Summary details of prospective studies of predictive value of bone density for fractures that were included in meta-analysis
Mean age Relative riskSize of at entry Average Site of bone Type of fracture (95% confidencecohort to study years of Quality density (No of women with interval) adjusted
Study population followed (years) follow up score measurement fracture) for age
HuI etal1415Indiana Medical Center, USA 386
Outpatients
135Inpatients
Glrdsell tal1617Malm6 General Hospital, Sweden
57
1076 63
6.7
5.5
13.0
15.0
Wasnich and colleagues18-22Kuakini Medical Center, Honululu, USA
Cummings and colleagues23-29University of Califomia, USA
109 18-20 63
64921 22
813423
970424
813425
73
72
73
970426 27 72
458628 29 74
Melton et a/3Mayo Clinic and Mayo Foundation,
Rochester, USA
Nordin and colieagues31 32Royal Adelaide Hospital, Australia
Lester et a/>University of North Carolina, USA
Porter et a/3University Medical School, Aberdeen, UKNguyen et 8a35St Vincent's Hospital, Darlinghurst, AustraliaCheng et a36University of Jyvaskyla, FinlandHeaney and colleagues37 38
Creighton University, Omaha, USA
304 60
492 Notspecified
383 Notspecified
1414 83
1080 69
320 76
191
4.7
1.8
2.2
0.7
2.2(SD 1.6)
4.9
8.3(95% confidence
interval0.1 to 10.2)
5.0
4.0
2.0
3.2
2.8
24.0
16.8 Proximal radius Forearm (17)Hip (32)All non-spine (89)
Proximal radius Forearm (17)Hip (32)All non-spine (89)
17.2 Proximal radius Hip (43)Vertebral (70)Fragility (154)
Distal radius Hip (43)Vertebral (70)Fragility (154)
Proximal radius Fragility (96)Distal radius Fragility (96)
17.0 Distal radiusProximal radiusCalcaneusLumbar spineSpineCalcaneus
18.8 Middle radiusDistal radiusCalcaneusProximal femurLumbar spineDistal radius
Distal radiusProximal radiusCalcaneusProximal femurLumbar spineDistal Radius
Proximal Radius
Calcaneus
Calcaneus
Vertebral (61)Vertebral (61)Vertebral (61)Vertebral (61)All (15)Vertebral (83)
Hip (65)Hip (65)Hip (65)Hip (65)Hip (65)Distal forearm (171)Proximal humerus (79)All non-spine (191)All non-spine (191)All non-spine (191)All non-spine (191)All non-spine (191)Humerus (79)Hip (78)Humerus (79)Hip (78)Humerus (79)Hip (78)Vertebral (314)HipAll (695)
19.3 Lumbar spine Distal forearm (<22)tProximal femur (<15)tVertebral (37)tAll (93)t
Proximal femur Distal forearm (<22)tProximal femur (<15)tVertebral (37)tAll (93)t
Femoral neck Distal forearm (<22)tProximal femur (<15)tVertebral (37)tAll (93)t
Distal radius Distal forearm (<22)tProximal femur (<15)tVertebral (37)tAll (93)t
Middle radius Distal forearm (<22)tProximal femur (<15)tVertebral (37)tAll (93)t
13.5 Forearm
14.0 Forearm
11.7 Calcaneus
All (57)
Wrist (31)Hip
Hip (73)
19.0 Femoral neck All (192)
18.3 Calcaneus All (27)
19.3 Proximal radius All (<31)t
4.4 (2.2 to 8.7)
2.6 (2.0 to 3.4)1.2 (0.6 to 2.2)1.9 (1.4to2.7)1.5 (1.2 to 2.0)
2.5 (1.3 to 4.8)-1.9 (1.05 to 3.5)-1.9 (1.05 to 3.5)-2.1 (1.06 to 4.1)-2.4 (1.1 0 to 5.2)*2.6 (1.6 to 4.1)*3.2 (1.5 to 4.5)2.6
2.0 (1.5 to 2.6)2.0 (1.5 to 2.7)2.4 (1.8 to 3.2)2.2 (1.7 to 3.0)2.0 (1.2 to 3.0)1.8 (1.4 to 2.4)
1.5 (1.2 to 1.9)1.6 (1.2 to 2.1)2.0 (1.5 to 2.7)2.7 (2.0 to 3.6)1.6 (1.2to2.2)1.7 (1.4 to 2.1)2.0 (1.5 to 2.7)1.4 (1.2 to 1.7)1.3 (1.1 to 1.5)1.5 (1.3 to 1.8)1.4 (1.2 to 1.6)1.4 (1.2 to 1.6)2.0 (1.6 to 2.7)1.5 (1.1 to 1.92.0 (1.6 to 2.5)1.4 (1.1 to 1.8)1.9 (1.4 to 2.4)1.7 (1.3 to 2.2)1.7 (1.3 to 2.3)2.7 (1.8 to 4.0)1.5 (1.4 to 1.7)
1.8 (1.0 to 3.1)1.9 (0.9to3.7)1.9 (1.3 to 3.0)1.4 (1.1 to 1.8)1.6 (1.1 to 2.4)2.3 (1.2 to 4.6)1.5 (0.9 to 2.4)1.2 (1.0 to 1.6)1.6 (0.9 to 2.6)2.3 (1.2 to 4.5)1.5 (1.1 to 2.7)1.2 (1.0 to 1.8)2.7 (1.5 to 4.9)2.6 (1.2 to 5.4)1.3 (0.9to2.1)1.1 (0.8 to 1.5)1.6 (0.9to3.1)1.3 (0.6 to 2.7)2.2 (1.4 to 3.6)1.2 (0.9to 1.6)
1.4 (1.1 to 1.9)
1.6 (1.1 to 2.3)
2.0 (1.5 to 2.5)
2.4 (1.9 to 3.0)
1.7 (1.0 to 2.6)
1.7 (1.1 to 2.6)
*Confidence intervals estimated by us from data reported in the paper.tNo of women with fractures estimated from its upper limit (number of fractures).
BMJ voLuME 312 18 MAY 19961256
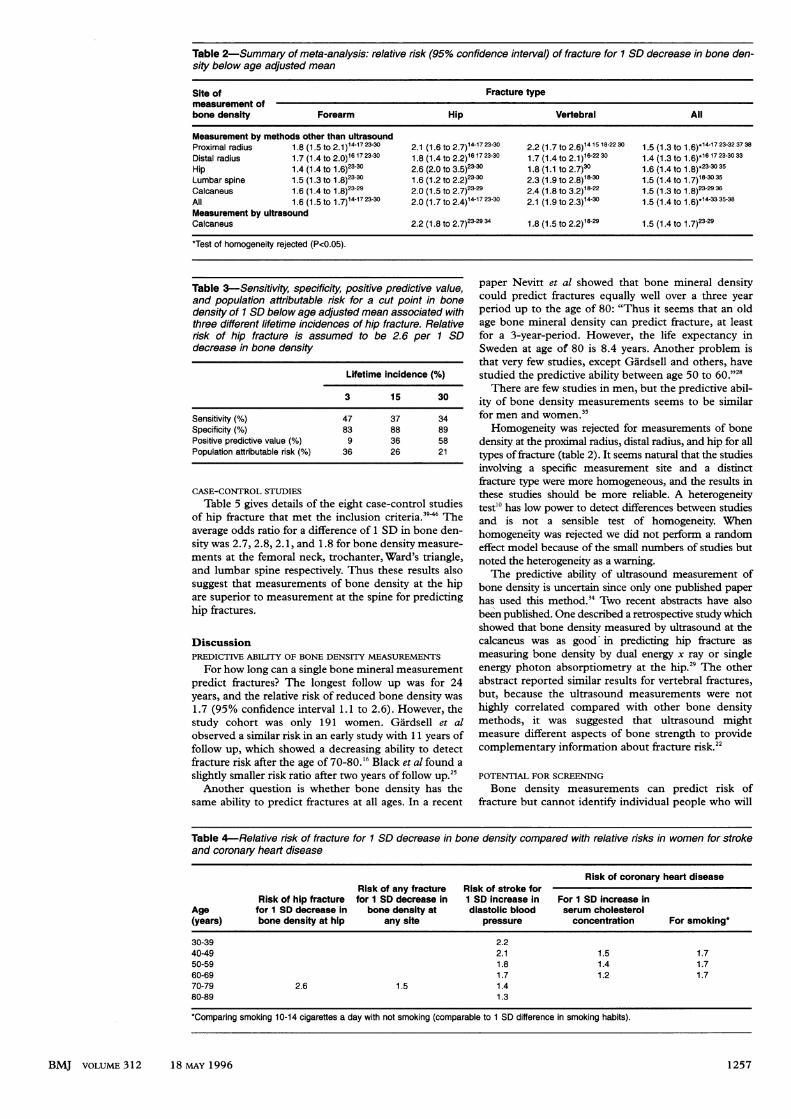
Table 2-Summary of meta-analysis: relative risk (95% confidence interval) of fracture for 1 SD decrease in bone den-sity below age adjusted mean
Site of Fracture typemeasurement ofbone density Forearm Hip Vertebral All
Measurement by methods other than ultrasoundProximal radius 1.8 (1.5 to 2.1 )14-17 23-30 2.1 (1.6 to 2.7)14-17 23-30 2.2 (1 .7 to 2.6)14 15 18-22 30 1.5 (1.3 to 1 .6) 14-17 23-32 37 38Distal radius 1.7 (1.4 to 2.0)1617 23-30 1.8 (1.4 to 2.2)16 17 23-30 1.7 (1.4 to 2.1 )16-22 30 1.4 (1.3 to 1.6)"1617 23-30 33Hip 1.4 (1.4 to 1.6)23.30 2.6 (2.0 to 3.5)23-30 1.8 (1.1 to 2.7)30 1.6 (1.4 to 1.8)*23-30 35
Lumbar spine 1.5 (1.3 to 1.8)23-30 1.6 (1.2 to 2.2)23-30 2.3 (1.9 to 2.8)18-30 1.5 (1.4 to 1.7)18-30 35Calcaneus 1.6 (1.4 to 1.8)23-29 2.0 (1.5 to 2.7)23-29 2.4 (1.8 to 3.2)18.22 1.5 (1.3 to 1.8)23-29 36All 1.6 (1.5 to 1.7)14-17 23-30 2.0 (1.7 to 2.4)14-17 23-30 2.1 (1.9 to 2.3)14-30 1.5 (1.4 to 1.6)*14-33 35-38Measurement by ultrasoundCalcaneus 2.2 (1.8 to 2.7)23-29 34 1.8 (1.5 to 2.2)18-29 1.5 (1.4 to 1.7)23-29
*Test of homogeneity rejected (P<0.05).
Table 3-Sensitivity, specificity, positive predictive value,and population attributable risk for a cut point in bonedensity of 1 SD below age adjusted mean associated withthree different lifetime incidences of hip fracture. Relativerisk of hip fracture is assumed to be 2.6 per 1 SDdecrease in bone density
Lifetime incidence (%)
3 15 30
Sensitivity (%) 47 37 34Specificity (%) 83 88 89Positive predictive value (%) 9 36 58Population attributable risk (%) 36 26 21
CASE-CONTROL STUDIES
Table 5 gives details of the eight case-control studiesof hip fracture that met the inclusion criteria."" Theaverage odds ratio for a difference of 1 SD in bone den-sity was 2.7, 2.8, 2.1, and 1.8 for bone density measure-ments at the femoral neck, trochanter, Ward's triangle,and lumbar spine respectively. Thus these results alsosuggest that measurements of bone density at the hipare superior to measurement at the spine for predictinghip fractures.
DiscussionPREDICTIVE ABILITY OF BONE DENSITY MEASUREMENTS
For how long can a single bone mineral measurementpredict fractures? The longest follow up was for 24years, and the relative risk of reduced bone density was1.7 (95% confidence interval 1.1 to 2.6). However, thestudy cohort was only 191 women. Gardsell et alobserved a similar risk in an early study with 11 years offollow up, which showed a decreasing ability to detectfracture risk after the age of 70 80."6 Black et al found aslightly smaller risk ratio after two years of follow up.2"Another question is whether bone density has the
same ability to predict fractures at all ages. In a recent
paper Nevitt et al showed that bone mineral densitycould predict fractures equally well over a three yearperiod up to the age of 80: "Thus it seems that an oldage bone mineral density can predict fracture, at leastfor a 3-year-period. However, the life expectancy inSweden at age of 80 is 8.4 years. Another problem isthat very few studies, except Gardsell and others, havestudied the predictive ability between age 50 to 60."28There are few studies in men, but the predictive abil-
ity of bone density measurements seems to be similarfor men and women."
Homogeneity was rejected for measurements of bonedensity at the proximal radius, distal radius, and hip for alltypes of fracture (table 2). It seems natural that the studiesinvolving a specific measurement site and a distinctfracture type were more homogeneous, and the results inthese studies should be more reliable. A heterogeneitytest"0 has low power to detect differences between studiesand is not a sensible test of homogeneity. Whenhomogeneity was rejected we did not perform a randomeffect model because of the small numbers of studies butnoted the heterogeneity as a warning.The predictive ability of ultrasound measurement of
bone density is uncertain since only one published paperhas used this method.34 Two recent abstracts have alsobeen published. One described a retrospective study whichshowed that bone density measured by ultrasound at thecalcaneus was as good' in predicting hip fracture asmeasuring bone density by dual energy x ray or singleenergy photon absorptiometry at the hip.20 The otherabstract reported similar results for vertebral fractures,but, because the ultrasound measurements were nothighly correlated compared with other bone densitymethods, it was suggested that ultrasound mightmeasure different aspects of bone strength to providecomplementary information about fracture risk.22
POTENTIAL FOR SCREENING
Bone density measurements can predict risk offracture but cannot identify individual people who will
Table 4-Relative risk of fracture for 1 SD decrease in bone density compared with relative risks in women for strokeand coronary heart disease
Risk of coronary heart diseaseRisk of any fracture Risk of stroke for
Risk of hip fracture for 1 SD decrease in 1 SD increase in For 1 SD increase inAge for 1 SD decrease in bone density at diastolic blood serum cholesterol(years) bone density at hip any site pressure concentration For smoking*
30-39 2.240-49 2.1 1.5 1.750-59 1.8 1.4 1.760-69 1.7 1.2 1.770-79 2.6 1.5 1.480-89 1.3
*Comparing smoking 10-14 cigarettes a day with not smoking (comparable to 1 SD difference in smoking habits).
BMJ VOLUME 312 18 MYA 1996 1 257
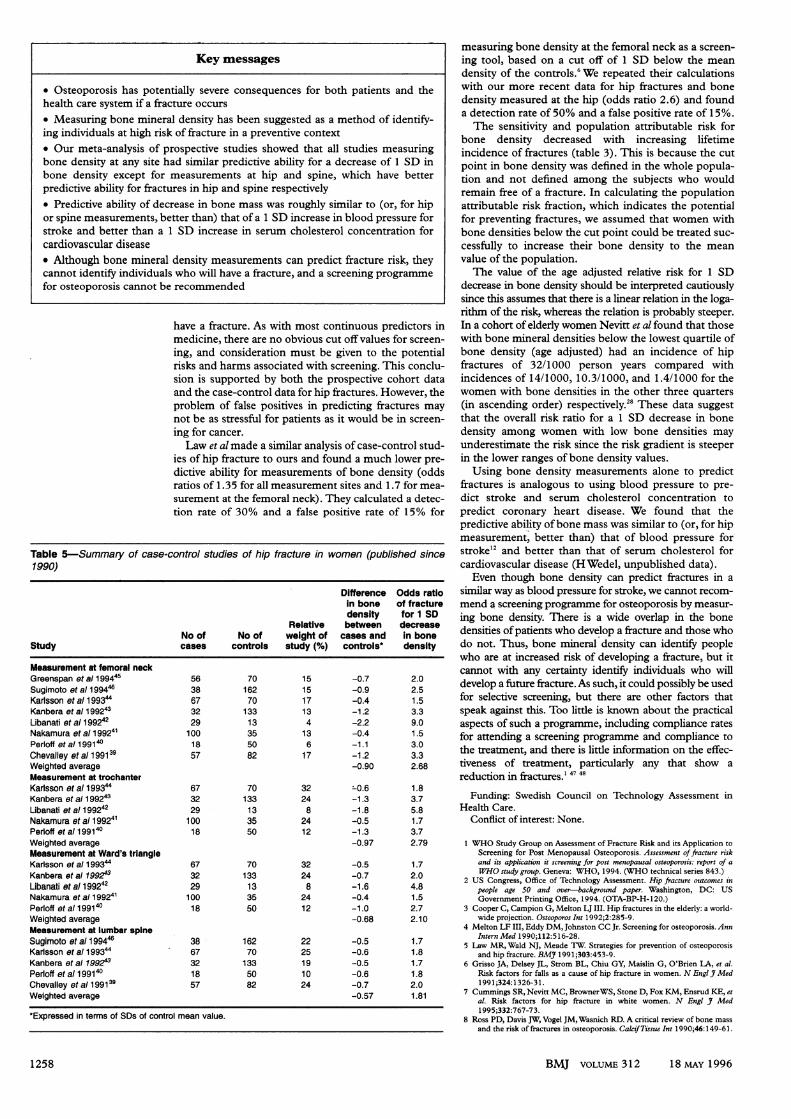
Key messages
* Osteoporosis has potentially severe consequences for both patients and thehealth care system if a fracture occurs* Measuring bone mineral density has been suggested as a method of identify-ing individuals at high risk of fracture in a preventive context* Our meta-analysis of prospective studies showed that all studies measuringbone density at any site had similar predictive ability for a decrease of 1 SD inbone density except for measurements at hip and spine, which have betterpredictive ability for fractures in hip and spine respectively* Predictive ability of decrease in bone mass was roughly similar to (or, for hipor spine measurements, better than) that of a 1 SD increase in blood pressure forstroke and better than a 1 SD increase in serum cholesterol concentration forcardiovascular disease* Although bone mineral density measurements can predict fracture risk, theycannot identify individuals who will have a fracture, and a screening programmefor osteoporosis cannot be recommended
have a fracture. As with most continuous predictors inmedicine, there are no obvious cut off values for screen-ing, and consideration must be given to the potentialrisks and harms associated with screening. This conclu-sion is supported by both the prospective cohort dataand the case-control data for hip fractures. However, theproblem of false positives in predicting fractures maynot be as stressful for patients as it would be in screen-ing for cancer.Law et al made a similar analysis of case-control stud-
ies of hip fracture to ours and found a much lower pre-dictive ability for measurements of bone density (oddsratios of 1.35 for all measurement sites and 1.7 for mea-surement at the femoral neck). They calculated a detec-tion rate of 30% and a false positive rate of 15% for
Table 5-Summary of case-control studies of hip fracture in women (published since1990)
Difference Odds ratioin bone of fracturedensity for 1 SD
Relative between decreaseNo of No of weight of cases and in bone
Study cases controls study (%) controls* density
Measurement at femoral neckGreenspan et al 199445 56 70 15 -0.7 2.0Sugimoto et al199446 38 162 15 -0.9 2.5Karlsson et all99344 67 70 17 -0.4 1.5Kanbera et al 199243 32 133 13 -1.2 3.3Libanati et all99242 29 13 4 -2.2 9.0Nakamura et al199241 100 35 13 -0.4 1.5Perloff etal199140 18 50 6 -1.1 3.0Chevalley etal199139 57 82 17 -1.2 3.3Weighted average -0.90 2.68Measurement at trochanterKarlsson et al 199344 67 70 32 -0.6 1.8Kanbera et al 199243 32 133 24 -1.3 3.7Libanati et al 199242 29 13 8 -1.8 5.8Nakamura et al199241 100 35 24 -0.5 1.7Perloff etal199140 18 50 12 -1.3 3.7Weighted average -0.97 2.79Measurement at Ward's trlangleKarlsson et al199344 67 70 32 -0.5 1.7Kanbera eta/ 199243 32 133 24 -0.7 2.0Libanati et al 199242 29 13 8 -1.6 4.8Nakamura et al 199241 100 35 24 -0.4 1.5Perloff et a/ 199140 18 50 12 -1.0 2.7Weighted average -0.68 2.10Measurement at lumbar spineSugimoto et all99446 38 162 22 -0.5 1.7Karlsson et al1 99344 67 70 25 -0.6 1.8Kanbera etal 199243 32 133 19 -0.5 1.7Perloff et al 199140 18 50 10 -0.6 1.8Chevalley et al 199139 57 82 24 -0.7 2.0Weighted average -0.57 1.81
Expressed in terms of SDs of control mean value.
measuring bone density at the femoral neck as a screen-ing tool, based on a cut off of 1 SD below the meandensity of the controls.6 We repeated their calculationswith our more recent data for hip fractures and bonedensity measured at the hip (odds ratio 2.6) and founda detection rate of 50% and a false positive rate of 15%.The sensitivity and population attributable risk for
bone density decreased with increasing lifetimeincidence of fractures (table 3). This is because the cutpoint in bone density was defined in the whole popula-tion and not defined among the subjects who wouldremain free of a fracture. In calculating the populationattributable risk fraction, which indicates the potentialfor preventing fractures, we assumed that women withbone densities below the cut point could be treated suc-cessfully to increase their bone density to the meanvalue of the population.The value of the age adjusted relative risk for 1 SD
decrease in bone density should be interpreted cautiouslysince this assumes that there is a linear relation in the loga-rithm of the risk, whereas the relation is probably steeper.In a cohort of elderly women Nevitt et al found that thosewith bone mineral densities below the lowest quartile ofbone density (age adjusted) had an incidence of hipfractures of 32/1000 person years compared withincidences of 14/1000, 10.3/1000, and 1.4/1000 for thewomen with bone densities in the other three quarters(in ascending order) respectively.28 These data suggestthat the overall risk ratio for a 1 SD decrease in bonedensity among women with low bone densities mayunderestimate the risk since the risk gradient is steeperin the lower ranges of bone density values.
Using bone density measurements alone to predictfractures is analogous to using blood pressure to pre-dict stroke and serum cholesterol concentration topredict coronary heart disease. We found that thepredictive ability ofbone mass was similar to (or, for hipmeasurement, better than) that of blood pressure forstroke"2 and better than that of serum cholesterol forcardiovascular disease (H Wedel, unpublished data).
Even though bone density can predict fractures in asimilar way as blood pressure for stroke, we cannot recom-mend a screening programme for osteoporosis by measur-ing bone density. There is a wide overlap in the bonedensities ofpatients who develop a fracture and those whodo not. Thus, bone mineral density can identify peoplewho are at increased risk of developing a fracture, but itcannot with any certainty identify individuals who willdevelop a future fracture. As such, it could possibly be usedfor selective screening, but there are other factors thatspeak against this. Too little is known about the practicalaspects of such a programme, including compliance ratesfor attending a screening programme and compliance tothe treatment, and there is little information on the effec-tiveness of treatnent, particularly any that show areduction in fractures.' 47 48
Funding: Swedish Council on Technology Assessment inHealth Care.
Conflict of interest: None.
1 WHO Study Group on Assessment of Fracture Risk and its Application toScreening for Post Menopausal Osteoporosis. Assessment offracture riskand its application it screening for post menopausal osteoporosis: report of aWHO study group. Geneva: WHO, 1994. (WHO technical series 843.)
2 US Congress, Office of Technology Assessment. Hip fracture outcomes inpeople age 50 and over-background paper. Washington, DC: USGovernment Printing Office, 1994. (OTA-BP-H-120.)
3 Cooper C, Campion G, Melton LJ III. Hip fractures in the elderly: a world-wide projection. Osteoporos Int 1992;2:285-9.
4 Melton LF III, Eddy DM, Johnston CC Jr. Screening for osteoporosis. AnnIntern Med 1990;112:516-28.
5 Law MR, Wald NJ, Meade TW. Strategies for prevention of osteoporosisand hip fracture. BMJ 1991;303:453-9.
6 Grisso JA, Delsey JL, Strom BL, Chiu GY, Maislin G, O'Brien LA, et al.Risk factors for falls as a cause of hip fracture in women. N Engl J Med1991;324:1326-31.
7 Cummings SR, Nevitt MC, BrownerWS, Stone D, Fox KM, Ensrud KE, etal. Risk factors for hip fracture in white women. N Engl J Med1995;332:767-73.
8 Ross PD, Davis IW, Vogel JM,Wasnich RD. A critical review of bone massand the risk of fractures in osteoporosis. Calcif Tissue Int 1990;46: 149-61.
1258 BMJ VOLUME 312 18 MAY 1996
9 Swedish Council on Technology Assessment in Health Care. Bone densitymeasurement. (In press.)
10 Thompson SG. Controversies in meta-analysis: the case of the trials ofserum cholesterol reduction. Stat Methods Med Res 1993;2:173-92.
11 Windeler J, Lange S. Events per person year-a dubious concept. BMJ1995;310:454-6.
12 Selmer R. Blood pressure and twenty-year mortality in the city of Bergen,Norway.AmAjEpidemiol 1992;136:428-40.
13 Cummings SR. Are patients with hip fractures more osteoporotic? Am JMed 1985;78:487-94.
14 Hui SL, Slemenda CW, Johnston CC Jr. Baseline measurement of bonemass predicts fracture in white women. Ann Intern Med 1989;111:355-61.
15 Hui SL, Slemenda CW, Johnston CC Jr. Age and bone mass as predictorsof fracture in a prospective study. Clin Invest 1988;81:1804-9.
16 Gardseil P, Johnell 0, Nilsson BE, Gullberg B. Predicting various fragilityfractures in women by forearm bone densitometry: a follow-up study.Calcif Tissue Int 1993;52:348-53.
17 Gardsell P, Johnell 0, Nilsson BE. The predictive value of bone loss for fra-gility fractures in women: a longitudinal study over 15 years. CakifTissueInt 1991;49:90-4.
18 Ross PD, Davis JW, Epstein RS, Wasnich RD. Pre-existing fractures andbone mass predict vertebral fracture incidence in women. Ann Intern Med1991;114:919-23.
19 Wasnich RD, Ross PD, Davis JW, Vogel JM. A comparison of single andmulti-site BMC measurements for assessment of spine fracture probabil-ity. Y Nucl Med 1989;30:1166-71.
20 Wasnich RD, Ross PD, Heirbrun LK, Vogel JM. Selection of the optimalsite for fracture risk prediction. Clin Orthop 1987;216:262-8.
21 Yano K,Wasnich RD, Vogel JM, Heilbrun LK. Bone mineral measurementsamong middle-aged and elderly Japanese residents in Hawaii. Am JEpidemiol 1984;119:751-64.
22 Vogel J, Huang C, Ross PD, Davis JW,Wasnich RD. Broadband ultrasoundattenuation (BUA) predicts risk of vertebral fractures [abstract). J BoneMinerRes 1994;9:S154.
23 Cummings SR, Black DM, Nevitt MC, Browner W, Cauley J, Ensrud K,et al. Bone density at various sites for prediction of hip fractures. Lancet1993;341:72-5.
24 Kelsey JL, Browner WS, Seeley DG, Nevitt MC, Cummings SR. Riskfactors for fractures of the distal forearm and proximal humerus. Am YEpidemiol 1992;135:477-89.
25 Black DM, Cummings SR, Genant HK, Nevitt MC, Palermo L, BrownerW Axial and appendicular bone density predict fractures in older women.JBone Miner Res 1992;7:633-8.
26 Seeley DG, Browner WS, Nevitt MC, Genant HK, Scott JC, CummingsSR. Which fractures are associated with low appendicular bone mass inelderly women? Ann Intern Med 1991;115:837-42.
27 Cummings SR, Black DM, Nevitt MC, Browner WS, Cauley JA, GenantHK, et al. Appendicular bone density and age predict hip fracture inwomen. JAMA 1990;263:665-8.
28 Nevitt MC, Johnell 0, Black DM, Ensrud K, Genant HK, Cummings SR.Bone mineral density predicts fractures in very elderly women. OsteoporosInt 1994;4:325-31.
29 Glier CC, Cummings SR, Bauer DC, Stone K, Pressman A, Genant HK.Associations between quantitative ultrasound and recent fractures[abstract]. a Bone Miner Res 1994;9:S153.
30 Melton U III,Atkinson EJ, O'Fallon M,Wahner HW Riggs BL. Long-termfracture prediction by bone mineral assessed at different skeletal sites. J7Bone Miner Res 1993;8:1227-33.
31 Cleghorn DB, Polley KJ, Bellon MJ, Chatterton J, Baghurst PA, NordinBEC. Fracture rates as a function of forearm mineral density in normalpostmenopausal women: retrospective and prospective data. Calcif TissueInt 1991;49:161-3.
32 Nordin BE, Chatterton BE, Walker CJ, Wishart J. The relation of forearmmineral density to peripheral fractures in postmenopausal women. MedIAus 1987;146:300-4.
33 Lester GE, Anderson JJB, Iylavsky FA, Sutton WR, Stinnett SS, DemasiRA, er al. Update on the use of distal radial bone density measurements inprediction of hip and Colles' fracture risk. JI Orthop Res 1990;8:220-6.
34 Porter RW, Miller CG, Grainger D, Palmer SB. Prediction of hip fracture inelderly women: a prospective study. BMJ 1990;301:638-41.
35 Nguyen T, Sambrook P, Kelly P, Jones G, Lord S, Freund J, et al. Predictionof osteoporotic fractures by postural instability and bone density. BMJ1993;307: 1111-5.
36 Cheng S, Suominen H, Era P, Heikkinen E. Bone density of the calcaneusand fractures in 75- and 80- year old men and women. Osteoporos Int1 994;4:48-54.
37 Stegman MR, Recker RR, Davies KM, Ryan RA, Heaney RP. Fracture riskas determined by prospective and retrospective study designs. OsteoporosInt 1992;2:290-7.
38 Heaney RP, Recker RR, Savill PD. Calcium balance and calciumrequirements in middle-aged women. Am Jf Clin Nutr 1977;30:1603-1 1.
39 Chevalley T, Rizzoli R, NydeggerV, Slosman D, Tkatch L, Rapin C-H, etal.Preferential low bone mineral density of the femoral neck in patients witha recent fracture of the proximal femur. Osteoporos Int 1991;1:147-54.
40 Perloff JJ, McDermott MT, Perloff KG, Blue PW, Enzenhauer R, Sieck E,et al. Reduced bone-mineral content is a risk factor for hip fractures.Orthop Rev 1991;20:690-8.
41 Nakamura N, Kyou T, Takaoka K, Ohzono K, Ono K. Bone mineral den-sity in the proximal femur and hip fracture type in the elderly. J BoneMiner Res 1992;7:755-9.
42 Libanati CR, Schulz EE, Shook JE, Bock M, Baylink DJ. Hip mineral den-sity in females with a recent hip fracture. J Clin Endocrinol Metab1992;74:351-6.
43 KanbaraY, Mizuno K, Hirohata K, Shiraishi H. A comparison of the bonemineral density of the vertebral bodies and the hip in elderly females withhip fractures. Kobe j Med Sci 1992;38:21-36.
44 Karlsson MK, Johnell 0, Nilsson BE, Sernbo I, Obrant KJ. Bone mineralmass in hip fracture patients. Bone 1993;14:161-5.
45 Greenspan SL, Myers ER, Maitland LA, Resnick NM, Hayes WC. Fallseverity and bone mineral density as risk factors for hip fracture in ambu-latory elderly. jAMA 1994;271:128-33.
46 Sugimoto T, KanbaraY, Shirashi M, Kawakatsu M, Negishi H, Fukase M,et al. Femoral and spinal bone mineral density in Japanese osteoporoticswith hip fracture. Osteoporos Int 1994;4:144-8.
47 Pitt F, Lloyd-Jones M, Brazier JE, McGrother CW, Kanis JA, Wallace WA,et al. The costs and benefits of screening and preventing post-menopausalosteoporosis in Trent Region. Sheffield: Trent Osteoporosis Working Group,Trent Regional Health Authority, 1990.
48 Screeningfor osteoporosis topreventfractures: bulletin on the effectiveness ofhealthservices interventions for decision makers. Vol 1. London: School of PublicHealth,UJniversity of Leeds, Centre for Health Economics, University ofYork, Research Unit of the Royal College of Physicians, Department ofHealth, 1992.
(Accepted 29 February 1996)
Lung cancer, smoking, and environment: a cohort study oftheDanish population
Gerda Engholm, Finn Palmgren, Elsebeth Lynge
Danish Cancer Society,Division for CancerEpidemiology, Box 839,DK-2100 Copenhagen 0,DenmarkGerda Engholm, statisticianElsebeth Lynge, head ofdepartment
National EnvironmentalResearch Institute,Box 358, DK-4000Roskilde, DenmarkFinn Palmgren, senior scientist
Correspondence to:Ms Engholm.
BMY 1996;312:1259-63
AbstractObjective-The almost twofold difference in
lung cancer incidence between people living inCopenhagen and in the rural areas ofDenmark inthe 1980s led to public concern; this study wasundertaken to assess the effects of air pollutionand occupation on lung cancer in Denmark, withcontrol for smoking habits.Design-Cohort study ofnational population.Subjects-People aged 30-64 and economically
active in 1970 (927 470 men and 486 130 women).Main outcome measures-Relative risks for
lung cancer estimated with multiplicative Poissonmodelling ofincidence rates.Results-Differences in smoking habit ex-
plained about 60% ofthe excess lung cancer risk inCopenhagen for men and 90% for women. Aftercontrol for smoking, workers had double the lungcancer risk of teachers and academics. There wasonly a small independent effect ofregion.Conclutsion-Smoking is the main factor behind
the regional differences in lung cancer incidencein Denmark, and occupational risk factors alsoseem to have an important role.The outdoor air in
Copenhagen around 1970 contained on average50-80 pg/rm' of sulphur dioxide, 80-100 jtg/m' totalsuspended particulate matter, and up to 10 nglm'benzo(a)pyrene and had peak values of dailysmoke of 120 tgIm'. Region had only a small effecton incidence of lung cancer in the present study,which suggests that an influence of outdoor airpollution on lung cancer is identifiable only abovethis pollution level.
IntroductionThe incidence of lung cancer incidence in Denmark
varied in the 1980s from a world standardised rate of47/100 000 for men in rural areas to 80/100 000 inCopenhagen.' Air pollution is higher in Copenhagenthan in rural areas, and the possible link between lungcancer and air pollution has been an issue of publicconcern. Using register based data we measured theimpact ofsmoking and occupational and environmentalexposures on the risk of lung cancer in Denmark.
MethodsThe study included people aged 30-64 years, living
and economically active in Denmark on the census date
BMJ VOLUME 312 18 MAY 1996 1259