
MEGAWATT DAILY - Renewable Energy Finance : Theory ...
22
Friday, April 17, 2020 MEGAWATT DAILY www.platts.com www.twitter.com/PlattsPower NEW DAIL Y HYDROGEN ASSESSMENTS NEWS HEADLINES PJM capacity market overhaul largely survives second look by FERC ■ RECs, RGGI not subject to MOPR, FERC clarifies ■ Self supply, energy efficiency will be mitigated ■ Glick offers strong rebuke of rehearing orders Renewables sector could emerge even stronger after pandemic turmoil, consolidation ■ Power and gas price recovery needed ■ Consolidation expected Cal-ISO peak demand served by renewables jumps 136% month on month in March ■ 23,757 MW: Cal-ISO installed renewable resources ■ 10,903 MW: peak demand served by renewables in March ■ 179,081 MWh: March curtailments, up 46.5% from 2019 INSIDE THIS ISSUE PJM Tracker: Power prices dip on slowing economy, milder weather, cheaper gas 6 ISO-NE proposes long-term fix for region's reliability, fuel-supply problems 7 Xcel says it expects 168-mile Hobbs to Lubbock power line to be completed in June 7 S&P: US, global economies to take longer, more severe hit than previously expected 9 California PUC hears from citizens voicing concerns over PG&E reorganization plan 9 Carbon markets trend higher, extending previous week’s momentum 11 Massachusetts, Connecticut V19 RECs continue on downward slump 11 Mass Hub falls $2.50 as demand expectations weaken 13 PJM, MISO power prices move down on lower natural gas 14 Southeast, ERCOT power prices mixed on differing fundamentals 15 West power dailies varied as demand tumbles 16 Mid-C hourly power prices fall as demand dips to its multi-months low 18 CAISO wind, solar curtailments drop as demand increases 19 Regional day-ahead pRice changes Day-ahead peak prices Regional weather trends Daily Prior Daily 7-day 17-Apr chg 7-day avg 17-Apr chg forecast ISO Price Locations CAISO NP 15 22.97 0.66 ▲ 21.11 59.1 -2.3 ▼ 61.8 ERCOT North Hub 20.50 7.08 ▲ 18.12 59.2 -2.0 ▼ 69.8 ISONE Internal Hub 16.66 -0.90 ▼ 17.55 42.0 -0.6 ▼ 46.6 MISO Indiana Hub 20.85 -0.76 ▼ 23.11 36.9 1.6 ▲ 50.9 NYISO Zone G 15.51 -0.66 ▼ 15.72 41.0 -1.2 ▼ 50.1 PJM West Hub 18.29 -1.14 ▼ 19.12 43.9 1.7 ▲ 52.6 SPP South Hub 17.81 10.64 ▲ 14.19 43.1 -4.0 ▼ 58.3 Bilateral indexes Into Southern 18.83 -1.17 ▼ 18.44 63.8 4.3 ▲ 69.0 Palo Verde 14.88 0.88 ▲ 14.38 60.5 -1.8 ▼ 63.4 COB 18.75 -1.00 ▼ 20.80 54.5 0.4 ▲ 55.4 Mid-C 16.91 -0.98 ▼ 19.93 54.5 0.4 ▲ 55.4 Source: Platts HOURLY INDEX VALUES 15-Apr Mid-C hourly ($/MWh) Cal ISO curtailment (MW) On-peak 11.03 7241.27 Off-peak 14.16 0.00 PLATTS PEAK DAILY DEMAND (GW) Daily change Season Season average ISO 08-Apr 09-Apr 10-Apr 11-Apr 12-Apr 13-Apr 14-Apr 15-Apr Chg % Chg Min Max 2020 2019 Chg % Chg BPA-Puget 7.20 6.76 6.63 6.49 6.85 7.17 6.87 6.33 -0.54 -7.86 5.57 8.63 7.49 7.44 0.06 0.79 IESO 14.55 14.45 14.17 13.96 13.72 14.66 15.02 15.35 0.33 2.20 12.87 18.18 15.91 18.96 -3.04 -16.05 CAISO 24.60 24.55 23.69 22.53 22.39 23.71 24.19 24.25 0.06 0.25 20.09 28.09 25.14 26.56 -1.42 -5.35 ERCOT 55.18 49.33 40.00 39.86 45.78 37.59 37.69 37.72 0.03 0.08 32.61 55.18 42.63 45.44 -2.81 -6.18 SPP 31.87 27.26 26.53 25.39 26.44 29.34 29.51 29.33 -0.18 -0.61 24.96 31.87 28.55 35.69 -7.14 -20.00 MISO 73.23 70.62 64.07 61.72 63.46 69.35 69.38 69.45 0.07 0.10 60.98 79.50 71.58 86.48 -14.90 -17.23 PJM 78.11 78.57 202.81 73.16 70.82 79.74 80.86 72.81 -8.05 -9.96 24.89 202.81 85.95 94.24 -8.29 -8.80 NYISO 15.63 16.30 16.52 15.60 14.89 16.11 16.00 16.14 0.14 0.88 14.89 19.28 17.04 18.54 -1.50 -8.08 NEISO 12.92 13.84 13.19 12.52 11.87 13.46 12.70 12.83 0.13 1.02 10.57 15.72 13.80 14.62 -0.82 -5.62 AESO 9.84 9.65 9.56 9.63 9.65 9.67 9.56 9.70 0.14 1.46 9.56 10.79 10.24 10.95 -0.72 -6.55 Season definitions: Summer (June – August), Fall (September – November), Winter (December – February), and Spring (March – May). Source: S&P Global Platts COAL-vs-GAS $/MWh FUEL COST RATIOS The Platts coal-vs-gas fuel cost ratios indicate the regional competitiveness of gas versus coal for power generation. The ratio is calculated by dividing the $/MWh fuel cost f or coal by that of gas. Gas generation is cheaper than coal generation when the ratio is greater than one. All price data reflects prompt month fuel contracts. Source: S&P Global Platts daily OTC coal prices and M2MS gas prices 0.0 0.5 1.0 1.5 2.0 2.5 14-Apr 18-Mar 21-Feb 27-Jan 30-Dec 03-Dec 05-Nov Into Southern PJM West MISO Ind SPP South ERCOT North Threshold
-
Upload
khangminh22 -
Category
Documents
-
view
2 -
download
0
Transcript of MEGAWATT DAILY - Renewable Energy Finance : Theory ...
Friday, April 17, 2020
MEGAWATT DAILY
www.platts.com www.twitter.com/PlattsPower
NEW DAILY HYDroGEN AssEssMENTs
News HeadliNes
PJM capacity market overhaul largely survives second look by FeRC
■■ ReCs, RGGi not subject to MOPR, FeRC clarifies■■ self supply, energy efficiency will be mitigated■■ Glick offers strong rebuke of rehearing orders
Renewables sector could emerge even stronger after pandemic turmoil, consolidation■■ Power and gas price recovery needed■■ Consolidation expected
Cal-isO peak demand served by renewables jumps 136% month on month in March■■ 23,757 Mw: Cal-isO installed renewable resources■■ 10,903 Mw: peak demand served by renewables in March■■ 179,081 Mwh: March curtailments, up 46.5% from 2019
iNside tHis issue
PJM Tracker: Power prices dip on slowing economy, milder weather, cheaper gas 6ISO-NE proposes long-term fix for region's reliability, fuel-supply problems 7Xcel says it expects 168-mile Hobbs to Lubbock power line to be completed in June 7S&P: US, global economies to take longer, more severe hit than previously expected 9California PUC hears from citizens voicing concerns over PG&E reorganization plan 9Carbon markets trend higher, extending previous week’s momentum 11Massachusetts, Connecticut V19 RECs continue on downward slump 11Mass Hub falls $2.50 as demand expectations weaken 13PJM, MISO power prices move down on lower natural gas 14Southeast, ERCOT power prices mixed on differing fundamentals 15West power dailies varied as demand tumbles 16Mid-C hourly power prices fall as demand dips to its multi-months low 18CAISO wind, solar curtailments drop as demand increases 19
Regional day-ahead pRice changes day-ahead peak prices Regional weather trends
daily Prior daily 7-day 17-apr chg 7-day avg 17-apr chg forecast
isO Price locations
CAISO NP 15 22.97 0.66 ▲ 21.11 59.1 -2.3 ▼ 61.8ERCOT North Hub 20.50 7.08 ▲ 18.12 59.2 -2.0 ▼ 69.8ISONE Internal Hub 16.66 -0.90 ▼ 17.55 42.0 -0.6 ▼ 46.6MISO Indiana Hub 20.85 -0.76 ▼ 23.11 36.9 1.6 ▲ 50.9NYISO Zone G 15.51 -0.66 ▼ 15.72 41.0 -1.2 ▼ 50.1PJM West Hub 18.29 -1.14 ▼ 19.12 43.9 1.7 ▲ 52.6SPP South Hub 17.81 10.64 ▲ 14.19 43.1 -4.0 ▼ 58.3
Bilateral indexes
Into Southern 18.83 -1.17 ▼ 18.44 63.8 4.3 ▲ 69.0Palo Verde 14.88 0.88 ▲ 14.38 60.5 -1.8 ▼ 63.4COB 18.75 -1.00 ▼ 20.80 54.5 0.4 ▲ 55.4Mid-C 16.91 -0.98 ▼ 19.93 54.5 0.4 ▲ 55.4
Source: Platts
HOuRly iNdex values15-Apr Mid-C hourly ($/MWh) Cal ISO curtailment (MW)On-peak 11.03 7241.27Off-peak 14.16 0.00
Platts Peak daily deMaNd (Gw) daily change season season average
isO 08-apr 09-apr 10-apr 11-apr 12-apr 13-apr 14-apr 15-apr Chg % Chg Min Max 2020 2019 Chg % ChgBPA-Puget 7.20 6.76 6.63 6.49 6.85 7.17 6.87 6.33 -0.54 -7.86 5.57 8.63 7.49 7.44 0.06 0.79IESO 14.55 14.45 14.17 13.96 13.72 14.66 15.02 15.35 0.33 2.20 12.87 18.18 15.91 18.96 -3.04 -16.05CAISO 24.60 24.55 23.69 22.53 22.39 23.71 24.19 24.25 0.06 0.25 20.09 28.09 25.14 26.56 -1.42 -5.35ERCOT 55.18 49.33 40.00 39.86 45.78 37.59 37.69 37.72 0.03 0.08 32.61 55.18 42.63 45.44 -2.81 -6.18SPP 31.87 27.26 26.53 25.39 26.44 29.34 29.51 29.33 -0.18 -0.61 24.96 31.87 28.55 35.69 -7.14 -20.00MISO 73.23 70.62 64.07 61.72 63.46 69.35 69.38 69.45 0.07 0.10 60.98 79.50 71.58 86.48 -14.90 -17.23PJM 78.11 78.57 202.81 73.16 70.82 79.74 80.86 72.81 -8.05 -9.96 24.89 202.81 85.95 94.24 -8.29 -8.80NYISO 15.63 16.30 16.52 15.60 14.89 16.11 16.00 16.14 0.14 0.88 14.89 19.28 17.04 18.54 -1.50 -8.08NEISO 12.92 13.84 13.19 12.52 11.87 13.46 12.70 12.83 0.13 1.02 10.57 15.72 13.80 14.62 -0.82 -5.62AESO 9.84 9.65 9.56 9.63 9.65 9.67 9.56 9.70 0.14 1.46 9.56 10.79 10.24 10.95 -0.72 -6.55
Season definitions: Summer (June – August), Fall (September – November), Winter (December – February), and Spring (March – May).
Source: S&P Global Platts
COAL-vs-GAS $/MWh FUEL COST RATIOS
The Platts coal-vs-gas fuel cost ratios indicate the regional competitiveness of gas versus coal for power generation. The ratio is calculated by dividing the $/MWh fuel cost for coal by that of gas. Gas generation is cheaper than coal generation when the ratio is greater than one. All price data re�ects prompt month fuel contracts.
Source: S&P Global Platts daily OTC coal prices and M2MS gas prices
0.0
0.5
1.0
1.5
2.0
2.5
14-Apr18-Mar21-Feb27-Jan30-Dec03-Dec05-Nov
Into Southern PJM West MISO IndSPP South ERCOT North Threshold
Friday, april 17, 2020Megawatt daily
2© 2020 S&P Global Platts, a division of S&P Global Inc. All rights reserved.
NEWS / PRICING COMMENTARY / MARkET FuNdAMENTAls
ISSN: 1088-4319
MEGAWATT DAILY
To reach Platts: E-mail:[email protected]; North America: Tel:800-PlATTs-8; latin America: Tel:+54-11-4121-4810; Europe & Middle East: Tel:+44-20-7176-6111; Asia Pacific: Tel:+65-6530-6430
The names “s&P Global Platts” and “Platts” and the S&P Global Platts logo are trademarks of S&P Global Inc. Permission for any commercial use of the S&P Global Platts logo must be granted in writing by S&P Global Inc.
You may view or otherwise use the information, prices, indices, assessments and other related information, graphs, tables and images (“data”) in this publication only for your personal use or, if you or your company has a license for the data from S&P Global Platts and you are an authorized user, for your company’s internal business use only. You may not publish, reproduce, extract, distribute, retransmit, resell, create any derivative work from and/or otherwise provide access to the data or any portion thereof to any person (either within or outside your company, including as part of or via any internal electronic system or intranet), firm or entity, including any subsidiary, parent, or other entity that is affiliated with your company, without S&P Global Platts’ prior written consent or as otherwise authorized under license from S&P Global Platts. Any use or distribution of the data beyond the express uses authorized in this paragraph above is subject to the payment of additional fees to S&P Global Platts.
S&P Global Platts, its affiliates and all of their third-party licensors disclaim any and all warranties, express or implied, including, but not limited to, any
warranties of merchantability or fitness for a particular purpose or use as to the data, or the results obtained by its use or as to the performance thereof. data in this publication includes independent and verifiable data collected from actual market participants. Any user of the data should not rely on any information and/or assessment contained therein in making any investment, trading, risk management or other decision. S&P Global Platts, its affiliates and their third-party licensors do not guarantee the adequacy, accuracy, timeliness and/or completeness of the data or any component thereof or any communications (whether written, oral, electronic or in other format), and shall not be subject to any damages or liability, including but not limited to any indirect, special, incidental, punitive or consequential damages (including but not limited to, loss of profits, trading losses and loss of goodwill).
ICE index data and NYMEX futures data used herein are provided under S&P Global Platts’ commercial licensing agreements with ICE and with NYMEX. You acknowledge that the ICE index data and NYMEX futures data herein are confidential and are proprietary trade secrets and data of ICE and NYMEX or its licensors/suppliers, and you shall use best efforts to prevent the unauthorized publication, disclosure or copying of the ICE index data and/or NYMEX futures data.
Permission is granted for those registered with the Copyright Clearance Center (CCC) to copy material herein for internal reference or personal use only, provided that appropriate payment is made to the CCC, 222 Rosewood drive, danvers, MA 01923, phone +1-978-750-8400. Reproduction in any other form, or for any other purpose, is forbidden without the express prior permission of s&P Global Inc. For article reprints contact: The YGs Group, phone +1-717-505-9701 x105 (800-501-9571 from the u.s.).
For all other queries or requests pursuant to this notice, please contact S&P Global Inc. via email at [email protected].
Megawatt Daily is published daily by Platts, a division of s&P Global, registered office: 55 Water street, 37th Floor, New York, N.Y. 10038.
Officers of the Corporation: Charles E. Haldeman, Jr., Non-Executive Chairman; doug Peterson, President and Chief Executive Officer; Ewout steenbergen, Executive Vice President, Chief Financial Officer; steve kemps, Executive Vice President, General Counsel
Megawatt Daily Questions? Email:[email protected]
Managers North America Gas and Power ContentRocco Canonica, +1-720-264-6626Joe Fisher, +1-713-658-3290Amy Gasca, +1-346-348-6896Chris Newkumet, +1-202-383-2141Anne swedberg, +1-720-264-6728
EditorsJared Anderson, +1-212-904-2002sheky Espejo, +55-5081-5274Brandon Evans, +1-720-264-6671Jasmin Melvin, +1-202-383-2135kassia Micek, +1-713-655-2227J. Robinson, +1-720-264-6657Jeffrey Ryser, +1-713-658-3225Mark Watson, +1-713-658-3214Harry Weber, +1-713-658-3257Maya Weber, +1-202-383-2244
Spot Market Editorskelli Ainsworth, +1-713-658-3267Humza Jamal +1-346-348-6890Isabel Milton, +1-713-658-3213
AnalystsEric BrooksEmmanuel CorralRichard FreyJohn Hilfikerluke JacksonTyler JubertJack WintersRoss Wyeno
Director, Americas Generating Fuels and Electric Power PricingMark Callahan
Director, Americas Energy NewsJames O’Connell
Global Director of Generating Fuelssimon Thorne
Manager, Advertisement SalesBob Botelho
Platts PresidentMartin Fraenkel
AdvertisingTel: +1-720-264-6618
© 2020 S&P Global Platts, a division of S&P Global Inc. All rights reserved.
News
PJM capacity market overhaul largely survives second look by FeRC
■■ ReCs, RGGi not subject to MOPR, FeRC clarifies■■ self supply, energy efficiency will be mitigated■■ Glick offers strong rebuke of rehearing orders
A divided Federal Energy Regulatory Commission Thursday voted to approve key clarifications to its overhaul of PJM Interconnection's capacity market in a move that also cleared the way for legal challenges related to the closely-watched proceeding to move forward.
During its monthly open meeting, FERC largely affirmed a June 2018 order (EL16-49) in which a deeply divided commission found that PJM's then-existing capacity market rules failed to address potential price distortion caused by state-sponsored clean energy resources.
In doing so, the commission also addressed requests for rehearing and clarification to a December 2019 order (EL18-178) directing the 13-state grid operator to expand its minimum offer price rule (MOPR) to all new resources and some existing generators seeking to participate in its capacity market that receive a material state subsidy.
Bitterly opposed by renewables advocates, FERC's December 2019 order also created confusion among market participants and PJM who sought clarification on whether the administratively set price floor would apply to private clean energy transactions and generators in states covered by the Regional Greenhouse Gas Initiative.
In a win for corporate clean energy procurement, Chairman Neil Chatterjee clarified during the Thursday meeting that the MOPR will not apply to voluntary purchases of renewable energy credits (RECs). Following the meeting, Chatterjee also clarified to reporters that RGGI will not be viewed as a state subsidy because the regional cap-and-trade scheme does not amount to "a payment or concession."
The full text of the orders was not available directly after the meeting, which was held virtually due to the coronavirus pandemic
Further clarificationsCommissioner Richard Glick, who dissented from both of the
rehearing orders, said in an interview that further clarifications to the agency's December 2019 directive will also subject energy efficiency resources to the MOPR "even though there's nothing in the record to suggest that [energy efficiency] causes any price suppression."
Glick said the commission's action Thursday could also cause certain demand response resources to be implicated in market mitigation. "The order handles demand response by essentially calling into question the way PJM takes demand response into account," he said.
Speaking to reporters after the meeting, Chatterjee cited Glick's dissent to the commission's June 2018 order as a way of justifying its decision to affirm the MOPR will apply to publicly-owned utilities that procure their own generating resources, known as self-supply entities.
"Commissioner Glick himself has made the case in a prior dissent that resources like utilities with guaranteed cost recovery are not competitive, and so at the end of the day all this rule requires is that
Friday, april 17, 2020Megawatt daily
3© 2020 S&P Global Platts, a division of S&P Global Inc. All rights reserved.
NEWS / PRICING COMMENTARY / MARkET FuNdAMENTAls
1,513
9,145
4,557
779
8,391
21,6563,290
15,3348
,722
635
14,113
ILLINO
IS
IND
IAN
A
MIC
HIG
AN
KEN
TU
CK
Y
OH
IO
WEST
VIR
GIN
IA
VIR
GIN
IA
PEN
NSY
LVAN
IA
NE
W JER
SEY
MA
RY
LAN
DNO
RT
H C
AR
OLIN
A2
02
11
5%
20
25
25
%
20
25
10
%
20
50
10
0%
20
50
: 10
0%
20
25
: 25
%
20
30
: 50
%
20
32
: 10
0%
20
27
0%
20
21
12
.5%
20
21
18
%
Targetdate
Goal
No goal
25 8.5%
5075100
Percentage of energy m
andated to be cleanor have renew
able standards
STATE R
ENE
WA
BLE
PO
LICY
TAR
GETS
TN
ILIN
MI
NJ
DE
MD
D.C
.VA
NC
WV
KY
OH
PA
Planned clean
energy additionsper state (M
W)
(sized by total MW
)
Off
shore leasedareas for w
inddevelopm
ent
In PJM there are over 92
GW
of wind and solar
generation interconnec-tion requests. 754 independent requests are potentially exposed to ruling.
Planned projects
Solar farm W
ind farm
1,364 M
WQ
uad Cities
908
MW
Davis-B
esse
1,268 M
WPerry
1,172 MW
Hope C
reek2,328
MW
Salem
MW
MW
MW
MW
MW
MW
MW
MW
MW
MW
GW
Eligible for statesubsidies
Nuclear plants
(sized by operating capacity)
Not eligible
10,00
05,0
00 1,0
00
0100
mi
0100
km
Sources: PJM, S&
P Global M
arket Intelligence, S&P G
lobal Platts; PJM Interconnection Q
ueue
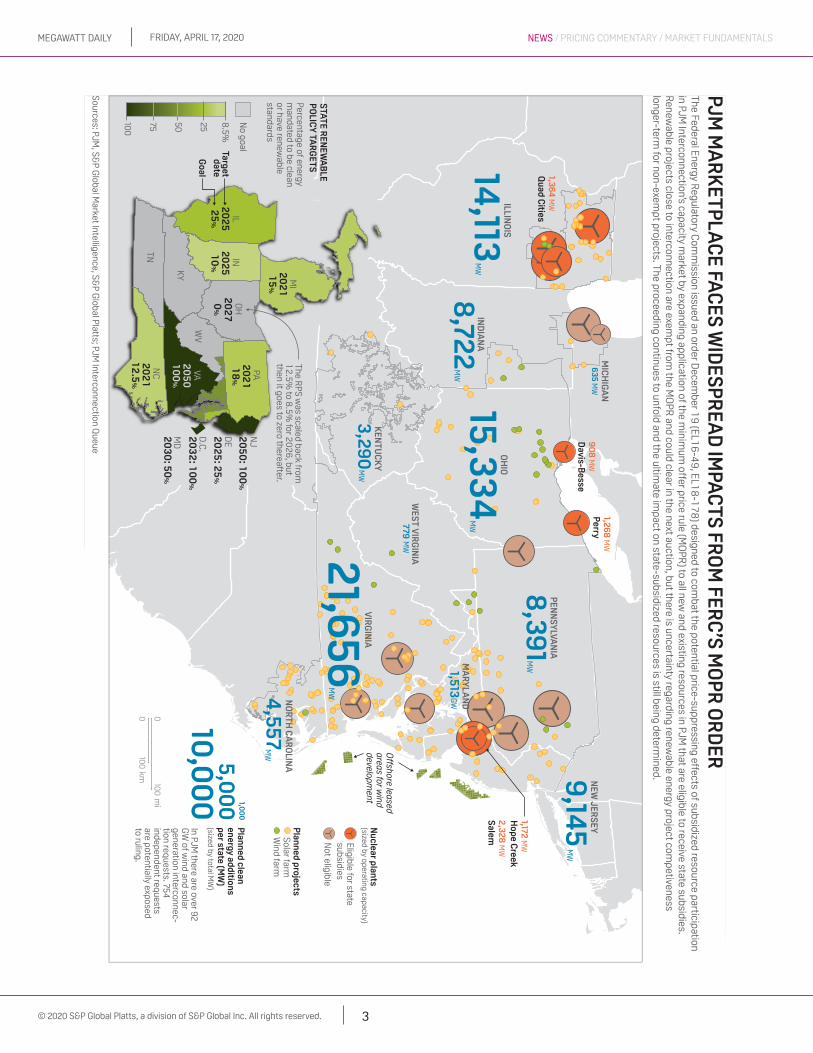
The Federal Energy Regulatory C
omm
ission issued an order Decem
ber 19
(EL16
-49
, EL18
-17
8) designed to com
bat the potential price-suppressing effects of subsidized resource participation
in PJM Interconnection’s capacity m
arket by expanding application of the minim
um off
er price rule (MO
PR) to all new
and existing resources in PJM that are eligible to receive state subsidies.
Renew
able projects close to interconnection are exempt from
the MO
PR and could clear in the next auction, but there is uncertainty regarding renew
able energy project competiveness
longer-term for non-exem
pt projects. The proceeding continues to unfold and the ultimate im
pact on state-subsidized resources is still being determined.
PJM M
AR
KET
PLA
CE FA
CES
WID
ESP
REA
D IM
PAC
TS FR
OM
FERC
’S M
OP
R O
RD
ER
The RPS w
as scaled back from
12
.5%
to 8.5
% for 2
02
6, but
then it goes to zero thereafter.

Friday, april 17, 2020Megawatt daily
4© 2020 S&P Global Platts, a division of S&P Global Inc. All rights reserved.
NEWS / PRICING COMMENTARY / MARkET FuNdAMENTAls
new entrants are competitive," Chatterjee said.But Glick later called that a "mischaracterization," explaining he
made that point while asserting MOPRs are generally ineffective because all resource types arguably receive some form of subsidy.
"You can't distinguish between them, which is why you shouldn't go down the MOPR path at all," Glick said.
'stunningly awful’Glick offered a strong rebuke of the rehearing orders during the
meeting, maintaining his position that FERC’s actions would dramatically increase the price of capacity and slow PJM’s transition to a clean energy economy.
He called FERC's response on rehearing to the December order “stunningly awful” as “it continues to target state clean energy policies and force consumers to pay billions of dollars more for generating capacity that they don't need.”
Among his concerns was that FERC failed to consider the costs associated with broadening the application of the MOPR.
Chatterjee later told reporters that Glick’s cost estimates were overblown and based on incorrect assumptions.
Glick responded in a statement: “People can quibble over assumptions, but my analysis was one of many that showed costs in the excess of $1 billion/year.”
The clean energy sector expressed dismay with FERC’s decision to largely reject rehearing requests, but advocates were encouraged by the acknowledgement that voluntary RECs would not trigger the MOPR.
Despite disappointment with FERC’s decision to stay the course, trade groups representing solar and wind power advocated for a swift resumption of PJM’s three-year-forward capacity auctions.
Meanwhile, competitive power producers celebrated FERC's orders Thursday as sound policy. "The bottom line is that customers pay the price when certain resources and companies enjoy an unfair market advantage that squeezes out competitors and removes the pressure to innovate, perform efficiently, control costs, and nimbly respond to changing circumstances," Todd Snitchler, president and CEO of the Electric Power Supply Association, said in a statement.
Court appealsThe rehearing orders clear the way for entities to take their gripes
with the MOPR orders to the DC Circuit Court of Appeals.Protective petitions for review have already been filed by the New
Jersey Divisions of Rate Counsel, the National Rural Electric Cooperative Association and most recently East Kentucky Power Cooperative in light of a separate court case challenging FERC’s issuance of tolling orders.
FERC earlier in the week filed motions to dismiss the two earlier proceedings as “incurably premature” since commission action was not yet final as rehearing requests were still pending. “Today’s orders render that motion moot and removes outstanding rehearing requests as an obstacle to judicial review,” a note from ClearView Energy Partners said.
ClearView added that other entities now have until June 15 to seek appeal. It cast doubt on the likelihood of a stay of the orders being granted by the DC Circuit.
PJM now has 45 days to submit a filing addressing the issues raised in FERC's Thursday orders. Comments on a compliance filing PJM submitted last month are also due May 15.
— Jasmin Melvin, Zack Hale, S&P Global Market Intelligence
Renewables sector could emerge even stronger after pandemic turmoil, consolidation
■■ Power and gas price recovery needed■■ Consolidation expected
US renewable energy market participants said Thursday they remain bullish on the renewable energy industry despite the challenges posed by the coronavirus pandemic, but getting higher returns on investment will rely on an energy price increase.
“To get higher returns, power prices need to be higher,” Joram Cukierman, managing director of Goldman Sachs commodities, said during a webinar hosted by law firm Bracewell.
“Higher returns require higher power prices at the back end of the curve,” Cukierman said.
Long-term pricing in the PJM Interconnection and California Independent System Operator are “pretty stable” … and “my sense is that fundamentals in markets mean a lot of producers will shut down and prices will go up … longer term we need higher pricing on natural gas to remain competitive,” Yuri Horwitz, CEO of solar energy firm Sol Systems, said.
Asked about project level impacts from the coronavirus pandemic,
Friday, april 17, 2020Megawatt daily
5© 2020 S&P Global Platts, a division of S&P Global Inc. All rights reserved.
NEWS / PRICING COMMENTARY / MARkET FuNdAMENTAls
the panelists said early-stage projects are more likely to face delays and other challenges than more advanced projects.
Cukierman said they have seven or eight projects about to reach commercial operational dates that have not been too severely impacted, but the bigger question is about projects in earlier stages of development where permitting offices might be closed or panels or turbines need to be delivered from overseas.
With regards to receiving equipment, Horwitz said there is some variation but the Chinese supply chain is mostly back on line along with other Asian manufacturing centers. Suppliers of trackers and racks have been nimble in using factories in different countries that are open, but some European manufacturers are being impacted.
Force majeureDanielle Garbien, a partner at Bracewell who moderated the
discussion, said Bracewell clients so far are saying they can still work subject to some exceptions.
Ricardo Alicea, senior legal counsel at Brookfield Renewables, said to date Brookfield has not had to declare force majeure and has not had suppliers or developers do it, but “the longer this goes on and the more restrictions are put in place, it becomes more likely.”
New York Governor Andrew Cuomo on Thursday extended the state’s stay-at-home order through May 15.
There are multiple factors that can trigger force majeure in contracts, Alicea said, and one of the easier bars to clear is the coronavirus pandemic being something not in reasonable control of the contracting parties.
“We are hearing all sorts of stories about permitting issues,” he said. If you can’t get a permit, you can’t build so that could potentially lead to a force majeure claim.
Another pandemic-related impact is that some developers have recently looked to get out of projects.
“We have seen some early-stage assets go on the block in PJM and Texas and could see more,” Horwitz said. But projects in which investors are betting on long-term cash flows for 10 or 15 years “should be okay,” he said.
“Good projects tend to get built,” Cukierman said. The good projects will go to the developers with the best financial wherewithal that have the best contacts in the market, he said.
Santosh Raikar, managing partner and head of renewables at investment management firm Silverpeak noted that renewable energy businesses rebounded well after the 2008 financial crisis.
There will be winners and losers, and the winners will be ones with new business models, Raikar said. “I believe there will be a lot of adaptation … renewable energy will come out stronger,” he said.
Cukierman said Goldman is seeing a good amount of corporate buying interest from companies who think commodity prices are low and think they should lock in long-dated hedges for energy.
Asked where the renewable energy industry will be one year from now, the panelists all had positive outlooks.
“There will be big consolidation over the next year … it will take bigger balance sheets to succeed,” Horwitz said. But he said he’s always been optimistic about the renewable energy industry and ESG mandates from pension funds and others should continue to drive growth.
Alicea sees a lot of work coming for lawyers. “It will be a challenging environment over the next year with some bankruptcies,” but he remains bullish on the renewable energy industry.
— Jared Anderson
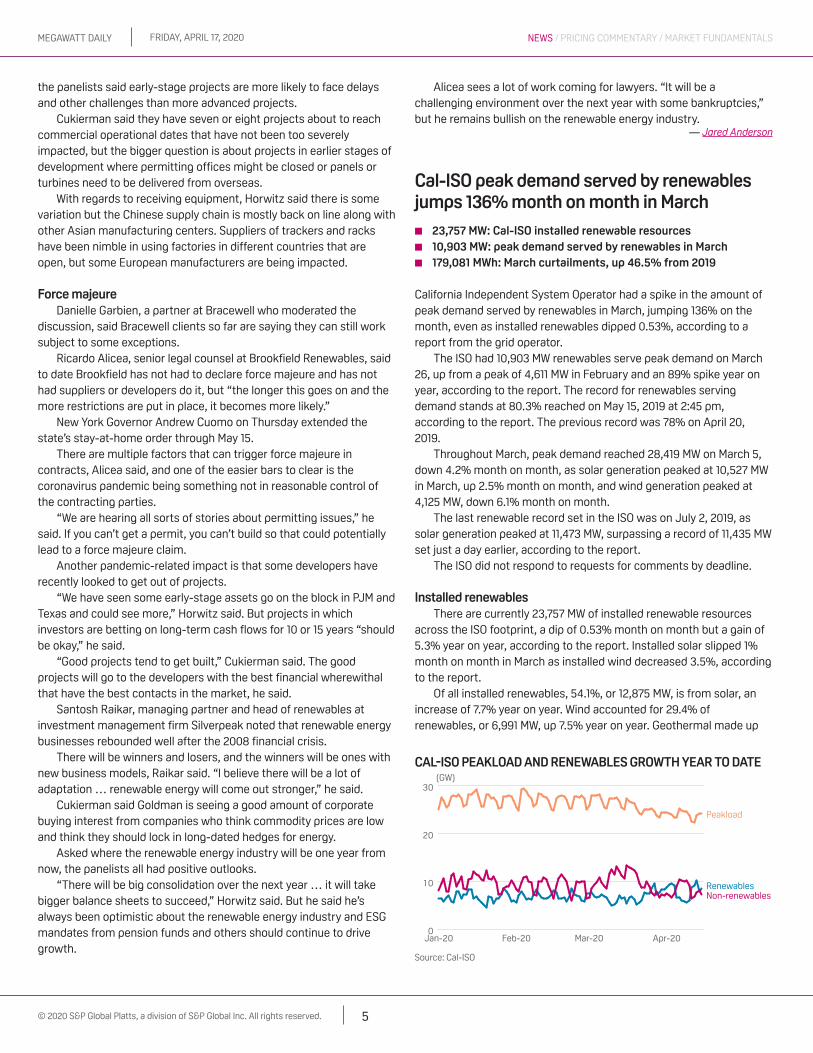
Cal-isO peak demand served by renewables jumps 136% month on month in March
■■ 23,757 Mw: Cal-isO installed renewable resources■■ 10,903 Mw: peak demand served by renewables in March■■ 179,081 Mwh: March curtailments, up 46.5% from 2019
California Independent System Operator had a spike in the amount of peak demand served by renewables in March, jumping 136% on the month, even as installed renewables dipped 0.53%, according to a report from the grid operator.
The ISO had 10,903 MW renewables serve peak demand on March 26, up from a peak of 4,611 MW in February and an 89% spike year on year, according to the report. The record for renewables serving demand stands at 80.3% reached on May 15, 2019 at 2:45 pm, according to the report. The previous record was 78% on April 20, 2019.
Throughout March, peak demand reached 28,419 MW on March 5, down 4.2% month on month, as solar generation peaked at 10,527 MW in March, up 2.5% month on month, and wind generation peaked at 4,125 MW, down 6.1% month on month.
The last renewable record set in the ISO was on July 2, 2019, as solar generation peaked at 11,473 MW, surpassing a record of 11,435 MW set just a day earlier, according to the report.
The ISO did not respond to requests for comments by deadline.
installed renewablesThere are currently 23,757 MW of installed renewable resources
across the ISO footprint, a dip of 0.53% month on month but a gain of 5.3% year on year, according to the report. Installed solar slipped 1% month on month in March as installed wind decreased 3.5%, according to the report.
Of all installed renewables, 54.1%, or 12,875 MW, is from solar, an increase of 7.7% year on year. Wind accounted for 29.4% of renewables, or 6,991 MW, up 7.5% year on year. Geothermal made up
Friday, april 17, 2020Megawatt daily
6© 2020 S&P Global Platts, a division of S&P Global Inc. All rights reserved.
NEWS / PRICING COMMENTARY / MARkET FuNdAMENTAls
7.4% of installed renewables, or 1,773 MW, a jump of 43.7% year on year. Small hydro was 5.3%, or 1,256 MW, a decrease of 29.6% year on year, while biofuels made up 3.6%, or 862 MW, down 9.4% year on year.
Managing oversupplyCal-ISO wind and solar curtailments totaled 179,081 MWh in March,
up 14% month on month and an increase of 46.5% year on year, according to the ISO. For comparison, March 2019 curtailments reached 122,225 MWh, an increase of 48% month on month, while April 2019 curtailments totaled 190,070 MW, a jump of 55.5% month on month.
— Kassia Micek
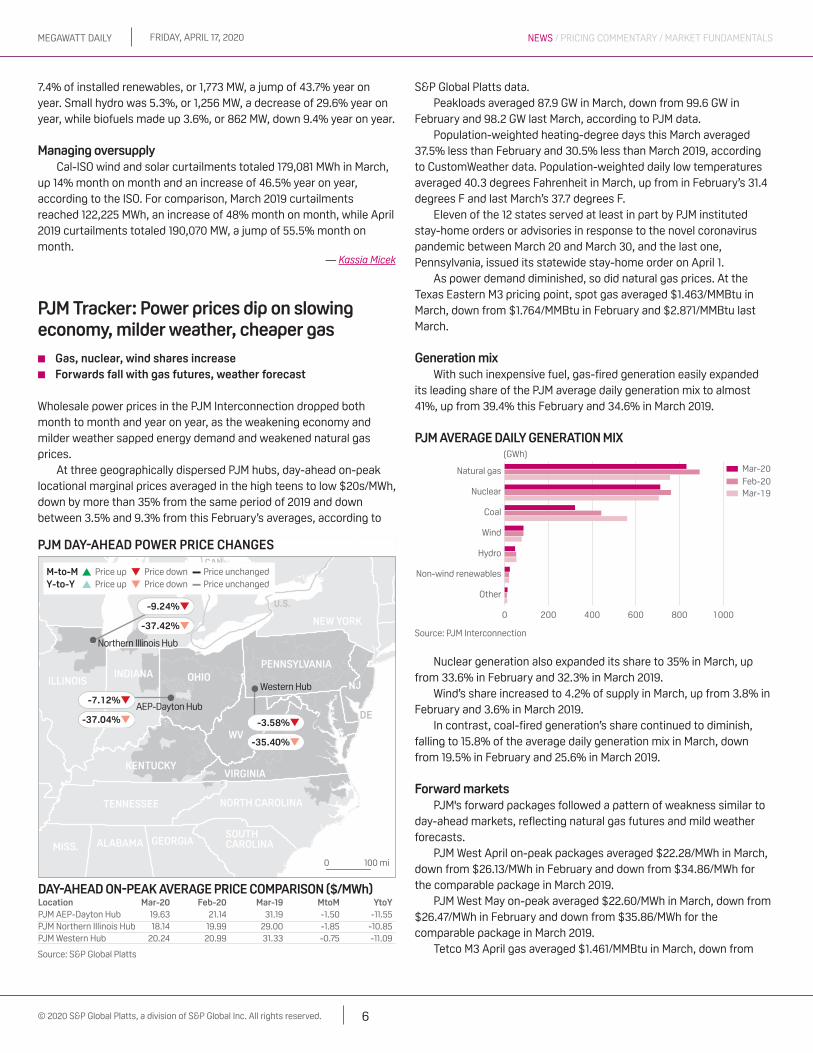
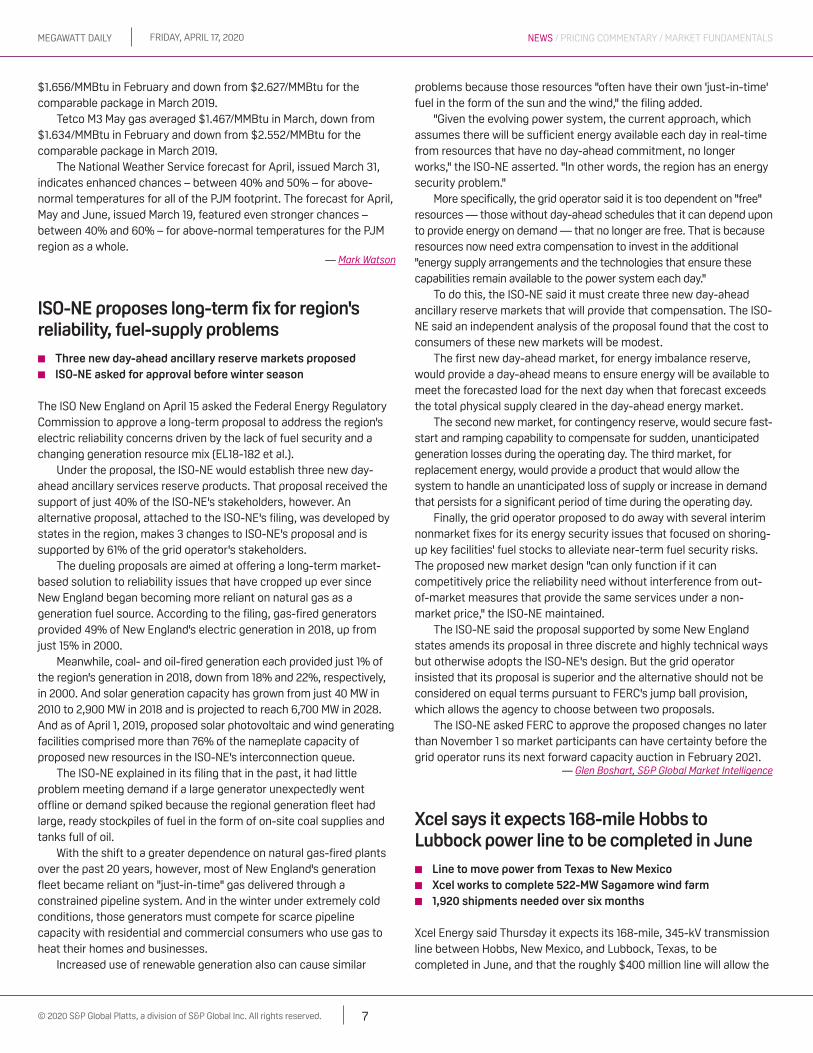
PJM tracker: Power prices dip on slowing economy, milder weather, cheaper gas
■■ Gas, nuclear, wind shares increase■■ Forwards fall with gas futures, weather forecast
Wholesale power prices in the PJM Interconnection dropped both month to month and year on year, as the weakening economy and milder weather sapped energy demand and weakened natural gas prices.
At three geographically dispersed PJM hubs, day-ahead on-peak locational marginal prices averaged in the high teens to low $20s/MWh, down by more than 35% from the same period of 2019 and down between 3.5% and 9.3% from this February’s averages, according to
S&P Global Platts data.Peakloads averaged 87.9 GW in March, down from 99.6 GW in
February and 98.2 GW last March, according to PJM data.Population-weighted heating-degree days this March averaged
37.5% less than February and 30.5% less than March 2019, according to CustomWeather data. Population-weighted daily low temperatures averaged 40.3 degrees Fahrenheit in March, up from in February’s 31.4 degrees F and last March’s 37.7 degrees F.
Eleven of the 12 states served at least in part by PJM instituted stay-home orders or advisories in response to the novel coronavirus pandemic between March 20 and March 30, and the last one, Pennsylvania, issued its statewide stay-home order on April 1.
As power demand diminished, so did natural gas prices. At the Texas Eastern M3 pricing point, spot gas averaged $1.463/MMBtu in March, down from $1.764/MMBtu in February and $2.871/MMBtu last March.
Generation mixWith such inexpensive fuel, gas-fired generation easily expanded
its leading share of the PJM average daily generation mix to almost 41%, up from 39.4% this February and 34.6% in March 2019.
Nuclear generation also expanded its share to 35% in March, up from 33.6% in February and 32.3% in March 2019.
Wind’s share increased to 4.2% of supply in March, up from 3.8% in February and 3.6% in March 2019.
In contrast, coal-fired generation’s share continued to diminish, falling to 15.8% of the average daily generation mix in March, down from 19.5% in February and 25.6% in March 2019.
Forward marketsPJM's forward packages followed a pattern of weakness similar to
day-ahead markets, reflecting natural gas futures and mild weather forecasts.
PJM West April on-peak packages averaged $22.28/MWh in March, down from $26.13/MWh in February and down from $34.86/MWh for the comparable package in March 2019.
PJM West May on-peak averaged $22.60/MWh in March, down from $26.47/MWh in February and down from $35.86/MWh for the comparable package in March 2019.
Tetco M3 April gas averaged $1.461/MMBtu in March, down from
Friday, april 17, 2020Megawatt daily
7© 2020 S&P Global Platts, a division of S&P Global Inc. All rights reserved.
NEWS / PRICING COMMENTARY / MARkET FuNdAMENTAls
$1.656/MMBtu in February and down from $2.627/MMBtu for the comparable package in March 2019.
Tetco M3 May gas averaged $1.467/MMBtu in March, down from $1.634/MMBtu in February and down from $2.552/MMBtu for the comparable package in March 2019.
The National Weather Service forecast for April, issued March 31, indicates enhanced chances – between 40% and 50% – for above-normal temperatures for all of the PJM footprint. The forecast for April, May and June, issued March 19, featured even stronger chances – between 40% and 60% – for above-normal temperatures for the PJM region as a whole.
— Mark Watson
isO-Ne proposes long-term fix for region's reliability, fuel-supply problems
■■ three new day-ahead ancillary reserve markets proposed■■ isO-Ne asked for approval before winter season
The ISO New England on April 15 asked the Federal Energy Regulatory Commission to approve a long-term proposal to address the region's electric reliability concerns driven by the lack of fuel security and a changing generation resource mix (EL18-182 et al.).
Under the proposal, the ISO-NE would establish three new day-ahead ancillary services reserve products. That proposal received the support of just 40% of the ISO-NE's stakeholders, however. An alternative proposal, attached to the ISO-NE's filing, was developed by states in the region, makes 3 changes to ISO-NE's proposal and is supported by 61% of the grid operator's stakeholders.
The dueling proposals are aimed at offering a long-term market-based solution to reliability issues that have cropped up ever since New England began becoming more reliant on natural gas as a generation fuel source. According to the filing, gas-fired generators provided 49% of New England's electric generation in 2018, up from just 15% in 2000.
Meanwhile, coal- and oil-fired generation each provided just 1% of the region's generation in 2018, down from 18% and 22%, respectively, in 2000. And solar generation capacity has grown from just 40 MW in 2010 to 2,900 MW in 2018 and is projected to reach 6,700 MW in 2028. And as of April 1, 2019, proposed solar photovoltaic and wind generating facilities comprised more than 76% of the nameplate capacity of proposed new resources in the ISO-NE's interconnection queue.
The ISO-NE explained in its filing that in the past, it had little problem meeting demand if a large generator unexpectedly went offline or demand spiked because the regional generation fleet had large, ready stockpiles of fuel in the form of on-site coal supplies and tanks full of oil.
With the shift to a greater dependence on natural gas-fired plants over the past 20 years, however, most of New England's generation fleet became reliant on "just-in-time" gas delivered through a constrained pipeline system. And in the winter under extremely cold conditions, those generators must compete for scarce pipeline capacity with residential and commercial consumers who use gas to heat their homes and businesses.
Increased use of renewable generation also can cause similar
problems because those resources "often have their own 'just-in-time' fuel in the form of the sun and the wind," the filing added.
"Given the evolving power system, the current approach, which assumes there will be sufficient energy available each day in real-time from resources that have no day-ahead commitment, no longer works," the ISO-NE asserted. "In other words, the region has an energy security problem."
More specifically, the grid operator said it is too dependent on "free" resources — those without day-ahead schedules that it can depend upon to provide energy on demand — that no longer are free. That is because resources now need extra compensation to invest in the additional "energy supply arrangements and the technologies that ensure these capabilities remain available to the power system each day."
To do this, the ISO-NE said it must create three new day-ahead ancillary reserve markets that will provide that compensation. The ISO-NE said an independent analysis of the proposal found that the cost to consumers of these new markets will be modest.
The first new day-ahead market, for energy imbalance reserve, would provide a day-ahead means to ensure energy will be available to meet the forecasted load for the next day when that forecast exceeds the total physical supply cleared in the day-ahead energy market.
The second new market, for contingency reserve, would secure fast-start and ramping capability to compensate for sudden, unanticipated generation losses during the operating day. The third market, for replacement energy, would provide a product that would allow the system to handle an unanticipated loss of supply or increase in demand that persists for a significant period of time during the operating day.
Finally, the grid operator proposed to do away with several interim nonmarket fixes for its energy security issues that focused on shoring-up key facilities' fuel stocks to alleviate near-term fuel security risks. The proposed new market design "can only function if it can competitively price the reliability need without interference from out-of-market measures that provide the same services under a non-market price," the ISO-NE maintained.
The ISO-NE said the proposal supported by some New England states amends its proposal in three discrete and highly technical ways but otherwise adopts the ISO-NE's design. But the grid operator insisted that its proposal is superior and the alternative should not be considered on equal terms pursuant to FERC's jump ball provision, which allows the agency to choose between two proposals.
The ISO-NE asked FERC to approve the proposed changes no later than November 1 so market participants can have certainty before the grid operator runs its next forward capacity auction in February 2021.
— Glen Boshart, S&P Global Market Intelligence
xcel says it expects 168-mile Hobbs to lubbock power line to be completed in June
■■ line to move power from texas to New Mexico■■ xcel works to complete 522-Mw sagamore wind farm■■ 1,920 shipments needed over six months
Xcel Energy said Thursday it expects its 168-mile, 345-kV transmission line between Hobbs, New Mexico, and Lubbock, Texas, to be completed in June, and that the roughly $400 million line will allow the

Friday, april 17, 2020Megawatt daily
8© 2020 S&P Global Platts, a division of S&P Global Inc. All rights reserved.
NEWS / PRICING COMMENTARY / MARkET FuNdAMENTAls
OUTAGES
GeNeRatiON uNit OutaGe RePORt, aPR 15Plant/Operator Cap Fuel state status Return shut
Northeast
BruceA-G4/Bruce 780 n Ont. MO Unk 02/18/20BruceB-G6/Bruce 872 n Ont. MO Unk 01/21/20Darlington-G2/OPG 887 n Ont. MO Unk 02/19/20Lennox-G2/ OPG 525 g Ont. MO Unk 02/19/20Pickering-1/OPG 516 n Ont. MO Unk 01/10/20Seabrook/Nextera 1302 n NH MO Unk 04/01/20TBayBow/RFP 116 bio Ont. MO Unk 04/15/20
west
El Segundo/SCE 263 g Calif. PMO Unk 04/15/20Gateway/PG&E 585 g Calif. PMO Unk 03/31/20Helms Pump-2/PG&E 407 h Calif. MO Unk 04/06/20High Desert/SCE 830 g Calif. PMO Unk 03/31/20Inland Empire-1/SCE 376 g Calif. PMO Unk 01/24/20Lodi/NCPA 303 g Calif. MO Unk 01/24/20Ormond Beach-2/SCE 750 g Calif. PMO Unk 03/24/20Otay Mesa/SDGE 604 g Calif. PMO Unk 04/15/20Palo Verde-2/APS 1314 n Ariz. PMO Unk 04/06/20
southeast & Central
Arkansas 2/ Entergy 930 n Ark. MO Unk 03/23/20Fermi 2/ DTE 1100 n Mich. MO Unk 03/23/20Grand Gulf/Entergy 1443 n Miss. MO Unk 03/06/20Hatch 2/ SNOC 883 n GA MO Unk 04/15/20McGuire 2/ Duke 1156 n N.C. MO Unk 03/23/20Oconee 3/Duke 934 n SC MO Unk 04/13/20Saint Lucie-2 1078 n Fl. MO Unk 02/18/20Sequoyah 2/TVA 1155 n Ten. MO Unk 04/13/20South Texas 1/ STP 1280 n TX. MO Unk 03/16/20Summer/SCE&G 1008 N SC. MO Unk 04/13/20Turkey Pt.3/FP&L 823 n Fl. MO Unk 03/30/20
PJM & MisO
Beaver 2/Entergy 879 n PA. MO Unk 04/13/20Gina/Constellation 568 n NY MO Unk 04/06/20N. Anna 2/Dominion 903 n Va. MO Unk 04/14/20Salem 2/PSEG 1156 n NJ MO Unk 04/13/20Susquehanna1/Talen 1330 n PA MO Unk 03/30/20
Daily generation outage references: MO=unplanned maintenance outage; RF=refueling outage; PMO=planned maintenance outage; Unk=unknown; OA=offline/available. Fuels: Nuclear=n; Coal=c; Natural gas=g; Hydro=h ; Wind=w; Solar=s
Sources: Generation owners, public information and other market sources.
NORtH aMeRiCaN daily GeNeRatiON OutaGes By ReGiON, aPR 16
isO Region Mw OFF
AESO 0CAISO 4,662ERCOT 5,561ISONE 1,760MISO 9,598NYISO 1,521Ontario IESO 3,490PJM 9,642SPP 2,775
NeRC Region Mw OFF
ERCOT 5,561FRCC 3,180MRO 1,820NPCC 6,771RFC ECAR 5,930RFC MAAC 4,866RFC MAIN 1,836SERC 17,183SPP 2,731WECC 10,039US TOTAL 59,916
Source: IIR Energy
For more information please contact IIR Energy at [email protected] or at their website, www.iirenergy.com
US MEGAWATTS OFFLINE BY FUEL TYPE
Source: IIR EnergyFor more information please contact IIR Energy at [email protected] or at their website, www.iirenergy.com
(MW)
0 5000 10000 15000 20000 25000 30000
Fuel Oil
Renewable Energy
Coal
Nuclear
Natural Gas
company to deliver “clean energy at a lower customer cost.”The $400 million project will be completed in June when the final
link is put into service between Yoakum Substation southeast of Plains, Texas, and TUCO Substation north of Abernathy in Hale County, Texas.
The company said: “Lower fuel costs have resulted in lower total bills over the last three years, thanks to efficiencies built into the regional grid and pathways to import less expensive energy from the wider power market.”
A company spokesman noted on Thursday that the line will help Xcel move power from the Texas market into New Mexico.
Xcel has two natural gas-fired facilities located near Hobbs — the 466-MW Cunningham facility, and the 173 MW Maddox facility. It also has three long-term power purchase agreements with combined-cycle facilities in the region that have combined capacity of 604 MW.
In Texas, Xcel has two coal-fired facilities with 2,085 MW of capacity, three gas-fired facilities with 1,690 MW of capacity and a new 478 MW wind facility. Its total Texas capacity it said on Thursday is 4,253 MW.
It said that it has invested in over 1,300 miles of new transmission lines since 2011 in New Mexico, Texas and Oklahoma.
“Another 200 additional miles of transmission line is planned to be
constructed through 2021. Since 2011, over 75 new substations have been built or upgraded. Another 11 substations will be built or upgraded through 2021. The transmission expansion represents more than $3 billion in investment,” the company said.
Powering the southeast New Mexico area around Hobbs “will require 300 miles of new distribution and 100 miles of transmission line to be built this year,” the company said.
Currently, work is underway on a $65 million, 345-kV transmission line stretching 34 miles in lower Eddy County, New Mexico. The Eddy-Kiowa transmission line is expected to be complete in November 2020.
trains and trucksXcel also has 452 MW of wind energy resources located in New
Mexico, with its largest wind facility, the 522-MW Sagamore Wind Project under construction in Roosevelt County near the border with Texas.
Xcel said its crews have completed more than 150 of the 240 wind turbine foundations thus far, and that wind turbine components are

Friday, april 17, 2020Megawatt daily
9© 2020 S&P Global Platts, a division of S&P Global Inc. All rights reserved.
NEWS / PRICING COMMENTARY / MARkET FuNdAMENTAls
currently arriving by train to Hobbs,Base sections are arriving first, the company said, followed by
generators and blades. Xcel said it will require 1,920 shipments to deliver all the components over a six-month period, and trucks will have to travel 100 miles to deliver the equipment to the job site near Dora, New Mexico.
Sagamore will be Xcel’s first company-owned wind farm in New Mexico. The Hale Wind Project in Texas was its first company-owned facility in that state.
Xcel Energy Power Plants–Texas and New MexicoName Location Fuel Capacity MWTolk Tx Coal 1,067Harrington Tx Coal 1,018Jones Tx Nat gas 822Nichols Tx Nat Gas 457Plant X Tx Nat Gas 411Hale Tx Wind 478Cunningham NM Nat Gas 466Maddox NM Nat Gas 173Source: Xcel Energy
— Jeffrey Ryser
s&P: us, global economies to take longer, more severe hit than previously expected
■■ Global GdP for this year drops to 2.4% contraction■■ us unemployment rate forecast to peak at 19% in May
S&P Global Ratings further revised its GDP forecasts for the US and the global economy in 2020, saying the fallout from the coronavirus pandemic has become "longer and more intense" than previously estimated as countries extend restrictive measures imposed to contain the health crisis.
The rating agency flipped its global GDP estimate for this year to a 2.4% contraction from the 0.4% growth projected in March. The forecast for the U.S. was revised to a full-year GDP slump of 5.2% from a 1.3% contraction.
"We now see the toll on GDP will be far more severe than we once thought," S&P Global Ratings said in its forecast for the U.S., which also cited other drags to growth such as Boeing Co.'s suspension of its 737 MAX aircraft production and the recent oil price plunge.
S&P Global Ratings expects U.S. real annualized GDP to plunge 7.6% in the first quarter and 35% in the second quarter. The unemployment rate is forecast to peak in May at 19%, which would be the biggest jump in records going back to 1948.
"While the recovery will kick into gear during the second half of the year, it won't be enough to offset overall economic losses caused by COVID-19," S&P Global Ratings said.
The GDP forecasts for the eurozone and the U.K. were also sharply downgraded, showing contractions of 7.3% and 6.5%, respectively, after earlier projections of a 2.0% economic decline. The growth forecast for China was lowered to 1.2% from 2.9%.
The forecast revisions reflect the impact of extended lockdown measures or social distancing restrictions as well as the spillover of
the slowdown in economic activity to trade, financial and health sectors, according to S&P Global Ratings.
"The gradual lifting of restrictions implies a more gradual recovery," the rating agency said.
S&P Global Ratings expects the U.S. and global economies to bounce back in 2021 with full-year growth rates of 6.2% and 5.9%, respectively. The eurozone and U.K. economies would expand by 5.6% and 6.0%, respectively, while China's GDP growth is seen to accelerate to 7.4% in 2021.
S&P Global Ratings said the length and pace of economic recovery will depend on health and economic policies, the response of consumers and businesses, labor market conditions, and the state of small and medium enterprises.
Smaller businesses are expected to take a larger hit from the pandemic compared to larger companies, and services would suffer more than manufacturing, S&P Global Ratings said.
— Emmanuel Louis Bacani, S&P Global Market Intelligence
California PuC hears from citizens voicing concerns over PG&e reorganization plan
■■ PG&e filed for Chapter 11 bankruptcy January 29, 2019■■ Hearing scheduled for May 27 on PG&e’s reorganization plan■■ PG&e on schedule to meet June 30 statutory deadline
California Public Utility Commissioners heard from numerous people voicing concern over the Pacific Gas and Electric reorganization plan that would bring the company out of bankruptcy.
The start of Thursday’s PUC meeting included the better part of an hour of public comments, most of which were citizens and organizations speaking against PG&E’s plan of reorganization and urged the commission not to approve the plan, which was not on the day’s agenda.
“We in California want to wash our hands of PG&E,” one commenter said.
“I don’t want to pay for the failures of PG&E,” another commenter said.One commenter called the plan “unacceptable” and said it does
nothing to address the underlying problems at PG&E.The goal of the reorganization plan is “to fairly compensate wildfire
victims, other prepetition creditors and other stakeholders; prioritize the interests of our customers and communities; and meet PG&E’s legal obligations,” according to PG&E. The company added that the plan will allow it to emerge from Chapter 11 financially sound and meet California’s clean energy goals.
However, those addressing the commission disagreed.“This plan does nothing to advance the state’s climate goals,” one
commenter said.The state has a renewable portfolio standard of 44% by 2024, 52%
by 2027, and 60% by 2030, and a goal of 100% clean energy by 2045.
Plan details“Throughout this process, our focus has remained on getting
victims paid fairly and as soon as possible, continuing to deliver safe and reliable electric and gas service, and implementing needed

Friday, april 17, 2020Megawatt daily
10© 2020 S&P Global Platts, a division of S&P Global Inc. All rights reserved.
NEWS / PRICING COMMENTARY / MARkET FuNdAMENTAls
changes across our business to improve our operations for the long term,” according to PG&E.
PG&E has reached agreements with all major wildfire claimants including wildfire victims, cities, counties and other public entities, insurance companies and bondholders, according to PG&E.
“The settlement with individual wildfire victims has the support of the Tort Claimants Committee that represents and has fiduciary duties to fire victims, as well as the majority of law firms representing individuals holding approximately 70% in number of the prepetition fire claims filed against PG&E,” according to PG&E.
The Governor’s office filed a statement March 20 in the Bankruptcy Court in support of PG&E’s plan and its compliance with Assembly Bill 1054. The Governor’s Bankruptcy Court filing states that, assuming the Bankruptcy Court and CPUC approve PG&E’s commitments, PG&E’s Plan of Reorganization “will, in the Governor’s judgment, be compliant with AB 1054,” according to PG&E.
BackgroundBoth PG&E the utility and PG&E Corporation, the holding company,
filed for Chapter 11 bankruptcy January 29, 2019.PG&E stated in an application filed November 4, 2019 that it would
be required to issue significant amounts of debt, approximately $27.35 billion, as part of its exit financing for its bankruptcy. Numerous parties filed responses and protests to that filing.
PG&E and PG&E Corporation entered into a restricting support agreement January 22 with a group of investment funds that hold senior notes issued by PG&E. The RSA led PG&E to file on January 27 an amendment to its application that reduced the long-term debt to $5.825 billion.
suBsCRiBeR NOtes
Platts launches California carbon price assessmentsS&P Global Platts is launching carbon price assessments, reflecting the value of traded carbon instruments in California, beginning April 16, 2020.These weekly assessments of current-year Regional Greenhouse Gas Initiative (RGGI), California Carbon Allowance (CCA) and California Offset prices will be published on Thursdays, or the prior business day if Thursday is a public holiday. The price assessments aim to reflect the prevailing value, in $/ton, for carbon prices on the day of publication at 2:30 pm ET. The assessment will be published in Megawatt Daily and Energy Trader.Symbol DescriptionARECB04 Carbon California Carbon Allowance WeeklyARECC04 Carbon California Offset WeeklyARECA04 Carbon RGGI WeeklyAdditionally, Platts will also begin publishing the Renewable Energy Certificate (REC) assessment in Energy Trader, beginning April 16, 2020, and every successive Thursday, or the prior business day if Thursday is a public holiday.Please send any comments to the above to [email protected] and [email protected]. For written comments, please provide a clear indication if comments are not intended for publication by Platts for public viewing. Platts will consider all comments received and will make comments
not marked as confidential available upon request.
As a result of the RSA, PG&E expects to reinstate about $9.575 billion in existing debt and to issue roughly $11.95 billion in new long-term debt at agreed interest rates, which does not need to be hedged.
The Bankruptcy Court is scheduled to hold a hearing May 27 on the confirmation of PG&E’s reorganization plan, following a vote on PG&E’s plan by relevant parties that will take place in the coming weeks, PG&E said. PG&E remains on track to have its Plan of Reorganization confirmed by the statutory deadline of June 30, 2020.
— Kassia Micek

Friday, april 17, 2020Megawatt daily
11© 2020 S&P Global Platts, a division of S&P Global Inc. All rights reserved.
NEWS / PRICING COMMENTARY / MARkET FuNdAMENTAls
ReC MaRkets
Massachusetts, Connecticut v19 ReCs continue on downward slump
■■ Massachusetts sReC v19 up $1.75 on week■■ Ohio sReC v19 rolls off the board
Massachusetts V19 RECs and Connecticut V19 RECs continued their downward momentum, falling about $3 to price in the low $20s/REC.
The Connecticut V19 REC traded in a wide range on ICE, from the low $20s/REC to the low $30s/REC, totaling at over 500 contracts.
Elsewhere in the Northeast, Maryland V20 and Pennsylvania V20 each gained 25 cents on the week to price at $7.75/REC. New Jersey continued last week’s upward momentum, gaining another 25 cents to $8/REC.
The Ohio V19 rolled off the board as S&P Global Platts assessed the V20 for the first time at $6.75/REC.
In Solar Renewable Energy Certificates, Massachusetts V20 gained the most on the week, rising $1.75 to be assessed at $388.25/SREC. Both Pennsylvania and New Jersey V20 remained flat on the week at $24/SREC and $225.50/SREC, respectively.
The Ohio SREC V19 rolled off the board on April 15, leading Platts to assess the V20, which priced lower than the V19 contract at $5.25/SREC.
Any Technology RECs, Wind and Texas Voluntary V20 RECs remained flat from previous week.
— Isabel Milton
RGGi CaRBON allOwaNCe FutuRes, aPR 15 ($/allowance)ICE Settlement Volume
Dec20 V20 5.75 0Dec21 V20 5.93 0Dec22 V20 6.11 0Dec20 V21 5.75 0Dec21 V21 5.93 0Dec22 V21 6.11 0Dec20 V22 5.75 0Dec21 V22 5.93 0Dec22 V22 6.11 0Dec20 V23 5.75 0Dec21 V23 5.93 0Dec22 V23 6.11 0
The Regional Greenhouse Gas Initiative is a carbon cap-and-trade program for power generators in nine Northeast and Mid-Atlantic US states. One RGGI allowance is equivalent to one short ton of CO2. The volume listed is the number of futures contracts traded. Each futures contract represents 1,000 RGGI allowances.
eMissiONs MaRkets aPR 16 ($/ton) low High Close
RGGI 5.75 5.75 5.75California Carbon Allowance 15.50 15.50 15.50California Offset 13.25 13.25 13.25
ReNewaBle eNeRGy CeRtiFiCate MaRkets aPR 16 ($/Mwh) low High Mid
Class i/tier i ReCs*
Connecticut 22.50 22.50 22.500Maryland 7.75 7.75 7.750Massachusetts 22.25 22.25 22.250New Jersey 8.00 8.00 8.000Ohio 6.75 6.75 6.750Pennsylvania 7.75 7.75 7.750Texas 0.75 0.75 0.750
solar ReCs*
Maryland 71.75 71.75 71.750Massachusetts 388.25 388.25 388.250New Jersey 225.50 225.50 225.500Ohio 5.25 5.25 5.250Pennsylvania 24.00 24.00 24.000
California RPs*
California Bundled REC (Bucket 1) 15.50 15.50 15.500California Bundled REC (Bucket 2) 11.00 11.00 11.000California Tradable REC (Bucket 3) 2.50 2.50 2.500
voluntary ReCs*
National voluntary, any technology 0.84 0.84 0.840National voluntary, wind 0.85 0.85 0.850
*Prices are for the value of the environment attribute of the renewable energy certificate only and do not include energy. Bundled transactions are normalized by subtracting the market price of electricity.
eMissiONs MaRkets
Carbon markets trend higher, extending previous week’s momentum
■■ RGGi v20 gains 12 cents to $5.75/mt■■ CCa v20 rises by 75 cents
Intercontinental Exchange trading activity for the California Carbon Allowance contracts was in a tighter range on the week between $14.35/mt to $16.90/mt for the trading week ended April 15.
CCA Vintage 20 for December 2020 delivery was assessed at $15.50/mt, up 75 cents from the previous week.
The CCA V20 December strip had over 230 trades on ICE for a total of more than 6,000 contracts.
Regional Greenhouse Gas Initiative prices increased by 12 cents to be assessed at $5.75 while the California offset increased 65 cents to be assessed at $13.25, on par with the most recent ICE settlement.
— Isabel Milton

Friday, april 17, 2020Megawatt daily
12© 2020 S&P Global Platts, a division of S&P Global Inc. All rights reserved.
NEWS / PRICING COMMENTARY / MARkET FuNdAMENTAlsNEWs / PRICING COMMENTARY / MARkET FuNdAMENTAls
Hydrogen
assessMeNt RatiONaleThe daily and month ahead hydrogen assessments are valuations that incorporate fixed capital and operating costs and variable natural gas, electricity, and carbon prices. Details on hydrogen methodology can be found at https://www.spglobal.com/platts/en/our-methodology/methodology-specifications/electric-power/hydrogen-methodology
NORtH aMeRiCa HydROGeN assessMeNts, aPRil 15* excluding Capex including CapexProduction Pathway $/kg Change $/kg Change
alberta (C$/kg)
SMR w/o CCS 0.33 -0.01 1.27 -0.01Alkaline Electrolysis 1.72 +0.19 2.43 +0.19PEM Electrolysis 1.93 +0.21 2.84 +0.21
appalachia
SMR w/o CCS 0.25 -0.01 1.24 -0.01Alkaline Electrolysis 0.98 -0.06 1.64 -0.06PEM Electrolysis 1.10 -0.06 1.94 -0.06
Gulf Coast
SMR w/o CCS 0.27 -0.01 1.11 -0.01Alkaline Electrolysis 0.95 -0.09 1.57 -0.09PEM Electrolysis 1.06 -0.10 1.85 -0.10
Midcontinent
SMR w/o CCS 0.21 -0.02 1.10 -0.02Alkaline Electrolysis 0.65 -0.42 1.29 -0.42PEM Electrolysis 0.73 -0.47 1.54 -0.47
Northeast
SMR w/o CCS 0.29 -0.01 1.35 -0.01Alkaline Electrolysis 0.91 +0.17 1.58 +0.17PEM Electrolysis 1.02 +0.19 1.88 +0.19
Northern California
SMR w/o CCS 0.54 0.00 1.76 0.00Alkaline Electrolysis 1.10 -0.08 1.83 -0.08PEM Electrolysis 1.23 -0.10 2.18 -0.10
Northwest
SMR w/o CCS 0.25 0.00 1.29 -0.03Alkaline Electrolysis 0.83 -0.04 1.50 -0.04PEM Electrolysis 0.94 -0.04 1.79 -0.04
Rockies
SMR w/o CCS 0.23 0.00 1.16 0.00Alkaline Electrolysis 0.88 -0.03 1.53 -0.03PEM Electrolysis 0.99 -0.03 1.82 -0.03
southeast
SMR w/o CCS 0.27 -0.01 1.14 -0.01Alkaline Electrolysis 0.88 -0.02 1.52 -0.02PEM Electrolysis 0.99 -0.01 1.80 -0.01
southern California
SMR w/o CCS 0.40 -0.01 1.57 -0.01Alkaline Electrolysis 0.81 -0.15 1.53 -0.15PEM Electrolysis 0.91 -0.16 1.83 -0.16
upper Midwest
SMR w/o CCS 0.28 -0.01 1.23 -0.01Alkaline Electrolysis 1.17 +0.06 1.84 +0.06PEM Electrolysis 1.32 +0.07 2.18 +0.07
*Assessed previous day
NetHeRlaNds HydROGeN assessMeNts, aPRil 15Production Pathway eur/kg Change eur/Mwh ChangeSMR w/o CCS 0.3698 -0.0084 12.3254 -0.2800SMR w/o CCS (inc. Capex) 0.8533 -0.0066 28.4405 -0.2200SMR w/o CCS (inc. Carbon) 0.5651 -0.0143 18.8348 -0.4766SMR w/o CCS (inc. Capex & Carbon) 1.0486 -0.0124 34.9498 -0.4133SMR w CCS 0.4052 -0.0091 13.5053 -0.3033SMR w CCS (inc. Capex) 1.1930 -0.0061 39.7627 -0.2033SMR w CCS (inc. Carbon) 0.4268 -0.0098 14.2252 -0.3267SMR w CCS (inc. Capex & Carbon) 1.2146 -0.0068 40.4826 -0.2267Alkaline Electrolysis 1.1482 -0.0600 34.4494 -1.8002Alkaline Electrolysis (inc. Capex) 1.9173 -0.0571 57.5248 -1.7131PEM Electrolysis 1.2833 -0.0672 38.5029 -2.0162PEM Electrolysis (inc. Capex) 2.2694 -0.0634 68.0888 -1.9022
JaPaN HydROGeN assessMeNts, aPRil 15* excluding Capex including CapexProduction Pathway yen/kg Change yen/kg ChangeSMR w/o CCS 56.07 -1.08 222.93 -1.08Alkaline Electrolysis 272.84 +8.20 395.16 +8.20PEM Electrolysis 305.77 +9.19 462.59 +9.19
*Assessed previous day
1.0
1.5
2.0
2.5
3.0
15-Apr07-Apr01-Apr26-Mar20-Mar16-Mar10-Mar04-Mar
SMR w/o CCS (inc. carbon) month ahead
SMR w CCS (inc. carbon) month ahead
PEMElectrolysis
AlkalineElectrolysis
NETHERLANDS HYDROGEN �INCLUDING CAPEX�
Source: S&P Global Platts
(Eur/kg)
CALIFORNIA ELECTROLYSIS �INCLUDING CAPEX�
Source: S&P Global Platts
($/kg)
N. Calif.Alkaline
N. Calif.PEM
S. Calif.Alkaline
S. Calif.PEM
1.0
1.5
2.0
2.5
3.0
15-Apr08-Apr02-Apr27-Mar23-Mar17-Mar11-Mar05-Mar
NATURAL GAS�LNG
Source: S&P Global Platts
($/MMBtu)
1.0
1.5
2.0
2.5
3.0
3.5
4.0
15-Apr08-Apr02-Apr27-Mar23-Mar17-Mar11-Mar05-Mar
Henry HubTTFJKM

Friday, april 17, 2020Megawatt daily
13© 2020 S&P Global Platts, a division of S&P Global Inc. All rights reserved.
NEWS / PRICING COMMENTARY / MARkET FuNdAMENTAlsNEWs / PRICING COMMENTARY / MARkET FuNdAMENTAls
NORtHeast day aHead POweR PRiCes ($/Mwh)
Marginal spark spread Price change Prior 7-day Month Month yearly changeHub/index symbol 17-apr heat rate @7k @12k Chg % Chg average Min Max apr-20 apr-19 Chg % Chg
On-Peak
ISONE Internal Hub IINIM00 16.66 10350 5.39 -2.66 -0.90 -5.1 17.55 14.67 25.53 19.25 28.78 -9.53 -33.1ISONE NE Mass-Boston IINNM00 17.13 10640 5.86 -2.19 -0.77 -4.3 17.86 14.94 26.10 19.60 28.84 -9.24 -32.0ISONE Connecticut IINCM00 15.82 10371 5.14 -2.48 -1.09 -6.4 16.99 14.20 24.49 18.49 28.70 -10.21 -35.6NYISO Zone G INYHM00 15.51 10173 4.84 -2.79 -0.66 -4.1 15.72 13.18 17.49 15.67 28.25 -12.58 -44.5NYISO Zone J INYNM00 15.81 11214 5.94 -1.11 -0.68 -4.1 15.96 13.34 17.81 15.93 31.87 -15.94 -50.0NYISO Zone A INYWM00 15.19 10623 5.18 -1.97 3.22 26.9 10.34 6.74 15.71 12.14 26.26 -14.12 -53.8NYISO Zone F INYCM00 15.59 11054 5.72 -1.33 -1.69 -9.8 17.30 13.76 21.19 16.42 28.00 -11.58 -41.4
Off-Peak
ISONE Internal Hub IINIP00 14.77 9172 3.50 -4.55 -2.30 -13.5 14.79 11.56 17.75 15.35 23.35 -8.00 -34.3ISONE NE Mass-Boston IINNP00 15.02 9327 3.75 -4.30 -2.29 -13.2 14.97 11.67 17.97 15.56 23.41 -7.85 -33.5ISONE Connecticut IINCP00 14.25 9344 3.57 -4.05 -2.18 -13.3 14.36 11.30 17.21 14.84 23.15 -8.31 -35.9NYISO Zone G INYHP00 14.25 9341 3.57 -4.06 -0.45 -3.1 13.24 11.53 14.70 12.92 21.33 -8.41 -39.4NYISO NYC Zone INYNP00 14.52 10294 4.65 -2.41 -0.46 -3.1 13.44 11.69 14.98 13.11 22.72 -9.61 -42.3NYISO West Zone INYWP00 9.72 6800 -0.29 -7.43 -0.40 -4.0 7.60 5.77 12.99 9.23 17.68 -8.45 -47.8NYISO Capital Zone INYCP00 15.49 10987 5.62 -1.43 -0.47 -2.9 15.22 11.40 15.96 13.97 22.08 -8.11 -36.7
NORTHEAST AVG. DAY-AHEAD/REAL-TIME PEAK PRICE SPREAD
Source: S&P Global Platts
($/MWh)
-20
-10
0
10
15-Apr13-Apr11-Apr09-Apr07-Apr05-Apr03-Apr
NYISO Zone J NYISO Zone G NYISO Zone A NEPOOL Mass Hub
NORTHEAST PLATTS M2MS FORWARD CURVE: ON-PEAK
Source: S&P Global Platts
($/MWh)
10
20
30
40
50
60
70
May-22Feb-22Nov-21Aug-21May-21Feb-21Nov-20Aug-20May-20
East NY ZnJEast NY ZnGWest NY ZnA Mass Hub
NORTHEAST PLATTS M2MS LOCATIONAL SPREADS: ON-PEAK
Source: S&P Global Platts
($/MWh)
-20
-10
0
10
20
30
May-22Feb-22Nov-21Aug-21May-21Feb-21Nov-20Aug-20May-20
NYISO ZnJ/NYISO ZnG
NYISO ZnG/PJM WestNYISO ZnG/NEPOOL Mass HubNEPOOL Mass Hub/PJM WestNYISO G/NYISO A
Mass Hub falls $2.50 as demand expectations weaken
■■ Power forwards trend down■■ isO-Ne expects peakload demand to dip
In the New York Independent System Operator footprint, day-ahead on-peak prices were mixed for April 17 delivery. Zone J and Zone G each fell less than 75 cents to price near $15.50/MWh.
Bucking the trend, Zone A West Hub on-peak rose abut $3.25 to near $15.25/MWh.
Off-peak packages in NYISO sank, with Zone J and Zone G each shedding 45 cents to near $14.25/MWh.
In ISO New England, the Mass Hub on-peak package shed $2.50 to price at $17.50 for April 17 delivery. The off-peak package was valued in a bid-offer range of $14.75/MWh to $17.75/MWh. ISO New England forecast peakload demand to dip 1.4%, while in NYISO, peakload was set to fall about 3% on the day.
Northeast high temperatures were forecast to continue below average through the end of the week, according to CustomWeather. High temperatures in Boston were expected to sit 6 degrees below average at 51 F. In New York City, temperatures were forecast to continue 13 degrees below average in the low 50s F. Low temperatures were forecast to reach the mid-20s F by the weekend.
Power forwards trended down, despite the NYMEX natural gas front-month contract rising 8.8 cents to settle at $1.686 /MMBtu on the Intercontinental Exchange. The NYISO Zone G on-peak front-month package shed 30 cents to near $16.75/MWh. The Mass Hub June on-peak package shed 25 cents to price near $15.50/MWh.
— Isabel Milton
Northeast PoWer MarKets

Friday, april 17, 2020Megawatt daily
14© 2020 S&P Global Platts, a division of S&P Global Inc. All rights reserved.
NEWS / PRICING COMMENTARY / MARkET FuNdAMENTAlsNEWs / PRICING COMMENTARY / MARkET FuNdAMENTAls
pJM/Miso day ahead poweR pRices ($/Mwh)
Marginal spark spread Price change Prior 7-day Month Month yearly ChangeHub/index symbol 17-apr heat rate @7k @12k Chg % Chg average Min Max apr-20 apr-19 Chg % Chg
On-Peak
PJM AEP Dayton Hub IPADM00 18.34 12306 7.91 0.46 -1.52 -7.7 19.10 14.54 20.98 18.24 29.06 -10.82 -37.2PJM Dominion Hub IPDMM00 17.39 11552 6.85 -0.67 -1.65 -8.7 18.80 13.29 20.34 17.65 29.03 -11.38 -39.2PJM Eastern Hub IPEHM00 16.22 11507 6.35 -0.69 -2.21 -12.0 17.10 13.95 18.43 16.14 26.12 -9.98 -38.2PJM Northern Illinois Hub IPNIM00 17.73 11586 7.02 -0.63 -1.53 -7.9 17.76 12.04 20.10 16.80 27.10 -10.30 -38.0PJM Western Hub IPWHM00 18.29 12975 8.42 1.37 -1.14 -5.9 19.12 14.39 21.63 18.28 27.96 -9.68 -34.6MISO Indiana Hub IMIDM00 20.85 13627 10.14 2.49 -0.76 -3.5 23.11 17.67 24.66 21.49 29.44 -7.95 -27.0MISO Minnesota Hub IMINM00 17.99 12158 7.63 0.23 -2.15 -10.7 18.17 11.38 23.10 16.28 25.86 -9.58 -37.0
Off-Peak
PJM AEP Dayton Hub IPADP00 16.47 11053 6.04 -1.41 -1.70 -9.4 16.16 10.88 18.17 14.61 22.09 -7.48 -33.9PJM Dominion Hub IPDMP00 17.52 11643 6.99 -0.54 -0.98 -5.3 16.15 10.64 18.50 14.62 21.78 -7.16 -32.9PJM Eastern Hub IPEHP00 15.18 10768 5.31 -1.74 0.27 1.8 14.73 10.85 17.19 13.62 20.88 -7.26 -34.8PJM Northern Illinois Hub IPNIP00 16.01 10463 5.30 -2.35 -1.58 -9.0 15.09 10.42 17.59 13.66 19.98 -6.32 -31.6PJM Western Hub IPWHP00 16.57 11755 6.70 -0.35 -1.00 -5.7 16.11 10.86 17.57 14.60 21.35 -6.75 -31.6MISO Indiana Hub IMIDP00 16.63 10867 5.92 -1.73 -2.41 -12.7 18.65 13.32 20.92 16.60 22.71 -6.11 -26.9MISO Minnesota Hub IMINP00 14.95 10102 4.59 -2.81 -2.86 -16.1 14.78 6.90 19.48 12.18 20.28 -8.10 -39.9
PJM/MISO AVG. DAY-AHEAD/REAL-TIME PEAK PRICE SPREAD
Source: S&P Global Platts
($/MWh)
-40
-30
-20
-10
0
10
15-Apr13-Apr11-Apr09-Apr07-Apr05-Apr03-Apr
MISO INMISO MNPJM AD HubPJM NI Hub PJM West Hub
PJM/MISO PLATTS M2MS FORWARD CURVE: ON-PEAK
Source: S&P Global Platts
($/MWh)
10
20
30
40
50
May-22Feb-22Nov-21Aug-21May-21Feb-21Nov-20Aug-20May-20
PJM AEP/Dayton PJM NI Hub MISO Ind. Hub PJM West
PJM/MISO PLATTS M2MS LOCATIONAL SPREADS: ON-PEAK
Source: S&P Global Platts
($/MWh)
-10
0
10
20
May-22Feb-22Nov-21Aug-21May-21Feb-21Nov-20Aug-20May-20
PJM West/MISO Ind. PJM West/PJM ADPJM West/PJM NI PJM West/NYISO ZnA
PJM, MisO power prices move down on lower natural gas
■■ Natural gas prices projected to drop■■ demand trends down as well
PJM electric power prices moved down on Thursday as lower natural gas prices and demand pushed the spot market lower.
PJM West Hub day-ahead on-peak for Friday delivery notched down, falling about 55 cents from Wednesday’s Intercontinental Exchange settlement price of $19.45/MWh to trade around $18.90/MWh.
Natural gas prices for next day delivery fell on the day, which could be putting downwards pressure on the spot market. Texas Eastern M-3 fell 10 cents from Wednesday's S&P Global Platts’ settled price of $1.510/MMBtu to trade around $1.409/MMBtu. Michcon also fell on the day, dropping 5 cents from Wednesday’s Platts settled price of $1.535/MMBtu to trade around $1.490/MMBtu. Though Midwest gas trended downwards, this was not the case across the nation. NYMEX natural gas prompt month contract gained on the day, rising 8.8 cents to settle at $1.686/MMBtu.
Demand is forecast to fall slightly, which also helps to explain the slight movements seen in spot prices. According to regional transmission organization data, PJM demand is forecast to drop from 85,400 MW on Thursday to 85,100 MW on Friday. Most of these declines were seen in PJM MidAtlantic region, which fell about 2.15% from 29,700 MW to 29,100 MW over the same time frame.
MISO demand moved in the same direction, though not as drastically. According to regional transmission organization data, MISO demand is forecast to tick down from 69.90 GW on Thursday to 69.80 GW on Friday.
Turning to the MISO electricity market, prices were trending in the same direction as PJM. Indiana Hub day-ahead on-peak was down about 40 cents from Wednesday’s ICE settled price of $21.65/MWh to trade around $21.25/MWh.
— Humza Jamal
PJM/MISO POWER MARKETS
Friday, april 17, 2020Megawatt daily
15© 2020 S&P Global Platts, a division of S&P Global Inc. All rights reserved.
NEWS / PRICING COMMENTARY / MARkET FuNdAMENTAls
SOUTHEAST POWER MARKETS
NEWs / PRICING COMMENTARY / MARkET FuNdAMENTAls
southeast & centRal day-ahead poweR pRices ($/Mwh)
Marginal spark spread Price change Prior 7-day Month Month yearly changeHub/index symbol 17-apr heat rate @7k @12k Chg % Chg average Min Max apr-20 apr-19 Chg % Chg
On-PeakMISO Texas Hub IMTXM00 19.87 13561 9.61 2.29 -0.43 -2.1 19.83 17.00 30.84 20.52 33.83 -13.31 -39.3MISO Louisiana IMLAM00 18.72 12482 8.22 0.72 0.46 2.5 19.72 17.15 27.73 19.99 33.84 -13.85 -40.9SPP North Hub ISNOM00 19.04 12866 8.68 1.28 3.33 21.2 16.80 7.99 26.40 16.19 25.55 -9.36 -36.6SPP South Hub ISSOM00 17.81 14602 9.27 3.17 10.64 148.4 14.19 4.90 26.12 15.47 23.48 -8.01 -34.1ERCOT Houston Hub IERHM00 21.00 14237 10.67 3.30 6.84 48.3 18.49 14.16 95.98 24.81 27.95 -3.14 -11.2ERCOT North Hub IERNM00 20.50 13994 10.25 2.92 7.08 52.8 18.12 13.42 94.09 24.11 26.68 -2.57 -9.6ERCOT South Hub IERSM00 20.13 13932 10.02 2.79 5.71 39.6 18.12 14.42 94.78 24.36 26.19 -1.83 -7.0ERCOT West Hub IERWM00 19.87 50955 17.14 15.19 18.63 1502.4 14.57 1.24 94.40 21.75 23.19 -1.44 -6.2
Off-PeakMISO Texas Hub IMTXP00 14.98 10223 4.72 -2.60 -0.67 -4.3 14.72 12.83 17.32 14.79 22.90 -8.11 -35.4MISO Louisiana IMLAP00 14.61 9738 4.11 -3.39 -0.35 -2.3 15.14 13.61 16.59 14.87 22.48 -7.61 -33.9SPP North Hub ISNOP00 10.29 6952 -0.07 -7.47 -0.07 -0.7 9.77 -2.99 19.86 7.88 13.93 -6.05 -43.4SPP South Hub ISSOP00 2.55 2089 -5.99 -12.10 5.04 202.4 2.96 -10.75 18.07 3.63 9.12 -5.49 -60.2ERCOT Houston Hub IERHP00 10.51 7128 0.19 -7.18 1.42 15.6 11.66 8.07 16.61 11.76 15.68 -3.92 -25.0ERCOT North Hub IERNP00 8.83 6026 -1.43 -8.75 0.94 11.9 11.49 7.13 16.44 11.35 15.59 -4.24 -27.2ERCOT South Hub IERSP00 12.60 8721 2.49 -4.74 2.36 23.0 11.49 7.98 16.51 11.79 14.97 -3.18 -21.2ERCOT West Hub IERWP00 2.40 6154 -0.33 -2.28 3.11 438.0 8.15 -0.71 17.24 8.44 12.24 -3.80 -31.0
ERCOT AVG. DAY-AHEAD/REAL-TIME PEAK PRICE SPREAD
Source: S&P Global Platts
($/MWh)
-50
-25
0
25
50
15-Apr13-Apr11-Apr09-Apr07-Apr05-Apr03-Apr
Houston HubSouth HubWest Hub North Hub
ERCOT PLATTS M2MS FORWARD CURVE: ON-PEAK
Source: S&P Global Platts
($/MWh)
0
50
100
150
May-22Feb-22Nov-21Aug-21May-21Feb-21Nov-20Aug-20May-20
ERCOT–Houston ERCOT–West ERCOT–South ERCOT–North
ERCOT PLATTS M2MS LOCATIONAL SPREADS: ON-PEAK
Source: S&P Global Platts
($/MWh)
-10
-5
0
5
May-22Feb-22Nov-21Aug-21May-21Feb-21Nov-20Aug-20May-20
North Hub/West HubNorth Hub/South Hub
Houston Hub/South HubHouston Hub/North Hub
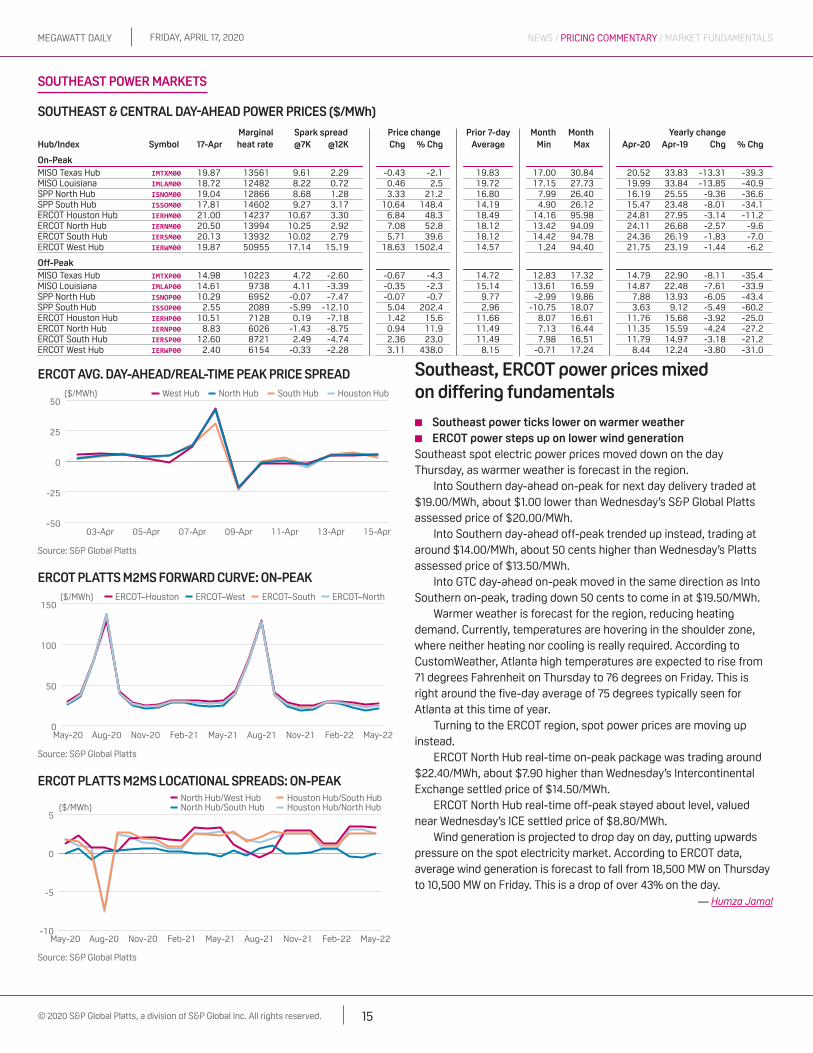
southeast, eRCOt power prices mixed on differing fundamentals
■■ southeast power ticks lower on warmer weather■■ eRCOt power steps up on lower wind generation
Southeast spot electric power prices moved down on the day Thursday, as warmer weather is forecast in the region.
Into Southern day-ahead on-peak for next day delivery traded at $19.00/MWh, about $1.00 lower than Wednesday’s S&P Global Platts assessed price of $20.00/MWh.
Into Southern day-ahead off-peak trended up instead, trading at around $14.00/MWh, about 50 cents higher than Wednesday’s Platts assessed price of $13.50/MWh.
Into GTC day-ahead on-peak moved in the same direction as Into Southern on-peak, trading down 50 cents to come in at $19.50/MWh.
Warmer weather is forecast for the region, reducing heating demand. Currently, temperatures are hovering in the shoulder zone, where neither heating nor cooling is really required. According to CustomWeather, Atlanta high temperatures are expected to rise from 71 degrees Fahrenheit on Thursday to 76 degrees on Friday. This is right around the five-day average of 75 degrees typically seen for Atlanta at this time of year.
Turning to the ERCOT region, spot power prices are moving up instead.
ERCOT North Hub real-time on-peak package was trading around $22.40/MWh, about $7.90 higher than Wednesday’s Intercontinental Exchange settled price of $14.50/MWh.
ERCOT North Hub real-time off-peak stayed about level, valued near Wednesday’s ICE settled price of $8.80/MWh.
Wind generation is projected to drop day on day, putting upwards pressure on the spot electricity market. According to ERCOT data, average wind generation is forecast to fall from 18,500 MW on Thursday to 10,500 MW on Friday. This is a drop of over 43% on the day.
— Humza Jamal

Friday, april 17, 2020Megawatt daily
16© 2020 S&P Global Platts, a division of S&P Global Inc. All rights reserved.
NEWS / PRICING COMMENTARY / MARkET FuNdAMENTAls
WEST POWER MARKETS
NEWs / PRICING COMMENTARY / MARkET FuNdAMENTAls
westeRn day-ahead poweR pRices ($/Mwh)
Marginal spark spread Price change Prior 7-day Month Month yearly changeHub/index symbol 17-apr heat rate @7k @12k Chg % Chg average Min Max apr-20 apr-19 Chg % Chg
On-Peak
NP15 ICNGM00 22.97 10416 7.53 -3.49 0.66 3.0 21.11 15.39 29.08 22.97 21.86 1.11 5.1SP15 ICSGM00 21.41 16535 12.35 5.87 7.31 51.8 14.79 10.05 27.82 17.27 23.15 -5.88 -25.4ZP26 ICZGM00 21.90 16912 12.84 6.36 8.70 65.9 14.35 8.77 28.26 16.87 22.81 -5.94 -26.0
Off-Peak
NP15 ICNGP00 21.41 9709 5.97 -5.05 -0.51 -2.3 25.01 21.27 28.59 24.22 23.04 1.18 5.1SP15 ICSGP00 21.54 16632 12.47 6.00 -1.09 -4.8 25.08 20.72 28.27 24.07 24.26 -0.19 -0.8ZP26 ICZGP00 21.44 16554 12.37 5.90 -0.91 -4.1 24.90 20.63 28.17 23.93 24.14 -0.21 -0.9
CAISO AVG. DAY-AHEAD/REAL-TIME PEAK PRICE SPREAD
Source: S&P Global Platts
($/MWh)
-10
0
10
20
15-Apr13-Apr11-Apr09-Apr07-Apr05-Apr03-Apr
NP15SP15 ZP26
WESTERN PLATTS M2MS FORWARD CURVE: ON-PEAK
Source: S&P Global Platts
($/MWh)
0
20
40
60
80
May-22Feb-22Nov-21Aug-21May-21Feb-21Nov-20Aug-20May-20
SP15 NP15 Mid-C Palo Verde
WESTERN PLATTS M2MS LOCATIONAL SPREADS: ON-PEAK
Source: S&P Global Platts
($/MWh)
-20
-10
0
10
20
May-22Feb-22Nov-21Aug-21May-21Feb-21Nov-20Aug-20May-20
SP15/Palo Verde SP15/NP15 SP15/Mid-C
west power dailies varied as demand tumbles■■ Cal-isO peakload demand forecast to slide 3.4% Friday■■ Power forwards trend up thursday
Western power dailies were mixed in Thursday trading on the Intercontinental Exchange with demand expected to slide ahead of the weekend.
In the Northwest, the Mid-Columbia on-peak package for Friday-Saturday delivery traded down about $1 to price at $17/MWh. The off-peak package was priced virtually unchanged around $18/MWh, trading above on-peak. Nevada-Oregon Border rose $1 to $18/MWh.
Above-average temperatures were expected across the Northwest Friday and Saturday, according to CustomWeather. Temperatures in Portland were forecast 10 degrees above average at 71 degrees Fahrenheit Friday and 2 degrees above average at 63 F Saturday.
In California, Zone SP15 on-peak day-ahead package rose $1 to price at $14.75/MWh. The California Independent System Operator forecast peakload demand to slide 3.4% Friday to 23,965 MW. Saturday demand expectations sat lower at 22,634 MW.
So far in April, Cal-ISO average peakload demand sank 8.6% month on month to average 24,296 MW.
Across the Southwest, prices trended up. The Palo Verde on-peak package ticked up 25 cents to $14.25/MWh. The corresponding off-peak package was valued just 5 cents higher around $19/MWh. Westwing on-peak gained $1.50 to trade at $17/MWh.
The Mead 230 on-peak and Four Corners off-peak packages saw biggest increases, rising $7 and $6.50 to price around $21/MWh and $23.75/MWh, respectively.
Temperatures in Phoenix were forecast on par with seasonal norms Friday and 3 degrees below average at 83 F Saturday.
In power forwards, packages largely trended up on ICE, with both Mid-C May and June on-peak futures contracts gaining 50 cents on the day to price at $12.33/MWh and $14.75/MWh, respectively. One exception was SP15 May day-ahead contract, which traded flat on the day at $15.75/MWh. Further along the curve, Mid-C July off-peak rose 40 cents to price at $19/MWh.
— Daryna Kotenko

Friday, april 17, 2020Megawatt daily
17© 2020 S&P Global Platts, a division of S&P Global Inc. All rights reserved.
NEWS / PRICING COMMENTARY / MARkET FuNdAMENTAls
Bilaterals
NEWs / PRICING COMMENTARY / MARkET FuNdAMENTAls
symbol On-peak symbol Off-peak
southeast & centRal day-ahead bilateRal indexes ($/Mwh)
Marginal spark spread Price change Prior 7-day Month Month yearly changeHub/index symbol 17-apr heat rate @7k @12k Chg % Chg average Min Max apr-20 apr-19 Chg % Chg
On-Peak
Florida AAMAV20 22.75 15167 12.25 4.75 -0.75 -3.2 22.86 21.00 23.75 22.44 29.33 -6.89 -23.5GTC, Into WAMCJ20 19.67 13201 9.24 1.79 -0.33 -1.6 19.81 18.50 21.00 19.57 29.43 -9.86 -33.5Southern, Into AAMBJ20 18.83 12638 8.40 0.95 -1.17 -5.9 18.93 16.50 20.06 18.34 28.80 -10.46 -36.3TVA, Into WEBAB20 19.50 13356 9.28 1.98 -1.25 -6.0 19.93 17.25 21.25 19.21 29.33 -10.12 -34.5VACAR AAMCI20 18.75 12458 8.21 0.69 -1.50 -7.4 19.18 16.50 20.50 18.60 29.15 -10.55 -36.2
Off-Peak
Florida AAMAO20 14.25 9500 3.75 -3.75 1.50 11.8 11.50 9.50 14.25 11.13 17.74 -6.61 -37.3GTC, Into WAMCC20 16.17 10852 5.74 -1.71 1.67 11.5 13.21 11.50 16.17 12.95 20.79 -7.84 -37.7Southern, Into AAMBC20 14.75 9899 4.32 -3.13 1.25 9.3 12.11 10.00 14.75 11.65 20.24 -8.59 -42.4TVA, Into AAJER20 15.75 10788 5.53 -1.77 1.25 8.6 13.11 11.00 15.75 12.60 20.92 -8.32 -39.8VACAR AAMCB20 15.50 10299 4.96 -2.56 1.25 8.8 12.86 10.75 15.50 12.44 20.67 -8.23 -39.8
westeRn day-ahead bilateRal indexes ($/Mwh)
Marginal spark spread Price change Prior 7-day Month Month yearly changeHub/index symbol 17-apr heat rate @7k @12k Chg % Chg average Min Max apr-20 apr-19 Chg % Chg
On-Peak
Mid-C WEABF20 16.91 12122 7.15 0.17 -0.98 -5.5 19.93 16.91 25.78 20.16 17.03 3.13 18.4John Day WEAHF20 18.75 13441 8.99 2.01 -1.00 -5.1 21.71 18.75 27.50 21.94 19.67 2.27 11.5COB WEABE20 18.75 13686 9.16 2.31 -1.00 -5.1 20.80 18.00 25.50 20.83 19.52 1.31 6.7NOB WEAIF20 18.00 12903 8.23 1.26 1.00 5.9 19.43 17.00 25.00 19.56 19.23 0.33 1.7Palo Verde WEACC20 14.88 9822 4.28 -3.30 0.88 6.3 14.38 11.50 17.50 14.22 18.58 -4.36 -23.5Mona AARLQ20 18.34 14614 9.56 3.28 0.34 1.9 19.46 15.86 23.00 19.34 18.71 0.63 3.4Four Corners WEABI20 16.00 14035 8.02 2.32 1.00 6.7 14.57 11.75 17.50 14.53 18.54 -4.01 -21.6Pinnacle Peak WEAKF20 16.50 10891 5.89 -1.68 1.00 6.5 15.89 13.50 19.00 15.97 19.52 -3.55 -18.2Westwing WEAJF20 16.67 11003 6.06 -1.51 1.17 7.5 15.68 13.25 19.00 15.71 19.15 -3.44 -18.0MEAD AAMBW20 21.00 13861 10.39 2.82 7.00 50.0 15.29 12.81 21.00 16.03 20.41 -4.38 -21.5
Off-Peak
Mid-C WEACL20 18.12 12989 8.35 1.38 0.13 0.7 19.28 15.00 24.48 20.00 15.38 4.62 30.0John Day WEAHL20 19.75 14158 9.99 3.01 0.00 0.0 21.04 16.75 26.25 21.71 18.12 3.59 19.8COB WEACJ20 18.00 13139 8.41 1.56 -1.25 -6.5 20.07 16.25 24.50 20.50 17.88 2.62 14.7NOB WEAIL20 17.75 12724 7.98 1.01 -1.25 -6.6 18.86 16.00 23.00 19.32 17.48 1.84 10.5Palo Verde WEACT20 18.13 11967 7.53 -0.05 -0.62 -3.3 18.19 11.00 19.56 17.43 17.62 -0.19 -1.1Mona AARLO20 19.00 15139 10.21 3.94 1.00 5.6 18.55 17.37 23.00 19.45 17.32 2.13 12.3Four Corners WEACR20 16.75 14693 8.77 3.07 -0.50 -2.9 16.96 10.50 18.75 16.36 17.58 -1.22 -6.9Pinnacle Peak WEAKL20 19.75 13036 9.14 1.57 -0.50 -2.5 19.68 12.50 21.00 18.94 18.34 0.60 3.3Westwing WEAJL20 18.00 11881 7.39 -0.18 -0.50 -2.7 17.93 10.75 19.25 17.19 18.20 -1.01 -5.5MEAD AAMBQ20 23.50 15512 12.90 5.32 3.25 16.0 20.15 11.75 23.50 19.10 18.88 0.22 1.2
Note: Western bilateral indexes reflect Friday-Saturday delivery
platts M2Ms balance-of-the-Month, apR 16, ($/Mwh) symbol On-peak symbol Off-peak
Northeast
Mass Hub EMHTB00 18.82 EMHUB00 15.85
N.Y. Zone G ENGTB00 13.22 ENGUB00 13.40
N.Y. Zone J ENJTB00 14.47 ENJUB00 14.10
N.Y. Zone A ENATB00 16.02 ENAUB00 10.15
Ontario* EONTB00 9.50 EONUB00 5.00
*Ontario prices are in Canadian dollars
PJM & MisO
PJM West EPJTB00 19.67 EPJUB00 14.50
AD Hub EECTB00 20.27 EECUB00 14.85
NI Hub ECETB00 19.62 ECEUB00 12.85
Indiana Hub ECITB00 20.22 ECIUB00 17.45
southeast & Central
Southern Into ESTTB00 20.72 ESTUB00 17.69
ERCOT North ETNTB00 24.49 ETNUB00 16.60
ERCOT Houston ETSTB00 26.44 ETSUB00 18.46
ERCOT West ETWTB00 22.69 ETWUB00 14.35
ERCOT South ETHTB00 24.77 ETHUB00 16.60
western
Mid-C EMCTB00 15.50 EMCUB00 14.90
Palo Verde EPVTB00 14.25 EPVUB00 18.95
Mead EMDTB00 16.79 EMDUB00 16.79
NP15 ENPTB00 20.95 ENPUB00 22.40
SP15 ESPTB00 15.25 ESPUB00 21.05

Friday, april 17, 2020Megawatt daily
18© 2020 S&P Global Platts, a division of S&P Global Inc. All rights reserved.
NEWS / PRICING COMMENTARY / MARkET FuNdAMENTAls
Mid-c houRly bilateRal indexes ($/Mwh) symbol 15-apr Range deals volume (Mw)On-peak MCRTP00 11.03 4.00-18.00 90 6887Off-peak MCRTO00 14.16 9.25-19.50 17 1250
Hour symbol 15-apr Range deals volume (Mw) apr-20
ending1 MCRTH01 14.00 14.00-14.00 1 50 16.732 MCRTH02 9.50 5.00-14.00 2 100 16.283 MCRTH03 9.25 4.00-14.00 2 95 16.104 MCRTH04 14.00 14.00-14.00 1 50 17.205 MCRTH05 14.25 14.25-14.25 2 125 18.726 MCRTH06 13.50 8.00-21.00 5 230 21.107 MCRTH07 9.00 5.00-13.00 6 725 22.028 MCRTH08 7.00 4.00-12.00 12 935 20.509 MCRTH09 6.25 5.00-10.00 6 575 19.1510 MCRTH10 9.50 5.00-18.00 5 360 18.2511 MCRTH11 11.50 5.00-18.00 7 355 18.4512 MCRTH12 18.00 10.00-23.00 5 295 18.9513 MCRTH13 16.75 10.00-18.00 4 220 19.0714 MCRTH14 17.00 16.00-18.00 2 100 18.7215 MCRTH15 17.25 13.00-20.00 5 175 18.1516 MCRTH16 14.75 12.00-20.00 5 400 17.8317 MCRTH17 12.00 5.00-20.00 6 398 16.8218 MCRTH18 10.25 4.00-20.00 8 497 17.0519 MCRTH19 7.25 4.00-18.00 7 797 17.4820 MCRTH20 8.00 4.00-15.00 8 910 17.9021 MCRTH21 8.00 4.00-14.00 3 127 18.3222 MCRTH22 4.00 4.00-4.00 1 18 17.2323 MCRTH23 19.50 13.00-21.00 2 250 18.5824 MCRTH24 19.25 12.00-21.00 4 475 17.72
MID-C AND NP15 HOURLY PRICES vs BPA HOURLY DEMAND
Source: S&P Global Platts, BPA(hour)
(GW)
0
10
20
30
242220181614121086424
5
6
7Mid-C NP15 BPA ($/MWh)
MID-C DAY-AHEAD/HOURLY ON-PEAK PRICE COMPARISON
Source: S&P Global Platts
($/MWh)
10
20
30
40
15-Apr10-Apr06-Apr01-Apr27-Mar23-Mar18-Mar
Day-ahead Hourly
HOuRly iNdiCes
Mid-C hourly power prices fall as demand dips to its multi-months low
■■ BPa peakload demand sinks to lowest level since October■■ total BPa generation rises 4% on the day
Mid-Columbia hourly power prices fell Wednesday as regional demand weakened to its lowest level since October 13.
Mid-C on-peak for Wednesday flow hours averaged $11.03/MWh, falling from $15.25/MWh seen Tuesday. The corresponding off-peak strip was down from Tuesday’s price of $16.34/MWh, averaging $14.16/MWh and trading about $3 above on-peak.
In the day-ahead market, packages were mixed, with Mid-Columbia on-peak assessed Tuesday for Wednesday delivery virtually flat around $17/MWh. Mid-C off-peak slid about $2, pricing around $15/MWh.
Real-time on-peak prices traded in a range of $4-$18/MWh, reaching their peak at noon PT. Off-peak prices traded in a range of $9.50-$19.50/MWh, with the highest price seen at hour 11 pm PT.
Bonneville Power Administration hourly average demand Monday peaked at 6,302 MW at hour ending 9 am PT during morning peak ramp. The lowest level of 5,386 MW was seen at hour ending 3 am PT.
The BPA peakload demand sank 8% to 6,334 MW Wednesday, the lowest level seen since October 13. As the coronavirus continues to put pressure on demand, peakload demand so far in April has declined about 11% month on month to average 7,091 MW.
Above-average temperatures were seen across the Pacific Northwest over the last few days, with Thursday’s temperatures in Seattle sitting 7 degrees above average at 65 degrees Fahrenheit and temperatures in Portland sitting 3 degrees above average at 64 F, according to CustomWeather.
Total BPA generation rose 4% on the day to 221,224 MWh Wednesday, adding to pressure on power pricing. Hydro share increased to about 62% or 137,979 MWh, up from 120,819 MWh seen the day before. Wind was down to 29,494 MWh from 37,467 MWh Tuesday.
— Daryna Kotenko
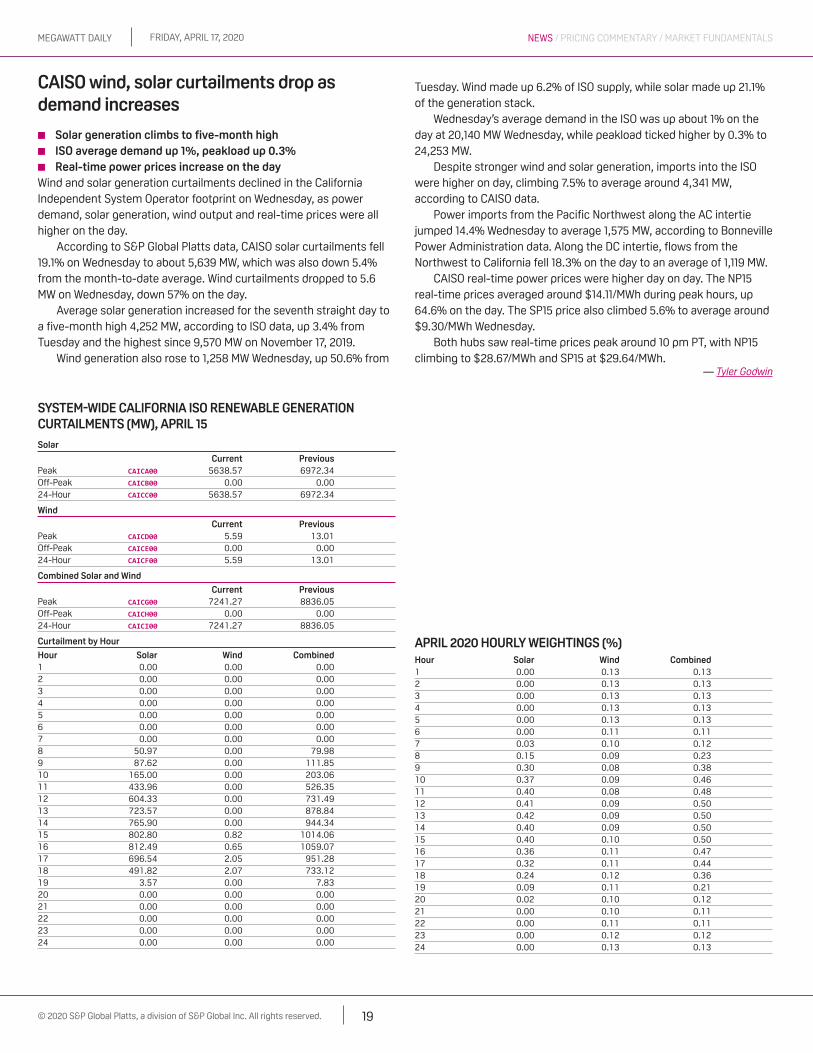
Friday, april 17, 2020Megawatt daily
19© 2020 S&P Global Platts, a division of S&P Global Inc. All rights reserved.
NEWS / PRICING COMMENTARY / MARkET FuNdAMENTAls
systeM-wide califoRnia iso Renewable geneRation CuRtailMeNts (Mw), aPRil 15
solar
Current PreviousPeak CAICA00 5638.57 6972.34Off-Peak CAICB00 0.00 0.0024-Hour CAICC00 5638.57 6972.34
wind
Current PreviousPeak CAICD00 5.59 13.01Off-Peak CAICE00 0.00 0.0024-Hour CAICF00 5.59 13.01
Combined solar and wind
Current PreviousPeak CAICG00 7241.27 8836.05Off-Peak CAICH00 0.00 0.0024-Hour CAICI00 7241.27 8836.05
Curtailment by Hour
Hour solar wind Combined1 0.00 0.00 0.002 0.00 0.00 0.003 0.00 0.00 0.004 0.00 0.00 0.005 0.00 0.00 0.006 0.00 0.00 0.007 0.00 0.00 0.008 50.97 0.00 79.989 87.62 0.00 111.8510 165.00 0.00 203.0611 433.96 0.00 526.3512 604.33 0.00 731.4913 723.57 0.00 878.8414 765.90 0.00 944.3415 802.80 0.82 1014.0616 812.49 0.65 1059.0717 696.54 2.05 951.2818 491.82 2.07 733.1219 3.57 0.00 7.8320 0.00 0.00 0.0021 0.00 0.00 0.0022 0.00 0.00 0.0023 0.00 0.00 0.0024 0.00 0.00 0.00
aPRil 2020 HOuRly weiGHtiNGs (%)Hour solar wind Combined1 0.00 0.13 0.132 0.00 0.13 0.133 0.00 0.13 0.134 0.00 0.13 0.135 0.00 0.13 0.136 0.00 0.11 0.117 0.03 0.10 0.128 0.15 0.09 0.239 0.30 0.08 0.3810 0.37 0.09 0.4611 0.40 0.08 0.4812 0.41 0.09 0.5013 0.42 0.09 0.5014 0.40 0.09 0.5015 0.40 0.10 0.5016 0.36 0.11 0.4717 0.32 0.11 0.4418 0.24 0.12 0.3619 0.09 0.11 0.2120 0.02 0.10 0.1221 0.00 0.10 0.1122 0.00 0.11 0.1123 0.00 0.12 0.1224 0.00 0.13 0.13
CaisO wind, solar curtailments drop as demand increases
■■ solar generation climbs to five-month high■■ isO average demand up 1%, peakload up 0.3%■■ Real-time power prices increase on the day
Wind and solar generation curtailments declined in the California Independent System Operator footprint on Wednesday, as power demand, solar generation, wind output and real-time prices were all higher on the day.
According to S&P Global Platts data, CAISO solar curtailments fell 19.1% on Wednesday to about 5,639 MW, which was also down 5.4% from the month-to-date average. Wind curtailments dropped to 5.6 MW on Wednesday, down 57% on the day.
Average solar generation increased for the seventh straight day to a five-month high 4,252 MW, according to ISO data, up 3.4% from Tuesday and the highest since 9,570 MW on November 17, 2019.
Wind generation also rose to 1,258 MW Wednesday, up 50.6% from
Tuesday. Wind made up 6.2% of ISO supply, while solar made up 21.1% of the generation stack.
Wednesday’s average demand in the ISO was up about 1% on the day at 20,140 MW Wednesday, while peakload ticked higher by 0.3% to 24,253 MW.
Despite stronger wind and solar generation, imports into the ISO were higher on day, climbing 7.5% to average around 4,341 MW, according to CAISO data.
Power imports from the Pacific Northwest along the AC intertie jumped 14.4% Wednesday to average 1,575 MW, according to Bonneville Power Administration data. Along the DC intertie, flows from the Northwest to California fell 18.3% on the day to an average of 1,119 MW.
CAISO real-time power prices were higher day on day. The NP15 real-time prices averaged around $14.11/MWh during peak hours, up 64.6% on the day. The SP15 price also climbed 5.6% to average around $9.30/MWh Wednesday.
Both hubs saw real-time prices peak around 10 pm PT, with NP15 climbing to $28.67/MWh and SP15 at $29.64/MWh.
— Tyler Godwin
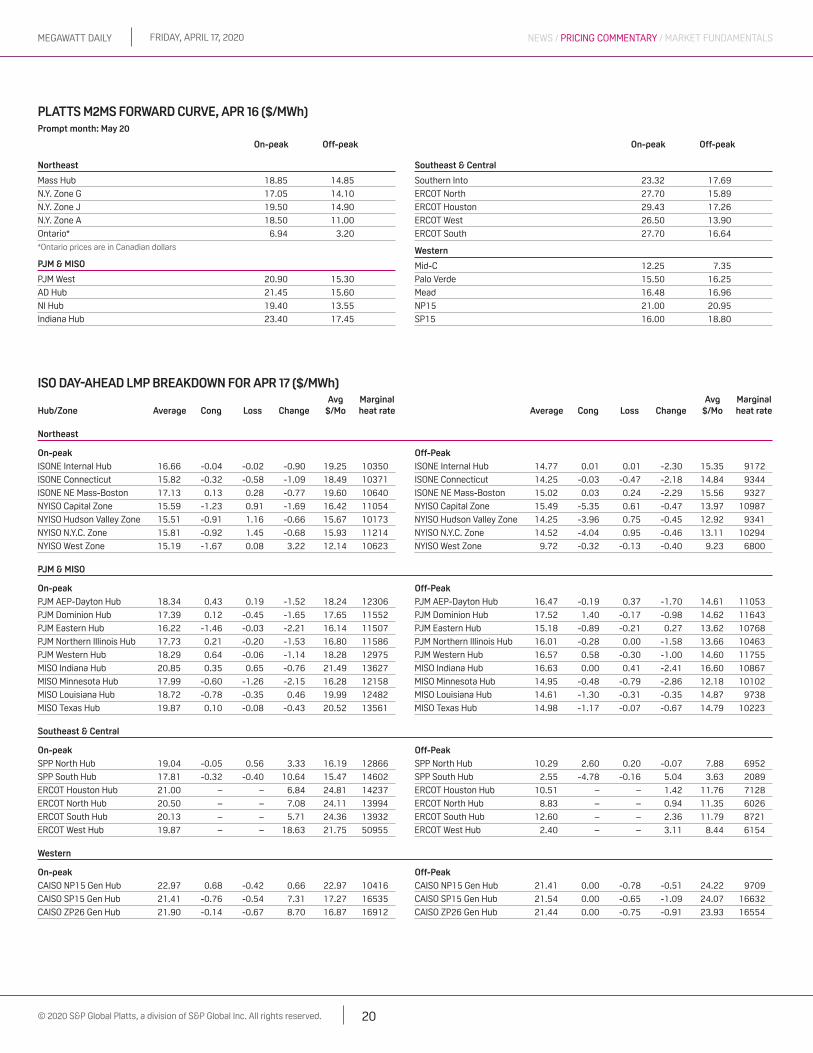
Friday, april 17, 2020Megawatt daily
20© 2020 S&P Global Platts, a division of S&P Global Inc. All rights reserved.
NEWS / PRICING COMMENTARY / MARkET FuNdAMENTAlsNEWs / PRICING COMMENTARY / MARkET FuNdAMENTAls
Platts M2Ms FORwaRd CuRve, aPR 16 ($/Mwh)Prompt month: May 20
On-peak Off-peak On-peak Off-peak
Northeast
Mass Hub 18.85 14.85
N.Y. Zone G 17.05 14.10
N.Y. Zone J 19.50 14.90
N.Y. Zone A 18.50 11.00
Ontario* 6.94 3.20
*Ontario prices are in Canadian dollars
PJM & MisO
PJM West 20.90 15.30
AD Hub 21.45 15.60
NI Hub 19.40 13.55
Indiana Hub 23.40 17.45
southeast & Central
Southern Into 23.32 17.69
ERCOT North 27.70 15.89
ERCOT Houston 29.43 17.26
ERCOT West 26.50 13.90
ERCOT South 27.70 16.64
western
Mid-C 12.25 7.35
Palo Verde 15.50 16.25
Mead 16.48 16.96
NP15 21.00 20.95
SP15 16.00 18.80
iso day-ahead lMp bReakdown foR apR 17 ($/Mwh) avg Marginal avg MarginalHub/Zone average Cong loss Change $/Mo heat rate average Cong loss Change $/Mo heat rate
Northeast
On-peak
ISONE Internal Hub 16.66 -0.04 -0.02 -0.90 19.25 10350
ISONE Connecticut 15.82 -0.32 -0.58 -1.09 18.49 10371
ISONE NE Mass-Boston 17.13 0.13 0.28 -0.77 19.60 10640
NYISO Capital Zone 15.59 -1.23 0.91 -1.69 16.42 11054
NYISO Hudson Valley Zone 15.51 -0.91 1.16 -0.66 15.67 10173
NYISO N.Y.C. Zone 15.81 -0.92 1.45 -0.68 15.93 11214
NYISO West Zone 15.19 -1.67 0.08 3.22 12.14 10623
Off-Peak
ISONE Internal Hub 14.77 0.01 0.01 -2.30 15.35 9172
ISONE Connecticut 14.25 -0.03 -0.47 -2.18 14.84 9344
ISONE NE Mass-Boston 15.02 0.03 0.24 -2.29 15.56 9327
NYISO Capital Zone 15.49 -5.35 0.61 -0.47 13.97 10987
NYISO Hudson Valley Zone 14.25 -3.96 0.75 -0.45 12.92 9341
NYISO N.Y.C. Zone 14.52 -4.04 0.95 -0.46 13.11 10294
NYISO West Zone 9.72 -0.32 -0.13 -0.40 9.23 6800
PJM & MisO
On-peak
PJM AEP-Dayton Hub 18.34 0.43 0.19 -1.52 18.24 12306
PJM Dominion Hub 17.39 0.12 -0.45 -1.65 17.65 11552
PJM Eastern Hub 16.22 -1.46 -0.03 -2.21 16.14 11507
PJM Northern Illinois Hub 17.73 0.21 -0.20 -1.53 16.80 11586
PJM Western Hub 18.29 0.64 -0.06 -1.14 18.28 12975
MISO Indiana Hub 20.85 0.35 0.65 -0.76 21.49 13627
MISO Minnesota Hub 17.99 -0.60 -1.26 -2.15 16.28 12158
MISO Louisiana Hub 18.72 -0.78 -0.35 0.46 19.99 12482
MISO Texas Hub 19.87 0.10 -0.08 -0.43 20.52 13561
Off-Peak
PJM AEP-Dayton Hub 16.47 -0.19 0.37 -1.70 14.61 11053
PJM Dominion Hub 17.52 1.40 -0.17 -0.98 14.62 11643
PJM Eastern Hub 15.18 -0.89 -0.21 0.27 13.62 10768
PJM Northern Illinois Hub 16.01 -0.28 0.00 -1.58 13.66 10463
PJM Western Hub 16.57 0.58 -0.30 -1.00 14.60 11755
MISO Indiana Hub 16.63 0.00 0.41 -2.41 16.60 10867
MISO Minnesota Hub 14.95 -0.48 -0.79 -2.86 12.18 10102
MISO Louisiana Hub 14.61 -1.30 -0.31 -0.35 14.87 9738
MISO Texas Hub 14.98 -1.17 -0.07 -0.67 14.79 10223
southeast & Central
On-peak
SPP North Hub 19.04 -0.05 0.56 3.33 16.19 12866
SPP South Hub 17.81 -0.32 -0.40 10.64 15.47 14602
ERCOT Houston Hub 21.00 – – 6.84 24.81 14237
ERCOT North Hub 20.50 – – 7.08 24.11 13994
ERCOT South Hub 20.13 – – 5.71 24.36 13932
ERCOT West Hub 19.87 – – 18.63 21.75 50955
Off-Peak
SPP North Hub 10.29 2.60 0.20 -0.07 7.88 6952
SPP South Hub 2.55 -4.78 -0.16 5.04 3.63 2089
ERCOT Houston Hub 10.51 – – 1.42 11.76 7128
ERCOT North Hub 8.83 – – 0.94 11.35 6026
ERCOT South Hub 12.60 – – 2.36 11.79 8721
ERCOT West Hub 2.40 – – 3.11 8.44 6154
western
On-peak
CAISO NP15 Gen Hub 22.97 0.68 -0.42 0.66 22.97 10416
CAISO SP15 Gen Hub 21.41 -0.76 -0.54 7.31 17.27 16535
CAISO ZP26 Gen Hub 21.90 -0.14 -0.67 8.70 16.87 16912
Off-Peak
CAISO NP15 Gen Hub 21.41 0.00 -0.78 -0.51 24.22 9709
CAISO SP15 Gen Hub 21.54 0.00 -0.65 -1.09 24.07 16632
CAISO ZP26 Gen Hub 21.44 0.00 -0.75 -0.91 23.93 16554

MEGAWATT DAILY NEWS / PRICING COMMENTARY / MARKET FUNDAMENTALSFRIDAY, APRIL 17, 2020
© 2020 S&P Global Platts, a division of S&P Global Inc. All rights reserved.
US POWER FUNDAMENTALS
ISONE-NYISO INTERTIE TRANSMISSION E-W
ISONE & NYISO NUCLEAR GENERATION OUTAGES
Source: NRC
Source: ISONE
MISO GENERATION MARKET SHARE - GAS VS. WIND
Source: S&P Global Platts Analytics
SPP ACTUAL WIND GENERATION VS. FORECAST
Source: SPP
SPP GENERATION MARKET SHARE - GAS VS. WIND
Source: S&P Global Platts Analytics
GAS GEN MARKET SHARE BY ISO
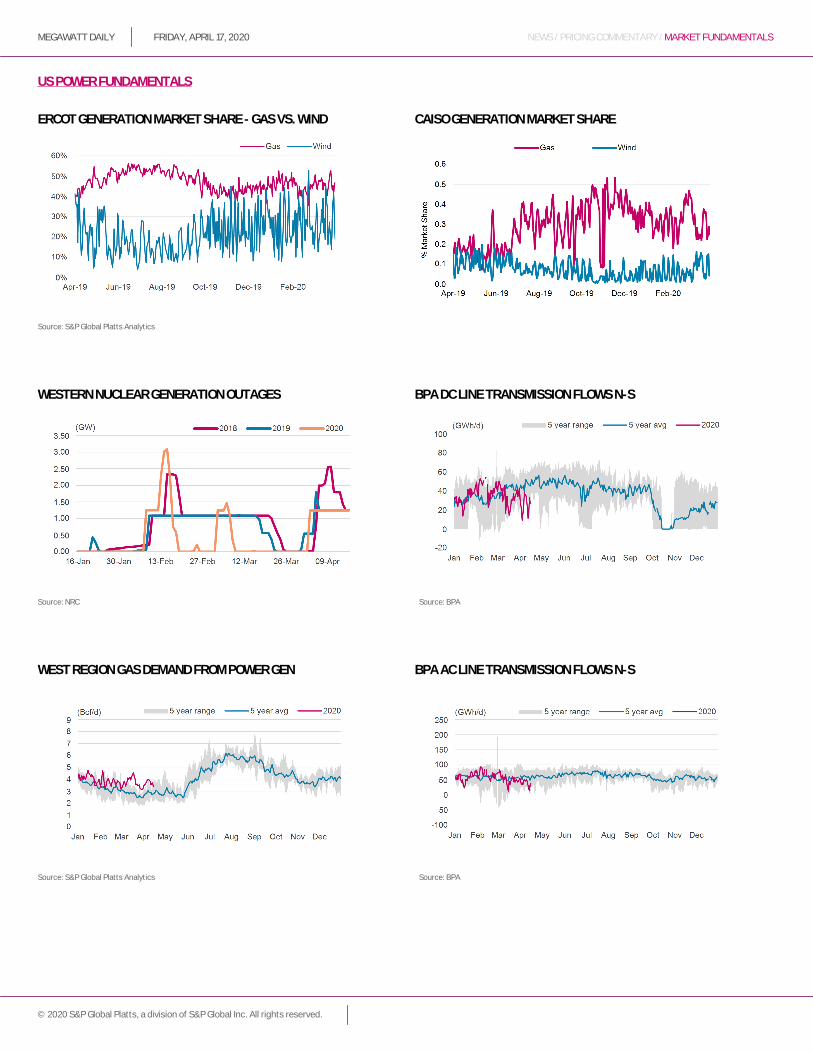
MEGAWATT DAILY NEWS / PRICING COMMENTARY / MARKET FUNDAMENTALSFRIDAY, APRIL 17, 2020
© 2020 S&P Global Platts, a division of S&P Global Inc. All rights reserved.
US POWER FUNDAMENTALS
ERCOT GENERATION MARKET SHARE - GAS VS. WIND
Source: S&P Global Platts Analytics
WEST REGION GAS DEMAND FROM POWER GEN
WESTERN NUCLEAR GENERATION OUTAGES
Source: NRC
Source: S&P Global Platts Analytics
BPA AC LINE TRANSMISSION FLOWS N-S
BPA DC LINE TRANSMISSION FLOWS N-S
Source: BPA
Source: BPA
CAISO GENERATION MARKET SHARE