Medical Material Management Support Using Data Mining and Analytics
12
Association for Information Systems AIS Electronic Library (AISeL) AMCIS 2007 Proceedings Americas Conference on Information Systems (AMCIS) 12-31-2007 Medical Material Management Support Using Data Mining and Analytics Richard Meyer Madhav Erraguntla Knowledge Based Systems, Inc. Follow this and additional works at: hp://aisel.aisnet.org/amcis2007 is material is brought to you by the Americas Conference on Information Systems (AMCIS) at AIS Electronic Library (AISeL). It has been accepted for inclusion in AMCIS 2007 Proceedings by an authorized administrator of AIS Electronic Library (AISeL). For more information, please contact [email protected]. Recommended Citation Meyer, Richard and Erraguntla, Madhav, "Medical Material Management Support Using Data Mining and Analytics" (2007). AMCIS 2007 Proceedings. Paper 468. hp://aisel.aisnet.org/amcis2007/468
Transcript of Medical Material Management Support Using Data Mining and Analytics

Association for Information SystemsAIS Electronic Library (AISeL)
AMCIS 2007 Proceedings Americas Conference on Information Systems(AMCIS)
12-31-2007
Medical Material Management Support UsingData Mining and AnalyticsRichard Meyer
Madhav ErraguntlaKnowledge Based Systems, Inc.
Follow this and additional works at: http://aisel.aisnet.org/amcis2007
This material is brought to you by the Americas Conference on Information Systems (AMCIS) at AIS Electronic Library (AISeL). It has been acceptedfor inclusion in AMCIS 2007 Proceedings by an authorized administrator of AIS Electronic Library (AISeL). For more information, please [email protected].
Recommended CitationMeyer, Richard and Erraguntla, Madhav, "Medical Material Management Support Using Data Mining and Analytics" (2007). AMCIS2007 Proceedings. Paper 468.http://aisel.aisnet.org/amcis2007/468

Medical Material Management Support Using Data Mining and Analytics (Madhav Erraguntla, Richard Mayer)
1
Medical Material Management Support Using Data Mining and Analytics
Madhav Erraguntla, Ph.D
Richard J. Mayer, Ph.D
Knowledge Based Systems, Inc.
1408 University Drive
College Station, TX-77845
Abstract
We present the application of data mining and analytics to support medical material management. Medical materials considered include medical equipment, drugs and pharmaceuticals, and blood. This paper presents the work performed in two different Office of Secretary of Defense (OSD) funded projects – (i) Medical Material Knowledge Discoverer (MMKD), covering medical equipment, pharmaceuticals and item management; and (ii) Blood Reserve Availability Assessment, Tracking, and Management System (BRAMS), covering blood supply chain management. Data mining and analytics are used to analyze inventory and consumption patterns, evaluate supply chain status, identify and determine key performance metrics at different levels of hierarchy, detect potential problems and issues and identify opportunities for improvement. The paper presents the application of clustering, association rules, regression analyses, online analytical processing (OLAP), performance metrics, data validation, alerts and notifications, a Geographic Information System (GIS), and analyses at multiple levels of abstraction to facilitate the efficient management of supply chains. Due to the sensitive nature of the data, the paper does not present data mining results per se, and data and analyses results are obscured when necessary. Instead, the focus of the paper is on how data mining and analytics are used to support supply chain management.
Key Words
Medical material management, blood inventory management, data mining, clustering, association rules, regression analyses, online analytical processing (OLAP), performance metrics, data validation, alerts and notifications, Geographic Information System (GIS), and analyses at multiple levels of abstraction.
1 Introduction
We present the application of data mining and analytics to support medical material management. Medical materials considered include medical equipment, drugs and pharmaceuticals, and blood. The paper presents work performed in two different Office of Secretary of Defense (OSD) funded projects – (i) Medical Material Knowledge Discoverer (MMKD), covering medical equipment, pharmaceuticals and item management; and (ii) Blood Reserve Availability Assessment, Tracking, and Management System (BRAMS), covering blood supply chain management. Data mining and analytics are used to analyze inventory and consumption patterns, evaluate supply chain status, identify and determine key performance metrics at different levels of hierarchy, detect potential problems and issues and identify opportunities for improvement. The paper presents the application of clustering, association rules, regression analyses, online analytical processing (OLAP), performance metrics, data validation, alerts and notifications, Geographic Information System (GIS), and analyses at multiple levels of abstraction to facilitate the efficient management of supply chains. Due to the sensitive nature of the data, the paper does not present data mining results per se, and data and analyses results are obscured when necessary. Instead, the focus of the paper is on how data mining and analytics are used to support supply chain management.

Medical Material Management Support Using Data Mining and Analytics (Madhav Erraguntla, Richard Mayer)
2
The Armed Services Blood Program’s (ASBP) mission is to provide quality blood products, blood substitutes, and services for all worldwide customers in peace and war [ASBP, 2007]. The Armed Services Blood Program is a joint operation that requires coordination among the blood programs of the military Services (Army, Air Force, and Navy) and the unified commands. It relies upon many components working together to provide quality blood products to service members “whenever and wherever needed” [ASBP, 2007]. The criticality of the product handled (blood and blood products), storage and handling requirements, and the vastness of the theater of operations coverage (practically the entire world) make the blood supply chain management a complex process. The Blood Reserve Availability Assessment, Tracking, and Management System (BRAMS) is an OSD-funded SBIR effort to facilitate blood availability and consumption data from DoD medical facilities using a web portal [BRAMS, 2007]. BRAMS developed data mining and analytical support for blood supply chain management, and the features of our supply chain support are presented in Section 3.
The Joint Medical Asset Repository (JMAR) is the DoD data warehouse for medical logistics [JMAR, 2007]. It collects in storage, in process, in transit, and in theater medical assets across all service components. It also aggregates data using OLAP techniques to allow for the analysis of inventory data at different levels of the product, service, geographic, and temporal dimensions using drill-up and drill-down features. Medical Material Knowledge Discoverer (MMKD) is an OSD- funded project intended to develop decision support for medical logistics supply chain management [MMKD, 2003]. Section 4 presents the results of our efforts to design and develop data mining and analytical support for medical material supply chain management.
Specific contribution of our work includes packaging of data mining and analytics to facilitate ease of use by decision makers in supply chain management and development of tools and techniques that enhance information systems capability through data mining and appropriate visualization.
2 Problem Description - Proactive Supply Chain Optimization Through Data Mining
The utilization of data collected as a normal part of the business process for retrospective analysis to improve operational effectiveness, and efficiency is a formidable and elusive task for most organizations. The data must be transformed into actionable insights, capable of generating solid results and measurable improvements in performance. The transformation from data to knowledge application requires knowledge discovery to understand relationships among variables and the development of processes that will recognize a given situation and trigger an appropriate responding action. Taken to its logical conclusion, such a process will ultimately permit the forecasting of changes and the proactive initiation of solutions. Effective implementation of data mining concepts can radically transform an individual’s potential impact on the supply chain and generate an ongoing process of innovations and improvements [Brachman and Anand 96; Fayyad and Uthurusamy 95; Brachman and Anand 96; Fukunaga 90; HPKB 98; Nemati et al. 96; Matheus et al., 96].
Organizations must build bridges that allow users (i.e., non experts in data mining) to gain mission critical insights from vast warehouses of data:
How does a change in deployment location, vendor, or medical practice impact demand for certain items? Are there any unusual demands, inventories, expirations or loss/destruction patterns that can cause problems in the future? What can be learned from the interrelationships of various types of supplies? Have the methods of treatment changed? How can a change in consumption identify a critical event or condition? How can the best practices for optimal supply chain performance be identified?
Medical Material Management Support Using Data Mining and Analytics (Madhav Erraguntla, Richard Mayer)
3
The Armed Services Blood Program (ASBP) and Joint Medical Asset Repository (JMAR) must address the challenge of supporting two types of supply environments: fixed Military Treatment Facilities (MTFs) and deployed theater forces. A data mining solution must simultaneously address both environments while taking into account interfacing or correlated events. The monitoring of the MTFs must address standard supply chain dynamics. Evolving a quantitative understanding of supply chain dynamics is critical in improving the performance and reducing the costs of MTFs as well as to assessing the similarities and differences that might be anticipated in a theater environment. For deployed theater forces, the application of knowledge discovery in the theater to understand the impact of change must occur rapidly− both for efficient management of the supply chain and for response to critical events. Furthermore, the data and knowledge gathered must be included in the long-term assessment of MTF readiness and for future implementations for theater deployed forces. Therefore, JMAR and ASBP must have a knowledge discovery solution that can be readily used by supply chain logisticians and which allows for rapid deployment. This paper presents our efforts to develop such a solution for bloodand medical material supply chains.
3 Blood Supply Chain Management
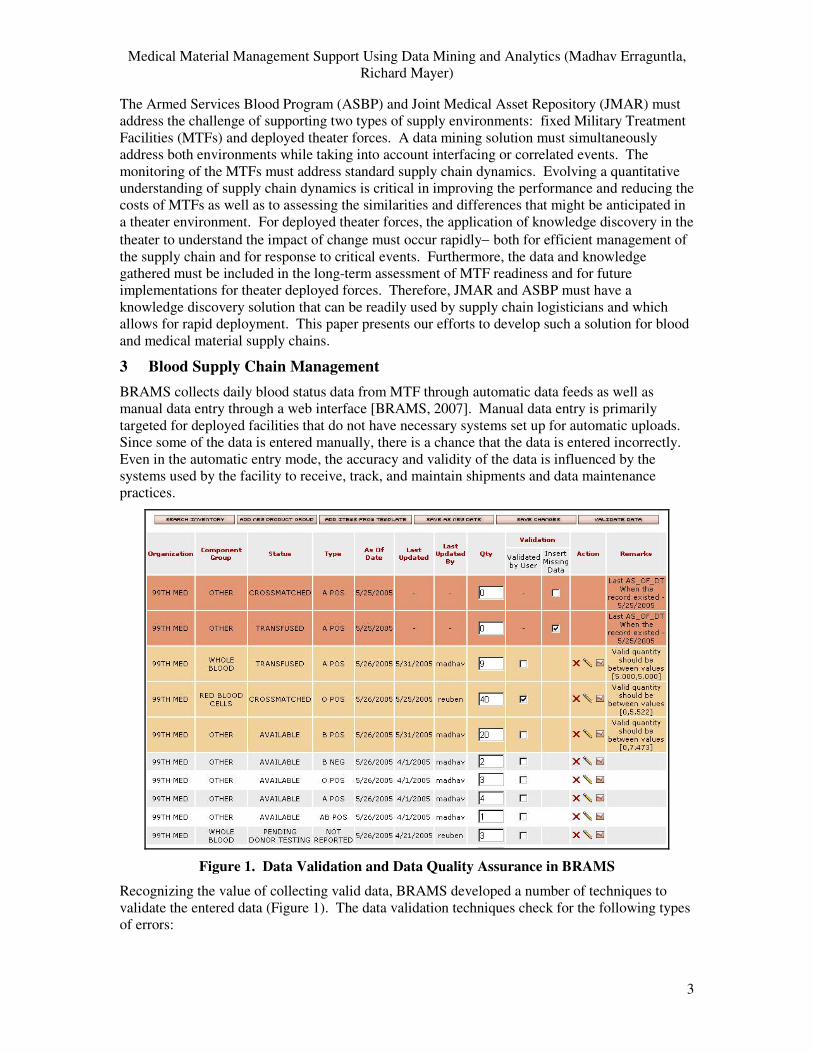
BRAMS collects daily blood status data from MTF through automatic data feeds as well as manual data entry through a web interface [BRAMS, 2007]. Manual data entry is primarily targeted for deployed facilities that do not have necessary systems set up for automatic uploads. Since some of the data is entered manually, there is a chance that the data is entered incorrectly. Even in the automatic entry mode, the accuracy and validity of the data is influenced by the systems used by the facility to receive, track, and maintain shipments and data maintenance practices.
Figure 1. Data Validation and Data Quality Assurance in BRAMS
Recognizing the value of collecting valid data, BRAMS developed a number of techniques to validate the entered data (Figure 1). The data validation techniques check for the following types of errors:
Medical Material Management Support Using Data Mining and Analytics (Madhav Erraguntla, Richard Mayer)
4
Potentially Missing Data: If a particular blood component group (red blood cells, platelets, etc.), blood type (A+, B-, O+, etc.) and status (inventory, collections, transfused, expired, destroyed, etc.) are present at a facility on a regular basis, and are suddenly not specified for a specific date, then there is a good chance that the data could have been mistakenly omitted.
Potentially Incorrectly Entered Data: We detect potentially incorrect data using two heuristics:
(i) Outlier Analyses: Use 3σ limits to identify data points that are outliers and hencecould have been data entry mistakes.
(ii) Collection and Transfusion Accounting: The inventory of any component group and type should match (within allowed tolerances) with the previous day’s inventory + incoming quantity (collections, shipments received, returns) – outgoing quantity (transfusions, expirations, destructions).
The user is presented with the option to either fixing the potential errors or overriding the notifications.
3.1 Inventory Management
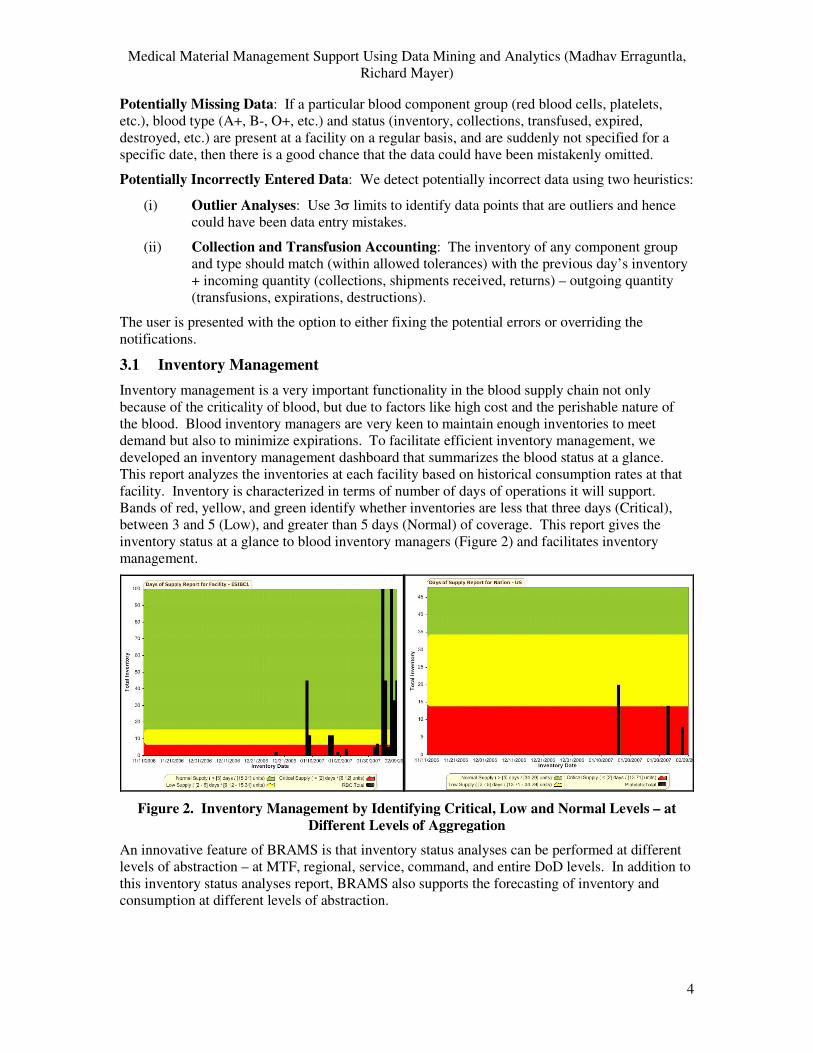
Inventory management is a very important functionality in the blood supply chain not only because of the criticality of blood, but due to factors like high cost and the perishable nature of the blood. Blood inventory managers are very keen to maintain enough inventories to meet demand but also to minimize expirations. To facilitate efficient inventory management, we developed an inventory management dashboard that summarizes the blood status at a glance. This report analyzes the inventories at each facility based on historical consumption rates at that facility. Inventory is characterized in terms of number of days of operations it will support. Bands of red, yellow, and green identify whether inventories are less that three days (Critical), between 3 and 5 (Low), and greater than 5 days (Normal) of coverage. This report gives the inventory status at a glance to blood inventory managers (Figure 2) and facilitates inventory management.
Figure 2. Inventory Management by Identifying Critical, Low and Normal Levels – at Different Levels of Aggregation
An innovative feature of BRAMS is that inventory status analyses can be performed at different levels of abstraction – at MTF, regional, service, command, and entire DoD levels. In addition to this inventory status analyses report, BRAMS also supports the forecasting of inventory and consumption at different levels of abstraction.

Medical Material Management Support Using Data Mining and Analytics (Madhav Erraguntla, Richard Mayer)
5
3.2 Proactive Supply Chain Management
A key BRAMS innovation is the alerts and notifications feature. Alerts allow supply chain managers to proactively identify problems and develop solutions before they become critical. This will be enabled by using software agents that continually monitor critical metrics such as inventory levels, not-in-stock items, unusual trends in consumption, and expiration dates and expiration rates of blood and blood products. Notifications are sent to concerned program and preparedness managers via e-mail or pop-up messages within BRAMS. By automatically monitoring all of the relevant metrics, detecting problems before they become critical and notifying the corresponding managers, BRAMS enables the transition of blood supply chain from a reactive agency to a proactive agency. BRAMS users have the flexibility to define what to monitor, acceptable levels for these metrics, and even the mode of notification. BRAMS currently supports the following alerts.
Table 1. Alerts Supported in BRAMS
Alert Type Issue Monitored Algorithm, Heuristic, or Metric
Current Status Excess and Shortage Inventories
1) Number of days the inventories will cover based on historical consumption.
2) Number of days inventory will cover based on forecasted consumption
Sudden Changes Inventory, consumption, expiration and destruction spikes and valleys
1) 2σ or 3σ deviation from respective mean
2) % Deviation from respective mean
3) % Deviation from previous spike or valley
Trend Analyses Gradual changes in inventory, consumption, expiration and destruction trends
1) Consecutive X data points that are asymptotically increasing (or decreasing)
2) X out of Y data points that are increasing (or decreasing)
3) % Increase (or decrease) of last data point compared to average increase (or decrease) over specified period
Alerts are implemented at different levels of abstraction – MTF, regional, service, command and DoD levels. Publish and subscribe architecture was used to implement alerts. Users can choose to subscribe to alerts that were authorized based on their role in the system.
3.3 GIS Based Emergency Management and Information Visualization
A Geographic Information System (GIS) is used in innovative applications in BRAMS [Donlon, 1999]. GIS is used to overlay information about excess inventories, shortages, destructions, expirations, and consumptions on a map interface. GIS is also used to overlay open problems that the users report about any issue they are having (e.g. problem with contamination in supplies). Overlaying such information on a map layout allows supply chain managers to visualize if the issue is local to that facility, random across the entire supply chain, or due to any regional causes. For example, an emerging outbreak of an epidemic in a region will cause an increase in blood

Medical Material Management Support Using Data Mining and Analytics (Madhav Erraguntla, Richard Mayer)
6
transfusions within that geographic region. BRAMS facilitates the early identification of such events by overlaying excess transfusion at each facility on a map background (Figure 3).
Figure 3. Blood Information Overlaid on Map Interface
The GIS interface is also used in BRAMS to facilitate inventory management and emergency management. Users can select a facility and choose to display the facilities that have required blood components and types within a specified distance. This allows stakeholders at different levels to share and manage inventories and respond to emergencies.
4 Medical Material Management
This section presents work performed by KBSI in medical material supply chain management in the OSD-funded Medical Material Knowledge Discoverer (MMKD) project [MMKD, 2003]. The goal of the MMKD effort is to build and validate a Material Management Dashboard that will be a key enabler for the DoD Medical Logistics community transformation to Focused Logistics. The data mining and On-Line Analytical Processing (OLAP) work presented in this section was performed on a dataset from the DoD medical logistics warehouse called the Joint Medical Asset Repository (JMAR).
4.1 Online Analytical Processing (OLAP)
MMKD supports tactical, operational, and strategic medical logistics decision making. The logistics users supported include logistics managers at a medical treatment facility (MTF), regional managers (Tri-service [TRBO] as well as individual service), and command and DoD level users. As part of the MMKD project, we met logistics managers at different levels in the hierarchy and discussed with them the key performance indicators (KPI) that are most relevant for them. We then developed an On-Line Analytical Processing (OLAP) model in Business Objects to determine and present the KPI at different levels of abstraction. Using the MMKD OLAP interface, users will be able to drill-down and drill-up to get information across detailed MTF levels or on aggregated regional and national levels. At any level, they will be able to compare their focus entity (MTF or Region) with a peer. A peer is automatically determined using clustering, and the cluster mean (Centroid) is used to facilitate a comparison of a focus item with its peer. Table 2 summarizes the KPI implemented in MMKD and their business value to users at different levels in the DoD medical logistics supply chain.

Medical Material Management Support Using Data Mining and Analytics (Madhav Erraguntla, Richard Mayer)
7
Table 2. Medical Logistics Key Performance Indicators and Their Business Value
Business ValueMetric
MTF Level Regional Level DoD Level
Not In Stock and Critical Items Percentages
• Identify Critical Items
• Compare Performance With Similar Facilities and Region Averages
• Determine the Region Performance.
• Identify Potential Items for standardization and inclusion into Prime Vendor Contract
• Go To War Preparedness (Readiness)
Number and Dollar Value of Items
• Identify the total dollars spent on Inventory
• Plan for material budget
• Identify items for standardization
• Budgeting and policy decisions
ABC Analysis
(Based on Inventory Status)
• Identify “high” value items and focus inventory management efforts.
• Identify items for standardization
• Inventory control and prioritization
Standardization Potential
(Identify items that are used only by a small number of MTFs)
• Identify potential items for standardization
• Report standardization compliance
• Identify potential items for standardization
• Cost control
PV Utilization Trend • Determine if the prime vendor utilization is improving with time.
• 2) Compare the PV utilization trend with other facilities, region averages.
• Compare the trends of PV utilizations of all the MTFs in the region.
• Cost control
Best Price For an Item Report
• Determine if a source other than Prime vendor is offering a better price. Negotiate with prime vendor.

Medical Material Management Support Using Data Mining and Analytics (Madhav Erraguntla, Richard Mayer)
8
Figure 4 shows the Not-In-Stock (NIS) report at the regional level and a comparison of NIS performance of the individual MTF with the mean in the region. Similarly, OLAP reports were developed for all the KPI presented in Table 2.
Figure 4. Not-In-Stock Report at the Regional Level and Comparison with Peers
4.2 Clustering and Cluster Visualization
KBSI has developed a data mining tool suite called “Personal Data Prospector” (PDP) and a web version called “Web Data Prospector” (WDP). With these technologies, insights discovered with the PDP can be delivered over traditional web based portals. Using these tool suites, we developed a clustering capability for MMKD. Users in MMKD can cluster MTF based on attributes like the number of items, the dollar value of items, the number of critical items, the number of NIS items, the number of items from prime vendors, and the type of organization. Clustering is used in MMKD to determine an appropriate peer to compare an individual MTF based on key performance indicators. Clustering is also used to analyze the reason why the performance of certain organizations is better than others. For example, we can cluster on levels of NIS items and form groups of organizations that have different levels of NIS items (Figure 18). We can then analyze to see if there are any factors (prime vendor, geographical location, or procurement policies) that distinguish organizations with low NIS items from others. To facilitate such analyses, MMKD supports the overlay of cluster information on a map interface (Figure 5).
Figure 5. Clustering and Cluster Visualization in MMKD
4.3 Prime Vendor Effectiveness Analyses
A prime vendor (PV) is an important consideration in DoD medical logistics. Prime vendors are contractors who are authorized to supply a selected list of items for all the facilities in the focus region. The belief is that because of preferred vendor status and a pre-negotiated price, prime

Medical Material Management Support Using Data Mining and Analytics (Madhav Erraguntla, Richard Mayer)
9
vendor contracts will lead to reduced costs and less Not-in-Stocks (NIS) and critical items. Much effort is focused on developing standardizing items and entering contracts with prime vendors.
The medical material logistic stakeholders at different levels in the supply chain are continuously challenged to determine if prime vendors are indeed beneficial and if medical logisticians should continue focusing efforts to develop prime vendors. Analyzing the data, we determined that PV utilization would definitely help ensure that the DoD is getting the best price in most cases. We also performed a correlation analysis to study the effect of prime vendor utilization on NIS and the Number of Critical Items. Sample results are displayed in Figure 6. The results strongly reinforce the conventional logic that increasing prime vendor utilization can potentially lead to lower NIS rates.
Figure 6. Correlation Analyses to Analyze Effectiveness of Prime Vendor Utilization
Insights gained by correlation analyses are:
1. The initial regression fit (NIS = 0.32 – (0.162 * PV)) had R2 value of 10% and p-value for F-test of 0.0053 (proving dependency between NIS and PV Utilization).
2. There are some small facilities that have low NIS levels just because of the small number of items they manage (points in the bottom left portion of Figure 6). These facilities are filtered from the next version of the analyses.
3. Some facilities are having an unusually high number of NIS even though the PV utilization is high (points along the 100% PV utilization in Figure 6). These are identified as belonging to a particular problem vendor with under-performance.
4. Regression analyses were reformed after filtering out the outliers (small facilities with spuriously good NIS levels and facilities with a specific problem prime vendor). This resulted in the regression equation (NIS = 0.59 – (0.534 * PV)) with R2 value of 36% and p-value for F-test of 0.00001, validating that PV utilization has a positive effect on reducing NIS levels.
In this manner, the regression analyses and scatter plots formed the basis for developing the PV rating and identification of under-performance in MMKD.
4.4 Association Rules
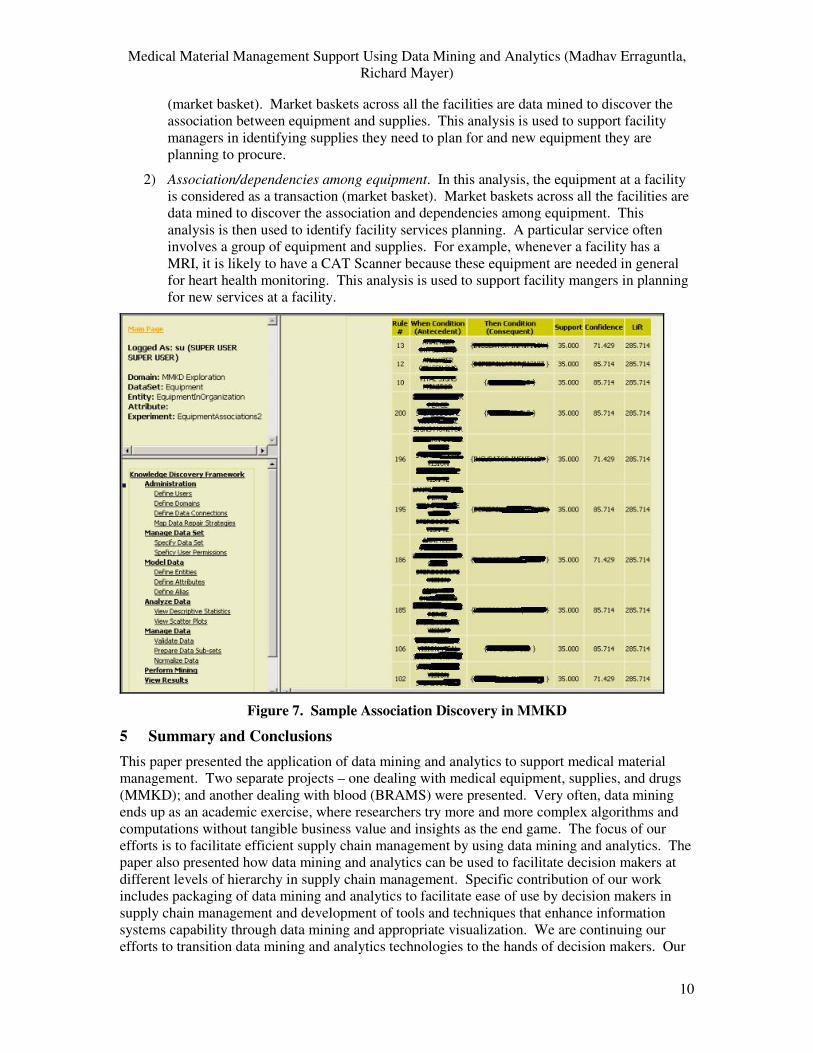
In MMKD, we used association rule extraction to support facility planning (Figure 7). Association rules were used to perform two types of analyses:
1) Association between equipment and supplies. In this analysis, the equipment at a facility and the supply items maintained at a facility are considered as a single transaction
Medical Material Management Support Using Data Mining and Analytics (Madhav Erraguntla, Richard Mayer)
10
(market basket). Market baskets across all the facilities are data mined to discover the association between equipment and supplies. This analysis is used to support facility managers in identifying supplies they need to plan for and new equipment they are planning to procure.
2) Association/dependencies among equipment. In this analysis, the equipment at a facility is considered as a transaction (market basket). Market baskets across all the facilities are data mined to discover the association and dependencies among equipment. This analysis is then used to identify facility services planning. A particular service often involves a group of equipment and supplies. For example, whenever a facility has a MRI, it is likely to have a CAT Scanner because these equipment are needed in general for heart health monitoring. This analysis is used to support facility mangers in planning for new services at a facility.
Figure 7. Sample Association Discovery in MMKD
5 Summary and Conclusions
This paper presented the application of data mining and analytics to support medical material management. Two separate projects – one dealing with medical equipment, supplies, and drugs (MMKD); and another dealing with blood (BRAMS) were presented. Very often, data mining ends up as an academic exercise, where researchers try more and more complex algorithms and computations without tangible business value and insights as the end game. The focus of our efforts is to facilitate efficient supply chain management by using data mining and analytics. The paper also presented how data mining and analytics can be used to facilitate decision makers at different levels of hierarchy in supply chain management. Specific contribution of our work includes packaging of data mining and analytics to facilitate ease of use by decision makers in supply chain management and development of tools and techniques that enhance information systems capability through data mining and appropriate visualization. We are continuing our efforts to transition data mining and analytics technologies to the hands of decision makers. Our

Medical Material Management Support Using Data Mining and Analytics (Madhav Erraguntla, Richard Mayer)
11
vision for the future is to be able to data mine across both the supply side and the demand side of the health care domain. In a third initiative Military Health Data Mining Algorithms Library (M-HDML) for the Military Health System (MHS) Telemedicine and Advanced Technology Research Center (TATRC) we have demonstrated both clinical and health care management directed insights that can be data mined from treatment, payment, and operations (TPO) data. In that initiative we have also established an initial research data cube with over four years worth of data (>1.3 TB) covering over 9 million plan participants. Using the data mining tools, this initial research data set, and in collaboration with MHS domain experts as well as researchers at Vanderbilt University Medical Center, we have been generated results in domains ranging from “bounce back” predictors to prostate cancer research and decision maker performance scoring. The opportunity now exists to integrate the data from these two domains. We believe that looking across the TPO and supply domains can generate significant insights.
6 Acknowledgements
We acknowledge the support of the Contracting Officer’s Technical Representatives (COTR) for BRAMS (LTC Ronny Fryar and MAJ Antoinette Mattoch) and MMKD (CDR David Stratton). We also acknowledge the contributions of the MMKD and BRAMS team at KBSI that included Shashikanth Hosur, Kannan Swaminathan, Priya Ramanujam, and Sarita Khaire. The concept development and implementation of the ideas presented in this paper would not have been possible without participation and involvement of the KBSI team and COTRs.
7 References
ASBP. 2007. “Armed Services Blood Program”, http://www.militaryblood.dod.mil/.
Brachman, R. J., Anand, T.1996. “The Process of Knowledge Discovery in Databases.” In Advances in Knowledge Discovery and Data Mining, pp. 37- 57, AAAA/MIT.
BRAMS. 2007. “Blood Reserve Availability Assessment, Tracking, and Management System (BRAMS) Phase II Year 1 Final Report,” Knowledge Based Systems Inc, OSD SBIR Contract Number W81XWH-05-C-0074.
Donlon, J.J. and Forbus, K.D. 1999. Using a Geographic Information System for Qualitative Spatial Reasoning about Trafficability. Proceedings of QR99, Loch Awe, Scotland, June 1999.
Fayyad, U. M., Uthurusamy, R. 1995. Proceedings, First International Conference on Knowledge Discovery and Data mining. The AAAI Press, Menlo Park, CA.
Fukunaga, K. 1990. Introduction to Statistical Pattern Recognition, Academic Press, Boston, MA.
HPKB. 1998. “High Performance Knowledge Bases,” DARPA Program, http://www.teknowledge.com/HPKB/.
JMAR. 2007. “Joint Medical Asset Repository,” https://jmar.detrick.army.mil/
Matheus, C. J., G. Piatetsky-Shapiro and D. McNeil. 1996. Selecting and Reporting What is Interesting. Advances in Knowledge Discovery and Data Mining (eds. U. Fayyad, G. Piatetsky-Shapiro, P. Smyth, and R. Uthursamy), AAAI/MIT Press, Cambridge, MA.
MMKD, 2003. “Materiel Management Knowledge Discoverer (MMKD) Phase I Final Report,” Knowledge Based Systems Inc, OSD SBIR Contract Number DAMD17-03-0063.
Nemati, H., Phelps, M., Stoeffler, D. I. 1996. “Knowledge Discovery Through Data Mining,” Advances in Knowledge Discovery and Data Mining, pp. 2- 16, AAAA/MIT.