Monitoring-and-reporting-guidelines-for-flare-reduction-CDM ...
Upload
independentCategory
view
1download
0
Cardiac data mining (CDM); organization and predictive analytics on biomedical(cardiac) dataM. Musa Bilal, Masood Hussain, Iqra Basharat, and Mamuna Fatima Citation: AIP Conference Proceedings 1559, 260 (2013); doi: 10.1063/1.4825018 View online: http://dx.doi.org/10.1063/1.4825018 View Table of Contents: http://scitation.aip.org/content/aip/proceeding/aipcp/1559?ver=pdfcov Published by the AIP Publishing Articles you may be interested in Wavelet methods in data mining AIP Conf. Proc. 1463, 103 (2012); 10.1063/1.4740042 Mining Connected Data AIP Conf. Proc. 1126, 94 (2009); 10.1063/1.3149476 Application of Bayesian networks and data mining to biomedical problems AIP Conf. Proc. 953, 132 (2007); 10.1063/1.2817336 CDM: Numerical predictions on small scales AIP Conf. Proc. 586, 130 (2001); 10.1063/1.1419542 Pros and cons of data mining Phys. Today
This article is copyrighted as indicated in the article. Reuse of AIP content is subject to the terms at: http://scitation.aip.org/termsconditions. Downloaded to IP:
111.68.101.200 On: Mon, 08 Dec 2014 07:26:58
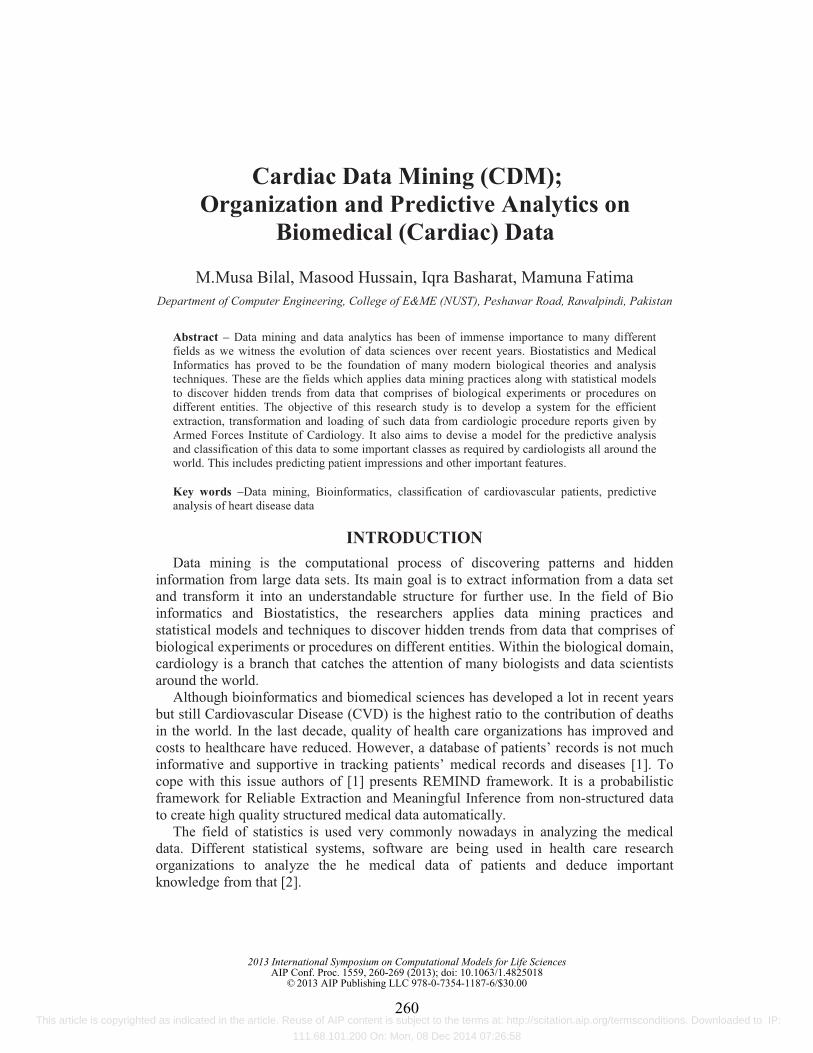
Cardiac Data Mining (CDM); Organization and Predictive Analytics on
Biomedical (Cardiac) Data
M.Musa Bilal, Masood Hussain, Iqra Basharat, Mamuna Fatima Department of Computer Engineering, College of E&ME (NUST), Peshawar Road, Rawalpindi, Pakistan
Abstract – Data mining and data analytics has been of immense importance to many different fields as we witness the evolution of data sciences over recent years. Biostatistics and Medical Informatics has proved to be the foundation of many modern biological theories and analysis techniques. These are the fields which applies data mining practices along with statistical models to discover hidden trends from data that comprises of biological experiments or procedures on different entities. The objective of this research study is to develop a system for the efficient extraction, transformation and loading of such data from cardiologic procedure reports given by Armed Forces Institute of Cardiology. It also aims to devise a model for the predictive analysis and classification of this data to some important classes as required by cardiologists all around the world. This includes predicting patient impressions and other important features.
Key words –Data mining, Bioinformatics, classification of cardiovascular patients, predictive analysis of heart disease data
INTRODUCTION Data mining is the computational process of discovering patterns and hidden
information from large data sets. Its main goal is to extract information from a data set and transform it into an understandable structure for further use. In the field of Bio informatics and Biostatistics, the researchers applies data mining practices and statistical models and techniques to discover hidden trends from data that comprises of biological experiments or procedures on different entities. Within the biological domain, cardiology is a branch that catches the attention of many biologists and data scientists around the world.
Although bioinformatics and biomedical sciences has developed a lot in recent years but still Cardiovascular Disease (CVD) is the highest ratio to the contribution of deaths in the world. In the last decade, quality of health care organizations has improved and costs to healthcare have reduced. However, a database of patients’ records is not much informative and supportive in tracking patients’ medical records and diseases [1]. To cope with this issue authors of [1] presents REMIND framework. It is a probabilistic framework for Reliable Extraction and Meaningful Inference from non-structured data to create high quality structured medical data automatically.
The field of statistics is used very commonly nowadays in analyzing the medical data. Different statistical systems, software are being used in health care research organizations to analyze the he medical data of patients and deduce important knowledge from that [2].
2013 International Symposium on Computational Models for Life SciencesAIP Conf. Proc. 1559, 260-269 (2013); doi: 10.1063/1.4825018
© 2013 AIP Publishing LLC 978-0-7354-1187-6/$30.00
260 This article is copyrighted as indicated in the article. Reuse of AIP content is subject to the terms at: http://scitation.aip.org/termsconditions. Downloaded to IP:
111.68.101.200 On: Mon, 08 Dec 2014 07:26:58
The aim of this research is to thoroughly study and analyze the past patient reports from the nuclear medicine department of Armed Forces Institute of Cardiology (AFIC) to frame out a system that can efficiently and accurately be used to store and analyze data extracted from those reports. In this study, we have extracted, transformed and load the data from past reports into our designed databases; and carry out analysis on that data by building different exploratory, classification and predictive models. This analysis involves classifying the patients into different categories depending upon the impressions deduced from their past history and current scan findings.
Moreover, we have applied different clustering techniques on the data set to categorize the patients into distinct clusters and to extract useful features. These features can then be employed in making decisions over the data set in our analysis. Classification models use these classifiers. The analysis also involves predicting the values of different intermediate statistics involved in the procedures carried out.
LITERATURE REVIEW There is a lot of work in literature that is carried out on analysis, classification and
prediction of bio medical data using data mining techniques but cardiology and cardiac data analysis is a field that holds utmost importance and cannot be ignored.
Bio-medical data can be broken down into different categories; there has been work done on the gene expressions and patterns of various diseases. This work includes approaches developed to detect patterns in various images using segmentation, feature extraction and neural networks [4] [6] [7]. Besides this Bio-medical data analysis has also been done on data extracted from different medical devices like electroencephalographic (EEG) and magneto encephalographic (MEG) recordings [5]. It has also been done on structured and unstructured data from various data sources like medical journals. Biomedical Text mining has been used extensively for disease gene discovery [8]. Extensive work has been done on semantic bio-medical data mining using the common practices of the CRISP – DM model. Many different semantic sub-group discovery algorithms have been developed which aides any future work on gene pattern recognition [3].
Most of the work in cardiology has been done on image segmentation, pattern recognition, scan correlation and feature extraction. The images commonly used within this analysis are Angiography scans, CT-Angiography Scans, Thallium Scans etc. Most of this work deals with diagnosis of different cardiac problems. Some of these diagnoses include identification of wall motion abnormalities within developed classification images of heart [9] and diagnosis of Cardiovascular images using echocardiography images for the automatic assessment of the left ventricular ejection fraction (EF) of a patient [10].
Besides, some data mining techniques have also been applied on ECG generated data; mostly this has been done for the efficient identification of any cardiac abnormality. This is done by feature selection from different compressed ECG signals using Clustering [11]. Besides this ECG Signals have also been applied to apply adaptive data analysis for the identification of Cardiovascular Diseases [12] and for the early prediction of Cardiovascular Diseases [13]. Some work has also been done on predicting Cardiovascular Risk Factors using decision tree algorithm
261 This article is copyrighted as indicated in the article. Reuse of AIP content is subject to the terms at: http://scitation.aip.org/termsconditions. Downloaded to IP:
111.68.101.200 On: Mon, 08 Dec 2014 07:26:58
Unfortunately much work hasn’t been done in the analysis of clinical cardiologic data. Some research however has been done in the field of improving cardiac care using clinical cardiac data. When dealt with clinical data, the major challenge is to structure all the available information into a single, suitable format. Another challenge is to remove any sort of data redundancies which may lead to an inaccurate or biased analysis. Once the data is structured and any inaccuracies or redundancies are removed using probabilistic models, different machine learning algorithms were applied to monitor the accuracy for making inferences on future data [14].
There are different heart diseases systems developed that are helping a lot medical practitioners to make intelligent guesses. An intelligent heart disease prediction system was developed using three data mining techniques (Naïve Byes, Neural Networks and Decision trees) [15]. Results of this study shows that Naïve Byes is more influential in envisaging patients with heart disease whereas Decision Tree gives better results in predicting patients with no heart disease.
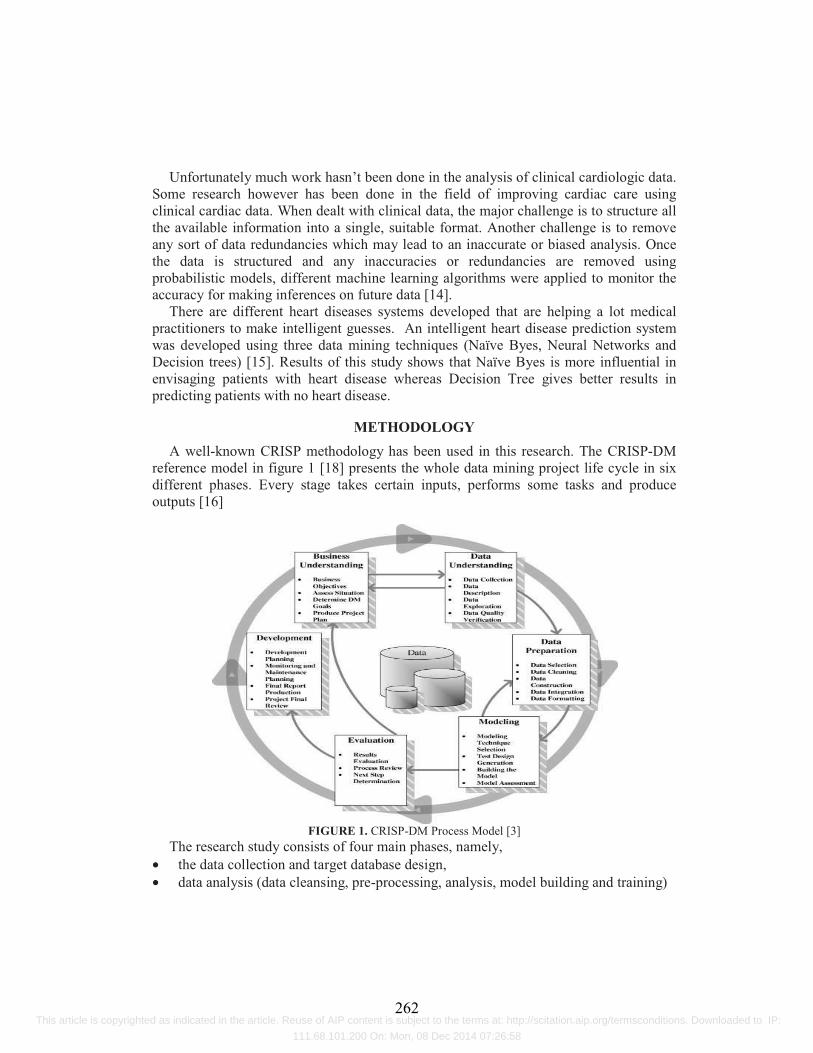
METHODOLOGY A well-known CRISP methodology has been used in this research. The CRISP-DM
reference model in figure 1 [18] presents the whole data mining project life cycle in six different phases. Every stage takes certain inputs, performs some tasks and produce outputs [16]
FIGURE 1. CRISP-DM Process Model [3] The research study consists of four main phases, namely,
• the data collection and target database design, • data analysis (data cleansing, pre-processing, analysis, model building and training)
262 This article is copyrighted as indicated in the article. Reuse of AIP content is subject to the terms at: http://scitation.aip.org/termsconditions. Downloaded to IP:
111.68.101.200 On: Mon, 08 Dec 2014 07:26:58

• Application Design (Platform for efficient storage and automated analysis; exploratory analysis and classification of intended data)
• Reporting the results of the automated analysis All four phases of the project were completed in the planned time span. The resources
used within the four phases include the following languages and tools,
TABLE 1. Tools and Languages used in the research study Tools and Languages UsageIBM SPSS Statistics data handling, cleansing and pre-processing WEKA data exploratory analysis and model building R language for Statistical Computing
data exploratory analysis, model building and generating graphs
Microsoft SQL Server 2008 Data modeling and target database design MATLAB 2010 Handling Data, applying logic, writing scripts
and generating distributions Microsoft Visual Studio 2010; C#.NET
Developing Application, building real-time classification model and applying logic
SAP Crystal Reports 2010 Making Reports over the results
Data Collection and Understanding The first stage of the CRISP methodology is data understanding. This step involved
the collection and understanding of our research domain, patient reports and procedural test reports from Armed Forces Institute of Cardiology (AFIC), Pakistan. Knowledge acquisition and understanding of medical data of patients’ and biological terms and procedure was developed in close collaboration with senior cardiologist at AFIC.
Data Extraction, Transformation and Load In this phase, the collected data was extracted from patients’ reports and database was
designed to keep the processed data. The collected data was in unstructured report form that could not be used in machine learning so it has t be transformed into structured form. For this purpose mapping tables were used in database. IBM SPSS Statistics Suite was used for preprocessing and transformation of the different segments of the data suitable for data mining at later stage. This preprocessing stage was carried out in a recursive manner according to the need, aiding in the exploratory analysis stage and the improvement of the classification/predictive model.
The preprocessing stage involved the following steps, • Data Normalization; • Visualizing the distribution trend in different important attributes and transforming
them to a normal distribution using techniques like natural log transformation, power transformation, min-max transformation and boxcox transformation according to the nature of data
• Data Standardization; • Transforming the data into a fixed upper and lower bound range, normally between 0
and 1
263 This article is copyrighted as indicated in the article. Reuse of AIP content is subject to the terms at: http://scitation.aip.org/termsconditions. Downloaded to IP:
111.68.101.200 On: Mon, 08 Dec 2014 07:26:58
• Data Binning; • Transforming nominal data into categorical data or transforming wider categories into
a narrower range.
The tool used for data modeling and database design was Microsoft SQL Server. For data preprocessing and normalization we used IBM SPSS Statistics and Matlab.
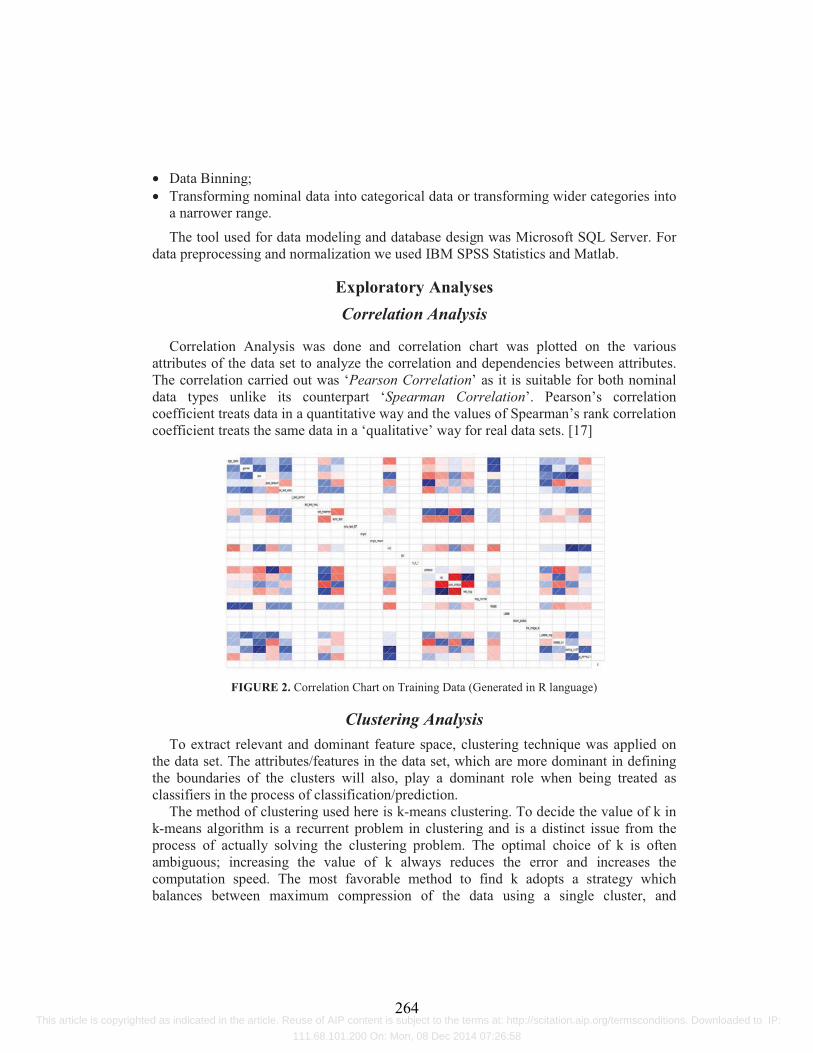
Exploratory Analyses Correlation Analysis
Correlation Analysis was done and correlation chart was plotted on the various attributes of the data set to analyze the correlation and dependencies between attributes. The correlation carried out was ‘Pearson Correlation’ as it is suitable for both nominal data types unlike its counterpart ‘Spearman Correlation’. Pearson’s correlation coefficient treats data in a quantitative way and the values of Spearman’s rank correlation coefficient treats the same data in a ‘qualitative’ way for real data sets. [17]
FIGURE 2. Correlation Chart on Training Data (Generated in R language)
Clustering Analysis To extract relevant and dominant feature space, clustering technique was applied on
the data set. The attributes/features in the data set, which are more dominant in defining the boundaries of the clusters will also, play a dominant role when being treated as classifiers in the process of classification/prediction.
The method of clustering used here is k-means clustering. To decide the value of k in k-means algorithm is a recurrent problem in clustering and is a distinct issue from the process of actually solving the clustering problem. The optimal choice of k is often ambiguous; increasing the value of k always reduces the error and increases the computation speed. The most favorable method to find k adopts a strategy which balances between maximum compression of the data using a single cluster, and
264 This article is copyrighted as indicated in the article. Reuse of AIP content is subject to the terms at: http://scitation.aip.org/termsconditions. Downloaded to IP:
111.68.101.200 On: Mon, 08 Dec 2014 07:26:58

maximum accuracy by assigning each data point to its own cluster. So accordingly, the ELBOW approach was used for one-way analysis of variance [19]. The mathematical formula to compute the percentage of variance for each number of clusters used is given below.
FIGURE 3. Percentage of Variance (ANOVA) For ease of use we put reference value one on the x-axis as corresponding to 3
clusters. We choose that specific number of clusters where the inclination of the graph shown in Figure 3 starts to decline which in the figure is 6 clusters. Results of clusters can be visualized in figure 4.
FIGURE 4. Cluster Visualization with reference to Protocol applied i.e. Bruce, Adenosine or Thallium Infusion
Feature Selection Once the optimal number of clusters is decided, we carry out clustering by separating
data set into the specified number of distinct clusters.
We made a comparative study of K-means, K-mediods and Fuzzy K-means clustering for this purpose. The attributes selected from this process of feature extraction are given below,
265 This article is copyrighted as indicated in the article. Reuse of AIP content is subject to the terms at: http://scitation.aip.org/termsconditions. Downloaded to IP:
111.68.101.200 On: Mon, 08 Dec 2014 07:26:58
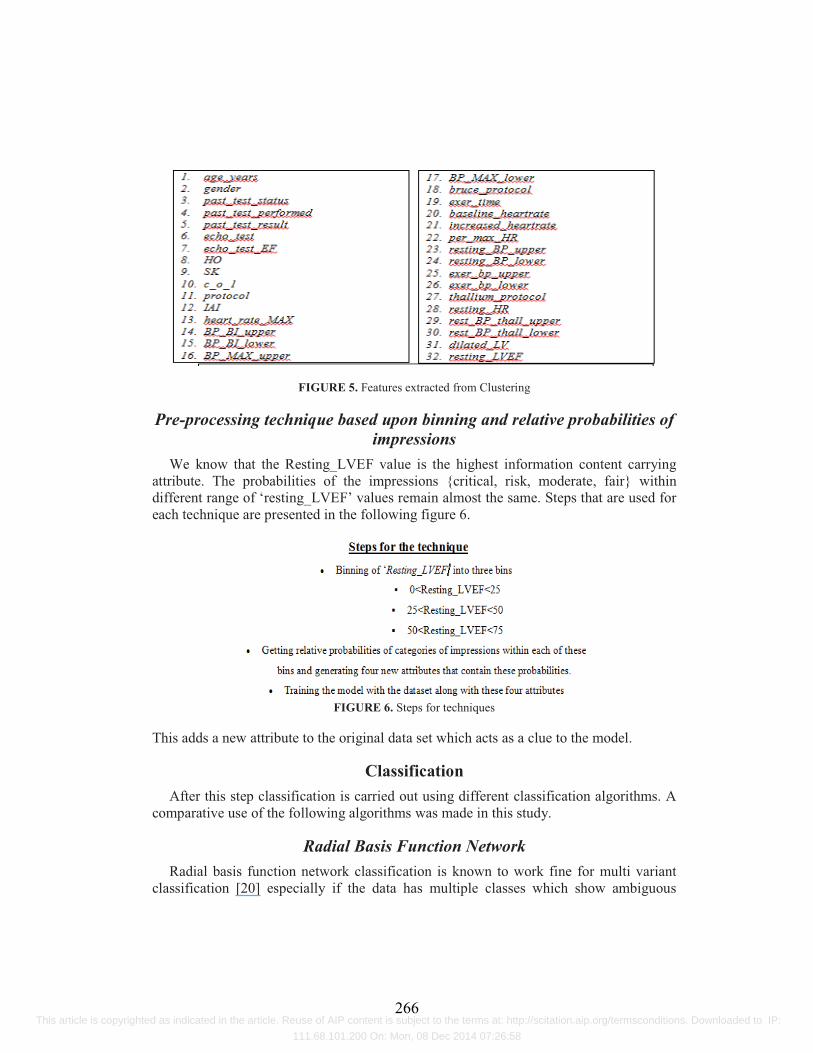
FIGURE 5. Features extracted from Clustering
Pre-processing technique based upon binning and relative probabilities of impressions
We know that the Resting_LVEF value is the highest information content carrying attribute. The probabilities of the impressions {critical, risk, moderate, fair} within different range of ‘resting_LVEF’ values remain almost the same. Steps that are used for each technique are presented in the following figure 6.
FIGURE 6. Steps for techniques
This adds a new attribute to the original data set which acts as a clue to the model.
Classification After this step classification is carried out using different classification algorithms. A
comparative use of the following algorithms was made in this study.
Radial Basis Function Network Radial basis function network classification is known to work fine for multi variant
classification [20] especially if the data has multiple classes which show ambiguous
266 This article is copyrighted as indicated in the article. Reuse of AIP content is subject to the terms at: http://scitation.aip.org/termsconditions. Downloaded to IP:
111.68.101.200 On: Mon, 08 Dec 2014 07:26:58
attribute trends for different classes. We have four classes of impressions in case of our data with classifiers coming from different medical procedure results and patient history. Many of these classifiers are totally uncorrelated.
Support Vector Machines using Polynomial Kernel Support Vector Machines is a well-known classification technique giving better
accuracy results in predicting the unknown classes. Techniques for feature selection and SVM parameters optimization are known to improve classification accuracy. The most common methods in writings for the optimization of the classification performance of SVMs are undertaking the misclassification consequence and kernel constraints, frequently by fine-tuning them composed.
Polynomial, Linear and RBF kernels are considered the most common kernels in literature work that acquired the best developments, where as there are other well-known kernels but have attained poor results [21].
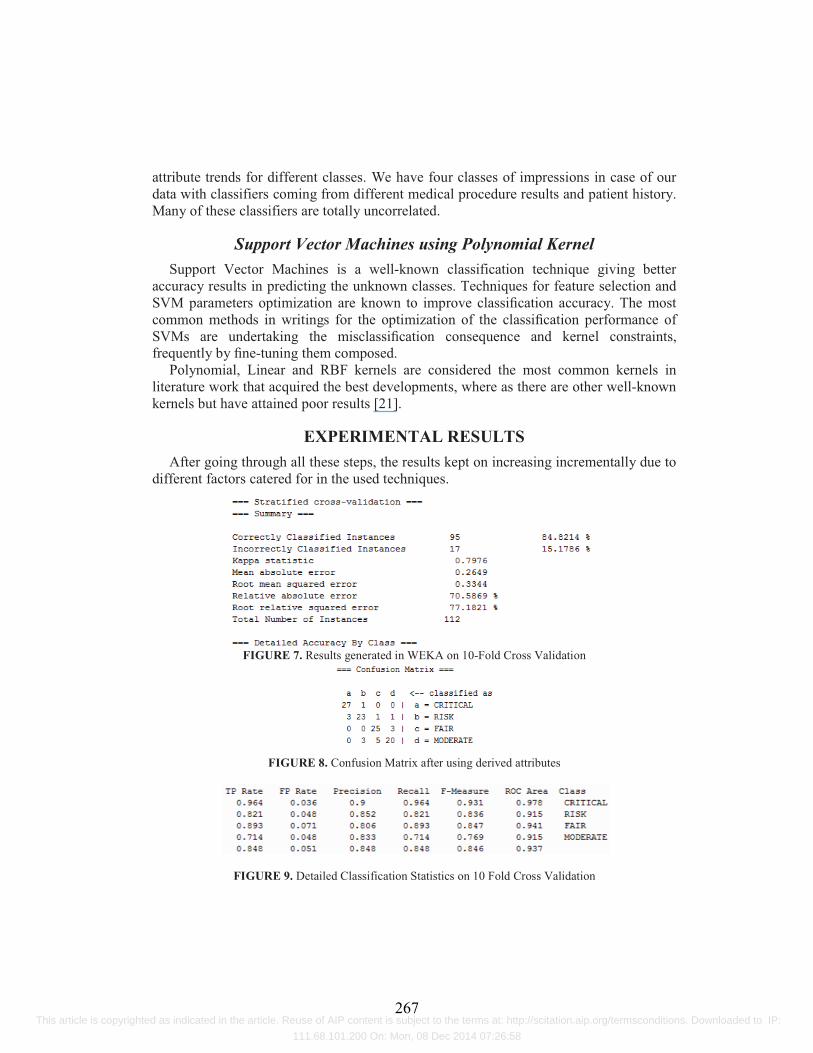
EXPERIMENTAL RESULTS After going through all these steps, the results kept on increasing incrementally due to
different factors catered for in the used techniques.
FIGURE 7. Results generated in WEKA on 10-Fold Cross Validation
FIGURE 8. Confusion Matrix after using derived attributes
FIGURE 9. Detailed Classification Statistics on 10 Fold Cross Validation
267 This article is copyrighted as indicated in the article. Reuse of AIP content is subject to the terms at: http://scitation.aip.org/termsconditions. Downloaded to IP:
111.68.101.200 On: Mon, 08 Dec 2014 07:26:58

Platform (Application Development) After we are done with the complete analysis and model building, we come to the
stage of building the Platform, which is the complete package for the utility of the intended user. This working unit aims to provide the cardiologist a complete facility to carry out the following tasks, 1. Record and manage the incoming patient data (historical, procedural) 2. Import/Export patient data for analysis 3. Perform exploratory analysis on the imported data (generating graphs and
visualizations like histograms, box plots, scatter plots etc) for aides in future studies and research
4. Perform classification and Predictive analysis on any incoming data using the built model
5. Generating Reports from the analysis and classifications carried out in the former step. Following are screen shots of the application.
CONCLUSION The main goal of data mining is to extract the hidden information from unstructured
and seemingly unknown data. The healthcare organizations such as hospitals have huge data that needs to be filtered out to be used in the development of better clinical procedures. The objective of this study was to develop a system for the efficient extraction, transformation and loading of such data from cardiac procedure reports given by Armed Forces Institute of Cardiology. It also aims to devise a model for the predictive analysis and classification of this data to some important classes.
We have analyzed the data and the built the classification model using Kernel Support Vector Machines using the Polynomial kernel.
This model was recreated in the .Net Application using the open source ‘Libsvm’ implementation [12]. The exploratory analysis done during the analysis stage was carried out in R language and WEKA and later during the development of the Exploratory Analysis Engine in the .Net Application, the RDotNet library was used to establish the communication between R packages and commands and .NET framework. After this Reporting of the stored patient data and results was done using SAP Crystal Reports.
This Application can prove to be of great help to different cardiologic studies and surveys; moreover it can be a step towards evolving better and more sophisticated biological data analysis tools. There are off the shelf tools in the market for data analysis over financial data, social sciences and images; biological data analysis or more commonly termed as bio-statistics haven’t evolved too much yet.
FUTURE WORK Four categories of patient impressions, which lie in the domain, can be further
expanded to many other features. These features together add up to form the particular impression. After the particular impression category is right fully predicted, further predictions within the category can be made employing different models.
268 This article is copyrighted as indicated in the article. Reuse of AIP content is subject to the terms at: http://scitation.aip.org/termsconditions. Downloaded to IP:
111.68.101.200 On: Mon, 08 Dec 2014 07:26:58

ACKNOWLEDGEMENTS We would like to acknowledge the Armed Forces of Institute of Cardiology, Pakistan,
for providing the medical datasets to carry out this research. We are thankful to Major General Shahab Naqvi, Commandant of E&ME College, Colonel Mohsin Sheikh, Head of Department (Nuclear Cardiology), AFIC and DrShoab Ahmed Khan of E&ME College for their support and guidance throughout the course of this study.
REFERENCES
1. Rao, R. B., Krishnan, S., &Niculescu, R. S. (2006), Data mining for improved cardiac care. ACM SIGKDD Explorations Newsletter, 8(1), 3-10.
2. Kajabadi, A., Saraee, M. H., &Asgari, S. (2009, October). Data mining cardiovascular risk factors.In Application of Information and Communication Technologies, 2009.AICT 2009. International Conference on (pp. 1-5). IEEE.
3. Nada Lavra_,(2012), Advances in Data Mining for Biomedical Research 4. M. K. Osman, F. Ahmad, Z. Saad, (2010), A Genetic Algorithm-Neural Network Approach for
Mycobacterium Tuberculosis Detection in Ziehl-Neelsen Stained Tissue Slide Images 5. �Ricardo Vig_ario, JaakkoS arela, HarriValpola, ErkkiOja, Biomedical Data Analysis 6. Wamiq M. Ahmed, (2008) Knowledge representation and data mining for biological imaging, Purdue
University Cytometry Laboratories, Bindley Bioscience Center, 1203 W. State Street, West Lafayette, IN 47907, USA.
7. Development of Multiscale Biological Image Data Analysis: Review of 2006 International Workshop on Multiscale Biological Imaging, Data Mining and Informatics, Santa Barbara, USA (BII06)
8. BiomedicalText Mining for Disease Gene Discovery, Sarah ElShal, Jesse Davis, Yves Moreau, EMBnet.Journal on 25/6/2013
9. J.J. Sychra, D.G. Pave1, E. Olea,(1988) , Classification Images Of Cardiac Wall Motion Abnormalities 10. R. Bharat Rao, Glenn Fung, BalajiKrishnapuram, (2010), Mining Medical Images 11. Fahim Sufi, Khalil.I., (2010),Diagnosis of Cardiovascular Abnormalities From Compressed ECG: A
Data Mining-Based Approach 12. Md. Rabiul Islam, Shamim Ahmad, Keikichi Hirose and Md. Khademul Islam Molla, (2010), Data
Adaptive Analysis of ECG Signals for Cardiovascular Disease Diagnosis 13. NurulHikmahKamaruddin, M.Murugappan, M o h a m m a d I q b a l O m a r , ( 2 0 1 2 ) , Early Prediction of
Cardiovascular Diseases U s i n g E C G s i g n a l : R e v i e w 14. R.BharatRao, Sriram Krishnan, Radu Stefan Niculescu, (2006), Data mining for improved cardiac care. 15. Palaniappan, S. &, Awang, R., “Intelligent heart disease predication system using data mining
technique”.IJCSNS International Journal of Computer Science and Network Security.Vol. 8, No. 8, 2008.
16. Rüdiger Wirth&JochenHipp, CRISP-DM: Towards a Standard Process Model for Data Mining. 17. Hauke, J., &Kossowski, T. (2011). Comparison of values of Pearson's and Spearman's correlation
coefficients on the same sets of data. 18. Ahmad Mirabadi, ShabnamSharifian, Application of association rules in Iranian Railways (RAI)
accident data analysis, Safety Science, Volume 48, Issue 10, December 2010, Pages 1427-1435, ISSN 0925-7535
19. PreetinderKaur, MadhuGoyal, and Jie Lu, (2013),Pricing Analysis in Online Auctions Using Clustering and Regression Tree Approach
20. Albrecht S, Busch J, Kloppenburg M, Metze F, Tavan P., (2000), Generalized radial basis function networks for classification and novelty detection: self-organization of optimal Bayesian decision.
21. Gaspar, P., Carbonell, J., & Oliveira, J. L. (2012).On the parameter optimization of Support Vector Machines for binary classification. Journal of Integrative Bioinformatics, 9(3), 201.
269 This article is copyrighted as indicated in the article. Reuse of AIP content is subject to the terms at: http://scitation.aip.org/termsconditions. Downloaded to IP:
111.68.101.200 On: Mon, 08 Dec 2014 07:26:58
Copyright © 2022 FDOKUMEN