Fetal cardiac signal extraction from magnetocardiographic data using a probabilistic algorithm
12
Signal Processing 87 (2007) 1993–2004 Fetal cardiac signal extraction from magnetocardiographic data using a probabilistic algorithm Kenneth E. Hild II a , Hagai T. Attias b , Silvia Comani c,d , Srikantan S. Nagarajan a, a Department of Radiology, University of California at San Francisco, CA 94122, USA b Golden Metallic, Inc., San Francisco, CA 94147, USA c Institute of Advanced Biomedical Technologies, University Foundation G. D’Annunzio, Chieti, Italy d Department of Clinical Sciences and Bio-imaging, Chieti University, Chieti, Italy Received 1 August 2006; received in revised form 12 February 2007; accepted 13 February 2007 Available online 1 March 2007 Abstract Fetal magnetocardiographic sensor measurements are contaminated by undesired environmental and biological signals, such as the maternal cardiac signal. Several methods have been used in an attempt to extract the fetal cardiac signal from these data, which are based on, e.g., the presumed quasi-periodicity of the maternal cardiac signal or the presumed statistical independence between the fetal cardiac signal and interfering signals. Recently a different type of method for extracting signals from noisy data has been introduced. This probabilistic method, known as partitioned factor analysis (PFA), assumes that the data can be partitioned into periods of source inactivity and source activity. PFA was originally developed for stimulus-evoked, trial-averaged encephalographic data, for which the partitions are known in advance. Here we show how to use PFA for extracting the fetal cardiac signal from cardiographic data, for which the partitions must be determined from the data. In addition, we show that PFA can be used even when the partitions cannot be determined directly from the data. r 2007 Elsevier B.V. All rights reserved. Keywords: Independent components analysis; Fetal MCG; Denoising; Interference rejection 1. Introduction Fetal magnetocardiographic (fMCG) sensor data are a measure of the magnetic field collected at locations slightly above the maternal abdomen. The well-being of the fetus is commonly assessed by studying the morphology of the fetal cardiac signal, which is obtained from fMCG data [1–5]. The fMCG data contain a mixture of signals, which include the (desired) fetal cardiac signal, the (undesired) maternal cardiac signal, movement artifacts, sensor noise, and additional biological signals not related to the fetal heart. The magnetic fields generated by the fetal and maternal cardiac signals are a result of atrial and ventricular depolarization and repolarization of the two hearts. The combination of depolarization and repolariza- tion produce the familiar PQRST waveform. The maternal cardiac signal, as it appears in the sensors, ARTICLE IN PRESS www.elsevier.com/locate/sigpro 0165-1684/$ - see front matter r 2007 Elsevier B.V. All rights reserved. doi:10.1016/j.sigpro.2007.02.005 Corresponding author. Tel.: +1 415 476 4982; fax: +1 415 476 4302. E-mail addresses: [email protected] (K.E. Hild II), [email protected] (H.T. Attias), [email protected] (S. Comani), [email protected] (S.S. Nagarajan). URL: http://www.bil.ucsf.edu (S.S. Nagarajan).
-
Upload
independent -
Category
Documents
-
view
5 -
download
0
Transcript of Fetal cardiac signal extraction from magnetocardiographic data using a probabilistic algorithm
ARTICLE IN PRESS
0165-1684/$ - se
doi:10.1016/j.si
�Correspondfax: +1415 476
E-mail addr
htattias@golde
srikantan.nagar
URL: http:/
Signal Processing 87 (2007) 1993–2004
www.elsevier.com/locate/sigpro
Fetal cardiac signal extraction from magnetocardiographic datausing a probabilistic algorithm
Kenneth E. Hild IIa, Hagai T. Attiasb, Silvia Comanic,d, Srikantan S. Nagarajana,�
aDepartment of Radiology, University of California at San Francisco, CA 94122, USAbGolden Metallic, Inc., San Francisco, CA 94147, USA
cInstitute of Advanced Biomedical Technologies, University Foundation G. D’Annunzio, Chieti, ItalydDepartment of Clinical Sciences and Bio-imaging, Chieti University, Chieti, Italy
Received 1 August 2006; received in revised form 12 February 2007; accepted 13 February 2007
Available online 1 March 2007
Abstract
Fetal magnetocardiographic sensor measurements are contaminated by undesired environmental and biological signals,
such as the maternal cardiac signal. Several methods have been used in an attempt to extract the fetal cardiac signal from
these data, which are based on, e.g., the presumed quasi-periodicity of the maternal cardiac signal or the presumed
statistical independence between the fetal cardiac signal and interfering signals. Recently a different type of method for
extracting signals from noisy data has been introduced. This probabilistic method, known as partitioned factor analysis
(PFA), assumes that the data can be partitioned into periods of source inactivity and source activity. PFA was originally
developed for stimulus-evoked, trial-averaged encephalographic data, for which the partitions are known in advance. Here
we show how to use PFA for extracting the fetal cardiac signal from cardiographic data, for which the partitions must be
determined from the data. In addition, we show that PFA can be used even when the partitions cannot be determined
directly from the data.
r 2007 Elsevier B.V. All rights reserved.
Keywords: Independent components analysis; Fetal MCG; Denoising; Interference rejection
1. Introduction
Fetal magnetocardiographic (fMCG) sensor dataare a measure of the magnetic field collected atlocations slightly above the maternal abdomen. Thewell-being of the fetus is commonly assessed by
e front matter r 2007 Elsevier B.V. All rights reserved
gpro.2007.02.005
ing author. Tel.: +1415 476 4982;
4302.
esses: [email protected] (K.E. Hild II),
nmetallic.com (H.T. Attias),
nich.it (S. Comani),
[email protected] (S.S. Nagarajan).
/www.bil.ucsf.edu (S.S. Nagarajan).
studying the morphology of the fetal cardiac signal,which is obtained from fMCG data [1–5]. ThefMCG data contain a mixture of signals, whichinclude the (desired) fetal cardiac signal, the(undesired) maternal cardiac signal, movementartifacts, sensor noise, and additional biologicalsignals not related to the fetal heart. The magneticfields generated by the fetal and maternal cardiacsignals are a result of atrial and ventriculardepolarization and repolarization of the two hearts.The combination of depolarization and repolariza-tion produce the familiar PQRST waveform. Thematernal cardiac signal, as it appears in the sensors,
.

ARTICLE IN PRESSK.E. Hild II et al. / Signal Processing 87 (2007) 1993–20041994
is usually much larger than the fetal cardiac signal.Hence, the removal of the maternal cardiac signalfrom fMCG data is an important part of fetalcardiac signal extraction.
The goal of signal extraction is to estimate thesignal subspace from the data (we allow a ‘‘signal’’to be multiple-dimensional, whereas a ‘‘source’’ isalways one-dimensional). A closely related goal is toremove as much energy of the undesired signalsfrom the data as possible. One approach used fordenoising/interference rejection is to project thesignal subspace back into the space of the sensors,which has the effect of removing all noise/inter-ference that does not appear in the signal subspace.We recently introduced a method that can be usedfor either signal extraction or denoising. We refer tothis method as partitioned factor analysis (PFA)[6,7].
The PFA algorithm was originally designed forstimulus-evoked encephalographic data, i.e., forelectroencephalographic (EEG) and magnetoence-phalographic (MEG) data [6]. All the model para-meters are inferred from the data using variationalBayesian expectation-maximization (VB-EM) [8].The major premise of PFA is that the data can bedivided into two partitions, where the first partitioncorresponds to the instances in time where the signalof interest has very low energy relative to the energyof the signal in the second partition. In keeping withpreviously used terminology we refer to these twopartitions as the inactive and active partitions,respectively, even though the brain is never trulyinactive (nor is the heart). The data are recorded fornumerous trials, where each trial corresponds to asingle presentation of the stimulus. The data arethen averaged over trials after aligning each trialaccording to the timing of the stimulus. Theaveraging has the effect of emphasizing the signalsthat are phase-locked to the stimulus (the evokedsignals) and, likewise, de-emphasizing all othersignals. Hence, supposing that the evoked signal isthe signal of interest, the natural partitions forstimulus-evoked, trial-averaged data are the pre-stimulus and post-stimulus periods.
Another type of data that can be partitioned asabove is cardiographic data, which includes datafrom either an electrocardiogram (ECG/EKG) ormagnetocardiogram (MCG). Most of the energy ofthe (clean) cardiac signal is contained in the QRScomplexes and the amplitude of the cardiac signalbetween successive QRS complexes is relatively low.To apply PFA to cardiographic data the inactive
window should be a concatenation of smallwindows, where each small window consists of databetween successive QRS complexes. Likewise, theactive window should be either a contiguous sectionof the data that is large enough to include (at aminimum) several QRS complexes or it should be aconcatenation of multiple small windows, whereeach small window consists of an individual QRScomplex. The signal-to-noise ratio (SNR) of ECGdata is oftentimes satisfactory without the need fordenoising. However, the SNR of the fetal cardiacsignal collected from a non-invasive, trans-abdom-inal cardiogram is low enough to warrant denoising.For young gestational ages the fetal cardiac signal isvery small so that the (fetal) QRS complexes are notvisible in either fECG or fMCG data. For oldergestational ages the quality of the fetal cardiacsignal from fECG is poor due to the insulatingproperties of the vernix caseosa [9–11]. The fMCGis not sensitive to the vernix caseosa. However, theSNR for fMCG data is still poor due to the presenceof interfering signals including the maternal cardiacsignal, which overlaps with the fetal cardiac signalboth temporally (simultaneous ventricular depolar-ization is not uncommon) and spectrally. The PFAmethod was originally conceived to be used whenthe partitions are known or can be easily determinedfrom data. At first glance it would appear that, forcardiographic data, valid partitions can only beobtained if the fetal QRS complexes are visible. Itturns out that PFA does not require that the fetalQRS complexes are visible, as we show later.
There are several notable differences between theencephalographic data for which PFA was origin-ally designed and the cardiographic data used here.The MEG data used previously is stimulus-evokedand averaged over trials, whereas here we use onlynon-averaged, non-evoked, single-trial MCG data.For the MCG data the formation of the inactivewindow (and sometimes the active window) requiresconcatenation of multiple small windows whoselocations must be determined from the data,whereas this is not required for the MEG data.The inactive and active partitions do not overlap forthe MEG data, whereas we allow overlap of thepartitions for the MCG data. Another differencebetween the present paper and the previous PFApaper [6] is that the latter focuses on the ability ofthe method to estimate the model order. Our goalsin the present paper, which expands the results ofthe conference paper [7], are to modify the PFAalgorithm so that it can be applied to cardiographic
ARTICLE IN PRESSK.E. Hild II et al. / Signal Processing 87 (2007) 1993–2004 1995
data, to show how well it works for this type ofdata, and to show that PFA can be used even whenit is not apparent how the data should bepartitioned.
2. Partitioned factor analysis
Most of the differences between using PFA forstimulus-evoked MEG data and single-trial MCGdata are related to practical issues, such asdetermining the proper inactive and active parti-tions. The main difference in the PFA equations forthe two types of data is that the time indices must bechanged for MCG data, as explained below. Thegenerative model and criterion for PFA are includedhere for sake of convenience.
2.1. Generative model
The PFA method assumes the observations arecreated from a linear instantaneous mixture of threetypes of signals,
yn ¼Bun þ vn; n ¼ 1; . . . ;N0 � 1;
Axn þ Bun þ vn; n ¼ N0; . . . ;N;
((1)
where yn is the ðMy � 1Þ vector of observations attime n. In this equation we have simplified thenotation by assuming that the data are ordered suchthat n 2 1; . . . ;N0 � 1 corresponds to the concate-nation of all inactive partitions and that n 2
N0; . . . ;N corresponds to the active partition (orthe concatenation of all active partitions). The threetypes of signals for cardiographic data are thecardiac signal, the interfering signals, and the sensornoise. These three signals are represented by theðMx � 1Þ vector xn, the ðMu � 1Þ vector un, and theðMy � 1Þ vector vn, respectively. The cardiac signalrepresents the collection of all factors, where eachfactor is a single-dimensional waveform that hasmost of its energy concentrated in the activepartition and each corresponds to one of the axesof the signal subspace (using ICA terminology, thevector of Mx factors are an arbitrary, invertiblemixture of the Mx sources of interest). Theinterfering signals consist of all signals that arespatially correlated in sensor space and exist in bothpartitions. The sensor noise represents all signalsthat are spatially uncorrelated in sensor space andexist in both partitions. The inclusion of theinterference signals in (1) allow us to model signalsof no interest that, unlike the model commonly used
for sensor noise, are spatially correlated in sensorspace, e.g., neural signals, respiration, muscleartifacts, and all externally generated magneticfields.
Each factor xm;n and each interference um;n ismodeled as having a Gaussian probability densityfunction (pdf) with zero mean and unit precision,where the precision is defined as the inverse varianceand xm;n and um;n are the mth element of vectors xn
and un, respectively. Likewise, the noise at sensor m
is modeled as having a Gaussian pdf with zero meanand precision lm. We model the factors, interfer-ences, and noises as mutually statistically indepen-dent so that pðxn; un; vnÞ ¼ pðxnÞpðunÞpðvnÞ and,
pðxnÞ ¼YMx
m¼1
pðxm;nÞ ¼Nðxnj0; IÞ,
pðunÞ ¼YMu
m¼1
pðum;nÞ ¼Nðunj0; IÞ,
pðvnÞ ¼YMy
m¼1
pðvm;nÞ ¼Nðvnj0; kÞ, ð2Þ
where Nðxnjl;PÞ indicates that vector xn has anormal distribution with mean vector l andprecision matrix P, 0 is a column vector of zeros,I is an identity matrix, and k is a diagonal matrixthat contains the collection of all lm. By inspectionthe data likelihood is
pðynjxn; un;A;BÞ
¼NðynjBun; kÞ; n ¼ 1; . . . ;N0 � 1;
NðynjAxn þ Bun; kÞ; n ¼ N0; . . . ;N:
(ð3Þ
We assume that the signals are temporally i.i.d. sothat
pðxÞ ¼YN
n¼N0
pðxnÞ,
pðuÞ ¼YNn¼1
pðunÞ,
pðvÞ ¼YNn¼1
pðvnÞ,
pðyjx; u;A;BÞ ¼YNn¼1
pðynjxn; un;A;BÞ. ð4Þ
We also assume the elements of both mixingmatrices are independent zero-mean Gaussians thathave a precision that is proportional to the noise

ARTICLE IN PRESSK.E. Hild II et al. / Signal Processing 87 (2007) 1993–20041996
precision of the corresponding sensor
pðAÞ ¼YMy
m¼1
YMx
k¼1
NðAm;kj0; lmakÞ,
pðBÞ ¼YMy
m¼1
YMu
k¼1
NðBm;kj0; lmbkÞ, ð5Þ
where the proportionality constants, ak;bk, arereferred to as hyperparameters. These priors arechosen so that they have the same functional formas the posterior distribution (when this is true theprior is referred to as a conjugate prior).
2.2. Criterion
The criterion for standard EM optimization is thelog (marginal) likelihood, which can be written as
log pðyÞ ¼ log pðyÞ
ZpðhjyÞdh
¼
ZpðhjyÞ log
pðh; yÞ
pðhjyÞdh, ð6Þ
where h ¼ fx; u;A;Bg. Since the exact posteriordistribution is computationally intractable for thePFA model, we approximate the posterior with afunction that factorizes
pðhjyÞ � qðhjyÞ. (7)
The distribution qðhjyÞ is chosen such that itfactorizes the hidden variables from the parameters(given the data)
qðhjyÞ ¼ qðx; ujyÞqðA;BjyÞ. (8)
The consequence of introducing this factorizationis that the criterion is no longer equal to thelikelihood. The end result is that the PFA criterionis an approximation of the log likelihood, which isgiven by
F ¼
Zqðx; ujyÞqðA;BjyÞ
� logpðx; u;A;B; yÞ
qðx; ujyÞqðA;BjyÞdxdudAdB. ð9Þ
The VB-EM optimization method adapts qðx; ujyÞand qðA;BjyÞ to maximize F. It is trivial to showthat maximizing F with respect to the twodistributions that comprise qðhjyÞ is equivalent tominimizing the Kullback–Leibler divergence [12]between pðhjyÞ and qðhjyÞ.
Once both distributions are estimated then thetwo posterior means of interest may be found using
x ¼
Zx
Zqðx; ujyÞdu dx,
A ¼
ZA
ZqðA;BjyÞdB dA. ð10Þ
Since qðx; ujyÞ and qðA;BjyÞ are both Gaussian forthe PFA model, alternative expressions for x and Aare, respectively, the solutions to
dR
qðx; ujyÞdu� �
dx¼ 0,
dR
qðA;BjyÞdB� �
dA¼ 0. ð11Þ
Once x and A have been calculated, the extractedcardiac signal is given by the vector xn and thedenoised signals are given by yn ¼ Axn.
Like standard EM the VB-EM optimizationmethod is an iterative algorithm where eachiteration is composed of an E-step and an M-step.The posterior over hidden variables, qðx; ujyÞ, isadapted in the E-step and the posterior overparameters, qðA;BjyÞ, is adapted in the M-step.
2.3. E-Step
Maximization of F with respect to the posteriorover hidden variables is accomplished by setting thederivative of F to zero and solving for qðx; ujyÞwhile keeping qðA;BjyÞ fixed. This produces,
qðx; ujyÞ ¼1
z1exp
ZqðA;BjyÞ
�
� log pðx; u;A;B; yÞdAdB
�, ð12Þ
where the joint pdf, due to the assumptions made inthe PFA model, simplifies to
pðx; u;A;B; yÞ ¼ pðyjx; u;A;BÞpðxÞpðuÞpðAÞpðBÞ
(13)
and where z1 is the normalizing constant thatensures that the distribution integrates to one(normalization of the posterior over hidden vari-ables and the posterior over parameters is enforcedby adding two Lagrange multipliers to F). Thequantities in Eq. (13) are given by Eqs. (2)–(5).

ARTICLE IN PRESSK.E. Hild II et al. / Signal Processing 87 (2007) 1993–2004 1997
The posterior over hidden variables factorizesover time so that
qðx; ujyÞ ¼YN0�1
n¼1
qðunjynÞYN
n¼N0
qðxn; unjynÞ, (14)
where
qðunjynÞ ¼Nðunjun;U�1Þ,
qðxn; unjynÞ ¼Nxn
un
" #xn
un
" #;C�1
����� !
. ð15Þ
For the inactive period it can be shown that
un ¼ UBTkyn,
U ¼ ðBTkB þ I þMyWBBÞ
�1ð16Þ
and for the active period
xn ¼ ðCxxATþ CxuB
TÞkyn,
un ¼ ðCTxuA
Tþ CuuB
TÞkyn,
C ¼A
T
BT
" #k½AB� þ I þMyW
!�1
¼
Cxx Cxu
CTxu Cuu
" #, ð17Þ
where A; B; k;W are computed in the M-step.
2.4. M-Step
Similarly, maximization of F with respect to theposterior over parameters is accomplished bysetting the derivative of F to zero and solving forqðA;BjyÞ while keeping qðx; ujyÞ fixed. This pro-duces
qðA;BjyÞ ¼1
z2exp
Zqðx; ujyÞ
�
� log pðx; u;A;B; yÞdAdB
�, ð18Þ
where z2 is the normalizing constant.It follows from Eq. (15) that the posterior over
parameters factorizes over the rows of the twomixing matrices, whereas the columns of each arecorrelated. Hence, the posterior over each row isGaussian so that
qðA;BjyÞ ¼YMy
m¼1
NAT
m
BTm
" #�����A
T
m
BT
m
24
35; lmW�1
0@
1A, (19)
where Am is the mth row of A and
A ¼XN
n¼N0
ynxTn
0@
1AWAA,
B ¼XN
n¼1
ynuTn
!WBB,
W ¼Rxx þ a Rxu
RTxu Ruu þ b
" #�1,
¼
WAA WAB
WTAB WBB
" #,
Rxx ¼XN
n¼N0
ðxnxTn þ CxxÞ,
Rxu ¼XN
n¼N0
ðxnuTn þ CxuÞ,
Ruu ¼XN0�1
n¼1
ðunuTn þUÞ þ
XN
n¼N0
ðunuTn þ CuuÞ ð20Þ
and a; b are diagonal matrices that contain thehyperparameters, ak;bk, respectively.
The solutions for the noise precision matrix andthe hyperparameters are found by computing thederivative of F and equating the result with zero.The solutions are
a�1 ¼ diag1
My
ATkAþWAA
� �,
b�1 ¼ diag1
My
BTkB þWBB
� �,
k�1 ¼1
NdiagðRyy � ART
yx � BRTyuÞ, ð21Þ
where
Ryy ¼XN
n¼1
ynyTn ,
Ryx ¼XN
n¼N0
ynxTn ,
Ryu ¼XN
n¼1
ynuTn . ð22Þ

ARTICLE IN PRESSK.E. Hild II et al. / Signal Processing 87 (2007) 1993–20041998
3. Other approaches
The PFA method uses an adaptive (linear) spatialfilter for extracting the signal of interest. Othersignal extraction/denoising methods that use aspatial filter include principal components analysis(PCA) [13–16] and independent components analy-sis (ICA) [17–23]. Popular approaches that are notbased on a (linear) spatial filter include trialaveraging [24], temporal filtering, and the adaptivematernal beat subtraction (AMBS) method [25].
PCA, which was used as early as 1987 for fetalcardiac signal extraction [32], is the most widely usedmethod of signal extraction/denoising. It is an idealchoice for fetal cardiographic data when either thepower of the fetal cardiac signal is large relative to thepower of all undesired signals or when all theundesired signals are spatially uncorrelated andisotropic in sensor space [26]. ICA is ideal when thefetal cardiac signal is statistically independent of allundesired signals, there are at least as many sensors assources (desired and undesired), and the subspace thatcontains the fetal cardiac signal can be robustlydetermined from the source estimates either auto-matically or with the aid of a human expert [27]. Trialaveraging is ideal in the limit as the number of fetalQRS complexes approaches infinity if the locations ofall fetal QRS complexes are known, the morphologyof each QRS complex is identical (which requires, atthe very minimum, that neither the fetus nor themother moves during the acquisition), and if none ofthe undesired signals are phase-locked to the fetalQRS complexes. Temporal filtering is ideal if there isno overlap in the frequency domain between the fetalcardiac signal and all undesired signals and assumingperfect brick-wall filters are used. AMBS, which findsand then subtracts the average maternal cardiac signalfrom the data, is ideal for removing the maternalcardiac signal if the locations of all the maternal QRScomplexes are known and the morphology of each(maternal) QRS complex is identical (requiring that,at the very minimum, the mother does not moveduring acquisition). By contrast, PFA is ideal whenthe data can be partitioned into two partitions suchthat all of the energy of the fetal cardiac signal iscontained in one partition and the second-orderstatistics of the undesired signals are identical betweenthe two partitions.
The PFA model is more complete than what isimplicitly assumed in PCA and in the vast majority ofICA algorithms, which combine xn and un into asingle vector and assume that vn is zero. PFA also
takes into account, in a principled fashion, theinformation of the data partition, whereas this is notdone in any of the other methods mentioned above.The first condition required for PFA to be ideal isapproximately met—the energy of the cardiac signalbetween successive QRS complexes is much less thanthe energy of the QRS complex. The second condi-tion, which is related to the statistical stationarity ofthe interference and noise, is reasonable if the twopartitions are (temporally) near each other and thephysical locations of the active biological and externalinterferences change slowly in time. The performanceof the PFA method is also sensitive to fetal move-ments, as are all methods based on a spatial filter.
4. Results
Only real data are used in this paper thus limitingthe type of performance evaluations that are possible.Evaluation of PFA is based on using the true positiveand false positive rates, which requires knowledge ofthe true locations of the QRS complexes. Thedetermination of the true locations of the QRScomplexes is based on visual inspection of the dataand takes into account the expectation that thematernal and fetal instantaneous heart rate changesslowly over time. Determination of true and falsepositives also requires that the data are discretized intime. For this purpose we use a single window centeredat each true QRS location, to which we assign a valueof zk ¼ 1. Likewise, we use five contiguous (non-overlapping) windows between each true positive, towhich we assign a value of zk ¼ 0. The lengths of thewindows are divided evenly between the six windowsassociated with a single RR interval. Hence, forpurposes of measuring the true and false positiverates, the data are downsampled to six ‘‘data points’’for each true QRS complex. For a given denoisingmethod the estimate of each ‘‘data point’’, zk, isassigned a value of one if the maximum signal over allsensors and all time instances within the associatedwindow surpasses the threshold. Otherwise it isassigned a value of zero. The polarity of the QRScomplex is also taken into account in the expectedmanner in order to increase robustness. This process isgiven mathematically as follows:
zk ¼
1 if max ym;nXt
ðfor m ¼ 1; . . . ;M; n 2 NkÞ;
0 if max ym;not
ðfor m ¼ 1; . . . ;M; n 2 NkÞ;
8>>>><>>>>:
(23)
ARTICLE IN PRESS
0 1 2 3 4 5
−0.5
0
0.5
0 1 2 3 4 5
−0.5
0
0.5
Am
plitu
de (
pT)
Am
plitu
de (
pT)
Time (sec)
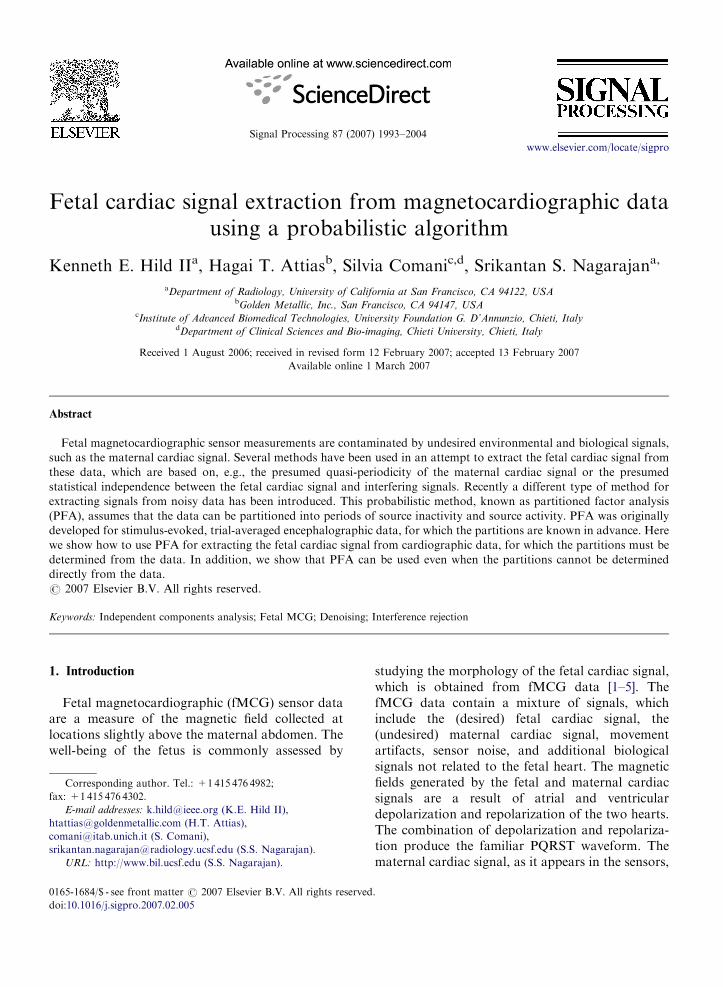
Fig. 1. Fetal MCG data at 23 weeks gestation for a representa-
tive sensor. The upper plot shows the raw data and the lower plot
shows the data after PFA denoising.
K.E. Hild II et al. / Signal Processing 87 (2007) 1993–2004 1999
where it is assumed that the QRS complex ispredominantly positive, t is the threshold ðt40Þ,and Nk is the window of time associated with thekth data point. In the case that the QRS complex ispredominantly negative the inequalities in theequation above need to be reversed and the thresh-old takes a negative value ðto0Þ.
Results are reported from a total of six data sets.Five of these are from the same healthy subject,which has a normal singleton pregnancy. The fivedata sets corresponding to this subject werecollected at gestational ages of 21, 23, 30, 34, and37 weeks. These data were collected for a durationof 4min at a sampling rate of 520.8Hz using 37channels of a 74-channel, axial Magnes Biomagnet-ometer made by Biomagnetic Technologies, Inc.(BTi—which has since changed names to four-dimensional Neuroimaging). The sixth data setinvolves a patient whose fetus has been diagnosedwith heart blockage. This data set was collected fora duration of 2min at a sampling rate of 600Hzusing a 275-channel, axial CTF Omega 2000 MEGsystem made by VSM MedTech Ltd.
For three of the five data sets associated with thehealthy subject (23, 34, and 37 weeks gestation) thesize of the inactive and active partitions is 0.4 and0.2 s, respectively, which represents 0.2% and 0.1%of the data. Both partitions represent the concate-nations of two equal-length windows. There is nooverlap between the two partitions. For the healthysubject at 30 weeks gestation the inactive and activewindows are of length 2.8 and 1.4 s, respectively(which represents 1.4% and 0.7% of the data). Eachof these two partitions are constructed from sevenpairs of equal-length windows (each pair comesfrom adjacent RR intervals), where the seven pairsof windows are evenly spaced (in time) throughoutthe entire data set. Once again there is no overlapbetween the two partitions. The reason for usinglarger partitions for this data set is given below. The(overlapping) inactive and active partitions used forthe healthy subject at 21 weeks gestation are oflength 0.38 and 3.8 s, respectively (representing0.16% and 1.6% of the data). Additional detailsfor this data set are given below. For the heartblockdata set the inactive and active partitions are oflength 2.3 and 6.7 s, respectively (representing 2%and 6% of the data). The inactive partition is aconcatenation of four equal-length windows,whereas the active partition is a single window thatcontains the entire inactive partition. TDSEP,AMBS, PCA, and the Raw Data, on the other
hand, use 100% of the data for parameter training.PFA can use all of the data, although doing soincreases the amount of computation time. Allmethods assume that the fetal cardiac signal iscomprised of Mx ¼ 2 sources (Mx ¼ 1 is used forTDSEP whenever there is only a single sourceestimate that resembles a fetal cardiac signal). ForPFA the number of interference sources is assumedto be Mu ¼ 20 and all partitions are determinedmanually.
For most of the results reported here TDSEP [28]was selected to represent the ICA method. In pre-vious experiments another ICA algorithm, FastICA[29], outperformed TDSEP for fetal cardiac signalextraction [30]. However, in a different set ofexperiments TDSEP outperformed FastICA forneural evoked-stimulus data [7]. We chose TDSEPbecause, without dimension reduction, it requiresroughly the same amount of time to produce asolution as the other methods considered in thispaper. FastICA is very fast when the number ofsensors is small, but it is several orders of magnitudeslower than TDSEP for the data sets used here. Wedo use FastICA on several occasions, but only afterreducing the dimensionality using PCA.
Figs. 1–4 use the data from the healthy subject.These figures show a short segment of the fMCGdata for a representative channel. The top portionof each figure shows the original fMCG data, ym;n,and the lower portion of each figure shows the dataafter they have been cleaned by PFA, ym;n. Figs. 1,2, 3, and 4 correspond to 23, 30, 34, and 37 weeksgestational age, respectively. The maternal and fetalQRS complexes can be recognized by keeping in

ARTICLE IN PRESS
0 1 2 3 4 5−1
0
1
Am
plitu
de (
pT)
Am
plitu
de (
pT)
Time (sec)
0 1 2 3 4 5−1
0
1
Fig. 2. Fetal MCG data at 30 weeks gestation for a representa-
tive sensor. The upper plot shows the raw data and the lower plot
shows the data after PFA denoising.
0 1 2 3 4 5−1
0
1
Am
plitu
de (
pT)
Am
plitu
de (
pT)
0 1 2 3 4 5−1
0
1
Time (sec)
Fig. 3. Fetal MCG data at 34 weeks gestation for a representa-
tive sensor. The upper plot shows the raw data and the lower plot
shows the data after PFA denoising.
0 1 2 3 4 5
−1
0
1
Am
plitu
de (
pT)
Am
plitu
de (
pT)
Time (sec)
0 1 2 3 4 5
−1
0
1
Fig. 4. Fetal MCG data at 37 weeks gestation for a representa-
tive sensor. The upper plot shows the raw data and the lower plot
shows the data after PFA denoising.
−0.5 0 0.5−1
−0.5
0
0.5
1
1.5
2
2.5
3
Time (sec)
Mag
netic
Fie
ld (
pT)
FICA (10)PFA
TDSEP
PCARaw Data
AMBS
Fig. 5. Mean PQRST waveforms computed after denoising is
applied. The parenthetical entries indicate that the dimensionality
was reduced to the indicated value prior to denoising.
K.E. Hild II et al. / Signal Processing 87 (2007) 1993–20042000
mind that the polarity and general shape of the QRScomplexes of both the maternal and fetal cardiacsignals do not change significantly during the 5.5 sinterval shown in each figure. For these four figuresthe fetal heart rate is between 58% and 113% fasterthan the maternal heart rate. Notice that there isextensive temporal overlap of the maternal and fetalQRS complexes in Figs. 1 and 2. In all four cases thedenoised data have visibly less variance betweensuccessive QRS complexes and there is very littlecontamination from the maternal cardiac signal.
Fig. 5 shows the mean fetal PQRST complex forthe heartblock data set. The mean waveform, shownfor a single representative sensor, is found after
PFA denoising is applied. Also shown in the figureare the mean waveforms for AMBS, TDSEP (withand without dimension reduction), FastICA (withdimension reduction), PCA, and the original data.Dimension reduction (to a dimension of 10) wasperformed for the ICA methods using PCA. Themean PQRST waveforms and the location of the Twave for all methods except AMBS are very similarto the results of the averaged (raw) data. Thewaveforms for all methods are noticeably smootherthan for AMBS. The AMBS mean waveform issomewhat distorted because the maternal QRScomplex changes shape over the length of the dataset, which violates one of the assumptions of

ARTICLE IN PRESSK.E. Hild II et al. / Signal Processing 87 (2007) 1993–2004 2001
AMBS. On the other hand, the AMBS method isthe only method that contains what may be a Pwave. It should be noted that similarity in the shapeof the mean PQRST waveform does not imply thatthe denoising methods produce similar instanta-neous (non-averaged) denoised signals, which aremuch more important than the mean for diagnosticpurposes. Indeed, the instantaneous denoised sig-nals vary significantly from one method to the next.This plot is only included to show the largedifference, which is manifested both with andwithout averaging, between the AMBS result andall other results. Fig. 6 shows a more properassessment of the performance of the different
0 0.25 0.5 0.75 10
0.25
0.5
0.75
1
Tru
e Po
sitiv
e R
ate
0 0.25 0.5 0.75 10
0.25
0.5
0.75
1
Tru
e Po
sitiv
e R
ate
0 0.25 0.5 0.75 10
0.25
0.5
0.75
1
Tru
e Po
sitiv
e R
ate
0 0.25 0.5 0.75 10
0.25
0.5
0.75
1
False Positive Rate
Tru
e Po
sitiv
e R
ate
0 0.1 0.2
0.8
0.9
1
Raw DataAMBS
TDSEP
PFA
PCA
0 0.1 0.2
1TDSEP
PFA
PCAAMBS Raw Data
0.8
0.9
0 0.1 0.2
0.8
0.9
1
PFA,TDSEP
PCA
AMBS
Raw Data
False Positive Rate
0 0.1 0.2
0.8
0.9
1
Raw Data
AMBS
PFA
PCA
TDSEP
Fig. 6. True positive rate versus false positive rate (for fetal QRS
complexes). From top to bottom the plots represent fMCG data
at 23, 30, 34, and 37 weeks gestation, respectively. The right
column shows a close-up of the left column results.
denoising methods since it is based on the instanta-neous (non-averaged) signal estimates.
Fig. 6 shows the ROC curves pertaining to thehealthy subject for gestational ages of 23, 30, 34,and 37 weeks in rows 1, 2, 3, and 4, respectively.Results are shown for PFA, TDSEP, AMBS, PCA,and the raw data. The ROC curves are created byvarying the threshold in (23). The left column showsthe entire ROC curve and the right column shows aclose-up of the top left portion of each ROC curve.Two results are shown for PFA for 30 weeksgestation. The solid line shows the original results,which are based on the originally chosen partitions.The dotted line shows the results when the largerpartition is used (as described above). The need fora larger partition for this particular data set isexplained in the discussion section. The results forPFA for 37 weeks gestation are perfect, whereas theresults for TDSEP for this data set are nearlyperfect. PFA outperforms the other methods onthree of the four data sets. It also performs as wellor better than any of the other methods for thefourth data set (30 weeks gestation) when the largerpartition is used.
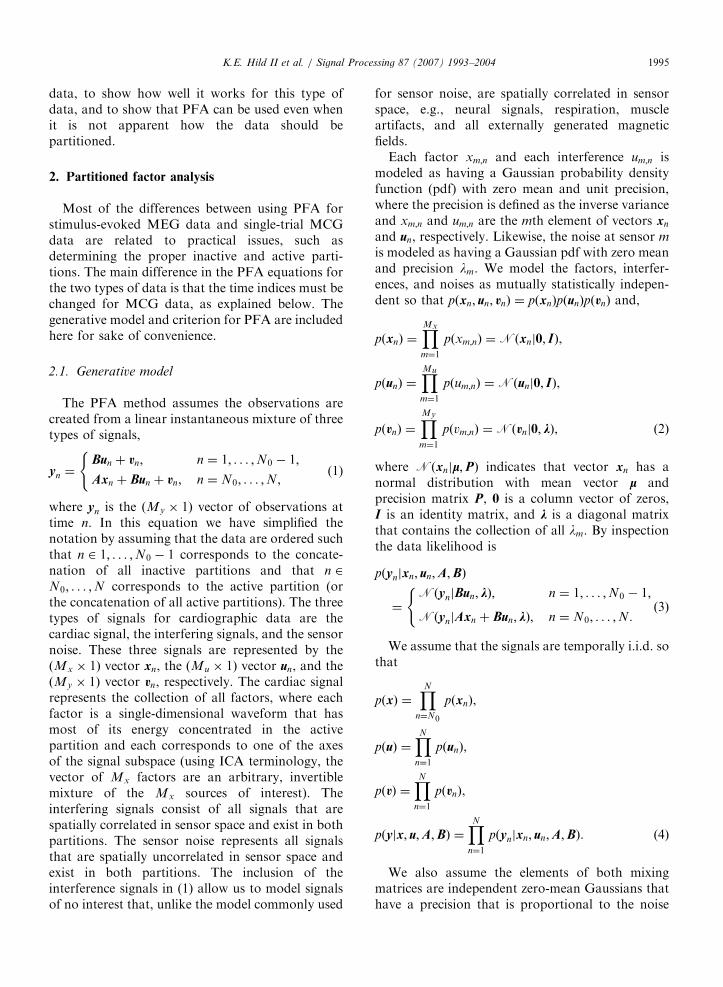
Fig. 7 pertains to the data set from the healthysubject at 21 weeks gestation. The upper plot in thisfigure shows an overlay of the data from all 37channels. Unlike the other data sets the fetal cardiacsignal is not visible in any of the sensors at any time.
Fig. 7. Overlay of all 37 channels of fMCG data from 21 weeks
gestation. The upper plot corresponds to the raw data. The
middle and lower plots correspond to the data after PFA
denoising is applied. The difference between the middle and lower
plots is that each uses a different lag for specifying the location of
the inactive partition. The inactive partitions are designated by
the vertical lines.
ARTICLE IN PRESSK.E. Hild II et al. / Signal Processing 87 (2007) 1993–20042002
It is not known a priori how to select the inactivepartition for PFA since its selection requires knowl-edge of the location of the fetal QRS complexes. Wedo know, however, the expected rate that the QRScomplexes occur. Based on this knowledge we usedan appropriately sized inactive partition (a singlewindow of length 0.38 s, which is just less than0.41 s, the expected distance between successive fetalQRS complexes for a heart rate of 146 beats perminute). For the active partition we used a singlecontiguous window of length 3.8 s. We thenperformed PFA denoising as a function of thelocation of the inactive window, which was shiftedto the right by 0.1 s between each run. The hope isthat at one or more lags PFA will successfullyextract the fetal cardiac signal. The middle plot inFig. 7 shows the denoised data for the lag thatproduced a signal that most closely matchesour expectations for the fetal cardiac signal.Incorrect placement of the inactive partition shouldextract the maternal cardiac signal instead of thefetal cardiac signal since PFA does not know thedifference between the two. The lower plot in Fig. 7shows the denoised data for the lag that produced asignal that most closely matches our expectationsfor the maternal cardiac signal. Whereas the fetalQRS complexes are not visible in the original data,they are clearly visible in the denoised data shown inthe middle plot of this figure.
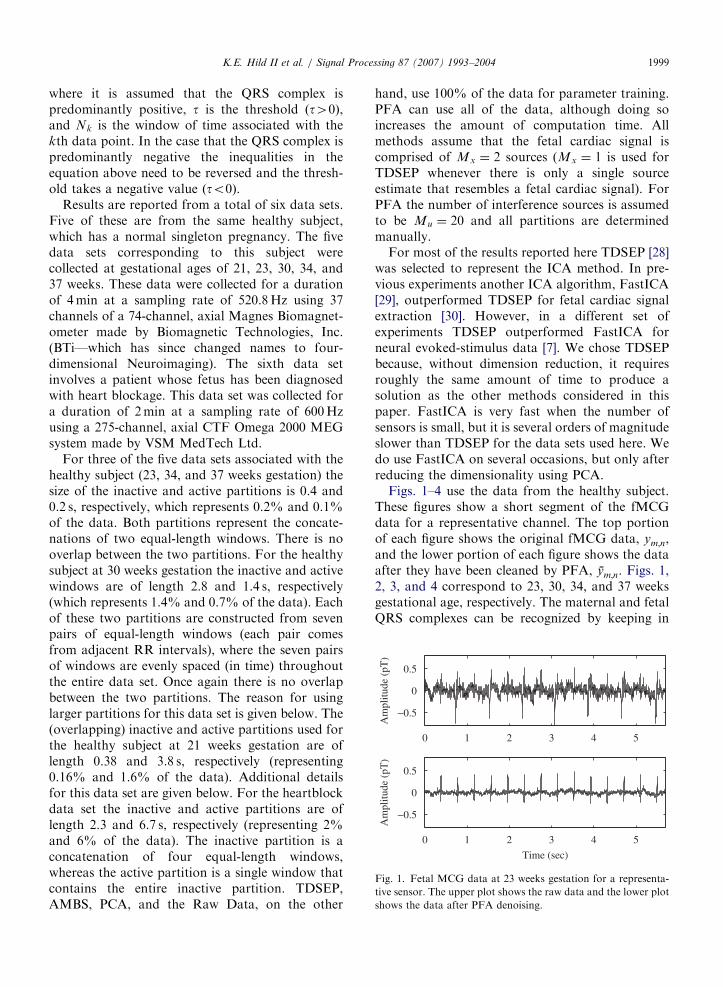
Fig. 8 shows the plot of the true positive rate forthe fetal QRS complexes minus the true positive ratefor the maternal QRS complexes as a function ofthe location of the leading edge of the inactive
2 2.5 3 3.5 4 4.5 5 5.5−1
−0.8
−0.6
−0.4
−0.2
0
0.2
0.4
0.6O
O
Time (sec)
Dif
fere
nce
of T
rue
Posi
tive
Rat
es
Fig. 8. True positive rate for the fetal QRS minus the true
positive rate for the maternal QRS as the leading edge of the
inactive partition is varied.
partition. The values necessarily range between �1and 1. As the difference in true positives approaches1 the denoised data look increasingly like the fetalcardiac signal. Likewise, as it approaches �1 thedenoised data look increasingly like the maternalcardiac signal. The plot resembles a square wave,which indicates that PFA is extracting either thefetal cardiac signal or the maternal cardiac signalfor every lag. This shape is the best that can beexpected since PFA can extract either the fetal orthe maternal cardiac signal. If the change betweenthe extraction of the fetal and maternal cardiacsignals occurred gradually then Fig. 8 would have asinusoidal shape. This would also indicate that theperformance of PFA is very sensitive to the locationof the inactive partition. The actual shape indicatesthat the method is fairly insensitive to the locationof the inactive partition. The plot comes closer toreaching �1 than it does 1, which is expected sincethe maternal cardiac signal has a much largeramplitude than the fetal cardiac signal. The twocircles indicate the lags that correspond to themiddle and lower plots in Fig. 7. Keep in mind thatthe true positives for the fetal cardiac signal cannotbe measured without knowledge of the locations ofthe fetal QRS complexes. This information wasobtained only after applying PFA denoising. Alsorecall that PFA has no knowledge of, nor does itmake any assumptions about, either the shape of thefetal QRS complexes or the approximate periodicityof the fetal QRS complexes. The fact that theresulting signal estimate has the expected QRSshape and is periodic with a period close to theexpected heart rate of the fetus gives us confidencethat the extracted signal is indeed an estimate of thefetal cardiac signal.
5. Discussion
The larger partition was used for the healthysubject at 30 weeks gestation because we suspected,based on lower performance relative to the otherdata sets, that the fetus moved during the acquisi-tion. Our original partition was chosen from a singletemporal region of the data. The use of a shortpartition from only one temporal region of the dataresults in a denoising solution that is optimized forthat temporal region only. This is problematic sincethe performance metric used in this paper is basedon the entire data set. We expect, and the resultsappear to confirm (see Fig. 6), that improved signalextraction/denoising performance is obtained when

ARTICLE IN PRESSK.E. Hild II et al. / Signal Processing 87 (2007) 1993–2004 2003
the two partitions include data from across theentire data set. Even better performance is expectedby learning a different denoising solution for eachfetal position. However, accurate segmentation ofthe time points corresponding to unique fetalpositions is extremely difficult.
It is important for PFA that the partitions arechosen such that the energy of the desired signalwithin the inactive partition is relatively small andthat the energy of the desired signal within theactive partition is relatively large. Outside of theseenergy requirements, there is nothing in the devel-opment of PFA that prevents the use of overlappingpartitions. In fact, it is even acceptable for the activepartition to completely subsume the inactive parti-tion. Hence, the choice for the locations of the twopartitions can be made independently. As long asthe heart rate is not too slow (a normal resting heartrate is adequate), we find that the energy require-ments for the active partition are met by using asingle, contiguous window large enough to captureat least two or three QRS complexes. In addition,using a single window for the active partition allowsthe user to focus on the location of the inactivepartition, which we find is more important for goodperformance.
There are two important differences between theproposed method, which uses partitions, and usingthe partitioned data itself. First, partitioning thedata is only useful for examining the instantaneousdata that has been partitioned. The proposedmethod, on the other hand, learns a transformbased on the partitions that can be applied to theentire data set/segment. Hence, it can be used toextract the fetal signal even when the fetal andmaternal QRS complexes temporally coincide (asoccurs in Figs. 1 and 2). Second, PFA (spatially)denoises the observations, whereas partitioningalone does not have any denoising capabilities.
The shape and timing of the P and T waves arevery important for clinical evaluations. Based ontheoretical considerations there are two ways thatPFA can recover the P and T waves along with theQRS complex. The most obvious way is to becareful to include the P and T waveforms in theactive partition and to exclude them in the inactivepartition. The second way, which is valid for allmethods based on a spatial filter, allows for thepossibility that the P and/or T waves are included inthe inactive partition as long as they have muchsmaller energy than the QRS complex. Suppose thatthe physical locations of the P and T sources are
nearly identical to the locations of the sourcesrepresenting the QRS signal (i.e., they have identicallead fields). In this case perfect recovery of the QRSsignal in the active partition (which requires thatthere are at least as many sensors as sources)equates with recovery of the P and T wavesregardless of whether they were included in eitherthe inactive or active partition.
The PFA method is very data efficient. As alludedto earlier, PFA uses anywhere from 0.3% to 6% ofthe data used by the other methods considered here.If there is no movement of either the fetus or themother during the acquisition then PFA does notbenefit much from using more data. This is not thecase for the vast majority of ICA methods [31]. Forexample, the mean PQRST waveform produced byFastICA has no discernable P, Q, R, or S wavewhen trained with only 6% of the data, whereas allthese waves are clearly discernable when using allthe data (healthy subject; 23 weeks gestation;dimension was first reduced to 10 using PCA).The data efficiency of PFA is expected to beespecially useful when, e.g., the fetus moves duringacquisition.
6. Conclusions
The PFA graphical model for signal extractionand denoising is applied to fMCG data in anattempt to extract the fetal cardiac signal. Thismodel takes into account information related to thedata partitions. Namely, knowledge of when thesource is (predominantly) inactive and when it isactive. PFA can also be used if the partitions cannotbe visually discerned as long as one (or more)defining characteristic of the desired signal isknown, such as its approximate shape or periodi-city. Denoising in this case is accomplished by usingseveral different lags for the inactive partition andexamining the denoised output resulting from eachlag to see if it contains the defining characteristic(s).The results on real data indicate that PFA may be aviable alternative to ICA for signal extraction anddenoising, especially when there are few data, whentrying to capture infrequent events, or when there isany movement during data acquisition.
Acknowledgment
This work supported by National Institutes ofHealth Grants F32 NS 52048 and RO1 DC 4855.

ARTICLE IN PRESSK.E. Hild II et al. / Signal Processing 87 (2007) 1993–20042004
References
[1] M. Peters, J. Crowe, J.F. Pieri, et al., Monitoring the fetal
heart non-invasively: a review of methods, J. Perinat Med.
29 (2001) 408–416.
[2] M.J. Lewis, Review of electromagnetic source investigations
of the fetal heart, Med. Eng. Phys. 25 (2003) 801–810.
[3] S. Comani, M. Liberati, D. Mantini, E. Gabriele, D.
Brisinda, S. Di Luzio, R. Fenici R, G.L. Romani,
Characterization of fetal arrhythmias by means of fetal
magnetocardiography in three cases of difficult ultrasono-
graphic imaging, Pacing Clin. Electrophysiol. 27 (2004)
1647–1655.
[4] H. Horigome, J. Shiono, S. Shigemitsu, M. Asaka, A.
Matsui, A. Kandori, T. Miyashita, K. Tsukada, Detection of
cardiac hypertrophy in the fetus by approximation of the
current dipole using magnetocardiography, Pediatr. Res. 50
(2001) 242–245.
[5] T. Hosono, T. Kanegawa, Y. Chiba, A. Kandori, K.
Tsukada, The coincidence of fetal magnetocardiography
and direct electrocardiography in a case of fetal atrial flutter
due to intracardiac tumor, Fetal Diagn. Ther. 17 (2002)
331–333.
[6] S.S. Nagarajan, H.T. Attias, K.E. Hild II, K. Sekihara, A
probabilistic algorithm for robust interference suppression
in bioelectromagnetic sensor data, Statist. Med., in press.
[7] S.S. Nagarajan, H.T. Attias, K. Sekihara, K.E. Hild II,
Partitioned factor analysis for interference suppression and
source extraction, in: International Workshop on Indepen-
dent Component Analysis and Signal Separation, Charles-
ton, North Carolina, 2006, pp. 189–197.
[8] H.T. Attias, A variational Bayesian framework for graphical
models, Adv. Neural Inform. Proc. Systems 13 (2000)
209–215.
[9] M.J. Lewis, Review of electromagnetic source investigations
of the fetal heart, Med. Eng. Phys. 25 (2003) 801–810.
[10] J.G. Stinstra, M.J. Peters, The influence of fetoabdominal
tissues on fetal ECGs and MCGs, Arch. Physiol. Biochem.
110 (2002) 165–176.
[11] R.T. Wakai, J.M. Lengle, A.C. Leuthold, Transmission of
electric and magnetic foetal cardiac signals in a case of
ectopia cordis: the dominant role of the vernix caseosa, Phys.
Med. Biol. 45 (2000) 1989–1995.
[12] T.M. Cover, J.A. Thomas, Elements of Information Theory,
John Wiley & Sons, Inc., 1991.
[13] A. Achim, F. Richer, J. Saint-Hilaire, Methods for separat-
ing temporally overlapping sources of neuroelectric data,
Brain Topogr. 1 (1988) 22–28.
[14] M. Chen, R.T. Wakai, B. Van Veen, Eigenvector based
spatial filtering of fetal biomagnetic signals, J. Perinat. Med.
29 (2001) 486–496.
[15] J. Maier, G. Dagnelie, H. Spekreijse, B. van Dijk, Principal
component analysis for source localization of VEPs in man,
Vis. Res. 27 (1987) 165–177.
[16] J. Vrba, S.E. Robinson, J. McCubbin, C.L. Lowery, H.
Eswaran, J.D. Wilson, P. Murphy, H. Preissl, Fetal MEG
redistribution by projection operators, IEEE Trans. Biomed.
Eng. 51 (2004) 1207–1218.
[17] S. Comani, D. Mantini, A. Lagatta, F. Esposito, S. Di
Luzio, G.L. Romani, Time course reconstruction of fetal
cardiac signals from fMCG: independent component analy-
sis vs. adaptive maternal beat subtraction, Physiol. Meas. 25
(5) (2004) 1305–1321.
[18] C.J. James, C.W. Hesse, Independent component analysis
for biomedical signals, Physiol. Meas. 26 (2005) R15–R39.
[19] S. Makeig, T.P. Jung, A. Bell, D. Ghahremani, T.J.
Sejnowski, Blind separation of auditory event related brain
responses into independent components, Proc. Nat. Acad.
Sci. 94 (1997) 10979–10984.
[20] M.J. McKeown, S. Makeig, G.G. Brown, T.P. Jung, S.S.
Kindermann, T.J. Sejnowski, Analysis of fMRI by blind
separation into independent spatial components, Hum.
Brain Map. 6 (1998) 160–188.
[21] A. Ossadtchi, S. Baillet, J.C. Mosher, D. Thyerlei, W.
Sutherling, R.M. Leahy, Automated interictal spike detec-
tion and source localization in magnetoencephalography
using independent components analysis and spatio-temporal
clustering, Clin. Neurophysiol. 115 (3) (2004) 508–522.
[22] A.C. Tang, B.A. Pearlmutter, N.A. Malaszenko, D.B.
Phung, B.C. Reeb, Independent components of magnetoen-
cephalography: localization, Neural Comput. 14 (8) (2002)
1827–1858.
[23] R. Vigario, V. Jousmaki, M. Hamalainen, R. Hari, E. Oja,
Independent component analysis for identification of arti-
facts in magnetoencephalographic recordings, Adv. Neural
Inform. Process. 10 (1998) 229–235.
[24] P. Ungan, E. Basar, Comparison of Wiener filtering and
selective averaging of evoked potentials, Electroencephalo-
graphy Clin. Neurophysiol. 40 (1976) 516–520.
[25] K. Abraham-Fuchs, P. Strohbach, S.S. HarerWand, Im-
provement of neuromagnetic localisation by MCG artifact
correction in MEG, in: Eighth International Conference on
Biomagnetism, Munster, Germany, 1991, pp. 429–430.
[26] J.E. Jackson, A User’s Guide to Principal Components,
John Wiley & Sons, Inc., 2003.
[27] J.F. Cardoso, Blind signal separation: statistical principles,
Proc. IEEE 86 (10) (1998) 2009–2025.
[28] A. Ziehe, K.R. Mueller, TDSEP—an efficient algorithm
for blind separation using time structure, in: Interna-
tional Conference on Artificial Neural Networks, 1998,
pp. 675–680.
[29] A. Hyvarinen, Fast and robust fixed-point algorithms for
independent component analysis, IEEE Trans. Neural Net-
works 10 (1999) 626–634.
[30] D. Mantini, K.E. Hild II, G. Alleva, S. Comani, Perfor-
mance comparison of independent component analysis
algorithms for fetal cardiac signal reconstruction: a study
on synthetic fMCG data, Phys. Med. Biol. 51 (2006)
1033–1046.
[31] K.E. Hild II, D. Erdogmus, J.C. Principe, An analysis of
entropy estimators for blind source separation, Signal
Process. 86 (2006) 182–194.
[32] J. Vanderschoot, D. Callaerts, W. Sansen, J. Vandewalle, G.
Vantrappen, J. Janssens, Two methods for optimal MECG
elimination and FECG detection from skin electrode signals,
IEEE Trans. Biomed. Eng. 34 (1987) 233–243.