PROJECT DESIGN DOCUMENT FORM (CDM-SSC-PDD ...
62
PROJECT DESIGN DOCUMENT FORM (CDM-SSC-PDD) - Version 03 CDM – Executive Board 1 CLEAN DEVELOPMENT MECHANISM PROJECT DESIGN DOCUMENT FORM (CDM-SSC-PDD) Version 03 - in effect as of: 22 December 2006 CONTENTS A. General description of the small scale project activity B. Application of a baseline and monitoring methodology C. Duration of the project activity / crediting period D. Environmental impacts E. Stakeholders’ comments Annexes Annex 1: Contact information on participants in the proposed small scale project activity Annex 2: Explanation of beer brewing processes and energy saving technologies for beer brewery Annex 3: Information regarding public funding Annex 4: Baseline Information Annex 5: Monitoring Plan Annex 6: Environmental Impact Assessment Annex 7: Stakeholders’ Comments Annex 8: CDM Project Criteria
-
Upload
khangminh22 -
Category
Documents
-
view
1 -
download
0
Transcript of PROJECT DESIGN DOCUMENT FORM (CDM-SSC-PDD ...
PROJECT DESIGN DOCUMENT FORM (CDM-SSC-PDD) - Version 03 CDM – Executive Board
1
CLEAN DEVELOPMENT MECHANISM PROJECT DESIGN DOCUMENT FORM (CDM-SSC-PDD)
Version 03 - in effect as of: 22 December 2006
CONTENTS A. General description of the small scale project activity B. Application of a baseline and monitoring methodology C. Duration of the project activity / crediting period D. Environmental impacts E. Stakeholders’ comments
Annexes Annex 1: Contact information on participants in the proposed small scale project activity
Annex 2: Explanation of beer brewing processes and
energy saving technologies for beer brewery
Annex 3: Information regarding public funding Annex 4: Baseline Information Annex 5: Monitoring Plan
Annex 6: Environmental Impact Assessment Annex 7: Stakeholders’ Comments Annex 8: CDM Project Criteria

PROJECT DESIGN DOCUMENT FORM (CDM-SSC-PDD) - Version 03 CDM – Executive Board
2
Revision history of this document Version Number
Date Description and reason of revision
01 21 January 2003
Initial adoption
02 8 July 2005 • The Board agreed to revise the CDM SSC PDD to reflect guidance and clarifications provided by the Board since version 01 of this document.
• As a consequence, the guidelines for completing CDM SSC PDD have been revised accordingly to version 2. The latest version can be found at <http://cdm.unfccc.int/Reference/Documents>.
03 22 December 2006
• The Board agreed to revise the CDM project design document for small-scale activities (CDM-SSC-PDD), taking into account CDM-PDD and CDM-NM.
PROJECT DESIGN DOCUMENT FORM (CDM-SSC-PDD) - Version 03 CDM – Executive Board
3
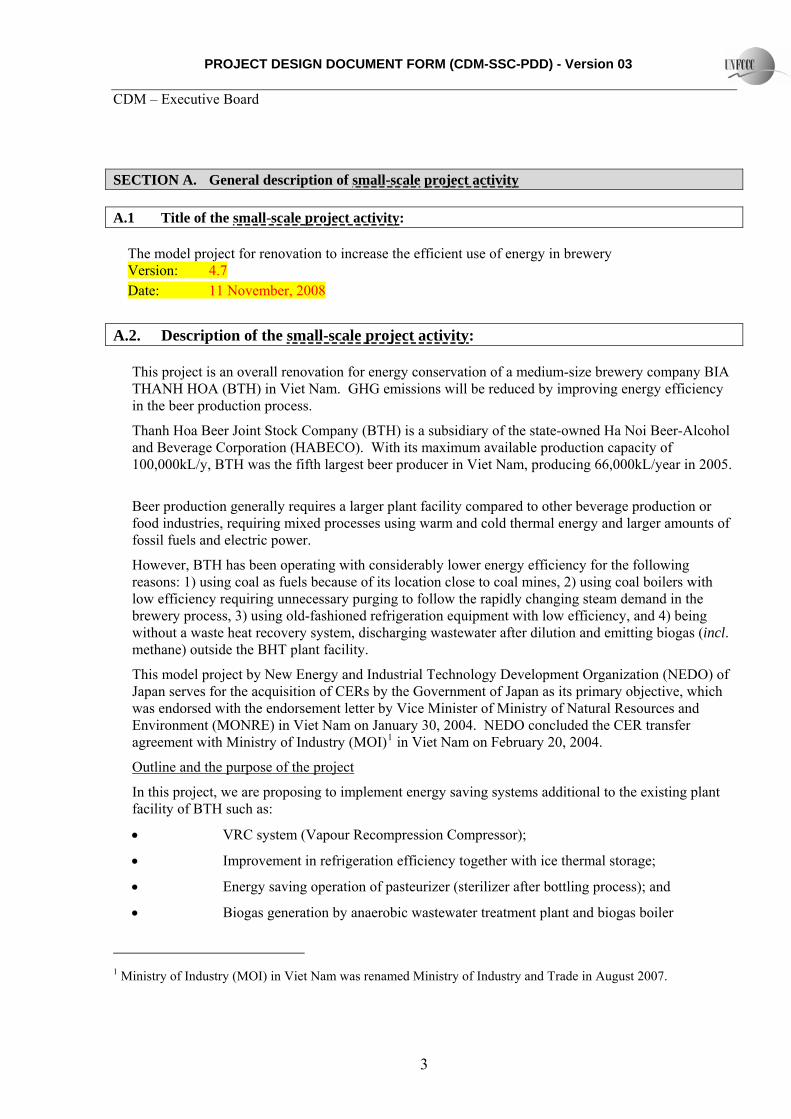
SECTION A. General description of small-scale project activity A.1 Title of the small-scale project activity:
The model project for renovation to increase the efficient use of energy in brewery Version: 4.7 Date: 11 November, 2008
A.2. Description of the small-scale project activity:
This project is an overall renovation for energy conservation of a medium-size brewery company BIA THANH HOA (BTH) in Viet Nam. GHG emissions will be reduced by improving energy efficiency in the beer production process.
Thanh Hoa Beer Joint Stock Company (BTH) is a subsidiary of the state-owned Ha Noi Beer-Alcohol and Beverage Corporation (HABECO). With its maximum available production capacity of 100,000kL/y, BTH was the fifth largest beer producer in Viet Nam, producing 66,000kL/year in 2005.
Beer production generally requires a larger plant facility compared to other beverage production or food industries, requiring mixed processes using warm and cold thermal energy and larger amounts of fossil fuels and electric power.
However, BTH has been operating with considerably lower energy efficiency for the following reasons: 1) using coal as fuels because of its location close to coal mines, 2) using coal boilers with low efficiency requiring unnecessary purging to follow the rapidly changing steam demand in the brewery process, 3) using old-fashioned refrigeration equipment with low efficiency, and 4) being without a waste heat recovery system, discharging wastewater after dilution and emitting biogas (incl. methane) outside the BHT plant facility.
This model project by New Energy and Industrial Technology Development Organization (NEDO) of Japan serves for the acquisition of CERs by the Government of Japan as its primary objective, which was endorsed with the endorsement letter by Vice Minister of Ministry of Natural Resources and Environment (MONRE) in Viet Nam on January 30, 2004. NEDO concluded the CER transfer agreement with Ministry of Industry (MOI)1 in Viet Nam on February 20, 2004.
Outline and the purpose of the project
In this project, we are proposing to implement energy saving systems additional to the existing plant facility of BTH such as:
• VRC system (Vapour Recompression Compressor);
• Improvement in refrigeration efficiency together with ice thermal storage;
• Energy saving operation of pasteurizer (sterilizer after bottling process); and
• Biogas generation by anaerobic wastewater treatment plant and biogas boiler
1 Ministry of Industry (MOI) in Viet Nam was renamed Ministry of Industry and Trade in August 2007.

PROJECT DESIGN DOCUMENT FORM (CDM-SSC-PDD) - Version 03 CDM – Executive Board
4
without expanding beer production capacity.
Energy consumption of an entire brewery plant will be reduced which will, in turn, reduce emissions of GHGs (particularly CO2) generated by combustion of fossil fuel.
Estimated total emission reduction is 87,625 ton-CO2 over the crediting period (10 years).
Contribution to sustainable development of the host country
As the brewery plant is often an advanced leader in the food industry, most of the energy saving systems proposed in this project can be applied and expected to penetrate to other food industries as well. This transfer of technology for energy saving as well as reduction of polluted emission substances will contribute extensively to the sustainable development of Viet Nam.
It is also expected that this project will create more employment for skilled workers such as machine operators and maintenance staffs.
A.3. Project participants:
Name of Party Involved(*) ((host) indicates a host Party)
Private and/or public entity(ies)
Project participants (*) (as applicable)
Kindly indicate if the Party involved wishes to be considered as project participant (Yes/No)
Viet Nam (host) BTH: Thanh Hoa Beer Joint Stock Company (the project owner)
HABECO: Ha Noi Beer-Alcohol and Beverage Corporation (the parent company of BTH)
The Technical Institute of Brewing of Hanoi Beer-Alcohol and Beverage Corporation (Former RIB: The Research Institute of Brewing, a division of HABECO supporting BTH technically)
MOIT: Ministry of Industry and Trade, former MOI (Ministry of Industry) (in charge of HABECO (Permits and Supervising))
No
Japan NEDO: New Energy and Industrial Technology Development Organization (the participant in Annex I country acquiring CERs)
MYCOM: Mayekawa Mfg.
No
PROJECT DESIGN DOCUMENT FORM (CDM-SSC-PDD) - Version 03 CDM – Executive Board
5
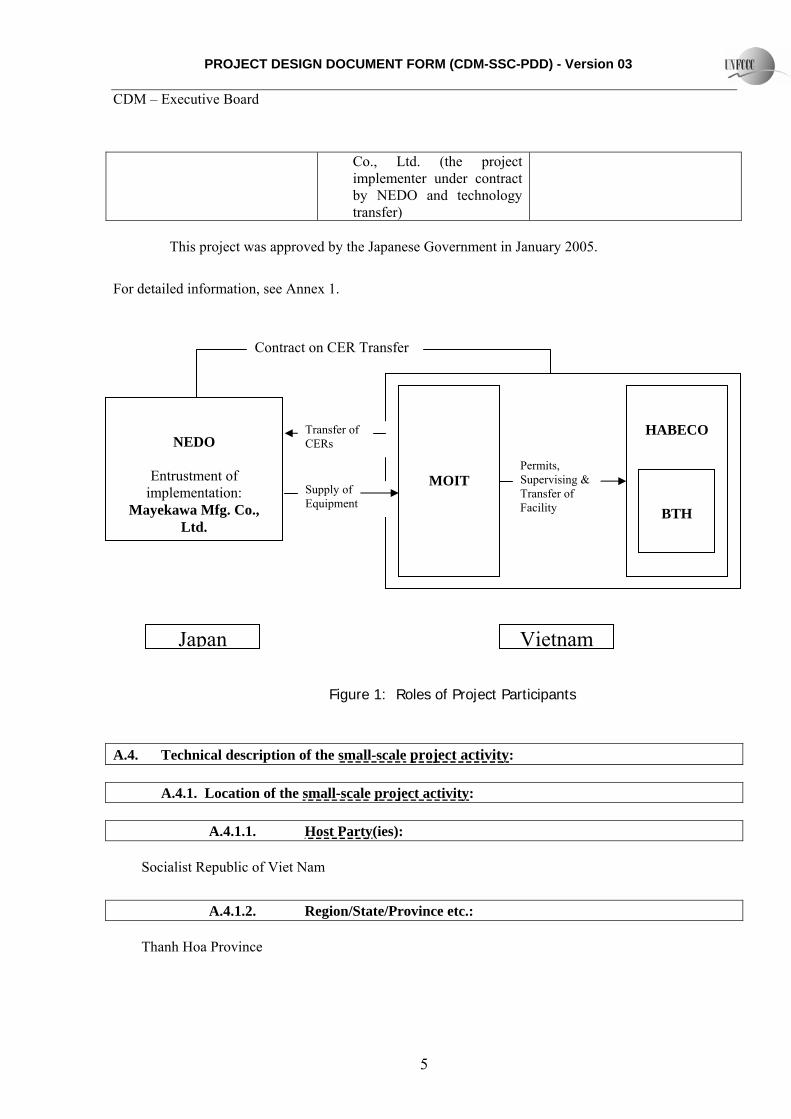
Co., Ltd. (the project implementer under contract by NEDO and technology transfer)
This project was approved by the Japanese Government in January 2005.
For detailed information, see Annex 1.
NEDO
Entrustment of implementation:
Mayekawa Mfg. Co., Ltd.
Japan
HABECO
MOIT
BTH
Vietnam
Contract on CER Transfer
Transfer of CERs
Supply of Equipment
Permits, Supervising & Transfer of Facility
Figure 1: Roles of Project Participants
A.4. Technical description of the small-scale project activity: A.4.1. Location of the small-scale project activity: A.4.1.1. Host Party(ies):
Socialist Republic of Viet Nam
A.4.1.2. Region/State/Province etc.:
Thanh Hoa Province
PROJECT DESIGN DOCUMENT FORM (CDM-SSC-PDD) - Version 03 CDM – Executive Board
6
A.4.1.3. City/Town/Community etc:
Thanh Hoa City
A.4.1.4. Details of physical location, including information allowing the unique identification of this small-scale project activity :
Detailed location: 152 Quang Trung Str., Thanh Hoa City, Thanh Hoa Province
Thanh Hoa Beer Joint Stock Company is a state-owned brewery company situated 150 km south (3 hours drive by car) of Ha Noi - the capital of Viet Nam, in the center of the Province of Thanh Hoa which is the northern end of Central Viet Nam. It is situated along National Route No.1 which runs north to south through Viet Nam. Route No.1 is the trunk route in Viet Nam with continuous traffic throughout the day.
BTH plant with an area of approximately 40,000 m2, is surrounded by closely spaced houses and 4-meter wide streets to North, South, East and West. Only one gate on Southeast side is open to Route No.1. A rural area develops behind the plant (Northwest) 50 meters away across crowded houses. Sam Son, a beach resort along Tonkin Bay is located about 20 km to the West.
There are about 20 breweries in Viet Nam which produce more than 10,000 kL per year. Among them, six breweries including BTH are using coal as the primary fuel because they are located in the northern part of Viet Nam close to coal mines.
BTH is the second largest plant in Thanh Hoa province and Thanh Hoa is designated as one of the most important for development purpose.

PROJECT DESIGN DOCUMENT FORM (CDM-SSC-PDD) - Version 03 CDM – Executive Board
7
BIA THANH HOA
Figure 2: Map of Viet Nam and the Location of BIA THANH HOA
A.4.2. Type and category(ies) and technology/measure of the small-scale project activity:
Type and category of the small-scale project activity
Type II - Energy Efficiency Improvement Project: [Energy efficiency and fuel switching measures for industrial facilities]
Type I - Renewable Energy Project [Thermal Energy for the User]
Technology of the small-scaled project activity (including how to transfer the technology and know-how to the host country)
Energy saving technologies used in the project are integrated system of:
(1)VRC, (2) Improvement of refrigeration efficiency & thermal storage, (3) Optimization of pasteurizer efficiency, and (4) Biogas generation by anaerobic wastewater treatment plant and
PROJECT DESIGN DOCUMENT FORM (CDM-SSC-PDD) - Version 03 CDM – Executive Board
8
biogas boiler. BTH established the energy saving team with six members headed by Mr. le Ah Tuan (Vice Director, Plant Manager) in order to improve their energy saving practices and to promote the daily management of their CDM project activity.
For the basic information about a beer brewing system and energy saving technologies available for the system, see Annex 2.
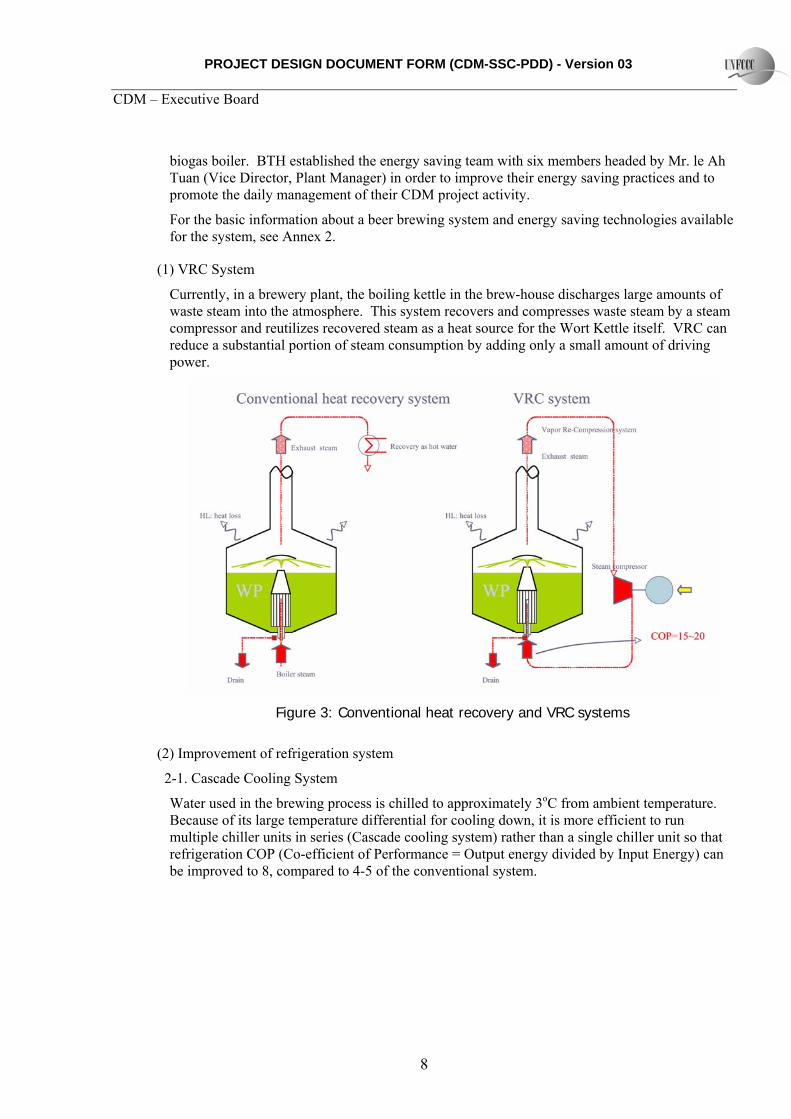
(1) VRC System
Currently, in a brewery plant, the boiling kettle in the brew-house discharges large amounts of waste steam into the atmosphere. This system recovers and compresses waste steam by a steam compressor and reutilizes recovered steam as a heat source for the Wort Kettle itself. VRC can reduce a substantial portion of steam consumption by adding only a small amount of driving power.
Figure 3: Conventional heat recovery and VRC systems
(2) Improvement of refrigeration system
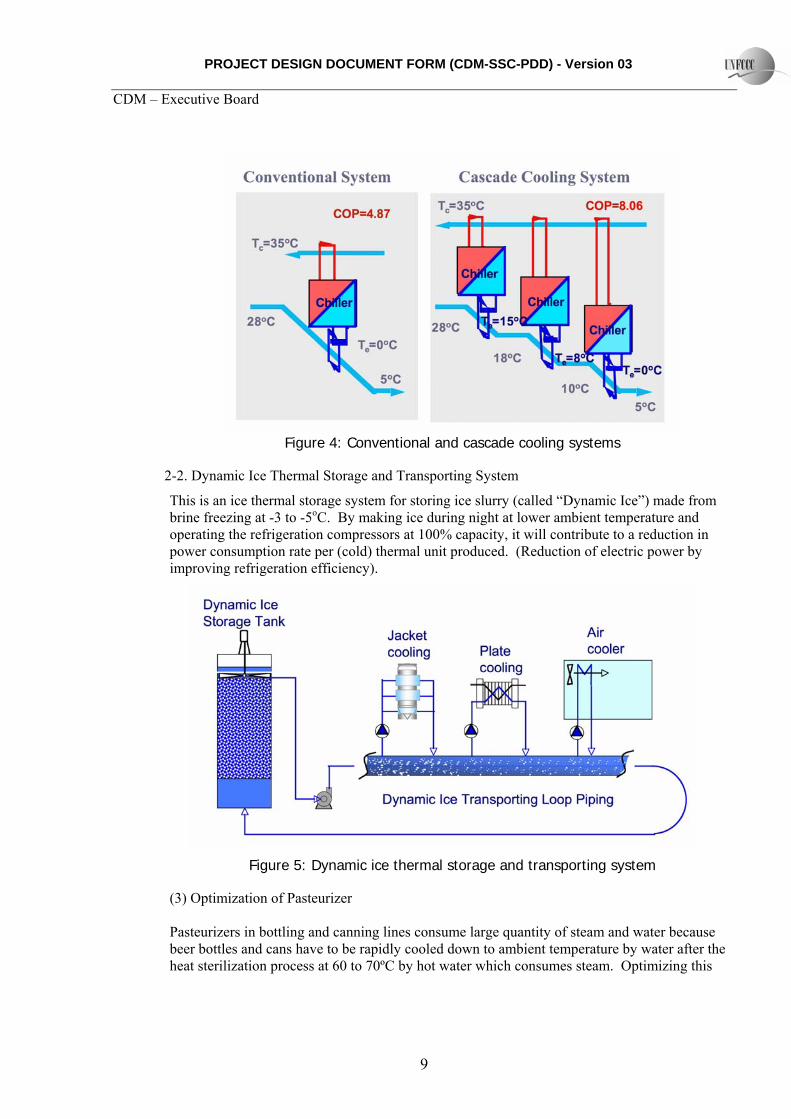
2-1. Cascade Cooling System
Water used in the brewing process is chilled to approximately 3oC from ambient temperature. Because of its large temperature differential for cooling down, it is more efficient to run multiple chiller units in series (Cascade cooling system) rather than a single chiller unit so that refrigeration COP (Co-efficient of Performance = Output energy divided by Input Energy) can be improved to 8, compared to 4-5 of the conventional system.
PROJECT DESIGN DOCUMENT FORM (CDM-SSC-PDD) - Version 03 CDM – Executive Board
9
Figure 4: Conventional and cascade cooling systems
2-2. Dynamic Ice Thermal Storage and Transporting System
This is an ice thermal storage system for storing ice slurry (called “Dynamic Ice”) made from brine freezing at -3 to -5oC. By making ice during night at lower ambient temperature and operating the refrigeration compressors at 100% capacity, it will contribute to a reduction in power consumption rate per (cold) thermal unit produced. (Reduction of electric power by improving refrigeration efficiency).
Figure 5: Dynamic ice thermal storage and transporting system
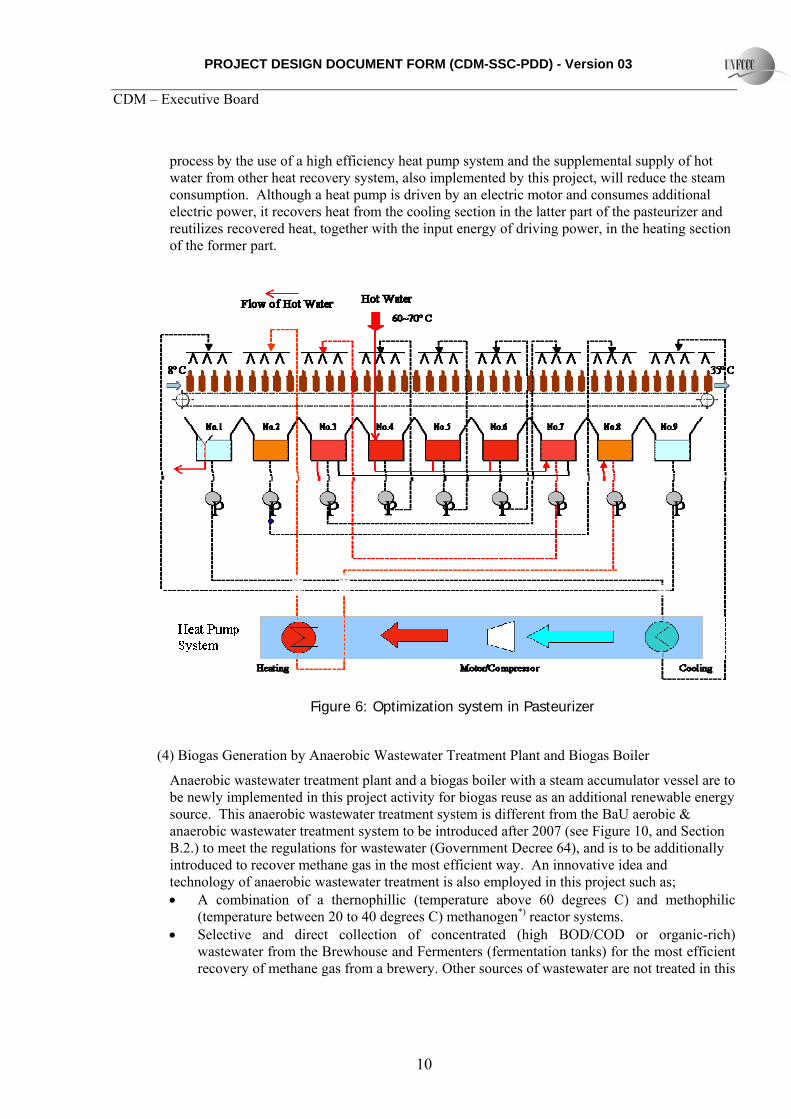
(3) Optimization of Pasteurizer Pasteurizers in bottling and canning lines consume large quantity of steam and water because beer bottles and cans have to be rapidly cooled down to ambient temperature by water after the heat sterilization process at 60 to 70ºC by hot water which consumes steam. Optimizing this
PROJECT DESIGN DOCUMENT FORM (CDM-SSC-PDD) - Version 03 CDM – Executive Board
10
process by the use of a high efficiency heat pump system and the supplemental supply of hot water from other heat recovery system, also implemented by this project, will reduce the steam consumption. Although a heat pump is driven by an electric motor and consumes additional electric power, it recovers heat from the cooling section in the latter part of the pasteurizer and reutilizes recovered heat, together with the input energy of driving power, in the heating section of the former part.
Figure 6: Optimization system in Pasteurizer
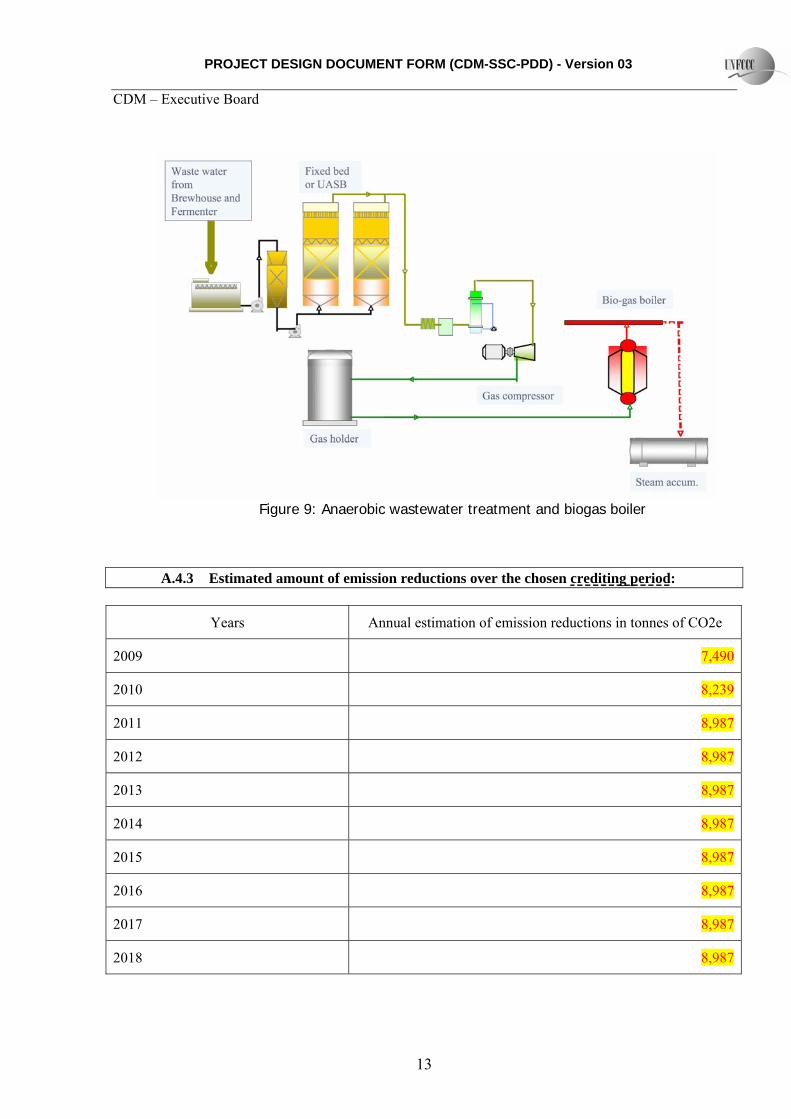
(4) Biogas Generation by Anaerobic Wastewater Treatment Plant and Biogas Boiler
Anaerobic wastewater treatment plant and a biogas boiler with a steam accumulator vessel are to be newly implemented in this project activity for biogas reuse as an additional renewable energy source. This anaerobic wastewater treatment system is different from the BaU aerobic & anaerobic wastewater treatment system to be introduced after 2007 (see Figure 10, and Section B.2.) to meet the regulations for wastewater (Government Decree 64), and is to be additionally introduced to recover methane gas in the most efficient way. An innovative idea and technology of anaerobic wastewater treatment is also employed in this project such as; • A combination of a thernophillic (temperature above 60 degrees C) and methophilic
(temperature between 20 to 40 degrees C) methanogen*) reactor systems. • Selective and direct collection of concentrated (high BOD/COD or organic-rich)
wastewater from the Brewhouse and Fermenters (fermentation tanks) for the most efficient recovery of methane gas from a brewery. Other sources of wastewater are not treated in this

PROJECT DESIGN DOCUMENT FORM (CDM-SSC-PDD) - Version 03 CDM – Executive Board
11
plant but diluted by water due to low BOD/COD value. • Separated collection of high temperature wastewater from the Brewhouse and low
temperature wastewater from fermenters for thermophillic and methophillic reactors respectively.
Final effluent, after the due treatment, is discharged into local water bodies.
*) Methanogen: micro-organism able to produce methane from organic matter in the absence of air
B rew H ouse 1
B rew H ouse 2
Ferm enter 1
Ferm enter 2
Aerobic W aste w ater Treatm ent
O thers
B iogas
B iogas
H igh Tem p. W aste W aterTherm ophillic Treatm ent
Low Tem p. W aste W aterM ethophillic Treatm ent
D ilute W aste W ater
Figure 7: Selective and Direct Wastewater Collection and Treatment

PROJECT DESIGN DOCUMENT FORM (CDM-SSC-PDD) - Version 03 CDM – Executive Board
12
Figure 8: Flow and Control of Combined Wastewater Treatment Plant
PROJECT DESIGN DOCUMENT FORM (CDM-SSC-PDD) - Version 03 CDM – Executive Board
13
Figure 9: Anaerobic wastewater treatment and biogas boiler
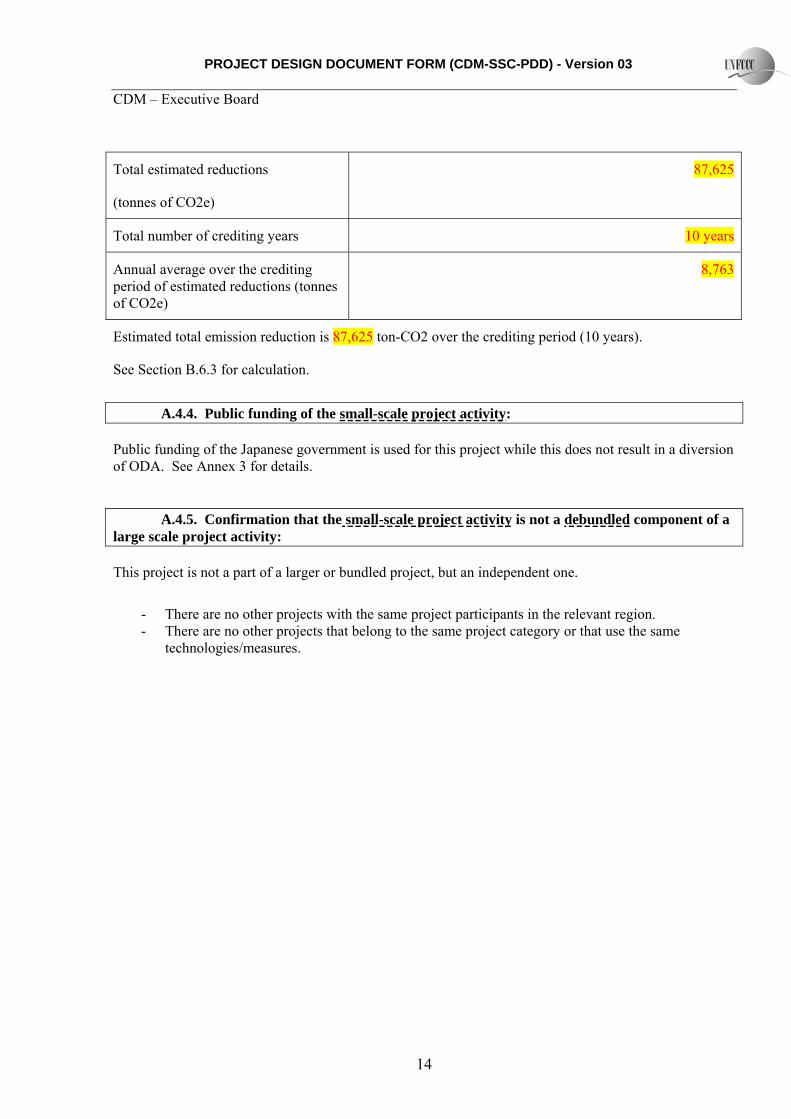
A.4.3 Estimated amount of emission reductions over the chosen crediting period:
Years Annual estimation of emission reductions in tonnes of CO2e
2009 7,490
2010 8,239
2011 8,987
2012 8,987
2013 8,987
2014 8,987
2015 8,987
2016 8,987
2017 8,987
2018 8,987
PROJECT DESIGN DOCUMENT FORM (CDM-SSC-PDD) - Version 03 CDM – Executive Board
14
Total estimated reductions
(tonnes of CO2e)
87,625
Total number of crediting years 10 years
Annual average over the crediting period of estimated reductions (tonnes of CO2e)
8,763
Estimated total emission reduction is 87,625 ton-CO2 over the crediting period (10 years).
See Section B.6.3 for calculation.
A.4.4. Public funding of the small-scale project activity: Public funding of the Japanese government is used for this project while this does not result in a diversion of ODA. See Annex 3 for details. A.4.5. Confirmation that the small-scale project activity is not a debundled component of a large scale project activity: This project is not a part of a larger or bundled project, but an independent one.
- There are no other projects with the same project participants in the relevant region. - There are no other projects that belong to the same project category or that use the same
technologies/measures.

PROJECT DESIGN DOCUMENT FORM (CDM-SSC-PDD) - Version 03 CDM – Executive Board
15
SECTION B. Application of a baseline and monitoring methodology B.1. Title and reference of the approved baseline and monitoring methodology applied to the small-scale project activity:
AMS-II.D. Energy efficiency and fuel switching measures for industrial facilities Ver. 8 / Scope 4: 23 December 2006
AMS-I.C. Thermal energy for the user Ver. 9 / Scope 1: 23 December 2006
B.2 Justification of the choice of the project category:
The proposed project aims to improve energy efficiency, and will be implemented at a single industrial facility, which is BTH plant facility. The project consists of four components grouped into two different categories as follows:
• VRC system: Energy efficiency improvement (Type II)
• Improvement of refrigeration efficiency & thermal storage: Energy efficiency improvement (Type II)
• Energy efficient operation of pasteurizer: Energy efficiency improvement (Type II)
• Biogas generation by anaerobic wastewater treatment plant and biogas boiler: Renewable energy (Type I)
As the installation capacity of the above biogas boiler is 0.63MW with 1 ton/hour steam generation, which is well below the threshold of 45MWth/year for AMS-I.C. Ver.9, “Thermal Energy for the User” in Annex B of the simplified methodologies and procedures for small-scale CDM project activities. In addition, the estimated total energy reduction from energy efficiency improvement by installing the above four components is 22.0GWhth/y at maximum from coal reduction and 2.7GWhe/y at maximum from electricity reduction (in total, 10.1GWhe/y at maximum), which is below 60GWhe/year as specified in AMS-II.D, Ver.8, “Energy efficiency and fuel switching measures for industrial facilities” in Annex B of the simplified modalities and procedures for small-scale CDM project activities. As a whole, therefore, the proposed project is eligible as a small-scale CDM project activity.
PROJECT DESIGN DOCUMENT FORM (CDM-SSC-PDD) - Version 03 CDM – Executive Board
16
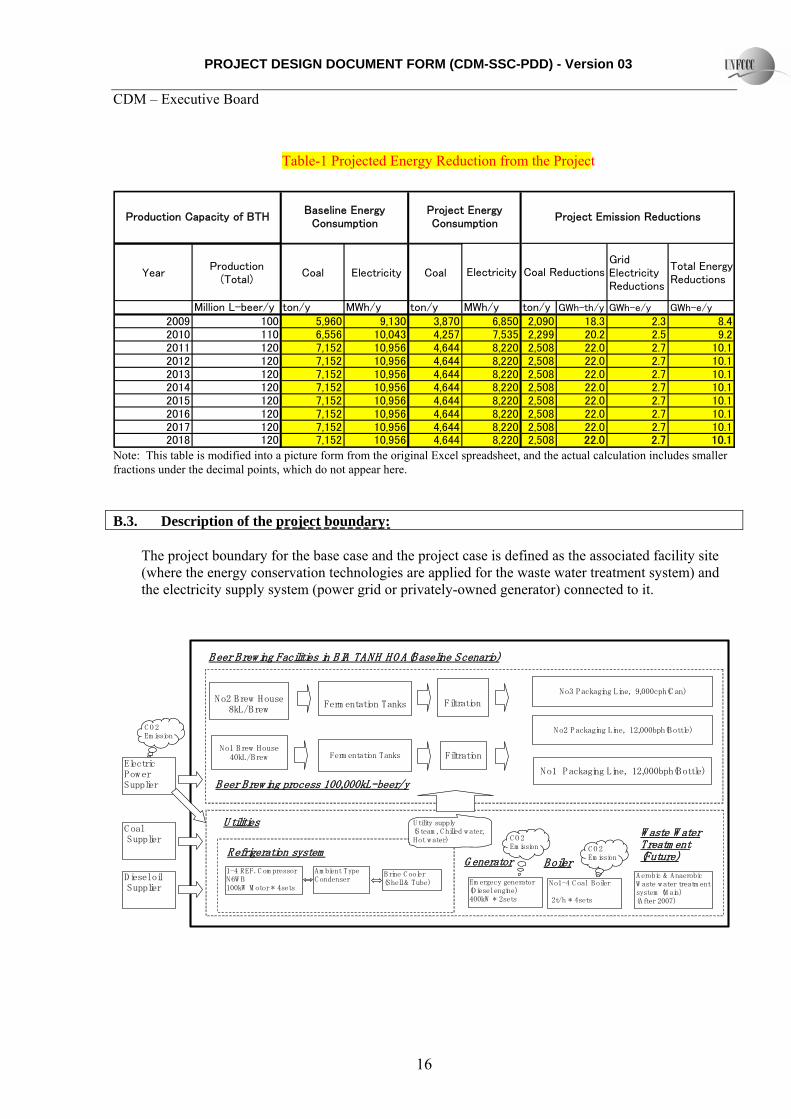
Table-1 Projected Energy Reduction from the Project
YearProduction
(Total)Coal Electricity Coal
GridElectricityReductions
Total EnergyReductions
Million L-beer/y ton/y MWh/y ton/y MWh/y ton/y GWh-th/y GWh-e/y GWh-e/y
2009 100 5,960 9,130 3,870 6,850 2,090 18.3 2.3 8.42010 110 6,556 10,043 4,257 7,535 2,299 20.2 2.5 9.22011 120 7,152 10,956 4,644 8,220 2,508 22.0 2.7 10.12012 120 7,152 10,956 4,644 8,220 2,508 22.0 2.7 10.12013 120 7,152 10,956 4,644 8,220 2,508 22.0 2.7 10.12014 120 7,152 10,956 4,644 8,220 2,508 22.0 2.7 10.12015 120 7,152 10,956 4,644 8,220 2,508 22.0 2.7 10.12016 120 7,152 10,956 4,644 8,220 2,508 22.0 2.7 10.12017 120 7,152 10,956 4,644 8,220 2,508 22.0 2.7 10.12018 120 7,152 10,956 4,644 8,220 2,508 22.0 2.7 10.1
Production Capacity of BTH
Electricity
Project Emission Reductions
Coal Reductions
Baseline EnergyConsumption
Project EnergyConsumption
Note: This table is modified into a picture form from the original Excel spreadsheet, and the actual calculation includes smaller fractions under the decimal points, which do not appear here. B.3. Description of the project boundary:
The project boundary for the base case and the project case is defined as the associated facility site (where the energy conservation technologies are applied for the waste water treatment system) and the electricity supply system (power grid or privately-owned generator) connected to it.
No2 Brew House8kL/Brew
No1 Brew House40kL/Brew
Ferm entation Tanks
Beer Brew ing Facilities in BIA TANH HO A(Baseline Scenario)
Ferm entation Tanks
Filtration
Filtration
No1 Packaging Line, 12,000bph(Bottle)
No2 Packaging Line, 12,000bph(Bottle)
No3 Packaging Line, 9,000cph(C an)
B oilerRefrigeration system
No1-4 C oal Boiler
2t/h * 4sets
1-4 REF. C om pressorN6W B100kW M otor * 4sets
Am bient TypeC ondenser
B eer Brew ing process 100,000kL-beer/y
Aerobic & AnaerobicW aste w ater treatm entsystem (M ain)(After 2007)
W aste W aterTreatm ent(Future)
Brine C ooler(Shell & Tube)
U tilities
ElectricPowerSupplier
C oal Supplier
C O 2Em ission
C O 2Em ission
G enerator
Em ergecy generator(D iesel engine)400kW * 2sets
C O 2Em ission
Diesel oil Supplier
Utility supply(Steam , C hilled w ater,Hot w ater)
PROJECT DESIGN DOCUMENT FORM (CDM-SSC-PDD) - Version 03 CDM – Executive Board
17
Steam Accum lator,45ton(W ater)
BiogasBoiler 1t/h
No2 Brew House8kL/Brew
No1 Brew House40kL/Brew
Ferm entation Tanks
B eer Brew ing Facilities in BIA TANH HO A(Project Scenario)
Ferm entation Tanks
Filtration
Filtration
No1 Packaging Line, 12,000bph(Bottle)
No2 Packaging Line, 12,000bph(Bottle)
No3 Packaging Line, 9,000cph(C an)
Boiler
(2) Im provem ent ofrefrigerationefficiency & therm al
No1-4 C oal Boiler
2t/h * 4sets
1-4 REF. C om pressorN6W B100kW M otor * 4sets
Am bient TypeC ondenser <Scrap>
U tilities
Brine C ooler(Shell & Tube)
(3) Heat pum p system forNo1 Pasteurizer (M otor 37kW )
(1) VRC system forNo.1 Brew house(M otor 110kW )
EvaporativeTypeC ondenser
1-3REF. C om pressor (C ascade cooling unit)50kW M otor * 4sets
D ynam ic Ice M aker300tons Ice/day
Refrigeration system
(4) Biogas Boiler and steam accum later
B eer Brew ing process 100,000kL-beer/y
ElectricPowerSupplier
C oal Supplier
C O 2Em ission
C O 2Em ission
G enerator
Em ergecy generator(D iesel engine)400kW * 2sets
C O 2Em ission
Aerobic & AnaerobicW aste w ater treatm entsystem (M ain)(After 2007)
W aste W aterTreatm ent(Future)
Anaerobic W astew ater treatm entsystem for biogasgeneration
Diesel oil Supplier
Note: D iesel engine generator is for em ergency
Hot w ater
Hot w ater
Utility supply(Steam , C hilled water,Hot w ater,
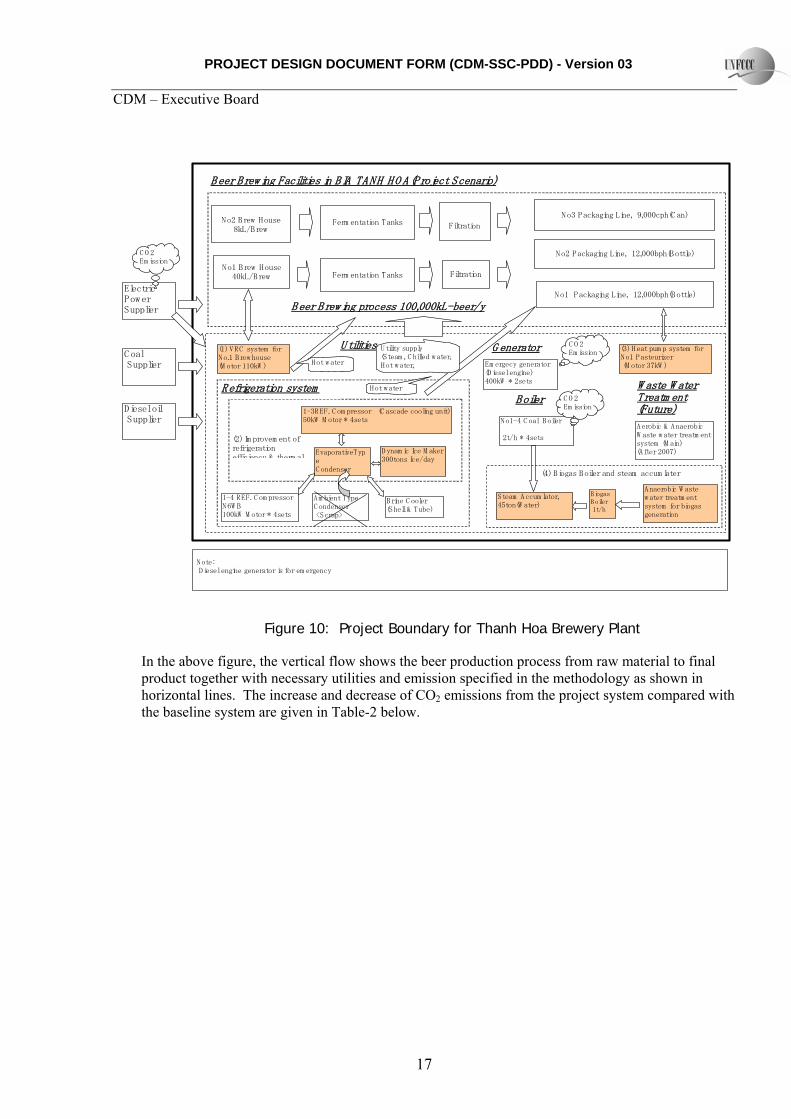
Figure 10: Project Boundary for Thanh Hoa Brewery Plant
In the above figure, the vertical flow shows the beer production process from raw material to final product together with necessary utilities and emission specified in the methodology as shown in horizontal lines. The increase and decrease of CO2 emissions from the project system compared with the baseline system are given in Table-2 below.
PROJECT DESIGN DOCUMENT FORM (CDM-SSC-PDD) - Version 03 CDM – Executive Board
18
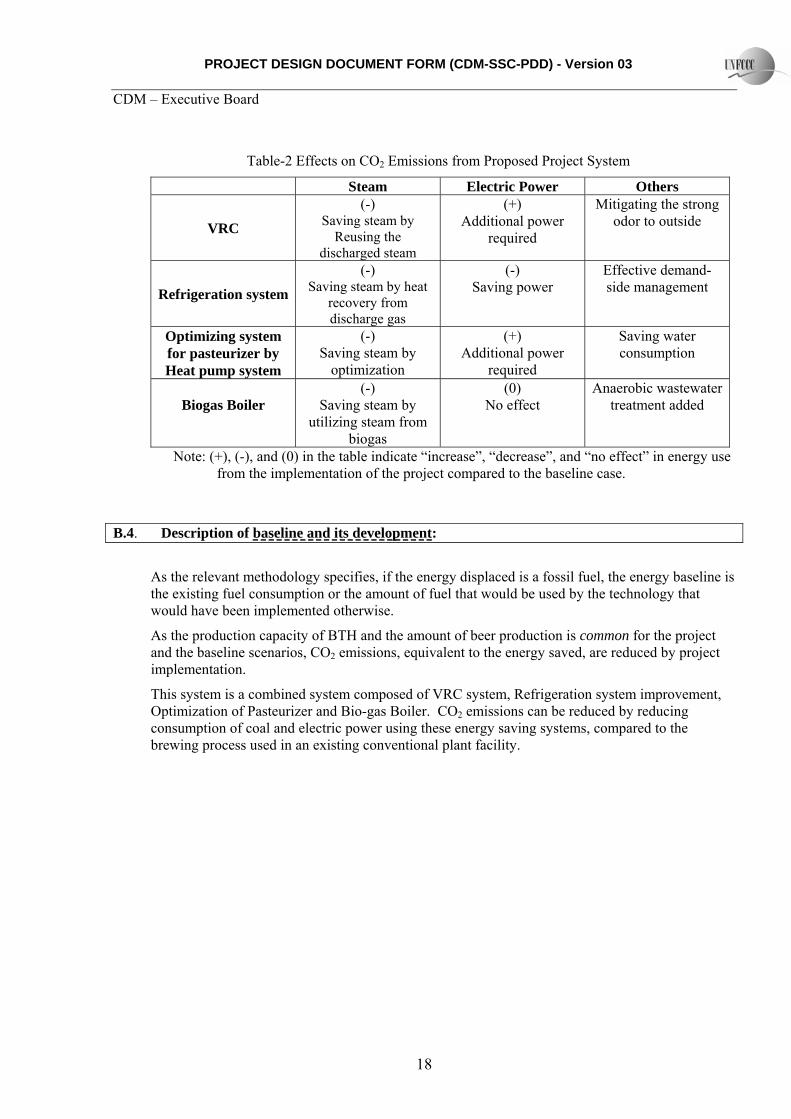
Table-2 Effects on CO2 Emissions from Proposed Project System
Steam Electric Power Others
VRC
(-) Saving steam by
Reusing the discharged steam
(+) Additional power
required
Mitigating the strong odor to outside
Refrigeration system
(-) Saving steam by heat
recovery from discharge gas
(-) Saving power
Effective demand-side management
Optimizing system for pasteurizer by Heat pump system
(-) Saving steam by
optimization
(+) Additional power
required
Saving water consumption
Biogas Boiler
(-) Saving steam by
utilizing steam from biogas
(0) No effect
Anaerobic wastewater treatment added
Note: (+), (-), and (0) in the table indicate “increase”, “decrease”, and “no effect” in energy use from the implementation of the project compared to the baseline case.
B.4. Description of baseline and its development:
As the relevant methodology specifies, if the energy displaced is a fossil fuel, the energy baseline is the existing fuel consumption or the amount of fuel that would be used by the technology that would have been implemented otherwise.
As the production capacity of BTH and the amount of beer production is common for the project and the baseline scenarios, CO2 emissions, equivalent to the energy saved, are reduced by project implementation.
This system is a combined system composed of VRC system, Refrigeration system improvement, Optimization of Pasteurizer and Bio-gas Boiler. CO2 emissions can be reduced by reducing consumption of coal and electric power using these energy saving systems, compared to the brewing process used in an existing conventional plant facility.

PROJECT DESIGN DOCUMENT FORM (CDM-SSC-PDD) - Version 03 CDM – Executive Board
19
Figure 11: Proposed Integrated High Energy Efficient System
Reduction in generation of fermented gas downstream of diluted wastewater discharge:
BTH is currently discharging wastewater from the plant after only diluting. Therefore, methane is generated under anaerobic conditions downstream where detention of water occurs. In addition to the biogas generation system proposed under the CDM project activity, the project plant is planning to introduce a BaU aerobic & anaerobic waster water treatment system at the downstream of the proposed anaerobic waste water treatment system after 2007 (see Figure 10 for Project Boundary) in order to satisfy the water treatment standard stipulated under Government Decree 64. In the proposed CDM project, the plant introduces the anaerobic wastewater treatment system with thermophillic methanogen reactor to collect highly concentrated wastewater from the brewing process and treat it under anaerobic conditions for biogas generation. Biogas is then recovered and used as fuel for biogas boilers. The amount of methane generated outside the plant facility will be reduced compared to the conventional system.
The amount of methane generation cannot, however, be determined precisely due to the technical difficulties in estimating the open water system which BTH utilizes. Therefore, in the baseline scenario, it is designed to be estimated on the conservative side, that there is no generation of methane with the help of the aerobic treatment and with additional power required.
B.5. Description of how the anthropogenic emissions of GHG by sources are reduced below those that would have occurred in the absence of the registered small-scale CDM project activity:
Technological Barrier
Since the technologies to be introduced by the proposed project activity, including VRC, cascade cooling system, dynamic ice thermal storage system, pasteurizer heat pump system, and anaerobic
PROJECT DESIGN DOCUMENT FORM (CDM-SSC-PDD) - Version 03 CDM – Executive Board
20
wastewater treatment and biogas boiler system, are the first of this kind in Viet Nam as well as in the other ASEAN countries, technological barriers exist for refurbishment type of energy efficiency improvement (even if it is simple one).
Prevailing Practice
In addition to the above technological barrier, there exists an implementation barrier from a prevailing practice. With the higher accessibility to coal, industries in Northern part of Viet Nam, as well as in the other Southeast Asian countries, are not energy-saving conscious, conventionally practicing energy intensive business activities.
Due to the prohibitive barriers in accessing and implementing integrated up-to-date energy saving technologies, this project can only be realized with the help of public fund. Therefore, this project is an additional implementation for the BTH brewery plant in Viet Nam.
The implementation of this proposed project as a CDM project is seriously considered before the actual implementation of the project, which is supported by the endorsement letter from MONRE on January 30, 2004 and the CER transfer agreement between NEDO and MOI on February 20, 2004.
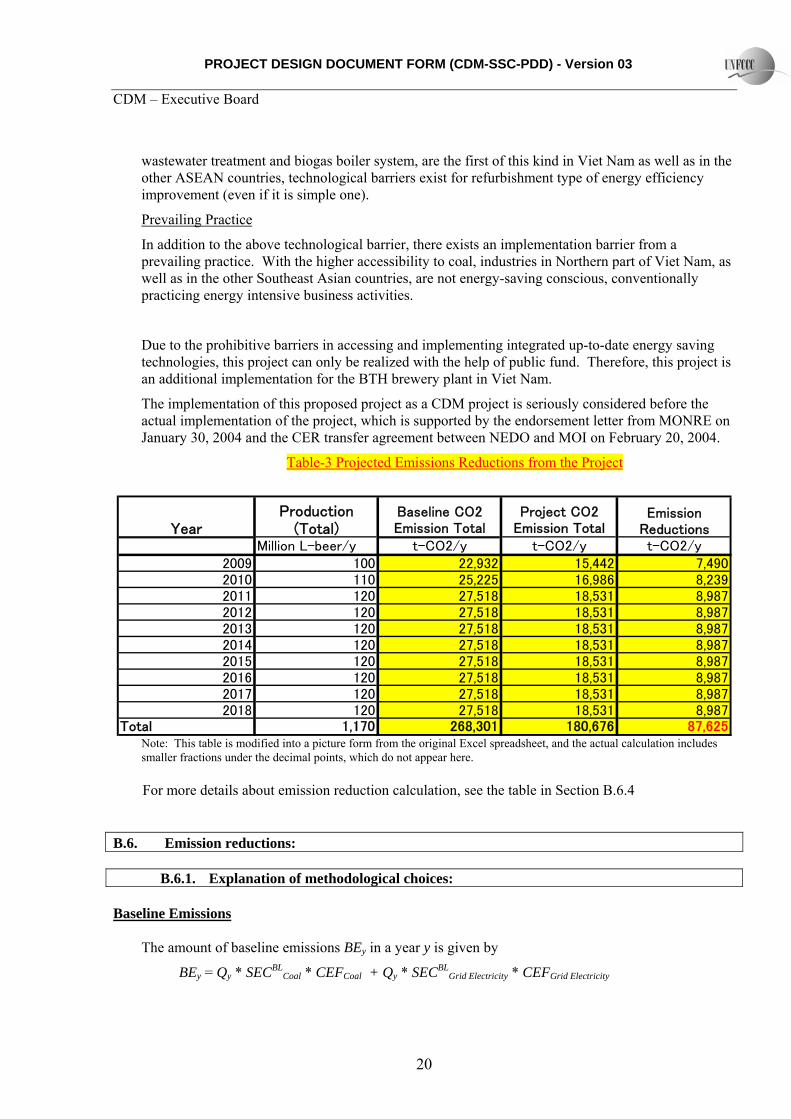
Table-3 Projected Emissions Reductions from the Project
YearProduction
(Total)Emission
ReductionsMillion L-beer/y t-CO2/y t-CO2/y t-CO2/y
2009 100 22,932 15,442 7,4902010 110 25,225 16,986 8,2392011 120 27,518 18,531 8,9872012 120 27,518 18,531 8,9872013 120 27,518 18,531 8,9872014 120 27,518 18,531 8,9872015 120 27,518 18,531 8,9872016 120 27,518 18,531 8,9872017 120 27,518 18,531 8,9872018 120 27,518 18,531 8,987
Total 1,170 268,301 180,676
Baseline CO2Emission Total
Project CO2Emission Total
87,625 Note: This table is modified into a picture form from the original Excel spreadsheet, and the actual calculation includes smaller fractions under the decimal points, which do not appear here.
For more details about emission reduction calculation, see the table in Section B.6.4 B.6. Emission reductions:
B.6.1. Explanation of methodological choices: Baseline Emissions
The amount of baseline emissions BEy in a year y is given by
BEy = Qy * SECBLCoal * CEFCoal + Qy * SECBL
Grid Electricity * CEFGrid Electricity

PROJECT DESIGN DOCUMENT FORM (CDM-SSC-PDD) - Version 03 CDM – Executive Board
21
where Qy is the pilsner-equivalent annual production of beer in the facility [kL-beer/yr], SECBLCoal is
the specific energy consumption rate (energy intensity) for coal [ton/kL-beer], and SECBLGrid Electricity
is the specific energy consumption rate for grid electricity in the baseline [KWh/kL-beer]. CEFcoal, and CEFGrid Electricity are the CO2 emission factors of the coal and grid electricity consumed by the facility [tCO2/t-coal and tCO2/MWh].
Diesel oil consumption for in-house power generation can usually be disregarded because it is for emergency power supply and has historically been accounting for less than 5% of the total fuel use in the factory. The use of diesel oil for emergency power supply is due to local electricity supply conditions, and is not influenced by the implementation of the project activity. The capacity of the emergency diesel generators is approximately only 40% of the whole demand in the project factory. The emergency generators are only used to operate the essential equipment for beer production and not for the energy-saving equipment. The energy-saving equipment is to be temporarily stopped while the emergency generators are operated. In addition, the use of diesel oil for emergency power supply is expected to be reduced with the future improvement in the local electricity supply conditions. Given such conditions, diesel oil consumption is not to be considered, and can be excluded from the baseline emission calculation. It can also be disregarded in the calculation of SEC also from the conservativeness point of view, and only the consumption amount of coal and grid electricity should be considered.
The above SECBLCoal and SECBL
Grid Electricity are calculated from the historical data. Before the conclusion of MOU and the CER transfer agreement, historical production data are available for 14 months; Dec 2002 to Jan 2004. Although data are collected monthly, it is not reasonable to calculate the baseline specific consumption rate (SECBL) from monthly data considering a time lag between production date and shipping date (see Annex 2 for beer brewing processes), as well as the seasonal variation of production and shipping. Therefore, a longer time span for calculating SECBL – annual average SECBL – is selected for this specific project activity. From the perspective of conservativeness, the project participants calculated SEC for different 12 month periods as shown in Table 2 in Annex 4, and selected the lowest SECs (that for Feb 2003 to Jan 2004) as their SECBL
Coal and SECBL
Grid Electricity.
In order to find SECBLCoal and SECBL
Grid Electricity for this specific period, we divided the total beer production by coal and grid electricity consumption amounts during the relevant period. The beer production during this period was 42,909kL. The specific consumption rates for coal and electricity are 59.6kg/kL and 91.3KWh/kL respectively, which are the averaged consumption rates during the relevant period. (See Annex 4.)
Even when the production volume may increase, fuel consumption per unit of beer production would remain unchanged because the beer brewing is a batch process. The volume of wort to be processed in one batch is fixed by the capacity of wort kettle. If beer production volume needs to be increased, the factory must increase the number of batches. There would be no fuel efficiency improvement as a result of increased beer production volume. Therefore, it would be reasonable to calculate the baseline CO2 emissions based on specific energy consumption.
Project Emissions
The amount of project emissions PEy in a year y is given by
PEy = Q_Coal,y* CEFCoal + Q_Grid Electricity,y * CEFGrid Electricity + Q_Diesel,y * CEFDiesel
PROJECT DESIGN DOCUMENT FORM (CDM-SSC-PDD) - Version 03 CDM – Executive Board
22
where Qy is the pilsner-equivalent annual production of beer in the facility [kL-beer/yr], Q_Coal,y and Q_Grid Electricity,y are annual coal and grid electricity consumptions [t-coal and MWh] in the project. Q_Diesel,y is the amount of diesel used in the facility for an emergency power source. CEFcoal ,CEFGrid
Electricity and CEFDiesel are the CO2 emission factors of the coal, grid electricity and diesel oil consumed by the facility [tCO2/t-coal, tCO2/MWh and tCO2/m3].
For ex-ante calculation, the amounts of coal and grid electricity consumption during the project implementation are calculated based on the estimated annual production of beer and the specific energy consumption rates (energy intensity) for coal and grid electricity during the project as follows:
PEy = Qy * (Q_Coal,y/Qy ) * CEFCoal + Qy * (Q_Grid Electricity,y/Qy ) * CEFGrid Electricity + Q_Diesel,y * CEFDiesel
= Qy * (SECBLCoal * 0.65) *CEFCoal + Qy * (SECBL
Grid Electricity * 0.75) * CEFGrid Electricity + Q_Diesel,y * CEFDiesel
where Qy is the pilsner-equivalent annual production of beer in the facility [kL-beer/yr], and the project coal and grid electricity consumption is calculated by multiplying expected energy efficiency to be realized by the project, which is 65% and 75% respectively, to their baseline specific energy consumptions.
Leakage
As per the methodology AMS-II.D./Ver.8, leakages need not be considered as there is no transfer of equipment. For the component categorized in renewable energy project (biogas boiler), leakages need to be considered based on AMS-I.C./Ver.9, if the energy generating equipment is transferred from another activity or if the existing equipment is transferred to another activity. However, as the biogas boiler is newly introduced for this project activity, there are no leakages to be considered.
Emission Reductions
The amount of emission reductions ERy in a given year y is given by
ERy = BEy − PEy
See the notations above.
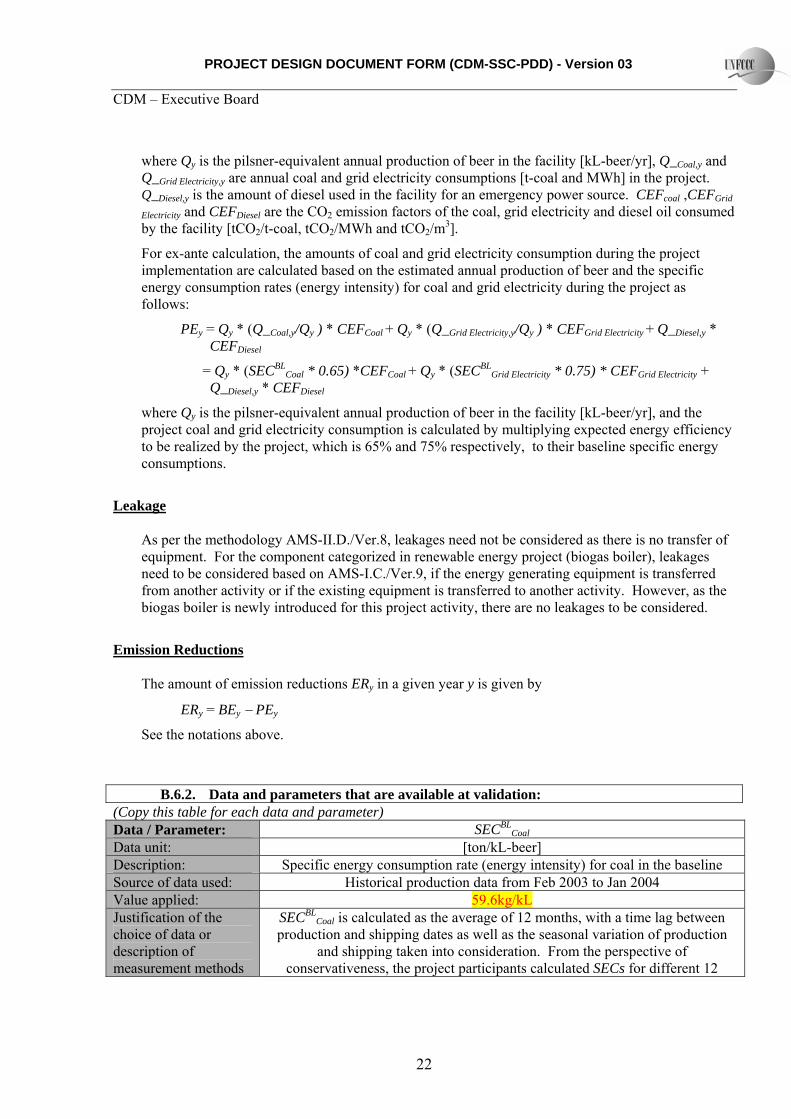
B.6.2. Data and parameters that are available at validation: (Copy this table for each data and parameter) Data / Parameter: SECBL
Coal
Data unit: [ton/kL-beer] Description: Specific energy consumption rate (energy intensity) for coal in the baseline Source of data used: Historical production data from Feb 2003 to Jan 2004 Value applied: 59.6kg/kL Justification of the choice of data or description of measurement methods
SECBLCoal is calculated as the average of 12 months, with a time lag between
production and shipping dates as well as the seasonal variation of production and shipping taken into consideration. From the perspective of
conservativeness, the project participants calculated SECs for different 12

PROJECT DESIGN DOCUMENT FORM (CDM-SSC-PDD) - Version 03 CDM – Executive Board
23
and procedures actually applied :
month periods during Dec 2002 to Jan 2004as shown in Table 2 in Annex 4, and selected the lowest SEC (that for Feb 2003 to Jan 2004) as their SECBL
Coal,. For detailed calculation, see Annex 4.
Any comment:
Data / Parameter: SECBLGrid Electricity
Data unit: [kWh/kL-beer] Description: Specific energy consumption rate for grid electricity in the baseline Source of data used: Historical production data from Feb 2003 to Jan 2004 Value applied: 91.3kWh/kL Justification of the choice of data or description of measurement methods and procedures actually applied :
SECBLGrid Electricity is calculated as the average of 12 months, with a time lag
between production and shipping dates as well as the seasonal variation of production and shipping taken into consideration. From the perspective of conservativeness, the project participants calculated SECs for different 12
month periods during Dec 2002 to Jan 2004as shown in Table 2 in Annex 4, and selected the lowest SEC (that for Feb 2003 to Jan 2004) as their SECBL
Grid
Electricity. For detailed calculation, see Annex 4. Any comment:
Data / Parameter: CEFcoal
Data unit: [tCO2/t-coal] Description: CO2 emission factors of coal consumed by the facility Source of data used: Coal specification data from the government of Viet Nam and IPCC 1996
Guidelines Value applied: 2.93tCO2/t-coal Justification of the choice of data or description of measurement methods and procedures actually applied :
Based on the calorific value on burnable basis (kcal/kg) for the coal type used at Thanh Hoa, Grain grade 1, as described in the specification data publicized by the government of Viet Nam. (See Table 4 of Annex 4.) According to the data,
the calorific value on burnable basis for Grain grade 1 is 7800kcal/kg for the average and 7550kcal/kg for the minimum value. For a sake of
conservativeness, the minimum value of 7550kcal/kg is employed to calculate CEFCoal, as follows:
CEFCoal,= Thermal Content of Coal (TJ/t)*Carbon Emission
Factor for Coal (t-C/TJ)* Carbon Oxidation Factor* Unit Conversion (CO2/C)
=7550kcal/kg * 4.186 MJ/kcal *25.8 tC/TJ * 0.98 *44/12 =2.93tCO2/t-coal
The values for Carbon Emission Factor (t-C/TJ) and Oxidation Factor are taken
from 1996 IPCC Guidelines. The calorific value of Grain grade 1 must be monitored ex-ante to check whether the above value for CEFCoal, should be
reasonable and appropriate. Any comment:
Data / Parameter: CEFGrid Electricity
Data unit: [tCO2/MWh] Description: CO2 emission factors of grid electricity

PROJECT DESIGN DOCUMENT FORM (CDM-SSC-PDD) - Version 03 CDM – Executive Board
24
Source of data used: See Institute of Energy, Electricity of Viet Nam (EVN) March 2006 and IPCC 1996 Guidelines
Value applied: 0.599 tCO2/MWh Justification of the choice of data or description of measurement methods and procedures actually applied :
Calculated using 2004 -2006 electricity data, based on AMS I.D. Ver. 10 For justification of the calculation, see Section B.6.3.
Any comment:
Data / Parameter: CEFDiesel
Data unit: [m3] Description: CO2 emission factors of diesel oil Source of data used: IPCC 1996 and 2006 Guidelines Value applied: 2.73tCO2/ m3
Justification of the choice of data or description of measurement methods and procedures actually applied :
Calculated based on the default calorific value of diesel (43.33TJ/103t) and the default CO2 emission factor (74.1tCO2/TJ) specified by the IPCC 1996 as well as2006 Guidelines as follows:
CEFDiesel,= Thermal Content of Diesel (MJ/kg)*Density (0.85kg/m3)*CO2 Emission Factor for Diesel (tCO2/TJ)
= 43.33 TJ/103t * 0.85kgm3*74.1CO2/TJ =2.73tCO2/ m3.
Any comment:
In addition to the above parameters, following information must be collected in order to check the appropriateness of the parameters to be monitored:
• specifications of replaced equipment • change of products and/or utility process that requires the change of fuel and/or equipment
B.6.3 Ex-ante calculation of emission reductions:
Baseline Emissions
Based on discussions in B.4., the baseline emission for the proposed project activity is calculated as follows:
BEy = Qy * SECBL
Coal * CEFCoal, + Qy * SECBLGrid Electricity * CEFGrid Electricity
Where: Qy Pilsner-equivalent annual production of beer in the facility [kL-beer/yr]. For annual expected production during the crediting period, see the Figure in B.6.2.
PROJECT DESIGN DOCUMENT FORM (CDM-SSC-PDD) - Version 03 CDM – Executive Board
25
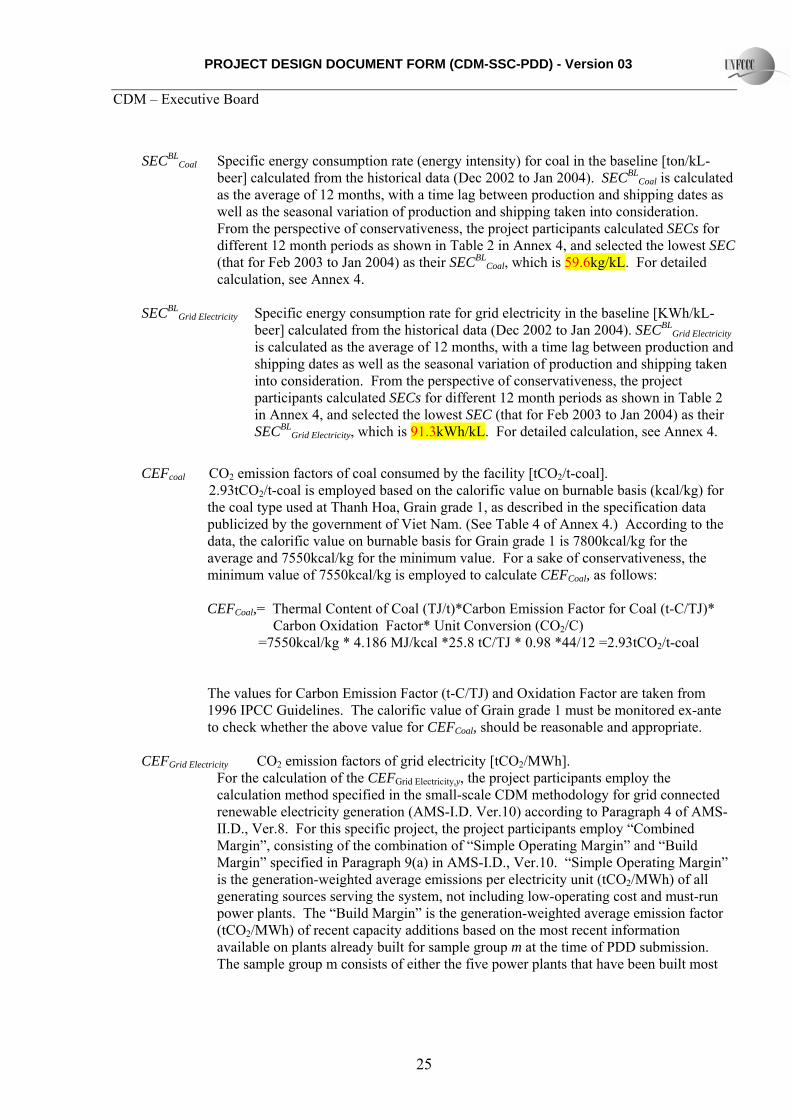
SECBLCoal Specific energy consumption rate (energy intensity) for coal in the baseline [ton/kL-
beer] calculated from the historical data (Dec 2002 to Jan 2004). SECBLCoal is calculated
as the average of 12 months, with a time lag between production and shipping dates as well as the seasonal variation of production and shipping taken into consideration. From the perspective of conservativeness, the project participants calculated SECs for different 12 month periods as shown in Table 2 in Annex 4, and selected the lowest SEC (that for Feb 2003 to Jan 2004) as their SECBL
Coal, which is 59.6kg/kL. For detailed calculation, see Annex 4.
SECBL
Grid Electricity Specific energy consumption rate for grid electricity in the baseline [KWh/kL-beer] calculated from the historical data (Dec 2002 to Jan 2004). SECBL
Grid Electricity is calculated as the average of 12 months, with a time lag between production and shipping dates as well as the seasonal variation of production and shipping taken into consideration. From the perspective of conservativeness, the project participants calculated SECs for different 12 month periods as shown in Table 2 in Annex 4, and selected the lowest SEC (that for Feb 2003 to Jan 2004) as their SECBL
Grid Electricity, which is 91.3kWh/kL. For detailed calculation, see Annex 4.
CEFcoal CO2 emission factors of coal consumed by the facility [tCO2/t-coal]. 2.93tCO2/t-coal is employed based on the calorific value on burnable basis (kcal/kg) for the coal type used at Thanh Hoa, Grain grade 1, as described in the specification data publicized by the government of Viet Nam. (See Table 4 of Annex 4.) According to the data, the calorific value on burnable basis for Grain grade 1 is 7800kcal/kg for the average and 7550kcal/kg for the minimum value. For a sake of conservativeness, the minimum value of 7550kcal/kg is employed to calculate CEFCoal, as follows:
CEFCoal,= Thermal Content of Coal (TJ/t)*Carbon Emission Factor for Coal (t-C/TJ)*
Carbon Oxidation Factor* Unit Conversion (CO2/C) =7550kcal/kg * 4.186 MJ/kcal *25.8 tC/TJ * 0.98 *44/12 =2.93tCO2/t-coal
The values for Carbon Emission Factor (t-C/TJ) and Oxidation Factor are taken from 1996 IPCC Guidelines. The calorific value of Grain grade 1 must be monitored ex-ante to check whether the above value for CEFCoal, should be reasonable and appropriate.
CEFGrid Electricity CO2 emission factors of grid electricity [tCO2/MWh].
For the calculation of the CEFGrid Electricity,y, the project participants employ the calculation method specified in the small-scale CDM methodology for grid connected renewable electricity generation (AMS-I.D. Ver.10) according to Paragraph 4 of AMS-II.D., Ver.8. For this specific project, the project participants employ “Combined Margin”, consisting of the combination of “Simple Operating Margin” and “Build Margin” specified in Paragraph 9(a) in AMS-I.D., Ver.10. “Simple Operating Margin” is the generation-weighted average emissions per electricity unit (tCO2/MWh) of all generating sources serving the system, not including low-operating cost and must-run power plants. The “Build Margin” is the generation-weighted average emission factor (tCO2/MWh) of recent capacity additions based on the most recent information available on plants already built for sample group m at the time of PDD submission. The sample group m consists of either the five power plants that have been built most

PROJECT DESIGN DOCUMENT FORM (CDM-SSC-PDD) - Version 03 CDM – Executive Board
26
recently, or the power plant capacity additions in the electricity system that comprise 20% of the system generation (in MWh) and that have been built most recently. Project participants should use from those options that sample group that comprises the larger annual generation.
CEFGrid Electricity = The average of the “Simple OM” and “BM”
Based on AMS.-I.D. Ver.10., Simple OM and BM can be calculated as follows:
(1) Simple OM
Simple OM is calculated by the following formula as average emission factor.
Simple operating margin = {Σi (EGi×k×GEFi×ρi×CO2/C÷ηi)}÷ΣiEGi
Where:
i : fuel types; Coal, Diesel Oil, Fuel Oil, Gas, etc.
EGi : yearly electricity production by sources (MWh/y) (See Institute of Energy, Electricity of Viet Nam (EVN) March 2006)
k : energy unit conversion; 1MWh = 3.6*10-3TJ
GEFi: emission factor by sources (t-C/TJ); Coal =26.8, Diesel Oil = 20.2, Fuel Oil = 21.1, Gas= 15.3 (See Revised 1996 IPCC Guidelines for National Greenhouse Gas Inventories)
ρi : oxidization proportion coefficient of carbon; Coal = 0.98, Oil = 0.99, Gas = 0.995 (See Revised 1996 IPCC Guidelines for National Greenhouse Gas Inventories)
CO2/C: unit conversion; 44/12
ηi : generating efficiency by sources (%); for the simple operation margin, Coal = 26.9, Fuel oil = 31.5, Diesel oil = 30.3, Gas = 33.2 are adopted. (See Institute of Energy, Electricity of Viet Nam (EVN) (March 2006))
From the standpoint of transparency and conservativeness of data, two methods using the following values are used to determine the approximate operating margin. The values are obtained from Institute of Energy, of which 2004 and 2005 data are actual performance while that for 2006 are predictions.
PROJECT DESIGN DOCUMENT FORM (CDM-SSC-PDD) - Version 03 CDM – Executive Board
27
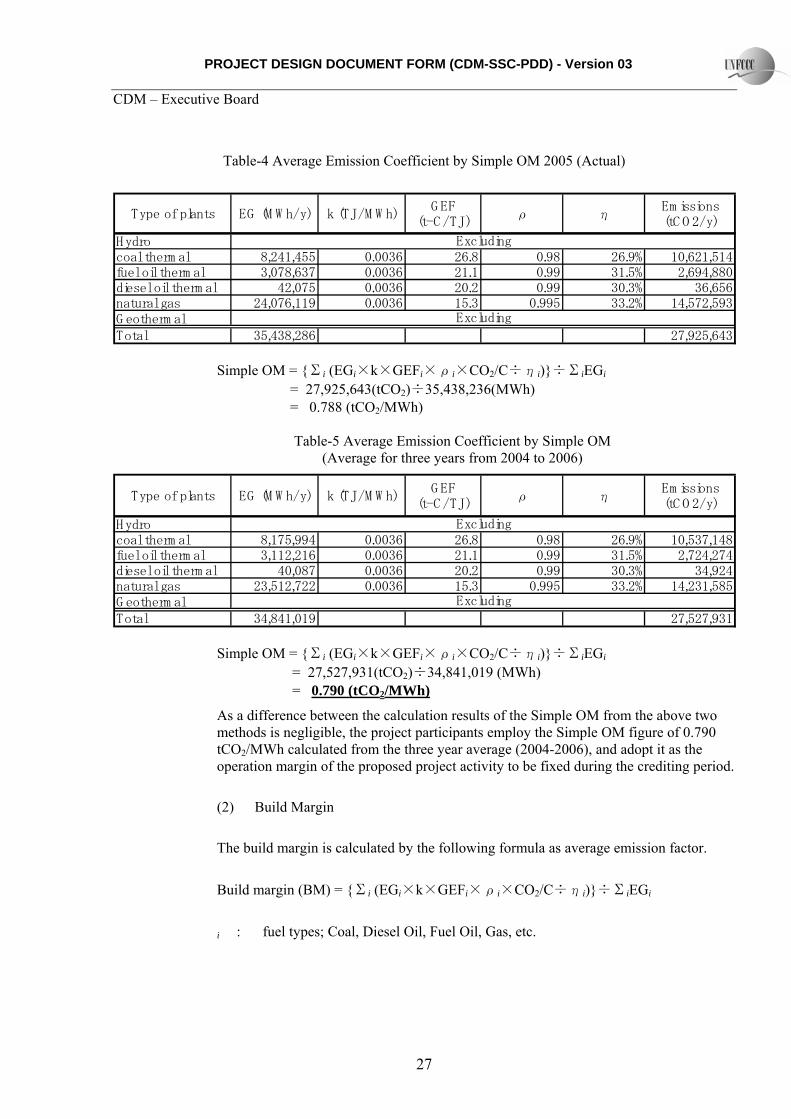
Table-4 Average Emission Coefficient by Simple OM 2005 (Actual)
Type of plants EG (M W h/y) k (TJ/M W h)G EF
(t-C /TJ)ρ η
Em issions(tC O 2/y)
Hydrocoal therm al 8,241,455 0.0036 26.8 0.98 26.9% 10,621,514fuel oil therm al 3,078,637 0.0036 21.1 0.99 31.5% 2,694,880diesel oil therm al 42,075 0.0036 20.2 0.99 30.3% 36,656natural gas 24,076,119 0.0036 15.3 0.995 33.2% 14,572,593G eotherm al Total 35,438,286 27,925,643
Excluding
Excluding
Simple OM = {Σi (EGi×k×GEFi×ρi×CO2/C÷ηi)}÷ΣiEGi = 27,925,643(tCO2)÷35,438,236(MWh) = 0.788 (tCO2/MWh)
Table-5 Average Emission Coefficient by Simple OM
(Average for three years from 2004 to 2006)
Type of plants EG (M W h/y) k (TJ/M W h)G EF
(t-C /TJ)ρ η
Em issions(tC O 2/y)
Hydrocoal therm al 8,175,994 0.0036 26.8 0.98 26.9% 10,537,148fuel oil therm al 3,112,216 0.0036 21.1 0.99 31.5% 2,724,274diesel oil therm al 40,087 0.0036 20.2 0.99 30.3% 34,924natural gas 23,512,722 0.0036 15.3 0.995 33.2% 14,231,585G eotherm al Total 34,841,019 27,527,931
Excluding
Excluding
Simple OM = {Σi (EGi×k×GEFi×ρi×CO2/C÷ηi)}÷ΣiEGi = 27,527,931(tCO2)÷34,841,019 (MWh)
= 0.790 (tCO2/MWh)
As a difference between the calculation results of the Simple OM from the above two methods is negligible, the project participants employ the Simple OM figure of 0.790 tCO2/MWh calculated from the three year average (2004-2006), and adopt it as the operation margin of the proposed project activity to be fixed during the crediting period.
(2) Build Margin
The build margin is calculated by the following formula as average emission factor.
Build margin (BM) = {Σi (EGi×k×GEFi×ρi×CO2/C÷ηi)}÷ΣiEGi
i : fuel types; Coal, Diesel Oil, Fuel Oil, Gas, etc.

PROJECT DESIGN DOCUMENT FORM (CDM-SSC-PDD) - Version 03 CDM – Executive Board
28
EGi : yearly electricity production by sources (MWh/y) (See Institute of Energy, Electricity of Viet Nam (EVN) March 2006)
k : energy unit conversion; 1MWh = 3.6*10-3TJ
GEFi: emission factor by sources (t-C/TJ); Coal =25.8, Diesel Oil = 20.2, Fuel Oil = 21.1, Gas= 15.3 (See Revised 1996 IPCC Guidelines for National Greenhouse Gas Inventories)
ρi : oxidization proportion coefficient of carbon; Coal = 0.98, Oil = 0.99, Gas = 0.995 (See Revised 1996 IPCC Guidelines for National Greenhouse Gas Inventories)
CO2/C: unit conversion; 44/12
ηi : generating efficiency by sources (%); for the build margin, Coal = 35.0, Gas = 50.0 are adopted. (See Institute of Energy, Electricity of Viet Nam (EVN) (March 2006))
In terms of the build margin, it is impossible to cover all the power sources including small-scale ones and, thus, calculation is made as to the following five large-scale power sources which are scheduled to launch operation by 2005 according to data obtained from EVN and Institute of Energy.
Table-6 Average Emission Coefficient by Build Margin
Year ofoperation
Nam eType ofplants
EG (M W h/y) k (TJ/M W h)G EF
(t-C /TJ)ρ η
Em issions (T-C O 2/y)
2004 Plu M y 3 gas 6,307,200 0.0036 15.3 0.995 50.0% 2,534,8662004 Na D uong coal 145,817 0.0036 25.8 0.98 35.0% 139,0462005 Phu M y 2-2 gas 456,500 0.0036 15.3 0.995 50.0% 183,4682005 Phu M y 4 gas 2,774,000 0.0036 15.3 0.995 50.0% 1,114,8722005 Phu M Y 2-1EXT gas 5,771,000 0.0036 15.3 0.995 50.0% 2,319,367Total 15,454,517 6,291,619
Build margin (BM) = {Σi (EGi×k×GEFi×ρi×CO2/C÷ηi)}÷ΣiEGi
= 6,291,619 (tCO2) ÷15,454,517 (MWh) = 0.407 (tCO2/MWh)
(3) Emission Coefficient
Grid emission factor is defined as the average of Simple OM and BM

PROJECT DESIGN DOCUMENT FORM (CDM-SSC-PDD) - Version 03 CDM – Executive Board
29
(0.790 + 0.407) kgCO2/KWh ÷ 2 = 0.599 tCO2/MWh
With the rate for each term given above, the estimate baseline emissions are available by plugging those numbers into the formula below:
BEy = Qy * SECBLCoal * CEFCoal + Qy * SECBL
Grid Electricity * CEFGrid Electricity
BE2009=100,000kL*59.6kg/kL*2.93tCO2/t+100,000kL*91.3KWh/kL*0.599tCO2/MWh
= 22,932tCO2
Project Emissions
Based on discussions in B.4., the project emission for the proposed project activity is calculated ex-ante as follows:
PEy = Qy * (SECBLCoal * 65%) *CEFCoal + Qy * (SECBL
Grid Electricity * 75%) * CEFGrid Electricity + Q_Diesel,y * CEFDiesel
Where: SECBL
Coal Specific energy consumption rate (energy intensity) for coal in the baseline [ton/kL-beer]. See explanations in the above paragraphs for Baseline Emissions for details. Since the
specific energy consumption for coal is assumed to be reduced by 35%, 65% of SECBLCoal,,
which is 38.7 kg/kL, is used for ex-ante calculation. SECBL
Grid Electricity Specific energy consumption rate for grid electricity in the baseline [KWh/kL-beer]. See explanations in the above paragraphs for Baseline Emissions for details. Since the specific energy consumption for grid electricity is assumed to be reduced by 25%, 75% of SECBL
Grid Electricity,, which is 68.5KWh/kL is used for ex-ante calculation.
Q_Diesel,y Amount of diesel oil used in the facility for an emergency power source [m3].
Usually, diesel oil consumption for in-house power generation can be disregarded because it is for emergency power supply and has historically been accounting for less than 5% of the total fuel use in the factory. The use of diesel oil for emergency power supply is due to local electricity supply conditions and is not influenced by the implementation of the project activity. The capacity of the emergency diesel generators is approximately only 40% of the whole demand in the project factory. The emergency generators are only used to operate the essential equipment for beer production and not for the energy-saving equipment. The energy-saving equipment is to be temporarily stopped while the emergency generators are operated. In addition, the use of diesel oil for emergency power supply is expected to be reduced with the future improvement in the local electricity supply conditions. Therefore, Q_Diesel,y is assumed to be 0m3 for ex-ante calculation.
CEFDiesel CO2 emission factors of diesel oil [tCO2/m3].
PROJECT DESIGN DOCUMENT FORM (CDM-SSC-PDD) - Version 03 CDM – Executive Board
30
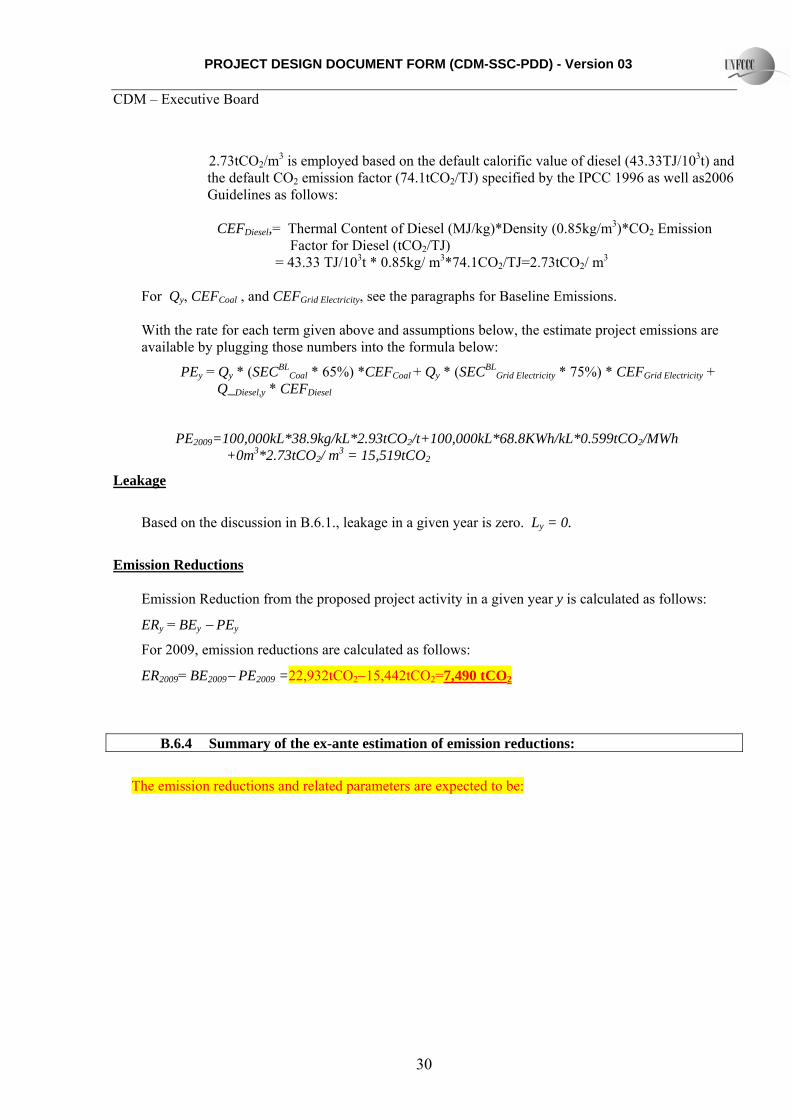
2.73tCO2/m3 is employed based on the default calorific value of diesel (43.33TJ/103t) and the default CO2 emission factor (74.1tCO2/TJ) specified by the IPCC 1996 as well as2006 Guidelines as follows:
CEFDiesel,= Thermal Content of Diesel (MJ/kg)*Density (0.85kg/m3)*CO2 Emission
Factor for Diesel (tCO2/TJ) = 43.33 TJ/103t * 0.85kg/ m3*74.1CO2/TJ=2.73tCO2/ m3
For Qy, CEFCoal , and CEFGrid Electricity, see the paragraphs for Baseline Emissions.
With the rate for each term given above and assumptions below, the estimate project emissions are available by plugging those numbers into the formula below:
PEy = Qy * (SECBLCoal * 65%) *CEFCoal + Qy * (SECBL
Grid Electricity * 75%) * CEFGrid Electricity + Q_Diesel,y * CEFDiesel
PE2009=100,000kL*38.9kg/kL*2.93tCO2/t+100,000kL*68.8KWh/kL*0.599tCO2/MWh +0m3*2.73tCO2/ m3 = 15,519tCO2
Leakage
Based on the discussion in B.6.1., leakage in a given year is zero. Ly = 0.
Emission Reductions
Emission Reduction from the proposed project activity in a given year y is calculated as follows:
ERy = BEy − PEy
For 2009, emission reductions are calculated as follows:
ER2009= BE2009− PE2009 =22,932tCO2−15,442tCO2=7,490 tCO2
B.6.4 Summary of the ex-ante estimation of emission reductions:
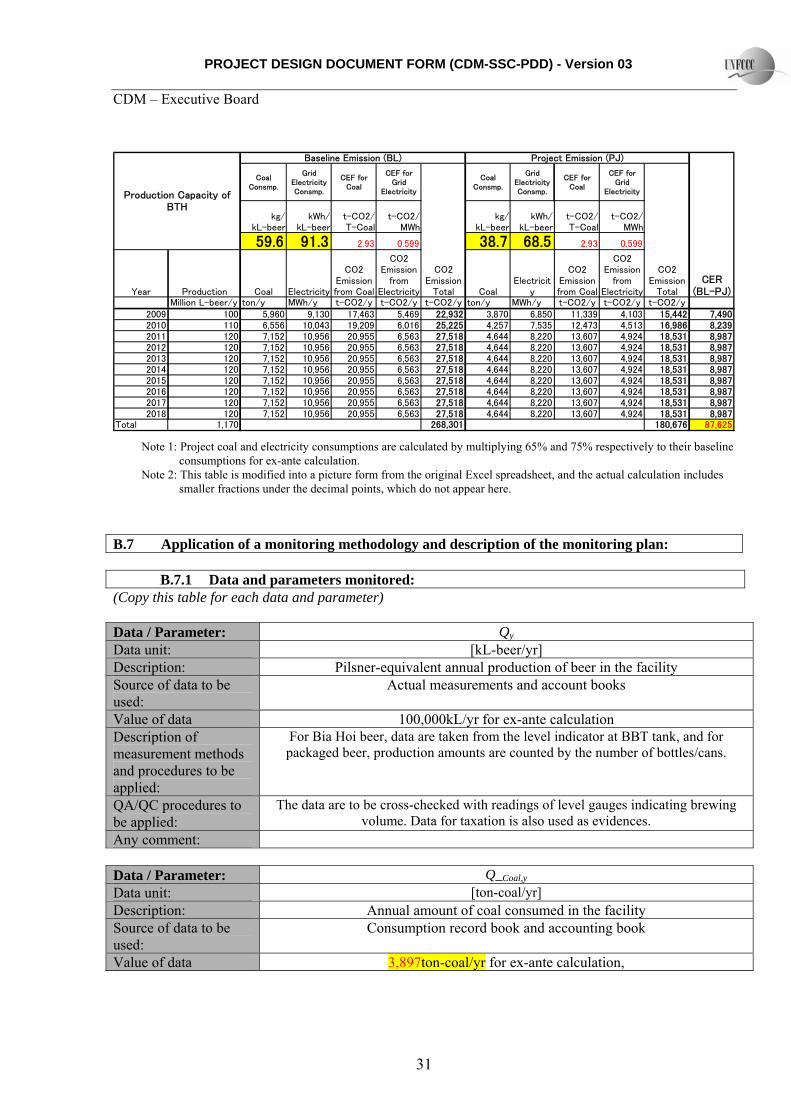
The emission reductions and related parameters are expected to be:
PROJECT DESIGN DOCUMENT FORM (CDM-SSC-PDD) - Version 03 CDM – Executive Board
31
CoalConsmp.
GridElectricityConsmp.
CEF forCoal
CEF forGrid
Electricity
CoalConsmp.
GridElectricityConsmp.
CEF forCoal
CEF forGrid
Electricity
kg/kL-beer
kWh/kL-beer
t-CO2/T-Coal
t-CO2/MWh
kg/kL-beer
kWh/kL-beer
t-CO2/T-Coal
t-CO2/MWh
59.6 91.3 2.93 0.599 2.93 0.59938.7 68.5
Year Production Coal Electricity
CO2Emissionfrom Coal
CO2Emission
fromElectricity
CO2Emission
Total CoalElectricit
y
CO2Emissionfrom Coal
CO2Emission
fromElectricity
CO2Emission
TotalCER
(BL-PJ)Million L-beer/y ton/y MWh/y t-CO2/y t-CO2/y t-CO2/y ton/y MWh/y t-CO2/y t-CO2/y t-CO2/y
2009 100 5,960 9,130 17,463 5,469 22,932 3,870 6,850 11,339 4,103 15,442 7,4902010 110 6,556 10,043 19,209 6,016 25,225 4,257 7,535 12,473 4,513 16,986 8,2392011 120 7,152 10,956 20,955 6,563 27,518 4,644 8,220 13,607 4,924 18,531 8,9872012 120 7,152 10,956 20,955 6,563 27,518 4,644 8,220 13,607 4,924 18,531 8,9872013 120 7,152 10,956 20,955 6,563 27,518 4,644 8,220 13,607 4,924 18,531 8,9872014 120 7,152 10,956 20,955 6,563 27,518 4,644 8,220 13,607 4,924 18,531 8,9872015 120 7,152 10,956 20,955 6,563 27,518 4,644 8,220 13,607 4,924 18,531 8,9872016 120 7,152 10,956 20,955 6,563 27,518 4,644 8,220 13,607 4,924 18,531 8,9872017 120 7,152 10,956 20,955 6,563 27,518 4,644 8,220 13,607 4,924 18,531 8,9872018 120 7,152 10,956 20,955 6,563 27,518 4,644 8,220 13,607 4,924 18,531 8,987
Total 1,170 268,301 180,676
Baseline Emission (BL) Project Emission (PJ)
Production Capacity ofBTH
87,625 Note 1: Project coal and electricity consumptions are calculated by multiplying 65% and 75% respectively to their baseline
consumptions for ex-ante calculation. Note 2: This table is modified into a picture form from the original Excel spreadsheet, and the actual calculation includes
smaller fractions under the decimal points, which do not appear here.
B.7 Application of a monitoring methodology and description of the monitoring plan:
B.7.1 Data and parameters monitored: (Copy this table for each data and parameter) Data / Parameter: Qy
Data unit: [kL-beer/yr] Description: Pilsner-equivalent annual production of beer in the facility Source of data to be used:
Actual measurements and account books
Value of data 100,000kL/yr for ex-ante calculation Description of measurement methods and procedures to be applied:
For Bia Hoi beer, data are taken from the level indicator at BBT tank, and for packaged beer, production amounts are counted by the number of bottles/cans.
QA/QC procedures to be applied:
The data are to be cross-checked with readings of level gauges indicating brewing volume. Data for taxation is also used as evidences.
Any comment:
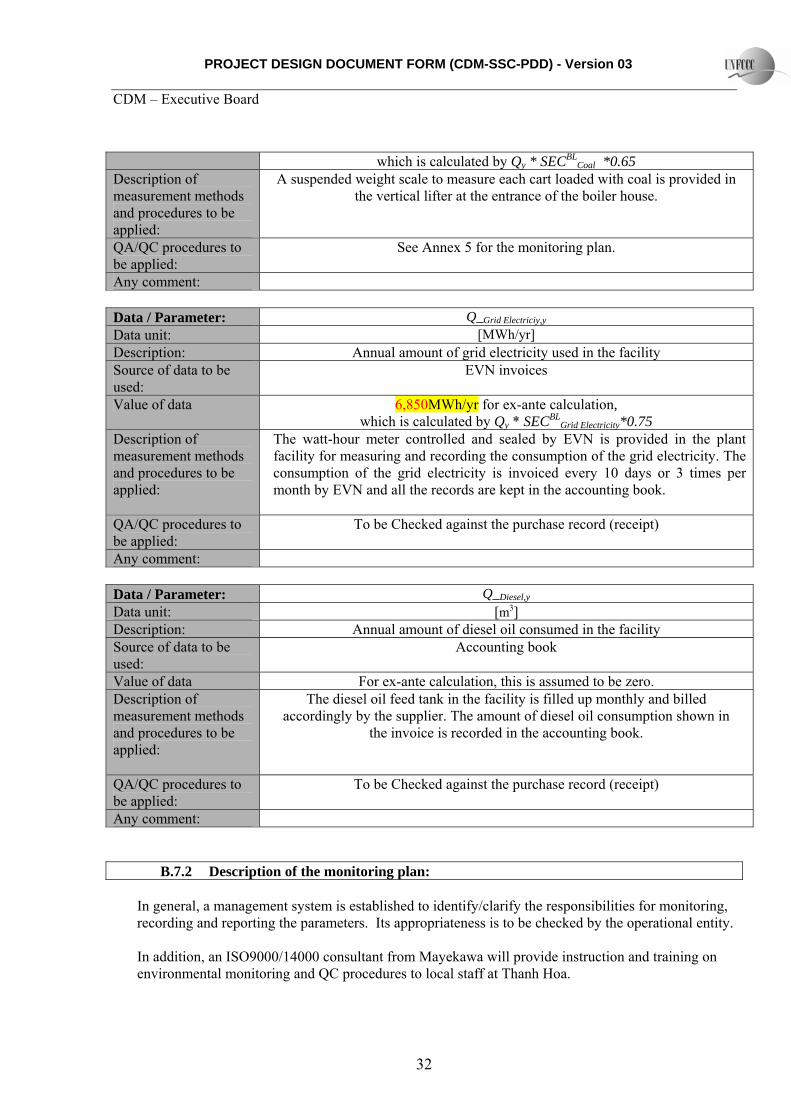
Data / Parameter: Q_Coal,y
Data unit: [ton-coal/yr] Description: Annual amount of coal consumed in the facility Source of data to be used:
Consumption record book and accounting book
Value of data 3,897ton-coal/yr for ex-ante calculation,
PROJECT DESIGN DOCUMENT FORM (CDM-SSC-PDD) - Version 03 CDM – Executive Board
32
which is calculated by Qy * SECBLCoal *0.65
Description of measurement methods and procedures to be applied:
A suspended weight scale to measure each cart loaded with coal is provided in the vertical lifter at the entrance of the boiler house.
QA/QC procedures to be applied:
See Annex 5 for the monitoring plan.
Any comment: Data / Parameter: Q_Grid Electriciy,y
Data unit: [MWh/yr] Description: Annual amount of grid electricity used in the facility Source of data to be used:
EVN invoices
Value of data 6,850MWh/yr for ex-ante calculation, which is calculated by Qy * SECBL
Grid Electricity*0.75 Description of measurement methods and procedures to be applied:
The watt-hour meter controlled and sealed by EVN is provided in the plant facility for measuring and recording the consumption of the grid electricity. The consumption of the grid electricity is invoiced every 10 days or 3 times per month by EVN and all the records are kept in the accounting book.
QA/QC procedures to be applied:
To be Checked against the purchase record (receipt)
Any comment:
Data / Parameter: Q_Diesel,y
Data unit: [m3] Description: Annual amount of diesel oil consumed in the facility Source of data to be used:
Accounting book
Value of data For ex-ante calculation, this is assumed to be zero. Description of measurement methods and procedures to be applied:
The diesel oil feed tank in the facility is filled up monthly and billed accordingly by the supplier. The amount of diesel oil consumption shown in
the invoice is recorded in the accounting book.
QA/QC procedures to be applied:
To be Checked against the purchase record (receipt)
Any comment: B.7.2 Description of the monitoring plan:
In general, a management system is established to identify/clarify the responsibilities for monitoring, recording and reporting the parameters. Its appropriateness is to be checked by the operational entity. In addition, an ISO9000/14000 consultant from Mayekawa will provide instruction and training on environmental monitoring and QC procedures to local staff at Thanh Hoa.

PROJECT DESIGN DOCUMENT FORM (CDM-SSC-PDD) - Version 03 CDM – Executive Board
33
B.8 Date of completion of the application of the baseline and monitoring methodology and the name of the responsible person(s)/entity(ies)
Date of completion 15/11/2007
Name of the responsible persons determining the baseline and monitoring methodology:
Mr. Hidefumi Nakashima New Energy and Industrial Technology Development Organization (NEDO) [email protected](Project Participant) Dr. Naoki Matsuo Climate Experts Ltd. [email protected](Not Project Participant)
Ms. Asako Yamamoto Climate Experts Ltd. [email protected](Not Project Participant)

PROJECT DESIGN DOCUMENT FORM (CDM-SSC-PDD) - Version 03 CDM – Executive Board
34
SECTION C. Duration of the project activity / crediting period C.1 Duration of the project activity: C.1.1. Starting date of the project activity:
25/05/2004 (Starting date of implementation)
C.1.2. Expected operational lifetime of the project activity:
30 years C.2 Choice of the crediting period and related information: C.2.1. Renewable crediting period C.2.1.1. Starting date of the first crediting period:
Not applicable. C.2.1.2. Length of the first crediting period:
Not applicable. C.2.2. Fixed crediting period: C.2.2.1. Starting date:
01/01/2009 or the date of registration whichever is later. C.2.2.2. Length:
10 years

PROJECT DESIGN DOCUMENT FORM (CDM-SSC-PDD) - Version 03 CDM – Executive Board
35
SECTION D. Environmental impacts D.1. If required by the host Party, documentation on the analysis of the environmental impacts of the project activity:
The environmental impact analysis (EIA) for this proposed project activity was conducted as follows at the direction of CDM National Executive and Consultative Board and, was confirmed by Ministry of Natural Resources and Environment of Viet Nam on July 29, 2004.
In general, the project reduces environmental impact as follows:
Wastewater:
In the conventional method, wastewater is discharged after dilution only. The load by the wastewater will be reduced significantly—around a half by implementing this project.
Air pollution:
Air pollution will be mitigated by reduction of coal consumption.
The project does not increase toxic emissions.
Reports on measurement of noise and air pollution of the plant are submitted to the city office once a year and environmental standards are cleared. Additionally, emissions from the traffic on Route-1 are greater than that of BTH’s which results in no complaints to BTH.
For wastewater, because of substantial amounts of emissions from household wastewater in the vicinity, constant discharge of diluted wastewater from BTH contributes someway to the dilution of the wastewater content of the entire area.
BTH reports analysis of wastewater once a year. According to analysis of 2002, several items exceed standards (COD 110 [100] mg/L, BOD 72 [50] mg/L in Vietnamese Standard TCVN5945-1995). BTH is planning to buy neighboring property for aerobic treatment of wastewater in the future and obtain a permit for plant operation.
BTH has acquired ISO9000 certification already and is increasing production by consignment production for other companies. However, emissions may increase without control if no action is taken. Due to this background, we expect great benefit from this project.
BTH plans to obtain ISO14000 certification after implementation of this project based on CDM and expects to become an internationally competitive beer company.
Furthermore, reduction of utility costs is expected from this project due to energy saving effect and water saving effect. This will contribute to reduced production costs for beer which will be refunded broadly to consumers in general.
For further information on environmental impact assessment, see Annex 6.
D.2. If environmental impacts are considered significant by the project participants or the host Party, please provide conclusions and all references to support documentation of an environmental impact assessment undertaken in accordance with the procedures as required by the host Party:

PROJECT DESIGN DOCUMENT FORM (CDM-SSC-PDD) - Version 03 CDM – Executive Board
36
Not Applicable.

PROJECT DESIGN DOCUMENT FORM (CDM-SSC-PDD) - Version 03 CDM – Executive Board
37
SECTION E. Stakeholders’ comments E.1. Brief description how comments by local stakeholders have been invited and compiled: Upon consultation with the People’s Committee of Thanh Hoa Province, presentation about this project was given to neighbourhood residents and the office of environmental issues of Thanh Hoa City for their comprehension.
Comments received at:
1) The People’s committee of Thanh Hoa Province dated on 12th July, 2004
2) HABECO dated on 14th July, 2004
3) Stakeholders’ meeting at BTH dated on 9th December, 2004
BTH issued invitation letters for the stakeholders’ meeting to neighbourhood residents and Provincial, City and District People’s Committees as well as relevant ministry offices. An article about this stakeholders’ meeting appeared in the local newspaper.
Total 47 local representatives were present for the meeting: 3 members from the People’s Committee of Thanh Hoa Province, 2 members from the People’s Committee of Thanh Hoa City, 8 members from the ministry offices of Thanh Hoa Province, 5 people from mass media, 3 members each from the People’s Committees of Dong Ve and Ngoc Trao Districts, 15 local residents from Dong Ve District, and 8 local residents from Ngoc Trao District.
The representatives from Japan are: 3 officials from NEDO and 1 representative from MYCOM.
E.2. Summary of the comments received:
1) The People’s committee of Thanh Hoa province dated on 12th July, 2004
After reviewing the project, The People Committee of Thanh Hoa province recognized that this is a sustainable development project. It helps the brewery do well the environment protection through reduction of polluted wastes and saving of the energy. This project has not only economic efficiency but also social efficiency, and contributes to motivate the sustainable development of the brewery in future.
2) HABECO dated on 14th July, 2004 (Minutes of the meeting on the model project)
100% participants approve the NEDO project at Thanh Hoa Beer Joint Stock Company.
The meeting has consensus to propose to the Ministry of Industry, Ministry of Natural Resources and Environment make good conditions for the project to be extended and carried out soon.
The minutes is read at the meeting and voted to approve the project.
3) Stakeholders’ meeting on 9th December, 2004. Comments by Mr. Lu Kha Cat, representative of People’s Committee of Thanh Hoa province.
This is an outstanding project achieving energy saving and environmental improvements simultaneously. We hope that this project will be implemented as soon as possible with effective

PROJECT DESIGN DOCUMENT FORM (CDM-SSC-PDD) - Version 03 CDM – Executive Board
38
performances and also hope NEDO to expand such projects to sugar and paper industries in Thanh Hoa in the future. For further information, see Annex 7.
E.3. Report on how due account was taken of any comments received:
Not Applicable.
PROJECT DESIGN DOCUMENT FORM (CDM-SSC-PDD) - Version 03 CDM – Executive Board
39
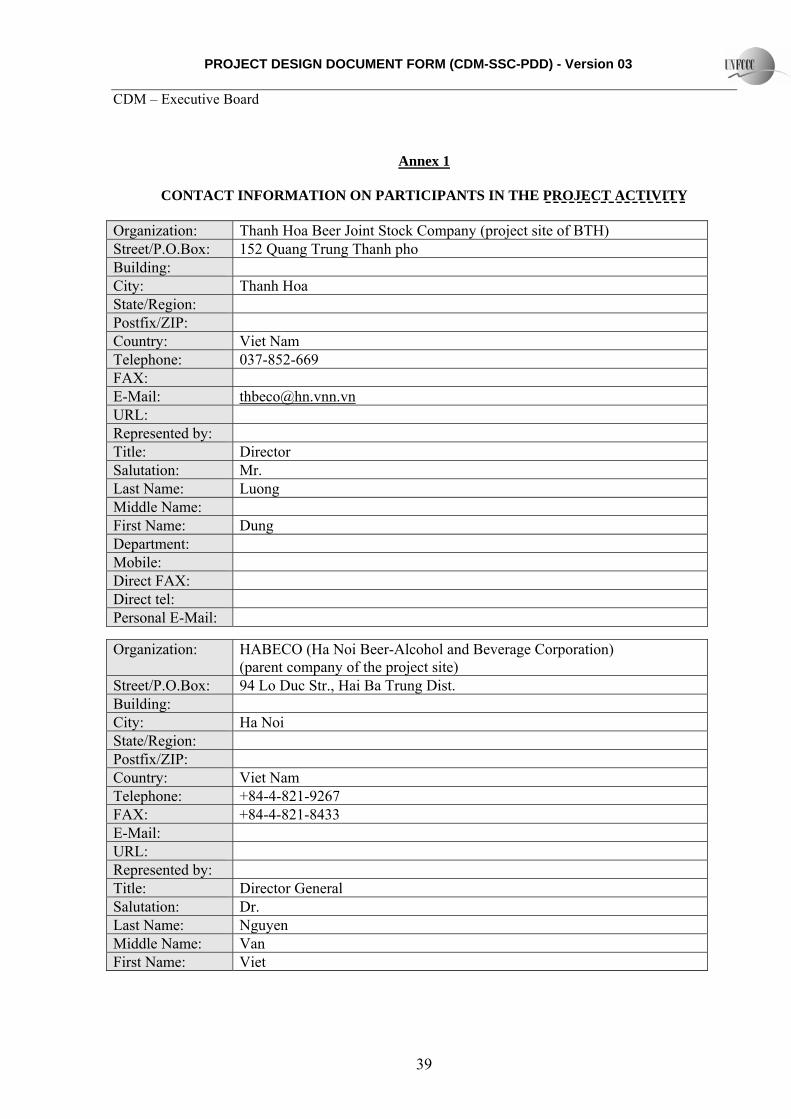
Annex 1
CONTACT INFORMATION ON PARTICIPANTS IN THE PROJECT ACTIVITY
Organization: Thanh Hoa Beer Joint Stock Company (project site of BTH) Street/P.O.Box: 152 Quang Trung Thanh pho Building: City: Thanh Hoa State/Region: Postfix/ZIP: Country: Viet Nam Telephone: 037-852-669 FAX: E-Mail: [email protected]: Represented by: Title: Director Salutation: Mr. Last Name: Luong Middle Name: First Name: Dung Department: Mobile: Direct FAX: Direct tel: Personal E-Mail:
Organization: HABECO (Ha Noi Beer-Alcohol and Beverage Corporation) (parent company of the project site)
Street/P.O.Box: 94 Lo Duc Str., Hai Ba Trung Dist. Building: City: Ha Noi State/Region: Postfix/ZIP: Country: Viet Nam Telephone: +84-4-821-9267 FAX: +84-4-821-8433 E-Mail: URL: Represented by: Title: Director General Salutation: Dr. Last Name: Nguyen Middle Name: Van First Name: Viet

PROJECT DESIGN DOCUMENT FORM (CDM-SSC-PDD) - Version 03 CDM – Executive Board
40
Department: Mobile: Direct FAX: Direct tel: Personal E-Mail: [email protected] Organization: The Technical Institute of Brewing of Hanoi Beer-Alcohol and Beverage
Corporation (Former The Research Institute of Brewing (RIB)) Street/P.O.Box: 94 Lo Duc Str., Hai Ba Trung Dist. Building: City: Ha Noi State/Region: Postfix/ZIP: Country: Viet Nam Telephone: +84-4-662-0911 FAX: +84-4-662-1727 E-Mail: [email protected]: Represented by: Title: Director Salutation: Mr. Last Name: Tran Middle Name: Dinh First Name: Thanh Department: Mobile: Direct FAX: Direct tel: Personal E-Mail: [email protected] Organization: MOIT (Ministry of Industry and Trade – Former Ministry of Industry
(MOI), Government office in charge of HABECO) Street/P.O.Box: 54 Hai Ba Trung Str. Hoan Kiem Dist. Building: City: Ha Noi State/Region: Postfix/ZIP: Country: Viet Nam Telephone: +84-4-824-6762 FAX: +84-4-826-5303 E-Mail: URL: http://www.moi.gov.vn/ Represented by: Title: Deputy Director General Salutation: Ms.

PROJECT DESIGN DOCUMENT FORM (CDM-SSC-PDD) - Version 03 CDM – Executive Board
41
Last Name: Huong Middle Name: Phan Thu First Name: Dang Department: Department of International Cooperation Mobile: Direct FAX: Direct tel: Personal E-Mail: [email protected] Organization: NEDO (New Energy and Industrial Technology Development
Organization) (CERs Credit Holder) Street/P.O.Box: 1310, Omiya-cho, Saiwai-ku Building: Muza Kawasaki Building City: Kawasaki State/Region: Kanagawa Postfix/ZIP: 212-8554 Country: Japan Telephone: +81-44-520-5185 FAX: +81-44-520-5196 E-Mail: URL: http://www.nedo.go.jpRepresented by: Title: Director General Salutation: Mr. Last Name: Nakashima Middle Name: First Name: Hidefumi Department: Kyoto Mechanisms Promotion Department Mobile: Direct FAX: Direct tel: Personal E-Mail: [email protected] Organization: Mayekawa Mfg, Co., Ltd. Street/P.O.Box: 2-13-1, Botan Building: City: Koto-ku State/Region: Tokyo Postfix/ZIP: 135-8182 Country: Japan Telephone: +81-3-3642-8088 FAX: +81-3-3643-7094 E-Mail: URL: http://www.mycomj.co.jpRepresented by:
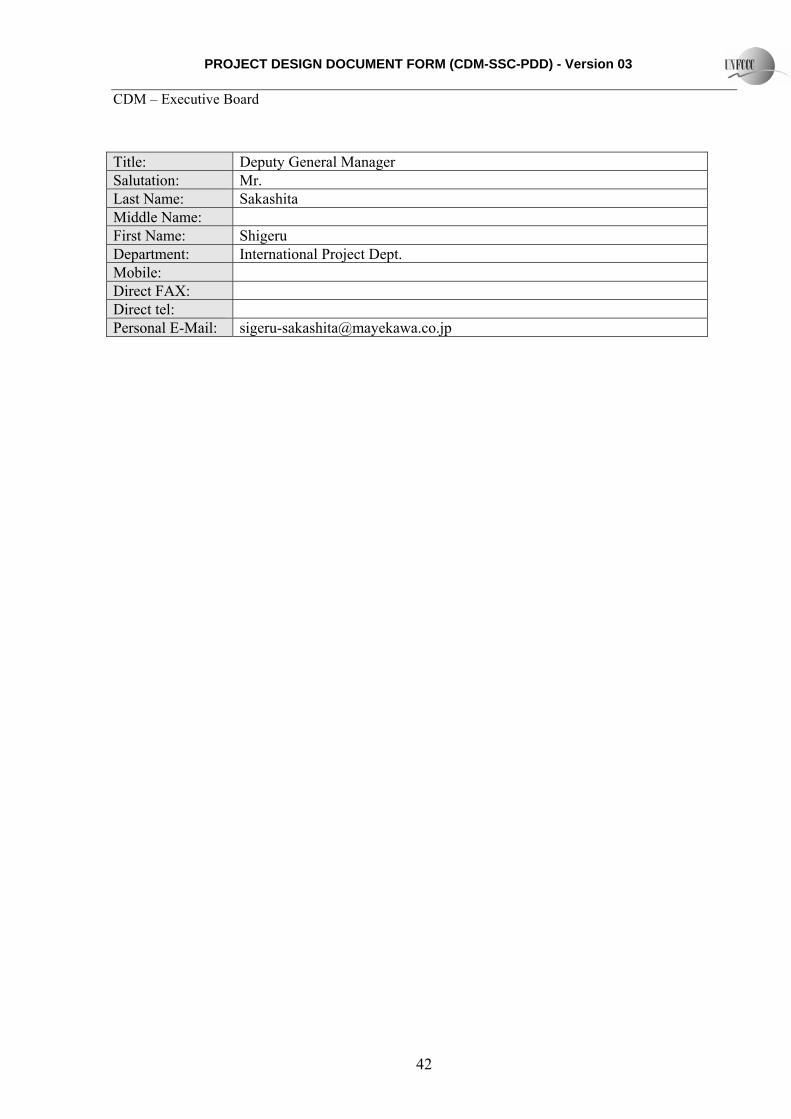
PROJECT DESIGN DOCUMENT FORM (CDM-SSC-PDD) - Version 03 CDM – Executive Board
42
Title: Deputy General Manager Salutation: Mr. Last Name: Sakashita Middle Name: First Name: Shigeru Department: International Project Dept. Mobile: Direct FAX: Direct tel: Personal E-Mail: [email protected]
PROJECT DESIGN DOCUMENT FORM (CDM-SSC-PDD) - Version 03 CDM – Executive Board
43
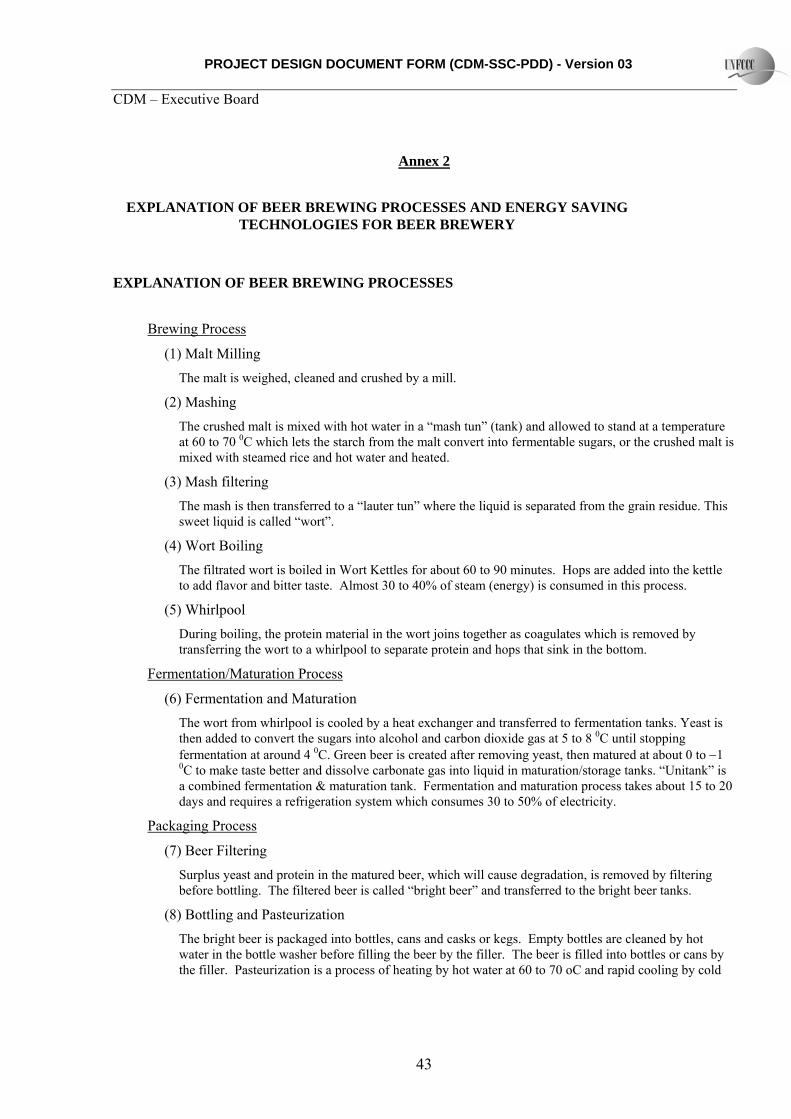
Annex 2
EXPLANATION OF BEER BREWING PROCESSES AND ENERGY SAVING TECHNOLOGIES FOR BEER BREWERY
EXPLANATION OF BEER BREWING PROCESSES
Brewing Process
(1) Malt Milling The malt is weighed, cleaned and crushed by a mill.
(2) Mashing The crushed malt is mixed with hot water in a “mash tun” (tank) and allowed to stand at a temperature at 60 to 70 0C which lets the starch from the malt convert into fermentable sugars, or the crushed malt is mixed with steamed rice and hot water and heated.
(3) Mash filtering The mash is then transferred to a “lauter tun” where the liquid is separated from the grain residue. This sweet liquid is called “wort”.
(4) Wort Boiling The filtrated wort is boiled in Wort Kettles for about 60 to 90 minutes. Hops are added into the kettle to add flavor and bitter taste. Almost 30 to 40% of steam (energy) is consumed in this process.
(5) Whirlpool During boiling, the protein material in the wort joins together as coagulates which is removed by transferring the wort to a whirlpool to separate protein and hops that sink in the bottom.
Fermentation/Maturation Process
(6) Fermentation and Maturation The wort from whirlpool is cooled by a heat exchanger and transferred to fermentation tanks. Yeast is then added to convert the sugars into alcohol and carbon dioxide gas at 5 to 8 0C until stopping fermentation at around 4 0C. Green beer is created after removing yeast, then matured at about 0 to −1 0C to make taste better and dissolve carbonate gas into liquid in maturation/storage tanks. “Unitank” is a combined fermentation & maturation tank. Fermentation and maturation process takes about 15 to 20 days and requires a refrigeration system which consumes 30 to 50% of electricity.
Packaging Process
(7) Beer Filtering Surplus yeast and protein in the matured beer, which will cause degradation, is removed by filtering before bottling. The filtered beer is called “bright beer” and transferred to the bright beer tanks.
(8) Bottling and Pasteurization The bright beer is packaged into bottles, cans and casks or kegs. Empty bottles are cleaned by hot water in the bottle washer before filling the beer by the filler. The beer is filled into bottles or cans by the filler. Pasteurization is a process of heating by hot water at 60 to 70 oC and rapid cooling by cold
PROJECT DESIGN DOCUMENT FORM (CDM-SSC-PDD) - Version 03 CDM – Executive Board
44
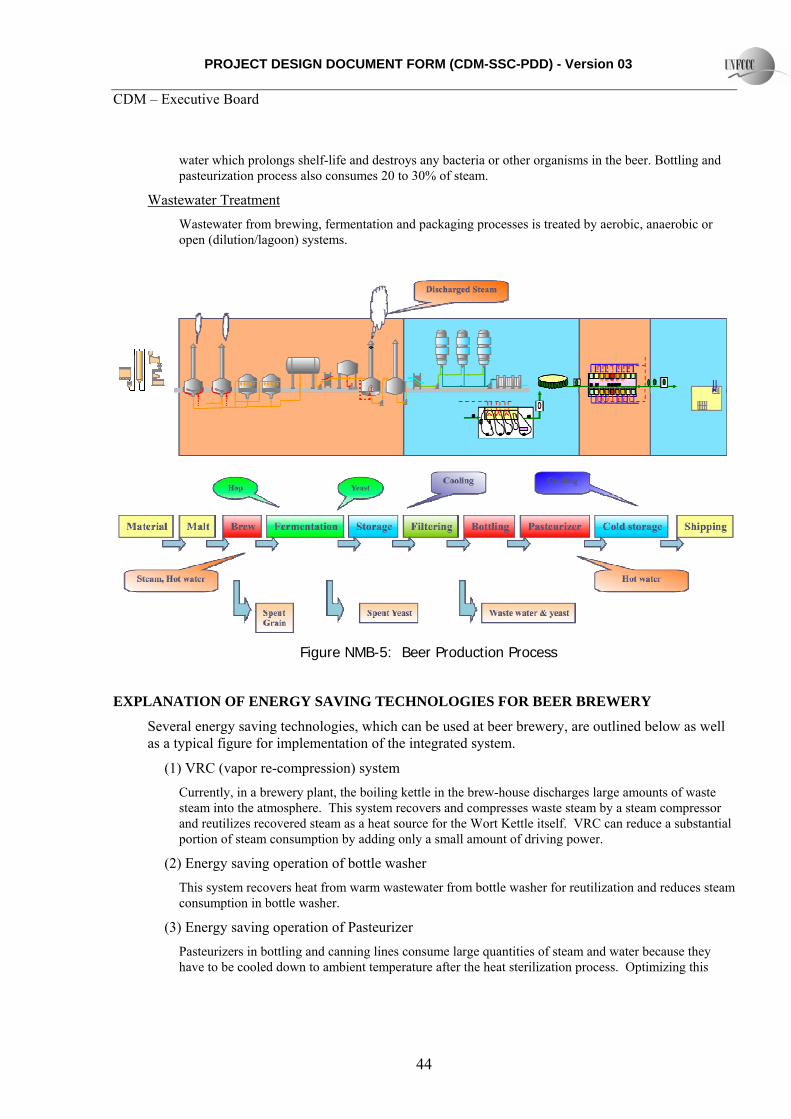
water which prolongs shelf-life and destroys any bacteria or other organisms in the beer. Bottling and pasteurization process also consumes 20 to 30% of steam.
Wastewater Treatment Wastewater from brewing, fermentation and packaging processes is treated by aerobic, anaerobic or open (dilution/lagoon) systems.
Figure NMB-5: Beer Production Process
EXPLANATION OF ENERGY SAVING TECHNOLOGIES FOR BEER BREWERY
Several energy saving technologies, which can be used at beer brewery, are outlined below as well as a typical figure for implementation of the integrated system.
(1) VRC (vapor re-compression) system Currently, in a brewery plant, the boiling kettle in the brew-house discharges large amounts of waste steam into the atmosphere. This system recovers and compresses waste steam by a steam compressor and reutilizes recovered steam as a heat source for the Wort Kettle itself. VRC can reduce a substantial portion of steam consumption by adding only a small amount of driving power.
(2) Energy saving operation of bottle washer This system recovers heat from warm wastewater from bottle washer for reutilization and reduces steam consumption in bottle washer.
(3) Energy saving operation of Pasteurizer Pasteurizers in bottling and canning lines consume large quantities of steam and water because they have to be cooled down to ambient temperature after the heat sterilization process. Optimizing this

PROJECT DESIGN DOCUMENT FORM (CDM-SSC-PDD) - Version 03 CDM – Executive Board
45
process by a heat pump system will reduce steam consumption. (Reduction of steam consumption without wasting energy).
(4) Improvement of refrigeration system
4-1. Cascade cooling system Water used in the brewing process is chilled to approximately 3 0C from ambient temperature. Because of its large temperature differential for cooling down, it is more efficient to run multiple chiller units in series (Cascade cooling system) rather than a single chiller unit so that refrigeration COP (Co-efficient of Performance) can be improved to 8.
4-2. Dynamic ice thermal storage and transporting system This is an ice thermal storage system for storing ice slurry (called “Dynamic Ice”) made from brine freezing at −3 to −5 0C. By making ice during night at lower ambient temperature and operating the refrigeration compressors at 100% capacity, it will contribute to a reduction in power consumption rate per (cold) thermal unit produced. (Reduction of electric power by improving refrigeration efficiency).
(5) Improvement of boiler efficiency Steam accumulator will be implemented to absorb the sharp fluctuation of steam load. The efficiency of boiler economizers which have been already installed at project site will be improved.
(6) Power recovery from high-pressure steam A steam expander system will be implemented to recover power in depressurizing/expansion process of steam. It is aligned in-line with electric motor/generator and refrigeration compressor.
(7) Biogas co-generation with high-efficiency anaerobic wastewater treatment Recovery of methane gas generated from wastewater treatment by anaerobic fermentation is used as fuel for cogeneration using a biogas engine. The waste heat boiler to generate steam and hot water will be used to take up large fluctuations in steam consumption in the brewing process and reduces steam and fuel consumption. It is more useful to generate electric power rather than steam generation by biogas boiler alone, because there is no use of steam during weekend when there is no brewing whilst electricity is always required to operate refrigeration plant, water treatment etc.
(8) Hot water recovery from air-compressors A heat exchanger will be implemented to recover heat from the discharge line of air compressors for reutilization. It will reduce steam and fuel consumption
(9) Steam type spent grain dryer with vapor recovery system The existing direct-fired spent grain dryers will be replaced by steam type. Waste steam will be recovered and recycled.
(10) Improvement of dehydration in yeast before entering yeast dryer A dehydrator will be implemented for yeast before entering yeast dryer. It will reduce steam consumption in the yeast dryer.
(11) Improvement of CO2 recovery rate in the fermentation process A variable capacity compressor will be implemented as a booster in addition to existing reciprocating type compressor to improve recovery rate of CO2.
For the proposed project activity, (1), (3), (4), (5) and (7) are introduced for energy saving.
PROJECT DESIGN DOCUMENT FORM (CDM-SSC-PDD) - Version 03 CDM – Executive Board
46
Annex 3
INFORMATION REGARDING PUBLIC FUNDING
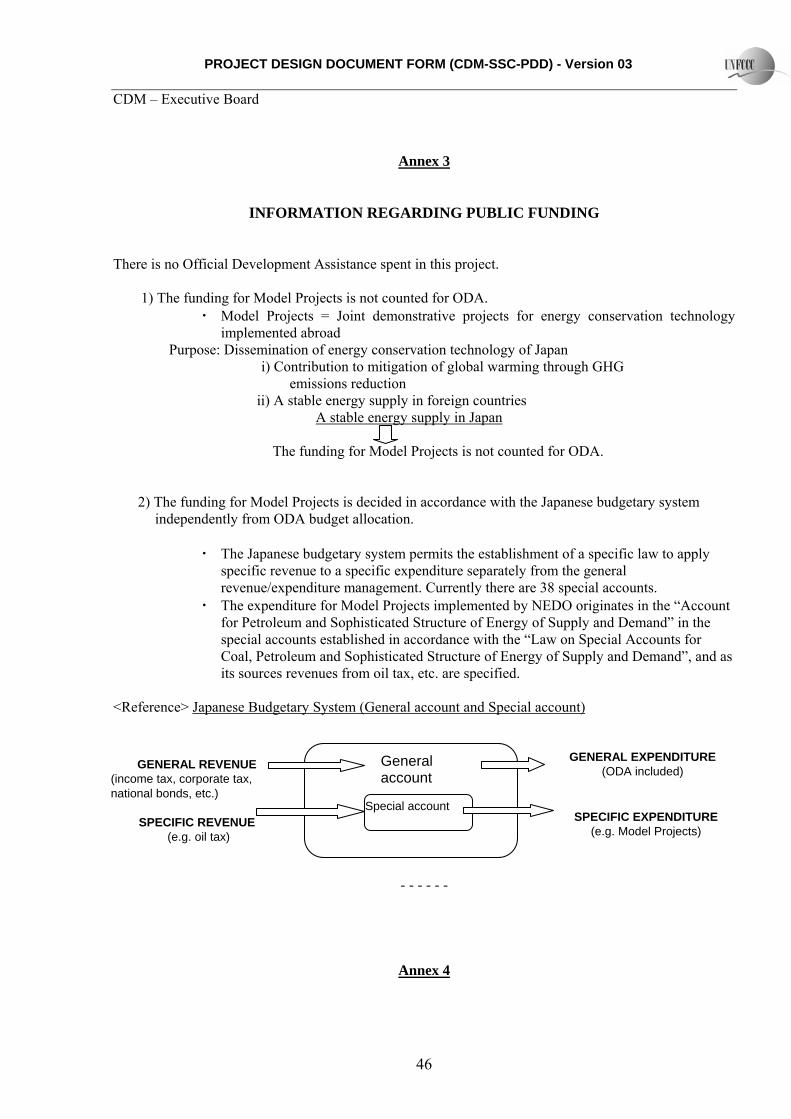
There is no Official Development Assistance spent in this project.
1) The funding for Model Projects is not counted for ODA. ・ Model Projects = Joint demonstrative projects for energy conservation technology
implemented abroad Purpose: Dissemination of energy conservation technology of Japan
i) Contribution to mitigation of global warming through GHG emissions reduction
ii) A stable energy supply in foreign countries A stable energy supply in Japan
The funding for Model Projects is not counted for ODA.
2) The funding for Model Projects is decided in accordance with the Japanese budgetary system
independently from ODA budget allocation.
・ The Japanese budgetary system permits the establishment of a specific law to apply specific revenue to a specific expenditure separately from the general revenue/expenditure management. Currently there are 38 special accounts.
・ The expenditure for Model Projects implemented by NEDO originates in the “Account for Petroleum and Sophisticated Structure of Energy of Supply and Demand” in the special accounts established in accordance with the “Law on Special Accounts for Coal, Petroleum and Sophisticated Structure of Energy of Supply and Demand”, and as its sources revenues from oil tax, etc. are specified.
<Reference> Japanese Budgetary System (General account and Special account)
GENERAL REVENUE
(income tax, corporate tax, national bonds, etc.)
SPECIFIC REVENUE
GENERAL EXPENDITURE (ODA included)
SPECIFIC EXPENDITURE (e.g. Model Projects)
General
Special account
account
(e.g. oil tax)
- - - - - -
Annex 4
PROJECT DESIGN DOCUMENT FORM (CDM-SSC-PDD) - Version 03 CDM – Executive Board
47
BASELINE INFORMATION
The information used for the calculation of baseline emissions consists of two groups:
(1) Information to calculate specific energy consumption rate as well as the beer production (ex ante for planned/expected value and ex post for real results).
(2) Information to obtain carbon emission factors of the grid electricity displacement effect and fuel used.
The information belongs to the first group is directly linked to the confidential information of the BTH. Therefore, it will be disclosed for the Operational Entity in the validation process. Only analyzed/processed data will be cited on the PDD (Section B).
The precise and up-dated information belongs to the second group is under preparation. These are compiled in the PDD (Section B) at the stage of validation.
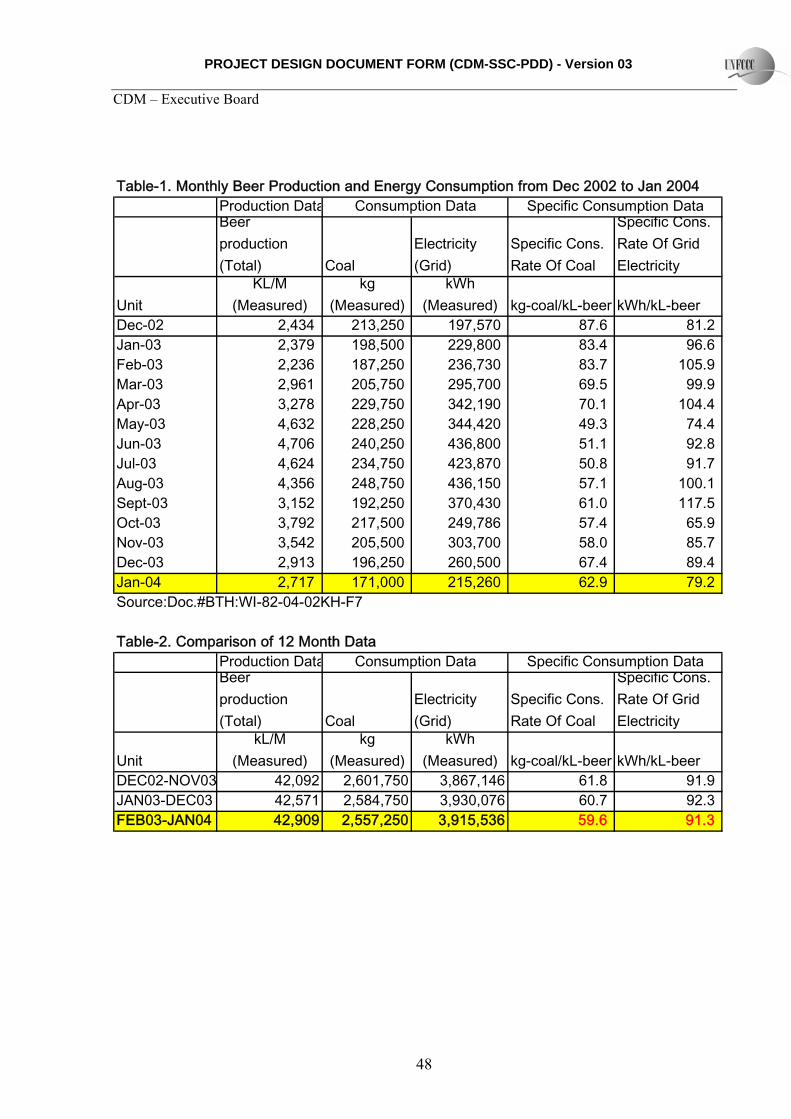
PROJECT DESIGN DOCUMENT FORM (CDM-SSC-PDD) - Version 03 CDM – Executive Board
48
Table-1. Monthly Beer Production and Energy Consumption from Dec 2002 to Jan 2004Production DataBeerproduction(Total) Coal
Electricity(Grid)
Specific Cons.Rate Of Coal
Specific Cons.Rate Of GridElectricity
UnitKL/M
(Measured)kg
(Measured)kWh
(Measured) kg-coal/kL-beer kWh/kL-beerDec-02 2,434 213,250 197,570 87.6 81.2Jan-03 2,379 198,500 229,800 83.4 96.6Feb-03 2,236 187,250 236,730 83.7 105.9Mar-03 2,961 205,750 295,700 69.5 99.9Apr-03May-03Jun-03Jul-03
3,278 229,750 342,190 70.1 104.44,632 228,250 344,420 49.3 74.44,706 240,250 436,800 51.1 92.84,624 234,750 423,870 50.8 91.7
Aug-03Sept-03Oct-03Nov-03Dec-03Jan-04Source:
Table-2.
4,356 248,750 436,150 57.1 100.13,152 192,250 370,430 61.0 117.53,792 217,500 249,786 57.4 65.93,542 205,500 303,700 58.0 85.72,913 196,250 260,500 67.4 89.42,717 171,000 215,260 62.9 79.2
Doc.#BTH:WI-82-04-02KH-F7
Comparison of 12 Month DataProduction DataBeerproduction(Total) Coal
Electricity(Grid)
Specific Cons.Rate Of Coal
Specific Cons.Rate Of GridElectricity
kL/M(Measured)
kg(Measured)
kWh(Measured) kg-coal/kL-beer kWh/kL-beer
NOV0UnitDEC02- 3 42,092 2,601,750 3,867,146 61.8 91.9
DEC03 42,571 2,584,750 3,930,076 60.7 92.3JAN04 42,909 2,557,250 3,915,536
JAN03-FEB03-
Consumption Data Specific Consumption Data
Consumption Data Specific Consumption Data
59.6 91.3
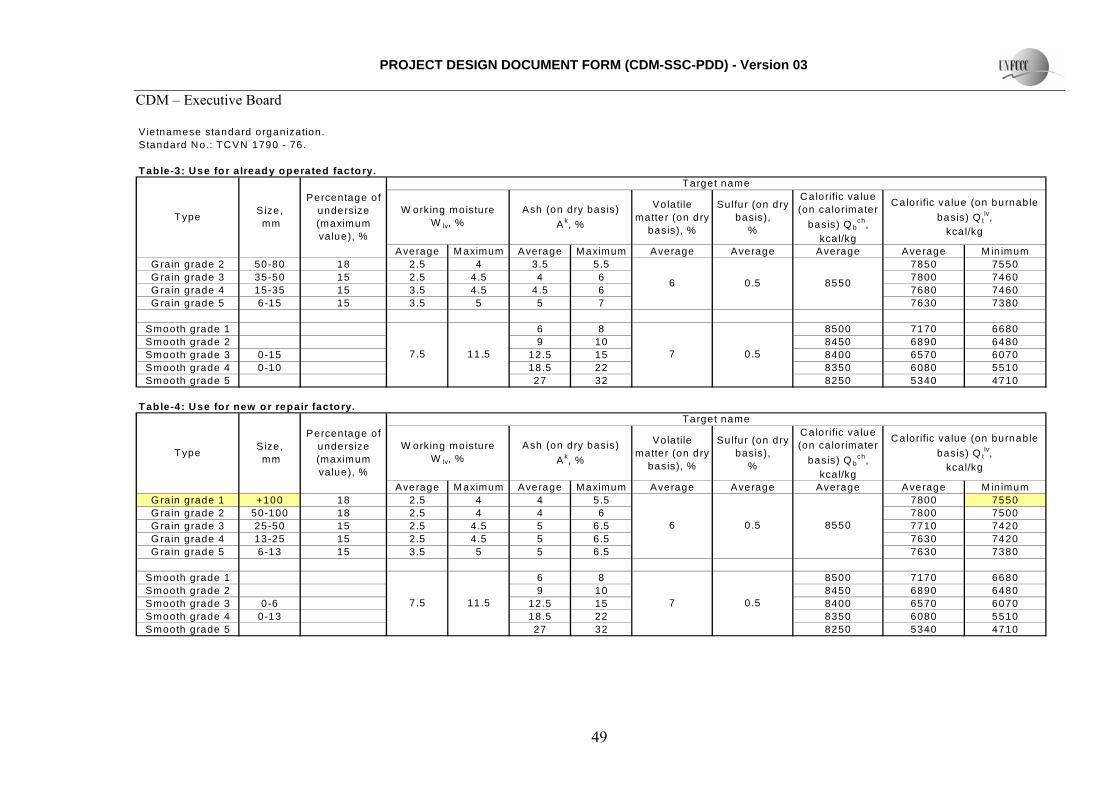
PROJECT DESIGN DOCUMENT FORM (CDM-SSC-PDD) - Version 03 CDM – Executive Board
49
Vietnamese standard organization.Standard No.: TCVN 1790 - 76.
T able-3: Use for already operated factory.
Volatilematter (on dry
basis), %
Sulfur (on drybasis),
%
Calorific va lue(on calorimater
basis) Q bch,
kcal/kgAverage Maximum Average Maximum Average Average Average Average M in imum
G rain grade 2 50-80 18 2.5 4 3.5 5.5 7850 7550G rain grade 3 35-50 15 2.5 4.5 4 6 7800 7460G rain grade 4 15-35 15 3.5 4.5 4.5 6 7680 7460G rain grade 5 6-15 15 3.5 5 5 7 7630 7380
Smooth grade 1 6 8 8500 7170 6680Smooth grade 2 9 10 8450 6890 6480Smooth grade 3 0-15 12.5 15 8400 6570 6070Smooth grade 4 0-10 18.5 22 8350 6080 5510Smooth grade 5 27 32 8250 5340 4710
T able-4: Use for new or repair factory.
Volatilematter (on dry
basis), %
Sulfur (on drybasis),
%
Calorific va lue(on calorimater
basis) Q bch,
kcal/kgAverage Maximum Average Maximum Average Average Average Average M in imum
G rain grade 1 +100 18 2.5 4 4 5.5 7800 7550G rain grade 2 50-100 18 2.5 4 4 6 7800 7500G rain grade 3 25-50 15 2.5 4.5 5 6.5 7710 7420G rain grade 4 13-25 15 2.5 4.5 5 6.5 7630 7420G rain grade 5 6-13 15 3.5 5 5 6.5 7630 7380
Smooth grade 1 6 8 8500 7170 6680Smooth grade 2 9 10 8450 6890 6480Smooth grade 3 0-6 12.5 15 8400 6570 6070Smooth grade 4 0-13 18.5 22 8350 6080 5510Smooth grade 5 27 32 8250 5340 4710
Percentage ofundersize(maximumvalue), %
Size, mmType
6
W orking moistureW lv, %
Target name
Ash (on dry basis)Ak, %
Calorific va lue (on burnablbasis) Q t
lv,kcal/kg
0.5 8550
7.5 11.5 7 0.5
6 0.5 8550
Type Size, mm
Percentage ofundersize(maximumvalue), %
Target name
W orking moistureW lv, %
Ash (on dry basis)Ak, %
Calorific va lue (on burnablbasis) Q t
lv,kcal/kg
7.5 11.5 7 0.5
e
e
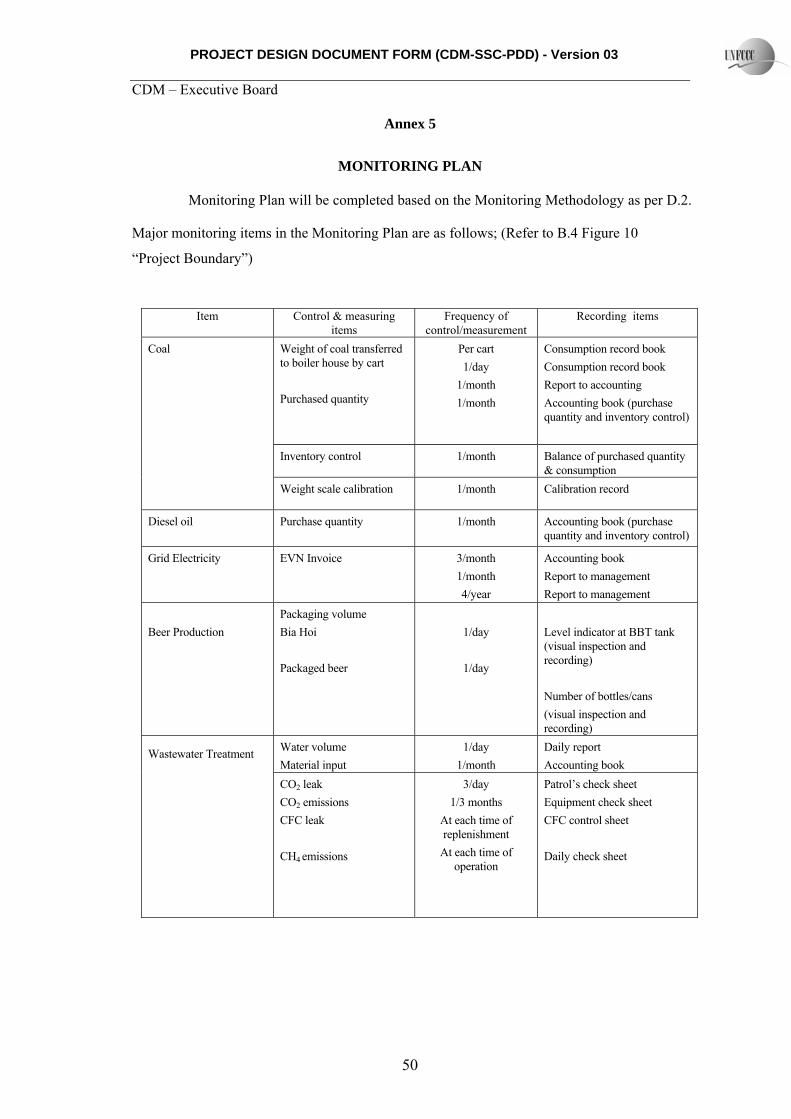
PROJECT DESIGN DOCUMENT FORM (CDM-SSC-PDD) - Version 03 CDM – Executive Board
50
Annex 5
MONITORING PLAN
Monitoring Plan will be completed based on the Monitoring Methodology as per D.2.
Major monitoring items in the Monitoring Plan are as follows; (Refer to B.4 Figure 10
“Project Boundary”)
Item Control & measuring
items Frequency of
control/measurement Recording items
Weight of coal transferred to boiler house by cart Purchased quantity
Per cart 1/day
1/month 1/month
Consumption record book Consumption record book Report to accounting Accounting book (purchase quantity and inventory control)
Inventory control 1/month Balance of purchased quantity & consumption
Coal
Weight scale calibration 1/month Calibration record
Diesel oil
Purchase quantity 1/month Accounting book (purchase quantity and inventory control)
Grid Electricity EVN Invoice 3/month 1/month 4/year
Accounting book Report to management Report to management
Beer Production
Packaging volume Bia Hoi Packaged beer
1/day
1/day
Level indicator at BBT tank (visual inspection and recording) Number of bottles/cans (visual inspection and recording)
Water volume Material input
1/day 1/month
Daily report Accounting book
Wastewater Treatment
CO2 leak CO2 emissions CFC leak CH4 emissions
3/day 1/3 months
At each time of replenishment
At each time of operation
Patrol’s check sheet Equipment check sheet CFC control sheet Daily check sheet

PROJECT DESIGN DOCUMENT FORM (CDM-SSC-PDD) - Version 03 CDM – Executive Board
51
Discharge of, COD, SS, temperature and Ph Abnormal water discharge Wort/beer discharge Discharge of PG/PG brine Discharge of chemicals and oil Smell leak
1/week
1/month 1/day 1/day
Each time of operation
More than 1/week
Measurement certificate Measurement certificate Daily report and check sheet Daily report and check sheet Check sheet Check sheet
Biogas Boiler 1 ton/hr boiler 1/day Operating hours
All data are reported to Section Chiefs, who are responsible for the relevant items, to three
times in a month. Based on ISO9000, Vice Director implements internal assessment on each
item once in every month, with respective Section Chiefs (including Accounting Chief). Data
quality of above monitoring items is sufficiently guaranteed by the expanded practice of
ISO9000 at BTH and other tax related requirement regarding data accuracy..
As for the BaU wastewater treatment system at the downstream, the monitoring of
following items are required in the EIA by DONRE.
Wastewater monitoring
• Monitoring sites: - overall sump of all wastewater discharge streams
from the Company
- effluent discharge site to outside
• Monitoring parameters: pH, COD, BOD5, DO, SS, N, P, Coliform.
• Monitoring frequency: 04times/year
• Sampling equipment and storage: according to TCVN
• Comparison standard: TCVN 6980-2001 (F2, Q-50-200m3/s)
Monitoring underground water quality
• Monitoring sites: well
• Monitoring parameters: pH, SS, Fe, Coliform, As.
• Monitoring frequency: 04times/year
• Sampling equipment and storage: according to TCVN
• Comparison standard: TCVN-5944:1995
Monitoring of solid wastes

PROJECT DESIGN DOCUMENT FORM (CDM-SSC-PDD) - Version 03 CDM – Executive Board
52
• Monitoring sites: - collection site of household solid wastes
- collection site of industry solid wastes
• Monitoring parameters: composition and weight
• Monitoring frequency: 04times/year
• Sampling equipment and storage: according to TCVN
Monitoring of the air environment
• Monitoring sites: 01 boiler site, 01 refrigeration compressor with possible
NH3 leakage and CO2 recovery, 02 sites outside the Company with the
distance of 500m to 1000m from the Company boundary according to the
main wind direction at the monitoring time.
• Monitoring parameters: Dust, CO, CO2, NO2, NH3
• Monitoring frequency: 04times/year
• Sampling equipment and storage: according to TCVN
• Comparison standard : TCVN 5937-1995 vµ TCVN 5939-1995
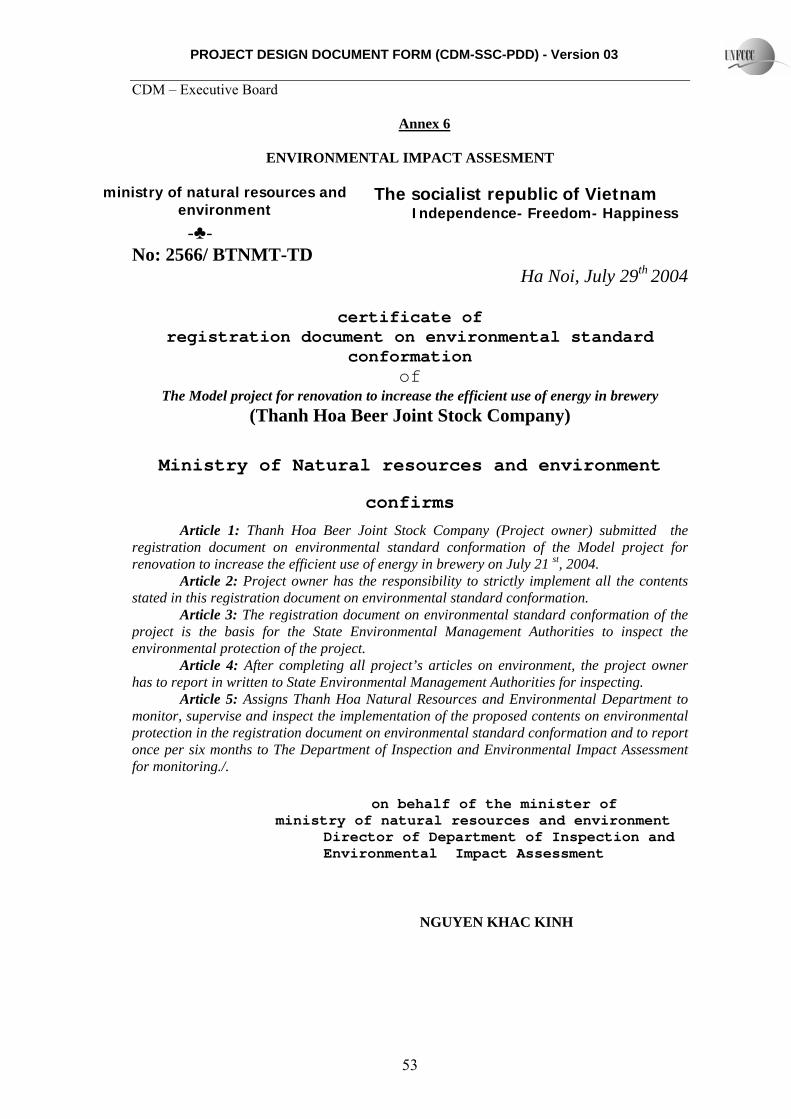
PROJECT DESIGN DOCUMENT FORM (CDM-SSC-PDD) - Version 03 CDM – Executive Board
53
Annex 6
ENVIRONMENTAL IMPACT ASSESMENT
ministry of natural resources and environment
The socialist republic of Vietnam Independence- Freedom- Happiness
-♣- No: 2566/ BTNMT-TD
Ha Noi, July 29th 2004
certificate of registration document on environmental standard
conformation of
The Model project for renovation to increase the efficient use of energy in brewery (Thanh Hoa Beer Joint Stock Company)
Ministry of Natural resources and environment
confirms Article 1: Thanh Hoa Beer Joint Stock Company (Project owner) submitted the
registration document on environmental standard conformation of the Model project for renovation to increase the efficient use of energy in brewery on July 21 st, 2004.
Article 2: Project owner has the responsibility to strictly implement all the contents stated in this registration document on environmental standard conformation.
Article 3: The registration document on environmental standard conformation of the project is the basis for the State Environmental Management Authorities to inspect the environmental protection of the project.
Article 4: After completing all project’s articles on environment, the project owner has to report in written to State Environmental Management Authorities for inspecting.
Article 5: Assigns Thanh Hoa Natural Resources and Environmental Department to monitor, supervise and inspect the implementation of the proposed contents on environmental protection in the registration document on environmental standard conformation and to report once per six months to The Department of Inspection and Environmental Impact Assessment for monitoring./.
on behalf of the minister of ministry of natural resources and environment
Director of Department of Inspection and Environmental Impact Assessment
NGUYEN KHAC KINH
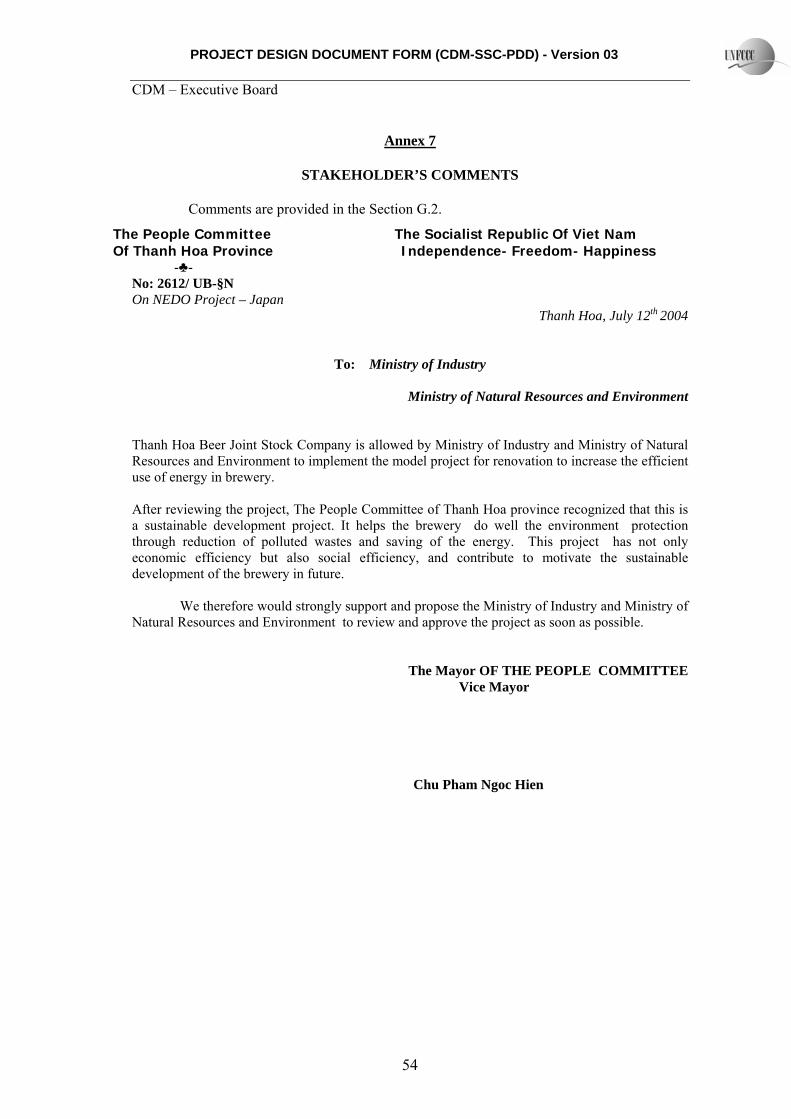
PROJECT DESIGN DOCUMENT FORM (CDM-SSC-PDD) - Version 03 CDM – Executive Board
54
Annex 7
STAKEHOLDER’S COMMENTS
Comments are provided in the Section G.2.
The People Committee Of Thanh Hoa Province
The Socialist Republic Of Viet Nam Independence- Freedom- Happiness
-♣- No: 2612/ UB-§N On NEDO Project – Japan
Thanh Hoa, July 12th 2004
To: Ministry of Industry
Ministry of Natural Resources and Environment
Thanh Hoa Beer Joint Stock Company is allowed by Ministry of Industry and Ministry of Natural Resources and Environment to implement the model project for renovation to increase the efficient use of energy in brewery. After reviewing the project, The People Committee of Thanh Hoa province recognized that this is a sustainable development project. It helps the brewery do well the environment protection through reduction of polluted wastes and saving of the energy. This project has not only economic efficiency but also social efficiency, and contribute to motivate the sustainable development of the brewery in future.
We therefore would strongly support and propose the Ministry of Industry and Ministry of Natural Resources and Environment to review and approve the project as soon as possible.
The Mayor OF THE PEOPLE COMMITTEE Vice Mayor
Chu Pham Ngoc Hien
PROJECT DESIGN DOCUMENT FORM (CDM-SSC-PDD) - Version 03 CDM – Executive Board
55
HANOI BEER ALCOHOL
BEVERAGES CORPORATION THANH HOA BEER JOINT STOCK COMPANY
The Socialist Republish Of Viet Nam Independence- Freedom- Happiness
MINUTES
The meeting on the model project for renovation to increate the efficient use of energy in brewery
1. Time and location: Joint Stock Time: 14 h July 9th 2004 Location: At the first floor of the office of Thanh Hoa Joint Stock Beer Company 2. The participants: - A board of directors. - Chief of bureau, board, workshop - Supervisors and worker representative. 3. The total of participants: 154 people 4. The person in charge of the meeting : Mr Luong Dung- The Director 5. The Content: 5.1 Brief the purpose of the project:
In this project, the energy saving systems will be installed at BTH in addition to existing facility of Thanh Hoa Beer Joint Stock Company, including: - VRC system (Vapor Recovery system) - Improve the refrigeration efficiency by using ice thermal storage; - Save the energy to operate pasteurizer - Steam produced by using bio-gas boilers,
Energy consumption of an entire brewery is reduced, the emissions of GHG (particularly CO2) generated by using fossil fuel will also be reduced. 5.2. Support for sustainable development of the company.
The concrete benefits resulting from the implementation of each system: - VRC system: Substantial reduction in steam consumption with little
additional power consumption. - Improvement of refrigeration efficiency. Reduction in electric power - Ice thermal storage system: Reduction in power by producing cold thermal
energy during the night.
PROJECT DESIGN DOCUMENT FORM (CDM-SSC-PDD) - Version 03 CDM – Executive Board
56
- Energy saving operation of pasteurizer: reduction in steam consumption. Besides, a group of skilled workers to operate and maintain the equipment
will be additionally trained through the project 5.3 Efficiency for economic, society and environment Environmental benefits:
- More balanced of peak electric power demand - Reduction air polluted because of using bio-gas boilers - Saving natural resources: Coal, electric power and water - Reduction of GHG emissions.
Social and economic benefits: - Substantial reduction of energy cost, water cost, coal cost. - Balance of peak electric power demand.
Direct benefits: - Improve the skill of local engineers and workers - Reduction of operation cost
Other benefits: - Be able to transfer the technology to other beer companies and other
beverages or foodstuff companies. 5.4 The meeting to approve the project and the participants’ comments are summarized as follow:
- Thanh Hoa Beer Joint Stock Company is allowed by Ministry of Industry and Ministry of Natural Resources and Environment to implement the model project for renovation to increase the efficient use of energy in brewery.
- After reviewing the project, The People Committee of Thanh Hoa province recognized that this is a sustainable development project. It help the brewery do well the environment protection through reduction of polluted wastes and saving of the energy. This project has not only economic efficiency but also social efficiency. The good environment contributes to motivate the sustainable development of the brewery in future.
- 100% participants approve the NEDO project at Thanh Hoa Beer Joint Stock Company.
The meeting has consensus to propose to the Ministry of Industry, Ministry of Natural Resources and Environment make good conditions for the project to be extended and carried out soon.
The minutes is read at the meeting and vote to approve the project.

PROJECT DESIGN DOCUMENT FORM (CDM-SSC-PDD) - Version 03 CDM – Executive Board
57
The meeting is ended at 17 h on the same day. /. Chairman of Meeting Secretary Worker Representative Luong Dung Nguyen Thi Ninh Nguyen Quang Huynh

PROJECT DESIGN DOCUMENT FORM (CDM-SSC-PDD) - Version 03 CDM – Executive Board
58
(ANNEX-7) Ministry of industry Hanoi Beer Alcohol Beverage Corporation
The socialist republic of Vietnam Independence- Freedom- Happiness
-♣- No: 264/ CV-VP On implementing CDM project in Thanh Hoa Beer Company
Ha Noi, July 30th 2004
To: Ministry of Industry
Ministry of Natural Resources and Environment
Now, New Energy and Industrial Technology Development Organization of Japan (NEDO) is preparing to implement a CDM project in Thanh Hoa Beer Joint Stock Company.
Thanh Hoa Beer Joint Stock Company is a subsidiary of Ha Noi Beer Alcohol Beverage Corporation. This is a model project on renovation to increase energy efficiency at brewery in Viet Nam for the first time. Advanced technologies on environment and energy saving will be applied in order to reduce consumption of electricity, coal, steam in brewery contributing to the reduction in GHG emission in production process.
Technologies that will be applied include:
- Vapour recovery compressor system: recovery of steam from wort kettle, reduction in steam consumption for brewhouse.
- Improvement of refrigeration efficiency by cascade cooling system.
- Ice thermal storage system: reduction in electricity consumption by producing cold thermal energy at night time.
- Energy saving operation of pasteurizer, reduction in steam consumption.
- Biogas boiler: reduction in coal consumption

PROJECT DESIGN DOCUMENT FORM (CDM-SSC-PDD) - Version 03 CDM – Executive Board
59
These up to date technologies have been successfully applied in Japan. Estimated pay back period of the model project in Thanh Hoa Beer Joint Stock Company is 5.5 years and the reduction in GHG emission is about 10,476 tons of CO2 per year.
Ha Noi Beer Alcohol Beverage Corporation realises that this project can bring back many benefits:
- Conservation of energy in production process.
- Contributing to environmental protection, ensuring sustainable development of brewery.
This project satisfies all CDM project criteria which are sustainability, additionality and feasibility.
For above mentioned reasons, Ha Noi Beer Alcohol Beverage Corporation
proposes the Ministry of Industry and Ministry of Natural Resources and Environment to review and approve the project as a CDM project in Thanh Hoa Beer Joint Stock Company. General director Ha Noi Beer Alcohol Beverage Corporation
Dr. Nguyen Van Viet

PROJECT DESIGN DOCUMENT FORM (CDM-SSC-PDD) - Version 03 CDM – Executive Board
60
Annex 8
CDM PROJECT CRITERIA (VIETNAM) Sustainability A1. Be congruent with the national sustainable objectives Environmental issues such as global warming are inevitable issues in the 21st century. It is necessary to take measures combining global environmental issues and energy issues taking into consideration that a majority of greenhouse gases are derived from energy utilization. Such measures can include introduction of energy conservation technologies as well as utilization of the market mechanism such as CDM project activities in an effort to reduce fossil fuel consumption. In this view, the Vietnamese government recognizes the vital importance of energy conservation policies and thus enacted the “Decree of Government on Energy Conservation and Energy Efficiency ” in 2003 to promote energy conservation. Promotion of energy conservation can help in securing energy, in realizing favorable economics as a result of efficient energy utilization and in furthering development of energy conservation technologies and their transfer. The Governments of Vietnam and of Japan have a common recognition for the above-mentioned perspectives and are jointly conducting annual intergovernmental Policy Dialogue for the purpose of promoting more efficient energy/environmental policies. This Project was confirmed during the Policy Dialogue of this year as a Model Project, which promotes energy conservation, and as a CDM project activity, and that both Governments will implement it jointly. In addition, the MOU of this intergovernmental Project was concluded between New Energy and Industrial Technology Development Organization (NEDO), an Incorporated Administrative Agency under the jurisdiction of the Ministry of Economy, Trade and Industry of Japan and the Ministry of Industry of Vietnam, with MONRE signing as a witness. A2. MEETS THE SECTORAL AND PROVINCIAL STRATEGY OBJECTIVES Municipal governments in Vietnam are required to commit strong efforts to resolve issues in energy environmental conservation at the grassroots level and are regulatory authorities of Decree 64. Thanh Hoa Brewery Company should strengthen wastewater treatment based on Decree 64. The Project, which includes not only energy conservation technology but also introduction of wastewater treatment technology, will improve contaminated wastewater. In addition, the Project has acquired EIA approval, required by the Decree on Protection of the Environment.
A3. DO NOT AT LEAST IN AN INTEGRATED MEANS, WORSE ALL ASPECTS OF SECTORAL BASELINE The Project aims at energy cost reduction and improvement of energy security through transfer of energy conservation technology as well as reduction of contaminants by introducing
PROJECT DESIGN DOCUMENT FORM (CDM-SSC-PDD) - Version 03 CDM – Executive Board
61
wastewater treatment, thus truly contributing to energy and environmental conservation in Vietnam. The Project does not pose any negative aspects from the standpoints of energy and the environment. Additionality B.1. Baseline B.1.1. For existed baseline project: All economical and technical indicators are in accordance with sub-sectoral BAU, otherwise it must be shown that the own resources have been maximally mobilized for achieving present stage. The methodology in the PDD stipulates a baseline for energy consumption such as coal consumption (for boiler usage) required for beer production in unit quality as well as electric power consumption “in the absence of the CDM project activity”. Thus, a baseline is estimated by regression analysis. Data for such analysis is colleted and monitored accordingly at the project site. A baseline for the energy consumption rate shall also be reviewed by selecting a beer brewery where coal is employed as a fuel source, and conducting monitoring. In accordance with a substantial production increase in the targeted beer brewery, in case government programs or regulations are introduced, such will be flexibly treated, reviewing the baseline and revising the specific energy consumption rate by correct calculations. B.2. Emission Reduction GHG emission from CDM project must be less than baseline project. Emission reduction shall be measurable and verifiable. Coal or electric power actually utilized and consumed are measurable and will be recorded for future verification. The amount of emission reduction can be calculated by subtracting the value of the baseline set in B1 “in the absence of the CDM project activity” from the actual energy consumption. The amount of emission reduction of the Project is calculated to be approximately 10,000 t/y.
B.3. FINANCE The funding for Model Projects is decided in accordance with the Japanese budgetary system independently from ODA budget allocation. The Japanese budgetary system permits the establishment of a specific law to apply specific revenue to a specific expenditure separately from the general revenue/expenditure management. The expenditure for Model Projects implemented by NEDO originates in “The account for Petroleum and Sophisticated Structure of Energy of Supply and Demand” in the special accounts established in accordance with the “Law on Special Accounts for Coal, Petroleum and

PROJECT DESIGN DOCUMENT FORM (CDM-SSC-PDD) - Version 03 CDM – Executive Board
62
Sophisticated Structure of Energy of Supply and Demand”, and as its sources, revenues from oil tax, etc. are specified. Feasibility C.1. THE SUPPORT OF THE GOVERNMENT SHALL BE SECURED As previously mentioned, the MOU of the Project was signed between NEDO, an Incorporated Administrative Agency under the jurisdiction of the Ministry of Economy, Trade and Industry of Japan, and the Ministry of Industry of Vietnam. (NEDO= an Incorporated Administrative Agency, established by the “New Energy and Industrial Technology Development Organization Law”, and under the Ministry of Economy, Trade and Industry). The funding for the Project is derived from subsidies allocated by the Ministry of Economy, Trade and Industry, and the Japanese Government comprehensively supports the Project in the aspect of energy policy. C.2. Monitoring methodology and performance shall be clearly clarified. For the monitoring methodology, see Section B of the PDD.