Environmental Monitoring Report Tajikistan: Golovnaya 240 ...
Upload
khangminh22Category
view
0download
0
Methane Recovery and Power Generation in a distillery plant - Monitoring Report # 1 1
CDM
Monitoring Report Of
“Methane Recovery and Power Generation in a
Distillery plant”
By GMR Industries Ltd. (GIDL)
UNFCCC0505
Version 1.1
Monitoring Period:
From: 01/10/2006
To: 31/03/2007
GMR Industries Limited (sugar division)
Sankili, Regidi, Amadalavalasa Mandal,
Srikakulam District – 532440
Andhra Pradesh, India
Date: 30/05/07
Mr.K. Sreeramamurthy, GMR Industires

Methane Recovery and Power Generation in a distillery plant - Monitoring Report # 1 2
Table of Contents:
1. Introduction
2. Reference
3. Definition
4. Description of Project activity
5. Baseline Methodology
6. Monitoring Methodology and plan
7. GHG Calculations
Appendices – 1 ~ 16

Methane Recovery and Power Generation in a distillery plant - Monitoring Report # 1 3
1. Introduction
The purpose of monitoring report is to calculate and clearly demonstrate the GHG
emission reduction quantity achieved by this project for periodic verification.
The monitoring report shall cover the activity from 01/10/2006 to 31/03/2007 as first
monitoring period.
Starting date of project activity: 01/12/2003
Project Commissioning date: 01/06/2005
Starting date of crediting period (first 7 year crediting period): 01/10/2006
2. Reference
Title: Methane Recovery and Power Generation in a distillery plant.
Version: Ver 01
Date of completion of the Monitoring Report: 30/05/2007
Approved Baseline Methodology:
The project has two components and they confirm to following small scale approved
baseline methodologies.
a. Type IIIH: Methane recovery in wastewater treatment.
b. Type ID: Grid connected renewable electricity generation.
Approved Monitoring Methodology:
The project has two components and they confirm to following small scale approved
monitoring methodologies.
a. Type IIIH: Comprises Methane recovery from spent wash treatment facilities.
b. Type ID: Comprises renewable energy generation units that displaces
electricity based on fossil fuel fired generating stations.
Project Design Document:
Methane recovery and power generation in a distillery plant” by GMR Industries Ltd.
(GIDL); UNFCCC reference number - 0505
Version: 1.3
Date: 04/09/2006
3. Definition

Methane Recovery and Power Generation in a distillery plant - Monitoring Report # 1 4
4. Description of Project Activity
a. General Description:
This project activity is based at the distillery unit of integrated sugar complex of GMR
Industries Ltd. (GIDL - Sugar Division) at Sankili village, Srikakulam District in the
State of Andhra Pradesh. The company belongs to GMR group. The distillery has
implemented ISO-9001:2000: system.
The sugar division of the GMR Industries Ltd. (GIDL) owns a distillery with a capacity
of 40 KLPD. The raw material to the distillery is molasses from the sugar plant. The
major products from the distillery are Rectified Spirit (RS), Extra Neutral Alcohol (ENA)
and Ethanol. The plant has modern Molecular Sieve Dehydration System. The plant is
having zero pollution discharge.
The Spent-Wash generated from the distillery is high in Bio-chemical Oxygen Demand
(BOD)/Chemical Oxygen Demand (COD) content. The approx. quantity of Spent-Wash
generated from the process is ~400 m3 per day. The BOD level of the Spent-Wash is in
the range 55000-60000 mg/l and the COD is in the range of 130000-150000 mg/l. As per
the norms of State Pollution Control Board and Central pollution Control Board (CPCB)
in India this high BOD/COD Spent-Wash can not be discharged without proper treatment.
The limit of BOD of the Spent-Wash for disposal in surface water is 30 mg/l and for
disposal on land is 100 mg/l.
In normal course distilleries in India adopt open lagoons treatment system for meeting the
pollution control standards of BOD/COD of the Spent-Wash before its discharge. But in
open lagoon system Methane, a potent GHG, is generated due to the anaerobic conditions
which escape into atmosphere and there is no control or capturing involved. This project
activity from GIDL entails treatment of this high BOD/COD Spent-Wash anaerobically in
a closed digester and capturing the Methane generated in a controlled manner. The
Methane captured is combusted in a boiler for steam generation and further to generate
power through a turbo-generator. The project activity also includes combustion of other
GHG natural biomass residue fuels such as rice-husk to supplement biogas fuel in the
boiler. The capacity of the power generation plant is ~1.0 MW.
b. Technical Description of Project activity:
Location details:
The plant is located at the distillery unit of GIDL (Sugar Division) at village Sankili of
Regidi Mandal of Srikakulam District in Andhra Pradesh, India. The plant site is about
142 km from the nearest airport of Visakhapatnam on National Highway NH-5. The
geographic location in which the project activity is located is depicted in the map below:
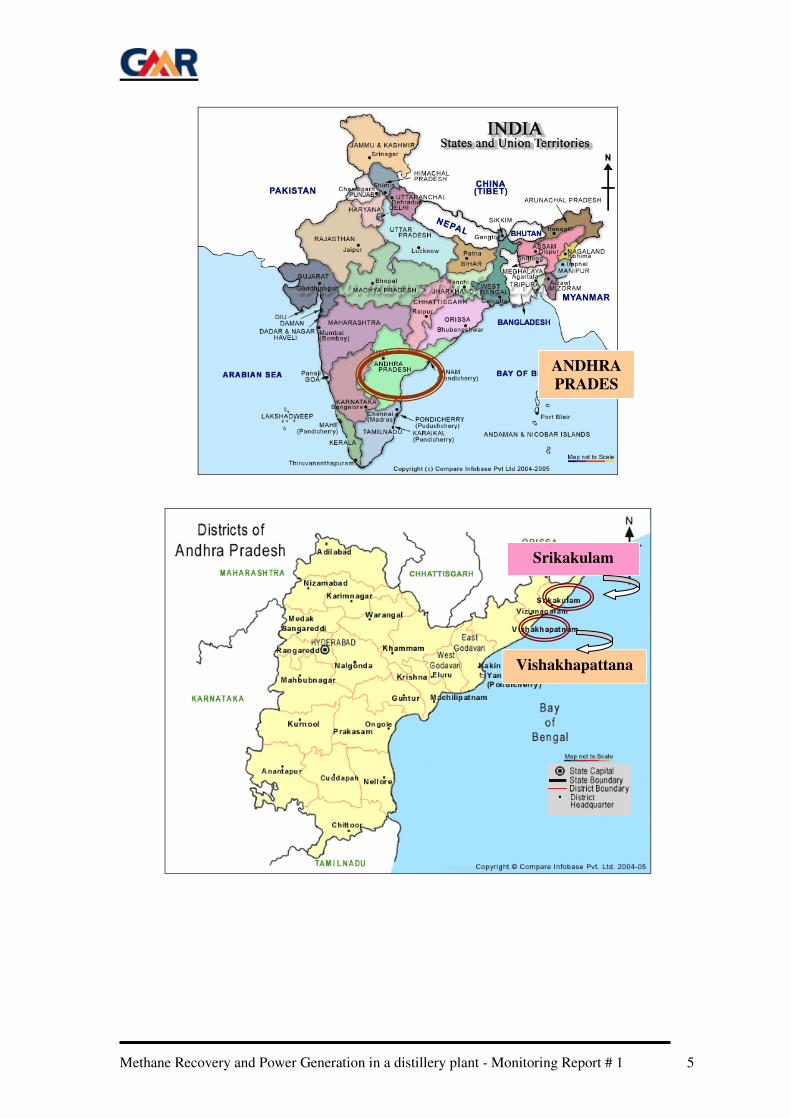
Methane Recovery and Power Generation in a distillery plant - Monitoring Report # 1 5
Srikakulam
Vishakhapattana
m
ANDHRA
PRADES
H

Methane Recovery and Power Generation in a distillery plant - Monitoring Report # 1 6
Technical Details:
Turbine Specification:
Steam turbine Model PRSB 150
Inlet Steam pr. 43 ata
Inlet Steam Temp. 425 Deg C
Exhaust Steam Pr. 4 ata
Max. Steam flow 10.5 TPH
Turbine Rated Speed 8142 RPM
Rated Power 1000 kW
No of stages 05
Boiler Specification:
Make Cheema Boilers ltd.
Capacity 10.5 TPH
Boiler Type Power Pack-FBC
Superheated steam pr. 44 kg/cm2
Superheated steam temp. 430 +- 5 Deg C
ESP:
Make Thermax Ltd.
Srikakula
m
NH-5

Methane Recovery and Power Generation in a distillery plant - Monitoring Report # 1 7
Model SC-9-16-16G-
(3X1.25)-1.2P
Number of fields 3
5. Baseline Methodology
The project activity helps in GHG emission reduction in two ways-
1. Methane emission reduction through its controlled recovery in an anaerobic
digestion plant
2. Reduction of emissions from fossil fuel based grid power by biogas and other
biomass combustion in power generation plant
The project is a small scale CDM project activity and is based on Appendix B (Version
No. 07 dated 28 November 2005) of the simplified modalities and procedures for small-
scale CDM project activities. The project activity conforms to the following categories-
Category Technology/ measure
TYPE IIIH: Methane
Recovery in Wastewater
Treatment
Reference: version 1, Scope
13, 15; dated 03 March 2006
Comprises Methane recovery and combustion from waste
water treatment facilities.
TYPE ID: Grid connected
renewable electricity
generation
Reference: Version 8, Scope
1; dated 03 March 2006
Comprises renewable energy generation units that
displaces electricity based on at least fossil fuel fired
generating stations.
Estimation of Grid Emission factor has been done ex ante in PDD. The GEF calculation is
done in Appendix -16.
6. Monitoring Methodology and Plan
The project is a small scale CDM project activity and is based on Appendix B (Version
No. 07 dated 28 November 2005) of the simplified modalities and procedures for small-
scale CDM project activities. The project activity conforms to the following categories-
Project Category Criteria
TYPE IIIH : Methane
Recovery in Wastewater
Treatment
Comprises Methane recovery from Spent-Wash treatment
facilities.
TYPE ID : Grid connected
renewable electricity
generation
Comprises renewable energy generation units that
displaces electricity based on fossil fuel fired generating
stations


Methane Recovery and Power Generation in a distillery plant - Monitoring Report # 1 9
6.1 The data being monitored as a part of project activity are as follows:
ID
number
Data Source Data variable Data unit Measured
(m),
calculated ©
or estimated
(e)
Recording
frequency
Proportion of
data to be
monitored
How will
the data be
archived?
(electronic/
paper)
For how
long is
archived
data to be
kept?
Comment Reference
1.1 Plant Data Flow of Spent-
Wash in digester
m3 m Daily 100% paper Credit
period + 2
yrs
Appendix -1
1.2 Lab test data Chemical Oxygen
Demand of
untreated Spent-
Wash into the
digester
mg/l e Daily 100% paper Credit
period + 2
yrs
Standard
“Reflux
method” is
used for
estimation of
COD of
spent wash
following
Central
Pollution
Control
Board
norms
Appendix -2
1.3 Lab test data Chemical Oxygen
Demand of treated
water from digester
mg/l e Daily 100% paper Credit
period + 2
yrs
Standard
“Reflux
method” is
used for
estimation of
COD of
treated
water
following
Central
Pollution
Control
Board
norms
Appendix -3

Methane Recovery and Power Generation in a distillery plant - Monitoring Report # 1 10
1.4 Plant data Biogas flow into
boiler
m3 m Daily 100% paper Credit
period + 2
yrs
Appendix -4
1.5 Lab test data %CH4, Volumetric
content of Methane
in biogas
% m Daily 100% paper Credit
period + 2
yrs
Methane
concentratio
n in biogas
is measured
using “Gas
Chromatogr
aph-
Thermal
Coductivity
Detector”
Appendix -5
1.6 Plant data Pressure of biogas mm. WC m Daily 100% paper Credit
period + 2
yrs
1.7 Plant data Temp. of biogas Deg C m Daily 100% paper Credit
period + 2
yrs
Appendix -6
1.8 Plant data Gross Electricity
generated in the
power plant
kWh m Daily 100% paper Credit
period + 2
yrs
Appendix -7
1.9 Plant data Auxiliary
Electricity
Consumption
kWh m Daily 100% paper Credit
period + 2
yrs
Appendix -8
1.10 Plant data Net electricity
generation
kWh c Daily 100% paper Credit
period + 2
yrs
Appendix -9
1.11 Plant data Quantity of fossil
fuel i combusted in
boiler
Tonnes m Monthly 100% paper Credit
period + 2
yrs
Appendix -10
1.12 Lab test data Calorific value of
fossil fuel i
combusted
kcal/ kg e Monthly 100% paper Credit
period + 2
yrs
Appendix -11
1.13 Plant data Power consumed in
equipment in
digester plant
kWh m Daily 100% paper Credit
period + 2
yrs
Appendix -12

Methane Recovery and Power Generation in a distillery plant - Monitoring Report # 1 11
1.14 Plant data Quantity of
digester solid
residues generated
tonnes m Monthly 100% paper Credit
period + 2
yrs
Appendix -13
1.15 Plant data Quantity of
digester solid
residue treated by
composting
tonnes m Monthly 100% paper Credit
period + 2
yrs
Total
quantity
generated of
solid
residues in
digester
goes to
composting
plant
Appendix -14
1.16 Plant data/
IPCC default
values
Coefficient of
emission for fossil
fuel i combusted in
boiler
tCO2e/
tonne
c Monthly 100% paper Credit
period + 2
yrs
Refer
Section
E.1.1 for
detail
formula
Appendix -15

Methane Recovery and Power Generation in a distillery plant - Monitoring Report # 1 13
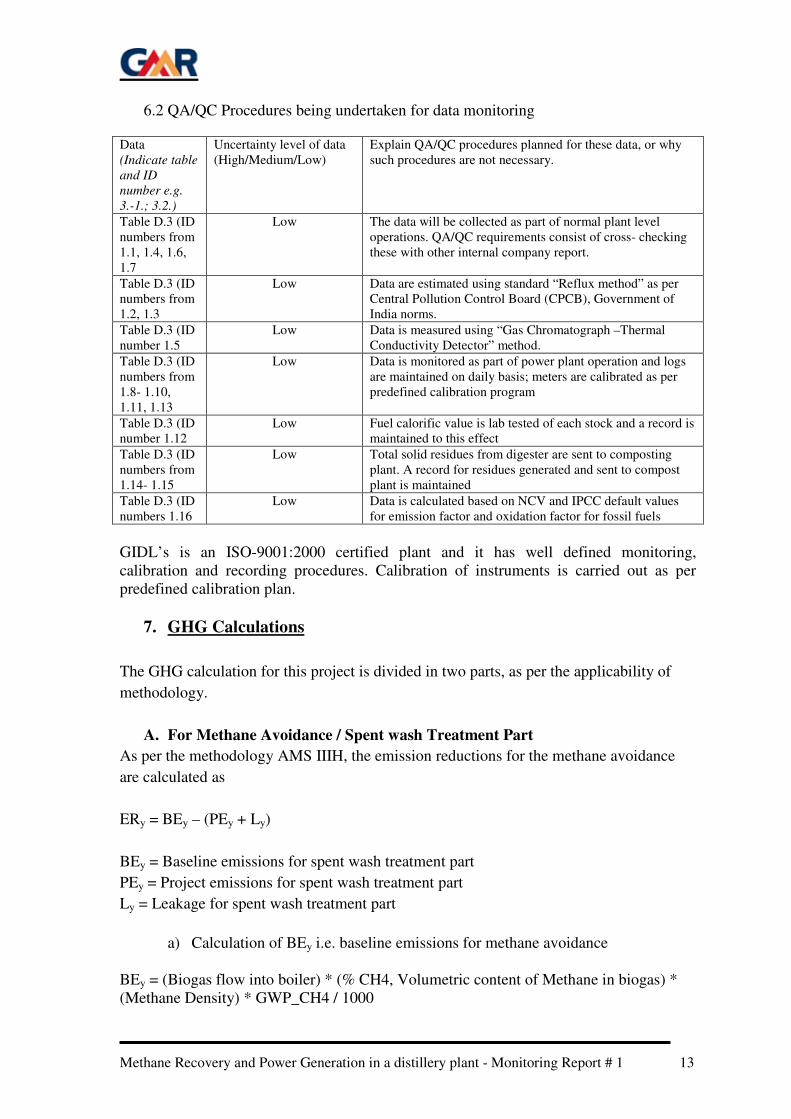
6.2 QA/QC Procedures being undertaken for data monitoring Data
(Indicate table
and ID
number e.g.
3.-1.; 3.2.)
Uncertainty level of data
(High/Medium/Low)
Explain QA/QC procedures planned for these data, or why
such procedures are not necessary.
Table D.3 (ID
numbers from
1.1, 1.4, 1.6,
1.7
Low The data will be collected as part of normal plant level
operations. QA/QC requirements consist of cross- checking
these with other internal company report.
Table D.3 (ID
numbers from
1.2, 1.3
Low Data are estimated using standard “Reflux method” as per
Central Pollution Control Board (CPCB), Government of
India norms.
Table D.3 (ID
number 1.5
Low Data is measured using “Gas Chromatograph –Thermal
Conductivity Detector” method.
Table D.3 (ID
numbers from
1.8- 1.10,
1.11, 1.13
Low Data is monitored as part of power plant operation and logs
are maintained on daily basis; meters are calibrated as per
predefined calibration program
Table D.3 (ID
number 1.12
Low Fuel calorific value is lab tested of each stock and a record is
maintained to this effect
Table D.3 (ID
numbers from
1.14- 1.15
Low Total solid residues from digester are sent to composting
plant. A record for residues generated and sent to compost
plant is maintained
Table D.3 (ID
numbers 1.16
Low Data is calculated based on NCV and IPCC default values
for emission factor and oxidation factor for fossil fuels
GIDL’s is an ISO-9001:2000 certified plant and it has well defined monitoring,
calibration and recording procedures. Calibration of instruments is carried out as per
predefined calibration plan.
7. GHG Calculations
The GHG calculation for this project is divided in two parts, as per the applicability of
methodology.
A. For Methane Avoidance / Spent wash Treatment Part
As per the methodology AMS IIIH, the emission reductions for the methane avoidance
are calculated as
ERy = BEy – (PEy + Ly)
BEy = Baseline emissions for spent wash treatment part
PEy = Project emissions for spent wash treatment part
Ly = Leakage for spent wash treatment part
a) Calculation of BEy i.e. baseline emissions for methane avoidance
BEy = (Biogas flow into boiler) * (% CH4, Volumetric content of Methane in biogas) *
(Methane Density) * GWP_CH4 / 1000
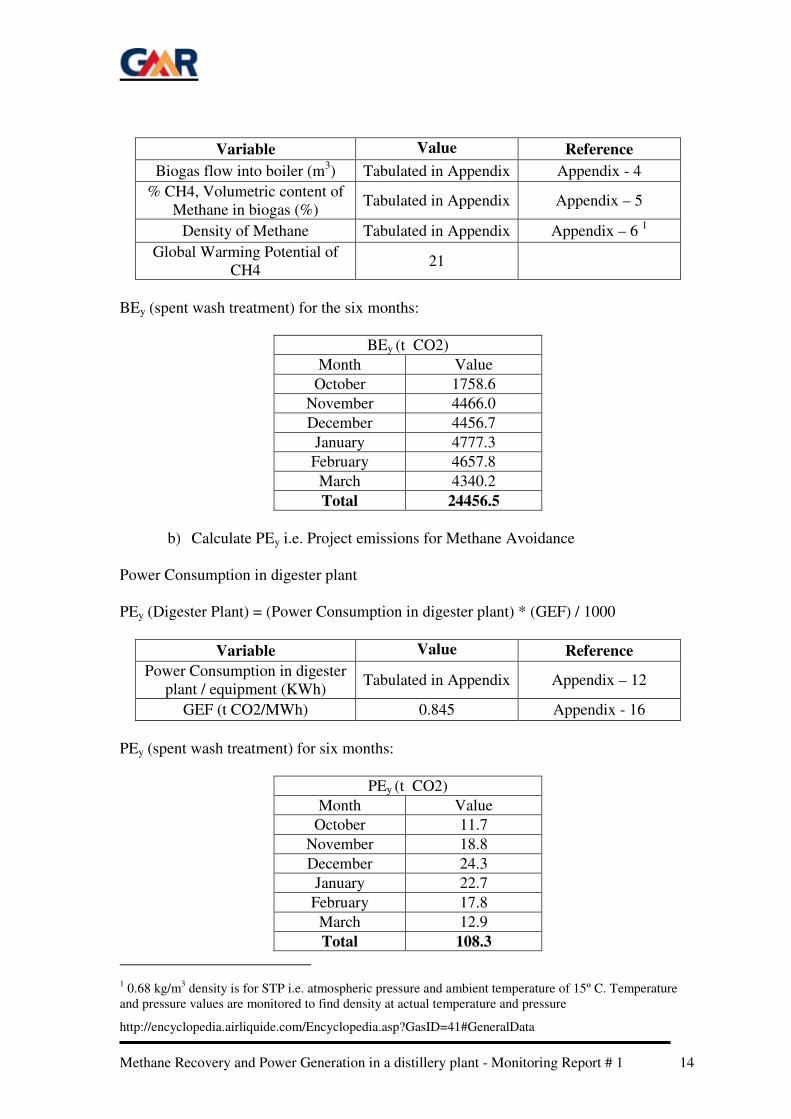
Methane Recovery and Power Generation in a distillery plant - Monitoring Report # 1 14
Variable Value Reference
Biogas flow into boiler (m3) Tabulated in Appendix Appendix - 4
% CH4, Volumetric content of
Methane in biogas (%) Tabulated in Appendix Appendix – 5
Density of Methane Tabulated in Appendix Appendix – 6 1
Global Warming Potential of
CH4 21
BEy (spent wash treatment) for the six months:
BEy (t CO2)
Month Value
October 1758.6
November 4466.0
December 4456.7
January 4777.3
February 4657.8
March 4340.2
Total 24456.5
b) Calculate PEy i.e. Project emissions for Methane Avoidance
Power Consumption in digester plant
PEy (Digester Plant) = (Power Consumption in digester plant) * (GEF) / 1000
Variable Value Reference
Power Consumption in digester
plant / equipment (KWh) Tabulated in Appendix Appendix – 12
GEF (t CO2/MWh) 0.845 Appendix - 16
PEy (spent wash treatment) for six months:
PEy (t CO2)
Month Value
October 11.7
November 18.8
December 24.3
January 22.7
February 17.8
March 12.9
Total 108.3
1 0.68 kg/m
3 density is for STP i.e. atmospheric pressure and ambient temperature of 15º C. Temperature
and pressure values are monitored to find density at actual temperature and pressure
http://encyclopedia.airliquide.com/Encyclopedia.asp?GasID=41#GeneralData

Methane Recovery and Power Generation in a distillery plant - Monitoring Report # 1 15
c) Calculate Ly i.e. Project Leakages
In this case the leakages are already taken into account, since methane avoidance is taken
for only the methane going into boiler.
B. For Power Generation
This calculation is based on AMS ID
ERy = BEy – (PEy + Ly)
a) BEy (Power Generation) = (Gross Electricity Generated in Power Plant) *
GEF /1000
Variable Value Reference
Gross Power generation in
Power Plant (KWh) Tabulated in Appendix Appendix – 7
GEF (t CO2/MWh) 0.845 Appendix - 16
BEy (power generation) for the six months:
BEy (t CO2)
Month Value
October 234.9
November 434.2
December 404.8
January 155.1
February 342.9
March 336.0
Total 1907.9
b) PEy (Combustion Process) = (Power Consumption in combustion process) *
(GEF) / 1000
Variable Value Reference
Power Consumption in
combustion process (KWh)2
Tabulated in Appendix Appendix – 8
GEF (t CO2/MWh) 0.845 Appendix – 16
PEy (power generation) for six months:
PEy (t CO2)
2 This power accounts for all the auxiliary consumption, also in situations when there is no gross generation.

Methane Recovery and Power Generation in a distillery plant - Monitoring Report # 1 16
Month Value
October 56.9
November 84.9
December 90.5
January 85.1
February 84.4
March 83.9
Total 485.6
c) Ly (Fossil fuel combustion) = (fossil fuel consumption) * (Net calorific value
of fossil fuel) * (IPCC default oxidation factor) * (Emission factor for sub-
bituminous coal) * 4.187 / 1000000
Variable Value Reference
Quantity of fossil fuel
combusted (tonnes) Tabulated in Appendix Appendix –10
NCV of Fossil fuel 4514 IPCC default
Oxidation factor 0.98 IPCC default value
Emission factor for sub-
bituminous 96.1 tCO2 / TJ IPCC default value
Rice husk consumption for power generation was monitored as part of standard
procedures of plant, though not a part of monitoring plan are as below:
Rice Husk Consumption
Month Value (tonnes)
October Nil
November Nil
December 149.0
January 160.2
February 195.0
March 330.0
Total 834.3
Ly (power generation) for six months:
Ly (t CO2)
Month Value
October 1027.0
November 1717.2
December 1656.8
January 302.0
February 324.0
March 0.0
Total 5027.0
Emission reductions can be summarized as below:
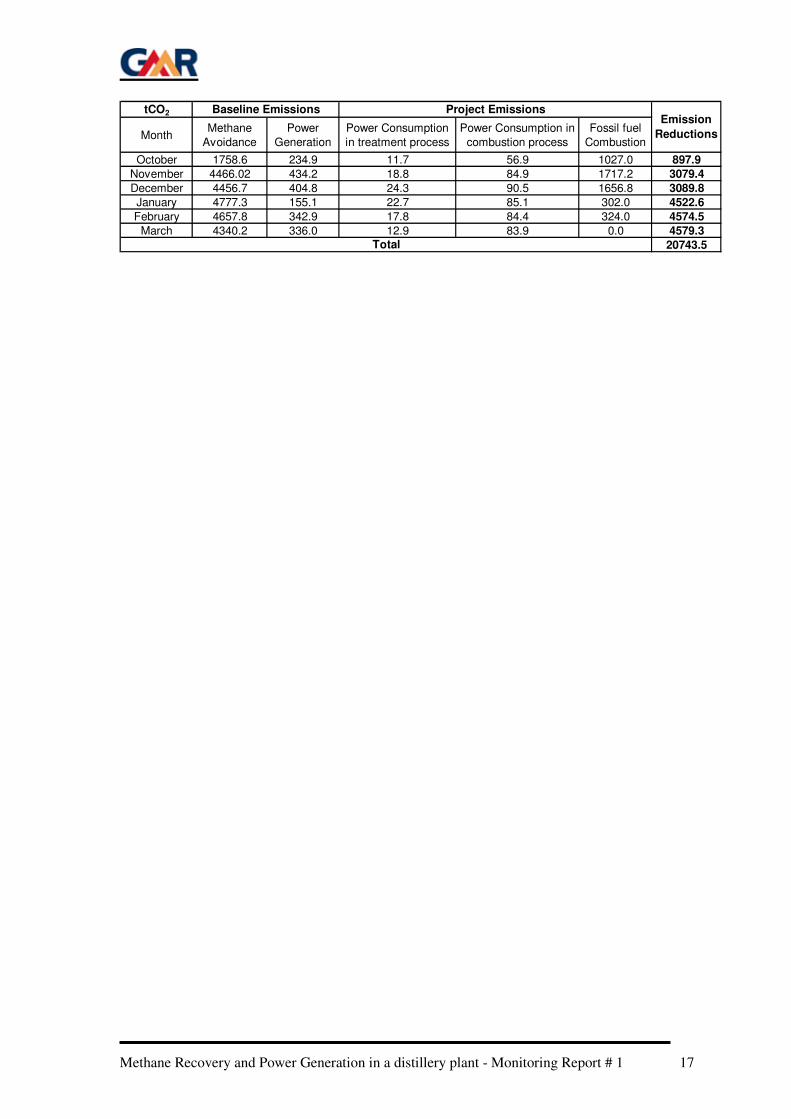
Methane Recovery and Power Generation in a distillery plant - Monitoring Report # 1 17
tCO2
MonthMethane
Avoidance
Power
Generation
Power Consumption
in treatment process
Power Consumption in
combustion process
Fossil fuel
Combustion
October 1758.6 234.9 11.7 56.9 1027.0 897.9
November 4466.02 434.2 18.8 84.9 1717.2 3079.4
December 4456.7 404.8 24.3 90.5 1656.8 3089.8
January 4777.3 155.1 22.7 85.1 302.0 4522.6
February 4657.8 342.9 17.8 84.4 324.0 4574.5
March 4340.2 336.0 12.9 83.9 0.0 4579.3
20743.5
Baseline Emissions Project EmissionsEmission
Reductions
Total

Methane Recovery and Power Generation in a distillery plant - Monitoring Report # 1 18
Appendix – 1
Flow of Spent Wash in digester
Date /
Month Oct Nov Dec Jan Feb March
1 0 287 138 385 354 402
2 0 313 0 394 370 412
3 0 318 89 377 387 384
4 0 347 253 428 363 412
5 0 398 415 403 404 408
6 0 412 424 404 410 402
7 0 422 452 405 338 432
8 0 396 413 406 347 421
9 0 377 433 412 338 384
10 0 435 444 388 372 432
11 0 397 419 420 363 418
12 287 404 418 387 385 408
13 233 367 448 388 371 420
14 276 313 407 343 361 420
15 303 373 409 400 410 426
16 288 420 400 405 374 420
17 336 464 438 377 414 430
18 360 415 457 83 408 420
19 304 421 426 0 408 410
20 253 388 411 340 410 419
21 324 431 473 404 420 420
22 288 408 401 420 411 390
23 354 466 428 397 408 384
24 315 364 432 397 432 306
25 196 417 426 362 408 394
26 0 423 451 389 420 382
27 0 408 460 394 420 378
28 0 380 389 390 384 120
29 0 363 441 415 - 0
30 0 377 356 387 - 0
31 0 - 379 374 - 0

Methane Recovery and Power Generation in a distillery plant - Monitoring Report # 1 19
Appendix – 2
Chemical Oxygen Demand of untreated Spent-Wash into the digester (mg/l)
Date /
Month Oct Nov Dec Jan Feb March
1 0 132000 105000 130000 135000 123000
2 0 128000 0 129000 130000 120000
3 0 126000 80000 135000 130000 125000
4 0 120000 110000 125000 135000 120000
5 0 120000 110000 128000 122000 120000
6 0 118000 115000 128000 125000 123000
7 0 112000 110000 129000 135000 115000
8 0 110000 115000 128000 140000 120000
9 0 122000 110000 127000 140000 130000
10 0 112000 110000 130000 130000 120000
11 100000 120000 120000 123000 135000 120000
12 125000 120000 125000 120000 130000 122000
13 130000 124000 125000 126000 135000 118000
14 130000 130000 130000 120000 135000 120000
15 135000 125000 125000 126000 121000 118000
16 125000 115000 125000 128000 123000 115000
17 120000 110000 120000 132000 120000 120000
18 130000 115000 118000 135000 123000 114000
19 135000 115000 120000 0 124000 115000
20 126000 120000 125000 95000 122000 125000
21 133000 110000 115000 120000 120000 123000
22 120000 115000 125000 110000 122000 125000
23 127000 100000 120000 123000 123000 125000
24 120000 130000 120000 127000 118000 110000
25 0 118000 120000 135000 121000 123000
26 0 107000 115000 129000 120000 120000
27 0 115000 115000 129000 120000 115000
28 0 130000 125000 129000 125000 115000
29 0 135000 120000 123000 - 0
30 0 132000 135000 129000 - 0
31 0 - 130000 120000 - 0

Methane Recovery and Power Generation in a distillery plant - Monitoring Report # 1 20
Appendix – 3
Chemical Oxygen Demand of treated water from digester (mg/l)
Date /
Month Oct Nov Dec Jan Feb March
1 0 35000 36000 35000 35000 36000
2 0 36000 0 37000 36000 37000
3 0 36000 36000 35000 37000 35000
4 0 36000 36000 37000 37000 35000
5 0 36000 37000 36000 36000 35000
6 0 37000 40000 37000 37000 35000
7 0 40000 39000 39000 35000 34000
8 0 40000 37000 37000 36000 35000
9 0 39000 38000 37000 36000 37000
10 0 39000 39000 35000 36000 36000
11 40000 38000 39000 37000 37000 37000
12 36000 40000 38000 35000 38000 36000
13 36000 40000 39000 35000 38000 35000
14 35000 37000 40000 37000 35000 36000
15 35000 39000 39000 36000 35000 36000
16 36000 38000 38000 38000 35000 34000
17 36000 38000 38000 35000 35000 35000
18 36000 38000 40000 35000 36000 34000
19 34000 40000 38000 0 37000 34000
20 36000 38000 36000 36000 35000 37000
21 34000 39000 40000 38000 36000 36000
22 37000 39000 39000 36000 35000 35000
23 37000 36000 37000 36000 36000 36000
24 40000 38000 37000 37000 35000 34000
25 0 40000 36000 36000 35000 35000
26 0 40000 36000 38000 35000 35000
27 0 40000 37000 36000 35000 35000
28 0 40000 36000 37000 35000 35000
29 0 39000 37000 36000 - 0
30 0 40000 37000 35000 - 0
31 0 0 39000 36000 - 0

Methane Recovery and Power Generation in a distillery plant - Monitoring Report # 1 21
Appendix – 4
Biogas Flow into Boiler (m3)
Date /
Month Oct Nov Dec Jan Feb March
1 0 15295 5306 19648 19648 18866
2 0 15549 0 19347 18760 17992
3 0 15450 2176 20020 19030 18736
4 0 15714 10432 19995 19178 18792
5 0 17962 17365 19995 18643 18420
6 0 17639 17125 19636 18985 18940
7 0 16518 17065 19342 18873 18551
8 0 15662 17146 19827 19079 18928
9 0 17240 16785 19585 18817 19329
10 0 17540 16778 19450 18840 19010
11 9122 17112 18236 19255 18950 18727
12 11578 17219 19295 17606 18863 18621
13 13861 16878 19399 18768 19082 18967
14 16599 16214 19605 15044 19260 18920
15 16234 17256 18829 19060 18820 18925
16 16028 17716 18605 19255 17500 18430
17 15824 17964 19083 19472 18555 19318
18 15892 17652 19018 6122 18880 18337
19 15671 17154 18704 0 18879 17773
20 16026 17607 19518 10400 19048 19553
21 15822 16775 18837 17520 18800 19449
22 15529 16924 18404 16450 19154 18775
23 15505 16661 18923 18289 18846 18102
24 8360 17721 19192 19061 19018 12863
25 0 17484 19284 19360 18688 18325
26 0 15008 18990 18820 19140 17572
27 0 16340 18928 19540 18858 15981
28 0 18414 18602 19120 18840 5118
29 0 19059 18306 19278 - 0
30 0 18749 18466 19181 - 0
31 236 18300 16883 - 0

Methane Recovery and Power Generation in a distillery plant - Monitoring Report # 1 22
Appendix – 5 %CH4, Volumetric content of Methane in biogas
Date /
Month Oct Nov Dec Jan Feb March
1 0 61.41 62.52 61.14 63.2 62.88
2 0 62.36 0 61.89 61.75 61.25
3 0 62.36 62.36 61.24 60.2 62.05
4 0 62.24 61.31 62.56 63.38 62.4
5 0 61.31 60.38 60.3 62.63 62.15
6 0 61.22 61.55 61.75 61.1 61.14
7 0 63.41 61.95 61.56 60.38 64.52
8 0 63.32 61.08 61.52 61.38 62.45
9 0 62.38 60.11 61.16 61.38 62.16
10 0 62.45 60.38 61.75 63.52 61.76
11 61.24 61.4 61.11 61.63 62.36 63.36
12 62.36 63.36 61.55 61.03 63.36 63.31
13 62.14 61.41 60.43 61.26 63.63 63.75
14 63.75 62.15 60.16 62.16 62.38 63.22
15 61.41 61.75 61.21 62.52 63.55 61.99
16 61.83 62.36 60.36 61.75 64.38 63.46
17 62.85 61.32 60.38 61.96 64.56 63.8
18 61.03 62.01 61.55 62.11 63.85 62.21
19 61.05 63.2 61.33 0 63.15 62.17
20 62.85 61.65 61.38 62.89 63.75 63.46
21 63.24 62.36 61.99 63.39 64.01 61.01
22 62.01 62.01 61.38 62.55 63.1 63.05
23 62.75 61.75 61.31 62.35 64.75 62.66
24 62.85 61.15 60.43 62.11 61.75 61.63
25 0 62.11 61.05 62.49 65.23 62.41
26 0 62.16 61.38 63.11 62.4 61.85
27 0 63.36 61.31 62.35 60.65 60.73
28 0 62.11 61.86 62.55 63.85 60.73
29 0 62.15 62.36 63.39 - 0
30 0 62.36 61.14 63.5 - 0
31 61.36 61.15 63.5 - 0

Methane Recovery and Power Generation in a distillery plant - Monitoring Report # 1 23
Appendix – 6
Pressure of Biogas (mm of water column)
Date /
Month Oct Nov Dec Jan Feb March
1 0 650 600 800 800 750
2 0 650 0 800 750 700
3 0 650 200 800 750 750
4 0 650 400 800 750 750
5 0 750 700 800 700 700
6 0 700 700 800 700 750
7 0 700 700 800 700 750
8 0 650 700 800 750 750
9 0 700 700 800 700 750
10 0 750 700 800 700 750
11 350 700 750 800 700 750
12 450 700 800 700 700 750
13 550 700 800 750 750 750
14 700 700 800 600 750 750
15 650 700 750 750 750 750
16 650 750 750 800 650 700
17 650 750 750 800 750 750
18 650 750 750 250 750 700
19 650 710 750 0 750 700
20 650 750 800 400 750 750
21 650 700 750 700 700 750
22 650 700 750 650 750 750
23 650 700 750 750 700 700
24 700 750 800 750 750 500
25 0 750 800 800 700 700
26 0 650 750 750 750 700
27 0 700 750 800 700 600
28 0 750 750 750 700 650
29 0 800 750 800 - 0
30 0 800 750 750 - 0
31 0 750 700 - 0

Methane Recovery and Power Generation in a distillery plant - Monitoring Report # 1 24
Temperature of Biogas (Deg Celsius)
Date /
Month Oct Nov Dec Jan Feb March
1 0 39 40 40 40 43
2 0 39 0 40 41 43
3 0 38 39 40 41 44
4 0 39 39 40 40 43
5 0 40 40 40 41 43
6 0 40 39 40 40 44
7 0 39 40 40 40 44
8 0 39 40 40 40 45
9 0 40 39 40 40 45
10 0 40 39 40 41 44
11 39 39 39 40 40 45
12 39 39 40 40 41 45
13 40 39 40 40 41 45
14 40 39 40 39 41 46
15 39 40 39 40 40 45
16 39 39 40 40 40 44
17 39 40 39 40 40 45
18 39 40 39 38 40 44
19 39 39 39 0 40 45
20 40 39 39 38 41 46
21 40 39 39 40 42 46
22 39 39 40 39 42 45
23 40 40 39 39 42 45
24 39 40 39 40 42 46
25 0 39 39 40 43 46
26 0 39 40 40 43 45
27 0 39 40 40 43 45
28 0 40 40 40 43 45
29 0 40 40 40 - 0
30 0 40 40 40 - 0
31 0 40 39 - 0

Methane Recovery and Power Generation in a distillery plant - Monitoring Report # 1 25
Density of Methane kg/cm3 (calculated from pressure and temperature)
Date /
Month Oct Nov Dec Jan Feb March
1 0.717 0.667 0.662 0.674 0.674 0.665
2 0.717 0.667 0.717 0.674 0.672 0.662
3 0.717 0.669 0.640 0.674 0.672 0.663
4 0.717 0.667 0.652 0.674 0.674 0.665
5 0.717 0.671 0.668 0.674 0.672 0.662
6 0.717 0.668 0.670 0.674 0.674 0.663
7 0.717 0.670 0.668 0.674 0.674 0.663
8 0.717 0.667 0.668 0.674 0.674 0.661
9 0.717 0.668 0.670 0.674 0.674 0.661
10 0.717 0.671 0.670 0.674 0.672 0.663
11 0.649 0.670 0.673 0.674 0.674 0.661
12 0.655 0.670 0.674 0.668 0.666 0.661
13 0.659 0.670 0.674 0.671 0.669 0.661
14 0.668 0.670 0.674 0.664 0.660 0.659
15 0.667 0.668 0.673 0.671 0.671 0.661
16 0.667 0.673 0.671 0.674 0.674 0.660
17 0.667 0.671 0.673 0.674 0.674 0.661
18 0.667 0.671 0.673 0.645 0.641 0.660
19 0.667 0.671 0.673 0.717 0.647 0.658
20 0.665 0.673 0.676 0.654 0.648 0.659
21 0.665 0.670 0.673 0.668 0.664 0.659
22 0.667 0.670 0.671 0.667 0.661 0.661
23 0.665 0.668 0.673 0.673 0.667 0.658
24 0.670 0.671 0.676 0.671 0.667 0.644
25 0.717 0.673 0.676 0.674 0.668 0.656
26 0.717 0.667 0.671 0.671 0.665 0.658
27 0.717 0.670 0.671 0.674 0.668 0.652
28 0.717 0.671 0.671 0.671 0.665 0.655
29 0.717 0.674 0.671 0.674 - 0.717
30 0.717 0.674 0.671 0.671 - 0.717
31 0.717 0.671 0.670 - 0.717

Methane Recovery and Power Generation in a distillery plant - Monitoring Report # 1 26
Appendix – 7
Gross Electricity Generation in Power Plant (KWh)
Date /
Month Oct Nov Dec Jan Feb March
1 0 17050 5355 15230 14384 14133
2 0 17543 0 15399 15718 6785
3 0 17442 6081 15452 14582 11922
4 0 17538 16986 15545 14707 14066
5 1423 17684 17371 15090 14736 14179
6 0 17688 16953 15554 17424 14150
7 0 17684 16950 15557 17291 14719
8 13657 16973 18728 15661 17490 15468
9 12406 16755 18815 15548 16716 15002
10 1498 16804 18203 15523 13869 15199
11 16476 16583 17968 15439 14588 15202
12 18041 16767 18615 9321 15183 15611
13 18993 16987 17651 0 15357 16163
14 18436 17124 18780 0 15450 16621
15 18549 17345 18259 0 15844 16186
16 18447 16794 17552 0 8523 16439
17 18125 17166 15543 0 6600 15385
18 18004 14478 15355 0 14581 14135
19 19467 17414 17331 0 14679 14135
20 19501 16955 16896 0 14559 14284
21 18542 17184 16197 0 14135 14411
22 18522 17376 15409 0 14239 14365
23 18092 17261 15043 0 14088 14112
24 9820 17567 15135 0 14289 11263
25 0 17432 15556 0 14090 14650
26 0 17295 15484 0 14363 16144
27 0 16998 15403 0 14040 14415
28 0 17547 15152 0 14239 3459
29 0 17424 15503 0 - 0
30 0 17032 15368 0 - 0
31 0 15418 4197 - 4990

Methane Recovery and Power Generation in a distillery plant - Monitoring Report # 1 27
Appendix – 8
Auxiliary Electricity Consumption (KWh)
Date /
Month Oct Nov Dec Jan Feb March
1 230 3308 2442 3761 3333 3461
2 888 3427 941 3608 3576 3284
3 397 3356 2078 3569 3616 3350
4 1468 3342 3591 3638 3546 3465
5 1193 3316 3668 3570 3430 3435
6 334 3276 3647 3679 3573 3456
7 575 3289 3456 3659 3621 3437
8 3339 3307 3692 3663 3665 3464
9 3147 3344 3744 3609 3665 3508
10 1878 3358 3608 3686 3523 3521
11 3346 3303 3596 3630 3568 3542
12 3476 3425 3530 3652 3719 4190
13 3588 3337 3646 3547 3767 3566
14 3509 3372 3674 2939 3865 3437
15 3551 3387 3659 3175 4063 3377
16 3491 3326 3747 3226 3416 3417
17 3473 3384 3666 3080 3508 3433
18 3478 3271 3568 2276 3534 3401
19 3418 3327 3637 1214 3459 3312
20 3555 3388 3734 3033 3447 3485
21 3312 3323 3629 3263 3484 3501
22 3416 3361 3694 3096 3465 3456
23 3444 3360 3635 3116 3468 3267
24 2497 3371 3585 3135 3527 2922
25 1507 3416 3557 3044 3514 3401
26 818 3344 3584 3100 3484 3375
27 636 3337 3548 3129 3549 3331
28 659 3387 3551 3152 3453 1730
29 636 3389 3662 3081 - 940
30 729 3321 3663 3103 - 1022
31 1320 3662 3250 - 2813

Methane Recovery and Power Generation in a distillery plant - Monitoring Report # 1 28
Appendix – 9
Net Electricity Generation (KWh)
Date /
Month Oct Nov Dec Jan Feb March
1 0 13742 2913 11469 11051 10672
2 0 14116 0 11791 12142 3501
3 0 14086 4003 11883 10966 8572
4 0 14196 13395 11907 11161 10601
5 230 14368 13703 11520 11306 10744
6 0 14412 13306 11875 13851 10694
7 0 14395 13494 11898 13670 11282
8 10318 13666 15036 11998 13825 12004
9 9259 13411 15071 11939 13051 11494
10 0 13446 14595 11837 10346 11678
11 13130 13280 14372 11809 11020 11660
12 14565 13342 15085 5669 11464 11421
13 15405 13650 14005 0 11590 12597
14 14927 13752 15106 0 11585 13184
15 14998 13958 14600 0 11781 12809
16 14956 13468 13805 0 5107 13022
17 14652 13782 11877 0 3092 11952
18 14526 11207 11787 0 11047 10734
19 16049 14087 13694 0 11220 10823
20 15946 13567 13162 0 11112 10799
21 15230 13861 12568 0 10651 10910
22 15106 14015 11715 0 10774 10909
23 14648 13901 11408 0 10620 10845
24 7323 14196 11550 0 10762 8341
25 0 14016 11999 0 10576 11249
26 0 13951 11900 0 10879 12769
27 0 13661 11855 0 10491 11084
28 0 14160 11601 0 10786 1729
29 0 14035 11841 0 - 0
30 0 13711 11705 0 - 0
31 0 11756 947 - 2177

Methane Recovery and Power Generation in a distillery plant - Monitoring Report # 1 29
Appendix – 10
Quantity of Fossil fuel burnt (tonnes)
Month Oct Nov Dec Jan Feb March
Quantity(t) 577 964.7 930.8 169.6 182 0
Appendix – 11
Calorific value of fossil fuel i combusted
Month Oct Nov Dec Jan Feb March
Quantity(t) 4514 4514 4514 4514 4514 4514

Methane Recovery and Power Generation in a distillery plant - Monitoring Report # 1 30
Appendix – 12
Power consumed in equipment in digester plant (KWh)
Date /
Month Oct Nov Dec Jan Feb March
1 213 619 550 985 907 542
2 355 656 410 928 878 488
3 312 579 427 1134 878 598
4 293 559 648 1025 865 547
5 288 683 998 1063 870 518
6 295 657 966 1021 851 504
7 300 627 979 1046 873 504
8 320 544 1022 1052 851 515
9 441 648 1000 1021 831 556
10 297 746 1043 1028 818 522
11 531 732 962 1001 837 519
12 646 739 1049 940 809 688
13 687 750 967 920 804 613
14 618 665 979 772 845 634
15 639 726 1006 832 813 518
16 630 768 973 943 757 589
17 561 802 991 919 781 556
18 545 733 989 564 745 580
19 524 769 1035 309 683 464
20 607 808 988 1209 678 517
21 589 778 1034 46 648 525
22 590 798 912 767 645 488
23 528 811 910 782 628 472
24 400 801 917 814 564 412
25 348 901 927 792 557 591
26 412 817 956 816 585 543
27 391 758 973 807 557 590
28 417 863 1033 825 536 224
29 428 907 1055 960 - 124
30 316 980 1055 778 - 177
31 318 1051 783 - 182

Methane Recovery and Power Generation in a distillery plant - Monitoring Report # 1 31
Appendix – 13
Quantity of digester solid residues generated (in form of liquid) m
3
Month Oct Nov Dec Jan Feb March
Quantity(m3) 4117 11704 11930 11474 10890 11054
Appendix – 14
Quantity of digester solid residue treated by composting (in form of liquid) m
3
Month Oct Nov Dec Jan Feb March
Quantity(m3) 5255.8 6908.7 6100 6560 5926 6200
Appendix – 15
Coefficient of emission for fossil fuel i combusted in boiler (tCO2/tonne) (IPCC default
value taken)
Month Oct Nov Dec Jan Feb March
1.78 1.78 1.78 1.78 1.78 1.78

Methane Recovery and Power Generation in a distillery plant - Monitoring Report # 1 32
Appendix -16
Estimation of baseline emissions
Baseline scenario is that the electricity generated by the project would otherwise have
been generated by the operation of grid-connected power plants and by the addition of
new generation sources, as reflected in the combined margin (CM) calculations (for SR
Grid) described below.
Step 2.1: Calculate the Operating Margin emission factor (EFOM,y)
ACM0002, version 05 dated 03 March 2006, suggested following methods to calculate the
Operating Margin emission factor(s) (EFOM,y):
(a) Simple OM, or
(b) Simple adjusted OM, or
(c) Dispatch Data Analysis OM, or
(d) Average OM.
As per the approved methodology ACM0002 Dispatch data analysis should be the first
methodological choice. However due to lack of data availability ‘Dispatch Data Analysis’
is not selected for the project activity.
The Simple adjusted OM and Average OM methods are applicable to project activities connected
to the project electricity system (grid) where the low-cost/must run resources constitute more than
50% of the total grid generation.
‘Simple OM’ method is applicable to project activity connected to the project electricity system
(grid) where the low-cost/must run resources constitute less than 50% of the total grid generation
in 1) average of the five most recent years, or 2) based on long-term normal for hydroelectricity
production.
The low-cost/must run resources contribute to less than 50% of total power in the grid hence
‘Simple OM’ option has been chosen.
Type 2002-03 2003-04 2004-05
Thermal 93350.1 96664.0 97964.3
Diesel 4457.0 3225.0 2370.1
Gas 15138.0 16183.0 12276.6
Total (Thermal + Gas) 112945.1 116072.0 112611.1
Wind* 1577.3 2055.7 1270.7
Hydro 18167.8 17317.0 25280.4
Nuclear 4390.0 4700.0 4406.7
Low cost/Must run 24135.1 24072.7 30957.8
Total 137080.1 140144.7 143568.8
% of Low cost/must run 18% 17% 22%
Unit
Source
Generation Mix of Power in Southern Grid
www.cea.nic.in
Million Units
The Simple OM emission factor (EFOM,simple,y) is calculated as the generation-weighted average
emissions per electricity unit (tCO2/MU) of all generating sources serving the project electricity
system, not including low-operating cost and must-run power plants.

Methane Recovery and Power Generation in a distillery plant - Monitoring Report # 1 33
The Simple OM emission factor can be calculated using either of the two following data vintages
for years(s) y:
� A 3-year average, based on the most recent statistics available at the time of PDD
submission, or
� The year in which project generation occurs, if EFOM,y is updated based on ex post
monitoring.
The project activity uses the OM emission factor as per the 3-year average of Simple OM
calculated based on the most recent statistics available at the time of PDD submission.
Source MoU OM (2002-03) OM (2003-04) OM (2004-05)
Year-wise OM tCO2/ MWh 0.952 0.978 0.992
OM tCO2/ MWh 0.974
Emissions due to imports from other grids into the southern grid have been considered as
“0 tCO2/MWh”. This is conservative.
Step 2.2: Calculate the Build Margin emission factor (EFBM,y)
As per the methodology the Build Margin emission factor (EFBM,y) is calculated as the generation-
weighted average emission factor (tCO2/MU) of a sample of power plants. The project activity
calculates the Build Margin emission factor EFBM,y ex ante based on the most recent information
available on plants already built for sample group m at the time of PDD submission.
The sample group m consists of either:
(a) The five power plants that have been built most recently, or
(b) The power plants’ capacity additions in the electricity system, that comprise 20%
of the system generation (in MU) and that have been built most recently.
As per the baseline information data the option (b) comprises the larger annual
generation. Therefore for the project activity the sample group m consists of power plants
capacity additions in the electricity system that comprise 20% of the system generation
(in MU) and that have been built most recently. Power plant capacity additions registered
as CDM project activities are excluded from the sample group.
Power Plants considered for Build Margin (BM) estimation:
Type State Station Capacity
(MW)
Commissioning Date
Hydro AP Mini Hydro 30.0 01.12.2005
Hydro Karnataka Narayanpur 6.6 01.12.2005
Hydro Kerala Other Hydro 5.0 01.12.2005
Hydro Kerala Malampuzha 2.5 01.12.2005
Hydro Karnataka Almattidam 6 55.0 10.08.2005
Hydro Karnataka Almattidam 5 55.0 06.07.2005
Hydro Karnataka Almattidam 4 55 26.03.2005
Hydro Karnataka Almattidam 3 55 13.01.2005
Hydro Karnataka Almattidam 2 55 04.11.2004
Hydro Kerala Malankara 10.5 30.05.2004

Methane Recovery and Power Generation in a distillery plant - Monitoring Report # 1 34
Gas Tamilnadu Kuttalam 36 30.03.2004
Hydro Karnataka Almattidam 1 15 26.03.2004
Hydro Kerala Chembukadavu 6.5 30.12.2003
Hydro Kerala Urumi 6.2 30.12.2003
Gas Tamilnadu Kuttalam 64 30.11.2003
Thermal Tamilnadu NLC TS I extension 420 15.09.2003
Hydro AP Srisailam Left 6 150.0 04.09.2003
Hydro Karnataka Shahpur 1.4 01.08.2003
Hydro AP Srisailam Left 5 150.0 28.03.2003
Gas Tamilnadu Valuthur 94 13.03.2003
Thermal Tamilnadu Neyvelli Zero 250 16.12.2002
Thermal Karnataka Raichur TPS 210 10.12.2002
Hydro AP Srisailam Left 4 150.0 29.11.2002
Thermal AP Simhadri 500 15.08.2002
Hydro AP Srisailam Left 3 150.0 19.04.2002
Gas AP LANCO- Kondapalli 355 01.03.2002
Diesel AP LVS power 36.8 15.01.2002
Thermal AP Simhadri 500 15.01.2002
Gas AP BSES- Peddapuram 220 30.11.2001
Hydro AP Srisailam Left 2 150.0 12.11.2001
Diesel Tamilnadu Samayanallur DEPP 106 22.09.2001
Diesel Tamilnadu Samalpatti DEPP 105.7 15.07.2001
Diesel Karnataka Belgaum 81.3 01.07.2001
Hydro Karnataka Madhavmantrii 3 01.07.2001
Hydro Kerala Kuthungal 21 01.07.2001
Gas Karnataka Tanir Bavi 220 15.05.2001
Hydro Karnataka Gerusuppa 240 01.05.2001
Hydro AP Srisailam Left 1 150.0 26.04.2001
Gas Tamilnadu Pillai Perumal Nallur GTPP 330.5 26.04.2001
Diesel Kerala Kasargode 21.84 15.03.2001
Hydro Kerala Kuttiadi 50 27.01.2001
Nuclear Karnataka Kaiga 1 220 16.11.2000
Gas Tamilnadu Kovilkalapai 108 30.09.2000
Hydro Tamilnadu Mukurthy Mini 0.7 18.08.2000
Diesel Karnataka Bellay 25.2 15.05.2000
Hydro Tamilnadu Parsons Valley 30 29.03.2000
Hydro Tamilnadu Thirumurthy Mini 1.95 20.03.2000
Nuclear Karnataka Kaiga 2 220 16.03.2000
Hydro AP Singur 15.0 31.03.2000
Thermal Karnataka Torangulu Steam 130 15.12.1999
Thermal Karnataka Torangulu Steam 130 15.12.1999
Hydro Kerala Kakkad 50 14.10.1999
Gas Kerala Kayamkulam GT3 129.2 01.10.1999
Hydro Karnataka Kodasalli 3 40 28.08.1999
Hydro Karnataka Rajankollur 2 01.08.1999
Hydro Karnataka Harangi 9 19.07.1999
Gas Pondichery PPCL GTG 32.5 25.05.1999
Hydro Karnataka Kadra 3 50 21.05.1999
Hydro Karnataka Kodasalli 2 40 20.04.1999
Hydro Tamilnadu Sathanur 7.5 30.03.1999
Diesel Tamilnadu GMR Vasavi DEPP 196 01.02.1999

Methane Recovery and Power Generation in a distillery plant - Monitoring Report # 1 35
Source MoU Thermal Diesel Gas Hydro Nuclear Wind
Gross Generation MU 23929.8 1796.0 7339.4 3296.5 2926.3 1270.7
Net Generation MU 23096.9 1742.3 7252.9 3279.7 2575.1 1270.7 39217.6
Heat Rate kcal/kWh 2490.0 2062.0 2000.0 0.0 0.0
Fuel CV kcal/kg 3820.0 10186.0 10350.0 0.0 0.0
Fuel ConsumptionTonnes per
annum15598220.4 363572.7 1418241.5
Total Emissions tCO2/ annum 23495832.6 1137499.9 3430674.0 28064006.6
Emission Factor-
BMtCO2/ MWh 0.716
Step 2.3: Calculate the Electricity Baseline Emission Factor (EFelectricity, y)
Electricity baseline emission factor is calculated as the weighted average of the Operating
Margin emission factor (EFOM,y) and the Build Margin emission factor (EFBM,y) where
the weights wOM and wBM, by default, are 50% (i.e., wOM = wBM = 0.5). This is
presented in the table below.
Source MoU OM (2002-03) OM (2003-04) OM (2004-05)
Year-wise OM tCO2/ MWh 0.952 0.978 0.992
OM tCO2/ MWh 0.974
BM tCO2/ MWh 0.716
Emission Factor-CM
tCO2/ MWh 0.845
Copyright © 2022 FDOKUMEN