F-CDM-MR: Monitoring report form. version 03.2 - Carbon Check
18
CDM-MR-FORM Version 05.1 Page 1 of 18 Monitoring report form (Version 05.1) MONITORING REPORT Title of the project activity 15MW Grid connected renewable energy generation by RSMML UNFCCC reference number of the project activity 2613 Version number of the monitoring report 1.0 Completion date of the monitoring report 03/03/2017 Monitoring period number and duration of this monitoring period Monitoring period number: 05 Monitoring period: 01/01/2015 – 03/01/2017 (including both days) Project participant(s) Rajasthan State Mines & Minerals Limited (RSMML) Other parties: Emergent Ventures India Private Limited Swedish Energy Agency Host Party India Sectoral scope(s) Sectoral scope: 01 Energy industries (renewable - / non-renewable sources) Selected methodology(ies) Applied Methodology: AMS-I.D. Grid connected renewable electricity generation, Version 13, EB 36 Selected standardized baseline(s) Not applicable Estimated amount of GHG emission reductions or net GHG removals by sinks for this monitoring period in the registered PDD 49,533 tCO 2 e (734 days) Total amount of GHG emission reductions or net GHG removals by sinks achieved in this monitoring period GHG emission reductions or net GHG removals by sinks reported up to 31 December 2012 GHG emission reductions or net GHG removals by sinks reported from 1 January 2013 onwards Not applicable 30,078 tCO 2 e
-
Upload
khangminh22 -
Category
Documents
-
view
0 -
download
0
Transcript of F-CDM-MR: Monitoring report form. version 03.2 - Carbon Check

CDM-MR-FORM
Version 05.1 Page 1 of 18
Monitoring report form
(Version 05.1)
MONITORING REPORT
Title of the project activity 15MW Grid connected renewable energy generation by RSMML
UNFCCC reference number of the project activity
2613
Version number of the monitoring report
1.0
Completion date of the monitoring report
03/03/2017
Monitoring period number and duration of this monitoring period
Monitoring period number: 05 Monitoring period: 01/01/2015 – 03/01/2017 (including both days)
Project participant(s) Rajasthan State Mines & Minerals Limited (RSMML) Other parties:
Emergent Ventures India Private Limited
Swedish Energy Agency
Host Party India
Sectoral scope(s) Sectoral scope: 01 Energy industries (renewable - / non-renewable sources)
Selected methodology(ies) Applied Methodology: AMS-I.D. Grid connected renewable electricity generation, Version 13, EB 36
Selected standardized baseline(s)
Not applicable
Estimated amount of GHG emission reductions or net GHG removals by sinks for this monitoring period in the registered PDD
49,533 tCO2e (734 days)
Total amount of GHG emission reductions or net GHG removals by sinks achieved in this monitoring period
GHG emission reductions or net GHG removals by sinks reported up to 31 December 2012
GHG emission reductions or net GHG removals by sinks reported from 1 January 2013 onwards
Not applicable 30,078 tCO2e

CDM-MR-FORM
Version 05.1 Page 2 of 18
SECTION A. Description of project activity
A.1. Purpose and general description of project activity
>> The project is a 15MW wind power project comprising of 12 WTGs of 1.25MW rating each in Jaisalmer district of Rajasthan. This is Phase-VI of wind farm establishment for Rajasthan State Mines & Minerals Limited (RSMML). The electricity generated by project activity is supplied to Northern Eastern Western and North-Eastern (NEWNE) grids and thereby displace grid electricity. In India, regional electricity grids are dominated by fossil fuel fired power generation.
Unique Id Village Commissioning Date Power Arrangement
J 253 Sata - Gorera 29/09/2007
Generated electricity is supplied to Ajmer Vidyut
Vitran Nigam Limited (AVVNL)
J 255 Sata – Gorera 29/09/2007
J 256 Sata – Gorera 29/09/2007
J 257 Sata – Gorera 29/09/2007
J 258 Sata – Gorera 29/09/2007
J 262 Sata – Gorera 29/09/2007
J 605 Pithala 29/09/2007
J 606 Pithala 29/09/2007
J 607 Pithala 29/09/2007
J 608 Pithala 29/09/2007
J 609 Pithala 29/09/2007
J 610 Pithala 29/09/2007
RSMML is one of the premier public sector enterprises of the Government of Rajasthan, primarily engaged in mining and marketing of industrial minerals in the State. The objective of the company is to achieve cost effective technological innovations in the mining of minerals and to diversify into mineral based downstream projects. This company is professionally managed and remains focused towards increasing productivity and growth. RSMML is multi mineral and multi location enterprise engaged in mining of Rock Phosphate, Lignite, SMS grade Limestone and Gypsum. Wind power project does not have any associated GHG emission compared to fossil fuel power plant and thereby avoids the GHG emission. The power generated by the project activity displaces the carbon intensive grid power. The ex-ante fixed emission factor for northern grid is 0.902 tCO2e/ MWh. The project has achieved an emission reduction of 30,078 tCO2e in the current monitoring period by supplying 33,346.466 MWh of electricity to grid.
A.2. Location of project activity
>> The project activity is located in northern part of India in the state of Rajasthan. The WTG site is in vicinity of three villages of Jaisalmer district. The villages are namely Pithala, Sata and Gorera.
Unique Id Village UTM Co-ordinates Northing / Easting
Geographical Co-ordinates
Longitude and Latitude
J 253 Sata -Gorera 686111.5 / 2962081 26°46’3.9’’ N 70°52’18.5’’ E
J 255 Sata – Gorera 685731.5 / 2962716 26°46’24.7’’ N 70°52’5.1’’ E
J 256 Sata – Gorera 686764.5 / 2962057 26°46’2.8’’ N 70°52’42.1’’ E
J 257 Sata – Gorera 686519.7 / 2962324 26°46’11.6’’ N 70°52’33.4’’ E
J 258 Sata – Gorera 686439.2 / 2962655 26°46’22.4’’ N 70°52’30.7’’ E
J 262 Sata – Gorera 685645 / 2964292 26°47’15.9’’ N
CDM-MR-FORM
Version 05.1 Page 3 of 18
Unique Id Village UTM Co-ordinates Northing / Easting
Geographical Co-ordinates
Longitude and Latitude
70°52’2.8’’ E
J 605 Pithala 682883 / 2960002 26°44’57.9’’ N 70°50’20.6’’ E
J 606 Pithala 683134 / 2959760 26°44’49.9’’ N 70°50’29.5’’ E
J 607 Pithala 681821.4 / 2960665 26°45’19.9’’ N 70°49’42.5’’ E
J 608 Pithala 681873.5 / 2960222 26°45’5.5’’ N 70°49’44.2’’ E
J 609 Pithala 682121 / 2959975 26°44’57.4’’ N 70°49’51.6’’ E
J 610 Pithala 682368.5 / 2959727 26°44’49.2’’ N 70°50’1.8’’ E
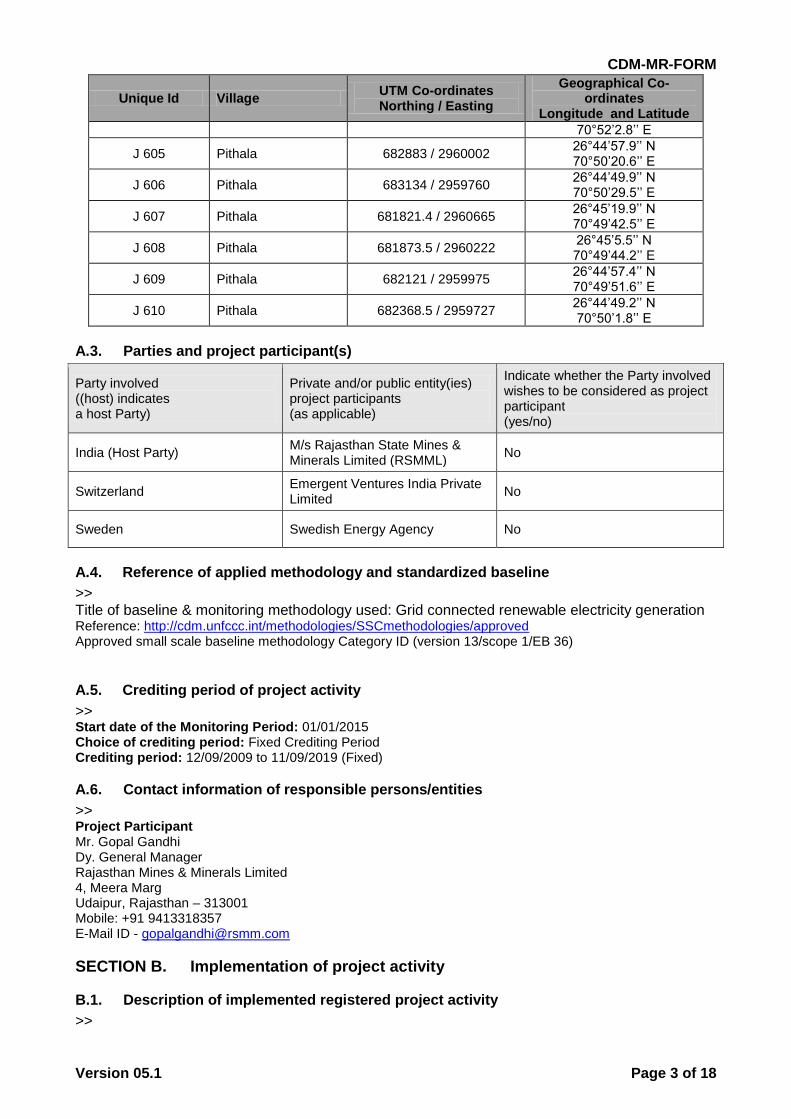
A.3. Parties and project participant(s)
Party involved ((host) indicates a host Party)
Private and/or public entity(ies) project participants (as applicable)
Indicate whether the Party involved wishes to be considered as project participant (yes/no)
India (Host Party) M/s Rajasthan State Mines & Minerals Limited (RSMML)
No
Switzerland Emergent Ventures India Private Limited
No
Sweden Swedish Energy Agency No
A.4. Reference of applied methodology and standardized baseline
>> Title of baseline & monitoring methodology used: Grid connected renewable electricity generation Reference: http://cdm.unfccc.int/methodologies/SSCmethodologies/approved Approved small scale baseline methodology Category ID (version 13/scope 1/EB 36)
A.5. Crediting period of project activity
>> Start date of the Monitoring Period: 01/01/2015 Choice of crediting period: Fixed Crediting Period Crediting period: 12/09/2009 to 11/09/2019 (Fixed)
A.6. Contact information of responsible persons/entities
>> Project Participant Mr. Gopal Gandhi Dy. General Manager Rajasthan Mines & Minerals Limited 4, Meera Marg Udaipur, Rajasthan – 313001 Mobile: +91 9413318357 E-Mail ID - [email protected]
SECTION B. Implementation of project activity
B.1. Description of implemented registered project activity
>>

CDM-MR-FORM
Version 05.1 Page 4 of 18
The project is a Renewable Energy project with maximum output capacity of 15 MW (≤15 MW, the maximum output for small scale project) this comes under the Appendix B of the simplified modalities & procedures for small-scale CDM-project activities. The power generated by wind power project is supplied to AVVNL which in turn feeds to NEWNE grid. WTGs installed in the project activity are of 1.25 MW (each) and the technical details are given in table below:
Wind Turbine Generator Type 1.25 MW
Make Suzlon
Rotor
Rotor Diameter 69 m
Number of rotor blades 03
Hub Height 74.5 m (Including 1m of foundation height)
Swept Area 3740 square meter
Rotational Speed 20.30 rpm (at rated power)
Rotor Blade Material Epoxy bonded fibre glass
Operational Data
Cut in wind speed 3 m/s
Rated wind speed 14 m/s
Cut off wind speed 18 m/s
Gear Box
Type One planetary stage/ two helical stages
Gear Ratio 1: 79.4
Maximum power transmission 1390 kW (Mechanical power)
Lubricant ISO VG-460Grade oil/ ISO VG-320 Grade oil
Generator
Type Induction generator (asynchronous) air cooled
Rotational Speed 1007/1509 RPM
Rated output 250/1250 kW
Rated Voltage 690 V
Frequency 50 Hz
Insulation Class “H”
Enclosure class IP 56
Operating Brakes
Aerodynamic brake 3 Independent systems with blade pitching
Mechanical brake Hydraulic disc brakes activated by spring (fail-safe) + mechanical rotor lock activated by hydraulic pressure
Yaw Drive
Type Slide bearing with gear ring and automatic greasing system along with electric yaw drive having electric motor with break, gear box and pinion
Gear box ratio 1: 1954
Yawing motor 1.5 kW each
B.2. Post-registration changes
B.2.1. Temporary deviations from registered monitoring plan, applied methodology or applied standardized baseline
>> No deviation from the registered monitoring plan or applied methodology.
B.2.2. Corrections
>>
No correction to project information or parameters fixed during validation. Hence this is not applicable.
CDM-MR-FORM
Version 05.1 Page 5 of 18
B.2.3 Changes to start date of crediting period
>>
There is no change in the start date of crediting period.
B.2.4 Inclusion of a monitoring plan to the registered PDD that was not included at registration
>>
There is no change the monitoring plan of project activity.
B.2.5. Permanent changes from registered monitoring plan, applied methodology or applied standardized baseline
>>
There are no permanent changes from the registered monitoring plan or applied methodology.
B.2.6. Changes to project design of registered project activity
>>
There is no change the project design of registered project activity.
B.2.7. Types of changes specific to afforestation or reforestation project activity
>> The project activity is not an afforestation or reforestation project.
SECTION C. Description of monitoring system
>> RSMML has the following structure for data monitoring, collection, data archiving and calibration of equipments for this project activity. The team comprises of the following members.
1. General Manager Projects 2. Deputy General manager (Electrical) 3. Senior Manager (Electrical) 4. Assistant Manager (Electrical) 5. O&M service provider
Data collection and record keeping: O & M team is responsible for data collection at the site. Monthly generation data is directly measured from installed main meter readings with accuracy level of 0.2s at location number 29. Readings are taken up by AVVNL personnel in presence of Project Proponent or their representatives.
Qualification and training: In order to ensure a proper functioning of the project activity and a properly monitoring of emission reductions, the staff will be trained. The site personnel will be trained in equipment operation, data recording, operation and maintenance and emergency procedures in compliance with the monitoring plan. O&M Service provider is responsible for the training of the staff.

CDM-MR-FORM
Version 05.1 Page 6 of 18
Organizational structure for monitoring plan
Designation Responsibilities
General Manager Projects Holds complete control over monitoring aspects pertaining to the project
Deputy General manager Electrical Review - 2
Storage of Data
Senior Manager Electrical Review -1
Storage of Data
Assistant Manager Electrical Compilation of data
Storage of Data
O&M service provider
Operation and Monitoring
Data Recording
Storage of data
Archiving of data: The data collected will be recorded in as part of monitoring will be archived for at least 2 years after the crediting period or from last issuance. Data source: As per section B.7.1 Frequency of monitoring: As per section B.7.1 Internal audits and management review: O&M Service provider will monitor all the parameters mention in section B.7.1 of the PDD. Shift in-charge will present the recorded data to Assistant Manager - Electrical. Assistant Manager - Electrical compiles the data and will be reviewed by Senior Manager and Deputy General Manager every month. After the review the report will be submitted to General Manager - Projects. Emergency preparedness: The project activity will not result in any unidentified activity that can result in substantial emissions from the project activity. No need for emergency preparedness in data monitoring is visualized. In case of failure of equipments (both main meter and check meter) data will not be considered for emission reduction calculation.
Deputy General Manager (Electrical)
Senior Manager (Electrical)
Assistant Manager (Electrical)
General Manager Projects
O&M Service provider
CDM-MR-FORM
Version 05.1 Page 7 of 18
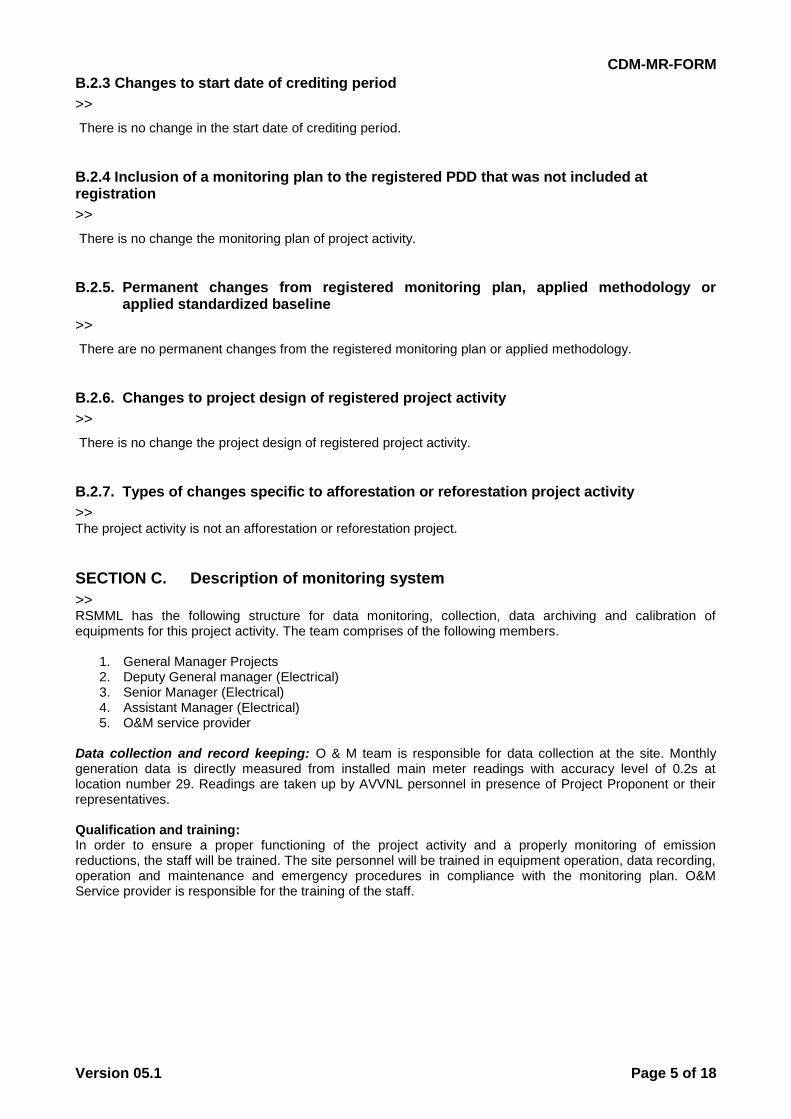
Line diagram showing relevant monitoring points

CDM-MR-FORM
Version 05.1 Page 8 of 18

CDM-MR-FORM
Version 05.1 Page 9 of 18
SECTION D. Data and parameters
D.1. Data and parameters fixed ex ante or at renewal of crediting period
Data/parameter: EF y
Unit t CO2/MWh
Description Grid emission factor fixed ex-ante
Source of data CEA published data.
Value(s) applied) 0.902
Choice of data or measurement methods and procedures
The value is taken from a published document available on CEA website. The procedure used is as per “tool to calculate emission factor for an electricity system” CEA Website http://cea.nic.in/planning/c%20and%20e/Government%20of%20India%20website.ht m
Purpose of data Baseline emission calculation
Additional comments -
D.2. Data and parameters monitored
Data/parameter: EG y
Unit MWh

CDM-MR-FORM
Version 05.1 Page 10 of 18
Description The amount of electricity supplied by wind turbine generators to the NEWNE grid
1.
Measured/calculated/default Calculated
Source of data Calculated from Export and Import data. Export and import reading is taken from RERC meter.
Value(s) of monitored parameter
33,346.466
Monitoring equipment Meter details are given in appendix 2
Measuring/reading/recording frequency:
Measuring frequency: Continuous Recording frequency: Monthly Reading frequency: Monthly
Calculation method (if applicable):
Calculation procedure provided in appendix 3
QA/QC procedures: The meters at the uploading station are two way meters and are in custody of State Electricity Board The readings in these meters is taken by State Electricity Board (SEB) officials and used for billing purposes. These meters are periodically tested / calibrated by officials of SEB.
Purpose of data: Baseline emission calculation
Additional comments: -
D.3. Implementation of sampling plan
>> Sampling approach is not used in any of the monitoring parameters listed in section D.2 of the MR. Hence this is not applicable.
SECTION E. Calculation of emission reductions or GHG removals by sinks
E.1. Calculation of baseline emissions or baseline net GHG removals by sinks
>> Emission Factor: EF y = 0.902 tCO2/MWh (for wind power projects) Baseline Emissions: BE y = EG y * EF y Where, EG y = Energy supplied to grid by windmills during year y EF y = Emission factor for the Northern Grid which is fixed ex-ante BEy = 33,346.466 (MWh) * 0.902 (tCO2/MWh) = 30,078 (tCO2e)
1 Northern Eastern Western and North East region

CDM-MR-FORM
Version 05.1 Page 11 of 18
Monthly Baseline emission reduction details are as follows:
Month
Electricity exported to grid (kWh)
Electricity imported from grid
(kWh)
Net Electricity export to
grid (kWh) EGy
Net Electricity export to
grid (MWh)
EGy
Emission factor
(tCO2e/MWh) EFy
Estimation
of Baseline
emissions (tCO2e )
BEy
Date of Initial
reading
Date of Final
reading
01/01/2015 01/02/2015 710,269 6,449 703,820 703.82 0.902 635
01/02/2015 02/03/2015 1,041,292 5,875 1,035,417 1,035.42 0.902 934
02/03/2015 01/04/2015 1,139,714 5,632 1,134,082 1,134.08 0.902 1,023
01/04/2015 02/05/2015 854,729 5,175 849,554 849.55 0.902 766
02/05/2015 01/06/2015 1,553,431 3,227 1,550,204 1,550.20 0.902 1,398
01/06/2015 01/07/2015 1,490,709 6,475 1,484,234 1,484.23 0.902 1,339
01/07/2015 01/08/2015 1,683,719 2,759 1,680,960 1,680.96 0.902 1,516
01/08/2015 01/09/2015 1,978,283 334 1,977,949 1,977.95 0.902 1,784
01/09/2015 01/10/2015 1,353,003 3,264 1,349,739 1,349.74 0.902 1,217
01/10/2015 02/11/2015 1,299,575 4,660 1,294,915 1,294.92 0.902 1,168
02/11/2015 01/12/2015 1,007,982 4,296 1,003,686 1,003.69 0.902 905
01/12/2015 01/01/2016 609,383 10,436 598,947 598.95 0.902 540
01/01/2016 01/02/2016 579,095 10,356 568,739 568.74 0.902 513
01/02/2016 01/03/2016 1,000,186 10,306 989,880 989.88 0.902 893
01/03/2016 01/04/2016 1,252,710 6,625 1,246,085 1,246.09 0.902 1,124
01/04/2016 03/05/2016 1,331,911 5,008 1,326,903 1,326.90 0.902 1,197
03/05/2016 02/06/2016 2,471,996 1,214 2,470,782 2,470.78 0.902 2,229
02/06/2016 02/07/2016 2,461,623 3,644 2,457,979 2,457.98 0.902 2,217
02/07/2016 02/08/2016 3,376,125 2,027 3,374,098 3,374.10 0.902 3,043
02/08/2016 02/09/2016 1,609,731 8,905 1,600,826 1,600.83 0.902 1,444
02/09/2016 03/10/2016 2,481,628 3,641 2,477,987 2,477.99 0.902 2,235
03/10/2016 04/11/2016 1,097,758 6,304 1,091,454 1,091.45 0.902 984
04/11/2016 01/12/2016 472,779 13,416 459,363 459.36 0.902 414
01/12/2016 03/01/2017 633,268 14,405 618,863 618.86 0.902 558
Total 33,346,466 33,346.47 30,078
The cumulative baseline emissions for the period 01/01/2015 to 03/01/2017 is BEy = 30,078 (tCO2e)
E.2. Calculation of project emissions or actual net GHG removals by sinks
>>
Since, the project activity is a renewable energy project which generates electricity using wind power; no anthropogenic emissions by sources of greenhouse gases within the project boundary are identified. Hence, no formulae are applicable.
E.3. Calculation of leakage
>> No anthropogenic greenhouse gases by sources outside the project boundary that are significant, measurable and attributable to the project activity are identified. Hence, no leakage is considered from the project activity. In addition, project proponents confirm that the renewable energy technology is not equipment transferred from another activity. Hence, no leakage calculation is required.

CDM-MR-FORM
Version 05.1 Page 12 of 18
E.4. Summary of calculation of emission reductions or net GHG removals by sinks
Item
Baseline emissions
or baseline net GHG removals by sinks (t CO2e)
Project emissions or actual net GHG removals by sinks (t CO2e)
Leakage (t CO2e)
GHG emission reductions or net GHG removals by sinks
(t CO2e) achieved in the monitoring period
Up to 31/12/2012
From 01/01/2013
Total amount
Total 30,078 0 0 NA 30,078 30,078
E.5. Comparison of actual emission reductions or net GHG removals by sinks with estimates in registered PDD
Item Values estimated in ex ante calculation
of registered PDD Actual values achieved during this
monitoring period
Emission reductions or GHG removals by sinks (t CO2e)
49,533 30,078
Notes: There are 734 days in this monitoring period
E.6. Remarks on difference from estimated value in registered PDD
>> Estimated Emission
Reduction Actual Emission Reduction Variation
49,533 30,078 -39%
The CERs are less by 39 % because of low CUF (Capacity Utilization factor). The shutdown and breakdown details are provided in appendix 4.
- - - - -
CDM-MR-FORM
Version 05.1 Page 13 of 18
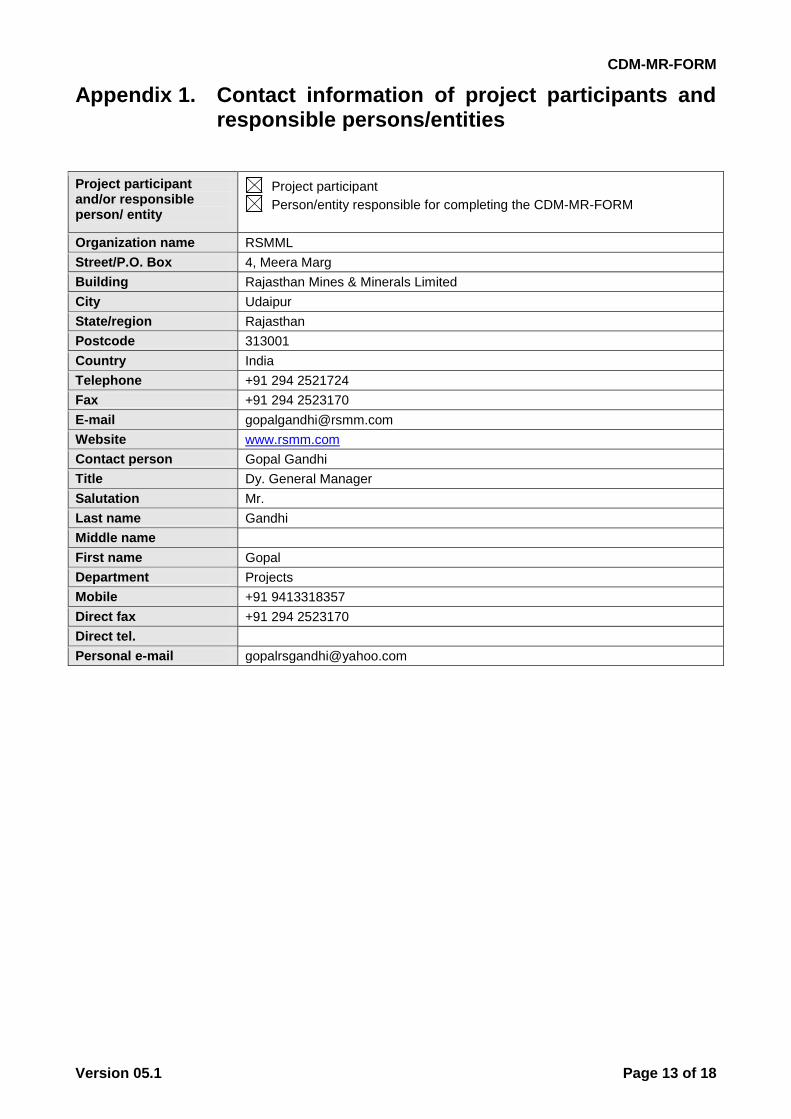
Appendix 1. Contact information of project participants and responsible persons/entities
Project participant and/or responsible person/ entity
Project participant
Person/entity responsible for completing the CDM-MR-FORM
Organization name RSMML
Street/P.O. Box 4, Meera Marg
Building Rajasthan Mines & Minerals Limited
City Udaipur
State/region Rajasthan
Postcode 313001
Country India
Telephone +91 294 2521724
Fax +91 294 2523170
E-mail [email protected]
Website www.rsmm.com
Contact person Gopal Gandhi
Title Dy. General Manager
Salutation Mr.
Last name Gandhi
Middle name
First name Gopal
Department Projects
Mobile +91 9413318357
Direct fax +91 294 2523170
Direct tel.
Personal e-mail [email protected]

CDM-MR-FORM
Version 05.1 Page 14 of 18
Appendix 2. Calibration detail
Details Meter serial
number Calibration
Date Validity of Calibration
SEL29_33kV
Main meter RJU 02408 16/01/2015 16/01/2016
15/04/2016 15/04/2017
Backup meter RJU 02409 16/01/2015 16/01/2016
15/04/2016 15/04/2017
220 kV
Main meter
Transformer 220 KV RJB 00316 16/01/2015 16/01/2016
15/04/2016 15/04/2017
Transformer 220 KV TNU 00956 16/01/2015 16/01/2016
15/04/2016 15/04/2017
Transformer 220 KV TNU 00957 15/01/2015 15/01/2016
15/04/2016 15/04/2017
Backupmeter
Transformer 220 KV RJB 00317 16/01/2015 16/01/2016
15/04/2016 15/04/2017
Transformer 220 KV RJU 00327 15/01/2015 15/01/2016
15/04/2016 15/04/2017
Transformer 220 KV RJB 00318 15/01/2015 15/01/2016
15/04/2016 15/04/2017
CDM-MR-FORM
Version 05.1 Page 15 of 18
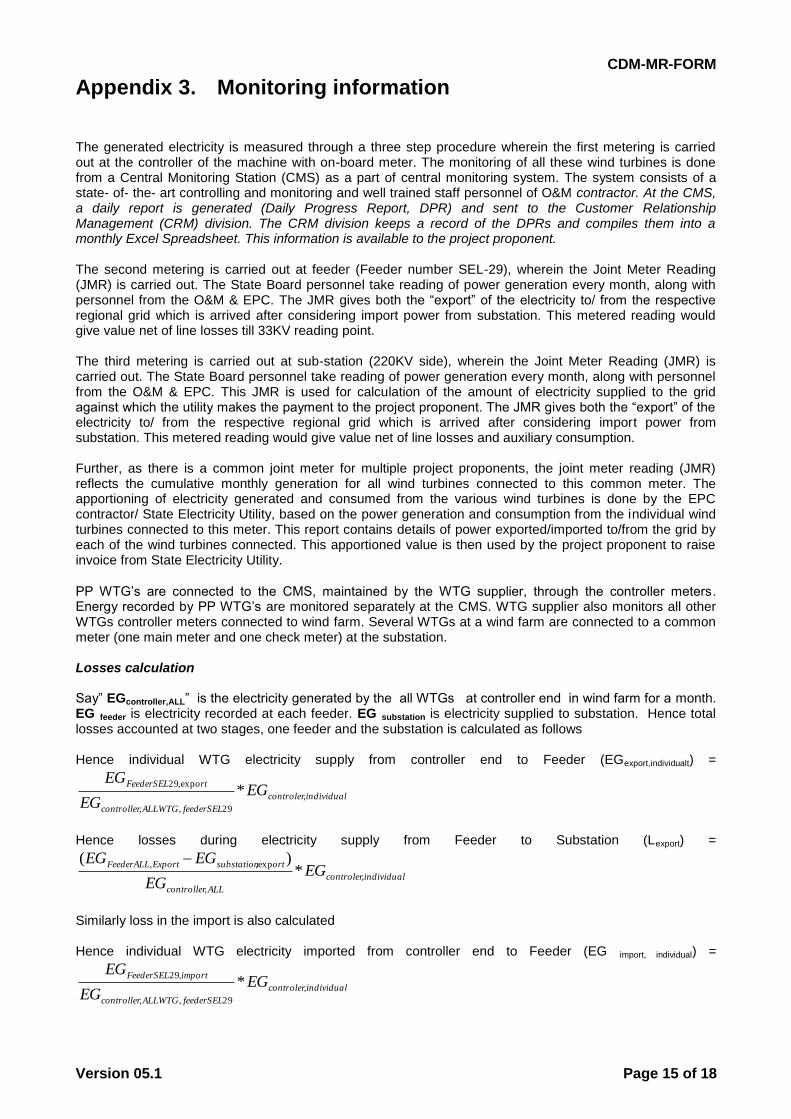
Appendix 3. Monitoring information
The generated electricity is measured through a three step procedure wherein the first metering is carried out at the controller of the machine with on-board meter. The monitoring of all these wind turbines is done from a Central Monitoring Station (CMS) as a part of central monitoring system. The system consists of a state- of- the- art controlling and monitoring and well trained staff personnel of O&M contractor. At the CMS, a daily report is generated (Daily Progress Report, DPR) and sent to the Customer Relationship Management (CRM) division. The CRM division keeps a record of the DPRs and compiles them into a monthly Excel Spreadsheet. This information is available to the project proponent. The second metering is carried out at feeder (Feeder number SEL-29), wherein the Joint Meter Reading (JMR) is carried out. The State Board personnel take reading of power generation every month, along with personnel from the O&M & EPC. The JMR gives both the “export” of the electricity to/ from the respective regional grid which is arrived after considering import power from substation. This metered reading would give value net of line losses till 33KV reading point. The third metering is carried out at sub-station (220KV side), wherein the Joint Meter Reading (JMR) is carried out. The State Board personnel take reading of power generation every month, along with personnel from the O&M & EPC. This JMR is used for calculation of the amount of electricity supplied to the grid against which the utility makes the payment to the project proponent. The JMR gives both the “export” of the electricity to/ from the respective regional grid which is arrived after considering import power from substation. This metered reading would give value net of line losses and auxiliary consumption. Further, as there is a common joint meter for multiple project proponents, the joint meter reading (JMR) reflects the cumulative monthly generation for all wind turbines connected to this common meter. The apportioning of electricity generated and consumed from the various wind turbines is done by the EPC contractor/ State Electricity Utility, based on the power generation and consumption from the individual wind turbines connected to this meter. This report contains details of power exported/imported to/from the grid by each of the wind turbines connected. This apportioned value is then used by the project proponent to raise invoice from State Electricity Utility.
PP WTG’s are connected to the CMS, maintained by the WTG supplier, through the controller meters. Energy recorded by PP WTG’s are monitored separately at the CMS. WTG supplier also monitors all other WTGs controller meters connected to wind farm. Several WTGs at a wind farm are connected to a common meter (one main meter and one check meter) at the substation. Losses calculation Say” EGcontroller,ALL” is the electricity generated by the all WTGs at controller end in wind farm for a month. EG feeder is electricity recorded at each feeder. EG substation is electricity supplied to substation. Hence total losses accounted at two stages, one feeder and the substation is calculated as follows Hence individual WTG electricity supply from controller end to Feeder (EGexport,individualt) =
individualcontroler
feederSELALLWTGcontroller
ortFeederSELEG
EG
EG,
29,,
exp,29*
Hence losses during electricity supply from Feeder to Substation (Lexport) =
individualcontroler
ALLcontroller
ortsubstationExportFeederALLEG
EG
EGEG,
,
exp,,*
)(
Similarly loss in the import is also calculated Hence individual WTG electricity imported from controller end to Feeder (EG import, individual) =
individualcontroler
feederSELALLWTGcontroller
importFeederSELEG
EG
EG,
29,,
,29*

CDM-MR-FORM
Version 05.1 Page 16 of 18
Hence losses during electricity imported from Feeder to Substation (L import) =
individualcontroler
ALLcontroller
importsubstationimportFeederALLEG
EG
EGEG,
,
,*
),(
Where EGcontroller,ALL is the electricity generated by the all WTGs connected to substation for a month at controller end. EGcontroller,ALL feeder SEL 29 is the electricity generated by all WTGs connected to feeder SEL 29 at controller end EG controller,individual is the total electricity supplied by each WTG to the feeder EG substation, export is the total electricity supplied to the substation by all feeder connected to substation EG substation, import is the total electricity imported from the substation by all feeder connect to substation EG Feeder,ALL,export is the total electricity supplied to the feeder by all WTGs in a wind farm EG Feeder, ALL,import is the total electricity imported from feeder by all WTGs in a wind farm EG Feeder SEL 29, export is the total electricity exported by SEL 29 to substation EG Feeder,SEL 29, import is the total electricity imported by SEL 29 from substation
EG BL, = EGexport, individual – Lexport – (EGimport, individual– Limport )
CDM-MR-FORM
Version 05.1 Page 17 of 18
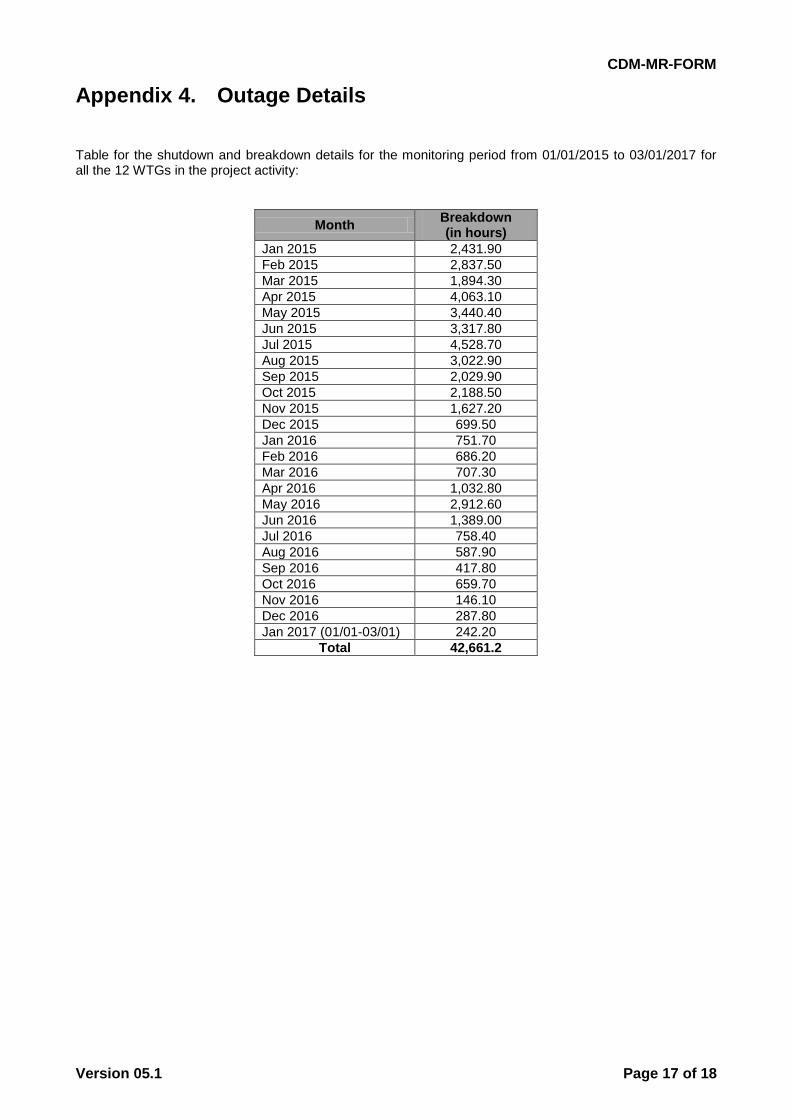
Appendix 4. Outage Details
Table for the shutdown and breakdown details for the monitoring period from 01/01/2015 to 03/01/2017 for all the 12 WTGs in the project activity:
Month Breakdown (in hours)
Jan 2015 2,431.90
Feb 2015 2,837.50
Mar 2015 1,894.30
Apr 2015 4,063.10
May 2015 3,440.40
Jun 2015 3,317.80
Jul 2015 4,528.70
Aug 2015 3,022.90
Sep 2015 2,029.90
Oct 2015 2,188.50
Nov 2015 1,627.20
Dec 2015 699.50
Jan 2016 751.70
Feb 2016 686.20
Mar 2016 707.30
Apr 2016 1,032.80
May 2016 2,912.60
Jun 2016 1,389.00
Jul 2016 758.40
Aug 2016 587.90
Sep 2016 417.80
Oct 2016 659.70
Nov 2016 146.10
Dec 2016 287.80
Jan 2017 (01/01-03/01) 242.20
Total 42,661.2
CDM-MR-FORM
Version 05.1 Page 18 of 18
- - - - -
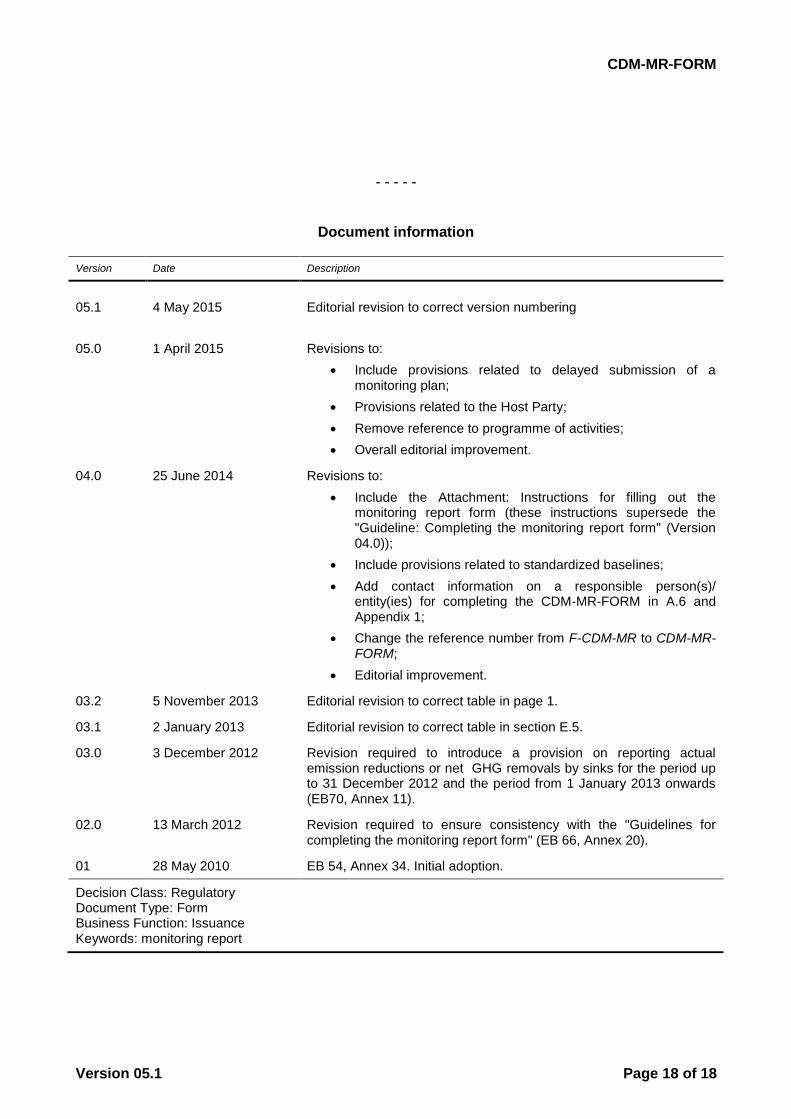
Document information
Version Date Description
05.1
05.0
4 May 2015
1 April 2015
Editorial revision to correct version numbering
Revisions to:
Include provisions related to delayed submission of a monitoring plan;
Provisions related to the Host Party;
Remove reference to programme of activities;
Overall editorial improvement.
04.0 25 June 2014 Revisions to:
Include the Attachment: Instructions for filling out the monitoring report form (these instructions supersede the "Guideline: Completing the monitoring report form" (Version 04.0));
Include provisions related to standardized baselines;
Add contact information on a responsible person(s)/ entity(ies) for completing the CDM-MR-FORM in A.6 and Appendix 1;
Change the reference number from F-CDM-MR to CDM-MR-FORM;
Editorial improvement.
03.2 5 November 2013 Editorial revision to correct table in page 1.
03.1 2 January 2013 Editorial revision to correct table in section E.5.
03.0 3 December 2012 Revision required to introduce a provision on reporting actual emission reductions or net GHG removals by sinks for the period up to 31 December 2012 and the period from 1 January 2013 onwards (EB70, Annex 11).
02.0 13 March 2012 Revision required to ensure consistency with the "Guidelines for completing the monitoring report form" (EB 66, Annex 20).
01 28 May 2010 EB 54, Annex 34. Initial adoption.
Decision Class: Regulatory Document Type: Form Business Function: Issuance Keywords: monitoring report