ACER Market Monitoring Report 2020 - Electricity
138
Publishing date: 12/1/2022 Document title: ACER Market Monitoring Report 2020 – Electricity Wholesale Market Volume Document version: 1.1 We appreciate your feedback. Please click on the button to take a 5-minute online survey and provide your feedback about this document. Share this document GIVE FEEDBACK
-
Upload
khangminh22 -
Category
Documents
-
view
3 -
download
0
Transcript of ACER Market Monitoring Report 2020 - Electricity

Publishing date: 12/1/2022
Document title: ACER Market Monitoring Report 2020 – Electricity Wholesale Market Volume
Document version: 1.1
We appreciate your feedback.
Please click on the button to take a 5-minute online survey and provide your feedback about this document.
Share this document
GIVE FEEDBACK
Social icon
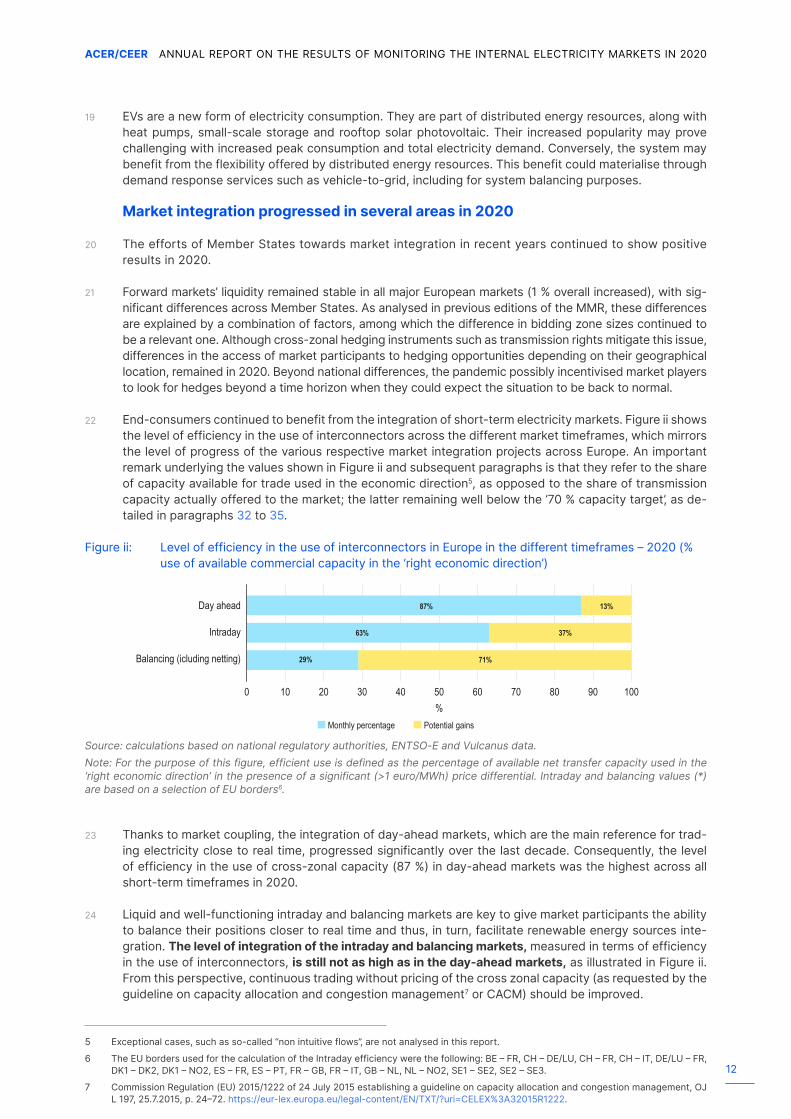
CircleOnly use blue and/or white.
For more details check out ourBrand Guidelines.
ACER/CEER
Annual Report on the Results of Monitoring the Internal Electricity and Natural Gas Markets in 2020Electricity Wholesale Markets Volume
October 2021

2
ACER/CEER ANNUAL REPORT ON THE RESULTS OF MONITORING THE INTERNAL ELECTRICITY MARKETS IN 2020
© European Union Agency for the Cooperation of Energy Regulators and the Council of European Energy Regulators, 2021
Reproduction is authorised provided the source is acknowledged.
Legal notice
The joint publication of the European Union Agency for the Cooperation of Energy Regulators and the Council of European Energy Regulators is protected by copyright. The European Union Agency for the Cooperation of Energy Regulators and the Council of European Energy Regulators accept no responsibil-ity or liability for any consequences arising from the use of the data contained in this document.

3
ACER/CEER ANNUAL REPORT ON THE RESULTS OF MONITORING THE INTERNAL ELECTRICITY MARKETS IN 2020
ACER/CEER
Annual Report on the Results of Monitoring the Internal Electricity and Natural Gas Markets in 2020Electricity Wholesale Markets Volume
October 2021
The support of the Energy Community Secretariat in coordinating the collection and in analysing the information related to the Energy Community Contracting Parties is gratefully acknowledged.
CEER
Mr Charles EsserT +32 (0)2 788 73 30E [email protected]
Cours Saint-Michel 30a, box F1040 BrusselsBelgium
Trg republike 3 1000 Ljubljana Slovenia
If you have any queries relating to this report, please contact:
ACER
Mr David MerinoT +386 (0)8 2053 417E [email protected]

4
ACER/CEER ANNUAL REPORT ON THE RESULTS OF MONITORING THE INTERNAL ELECTRICITY MARKETS IN 2020
ContentsExecutive Summary . . . . . . . . . . . . . . . . . . . . . . . . . . . . . . . . . . . . . . . . . . . . . . . . . . . . . . . . . . . . . . . . . . . . . . . . . . . . . . . . . . . . . . . . . . . . . . . . . . . . . . 9
Recommendations . . . . . . . . . . . . . . . . . . . . . . . . . . . . . . . . . . . . . . . . . . . . . . . . . . . . . . . . . . . . . . . . . . . . . . . . . . . . . . . . . . . . . . . . . . . . . . . . . . . . . . 21
1 Introduction . . . . . . . . . . . . . . . . . . . . . . . . . . . . . . . . . . . . . . . . . . . . . . . . . . . . . . . . . . . . . . . . . . . . . . . . . . . . . . . . . . . . . . . . . . . . . . . . . . . . . . . . . . 24
Part I: Electricity Market trends in 2020 . . . . . . . . . . . . . . . . . . . . . . . . . . . . . . . . . . . . . . . . . . . . . . . . . . . . . . . . . . . . . . . . . . . . . . . . . . . . . . 27
2 Overview of market developments . . . . . . . . . . . . . . . . . . . . . . . . . . . . . . . . . . . . . . . . . . . . . . . . . . . . . . . . . . . . . . . . . . . . . . . . . . . . . . . . 272.1 Electricity supply and demand . . . . . . . . . . . . . . . . . . . . . . . . . . . . . . . . . . . . . . . . . . . . . . . . . . . . . . . . . . . . . . . . . . . . . . . . . . . . . 272.2 Market trends related to the energy transition . . . . . . . . . . . . . . . . . . . . . . . . . . . . . . . . . . . . . . . . . . . . . . . . . . . . . . . . . . . 28
3 Evolution of day-ahead prices . . . . . . . . . . . . . . . . . . . . . . . . . . . . . . . . . . . . . . . . . . . . . . . . . . . . . . . . . . . . . . . . . . . . . . . . . . . . . . . . . . . . . 343.1 Electricity price developments . . . . . . . . . . . . . . . . . . . . . . . . . . . . . . . . . . . . . . . . . . . . . . . . . . . . . . . . . . . . . . . . . . . . . . . . . . . . . 343.2 Price spikes and negative prices . . . . . . . . . . . . . . . . . . . . . . . . . . . . . . . . . . . . . . . . . . . . . . . . . . . . . . . . . . . . . . . . . . . . . . . . . . . 363.3 Price convergence . . . . . . . . . . . . . . . . . . . . . . . . . . . . . . . . . . . . . . . . . . . . . . . . . . . . . . . . . . . . . . . . . . . . . . . . . . . . . . . . . . . . . . . . . . 38
Part II: The Internal Electricity Market . . . . . . . . . . . . . . . . . . . . . . . . . . . . . . . . . . . . . . . . . . . . . . . . . . . . . . . . . . . . . . . . . . . . . . . . . . . . . . . . . 40
4 Cross-zonal capacity . . . . . . . . . . . . . . . . . . . . . . . . . . . . . . . . . . . . . . . . . . . . . . . . . . . . . . . . . . . . . . . . . . . . . . . . . . . . . . . . . . . . . . . . . . . . . . . 404.1 Level of cross-zonal capacity where NTC calculation applies . . . . . . . . . . . . . . . . . . . . . . . . . . . . . . . . . . . . . . . . . . 404.2 Evolution of capacity on borders where flow-based capacity calculation applies (CWE region) . . . . 424.3 Remedial actions . . . . . . . . . . . . . . . . . . . . . . . . . . . . . . . . . . . . . . . . . . . . . . . . . . . . . . . . . . . . . . . . . . . . . . . . . . . . . . . . . . . . . . . . . . . . 454.4 Efficiency of current bidding zone configuration (market report pursuant to Article 34(1) of
the CACM Regulation) . . . . . . . . . . . . . . . . . . . . . . . . . . . . . . . . . . . . . . . . . . . . . . . . . . . . . . . . . . . . . . . . . . . . . . . . . . . . . . . . . . . . . . 474.5 Use of cross-zonal capacity across timeframes . . . . . . . . . . . . . . . . . . . . . . . . . . . . . . . . . . . . . . . . . . . . . . . . . . . . . . . . . . 52
5 Liquidity across market timeframes . . . . . . . . . . . . . . . . . . . . . . . . . . . . . . . . . . . . . . . . . . . . . . . . . . . . . . . . . . . . . . . . . . . . . . . . . . . . . . . 655.1 Forward markets liquidity . . . . . . . . . . . . . . . . . . . . . . . . . . . . . . . . . . . . . . . . . . . . . . . . . . . . . . . . . . . . . . . . . . . . . . . . . . . . . . . . . . . 655.2 Day-ahead markets liquidity . . . . . . . . . . . . . . . . . . . . . . . . . . . . . . . . . . . . . . . . . . . . . . . . . . . . . . . . . . . . . . . . . . . . . . . . . . . . . . . . 685.3 Intraday markets liquidity . . . . . . . . . . . . . . . . . . . . . . . . . . . . . . . . . . . . . . . . . . . . . . . . . . . . . . . . . . . . . . . . . . . . . . . . . . . . . . . . . . . 68
6 Capacity mechanisms and resource adequacy . . . . . . . . . . . . . . . . . . . . . . . . . . . . . . . . . . . . . . . . . . . . . . . . . . . . . . . . . . . . . . . . . . 706.1 Status of CMs . . . . . . . . . . . . . . . . . . . . . . . . . . . . . . . . . . . . . . . . . . . . . . . . . . . . . . . . . . . . . . . . . . . . . . . . . . . . . . . . . . . . . . . . . . . . . . . 716.2 Costs and financing of CMs . . . . . . . . . . . . . . . . . . . . . . . . . . . . . . . . . . . . . . . . . . . . . . . . . . . . . . . . . . . . . . . . . . . . . . . . . . . . . . . . 726.3 Technologies remunerated under CMs . . . . . . . . . . . . . . . . . . . . . . . . . . . . . . . . . . . . . . . . . . . . . . . . . . . . . . . . . . . . . . . . . . . . 756.4 Cross-border participation in CMs . . . . . . . . . . . . . . . . . . . . . . . . . . . . . . . . . . . . . . . . . . . . . . . . . . . . . . . . . . . . . . . . . . . . . . . . . 766.5 Interruptibility schemes . . . . . . . . . . . . . . . . . . . . . . . . . . . . . . . . . . . . . . . . . . . . . . . . . . . . . . . . . . . . . . . . . . . . . . . . . . . . . . . . . . . . . 77
7 Efficient price formation and easy entry and participation for new entrants and small actors in wholesale electricity markets . . . . . . . . . . . . . . . . . . . . . . . . . . . . . . . . . . . . . . . . . . . . . . . . . . . . . . . . . . . . . . . . . . . . . . . . . . . . . . . . . . . . . 837.1 Price limits and restrictions on features of imbalance settlement . . . . . . . . . . . . . . . . . . . . . . . . . . . . . . . . . . . . . . 857.2 Limited competitive pressure and/or liquidity in wholesale markets . . . . . . . . . . . . . . . . . . . . . . . . . . . . . . . . . . . . 887.3 Insufficient cross-zonal capacity . . . . . . . . . . . . . . . . . . . . . . . . . . . . . . . . . . . . . . . . . . . . . . . . . . . . . . . . . . . . . . . . . . . . . . . . . . 897.4 Bidding zones not reflecting structural congestions . . . . . . . . . . . . . . . . . . . . . . . . . . . . . . . . . . . . . . . . . . . . . . . . . . . . . 907.5 Restrictive requirements in prequalification and/or the design of products for balancing . . . . . . . . . . . 917.6 Lack of a proper legal framework to enable new entrants and small players . . . . . . . . . . . . . . . . . . . . . . . . . . 957.7 Restrictive requirements to participate in capacity mechanisms and interruptibility schemes . . . . . . . 977.8 Limited competitive pressure in retail markets . . . . . . . . . . . . . . . . . . . . . . . . . . . . . . . . . . . . . . . . . . . . . . . . . . . . . . . . . . . 997.9 End-user price interventions . . . . . . . . . . . . . . . . . . . . . . . . . . . . . . . . . . . . . . . . . . . . . . . . . . . . . . . . . . . . . . . . . . . . . . . . . . . . 1007.10 Limited incentive to contract dynamic retail prices . . . . . . . . . . . . . . . . . . . . . . . . . . . . . . . . . . . . . . . . . . . . . . . . . . . . . 1027.11 Insufficient information provided by system operators . . . . . . . . . . . . . . . . . . . . . . . . . . . . . . . . . . . . . . . . . . . . . . . . 103

5
ACER/CEER ANNUAL REPORT ON THE RESULTS OF MONITORING THE INTERNAL ELECTRICITY MARKETS IN 2020
Part III: Energy Community outlook . . . . . . . . . . . . . . . . . . . . . . . . . . . . . . . . . . . . . . . . . . . . . . . . . . . . . . . . . . . . . . . . . . . . . . . . . . . . . . . . . . 105
8 Coordination of the market reforms in the Energy Community . . . . . . . . . . . . . . . . . . . . . . . . . . . . . . . . . . . . . . . . . . . . . . . . 105
9 Specific progress made by Contracting Parties . . . . . . . . . . . . . . . . . . . . . . . . . . . . . . . . . . . . . . . . . . . . . . . . . . . . . . . . . . . . . . . 1069.1 Albania . . . . . . . . . . . . . . . . . . . . . . . . . . . . . . . . . . . . . . . . . . . . . . . . . . . . . . . . . . . . . . . . . . . . . . . . . . . . . . . . . . . . . . . . . . . . . . . . . . . . . 1069.2 Bosnia and Hercegovina . . . . . . . . . . . . . . . . . . . . . . . . . . . . . . . . . . . . . . . . . . . . . . . . . . . . . . . . . . . . . . . . . . . . . . . . . . . . . . . . . . 1069.3 Georgia . . . . . . . . . . . . . . . . . . . . . . . . . . . . . . . . . . . . . . . . . . . . . . . . . . . . . . . . . . . . . . . . . . . . . . . . . . . . . . . . . . . . . . . . . . . . . . . . . . . . . . 1079.4 Kosovo* . . . . . . . . . . . . . . . . . . . . . . . . . . . . . . . . . . . . . . . . . . . . . . . . . . . . . . . . . . . . . . . . . . . . . . . . . . . . . . . . . . . . . . . . . . . . . . . . . . . . . 1079.5 North Macedonia . . . . . . . . . . . . . . . . . . . . . . . . . . . . . . . . . . . . . . . . . . . . . . . . . . . . . . . . . . . . . . . . . . . . . . . . . . . . . . . . . . . . . . . . . . . 1079.6 Moldova . . . . . . . . . . . . . . . . . . . . . . . . . . . . . . . . . . . . . . . . . . . . . . . . . . . . . . . . . . . . . . . . . . . . . . . . . . . . . . . . . . . . . . . . . . . . . . . . . . . . 1089.7 Montenegro . . . . . . . . . . . . . . . . . . . . . . . . . . . . . . . . . . . . . . . . . . . . . . . . . . . . . . . . . . . . . . . . . . . . . . . . . . . . . . . . . . . . . . . . . . . . . . . . 1089.8 Serbia . . . . . . . . . . . . . . . . . . . . . . . . . . . . . . . . . . . . . . . . . . . . . . . . . . . . . . . . . . . . . . . . . . . . . . . . . . . . . . . . . . . . . . . . . . . . . . . . . . . . . . . 1089.9 Ukraine . . . . . . . . . . . . . . . . . . . . . . . . . . . . . . . . . . . . . . . . . . . . . . . . . . . . . . . . . . . . . . . . . . . . . . . . . . . . . . . . . . . . . . . . . . . . . . . . . . . . . 108
Annex 1: Additional figures and tables . . . . . . . . . . . . . . . . . . . . . . . . . . . . . . . . . . . . . . . . . . . . . . . . . . . . . . . . . . . . . . . . . . . . . . . . . . . . . . 109
Annex 2: Efficiency of current bidding zone configuration (indicators, qualification criteria and detailed analysis). . . . . . . . . . . . . . . . . . . . . . . . . . . . . . . . . . . . . . . . . . . . . . . . . . . . . . . . . . . . . . . . . . . . . . . . . . . . . . . . . . . . . . . . . . . . . . . . . . . . . . . . . . . . . 117
Annex 3: Unscheduled flows . . . . . . . . . . . . . . . . . . . . . . . . . . . . . . . . . . . . . . . . . . . . . . . . . . . . . . . . . . . . . . . . . . . . . . . . . . . . . . . . . . . . . . . . . . 119
Annex 4: Methodology to estimate the scores per barrier . . . . . . . . . . . . . . . . . . . . . . . . . . . . . . . . . . . . . . . . . . . . . . . . . . . . . . . . 123
Annex 5: Data sources . . . . . . . . . . . . . . . . . . . . . . . . . . . . . . . . . . . . . . . . . . . . . . . . . . . . . . . . . . . . . . . . . . . . . . . . . . . . . . . . . . . . . . . . . . . . . . . . 135
Annex 6: List of acronyms . . . . . . . . . . . . . . . . . . . . . . . . . . . . . . . . . . . . . . . . . . . . . . . . . . . . . . . . . . . . . . . . . . . . . . . . . . . . . . . . . . . . . . . . . . . . 136

6
ACER/CEER ANNUAL REPORT ON THE RESULTS OF MONITORING THE INTERNAL ELECTRICITY MARKETS IN 2020
List of figuresFigure i: Evolution of monthly average day-ahead electricity wholesale prices in a selection
of EU Member States – 2010 – 2021 (euros/MWh) . . . . . . . . . . . . . . . . . . . . . . . . . . . . . . . . . . . . . . . . . . . . . . . . . . . . . 9Figure ii: Level of efficiency in the use of interconnectors in Europe in the different
timeframes – 2020 (% use of available commercial capacity in the ‘right economic direction’) . . . 12Figure iii: Interruptibility schemes in Europe - 2020 . . . . . . . . . . . . . . . . . . . . . . . . . . . . . . . . . . . . . . . . . . . . . . . . . . . . . . . . . . . . . 19Figure 1: Year-on-year changes in electricity demand in the EU-27 + Norway, Switzerland,
and the UK – 2016–2020 (%) . . . . . . . . . . . . . . . . . . . . . . . . . . . . . . . . . . . . . . . . . . . . . . . . . . . . . . . . . . . . . . . . . . . . . . . . . . . . 27Figure 2: Evolution of generation from RES, per type of RES technology, compared to
generation from fossil fuels in the EU-27 + Norway, Switzerland, and the UK – 2016–2020 (TWh) . . . . . . . . . . . . . . . . . . . . . . . . . . . . . . . . . . . . . . . . . . . . . . . . . . . . . . . . . . . . . . . . . . . . . . . . . . . . . . . . . . . . . . . . 28
Figure 3: Year-on-year percentage change for the main generation technologies in EU-27 + Norway, Switzerland, and the UK – 2020 (%) . . . . . . . . . . . . . . . . . . . . . . . . . . . . . . . . . . . . . . . . . . . . . . . . . . . . . . . . . . 28
Figure 4: Evolution of installed capacity for the main types of renewable (left) and conventional (right) generation technologies, in the EU-27 + Norway, Switzerland, and the UK – 2016–2020 (GW) . . . . . . . . . . . . . . . . . . . . . . . . . . . . . . . . . . . . . . . . . . . . . . . . . . . . . . . . . . . . . . . . . . . . . . . . . 29
Figure 5: Capacity factors of EU-27 coal and gas-fired power plants, 2016-2020 (%) . . . . . . . . . . . . . . . . . . . . . . . 29Figure 6: Evolution of the EUA price (euros/tonne CO2), and German month-ahead clean
spark and clean dark spreads (euros/MWh) – 2011–2020 . . . . . . . . . . . . . . . . . . . . . . . . . . . . . . . . . . . . . . . . . . . . 30Figure 7: Greenhouse gas emission intensity of electricity generation, EU-27 average – 1990–
2020 (g CO2e/kWh) . . . . . . . . . . . . . . . . . . . . . . . . . . . . . . . . . . . . . . . . . . . . . . . . . . . . . . . . . . . . . . . . . . . . . . . . . . . . . . . . . . . . . . 31Figure 8: Total emissions of EU-27 electricity generation, share per MS (areas of rectangles
correspond to each MS’s share) – 2020 . . . . . . . . . . . . . . . . . . . . . . . . . . . . . . . . . . . . . . . . . . . . . . . . . . . . . . . . . . . . . . . 31Figure 9: Share of electric passenger cars among all newly registered electric cars in the EU-
27 in 2016 (left) and 2020 (right) (%) . . . . . . . . . . . . . . . . . . . . . . . . . . . . . . . . . . . . . . . . . . . . . . . . . . . . . . . . . . . . . . . . . . 32Figure 10: Growth in the total number of EVs in the EU-27 (left) and the number of public
electric vehicle charging points in the EU (right) . . . . . . . . . . . . . . . . . . . . . . . . . . . . . . . . . . . . . . . . . . . . . . . . . . . . . . 32Figure 11: Average annual DA electricity prices and relative changes compared to the previous
year in European bidding zones – 2020 (euros/MWh and % change compared to 2019) . . . . . . . . . 35Figure 12: Evolution of annual DA electricity prices in a selection of European markets – 2016–
2020 (euros/MWh) . . . . . . . . . . . . . . . . . . . . . . . . . . . . . . . . . . . . . . . . . . . . . . . . . . . . . . . . . . . . . . . . . . . . . . . . . . . . . . . . . . . . . . . 36Figure 13: DA price spikes across Europe – 2020 (left), and evolution of price spikes in Europe
– 2016–2020 (right) . . . . . . . . . . . . . . . . . . . . . . . . . . . . . . . . . . . . . . . . . . . . . . . . . . . . . . . . . . . . . . . . . . . . . . . . . . . . . . . . . . . . . . 37Figure 14: DA negative prices across Europe – 2020 (left), and evolution of negative prices in
Europe – 2016–2020 (right) . . . . . . . . . . . . . . . . . . . . . . . . . . . . . . . . . . . . . . . . . . . . . . . . . . . . . . . . . . . . . . . . . . . . . . . . . . . . . 37Figure 15: DA price convergence in Europe by region – 2016–2020 (% of hours) . . . . . . . . . . . . . . . . . . . . . . . . . . . . . . 39Figure 16: NCT averages of both directions on cross-zonal borders, aggregated per CCR –
2016–2020 (GW) . . . . . . . . . . . . . . . . . . . . . . . . . . . . . . . . . . . . . . . . . . . . . . . . . . . . . . . . . . . . . . . . . . . . . . . . . . . . . . . . . . . . . . . . . 40Figure 17: Changes in tradable capacity (NTC) in Europe – 2019–2020 (MW) . . . . . . . . . . . . . . . . . . . . . . . . . . . . . . . . . . 41Figure 18: Average size (nth root of the volume) of the directional FB DA domain in the
economic direction in the Core (CWE) – 2016–2019 (GW) . . . . . . . . . . . . . . . . . . . . . . . . . . . . . . . . . . . . . . . . . . . . 42Figure 19: Share of active constraints in the Core (CWE) domain per TSO control area and
category – 2020 (%) . . . . . . . . . . . . . . . . . . . . . . . . . . . . . . . . . . . . . . . . . . . . . . . . . . . . . . . . . . . . . . . . . . . . . . . . . . . . . . . . . . . . . 43Figure 20: Density function of the minimum hourly RAM over Fmax among all CNECs in the
Core (CWE) region, per MS – 2019–2020 (%) . . . . . . . . . . . . . . . . . . . . . . . . . . . . . . . . . . . . . . . . . . . . . . . . . . . . . . . . . . 44Figure 21: Distribution of redispatching volume by underlying cause (left) and by objective
(right) – 2020 (%) . . . . . . . . . . . . . . . . . . . . . . . . . . . . . . . . . . . . . . . . . . . . . . . . . . . . . . . . . . . . . . . . . . . . . . . . . . . . . . . . . . . . . . . . 46Figure 22: National performances with respect to the use of costly remedial actions –
evaluation of the cost of remedial actions per unit of demand – 2018–2020 . . . . . . . . . . . . . . . . . . . . . . . 50Figure 23: Forward capacity allocation - status of the implementation as of 1 January 2021 . . . . . . . . . . . . . . . . . 53Figure 24: Level of efficient use of cross-zonal capacity in the DA market timeframe, per
border in Europe – 2020 (%) . . . . . . . . . . . . . . . . . . . . . . . . . . . . . . . . . . . . . . . . . . . . . . . . . . . . . . . . . . . . . . . . . . . . . . . . . . . . 54Figure 25: Estimated social welfare gains still to be obtained from further extending DA market
coupling per border – 2018–2020 . . . . . . . . . . . . . . . . . . . . . . . . . . . . . . . . . . . . . . . . . . . . . . . . . . . . . . . . . . . . . . . . . . . . . . 55Figure 26: Absolute sum of net ID nominations at relevant EU borders – 2018–2020 (TWh) . . . . . . . . . . . . . . . . . . 56Figure 27: Weighted average prices of balancing energy activated from aFRRs (upward and
downward activations) in a selection of EU markets – 2020 (euros/MWh) . . . . . . . . . . . . . . . . . . . . . . . . . . 57Figure 28: Average prices of balancing capacity (upward and downward capacity from aFRRs)
in selected EU markets – 2020 (euros/MW/h) . . . . . . . . . . . . . . . . . . . . . . . . . . . . . . . . . . . . . . . . . . . . . . . . . . . . . . . . . 58

7
ACER/CEER ANNUAL REPORT ON THE RESULTS OF MONITORING THE INTERNAL ELECTRICITY MARKETS IN 2020
Figure 29: Overall costs of balancing (capacity and energy) over national electricity demand in selected European markets – 2020 (euros/MWh) . . . . . . . . . . . . . . . . . . . . . . . . . . . . . . . . . . . . . . . . . . . . . . . . . . . . . 59
Figure 30: Repartition of the procurement lead time of each type of reserve in selected European markets – 2020 (%) . . . . . . . . . . . . . . . . . . . . . . . . . . . . . . . . . . . . . . . . . . . . . . . . . . . . . . . . . . . . . . . . . . . . . . . . . . 60
Figure 31: Repartition of procurement lead time of each MS, for all types of reserve (FCR, aFRR, mFRR, RR) – 2020 (%) . . . . . . . . . . . . . . . . . . . . . . . . . . . . . . . . . . . . . . . . . . . . . . . . . . . . . . . . . . . . . . . . . . . . . . . . . . . . 60
Figure 32: EU balancing energy activated cross-border as a percentage of the amount of total balancing energy activated to meet national needs (left) and EU balancing capacity contracted cross-border as a percentage of the system requirements of reserve capacity (upward FCRs) (right) – 2020 (%) . . . . . . . . . . . . . . . . . . . . . . . . . . . . . . . . . . . . . . . . . . . . . . . . . . . . . . . . . . . . 61
Figure 33: Imbalance netting as a percentage of the total need for balancing energy (explicitly activated or avoided by means of netting) from all types of reserves in national balancing markets – 2020 (%) . . . . . . . . . . . . . . . . . . . . . . . . . . . . . . . . . . . . . . . . . . . . . . . . . . . . . . . . . . . . . . . . . . . . . . . . . . 61
Figure 34: Churn factors in major European forward markets – 2016–2020 . . . . . . . . . . . . . . . . . . . . . . . . . . . . . . . . . . . . 65Figure 35: Forward markets churn factor per type of trade in the largest European forward
markets – 2020 . . . . . . . . . . . . . . . . . . . . . . . . . . . . . . . . . . . . . . . . . . . . . . . . . . . . . . . . . . . . . . . . . . . . . . . . . . . . . . . . . . . . . . . . . . 66Figure 36: Share of yearly traded volumes of selected European forward markets by product
type – 2016–2020 (%) . . . . . . . . . . . . . . . . . . . . . . . . . . . . . . . . . . . . . . . . . . . . . . . . . . . . . . . . . . . . . . . . . . . . . . . . . . . . . . . . . . . 67Figure 37: Average bid-ask spreads of OTC yearly products in European forward markets per
year of delivery – 2020–2022 (euros/MWh) . . . . . . . . . . . . . . . . . . . . . . . . . . . . . . . . . . . . . . . . . . . . . . . . . . . . . . . . . . . 67Figure 38: Churn factors in major European DA markets – 2016–2020 . . . . . . . . . . . . . . . . . . . . . . . . . . . . . . . . . . . . . . . . . . 68Figure 39: Yearly ID churn factors in major European markets by type of trade – 2018–2020 . . . . . . . . . . . . . . . . . 69Figure 40: Share of continuous ID-traded volumes according to intra-zonal vs. cross-zonal
nature of trades in Europe and yearly continuous ID-traded volumes – 2017–2020 (% and TWh) 69Figure 41: CMs in Europe – 2020 . . . . . . . . . . . . . . . . . . . . . . . . . . . . . . . . . . . . . . . . . . . . . . . . . . . . . . . . . . . . . . . . . . . . . . . . . . . . . . . . . . . 72Figure 42: Costs incurred or forecast to finance CMs in the EU-27 (left) and per MS (right) –
2019 - 2022 (million euros) . . . . . . . . . . . . . . . . . . . . . . . . . . . . . . . . . . . . . . . . . . . . . . . . . . . . . . . . . . . . . . . . . . . . . . . . . . . . . 73Figure 43: Unit cost of CMs – 2019 - 2022, (thousand euros per MW) . . . . . . . . . . . . . . . . . . . . . . . . . . . . . . . . . . . . . . . . . . 73Figure 44: Costs incurred or forecast to finance CMs per unit demand – 2019 – 2021, and
expressed as a percentage of the yearly average DA price in Europe – 2020, (euros per MWh demand and %, respectively) . . . . . . . . . . . . . . . . . . . . . . . . . . . . . . . . . . . . . . . . . . . . . . . . . . . . . . . . . . . . . . . . 74
Figure 45 : Capacity remunerated through CMs in a number of MSs per type of technology – 2020 – 2021 (%) . . . . . . . . . . . . . . . . . . . . . . . . . . . . . . . . . . . . . . . . . . . . . . . . . . . . . . . . . . . . . . . . . . . . . . . . . . . . . . . . . . . . . . . . . . 75
Figure 46: Long-term contracted capacity and relevant costs by type of technology in the EU-27 – 2026 – 2035 (GW and million euros, respectively) . . . . . . . . . . . . . . . . . . . . . . . . . . . . . . . . . . . . . . . . . . . . . . 76
Figure 47: Interruptibility schemes in Europe in 2020 . . . . . . . . . . . . . . . . . . . . . . . . . . . . . . . . . . . . . . . . . . . . . . . . . . . . . . . . . . . . . 78Figure 48: Realised and forecast costs of the ISs over 2017 – 2021 (million euros) . . . . . . . . . . . . . . . . . . . . . . . . . . . . 80Figure 49: Number of IS activations over 2016 – 2020 . . . . . . . . . . . . . . . . . . . . . . . . . . . . . . . . . . . . . . . . . . . . . . . . . . . . . . . . . . . 80Figure 50: Maximum and minimum technical price limits for balancing energy products per MSs
– 2020 (euros/MWh) . . . . . . . . . . . . . . . . . . . . . . . . . . . . . . . . . . . . . . . . . . . . . . . . . . . . . . . . . . . . . . . . . . . . . . . . . . . . . . . . . . . . . 86Figure 51: Share of hours when the minimum 70 % target was not met across the EU (%) - 2020 . . . . . . . . . . . 89Figure 52: Average MACZT on network elements where the minimum 70 % target was not met (%) - 2020 90Figure 53: Capacity of DSR, RES generation and energy storage remunerated through CMs in a
number of Member States – 2020 (%) . . . . . . . . . . . . . . . . . . . . . . . . . . . . . . . . . . . . . . . . . . . . . . . . . . . . . . . . . . . . . . . . . 99Figure 54: Monthly evolution of DA price spikes, together with the monthly cost of producing
with gas, on which the price spikes are based (number of hours with negative prices and euros/MWh, respectively) . . . . . . . . . . . . . . . . . . . . . . . . . . . . . . . . . . . . . . . . . . . . . . . . . . . . . . . . . . . . . . . . 109
Figure 55: Monthly evolution of DA negative prices –2017 – 2020 (number of hours with negative prices) . 110Figure 56: Absolute aggregate sum of UFs for the Core (CWE and non-CWE borders) and Italy
North regions and for Swiss borders – 2016–2020 (TWh) . . . . . . . . . . . . . . . . . . . . . . . . . . . . . . . . . . . . . . . . . . . 119Figure 57: Average oriented UFs in Continental Europe – 2020 (MW) . . . . . . . . . . . . . . . . . . . . . . . . . . . . . . . . . . . . . . . . . . 120Figure 58: Average oriented UAFs in Continental Europe – 2020 (MW) . . . . . . . . . . . . . . . . . . . . . . . . . . . . . . . . . . . . . . . . 121Figure 59: Average oriented LFs in Continental Europe – 2019 (MW) . . . . . . . . . . . . . . . . . . . . . . . . . . . . . . . . . . . . . . . . . . . 121Figure 60: Average absolute UAFs and LFs in Continental Europe – 2016–2019 (GWh) . . . . . . . . . . . . . . . . . . . . . . . 122

8
ACER/CEER ANNUAL REPORT ON THE RESULTS OF MONITORING THE INTERNAL ELECTRICITY MARKETS IN 2020
List of tablesTable i: Overview of barriers to efficient price formation per Member State – 2020 . . . . . . . . . . . . . . . . . . . . . . . 15Table ii: Overview of barriers to new entrants and small actors per Member State – 2020 . . . . . . . . . . . . . . . . . 15Table 1: Evolution of the costs of remedial actions – 2018–2020 (thousand euros) . . . . . . . . . . . . . . . . . . . . . . . . . 46Table 2: Regional performances with respect to the available cross-zonal capacity-
percentage of time when the 70% minimum target was met (%) - 2020 . . . . . . . . . . . . . . . . . . . . . . . . . . . . 49Table 3: Need for investigating bidding zone improvements . . . . . . . . . . . . . . . . . . . . . . . . . . . . . . . . . . . . . . . . . . . . . . . . . . . 51Table 4: Cost recovery method per MS with capacity payments . . . . . . . . . . . . . . . . . . . . . . . . . . . . . . . . . . . . . . . . . . . . . . 74Table 5: Status on cross-border participation in CMs . . . . . . . . . . . . . . . . . . . . . . . . . . . . . . . . . . . . . . . . . . . . . . . . . . . . . . . . . . 77Table 6: Purpose of the interruptibility schemes . . . . . . . . . . . . . . . . . . . . . . . . . . . . . . . . . . . . . . . . . . . . . . . . . . . . . . . . . . . . . . . . 79Table 7: Barriers to efficient price formation and easy market entry and participation for new
entrants and small actors – 2020 . . . . . . . . . . . . . . . . . . . . . . . . . . . . . . . . . . . . . . . . . . . . . . . . . . . . . . . . . . . . . . . . . . . . . . . 84Table 8: Final positions and settlement rule per MS – 2020 . . . . . . . . . . . . . . . . . . . . . . . . . . . . . . . . . . . . . . . . . . . . . . . . . . . 87Table 9: Average emission intensity of MSs . . . . . . . . . . . . . . . . . . . . . . . . . . . . . . . . . . . . . . . . . . . . . . . . . . . . . . . . . . . . . . . . . . . 109Table 10: Number of active capacity constraints and shadow prices by element type in the
Core (CWE) region – 2019– 2020 . . . . . . . . . . . . . . . . . . . . . . . . . . . . . . . . . . . . . . . . . . . . . . . . . . . . . . . . . . . . . . . . . . . . . 110Table 11: Number of active capacity constraints and shadow prices induced by ALEGrO in the
Core (CWE) region – 2020 . . . . . . . . . . . . . . . . . . . . . . . . . . . . . . . . . . . . . . . . . . . . . . . . . . . . . . . . . . . . . . . . . . . . . . . . . . . . . 110Table 12: Detailed data on the cost of remedial actions in European countries – 2020 . . . . . . . . . . . . . . . . . . . . . . 111Table 13: Characteristics of existing CMs in the EU – 2020 . . . . . . . . . . . . . . . . . . . . . . . . . . . . . . . . . . . . . . . . . . . . . . . . . . . . 112Table 14 Interruptibility schemes summary table – 2020 . . . . . . . . . . . . . . . . . . . . . . . . . . . . . . . . . . . . . . . . . . . . . . . . . . . . . 113Table 15: Main market characteristics of the Contracting Parties of the Energy Community-
2020 (MWh) . . . . . . . . . . . . . . . . . . . . . . . . . . . . . . . . . . . . . . . . . . . . . . . . . . . . . . . . . . . . . . . . . . . . . . . . . . . . . . . . . . . . . . . . . . . . 114Table 16: Main market characteristics of the Contracting Parties of the Energy Community - 2020 (%) . . . 114Table 17: Market share in generation for the contracting parties of the energy community - 2020 (%) . . . 115Table 18: Market share in DAM for the contracting parties of the energy community – 2020 (%) . . . . . . . . . . 115Table 19: Main market characteristics for the contracting parties of the energy community – 2020 . . . . . . . 116Table 20: Bidding zone efficiency (detailed assessment) . . . . . . . . . . . . . . . . . . . . . . . . . . . . . . . . . . . . . . . . . . . . . . . . . . . . . . 117Table 21: Overview of the indicators used for each of the analysed barriers – 2020 . . . . . . . . . . . . . . . . . . . . . . . . 124Table 22: Product requirements and design features of the national balancing markets that
are not in line with the European target model – 2020 . . . . . . . . . . . . . . . . . . . . . . . . . . . . . . . . . . . . . . . . . . . . . . 129Table 23: State of incorporation of provisions on active consumers into the national law – 31
December 2020 . . . . . . . . . . . . . . . . . . . . . . . . . . . . . . . . . . . . . . . . . . . . . . . . . . . . . . . . . . . . . . . . . . . . . . . . . . . . . . . . . . . . . . . . . 132Table 24: State of incorporation of provisions on CECs into the national regulatory law – 31
December 2020 . . . . . . . . . . . . . . . . . . . . . . . . . . . . . . . . . . . . . . . . . . . . . . . . . . . . . . . . . . . . . . . . . . . . . . . . . . . . . . . . . . . . . . . . . 132Table 25: State of incorporation of provisions on aggregators (including independent
aggregators) into the national law – 31 December 2020 . . . . . . . . . . . . . . . . . . . . . . . . . . . . . . . . . . . . . . . . . . . 133Table 26: Eligibility to participate in different market timeframes and products by some new
entrants and small actors – 2020 . . . . . . . . . . . . . . . . . . . . . . . . . . . . . . . . . . . . . . . . . . . . . . . . . . . . . . . . . . . . . . . . . . . . . 134Table 27: Data sources - Electricity Wholesale Markets Volume of the 2020 MMR . . . . . . . . . . . . . . . . . . . . . . . . . . 135

9
ACER/CEER ANNUAL REPORT ON THE RESULTS OF MONITORING THE INTERNAL ELECTRICITY MARKETS IN 2020
Executive Summary1 The 2020 Electricity Volume of the Market Monitoring Report (MMR) provides information on the status
of Europe’s electricity wholesale markets in 2020. The MMR covers the European Union (EU) Member States and, for some topics, the United Kingdom, Norway, Switzerland and the Energy Community (EnC) Contracting Parties (CPs).
Historical highs in European energy markets in 2021
2 While the present report focuses on 2020, the unprecedented increases in energy prices across the EU in 2021 deserve some initial attention at the time of publishing this report. By displaying electricity wholesale prices since 2010, Figure i illustrates the exceptional nature of this increase.
3 Both demand and supply factors have contributed to the increase in electricity prices. Electricity demand is recovering to pre-COVID levels. As a consequence of this increase and the low availability of wind dur-ing the summer, gas-fired power plants have increasingly become the price-setting units in electricity wholesale markets. Hence, pushed by extraordinarily high prices for gas, as gas prices in early October 2021 were 400% more expensive than in April 2021, and emission allowances (+89 %), electricity whole-sale prices increased rapidly.
Figure i: Evolution of monthly average day-ahead electricity wholesale prices in a selection of EU Member States – 2010 – 2021 (euros/MWh)
Source: ACER calculation based on ENTSO-E data
4 Higher than usual market prices are not per se a sign of malfunctioning markets, in particular when prices reflect underlying market fundamentals. That said, persistently high energy prices naturally raise a num-ber of concerns for governments, affordability for end-consumer and especially vulnerable consumers, the competitiveness of European industry, inflationary pressures and wider economic implications for the economic recovery.
5 In response to the high energy price rises, the European Commission published, in October, a “toolbox”1 of measures that could be provided by Member States to mitigate the impact of the significant 2021 wholesale price hikes on household bills, in particular on vulnerable consumers, while protecting the well-functioning EU energy markets. In it, the Commission tasks ACER witih assessing the benefits and draw-backs of the current wholesale electricity market design. The ACER Note on High Energy Prices2 (October 2021) identifies the drivers and the impact on price levels across Europe;
a) provides the market outlook of how long it is likely to last;
1 The European Commission Communication on tackling rising energy prices: a toolbox for action and support: https://eur-lex.europa.eu/legal-content/EN/TXT/PDF/?uri=CELEX:52021DC0660&from=EN.
2 The ACER Note on High Energy Prices (October 2021): https://documents.acer.europa.eu/en/The_agency/Organisation/Documents/Energy%20Prices_Final.pdf.
Euro
s/MW
h
150
120
60
90
30
02010 2011 20132012 2014 2015 2016 20182017 2019 2020 2021
AT BE DE/AT/LU DE/LU ES FR

10
ACER/CEER ANNUAL REPORT ON THE RESULTS OF MONITORING THE INTERNAL ELECTRICITY MARKETS IN 2020
b) looks at certain market behaviours; and
c) touches on some important policy considerations (such as short-term relief measures that can protect the energy poor and vulnerable consumers; the EU electricity market design; and perspec-tives on gas storage obligationn and on centralised gas purchasing of strategic reserves).
Key findings of the 2020 Market Monitoring Report
6 In 2020, trends observed in previous years, namely a drop in EU electricity demand and prices, and changes in the electricity generation mix, were reinforced during the pandemic. For the first time, renew-able energy sources generated more electricity than fossil fuels. In this context, the efforts of Member States (MSs) towards market integration in recent years continued to show positive results in 2020. In particular, 2020 saw further progress in the integration of EU intraday markets, which are instrumental for the large scale integration of renewable energy resources.
7 Most recommendations expressed in the previous edition of the MMR remain valid because of the limited progress of some key market integration projects in recent years. This situation reflects a combination of reasons, including long implementation timelines, the technical complexity of certain topics, and possibly enforcement difficulties. ACER reiterates its recommendation to finalise urgently the implementation of single day-ahead and single intraday market coupling and to increase gradually the level of cross zonal capacity that it is still far from the EU 70 % binding target. Implementing the policy recommendations pro-posed in this Volume will help to address both existing and emerging challenges, with the ultimate goal of ensuring a well-functioning internal electricity market.
8 As required by ACER’s regulation of the Clean Energy for All Europeans Package (CEP)3, this volume of the MMR includes the first assessment of barriers to price formation and entry and participation of new and small market players. An assessment of eleven potential barriers through a set of indicators reveals the ex-istence of such barriers, to varying degrees, in most Member States. Regarding efficient price formation, a number of issues stand out as barriers, including insufficient cross-zonal capacity and liquidity. The report identifies several main barriers affecting new and small players. Firstly, some Member States lack a legal framework to enable the entry and participation of new and small players in the various market segments. Secondly, in some Member States, new and small players are faced with requirements restricting their par-ticipation in balancing markets. Thirdly, some Member States lack sufficient competition in retail markets or insufficient incentives for consumers to participate in such markets more actively. Moreover, in some Member States, there is a practice of end-user price interventions, e.g. price regulation. In principle, some of these practices may represent an important barrier to efficient price formation and market entry. At the same time, in the current context of unusually high prices, end-user price intervention may be considered as an instrument to protect the most vulnerable from undesirable economic consequences. Nevertheless, end-user price interventions for energy poor and vulnerable households are allowed under EU legislation only in exceptional situations and under strict conditions, as set in Article 5 of the Electricity Directive. As such, these types of interventions reinforce the dilemma on how, on the one hand, to best protect the most vulnerable from these consequences, whilst, on the other hand, preserving the role and value of price signals to drive certain behaviour also deemed desirable from policymakers. All in all, notwithstanding the aim of such measures, they can constitute a barrier to efficient price formation and market entry and thus should be part of the broader overview assembled here. This does not take away from the ensuing policy discussion of which interventions amongst those outlined are deemed legitimate and proportionate versus those that are not.
9 In the context of security of supply, the report includes for the first time an assessment of interruptibility schemes. The report recommends that dedicated interruptibility schemes be only offered where no paral-lel procurement channels exist, or when there is a need to kick-start the development of new demand side response products or services. This is to avoid fragmenting competition.
10 The report also provides for the first time an overview of the market reforms in the Energy Community.
3 The Commission’s Clean Energy for All Europeans legislative proposal covered energy efficiency, generation from renewable energy sources, the design of the electricity market, security of electricity supply, and governance rules for the Energy Union. Relevant material along with the adopted directives and legislation is available at: https://ec.europa.eu/energy/en/topics/energy-strategy-and-energy-union/clean-energy-alleuropeans.
11
ACER/CEER ANNUAL REPORT ON THE RESULTS OF MONITORING THE INTERNAL ELECTRICITY MARKETS IN 2020
Market monitoring relevance in the context of significant shifts and change for European energy markets
11 The COVID-19 pandemic and the subsequent lockdown measures significantly impacted the energy sys-tems in 2020. For example, EU electricity demand dropped substantially in 2020, with an annual decrease of 4.1 % compared to 2019. The decrease is comparable to the 5 % drop in 2009, which resulted from the 2008 financial crisis.
12 Despite the disruption caused by the pandemic, electricity market integration projects did not stall. For example, continuous intraday volumes increased by nearly 32 % in 2020. The integration of EU intra-day markets is key to facilitating the integration of renewables, which requires close-to-real-time trading. This is illustrated by the fact that, consistently over time, some 70 % of the volumes traded in the intraday continuous market are negotiated two hours or less before delivery.
13 In the post-COVID era, achieving a sustainable and resilient recovery will be a priority. In this context, a cost-efficient integration of the internal energy market supported by an exhaustive market monitoring becomes more relevant than ever. Market monitoring activities allow to capture the status of energy mar-kets, to measure the impact of energy policies and to identify remaining barriers to EU markets integration.
14 The main findings of the electricity wholesale markets volume of this MMR edition are summarised below. They show progress in some areas despite the persistence of barriers to the further integration of the internal energy market.
15 With regard to the most recent developments, the COVID-19 pandemic accelerated some market trends observed in 2019. Firstly, the drop in demand related to the COVID-19 pandemic in the first half of 2020 exacerbated the decrease in electricity prices observed in almost all EU markets in the preceding year. The 2020 MMR reports the highest annual average day-ahead prices in the Polish (46.7 euros/MWh), Greek (45.0 euros/MWh), Italian (40.1 euros/MWh), and Romanian (39.5 euros/MWh) markets, whereas Finland (28.0 euros/MWh), Denmark (26.7 euros/MWh), Sweden (18.9 euros/MWh) and Norway (9.2 eu-ros/MWh) recorded the lowest annual average day-ahead prices.
16 Secondly, the number of occurrences of negative prices in 2020 was more than twice than in 2019, which was already nearly twice that of 2018. The occurrence of negative prices is not a reason for concern per se. In the absence of price manipulation or market abuse, practices that are out of the scope of this re-port, negative prices are not necessarily the result of an inefficient price formation. However, an increas-ing frequency of negative prices points to the need to reward efficiently the flexibility in the market, in-cluding demand side response, which would contribute to a more cost-efficient integration of renewable energy sources in the electricity system.
17 Thirdly, 2020 confirmed the changes in the electricity generation mix already observed in 2019. For the first time, more electricity was generated from renewable energy sources than from fossil fuels. In particu-lar, wind power alone generated more electricity than coal-fired power plants (15.1 % and 13.8 % of total generation output respectively). On-going changes in the generation mix help to reduce net emissions of greenhouse gases resulting from electricity generation. According to the European Green Deal, by 2030, total net emissions should be reduced by at least 55 % compared to 1990 4, as an intermediate step to reach climate neutrality by 2050. The EU is working on the revision of its climate, energy and transport-related legislation under the so-called ‘Fit for 55 package’ in order to align current laws with the 2030 and 2050 ambitions.
The fast electrification of the society in the context of the energy transition: chal-lenges and opportunities
18 Society’s transition into a more sustainable economy affects the electricity sector. For example, the num-ber of electric vehicles (EVs) has increased exponentially in the past years, by more than ten times since 2016. However, in the same time, the number of public charging stations only increased threefold.
4 Moreinformationonthe2030climate&energyframeworkisavailableathttps://ec.europa.eu/clima/policies/strategies/2030_en.
12
ACER/CEER ANNUAL REPORT ON THE RESULTS OF MONITORING THE INTERNAL ELECTRICITY MARKETS IN 2020
19 EVs are a new form of electricity consumption. They are part of distributed energy resources, along with heat pumps, small-scale storage and rooftop solar photovoltaic. Their increased popularity may prove challenging with increased peak consumption and total electricity demand. Conversely, the system may benefit from the flexibility offered by distributed energy resources. This benefit could materialise through demand response services such as vehicle-to-grid, including for system balancing purposes.
Market integration progressed in several areas in 2020
20 The efforts of Member States towards market integration in recent years continued to show positive results in 2020.
21 Forward markets’ liquidity remained stable in all major European markets (1 % overall increased), with sig-nificant differences across Member States. As analysed in previous editions of the MMR, these differences are explained by a combination of factors, among which the difference in bidding zone sizes continued to be a relevant one. Although cross-zonal hedging instruments such as transmission rights mitigate this issue, differences in the access of market participants to hedging opportunities depending on their geographical location, remained in 2020. Beyond national differences, the pandemic possibly incentivised market players to look for hedges beyond a time horizon when they could expect the situation to be back to normal.
22 End-consumers continued to benefit from the integration of short-term electricity markets. Figure ii shows the level of efficiency in the use of interconnectors across the different market timeframes, which mirrors the level of progress of the various respective market integration projects across Europe. An important remark underlying the values shown in Figure ii and subsequent paragraphs is that they refer to the share of capacity available for trade used in the economic direction5, as opposed to the share of transmission capacity actually offered to the market; the latter remaining well below the ’70 % capacity target’, as de-tailed in paragraphs 32 to 35.
Figure ii: Level of efficiency in the use of interconnectors in Europe in the different timeframes – 2020 (% use of available commercial capacity in the ‘right economic direction’)
Source: calculations based on national regulatory authorities, ENTSO-E and Vulcanus data.Note: For the purpose of this figure, efficient use is defined as the percentage of available net transfer capacity used in the ‘right economic direction’ in the presence of a significant (>1 euro/MWh) price differential. Intraday and balancing values (*) are based on a selection of EU borders6.
23 Thanks to market coupling, the integration of day-ahead markets, which are the main reference for trad-ing electricity close to real time, progressed significantly over the last decade. Consequently, the level of efficiency in the use of cross-zonal capacity (87 %) in day-ahead markets was the highest across all short-term timeframes in 2020.
24 Liquid and well-functioning intraday and balancing markets are key to give market participants the ability to balance their positions closer to real time and thus, in turn, facilitate renewable energy sources inte-gration. The level of integration of the intraday and balancing markets, measured in terms of efficiency in the use of interconnectors, is still not as high as in the day-ahead markets, as illustrated in Figure ii. From this perspective, continuous trading without pricing of the cross zonal capacity (as requested by the guideline on capacity allocation and congestion management7 or CACM) should be improved.
5 Exceptional cases, such as so-called “non intuitive flows”, are not analysed in this report.
6 TheEUbordersusedforthecalculationoftheIntradayefficiencywerethefollowing:BE–FR,CH–DE/LU,CH–FR,CH–IT,DE/LU–FR,DK1–DK2,DK1–NO2,ES–FR,ES–PT,FR–GB,FR–IT,GB–NL,NL–NO2,SE1–SE2,SE2–SE3.
7 CommissionRegulation(EU)2015/1222of24July2015establishingaguidelineoncapacityallocationandcongestionmanagement,OJL197,25.7.2015,p.24–72.https://eur-lex.europa.eu/legal-content/EN/TXT/?uri=CELEX%3A32015R1222.
Day ahead
Intraday
Balancing (icluding netting)
%0 10 20 30 1008060 90705040
Potential gainsMonthly percentage
87% 13%
63%
29%
37%
71%

13
ACER/CEER ANNUAL REPORT ON THE RESULTS OF MONITORING THE INTERNAL ELECTRICITY MARKETS IN 2020
25 However, 2020 saw further progress in the integration of the intraday timeframe. Efficient use of intra-day cross-zonal capacity increased by 4 % year-on-year in 2020, reaching 63 %. Intraday liquidity further increased since 2018, by 10 % in 2019 and 29 % in 2020. The increase relates to the extension of single intraday coupling to Bulgaria, Croatia, the Czech Republic, Hungary, Poland, Romania and Slovenia on 19 and 20 November 20198. The trend is consistent with the growing need for short-term adjustments due to the greater penetration of variable generation from renewables into the electricity system.
26 The extension of the single intraday coupling to Italy occurred on 21 September 2021 and Greece should join during the first quarter of 2022. These extensions, as well as the implementation of pan-European intraday auctions as envisaged in ACER’s decision 01/20199, are expected to further increase the level of efficient use of cross-zonal capacity in the intraday timeframe.
27 Well-functioning balancing markets are key to ensuring an efficient overall price formation. In 2020 the level of efficiency of the balancing timeframe increased by 6 % up to 29 %. This increase likely results from various initiatives consisting in the early implementation of provisions set in the recast Electricity Regulation10. Going forward, further increase is expected with the implementation of a large number of decisions approved by ACER in 2019 and 2020. These decisions set out rules for the integration of EU balancing markets.
28 The recast Electricity Regulation underlines that energy prices better reflect the value of scarcity closer to real time. Therefore, balancing capacity procurement should be performed on a short-term basis. This principle aims to maximise the participation of flexible resources in short-term energy markets with a view to improving liquidity and competition. Market participants would be incentivised to respond to immediate market needs while efficiently supporting the balancing of the system. The MMR shows that in 2020 the lead-time for procuring balancing capacity has greatly evolved since 2019. The percent-age of reserves of all types contracted on a day-ahead basis increased from 55 % in 2019 to 72 % in 2020.
29 Accomplishing market coupling in all timeframes across EU borders would render additional welfare ben-efits of more than 1.5 billion euros per year11. As highlighted above, the level of integration of balancing markets remains low compared to day-ahead and intraday markets. Therefore, a large share of future benefits should result from the efficient integration of balancing markets. Strong commitment and co-ordination among transmission system operators (TSOs) is needed in order to ensure an effective and successful implementation of the pan-EU balancing platforms, which are currently under development.
A number of significant concerns and implementation delays remained in 2020
30 A number of concerns and delays, jeopardising the shorter-term achievement of the aforementioned EU energy union’s objectives, remained in 2020.
31 The first concern refers to the implementation of the flow-based market coupling project in the Core region, which involves thirteen Member States of Central Europe. This implementation has been facing recurrent delays and is now planned for 28 February 202212. An important milestone was reached in June 2021, with the completion of an interim coupling solution to all borders of the Core region13. These delays are hindering the completion of day-ahead market coupling and more widely, the progress towards truly integrated electricity markets, to the detriment of end-consumers. The implementation of this project in line with ACER´s decision 02/201914 should remain a priority for the TSOs of the Core region.
8 More information on Single Intraday Coupling is available at: https://www.entsoe.eu/network_codes/cacm/implementation/sidc/.
9 ACER Decision No 01/2019 of 24 January 2019 establishing a single methodology for pricing intraday cross-zonal capacity, available at: https://www.acer.europa.eu/Official_documents/Acts_of_the_Agency/Individual%20decisions/ACER%20Decision%2001-2019%20on%20intraday%20cross-zonal%20capacity%20pricing%20methodology.pdf.
10 Namely,theFrequencyContainmentReserves(FCR)cooperationproject,theInternationalGridControlCooperation(IGCC)project,thePlatformfortheInternationalCoordinationofAutomatedFrequencyRestorationandStableSystemOperation(PICASSO),theplatformforexchanging balancing energy from manually activated Frequency Restoration Reserves (mFRRs), and the Trans European Replacement ReservesExchange(TERRE).
11 Based on calculations performed in previous editions of the MMR.
12 First amendment of the Day-Ahead Capacity Calculation Methodology of the Core Capacity Calculation Region, 10 May 2021. See https://assets.ilr.lu/energie/Documents/ILRLU-1685561960-886.pdf.
13 See http://www.nemo-committee.eu/sdac.
14 ACERDecisionNo02/2019of21February2019ontheCorecapacitycalculationregion(CCR)TSOs’proposalsfortheregionaldesignof the day-ahead and intraday common capacity calculation methodologies, available at: https://documents.acer.europa.eu/Official_documents/Acts_of_the_Agency/Individual%20decisions/ACER%20Decision%2002-2019%20on%20CORE%20CCM.pdf.

14
ACER/CEER ANNUAL REPORT ON THE RESULTS OF MONITORING THE INTERNAL ELECTRICITY MARKETS IN 2020
32 The second main area of concern refers to the insufficient amount of capacity available for cross-zonal trade, which led to establish a minimum level, the ’70 % capacity target’15, of cross-zonal capacity in the CEP. Significant improvements are necessary to meet the 70 % target, as further explained below.
33 The third area of improvement concerns security of supply. It is necessary to perform robust adequacy assessments and strive to improve short term market functioning to ensure improved price signals by better integrating system constraints in market models. To avoid market fragmentation, demand side response should be procured via existing channels when they are available, and in a market-based and cost-efficient manner, rather than via dedicated interruptibility schemes.
Available cross-zonal capacity and 70 % target
34 The CEP identified the lack of sufficient cross-zonal capacity as one of the main barriers to the electricity markets integration.
35 Overall, this year saw no significant improvement in the amount of cross-zonal capacity made available for trading in most Member States. ACER’s latest report on the margin available for cross-zonal trade16, in line with ACER’s Recommendation No 01/201917, observes that significant improvements are needed to meet the 70 % target set in the CEP and applying since 1 January 2020. The implementation of this target must remain a key priority for Member States in the coming years. The monitoring of this implementation depends critically on TSOs providing robust and extensive data. Finally, Member States must strive to harmonise temporary measures to deviate from the 70 % target across the EU.
36 Member States have a portfolio of instruments available to achieve the 70 % minimum target. This includes from short-term measures, such as introducing improvements to the capacity calculation pro-cesses, in combination with remedial actions by TSOs, to medium-term ones such as improving the de-lineation of bidding zones, and long-term ones such as network investments.
37 This edition of the MMR shows an increase of the costs of remedial actions in 2020 by 6 % in compari-son to 2019. This increase in costs of remedial actions was expected as more remedial actions are likely needed to meet the 70 % minimum target in the context of growing penetration of variable renewable energy sources. The cost of remedial actions is a helpful indicator; when the costs raise, this suggests that alternative, possibly more cost-efficient, solutions to address network congestions should be sought.
Barriers to market entry and efficient price formation: a first overview flags room for improvement
38 The recast ACER Regulation18 requires ACER to monitor barriers to efficient price formation and the entry of new and small market players. Efficient price formation is key to ensuring that market price signals drive cost-efficient investments. Ensuring the easy entry of new market players is crucial to attracting innova-tive and potentially more efficient capacity and energy providers. Together, efficient prices and the entry of new players, are important to lower the overall cost of the energy transition. Such a goal is also in line with key legislative pieces included in the ‘Fit for 55 package’19.
39 The MMR does not intend to identify an absolute benchmark to evaluate the performance of MSs in ensuring efficient price formation and easy entry for new participants. Instead, the proposed indicators aim to measure how MSs perform against a selection of features, including key features of the Electricity Target Model that contribute to efficient prices and easy market entry. This MMR monitors the presence of eleven barriers across the Member States, separately identified for each of the two aspects required
15 In particular, the CEP requires that at least 70% of the maximum admissible active power flow in critical network elements considering contingencies is made available for cross-zonal trade.
16 See: https://www.acer.europa.eu/events-and-engagement/news/acer-releases-its-second-70-target-report-minimum-margin-available-cross.
17 ACER Recommendation No 01/2019 of 8 August 2019 on the implementation of the minimum margin available for cross-zonal trade pursuanttoArticle16(8)ofRegulation(EU)2019/943,availableat:https://www.acer.europa.eu/Official_documents/Acts_of_the_Agency/Recommendations/ACER%20Recommendation%2001-2019.pdf.
18 Article 15 of the recast ACER Regulation, available at: https://eur-lex.europa.eu/legal-content/en/ALL/?uri=CELEX:32019R0942.
19 For example, the proposal for a revised renewable directive (available at https://ec.europa.eu/info/sites/default/files/amendment-renewable-energy-directive-2030-climate-target-with-annexes_en.pdf asks MSs to ensure that the national regulatory frameworks do not discriminate against participation in the electricity markets, including congestion management and the provision of flexibility and balancing services, of small or mobile systems such as domestic batteries and electric vehicles, both directly and through aggregation. The extent to which this is a barrier is part of the analysis made by ACER in the context of this and future editions of the MMR.

15
ACER/CEER ANNUAL REPORT ON THE RESULTS OF MONITORING THE INTERNAL ELECTRICITY MARKETS IN 2020
by the recast ACER Regulation, i.e. barriers to efficient price formation, and barriers affecting the entry or participation of new entrants and smaller actors in wholesale electricity markets. Some barriers are specific to one of these two aspects, while others relate to both. Table i and Table ii provide an overview of the barriers and the outcome of the analysis for each Member State.
Table i: Overview of barriers to efficient price formation per Member State – 2020
Barriers to efficient price formationPrice limits and restrictions on features of imbalance settlement AT BE BG CY CZ DE DK EE ES FI FR GR HR HU IE IT LT LU LV MT NL NO PL PT RO SE SI SK
Limited competitive pressure and/or liquidity in wholesale markets AT BE BG CY CZ DE DK EE ES FI FR GR HR HU IE IT LT LU LV MT NL NO PL PT RO SE SI SK
Insufficient cross-zonal capacity AT BE BG CY CZ DE DK EE ES FI FR GR HR HU IE IT LT LU LV MT NL NO PL PT RO SE SI SK
Bidding zones not reflecting structural congestions AT BE BG CY CZ DE DK EE ES FI FR GR HR HU IE IT LT LU LV MT NL NO PL PT RO SE SI SK
Restrictive requirements in prequalification and/or the design of products for balancing
AT BE BG CY CZ DE DK EE ES FI FR GR HR HU IE IT LT LU LV MT NL NO PL PT RO SE SI SK
End-user price interventions AT BE BG CY CZ DE DK EE ES FI FR GR HR HU IE IT LT LU LV MT NL NO PL PT RO SE SI SK
Limited incentive to contract dynamic retail prices AT BE BG CY CZ DE DK EE ES FI FR GR HR HU IE IT LT LU LV MT NL NO PL PT RO SE SI SK
Insufficient information provided by system operators AT BE BG CY CZ DE DK EE ES FI FR GR HR HU IE IT LT LU LV MT NL NO PL PT RO SE SI SK
High (0-0.2) Moderate (0.2-0.4) Light (0.4-0.6) Not restrictive (>0.6) NA NAP
Table ii: Overview of barriers to new entrants and small actors per Member State – 2020
Barriers to entry and participation for new entrants and small actorsRestrictive requirements in prequalification and/or the design of products for balancing
AT BE BG CY CZ DE DK EE ES FI FR GR HR HU IE IT LT LU LV MT NL NO PL PT RO SE SI SK
Lack of a proper legal framework to enable new entrants and small players
AT BE BG CY CZ DE DK EE ES FI FR GR HR HU IE IT LT LU LV MT NL NO PL PT RO SE SI SK
Restrictive requirements to participate in capacity mechanisms and interruptibility schemes
AT BE BG CY CZ DE DK EE ES FI FR GR HR HU IE IT LT LU LV MT NL NO PL PT RO SE SI SK
Limited competitive pressure in the retail market AT BE BG CY CZ DE DK EE ES FI FR GR HR HU IE IT LT LU LV MT NL NO PL PT RO SE SI SK
End-user price interventions AT BE BG CY CZ DE DK EE ES FI FR GR HR HU IE IT LT LU LV MT NL NO PL PT RO SE SI SK
Limited incentive to contract dynamic retail prices AT BE BG CY CZ DE DK EE ES FI FR GR HR HU IE IT LT LU LV MT NL NO PL PT RO SE SI SK
Insufficient information provided by system operators AT BE BG CY CZ DE DK EE ES FI FR GR HR HU IE IT LT LU LV MT NL NO PL PT RO SE SI SK
High (0-0.2) Moderate (0.2-0.4) Light (0.4-0.6) Not restrictive (>0.6) NA NAP
Source: ACER calculationsNote: NA (not available) refers to Member States where it was not possible to assess the barrier due to insufficient data availa-ble. NAP (not applicable) refers to Member States where the barrier does not apply, e.g. if no capacity market was operational, if there were no price interventions in the retail price settings, etc. No specific barrier to efficient price formation was analysed in Cyprus and Malta since they do not have wholesale electricity markets and their power systems are not interconnected with the EU mainland power systems.
40 Price limits and restrictions on features of imbalance settlement – Despite significant progress in the integra-tion of electricity markets in recent years, the free fluctuation of day-ahead and intraday prices remained an unattained objective in a few Member States in 2020. In particular, non-harmonised maximum and minimum bid limits remained in the Iberian (180 and 0 euros/MWh for DA and ID) and Italian (3000 euros/MWh only for ID, and 0 euros/MWh for DA and ID20) markets in 2020. In the 2018-2020 period, the minimum limit was reached
20 ARERA discussed the possibility of introducing negative prices in Italy (including not only DA and ID but also the balancing and ancillary services market) in their consultation document, available at: https://www.arera.it/it/docs/dc/15/605-15.jsp,whichdescribespossibledistortions especially due to incentivised RES and possible abuse of market power in downward redispatch.

16
ACER/CEER ANNUAL REPORT ON THE RESULTS OF MONITORING THE INTERNAL ELECTRICITY MARKETS IN 2020
1470, 78 and 48 times in the ID markets of Italy, Portugal and Spain, respectively and 648 times in the DA market of Italy. The maximum limit was reached twice in ID market of Portugal, and only once in the ID market of Italy. Non-technical price limits and a lack of harmonisation in technical price limits may represent a direct barrier to price formation. They might prevent market prices from reflecting the actual value of scarcity during times of system stress and high demand or when energy production is in abundance. Moreover, such limits diminish the accuracy of dispatch and investment signals embedded in the bidding zone model and, when they are only applied in some MSs, they prevent market participants from competing on a level playing field with European counterparties. With an increasing variable power generation, accurate price signals are more and more needed to encourage market participants to adapt their generation or consumption close-to-real-time and to promote investments in flexible units of all types, including demand response and energy storage.
41 Close-to-real time price formation would also benefit from speeding up the implementation of relevant features of the target model envisaged for imbalance settlement. Some of these design features include the length of the imbalance settlement period (ISP) and the number of positions and prices in the imbal-ance settlement rules. In 2020, most MS still had an ISP longer than 15 minutes and in many MSs their imbalance settlement rules were not fully aligned with the European target model.
42 Limited competitive pressure or liquidity in wholesale markets – In 2020, nineteen Member States showed insufficient liquidity or competition at wholesale level. This barrier was more severe in Belgium, the Czech Republic, France, Hungary, Latvia, Romania, Slovenia and Slovakia. Additionally, based on the information provided to ACER, at least France, Romania, Ireland and Italy used mechanisms allowing some domestic generators to offer production at regulated prices. This may have limited the competitive pres-sure and liquidity in their wholesale markets.
43 Insufficient cross-zonal capacity – The lack of sufficient cross-zonal capacity is one of the main barri-ers to the integration of electricity markets. Based on recent ACER’s reports on the 70 % target21, the vast majority of Member States22 still have much to do to get closer to the minimum legally binding 70 % target.
44 Bidding zones not reflecting structural congestions – The current delineation of bidding zones does not always reflect structural congestions in the EU, which leads to inefficient price signals. Among other indica-tors, the presence of loop flows and the amount of remedial action costs23 indicate where bidding zones and congestions are not aligned. When a relevant part of the interconnectors is left aside to accommodate loop flows originated from intra-zonal exchanges, there is less scope for cross-border competition; ad-ditionally, market prices do not reflect the value of the congestion, become less cost-reflective and do not deliver efficient investment signals. In the period 2018-2020, Germany was the MS contributing the most to burdening loop flows on interconnectors on average24, consuming around 5 % of the thermal capacity of all interconnectors in continental Europe, followed by France (2.1 %). The share of capacity consumed by German loop flows was the highest for the interconnectors of Denmark (14 % of its thermal capacity), the Netherlands (12 %), Belgium and Poland (both 10 %). Moreover, in the same period, the highest redispatch-ing costs per unit of demand were found in Germany and Austria (2.1 euros/MWh in both cases).
45 All in all, to address the impacts of the congestions and loop flows originated in Germany, a reconfigura-tion of bidding zones is an option that merits serious consideration. This is even more so in light of the recurrent delays in infrastructure projects combined with Europe’s ambitious decarbonisation plans that count on additional variable renewable generation coming online, possibly further aggravating current network congestion. As such, there would seem to be significant choices to be made up ahead – either to convincinglytackletherequiredinfrastructurebuild‐outacrossGermany(hithertoasignificantchallengeper various delaying factors) or to seriously consider a different bidding zone configuration, notwith-
21 The latest reports are available here: https://www.acer.europa.eu/electricity/market-monitoring-report/cross-zonal-capacity-70-target.
22 ACER was not able to analyse this barrier in the Baltics and Sweden since the TSOs did not provide the data to calculate the indicators onbothalternativecurrent(AC)anddirectcurrent(DC)borders,ontimefortheproductionofthisreport.
23 The cost of remedial actions per MWh load is obtained by dividing the sum of redispatching costs and costs related to other actions, excluding the costs incurred to solve voltage issues at the transmission level, by the total national demand.
24 The burdening loop flow created by a country in another network line is estimated as the ratio of the thermal capacity of this network line that is consumed by the loop flow in the direction of the congestion. Flow decomposition is applied to estimate the magnitude of the loop flow. For more information, please refer to ACER Decision No 30/2020 on the Core CCR TSO´s proposal for the methodology for cost sharing of redispatching and countertrading, available at: https://documents.acer.europa.eu/Official_documents/Acts_of_the_Agency/Individual%20decisions/ACER%20Decision%2030-2020%20on%20Core%20RDCT%20Cost%20Sharing.pdf. The calculation is based on tworepresentativewinterandsummerD2CF(Day-2CongestionForecast)networkmodelsforthe2018-2020years.Thesenetworkmodels cover the Continental Europe synchronous area only since the network models of the synchronous areas of the Nordics (with the exception of the continental part of Denmark), the Baltics, the UK, Ireland, Malta and Cyprus are not available.

17
ACER/CEER ANNUAL REPORT ON THE RESULTS OF MONITORING THE INTERNAL ELECTRICITY MARKETS IN 2020
standing the difficulties this may give rise to, or a combination of the two. Currently Germany is applying an action plan to address the structural congestions. In any case, finding a way to best signal locational costsandvaluefornewgenerationvis‐à‐visdemandcentresremainskey.
46 Restrictive requirements in prequalification or the design of products for balancing – Some key design elements of the balancing markets were found to restrict price formation in ten Member States in 2020. This applies in particular in Croatia and Slovakia. The same barrier was found to limit the participation of new entrants and small actors in eighteen Member States, and more severely in Bulgaria, Croatia, Italy25, Portugal, Romania and Sweden. This barrier was not found relevant only in Austria, Belgium, Germany, Estonia, Ireland and the Netherlands.
47 Lack of a proper legal framework to enable new entrants and small players – The transposition of the Elec-tricity Directive, which lays down the principles to create adequate frameworks for demand side flexibility and the active participation of all energy consumers, was still ongoing in most Member States at the end of 2020. Only a few Member States (Germany, Denmark, France and Hungary) had pioneered the definition of the main roles and responsibilities for aggregators, independent aggregators, active consumers and citizen energy communities, and the opening of their markets and products to these new entrants. Elsewhere, and more severely in Belgium, Cyprus, Greece, Croatia, Luxembourg, Malta, the Netherlands, Poland, Sweden and Slovakia, the absence of an appropriate framework constitutes a barrier to varying degrees.
48 Restrictive requirements to participate in capacity mechanisms and interruptibility schemes – In 2020, the capacity mechanisms of Greece and Finland were not open to all capacity resources. Even though, the remaining capacity mechanisms are potentially open to all or a wide range of technologies, some require-ments such as the minimum eligible capacity, restrictions to aggregation and the minimum bid size can de facto exclude demand side response, energy storage and variable renewable energy sources. In particu-lar, the minimum bid is as high as 10 MW in Finland and 5 MW in Sweden and Germany. Other restrictions applied to the aggregation of generating units in Finland or of renewable energy sources and storage units in Germany. Energy storage was not remunerated in any capacity market across the EU in 2020; the same applies to demand side response, and to generation from variable renewable energy sources for the capacity mechanisms of Germany and Greece, despite the German strategic reserve being open to all technologies and the Greek capacity mechanism being open to demand side response.
49 Limited competitive pressure in retail markets – In 2020, there was still significant room to improve com-petition in retail markets with a view to supporting wholesale price formation and the entry of new and small market players. This was due to a combination of factors, including high market concentration, low entry-exit activity, and low correlation between the energy component of retail prices and the wholesale prices. The indicators analysed reveal that this barrier was more relevant in Belgium, France, Greece, Hungary, Ireland, Lithuania, Luxembourg, Poland, Portugal and Slovakia.
50 End-user price interventions – While some price interventions aim to protect household or non-house-hold customers from significant increases in wholesale energy prices, end-user price interventions con-sisting on regulated prices compromise competition. This is particularly true for markets where retail end-user prices are set below costs. In addition, while MSs are required to protect vulnerable consumers, it is also important to favour wholesale prices reaching end-consumers (or their retailers) to drive behaviour and innovative models. A wide use of public intervention in end-user prices may prompt non-vulnerable household consumers to disengage from the switching process and consequently hinder competition in retail markets. In 2020, twelve Member States still had some form of price intervention in the price setting for either household or non-household consumers. In France, Hungary, Romania and Slovakia, the bar-rier was more restrictive since all had regulated prices for some non-households and more than 50 % of their households had some type of public intervention. In addition, in Romania and Slovakia none of these household consumers were qualified as vulnerable.
51 Limited incentive to contract dynamic retail prices – Consumers may find limited incentives to conclude dynamic price contracts in fourteen Member States for different reasons. These include a limited roll-out rate of smart meters, a low share of the energy component in their electricity bill and limited gains from adapt-ing their consumption in response to changes in wholesale prices. In nine Member States (Austria, Belgium, Germany, Croatia, Hungary, Lithuania, Poland, Romania and Slovakia), this barrier was more relevant in 2020.
25 Somepilotprojects toenable renewableenergysources (RES)anddemandside response (DSR) toprovidebalancingandancillaryservices are ongoing.

18
ACER/CEER ANNUAL REPORT ON THE RESULTS OF MONITORING THE INTERNAL ELECTRICITY MARKETS IN 2020
52 Insufficient information provided by system operators – A limited access to information on the actual conditions of the electricity system and the available transmission capacities hampers price formation and the participation of new entrants and small actors, especially when their business models rely on providing services related to balancing or to congestion management. In 2020, the TSOs of eight Member States still needed to make more efforts to increase the level of transparency when sharing information. These efforts are particularly important in the Baltics, Ireland and Sweden.
Security of supply: capacity mechanisms and interruptibility schemes
53 According to the recast Electricity Regulation, Member States shall primarily strive to ensure an appropri-ate market functioning through relevant reforms. If necessary, temporary and properly designed capacity mechanisms allowing for cross-border participation of resources could be applied. Member States must justify the application of a capacity mechanism based on identified resource adequacy concerns.
54 In 2020, ACER approved a series of methodologies setting the framework for ensuring the proper identifi-cation and quantification of resource adequacy concerns26. Robust adequacy assessments that consider all relevant factors, are key to ensuring that consumers are not overpaying for their system security. As an example, traditionally overlooked factors, such as the contribution of demand side response and storage to security of supply, are expected to be carefully considered in modern and cost-efficiency driven ad-equacy assessments. Moreover, a significant alignment between the European-wide resource adequacy assessment and the national ones is expected to be seen over time.
55 In the area of security of supply, the MMR shows that a variety of national capacity mechanisms remained in 2020 across Europe. Overall cost of capacity mechanisms across the EU (excluding Great Britain) re-mained similar to those in 2019, at 2.6 billion euros. These costs will increase further as more countries will use market-wide capacity mechanisms.
56 Interruptibility schemes normally refer to national programmes dedicated to demand-side response, or-ganised by TSOs for temporary load interruption or reduction. An interruptibility scheme typically pools large industrial consumers from energy-intensive industries with processes that can be suspended for a limited time. Participants are remunerated for their availability to be interrupted according to the contract specifications. Figure iii provides an overview of interruptibility schemes in Europe.
26 Information on the work and decisions of ACER in the context of security of supply can be found here: https://extranet.acer.europa.eu/en/Electricity/Pages/Security-of-supply.aspx.

19
ACER/CEER ANNUAL REPORT ON THE RESULTS OF MONITORING THE INTERNAL ELECTRICITY MARKETS IN 2020
Figure iii: Interruptibility schemes in Europe - 2020
Source: ACER based on information provided by the national regulatory authorities and, in case of France, publicly available information27. Note: The Irish schemes were phased out in 2016 and 2018. The Spanish and Greek schemes were phased out in July 2020 and September 2021, respectively. The Portuguese and German schemes expire in November 2021 and July 2022 respec-tively, with renewal under consideration in both cases. In Poland, the interruptibility scheme was terminated in November 2020 and replaced by a demand side response scheme as of April 2021
57 Interruptibility schemes provide services on different time scales: from a planned reduction of consump-tion during times of scarcity, to an automatic response to unexpected immediate needs of the network. This volume’s overview identified four interruptibility scheme services: adequacy, balancing, conges-tion management and contingency reserves28.
58 On 8 January 2021, the Continental Europe Synchronous Area was separated into two areas (the North-West and the South-East) due to cascaded trips of several transmission network elements29. The incident was handled in a better and more efficient manner than the split in November 2006, confirming the importance of improved TSOs coordination. Further, the disconnection of industrial loads as regu-lated by interruptibility schemes30 in France and Italy contributed to frequency stabilisation. As electricity systems face unprecedented changes, demand side response is increasingly important to achieve the desired security of supply levels at a low cost for end-consumers, if procured in a coordinated and com-petitive way.
27 The data was provided to ACER by all national regulatory authorities except for France. Regarding France, ACER’s information could only bebasedontheapplicablenationallegislation.Source:Arrêtédu22décembre2015prisenapplicationdel’articleL.321-19ducodedel’énergie, available here : https://www.legifrance.gouv.fr/loda/id/JORFTEXT000031733388/.
28 The categorisation of the capacitymechanisms (CMs) is based on the taxonomy in the EuropeanCommission’s (EC) staffworkingdocument accompanying the document Final Report of the Sector Inquiry on Capacity Mechanisms sector inquiry, available here https://eur-lex.europa.eu/legal-content/EN/TXT/PDF/?uri=CELEX:52016SC0385&from=EN.
29 See the final report on the separation of the Continental Europe power system on 8 January 2021 available here: https://extranet.acer.europa.eu/Media/Press%20releases/ACER%20PR%2002-21.pdf.
30 See the definition of interruptibility schemes in paragraph 54.
IS active No IS IS phased out

20
ACER/CEER ANNUAL REPORT ON THE RESULTS OF MONITORING THE INTERNAL ELECTRICITY MARKETS IN 2020
59 The overlap of interruptibility schemes with already existing procurement channels for the relevant ser-vices may lead to market fragmentation, with regard to the participation of demand side response. To ensure a level-playing field and maximise competition, the services related to interruptibility schemes should preferably be integrated within existing markets, in particular when these markets include cross-border participation. Dedicated interruptibility schemes should only be left to cases where no parallel procurement channels exist, or when there is a need to kick-start the development of new demand side response products or services.
21
ACER/CEER ANNUAL REPORT ON THE RESULTS OF MONITORING THE INTERNAL ELECTRICITY MARKETS IN 2020
Recommendations60 Electricity markets are facing unprecedented changes. As they adapt to meet global decarbonisation
targets, electricity markets must safeguard security of supply and ensure affordability in the increas-ingly challenging context of climate change. The market integration process is at a critical point, where the effective implementation of all the regional and EU-wide terms, conditions and methodologies ap-proved by national regulatory authorities (NRAs) or ACER over the last five years are expected to eventu-ally improve the functioning of European electricity markets and deliver the expected benefits.
61 ACER is strongly convinced that implementing the policy recommendations proposed in this Volume will help to address both existing and emerging challenges, with the ultimate goal of ensuring a well-functioning internal electricity market.
62 These recommendations are grouped into four distinct categories:
• recommendations to increase the limited amount of cross-zonal capacity made available for trading throughout the EU;
• recommendations to ensure the completion of the integration process across all electricity market timeframes;
• recommendations to minimise barriers to price formation and to entry and participation of new and small market players; and
• recommendations to address adequacy concerns in a coordinated and efficient manner.
63 ACER acknowledges that the recommendations in this report are largely identical to those expressed in last year’s report31. This logically reflects limited progress achieved in recent years, which is due to a combination of reasons, among which long implementation timelines, the technical complexity of certain topics, and possibly enforcement difficulties. In that regard, ACER welcomes the on-going initiative from national regulatory authorities to address this issue within the ad-hoc Group on Compliance and Enforce-ment established in 2021. ACER expects that this initiative will cover transparency requirements and the timely delivery of data to ACER.
64 The first group of recommendations is aimed at increasing the amount of cross-zonal capacity made available for trading. This issue is currently one of the most significant factors limiting the integration of electricity markets throughout the EU. In this respect, the following is recommended:
1. Urgently implement regional methodologies for coordination of re-dispatching and counter-trading (and related cost-sharing), as an absolute prerequisite to meet the 70 % minimum target;
2. As soon as possible, amend regional capacity calculation methodologies in order to take into ac-count the requirements of the CEP with particular emphasis on ensuring that the 70 % capacity target is met. Moreover, the amendments should consider the aspects for improvement identified in previous editions of ACER’s MMR, particularly with regard to the need to guarantee effective transparency, through publication of the relevant data, of the capacity calculation methodologies;
3. Perform an unbiased, sound, technical and neutral bidding zone review.
31 Recommendations 1 to 8, 16 and 17 are repeated. Recommendations 9 to 15, and 18 are new.

22
ACER/CEER ANNUAL REPORT ON THE RESULTS OF MONITORING THE INTERNAL ELECTRICITY MARKETS IN 2020
65 The second group of recommendations is aimed to ensure the effective completion of the integration progress across all market timeframes, from long-term to closer-to real time markets. In this respect, the following is recommended:
4. Despite recent progress32, it remains necessary to finalise urgently the implementation of sin-gle day-ahead and single intraday market coupling. In particular, urgently finalise the imple-mentation of flow-based market coupling in the Core region, involving thirteen Member States of continental Europe, which has faced recurrent delays, and has been hindering the whole market integration process;
5. Urgently finalise the implementation of the common grid model methodologies as required by the Regulations establishing the various network codes. Such methodologies are instrumental to achieve the necessary level of TSOs’ coordination, without which any progress on the aforemen-tioned recommendations is exceptionally difficult;
6. Effectively and timely implement the Regulation establishing an Electricity Balancing Guideline, as the integration of balancing markets is increasingly important to facilitate the integration of growing amounts of renewable energy sources in the network;
7. Implement pan-European intraday auctions for pricing cross-zonal capacity in line with the AC-ER’s decision 01/201933, with a view to ensuring a more efficient use and the pricing of cross-zonal capacity closer to real time;
8. Investigate improvements to the design of forward markets with a view to ensuring sufficient hedging opportunities for all market participants, irrespective of their geographical location.
66 The third group of recommendations reflects the outcome of the first study of barriers to price for-mation and entry and participation of new and small market players as required by the recast ACER Regulation:
9. Remove explicit wholesale price restrictions (caps or floors) where they still apply;
10. Review the requirements related to prequalification and aggregation, to ensure that a larger set of technologies, including new and small players can effectively participate to balancing mar-kets and capacity mechanisms;
11. Urgently finalise the transposition of the Electricity Directive to enable, among others, the entry of new and small players in all market timeframes and products;
12. In line with the Electricity Directive, seek ways to protect vulnerable consumers without inter-fering with free price formation and without discouraging the participation of demand in the markets;
13. Speed-up the roll-out of smart meters to enable increasing opportunities for demand to provide flexibility in a scenario of growing penetration of low-carbon technologies;
14. Seek ways to reduce the share of non-contestable charges in the electricity bill, as those charg-es limit the incentives for consumers to engage in demand side response, e.g. through dynamic retail contracts;
15. Ensure that TSOs increase their levels of transparency in information sharing to the fullest.
32 See https://www.nemo-committee.eu/sdac and https://www.nemo-committee.eu/sidc.
33 See footnote 9.
23
ACER/CEER ANNUAL REPORT ON THE RESULTS OF MONITORING THE INTERNAL ELECTRICITY MARKETS IN 2020
67 Additionally, the analysis of the barriers to price formation and the entry of new and small market players emphasises the importance of addressing the above-mentioned recommendations on the need to meet the 70 % target (see recommendation 2), the need to seek improvements to the delineation of bidding zones particularly in Germany (see recommendation 3), and hedging opportunities (see recommendation 8).
68 The fourth group of recommendations aims to address adequacy concerns in an efficient manner. In this respect, ACER recommends the following measures, in line with the CEP:
16. Establish an appropriate reliability standard and perform sound adequacy assessments at the EU and national levels in line with the methodologies for the European resource adequacy assessment and the short-term and seasonal adequacy assessments, as approved by ACER34. Improvements in the data used as input for the adequacy assessments should also be sought, including data related to demand side response and energy storage potential, and data related to future climate;
17. Only adopt (or maintain) capacity mechanisms where resource adequacy issues are forecast pur-suant to national or European resource adequacy assessments. Moreover, take account of the monitoring of barriers to price formation initiated by ACER to implement solutions to improve mar-ket price signals;
18. Preferably integrate the services related to interruptibility schemes within existing procurement channels. Dedicated interruptibility schemes should only be left to cases where no parallel pro-curement channels exist, or when there is a need to kick-start the development of new products or services for demand side response.
69 As a final recommendation, there is a need to renew efforts to further improve the quality and the timeli-ness of the data provided to ACER. These efforts are instrumental for ACER to monitor essential aspects of market integration such as monitoring the 70 % capacity target prescribed by the CEP.
34 See https://www.acer.europa.eu/documents/official-documents/individual-decisions.

24
ACER/CEER ANNUAL REPORT ON THE RESULTS OF MONITORING THE INTERNAL ELECTRICITY MARKETS IN 2020
1 Introduction70 The Market Monitoring Report (MMR), which is in its tenth edition, consists of three volumes - the Elec-
tricity Wholesale Market Volume, the Gas Wholesale Market Volume, and the Electricity and Gas Retail Markets Volume, the latter also covering aspects related to consumer protection. In addition to Member States (MSs), the MMR includes monitoring results and analyses of the Contracting Parties of the Energy Community for selected topics.
71 Through the MMR, the European Union Agency for the Cooperation of Energy Regulators (ACER) reports on the state of the European Union (EU) internal energy market, highlights any identified barriers to its ef-ficient functioning and makes recommendations on how to overcome them. While all three MMR Volumes share this objective, the unique challenges faced in the internal electricity market, the internal gas market and the internal energy retail market guide ACER’s market monitoring priorities for each of the volumes.
72 The goal of the Electricity Wholesale Market Volume is to present the results of the monitoring of the performance of the internal market for electricity (IEM) in the European Union35 against the existing legal framework. The performance largely depends on how efficiently the European electricity network is used and on how the wholesale markets perform in all timeframes. The integration of electricity wholesale markets via an optimal amount of interconnector capacity and the efficient use of this capacity allow competition that benefits all consumers and contributes to ensuring long-term security of supply (SoS) at a lower cost.
73 The Regulation establishing a Guideline on Capacity Allocation and Congestion Management (CACM)36 provides clear objectives to deliver an integrated IEM in the following areas: (i) full coordination and opti-misation of cross-zonal capacity calculations performed by transmission system operators (TSOs) within regions; (ii) definition of appropriate bidding zones, including regular monitoring and reviewing of the efficiency of the bidding zone configuration; (iii) use of flow-based (FB) capacity calculation methods in highly meshed networks and (iv) efficient allocation of cross-zonal capacity in the day-ahead (DA) and intraday (ID) timeframes. These processes are intended to optimise the utilisation of the existing infra-structure and to provide more possibilities to exchange energy, enabling the cheapest supply to meet demand with the greatest willingness to pay in Europe, given the capacity of the network.
74 The Regulations establishing Guidelines on Forward Capacity Allocation (FCA)37 and on Electricity Balanc-ing (EB)38 also play a crucial role in the further integration of the IEM. The former establishes a framework for calculating and efficiently allocating interconnection capacity and for cross-zonal trading in forward markets, while the latter sets rules on the operation of balancing markets with the aim to increase the op-portunities for cross-zonal trading and efficiency close to real time.
75 The implementation of the provisions included in the above-mentioned regulations is currently ongoing. Firstly, long-term harmonised allocation rules have been in place since January 2018, while the EU single allocation platform was launched in October 201839. Secondly, there has been significant progress to-wards the full implementation of the Single Day-Ahead Market Coupling (SDAC). Since the publication of
35 Inthisreport,EU-27referstothe27MSsafterBrexit,i.e.aftertheUKlefttheEUon31January2020.AsaconsequenceofBrexit,ACERdid not have access to all UK-related data. Therefore, while UK remained an EU member in 2020, it is excluded from the scope of this MMR for the country-specific figures. EU-wide figures still include 28 MSs, unless specified otherwise. Several aspects of the report cover Norwegian and Swiss markets. For simplicity, the scope of the analysis is referred to as ‘the EU’ or ‘Europe’. Norway enforces most of the EU energy legislation, including legislation on the internal energy market, and is included in the data reported in several sections of this report. Switzerland has been included in some parts of the wholesale sections on the basis of a voluntary commitment of the NRA. Consequently, the terms ‘countries’ and ‘Member States (MSs)’ are used interchangeably throughout this report, depending on whether the particular section/graph also covers Norway or Switzerland or not. Several maps included in this report show Kosovo*. In this context the following statement applies: “This designation is without prejudice to positions on status, and is in line with UNSCR 1244 and the ICJ Advisory Opinion on the Kosovo declaration of independence”.
36 CommissionRegulation(EU)2015/1222of24July2015,availableat:http://eur-lex.europa.eu/legal-content/EN/TXT/PDF/?uri=CELEX:32015R1222&from=EN.
37 CommissionRegulation(EU)2016/1719of26September2016,availableat:http://eur-lex.europa.eu/legal-content/EN/TXT/PDF/?uri=CELEX:32016R1719&from=EN.
38 CommissionRegulation(EU)2017/2195of23November2017,availableat:https://eur-lex.europa.eu/legal-content/EN/TXT/PDF/?uri=CELEX:32017R2195&from=EN.
39 For more information, please see: https://www.acer.europa.eu/Official_documents/Acts_of_the_Agency/Publication/FCA_CACM_Implementation_Monitoring_Report_2019.pdf.

25
ACER/CEER ANNUAL REPORT ON THE RESULTS OF MONITORING THE INTERNAL ELECTRICITY MARKETS IN 2020
the previous MMR, MSs with markets that were not coupled at the time have been integrated40. The inte-gration of coexisting market coupling projects in Europe has progressed since the last report41. However, the implementation of Flow-Based Market Coupling (FBMC) for the whole Core region is still pending. Thirdly, the second phase of Single Intraday Coupling (SIDC), also called the ‘second wave’, was launched in November 2019 with the integration of seven countries into the existing intraday coupling region42. The ‘third wave’ was initially foreseen by the end of 2020 but is now expected in in the third quarter of 202143. In 2020, the exchange of balancing energy and reserves progressed, steered by various initiatives. Other relevant initiatives remain to be implemented44.
76 The adoption of the Clean Energy for All Europeans45 Package (Clean Energy Package, CEP) legislation in June 2019 initiated a period of significant changes fostering the creation of smarter and more efficient electricity markets46. The CEP defines an enhanced framework for a well-functioning, integrated market with non-discriminatory participation of all available sources, providing appropriate and affordable SoS while enabling innovation and decarbonisation in line with the EU energy and climate objectives.
77 Moreover, under the new framework, ACER has an enhanced role in the development, monitoring and surveillance of energy markets, as well as in the area of SoS. ACER’s competences are adapted to new challenges faced by the electricity sector, for example in the context of increased regional cooperation. The implementation of the provisions included in the above-mentioned regulations remains a key priority for ACER. ACER is well aware that the CEP has become the reference framework for the functioning of the European electricity markets, as explained above.
78 Consequently, ACER has been working towards enlarging the scope of its MMR in order to adapt to the new requirements of the CEP. Since the 2018 edition of the MMR, ACER has monitored the margin avail-able for cross-zonal trade (MACZT). Since 1 January 2020, TSOs have been legally required to meet a minimum cross-zonal capacity target set in the recast Electricity Regulation47,48. In this context, ACER regularly produces a dedicated report on the MACZT49. The separate report aims to identify possible improvements to meet the minimum cross-zonal capacity target set in the CEP. ACER will regularly report on the progress made to reach this binding target in the coming years.
79 This year’s volume includes a number of novelties. Firstly, to illustrate on-going challenges in the electric-ity sector, Section 2.2 focuses on new trends related to the clean energy transition. As in the 2017 MMR, pursuant to CACM Regulation Art 34(1), Section 4.4 reports on the efficiency of bidding zones.
40 Greece and Bulgaria coupled with SDAC in December 2020 and May 2021, respectively.
41 In2020, therewere twoco-existingmarketcoupling regions: the4MMarketCoupling (4MMC) regioncovering theCzechRepublic,Slovakia,HungaryandRomania,andtheMulti-RegionalCoupling(MRC)regioncovering,thefollowing21countries:Austria,Belgium,Croatia, Germany, Denmark, Estonia, Finland, France, Ireland, Italy, Lithuania, Latvia, Luxembourg, the Netherlands, Norway, Poland, Portugal, Spain, Slovenia, Sweden and the United Kingdom. The borders between the 4MMC and the MRC regions are coupled as of June 2021.
42 For more information on the countries integrated in the first and second waves please see paragraph 233 and footnote 182 in Section 5.3.
43 The extension of the Single Intraday Coupling to Italy occurred on 21 September 2021; Greece should join during the first quarter of 2022. For more information on the countries expected to be integrated in the third wave please see footnote 183 in Section 5.3.
44 See Subsection 4.5.4.
45 The Commission’s Clean Energy for All Europeans legislative proposal covered energy efficiency, RES generation, the design of the electricity market, security of electricity supply and governance rules for the Energy Union. Relevant material along with the adopted directives and legislation are available at: https://ec.europa.eu/energy/en/topics/energy-strategy-and-energy-union/clean-energy-all-europeans.
46 Main legislative documents on the electricity markets, available at: https://eur-lex.europa.eu/legal-content/EN/TXT/?uri=OJ:L:2019:158:TOC.
47 Regulation(EU)2019/943oftheEuropeanParliamentandoftheCouncilof5June2019ontheinternalmarketforelectricity(recast),available at: https://eur-lex.europa.eu/legal-content/EN/TXT/PDF/?uri=CELEX:32019R0943&from=EN.
48 The Energy Regulation requires a minimum level of capacity to be made available for cross-zonal trade. In particular, at least 70% of the maximum admissible active power flow (Fmax) of critical network elements considering contingencies (CNECs) shall be made available for cross-zonal trade.
49 See https://www.acer.europa.eu/events-and-engagement/news/acer-releases-its-second-70-target-report-minimum-margin-available-cross.

26
ACER/CEER ANNUAL REPORT ON THE RESULTS OF MONITORING THE INTERNAL ELECTRICITY MARKETS IN 2020
80 Secondly, this year’s report includes new methodologies to fulfil additional monitoring duties envisaged for ACER in the CEP50. Chapter 6 on capacity mechanisms and resource adequacy deepens the analysis included in previous MMRs, aiming to monitor ‘state interventions preventing prices from reflecting actual scarcity’. This work builds on ACER’s work on SoS51. Chapter 7 provides a preliminary analysis of ‘regula-tory barriers for new market entrants and smaller actors’. This analysis is the result of a study led by ACER in 2020 to define appropriate indicators52.
81 Finally, Part III marks the beginning of ACER’s collaboration with the Energy Community Regulatory Board (ECRB)53 on the monitoring of electricity wholesale markets.
82 This year’s electricity wholesale markets volume is divided in three parts54. Part I outlines electricity mar-ket trends in 2020. Part II focuses on development in the internal energy market. Part III provides an out-look of the situation in the Energy Community.
83 Within Part I, Chapter 2 presents the key developments in electricity wholesale markets across Europe in 2020. Chapter 3 assesses the evolution of electricity prices.
84 Within Part II, Chapter 4 assesses the level of cross-zonal capacity made available for trade. More specifi-cally, Chapter 4 details the evolution of this capacity within the central-west european (CWE) region. It further provides an update of the volumes and costs of remedial actions used by TSOs to alleviate net-work congestions. Finally, it assesses the efficient use of available cross-zonal capacity across the DA, ID and balancing timeframes. Chapter 5 presents an analysis of the evolution of market liquidity across different market timeframes55. Chapter 6 monitors the situation of the capacity mechanisms (CMs) in the EU and their consistency with the perceived adequacy concerns. Chapter 7 focuses on barriers to market entry and price formation.
85 Finally, Part III is dedicated to the Energy Community. It provides an overview of progress made in the Energy Community regarding the implementation of energy market rules and the associated benefits.
50 Inparticular,theseadditionalmonitoringtasksareenvisagedinArticle15oftheRegulation(EU)2019/942oftheEuropeanParliamentand of the Council of 5 June 2019 establishing a European Union Agency for the Cooperation of Energy Regulators (recast), available at: https://eur-lex.europa.eu/legal-content/EN/TXT/PDF/?uri=CELEX:32019R0942&from=EN.
51 See: https://www.acer.europa.eu/electricity/security-of-supply.
52 See: https://www.acer.europa.eu/gas/market-monitoring.
53 See: https://www.energy-community.org/aboutus/institutions/ECRB.html.
54 To facilitate the reading of the document, the most relevant monitoring methodologies used across this Volume have been compiled into a set of ‘methodological papers’, which are cross-referenced in the relevant chapters where those methodologies are applied. These are available at: https://www.acer.europa.eu/en/Electricity/Market%20monitoring/Pages/Methodologies.aspx.
55 Similarly, the Gas Wholesale MMR provides an assessment of the liquidity of EU gas markets across different timeframes, putting the emphasisinturninmeasuringmetricsthatarecoretotheGasTargetModel(GTM)construction.Whilebothsetsofmetricsarenotfullycoincident for electricity and gas, each set is proposed to better measure the most crucial aspects of market design.

27
ACER/CEER ANNUAL REPORT ON THE RESULTS OF MONITORING THE INTERNAL ELECTRICITY MARKETS IN 2020
Part I: Electricity Market trends in 2020
2 Overview of market developments86 Section 2.1 describes electricity demand and supply in 2020. Section 2.2 reports on other relevant market
trends associated with the energy transition in Europe in 2020.
2.1 Electricity supply and demand
87 This section reports on electricity demand and supply in 2020, and also includes year-on-year changes and multi-year trends.
88 EU electricity demand dropped substantially in 2020, with an annual decrease of 4.3 %56 compared to 2019. The mild winter contributed to a reduction in demand in January and February. The subsequent COVID-19 containement measures pushed the drop further. The decrease is comparable to the 5 % drop in 2009, which resulted from the 2008 financial crisis. Figure 1 shows the year-on-year changes in EU electricity demand. Demand started decreasing in 2019 with a mild winter and further decreased in 2020.
Figure 1: Year-on-year changes in electricity demand in the EU-2757 + Norway, Switzerland, and the UK – 2016–2020 (%)
Source: ACER Calculations based on Eurostat data, completed with data by the European Network of Transmission System Operators for Electricity (ENTSO-E) – Transparency platform.
89 On the supply side, Figure 2 shows the evolution of renewable energy sources (RES) and fossil fuel gen-eration over the last five years. Figure 3 shows the year-on-year changes for 2020 for all main generation technologies. Significant changes have taken place in the EU generation mix, largely driven by lower de-mand in 2020. Firstly, electricity generation from fossil fuels decreased by 11 % relative to 2019. Secondly, gas generation technologies produced more electricity than coal-fired power plants. This phenomenon was first observed in 2019. Thirdly, for the first time RES generated more electricity than fossil fuels. Finally, wind power generated more electricity than coal-fired power plants (15.1 % vs 11.8 % of total gen-eration respectively).
56 By default, demand data are based on Eurostat data (available for final consumption). For the years when data was not available from Eurostat,butonlyENTSO-E transparencyplatform, twoapproacheswereapplied.First, forcountrieswherebothEurostatdataandENTSO-ETransparencydatawereavailableforthetwoprecedingyears,thenENTSO-Edatawasusedafterapplyingacorrectionfactorpercountry.Thecorrectionfactor,usedtoensuretimeseriesconsistency,wastheratiobetweenENTSO-EaggregatedloadvaluesandEurostatdemanddata,forthetworeferenceyears.Second,ifnodatawasavailableforthetwoprecedingyears,thenENTSO-Edatawasused without correction factor.
57 EU-27meansEU-28minustheUK.Seefootnote 35 for a detailed explanation.
%
2
-2
0
-4
1
-3
-1
-52016 2017 2018 2019 2020

28
ACER/CEER ANNUAL REPORT ON THE RESULTS OF MONITORING THE INTERNAL ELECTRICITY MARKETS IN 2020
Figure 2: Evolution of generation from RES, per type of RES technology, compared to generation from fossil fuels in the EU-27 + Norway, Switzerland, and the UK – 2016–2020 (TWh)
Source: ENTSO-E Transparency platform.
Figure 3: Year-on-year percentage change for the main generation technologies in EU-27 + Norway, Swit-zerland, and the UK – 2020 (%)
Source: ACER calculations based on ENTSO-E data.
90 The changes in the generation mix described in Figure 2 and Figure 3 do not simply result from a drop in demand. Section 2.2.1 will detail that 2020 saw the confirmation of other trends that may have had influenced the changes. Such trends include increased RES capacity, and the increasing prices of CO2 emissions that caused decreased profitability and closures of coal-fired power plants.
2.2 Market trends related to the energy transition
91 This section highlights market trends related to the energy transition, including:
• the installed capacity of renewable energy sources compared to fossil fuels,
• the intensity of greenhouse gas emissions from electricity generation,
• the prices of the emission allowances and their impact on generation profitability, and
• the number of electric vehicles and charging stations.
TWh
1,500
1,000
500
1,250
750
250
02016 2017 2018 2019 2020
Other RES RES Fossil fuelsSolarWindHydroBiomass
SolarHydroWind
BiomassGas
NuclearCoal
-25% -20% -15% -10 -5% 0% 25%20%15%10%5%

29
ACER/CEER ANNUAL REPORT ON THE RESULTS OF MONITORING THE INTERNAL ELECTRICITY MARKETS IN 2020
2.2.1 Relative evolution of conventional and renewable generation capacity and profitability
92 Figure 4 shows the evolution of installed capacity, displaying renewable energy sources, and conventional technologies. Installed capacity of RES has been growing steadily in recent years. It reached 475 GW in 2020 from 360 GW in 2016, or an overall increase of 32 % in four years. Wind and solar installations con-tributed most to the rise, representing 65 % of the mix in 2020. Conversely, installed capacity of coal and nuclear power plants has been falling since 2018. Installed capacity of gas-fired power plants increased until 2019. It remained stable in 2020, with 216 GW, representing 46 % of the installed capacity of fossil fuel power plants.
Figure 4: Evolution of installed capacity for the main types of renewable (left) and conventional (right) gen-eration technologies, in the EU-27 + Norway, Switzerland, and the UK – 2016–2020 (GW)
Source: ENTSO-E Transparency Platform.
93 Figure 5 shows the evolution of yearly capacity factors58 of coal and gas-fired power plants in the period 2016-2020. The utilisation of coal-fired power plants has been decreasing since 2018. Conversely, the use of gas-fired power plants has remained stable over the period.
Figure 5: Capacity factors of EU-27 coal and gas-fired power plants, 2016-2020 (%)
Source: ACER calculations based on ENTSO-E data.
58 Ratio between actual and theoretically possible generation.
GWGW
500
400
300
200
100
0
500
400
300
200
100
02016 2017 2018 2019 2020 2016 2017 2018 2019 2020
Other renewableHydroSolar
Wind offshoreWind onshore
GasCoalNuclear
%
50
40
20
30
10
02016 2017 2018 2019 2020
Gas Coal

30
ACER/CEER ANNUAL REPORT ON THE RESULTS OF MONITORING THE INTERNAL ELECTRICITY MARKETS IN 2020
94 Figure 6 shows the evolution of the price of EU emission allowances (EUAs)59. In addition, it displays the profitability60 of generating electricity with gas (clean spark spread) or coal (clean dark spread) in Germany.
95 Since 2018, the price of emitting CO2 has risen substantially. In 2020, the EUA price first decreased during the pandemic-related lockdowns in spring, but later rapidly recovered. Through the year, it averaged 25 euros per tonne of emitted carbon dioxide. The rise in EUA prices since 2018 coincides with the declined utilisation of coal-fired power plants described above and seen in Figure 5.
Figure 6: Evolution of the EUA price (euros/tonne CO2), and German month-ahead clean spark and clean dark spreads (euros/MWh) – 2011–2020
Source: PLATTS.
96 When EUA prices increase, they reach a level called the ‘fuel switching range’. Above this range, there is an incentive to favour less carbon-intensive gas-fired power plants over coal plants61. Since the beginning of 2019, the profitability of producing electricity with coal has remained below zero. It has been consistently lower than the profitability of producing electricity with gas.
2.2.2 Emission intensity of electricity generation
97 As part of the European Green Deal, the European Commission (EC) proposed in September 2020 a target to reduce the net emissions of greenhouse gases. By 2030, the net emissions should be at least 55 % lower than in 199062. Electricity generation currently contributes substantially to the total emissions. On-going changes in the generation mix help to reduce this share.
98 The total emission intensity of electricity generation decreases as less carbon-intensive generation tech-nologies displace those with a higher carbon footprint. Figure 7 shows the average emission intensity63 of electricity generation in the EU. It demonstrates the reduction in emission intensity already achieved in the last three decades. The figure also shows emission intensity reductions needed by 2030 for the EU electricity supply to be in line with the EC’s climate goals64. By the end of the decade, the average emis-sion intensity must be approximately three times lower than today.
59 The EUA gives the holder the right to emit one tonne of CO2 (or the equivalent amount of nitrous oxide or perfluorocarbons) in industrial or energy operations. More information on EUAs and the EU Emissions Trading System is available at https://ec.europa.eu/clima/policies/ets_en.
60 Spreads indicate the theoretical gross profitability of power plants, taking into account the price of the primary energy carrier and the generation efficiency. Clean spreads (theoretical net profitability) additionally consider the costs of emissions.
61 IPCC working group 3, annex iii: emissions of selected electricity supply technologies. Median lifecycle emissions:Gas – Combined Cycle: 490 gCO2eq/kWh;Coal–PC:820gCO2eq/kWh (see footnote 59 for explanation of the unit).
62 Moreinformationonthe2030climate&energyframeworkisavailableathttps://ec.europa.eu/clima/policies/strategies/2030_en.
63 Emission intensity indicates the amount of greenhouse gases emitted (grams of CO2 equivalent) per unit of electricity produced (kWh).
64 The 2030 values represent indicative intensity levels that would allow the EU to achieve a net 55 % reduction in greenhouse gases by 2030, compared with 1990. They are consistent with scenario ranges in the staff working document accompanying the Commission communication‘SteppingupEurope’s2030climateambition-Investinginaclimate-neutralfutureforthebenefitofourpeople’(COM562 final). More information by EEA available at https://www.eea.europa.eu/data-and-maps/daviz/co2-emission-intensity-6#tab-googlechartid_googlechartid_googlechartid_googlechartid_chart_11111.
Euro
353025201510
50
-5-10-15-20-25-30-35
201620152014201320122011 2017 2018 2019 2020 2021Clean spark spread (euro/MWh) Clean dark spark spread (euro/MWh) EUA price (euro/tCO2e)
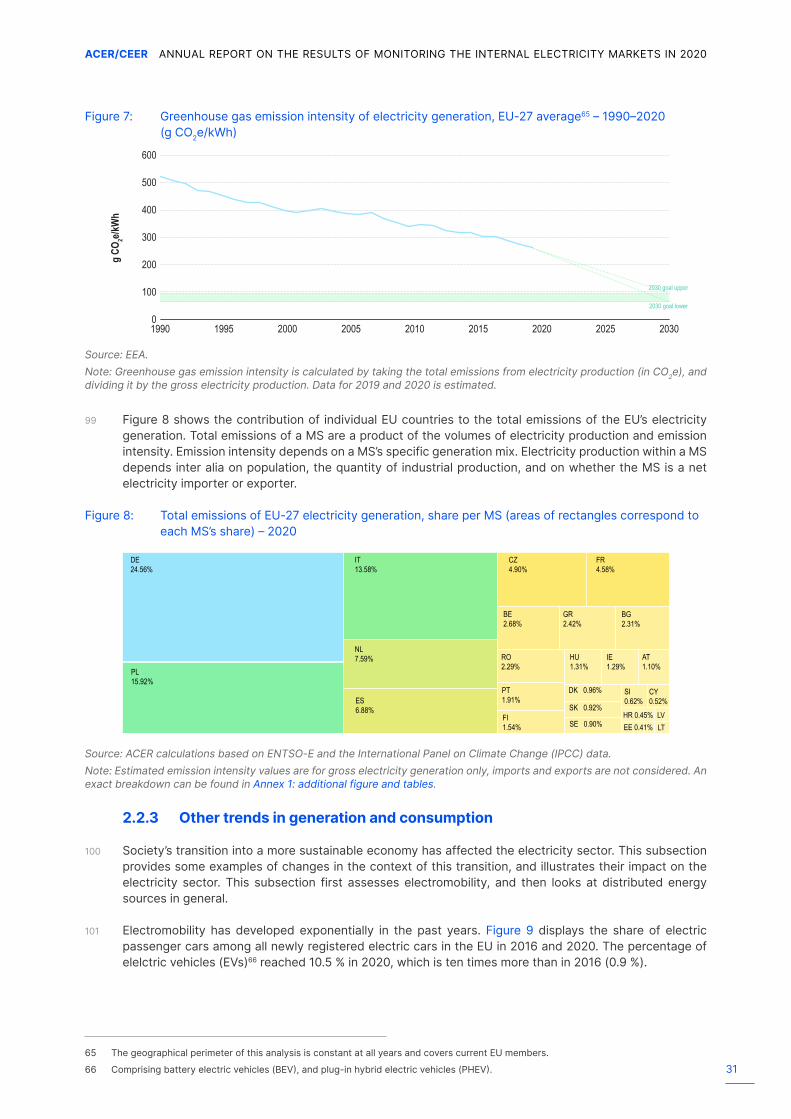
31
ACER/CEER ANNUAL REPORT ON THE RESULTS OF MONITORING THE INTERNAL ELECTRICITY MARKETS IN 2020
Figure 7: Greenhouse gas emission intensity of electricity generation, EU-27 average65 – 1990–2020 (g CO2e/kWh)
Source: EEA.Note: Greenhouse gas emission intensity is calculated by taking the total emissions from electricity production (in CO2e), and dividing it by the gross electricity production. Data for 2019 and 2020 is estimated.
99 Figure 8 shows the contribution of individual EU countries to the total emissions of the EU’s electricity generation. Total emissions of a MS are a product of the volumes of electricity production and emission intensity. Emission intensity depends on a MS’s specific generation mix. Electricity production within a MS depends inter alia on population, the quantity of industrial production, and on whether the MS is a net electricity importer or exporter.
Figure 8: Total emissions of EU-27 electricity generation, share per MS (areas of rectangles correspond to each MS’s share) – 2020
Source: ACER calculations based on ENTSO-E and the International Panel on Climate Change (IPCC) data.Note: Estimated emission intensity values are for gross electricity generation only, imports and exports are not considered. An exact breakdown can be found in Annex 1: additional figure and tables.
2.2.3 Other trends in generation and consumption
100 Society’s transition into a more sustainable economy has affected the electricity sector. This subsection provides some examples of changes in the context of this transition, and illustrates their impact on the electricity sector. This subsection first assesses electromobility, and then looks at distributed energy sources in general.
101 Electromobility has developed exponentially in the past years. Figure 9 displays the share of electric passenger cars among all newly registered electric cars in the EU in 2016 and 2020. The percentage of elelctric vehicles (EVs)66 reached 10.5 % in 2020, which is ten times more than in 2016 (0.9 %).
65 The geographical perimeter of this analysis is constant at all years and covers current EU members.
66 Comprisingbatteryelectricvehicles(BEV),andplug-inhybridelectricvehicles(PHEV).
g CO
2e/kW
h
600
200
400
500
100
300
02005
2030 goal upper
2030 goal lower
1990 20001995 2010 2015 2020 2025 2030
DE24.56%
PL15.92%
IT13.58%
NL7.59%
ES6.88%
CZ4.90%
FR4.58%
BE2.68%
GR2.42%
BG2.31%
RO2.29%
PT1.91%
FI1.54%
HU1.31%
IE1.29%
AT1.10%
DK 0.96%
SK 0.92%
SE 0.90%
SI0.62%
CY0.52%
HR 0.45%EE 0.41%
LVLT
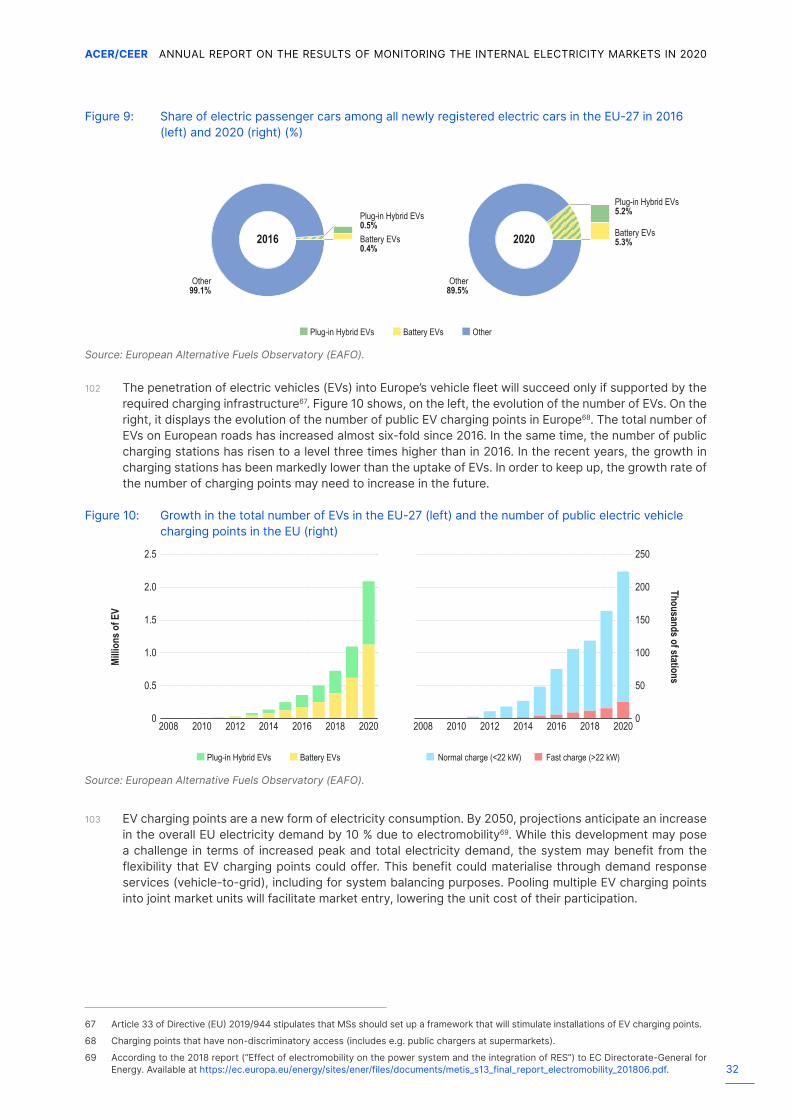
32
ACER/CEER ANNUAL REPORT ON THE RESULTS OF MONITORING THE INTERNAL ELECTRICITY MARKETS IN 2020
Figure 9: Share of electric passenger cars among all newly registered electric cars in the EU-27 in 2016 (left) and 2020 (right) (%)
Source: European Alternative Fuels Observatory (EAFO).
102 The penetration of electric vehicles (EVs) into Europe’s vehicle fleet will succeed only if supported by the required charging infrastructure67. Figure 10 shows, on the left, the evolution of the number of EVs. On the right, it displays the evolution of the number of public EV charging points in Europe68. The total number of EVs on European roads has increased almost six-fold since 2016. In the same time, the number of public charging stations has risen to a level three times higher than in 2016. In the recent years, the growth in charging stations has been markedly lower than the uptake of EVs. In order to keep up, the growth rate of the number of charging points may need to increase in the future.
Figure 10: Growth in the total number of EVs in the EU-27 (left) and the number of public electric vehicle charging points in the EU (right)
Source: European Alternative Fuels Observatory (EAFO).
103 EV charging points are a new form of electricity consumption. By 2050, projections anticipate an increase in the overall EU electricity demand by 10 % due to electromobility69. While this development may pose a challenge in terms of increased peak and total electricity demand, the system may benefit from the flexibility that EV charging points could offer. This benefit could materialise through demand response services (vehicle-to-grid), including for system balancing purposes. Pooling multiple EV charging points into joint market units will facilitate market entry, lowering the unit cost of their participation.
67 Article33ofDirective(EU)2019/944stipulatesthatMSsshouldsetupaframeworkthatwillstimulateinstallationsofEVchargingpoints.
68 Charging points that have non-discriminatory access (includes e.g. public chargers at supermarkets).
69 According to the 2018 report (“Effect of electromobility on the power system and the integration of RES”) to EC Directorate-General for Energy. Available at https://ec.europa.eu/energy/sites/ener/files/documents/metis_s13_final_report_electromobility_201806.pdf.
Other99.1%
Other89.5%
Plug-in Hybrid EVs5.2%
Battery EVs5.3%
Plug-in Hybrid EVs0.5%Battery EVs0.4%
2016 2020
OtherBattery EVsPlug-in Hybrid EVs
Millio
ns o
f EV
Thousands of stations
2.5
2.0
1.5
1.0
0.5
0
250
200
150
100
50
02016 2018 20202008 2010 2012 2014 2016 2018 20202008 2010 2012 2014
Fast charge (>22 kW)Normal charge (<22 kW)Battery EVsPlug-in Hybrid EVs
33
ACER/CEER ANNUAL REPORT ON THE RESULTS OF MONITORING THE INTERNAL ELECTRICITY MARKETS IN 2020
104 EVs are part of distributed energy resources70. These resources are expected to significantly influence generation and consumption patterns in the next coming years and decades. Other than EVs, distributed energy resources that can be aggregated when participating in electricity markets include:
• Heat pumps which can store energy in the form of heat. They can assist in shifting electricity con-sumption and flattening the household consumption pattern. Heat pumps are being used increasingly to heat European homes, with 1.6 million heat pumps sold in Europe in 2020. Since 2014, average an-nual growth in sales has been 13 %71.
• Small-scale storage: In 2020, more than 90 % of energy storage capacity in the grid was large-scale pumped hydroelectric storage72. Battery storage systems are an increasingly popular alternative. They can be smaller in size and can be installed by household consumers, possibly behind-the-meter. In Germany, 46 000 household electricity storage systems were installed in the first half of 2020, which translates into an annual growth rate of 59 %73. Data for other MSs are scarce.
• Rooftop solar photovoltaic (PV) power systems: Such installations can go hand in hand with instal-lations of small-scale storage. In the case of Germany, 87 % of household electricity storage systems are installed together with a PV system. Some 63 000 PV systems with a rated capacity under ten kW were installed in the first half of 2020, or a year-on-year growth rate of 56 %74. In the same time, the number of newly installed household electricity storage reached 46 000 units, a year-on-year growth rate of 59 %.
70 Distributed energy resources (DERs) refers to small or medium-sized resources, directly connected to the distribution network (EC, 2015).DERsincludedistributedgeneration,energystorage(small-scalebatteries)andcontrollableloads,suchaselectricvehicles(EVs),heatpumpsordemandresponse.(FromIRENAandSEDCreports).
71 According to data by the European Heat Pump Association. Available at http://www.stats.ehpa.org/hp_sales/story_sales/.
72 According to the 2020 report (“Study on energy storage – Contribution to the security of the electricity supply in Europe”) by the EC. Available at https://op.europa.eu/en/publication-detail/-/publication/a6eba083-932e-11ea-aac4-01aa75ed71a1/language-en.
73 According to a report by EuPD research. Available at https://www.eupd-research.com/pv-heimspeichermarkt-in-2020-auf-rekordkurs/.
74 See footnote 39.

34
ACER/CEER ANNUAL REPORT ON THE RESULTS OF MONITORING THE INTERNAL ELECTRICITY MARKETS IN 2020
3 Evolution of day-ahead prices105 This chapter reports on the evolution of DA prices in European wholesale markets. It covers DA price
trends, the level of price convergence within European regions, and occurrences of extreme prices.
3.1 Electricity price developments
106 This section analyses the trends in wholesale prices in EU electricity markets.
107 In 2020, DA prices have dropped by 32 % on average across the European Union, compared to 2019. DA prices in Europe in January and February were lower in comparison to the same period in the previous year, partly due to a mild winter. However, the main driver of the decline was the decrease in demand related to the COVID-19 pandemic75. In March, the pandemic-related measures started limiting social and economic activity. This led to a further decrease in European DA prices. Prices remained low through much of the second quarter of 2020. They increased in the second half of 2020 as electricity demand started to recover. During the fourth quarter of 2020, prices were higher than at the same time in 2019 in all MSs, except in the Nordic region.
108 The map in Figure 11 shows the average European DA electricity prices in 2020. In comparison to 2019, prices fell in all EU bidding zones. The drop was most significant in the Nordics. Prices in Norway were 76 % lower year-on-year, followed by Sweden (-51 %), Finland (-36 %), Denmark (-32 %), and Greece (-29 %). High wind generation and above-average hydro reservoir levels76 in the Nordics contributed to the decrease in prices in this region77. In comparison, Central Europe faced less significant decreases. Prices decreased the least in Poland (-13 %), the Czech Republic (-16 %), as well as Switzerland, Austria and Bulgaria (each by -17 %).
75 See Figure 1 in Section 2.2.1.
76 Holding above 100 TWh since the middle of July.
77 EC’s Quarterly Report on European Electricity Markets, available at https://ec.europa.eu/energy/sites/default/files/documents/quarterly_report_on_european_electricity_markets_q3_2020.pdf.

35
ACER/CEER ANNUAL REPORT ON THE RESULTS OF MONITORING THE INTERNAL ELECTRICITY MARKETS IN 2020
Figure 11: Average annual DA electricity prices and relative changes compared to the previous year in Euro-pean bidding zones – 2020 (euros/MWh and % change compared to 2019)
Source: ACER calculations based on ENTSO-E data.
109 Figure 12 shows the evolution of annual DA electricity prices over the last five years. The decrease in prices seen in 2019, which broke the upward trend of the preceding years, continued in 2020. Prices de-creased in all markets, including Greece, Bulgaria and Poland, which in 2019 still noted a price increase.
9.1776.6%
9.29-76.3%
9.46-75.5%
9.29-76.4%
21.19-44.8%
14.39-62.1%
14.39-62.1%
28.02-36.4%
33.69-26.5%
34.05-26.4%
34.04-26.2%
46.66-12.7%
33.60-16.4%33.15
-17.3%
34.01-18.1%
39.01-22.5%
45.01-29.5%46.21
-26.4%
38.97-24.8%
39.00-23.4%
39.67-24.1%
38.71-25.9%
37.79-26.3%
39.49-21.7%
39.28-17.3%
37.55-23.0%
34.00-16.8%
30.47-19.1%
32.24-21.7%
31.88-19.0%
39.59-19.1%
33.96-28.8%33.99
-29.0%
32.20-18.4%
37.59-25.0%
38.03-22.8%
8.88-76.8%
25.86-35.0%28.41
-28.7%
24.99-35.1%
100 20 30 40 50 euros/MWh

36
ACER/CEER ANNUAL REPORT ON THE RESULTS OF MONITORING THE INTERNAL ELECTRICITY MARKETS IN 2020
Figure 12: Evolution of annual DA electricity prices in a selection of European markets – 2016–2020 (euros/MWh)
Source: ACER calculations based on ENTSO-E data.Note: The figure includes only a selection of the largest markets. The DA prices for the regions ‘Nordic’, ‘Baltic’, ‘Iberia’ and ‘4MMC’ are the average of DA prices of the included bidding zones.
3.2 Price spikes and negative prices
110 This section reports on the occurrence of significantly high DA prices (price spikes78) or significantly low DA prices in 2020, including negative prices. This analysis does not consist in an in-depth investigation of causes, but rather identify trends and high-level explanations.
111 Figure 13 displays the occurrence of price spikes in Europe. Price spikes occur in times of high demand and low supply, sometimes associated with network contingencies or other unexpected events. Possible reasons for price spikes are numerous. They can result, for example, from mismatches between supply and demand, or market power situations, and possible abuses. The information underpinning this evalua-tion did not allow a precise identification of the reasons for price spikes.
112 In 2020, price spikes appeared in all EU bidding zones except Iberia79. Overall, the number of price spikes increased by 25 % in 2020. Price spikes appeared most often in Sicily, with 550 occurrences in the year. Furthermore, Poland, the Baltic States, Greece, the Irish single energy market (SEM), and Finland all regis-tered more than 100 occurrences in 2020. Price spikes also showed a seasonal concentration. Due to the falling prices of natural gas, 68 % of the price spikes occurred between May and August.
113 Even though the number of price spikes has increased from the previous years, their actual price level or magnitude has not. 2020 saw the lowest magnitude of average price spikes in the last five years80.
78 For the purpose of the MMR, a price spike is defined as an hourly DA price that is three times above the theoretical variable cost of generating electricity with gas-fired power plants based on the TTF DA gas prices in the Netherlands. See more details in footnote 12 of the Electricity Wholesale Markets volume of the 2015 MMR, available at: https://www.acer.europa.eu/Official_documents/Acts_of_the_Agency/Publication/ACER%20Market%20Monitoring%20Report%202015%20-%20ELECTRICITY.pdf.
79 The Spanish and Portuguese bidding zones are gathered in the Iberian electricity market MIBEL.
80 Calculated as the average of the 99th percentile of prices in all bidding zones.
euro
s/MW
h
2016
2017
2018
2019
2020
2016
2017
2018
2019
2020
2016
2017
2018
2019
2020
2016
2017
2018
2019
2020
2016
2017
2018
2019
2020
4MMC France Baltic Germany Luxembourg Nordic
euro
s/MW
h
-29%
-18%-20%
-17%
-13%
-26%
-26%
-29%
-19%
-57%
70
60
40
20
30
50
10
0
60
40
20
30
50
10
0
2016
2017
2018
2019
2020
2016
2017
2018
2019
2020
2016
2017
2018
2019
2020
2016
2017
2018
2019
2020
2016
2017
2018
2019
2020
Greece Bulgaria Italy Iberia Poland

37
ACER/CEER ANNUAL REPORT ON THE RESULTS OF MONITORING THE INTERNAL ELECTRICITY MARKETS IN 2020
114 The increase in price spikes is partly a consequence of the drop in prices of natural gas due to the pan-demic. ACER currently defines price spikes based on the price of generating electricity with gas, assum-ing that this is the typical marginal technology in Europe. The technology setting the marginal price may become increasingly dependent on the evolution of fuel and CO2 emissions prices, together with the jurisdiction. ACER is working on a redefinition of price spikes to better reflect market developments.
Figure 13: DA price spikes across Europe – 2020 (left), and evolution of price spikes in Europe – 2016–2020 (right)
Source: ACER calculations based on ENTSO-E and PLATTS data. Note: For the calculation of the DA price spikes, the virtual bidding zones of Italy are excluded from the calculation. Values may differ from values reported in previous editions of the MMR as data are retroactively updated in the ENTSO-E transparency platform.
115 Figure 14 shows the occurrence of negative prices. Negative prices usually appear in times of high RES production in combination with low demand. Some inflexible generators then prefer paying and continuing to produce rather than interrupting their production81. The number of negative prices has been increasing steeply since 2018.
116 In 2020, the number of occurrences of negative prices was more than twice the number in 2019. The SEM bidding zone has seen by far the most occurrences of negative prices, with 374 occurrences in 2020, a year-on-year increase of 209 %. The DE/LU bidding zone follows with 298 occurrences (+41 % year-on-year). This year, the drop in electricity demand due to COVID-19-pandemic restrictions triggered more instances of negative prices. The number of negative prices was highest from February to May with 62 % of negative prices over the period82.
Figure 14: DA negative prices across Europe – 2020 (left), and evolution of negative prices in Europe – 2016–2020 (right)
Source: ACER calculations based on ENTSO-E data.Note: For the calculation of the DA negative prices, the virtual bidding zones of Italy have been excluded from the calculation. Values may differ from values reported in previous editions of the MMR as data are retroactively updated in the ENTSO-E transparency platform.
81 Depending on the specific national rules to integrate RES in wholesale markets, some subsidised RES generators could also be interested in paying a certain amount of money for producing, as long as this amount is lower than the subsidy that they receive.
82 See Figure 53 in Annex1:additionalfiguresandtables.
Num
ber o
f spi
kes
2016 2017 2018 20202019
2,500
1,500
2,000
500
1,000
0
1,722
1,517
240
1,939
2,369
131399
2828
44551818
2323 9595
144144
131131
88
180180
52523939
42424343
1616
5454550550
4343
126126126126
12124646127127
44
44
152152
4242
1515
1515
8080
8585
2929
99
Num
ber o
f spi
kes
2016 2017 2018 20202019
2,000
1,500
500
1,000
0
457
111111136136
7575119119298298
192192 8989
5555
55
99
102102
9191
22
23232323 44
9797
5555
11
99
99
99
1010
374374
115115
686511
925
1,923

38
ACER/CEER ANNUAL REPORT ON THE RESULTS OF MONITORING THE INTERNAL ELECTRICITY MARKETS IN 2020
117 In general, the increasing number of negative prices is related to the increasing penetration of variable RES. This is true especially when part of these generators is subsidised with payments that do not depend on the instantaneous needs of the system. Such situations should be avoided. The EC recommends in its dedicated guidelines83 that measures be “put in place to ensure that generators have no incentive to generate electricity under negative prices.”
118 Furthermore, the presence of negative prices emphasises the need to reward flexibility efficiently, includ-ing fast-activation production, storage solutions and in general demand side response (DSR). This year especially, the flexibility of the system was put to the test by the impact of the COVID-19 pandemic on the electricity demand84.
3.3 Price convergence
119 Figure 15 shows an overview of the price convergence in a selection of regions in Europe85. Price conver-gence provides an indication of electricity markets integration in Europe. Price convergence is expected to increase following the introduction of market coupling, network expansion, or other actions leading to an increase in commercial cross-zonal capacity (e.g. the “70 % target”)86. Year-on-year changes may also be caused by market fundamentals, which are not necessarily related to market integration87. Therefore, price convergence should be analysed over a period of a few years. Nevertheless, reaching full price con-vergence is not an objective in itself, as it would require overinvestment in network infrastructure.
83 Section3.3.3.2.1 of theEuropeanCommissionGuidelines onState aid for environmental protection andenergy2014-2020 (2014/C200/01),availableathttps://eur-lex.europa.eu/legal-content/EN/TXT/PDF/?uri=CELEX:52014XC0628(01)&from=EN.
84 See Chapter 4forelementsofanalysisonimpactoftheCOVID-19onnetworkcapacity.
85 Priceconvergenceiscalculatedpercapacitycalculationregion(CCR),withtheexceptionoftheCoreregion.CCRsaredefinedinAnnexIoftheamendmentofArticle9(13)oftheCommissionRegulation(EU)2015/1222.Thisamendmentwaspublishedonthe1stofApril2019.For this analysis, the Core CCR has been split into the flow-based CWE part of the Core region, and the rest of Core excluding CWE. The selection of regions is different from last year’s MMR, thus the figures from last year and this year should not be compared to each other.
86 The CEP sets a binding minimum 70 % target for electricity interconnector capacity for cross-zonal trading. ACER produces regular reports on the results of monitoring of the margin available for cross-zonal trade, available at https://www.acer.europa.eu/Official_documents/Publications/Pages/Publication.aspx.
87 For example, a fast expansion of RES could decrease price convergence but still be in on target with the climate goals.

39
ACER/CEER ANNUAL REPORT ON THE RESULTS OF MONITORING THE INTERNAL ELECTRICITY MARKETS IN 2020
Figure 15: DA price convergence in Europe by region – 2016–2020 (% of hours)
Source: ACER calculations based on ENTSO-E data.Note: Full price convergence: <1 euros/MWh difference. Moderate price convergence: 1-10 euros/MWh difference. Low price convergence: >10 euros/MWh difference. The number of bidding zones varies among CCRs; full price convergence is more complex to achieve in CCRs with a higher number of zones.
120 The IU region showed full price convergence 66 % of the time in 202088. In Central-West Europe (CWE), price convergence remained stable; full convergence was observed 49 % of the time. South-West Europe (SWE) saw a significant rise in full convergence in 2020, from 23 % in 2019 to 42 % of the time. Similarly, Italy North experienced higher price convergence, with full price convergence rising from 8 % to 30 %.
121 In contrast, price convergence kept decreasing in the Baltic CCR. Overall convergence dropped signifi-cantly. Full price convergence was only observed 6 % of the time, compared to 11 % in 2019. This is mainly due to divergences between Baltic States and neighbouring countries within the Baltic CCR (Finland, Poland, and Sweden), also belonging to other CCRs. In particular, the pandemic affected the countries in the Core CCR, including Poland, very differently from the Baltic States.
122 Core (excluding CWE) region experienced full price convergence less than 1 % of the time. The main causes are the relatively low cross-border capacity and a lack of market coupling89. Price convergence continued to decrease in the Nordic region. In 2020, full price convergence was seen 17 % of the time, compared to 33 % in 2019. This is due to this year’s increased hydro production pushing down prices in northerly bidding zones of Norway and Sweden, but not in the rest of the CCR.
88 IUexitedSDACinJanuary2021,asdidotherEU-GBinterconnectorsandGBbiddingzones.
89 See footnote 137.
%
2016
2017
2018
2019
2020
2016
2017
2018
2019
2020
2016
2017
2018
2019
2020
2016
2017
2018
2019
2020
2016
2017
2018
2019
2020
2016
2017
2018
2019
2020
Hansa Italy North IU Nordic SWESEE
% 85%
88%
30%15%
65%
48%
23%
40%23%
75%
63%
100
80
40
60
20
0
100
80
40
60
20
0
2016
2017
2018
2019
2020
2016
2017
2018
2019
2020
2016
2017
2018
2019
2020
2016
2017
2018
2019
2020
2016
2017
2018
2019
2020
Baltic Channel Core (CWE) Core (excl. CWE) GRIT
Full price convergence (<1 euro/MWh price difference)
Moderate price convergence (1-10 euros/MWh price difference)
Low price convergence (>10 euros/MWh price difference)
32%
5%24%0%
28%
49%
31%
28%
34%
42%51%
1%
18%
17%
18%
66%40%
30%11%1%
9%6%

40
ACER/CEER ANNUAL REPORT ON THE RESULTS OF MONITORING THE INTERNAL ELECTRICITY MARKETS IN 2020
Part II: The Internal Electricity Market
4 Cross-zonal capacity123 A well-integrated and efficient IEM relies on sufficient capabilities for cross-zonal trade. The optimal pro-
vision of cross-zonal capacity is an essential prerequisite for the IEM to function well.
124 Firstly, this Chapter provides an overview of the levels of cross-zonal capacity available for trade (trad-able capacity)90 in Europe and the actions taken to enhance them. Section 4.1 details the evolution of capacity available for trade on borders where the Net Transfer Capacity (NTC) calculation applies. Sec-tion 4.2 provides a similar assessment where FB capacity calculation applies. It is important to note that the scope of the underlying assessment of sections 4.1 and 4.2 is limited to the evolution of the absolute cross-zonal capacities over time. The analysis does not consider the so-called “70 % target”, which is the subject of a dedicated report91. The chapter also includes an update on the use of remedial actions used by TSOs to alleviate network congestions and related costs (Section 4.3).
125 Secondly, Section 4.4 of this Chapter reports on the efficiency of the current bidding zone configuration as required to ACER, every three years, pursuant to Article 34(1) of the CACM Regulation.
126 Thirdly, this Chapter reports on the progress made regarding the use of available cross-zonal capacities in the DA, ID and balancing timeframes across Europe (Section 4.5). Subsection 4.5.4 also includes an assessment of selected aspects of balancing markets in light of its ongoing pan-European integration.
4.1 Level of cross-zonal capacity where NTC calculation applies
127 This Section describes the evolution of the amount of cross-zonal capacity made available to the market during the last five years.
128 Figure 16 presents the average cross-zonal DA NTC per capacity calculation region (CCR) from 2016 to 2020, based on hourly cross-zonal capacities made available across all timeframes and all borders of each CCR. The aim of the figure is to identify trends within regions rather than comparing absolute values across regions.
Figure 16: NCT averages of both directions on cross-zonal borders, aggregated per CCR – 2016–2020 (GW)
Source: ACER calculations based on ENTSO-E data. Note: Only cross-zonal NTC and technical profiles’ values are considered in this figure. Bidding zone borders within countries (i.e. within Denmark, Italy, Sweden and Norway) are not included in this figure.
90 Throughout this report, tradable cross-zonal capacity is also referred to as commercial cross-zonal capacity, available cross-zonal capacity or, simply, commercial or available capacity.
91 See footnote 86.
GW
15.0
10.0
5.0
12.5
7.5
2.5
0Baltic
2016 2017 2018 2019 2020
Channel Core(excl. CWE)
Greece-Italy(GRIT)
Hansa Italy North IU Nordic Norwegianborders
SEE SWE Swissborders

41
ACER/CEER ANNUAL REPORT ON THE RESULTS OF MONITORING THE INTERNAL ELECTRICITY MARKETS IN 2020
129 There was an overall moderate increase (of 5% compared to 2019) in 2020, with significant differences across CCRs. The highest increase occurred at the South-East Europe (SEE) region (60.9 %), followed by the Swiss borders (7.4 %) and South-West Europe (SWE) (6.7 %), the Core (excluding CWE) (5.4 %), Hansa (5.1 %) and the Baltic (4 %) regions. In the Nordic and the IU regions, the NTC increased by 3.8%. Moder-ate decreases, compared to 2019, were observed at the Norwegian borders (3.3 %) and at a smaller scale in the GRIT (Greece-Italy) region (2.2 %). The situation remained stable in the Channel (+0.6 %) and Italy North (-0.6 %) regions.
130 The reasons for the above listed variations in cross-zonal capacity are border-specific.
131 Figure 17 shows the major changes in the NTCs on European borders between 2019 and 2020. A descrip-tion of the factors explaining the most remarkable changes is included below.
Figure 17: Changes in tradable capacity (NTC) in Europe – 2019–2020 (MW)
Source: ACER calculations based on ENTSO-E, NRAs and Nord Pool data.Note: Differences lower than 100 MW are excluded.
132 Firstly, the largest increase in both absolute and relative terms occurred at the border between Romania and Bulgaria (+101 % in the exporting direction from Bulgaria and +118 % in the opposite direction). The increase could correspond to the first commissioning phase of the on-going Projects of Common Interest (PCI) in the region92.
133 Secondly, a significant increase was observed between the Polish and the Swedish border (75 % in the exporting direction from Poland). A linear increase of cross-border capacity is expected at the Polish borders as part of the action plan set by Poland in accordance with article 15 of the recast Electricity Regulation, from 2019 to 202593. The interconnection between the Danish and Swedish border similarly observed an increase of 38 % in the exporting direction from Denmark. This pattern at Swedish borders corresponds to the ongoing trend of closure of Swedish nuclear power plants in the southern part of Swe-den combined with the installation of wind farms in the northern part of Sweden.
134 Thirdly, significant increases were observed at the technical profile between the Polish borders and the borders of the Czech Republic, Germany and Slovakia (80 % in the exporting direction from Poland and 53 % in the opposite direction). The most significant decreases were observed at the border between the Czech Republic and Poland (68 % in the exporting direction from Poland and 32 % in the opposite direction).
135 Fourthly, the increase at Swiss borders was mainly due to the increase in the available capacity between Switzerland and Austria (42 % in the exporting direction from Switzerland, and 15 % in the other direc-tion). This corresponds to the reinforcement of the Swiss network and the anticipated commissioning of a 380 kV line between Beznau and Birr.
92 Various projects in the context of the priority corridor NSI-EAST. See http://www.acer.europa.eu/electricity/infrastructure/projects-common-interest.
93 See https://www.gov.pl/web/aktywa-panstwowe/plan-dzialania-przyjety-przez-kse.
MW
1000800
400600
2000
-400
-800
-200
-600
LT - L
VLT
- SE4
CZ - D
E/LU
CZ - P
LCZ
+DE+
SK - P
LDE
/LU - C
ZPL
- CZ
PL - C
Z+DE
+SK
RO - H
UDE
/LU - D
K1DE
/LU - D
K2DK
1 - D
E/LU
DK1 -
NL
DK2 -
DE/
LUNL
- DK1
PL - S
E4DK
1 - S
E3DK
2 - S
E4SE
1 - S
E2SE
2 - S
E3SE
3 - S
E4SE
4 - S
E3DK
1 - N
O2NO
1 - S
E3NO
2 - D
K1NO
2 - N
LNO
2 - N
O1NO
5 - N
O1SE
3 - N
O1BG
- RO
RO - B
GES
- FR
ES - P
TFR
- ES
PT - E
SAT
- CH
CH - A
TCH
- DE/
LUCH
- IT N
ORTH
FR - C
H
Baltic HansaCore (excl. CWE)Norwegian bordersNordic SEE SWE
Swiss borders
19%29%
14%
-32%
53%17%
-68%
80%
26%
27%
-27%
21%
-26%
75%38%14%
-3% -2%
-9%
11%
-12%
-25%
18%
-16%-9%
-4%
15%
101%118%
10%14%20%
-10%
15%42%
6% 10%10%

42
ACER/CEER ANNUAL REPORT ON THE RESULTS OF MONITORING THE INTERNAL ELECTRICITY MARKETS IN 2020
136 Finally, the overall increase in the SWE region likely resulted from the launch of a coordinated day-ahead capacity calculation in January 2020. In addition, contrarily to 2019, there was no major outage at the border between France and Spain in 2020.
137 At the other end, a decrease was observed at most Norwegian borders, except in the directions from Sweden to Norway and from Norway to Denmark.
4.2 Evolution of capacity on borders where flow-based capacity calculation ap-plies (CWE region)
138 This section analyses the evolution of cross-zonal capacity in the Core (CWE) region where FB DA capac-ity calculation applies. The section first shows high-level trends of capacity in the region, then it analyses the frequency and location of network constraints; finally, it assesses the severity of those constraints.
139 In the Core (CWE) region, NTC values have not been relevant since the launch of FBMC in 2015. Figure 18 displays an overall indicator for the development of tradable capacity in the Core (CWE) region be-tween 2016 and 2020. The monthly average size (i.e. nth root of the volume94) of the FB DA domain in the Core (CWE) region is computed for every hour. It is computed only for the economic direction, i.e. the ‘directional size’. The latter is defined for the purpose of this indicator as the FB domain in the orthant95 that includes the solution of the DA market-coupling algorithm. This is the direction corresponding to the bidding zones’ net positions96.
140 Compared to 2019, the directional volume decreased on average by 1.2 % in 2020. This confirms a trend initiated in the third and fourth quarters of 2019. This is the first decrease observed since 2016, back be-low levels reached in 2018. In the context of the pandemic combined with the energy transition, networks faced an increase in situations with persistent high or low voltage levels as well as such situations with unexpected voltage fluctuations97.
Figure 18: Average size (nth root of the volume) of the directional FB DA domain in the economic direction in the Core (CWE) – 2016–2019 (GW)
Source: ACER calculations based on Core (CWE) TSOs data.Note: The directional FB domain lies in the orthant, which contains the solution of the DA market-coupling algorithm maximis-ing social welfare.
94 Initially, the FB domain used for capacity calculation in the CWE region was three-dimensional. The introduction of an additional bidding-zone border between Austria and Germany/Luxembourg in October 2018 added one more dimension, thus leading to a four-dimensional domain. As of November 2020, following the commissioning of ALEGrO (for Aachen Liège Electricity Grid Overlay), a HVDC power link between Germany and Belgium, the FB domain became five-dimensional. Nonetheless, as the number of hours in which ALEGrO was in full commercial operation (i.e. excluding the ramp-up phase and the forced outage period) is lower than the monthly granularity adopted for the figure, those hours have been filtered out. As a result, to ensure comparability, the cubic root of the volume is used up to September 2018, and for subsequent periods the fourth root of the volume is used.
95 An orthant corresponds to a subdivision of an n-dimensional space by coordinate planes (and is equivalent to an octant for a three-dimensional space).
96 For more information on relevant definitions and indicators related to the evolution of capacity on borders where FB methods apply, pleaseseeSubsection3.2.1on‘Evolutionofcommercialcross-zonalcapacity’(page24)oftheElectricityWholesaleMarketsVolumeofthe 2016 MMR, available at: https://extranet.acer.europa.eu/Official_documents/Acts_of_the_Agency/Publication/ACER%20Market%20Monitoring%20Report%202016%20-%20ELECTRICITY.pdf.
97 See Amprion’s Market Report 2021, available here: https://www.amprion.net/Market/Market-Report/Market-Report-2021/.
GW
5.0
3.0
4.0
4.5
2.5
3.5
2.020192016 20182017 2020 2021
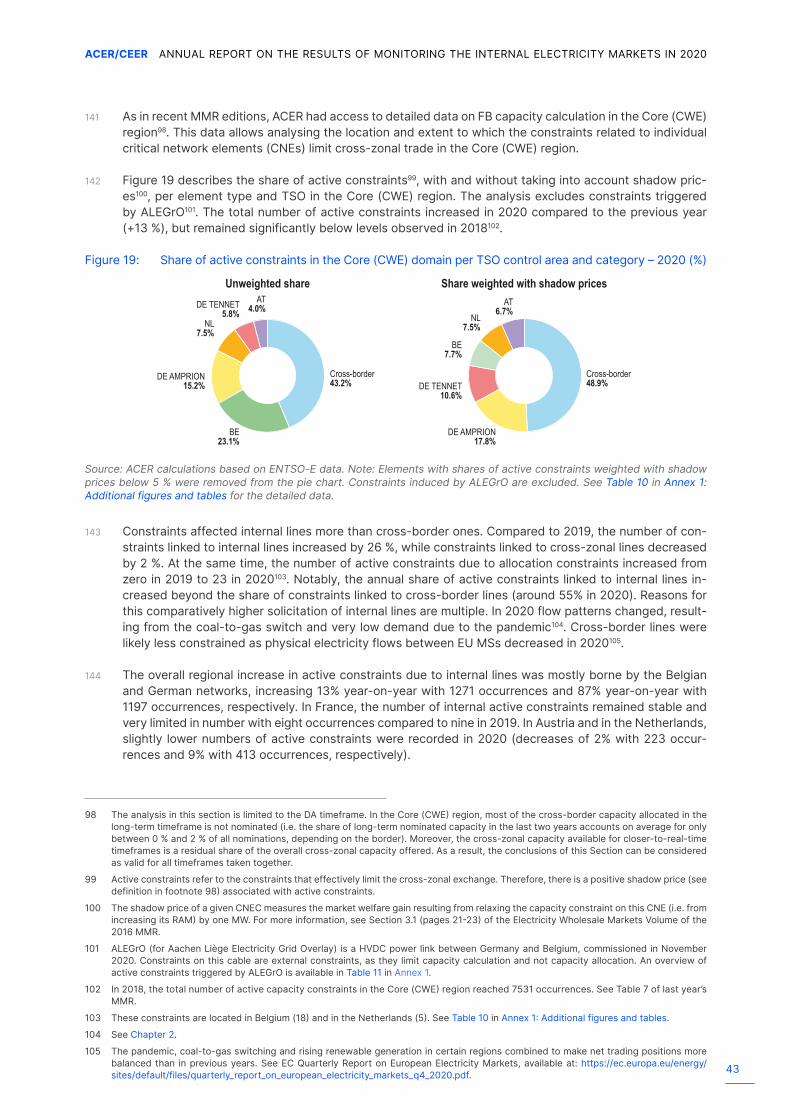
43
ACER/CEER ANNUAL REPORT ON THE RESULTS OF MONITORING THE INTERNAL ELECTRICITY MARKETS IN 2020
141 As in recent MMR editions, ACER had access to detailed data on FB capacity calculation in the Core (CWE) region98. This data allows analysing the location and extent to which the constraints related to individual critical network elements (CNEs) limit cross-zonal trade in the Core (CWE) region.
142 Figure 19 describes the share of active constraints99, with and without taking into account shadow pric-es100, per element type and TSO in the Core (CWE) region. The analysis excludes constraints triggered by ALEGrO101. The total number of active constraints increased in 2020 compared to the previous year (+13 %), but remained significantly below levels observed in 2018102.
Figure 19: Share of active constraints in the Core (CWE) domain per TSO control area and category – 2020 (%)
Source: ACER calculations based on ENTSO-E data. Note: Elements with shares of active constraints weighted with shadow prices below 5 % were removed from the pie chart. Constraints induced by ALEGrO are excluded. See Table 10 in Annex 1: Additional figures and tables for the detailed data.
143 Constraints affected internal lines more than cross-border ones. Compared to 2019, the number of con-straints linked to internal lines increased by 26 %, while constraints linked to cross-zonal lines decreased by 2 %. At the same time, the number of active constraints due to allocation constraints increased from zero in 2019 to 23 in 2020103. Notably, the annual share of active constraints linked to internal lines in-creased beyond the share of constraints linked to cross-border lines (around 55% in 2020). Reasons for this comparatively higher solicitation of internal lines are multiple. In 2020 flow patterns changed, result-ing from the coal-to-gas switch and very low demand due to the pandemic104. Cross-border lines were likely less constrained as physical electricity flows between EU MSs decreased in 2020105.
144 The overall regional increase in active constraints due to internal lines was mostly borne by the Belgian and German networks, increasing 13% year-on-year with 1271 occurrences and 87% year-on-year with 1197 occurrences, respectively. In France, the number of internal active constraints remained stable and very limited in number with eight occurrences compared to nine in 2019. In Austria and in the Netherlands, slightly lower numbers of active constraints were recorded in 2020 (decreases of 2% with 223 occur-rences and 9% with 413 occurrences, respectively).
98 TheanalysisinthissectionislimitedtotheDAtimeframe.IntheCore(CWE)region,mostofthecross-bordercapacityallocatedinthelong-term timeframe is not nominated (i.e. the share of long-term nominated capacity in the last two years accounts on average for only between 0 % and 2 % of all nominations, depending on the border). Moreover, the cross-zonal capacity available for closer-to-real-time timeframes is a residual share of the overall cross-zonal capacity offered. As a result, the conclusions of this Section can be considered as valid for all timeframes taken together.
99 Active constraints refer to the constraints that effectively limit the cross-zonal exchange. Therefore, there is a positive shadow price (see definitioninfootnote98)associatedwithactiveconstraints.
100 The shadow price of a given CNEC measures the market welfare gain resulting from relaxing the capacity constraint on this CNE (i.e. from increasingitsRAM)byoneMW.Formoreinformation,seeSection3.1(pages21-23)oftheElectricityWholesaleMarketsVolumeofthe2016 MMR.
101 ALEGrO (for Aachen Liège Electricity Grid Overlay) is a HVDC power link between Germany and Belgium, commissioned in November 2020. Constraints on this cable are external constraints, as they limit capacity calculation and not capacity allocation. An overview of active constraints triggered by ALEGrO is available in Table 11 in Annex 1.
102 In2018,thetotalnumberofactivecapacityconstraintsintheCore(CWE)regionreached7531occurrences.SeeTable7oflastyear’sMMR.
103 TheseconstraintsarelocatedinBelgium(18)andintheNetherlands(5).SeeTable 10 in Annex1:Additionalfiguresandtables.
104 See Chapter 2.
105 The pandemic, coal-to-gas switching and rising renewable generation in certain regions combined to make net trading positions more balanced than in previous years. See EC Quarterly Report on European Electricity Markets, available at: https://ec.europa.eu/energy/sites/default/files/quarterly_report_on_european_electricity_markets_q4_2020.pdf.
DE AMPRION17.8%
DE TENNET10.6%
BE7.7%
NL7.5%
AT6.7%
Cross-border48.9%
BE23.1%
DE AMPRION15.2%
NL7.5%
DE TENNET5.8%
AT4.0%
Cross-border43.2%
Unweighted share Share weighted with shadow prices

44
ACER/CEER ANNUAL REPORT ON THE RESULTS OF MONITORING THE INTERNAL ELECTRICITY MARKETS IN 2020
145 TSOs should not solve internal constraints by limiting the volume of interconnection capacity106. The re-cast Electricity Regulation considers this to be complied with if a minimum level of available cross-zonal capacity is reached: “the 70% target”107. The achievement of this objective is subject to on-going tran-sitory measures108. In Core (CWE), a minimal remaining available margin (RAM) of 20% of their thermal capacity has been imposed on each CNEC since April 2018 (the ‘20% requirement’). Figure 20 shows the distribution of the minimum hourly RAM109 over the maximum admissible flow (Fmax) among all CNECs in the Core (CWE) region, per MS, in 2019 and 2020. The peak of each curve shows, for each MS, the most frequently observed level of minimum hourly RAM among all CNECs. Lower percentages reveal more se-vere constraints as a relative lower amount of capacity is available for trade. Figure 20 confirms the evolu-tions observed in 2019. Except for some occurrences in Germany (39 hours), in all MSs, the RAM remained above 20% of Fmax for all CNECs at all times, in line with the 20% requirement110,111.
Figure 20: Density function of the minimum hourly RAM over Fmax among all CNECs in the Core (CWE) region, per MS – 2019–2020 (%)
Source: ACER calculations based on ENTSO-E data. Note: The dashed lines mark 20% (minimum RAM requirement as of April 2018).
146 The pandemic triggered exceptional grid situations. Flow patterns changed under a switch from coal to gas, and generally to renewables, while levels of tradable capacity decreased compared to 2019. The location of congestions shifted, with an increase in occurrences of internal active constraints. However, levels of minimum hourly RAM remained stable from 2019 to 2020. Overall, EU TSOs coped with the situation. They offered slightly lower amounts of capacity for trade. However, higher constraints on EU networks did not influence significantly the levels of price convergence within the Core (CWE) region. As demand was also lower, price convergence remained at levels similar to 2019112.
106 Article16(8)ofRegulation(EU)2019/943.
107 See footnote 86.
108 SuchasactionplanspursuanttoArticle15ofRegulation(EU)2019/943orderogationspursuanttoArticle16(9)ofthesameRegulation.
109 Fortheanalysis,allocationconstraintsandCNECsstemmingfromtheapplicationofthelong-termcapacityallocation(LTA)inclusionpatch were excluded.
110 The 20% minimum RAM requirement is subject to operational constraints, allowing further reduction in the capacity made available if system security is endangered. For implementation details please see the latest version of the Documentation of the CWE FB MC solution, available at: https://www.jao.eu/support/resourcecenter/overview?parameters=%7B%22IsCWEFBMCRelevantDocumentation%22%3A%22True%22%7D.
111 See footnote 86. Figure 20 does not enable drawing precise conclusions with respect to the fulfilment of the 70 % minimum capacity target.InlinewithitsRecommendationNo01/2019,ACERmonitorstheaveragerelativemarginavailableforcrosszonaltrade(MACZT)inrelation to the 70 % target and regularly publishes the outcome in dedicated reports. In these reports, ACER considers the capacity used toaccommodateflowsderivedfromlong-termcapacityallocation(LTA)andfromcross-zonalexchangesbeyondtheCore(CWE)region(i.e.themarginfromnon-coordinatedcapacitycalculation,MNCC).
112 See Section 3.3.
Dens
ity (%
) Density (%)
Minimum hourly RAM (%)
201920
15
10
5
0
20
15
10
5
00 40 12080 160
AT BE DE FR NL
Minimum hourly RAM (%)
2020
0 40 12080 160

45
ACER/CEER ANNUAL REPORT ON THE RESULTS OF MONITORING THE INTERNAL ELECTRICITY MARKETS IN 2020
4.3 Remedial actions
147 This Section focuses on the costs of currently applied remedial actions. The remedial actions relate to the measures taken by TSOs to address the congestions remaining after the market gate closure time, i.e. af-ter day-ahead and intraday market coupling. Some remedial measures, such as changes in grid topology, do not lead to significant costs113. Others, like re-dispatching, countertrading and curtailment of allocated capacity, come at a cost to the system or to TSOs.
148 The use of remedial measures to resolve physical congestions in Europe has become frequent. It is likely to increase further in the near future for several key reasons. Firstly, as the share of variable RES genera-tion is increasing, the location of structural congestion will probably change more frequently with flow patterns. This may require more TSOs’ interventions, sometimes in timeframes closer to real-time. If bid-ding zones are not properly defined, the volume of remedial actions needed to relieve structural conges-tion is unlikely to decrease. Secondly, an increased application of remedial actions will likely be necessary to ensure the fulfilment of the 70% minimum target. Thirdly, bidding zones in Europe are usually defined by political borders. Thus, often they cannot efficiently address structural, physical congestion in the net-work. As a result, locational price signals, via wholesale prices, are partly distorted, as they do not always reflect the cost of congestions.
149 Table 1 shows the evolution of the cost of remedial actions during the period between 2018 and 2020. The cost totalled 3.6 billion euros in 2020. This is a 26 % increase compared to 2019 levels.
150 The costs increased in Lithuania (438%)114; Spain (76%), the Czech Republic and Italy (38%), the Nether-lands (29%), Germany (18%) and Norway (6%), while reducing in other MSs. Italy, with costs of 1.5 billion euros, accounts for 41% of the overall costs. Then come Germany (38%), Spain (12%), Austria (4%), the Netherlands and Poland (both 2%).
151 The relatively moderate increase in the cost of remedial actions in Germany is partly explained by the flow patterns observed since 2019. These new patterns partly result from the shift in the merit order of coal and gas generation units115. They further result from the reduction in the North-South flows following the introduction of capacity calculation between Germany and Austria. In addition, following the split of the German/Luxembourgish/Austrian bidding zone, Austria started to bear most of the costs for the so-called network reserves. This resulted in a cost increase in Austria in 2019, confirmed in 2020.
152 The increase in remedial actions in the Netherlands may reflect new constraints in networks. In 2020, fol-lowing the coal-to-gas switch, the Netherlands became a net exporter. It had not occurred since 1981116. The MS has a significant share of gas-fired capacity in its generation mix.
153 In Spain, the increase in remedial actions results from the reduction in demand caused by the COVID-19 pandemic, and associated voltage issues reported by the Spanish TSO. In 2020, in Spain, 71 % of the volume of remedial actions was dedicated to solving voltage issues.
154 In relative terms, the highest redispatching costs per unit of demand were observed in Italy (5.26 euros/MWh), Germany (2.67 euros/MWh), Austria (2.22 euros/MWh) and Spain (1.89 euros/MWh).
113 However, they may result from long-term investments in the network (e.g. substations or phase-shifters).
114 ThisoutstandingincreasewascausedbytwoHVDC(NordBalt)tripeventsthatlasted16and23hoursrespectively,during2020.
115 See footnote 77 of last year’s MMR.
116 See TenneT’s annual market update, available here: https://www.tennet.eu/fileadmin/user_upload/Company/Publications/Technical_Publications/Annual_Market_Update_2020.pdf.

46
ACER/CEER ANNUAL REPORT ON THE RESULTS OF MONITORING THE INTERNAL ELECTRICITY MARKETS IN 2020
Table 1: Evolution of the costs of remedial actions – 2018–2020 (thousand euros)
CountryTotal
volumes 2020
(GWh)
Redispatching Costs 2020
(million euros)
Countertrading costs 2020
(million euros)
Other costs 2020 (million
euros)
Total costs 2020 (million
euros)
Total costs 2018 (million
euros)
Total costs 2019 (million
euros)
Total costs 2020 (million
euros)
Relative change
2020/2019
Cost of RAs per MWh of
demand 2020 (euros/MWh)
AT 1,484.60 28,730.50 5.80 112,563.20 141,299.50 116,649.56 148,706.18 141,299.50 -5% 2.224BE 44.23 1,356.70 328.45 0.00 1,685.15 16,879.65 3,312.39 1,685.15 -49% 0.021CZ 0.60 58.00 58.00 2,186.67 42.00 58.00 38% 0.001DE 21,096.87 251,924.02 135,343.43 951,393.34 1,338,660.79 1,134,886.02 1,136,107.50 1,338,660.79 18% 2.667EE 1.90 58.20 58.20 970.18 871.45 58.20 -93% 0.007ES 10,639.20 428,215.30 7,019.20 435,234.50 368,742.77 246,912.84 435,234.50 76% 1.888FI 14.20 370.00 317.00 687.00 4,135.00 902.00 687.00 -24% 0.009FR 363.71 149.89 7,463.30 7,613.19 16,896.51 24,988.62 7,613.19 -70% 0.018HU 0.00 0.00 0.00 0.00 226.69 510.95 -100%IT 9,288.00 1,470,000.00 1,470,000.00 850,000.00 1,068,000.00 1,470,000.00 38% 5.257LT 12.78 0.00 953.04 0.00 953.04 782.92 177.20 953.04 438% 0.086LV 74.76 6.95 4,085.00 4,091.95 2,721.68 5,623.64 4,091.95 -27% 0.634NL 533.00 31,033.00 47,706.00 78,739.00 65,456.00 61,063.55 78,739.00 29% 0.734NO 1,308.00 9,491.00 44.00 9,535.00 13,216.00 8,992.00 9,535.00 6% 0.077PL 17,034.35 75,559.84 220.73 0.00 75,780.57 134,354.33 113,995.65 75,780.57 -34% 0.514PT 7.23 73.93 73.93 16,764.29 174.08 73.93 -58% 0.002SE 69.20 172.90 966.30 1,139.20 3,663.74 2,547.90 1,139.20 -55% 0.009
Total 61,972.62 2,297,135.08 152,726.40 1,115,747.54 3,565,609.02 2,748,532.00 2,822,927.95 3,565,609.02 1.53Source: ACER calculations based on NRAs data.Note: ACER requested data on congestion-related remedial actions. No costs related to costly remedial actions were incurred in Bulgaria, Croatia, Cyprus, Denmark, Greece, Ireland, Luxembourg, Romania, Slovakia and Slovenia. Switzerland has not provided details on costs. Italy costs related to counter-trading and remedial actions to avoid power flow violating voltage stability117. The cost of remedial actions per MWh load is obtained by dividing the sum of redispatching costs and costs re-lated to other actions, by the total national demand. The detailed costs of remedial actions is available in Table 12 in Annex 1. Other actions include network reserves in Austria, Germany (including both availability and activation payments), Latvia and Lithuania, cross-border re-dispatching in Belgium, RES curtailment in Germany and the so called “restriction contracts” in the Netherlands (contracts related to the availability for ramping in situations where there is a risk of inadequate capacity available for redispatching, e.g. in case of foreseen maintenance).
155 Figure 21 shows the distribution of redispatching volumes by underlying cause and by objective. Firstly, TSOs mostly relied on redispatching to cope with congestion issues at the transmission level (66%). Sec-ondly, clearly identifying a single objective for the applied remedial actions is not always possible. How-ever, the preservation of intra-zonal opposed to cross-zonal exchanges was the main objective behind the use of remedial actions (92%).
Figure 21: Distribution of redispatching volume by underlying cause (left) and by objective (right) – 2020 (%)
Source: ACER calculations based on NRAs data.Note: The left chart does not include redispatching costs for Poland and Sweden as the breakdown per cause was not provided.
117 Terna did not provide data, therefore, the conclusions presented in the table for Italy are not representative of the Italian situation. ARERA produces a specific monitoring report on voltage constraints. See https://www.arera.it/it/docs/20/282-20.htm.
Preserve cross-borderexchanges
4.1%
Preserve internalexchanges91.9%
Not specified3.9%
Voltage issuesat transmission level
25.9%
Issues at distribution level5.8%
Other issues at transmission level2.3%
Congestion attransmission level66.0%
Underlying cause Objective

47
ACER/CEER ANNUAL REPORT ON THE RESULTS OF MONITORING THE INTERNAL ELECTRICITY MARKETS IN 2020
156 In 2020, the pandemic triggered exceptional grid situations that constrained internal networks118. To solve these constraints, TSOs used more remedial actions, at a higher cost. In the coming years, the necessary compliance with the 70% requirement will likely trigger changes in remedial action costs borne by EU member states. Firstly, ensuring a significantly higher level of cross-zonal capacity, notwithstanding other measures available, will require an increasing volume of remedial actions. Secondly, the implementation of the regional methodologies for the cost-sharing of remedial actions, based on the “polluter-pays prin-ciple”, will trigger redistributions of the remedial action costs among member states.
4.4 Efficiency of current bidding zone configuration (market report pursuant to Article 34(1) of the CACM Regulation)
157 Due to the limited capacity of the EU electricity transmission infrastructure, the efficiency and functioning of wholesale electricity markets and network operational security are affected by electricity flows from source to sink. Congestion management methods and market design arrangements are intended to han-dle these flows in the most efficient way, while ensuring secure operations and providing for an appropri-ate framework for the optimal use and development of the EU electricity system.
158 The EU Electricity Target Model prescribes that structural network congestion should be handled through a bidding zone-based market structure. Electricity exchanges within a bidding zone are unlimited (and do not directly pay for congestion costs), then a combination of preventive and curative methods allows the man-agement of the underlying infrastructure limitations within and between bidding zones. Preventive methods mainly define ex-ante limitations to cross-zonal trade by calculating cross-zonal capacities and efficiently allocating them to market players. Curative methods, e.g. redispatching or counter-trading119, update the network topology and dispatch pattern when relevant, to avoid jeopardising operational security.
159 An efficient bidding zone configuration should aim to promote robust price signals for both efficient short-term utilisation and long-term development of the power system. Achieving these targets requires a defi-nition of bidding zones based on structural congestions. Structural congestions should lie between bid-ding zones. Congestions inside each bidding zone should remain limited.
160 So far, bidding zone configurations have not reflected the underlying structural congestions but rather, most commonly follow national borders. In such bidding zones, internal exchanges may lead to externali-ties. These include loop flows (LFs), ‘consuming’ capacity on cross-zonal elements. Internal exchanges may also cause distorted economic signals and economic transfers among market participants. In turn, such distortions and transfers may cause discrimination between bidding zones, as well as between in-ternal and cross-zonal flows.
161 Pursuant to Article 34(1) of the CACM Regulation, ACER is tasked to “draft a market report to assess the efficiency of current bidding zone configuration every three years”, and “shall request ENTSO-E to draft a technical report on current bidding zone configuration”.
162 This Section constitutes ACER’s second market report evaluating the impact of the current bidding zone configuration on market efficiency, in accordance with Article 34(1) of the CACM Regulation120.
163 This market report does not provide recommendations for the changes in bidding zones. Instead, it as-sesses the need for detailed studies where it identifies inefficiencies in current configurations. As a result, aspects121 such as forward markets liquidity, relevance of long-term investment signals, are beyond the scope of this market report. They should be assessed when investigating potential improvements related to bidding zone configurations. Equally, neither this report nor the technical report drafted by ENTSO-E is expected to trigger a bidding zone review.
118 See Section 4.2.
119 Remedial actions may also be applied as a preventive measure in some cases, e.g. to avoid undue discrimination of cross-zonal and internal exchanges during capacity calculation.
120 See MMR 2017 for the previous edition of the market report.
121 In line with Article 33 of the CACM Regulation.
48
ACER/CEER ANNUAL REPORT ON THE RESULTS OF MONITORING THE INTERNAL ELECTRICITY MARKETS IN 2020
164 The preparatory steps to start the bidding zone review pursuant to Article 14 of the recast Electricity Regulation are currently ongoing. With its Decision 29/2020122, issued in November 2020, ACER decided on a pan-European methodology and assumptions for the review process. A second decision is expected in the first half of 2022. It will include the approval of alternative bidding zone configurations, to be studied by TSOs during the bidding zone review.
165 The analysis presented in this Section follows a stepwise approach. Firstly, it assesses whether structural congestions are located between bidding zones. Secondly, it assesses whether significant discrimination occurred between internal and cross-zonal exchanges. Finally, it infers whether issues identified in the first two steps hampered overall bidding zone efficiency. Two criteria are used to measure these aspects. The first criterion is the amount of time when the so-called minimum 70% cross-zonal capacity target is met123. The second criterion is the application of costly remedial actions. For the purpose of this analysis, only remedial actions without cross-border relevance are considered. This is because the cross-border dimension is already captured in the first criterion124.
4.4.1 Methodology
166 The methodology applied for the second market report is mostly similar to that of the first report. The as-sessment of cross-zonal capacity was adapted in light of the requirements set by the CEP.
167 The assessment covers Europe, subject to data availability. It spans over the period 2018–2020 for the cost of remedial actions, and the year 2020 for the amount of time when the cross-zonal capacity meets the minimum 70% target.
168 The main assessment criteria125 monitor cross-zonal capacity and costly remedial actions, as described below126:
• The available cross-zonal capacity criterion assesses the share of time when the capacity made avail-able for cross-zonal trade reaches the minimum 70% target established in the CEP. The methodology and the caveats underlying the necessary calculations are the same as the one used in ACER’s report on the result of monitoring the margin available for cross-zonal electricity trade127.
• The costly128 remedial actions criterion describes the direct cost and related volume of allowing un-limited exchanges within a bidding zone while ensuring non-discrimination with cross-zonal exchang-es129. Structural network congestions should lie between bidding zones. Hence, costs related to inter-nal exchanges should remain relatively low. High costs indicate that a large part of the congestions is handled through remedial actions. This is not cost reflective nor provides relevant price signals. In order to make these values comparable across bidding zones, the information was normalised per unit demand. This indicator is not used for markets that rely on the central dispatching model130. In those cases, it is not possible to disentangle the cost of network congestion from the global dispatch.
122 See: https://acer.europa.eu/Official_documents/Acts_of_the_Agency/Individual%20decisions/ACER%20Decision%2029-2020%20on%20the%20Methodology%20and%20assumptions%20that%20are%20to%20be%20used%20in%20the%20bidding%20zone%20review%20process%20and%20for%20the%20alternative%20bidding%20zone%20configurations%20to%20be%20considered.pdf.
123 See footnote 84.
124 The Agency requested data on congestion-related remedial actions. NRAs were asked to provide the “Costs of all (redispatch/ countertrading/others) remedial actions, distinguishing whether these remedial actions were applied on cross-border relevant network elements or not”; however, this distinction was not available for all jurisdictions. Based on information collected in the previous edition of themarketreportontheefficiencyofbiddingzones,theoverwhelmingmajorityoftheremedialactionscosts(97%)aimedatensuringthat intra-zonal exchanges materialise, rather than to preserve or increase cross-zonal capacity. Consequently, the overall redispatching costs and costs related to other actions, excluding the costs incurred to solve voltage issues, represent a good proxy for the remedial actions without cross-border relevance.
125 An informative assessment is also performed on LFs and is presented in Table 20 in Annex 2.
126 The detailed specifications of the various indicators and their associated threshold values are provided in Annex 2.
127 See http://www.acer.europa.eu/electricity/market-monitoring-report/cross-zonal-capacity-70-target for the latest version of the report and ACER’s recommendation on estimating the margin available for cross-zonal trade.
128 Currently, non-costly remedial actions are much harder to track and value. Non-costly remedial actions indirectly affect costly remedial actions. Thus, there are limits to a comparison between costly and non-costly remedial actions.
129 In the current report, this approach results in taking into account the total redispatching costs reported by national regulatory authorities, to the exclusion of redispatching costs relating to voltage issues at transmission level.
130 In a central dispatching model, the dispatching is computed (and regularly updated) in order to cost-effectively ensure simultaneously power supply, required reserve levels, network constraints fulfilment. As a result, the additional cost specifically coming from network constraints is usually not available.

49
ACER/CEER ANNUAL REPORT ON THE RESULTS OF MONITORING THE INTERNAL ELECTRICITY MARKETS IN 2020
169 When assessing available cross-zonal capacity, the performance is assessed at the level of each capacity calculation region. When assessing costly remedial actions, the performance is first assessed per Mem-ber State, then aggregated for each capacity calculation region by attributing the outcome of the least performing Member State to the given capacity calculation region. It is then classified according to three categories, based on threshold values131. These categories are: 1 - poor performance, 2 - to be closely monitored, 3 - adequate performance.
170 A bidding zone configuration is considered inefficient, and should be improved, when it performs poorly on either the available cross-zonal capacity or costly remedial actions criterion. When it performs poorly on both criteria, the improvement should be investigated with priority. In this case, it is unlikely that reme-dial actions would solve the significant discrimination of cross-zonal flows. However, the cause of an issue observed in one bidding zone may be located within the zone or in another bidding zone. For example, loop flows may come from a neighbouring bidding zone. As a result, bidding zone improvements should be investigated at least at regional level.
4.4.2 Results
171 Table 2 details regional performances with respect to the available cross-zonal capacity compared to the minimum 70% target. Figure 22 shows the relative performance of Member States with respect to the use of costly remedial actions.
172 The average values displayed in Table 2 are calculated according to the following two steps. Firstly, the percentage of hours when the 70% target is met is estimated at the level of capacity calculation area for each MS, as defined in ACER’s reports on the MACZT. Then the values are aggregated at the level of ca-pacity calculation regions in the form of a capacity-weighted average. The weight is calculated based on the maximum exchange in the capacity calculation area over a year as a proxy for capacity.
Table 2: Regional performances with respect to the available cross-zonal capacity- percentage of time when the 70% minimum target was met (%) - 2020
CCR Capacity-weighted percentage of time when the 70% min. target is met (%) 70% performanceCore 12% poor
Italy North 48% to be monitoredSEE 8% poorSWE 51% to be monitored
Source: ACER calculation based on ENTSO-E dataNote: Poor performance corresponds to the capacity-weighted percentage being below 40%, performance to be monitored corresponds to the capacity-weighted percentage being 40% and 80%, and adequate performance corresponds to the capac-ity-weighted percentage being above 80%. There is no analysis in the Nordic and Baltic regions due to insufficient input data. Absent AC borders, the assessment of cross-border capacity does not apply to the GR-IT region.
131 See footnote 126.

50
ACER/CEER ANNUAL REPORT ON THE RESULTS OF MONITORING THE INTERNAL ELECTRICITY MARKETS IN 2020
Figure 22: National performances with respect to the use of costly remedial actions – evaluation of the cost of remedial actions per unit of demand – 2018–2020
Source: NRAs, ENTSO-E and ACER calculations (2020). Note: Poor performance corresponds to the cost of remedial actions per unit of demand being above 1.0 euro/MWh, performance to be monitored corresponds to the cost of remedial actions per unit demand being between 0.2 and 1.0 euro/MWh, and adequate performance corresponds to the cost of remedial actions per unit demand being below 0.2 euros/MWh. The detailed qualification methodology is described in Annex 2. As the central dispatching model is applied in Greece, Ireland, Italy and Poland, costs specifically linked with remedial actions are not avail-able; as a result, these jurisdictions are depicted in dark grey.
173 Table 2 and Figure 22 lead to the following conclusions. Overall, no capacity calculation region has achieved adequate performance on the levels of cross-zonal capacity required by the binding minimum 70% target132. Apart from South West Europe, all capacity calculation regions performed poorly, reaching the target no more than 50% of the time. On remedial actions, fifteen countries performed adequately. Still, three countries, Austria, Germany and Lithuania, performed poorly on remedial actions.
174 Based on both the available cross-zonal capacity criterion and the costly remedial action criterion, Table 3 brings together the recommendations for improvements in the bidding zone configuration in Europe for each capacity calculation region. The table also prioritises the improvements to be investigated, and brings in-sights on the issues that possibly trigger the need for such improvements.
132 In order to assess bidding zones on equal footing, the assessment used as a sole reference the 70% target and did not take account of transitory measures, i.e. derogations and action plans.
Poor To be monitored Adequate

51
ACER/CEER ANNUAL REPORT ON THE RESULTS OF MONITORING THE INTERNAL ELECTRICITY MARKETS IN 2020
Table 3: Need for investigating bidding zone improvements
Region name 70% performance Remedial action cost performance Potential underlying issue
Core Poor Poor Internal congestions in Germany and, to a lesser extent, in Austria, the Netherlands and Poland. Large LF volumes.
Italy North To be monitored Poor Internal congestions in Austria. Significant LF volumes between Austria, Italy and Slovenia.
SWE To be monitored To be monitored Internal congestion in Portugal and Spain.Nordic N.A. AdequateSEE Poor Adequate
Baltic N.A. Poor Lack of information prevented an assessment of cross-zonal capacity in the Baltic region.
Source: NRAs, ENTSO-E and ACER calculations (2021).Note: The analysis is limited based on limited data made available to ACER. The internal congestions identified as potential underlying issues in the last column are inferred based on the costs of remedial actions. The overwhelming majority of such costs is caused by congestions on network elements that are not cross-border relevant. A detailed assessment of the cost of remedial actions and loop flows is available in Table 20 in Annex 2. For interconnectors (Channel, Hansa), no analysis was performed as (i) there is no visibility on the region causing the performance on remedial actions and (ii) absent AC borders, the assessment of cross-border capacity does not apply. For Greece-Italy, no analysis was performed as (i) central dispatch for remedial actions applies in both countries and (ii) absent AC borders, the assessment of cross-border capacity does not apply.
175 The bidding zone review envisaged in the CACM Regulation and the recast Electricity Regulation is the obvious but difficult approach to trigger improvements in the delineation of bidding zones. A bidding zone review is challenging, technically complex and politically sensitive. However, it may come along with significant benefits for all EU consumers. For example, it could ensure the cost-effectiveness of network investments and fostering the integration of new low-carbon technologies.
176 Overall, the table indicates that investigations should be carried out in most regions. Investigations should be conducted with priority in the Baltic, Core and Italy North regions, because of general low cross-zonal capacity and high costs of remedial actions. In particular, Table 3 confirms the poor performances of the Core region, where improvements are still to come, following delays in implementing the common capac-ity calculation methodology, as well as derogations and action plans postponing the attainment of the binding minimum 70% target.
177 The CEP identified insufficient cross-zonal capacity and inefficient bidding zone configurations as two of the main barriers to the integration of electricity markets. Despite some improvement since 2017, this second edition of the market report confirms the need for a bidding zone review, which is currently in its preparatory phase.
178 The pan-European bidding zone review methodology adopted by ACER in November 2020 aims at ensur-ing a high level of pan-European consistency and coordination. The methodology entails regular stake-holders’ and regulators’ involvement and oversight. The upcoming second decision will include the ap-proval of alternative bidding zone configurations to be studied by TSOs during the bidding zone review, which should start in 2022.
52
ACER/CEER ANNUAL REPORT ON THE RESULTS OF MONITORING THE INTERNAL ELECTRICITY MARKETS IN 2020
4.5 Use of cross-zonal capacity across timeframes
179 This Chapter reports on the progress made regarding the efficient use of available cross-zonal capacities in the forward (Subsection 4.5.1), DA (Subsection 4.5.2), ID (Subsection 4.5.3) and balancing (Subsection 4.5.4) timeframes across Europe. Subsection 4.5.4.2 reports on the latest developments of the initiatives for the exchange and sharing of balancing services, and provides an overview of the level of prices and of the lead time for procuring reserves in Europe.
4.5.1 Forward market
180 As shown in previous editions of the MMR, there is a limited number of liquid forward markets in Europe. Therefore, cross-border access to these markets is important. Cross-border access to forward markets depends on the market design. In Europe, two forward market designs have emerged.
181 The first design was implemented in the Nordic and Baltic countries and within Italy in the context of multi-zone hubs. This design relies mainly on the market and a variety of products developed through various market platforms. This design contains a set of hedging contracts for a group of bidding zones. These contracts are linked to a hub price, or system price. In the case of the Nordic and Baltic areas, the system price represents a physically unconstrained DA price. In Italy, the hub price somewhat represents an average DA price within the group of zones constituting the Italian multi-zone hub.
182 Market participants hedge the bidding zone price risk by combining a forward product with a contract for differences. The forward product hedges the hub price. The contract for differences covers the difference between the hub price and the bidding zone price. Market participants particularly need contracts for dif-ferences when the correlation between hub and bidding zone prices is poor.
183 The second design was implemented in nearly all MSs in Continental Europe in the context of single-zone hubs. For each bidding zone, this design relies on a set of hedging contracts, which are linked to the DA clearing price of this bidding zone.
184 These contracts may be sufficient to hedge the price risk of market participants. However, market par-ticipants in a given bidding zone may want to hedge their exposure to risk using a hedging contract of a neighbouring bidding zone. This could be a sufficient hedge if prices in the two zones are highly cor-related. Otherwise, they would need an additional hedging tool to cover the price differential between the two zones. In this context, the second design gives an additional and specific role to TSOs. They are responsible for calculating long term capacities in a coordinated way and for auctioning (either physical or financial) transmission rights (PTRs or FTRs), enabling market participants to hedge against the specific risk of short term zonal price differentials133.
185 The FCA Regulation aims in part to facilitate long-term cross-zonal hedging opportunities for market participants by means of forward capacity allocation. In particular, article 49 of the FCA Regulation sets the principle of a ‘single allocation platform’ as a European platform established by all TSOs for forward capacity allocation. Article 51 of the FCA Regulation sets requirements for harmonised allocation rules for long-term transmission rights. These requirements were developed in ACER’s Decision No 14/2019134.
186 The outcome of the implementation of these requirements is presented in Figure 23, displaying cross-zonal hedging opportunities offered and various tools used at the different bidding zone borders.
133 In Italy, following the first design, the TSO issues zone-to-hub LT transmission rights.
134 See Annex I of Decision No 14/2019 of the European Union Agency For The Cooperation Of Energy Regulators of 29 October 2019 on the TSOs’ proposal for amendment of the harmonised allocation rules for long-term transmission rights, available at: https://documents.acer.europa.eu/Official_documents/Acts_of_the_Agency/ANNEXESTOTHEDECISIONOFTHEAGENCYFORTHECOOPERATIO4/Annex%20I_HAR%20amendment%20decision.pdf.

53
ACER/CEER ANNUAL REPORT ON THE RESULTS OF MONITORING THE INTERNAL ELECTRICITY MARKETS IN 2020
Figure 23: Forward capacity allocation - status of the implementation as of 1 January 2021
Source: ACER.Note: The financial instruments in place in the Nordic countries are also theoretically available in EE and LT. However, in prac-tice, there is no sufficient liquidity to allow their use.
187 Currently, on all borders except in the Baltics135, and between Poland and Sweden, market participants have access to some form of instrument related to forward capacity. Nordic countries and Italy, for its inner borders, retained the financial instruments developed following the multi-zone hub design. All other countries rely on long term transmission rights (LTTRs).
188 On all of the borders with LTTRs, auctions related to forward capacity allocation are conducted by JAO136 performing the function of the single allocation platform. Since the go-live of the Interim Coupling Pro-ject137, all bidding-zone borders with LTTRs but the SI-HR border will offer LTTRs in the form of Financial Transmission Rights (FTRs).
189 Market participants in a given bidding zone gained easier access to hedging contracts of neighbouring bidding zones. However, this access is not sufficient to guarantee sufficient hedging opportunities. Such guarantee stems from a viable combination of sufficient forward liquidity in local market, access to cross-border hedging, and a functioning forward market design. Despite significant progress in the increased availability of LTTRs, in the form of FTRs, and in a centralised manner, liquidity remains modest for a large part of Europe, as detailed in Section 5.1.
135 Currently, there is an instrument in place only at the border between Estonia and Latvia and in one direction only.
136 See http://www.jao.eu/main.
137 June 2021. See http://www.nemo-committee.eu/sdac.
Transmission rights based on harmonised allocation rules on a single allocation platform (22)
Transmission rights based on harmonised allocation rules (8)
Transmission rights to be introduced (2)
Financial instruments* (17)
Other instruments (5)
No instruments** (6)

54
ACER/CEER ANNUAL REPORT ON THE RESULTS OF MONITORING THE INTERNAL ELECTRICITY MARKETS IN 2020
4.5.2 Day-ahead markets
190 In recent years, significant progress has been made towards implementing the electricity target model (ETM) for the DA market timeframe. The ETM foresees a single DA coupling at European level. This cou-pling will enable cross-zonal capacity to be used in the ‘right economic direction’138, when prices differ across a given bidding-zone border139. Two indicators illustrate the progress made towards market inte-gration, as well as the potential for further progress. Figure 24 shows the level of efficient use of electric-ity interconnectors in the DA market timeframe across all European borders. Figure 25 shows the overall estimated welfare gains to be obtained from extending DA market coupling to all EU borders.
191 For the purpose of the analysis in Figure 24, efficient use is defined as the percentage of the available NTC used in the ‘right economic direction’ in the presence of a significant price differential (>1 euro/MWh). The blue bars in Figure 24 mark the coupled borders. They represent two thirds of the European borders, i.e. 25 European countries, and show 100% efficiency140.
192 For the remaining non-coupled borders, the difference between 100% and their own level of efficiency in Figure 25 indicates the potential for improvement. Overall, in 2020, the efficient use of cross-zonal capac-ity in the DA was measured at 87%141.The finalisation of the DA market coupling on these borders in Europe will lift the level of efficient use of cross-zonal capacity in the DA timeframe. In turn, it will raise the overall economic efficiency of European electricity wholesale markets.
Figure 24: Level of efficient use of cross-zonal capacity in the DA market timeframe, per border in Europe – 2020 (%)
Source: ACER calculations based on ENTSO-E data.Note: This figure contains data on all European bidding zone borders (except cross-zonal borders within countries and techni-cal profiles), aggregated into MS borders for convenience. The borders that were not included in previous MMRs are indicated with an asterisk (*). For borders where specific data on DA schedules was not available, aggregated data (DA plus ID) on schedules was used. Finally, the level of efficiency on CWE borders, where NTC values are no longer used since the application of FBMC, is assumed to be 100%. The GR-IT border, marked as non-coupled, was coupled in December 2020.
138 From low- to high- price areas. This definition of efficiency is a slight simplification of the welfare optimisation problem. In some circumstances, non-intuitive flows (from higher to lower price areas) may be beneficial if the welfare economic cost of a non-intuitive flow is smaller than the welfare economic benefit of the congestion relieved by such a non-intuitive flow. These situations are not analysed in this Section.
139 For more information, please see the methodological paper on ‘Benefits from day-ahead and intraday market coupling’, available at: https://www.acer.europa.eu/en/Electricity/Market%20monitoring/Documents/ACER%20Methodological%20paper%20-%20Benefits%20from%20day-ahead%20and%20intraday%20market%20coupling.pdf.
140 Since 1 January 2021, explicit allocation has applied to the borders with the UK. On some coupled-borders, the level of efficiency is reportedtobebelow100%.Thismaybeeitherduetotheexistenceofnetwork lossesfactors(e.g.onsomedirectcurrent (DC)interconnectors) which were not factored in the calculations underlying the figure, or due to occasional discrepancies between the reported DA NTC value and the actual offered capacity.
141 This value is not directly comparable with the level of efficiency reported in preceding MMRs, which was slightly higher. In previous MMR editions, some EU borders were not included in the analysis due to missing data. As most of the borders for which data are missing have not yet been coupled, the overall level of efficiency in the use of cross-zonal capacity for the whole EU is lower than the level reported in preceding MMRs.
%
100
60
20
80
40
0
AT - S
ICZ
- SK
DE/LU
- DK2
DE/LU
- SE4
DK2 -
SE4
EE - F
IEE
- LV
ES - F
RFI
- SE1
FI - S
E3HR
- SI
HU - S
KIT
NORT
H - SI
LT - L
VLT
- SE4
NO1 -
SE3
NO3 -
SE2
NO4 -
SE1
NO4 -
SE2
ES - P
TAT
- IT N
ORTH
FR - I
T NOR
THGB
- NL
NL - N
O2DK
1 - NO
2FR
- GB
HU - R
ODE
/LU - D
K1DK
1 - SE
3GB
- SEM
GB - N
IPL
- SE4
LT - P
LCH
- IT N
ORTH
AT - H
UGR
- IT S
OUTH
BG - G
RCH
- FR
CZ - P
LCH
- DE/L
UAT
- CH
AT - C
ZCZ
- DE T
ENNE
THR
- HU
BG - R
OCZ
- DE 5
0Hert
zPL
- SK
Not coupledCoupled

55
ACER/CEER ANNUAL REPORT ON THE RESULTS OF MONITORING THE INTERNAL ELECTRICITY MARKETS IN 2020
193 Second, Figure 25 shows that the overall estimated welfare gains to be obtained from extending DA mar-ket coupling to all EU borders, including the Swiss ones, amount to over 150 million euros per year. The remaining eight non-coupled EU borders are AT-CZ, AT-HU, BG-RO, CZ-DE, CZ-PL, DE-PL, PL-SK and HR-HU.
194 Since June 2021, the borders between the 4MMC and the MRC regions, i.e. AT-CZ, AT-HU, CZ-DE, CZ-PL, PL-SK and DE-PL have been coupled by introducing Net Transmission Capacity (NTC) based implicit capacity allocation on the abovementioned six borders142. The next step consists of the introduction of the FB capacity calculation method in the framework of the Core FBMC project.
195 Among the non-coupled borders, the largest social welfare gains could still be obtained on the Croatian and Bulgarian borders143. Bulgaria is coupled with SDAC since May 2021 at the BG-GR border144. The HR-HU border will be included in the coupling with the go-live of the CORE FB project.
Figure 25: Estimated social welfare gains still to be obtained from further extending DA market coupling per border – 2018–2020
Source: ACER calculations based on ENTSO-E, NRAs and Vulcanus data.Note: Only non-coupled borders are shown. The borders within the Core (excl. CWE) region with ‘multilateral’ technical profiles are not included in this figure, because the methodology applied to the other borders, based on NTC values, is not applicable to these (excl. CWE) borders for this calculation (DE/LU-CZ, DE/LU-PL, PL-SK).
196 In conclusion, DA market coupling remains a crucial element in the integration of European electricity markets. The efficient use of interconnectors did not significantly increase in the last five years. The main reason is the limited incorporation of new borders to market coupling in recent years. In 2020, the only change was the coupling of Greece. Welfare gains are expected for 2021 with the significant extension of implicit DA capacity allocation methods to new European bidding zone borders.
4.5.3 Intraday markets
197 Similarly to the previous editions of the MMR, this section assesses the level of economic efficiency in the use of available cross-zonal capacity in the ID market timeframe145. It analyses the evolution of cross-zonal intraday exchanges and the level of utilisation of cross-zonal capacity in the ID timeframe when it has an economic value (>1 euro/MWh).
198 Figure 25 confirms the trend observed last year. In absolute terms, aggregated cross-zonal volume nomi-nated in the ID market timeframe across the European network visibly increased after the go-live of the SIDC. This upward trend in nominations is consistent with the increase in ID-traded volumes observed in most MSs over the same period (see Section 5.3).
142 The first trading day, with delivery was 18 June 2021. See http://www.nemo-committee.eu/sdac.
143 Further, as mentioned in the last year’s edition of the MMR, a relevant part of the benefits will be delivered when the borders between Switzerland and the EU are coupled. However, this does not appear to be possible until the conditions envisaged in the CACM Regulation are met: the implementation of the main provisions of Union electricity market legislation in the Swiss national law and the conclusion of an intergovernmental agreement on electricity cooperation between the European Union and Switzerland.
144 ThecouplingofBG-ROisexpectedinOctober2021.
145 The level of efficiency is defined as the absolute sum of net nominations and the level of utilisation of cross-zonal capacity in the ID timeframe when it has an economic value (>1 euro/MWh).
Millio
n eu
ros
50
40
20
30
10
0
2018 2019 2020
HR - HU CZ - PL BG - RO CZ - DE 50Hert
LT - PL BG - GR CH - FR CZ - DE TENNET
AT - CZ CH - IT NORTH
AT - CH CH - DE/LU AT - HU GR - IT SOUTH
56
ACER/CEER ANNUAL REPORT ON THE RESULTS OF MONITORING THE INTERNAL ELECTRICITY MARKETS IN 2020
Figure 26: Absolute sum of net ID nominations at relevant EU borders – 2018–2020 (TWh)
Source: ACER calculations based on ENTSO-E data.Note: This figure contains data for all European bidding zones with ID markets. No comparison should be made with the analy-sis performed in previous MMRs, where the list of borders analysed was shorter due to unavailability of the data.
199 Despite the increasing trend of ID-traded volumes and cross-zonal nominations in the ID market time-frame, the efficiency146 of the utilisation of ID cross-zonal capacity remains at 63 %. This efficiency is sig-nificantly lower than the DA market timeframe (an average of 87% in 2020, see Figure 24), but about four percentage points higher than in 2019. This increase can be largely attributed to the launch of the second wave of SIDC, in late 2019, which included seven additional intraday markets147.
200 In addition, the analysis of individual borders confirms that cross-zonal capacity was allocated more efficiently by using implicit allocation methods (79% efficiency) rather than explicit or other allocation methods (55% efficiency)148.
201 Overall, this analysis suggests that a part of the potential benefits from the use of existing infrastructure in the ID market timeframe remains untapped across Europe. The additional welfare benefits from a more efficient use of ID cross-zonal capacity across Europe are estimated at over 50 million euros annually149. However, the introduction of the second wave of SIDC at the end of 2019, the anticipation of a third wave foreseen in the third quarter of 2021150 and, finally, the implementation of pan-European ID auctions as envisaged in ACER Decision 01/2019151, are expected to further increase the economic efficiency in the use of cross-zonal capacity in the ID timeframe.
4.5.4 Balancing markets
202 This Subsection provides an update on the status of balancing markets integration. To this end, firstly, it provides an overview of prices and other features of balancing services (energy and capacity) across Europe, (Subsection 4.5.4.1). Secondly, the subsection includes an overview of the exchanges of these services across EU borders (Subsection 4.5.4.2).
146 SimilartothestudydoneinpreviousMMRversions(see2017MMR,Figure36),theintradayefficiencyisdefinedasthepercentageofhours where the intraday capacity is “sufficiently” used in the economic direction (based on threshold values). For more details, see the methodological paper in footnote 139. Finally, the analysis was done for a selection of borders, similar to the study done in previous MMR versions(see2017MMR,Figure36).
147 The SIDC was extended on 19/20 November 2019 to include Bulgaria, Croatia, the Czech Republic, Hungary, Poland, Romania and Slovenia,over12borders(AT-CZ,AT-SI,AT-HU,BG-RO,CZ-DE,CZ-PL,DE-PL,SI-HR,HR-HU,HU-RO,LT-PL,PL-SE).
148 The analysis of border-specific intraday efficiency followed the approach mentioned in footnote 146. It covered the following borders: implicitBE-FR,CH-FR,CH-ITNorth,DK1-DK2,DK1-NO2,ES-PT,NL-NO2,SE1-SE2,SE2-SE3;explicitCH-FR,DE/LU-FR,FR-ITNorth.
149 For more information on how to estimate welfare benefits from increased efficiency in the use of ID cross-zonal capacity see the methodological paper in footnote 139. The actual welfare benefits from ID cross-zonal trade may be considerably higher as both intraday markets liquidity and the intraday capacity offered by TSOs via capacity recalculation is expected to increase in the coming years.
150 The third wave is expected to include Italy and Greece. More information on the SIDC integration is available at: https://www.entsoe.eu/network_codes/cacm/implementation/sidc/, and http://www.nemo-committee.eu/sidc.
151 ACER Decision 01/2019 of 24 January 2019 establishing a single methodology for pricing intraday cross-zonal capacity, available at: https://documents.acer.europa.eu/Official_documents/Acts_of_the_Agency/Individual%20decisions/ACER%20Decision%2001-2019%20on%20intraday%20cross-zonal%20capacity%20pricing%20methodology.pdf.
TWh
5.0
4.0
2.0
3.0
1.0
01 2 3 4 5 6 7 8 9 10 11 12
2018
SIDC1st wave
SIDC2nd wave
2019 20201 2 3 4 5 6 7 8 9 10 11 12 1 2 3 4 5 6 7 8 9 10 11 12
Annual sum 16.96 TWhAnnual sum 16.96 TWh
Annual sum 49.23 TWhAnnual sum 49.23 TWh
Annual sum 36.59 TWhAnnual sum 36.59 TWh

57
ACER/CEER ANNUAL REPORT ON THE RESULTS OF MONITORING THE INTERNAL ELECTRICITY MARKETS IN 2020
4.5.4.1 Overview of prices and other features of balancing services (capacity and energy) across Europe
203 The EB Regulation, which entered into force in 2017152, lays down detailed rules on electricity balancing. It harmonises the procurement, activation and exchanges of balancing energy. It further harmonises the procurement and exchange of balancing capacity and the sharing of reserves, including the allocation of cross-zonal capacity. Finally, it strives to implement an integrated balancing market, where TSOs will procure exchange and use both balancing energy and capacity in an economically efficient and market-based manner.
204 While waiting for major European projects and platforms initiated by the EB Regulation to be introduced more widely153, large disparities in balancing energy and balancing capacity prices persisted in 2020 (see Figure 27 and Figure 28 for automatically activated frequency restoration reserves (aFRRs)).
Figure 27: Weighted average prices of balancing energy activated from aFRRs (upward and downward acti-vations) in a selection of EU markets – 2020 (euros/MWh)
Source: ACER calculations based on ENTSO-E data.Note: The values shown in the figure refer to the prices of activated balancing energy in a given market area, irrespective of whether the activations aim to cover the needs for balancing in the same or in neighbouring market areas.
152 See footnote 38.
153 See Subsection 4.5.4.2.
ROSKNL
DE/LUHU
ITATSI
BEPLDKPTFI
ESFRCHSENO
euros/MWh-30 -15 0 15 30 45 15012090 1351057560
Downward Upward

58
ACER/CEER ANNUAL REPORT ON THE RESULTS OF MONITORING THE INTERNAL ELECTRICITY MARKETS IN 2020
Figure 28: Average prices of balancing capacity (upward and downward capacity from aFRRs) in selected EU markets – 2020 (euros/MW/h)
Source: ACER calculations based on NRAs data.
205 Across Europe, average prices of activated balancing energy from aFRRs have followed similar trends in most countries in 2020. However, prices remain very different in each MS, as shown in Figure 27. Com-pared to 2019, the price for upward energy decreased for all countries, except the Czech Republic, Ger-many and Netherlands, which means that this service was in average less costly to TSOs. Conversely, for all countries except Slovenia, the price for downward energy also decreased, meaning that this service was more expensive for TSOs to procure. In particular, there were more occurrences of negative aver-age prices for downward energy. These two trends may result from lower electricity demand during the year 2020. Fewer flexible generators were possibly running, or running below full capacity, compared to previous years. More of them were available for upward adjustments, and less for downward adjustments.
206 The average prices of balancing capacity for aFRRs for 2020 are similar to 2019 for a majority of countries, with some exceptions. Austria, Switzerland, Germany, Norway and Romania experienced slight decreas-es for both upward and downward capacity. In Sweden, the price for downward capacity significantly dropped from 24 to 14 euros/MWh. Conversely, the prices in Denmark skyrocketed in 2020, both for upward and downward capacity, with prices three times higher than in 2019. This is linked to the fact that since 1 January 2020, Denmark is procuring its aFRR capacity in DK1, while it was previously delivered at lower prices from Norway with a reservation on the interconnector between NO2 and DK1.
207 Figure 29 displays the overall costs of balancing154 for a selection of countries for which sufficient data was available.
208 Compared to 2019, when a decrease in balancing capacity procurement costs was observed in most countries, 2020 presents a more nuanced picture. It is overall stable for FCRs, with a decrease for Swit-zerland and for the Nordic region, driven by the decrease of capacity prices in Sweden. In addition, there has been a slight decrease in the price of FCR capacity for all countries that were part of the common procurement of the FCR cooperation in 2020. This is possibly linked to the switch to the day-ahead auc-tion in place since July 2020, which fosters the competition. For FRRs and RRs, increases were observed for the Netherlands (driven by costs related to FRRs, i.e. aFRRs and mFRRs), in Slovakia (driven by FRRs) and in Hungary (driven by the costs of aFRRs). The greatest decreases in balancing capacity procurement costs for FRRs and RRs were observed again in the Nordic region, and in Germany, driven by FRR, and to a lesser extent in Austria.
154 See how balancing costs are defined for the purpose of this analysis in the note below Figure 29.
SKHU
DK1FI
SECZHRNLBESI
FRESPTRONOCHGRDEAT
euros/MW/h30 25 20 15 10 5 302010 251550
UpwardDownward

59
ACER/CEER ANNUAL REPORT ON THE RESULTS OF MONITORING THE INTERNAL ELECTRICITY MARKETS IN 2020
209 For the costs of energy, the picture is also diverse across Europe. Significant drops are observed in Swit-zerland, the Czech Republic, Slovakia and Slovenia (costs more than halved). Germany has experienced a rise of 80%, while a two-time increase was observed in the Nordic region, due to increase in all Nordic countries but Norway and in the Netherlands. The increase of the energy cost in the Nordic region can partly be explained by an increase in the volumes activated, while the volume of energy activated in the Czech Republic, Slovakia and Slovenia was lower than in 2019. The increase of costs for the Netherlands and Germany is consistent with the increase in aFRR energy prices observed in these two countries in paragraph 203.
210 Overall, the conclusions drawn from equivalent figures in preceding MMRs are still valid. In most MSs, the largest share of balancing costs continued to be the procurement costs of balancing capacity. It is thus im-portant to optimise balancing capacity procurement costs. It can also be observed that, among the coun-tries presented, the three countries with higher capacity costs (Slovakia, Hungary and the Czech Republic) are also the countries with the highest share of capacity procured on a long-term and monthly basis155.
Figure 29: Overall costs of balancing (capacity and energy) over national electricity demand in selected European markets – 2020 (euros/MWh)
Source: ACER calculations based on NRAs data and ENTSO-E data.Note: The overall costs of balancing are calculated as the procurement costs of balancing capacity and the costs of activating balancing energy (based on activated energy volumes and the unit cost of activating balancing energy from the applicable type of reserve).For the purposes of this calculation, the unit cost of activating balancing energy is defined as the difference between the bal-ancing energy price of the relevant product and the DA market price.
211 The recast Electricity Regulation reasserts156 the principle established in the EB Regulation, that balancing capacity procurement should be performed on a short-term basis157. This principle aims to maximise the participation of flexible resources in short-term energy markets, to improve liquidity and competition. In particular, the day-ahead procurement of capacity advocated in the regulation158 allows for an efficient arbitrage between day-ahead and balancing capacity markets. The main benefit of this requirement is a sounder formation of close-to-real-time prices, which will better reflect the instantaneous needs of the system.
212 Following the implementation of the above-mentioned provisions, the share of reserve capacity con-tracted as balancing capacity in day-ahead or intraday timeframes is increasing. Figure 30 and Figure 31 show that the lead time for procuring balancing capacity has greatly evolved since 2019, in particular for FCRs and mFRRs. Overall, the day-ahead has become the predominant contracting period. Figure 30 shows that around 75% of the capacity from FCRs, aFRRs and RRs is already contracted on a day-ahead basis. It represents 59% for mFRRs.
155 See Figure 31.
156 Article6(9)oftherecastElectricityRegulation:“Contractsforbalancingcapacityshallnotbeconcludedmorethanonedaybeforetheprovision of the balancing capacity and the contracting period shall be no longer than one day”.
157 Article32(2)ofEBRegulation:“Theprocurementprocessshallbeperformedonashort-termbasistotheextentpossibleandwhereeconomically efficient”.
158 Articles6(9)to6(11)oftherecastElectricityRegulation.Aderogationcanbegranted,butmustbelimitedintime,andminimumquotasof balancing capacity contracted on at least a day-ahead basis have to be reached in any case.
euro
s/MW
h
8
6
3
7
5
1
4
2
0
Capacity (FCR only) Capacity (FRR+RR) Energy
SK HU RO CZ SI NL BE Nordic PT ES CH FR PL DE AT
60
ACER/CEER ANNUAL REPORT ON THE RESULTS OF MONITORING THE INTERNAL ELECTRICITY MARKETS IN 2020
213 One third of the FCR capacity in Europe that was contracted on a weekly basis in 2019 has been mainly contracted in day-ahead in 2020. It is the result of changes in the FCR cooperation project. While in early 2019, the FCR capacity was auctioned on a weekly basis, auctions started being held two days before delivery on 1 July 2019. Finally, since 1 July 2020, the FCR capacity is auctioned daily. The reduction of lead time for mFRRs procurement in Austria, Belgium, Switzerland, the Czech Republic, the Netherlands and Romania, are related to changes in the design of national balancing market, since a European platform is not yet in place.
214 Figure 31 shows that at the MS level, significant improvements have been operated since 2019159. As of 2019, Poland, and Portugal and Spain (for the part of its capacity procured on a market-based man-ner) were already in line with the recast Electricity Regulation’s requirements. In 2020, Austria, Belgium, Germany, Greece, the Netherlands, Romania and Sweden also procured between 70% and 100% of their reserves on a daily basis. In other jurisdictions (Bulgaria, Croatia, Hungary, Lithuania, Slovenia, Slovakia, and Switzerland), less than 15% of reserves were procured on a day-ahead basis, and significant efforts are needed to align with the requirements of the recast Electricity Regulation.
Figure 30: Repartition of the procurement lead time of each type of reserve in selected European markets – 2020 (%)
Source: ACER calculations based on NRAs data.Note: This figure is based on the countries mentioned in Figure 31. The category ‘other’ is for: regulated contracts for Romania, and mandatory provision of FCR (i.e. there is no FCR market) by all generators connected to the grid for Spain. The category ‘day-ahead’ also includes the procurement of FCR in D-2 that occurred until mid-2020, before the go-live of the day-ahead contracting.
Figure 31: Repartition of procurement lead time of each MS, for all types of reserve (FCR, aFRR, mFRR, RR) – 2020 (%)
Source: ACER calculations based on NRAs data.Note: In Italy, procurement occurs in the afternoon of the day-ahead, and is fine-tuned in intraday. The category ‘other’ is for: regulated contracts for Romania, and mandatory provision of FCR (i.e. there is no FCR market) by all generators connected to the grid for Spain. The category ‘day-ahead’ also includes the procurement of FCR in D-2 that occurred until mid-2020, before the go-live of the day-ahead contracting.
159 See figure 31 of last year’s MMR.
% o
f vol
ume
100
80
60
40
20
0FCR aFRR mFRR RR
Year and long-termMonth to half-yearWeekDay ahead Other
% o
f vol
ume
100
80
60
40
20
0
Year and long-termMonth to half-yearWeekDay ahead Other
AT BE BG CH CZ DE DK1 ES FI FR GR HR HU LT NL NO PL PT RO SE SI SK

61
ACER/CEER ANNUAL REPORT ON THE RESULTS OF MONITORING THE INTERNAL ELECTRICITY MARKETS IN 2020
4.5.4.2 Cross-zonal exchange of balancing services
215 This subsection consists in an overview of the exchanges of energy and capacity balancing services across EU borders. Figure 32 shows the share of activated balancing energy (left, for all types of re-serves) and balancing capacity (right, for FCRs) procured cross-border compared to the system’s needs. Additionally, Figure 33 shows the application of imbalance netting as a percentage of the total needs for balancing energy.
Figure 32: EU balancing energy activated cross-border as a percentage of the amount of total balancing en-ergy activated to meet national needs (left) and EU balancing capacity contracted cross-border as a percentage of the system requirements of reserve capacity (upward FCRs) (right) – 2020 (%)
Source: ACER calculations based on NRAs data. Note: These figures include only the countries that reported some level of cross-zonal exchange. The Baltic countries are part of a cooperation project for the exchange of balancing services, and activate balancing energy to balance the Baltic system as a whole. The actual exchange of balancing energy across borders within the Nordic region is not included in, because the Nordic electricity systems are integrated and balanced as a single load frequency control (LFC) area. Therefore, the cross-zonal exchange of balancing energy cannot be disentangled from imbalance netting across borders.
Figure 33: Imbalance netting as a percentage of the total need for balancing energy (explicitly activated or avoided by means of netting) from all types of reserves in national balancing markets – 2020 (%)
Source: ACER calculations based on NRAs data. Note: This figure includes only the countries that reported some level of cross-zonal exchange. The Nordic electricity systems are integrated and balanced as a single LFC area. The percentage of total need of balancing energy (imbalance netting and exchanged balancing energy, which cannot be disentangled) procured abroad for Nordic countries is 87 %, but is not strictly comparable to the other countries. In the Baltic countries, that are balanced as a single LFC block, imbalance netting is applied and only the non-netted imbalance are covered.
%
80
60
30
70
50
10
40
20
0
EU balancing energy activated cross-border EU balancing capacity contracted cross-border
AT FR DE PT ES SI CZ HR BE NL SK DE AT FR CH
%
80
60
30
70
50
10
40
20
0AT CZ SK BE DE HR SI CH HU FR PL IT ES PT

62
ACER/CEER ANNUAL REPORT ON THE RESULTS OF MONITORING THE INTERNAL ELECTRICITY MARKETS IN 2020
216 In 2020, the level of exchange of balancing energy (Figure 32, left) increased significantly for Austria and Germany (respectively from 32% to 72% and from 8% to 17%), mainly thanks to exchanges of bal-ancing energy from aFRRs between these two countries. Portugal and, to a lesser extent, France also experienced an increase (respectively from 4% to 8% and from 16% to 17%). Some other countries such as Spain, Slovenia, the Czech Republic and Croatia seem to start implementing exchanges, but they only accounted for 1% or less of their total needs in 2020. The increase in France, Spain and Portugal is linked to their introduction to the TERRE project, which allows TSOs to exchange RRs energy (see paragraph 218), in the course of 2020. Finally, despite the enhanced geographical scope of the FCR cooperation in 2020, the level of exchange of balancing capacity for FCRs (Figure 32, right) have not increased, except for Germany (from 1% to 8%).
217 Compared to previous years, the level of imbalance netting in 2020, displayed in Figure 33, has risen significantly for most countries. The most important increases are in Austria (+41%), Hungary (+80%), Slovakia (+72%), Slovenia (+34%) and Croatia (+38%). Imbalance netting in this region has probably been fostered by the inclusion of Slovenia in the IGCC cooperation in 2019, and of Hungary and Slovakia in 2020. Some increases are also noticeable in Switzerland (+9%), the Czech Republic (+6%), and Germany (15%). Finally, the gradual inclusion in 2020 of Italy, Poland, Portugal and Spain to the IGCC cooperation led to the introduction of imbalance netting volumes in these countries. These are likely to increase in the coming year.
218 As mentioned in Subsection 4.5.4.1, further improvements in cross-zonal exchanges for balancing servic-es are expected in the coming years. To accelerate the integration of balancing markets, several initiatives have been launched in Europe stemming from the implementation of the EB Regulation. These projects have proven useful to stimulate the exchanges of balancing services in Europe. Some of them will need to adapt to the EB Regulation requirements, and become part of the reference projects. This will guarantee a greater efficiency and better synergies across Europe. Others have already done so (e.g. the IGCC and TERRE). The status of the most relevant projects related to these initiatives is outlined below.
• The Frequency Containment Reserves (FCR) cooperation project160 for procuring and exchanging balancing capacity for FCRs has expanded geographically in recent years, and is expected to further expand in the near future161. The project relies on a TSO-TSO-model162. Thereby, FCR is procured through a common merit order list where all TSOs pool the offers they receive from balancing service providers (BSPs) within their respective areas of responsibility. The procurement of the capacity in-volved in the project is conducted one day before delivery through daily auctions.
• The International Grid Control Cooperation (IGCC) project163 operating the imbalance netting pro-cess; the imbalance netting cooperation projects have been merging into a single project. In particular, the IGCC project extended its geographical scope to Hungary, Italy, Poland, Portugal, Slovakia and Spain in 2020. Bulgaria, Greece and Romania plan to join between 2021 and 2022. IGCC is now the European reference project for imbalance netting164.
160 FCR currently involves elevenTSOs in eight countries: theTSOs inAustria (APG), Belgium (Elia), Switzerland (Swissgrid),Germany(50Hertz,Amprion,TenneTDE,TransnetBW),WesternDenmark(Energinet),France(RTE),theNetherlands(TenneTNL)andSlovenia(ELES).Formoreinformation,pleasesee:https://www.entsoe.eu/network_codes/eb/fcr/.
161 TheCzechRepublic(CEPS)isofficiallyanobserveroftheFCRcooperationsinceJuly2021.TheintegrationoftheCzechRepublicisplanned for the end of 2022.
162 ‘TSO-TSOmodel’isamodelfortheexchangeofbalancingserviceswherethebalancingserviceproviderprovidesbalancingservicestoits connecting TSO, which then provides these balancing services to the requesting TSO.
163 IGCC is a regional project for the imbalance netting process. Currently, it involves nineteen TSOs in sixteen countries: the TSOs in Austria(APG),Belgium(Elia),Croatia(HOPS),theCzechRepublic(CEPS),Denmark(Energinet),Germany(50Hertz,Amprion,TenneTDE,TransnetBW),France(RTE),Hungary(MAVIR),Italy(TERNA),theNetherlands(TenneTNL),Poland(PSE),Slovakia(SEPS),Slovenia(ELES),Spain (REE),Switzerland (Swissgrid),andPortugal (REN).Formore information,pleasesee:https://www.entsoe.eu/network_codes/eb/imbalance-netting/.
164 ACER Decision 13/2020 of 24 June 2020 on the implementation framework for the European platform for the imbalance netting process sets a twelve months deadline, after approval of this decision, for all TSOs to use the imbalance netting platform in order to operate the imbalance netting process for intended exchange of balancing energy. The decision is available at: https://www.acer.europa.eu/Official_documents/Acts_of_the_Agency/Individual%20decisions/ACER%20Decision%2013-2020%20on%20Implementation%20framework%20for%20imbalance%20netting.pdf.

63
ACER/CEER ANNUAL REPORT ON THE RESULTS OF MONITORING THE INTERNAL ELECTRICITY MARKETS IN 2020
• The Platform for the International Coordination of Automated Frequency Restoration and Stable System Operation (PICASSO)165 became the reference project for establishing a platform for ex-changing balancing energy from aFRR, in compliance with the EB Regulation. Previous aFRR coopera-tion projects in participating countries will be part of PICASSO and considered to be interim steps on the way to the target design. The existing aFRR cooperation project between Austria and Germany166 is such an example. The first launch of the platform is planned for the beginning of 2022167. Another example is the Nordic Balancing Model (NBM)168, which is a Nordic programme aimed at implementing a common balancing market. Between 2021 and 2024, the Nordic TSOs will gradually implement the changes in operational processes (in particular the single imbalance price model and the 15-minute imbalance settlement period). The goal is to merge with the Manually Activated Reserves Initiative (MARI) and with PICASSO.
• The platform for exchanging balancing energy from manually activated Frequency Restoration Re-serves (mFRRs) is planned for 2022169. The platform is part of MARI, which was launched in April 2017 with the signing of a memorandum of understanding by nineteen European TSOs. It was later replaced by a second memorandum of understanding in 2018 with 28 TSOs. Since late 2019, the Austrian and German TSOs have operated ‘GAMMA’, a shared platform for the joint activation and netting of mFRRs. Since 2018, Baltics TSOs are gathered on the Common Baltic Balancing Market170 platform for mFRR exchanges.
• The Trans European Replacement Reserves Exchange (TERRE171) platform for exchanging balanc-ing energy from replacement reserves (RRs) was implemented in early 2020. It incorporated first the Czech Republic, followed by Italy, France, Portugal, Spain and Switzerland. Poland is expected to join in 2022.
219 Early 2020, ACER published two decisions on the implementation frameworks for the European platform for the exchange of balancing energy from aFRRs and mFRRs172. These decisions set the deadlines for the implementation of these platforms, and confirm PICASSO and MARI as reference projects for the implementation. Since the beginning of 2020, ACER also took several decisions on key aspects of the implementation of the exchanges of balancing services173.
165 PICASSO originated as a regional project initiated by eight TSOs in five countries, including APG, Tennet NL, Elia, RTE, 50Hertz, Amprion, Tennet DE and Transnet BW. Currently the project involves the Baltic TSOs as observers and all the other EU TSOs as members. All TSOs obligedtoestablishtheaFRR-Platform,pursuanttotheEBRegulation,areparticipatinginthePICASSOproject.
166 The aFRR cooperation project involving the German and Austrian TSOs went live on 14 July 2016. This project allows the activation of themostefficientaFRRbidsbasedonacommonmeritorderlistandaTSO-TSOmodel.Asaresult,thecostsofactivatingaFRRscanbereduced.
167 The accession roadmap of PICASSO is published on ENTSO-E’s website, available at: https://eepublicdownloads.entsoe.eu/clean-documents/Network%20codes%20documents/Implementation/picasso/210427_PICASSO_3rd_Accession_roadmap.pdf.
168 The TSOs in Denmark (Energinet), in Finland (Fingrid), in Norway (Statnett) and in Sweden (Svenska kraftnätt) take part in this project. For more information, please see: http://nordicbalancingmodel.net/.
169 The accession roadmap of MARI is published on ENTSO-E’s website, available at: https://eepublicdownloads.azureedge.net/clean-documents/Network%20codes%20documents/NC%20EB/2021/210424_MARI_Accession_roadmap_Update_v3.pdf.
170 The Common Baltic Balancing Market started operating on 1 January 2018. It allows the Baltic TSOs (Elering, AST and Litgrid) to exchange standardized mFRR products through a common merit order list. For more information, please see: https://dashboard-baltic.electricity-balancing.eu/.
171 CurrentlyTERREinvolvessixTSOsasoperationalmembers:theTSOsintheCzechRepublic(CEPS),France(RTE),Italy(TERNA),Portugal(REN),Spain(REE)andSwitzerland(Swissgrid).Formoreinformation,pleasesee:https://www.entsoe.eu/network_codes/eb/terre/.
172 ACER Decision 02/2020 of 24 January 2020 on the implementation framework for aFRR platform, available at: https://acer.europa.eu/Official_documents/Acts_of_the_Agency/Annexes%20to%20the%20DECISION%20OF%20THE%20AGENCY%20FOR%20THE%20C3/ACER%20Decision%20on%20the%20Implementation%20framework%20for%20aFRR%20Platform%20-%20Annex%20I.pdf. and ACER Decision 03/2020 of 24 January 2020 on the implementation framework for mFRR platform, available at: https://acer.europa.eu/Official_documents/Acts_of_the_Agency/Annexes%20to%20the%20DECISION%20OF%20THE%20AGENCY%20FOR%20THE%20C4/ACER%20Decision%20on%20the%20Implementation%20framework%20for%20mFRR%20Platform%20-%20Annex%20I.pdf.
173 All ACER’s decisions are available at: https://www.acer.europa.eu/m/official_documents/Pages/individual_decision.aspx.

64
ACER/CEER ANNUAL REPORT ON THE RESULTS OF MONITORING THE INTERNAL ELECTRICITY MARKETS IN 2020
220 In addition, the actual volumes of imbalance netting and exchanged balancing energy can be compared to the potential of these two services, i.e. the maximum amount of imbalance netting and balancing en-ergy volumes that could be exchanged subject to sufficient available cross-zonal capacity. Based on the methodology used in the previous MMRs174, the actual application of imbalance netting and exchange of balancing energy is estimated at approximately 29 % of their potential in 2020 for a selection of thirteen borders where sufficient information was available. It is comparable to the previous year. It is still rela-tively low when compared to the level of efficiency recorded in the preceding DA (87 %) and ID (63 %) timeframes in 2020. In fact, the exchange of balancing energy (except imbalance netting) is still inexist-ent or residual on most European borders. The potential benefits from imbalance netting and exchange of balancing energy calculated for the whole of Europe, would be as high as 1.3 billion euros annually175.
174 See footnote 139.
175 For additional information, please see the methodological paper mentioned in footnote 137 of this report and paragraph 582 of the Electricity Wholesale Markets Volume of the 2014 MMR, available at: https://www.acer.europa.eu/Official_documents/Acts_of_the_Agency/Publication/ACER_Market_Monitoring_Report_2015.pdf.

65
ACER/CEER ANNUAL REPORT ON THE RESULTS OF MONITORING THE INTERNAL ELECTRICITY MARKETS IN 2020
5 Liquidity across market timeframes221 Market liquidity is one of the key indicators of a well-functioning electricity market176. An electricity market
is considered liquid if a significant number of market participants are able to sell and buy products in large quantities, quickly, without significantly affecting prices and without incurring significant transaction costs.
222 Market liquidity can be measured in several ways. Two of the most frequently used metrics of liquidity are:
• the ‘churn factor’, defined as the overall volume traded through exchanges and brokers expressed as a multiple of physical consumption, and
• the ‘bid-ask spread’, defined as the average difference between the highest buy offer (bid) and the lowest sell offer (ask) across the trading period of a given product.
223 The first metric provides an indication of the relative ‘size’ of the market compared to its physical size and it is relevant to all market timeframes. The second metric relates to the costs that market participants may incur when making a transaction. It is mostly relevant to markets based on continuous trading, i.e. most of forward markets and a large share of intraday markets in Europe.
224 This Chapter makes use of these two metrics to provide an update on liquidity in the forward markets across Europe (Section 5.1). The Chapter also includes an overview of European DA and ID markets’ liquid-ity (respectively Section 5.2 and Section 5.3).
5.1 Forward markets liquidity
225 This Section assesses the evolution of liquidity in major European forward markets in recent years.
226 Figure 34 displays the yearly churn factors of the largest European forward markets from 2016 to 2020. Forward markets’ liquidity remained stable in all major European markets (1 % overall increase). France (+33 %) and Romania (+58 %) experienced the most significant increases. Germany continued to be the most liquid market in 2020.
Figure 34: Churn factors in major European forward markets – 2016–2020
Source: Volumes from European Power Trading 2021 report, © Prospex Research Ltd and NRAs, and demand from the ENTSO-E Transparency Platform and Eurostat (see footnote 54 in Section 2.1).Note: The figure only includes volumes traded or cleared at power exchanges and volumes traded through brokers. For France, Germany, Great Britain, Iberia, Italy, the Netherlands, and the Nordic area, the traded volumes data from 2016 to 2020 were provided by Prospex. For Belgium, Bulgaria, the Czech Republic, Hungary, Poland, Romania and Slovenia, the traded volumes data from 2016 to 2020 were provided by the respective NRAs. For Belgium, Bulgaria, Poland, and Romania, the traded vol-umes are based only on contracts traded at the power exchange. For the Czech Republic the traded volumes are based only on contracts traded at or cleared by the power exchange, excluding purely bilateral forward volumes.
176 This statement should not be understood in isolation from other aspects of a well-functioning market assessed elsewhere in the report. In particular, there is a trade-off between high liquidity and efficient price signals representing market congestion.
Chur
n fa
ctor
10
6
2
8
4
0
2016 2017 2018 2019 2020
DE GB FR Nordic IT SI NL RO PL Iberia CZ BG BE HU

66
ACER/CEER ANNUAL REPORT ON THE RESULTS OF MONITORING THE INTERNAL ELECTRICITY MARKETS IN 2020
227 The evolution of forward markets volumes is unlikely due to a single factor, and some of those factors are MS-specific. However, one shared explanation for this accrued interest in forward market could be an impact of the COVID-19 pandemic. It may have incentivised market players to look for hedges beyond a time horizon when they could expect the situation to be back to normal.
228 Figure 35 shows the trading volumes per type across the major European forward markets over demand, presenting their divergent structure. In Great Britain, all market volumes are traded over-the-counter (OTC). In Poland and Romania, all market volumes are traded on power exchanges177. In other regions, market participants rely on both the power exchanges and OTC contract. Over the last years, there was an overall shift in European forward markets from non-cleared to cleared OTC contracts or trading at the power exchange. Figure 36 confirms that shift for 2020.
Figure 35: Forward markets churn factor per type of trade in the largest European forward markets – 2020
Source: European Power Trading 2021 report, © Prospex Research Ltd. and NRAs, and demand from the ENTSO-E Transpar-ency Platform and Eurostat (see footnote 54 in Section 2.1).Note: For France, Germany, Great Britain, Iberia, Italy, the Netherlands, and the Nordic area, the traded volumes data from 2016 to 2020 were provided by Prospex. For Belgium, Bulgaria, the Czech Republic, Hungary, Poland, Romania and Slovenia, the traded volumes data from 2016 to 2019 were provided by the respective NRAs. For Belgium, Bulgaria, Poland, and Romania, the traded volumes are based only on contracts traded at the power exchange. For the Czech Republic the traded volumes are based only on contracts traded at or cleared by the power exchange, excluding purely bilateral forward volumes.
177 In Poland as a principle all energy generated must be traded on power exchanges. There are, however, some exempted contracts for which OTC trading is allowed.
DEFR
NordicGB
ITNLPL
ROPTES
IberiaATCZBGHUBE
Churn factor0 1 2 3 4 5 9876
Power exchange forward OTC

67
ACER/CEER ANNUAL REPORT ON THE RESULTS OF MONITORING THE INTERNAL ELECTRICITY MARKETS IN 2020
Figure 36: Share of yearly traded volumes of selected European forward markets by product type – 2016–2020 (%)
Source: European Power Trading 2021 report, © Prospex Research Ltd.Note: Volumes from the German, French, Nordic, British, Italian Iberian and Dutch markets.
229 Figure 37 shows the average bid-ask spreads of OTC-traded yearly base-load products for delivery in 2020, 2021 and 2022 for the major European forward markets.
230 The figure shows MS-specific patterns. Firstly, Germany, Nordic countries and Hungary see a constant decrease over delivery years. Secondly, France, The Netherlands and the Czech Republic have shown overall stability, with a lower bid-ask spread for the year 2021. Underlying reasons are multiple. Decreas-ing bid-ask spreads could mark lower demand expected in the years ahead as a result of lasting COVID-19-pandemic-related shifts in the structure of the economy. Regarding Germany, such a decrease could possibly point to a recovery following a stabilisation of liquidity after the split of the German/Luxembour-gish/Austrian bidding zone. To the contrary, in markets that are more carbon-intensive, it is likely that the rapid rise in CO2 prices that took place in 2020, with an acceleration between November 2020 and Febru-ary 2021, had a negative impact. In the markets, higher carbon costs178 factored in future generation costs have outweighed the effect of lower demand expected in the years ahead (CZ, NL).
Figure 37: Average bid-ask spreads of OTC yearly products in European forward markets per year of deliv-ery – 2020–2022 (euros/MWh)
Source: ICIS.Note: Daily bid-ask spreads were averaged out throughout the period from 18 to 6 months before delivery start. For Great Britain, the half-yearly (winter and summer) products were used, and daily bid-ask spreads averaged out throughout the pe-riod from 12 to 6 months before the delivery start of each product. For Italy, the bid-ask spread of the base-load product for delivery in 2021 only refers to trades throughout the period from 12 to 6 months before the delivery start.
178 See Subsection 2.2.2.
%
100
60
20
80
40
02016 2017 2018 2019 2020
Cleared OTC Non-cleared OTCPower exchange forward
Euro
s/MW
h
0.6
0.3
0.1
0.4
0.5
0.2
0
2020 2021 2022
DE Nordpool IT GB ES FR NL CZ HU

68
ACER/CEER ANNUAL REPORT ON THE RESULTS OF MONITORING THE INTERNAL ELECTRICITY MARKETS IN 2020
5.2 Day-ahead markets liquidity
231 Figure 38 shows the evolution of DA markets churn factors across Europe in recent years. Levels of li-quidity in Europe diverge significantly. Differences are often related to differences in market design and market structure. Churn factors are equal to one179 in markets that are exclusive180, such as in the Single Energy Market of Ireland and Northern Ireland and Greece. Churn factors are lower in markets where a significant share of the energy can be sourced through bilateral contracts or through specific national arrangements such as in France181.
232 Moreover, Figure 38 shows that year-on-year changes in DA market liquidity are in general modest. This suggests that DA markets are mature for the largest part of Europe. Some exceptions include markets that emerged in recent years. For example, Croatia and Bulgaria saw year-on-year increases of 95 % and 25 %, respectively, in 2020.
Figure 38: Churn factors in major European DA markets – 2016–2020
Source: Volumes from European Power Trading 2021 report, © Prospex Research Ltd and demand from ENTSO-E Transpar-ency Platform and Eurostat (see footnote 54 in Section 2.1).Note: Only volumes traded at power exchanges are included.
5.3 Intraday markets liquidity
233 This Section provides an update on intraday markets liquidity in European ID markets in 2020.
234 Figure 39 shows the evolution of yearly ID churn factors in major European markets between 2018 and 2020. Overall, ID churn factors increased since 2018, by 10 % in 2019 and 29 % in 2020. Firstly, the figure indicates that in 2020 the Iberian Market, Germany, Italy and Great Britain, continued to have the highest ID-traded volumes expressed as a share of physical consumption.
235 Secondly, the figure shows that the upward trend in liquidity levels observed over the past years in most of the countries continued in 2020. The increase is largely related to the go-live of SIDC on 12 and 13 June 2018 across 15 countries182. The increase further relates to the extension of SIDC to Bulgaria, Croatia, the Czech Republic, Hungary, Poland, Romania and Slovenia on 19 and 20 November 2019183. In particular, it appears that the extension of SIDC has more than compensated any possible impact of the split of the German/Luxembourgish/Austrian bidding zone on liquidity. Liquidity remained stable in Iberia and Italy. Overall, while causes may be plural, the trend is consistent with the growing need for short-term adjust-ments due to the greater penetration of variable generation from renewables into the electricity system.
179 Except deviations due to discrepancies in the data sources used or other aspects such as the inclusion or exclusion of network losses and small producers in the statistics.
180 ‘Exclusive’ refers to markets that represent the only route to trade ahead of delivery.
181 See Figure 44.
182 In particular, the first go-live wave included Austria, Belgium, Denmark, Estonia, Finland, France, Germany, Latvia, Lithuania, Luxembourg, Norway, the Netherlands, Portugal, Spain and Sweden.
183 More information on the SIDC description, available at: https://www.entsoe.eu/network_codes/cacm/implementation/sidc/.
Chur
n fa
ctor
1.2
0.8
0.4
1.0
0.6
0.2
0
2016 2017 2018 2019 2020
SEM GR Nordics+ Baltics
Iberia IT SI HU RO SK CH CZ NL FR BE BG DE/LU AT HR

69
ACER/CEER ANNUAL REPORT ON THE RESULTS OF MONITORING THE INTERNAL ELECTRICITY MARKETS IN 2020
Figure 39: Yearly ID churn factors in major European markets by type of trade – 2018–2020
Source: Volumes from nominated electricity market operators (NEMOs) and demand from ENTSO-E Transparency Platform.Note: Croatia only started its ID market in April 2017, Bulgaria in July 2018, and Poland when it joined SIDC in the second wave in November 2019.
236 Figure 40 illustrates the benefits of SIDC. The increasing share of cross-zonal intraday trade is expressed as a percentage of the overall continuous ID trading volumes in Europe, following the go-live of SIDC in 2017. Overall, it confirms that SIDC allows market participants to access a larger portfolio of bids and of-fers to reduce their imbalances or support the system’s balance in an efficient way.
Figure 40: Share of continuous ID-traded volumes according to intra-zonal vs. cross-zonal nature of trades in Europe and yearly continuous ID-traded volumes – 2017–2020 (% and TWh)
Source: ACER calculations based on NEMOs data.
Chur
n fa
ctor
0.15
0.09
0.03
0.12
0.06
0
2018
2019
2020
2018
2019
2020
2018
2019
2020
2018
2019
2020
2018
2019
2020
2018
2019
2020
2018
2019
2020
2018
2019
2020
2018
2019
2020
2018
2019
2020
2018
2019
2020
2018
2019
2020
2018
2019
2020
2018
2019
2020
2018
2019
2020
2018
2019
2020
Continuous tradingAuction
DE Iberia IT GB AT SI NL BE FR BG Baltic CH Nordic 4MMC HR PL
77.6% 76.3% 71.9% 67.0%
201773.7 TWh
201884.5 TWh
201994.1 TWh
2020124.0 TWh
Cross-zonalDomestic
33.0%28.1%23.7%22.4%

70
ACER/CEER ANNUAL REPORT ON THE RESULTS OF MONITORING THE INTERNAL ELECTRICITY MARKETS IN 2020
6 Capacity mechanisms and resource adequacy
237 According to the recast Electricity Regulation, MSs shall primarily strive to ensure an appropriate market functioning through relevant reforms. If necessary, temporary and properly designed capacity mecha-nisms (CM) allowing for cross-border participation of resources could be applied. MSs must justify the application of a CM based on identified resource adequacy concerns.
238 Furthermore, when MSs identify adequacy concerns, they must detect any possible regulatory distor-tions or market failures and set a timeline for adopting measures to eliminate them in an implementation plan184. A number of MSs already set such so-called reform plans185. These plans are a prerequisite for the approval of new CMs or the conclusion of new contracts for existing CMs.
239 In 2020, ACER approved a series of methodologies setting the framework for ensuring the proper identi-fication and quantification of adequacy concerns:
• the methodology setting an adequacy reliability standard (RS) based on the calculation of the value of lost load (VOLL) and the cost of new entry (CONE) (VOLL/CONE/RS methodology)186 sets an objective reference for an appropriate market functioning,
• the methodology for the European resource adequacy assessment, (ERAA methodology187) identifies the potential resource adequacy gaps across Europe for the next ten coming years by assessing re-sources in the network against the RS188,189 , and
• the technical specifications for cross-border participation in CMs (Technical Specifications)190 set out detailed rules enabling capacity providers participation in CMs of other Member States.
240 This Chapter first presents the current status of CMs in Europe (Section 6.1), and an overview of their costs (Section 6.2). It then describes the technologies that are remunerated through the CMs and pre-sents the long-term commitments of CMs (Section 6.3). It presents the current status of cross-border participation in CMs (Section 6.4). The Chapter ends with an analysis of the interruptibility schemes191 (ISs) (Section 6.5).
184 Article20(3)oftherecastElectricityRegulation.
185 Information on the implementation plans can be found here: https://ec.europa.eu/energy/topics/markets-and-consumers/capacity-mechanisms_en#national-implementation-plans.
186 Annex I to ACER Decision 23/2020 available here: https://www.acer.europa.eu/Official_documents/Acts_of_the_Agency/Individual%20decisions%20Annexes/ACER%20Decision%20No%2023-2020_Annexes/ACER%20Decision%2023-2020%20on%20VOLL%20CONE%20RS%20-%20Annex%20I.pdf.
187 Annex I to ACER Decision 24/2020 available here: https://www.acer.europa.eu/Official_documents/Acts_of_the_Agency/Individual%20decisions%20Annexes/ACER%20Decision%20No%2024-2020_Annexes/ACER%20Decision%2024-2020%20on%20ERAA%20-%20Annex%20I.pdf.
188 MSs may conduct national resource adequacy assessments (NRAAs). According to Art. 24 of the recast Electricity Regulation, NRAAs shall be based on the ERAA methodology.
189 Based on information received from NRAs, there was no change in the status of reliability standards across Member States compared to the one described in Section 6.3 of the MMR2019. There are undergoing calculations of the reliability standard to align with the requirements of the recast Electricity Regulation and the VOLL/CONE/RS methodology in Belgium, Bulgaria, Estonia, Finland, France, Greece, Germany/ Luxemburg, Ireland, Italy, Poland, Spain and Sweden.
190 Annex I to ACER Decision 36/2020 available here: https://www.acer.europa.eu/Official_documents/Acts_of_the_Agency/Individual%20decisions%20Annexes/ACER%20Decision%20No%2036-2020_Annexes/ACER%20Decision%2036-2020%20on%20XBP%20CM%20-%20Annex%20I%20-%20technical%20specifications.pdf.
191 In its 2016 Sector Inquiry on CMs, the EC included Interruptibility Schemes (ISs) as a subcategory of strategic reserves focusing on DSR. The proposedrevisionoftheGuidelinesonStateaidforenvironmentalprotectionandenergy2014-2020 defines ISs as “‘a measure for security of electricity supply designed to ensure a stable frequency in the electricity system or address short term security of supply problems, including by interrupting load”. It explicitly includes ISs in the measures aimed at increasing SoS the compatibility with State Aid rules of which needs properly to be demonstrated. In this volume, ACER has reviewed the design and operation of interruptibility schemes in Europe in an effort to identify their impact on adequacy and their interrelation with other SoS measures, such as CMs.

71
ACER/CEER ANNUAL REPORT ON THE RESULTS OF MONITORING THE INTERNAL ELECTRICITY MARKETS IN 2020
6.1 Status of CMs
241 Figure 41 presents the status of CMs in Europe as of the end of 2020. Four different types of CMs are ap-plied192 in twelve MSs193. Out of these twelve CMs, seven have been approved by the EC for compliance with State Aid rules194.
242 Since 2019, seven MSs have been developing new CMs, i.e. Belgium195, Bulgaria, Greece, Finland, Lithu-ania, Sweden and Spain. According to the recast Electricity Regulation196, MSs must assess whether a strategic reserve is capable of addressing the identified resource adequacy concerns prior to introducing other types of CM. MSs must study the effects of the CM on neighbouring MSs and appropriately consult relevant stakeholders197. Studied effects include possible interactions between CMs to be applied by MSs and the ones applied by their neighbours.
243 All currently active CMs are open to DSR participation. However, RES and storage are not eligible in three and four cases respectively. This restriction likely contradicts the provisions of the recast Electricity Regu-lation on the design principles of CMs198, 199.
192 The categorisation of the CMs is based on the taxonomy in the EC’s staff working document accompanying the document Final Report of the Sector Inquiry on Capacity Mechanisms sector inquiry, available here https://eur-lex.europa.eu/legal-content/EN/TXT/PDF/?uri=CELEX:52016SC0385&from=EN.
193 As per Figure 41,thetargetedcapacitypaymentsaregraduallyphasedout.ThisisinlinewithArticle22(1)(f)oftherecastElectricityRegulation provisions according to which remuneration shall be determined through a competitive process.
194 A company that receives government support gains an advantage over its competitors. The Treaty prohibits State aid unless justified by reasons of general economic development. The EC is in charge of ensuring that State aids comply with EU rules.
195 E.g. a market wide CM for Belgium was approved in August 2021, see https://ec.europa.eu/commission/presscorner/detail/en/ip_21_4442.
196 Article21(3)oftherecastElectricityRegulation.
197 Article21(2)oftherecastElectricityRegulation.
198 Article22(1)(h)oftherecastElectricityRegulation.
199 See Table 13 in Annex 1 for more details on the characteristics of CMs in the EU.
72
ACER/CEER ANNUAL REPORT ON THE RESULTS OF MONITORING THE INTERNAL ELECTRICITY MARKETS IN 2020
Figure 41: CMs in Europe – 2020
Source: NRAs. Note: In Belgium, a market wide – central buyer type of CM was approved in August 2021. In Greece, the temporary flexibility remuneration mechanism is a targeted capacity payment (only flexible capacity providers are eligible) where the remuneration level is defined through a centrally organised auction. In Italy, contracts of the previous targeted capacity payment scheme are still valid for 2020 and 2021.The new CM was approved in 2018 and will become effective (first delivery period) from 2022 onward. In Poland, there were two interim CMs in place during 2020. The first, called operational capacity reserve, was in-troduced in 2014, and the second, called contingency reserve, in 2016. The new market wide CM was approved in 2018, and became effective as of 2021. In Portugal*, a strategic reserve scheme was introduced in 2017, which is currently postponed subject to assessment from the EC. The targeted CM has been revoked since 2018, yet some capacity payments will be pro-vided in the future to hydro power plants, currently under construction, due to “legacy” contracts. In Spain**, the CM used to comprise “investment incentives” and “availability payments”; however, such availability payments were removed in June 2018 and the investment incentives payments still apply only to generation capacity installed before 2016.
6.2 Costs and financing of CMs
244 Figure 42 provides an update on the costs of CMs incurred, in 2019 and 2020, or forecast, for 2021 and 2022, in the EU and per MS. In 2020, the overall cost of CMs across the EU (excluding GB) remained simi-lar to those in 2019, at 2.6 billion euros. Costs are expected to increase significantly in the next couple of years, reaching 4.9 billion euros and 5.3 billion euros in 2021 and 2022 respectively, as the market-wide CMs become effective in Poland (from 2021) and Italy (from 2022)200. Costs for the forecast period 2021-2022 do not reflect capacity auctions that might take place closer to delivery. At the same time, more MSs are considering the implementation of (market-wide) CMs in the coming years201. Hence, the total costs may well exceed the forecast values, and are expected to increase further in the longer term.
200 Market-wide CMs generally incur higher costs as they normally refer to a much larger volume of capacity than targeted CMs such as strategic reserves.
201 E.g. a market wide CM for Belgium was approved in August 2021, see https://ec.europa.eu/commission/presscorner/detail/en/ip_21_4442.
Market-wide central buyer Market-wide de-centralized obligation No CM Strategic reserves Targeted capacity payment
* **

73
ACER/CEER ANNUAL REPORT ON THE RESULTS OF MONITORING THE INTERNAL ELECTRICITY MARKETS IN 2020
Figure 42: Costs incurred or forecast to finance CMs in the EU-27 (left) and per MS (right) – 2019 - 2022 (million euros)
Source: ACER calculations based on NRAs data. Note: Costs are based on the total annual realised or forecast payments to capacity providers for delivery of capacity in the relevant year. The costs do not account for side effects such as impacts on electricity prices or additional costs or benefits derived from the CMs. The overall costs for France are an approximation (see note 2 under Figure 44). In Belgium, there was no auction in 2019 and 2020, resulting in zero costs. Cost data for Italy up to 2021 refer to remaining capacity payments from the previous capacity remuneration scheme, while for 2022 they refer to the CM currently in place. For Spain, the depicted costs refer to the remaining long-term investment incentives awarded to installations before these incentives were cancelled in 2016, see also note 2 in Figure 44.
245 Figure 43 presents the cost of the CMs per MW of capacity procured. These values are the ratio of total payments over total volumes remunerated per year. The resulting unit cost ranges from 8 to 68 thousand euros per MW202, reflecting differences in the generation mix, CM designs (e.g. with respect to eligibility criteria, auction frequency and bidding caps) and possibly different levels of competition in various markets.
Figure 43: Unit cost of CMs – 2019 - 2022 (thousand euros per MW)
Source: ACER calculations based on NRA data.Note: The unit costs are calculated by dividing total annual payments and total annual volumes remunerated and hence do not necessarily depict accurately auction results. In Belgium, there was no auction for 2019 and 2020. The overall costs for France are an approximation (see note 2 under Figure 44). In the case of Germany (2019 and 2021) and Greece (2019 and 2020), data were adjusted to account for the limited delivery period.
202 Actual auction results may be different in some cases and can even be higher for some categories of capacity. For example, in the Italian auctions held in December 2019, new capacity was procured at 75 thousand euros per MW.
80
60
40
20
70
50
30
10
0
3,000
2,000
1,000
2,500
1,500
500
0FI GR SEBG DEIE IT PLES FREU
Millio
n eu
ros
6,000
4,000
2,000
5,000
3,000
1,000
0
2019 2020 2021 2022
PL IEDE FR BGFISE GRES
Thou
sand
euro
s/MW
70
40
20
10
50
60
30
0
20202019 2021 2022

74
ACER/CEER ANNUAL REPORT ON THE RESULTS OF MONITORING THE INTERNAL ELECTRICITY MARKETS IN 2020
246 Figure 44 presents the relative cost to finance CMs, expressed per unit of demand, and as a share of the average DA price (green dots). Due to the significant drop of the latter203, the share increased significantly in Ireland and France (26 % and 13 % respectively compared to 19 % and 9 % in 2019). The cost per unit of demand is expected to further increase in MSs where a market-wide CM is foreseen204. In Poland, this cost is expected to be in the range of 18 % of the DA price in 2021205.
Figure 44: Costs incurred or forecast to finance CMs per unit demand – 2019 – 2021, and expressed as a percentage of the yearly average DA price in Europe – 2020 (euros per MWh demand and %, respectively)
Source: ACER calculations based on NRA and ENTSO-E data.Note 1: The costs expressed as percentages of day-ahead prices refer to 2020 data. Costs per unit demand are based on total annual realised or forecasted payments to capacity providers for delivery of capacity in the relevant year. Demand data are derived from Eurostat data206. Demand in 2020 was used for 2021 calculations. Note 2: In Belgium, no auction for 2019 and 2020 took place, due to the lack of a need for such reserves for the period 2020 - 2021, resulting in zero costs. The overall costs for France are an approximation considering that all capacity certificates are valued at the market reference price (PRM). For 2022, the PRM used is the average of the PRM for 2020 and 2021. A significant share (which varies year-on-year) of these capacity certificates is implicitly valued through the “Accès Régulé à l’Electricité Nucléaire Historique” (ARENH) mechanism, which is a scheme that enables suppliers to purchase electricity from nuclear generators at a regulated price. Therefore, the actual costs for France are dependent on the reference used to value the ca-pacity certificates related to the ARENH mechanism. For Greece, the provided costs referred only to the reference period i.e. 15 August – December 2020, and were scaled up to approximate yearly costs. For Germany, costs of the Strategic Reserves scheme for 2019 refer to October-December and were also scaled up to approximate yearly costs. Cost data for Italy refer to remaining capacity payments from the previous capacity remuneration scheme. For Spain, the CM was cancelled in June 2018. The depicted costs refer to the remaining long-term investment incentives awarded to installations before 2016.
247 Table 4 presents the cost recovery method for MSs with capacity payments. In most cases, the costs are either included in network tariffs or passed through to electricity suppliers, hence affecting end user prices.
Table 4: Cost recovery method per MS with capacity payments
Cost recovery CountriesSpecial levy to consumers BE Network tariffs BG (availability), DE, FI, PL, PTPass-through to suppliers ES, FR, GR, IEPass-through to BRPs BG (energy), IT, SE
Source: NRAs.Note: In Bulgaria, costs related to the supplied energy of the reserves, when activated, are passed to BRPs, while cost for availability are collected via network tariffs.
203 See Chapter 2.
204 Market-wide CMs tend to incur greater costs than the targeted CMs, as they remunerate all the capacity required to ensure adequacy and not just a supplementary need.
205 Assuming prices and demand levels remain similar to those in 2020.
206 See footnote 56.
Euro
s/MW
h%
10
4
2
6
8
0
30
15
10
5
20
25
0
20202019 2021 % of DA price (2020)
IE FR GR IT PL ES BG FI DE SE PT
25.7%25.7%
0.0%0.0%0.5%0.5%
12.8%12.8%
5.3%5.3%
1.4%1.4%1.5%1.5% 1.5%1.5%1.6%1.6% 0.6%0.6% 0.4%0.4%

75
ACER/CEER ANNUAL REPORT ON THE RESULTS OF MONITORING THE INTERNAL ELECTRICITY MARKETS IN 2020
6.3 Technologies remunerated under CMs
248 According to the design principles for CMs described in Article 22(1h) of the recast Electricity Regulation, CMs shall be open to participation of all capacity resources, including energy storage and demand-side response (DSR). At the same time, pursuant to Article 22(4) of the recast Electricity Regulation, capacity contracted under both new and existing CMs shall comply with explicitly defined CO2 emissions limits207. Finally, pursuant to Article 26 of the recast Electricity Regulation, CMs should allow direct cross-border participation of foreign resources, including for strategic reserves when technically feasible.
249 Figure 45 displays the breakdown of technologies remunerated through CMs for 2020 and 2021 in nine MSs with CMs208. Nuclear power plants account for slightly over a third of the remunerated capacity in both years, while a large share refers to fossil fuels209 (approximately 37 % and 40 % for 2020 and 2021 respectively, increased from 26 % in 2019). Notably, the introduction of a market-wide CM in Poland nearly tripled the relevant capacity of coal/lignite-fired power plants that receive support from CMs. As the provisions of the CO2 emission limits will gradually become effective, it is expected that the capacity of coal/lignite-fired power plants remunerated under CMs will be reduced.
250 Currently, cross-border participation is effective only via interconnectors in France and Ireland210, 211, yet at an increasing trend (from 6.8 GW in 2019 to 8.5 GW in 2021). DSR and RES still play a limited role in CMs (3 % for both technologies in 2020 and 2 %212 and 3 % respectively in 2021), while storage is just emerging (under 1 % in both years), indicating that currently CMs still largely support traditional resources vis-a-vis new technologies.
Figure 45 : Capacity remunerated through CMs in a number of MSs per type of technology – 2020 – 2021 (%)
Source: ACER calculations based on data from NRAs. Note: The graphs are based on data for Belgium (no contracts), Bulgaria, France, Finland, Germany, Greece, Ireland, Poland (no contracts), Portugal, Spain and Sweden. Some CMs allow for long-term contracts targeting new capacity213. Such provi-sions facilitate the commissioning of new capacity, by reducing risks for investors. However, these provisions come with some drawbacks. Long-term contracts result in lock-in effects that may not be aligned with other public policies, such as the decar-bonisation of the power sector214. Capacity resources may continue to receive support for periods with no foreseen adequacy related issues215. Contracts that often exceed ten years in duration may result in discrimination and barriers against potential new entries later on (e.g. due to no exit of otherwise unprofitable capacity).
207 Compliance to the emission limits is, however, without prejudice to contracts concluded by 31 December 2019.
208 In Belgium no auctions took place for 2020-2021. The Italianmarket-wide scheme is not effective prior to 2022 and no particularinformation on the type of technologies remunerated by the targeted capacity payments mechanism was available. In Portugal no capacityiscontractedfor2020-2021.
209 The other category may also include fossil fuel related capacity e.g. waste incineration plans.
210 As per Art. 26 of the recast Electricity Regulation, CMs that were operating on 4 July 2019 may allow for interconnections to compete togetherwithdirectforeigncapacityuptotwoyearsafterthereleaseoftheTechnicalSpecifications(22December2022).Afterthisdate, only direct participation of foreign capacity shall be allowed.
211 In Italy, foreign capacity was successful in both auctions held in 2020 for delivery in 2022 and 2023. In Poland, the CM rules foresee the participation of foreign capacity yet this was not effectively applied in the first auctions. See section 6.4.
212 TheslightreductioninDSRvaluesmightdepictthefactthat2021datadonotincluderesultsofT-1auctions,particularlysuitedforDSR.
213 For example, contracts up to 15 years long are possible in the Italian CM. See also Table 13 in Annex 1.
214 A way to mitigate such risks would be to insert environmental or climate criteria. For example, in France, long-term contracts are available only for technologies that have a strict limit of CO2 emissions (200 gr/kWh).
215 For example, this occurs if support schemes are maintained after the implementation of regulatory reforms allowing the market to deliver theappropriate levelofadequacy.Pursuant toArticle22(1)(c)of therecastElectricityRegulation,CMsmustnotgobeyondwhat isnecessarytoaddressadequacyconcerns.Moreover,Article21(6)oftherecastElectricityRegulationforeseesthatnonewcontractsshall be concluded in case no adequacy concern is identified.
38.3%35.7%
NuclearCoal/LigniteHydro, excluding pumped storage
Hydro, pumped storageOther
Demand ResponseIntermittent RESNatural gas
Oil & oil products
2020123 GW
2021136 GW
24.5%
11.4%
7.3%
6.4%4.0%
3.3%2.8%
2.1%
19.6%
18.0%
9.8%
5.1%
4.5%2.9%
2.7%1.8%

76
ACER/CEER ANNUAL REPORT ON THE RESULTS OF MONITORING THE INTERNAL ELECTRICITY MARKETS IN 2020
251 Figure 46 displays the capacity currently under long-term availability contracts in four MSs where such contracts exist, i.e. Ireland, Italy, Poland and Spain, along with the relevant costs. The vast majority of long-term contracts refers to fossil fuel power plants. Some CMs will continue to support fossil-fuelled power plants way beyond 2030, when their economic viability might be highly uncertain.
Figure 46: Long-term contracted capacity and relevant costs by type of technology in the EU-27 – 2026 – 2035 (GW and million euros, respectively)
Source: ACER calculations based on data from NRAs. Note: Long-term contracts exist in in France, Ireland, Italy, Poland, Portugal and Spain.
6.4 Cross-border participation in CMs
252 Article 26 of the recast Electricity Regulation requires that CMs are open to direct participation of foreign capacity providers and sets out high-level principles for such participation. These principles are further developed and specified in the Technical Specifications adopted by ACER in December 2020216. MSs are required to adapt their existing CMs217 in order to allow direct cross-border participation, without preju-dice to commitments or contracts concluded by 31 December 2019218. These MSs may also temporarily allow interconnectors to participate directly in the same competitive process as foreign capacity provid-ers, until 22 December 2022219.
253 Table 5 presents the arrangements for cross-border participation in MSs at the end of 2020, before the adoption of the Technical Specifications. At that time, four MSs with CMs, namely France, Ireland (SEM), Italy and Poland, had arrangements for cross-border participation in place220. Only the Italian CM was open to direct participation of foreign capacity providers, whereas the other CMs were open to participa-tion of interconnectors221.
254 There are two key differences between the Italian model for cross-border participation and the future French and Polish models. Firstly, France and Poland envisage broadly similar eligibility criteria and obli-gations between domestic and foreign capacity providers. In Italy, foreign capacity providers are generally subject to simpler eligibility criteria than domestic capacity provider. Further, they are subject to financial obligations only, whereas domestic capacity providers are also subject to availability obligations. Sec-ondly, the French and Polish CMs envisage a two-step approach for participation of foreign capacity. A pre-auction will select qualified foreign capacity providers that will then compete with domestic produc-ers in the main auction. Following the Italian CM, successful foreign capacity providers are selected in a single auction, together with domestic providers222.
216 See footnote 190.
217 CMs in operation on 4 July 2019.
218 Article22(5)injointreadingwithArticle26oftherecastElectricityRegulation.
219 Article26(2)oftherecastElectricityRegulation.
220 Following the withdrawal of the UK from the EU on 31 January 2020, UK is considered a third country and Ireland is currently only connectedtotheUK.UnderArticleENER6(3)oftheTradeandCooperationAgreement,neitherpartyisrequiredtopermitcross-borderparticipation in CMs.
221 The French and Polish CMs already include provisions about direct cross-border participation of foreign capacity providers. However, implementationwasnotyetpossibleduetothelackofTSO-TSOarrangements.
222 However, different clearing prices for foreign and domestic capacity providers apply.
GWMillion euros
25
10
5
15
20
0
1,500
600
300
900
1,200
02026 2027 2028 2029 2030 2031 2032 2033 2034 2035
Natural gasCoal/LigniteNuclear
Hydro, excluding pumped storageHydro, pumped storageOther storage excluding hydro
Intermittent RESOther non-hydro RESOil & oil products
Demand ResponseForeign generation capacityCross-border network capacity (if applicable)
OtherTotal cost

77
ACER/CEER ANNUAL REPORT ON THE RESULTS OF MONITORING THE INTERNAL ELECTRICITY MARKETS IN 2020
Table 5: Status on cross-border participation in CMs
Country How is cross-border participation applied? Auctions Eligibility criteria Obligations
FRInterconnectors (current) Single auction
Similar to domestic providers Similar to domestic providersForeign capacity providers (foreseen) Two-step approach
IE Interconnectors Single auction Similar to domestic providers Similar to domestic providers
IT Foreign capacity providers (simplified) Single auction Simplified compared to domestic providers Only financial obligations
PLInterconnectors (for delivery period 2021-2024) Single auction
Similar to domestic providers Similar to domestic providersForeign capacity providers (from delivery period 2025) Two-step approach
Source: NRAs.
255 After 2020, new CMs will have to enable effective and non-discriminatory participation of foreign capacity providers. Existing CMs will be expected to introduce such participation in a timely manner. Relevant TSOs or CM operators should enter into bilateral agreements, ensuring a level-playing field between domestic and foreign capacity providers intending to participate in a given CM. In particular, equivalent criteria should apply to domestic and foreign capacity providers where possible and appropriate. For example, technical requirements and penalties applied when capacity providers are unavailable should be equiva-lent. ENTSO-E started setting up an EU registry of foreign capacity providers eligible for cross-border participation, expected to enter into operation in 2021.
256 Relevant NRAs will oversee the conclusion of bilateral agreements to ensure effective and non-discrim-inatory cross-border participation. ACER will support the regulatory authorities in their mandate and will monitor closely the implementation of the Technical Specifications from 2022 onwards.
6.5 Interruptibility schemes
257 Interruptibility schemes (ISs) normally refer to national programmes dedicated to DSR, organised by TSOs for temporary load interruption or reduction. An IS typically pools large industrial consumers from energy intensive industries with processes that can be suspended for a limited time. Participants are remuner-ated for their availability to be interrupted according to the contract specifications. ISs provided an early example of DSR223, in the absence of a wide participation of consumers in the electricity market224.
258 While the initial aim of this section was to provide an overview of ISs in Europe in the context of adequacy, the findings reveal that ISs were deployed for a variety of purposes. Therefore, this section provides, for the first time, an overview of ISs in Europe while shedding light on their scope and purpose.
6.5.1 Status of interruptibility schemes in Europe
259 Figure 47 presents ISs that have been in place in Europe for the past five years. In 2020, ISs were opera-tional in seven MS: France, Germany, Greece, Italy, Portugal, Poland and Spain.
223 See the findings of the Final Report of the Sector Inquiry on Capacity Mechanisms available here: https://ec.europa.eu/competition/sectors/energy/capacity_mechanisms_final_report_en.pdf.
224 See Recital 10 of Directive 2019/944.

78
ACER/CEER ANNUAL REPORT ON THE RESULTS OF MONITORING THE INTERNAL ELECTRICITY MARKETS IN 2020
Figure 47: Interruptibility schemes in Europe in 2020
Source: ACER based on information provided by the NRAs and, in case of France, by the TSO. Note: The Irish schemes were phased out in 2016 and 2018. The Spanish and Greek schemes were phased out in July 2020 and September 2021 respectively. The Portuguese and German schemes expire in November 2021 and July 2022 respectively, with renewal under consideration in both cases. In Poland, the IS was terminated in November 2020 and replaced by a DSR scheme in April 2021.
6.5.2 Purpose and characteristics of the interruptibility schemes
260 The analysed ISs have different design features that serve different, sometimes multiple, purposes225. Table 6 provides an overview of the purposes of each scheme.
261 Six schemes (German, Greek, Irish, Polish, Portuguese and Spanish) explicitly relate to adequacy (some-times inter alia) as they aim to ensure sufficient capacity to meet demand.
262 In Germany, interruptible loads may also be activated complementing balancing reserves when needed, or for congestion management. In Spain, the IS was also contributing to the balancing needs, since it used to be activated once the cost of standard balancing energy exceeded the cost of the interruptible demand.
263 The fast response capability makes interruptible demand technically fit for coping with unexpected events in near real-time. All schemes, except for the Polish one, provide (at least partly) ancillary services other than balancing that are normally automatically activated at different frequency thresholds below normal operation226. For the purposes of this analysis, these services are called ‘contingency reserves’.
225 ACER did not assess the relevance of the underlying need for these services, or the justification for the individual ISs.
226 See Table 14 for more information.
IS active No IS IS phased out

79
ACER/CEER ANNUAL REPORT ON THE RESULTS OF MONITORING THE INTERNAL ELECTRICITY MARKETS IN 2020
Table 6: Purpose of the interruptibility schemes
Purpose DE ES FR GR IE IT PL PTAdequacy ● ● ● ● ● ●Balancing ● ●Congestion management ●Contingency reserve ● ● ● ● ● ● ●
Source: ACER based on information provided by the NRAs and, in case of France, by the TSO. Note: For the purposes of this analysis the term `contingency reserve` relate to frequency related ancillary services - other than balancing - that are normally automatically activated at different frequency thresholds below normal operation.
264 In all the ISs, except for the Portuguese one, participating consumers are remunerated for their availability on auctions. In Portugal, participants receive for their service an administratively set price. In Germany, Italy and Poland, providers also receive payment for the energy interrupted based on pay-as-bid auctions (weekly for Germany and daily for Italy227 and Poland).
265 The minimum eligible capacity varies from 1 MW in Poland and Italy to 25 MW in France. Participation of aggregators is only allowed in the German and Polish schemes.
266 While IS participants are generally passive recipients rather than active market participants, the German scheme allows parallel participation in the day-ahead market if their weekly bids are higher than the DA market price and the latter is above 200 euros/MWh. However, this option has not been used in practice, possibly indicating a lack of economic incentive228.
6.5.3 Size, cost and activation of the interruptibility schemes
267 The size of the schemes varies across MSs. In 2020, the biggest capacity was contracted in the Italian scheme (4,600 MW/year)229, while the lowest (690 MW/year) was in Poland230. For an efficient procure-ment of IS services, it is important to ensure that the procured quantity is commensurate with the purpose of the scheme.
268 Over the past four years, more than three billion euros were spent on ISs in the seven MSs presented in Figure 48. Overall, the Italian and Spanish are the most costly schemes, accounting for respectively 40 % and 35 % of the total cost for that period.
269 When comparing total cost divided by total contracted capacities, the Portuguese scheme comes on top at around 153 thousand euros/MW, the Spanish IS being second reaching aproximately half of that level at around 79 thousand euros/MW, while the Italian schemes come third at around 58 thousand euros/MW231.
270 Typically, the costs of the schemes are recovered through special charges levied232 on some or all of the network users, imposed on producers, balance responsible parties, or consumers233.
227 In Italy, the remuneration per activation is capped at 3,000 euros.
228 In Germany, participants may also participate in the BM but in that case will receive no remuneration from the IS.
229 In 2020, 4000 MW were contracted for the mainland Italy, 400 MW for Sicily and 200 MW for Sardinia.
230 More information in Table 14 in Annex 1.
231 The figures are indicative. On the one hand the underlying products are different, on the other hand total cost reflects both availability payments as well as activation payment where applicable. The Portuguese and Italian figure is calculated for 2020. The Spanish figure is calculated for 2019 to reflect a full year in service.
232 The German and Greek schemes, as well as the Italian sub-scheme (for the islands of Sicily and Sardinia), were subject to state aid investigations. The European Commission decided not to raise any objections in either of the cases.
233 For example, in Greece, a specific charge for SoS is imposed on all producers, while in Poland costs are passed through to energy end-users via the network tariff. In Germany, costs are recovered in two ways according to the use of the load. Costs due to activations for system balance needs are recovered via the imbalance settlement of BRPs. Costs for capacity payments and activation costs stemming from congestion management are passed through to consumers by a special levy.

80
ACER/CEER ANNUAL REPORT ON THE RESULTS OF MONITORING THE INTERNAL ELECTRICITY MARKETS IN 2020
Figure 48: Realised and forecast costs of the ISs over 2017 – 2021 (million euros)
Source: ACER based on information provided by the NRAs and, in case of France, by the TSO.Note: Realised (2017-2020) and forecast (2021) payments for delivery irrespective of the procurement date. Due to unavail-ability of data, the German costs for 2021 only reflect the cost of activation, and not the cost of capacity payment. No data was provided for Ireland, the schemes were phased out in 2016 and 2018 respectively.
271 Figure 49 shows the number of activations of ISs for the period 2016-2020. The German234 and Italian schemes were used regularly during this period, while the other schemes were not used (Poland, Portu-gal) or only used sporadically (France, Greece235, Spain236).
Figure 49: Number of IS activations over 2016 – 2020
Source: ACER based on information provided by the NRAs and, in case of France, by the TSO.Note: No data was provided for Ireland, the schemes were phased out in 2016 and 2018 respectively.
272 ISs may play a considerable role in resolving frequency deviation situations, as evidenced by two recent events in the Continental Europe Synchronous Area. On 10 January 2019, the French IS was automatically activated to support the restoration of frequency237. On 8 January 2021, the French and Italian ISs were automatically activated for the same reason. The latter event is explained in more detail in the box.
234 Heavy imbalances resulting from issues with the balancing market design led to an increased usage of the scheme in 2019. Activation for re-dispatching purposes occurred once in 2017 and five times in 2018. Source: https://www.netztransparenz.de/EnWG/Abschaltbare-Lasten-Umlage/Abschaltbare-Lasten-Umlagen-Uebersicht.
235 Onlyusedfourtimes.Allfourtimesappearedinthewintercrisisof2016-2017.
236 The uptake in Spain in 2018 is due to the addition of a new activation criterion according to which loads may also be used for balancing purposes.
237 See https://eepublicdownloads.entsoe.eu/clean-documents/news/2019/190522_SOC_TOP_11.6_Task%20Force%20Significant%20Frequency%20Deviations_External%20Report.pdf.
Millio
n eu
ros
600
400
200
100
500
300
0
20202019 20212017 2018
DE ES FR GR IT PL PT
Activ
atio
ns
140
100
60
40
20
120
80
0DE ES FR GR IT PL PT
2020201920172016 2018

81
ACER/CEER ANNUAL REPORT ON THE RESULTS OF MONITORING THE INTERNAL ELECTRICITY MARKETS IN 2020
273 In conclusion, the European Green Deal calls for the transformation of the energy system as a whole, and the electricity system in particular, to deliver clean, affordable and reliable electricity. Electricity markets should, through proper implementation of the recast Electricity Regulation, be the main source for deliver-ing the necessary level of SoS. In particular, electricity market integration improves resource adequacy, by enabling Member States to share resources and mitigate risks. CMs might still play a significant role, as a temporary way to address resource adequacy concerns. At the same time, CMs may introduce significant costs for consumers. As more MSs are considering the implementation of CMs, total costs of CMs in the EU will likely increase further.
274 In this respect, MSs should first focus on the implementation of the necessary market reforms to ensure a well-functioning market able to deliver the necessary level of SoS, before resorting to CMs.
275 When applying CMs to tackle any remaining adequacy concerns, MSs shall ensure that these comply with the design requirements from the recast Electricity Regulation238. Particular attention should be given to the calculation of the capacity needs, the procurement rules and the effective and reliable participation of all available capacity resources, including foreign capacity resources, to enable effective competition and moderate relevant costs.
276 The impact of CMs on neighbouring MSs shall be considered, especially if significant differences in CM designs arise between MSs.
277 At the same time, CM contracts should be carefully examined to avoid conflicts with other policies (e.g. decarbonisation) and undesirable technology lock-ins239.
278 ISs can provide services on different time scales: from a planned reduction of consumption during times of scarcity, to an automatic response to unexpected immediate needs of the network. In this overview, four IS services were identified: adequacy, balancing, congestion management and contingency reserves.
279 ISs may weaken the competitive and direct participation of consumers into CMs, balancing markets or network reserves by establishing a separate, DSR specific, procurement channel for these services. To ensure a level-playing field, maximise competition and avoid market fragmentation, the services related to ISs should preferably be integrated within existing procurement channels. Dedicated ISs should only be left to cases where no parallel procurement channels exist, or when there is a need to kick-start the development of new DSR products or services.
280 Concerning ISs that target adequacy, balancing services or any remedial actions for congestion manage-ment, such needs should first be addressed through technology-neutral (and DSR inclusive) markets, rather than separate measures. MSs should endeavour to enable full participation of DSR in these markets that are becoming more and more integrated on an EU level.
238 Based on the requirement of Article 22 of the recast Electricity Regulation.
239 E.g. by including additional sustainability criteria for the longer term.
Interruptibility schemes supported the resolution of the system separation in the Continental Europe Synchronous Area on 8 January 2021
From Portugal to Turkey, interconnected transmission grids of Continental Europe operate synchronously. On 8 January 2021, this synchronous area was separated into two parts (North West and South East), due to cas-cading tripping of several transmission network elements. A number of coordinated actions taken by the TSOs ensured that the two areas were resynchronised in around an hour.
In France and Italy, measures of the defence plans (ISs) were automatically activated which helped restoring the system frequency in the North-West area. Around 1.7 GW of automatic interruptible load was disconnected in France and Italy, in order to reduce the frequency deviation. The interrupted load accounted for around 90 % of the capacity of the French scheme, and 10 % of the Italian mainland scheme.
Find out more about the event here.

82
ACER/CEER ANNUAL REPORT ON THE RESULTS OF MONITORING THE INTERNAL ELECTRICITY MARKETS IN 2020
281 About contingency reserves, while automatically activated and fast responsive ISs may be well suited, these ISs may affect the synchronous area in which they operate. In this respect, TSOs should consider coordinating the dimensioning of the necessary capacity, the triggering criteria and the procurement to ensure an effective and efficient scheme. The procurement of these contingency reserves should be pro-portionate, market-based, cost-efficient240, and enable wide participation of DSRs (e.g. via aggregation) or other technologies (e.g. storage).
240 AccordingtoArticle20(3)(f)oftherecastElectricityRegulation.

83
ACER/CEER ANNUAL REPORT ON THE RESULTS OF MONITORING THE INTERNAL ELECTRICITY MARKETS IN 2020
7 Efficient price formation and easy entry and participation for new entrants and small actors in wholesale electricity markets
282 The recast ACER Regulation241 requires ACER to monitor, among other topics, state interventions prevent-ing prices from reflecting actual scarcity and regulatory barriers for new market entrants and smaller actors in the wholesale electricity markets. To be able to fulfil this task, ACER commissioned a methodo-logical study aiming to identify barriers and indicators to assess the performance of the MSs in terms of efficient price formation and easy market entry and participation of new actors and small entrants242.
283 This chapter assesses the presence of eleven relevant barriers across the MSs in 2020243 through differ-ent indicators proposed in the above mentioned study244. The barriers are separately identified for each of the two aspects required by the recast ACER Regulation, i.e. the barriers to efficient price formation and the barriers impacting the entry and/or participation of new entrants and smaller actors in wholesale electricity markets.
284 To determine specific barriers to efficient price formation, several aspects are examined. First, both ener-gy and capacity products in all market timeframes, i.e. from forward markets to balancing markets includ-ing imbalance settlement, are considered. Second, any requirement or market design feature preventing prices to be cost-reflective or to fluctuate freely is considered as a potential barrier to efficient price formation. Third, barriers due to insufficient market integrity and transparency are also part of the scope.
285 Several factors affect the barriers to entry and/or participation of new entrants and small actors. First, the following categories of new or small market actors are included: i) new business models aiming at pro-viding flexibility to the electricity system, ii) new technologies or market players with experience in other markets (such as energy efficiency services, IT and software development) entering in the electricity markets and iii) small actors without economies of scale. Second, any discriminatory, arbitrary or avoid-able requirement imposed on market participants is considered as a potential barrier to their easy market entry and participation.
286 Table 7 shows all the barriers identified in the methodological study and their categorisation. In the follow-ing sections, eleven out of the seventeen barriers are analysed individually. An overview of the presence and intensity of each barrier across the MSs is included in Table i and Table ii of the Executive Summary. The intensity of each barrier was measured with a total normalised indicator ranging from 0 to 1 and quali-fied as highly restrictive (if it was below or equal to 0.2), moderate (from 0.2 up to 0.4), light (from 0.4 to 0.6) or not relevant if the indicator was above 0.6. The list of the eleven barriers analysed in this report together with the scoring system for each barrier and the underlying indicators can be found in Table 21 in Annex 4. A comprehensive set of results for all the indicators used can be found in ACER’s website.
241 Article 15 of the recast ACER Regulation.
242 For more information, please see the methodological study at: https://extranet.acer.europa.eu/en/Electricity/Market%20monitoring/Documents_Public/DNV_Final%20Report%2018%20August%202021_Rev2.0.pdf.
243 While the methodological study identified seventeen potential barriers, this chapter focuses on eleven barriers, which were selected based on the relative importance given by stakeholders, NRAs, ACER and the consultants to the different barriers, and on the data availability. No specific barrier to efficient price formation was analysed in Cyprus and Malta since they do not have wholesale electricity markets and their power systems are not interconnected with the EU mainland power systems.
244 For more information about the indicators assessed under each barrier, the methodology to combine them and their thresholds, please refer to Table 21 in Annex 4.
84
ACER/CEER ANNUAL REPORT ON THE RESULTS OF MONITORING THE INTERNAL ELECTRICITY MARKETS IN 2020
Table 7: Barriers to efficient price formation and easy market entry and participation for new entrants and small actors – 2020
Barrier category Barrier
EFFI
CIEN
T PR
ICE
FORM
ATIO
N Regulation and market design
Price limits and restrictions on features of imbalance settlement
Potential market distortions due to support schemes
Potential market distortions due to capacity mechanisms
End-user price interventions*
Limited incentive to contract dynamic retail prices*
Restrictive requirements in prequalification and/or the design of products for balancing**
Market structure and performance
Limited competitive pressure and/or liquidity in wholesale markets
Scope for strengthening market integrity
Scope for increasing market transparency
Network services and operations
Insufficient cross-zonal capacity
Bidding zones not reflecting structural congestions
Scope for improving transparency, cost-reflectivity and non-discrimination in network tariffs
Insufficient information provided by system operators*
NEW
ENT
RANT
S AN
D SM
ALL A
CTOR
S
Regulation and market design
Complex, lengthy and discriminatory administrative and financial requirements
Lack of a proper legal framework to enable new entrants and small actors
Restrictive requirements to participate in capacity mechanisms and interruptibility schemes
End-user price interventions*
Limited incentive to contract dynamic retail prices*
Restrictive requirements in prequalification and/or the design of products for balancing**
Market structure and performance Limited competitive pressure in the retail market
Network services and operationsLack of incentives to consider non-wire alternatives
Insufficient information provided by system operators*
Source: ACER based on DNV study on a methodology to benchmark the performance of the EU Member States in terms of i) efficient price formation; and ii) easy market entry and participation for new entrants and small actors Note: *Same barrier and same indicators for efficient price formation and new entrants and small actors. ** Same barrier but different underlying indicators for efficient price formation and new entrants and small actors.The category “regulation and market design” refers to barriers related to market design and functionality caused by the unsuc-cessful implementation of legislation. The category “market structure and performance” refers to barriers related to the market participants and their behaviour or features. The category “network services and operations” refers to barriers related to infra-structure, operation and access to the transmission and distribution networks, constraints management, information sharing, etc.

85
ACER/CEER ANNUAL REPORT ON THE RESULTS OF MONITORING THE INTERNAL ELECTRICITY MARKETS IN 2020
7.1 Price limits and restrictions on features of imbalance settlement
287 This section assesses the presence of price restrictions and to what extent they constitute a barrier in electricity wholesale markets across the EU. As described in the methodological study, price restrictions can be either price caps or floors envisaged in national Regulations or they can relate to market design features, limiting the free fluctuation of prices. The latter includes features of imbalance settlement that may impact the efficiency of the market price signals close-to-real time.
288 With regards to price caps and floors, the recast Electricity Regulation245 states that as of 1 January 2020 there shall be neither maximum nor minimum limits to bidding and clearing in the wholesale electricity prices, including balancing energy and imbalance prices without prejudice to the harmonised technical limits on clearing prices that may be applied in the day-ahead and intraday timeframes by NEMOs, and in the balancing timeframe. NEMOs shall implement a transparent mechanism to adjust automatically the technical bidding limits in due time in the event that the set limits are expected to be reached246 in line with the ACER Decisions on the matter247.
289 Non-technical price limits and a lack of harmonisation in technical price limits may represent a direct bar-rier to price formation. They may prevent market prices from reflecting the actual value of scarcity during times of system stress and high demand or when energy production is in abundance. Moreover, such lim-its may lead to inaccurate dispatch and investment signals, and, when they are only applied in some MSs, they prevent market participants from competing on a level playing field with European counterparties. With an increasing variable power generation, accurate price signals are more and more needed to en-courage market participants to adapt their generation or consumption close-to-real-time and to promote investments in flexible units of all types, including demand response and energy storage.
290 Despite significant progress in the integration of electricity markets in recent years, the free fluctuation of DA and ID prices remained an unattained objective in a few MSs in 2020. In particular, non-harmonised maximum and minimum bid limits remained in the Iberian and Italian markets in 2020 with 180 and 0 eu-ros/MWh in DA and ID markets of Portugal and Spain248, a maximum bid limit of 3000 euros/MWh in the ID Italian market and a minimum bid limit of 0 euros/MWh in DA and ID Italian markets249. These bid limits impact price formation in the entire SDAC and SIDC areas. In the 2018-2020 period, the minimum limit was reached 1470, 78 and 48 times in the ID markets of Italy, Portugal and Spain, respectively and 648 times in the DA market of Italy250. The maximum limit was reached twice in ID market of Portugal, and only once in the ID market of Italy. As mentioned above, from 2020, there should be neither a maximum nor a minimum limit to the wholesale electricity price as set in Article 10.1 of the recast Electricity Regulation.
291 With regard to the balancing timeframe, there are no EU-wide harmonised price limits yet, except for the technical price limits (+/-99,999 euros/MWh) set in ACER Decision No 01/2020251, which will be applicable as soon as the relevant EU balancing energy platforms become operational. Anticipating the go-live of these platforms, in 2020 some MSs (Austria, Germany, Spain, Portugal and Romania) already adopted the technical price limits envisaged in the aforementioned ACER decision (Figure 50)252.
245 Article 10.1 of the recast Electricity Regulation.
246 Article 10.2 of the recast Electricity Regulation.
247 ACER Decision No 04/2017 on the Harmonised Maximum and Minimum Clearing Prices for Single Day-Ahead Coupling, available at: https://documents.acer.europa.eu/Official_documents/Acts_of_the_Agency/Individual%20decisions/ACER%20Decision%2004-2017%20on%20NEMOs%20HMMCP%20for%20single%20day-ahead%20coupling.pdf ACER Decision No 05/2017 on the Harmonised Maximum and Minimum Clearing Prices for Single Intraday Coupling, available at: https://documents.acer.europa.eu/Official_documents/Acts_of_the_Agency/Individual%20decisions/ACER%20Decision%2005-2017%20on%20NEMOs%20HMMCP%20for%20single%20intraday%20coupling.pdf.
248 As of 6 July 2021, Spain and Portugal removed the maximum and minimum limits to bidding and clearing in the DA and ID markets. These limits were replaced by the harmonised maximum and minimum clearing prices applied in the bidding zones participating in the SDAC (3,000euros/MWhand-500euros/MWhinlinewithACERDecisionNo04/2017)andintheSIDC(+/-9,999euros/MWhinlinewiththeACERDecisionNo05/2017).Formoreinformationpleasereferto:https://www.boe.es/eli/es/res/2021/05/06/(2)/con.
249 Italy is expected to remove the DA and ID bid limits when joining the SIDC in Q3 2021.
250 In Italy, the values are counted separately for each bidding zone and then aggregated.
251 ACER Decision No 01/2020 on the methodology to determine prices for the balancing energy that results from the activation of balancing energy bids, available at: https://documents.acer.europa.eu/Official_documents/Acts_of_the_Agency/Individual%20decisions/ACER%20Decision%2001-2020%20on%20the%20Methodology%20for%20pricing%20balancing%20energy.pdf.
252 From1January2018until31December2020,Germanyremainedthetechnicalpricelimitsforbalancingenergyequalto+/-99,999euros/MWh with the exception of the periods from 6 January 2018 to 11 July 2018, from 15 July 2018 to 14 October 2018, and from 17 October 2019to2November2020whentheselimitswerenarrowedto+/-9,999euros/MWh.

86
ACER/CEER ANNUAL REPORT ON THE RESULTS OF MONITORING THE INTERNAL ELECTRICITY MARKETS IN 2020
292 When balancing energy price limits are often reached, this is an indication that the free fluctuation of prices is somehow constrained. The narrower the limits and the more frequent they are reached, the more severe the constraint is. In the 2018-2020 period, some balancing energy markets reached their technical price limits (either the maximum or the minimum price) revealing their restrictive nature: Ireland (22 times), Ger-many (13 times)253, and Greece (twice). In Italy and Romania, the price limits were also frequently reached: in Italy, 21,232 balancing energy bids at price of zero were activated in the 2018-2020 period254 and in Romania, the balancing settlement price reached the price limits 14,757 times in the period from 1 January 2018 to 30 August 2020255. The frequent occurrence of prices reaching the limits may also relate to imper-fect market behaviour or market design issues. In the latter case, actions to improve market design, includ-ing alignment with the European target model for balancing markets, should be envisaged. In any case, regulatory authorities should investigate the reasons underlying the occurrence of these price events.
Figure 50: Maximum and minimum technical price limits for balancing energy products per MSs – 2020 (eu-ros/MWh)
Source: ACER based on NRAs data. Note: NA in Bulgaria and NAP in Malta and Cyprus. The figure shows the technical price limits as of 31 December 2020.
293 As above explained, besides price caps or floors imposed by national Regulation, price formation may also be constrained by some features of the imbalance settlement mechanism. The analysis below assesses some of these features at national level, against the European target model set in the EU Regulation, which aims, among other purposes, at ensuring that BRPs are exposed to market price signals as much as possible.
294 First, the EB Regulation and the recast Electricity Regulation set that the imbalance settlement period (ISP) shall be harmonised to 15 minutes by 1 January 2021256. This harmonisation aims to support ID trading and foster the development of a number of trading products with the same delivery windows. A shorter ISP makes imbalance prices more cost-reflective thus giving more incentives to the BRPs to re-duce their imbalances or even support the system within the TSO’s required time to restore frequency257. In general, a shorter ISP also allows to reveal the value of energy, including at times of scarcity, more accurately. In 2020, most MSs still had an ISP longer than 15 minutes: 30 minutes in France and Ireland and one hour in Bulgaria, Croatia, the Czech Republic, Denmark, Estonia, Finland, Italy258, Latvia, Lithu-ania, Norway, Poland, Slovenia, Spain and Sweden.
253 This figure refers to the period from 12 July 2018 to 31 December 2020. In particular, in the period from 15 July 2018 to 2 November 2020, threebalancingenergybids(twoforaFRRandanotheroneformFRR)wereactivatedatthetechnicalpricelimitof+9,999euros/MWhwhile ten balancing energy bids were activated at the technical price limit of +99,999 euros/MWh for aFRR in the period from 3 November 2020 to 31 December 2020. After the upper technical price limit (+99,999 euros/MWh) was reached repeatly in 2020, Germany narrowed bothtechnicalpricelimitsto+/-9,999euros/MWhonceagaininJanuary2021.Thismaycausethelimitstobereachedmoreoften.
254 This value is not comparable with the number of occurrences reported for the other countries, as information on the number of market time units where the minimum price of 0 euros/MWh was reached, was not available.
255 ThisfigurereferstothenumberofMTUs(MTU=1hour)inwhichatleastonebalancingsettlementpricereachedtheregulatedpricefloor(RON0,1/MWh)and/ortheregulatedslidingcap(DAMclearingpriceinthatMTU/ISP+RON450/MWh)intheperiodfrom1January2018to 31 August 2020. In some of these MTUs, both the floor and sliding cap price limits were reached. The pricing mechanism was marginal pricing for aFRR and pay-as-bid for mFRR and RR. Romania removed these price limits from 1 September 2020.
256 Derogations to the 15-minute ISP are possible until the end of 2024. From 1 January 2025, the ISP shall not exceed 30 minutes where an exemption has been granted within a synchronous area.
257 The TSOs are required to restore the system frequency within 15 minutes, as set in Annex 3, Table 1 of the SO Regulation, available at: https://eur-lex.europa.eu/legal-content/EN/TXT/PDF/?uri=CELEX:02017R1485-20210315&from=EN.
258 The ISP is one hour for units that are not eligible to provide ancillary and balancing services. Otherwise, it is 15 minutes.
euro
s/MW
h
120,000
60,000
-30,000
90,000
30,000
-90,000
0
-60,000
-120,000CZ
89.54
SK HU GR DK LT NO LV EE FI SE FR SI PL IE BE IT AT DE/LU ES PT RO HR NL
145 312.3 4,240 5,000 5,000 5,000 5,000 5,000 5,000 5,000 9,999 9,99910,834.71
11,000 13,500
89.54 -35-4,240 -5,000 -5,000 -5,000 0
-9,999 -9,999-10,834.71
-1,000-13,500
Maximum technical price limit Minimum technical price limit No limit implemented

87
ACER/CEER ANNUAL REPORT ON THE RESULTS OF MONITORING THE INTERNAL ELECTRICITY MARKETS IN 2020
295 Second, the rules related to imbalance prices and positions are also important design features to ensure that market participants are exposed to freely formed market prices, as much as possible. This includes the pricing model and the treatment of final positions.
296 The pricing model can either be a dual or a single price. This has implications on cost-reflectivity and on the related incentives for BRPs to support the system. Single pricing, as the EU target model envisaged in the EB Regulation259, is directly linked to the system needs since all BRPs, irrespective of their imbalance, are exposed to the same imbalance price and therefore they are incentivised to support the system´s imbalance by reducing the TSO demand for balancing energy. On the contrary, under dual pricing, imbal-ance prices are usually capped or linked to other market timeframes, so BRPs do not see the incentives of supporing the system´s needs. As a result, dual pricing is less cost-reflective and does not provide sufficient incentive for BRPs to keep or restore the system balance. In addition, dual pricing discriminates against smaller market players since unlike large actors, they cannot aggregate imbalances within a big portfolio to minimise their imbalance costs.
297 The final position of a BRP refers to the sum of its external and internal trade schedules used by the TSO to calculate its imbalance. Under dual position, the schedules for production and consumption are set-tled separately, which incentivises producers and consumers to keep their individual schedule in balance, instead of jointly supporting the system. Under single position, the EU target model260, there is only one position that represents the net buy or sell of electricity to other BRPs. Among other advantages, a single position incentivises the participation of smaller flexible units in balancing markets. They can be aggregat-ed into one balancing energy bid without the need to separate imbalance adjustments into two portfolios.
298 Table 8 shows the imbalance settlement rules (pricing and position) across the EU in 2020 and whether or not they were partially or fully in line with the European target model.
Table 8: Final positions and settlement rule per MS – 2020
Single pricing Dual pricingSingle position AT, BE, BG, DE, EE, FR, HR, NL*, LV, LT, PL, RO, SK CZ, ES, HU, NL*, SIDual position (or more) DK**, FI**, GR, IE, IT***, NO**, SE** DK**, ES, FI**, IT***, NO**, PT, SE**
Source: ACER based on ENTSO-E AS Survey 2020 and NRAs data.Note: Not applicable for Cyprus and Malta. *The Dutch system applies dual pricing under the following circumstances: where both positive and negative balancing energy is activated and where a preferred direction cannot generally be determined.**Denmark, Finland, Norway and Sweden have two positions (generation and consumption) with dual pricing for generation and single pricing for consumption***In Italy, the imbalance settlement rule consists of dual pricing for all units that are eligible to provide ancillary and balancing services and single pricing for the remaining units. The pricing scheme will become single pricing for all units in January 2022.
299 Overall, the analysis of explicit price restrictions (caps and floors) and some design features of imbalance settlement indirectly constraining price formation shows that in 2020 this barrier was relevant in Italy, Portugal and Spain (Table i).
259 Article 52 of the EB Regulation.
260 Article 3 of ACER Decision No 18/2020 the imbalance settlement harmonisation methodology – Annex I, available at: https://extranet.acer.europa.eu/Official_documents/Acts_of_the_Agency/Annexes%20to%20the%20DECISION%20OF%20THE%20AGENCY%20FOR%20THE%20C15/ACER%20Decision%2018-2020%20on%20balancing%20ISHP%20-%20Annex%20I.pdf.

88
ACER/CEER ANNUAL REPORT ON THE RESULTS OF MONITORING THE INTERNAL ELECTRICITY MARKETS IN 2020
7.2 Limited competitive pressure and/or liquidity in wholesale markets
300 Liquid wholesale markets are crucial to creating competitive pressure in both the retail and wholesale markets. The less liquid markets, the harder it is for non-vertically integrated firms to compete with verti-cally integrated firms and for new entrants and small actors to compete with incumbent firms. In addition, in low liquidity markets it is harder and more costly for market participants to find counterparts, thus lead-ing to inefficient prices in the market. Moreover, the use of mechanisms requiring some domestic genera-tors to offer production at regulated prices also limits competitive pressure in the wholesale markets thus affecting their liquidity.
301 This section assesses the extent to which low competitive pressure –using market concentration as a proxy– and/or low market liquidity levels may constitute a barrier in electricity wholesale markets. The analysis shows this barrier was present in nineteen MSs in 2020, becoming moderate in Belgium, Czech Republic, France, Hungary, Latvia, Romania, Slovakia and Slovenia (Table i). Converserly, the MSs pre-senting the best results were Germany/Luxembourg, Denmark, Finland, Italy and Norway.
302 Firstly, in 2020, Hungary, Belgium and the Czech Republic had a very low liquidity in their forward mar-kets: all with low churn factors and the Czech Republic and Hungary with the highest bid-ask spread of the countries analysed, as shown in Section 5.1. Their wholesale markets were also highly concentrated in 2019261: Belgium (91 % CR3262 and two generators covering more than 5% of national generation), the Czech Republic (82 % CR3; two generators) and Hungary (71 % CR3; three generators). Secondly, even though the liquidity of DA markets in Slovenia, Slovakia and Latvia was not very low in 2020 (Figure 38), they also have a relatively low competitive pressure in their wholesale markets. In 2019 the concentration rations reached: Slovenia (89 % CR3; two generators), Slovakia (79 % CR3; two generators) and Latvia (79 % CR3; one generator).
303 The presence of this barrier in France is rather MS-specific. Although France was the second most liquid forward market in 2020 (see Section 5.1), the competitive pressure is highly impacted by at least two fac-tors. Firstly, France had the highest level of concentration in the wholesale market in 2019 with a CR3 of 97 % and only two generators covering more than 5 % of national generation. Secondly, some domestic generators are required to offer their production at regulated prices, which limits the efficiency of the price signals. In 2020, France sold around 25 % of its electricity production through the ARENH mechanism at a fixed regulated price of 42 euros/MWh263. As shown in the 2015-2017 MMRs264, the liquidity levels in the French forward market are often dependant or at least affected on the relative levels of the ARENH and the wholesale markets prices, which illustrates how price regulation on the wholesale markets may reduce the competitive pressure and minimise the role of demand in these markets, thus affecting their liquidity.
304 It is important to note that Romania, Ireland and Italy also require some domestic generators to offer a share of their production at regulated prices. In Romania, the generators with this requirement must sell a share of their production to suppliers of last resort (SoLR) at a fixed regulated price265. In 2020, 69.8 % of the generation capacity concluded contracts at regulated prices representing 13 % of the total electricity sold in the MS. In Ireland and Northern Ireland, 21 % of the total capacity installed in 2020 was subject to the requirement to offer at a regulated price through directed contracts266.
261 2020 data on market concentration were not available at the time of producing this report.
262 CR3 is a traditional structural measure of market concentration based on market shares. In this report, we measure the concentration ratio 3 as the market share of the three largest generators in the wholesale market by volume. Both CR3 and the number of generators covering more than 5% of national generation refer to 2019 data since 2020 data was not available when producing this report.
263 The ARENH (regulated access to historical nuclear power) is an obligation for EDF to sell up to 100 TWh per year to the alternative suppliers at a regulated price. Since 2015, this mechanism has opened to the TSO and DSOs to cover their grid loss (around 26 TWh in2020).
264 For more information, please refer to Chapter 6 of the 2015MMR, Chapter 4 of the 2016 MMR and Chapter 4 of the 2017 MMR, available at: https://www.acer.europa.eu/electricity/market-monitoring-report#133.
265 Romania removed this requirement from 1 January 2021.
266 TheDirectedContractsareregulatedcontractsfordifference(CfDs)imposedbytheregulatoryauthorities(i.e.CRUandUREGNI)ontheincumbent generators deemed to have market power in the SEM.
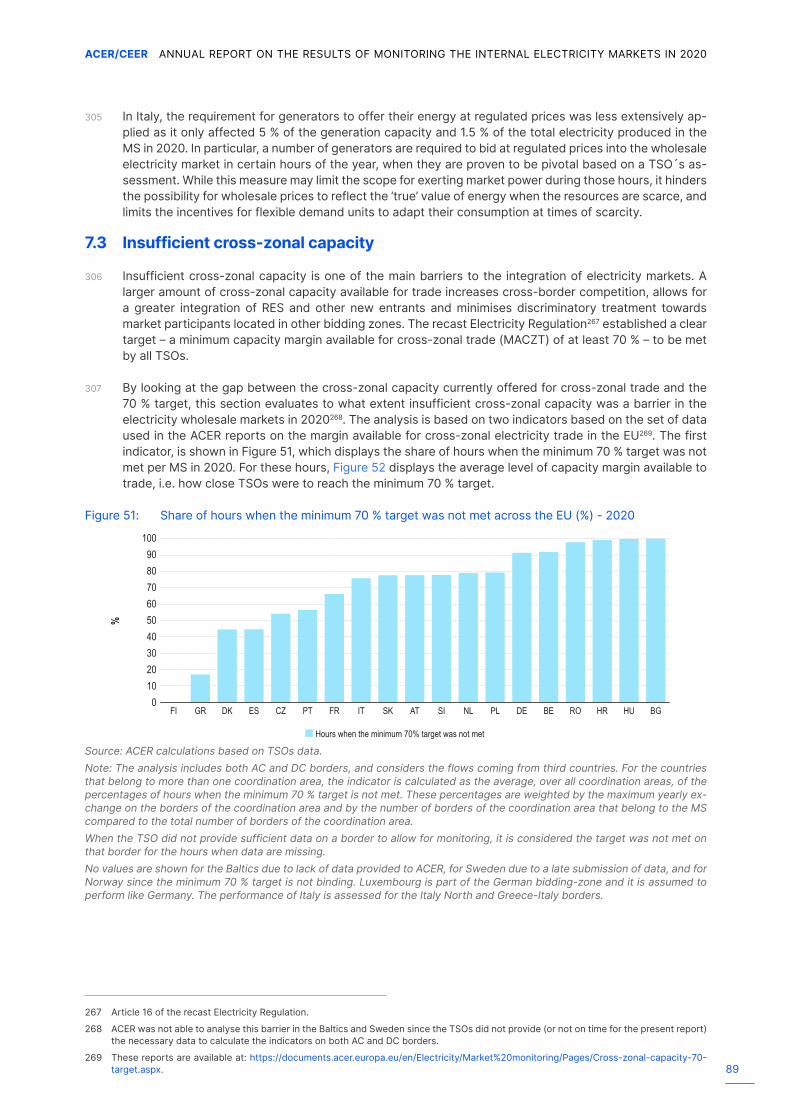
89
ACER/CEER ANNUAL REPORT ON THE RESULTS OF MONITORING THE INTERNAL ELECTRICITY MARKETS IN 2020
305 In Italy, the requirement for generators to offer their energy at regulated prices was less extensively ap-plied as it only affected 5 % of the generation capacity and 1.5 % of the total electricity produced in the MS in 2020. In particular, a number of generators are required to bid at regulated prices into the wholesale electricity market in certain hours of the year, when they are proven to be pivotal based on a TSO´s as-sessment. While this measure may limit the scope for exerting market power during those hours, it hinders the possibility for wholesale prices to reflect the ‘true’ value of energy when the resources are scarce, and limits the incentives for flexible demand units to adapt their consumption at times of scarcity.
7.3 Insufficient cross-zonal capacity
306 Insufficient cross-zonal capacity is one of the main barriers to the integration of electricity markets. A larger amount of cross-zonal capacity available for trade increases cross-border competition, allows for a greater integration of RES and other new entrants and minimises discriminatory treatment towards market participants located in other bidding zones. The recast Electricity Regulation267 established a clear target – a minimum capacity margin available for cross-zonal trade (MACZT) of at least 70 % – to be met by all TSOs.
307 By looking at the gap between the cross-zonal capacity currently offered for cross-zonal trade and the 70 % target, this section evaluates to what extent insufficient cross-zonal capacity was a barrier in the electricity wholesale markets in 2020268. The analysis is based on two indicators based on the set of data used in the ACER reports on the margin available for cross-zonal electricity trade in the EU269. The first indicator, is shown in Figure 51, which displays the share of hours when the minimum 70 % target was not met per MS in 2020. For these hours, Figure 52 displays the average level of capacity margin available to trade, i.e. how close TSOs were to reach the minimum 70 % target.
Figure 51: Share of hours when the minimum 70 % target was not met across the EU (%) - 2020
Source: ACER calculations based on TSOs data. Note: The analysis includes both AC and DC borders, and considers the flows coming from third countries. For the countries that belong to more than one coordination area, the indicator is calculated as the average, over all coordination areas, of the percentages of hours when the minimum 70 % target is not met. These percentages are weighted by the maximum yearly ex-change on the borders of the coordination area and by the number of borders of the coordination area that belong to the MS compared to the total number of borders of the coordination area. When the TSO did not provide sufficient data on a border to allow for monitoring, it is considered the target was not met on that border for the hours when data are missing. No values are shown for the Baltics due to lack of data provided to ACER, for Sweden due to a late submission of data, and for Norway since the minimum 70 % target is not binding. Luxembourg is part of the German bidding-zone and it is assumed to perform like Germany. The performance of Italy is assessed for the Italy North and Greece-Italy borders.
267 Article 16 of the recast Electricity Regulation.
268 ACER was not able to analyse this barrier in the Baltics and Sweden since the TSOs did not provide (or not on time for the present report) the necessary data to calculate the indicators on both AC and DC borders.
269 These reports are available at: https://documents.acer.europa.eu/en/Electricity/Market%20monitoring/Pages/Cross-zonal-capacity-70-target.aspx.
%
1009080
60
30
70
50
10
40
20
0
Hours when the minimum 70% target was not met
FI GR DK ES CZ PT FR IT SK AT SI NL PL DE BE RO HR HU BG

90
ACER/CEER ANNUAL REPORT ON THE RESULTS OF MONITORING THE INTERNAL ELECTRICITY MARKETS IN 2020
Figure 52: Average MACZT on network elements where the minimum 70 % target was not met (%) - 2020
Source: ACER calculations based on TSOs data. Note: The analysis includes both AC and DC borders, and considers the flows coming from third countries. For the countries that belong to more than one coordination area, the indicator is calculated as the average, over all coordination areas, of the average MACZT over network elements that do not meet the minimum 70 % target. These percentages are weighted by the maximum yearly exchange on the borders of the coordination area and by the number of borders of the coordination area that belong to the MS compared to the total number of borders of the coordination area. For flow-based coordination areas (i.e. CWE), the MACZT refers to the weakest network element, i.e. the one whose hourly MACZT is the lowest. No values are shown for the Baltics due to lack of data provided to ACER, for Sweden due to a late submission of data, and for Norway since the minimum 70 % target is not binding. Luxembourg is part of the German bidding-zone and it is assumed to perform like Germany. The performance of Italy is assessed for the Italy North and Greece-Italy borders.
308 As shown above and further specified in ACER’s specific reports on the matter270, the levels of MAZCT were very diverse across the EU, depending on the type of border – not explicitly shown in the above figures – and on the geographical location.
309 Overall, the combined analysis of the above described indicators shows that the room for improvement is significant for most countries (Table i). The Core TSOs, Italy, Bulgaria and Romania need to make the big-gest effort to meet the minimum 70 % target. Conversely, the regions and countries presenting the best results are the SWE region, the Nordic region, Greece and the Czech Republic, for which the target was reached more than half of the time in 2020.
7.4 Bidding zones not reflecting structural congestions
310 As shown in Section 4.4, the current bidding zone configurations in Europe do not often reflect the un-derlying structural congestions. This hinders the efficient operation and planning of the EU electricity network and the provision of effective price signals for generation, demand side response and transmis-sion infrastructure.
311 The conclusions of this section are based on two indicators that illustrate the extent to which the delinea-tion of bidding zones are aligned with physical congestions. These indicators are the average (burdening) loop flows on interconnectors and the redispatching costs per bidding zone in the 2018-2020 period271.
312 The indicator on loop flows indicates the extent to which exchanges within a zone consume capacity on interconnectors. The indicator on redispatching costs reveals the extent to which the delineation of bidding zone allows to address congestions in the market without the need to extensively apply remedial actions.
270 See footnote 269.
271 See note under Table 20.
%
1009080
60
30
70
50
10
40
20
0
Average MACZT on CNECs where the minimum 70% target was not met
minimum 70% target
GR PT CZ BE ES FR AT SK SI RO NL DE DK PL IT HU BG HR
91
ACER/CEER ANNUAL REPORT ON THE RESULTS OF MONITORING THE INTERNAL ELECTRICITY MARKETS IN 2020
313 In the 2018-2020 period, Germany was, by far, the MS causing more loop flows on average272 (consuming 4.9 % of the thermal capacity of all interconnectors in continental Europe), followed by France (2.1 %), Italy (1.2 %), Romania (0.9 %) and Austria (0.9 %). The borders that were more impacted by the German loop flows were all the AC interconnectors of Denmark (constraining 14 % of its thermal capacity), the Nether-lands (12 %), Belgium and Poland (both 10 %) while the borders that were more impacted by the French loop flows were Italy (9 %), the Switzerland (4 %) and Spain and Belgium (both 3 %). Further details on the BZs that were more impacted by the loop flows originated in these countries can be found in Section 4.4 and Annex 2.
314 Moreover, in the 2018-2020 period, the highest redispatching costs per unit of demand were found in Germany (2.1 euros/MWh) and Austria (2.1 euros/MWh), followed at some distance by Spain (0.7 euros/MWh), The Netherlands (0.6 euros/MWh) and Latvia (0.4 euros/MWh)273.
315 Overall, the combined analysis of the above indicators (Table i) indicates that the German bidding zone is the one reflecting the underlying congestions the least, which represents a significant barrier to efficient price formation. To a lesser extent this barrier is present in Austria and Spain. In some cases, such as the Baltics, where the costs of redispatching appear to be increasingly high in recent years, the absence of sufficient network information provided by the Baltic TSOs does not allow drawing a clear conclusion about the delineation of their bidding zones.
7.5 Restrictive requirements in prequalification and/or the design of products for balancing
316 The EB Regulation and the recast Electricity Regulation lay down rules for the integration of the balancing markets in Europe with the purpose of ensuring effective competition and non-discrimination between market participants as well as efficient price signals through balancing services defined and procured in a transparent, technologically neutral and market-based manner. Even though some features of the Euro-pean target model envisaged in the aforementioned pieces of Regulation and their related methodologies are not binding yet, this section aims to assess to what extent some product requirements and design features of the current national balancing markets are still not in line with the European target model and how this may represent a barrier. An overview of the parameters analysed per balancing market is shown in Table 22 in Annex 4.
317 As further explained below, some key design elements of the national balancing markets may distort wholesale price signals, increasing the cost of providing flexibility. These design variables include regu-lated or pay-as-bid pricing, pro-rata activation of balancing reserves, long procurement lead times, bal-ancing energy prices predetermined in capacity contracts, and restrictions to submit free energy bids.
318 Some product specifications and features of balancing markets, originally designed in a context of cen-tralised production, may also limit the participation of demand side response, decentralised production and energy storage. Among others, these parameters include long delivery periods and large minimum capacities required in the prequalification process, long validity periods of the balancing energy bids, long balancing capacity contracts, large minimum bid sizes, restrictions to the participation of aggregators274 and the obligation to provide symmetric balancing capacity. Similarly, long procurement lead-times and regulated or pay-as-bid pricing may also hinder participation of new entrants and small actors.
272 The burdening loop flow created by a country in another network line is estimated as the ratio of the thermal capacity of this network line that is consumed by the loop flow in the direction of the congestion. Flow decomposition is applied to estimate the magnitude of the loop flow. For more information on the flow decomposition methodology applied, please refer to ACER Decision No 30/2020 on the Core CCR TSO´s proposal for the methodology for cost sharing of redispatching and countertrading, available at: https://documents.acer.europa.eu/Official_documents/Acts_of_the_Agency/Individual%20decisions/ACER%20Decision%2030-2020%20on%20Core%20RDCT%20Cost%20Sharing.pdf.ThecalculationisbasedontworepresentativewinterandsummerD2CF(Day-2CongestionForecast)networkmodelsforthe2018-2020years.ThesenetworkmodelscovertheContinentalEuropesynchronousareaonlysincethenetworkmodels of the synchronous areas of the Nordics (with the exception of the continental part of Denmark), the Baltics, the UK, Ireland, Malta and Cyprus are not available.
273 As Greece, Ireland, Italy and Poland apply a central dispatching model, the costs specifically linked with redispatching measures are not available in these countries.
274 For example, if aggregators of load cannot be prequalified as reserve providing groups or stringent restrictions on the size of the physical units that can be aggregated are imposed.

92
ACER/CEER ANNUAL REPORT ON THE RESULTS OF MONITORING THE INTERNAL ELECTRICITY MARKETS IN 2020
319 As a whole, the analysis of this barrier shows that the product specifications and market features ana-lysed restricted price formation in ten MSs in 2020 although to a greater extent in Croatia and Slovakia (see Table i). When the analysis is made from the perspective of new entrants and small actors, the barrier was found more widely restrictive, impacting eighteen MSs. In these MSs, the barrier was more severe (moderate) in Bulgaria, Croatia, Italy, Portugal, Romania and Sweden (see Table ii). Only in Austria, Belgium, Germany, Estonia, Ireland and the Netherlands, this barrier was not found to be restrictive for neither efficient price formation nor new entrants and small actors.
7.5.1 Duration of the delivery period
320 The delivery period is the period of time during which the BSP delivers the full requested change of power in-feed to or withdrawal from the connected TSO system for mFRR and RR275. TSOs prequalify BSPs for a minimum and a maximum delivery period276. In the current prequalification process, both can range from zero minutes (i.e. the TSO only requires BSPs to ramp up and down as minimum requirement) to more than four hours. The European target model sets a minimum delivery period of five minutes for standard mFRR277 balancing products. The duration of the delivery period for standard RR balancing products can be 15, 30 or 60 minutes278. Too long delivery periods, either minimum or maximum, may represent a direct barrier for some new entrants and small actors. As an example, four hours or longer maximum delivery periods can limit DSR access, since most of residential and tertiary consumers are only able to activate their flexibility during one or two hours a day at most.
321 In 2020, Austria and Germany had a maximum delivery period of four hours for mFRR (the longest maxi-mum across the MSs), i.e. BSPs were required to be able to deliver the maximum power for four hours. The maximum delivery period was even more restrictive in Slovenia, Finland and Slovakia reaching more than four hours, even though Slovenia and Slovakia did not have a minimum delivery period. For RR, Por-tugal and Spain had a minimum and maximum delivery period of one hour (the longest minimum across the MSs). The maximum delivery period was even more restrictive in Italy reaching more than four hours.
7.5.2 Minimum capacity required in the prequalification process and minimum bid size
322 The European target model sets that the minimum quantity of the energy bid volume offered and the bid granularity279 for standard balancing products shall be 1MW for all reserve types280, which facilitates entry of small market participants such as RES generators or industrial DSR. Some balancing markets with big minimum bid size allow bidding with a pool of assets (i.e. reserve-providing groups), thus reducing the entry barrier.
323 In 2020, the minimum bid size was less or equal to 1MW for most balancing reserve types in most MSs although there were still larger values as shown in some examples below (more information in Table 22).
275 This design parameter is not applicable for aFRR and FCR where the TSO procures continuous products.
276 During the prequalification, a BSP is required to deliver during a minimum period after which it should be able to gradually reduce the delivery of balancing energy, and during a maximum period during which the BSP should be able to deliver the required energy without interruption.
277 ACER Decision No 3/2020 on the Implementation framework for mFRR Platform – Annex I, available at: https://documents.acer.europa.eu/Official_documents/Acts_of_the_Agency/Annexes%20to%20the%20DECISION%20OF%20THE%20AGENCY%20FOR%20THE%20C4/ACER%20Decision%20on%20the%20Implementation%20framework%20for%20mFRR%20Platform%20-%20Annex%20I.pdf.
278 Approval by relevant regulatory authorities on the proposal of all TSOs performing the reserve replacement process for the implementation frameworkfortheexchangeofbalancingenergyfromRRsinaccordancewithArticle19ofCommissionRegulation(EU)2017/2195of23 November 2017 establishing a guideline on electricity balancing, available at: https://extranet.acer.europa.eu/en/Electricity/MARKET-CODES/ELECTRICITY-BALANCING/02%20RR%20IF/Action%202%20-%20RR%20IF%20NRA%20approval.pdf. The proposal of all TSOs performing the reserve replacement process for the implementation framework for the exchange of balancing energy from Replacement Reserves inaccordancewithArticle 19ofCommissionRegulation (EU)2017/2195of23November2017establishingaguidelineonelectricity balancing, available at: https://extranet.acer.europa.eu/en/Electricity/MARKET-CODES/ELECTRICITY-BALANCING/02%20RR%20IF/Action%201%20-%20RR%20IF%20proposal%20approved.pdf.
279 The lowest possible increment for offers above the minimum bid size.
280 This requirement already applies in the TERRE platform for exchanging balancing energy from RRs and it will be binding in the upcoming European platforms for aFRR and mFRR by July 2022. If there is a derogation, the requirement will be binding from July 2024. More information in ACER Decision No 2/2020 on the Implementation framework for aFRR Platform – Annex I (available at: https://documents.acer.europa.eu/Official_documents/Acts_of_the_Agency/Annexes%20to%20the%20DECISION%20OF%20THE%20AGENCY%20FOR%20THE%20C3/ACER%20Decision%20on%20the%20Implementation%20framework%20for%20aFRR%20Platform%20-%20Annex%20I.pdf) andACERDecisionNo3/2020(seefootnote277).

93
ACER/CEER ANNUAL REPORT ON THE RESULTS OF MONITORING THE INTERNAL ELECTRICITY MARKETS IN 2020
324 ForFCR,theminimumbidsizereachedthelargestvalues(1MW<x≤5MW)inRomania281, the Czech Re-public and Bulgaria (all for balancing capacity) in 2020. In Romania, additional restrictions applied, first by requiring a high minimum capacity for prequalification282 and second by not allowing aggregation of load. In the Czech Republic, the minimum capacity required for prequalification was 3MW and aggregation was not allowed either283.
325 For aFRR, the minimum bid size reached 10MW284 in Romania (balancing capacity and energy) where other restrictive requirements existed since the same prequalification thresholds as for FCR applied.
326 For mFRR, the minimum capacity required and the minimum bid size for balancing capacity reached 20MW in the Netherlands (balancing capacity) although aggregation of load was allowed285.
327 For RR, the minimum bid size was higher than 10MW in Portugal (balancing energy). In France, the mini-mum bid size for mFRR and RR (balancing energy and capacity) was 10MW although an ongoing pilot project allows market participants to offer up to two upward bids below 1MW and 10MW. Consequently, BSPs in France must prequalify 1MW and 10MW for upward and downward bids, respectively.
7.5.3 Validity period of the balancing energy bids
328 The validity period of the balancing energy bids is the minimum resolution for which the product is re-quired to bid into the market. It can range from fifteen minutes until four hours (or blocks). Too long bal-ancing energy products prevent participation of market players leading to higher balancing energy prices with lower price fluctuation. The EB Regulation prescribes that the imbalance settlement period should be harmonised to fifteen minutes in order to provide consistent incentives to both BSPs and BRPs. Balancing energy products should also comply with this resolution.
329 In 2020, the validity period of the balancing energy bids was still higher than fifteen minutes for most jurisdictions. For aFRR and mFRR, in 2020 most countries required the procurement of hourly products reaching four-hour products in Germany and Austria. For aFRR, only Romania, the Netherlands and Bel-gium required the procurement of fifteen min-products while for mFRR, only the Netherlands, Belgium and Greece met this requirement. For RR, most countries used one-hour products in 2020; only the Czech Republic procured fifteen min-products (more information in Table 22).
7.5.4 Procurement lead-time and length of the balancing capacity contracts
330 Pursuant to the Article 6(9) of the recast Electricity Regulation, procurement lead-time286 and the dura-tion of the balancing capacity contracts287 shall be no longer than one day after 1 January 2020, unless a derogation applies288.
281 In Romania, all hydro and thermal units with a capacity higher than 10MW and 20MW, respectively, must provide FCR. To ensure this requirement, a unique quantum of reserve must be kept for FCR consisting of at least 1% of the rated power. This is estimated as a minimum bid size between to 1MW to 5MW as reserve per unit larger than 100MW.
282 See footnote 281.
283 From 1 January 2021, the Czech Republic reduced the minimum capacity required to prequalify and the minimum bid size until 1MW and aggregators became eligible to participate in balancing markets.
284 InRomaniawheretheactivationofaFRRispro-rata,theminimumregulatingbandwas10MW,i.e.asymmetricalreserve+/-5MW(upanddown).
285 The Dutch TSO TenneT intends to lower the minimum capacity to prequalify as well as the bid size to 1MW by 2022.
286 Time-lag between the balancing capacity auction (gate closure of the balancing capacity market) and the start of the contract period in which the balancing capacity must be offered as balancing energy in the real-time market.
287 When the balancing capacity offered by a BSP is accepted, the BSP is obliged to offer a certain volume of balancing energy during a certain period.
288 Article6(9)oftherecastElectricityRegulation.

94
ACER/CEER ANNUAL REPORT ON THE RESULTS OF MONITORING THE INTERNAL ELECTRICITY MARKETS IN 2020
331 As shown in Section 4.5.4, most types of reserves were contracted day-ahead in 2020, in line with with Article 6(9) of the recast Electricity Regulation. However, it is observed that in some MSs, most balanc-ing capacity is still procured year or month-ahead, including Lithuania (where 100 % of the balancing capacity was procured year-ahead), Slovakia (97 % year-ahead), Slovenia (52 % year-ahead and 11 % month-ahead), Croatia (92 % year-ahead)289, the Czech Republic (72 % year-ahead) and Hungary (88 % month-ahead). Such long procurement lead-times limit the participation of DSR, variable RES, and energy storage, as they have more difficulties to commit long time ahead of delivery.
332 The length of the capacity contracts also has an influence on the extent to which DSR, variable RES, and energy storage may be able to participate in the balancing capacity markets and compete on equal grounds with conventional generators. The length of the balancing capacity contracts can range from several years to a couple of hours and may differ by reserve product. In 2020, contracts with duration of only few hours existed in most countries; however longer contracts for FCR, aFRR and mFRR remained, for example in the following markets:
• Balancing capacity contracts had a duration of at least one year in Slovenia (FCR), Croatia (aFRR, mFRR), Latvia (mFRR), Lithuania (mFRR), and Spain (FCR).
• The duration reached one or more months in Bulgaria (FCR, aFRR), and Denmark and Slovenia (both for aFRR, mFRR).
7.5.5 Symmetry in balancing capacity products
333 The recast Electricity Regulation290 sets that the procurement of upward and downward balancing ca-pacity shall be carried out separately, i.e. without a requirement to be symmetrically offered or provided. Symmetric balancing capacity products may hinder the participation of variable RES and DSR. It is easier for RES to offer downward reserves curtailing their production and for DSR to offer upward reserves consuming less energy. In addition, symmetric products can decrease the portfolio of aggregators since some consumers can offer flexibility only in one direction. In 2020, all MSs allowed asymmetric balancing capacity products for mFRR. However, aFRR products were required to be symmetric in Denmark, Poland and Romania.
7.5.6 Price settlement for balancing energy
334 The recast Electricity Regulation291 sets that the settlement of balancing energy for standard and specific balancing products shall be based on marginal pricing (pay-as-cleared). Marginal pricing makes it easier for new entrants to offer balancing energy bids since they do not have to guess the ‘right’ bid to offer and they are only concerned about their marginal (opportunity) cost. With the EU balancing energy platforms, marginal pricing will become the settlement rule. However, in 2020, pay-as-bid was still the dominant pricing method in many MSs, especially for aFRR and mFRR (Table 22 in Annex 4). In some MSs, the regu-latory authority sets the price of the balancing energy activated from some reserves: France (FCR and aFRR), Italy (FCR), the Czech Republic (aFRR) and Denmark (aFRR).
7.5.7 Activation rule
335 The EB Regulation prescribes balancing energy markets with merit-order activation, which ensures cost-efficient activation of bids and adequate liquidity in the balancing market. In the upcoming years, merit-order activation will become the activation rule in the EU balancing energy platforms292. In 2020, all MSs used merit-order activation for mFRR and RR; however, for aFRR, pro-rata activation was still used in Bulgaria, Croatia, the Czech Republic, Denmark, Finland, France, Greece, Italy, Norway, Portugal, Spain and Sweden.
289 Even though the TSO in Croatia procured most of balancing capacity from the incumbent year-ahead, these contracts contained provisions allowing the TSO to adjust the balancing capacity afterwards if it was able to procure more affordable capacity from other market players.
290 Article6(9)oftherecastElectricityRegulation.
291 Article6(4)oftherecastElectricityRegulation.
292 ACER Decision No 2/2020 on the Implementation framework for aFRR Platform – Annex I, available at: https://documents.acer.europa.eu/Official_documents/Acts_of_the_Agency/Annexes%20to%20the%20DECISION%20OF%20THE%20AGENCY%20FOR%20THE%20C3/ACER%20Decision%20on%20the%20Implementation%20framework%20for%20aFRR%20Platform%20-%20Annex%20I.pdf.

95
ACER/CEER ANNUAL REPORT ON THE RESULTS OF MONITORING THE INTERNAL ELECTRICITY MARKETS IN 2020
7.5.8 Pre-determination of the balancing energy price in the balancing capacity contracts
336 The EB Regulation293 and recast Electricity Regulation294 prescribe that balancing capacity contracts should not set the price for balancing energy in order to ensure efficient price formation. In 2020, the balancing energy prices were still predetermined in balancing capacity contracts in Ireland and Slovakia.
7.5.9 Non-contracted balancing energy bids
337 The EB Regulation295 sets that BRPs should have the right to submit non-contracted balancing energy bids (also known as ‘free’ energy bids). They refer to the possibility of offering balancing energy bids on a voluntary basis without the need for a previous contract for balancing capacity. This promotes competi-tion and participation of new entrants in the balancing energy markets. In 2020, many MSs did not yet al-low these types of bids for some of their balancing reserves, but especially for aFRR (Table 22 in Annex 4).
338 Finally, anticipating the go-live of major European platforms in line with the EB Regulation, some TSOs have already started to procure some balancing products with the same characteristics as the standard ones envisaged for such platforms. As of September 2021, TSOs in Croatia, Italy, Spain and Denmark procure aFRR and mFRR balancing energy products with the same characteristics as the standard prod-ucts set in the ACER Decision No 2/2020296 and ACER Decision No 3/2020297. Also, the TSOs of Belgium, Croatia, Finland, Germany298, Ireland, and Denmark procure balancing capacity products with the charac-teristics envisaged in the ACER Decision No 11/2020299. The introduction of standard products at an early stage paves the way towards the go-live of the platforms, with a view to facilitate market entry of new/small players, which may find it easier to use few as opposed to very diverse products, and to enhance cross-border competition as a trigger for better price formation in the long run.
7.6 Lack of a proper legal framework to enable new entrants and small players
339 The Electricity Directive300 sets the principles to create a national legal framework for demand side flex-ibility and active participation of all energy consumers (mainly via demand response aggregation and citi-zen energy communities –CECs–) in the transition towards clean energy301. Even though these provisions should have been transposed in national legislation by 31 December 2020, their implementation was still work in progress in most MSs at the end of 2020.
340 The scope of the barrier analyses on the one hand, the progress (or lack thereof) in the implementation of regulatory frameworks describing the role and functions for active consumers, aggregators, independent aggregators302 and CECs, and on the other hand, to what extent such legal frameworks together with the design of the different market timeframes and products enabled the participation of these new entrants and small actors in 2020.
293 Article 16.6 of the EB regulation.
294 Article6(2)oftherecastElectricityRegulation.
295 Article16(5)oftheEBregulation.
296 See footnote 290.
297 See footnote 277.
298 In Germany, the TSOs have largely harmonized the balancing capacity products with the standard products set in the ACER Decision 11/2020. Only the minimum quantity of the energy bid volume offered and the price resolution differ from the requirement of the Decision.
299 ACER Decision No 11/2020 on standard products for balancing capacity – Annex I, available at: https://extranet.acer.europa.eu/Official_documents/Acts_of_the_Agency/Annexes%20to%20the%20DECISION%20OF%20THE%20AGENCY%20FOR%20THE%20C10/ACER%20Decision%20SPBC%20Annex%20I.pdf.
300 DIRECTIVE(EU)2019/944OFTHEEUROPEANPARLIAMENTANDOFTHECOUNCILof5June2019oncommonrulesfortheinternalmarket for electricity and amending Directive 2012/27/EU (recast), available at: https://eur-lex.europa.eu/legal-content/EN/TXT/PDF/?uri=CELEX:32019L0944&from=EN.
301 Articles 15 to 17 of the Electricity Directive.
302 Independent aggregator means a market participant engaged in aggregation who is not affiliated to the customer’s supplier.

96
ACER/CEER ANNUAL REPORT ON THE RESULTS OF MONITORING THE INTERNAL ELECTRICITY MARKETS IN 2020
341 Article 15 of the Electricity Directive established a framework for active consumers at EU level. As of 31 December 2020, only Denmark, Germany, France, Hungary, Italy, Spain and Slovenia had adopted all ma-jor provisions in their national legislation (Table 23 in Annex 4):
• Austria, Estonia and Romania had defined some of the provisions303 but they still had not removed double charges (including network charges) for active customers owning an energy storage facility304. Finland eliminated double taxation but not double network charges. Double network charging repre-sents an important barrier for active consumers since it damages their business model and discour-ages these consumers from providing flexibility services to SOs.
• Even though Malta and Cyprus transposed the major provisions on active consumers by 2021 and this implementation is ongoing in Belgium, Lithuania, Luxembourg, Latvia and Poland (as of September 2021), it has not started yet in Greece and Sweden.
342 Article 16 of the Electricity Directive also established a framework for CECs at EU level. As of 31 December 2020, only Germany, Denmark and Hungary had adopted all major provisions in their national regulatory framework305 and the Netherlands, the Czech Republic and Ireland had defined some roles and responsi-bilities for CECs (Table 24 in Annex 4).
343 Article 17 of the Electricity Directive established a framework for demand response through aggregation at EU level. With the exception of Romania, as of 31 December 2020, no MS had adopted all major provi-sions in their national legislation (Table 25 in Annex 4):
• The necessity of prior consent by suppliers is a major barrier for independent aggregators. Only the national legislation in ten MSs (Denmark, Estonia, Finland, France, Greece, Hungary, Italy, Lithuania, Latvia and Romania) has eliminated the possibility for suppliers to discriminate against customers that have a contract with an aggregator.
• No MS has defined a conflict resolution mechanism between market participants engaged in aggre-gation and other market participants, with the exception of Austria, Greece, Lithuania, Latvia and Romania.
• No MS has a method for calculating financial compensation to suppliers or BRPs during activation of DSR, with the exception of France, Italy, Slovenia and Romania.
• Even though Malta and Cyprus transposed the major provisions on aggregators by 2021 and this im-plementation is ongoing in Belgium, Germany, Luxembourg and Poland (as of September 2021), it has not started in Sweden and Spain.
344 Since a comprehensive legal framework defining the roles and responsibilities for aggregators, CECs and active consumers was still work in progress in most MSs at the end of 2020, these actors are not eligible to participate in most electricity markets and products with some exceptions (see Table 26 in Annex 4). In particular:
• Active consumers are eligible to participate directly in DA, ID, balancing markets in nine MSs (Germany, Denmark, Estonia, France, Hungary, Ireland, Italy, Romania and Slovenia306). Portugal allows their par-ticipation in their DA and ID markets, but not in balancing markets. Only in Germany, France, Hungary and Slovenia307, active consumers can also provide redispatching and other congestion management services for TSOs as well as congestion management and other services for distribution system op-erators (DSOs)308.
303 Estonia defined the provisions only for the participation of active consumers in balancing markets.
304 Article 15.5(b) of the Electricity Directive.
305 France defined a national regulatory framework for CECs that entered in force in 2021.
306 In Slovenia, active customers are entitled to provide balancing services directly or through aggregation. In practice, most active consumers providing balancing services consist of industries operating mainly through aggregation. Special provisions are also given for pilot projects (regulatory sandbox) to incentivise households and small businesses to participate in DSR.
307 In Slovenia there are not structural congestions within the bidding zone so the TSO does not need to use redis-patching and other congestion management services. Thus, active consumers, aggregators and independent aggregators do not need to provide these services.
308 Other DSO services refer to voltage support, contribution to restoration after incidents, etc.

97
ACER/CEER ANNUAL REPORT ON THE RESULTS OF MONITORING THE INTERNAL ELECTRICITY MARKETS IN 2020
• DA, ID and balancing markets are open to aggregators in fourteen MSs (Austria, Germany, Denmark, Estonia, Spain, France, Hungary, Ireland, Italy, the Netherlands, Lithuania, Latvia, Romania and Slove-nia). In the Czech Republic, aggregators are only eligible in DA and ID markets, but not in balancing markets. Aggregators only can participate in all market timeframes and provide any TSO and DSO services in five MSs (Germany, France, Hungary, Latvia and Slovenia309).
• Independent aggregators still face more restrictions than aggregators do. Unlike aggregators, DA and ID markets in Austria, the Czech Republic, Latvia, the Netherlands and Spain are not open for inde-pendent aggregators. Similarly, the balancing markets in Austria, Latvia, and Spain are open to aggre-gators, but they remain closed to independent aggregators. France, Germany, Hungary and Slovenia310 are the only MSs where independent aggregators can participate in all market timeframes and provide any TSO and DSO services.
• Citizen energy communities are only eligible to participate in DA, ID, balancing markets in five MSs (Germany, Denmark, France, Hungary and Ireland)311. They cannot provide redispatching and other congestion management services for TSOs and congestion management and other services for DSOs in the vast majority of the MSs with only three exceptions (Germany, France and Hungary).
345 As a whole, the analysis of this barrier shows that in 2020, the lack of a proper legal framework was a bar-rier to a greater or lesser extent in 22 MSs becoming moderate in eight MSs (Austria, the Czech Republic, Estonia, Spain, Finland, Lithuania, Latvia and Portugal) and highly restrictive in ten MSs (Belgium, Cyprus, Greece, Croatia, Luxembourg, Malta, the Netherlands, Poland, Sweden and Slovakia) (Table ii). Only a few MSs (Germany, Denmark, France and Hungary) had pioneered the definition of the main roles and responsibilities for aggregators, independent aggregators, active consumers and CECs in their national legal frameworks and the opening of their markets and products for SOs to these new entrants.
7.7 Restrictive requirements to participate in capacity mechanisms and inter-ruptibility schemes
346 The recast Electricity Regulation312 sets that any capacity mechanism shall be based on a transparent, non-discriminatory and competitive process, shall provide incentives for capacity providers to be avail-able at times of expected system stress and shall be open to the participation of all resources that are capable of providing the required technical performance, including energy storage and demand side man-agement.
347 This section aims to assess to what extent the current requirements for the eligibility of capacity provid-ers, the features of the capacity products and the processes to allocate these products may become an obstacle to the entry and participation of new entrants and small actors. A similar assessment is made for interruptibility schemes irrespective of whether they can be qualified as CMs or not. The analysis focuses on the CMs and ISs that were operational in 2020313 (Chapter 6).
348 With regard to the principle of allowing the participation of all technologies, in 2020 most CMs were open to all capacity resources with the exception of the CMs in Greece and Finland. The transitory flexibility remuneration mechanism in Greece (operational until March 2021) did not allow the participation of en-ergy storage and intermittent and other non-hydro RES while energy storage was not eligible in Finland.
349 Even though some CMs are potentially open to a wide range of technologies, some requirements such as the minimum eligible capacity, restrictions to aggregation and the minimum bid size can de facto exclude DSR, energy storage and smaller RES generators. In particular, the minimum bid is as high as 10MW in Finland, and 5MW in Sweden and Germany. Additional restrictions apply in all three CMs as follows:
309 See footnote 305.
310 See footnote 305.
311 However, as of 31 December 2020, only Germany, Denmark and Hungary had adopted all major provisions in their national legislation as shown in Table 24.
312 Article 22 of the recast Electricity Regulation.
313 The targeted capacity mechanism in Bulgaria was not analysed due to lack of data provided to ACER.

98
ACER/CEER ANNUAL REPORT ON THE RESULTS OF MONITORING THE INTERNAL ELECTRICITY MARKETS IN 2020
• Sweden allows any type of aggregation; however, Finland prohibits the aggregation of generation as-sets. Finland is working on regulatory changes to decrease the minimum bid size up to 1MW and allow aggregation for both generation and demand.
• In Germany, even though the minimum bid size is 5MW, single and small DSR units can be eligible if aggregated in bid groups of at least 1MW. At the same time, aggregation is not allowed for small RES and storage units, which effectively means that units lower than 5MW cannot participate.
350 It is important to note that even though the transitional flexibility remuneration mechanism in Greece has a low minimum bid size (1MW), it is the only CM in Europe where no aggregation is allowed (either load or generation).
351 Excessively long lead times314 may also hinder participation of DSR since they may not be able to commit too long in advance of the delivery period. All CMs hold auctions one year before delivery; however, in Ireland, Italy and Poland these T-1 auctions are complementary to main auctions with longer lead-times (Table 13). On the contrary, in France DSR is allowed to certify their capacity without penalty up to two months prior to the delivery year, even if the start-up is during the delivery year.
352 As mentioned in Chapter 6, multi-year capacity contracts in Ireland, Italy, Poland and Spain create a bias in favour of investing in fossil fuel power plants, representing a barrier to the participation of DSR, energy storage and variable RES generation. Additional restrictions regarding these contracts are observed in Italy as they are available for new generation and energy storage only above a certain investment thresh-old315 and they are not available for DSR. As a best practice, the multi-year capacity contracts in France provide guaranteed payments for seven years for DSR and batteries.
353 Some features of product design and allocation process may enhance participation of new entrants and small actors, and may reduce costs for end-consumers:
• A limited delivery period (e.g. seasonal obligation or in specific hours) increases participation, particu-larly of DSR and energy storage providers that may struggle to provide capacity over longer periods. Only five CMs have time-limited obligation: Finland (three winter months and one non-winter month), France (10-25 delivery days in November-December and January-March and 10 hours per delivery day), Italy (peak hours for RES and DSR), Poland (peak hours) and Sweden (15 November-15 March).
• The setting of a share of capacity targeted for DSR in T-1 auctions316. No CM includes this provision with the exception of Italy with a share of less than 5 %. France encourages DSR participation via specific tenders317.
354 As shown above, even though some CMs are theoretically open to DSR, energy storage and variable RES generation, certain requirements effectively hinder their entry and participation. Figure 53 shows the capacity of DSR, energy storage and variable RES remunerated through CMs in 2020. It shows that energy storage was not remunerated in any CM contract. In addition, no DSR, energy storage nor variable RES generation were remunerated in Germany, Greece and Poland, even though all these resources were eligible in Germany, DSR was eligible in Greece and energy storage in Poland.
314 The lead-time is the time between the conclusion of the allocation process and the start of the delivery obligation for the successful bidders.
315 This investment threshold was 209,000 euros/MW for the first auction.
316 T refers to the delivery year the auctions are about.
317 For more information, please refer to: https://ec.europa.eu/competition/elojade/isef/case_details.cfm?proc_code=3_SA_48490.

99
ACER/CEER ANNUAL REPORT ON THE RESULTS OF MONITORING THE INTERNAL ELECTRICITY MARKETS IN 2020
Figure 53: Capacity of DSR, RES generation and energy storage remunerated through CMs in a number of Member States – 2020 (%)
Source: ACER calculations based on NRAs data.Note: Belgium did not hold any auction in 2020. No data available for Italy.
355 As described in Section 6.5, interruptibility schemes normally refer to national programmes dedicated to DSR. While they contributed to the development of certain level of DSR at earlier stages, some design features may hinder the participation of new means of individual and aggregated DSR.
356 As in CMs, the participation in ISs may be impacted by the minimum bid size. Table 14 shows that with the exception of Italy and Poland, the remaining ISs operational in 2020 had a minimum bid size higher than 1 MW: 25MW in France, 5MW in Spain and Germany, 4MW in Portugal and 2MW in Greece. This limits participation to large industrial loads and increases the cost of these schemes. Spain exemplifies how a reduction of the bid size increased participation and reduced the cost of this scheme, over the last few years. In particular, Spain reduced the block sizes. First, sizes of 90MW and 5MW were used for the auc-tions held between 2015 and the first semester of 2018, second, sizes of 40MW and 5MW were used in the auctions of the second semester of 2018 and beginning of 2019, and finally, a single size of 5MW was available in the last auction held at the end of 2019. This block size decrease led to a sharp fall in the total cost of this scheme (-99.2 % in the period 2017-2020) as shown in Figure 48.
357 In addition, the aggregation of individual loads was not allowed in the interruptibility schemes of Italy, Spain, Portugal, Greece and France making their minimum bid size more restrictive.
358 Overall, the analysis of the requirements described in this section shows that in 2020, small market play-ers faced moderate obstacles to participate in the CMs of Germany, Greece and Finland and in the ISs of France, Spain, Greece and Portugal (Table ii).
7.8 Limited competitive pressure in retail markets
359 The ease with which a new supplier or business model (e.g. an independent aggregator) can enter the electricity market is highly dependent on a well-functioning and effective competition in the retail market. With a low competitive pressure, incumbents may hold a dominant position that may limit new entrants´ ability to compete on a level playing field and to offer innovative and flexibility products allowing end-users benefiting from potential costs savings.
360 This section assesses how competitive pressure in some retail markets may be lower as a result of a combination of factors, including (i) a relatively high market concentration, (ii) a low entry-exit activity of suppliers and (iii) a low correlation between the energy component of retail prices and wholesale prices.
%
25
15
5
20
10
0
DSR Energy storage (other than pumped storage) Variable and other non-hydro RES
SE BG FR IE (SEM) FI DE GR PL

100
ACER/CEER ANNUAL REPORT ON THE RESULTS OF MONITORING THE INTERNAL ELECTRICITY MARKETS IN 2020
361 The analysis shows that in 2020, ten retail markets (Belgium, Croatia, France, Greece, Hungary, Latvia, Lithuania, Luxembourg, the Netherlands and Portugal) recorded a CR3 of at least 70 %, a threshold that is commonly used to characterise a market as highly concentrated318. The CR3 is analysed together with the number of suppliers for household consumers with a market share above 5 % by metering points. The analysis confirms that some markets with a high CR3 tend to have a limited number of suppliers with a meaningful market share: in Greece and Lithuania there is only one supplier with a market share above 5 % while Croatia and Luxembourg have two suppliers. It should be noted that the limited number of suppliers may be partly explained by the very small size of some markets (e.g. Luxembourg), while this is not an explanatory factor for larger markets such as Greece.
362 While market concentration measures are structural indicators, the entry/exit activity319 allows to under-stand whether a market is static or dynamic. Among others, this indicator informs about the ability of new entrants to enter a market and compete with existing suppliers as well as the consumers´ chances to have systematically access to a larger choice and innovative solutions. In the 2018-2020 period, some relatively big retail markets, including France, Greece and Germany, experienced very low entry/exit activ-ity. In contrast, Italy and Spain were the most dynamic retail markets.
363 Another indication of the level of competition in retail markets is the correlation between the energy component of retail prices and the wholesale prices320. A stronger correlation can usually be expected in markets characterised by a more robust competition. The opposite is not always true since a high correla-tion may also be the result of price intervention linking the retail prices to the wholesale prices by law. In 2020, the weakest correlation was found in Bulgaria (-1), Latvia (-0.7), Slovenia (-0.4) and Poland (-0.4) followed at distance by Belgium, Slovakia, Hungary and Greece.
364 Overall, the combined analysis of the above described indicators shows that in 2020 a relatively low com-petitive pressure in retail markets may have represented a barrier for new entrants and small actors to a greater or lesser extent in the vast majority of the MSs (Table ii). This barrier was found moderate in ten MSs (Belgium, France, Greece, Hungary, Ireland, Lithuania, Luxembourg, Poland, Portugal and Slovakia).
7.9 End-user price interventions
365 The Electricity Directive321 states that MSs shall ensure the protection of energy poor and vulnerable household customers by social policy or by means other than public interventions in the price setting for the supply of electricity. Nevertheless, such public interventions may be applied if limited in time and proportionate as regards their beneficiaries, among other compliance criteria. In addition, MSs may apply public interventions in the price setting to household customers and to microenterprises during a transition period in order to establish effective competition for electricity supply contracts between suppliers, and to achieve fully effective market-based retail pricing of electricity. Nevertheless, such public interventions shall be set at a price that is above cost and at a level where effective price competition can occur, and shall minimise the negative impact on the wholesale electricity market, among other compliance criteria.
366 This section is intended to assess how widely end-user price interventions were applied to household and non-household consumers in the MSs in 2020, and the related potential impact on price formation and entry to the market. Hence, an important remark underlying the analysis is that it is not aimed to assess the formal transposition of the Electricity Directive, which was in any case not required until 31 December 2020322.
318 CR3 is a traditional structural measure of market concentration based on market shares. In this report, we measure the concentration ratio 3 as the market share of the three largest suppliers in the whole retail market by volume. Please note that in the Retail markets volume of the 2020 MMR, CR3 measures the total market shares of the three largest suppliers by metering points in the household market and by volume in the non-household market. For more information, please refer to the Retail markets volume of the 2020 MMR. Like the Retail markets volume of the 2020 MMR, the benchmark used in this report is 70%, since markets with CR3s between 70 and 100% are considered highly concentrated, ranging from oligopolies to monopolies.
319 In this report, the entry/exit activity measures the average number of entries and exits in the retail markets for households and non-householdsoverthe2018-2020periodnormalisedwiththenationalelectricitydemand.
320 Thiscorrelationiscalculatedfortheperiod2013-2020basedonEurostatdataandACERdatabaseonretailoffersandotherrelevantdata. The methodology is further described in Annex 6 of the ACER Market Monitoring report 2015, available at: https://documents.acer.europa.eu/Official_documents/Acts_of_the_Agency/Publication/ACER_Market_Monitoring_Report_2015.pdf.
321 Article 5 of the Electricity Directive.
322 Even though MSs were in the process of transposing the Electricity Directive in 2020, most MSs did not have a roadmap for a price intervention removal, with the exception of Italy, Lithuania, Romania and Slovakia for household consumers and France, Italy, Romania and Slovakia for non-household consumers. For more information, please refer to the Retail markets volume of the 2020 MMR.

101
ACER/CEER ANNUAL REPORT ON THE RESULTS OF MONITORING THE INTERNAL ELECTRICITY MARKETS IN 2020
367 While some MSs intervene in the retail price setting to protect household and/or non-household cus-tomers, these interventions tend to compromise competition. This is particularly true for markets where regulated retail end-user prices are set below costs (i.e. without taking into consideration wholesale mar-ket prices and/or other supply costs). Artificially low regulated prices (even without pushing them below costs but with a very squeezed margin) limit market entry and innovation, prompt consumers to disen-gage from the switching process and consequently hinder competition in retail markets. In addition, they may increase investor uncertainty and impact the long-term security of supply. Furthermore, other price interventions including regulated prices set above costs can act as a pricing focal point which competing suppliers are able to cluster around and – at least in markets featuring strong consumer inertia – can also considerably dilute competition. In general, the larger the size of the regulated customer segment, the stronger the impact on competition.
368 In 2020, twelve MSs (Belgium, Spain, France, Greece, Hungary, Italy, Lithuania, Latvia, Poland, Portugal, Romania and Slovakia)323 out of 28 still had some form of price intervention in the price setting for either household, non-household consumers or both.
369 In the household market, twelve MSs (Belgium, Spain, France, Greece, Hungary, Italy, Lithuania, Latvia, Poland, Portugal, Romania and Slovakia) had some type of public price intervention consisting of regu-lated prices except for Belgium, Italy, Lithuania, Latvia and Portugal324. In France, Lithuania, Poland and Romania more than 50 % of the household consumers were subject to some type of price intervention. In Hungary and Slovakia all household consumers were under regulated prices.
370 A wide usage of price setting intervention may prompt non-vulnerable household consumers to disen-gage from the switching process and consequently hinder competition in retail markets. In 2020, in only seven MSs (Belgium, Spain, France, Greece, Hungary, Latvia325 and Portugal) out of the twelve MSs, the price intervention also targeted the segment of vulnerable customers. For Belgium and Latvia, all household consumers with some price intervention in their price setting were deemed vulnerable, while in Greece and Portugal this share represented 87 % and 86 %, respectively. On the contrary, most of the household consumers with price intervention were non-vulnerable in France (87 %)326, Spain (90 %) and Hungary (99.6 %). Elsewhere (i.e. Italy, Lithuania, Poland, Romania and Slovakia), all consumers under some type of price intervention were not specifically qualified as non-vulnerable.
371 In the non-household market, seven MSs (France, Greece, Hungary, Italy, Portugal, Romania and Slova-kia) used some level of price intervention in 2020, always consisting on price regulation targeting small business. France and Italy were the countries with the highest share of non-household consumers with regulated prices: 8 % and 7 %, respectively.
372 Overall, the analysis of the above described indicators shows that the end-user price interventions in twelve MSs in 2020 may have represented a barrier to price formation and/or new entrants in all these MSs with the exception of Belgium (Table i) and (Table ii). In Spain, Italy, Lithuania, Latvia and Poland it represented a moderate barrier while it became more restrictive in France, Hungary, Romania and Slovakia.
323 Unlike the Retail markets volume of the 2020 MMR, Great Britain, Cyprus and Malta are out of the scope of the analysis of this barrier. Bulgaria had end-user price interventions in 2019; however, ACER was not able to analyse the status of these interventions in 2020 due to the lack of data provision from the Bulgarian NRA.
324 For additional infomation about the types of price interventions please refer to Section 2.4 of the Retail markets volume of the 2020 MMR (seefootnote323).
325 Latvia has removed the regulated prices for vulnerable consumers since September 2021.
326 In France, 9% of household consumers with regulated tariffs were vulnerable in 2020.

102
ACER/CEER ANNUAL REPORT ON THE RESULTS OF MONITORING THE INTERNAL ELECTRICITY MARKETS IN 2020
7.10 Limited incentive to contract dynamic retail prices
373 As set in the Electricity Directive327, consumers should have the possibility to participate in all forms of demand response benefiting from the full deployment of smart metering systems and, where such deployment has been negatively assessed, choosing to have a smart metering system and a dynamic electricity price contract. This would allow them to adjust their consumption according to real-time price signals that reflect the value and cost of producing and transporting electricity in different periods. Dy-namic electricity prices would also provide an opportunity for suppliers to reduce their hedging costs, as the risk is partly transferred to those consumers who are willing to accept such risk, and, in turn, possibly benefitting from lower end-user prices.
374 This section aims to identify the MSs where consumers do not have the possibility or incentives to choose dynamic price contracts328. The access to dynamic retail pricing depends largely on the roll-out rate of smart meters. While MSs329 are not required to roll out smart meters to 80 % of consumers until 2024330, their limited deployment limits the opportunity for consumers to react to market price signals. The incentives depend on the savings that consumers could get from adjusting their consumption. The latter depends, among other factors, on the share of the energy component in the electricity bill and the existence of suf-ficient price differentials between higher and lower price periods, e.g. between peak and off-peak hours.
375 In 2020, the roll-out rate of smart meters reached at least 80 % in twelve MSs only. In nine MSs, the devel-opment had started, but it was still lower than 20 %: Lithuania (0.4 %), Hungary (4.6 %), Belgium (5.6 %), Poland (10.5 %), Ireland (11.3 %), Croatia (12.2 %), Slovakia (14.3 %), Romania (15 %) and Germany (18 %). In addition, smart meter roll-out has been delayed in some MSs, as shown in the Retail markets volume of the 2020 MMR331: Austria had legal plans with an 80 % target by the end of 2020, but only reached roughly 29 % by this date; Greece, Hungary, Poland, and Portugal still have no national law stating the target to reach 80 % or more of electricity household consumers despite a positive roll-out decision; and Croatia and Slovakia are pending on a decision.
376 Furthermore, the recast Electricity Regulation encourages MSs not only to develop smart metering sys-tems, but also to introduce time-differentiated network tariffs in order to reflect the use of the network, in a transparent, cost-efficient and foreseeable way for the final customer. In 2020, some MSs with a high roll-out rate of smart meters still had no or limited time-differentiated network tariffs for end-consumers. In particular, Italy had no time-differentiation even though 98 % of households had smart meters. With a roll-out rate of smart meters higher than 85 % in Norway, Luxembourg and the Netherlands, more than 80 % of their household consumers did not have any time-differentiation in their network tariffs either.
377 Retail customers also need incentives to enhance their flexibility potential and interest in dynamic elec-tricity price contracts. A low share of the energy component in the final electricity bill does not give them price signals and it blurs the benefits of dynamic pricing. In 2020, the energy component accounted for 31 % of the final price on average in the EU. It was still lower than 30 % in Denmark (14 %), Norway (19 %), Germany (19 %), Sweden (23 %), Spain (23 %) and Belgium (29 %). At the other end, the energy compo-nent reached 75 % of the final bill in Malta.
378 Additionally, the higher the dispersion of DA wholesale prices, the bigger the incentive for end-users to conduct dynamic electricity price contracts and reap the benefits from adapting their consumption to e.g. hourly price variations. In 2020, the highest dispersion of DA wholesale prices332 was reached in Ireland (69 %), closely followed by Estonia (61 %), Lithuania (60 %), Finland (60 %) and Latvia (60 %). Household consumers in Ireland and Lithuania could receive price signals and benefit from falling prices; however, as shown above, only 11.3% and 0.4% benefited from smart meters in 2020.
327 Article 2 of the Electricity Directive.
328 Please note that this barrier was not analysed in Bulgaria, the Czech Republic and Greece due to lack of data about the roll-out rate of smart meters in 2020.
329 Subject to a positive cost-benefit analysis.
330 As outlined in Annex II of the Electricity Directive, where the deployment of smart metering systems is assessed positively by a MS, at least 80% of final customers shall be equipped with smart meters either within seven years of the date of the positive assessment or by 2024 for those Member States that have initiated the systematic deployment of smart metering systems before 4 July 2019.
331 See footnote 318.
332 Using the difference between the 95th and 5th percentiles of hourly DA wholesale prices as a proxy for price dispersion.
103
ACER/CEER ANNUAL REPORT ON THE RESULTS OF MONITORING THE INTERNAL ELECTRICITY MARKETS IN 2020
379 Overall, the combined analysis of the above described indicators shows that in 2020 the limited incentive to conclude dynamic retail contracts was not contributing to efficient price formation and easy entry and participation for new entrants in fourteen MSs (Table i) and (Table ii). In nine MSs (Austria, Belgium, Ger-many, Croatia, Hungary, Lithuania, Poland, Romania and Slovakia) this barrier was more relevant. A caveat underlying the analysis of this barrier is that sufficient information on the level of penetration of dynamic retail contracts across the entire EU was not yet available to ACER333.
7.11 Insufficient information provided by system operators
380 Insufficient information provided by electricity system operators about the actual conditions of the sys-tem and the available transmission capacities prevent market participants from anticipating the needs of the system, leading to inefficient price formation including at times of scarcity. A limited access to information also hampers the participation of new entrants and small actors, especially when their busi-ness models rely on the provision of flexibility to support the electricity system (e.g. balancing capacity or balancing energy) or to manage network constraints (e.g. re-dispatching).
381 Although the information provided by TSOs is very diverse, the analysis included in this section is based on the level completeness of the information made available by TSOs to: i) the public and ii) ACER in the context of its own duties. With regard to i), this section analyses the completeness of some selected items of the ENTSO-E Transparency Platform; with regard to ii) this section analyses the quality of data provided by TSOs for ACER’s monitoring of the minimum 70 % target and the level of transparency of the capacity calculation methodologies (CCMs)334.
382 Pursuant to Regulation (EU) 543/2013335, ENTSO-E is required to publish data on load, generation, trans-mission, balancing, outages, and congestion management in its Transparency Platform (TP), which is a relevant source of information for many market participants. Even though various types of organisations (including power exchanges, larger generation companies, merchant link operators, etc.) are required to provide data to the TP, the European TSOs, and to a lesser extent DSOs, are the main data providers. An assessment of the completeness of some relevant data items336 sheds light on where there is the largest room for improvement. Based on ACER’s analysis, the level of completeness of the 2020 data analysed ranged from 66 % to 100 %337. The lowest data completeness was found in the Nordics and Baltics ranging from 66 % to 86 %. At the other end, the data was complete in eleven MSs (Austria, Croatia, the Czech Republic, France, Hungary, Portugal, Slovakia, Slovenia, Spain, the Netherlands and Romania). Moreover, system operators published almost 100 % of the required information on DA prices; however, most MSs showed a lower level of completeness for data on NTCs and commercial schedules.
383 As shown in Section 7.3, insufficient cross-zonal capacity is one of the main barriers to the integration of electricity markets. ACER’s monitoring of the MACZT critically depends on TSOs providing robust and extensive data. Even though most TSOs made efforts to improve the provision of data for the second se-mester of 2020338, significant improvement must still be done in the Baltics where virtually no monitoring was possible on AC borders in 2020. To lesser extent, Sweden and the Netherlands also need to make efforts to enhance the data provision, as well as the Italy North region where despite some improvements, the monitoring of the minimum 70 % target in the second semester of 2020 was only possible for less than half of the hours.
333 Partial information indicates that in some countries the level of penetration of dynamic retail contracts appears to be higher than the EU average, despite the relatively low share of the energy component in the energy bill, e.g. in Norway. This suggests that other factors such as consumers’ awareness may also play a relevant role. Data permitting, such aspects could be analysed in future MMRs.
334 Please note that this barrier is not analysed for Norway because the minimum 70% target is not binding for Norway and the transparency of the CCMs is not applicable as Norwegian borders are not part of any CCR.
335 COMMISSIONREGULATION(EU)No543/2013of14June2013onsubmissionandpublicationofdatainelectricitymarketsandamendingAnnex I toRegulation(EC)No714/2009of theEuropeanParliamentandof theCouncil,availableat:https://eur-lex.europa.eu/legal-content/EN/TXT/?uri=CELEX%3A02013R0543-20200101.
336 Thisindicatorassessesthelevelofcompletenessofthefollowingdataitems:NTCs[Article11.1(a)oftheRegulation(EU)543/2013],scheduled DA commercial exchanges between bidding zones [12.1(f)], physical flows between bidding zones [12.1(g)], day-ahead prices in each bidding zone [12.1(d)] and DA forecast and actual total load [6.1(a-b)]. The publication of these data items is mandatory except for NTCs. The indicator does not assess the level of data completeness of NTCs on FB borders, on any border with third countries and on the virtual BZ for Italy.
337 DataextractedfromENTSOE-TPasofSeptember2021.
338 ACER monitored the minimum 70% target during the first and second semesters of 2020. For more information about the ACER reports on the margin available for cross-zonal electricity trade in the EU, please see footnote 269.

104
ACER/CEER ANNUAL REPORT ON THE RESULTS OF MONITORING THE INTERNAL ELECTRICITY MARKETS IN 2020
384 TSOs’ ability to provide good quality data for monitoring the MACZT appears to depend on the CCM. Where the FB methodology applies, TSOs can guarantee the quality of the data; where NTC methodol-ogy applies, TSOs would need to improve the capacity calculation process aiming at ensuring that the MACZT can be estimated on all network elements, and not only on the limiting ones, in line with the ACER recommendation No 01/2019339. In particular, an assessment of the level of transparency of the approved CCMs340 shows that in regions applying NTC methodologies the transparency of the CCMs is lower than regions intending to apply FB methodologies (i.e. in the Core and Nordic CCRs), with the exception of the SEE CCR341. In particular, the Baltic CCM shows the lowest level of transparency (24 %) followed by SWE CCM (32 %) and GRIT CCM (34 %). As a result, market participants in Latvia, Lithuania, Estonia, Portugal, Spain and Italy may face more difficulties to anticipate available levels of cross-border capacity and esti-mate the influence of neighbouring markets.
385 Overall, the indicators analysed above show that the TSOs of eight MSs still need to make more efforts to increase the level of transparency when sharing information (Table i) and (Table ii). In particular, in 2020 this barrier was found moderate in the Baltics, Ireland and Sweden.
339 ACERrecommendationNo01/2019ontheimplementationoftheminimummarginavailableforcross-zonaltradepursuanttoArticle16(8)ofRegulation(EU)2019/943,availableat:https://documents.acer.europa.eu/Official_documents/Acts_of_the_Agency/Recommendations/ACER%20Recommendation%2001-2019.pdf.
340 This assessment does not include the CCM for IT_North. For additional information, please refer to MMR 2018 as well as the methodological paper “Capacity Calculation Methodologies – Overview”, available at: http://extranet.acer.europa.eu/en/Electricity/Market%20monitoring/Documents/ACER%20Methodological%20paper%20-%20Capacity%20Calculation%20Methodologies%20Overview.pdf.
341 Since the SEE CCM was approved after ACER´s Decision on the Core CCM, the SEE CCM adopted good practices of the Core methodology, and in particular regarding the transparency provisions.

105
ACER/CEER ANNUAL REPORT ON THE RESULTS OF MONITORING THE INTERNAL ELECTRICITY MARKETS IN 2020
Part III: Energy Community outlook386 The Energy Community342 is an international organisation bringing together the EU and its neighbours to
create an integrated pan-European energy market since 2006. The key objective of the Energy Commu-nity is to extend the EU internal energy market rules and principles to countries in South-East Europe, the Black Sea region and beyond on the basis of a legally binding framework.
387 For the first time, the Electricity Wholesale volume includes an overview of the market develop-ments in the Energy Community. The first chapter reports on the coordination among members of the Energy Community in implementing market reforms. The second chapter updates on the situa-tion of specific countries.
8 Coordination of the market reforms in the Energy Community
388 This Chapter presents the coordinated approach set by Contracting Parties343 regarding the implementa-tion of market reforms.
389 Wholesale electricity markets in the Energy Community Contracting Parties are generally less mature than EU electricity markets. Currently, the Third Energy Package is in force. The CEP is expected to be adopted soon.
390 The Energy Community Secretariat, based in Vienna, monitors and reports344 on the level of implementa-tion of the Energy Community acquis communautaire. It also enforces the acquis through infringement procedures against Contracting Parties in case of non-compliance. Further, in line with its mandate under the Energy Community Treaty, the ECRB monitors and reports on certain aspects of regulatory and mar-ket developments. The implementation of the Third Energy Package in the Contracting Parties is key to facilitating the creation of an integrated energy market allowing for cross-border energy trade and inte-gration with the EU market. The ECRB developed a series of reports and recommendations to support this effort345. These documents cover the following areas: implementation of CACM (including NEMO designa-tion rules) and FCA Regulations, implementation of the Regulation on Wholesale Energy Market Integrity and Transparency (REMIT), transparency requirements, cross-border capacity calculation and allocation process, and reports and recommendations on forward market, intraday and balancing.
391 The work programme of ECRB is updated on yearly basis, keeping the activities of its working groups346 consistent with the development of the Energy Community acquis. The role of the ECRB and the coop-eration with ACER are essential as the CEP and network codes and guidelines are expected to expand their geographic scope into the Energy Community setting the basis for pan-European integrated electricity market.
342 https://www.energy-community.org/
343 Presently, the Energy Community has nine Contracting Parties - Albania, Bosnia and Herzegovina, Kosovo*, North Macedonia, Georgia, Moldova, Montenegro, Serbia and Ukraine. The Energy Community Secretariat clarifies that throughout this text the designation “Kosovo*” is without prejudice to positions on status, and is in line with UNSCR 1244 and the ICJ Advisory Opinion on the Kosovo declaration of independence.
344 Annual Implementation Reports produced by the Energy Community Secretariat can be found at: https://energy-community.org/aboutus/secretariat/reporting.html.
345 See: https://www.energy-community.org/documents/ECRB.html.
346 ECRBworkinggroups(WG):ElectricityWG,GasWG,CustomersandRetailMarketWG,REMITWG

106
ACER/CEER ANNUAL REPORT ON THE RESULTS OF MONITORING THE INTERNAL ELECTRICITY MARKETS IN 2020
9 Specific progress made by Contracting Parties
392 This Chapter compiles the progress made by the Contracting Parties regarding their electricity market reforms. Detailed data regarding electricity markets of the Contracting Parties is available in Table 15 to Table 19 of Annex 1.
9.1 Albania347
393 Albania showed progress in the following areas:
• network codes: transposition of the connection codes on demand connection, connection of genera-tors and HVDC by decision of the regulator. The Albanian regulator has also published derogation criteria for the generators’ connection code.
• balancing: implementation of successful dry runs and implementation of balancing market.
• power exchange: establishment of a power exchange and preparation for go-live in 2022, involving Al-banian stakeholders in two coupling initiatives: market coupling with Kosovo* and the so-called “AIMS project”. This project involves TSOs, power exchanges and NRAs of Albania, Italy, Montenegro and Serbia. The Albanian regulator engaged in early implementation of the CACM Regulation by adopting a regulatory act for NEMO designation based on the CACM Regulation criteria.
• REMIT: approval of a regulatory act that transposes the REMIT regulation and launch of registration implementation.
• RES integration: successful auction for renewables; two auctions performed for 240 MW of solar PV in total. This resulted in record high prices in the region: 24.89 EUR/MWh for 70 MW of capacity, including also another 70 MW to be sold on the market; and 55 EUR/MWh for 50 MW of capacity, including also another 50 MW to be sold on the market. Wind auction is ongoing.
9.2 Bosnia and Hercegovina
394 Bosnia and Herzegovina showed progress in the following areas:
• network codes implementation: partial348 transposition of the connection codes by decision of the regulator and integration into the national transmission code. The State Electricity Regulatory Author-ity published derogation criteria for all three connection codes.
• REMIT: approval and initiation of the implementation of REMIT, for the electricity sector349.
• RES integration: framework for investments in renewable, whereby the national regulatory authority passed a decision that sets that the maximum capacity for the integration of variable generation (840 MW for wind and 825 MW for photovoltaics).
347 See: https://www.energy-community.org/implementation/Albania.html.
348 The State Electricity Regulatory Commission does not have competences over the electricity distribution segment. Therefore, elements of the connection codes related to distribution were not transposed.
349 The State Electricity Regulatory Commission does not have competences over the gas sector.

107
ACER/CEER ANNUAL REPORT ON THE RESULTS OF MONITORING THE INTERNAL ELECTRICITY MARKETS IN 2020
9.3 Georgia
395 Georgia showed progress in the following areas:
• network code implementation: the Georgian regulatory authority transposed the three connection codes into the national grid code.
• REMIT: transposition of REMIT by decision of the regulator and start of the implementation phase.
• power exchange: the Georgian Power Exchange (GEX), responsible for the day-ahead and intraday markets, was established and the go-live, together with the balancing market, is expected as of 2022.
• RES integration: in 2020, the government issued a decree on the renewable support scheme, de-signed in the form of Feed in Premium (FiP), granting maximum 1.5 US cent/kWh in addition to the market price on day-ahead market for eight months per year.
9.4 Kosovo*
396 Kosovo* showed progress in the following areas:
• network codes: integration of the connection codes into the national transmission code by approval of the regulator.
• REMIT: transposition of REMIT by decision of the regulator and start of the implementation phase.
• balancing: operation of KOSTT as a control area and therefore as a bidding zone was the key devel-opment in 2020. This has paved the way for allocation of cross-border capacity and cross-border procurement of balancing services from Albanian TSO.
• power exchange: following ECRB recommendation, the Kosovo*’s Regulator approved the rules for NEMO designation that are fully in line with CACM Regulation. The Albanian power exchange is ex-pected to operate Kosovo*’s day-ahead market and facilitate market coupling.
• RES integration: renewable support scheme based on feed-in tariff was terminated in 2020, following a decision by the State aid Authority in Kosovo*.
9.5 North Macedonia
397 North Macedonia showed progress in the following areas:
• network codes: different from other Contracting Parties, network codes are directly binding in North Macedonia. Integration into the national grid code is still under development.
• balancing: rules on balancing market and cross-border balancing were adopted.
• power exchange: following the approval of rules for NEMO designation, the Electricity Market Opera-tor was established and is expected to receive the NEMO designation. Ongoing work with Bulgarian stakeholders on pilot project regarding to market coupling.
• RES integration: market-based RES auctions. North Macedonia launched market based scheme for supporting renewables. Two auctions on solar PV were completed successfully under fixed premium scheme.

108
ACER/CEER ANNUAL REPORT ON THE RESULTS OF MONITORING THE INTERNAL ELECTRICITY MARKETS IN 2020
9.6 Moldova
398 Moldova showed progress in the following areas:
• network codes : connection codes have been integrated into the national transmission code approved by the national regulator. In addition, the approval of the market rules that represents a significant reform on the electricity market and cross-border capacity allocation. The go-live of the market is expected in October 2021.
• RES integration: preparatory work is done on new energy law and renewable law that will facilitate implementation of renewable auctions.
9.7 Montenegro
399 Montenegro showed progress in the following areas:
• network codes implementation: connection network codes were transposed and entered into force as of 1 January 2021, except the Requirements for generators that will enter into force on 1 January 2022.
• power exchange: the energy law was amended to include some provisions from CACM Regulation. In parallel with the creation of the legal framework for market coupling, activities related to the imple-mentation of the AIMS market-coupling project are carried out. This project involves TSOs, power ex-changes and NRAs of Albania, Montenegro, Italy and Serbia. Cross-border capacity on the DC link with Italy is being allocated by SEE CAO350, the auction office for Southeast Europe located in Montenegro, in line with harmonised allocation rules.
9.8 Serbia
400 Serbia showed progress in the following areas:
• network codes implementation / REMIT: energy law amendments have been adopted in April 2020. Those will transpose certain provisions from the CACM Regulation and allow for NEMO designation, transposition of the REMIT provisions and completion of the connection code transposition.
• balancing: cross-border balancing cooperation is limited to bilateral exchanges with the TSOs of Bos-nia and Hercegovina, Montenegro, Hungary and Romania.
• power exchange: the power exchange SEEPEX is operational from 2016. Serbia is included in several initiatives related to market coupling, such as the AIMS project, while currently there are no develop-ments in relation to market coupling with Bulgaria and Croatia, and with the 4MMC project.
• RES integration: Serbia is in transition from administratively set feed-in tariffs, for which quotas have been fulfilled, to a market-based support scheme. In September 2019, the designated body ElektromrežaSrbije(EMS)becameafullmemberoftheAssociationofIssuingBodies(AIB).InNovem-ber 2020, EMS has been added to the hub to enable exchange of the guarantees of origin with other members of the AIB.
9.9 Ukraine
401 Ukraine showed progress in the following areas:
• market development: following the transposition of key provisions from the third energy package, a significant market reform took place in 2019, including operation of balancing mechanism and day-ahead and intraday market. Law amendments allowing joint cross-border capacity allocation have been adopted, therefore joint allocation is expected to be coordinated with neighbouring TSOs.
350 SEE CAO is the auction office for Southeast Europe located in Montenegro https://www.seecao.com/.
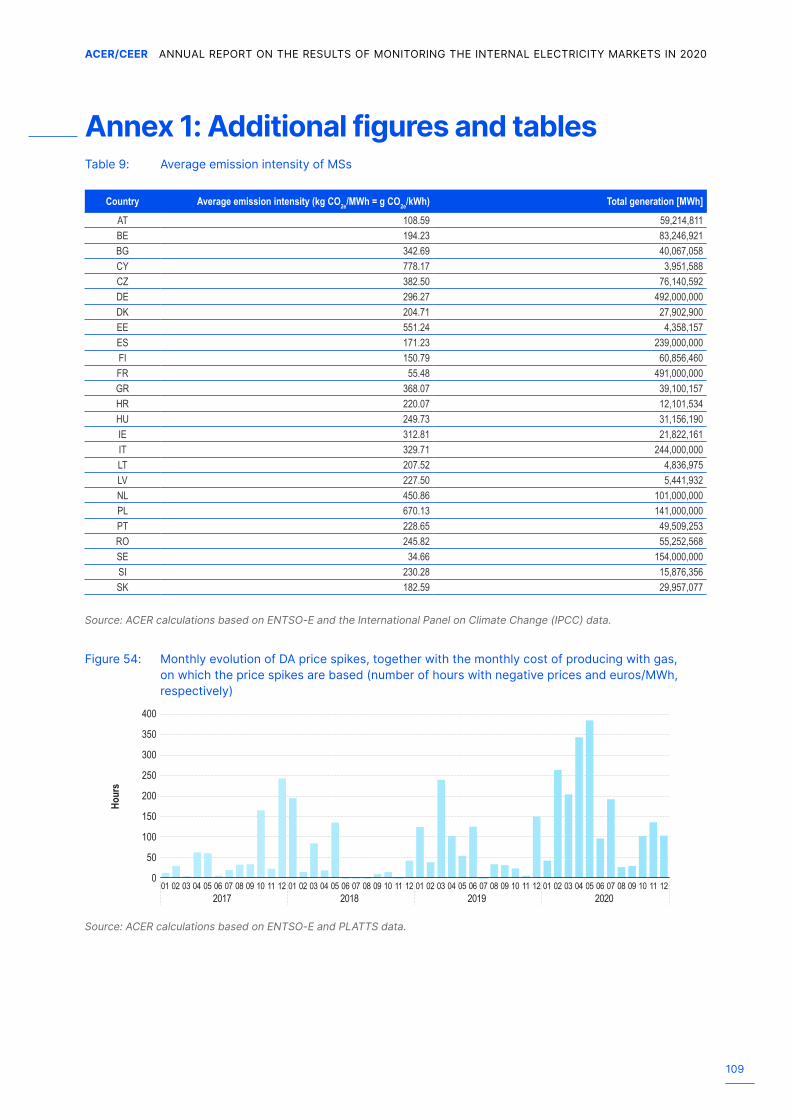
109
ACER/CEER ANNUAL REPORT ON THE RESULTS OF MONITORING THE INTERNAL ELECTRICITY MARKETS IN 2020
Annex 1: Additional figures and tablesTable 9: Average emission intensity of MSs
Country Average emission intensity (kg CO2e/MWh = g CO2e/kWh) Total generation [MWh]
AT 108.59 59,214,811BE 194.23 83,246,921BG 342.69 40,067,058CY 778.17 3,951,588CZ 382.50 76,140,592DE 296.27 492,000,000DK 204.71 27,902,900EE 551.24 4,358,157ES 171.23 239,000,000FI 150.79 60,856,460FR 55.48 491,000,000GR 368.07 39,100,157HR 220.07 12,101,534HU 249.73 31,156,190IE 312.81 21,822,161IT 329.71 244,000,000LT 207.52 4,836,975LV 227.50 5,441,932NL 450.86 101,000,000PL 670.13 141,000,000PT 228.65 49,509,253RO 245.82 55,252,568SE 34.66 154,000,000SI 230.28 15,876,356SK 182.59 29,957,077
Source: ACER calculations based on ENTSO-E and the International Panel on Climate Change (IPCC) data.
Figure 54: Monthly evolution of DA price spikes, together with the monthly cost of producing with gas, on which the price spikes are based (number of hours with negative prices and euros/MWh, respectively)
Source: ACER calculations based on ENTSO-E and PLATTS data.
Hour
s
400
200
300
350
100
150
50
250
001 02 03 04 05 06 07 08 09 10 11 12 01 02 03 04 05 06 07 08 09 10 11 12 01 02 03 04 05 06 07 08 09 10 11 12 01 02 03 04 05 06
2017 2018 2019 202007 08 09 10 11 12

110
ACER/CEER ANNUAL REPORT ON THE RESULTS OF MONITORING THE INTERNAL ELECTRICITY MARKETS IN 2020
Figure 55: Monthly evolution of DA negative prices –2017 – 2020 (number of hours with negative prices)
Source: ACER calculations based on ENTSO-E and PLATTS data.
Table 10: Number of active capacity constraints and shadow prices by element type in the Core (CWE) region – 2019– 2020
TSO Element Type Occurrence 2019 Occurrence 2020 Relative change 2020/2019
Total shadow prices 2020
(euros/MWh)
Average of shadow prices 2020
(euros/MWh)Cross-border line 2,430 2,380 -2% 159,560 67.04
AT Allocation constraint 0AT Internal line 233 223 -4% 21,757 97.57BE Allocation constraint 0 18 100 5.54BE Internal line 1,125 1,271 13% 25,060 19.72DE Allocation constraint 0DE AMPRION Internal line 374 839 124% 57,926 69.04DE TENNET Internal line 251 321 28% 34,490 107.44DE TRANSNETBW Internal line 16 37 131% 2,459 66.47FR Allocation constraint 0 0FR Internal line 9 8 -11% 289 36.16NL Allocation constraint 0 5 22 4.47NL Internal line 455 413 -9% 24,449 59.20Total 4,893 5,515 34% 326,112 53.27
Source: ACER calculations based on ENTSO-E data.Note: this table excludes capacity constraints and shadow prices induced by ALEGrO (see Table 11 below).
Table 11: Number of active capacity constraints and shadow prices induced by ALEGrO in the Core (CWE) region – 2020
TSO ALEGrO phase Number 2020 Total of shadow prices 2020 (euros/MWh)
Average of shadow prices 2020 (euros/MWh)
BE 8.00 1,229.00 154DE 33.00 1,362.00 41BE Commissioning 335.00 405,673.00 1,211DE Commissioning 336.00 405,690.00 1,207BE Outage 256.00 274,702.00 1,073DE Outage 300.00 274,960.00 917BE Ramp up 83.00 29,126.00 351DE Ramp up 146.00 29,101.00 199Total 1,497.00 1,421,843.00 644
Source: ACER calculations based on ENTSO-E data.Note: this table references capacity constraints induced by ALEGrO, from 4 November (initiation of the commissioning phase) to 31 December; during this period, ALEGrO went through the following phases : 4 to 17 November, commissioning; 18 Novem-ber to 5 December, ramp-up; 14 December to 23 December, outage.
Hour
sEuros/MW
h
600
200
400
500
100
300
0
70
30
50
60
20
40
10
Price spike occurrence Cost of producing electricity with gas (euros/MWh)
01 02 03 04 05 06 07 08 09 10 11 12 01 02 03 04 05 06 07 08 09 10 11 12 01 02 03 04 05 06 07 08 09 10 11 12 01 02 03 04 05 062017 2018 2019 2020
07 08 09 10 11 12
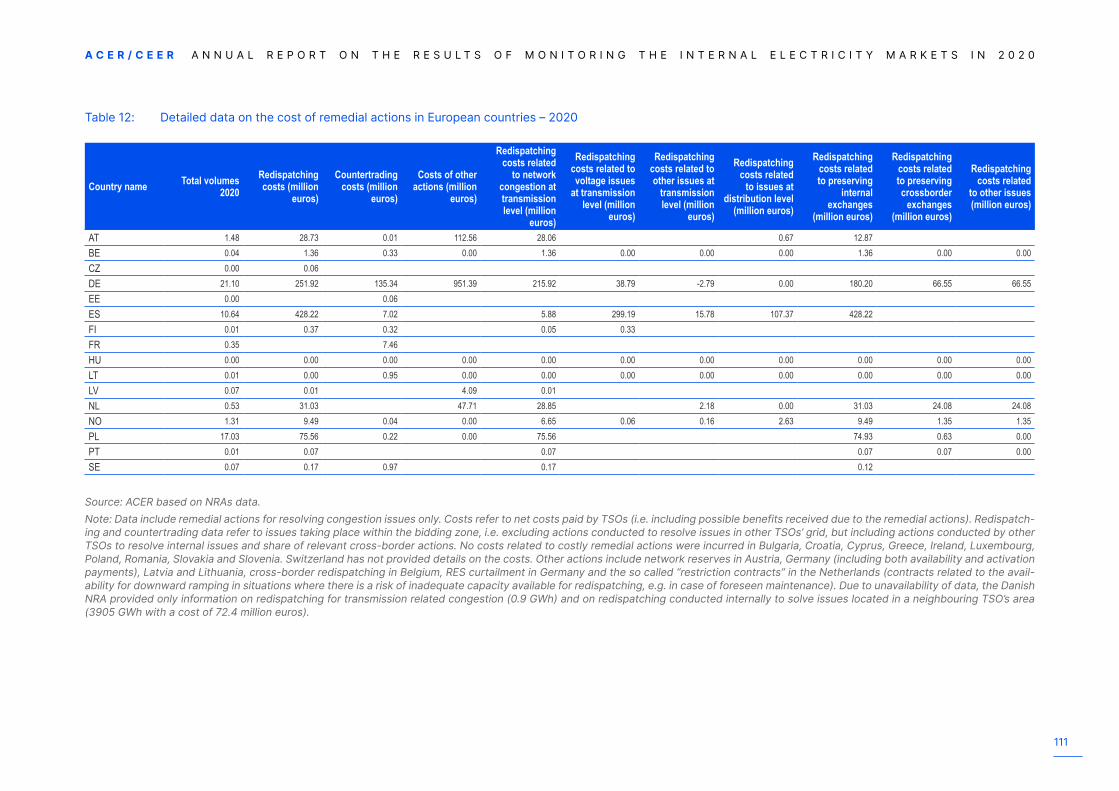
111
A C E R / C E E R A N N U A L R E P O R T O N T H E R E S U L T S O F M O N I T O R I N G T H E I N T E R N A L E L E C T R I C I T Y M A R K E T S I N 2 0 2 0
Table 12: Detailed data on the cost of remedial actions in European countries – 2020
Country name Total volumes 2020
Redispatching costs (million
euros)
Countertrading costs (million
euros)
Costs of other actions (million
euros)
Redispatching costs related
to network congestion at transmission level (million
euros)
Redispatching costs related to voltage issues
at transmission level (million
euros)
Redispatching costs related to other issues at
transmission level (million
euros)
Redispatching costs related
to issues at distribution level
(million euros)
Redispatching costs related to preserving
internal exchanges
(million euros)
Redispatching costs related to preserving crossborder
exchanges (million euros)
Redispatching costs related
to other issues (million euros)
AT 1.48 28.73 0.01 112.56 28.06 0.67 12.87BE 0.04 1.36 0.33 0.00 1.36 0.00 0.00 0.00 1.36 0.00 0.00CZ 0.00 0.06DE 21.10 251.92 135.34 951.39 215.92 38.79 -2.79 0.00 180.20 66.55 66.55EE 0.00 0.06ES 10.64 428.22 7.02 5.88 299.19 15.78 107.37 428.22FI 0.01 0.37 0.32 0.05 0.33FR 0.35 7.46HU 0.00 0.00 0.00 0.00 0.00 0.00 0.00 0.00 0.00 0.00 0.00LT 0.01 0.00 0.95 0.00 0.00 0.00 0.00 0.00 0.00 0.00 0.00LV 0.07 0.01 4.09 0.01NL 0.53 31.03 47.71 28.85 2.18 0.00 31.03 24.08 24.08NO 1.31 9.49 0.04 0.00 6.65 0.06 0.16 2.63 9.49 1.35 1.35PL 17.03 75.56 0.22 0.00 75.56 74.93 0.63 0.00PT 0.01 0.07 0.07 0.07 0.07 0.00SE 0.07 0.17 0.97 0.17 0.12
Source: ACER based on NRAs data.Note: Data include remedial actions for resolving congestion issues only. Costs refer to net costs paid by TSOs (i.e. including possible benefits received due to the remedial actions). Redispatch-ing and countertrading data refer to issues taking place within the bidding zone, i.e. excluding actions conducted to resolve issues in other TSOs’ grid, but including actions conducted by other TSOs to resolve internal issues and share of relevant cross-border actions. No costs related to costly remedial actions were incurred in Bulgaria, Croatia, Cyprus, Greece, Ireland, Luxembourg, Poland, Romania, Slovakia and Slovenia. Switzerland has not provided details on the costs. Other actions include network reserves in Austria, Germany (including both availability and activation payments), Latvia and Lithuania, cross-border redispatching in Belgium, RES curtailment in Germany and the so called “restriction contracts” in the Netherlands (contracts related to the avail-ability for downward ramping in situations where there is a risk of inadequate capacity available for redispatching, e.g. in case of foreseen maintenance). Due to unavailability of data, the Danish NRA provided only information on redispatching for transmission related congestion (0.9 GWh) and on redispatching conducted internally to solve issues located in a neighbouring TSO’s area (3905 GWh with a cost of 72.4 million euros).

112
A C E R / C E E R A N N U A L R E P O R T O N T H E R E S U L T S O F M O N I T O R I N G T H E I N T E R N A L E L E C T R I C I T Y M A R K E T S I N 2 0 2 0
Table 13: Characteristics of existing CMs in the EU – 2020
MS Type of CMa
State Aid approval Start End Delivery
period Long term contractsEligibility
Auction lead timeb Frequency of auctions Minimum bid size
Auction clearing methodc
CO2 limitsd Cost recoveryDSR, RES,
Storage Aggregators
BE SR YES 2014 2022 annual NO ALLe YES T-1 annual 1MW PAC NO special levyBG TCP NO 2013 2020 annual NO DSR NA NA annual NA NA NODE SR YES 2018 2025 2 years NO ALLe DSR only T-1 bi-annual 5MW PAC YES network tariffsES TCP NO 2018 annual YES NA NA NA NA NA NA NA NA
FI SR NO 20213 winter
months and 1 non winter
NO DSR, RES DSR only T-1 annual 10MW PAC NO network tariffs
FR DCO YES 2016 2026 10-25 days per year
YES (up to 7 years) ALL YES T-4, T-3, T-2, T-1
T-4 - annual, T-3 andT-2 four times/year, T-1 six times/year
0.1 MW PACYES
(only for new units)
suppliers
GR TCP YES 2018 2021 annual NO DSR NO various (months) 2-3 per year 1MW PAC NO suppliersIE
(SEM) MWCP YES 2017 2027 annual YES (up to 10 years) ALL YES T-4, T-1 annual NAf PAC YES suppliers
IT MWCP YES 2018 2028 annualg YES (up to 15 years) ALL YES
T-4 (lower lead times in short term), additional auctions
annual (two auctions in 2019) 1MW PAC YES suppliers
PL MWCP YES 2018 2030 annual YES (up to 15 years) ALL YES T-5, T-1 NA 0.001 MWh PAC YES network tariffsPT TCP NO NA 2018 annual YES (10 years) DSR YES T-1 annual 1 MW NA YES network tariffs
SE SR NO NA 2025 annual 15 Nov to 15 Mar NO RES YES T-1 annual 5 MW NA BRPs
Source: ACER based on information from NRAs.Explanatory note: a The categorisation of the schemes is based on the taxonomy of the EC’s sector inquiry (see footnote 190). Abbreviations refer to strategic reserves (SR), targeted capacity payments (TCP), market wide central buyer (MWCB), market wide de-centralised capacity obligations (MW-DCO).b T refers to the delivery year the auctions are about.c Auction clearing methods are pay-as-clear (PAC) and pay-as-bid (PAB). d Relevant to Art. 22(4) of the recast Electricity Regulation.e There are no legal restrictions for RES participation, however intermittent RES likely not fulfill the technical requirements.f In the SEM CM auctions, bids may consist up to five quantity-price blocks with no minimum quantity size.g RES and DSR are obliged to be available during the peak hours of each working day, peak hours being the 6 hours with the highest load (they can change weekly). h The minimum total net capacity for participation in the auction is two MW, however bid blocks may start from as low as one kW.Note: In France, a targeted capacity payment is also provided for the commissioning of a 442 MW CCGT plant in the Britany region following a State Aid approval by the EC (SA.40454 2015/C (ex 2015/N)). For the Italian CM auction, the pay-as-bid method is used in the cases capacity is cleared due to network constraints. In Spain, auctions were postponed since 2018 and in Portugal the scheme for the targeted CM was revoked in 2018 and the scheme for SR CM was suspended and postponed until EC assessment. In Sweden, no auction took place in 2020.

113
A C E R / C E E R A N N U A L R E P O R T O N T H E R E S U L T S O F M O N I T O R I N G T H E I N T E R N A L E L E C T R I C I T Y M A R K E T S I N 2 0 2 0
Table 14 Interruptibility schemes summary table – 2020351
Member State Product / Programme Activation criteria Procurement Remuneration
Total Contracted
Capacity (MW)
Minimum Eligible
Capacity (MW)
Aggregation possible
Availability requirements
Maximum length/number of interruption
Number of participants Status
DEImmediately interruptible load within 1 s at 49.7 Hz
AuctionAvailability (pay as clear) Energy (pay as bid)
7505 YES
Whole week except 120 quarters of an hour per week
1 to 32 quarters of an hour/week No dataExpires Jul-22, renewal under considerationQuickly interruptible load within 15 min 750
ESProduct 1 automatic
Auction Availability (pay as clear) 1000 5 NO
Minimum of 95 % of the hours of the period assigned
For a 5MW block: 40h max per month, 240h max per year. Maximum length of 1 h and two consecutive activations
118 bidders belonging to 62 business groups
Phased out in July-20Product 2 within 15 min
FR Lot 1 Automatic activation on
frequency drop (49.82 Hz for 3 s), manual activation possible.
Tender Availability (pay as bid) 1334
40NO
Availability 7500 hours / year max 10 activations per year
18The current scheme has been in place since July 1, 2016Lot 2 25 Availability 4500
hours / year max 5 activations per year
GR Product 1 within 1 min
Auction Availability (pay as clear)
4002 NO 24 hours/day
max 5 power reduction orders/month, max 36 hours/year
37 Phased out after Sep-21
Product 2 within 5 min 400 max 3 power reduction orders/month, max 288 hours/year
IE
Short Term Active Response (STAR) automatic at 48.85 Hz
Registry Energy (administrative price)
45 No lower limit NOBetween 07:00 and 24:00 on every day of the year.
max 20 interruptions per year Approx. 30 Phased out in 2018
Powersave with 30 min pre-notification 3 0,1 YES 24 hours/day min 1 event within one contractual period Approx. 10
“Last activated in 2016 Formally closed in 2020”
IT Mainland automatic within 200 ms
at 49.8 Hz or upon TSO instruction
Auction“Availability (pay as clear) Energy (pay as bid)”
40001 NO No data 8 hours / No max number of
interruptions No data No dataIslands of Sardinia and Sicily 600
PL
Guaranteed Programme summer & winter (PG)
time to achieve reduction: 0,5h-4h
Tender & Auction
Availability (tender) Energy (bids optimised with algorithm)
“winter: 612 summer: 764,5”
1 (for areas), 10 (for the MS)
YES
Working days 10:00 - 18:00 - summer; 16:00 - 20:00 - winter
7 obligatory response, after that voluntary response
14 (including aggregators)
New scheme since April-21
Simplified Non-Guaranteed Programme (PBU)
time to achieve reduction: 0,5h-6h
Energy (bids optimised with algorithm)
capacity becomes known to the TSO after the request for
biding
1 Working days 08:00 - 22:00
voluntary response, no limitNon-Guaranteed Programme (PB)
time to achieve reduction: from 0,5h
Energy (bids optimised with algorithm)
1 (for areas), 10 (for the MS)
Working days 10:00 - 18:00 - summer; 16:00 - 20:00 - winter
PT
5 product types with different activation characteristics i.e.: from automatic activation to 2 hours pre-notification
automatic at 49.2 Hz or pre-notification from 5 min to 2 hours depending on the product
Registry Availability (administrative price) 690,5 4 NO 24 hours/day
max 12 / 8 / 3 / 2 / 1 hours at once depending on the product; max total 120 hours/year; max once a day and 5 times per week
47Expires Nov-21, renewal under consideration
Source: Information provided by NRAs and, in case of France, by the TSO.
351 In case of Ireland, the data relates to the last available at the time of phase out.

114
ACER/CEER ANNUAL REPORT ON THE RESULTS OF MONITORING THE INTERNAL ELECTRICITY MARKETS IN 2020
Table 15: Main market characteristics of the Contracting Parties of the Energy Community- 2020 (TW)
Contracting Parties Installed Capacity (TW) Peak Demand (TW) Electricity Production (TW) Electricity Demand (TW)
Year 2019 2020 2019 2020 2019 2020 2019 2020Albania 2.28 2.50 1.50 1.40 5,206.05 5,313.03 7,612.08 7,588.64Bosnia and Hercegovina 4.51 4.53 1.95 1.80 16,074.01 15,390.68 11,438.67 10,577.68
Georgia 4.25 4.53 2.05 2.11 11,620.00 11,159.00 13,248.00 12,616.00Kosovo*352 1.10 1.11 1.25 1.25 5,717.81 6,300.80 6,001.20 6,166.74Moldova 2.91 2.52 2.92 2.52 3,658.03 4,102.45 3,658.03 4,102.45Montenegro 1.03 1.04 0.61 0.55 3,382.87 3,225.20 2,966.99 2,819.00North Macedonia 2.09 2.10 1.40 1.36 5,658.00 5,127.00 6,504.00 6,476.00Serbia 8.27 8.29 5.47 5.44 34,832.00 35,540.00 29,474.00 29,468.00Ukraine 54.29 54.77 23.50 23.64 148,992.00 148,304.90 148,402.00 144,322.00
Source: compiled by the Energy Community Secretariat.
Table 16: Main market characteristics of the Contracting Parties of the Energy Community - 2020 (%)
Production mix 2020 in % Nuclear Coal/lignite Gas HPP PV Wind Other Sources labelled as “Other”
Albania 0% 0% 0% 99% 1% 0% 0%
Bosnia and Hercegovina 0% 68% 0% 28% 0% 2% 3% PV, biogass, biomass, small wind
Georgia 0% 0% 25% 74% 0% 1% 0%Kosovo*353 0% 95% 0% 3% 0% 1% 0%Moldova 0% 0% 97% 1% 0% 1% 1% biomassMontenegro 0% 46% 0% 44% 0% 10% 0%North Macedonia 0% 49% 22% 25% 1% 2% 1%Serbia 0% 68% 1% 27% 0% 3% 2% distributed generatorsUkraine 51% 27% 10% 5% 4% 2% 1% biomass
Source: compiled by the Energy Community Secretariat.
352 See footnote 341.
353 See footnote 341.

115
ACER/CEER ANNUAL REPORT ON THE RESULTS OF MONITORING THE INTERNAL ELECTRICITY MARKETS IN 2020
Table 17: Market share in generation for the contracting parties of the Energy Community - 2020 (%)
Market share in generation in [%] AL BA GE XK* MD MN MK RS UA
Company 1 58% 41% 25% 95% 79% 84% 71% 96% 52%Company 2 32% 13% 15% 21% 7%Company 3 11% 4% 2% 6%Company 4 13% 3% 5%Company 5 11% 8%Company 6 7%All other with <5% share 42% 3% 37% 5% 3% 16% 8% 4% 24%
Source: compiled by the Energy Community Secretariat.
Table 18: Market share in DAM for the contracting parties of the Energy Community – 2020 (%)
Market share in generation in [%] AL BA GE XK* MD MN MK RS UA
Company 1 12% 25%Company 2 11% 20%Company 3 11% 8%Company 4 10%Company 5 9%Company 6 7%Company 7 5%All other with <5% share 34% 46%
Source: compiled by the Energy Community Secretariat.
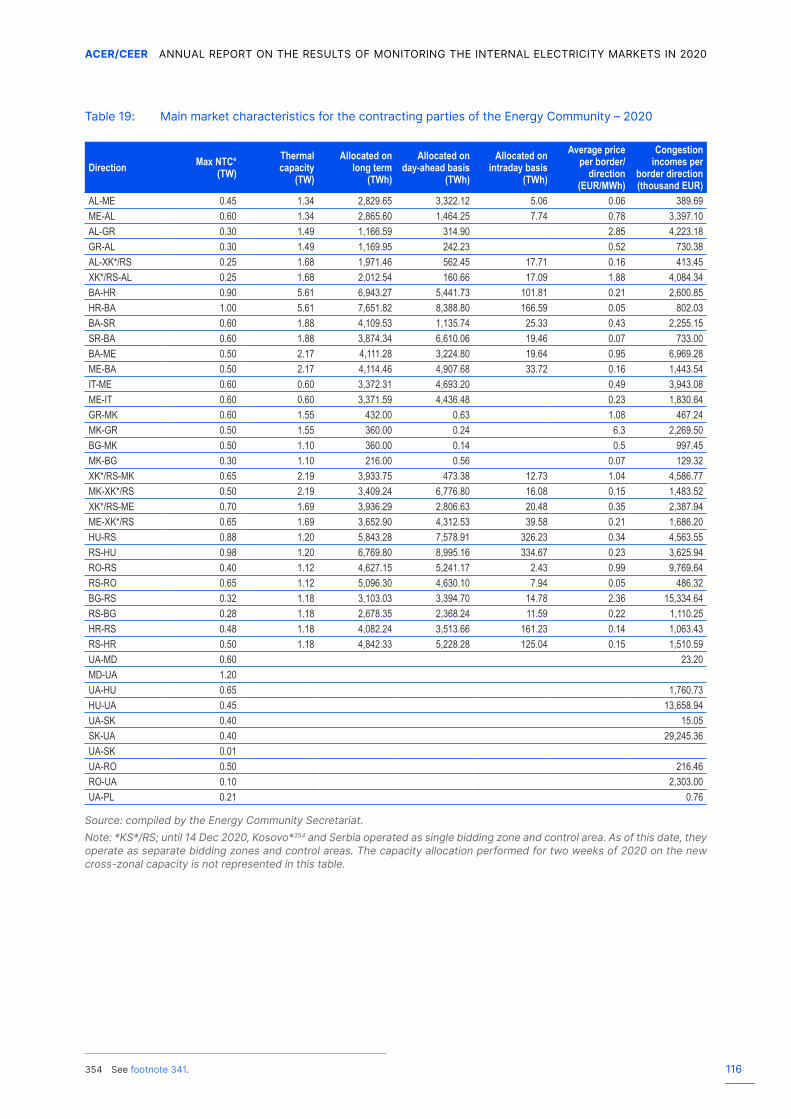
116
ACER/CEER ANNUAL REPORT ON THE RESULTS OF MONITORING THE INTERNAL ELECTRICITY MARKETS IN 2020
Table 19: Main market characteristics for the contracting parties of the Energy Community – 2020
Direction Max NTC* (TW)
Thermal capacity
(TW)
Allocated on long term
(TWh)
Allocated on day-ahead basis
(TWh)
Allocated on intraday basis
(TWh)
Average price per border/
direction (EUR/MWh)
Congestion incomes per
border direction (thousand EUR)
AL-ME 0.45 1.34 2,829.65 3,322.12 5.06 0.06 389.69ME-AL 0.60 1.34 2,865.60 1,464.25 7.74 0.78 3,397.10AL-GR 0.30 1.49 1,166.59 314.90 2.85 4,223.18GR-AL 0.30 1.49 1,169.95 242.23 0.52 730.38AL-XK*/RS 0.25 1.68 1,971.46 562.45 17.71 0.16 413.45XK*/RS-AL 0.25 1.68 2,012.54 160.66 17.09 1.88 4,084.34BA-HR 0.90 5.61 6,943.27 5,441.73 101.81 0.21 2,600.85HR-BA 1.00 5.61 7,651.82 8,388.80 166.59 0.05 802.03BA-SR 0.60 1.88 4,109.53 1,135.74 25.33 0.43 2,255.15SR-BA 0.60 1.88 3,874.34 6,610.06 19.46 0.07 733.00BA-ME 0.50 2.17 4,111.28 3,224.80 19.64 0.95 6,969.28ME-BA 0.50 2.17 4,114.46 4,907.68 33.72 0.16 1,443.54IT-ME 0.60 0.60 3,372.31 4,693.20 0.49 3,943.08ME-IT 0.60 0.60 3,371.59 4,436.48 0.23 1,830.64GR-MK 0.60 1.55 432.00 0.63 1.08 467.24MK-GR 0.50 1.55 360.00 0.24 6.3 2,269.50BG-MK 0.50 1.10 360.00 0.14 0.5 997.45MK-BG 0.30 1.10 216.00 0.56 0.07 129.32XK*/RS-MK 0.65 2.19 3,933.75 473.38 12.73 1.04 4,586.77MK-XK*/RS 0.50 2.19 3,409.24 6,776.80 16.08 0.15 1,483.52XK*/RS-ME 0.70 1.69 3,936.29 2,806.63 20.48 0.35 2,387.94ME-XK*/RS 0.65 1.69 3,652.90 4,312.53 39.58 0.21 1,686.20HU-RS 0.88 1.20 5,843.28 7,578.91 326.23 0.34 4,563.55RS-HU 0.98 1.20 6,769.80 8,995.16 334.67 0.23 3,625.94RO-RS 0.40 1.12 4,627.15 5,241.17 2.43 0.99 9,769.64RS-RO 0.65 1.12 5,096.30 4,630.10 7.94 0.05 486.32BG-RS 0.32 1.18 3,103.03 3,394.70 14.78 2.36 15,334.64RS-BG 0.28 1.18 2,678.35 2,368.24 11.59 0.22 1,110.25HR-RS 0.48 1.18 4,082.24 3,513.66 161.23 0.14 1,063.43RS-HR 0.50 1.18 4,842.33 5,228.28 125.04 0.15 1,510.59UA-MD 0.60 23.20MD-UA 1.20UA-HU 0.65 1,760.73HU-UA 0.45 13,658.94UA-SK 0.40 15.05SK-UA 0.40 29,245.36UA-SK 0.01UA-RO 0.50 216.46RO-UA 0.10 2,303.00UA-PL 0.21 0.76
Source: compiled by the Energy Community Secretariat.Note: *KS*/RS; until 14 Dec 2020, Kosovo*354 and Serbia operated as single bidding zone and control area. As of this date, they operate as separate bidding zones and control areas. The capacity allocation performed for two weeks of 2020 on the new cross-zonal capacity is not represented in this table.
354 See footnote 341.

117
ACER/CEER ANNUAL REPORT ON THE RESULTS OF MONITORING THE INTERNAL ELECTRICITY MARKETS IN 2020
Annex 2: Efficiency of current bidding zone configuration (indicators, qualification criteria and detailed analysis)402 ACER’s market efficiency analysis focuses on two main criteria: cross-zonal capacity and costly remedial
actions. The market efficiency analysis further includes an informative analysis on LFs. Each of these criteria is assessed through various indicators:
• The available cross-zonal capacity criterion,
• The costly remedial actions criterion,
• The loop flows criterion.
403 The first two criteria have been introduced in section 4.4.1. LFs monitoring compares, for each border, average absolute LFs with the thermal capacities of interconnectors in order to assess the share of inter-connectors consumed by internal exchanges. For a given MS, the average over borders (weighted with thermal capacities of interconnectors) is then derived, along with the worst border (i.e. the highest border ratio). These indicators are informative and are not formally taken into account in the efficiency assess-ment, but rather hint at possible underlying causes for low cross-zonal capacity or high costs of remedial actions. Table 20 shows the detailed MS-level assessment of market efficiency, and leads to the following conclusions.
Table 20: Bidding zone efficiency (detailed assessment)
CountryPercentage of time when
the 70% min. target is met (%)
Cost of remedial actions used for congestion
management per unit demand (average 2018-
2020, euro/MWh demand)
Loop flows vs. thermal capacity on interconnectors
(%) (average 2018-2020)
Loop flows vs. thermal capacity on interconnectors
(%) (worst border, average 2018-2020)
AT 34% 2.08 22% 57%
BE 1% 0.04 20% 20%
BG 0% 0.00 9% 14%
CZ 46% 0.01 36% 57%
DE 5% 2.13 24% 77%
DK 21% 0.00
ES 55% 0.74 0% 1%
FR 33% 0.00 11% 34%
GR 67% 0.00 5% 14%
HR 1% 0.00 25% 25%
HU 0% 0.01 14% 25%
IT 44% 3.82 35% 49%
NL 1% 0.61 17% 20%
PL 18% 0.72 41% 77%
PT 47% 0.12 0% 0%
RO 2% 0.00 7% 11%
SI 3% 0.00 33% 49%
SK 22% 0.00 20% 30%
Note: The assessment of the cost of remedial actions per unit demand covers the 2018-2020 period; other assessments cover the year 2020. The cost of remedial actions per MWh load is obtained by dividing the sum of redispatching costs and costs related to other actions, excluding the costs incurred to solve voltage issues at the transmission level, by the total national demand.
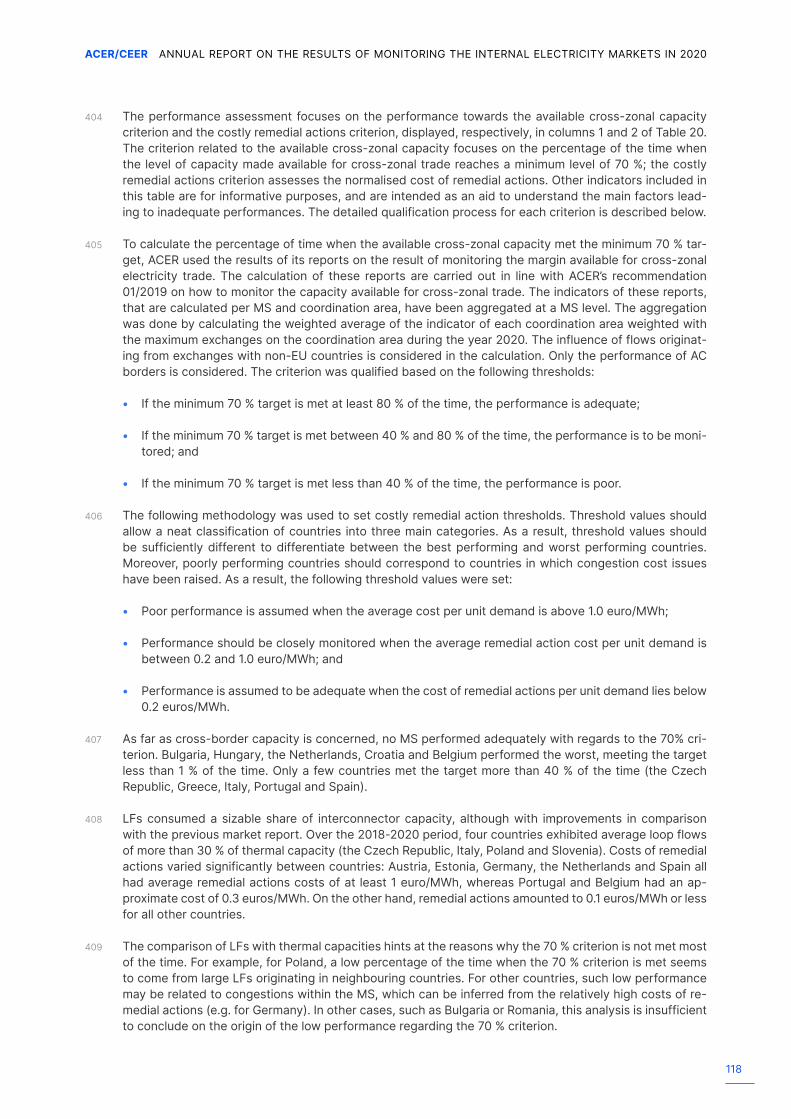
118
ACER/CEER ANNUAL REPORT ON THE RESULTS OF MONITORING THE INTERNAL ELECTRICITY MARKETS IN 2020
404 The performance assessment focuses on the performance towards the available cross-zonal capacity criterion and the costly remedial actions criterion, displayed, respectively, in columns 1 and 2 of Table 20. The criterion related to the available cross-zonal capacity focuses on the percentage of the time when the level of capacity made available for cross-zonal trade reaches a minimum level of 70 %; the costly remedial actions criterion assesses the normalised cost of remedial actions. Other indicators included in this table are for informative purposes, and are intended as an aid to understand the main factors lead-ing to inadequate performances. The detailed qualification process for each criterion is described below.
405 To calculate the percentage of time when the available cross-zonal capacity met the minimum 70 % tar-get, ACER used the results of its reports on the result of monitoring the margin available for cross-zonal electricity trade. The calculation of these reports are carried out in line with ACER’s recommendation 01/2019 on how to monitor the capacity available for cross-zonal trade. The indicators of these reports, that are calculated per MS and coordination area, have been aggregated at a MS level. The aggregation was done by calculating the weighted average of the indicator of each coordination area weighted with the maximum exchanges on the coordination area during the year 2020. The influence of flows originat-ing from exchanges with non-EU countries is considered in the calculation. Only the performance of AC borders is considered. The criterion was qualified based on the following thresholds:
• If the minimum 70 % target is met at least 80 % of the time, the performance is adequate;
• If the minimum 70 % target is met between 40 % and 80 % of the time, the performance is to be moni-tored; and
• If the minimum 70 % target is met less than 40 % of the time, the performance is poor.
406 The following methodology was used to set costly remedial action thresholds. Threshold values should allow a neat classification of countries into three main categories. As a result, threshold values should be sufficiently different to differentiate between the best performing and worst performing countries. Moreover, poorly performing countries should correspond to countries in which congestion cost issues have been raised. As a result, the following threshold values were set:
• Poor performance is assumed when the average cost per unit demand is above 1.0 euro/MWh;
• Performance should be closely monitored when the average remedial action cost per unit demand is between 0.2 and 1.0 euro/MWh; and
• Performance is assumed to be adequate when the cost of remedial actions per unit demand lies below 0.2 euros/MWh.
407 As far as cross-border capacity is concerned, no MS performed adequately with regards to the 70% cri-terion. Bulgaria, Hungary, the Netherlands, Croatia and Belgium performed the worst, meeting the target less than 1 % of the time. Only a few countries met the target more than 40 % of the time (the Czech Republic, Greece, Italy, Portugal and Spain).
408 LFs consumed a sizable share of interconnector capacity, although with improvements in comparison with the previous market report. Over the 2018-2020 period, four countries exhibited average loop flows of more than 30 % of thermal capacity (the Czech Republic, Italy, Poland and Slovenia). Costs of remedial actions varied significantly between countries: Austria, Estonia, Germany, the Netherlands and Spain all had average remedial actions costs of at least 1 euro/MWh, whereas Portugal and Belgium had an ap-proximate cost of 0.3 euros/MWh. On the other hand, remedial actions amounted to 0.1 euros/MWh or less for all other countries.
409 The comparison of LFs with thermal capacities hints at the reasons why the 70 % criterion is not met most of the time. For example, for Poland, a low percentage of the time when the 70 % criterion is met seems to come from large LFs originating in neighbouring countries. For other countries, such low performance may be related to congestions within the MS, which can be inferred from the relatively high costs of re-medial actions (e.g. for Germany). In other cases, such as Bulgaria or Romania, this analysis is insufficient to conclude on the origin of the low performance regarding the 70 % criterion.

119
ACER/CEER ANNUAL REPORT ON THE RESULTS OF MONITORING THE INTERNAL ELECTRICITY MARKETS IN 2020
Annex 3: Unscheduled flows410 As shown in previous editions of the MMR355, UFs present a challenge to the further integration of the IEM.
Their persistence reduces tradable cross-zonal capacity, market efficiency and network security.
411 The definitions of the flows and the methodology for the calculations underpinning results in this Annex are provided in the methodological paper on UFs356. Briefly, UFs are comprised of unscheduled allocated flows (UAFs), most of which stem from insufficient coordination in capacity calculation and allocation processes, and loop flows (LFs), which originate from electricity exchanges inside other bidding zones.
412 The data on the allocated flows357 (AFs) used in the analysis of this Annex were provided to ACER by EN-TSO-E. AFs were calculated on an hourly basis, using some simplifications. Because of the simplifications used, the AFs data obtained can be considered only as a proxy for the total amount of AFs (and indirectly LFs and UAFs) observed on each border. For the Core (CWE) region, ENTSO-E provided improved infor-mation on schedules, thus refining the analysis and reducing the amount of UAFs for this region. ACER has been monitoring the evolution of UFs in Europe (on the borders in the Core and Italy North regions and on Swiss borders) since 2012. In 2020, total UFs amounted to 111 TWh, which represents an overall increase of 2 % compared to 2019.
Figure 56: Absolute aggregate sum of UFs for the Core (CWE and non-CWE borders) and Italy North regions and for Swiss borders – 2016–2020 (TWh)
Source: ACER calculations based on ENTSO-E and Vulcanus data.Note: The calculation methodology used to derive UFs is described in the methodological paper on UFs358. The UFs are calcu-lated with an hourly frequency; the absolute values are then summed across the hours and aggregated for borders belonging to the relevant regions.
413 As shown in Figure 56, in the Core (excluding CWE) region, UFs increased by almost 8 % compared to 2019. Overall, this region had the larger share of UFs, more than 46 % of all UFs in Europe. In the Core (CWE) region, UFs decreased by more than 5 % year-on-year. In the Italy North region the UFs increased by 4 %, compared to 2019, while UFs remained stable on the Swiss borders.
355 Formoreinformation,pleaseseeSection5.1‘Unscheduledflows’(page28)oftheElectricityWholesaleMarketsVolumeofthe2015MMR.
356 For additional information, please see the methodological paper on ‘Unscheduled flows’, available at: https://www.acer.europa.eu/en/Electricity/Market%20monitoring/Documents_Public/ACER%20Methodological%20paper%20-%20Unscheduled%20flows.pdf.
357 Allocated flows describe the actual flows coming from cross-zonal capacity allocation.
358 See footnote 355.
TWh
70
50
60
40
30
20
10
0
Core (CWE) Core (excl. CWE) Italy North Swiss borders2016 2017 2018 2019 2020 2016 2017 2018 2019 2020 2016 2017 2018 2019 2020 2016 2017 2018 2019 2020
AT - DEBE - FRBE - NLDE - FRDE - NL
AT - ITFR - ITIT - SI
AT - CHCH - DECH - FRCH - IT
AT - CZAT - HUAT - SICZ - DECZ - DE 50HertzCZ - DE TENNETCZ - PL
CZ - SKDE - PLHR - HUHU - ROHU - SKPL - SK

120
ACER/CEER ANNUAL REPORT ON THE RESULTS OF MONITORING THE INTERNAL ELECTRICITY MARKETS IN 2020
414 Figure 57 shows the prevailing direction of UF volumes. It reveals that the overall pattern still consists of two major loops, from Germany to Switzerland to the south west, and to Poland to the east. UFs on the German-Polish border increased by 6 % year-on-year, confirming the levels observed in 2019. Un-scheduled flows between the Netherlands and Germany on average reverted to the same direction as in 2018, from Germany to the Netherlands, however at significantly lower levels than in 2018 (65 MW in 2020 against 645 MW in 2018). The lower UF levels on this border relate to the overall shift from coal to gas, which led to reduce the amount of electricity imported from Germany, while the amount of electricity exports for the Netherlands increased in 2019 and 2020. Unscheduled flows switched direction, from Italy to Switzerland, due to a further decrease on the French-Italian border, confirming previous years’ trend. Flows on the border between Germany and Austria further decreased, likely due to the confirmation of the change in flow patterns observed in the region since 2019, as a consequence of the general shift from coal to gas. Figure 58 and Figure 59 depict the UFs decomposition into UAFs and LFs.
Figure 57: Average oriented UFs in Continental Europe – 2020 (MW)
Source: ACER calculations based on ENTSO-E and Vulcanus data.Note: Average UFs are average hourly oriented values in 2020. The arrow width and label describe the average UF. The arrow is red when UFs flow in the same direction as the physical flow, and yellow when UFs flow opposite to physical flows. The direction of the UF is the same as that of the physical flow if the physical flow exceeds the cross-zonal schedule, or if both run in opposite directions. The direction of the UF is the opposite to the physical flow if the cross-zonal schedule exceeds the physical flow.
128717
242
231
221
209
65 950
31183
122
985
969
2
1315
136
147
270
339110
98
27
12
236
238
589
538
163169
4
404
13139

121
ACER/CEER ANNUAL REPORT ON THE RESULTS OF MONITORING THE INTERNAL ELECTRICITY MARKETS IN 2020
Figure 58: Average oriented UAFs in Continental Europe – 2020 (MW)
Source: ACER calculations based on ENTSO-E and Vulcanus data.Note: Average UAFs are average hourly oriented values in 2020. The arrow width and label describe the average UAF. The arrow is red when UAFs flow in the same direction as the physical flow, and yellow when UAFs flow opposite to physical flows.
Figure 59: Average oriented LFs in Continental Europe – 2019 (MW)
Source: ACER calculations based on ENTSO-E and Vulcanus data.Note: Average LFs are average hourly-oriented values in 2020. The arrow width and label describe the average LF. The arrow is red when LFs flow in the same direction as the physical flow, and yellow when LFs flow opposite to physical flows.
22
681
218
224
115
64142 133
397
390
211
42
33
889
614
296
97
308
278676
209553
15
184
30
13
189
14
411
288
9068
55
65
37
138
260
268
64
205
172
370532
145
281
147
639
274 397
13
54
309
97
97228
419
127
10

122
ACER/CEER ANNUAL REPORT ON THE RESULTS OF MONITORING THE INTERNAL ELECTRICITY MARKETS IN 2020
415 Figure 60 describes the average absolute UAFs and LFs in Continental Europe. The largest UAFs and LFs were both observed in the Core (excluding CWE) region, which is the region with the largest number of EU borders. The LFs remained on a level comparable to 2019.
Figure 60: Average absolute UAFs and LFs in Continental Europe – 2016–2019 (GWh)
Source: ACER calculations based on ENTSO-E and Vulcanus data.Note: For a given CCR, the UAFs (resp. LFs) are the sum of absolute UAFs (resp. LFs) on all individual borders. Neither UAFs nor LFs were observed in the GRIT region, because this region only has one DC border. Compared to the previous figures, the absolute UAFs and LFs are non-oriented.
416 Despite significant improvements in many regions, UFs still significantly impede the efficient functioning of the Internal Electricity Market, mainly by ‘consuming’ flow on interconnectors. As a result, the capacity available for cross-zonal trade is limited. FB market coupling should lead to decreasing UAFs (in particular those resulting from exchanges within the region) but does not affect LFs. LFs may be tackled through bidding zone reconfiguration or other measures to ensure non-discrimination in capacity calculation.
GWh
2016
2017
2018
2019
2020
2016
2017
2018
2019
2020
2016
2017
2018
2019
2020
2016
2017
2018
2019
2020
2016
2017
2018
2019
2020
2016
2017
2018
2019
2020
Core (excl. Cwe) Core (CWE) Swiss borders Italy north SWESEE
GWh
7,000
5,000
6,000
4,000
2,000
3,000
1,000
0
2016
2017
2018
2019
2020
2016
2017
2018
2019
2020
2016
2017
2018
2019
2020
2016
2017
2018
2019
2020
2016
2017
2018
2019
2020
2016
2017
2018
2019
2020
Core (excl. Cwe) Core (CWE) Swiss borders Italy north SWESEE
GWh
5,000
6,000
4,000
2,000
3,000
1,000
0
Loop flows
Unschedules allocated flows
123
ACER/CEER ANNUAL REPORT ON THE RESULTS OF MONITORING THE INTERNAL ELECTRICITY MARKETS IN 2020
Annex 4: Methodology to estimate the scores per barrier
417 As described in the methodological study359, the construction of the scores follows a stepwise approach, as follows:
1. Starting from raw data, the relevant indicators for each barrier are calculated as explained in Ta-ble 21. The table also describes how missing data are processed to derive a value for the indicator, or otherwise to consider the indicator as NA (not available).
2. To ensure comparability, each indicator is normalised onto a common scale ranging from 0 (the poorest performance) to 1 (the best performance).
3. The score for each barrier is then calculated as the weighted average of the values resulting from step 2. By default, all indicators are assumed to have the same weight360. When at least half of the indicators of a barrier are missing, the barrier score is considered as NA (not available).
359 See footnote 242.
360 The only exception applies to the barrier on “limited incentive to contract dynamic retail prices”, for which a 50% weight is given to the indicator “Share of final household consumers with smart meters among total households (metering points)” and a 25% weight is given to the other two indicators “Share of energy component in the retail electricity prices” and “Level of dispersion of the day-ahead wholesale prices”.

124
A C E R / C E E R A N N U A L R E P O R T O N T H E R E S U L T S O F M O N I T O R I N G T H E I N T E R N A L E L E C T R I C I T Y M A R K E T S I N 2 0 2 0
Table 21: Overview of the indicators used for each of the analysed barriers – 2020
Barrier Indicator Ranges and thresholds Method to treat missing data (see notes below the table) Data sources
Restrictions on prices and features of the imbalance settlement
Composite indicator assessing the maximum price limits in DA and ID markets compared to the VoLL. For each timeframe, an indicator is calculated in two steps:• If the price limit is in line with ACER Decision No 4/2017 and ACER Decision No 5/2017 pursuant
to Article 10.1 of the Electricity Regulation, a score of 1 is given;• Otherwise, a ratio between the price limit and the VoLL is calculated. A correction factor of 0.8 is
applied if the limit is beyond the VoLL and of 0.7 if it is below.Finally, an arithmetic average for the DA an ID indicators is calculated.
From 0 to 1. Method 2 ACER calculation based on NRAs data
Composite indicator assessing the minimum price limits in DA and ID markets compared to the limits set at ACER’s decisions pursuant to Article 10.1 of the Electricity Regulation. For each timeframe, an indicator is calculated in two steps:• If the price limit is in line with ACER Decision No 4/2017 and ACER Decision No 5/2017 pursuant
to Article 10.1 of the Electricity Regulation, a score of 1 is given;• Otherwise, a ratio between the price limit and the limits pursuant to the above mentioned article
is calculated.Finally, an arithmetic average for the DA an ID indicators is calculated.
From 0 to 1. Method 2 ACER calculation based on NRAs data
Number of hours when the maximum or minimum price limits in DA, ID and balancing energy markets were reached in the 2018-2020 period.
From 0 to the highest number of hours when the limits are hit in a MS in the period.
Method 2 NRAs
Composite indicator assessing features of the national imbalance settlement mechanisms (duration of the ISP, imbalance pricing method and the number of imbalance positions) against the European target model. A scoring system is used to illustrate how far or close a MS is from the target model.
From 0 to 6 (if the target model is met, i.e. 15 min ISP, single pricing and single position).
Method 1 ACER calculation based on ENTSO-E data
Limited competitive pressure and/or liquidity in wholesale markets
Composite indicator assessing the requirement to sell energy at regulated prices or under some regulated mechanism aside the market. It is calculated as the share of capacity installed as of 31 December 2020 subject to the requirement, multiplied by the share of the volume actually sold at the regulated price.
From 0 to 10,000 (maximum if 100% of capacity installed is subject to sell 100% of their production at regulated prices).
Method 2 NRAs
CR3: market share of the three biggest generation groups in 2020. From 0% to 100%. A CR3 equal and below 30% receives the maximum score 1. Between CR3 of 30% and 100%, the score reduces linearly to 0.
Method 2 CEER
Number of generation groups covering more than 5% of national generation in 2020. From 0 to 10 (maximum score for more than 10 generators above 5% of national generation).
Method 2 CEER
Overall liquidity index* From 0 to the highest value of the overall liquidity index observed in the MSs in 2020.
Method 2 ACER calculation based on data from NEMOs, PXs, ENTSO-E TP and NRAs
Bid-ask spread of the most frequently traded forward products* Between the minimum and the maximum values observed in the MSs in 2020.
Method 2 ACER calculation based on private data providers
Insufficient cross-zonal capacity Composite indicator illustrating the overall gap to meet the 70% target in 2020. For each border, a value is calculated as the share of hours when the minimum 70% target was not met, multiplied by the additional cross-zonal capacity necessary to meet the target during those hours. The composite indicator is the weighted average of all borders of a MS.
From 0 (the target is met for all hours) to 0.35 (if the gap to meet the target is 35% or higher).
Method 2 ACER calculation based on TSOs data

125
A C E R / C E E R A N N U A L R E P O R T O N T H E R E S U L T S O F M O N I T O R I N G T H E I N T E R N A L E L E C T R I C I T Y M A R K E T S I N 2 0 2 0
Barrier Indicator Ranges and thresholds Method to treat missing data (see notes below the table) Data sources
Bidding zones not reflecting structural congestions
Average burdening loop flows on EU interconnectors in the 2018-2020 period. From 0 to the highest share of loop flows observed in the period.
Method 2 ACER calculation based on TSOs data
Average redispatching costs used to resolve congestions, in the 2018-2020 period normalised with the national demand.
From 0 euros/MWh (the maximum score) to 1 euros/MWh. All results higher than 1 euros/MWh are considered to be a high restriction.
Method 1 except for countries witha central dispatching model where Method 2 is applied
ACER calculation based on NRAs data
Restrictive requirements in prequalification and/or the design of products for balancing impacting efficient price formation
Pre-determination of the balancing energy price in the balancing capacity contracts. Binary: 0 (energy prices pre-determined in balancing capacity contracts) or 1.
Method 1 NRAs
Composite indicator assessing the lead time for the procurement of balancing capacity for all types of reserves in 2020. It is calculated in two steps:• First the share of volume procured for each lead time range (e.g. less than 1 day ahead of
delivery, between 1 and 7 days etc.) is calculated. • Then the shares are multiplied by a score assigning a higher value to shorter procurement lead
times, and finally aggregated.
From 0 to 4 (maximum score if 100% of balancing capacity is procured within the same day of delivery).
Method 2 ACER calculation based on NRAs data
Composite indicator assessing the price settlement rule of balancing energy for all types of reserves in 2020. A scoring system allocates the best score when marginal pricing is used and the worst one when prices are regulated followed by pay-as-bid methods.
From 0 to 8 (if marginal pricing is the settlement rule for all four balancing reserves). If a MS does not have all four balancing energy reserves, the final score is rescaled to ensure comparability.
Method 1 ACER calculation based on NRAs data
Composite indicator assessing the activation rule of balancing energy for aFRR, mFRR and RR in 2020. A scoring system allocates the best score when merit order activation is used and the worst one when pro-rata activation is used.
From 0 to 3 (maximum score if merit order activation is used for all three balancing reserves). If a MS does not have all three balancing reserves, the final score is rescaled to ensure comparability.
Method 1 ACER calculation based on NRAs data
Composite indicator assessing the possibility to offer non-contracted balancing energy bids (free energy bids) for aFRR, mFRR and RR in 2020. A scoring system allocates the best score when free bids are allowed.
From 0 to 3 (maximum score if free bids are allowed for all three balancing reserves). If a MS does not have all three balancing capacity reserves, the final score is rescaled to ensure comparability.
Method 1 ACER calculation based on NRAs data
Restrictive requirements in prequalification and/or the design of products for balancing hindering easy market entry and participation for new entrants and small actors
Composite indicator assessing the maximum and minimum duration of the delivery period for mFRR and RR in 2020.
From 0 to 12 (maximum score if both the minimum and the maximum delivery periods are 0 minutes for mFRR and RR). If a MS does not have any of the two balancing reserves, the score is rescaled to avoid penalties.
Method 1 ACER calculation based on NRAs data
Composite indicator assessing the type of capacity and energy providers allowed to participate in balancing capacity and energy markets for all types of reserves in 2020. A scoring system allocates the worst score if only generators were allowed to participate.
From 0 to 56 (maximum score if generators, DSR, pump storage units, batteries and distributed generators are allowed to participate in all balancing capacity and energy reserves). If a MS does not have all four balancing capacity reserves, the final score is rescaled to ensure comparability.
Method 1 ACER calculation based on ENTSO-E data

126
A C E R / C E E R A N N U A L R E P O R T O N T H E R E S U L T S O F M O N I T O R I N G T H E I N T E R N A L E L E C T R I C I T Y M A R K E T S I N 2 0 2 0
Barrier Indicator Ranges and thresholds Method to treat missing data (see notes below the table) Data sources
Restrictive requirements in prequalification and/or the design of products for balancing hindering easy market entry and participation for new entrants and small actors
Composite indicator assessing the type of load units allowed to participate in balancing capacity and energy markets for all types of reserves in 2020. A scoring system allocates the worst score if no load was allowed to participate.
From 0 to 6 (maximum score if aggregators, aggregators including small size consumers, large consumers, small consumers, pump storage units and other storage load (e.g. battery storage and thermal storage) are allowed to participate in all balancing capacity and energy reserves). If a MS does not have all four balancing capacity reserves, the final score is rescaled to ensure comparability.
Method 1 ACER calculation based on ENTSO-E data
Composite indicator assessing the minimum capacity required in the prequalification process for all type of reserves in 2020.A scoring system allocates the worst score to a minimum capacity requirement higher than 10MW.
From 0 to 16 (maximum score if no minimum capacity is required in the prequalification process for all four balancing reserves). If a MS does not have all four balancing capacity reserves, the final score is rescaled to ensure comparability.
Method 1 ACER calculation based on NRAs data
Composite indicator assessing the minimum bid size required for balancing capacity and energy for all types of reserves in 2020. A scoring system allocates the worst score to a minimum bid size higher than 10MW.
From 0 to 16 (maximum score if no minimum bid size is required for both balance capacity and energy and for all four balancing reserves). If a MS does not have all four balancing capacity reserves, the final score is rescaled to ensure comparability.
Method 1 ACER calculation based on ENTSO-E data
Composite indicator assessing the lead time for the procurement of balancing capacity for all types of reserves in 2020. It is calculated in two steps:• First the share of volume procured for each lead time range (e.g. less than 1 day ahead of
delivery, between 1 and 7 days etc.) is calculated. • Then the shares are multiplied by a score assigning a higher value to shorter procurement lead
times, and finally aggregated.
From 0 to 4 (maximum score if 100% of balancing capacity is procured within the same day of delivery).
Method 2 ACER calculation based on NRAs data
Composite indicator assessing the validity period of the balancing energy bids for aFRR, mFRR and RR in 2020. A scoring system allocates the worst score to 4 hour-products.
From 0 to 9 (maximum score if the validity periods is 15 min for all three balancing reserves).If a MS does not have all three balancing capacity reserves, the final score is rescaled to ensure comparability.
Method 1 ACER calculation based on ENTSO-E data
Composite indicator assessing the length of the balancing capacity contracts for all balancing reserves in 2020. A scoring system allocates the worst score if balancing capacity contracts have a length of one year or more.
From 0 to 16 (maximum score if the length of the balancing capacity contracts is hour(s) for all four balancing reserves). If a MS does not have all four balancing capacity reserves, the final score is rescaled to ensure comparability.
Method 1 ACER calculation based on ENTSO-E data
Composite indicator assessing the symmetry of the balancing capacity products for FCR, aFRR and mFRR in 2020. A scoring system allocates the worst score when symmetrical products are required.
From 0 to 3 (maximum score if asymmetrical balancing capacity products are allowed in all three balancing reserves). If a MS does not have all three balancing capacity reserves, the final score is rescaled to ensure comparability.
Method 1 ACER calculation based on ENTSO-E data
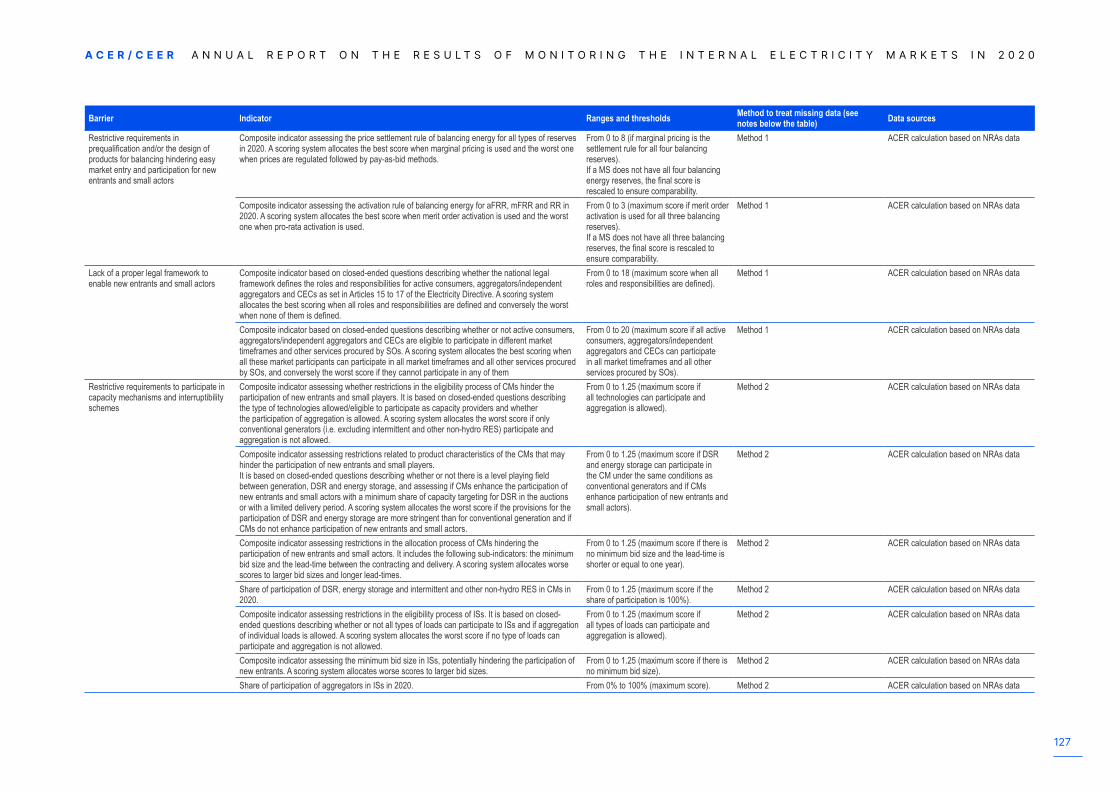
127
A C E R / C E E R A N N U A L R E P O R T O N T H E R E S U L T S O F M O N I T O R I N G T H E I N T E R N A L E L E C T R I C I T Y M A R K E T S I N 2 0 2 0
Barrier Indicator Ranges and thresholds Method to treat missing data (see notes below the table) Data sources
Restrictive requirements in prequalification and/or the design of products for balancing hindering easy market entry and participation for new entrants and small actors
Composite indicator assessing the price settlement rule of balancing energy for all types of reserves in 2020. A scoring system allocates the best score when marginal pricing is used and the worst one when prices are regulated followed by pay-as-bid methods.
From 0 to 8 (if marginal pricing is the settlement rule for all four balancing reserves). If a MS does not have all four balancing energy reserves, the final score is rescaled to ensure comparability.
Method 1 ACER calculation based on NRAs data
Composite indicator assessing the activation rule of balancing energy for aFRR, mFRR and RR in 2020. A scoring system allocates the best score when merit order activation is used and the worst one when pro-rata activation is used.
From 0 to 3 (maximum score if merit order activation is used for all three balancing reserves). If a MS does not have all three balancing reserves, the final score is rescaled to ensure comparability.
Method 1 ACER calculation based on NRAs data
Lack of a proper legal framework to enable new entrants and small actors
Composite indicator based on closed-ended questions describing whether the national legal framework defines the roles and responsibilities for active consumers, aggregators/independent aggregators and CECs as set in Articles 15 to 17 of the Electricity Directive. A scoring system allocates the best scoring when all roles and responsibilities are defined and conversely the worst when none of them is defined.
From 0 to 18 (maximum score when all roles and responsibilities are defined).
Method 1 ACER calculation based on NRAs data
Composite indicator based on closed-ended questions describing whether or not active consumers, aggregators/independent aggregators and CECs are eligible to participate in different market timeframes and other services procured by SOs. A scoring system allocates the best scoring when all these market participants can participate in all market timeframes and all other services procured by SOs, and conversely the worst score if they cannot participate in any of them
From 0 to 20 (maximum score if all active consumers, aggregators/independent aggregators and CECs can participate in all market timeframes and all other services procured by SOs).
Method 1 ACER calculation based on NRAs data
Restrictive requirements to participate in capacity mechanisms and interruptibility schemes
Composite indicator assessing whether restrictions in the eligibility process of CMs hinder the participation of new entrants and small players. It is based on closed-ended questions describing the type of technologies allowed/eligible to participate as capacity providers and whether the participation of aggregation is allowed. A scoring system allocates the worst score if only conventional generators (i.e. excluding intermittent and other non-hydro RES) participate and aggregation is not allowed.
From 0 to 1.25 (maximum score if all technologies can participate and aggregation is allowed).
Method 2 ACER calculation based on NRAs data
Composite indicator assessing restrictions related to product characteristics of the CMs that may hinder the participation of new entrants and small players. It is based on closed-ended questions describing whether or not there is a level playing field between generation, DSR and energy storage, and assessing if CMs enhance the participation of new entrants and small actors with a minimum share of capacity targeting for DSR in the auctions or with a limited delivery period. A scoring system allocates the worst score if the provisions for the participation of DSR and energy storage are more stringent than for conventional generation and if CMs do not enhance participation of new entrants and small actors.
From 0 to 1.25 (maximum score if DSR and energy storage can participate in the CM under the same conditions as conventional generators and if CMs enhance participation of new entrants and small actors).
Method 2 ACER calculation based on NRAs data
Composite indicator assessing restrictions in the allocation process of CMs hindering the participation of new entrants and small actors. It includes the following sub-indicators: the minimum bid size and the lead-time between the contracting and delivery. A scoring system allocates worse scores to larger bid sizes and longer lead-times.
From 0 to 1.25 (maximum score if there is no minimum bid size and the lead-time is shorter or equal to one year).
Method 2 ACER calculation based on NRAs data
Share of participation of DSR, energy storage and intermittent and other non-hydro RES in CMs in 2020.
From 0 to 1.25 (maximum score if the share of participation is 100%).
Method 2 ACER calculation based on NRAs data
Composite indicator assessing restrictions in the eligibility process of ISs. It is based on closed-ended questions describing whether or not all types of loads can participate to ISs and if aggregation of individual loads is allowed. A scoring system allocates the worst score if no type of loads can participate and aggregation is not allowed.
From 0 to 1.25 (maximum score if all types of loads can participate and aggregation is allowed).
Method 2 ACER calculation based on NRAs data
Composite indicator assessing the minimum bid size in ISs, potentially hindering the participation of new entrants. A scoring system allocates worse scores to larger bid sizes.
From 0 to 1.25 (maximum score if there is no minimum bid size).
Method 2 ACER calculation based on NRAs data
Share of participation of aggregators in ISs in 2020. From 0% to 100% (maximum score). Method 2 ACER calculation based on NRAs data

128
A C E R / C E E R A N N U A L R E P O R T O N T H E R E S U L T S O F M O N I T O R I N G T H E I N T E R N A L E L E C T R I C I T Y M A R K E T S I N 2 0 2 0
Barrier Indicator Ranges and thresholds Method to treat missing data (see notes below the table) Data sources
Limited competitive pressure in the retail market
CR3: Market share of the 3 largest suppliers in the whole retail market by volume From 0% to 100%. A CR3 equal and below 30% receives the maximum score 1. Between CR3 of 30% and 100%, the score reduces linearly to 0.
Method 2 CEER
Number of suppliers in the market for households with market shares higher than 5% by metering points
From 0 to 10 (maximum score for more than 10 suppliers above 5% of metering points)
Method 2 CEER
Average number of entries and exits in the retail markets for households and non-households over the period 2018-2020, normalised with the national electricity demand
From 0 to the maximum value observed in the MSs in the period.
Method 2 ACER calculation based on CEER data
Correlation coefficient between the energy component of retail prices and wholesale prices for household consumers
From -1 to 1 (for a perfect positive correlation)
Method 2 ACER calculation based on Eurostat data and ACER database on retail offers and other relevant data. The methodology is further described in Annex 6 of the ACER Market Monitoring report 2015 (See footnote 320).
End-user price interventions Share of household consumers subject to public intervention in the end-user prices setting From 0% (maximum score) up to 100%. Method 2 CEERShare of consumption of household consumers subject to public intervention in the end-user prices setting.
From 0% (maximum score) up to 100%. Method 2 CEER
Share of non-vulnerable consumers subject to public intervention in the end-user prices setting. From 0% (maximum score) up to 100%. Method 2 CEERShare of consumption of non-household consumers subject to public intervention in the end-user prices setting.
From 0% (maximum score) to 100%. Method 2 CEER
Limited incentive to contract dynamic retail prices
Share of final household consumers with smart meters (metering points) From 0% to 100% (maximum score). Method 2 CEERShare of the energy component in the electricity bill From 0% to 100% (maximum score). Method 2 CEERLevel of dispersion of DA prices in 2020 calculated as the difference between P95 and P5. From the lowest to the highest dispersion
observed in the MSs in 2020.Method 2 ACER calculation based on ENTSO-E
dataInsufficient information provided by system operators
Data completeness for a selection of data items published in the ENTSO-E TP* From the minimum level of data completeness observed in a MS in 2020, to 1 (maximum score).
Method 2 ACER calculation based on ENTSO-E data
Level of completeness and quality of the data used to assess the 70% target* From the minimum level of data completeness/quality observed in the MSs in 2020 up to 1 (maximum score).
Method 2 ACER assessment based on data provided by TSOs in the scope of the MACZT monitoring report
Transparency of the capacity calculation methodologies** From the minimum level of data completeness observed in the MSs in 2020 up to 1 (maximum score).
Method 2 ACER qualitative assessment of CCMs developed by TSOs
Source: ACER based on the DNV study on a methodology to benchmark the performance of the EU Member States in terms of i) efficient price formation; and ii) easy market entry and partici-pation for new entrants and small actorsNotes: Methods applied to deal with missing information: Method 1: When some underlying raw data are missing or a question is not answered, it is considered that the missing information corresponds to the lowest possible performance.Method 2: When some underlying raw data are missing or a question is not answered, the missing information is considered as not available (NA).* A detailed description of this index can be found in the methodological study (see footnote 242). ** This indicator analyses some aspects related to the legal requirements, the level of detail and the level of transparency of the CCMs as described in the methodological paper “Capacity Cal-culation Methodologies – Overview” (see footnote 340). In particular, the scope of the indicator covers the following: the questions about CACM 21(1)(b)(i), CACM 27(3), CACM 20(9) in Annex 1 – assessment of CACM coverage, the questions about the level of detail in Annex 2 – assessment of the level of detail and harmonisation, and the questions about publication of data in Annex 4 – assessment of transparency and enforceability.
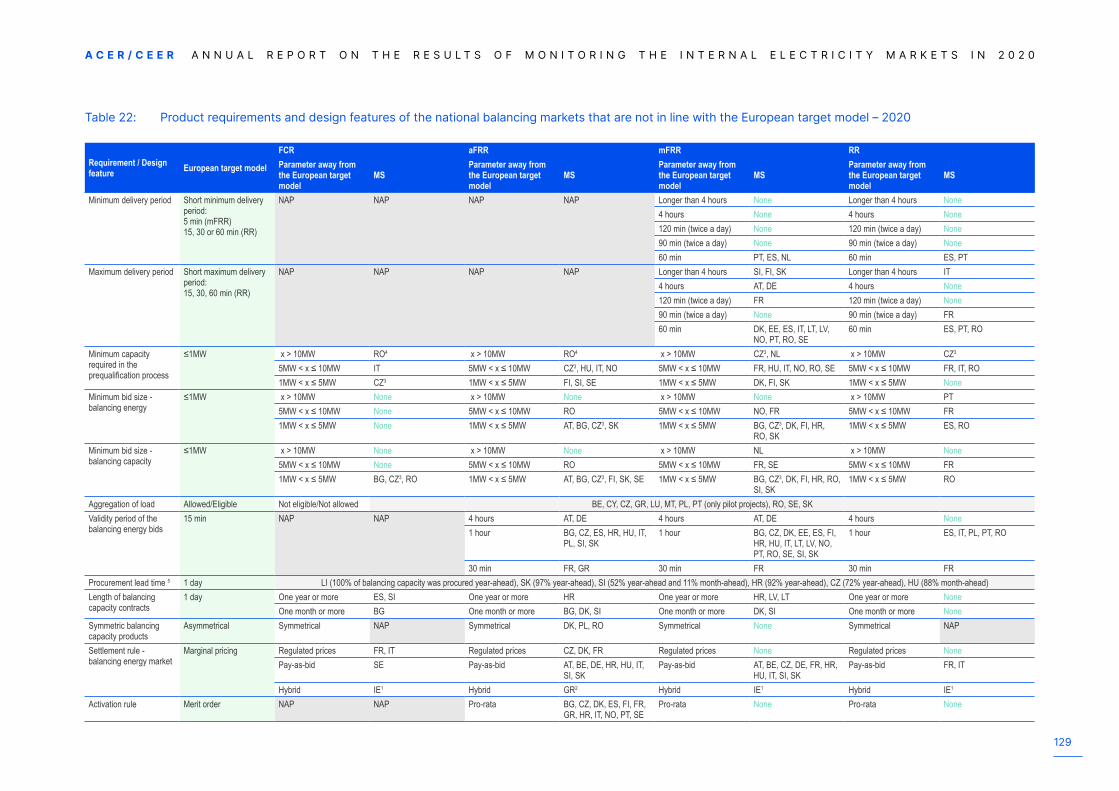
129
A C E R / C E E R A N N U A L R E P O R T O N T H E R E S U L T S O F M O N I T O R I N G T H E I N T E R N A L E L E C T R I C I T Y M A R K E T S I N 2 0 2 0
Table 22: Product requirements and design features of the national balancing markets that are not in line with the European target model – 2020
Requirement / Design feature European target model
FCR aFRR mFRR RRParameter away from the European target model
MSParameter away from the European target model
MSParameter away from the European target model
MSParameter away from the European target model
MS
Minimum delivery period Short minimum delivery period:5 min (mFRR)15, 30 or 60 min (RR)
NAP NAP NAP NAP Longer than 4 hours None Longer than 4 hours None4 hours None 4 hours None120 min (twice a day) None 120 min (twice a day) None90 min (twice a day) None 90 min (twice a day) None60 min PT, ES, NL 60 min ES, PT
Maximum delivery period Short maximum delivery period:15, 30, 60 min (RR)
NAP NAP NAP NAP Longer than 4 hours SI, FI, SK Longer than 4 hours IT4 hours AT, DE 4 hours None120 min (twice a day) FR 120 min (twice a day) None90 min (twice a day) None 90 min (twice a day) FR60 min DK, EE, ES, IT, LT, LV,
NO, PT, RO, SE60 min ES, PT, RO
Minimum capacity required in the prequalification process
≤1MW x > 10MW RO4 x > 10MW RO4 x > 10MW CZ3, NL x > 10MW CZ3
5MW < x ≤ 10MW IT 5MW < x ≤ 10MW CZ3, HU, IT, NO 5MW < x ≤ 10MW FR, HU, IT, NO, RO, SE 5MW < x ≤ 10MW FR, IT, RO1MW < x ≤ 5MW CZ3 1MW < x ≤ 5MW FI, SI, SE 1MW < x ≤ 5MW DK, FI, SK 1MW < x ≤ 5MW None
Minimum bid size - balancing energy
≤1MW x > 10MW None x > 10MW None x > 10MW None x > 10MW PT5MW < x ≤ 10MW None 5MW < x ≤ 10MW RO 5MW < x ≤ 10MW NO, FR 5MW < x ≤ 10MW FR1MW < x ≤ 5MW None 1MW < x ≤ 5MW AT, BG, CZ3, SK 1MW < x ≤ 5MW BG, CZ3, DK, FI, HR,
RO, SK1MW < x ≤ 5MW ES, RO
Minimum bid size - balancing capacity
≤1MW x > 10MW None x > 10MW None x > 10MW NL x > 10MW None5MW < x ≤ 10MW None 5MW < x ≤ 10MW RO 5MW < x ≤ 10MW FR, SE 5MW < x ≤ 10MW FR1MW < x ≤ 5MW BG, CZ3, RO 1MW < x ≤ 5MW AT, BG, CZ3, FI, SK, SE 1MW < x ≤ 5MW BG, CZ3, DK, FI, HR, RO,
SI, SK1MW < x ≤ 5MW RO
Aggregation of load Allowed/Eligible Not eligible/Not allowed BE, CY, CZ, GR, LU, MT, PL, PT (only pilot projects), RO, SE, SK Validity period of the balancing energy bids
15 min NAP NAP 4 hours AT, DE 4 hours AT, DE 4 hours None1 hour BG, CZ, ES, HR, HU, IT,
PL, SI, SK1 hour BG, CZ, DK, EE, ES, FI,
HR, HU, IT, LT, LV, NO, PT, RO, SE, SI, SK
1 hour ES, IT, PL, PT, RO
30 min FR, GR 30 min FR 30 min FRProcurement lead time 5 1 day LI (100% of balancing capacity was procured year-ahead), SK (97% year-ahead), SI (52% year-ahead and 11% month-ahead), HR (92% year-ahead), CZ (72% year-ahead), HU (88% month-ahead) Length of balancing capacity contracts
1 day One year or more ES, SI One year or more HR One year or more HR, LV, LT One year or more NoneOne month or more BG One month or more BG, DK, SI One month or more DK, SI One month or more None
Symmetric balancing capacity products
Asymmetrical Symmetrical NAP Symmetrical DK, PL, RO Symmetrical None Symmetrical NAP
Settlement rule - balancing energy market
Marginal pricing Regulated prices FR, IT Regulated prices CZ, DK, FR Regulated prices None Regulated prices NonePay-as-bid SE Pay-as-bid AT, BE, DE, HR, HU, IT,
SI, SKPay-as-bid AT, BE, CZ, DE, FR, HR,
HU, IT, SI, SKPay-as-bid FR, IT
Hybrid IE1 Hybrid GR2 Hybrid IE1 Hybrid IE1
Activation rule Merit order NAP NAP Pro-rata BG, CZ, DK, ES, FI, FR, GR, HR, IT, NO, PT, SE
Pro-rata None Pro-rata None

130
A C E R / C E E R A N N U A L R E P O R T O N T H E R E S U L T S O F M O N I T O R I N G T H E I N T E R N A L E L E C T R I C I T Y M A R K E T S I N 2 0 2 0
Requirement / Design feature European target model
FCR aFRR mFRR RRParameter away from the European target model
MSParameter away from the European target model
MSParameter away from the European target model
MSParameter away from the European target model
MS
Balancing energy price predetermined in balancing capacity contracts
Not predetermined Predetermined IE, SK Predetermined SK Predetermined IE, SK Predetermined IE
Non-contracted balancing energy bids
Allowed NAP NAP Not allowed AT, BG, CZ, DK, ES, FI, GR, HR, NO, PL, PT, RO, SE, SK
Not allowed AT, BG, CZ, EE, PT, RO, SK
Not allowed PT, RO
Source: ACER based on ENTSO-E AS Survey 2020 and NRAs data. Note: 1 The Ireland´s System Services are based on regulated prices and balancing energy services are remunerated based on marginal prices. 2 In Greece, aFRR (energy) is settled pay-as-bid unless the bid is lower than the marginal price of mFRR. In this case, it is settled with the marginal price of mFRR.3 In the Czech Republic, from 1 January 2021 the minimum capacity required in the prequalification process and the minimum bid size were was reduced for all types of reserves up to 1MW. 4 In Romania, the minimum nominal capacity required to prequalify for FCR was 10 MW for hydro generation units and 20 MW for thermal units in 2020. For aFRR where the activation is pro rata, the minimum regulating band was 10 MW, i.e. a symmetrical reserve +/- 5 MW (up and down). 5 In the procurement lead time, the table only shows those markets where more than 50% of reserves were contracted year- or month-ahead in 2020.

131
A C E R / C E E R A N N U A L R E P O R T O N T H E R E S U L T S O F M O N I T O R I N G T H E I N T E R N A L E L E C T R I C I T Y M A R K E T S I N 2 0 2 0
Overview of missing data in Table 22:
Requirement or design feature FCR aFRR mFRR RRMinimum delivery period NAP NAP BG No missing dataMaximum delivery period NAP NAP BG No missing dataMinimum capacity required in the prequalification process ES, BG BG BG No missing dataMinimum bid size - balancing energy market AT, BE, BG, CZ, DE, DK, ES, FI, GR, HR, HU, IT, LU, NL, NO, PT, RO, SE, SI, SK ES, FI, NO, PT, SE SE No missing dataMinimum bid size - balancing capacity market No missing data IT EE, ES, IT, PT CZ, ES, IT, PTAggregation of load BG Validity period of the balancing energy bids NAP DK, FI, NO, PT, SE IE IEProcurement lead time EE, IE, IT, LVLength of balancing capacity contracts HR, IT, PL, PT IT, PL CZ, EE, ES, IT, PT, SE CZ, ES, IT, PTSymmetric balancing capacity products NAP IT IT, PT, ES, ES NAPSettlement rule - balancing energy market AT, BE, CZ, DE, DK, ES, GR, HR, HU, LU, NL, NO, PT, RO, SI, SK No missing data No missing data No missing dataActivation rule NAP No missing data No missing data No missing dataBalancing energy price predetermined in balancing capacity contracts BG, CY, MT BG, CY, MT BG, CY, MT BG, CY, MT
Non-contracted balancing energy bids NAP No missing data No missing data No missing data
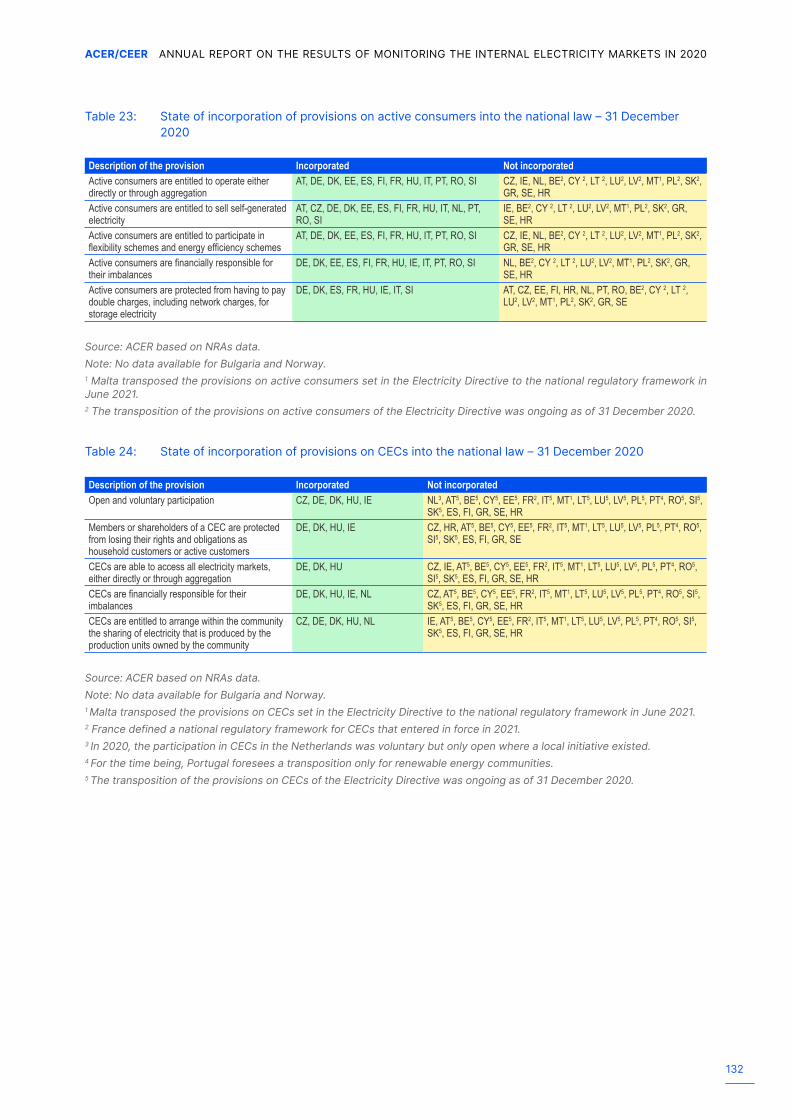
132
ACER/CEER ANNUAL REPORT ON THE RESULTS OF MONITORING THE INTERNAL ELECTRICITY MARKETS IN 2020
Table 23: State of incorporation of provisions on active consumers into the national law – 31 December 2020
Description of the provision Incorporated Not incorporatedActive consumers are entitled to operate either directly or through aggregation
AT, DE, DK, EE, ES, FI, FR, HU, IT, PT, RO, SI CZ, IE, NL, BE2, CY 2, LT 2, LU2, LV2, MT1, PL2, SK2, GR, SE, HR
Active consumers are entitled to sell self-generated electricity
AT, CZ, DE, DK, EE, ES, FI, FR, HU, IT, NL, PT, RO, SI
IE, BE2, CY 2, LT 2, LU2, LV2, MT1, PL2, SK2, GR, SE, HR
Active consumers are entitled to participate in flexibility schemes and energy efficiency schemes
AT, DE, DK, EE, ES, FI, FR, HU, IT, PT, RO, SI CZ, IE, NL, BE2, CY 2, LT 2, LU2, LV2, MT1, PL2, SK2, GR, SE, HR
Active consumers are financially responsible for their imbalances
DE, DK, EE, ES, FI, FR, HU, IE, IT, PT, RO, SI NL, BE2, CY 2, LT 2, LU2, LV2, MT1, PL2, SK2, GR, SE, HR
Active consumers are protected from having to pay double charges, including network charges, for storage electricity
DE, DK, ES, FR, HU, IE, IT, SI AT, CZ, EE, FI, HR, NL, PT, RO, BE2, CY 2, LT 2, LU2, LV2, MT1, PL2, SK2, GR, SE
Source: ACER based on NRAs data.Note: No data available for Bulgaria and Norway. 1 Malta transposed the provisions on active consumers set in the Electricity Directive to the national regulatory framework in June 2021.2 The transposition of the provisions on active consumers of the Electricity Directive was ongoing as of 31 December 2020.
Table 24: State of incorporation of provisions on CECs into the national law – 31 December 2020
Description of the provision Incorporated Not incorporatedOpen and voluntary participation CZ, DE, DK, HU, IE NL3, AT5, BE5, CY5, EE5, FR2, IT5, MT1, LT5, LU5, LV5, PL5, PT4, RO5, SI5,
SK5, ES, FI, GR, SE, HRMembers or shareholders of a CEC are protected from losing their rights and obligations as household customers or active customers
DE, DK, HU, IE CZ, HR, AT5, BE5, CY5, EE5, FR2, IT5, MT1, LT5, LU5, LV5, PL5, PT4, RO5, SI5, SK5, ES, FI, GR, SE
CECs are able to access all electricity markets, either directly or through aggregation
DE, DK, HU CZ, IE, AT5, BE5, CY5, EE5, FR2, IT5, MT1, LT5, LU5, LV5, PL5, PT4, RO5, SI5, SK5, ES, FI, GR, SE, HR
CECs are financially responsible for their imbalances
DE, DK, HU, IE, NL CZ, AT5, BE5, CY5, EE5, FR2, IT5, MT1, LT5, LU5, LV5, PL5, PT4, RO5, SI5, SK5, ES, FI, GR, SE, HR
CECs are entitled to arrange within the community the sharing of electricity that is produced by the production units owned by the community
CZ, DE, DK, HU, NL IE, AT5, BE5, CY5, EE5, FR2, IT5, MT1, LT5, LU5, LV5, PL5, PT4, RO5, SI5, SK5, ES, FI, GR, SE, HR
Source: ACER based on NRAs data.Note: No data available for Bulgaria and Norway. 1 Malta transposed the provisions on CECs set in the Electricity Directive to the national regulatory framework in June 2021. 2 France defined a national regulatory framework for CECs that entered in force in 2021. 3 In 2020, the participation in CECs in the Netherlands was voluntary but only open where a local initiative existed. 4 For the time being, Portugal foresees a transposition only for renewable energy communities.5 The transposition of the provisions on CECs of the Electricity Directive was ongoing as of 31 December 2020.

133
ACER/CEER ANNUAL REPORT ON THE RESULTS OF MONITORING THE INTERNAL ELECTRICITY MARKETS IN 2020
Table 25: State of incorporation of provisions on aggregators (including independent aggregators) into the national law – 31 December 2020
Description of the provision Incorporated Not incorporatedCustomers are free to contract with aggregators or independent aggregators without prior consent of their supplier
DK, EE, FI, FR, GR, HU, IT, LT, LV, RO
AT, CZ, IE, NL, PT, BE3, CY3, DE3, LU3, MT1, PL3, SK3, ES, SE, HR, SI
Market participants engaged in aggregation are financially responsible for their imbalances
AT, CZ, DK, EE, FR, GR, HU, IE, IT, LT, LV, NL, PT, RO, SI
FI, BE3, CY3, DE3, LU3, MT1, PL3, SK3, ES, SE, HR
A conflict resolution mechanism between market participants engaged in aggregation and other market participants
AT, GR, LT, LV, RO CZ, DK, EE, FI, FR, HR, HU2, IE, IT, NL, PT, SI, BE3, CY3, DE3, LU3, MT1, PL3, SK3, ES, SE
A method for calculating financial compensation to suppliers or BRPs during activation of DSR
FR, IT, RO, SI AT, CZ, DK, EE, FI, GR, HR, HU, IE, NL, LT, LV, PT, BE3, CY3, DE3, LU3, MT1, PL3, SK3, ES, SE
Source: ACER based on NRAs data.Note: No data available for Bulgaria and Norway.1 Malta transposed the provisions on aggregation set in the Electricity Directive to the national regulatory framework in June 2021.2 In Hungary, the general conflict resolution rules between market participants, already existing in the Hungarian legislation before the entry into force of CEP, can be applied between market participants engaged in aggregation and other market participants. However, the rules on complaint handling concerning energy communities and dispute resolution concerning ag-gregators and energy communities were amended since 1 January 2021.3 The transposition of the provisions on aggregators of the Electricity Directive was ongoing as of 31 December 2020.
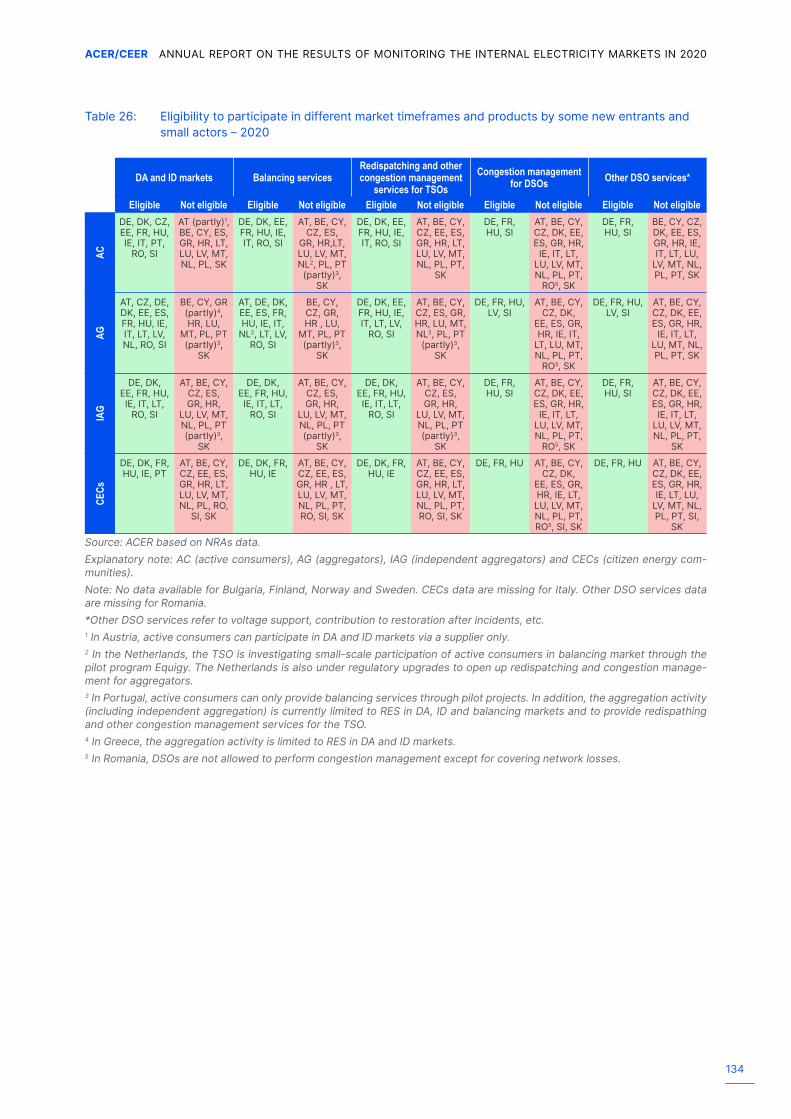
134
ACER/CEER ANNUAL REPORT ON THE RESULTS OF MONITORING THE INTERNAL ELECTRICITY MARKETS IN 2020
Table 26: Eligibility to participate in different market timeframes and products by some new entrants and small actors – 2020
DA and ID markets Balancing servicesRedispatching and other congestion management
services for TSOsCongestion management
for DSOs Other DSO services*
Eligible Not eligible Eligible Not eligible Eligible Not eligible Eligible Not eligible Eligible Not eligible
AC
DE, DK, CZ, EE, FR, HU, IE, IT, PT,
RO, SI
AT (partly)1, BE, CY, ES, GR, HR, LT, LU, LV, MT, NL, PL, SK
DE, DK, EE, FR, HU, IE, IT, RO, SI
AT, BE, CY, CZ, ES,
GR, HR,LT, LU, LV, MT, NL2, PL, PT
(partly)3, SK
DE, DK, EE, FR, HU, IE, IT, RO, SI
AT, BE, CY, CZ, EE, ES, GR, HR, LT, LU, LV, MT, NL, PL, PT,
SK
DE, FR, HU, SI
AT, BE, CY, CZ, DK, EE, ES, GR, HR,
IE, IT, LT, LU, LV, MT, NL, PL, PT,
RO5, SK
DE, FR, HU, SI
BE, CY, CZ, DK, EE, ES, GR, HR, IE, IT, LT, LU,
LV, MT, NL, PL, PT, SK
AG
AT, CZ, DE, DK, EE, ES, FR, HU, IE, IT, LT, LV, NL, RO, SI
BE, CY, GR (partly)4, HR, LU,
MT, PL, PT (partly)3,
SK
AT, DE, DK, EE, ES, FR, HU, IE, IT,
NL2, LT, LV, RO, SI
BE, CY, CZ, GR, HR , LU,
MT, PL, PT (partly)3,
SK
DE, DK, EE, FR, HU, IE, IT, LT, LV,
RO, SI
AT, BE, CY, CZ, ES, GR, HR, LU, MT, NL2, PL, PT
(partly)3, SK
DE, FR, HU, LV, SI
AT, BE, CY, CZ, DK,
EE, ES, GR, HR, IE, IT,
LT, LU, MT, NL, PL, PT,
RO5, SK
DE, FR, HU, LV, SI
AT, BE, CY, CZ, DK, EE, ES, GR, HR,
IE, IT, LT, LU, MT, NL, PL, PT, SK
IAG
DE, DK, EE, FR, HU, IE, IT, LT,
RO, SI
AT, BE, CY, CZ, ES, GR, HR,
LU, LV, MT, NL, PL, PT (partly)3,
SK
DE, DK, EE, FR, HU, IE, IT, LT,
RO, SI
AT, BE, CY, CZ, ES, GR, HR,
LU, LV, MT, NL, PL, PT (partly)3,
SK
DE, DK, EE, FR, HU, IE, IT, LT,
RO, SI
AT, BE, CY, CZ, ES, GR, HR,
LU, LV, MT, NL, PL, PT (partly)3,
SK
DE, FR, HU, SI
AT, BE, CY, CZ, DK, EE, ES, GR, HR,
IE, IT, LT, LU, LV, MT, NL, PL, PT,
RO5, SK
DE, FR, HU, SI
AT, BE, CY, CZ, DK, EE, ES, GR, HR,
IE, IT, LT, LU, LV, MT, NL, PL, PT,
SK
CECs
DE, DK, FR, HU, IE, PT
AT, BE, CY, CZ, EE, ES, GR, HR, LT, LU, LV, MT, NL, PL, RO,
SI, SK
DE, DK, FR, HU, IE
AT, BE, CY, CZ, EE, ES, GR, HR , LT, LU, LV, MT, NL, PL, PT, RO, SI, SK
DE, DK, FR, HU, IE
AT, BE, CY, CZ, EE, ES, GR, HR, LT, LU, LV, MT, NL, PL, PT, RO, SI, SK
DE, FR, HU AT, BE, CY, CZ, DK,
EE, ES, GR, HR, IE, LT, LU, LV, MT, NL, PL, PT, RO5, SI, SK
DE, FR, HU AT, BE, CY, CZ, DK, EE, ES, GR, HR, IE, LT, LU,
LV, MT, NL, PL, PT, SI,
SKSource: ACER based on NRAs data.Explanatory note: AC (active consumers), AG (aggregators), IAG (independent aggregators) and CECs (citizen energy com-munities). Note: No data available for Bulgaria, Finland, Norway and Sweden. CECs data are missing for Italy. Other DSO services data are missing for Romania. *Other DSO services refer to voltage support, contribution to restoration after incidents, etc.1 In Austria, active consumers can participate in DA and ID markets via a supplier only. 2 In the Netherlands, the TSO is investigating small-scale participation of active consumers in balancing market through the pilot program Equigy. The Netherlands is also under regulatory upgrades to open up redispatching and congestion manage-ment for aggregators. 3 In Portugal, active consumers can only provide balancing services through pilot projects. In addition, the aggregation activity (including independent aggregation) is currently limited to RES in DA, ID and balancing markets and to provide redispathing and other congestion management services for the TSO.4 In Greece, the aggregation activity is limited to RES in DA and ID markets.5 In Romania, DSOs are not allowed to perform congestion management except for covering network losses.
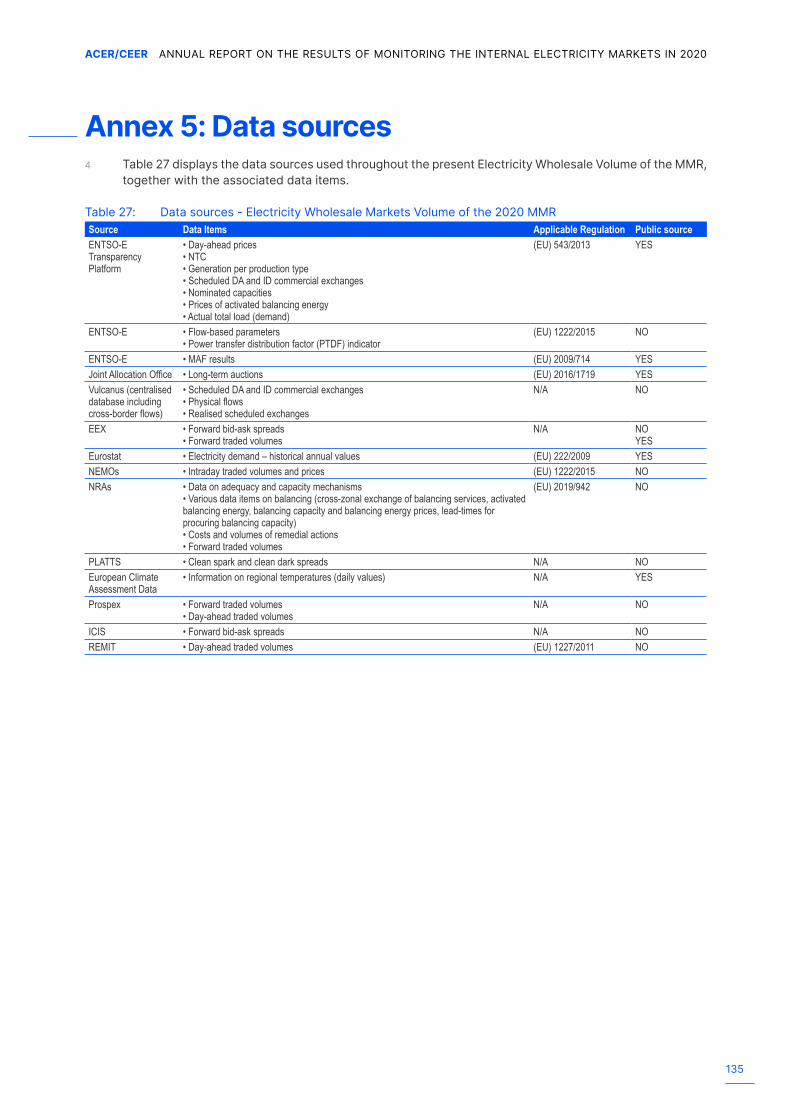
135
ACER/CEER ANNUAL REPORT ON THE RESULTS OF MONITORING THE INTERNAL ELECTRICITY MARKETS IN 2020
Annex 5: Data sources4 Table 27 displays the data sources used throughout the present Electricity Wholesale Volume of the MMR,
together with the associated data items.
Table 27: Data sources - Electricity Wholesale Markets Volume of the 2020 MMRSource Data Items Applicable Regulation Public sourceENTSO-E Transparency Platform
• Day-ahead prices • NTC • Generation per production type • Scheduled DA and ID commercial exchanges • Nominated capacities • Prices of activated balancing energy • Actual total load (demand)
(EU) 543/2013 YES
ENTSO-E • Flow-based parameters • Power transfer distribution factor (PTDF) indicator
(EU) 1222/2015 NO
ENTSO-E • MAF results (EU) 2009/714 YESJoint Allocation Office • Long-term auctions (EU) 2016/1719 YESVulcanus (centralised database including cross-border flows)
• Scheduled DA and ID commercial exchanges • Physical flows • Realised scheduled exchanges
N/A NO
EEX • Forward bid-ask spreads • Forward traded volumes
N/A NO YES
Eurostat • Electricity demand – historical annual values (EU) 222/2009 YESNEMOs • Intraday traded volumes and prices (EU) 1222/2015 NONRAs • Data on adequacy and capacity mechanisms
• Various data items on balancing (cross-zonal exchange of balancing services, activated balancing energy, balancing capacity and balancing energy prices, lead-times for procuring balancing capacity) • Costs and volumes of remedial actions • Forward traded volumes
(EU) 2019/942 NO
PLATTS • Clean spark and clean dark spreads N/A NOEuropean Climate Assessment Data
• Information on regional temperatures (daily values) N/A YES
Prospex • Forward traded volumes • Day-ahead traded volumes
N/A NO
ICIS • Forward bid-ask spreads N/A NOREMIT • Day-ahead traded volumes (EU) 1227/2011 NO

136
ACER/CEER ANNUAL REPORT ON THE RESULTS OF MONITORING THE INTERNAL ELECTRICITY MARKETS IN 2020
Annex 6: List of acronymsAbbreviation Definition4MMC 4M Market Coupling region covering the Czech Republic, Slovakia, Hungary and RomaniaACER Agency for the Cooperation of Energy RegulatorsAF Allocated flowaFRR Automatically-activated frequency restoration reserveALEGro Aachen Liège Electricity Grid Overlay
ARA Oil and coal trading area in the triangle formed by the cities Amsterdam-Rotterdam-Antwerp. Alternative designations are NWE (North West Europe) or Rotterdam
ARENH Regulated Access to Incumbent Nuclear ElectricityBRP Balancing Responsible PartyBSP Balancing service providerCACM Capacity Allocation and Congestion Management (electricity)CCM Capacity calculation methodologyCCR Capacity calculation regionCEC Citizen Energy CommunityCEE Central-East Europe (electricity region)CEER Council of European Energy RegulatorsCEP Clean Energy PackageCM Capacity mechanismCNE Critical network elementCNEC Critical network element with contingenciesCONE Cost of new entryCWE Central-West Europe (electricity region)D2CF Day 2 Congestion ForecastDA Day-aheadDC Direct currentDER Distributed Energy ResourcesDSO Distribution System OperatorDSR Demand side responseEB Electricity BalancingEC European CommissionECAD European Climate Assessment DataECRB Energy Community Regulatory BoardEEA European Emission AllowanceEENS Expected energy not servedEEX European Energy ExchangeENTSO-E European Network of Transmission System Operators for ElectricityEPEX SPOT European Power ExchangeERAA European resource adequacy assessment ETM Electricity Target ModelEU European UnionEUA EU Emission AllowancesEUE Expected unserved energyEV Electric VehiclesFB Flow-basedFBMC Flow-based Market CouplingFCA Forward Capacity AllocationFCR Frequency containment reserveFITS Flexible Intraday Trading SchemeFmax Maximum admissible active power flowFRR Frequency restoration reserveFTR Financial Transmission RightsGDP Gross domestic productGRIT Capacity calculation region, consisting of the border Greece-Italy and the bidding zone borders within ItalyHVDC High-Voltage Direct CurrentID IntradayIEM Internal Market for ElectricityIGCC International Grid Control Cooperation projectINC Imbalance netting cooperation IS Interruptibility Scheme
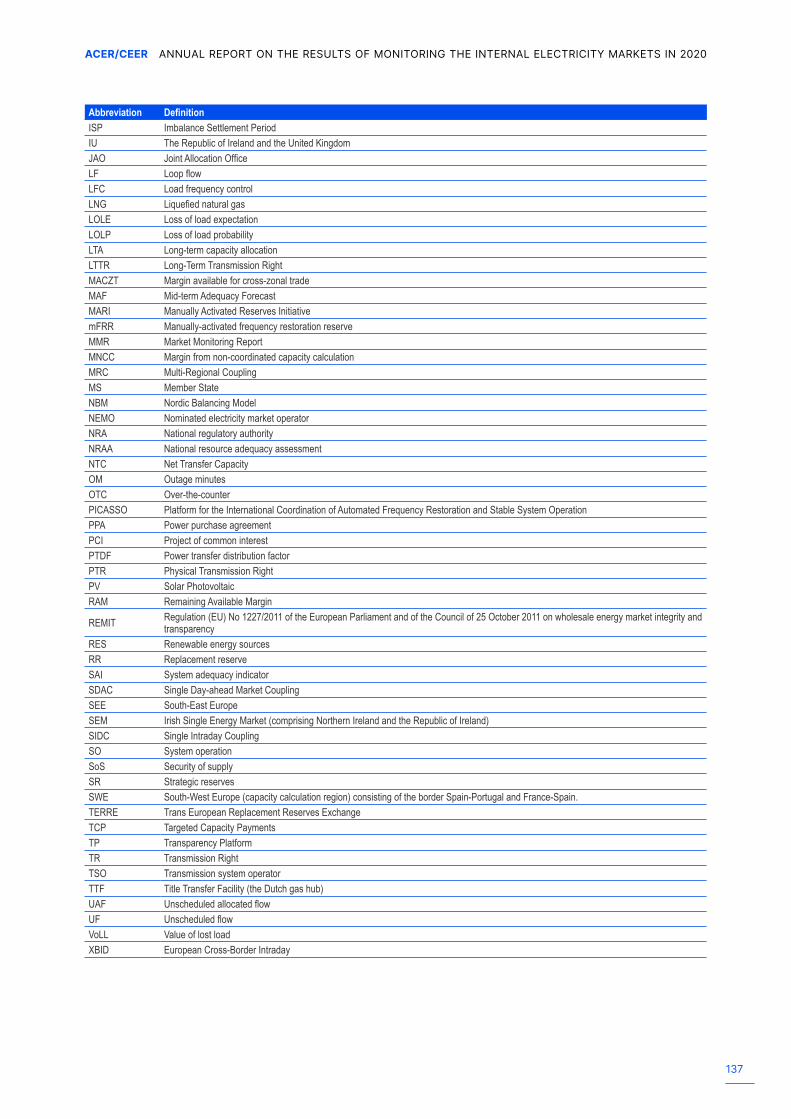
137
ACER/CEER ANNUAL REPORT ON THE RESULTS OF MONITORING THE INTERNAL ELECTRICITY MARKETS IN 2020
Abbreviation DefinitionISP Imbalance Settlement PeriodIU The Republic of Ireland and the United KingdomJAO Joint Allocation OfficeLF Loop flowLFC Load frequency controlLNG Liquefied natural gas LOLE Loss of load expectationLOLP Loss of load probabilityLTA Long-term capacity allocationLTTR Long-Term Transmission RightMACZT Margin available for cross-zonal tradeMAF Mid-term Adequacy ForecastMARI Manually Activated Reserves InitiativemFRR Manually-activated frequency restoration reserveMMR Market Monitoring ReportMNCC Margin from non-coordinated capacity calculationMRC Multi-Regional CouplingMS Member StateNBM Nordic Balancing Model NEMO Nominated electricity market operatorNRA National regulatory authorityNRAA National resource adequacy assessmentNTC Net Transfer CapacityOM Outage minutesOTC Over-the-counterPICASSO Platform for the International Coordination of Automated Frequency Restoration and Stable System OperationPPA Power purchase agreementPCI Project of common interestPTDF Power transfer distribution factorPTR Physical Transmission RightPV Solar PhotovoltaicRAM Remaining Available Margin
REMIT Regulation (EU) No 1227/2011 of the European Parliament and of the Council of 25 October 2011 on wholesale energy market integrity and transparency
RES Renewable energy sourcesRR Replacement reserveSAI System adequacy indicator SDAC Single Day-ahead Market CouplingSEE South-East Europe SEM Irish Single Energy Market (comprising Northern Ireland and the Republic of Ireland)SIDC Single Intraday CouplingSO System operationSoS Security of supplySR Strategic reservesSWE South-West Europe (capacity calculation region) consisting of the border Spain-Portugal and France-Spain.TERRE Trans European Replacement Reserves Exchange TCP Targeted Capacity PaymentsTP Transparency PlatformTR Transmission RightTSO Transmission system operatorTTF Title Transfer Facility (the Dutch gas hub)UAF Unscheduled allocated flowUF Unscheduled flowVoLL Value of lost load XBID European Cross-Border Intraday


![Acer [Course Title] [Teacher's Name](https://static.fdokumen.com/doc/165x107/6320a62900d668140c0d1f09/acer-course-title-teachers-name.jpg)