Annual Monitoring Report - Guildford Borough Council
36
1 Annual Monitoring Report Guildford Borough Council 1 April 2019 – 31 March 2020 Published February 2021
-
Upload
khangminh22 -
Category
Documents
-
view
0 -
download
0
Transcript of Annual Monitoring Report - Guildford Borough Council
1
Annual Monitoring Report
Guildford Borough Council
1 April 2019 – 31 March 2020
Published February 2021

2
Executive Summary
The Annual Monitoring Report (‘AMR’) has been prepared in accordance with the
requirements of national legislation (the Localism Act 2011, the Town and Country Planning
(Local Planning) England Regulations 2012 and the Planning and Compulsory Purchase Act
2004) and the direction of national Planning Practice Guidance (‘PPG’)1.
Monitoring is an essential part of the planning process, providing an opportunity to review
the performance of planning policies in the context of set objectives and indicators. Annual
Monitoring Reports are required to report on a range of specific topics and outline progress
against certain targets; including, among other things, providing information on the Council’s:
• progress in plan-making activities,
• activity in relation to the duty-to-cooperate,
• implementation of policies in the Local Plan, and
• implementation of neighbourhood plans.
This Annual Monitoring Report (2019 – 2020) covers the Monitoring Period between 1 April
2019 to 31 March 2020.
The Local Plan: Strategy and Sites (2015 - 2034) was adopted on 25th April 2019. Some
Development Management policies from the Local Plan (2003) were not superseded and
remain in effect. This AMR discusses the policies and performance indicators that formed
the adopted development plan during that time and data is available to assess.
The Local Plan: Strategy and Sites (2015 - 2034) was subject to Judicial Review, lodged by
three separate claimants. The claims were heard at the High Court, where the Judge Sir
Duncan Ouseley dismissed all three claims. Further, an appeal against this decision was
lodged and again dismissed.
The Council has undertaken data migration to a new monitoring database during this
monitoring period. The new database will support the collection and analysis of data required
to assess performance against the Monitoring Indicators introduced in the Local Plan:
Strategy and Sites (2015 – 2034). The initial set-up and transfer of data to this new system is
complete and the collection of new forms of data to support monitoring the new Indicators is
progressing. The next AMR should therefore include the full range of monitoring indicators
for the Local Plan: Strategy and Sites (2015 – 2034).
Further information
For further information please use the information below:
• Visit the Local Plan Webpage at: https://www.guildford.gov.uk/localplan
• Email us at: [email protected], or
• Phone us on: 01483 444 471
3
Contents
Executive Summary ............................................................................................................................. 2
Contents ................................................................................................................................................ 3
1. Introduction .................................................................................................................................... 4
What is an Annual Monitoring Report? ................................................................................... 4
What is included in an Annual Monitoring Report? ............................................................... 4
How will the Annual Monitoring Report be used? ................................................................. 5
2. Policy Context ............................................................................................................................... 6
The Development Plan .............................................................................................................. 6
Local Development Scheme .................................................................................................... 6
Status and progress of the New Local Plan ........................................................................... 7
Neighbourhood Development Plans and Orders .................................................................. 8
Supplementary Planning Documents ..................................................................................... 8
3. Monitoring Indicators .................................................................................................................... 9
Housing ........................................................................................................................................ 9
Overall Housing Numbers ...................................................................................................... 9
Key Characteristics of Housing Completions .................................................................... 15
Housing for Different Groups in the Community ............................................................... 18
Self-build and Custom House Build .................................................................................... 19
Employment and Retail ........................................................................................................... 22
Employment Floorspace ....................................................................................................... 22
Retail floorspace .................................................................................................................... 24
4. Planning Contributions ............................................................................................................... 28
5. Duty to Cooperate ...................................................................................................................... 30
6. Evidence Base ............................................................................................................................ 30
Appendix 1 - Duty to cooperate matrix of prescribed bodies and strategic issues .......... 31
Appendix 2 – TBH SPA Position Statement 2020 ................................................................. 33
Introduction ............................................................................................................................. 33
Implementation and Monitoring ........................................................................................... 33
Financial Situation ................................................................................................................. 33
Current SANG capacity ........................................................................................................ 34
Emerging SANGs and additional capacity......................................................................... 35
Strategic Access Management and Monitoring (SAMM) ................................................ 36
1 Available online at: https://www.gov.uk/government/collections/planning-practice-guidance.
4
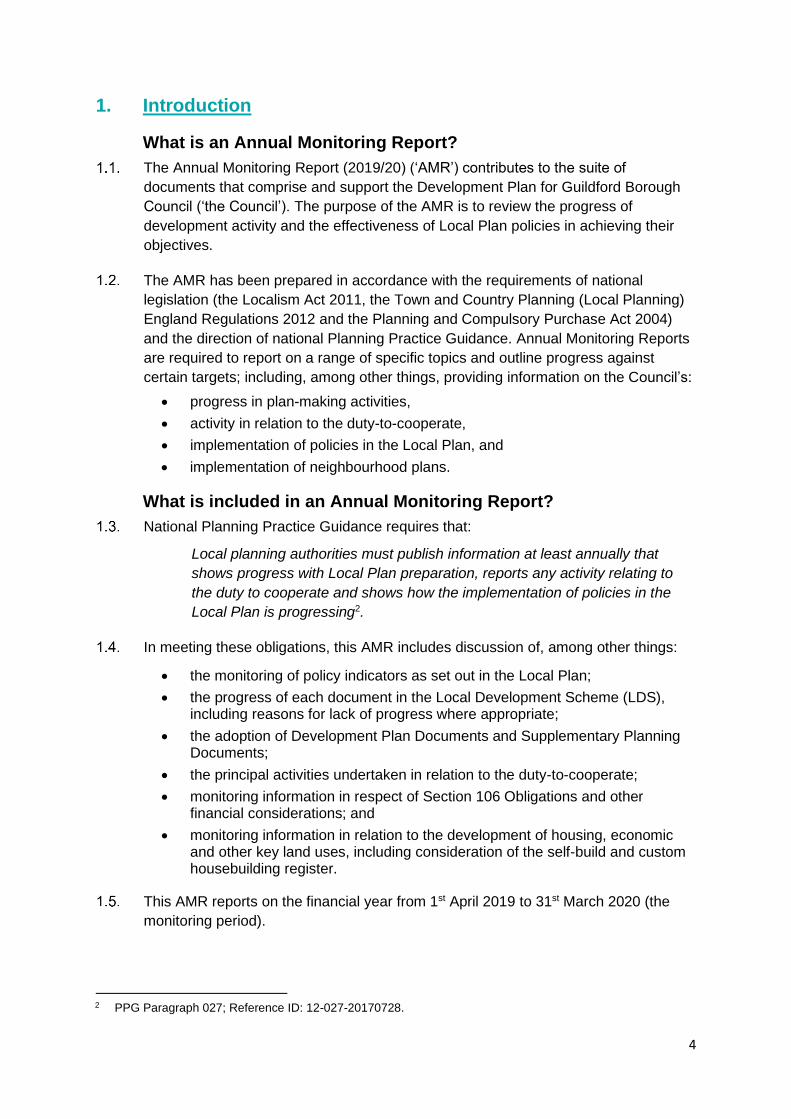
1. Introduction
What is an Annual Monitoring Report?
The Annual Monitoring Report (2019/20) (‘AMR’) contributes to the suite of
documents that comprise and support the Development Plan for Guildford Borough
Council (‘the Council’). The purpose of the AMR is to review the progress of
development activity and the effectiveness of Local Plan policies in achieving their
objectives.
The AMR has been prepared in accordance with the requirements of national
legislation (the Localism Act 2011, the Town and Country Planning (Local Planning)
England Regulations 2012 and the Planning and Compulsory Purchase Act 2004)
and the direction of national Planning Practice Guidance. Annual Monitoring Reports
are required to report on a range of specific topics and outline progress against
certain targets; including, among other things, providing information on the Council’s:
• progress in plan-making activities,
• activity in relation to the duty-to-cooperate,
• implementation of policies in the Local Plan, and
• implementation of neighbourhood plans.
What is included in an Annual Monitoring Report?
National Planning Practice Guidance requires that:
Local planning authorities must publish information at least annually that
shows progress with Local Plan preparation, reports any activity relating to
the duty to cooperate and shows how the implementation of policies in the
Local Plan is progressing2.
In meeting these obligations, this AMR includes discussion of, among other things:
• the monitoring of policy indicators as set out in the Local Plan;
• the progress of each document in the Local Development Scheme (LDS), including reasons for lack of progress where appropriate;
• the adoption of Development Plan Documents and Supplementary Planning Documents;
• the principal activities undertaken in relation to the duty-to-cooperate;
• monitoring information in respect of Section 106 Obligations and other financial considerations; and
• monitoring information in relation to the development of housing, economic and other key land uses, including consideration of the self-build and custom housebuilding register.
This AMR reports on the financial year from 1st April 2019 to 31st March 2020 (the
monitoring period).
2 PPG Paragraph 027; Reference ID: 12-027-20170728.

5
The Council adopted the Local Plan: Strategy and Sites (2015 – 2034) (‘LPSS’) on
25 April 2019. This is during the Monitoring Period covered in this AMR. The LPSS
identifies various policy targets and key performance indicators to measure the
effectiveness of the newly-adopted policies. However, this AMR is not able to report
on some of these performance indicators. Although the new monitoring database has
been set-up, there is an initial delay in reporting due to the lack of available data on
some of these indicators. Our work toward capability to report on all Monitoring
Indicators is currently ongoing, with the aim to be able to report on further monitoring
indicators in subsequent Monitoring Periods.
How will the Annual Monitoring Report be used?
Alongside other evidence-base documents, the AMR comprises one of the suite of
documents that supports the Council’s development plan.
National Planning Practice Guidance (‘PPG’) provides a short commentary on the
role of the Monitoring Report3. Importantly, the AMR should be designed to enable
communities and interested parties to remain aware of the Council’s progress in
development planning and delivery; including its plan-making activities and
implementation of neighbourhood plans that have been brought into force. The AMR
may also be used to help the Council determine whether there is a need to undertake
a partial or full review of the Local Plan.
3 PPG Paragraph 027; Reference ID: 12-027-20170728.

6
2. Policy Context
The Development Plan
The Council’s development plan comprises a number of documents, including:
• The Local Plan: Strategy and Sites (2015 – 2034),
• The non-superseded saved policies of the Guildford Borough Local Plan (2003),
• Neighbourhood Plans that have passed a referendum of local residents,
• Surrey Minerals and Waste Plans, and
• Saved policy NRM6 of the South East Plan 2009.
National legislation (the Town and Country Planning Act 1990 and the Planning and
Compulsory Purchase Act 2004) requires that “applications for planning permission
be determined in accordance with the development plan, unless material
considerations indicate otherwise”4.
In the determination of planning applications, national legislation requires that the
Council must give great weight to its development plan policies, according to their
degree of consistency with the NPPF (the closer the policies in the plan to the
policies in the Framework, the greater the weight that may be given)5. Importantly,
Councils may also give emerging policies some degree of weight in accordance with
criteria outlined in the NPPF at paragraph 48. The Council must also give significant
weight to other primary material considerations, such as the NPPF itself and the
Council’s own Supplementary Planning Documents, among other things.
Local Planning Authorities are required to identify in their Annual Monitoring Reports
where the authority is not implementing a policy specified in a local plan and provide
justification for this6. During the monitoring period being reported, the Council applied
all of the saved policies in the Local Plan (2003) where relevant, in so far as they
accorded with the NPPF. Policies which did not accord with the NPPF were also
considered in the decision-making process and provided weight accordingly.
Local Development Scheme
The Local Development Scheme (‘LDS’) sets out the Council’s timetable for
producing new planning documents. The Council’s adopted LDS (May 2020) is
available to view at the following link: https://www.guildford.gov.uk/lds. The 2020 LDS
was adopted on 26th May 2020, which is beyond this monitoring period.
Where the Council’s Local Development Scheme does not reflect the likely trajectory
of the production of planning documents, it is required to set out the reasons for the
delay. The Regulation 18 consultation for the Local Plan: Development Management
Policies was undertaken in accordance with the Local Development Scheme. This
consultation was slightly delayed due to the outbreak of COVID-19 and the need to
update its Statement of Community Involvement.
4 NPPF Paragraph 2.
5 NPPF Paragraph 213.
6 See Regulation 34 of the Town and Country Planning Regulations (2012).

7
Following this, the ‘LDS’ was not updated for the stages after Regulation 18
consultation to reflect this delay. The Regulation 19 consultation, which the Local
Development Scheme states would be consulted upon in March 2021 is no longer
realistic and will occur in 2021/22 instead. Principally, this is due to consequential
delays within the Regulation 18 consultation process and further time required for
drafting and finalising the Regulation 19 policies than had been anticipated. The
Local Development Scheme will be updated to reflect this delay when there is greater
certainty regarding the timescales.
Whilst progressing the Local Plan: Development Management Policies, significant
progress also has been made on finalising and adopting the Town Centre Views SPD
(adopted 24 September 2019), Strategic Development Framework SPD (adopted 21
July 2020) and Climate Change, Sustainable Design, Construction and Energy SPD
(adopted 22 September 2020).
Status and progress of the New Local Plan
Guildford Borough Council has been developing a new Local Plan since 2012. The
new Local Plan is intended to comprise two parts. Part 1 is the ‘Strategy and Sites’
document, which contains the vision, objectives and strategy for the borough up to
2034. Part 2 is the ‘Development Management Policies’ document, which provides
greater detail in how proposals should be determined and developed.
The Local Plan: Strategy and Sites (2015 – 2034) was adopted on 25th April 2019
and constitutes Part 1 of the Local Plan. The policies in this plan are applied full
weight in the determination of planning applications. The ‘Development Management
Policies’ part of the Local Plan is currently being produced by the Council but does
not yet carry any material weight in the determination of planning applications.
The ‘Development Management Policies’ plan was subject to a seven week
‘Regulation 18’ consultation from 3 June to 22 July 20207. The consultation
responses are currently being reviewed and the draft policies are being prepared for
a minimum six week ‘Regulation 19’ consultation in 2021/22.
The Local Plan: Strategy and Sites (2015 – 2034) (‘LPSS’) was adopted in April
2019. The Council’s adopted Development Plan policies during the monitoring period
relate to the LPSS, the non-superseded saved policies of the Local Plan (2003) and
the other sources outlined in paragraph 2.1 (above). However, the LPSS introduced
a suite of new Monitoring Indicators that the Council was unable to collect data for at
the time. Although the new monitoring database is now established, the data is not
yet available to report on many of these Indicators. As such, this AMR discusses
those policies and performance indicators that data is available for. The intention is to
progress toward reporting on all the adopted policies in the Local Plan: Strategy and
Sites (2015 – 2034) in subsequent reports as the data becomes available.
7 See Regulation 18 of the Town and Country Planning Regulations (2012). Available online at:
www.legislation.gov.uk/uksi/2012/767/regulation/18/made.

8
Neighbourhood Development Plans and Orders
Neighbourhood planning was introduced through the Localism Act (2011). New
powers were introduced that allowed qualifying bodies8 to produce neighbourhood
plans and neighbourhood development orders. Neighbourhood plans allow
communities to set planning policies for their area.
Once adopted, neighbourhood plans become part of the Council’s Development
Plan. They must be considered when planning decisions are made, along with the
Local Plan and national planning policy.
During the monitoring period, the Council has not designated any additional
Neighbourhood Areas. Therefore, nine Neighbourhood Areas remain designated,
covering the parishes of Albury, East Horsley, West Horsley, Puttenham, Send and
Seale and Sands, and the wards of Burpham and Lovelace (Lovelace encompasses
the parishes of Ockham, Ripley and Wisley)9.
During the monitoring period, the Council has not adopted any further
Neighbourhood Plans. Due to the Coronavirus Act 2020, local polls (including
referendums) will not be held until 6th May 2021. This has halted the process for the
plans that have been through examination and are currently awaiting referendum.
These include the Parishes of Lovelace, Send and Puttenham. The Council are
currently looking for a suitable date to hold these referendums.
Three other Parish Councils are currently working to produce Neighbourhood Plans for
their respective Neighbourhood Areas. The parishes of Albury and Seale and Sands
are at the plan-making stage, whereas West Clandon have submitted a Plan to the
Council which is awaiting Regulation 15 Consultation. The Council is supporting this
process by providing advice and guidance. The Council is also talking to other
prospective qualifying bodies to help them decide whether they would like to apply for a
neighbourhood area designation in order to undertake neighbourhood planning.
Supplementary Planning Documents
The Council adopted one Supplementary Planning Document (‘SPD’) during the
monitoring period; the Guildford Town Centre Views SPD (2019), which was formally
adopted on 24th September 2019 via Executive Council decision. The document is
available to view online at: https://www.guildford.gov.uk/localplan/spd.
The Strategic Development Framework SPD was adopted in July 2020, as well as
the Climate Change, Sustainable Design, Construction and Energy SPD in
September 2020. Both of these were adopted beyond the end of the monitoring
period. Other SPDs are set to be produced in line with commitments in the adopted
Local Plan: Strategy and Sites however there are no timescales currently agreed.
8 Parish or Town Councils and designated Neighbourhood Forums. More information is available online at:
https://www.guildford.gov.uk/neighbourhoodplanninginformation.
9 The Neighbourhood Areas can be seen on the interactive map at:
https://www.guildford.gov.uk/neighbourhoodplanninginformation.

9
3. Monitoring Indicators
Housing
The following section considers those monitoring indicators relating to the
development of homes in the borough.
Overall Housing Numbers
Annual Housing Requirement
The Local Plan: Strategy and Sites (2015 - 2034) identified a total housing delivery
target of 10,678 units over the plan period. This equates to an annual housing target
of 562 units throughout the plan period.
The Town and Country Planning Regulations (2012) require that Annual Monitoring
Reports outline progress against targets for the monitoring period (2019 – 2020), and
since that target was first published. The ‘LPSS’ confirms that the Council’s Objectively
Assessed Need (‘OAN’) is 562 dwellings over the plan period (2015-2034).
Table 1: Previous Housing Completions10
Monitoring Period 2015/16 2016/17 2017/18 2018/19 2019/20 Total
Completions 387 294 299 351 352 1,683
Delivery against target (562) -175 -268 -263 -211 -210 -1,120
Table 1 above demonstrates that there has been an historic undersupply of housing in
Guildford. The annual target of 562 has not been met in a single year of the plan period
(2015 – 2034), providing an undersupply of 1,120 homes to date. The Inspector
examining the LPSS accepted that this backlog should be met over the plan period
(called the Liverpool approach) rather than in the first five years (called the Sedgefield
approach). However, annual completions in the borough are demonstrating a general
upward trend and are projected to grow significantly since the adoption of the Local
Plan: Strategy and Sites in 201911.
Planning Permissions Granted for New Homes
The number of homes that have been granted planning permission this year is lower
than the previous monitoring period. However, the previous monitoring period
benefitted from the granting of a small number of planning applications for a large
number of dwellings. The largest application that was approved during this monitoring
period was 19/P/01541: Land rear of Chicane and Quintons, Ockham Road North. This
is significantly lower than the largest planning permission approval in the previous
monitoring period (17/P/02592), which was for 481 homes. This year, the approvals
comprise mostly smaller planning permissions.
10 Housing completions data for monitoring periods preceding 2015/2016 is available in previous monitoring
reports, available at: https://www.guildford.gov.uk/localplan/monitoring.
11 As demonstrated in Appendix 8 of the Guildford borough Land Availability Assessment (2020), available at:
https://www.guildford.gov.uk/localplan/housing.
10
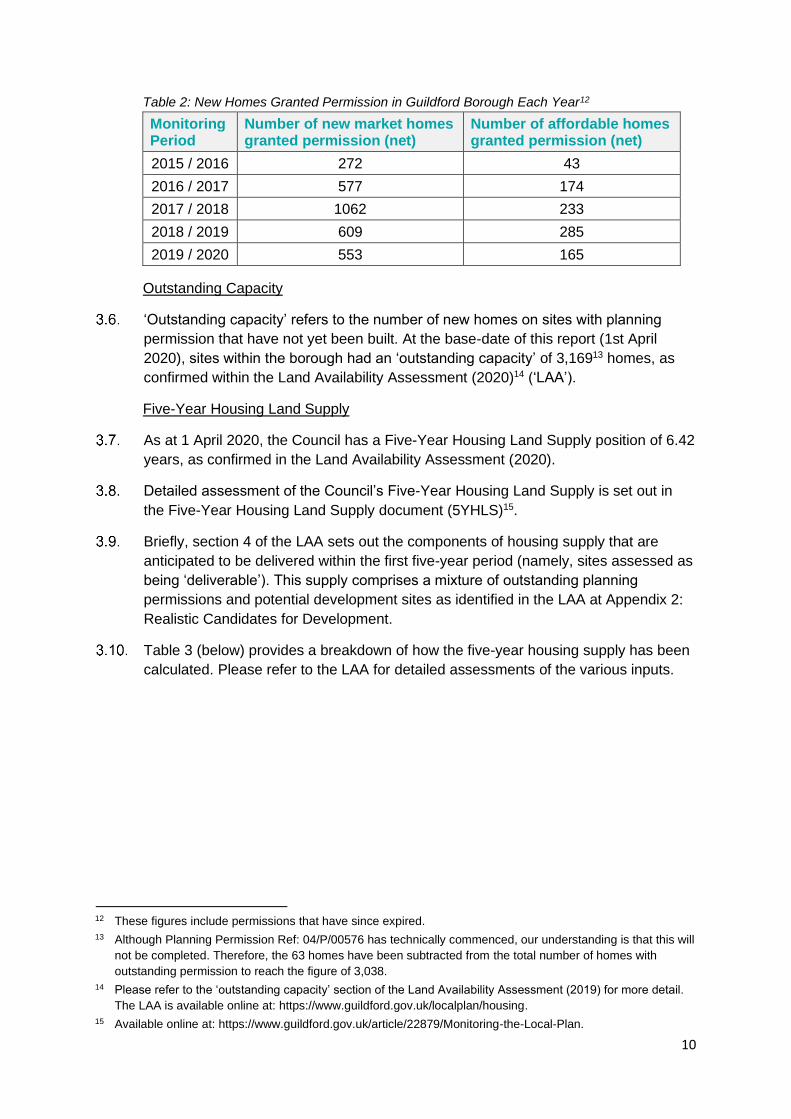
Table 2: New Homes Granted Permission in Guildford Borough Each Year12
Monitoring Period
Number of new market homes granted permission (net)
Number of affordable homes granted permission (net)
2015 / 2016 272 43
2016 / 2017 577 174
2017 / 2018 1062 233
2018 / 2019 609 285
2019 / 2020 553 165
Outstanding Capacity
‘Outstanding capacity’ refers to the number of new homes on sites with planning
permission that have not yet been built. At the base-date of this report (1st April
2020), sites within the borough had an ‘outstanding capacity’ of 3,16913 homes, as
confirmed within the Land Availability Assessment (2020)14 (‘LAA’).
Five-Year Housing Land Supply
As at 1 April 2020, the Council has a Five-Year Housing Land Supply position of 6.42
years, as confirmed in the Land Availability Assessment (2020).
Detailed assessment of the Council’s Five-Year Housing Land Supply is set out in
the Five-Year Housing Land Supply document (5YHLS)15.
Briefly, section 4 of the LAA sets out the components of housing supply that are
anticipated to be delivered within the first five-year period (namely, sites assessed as
being ‘deliverable’). This supply comprises a mixture of outstanding planning
permissions and potential development sites as identified in the LAA at Appendix 2:
Realistic Candidates for Development.
Table 3 (below) provides a breakdown of how the five-year housing supply has been
calculated. Please refer to the LAA for detailed assessments of the various inputs.
12 These figures include permissions that have since expired.
13 Although Planning Permission Ref: 04/P/00576 has technically commenced, our understanding is that this will
not be completed. Therefore, the 63 homes have been subtracted from the total number of homes with
outstanding permission to reach the figure of 3,038.
14 Please refer to the ‘outstanding capacity’ section of the Land Availability Assessment (2019) for more detail.
The LAA is available online at: https://www.guildford.gov.uk/localplan/housing.
15 Available online at: https://www.guildford.gov.uk/article/22879/Monitoring-the-Local-Plan.

11
Table 3: Five-Year Housing Land Supply Calculation
A Housing requirement (2015 - 2034) 10,678
B Annual requirement A / 19 = 562
C Completions required (1 April 2015 - 31 March 2020) B * 4 = 2,810
D Completions delivered (1 April 2015 - 31 March 2019) 1,683
E Accrued deficit (1 April 2015 - 31 March 2020) C - D = 1,127
F Deficit annualised over the remaining plan period (Liverpool approach)
E / 15 = 81
G Annual housing requirement taking account of deficit B + F = 643
H Housing requirement (1 April 2020 - 31 March 2025) G * 5 = 3,213
I Plus 20% buffer due to significant under delivery H * 1.2 = 3,855
J Housing supply (1 April 2020- 31 March 2025) 4,950
K Five-year housing land supply (J / I) *5 = 6.42
Housing Delivery Test (‘HDT’)
The HDT compares the net homes delivered over three years to the homes that
should have built over the same period (the housing requirement). Guildford’s HDT
results for the 2019 measurement (covering 2016/17, 2017/18 and 2018/19) were
published on 13 February 2020. The HDT measurement for Guildford is 83% of its
housing requirement over the previous three years.
The NPPF indicates that in cases where housing delivery has fallen below 95% of
the Local Planning Authority’s housing requirement during the three-year period in
question, it should prepare an action plan to assess the causes of under-delivery and
identify actions to increase delivery in future years16.
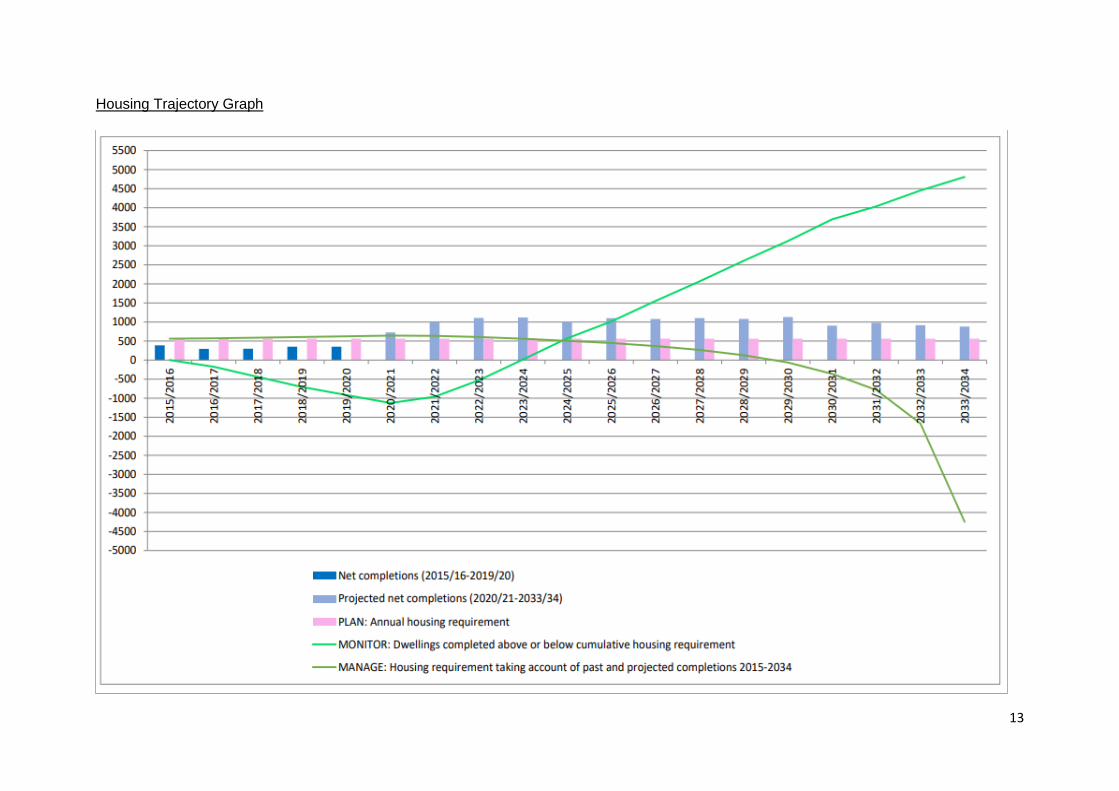
Housing Trajectory
Appendix 8 of the Land Availability Assessment (2020) includes the anticipated
Housing Trajectory over the remaining Local Plan period (2020– 2034). The Housing
Trajectory represents the anticipated phasing of sites with planning permission and
potential development sites identified in the LAA. The trajectory is included below, on
page 12 of this document.
The accompanying graph, on page 13 of this document, demonstrates the
relationship that the anticipated housing delivery has with the borough’s annual
housing target. The green ‘Monitor’ line identifies the extent to which the anticipated
housing delivery is above or below the cumulative housing requirement for the same
period. This provides the cumulative deficit or surplus as at the beginning of each
year, which would need to be taken account of in rolling forward the five-year land
supply calculations. If the trend line is positive (above zero), housing delivery is
ahead of target, if it is negative (below zero), then housing delivery is behind target.
16 The Council’s Housing Delivery Action Plan can be viewed online at:
https://www.guildford.gov.uk/localplan/monitoring.

12
Housing Trajectory
13
Housing Trajectory Graph
-5500
-5000
-4500
-4000
-3500
-3000
-2500
-2000
-1500
-1000
-500
0
500
1000
1500
2000
2500
3000
3500
4000
4500
5000
5500
6000
20
15
/20
16
20
16
/20
17
20
17
/20
18
20
18
/20
19
20
19
/20
20
20
20
/20
21
20
21
/20
22
20
22
/20
23
20
23
/20
24
20
24
/20
25
20
25
/20
26
20
26
/20
27
20
27
/20
28
20
28
/20
29
20
29
/20
30
20
30
/20
31
20
31
/20
32
20
32
/20
33
20
33
/20
34
Net completions (2015-2019)
Projected net completions (2019-2034)
PLAN: Annual housing requirement
MONITOR: Dwellings completed above or below cumulative housing requirement
MANAGE: Housing requirement taking account of past and projected completions 2015-2034
14
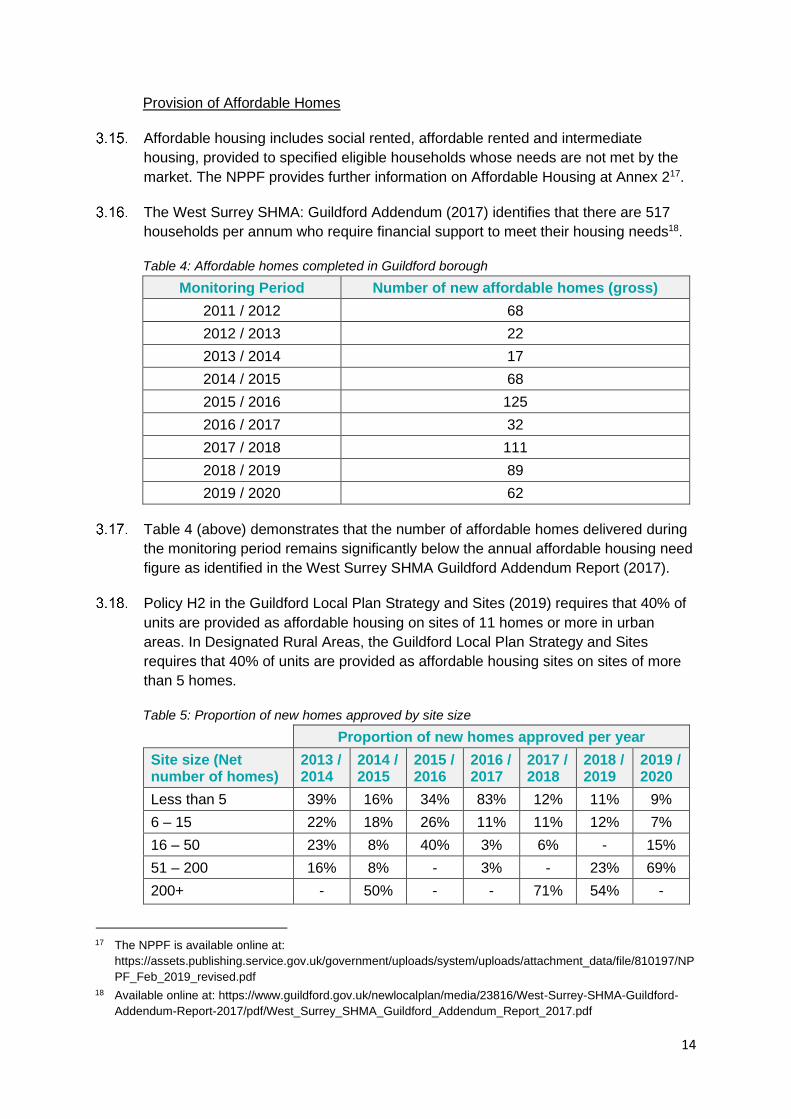
Provision of Affordable Homes
Affordable housing includes social rented, affordable rented and intermediate
housing, provided to specified eligible households whose needs are not met by the
market. The NPPF provides further information on Affordable Housing at Annex 217.
The West Surrey SHMA: Guildford Addendum (2017) identifies that there are 517
households per annum who require financial support to meet their housing needs18.
Table 4: Affordable homes completed in Guildford borough
Monitoring Period Number of new affordable homes (gross)
2011 / 2012 68
2012 / 2013 22
2013 / 2014 17
2014 / 2015 68
2015 / 2016 125
2016 / 2017 32
2017 / 2018 111
2018 / 2019 89
2019 / 2020 62
Table 4 (above) demonstrates that the number of affordable homes delivered during
the monitoring period remains significantly below the annual affordable housing need
figure as identified in the West Surrey SHMA Guildford Addendum Report (2017).
Policy H2 in the Guildford Local Plan Strategy and Sites (2019) requires that 40% of
units are provided as affordable housing on sites of 11 homes or more in urban
areas. In Designated Rural Areas, the Guildford Local Plan Strategy and Sites
requires that 40% of units are provided as affordable housing sites on sites of more
than 5 homes.
Table 5: Proportion of new homes approved by site size
Proportion of new homes approved per year
Site size (Net number of homes)
2013 / 2014
2014 / 2015
2015 / 2016
2016 / 2017
2017 / 2018
2018 / 2019
2019 / 2020
Less than 5 39% 16% 34% 83% 12% 11% 9%
6 – 15 22% 18% 26% 11% 11% 12% 7%
16 – 50 23% 8% 40% 3% 6% - 15%
51 – 200 16% 8% - 3% - 23% 69%
200+ - 50% - - 71% 54% -
17 The NPPF is available online at:
https://assets.publishing.service.gov.uk/government/uploads/system/uploads/attachment_data/file/810197/NP
PF_Feb_2019_revised.pdf
18 Available online at: https://www.guildford.gov.uk/newlocalplan/media/23816/West-Surrey-SHMA-Guildford-
Addendum-Report-2017/pdf/West_Surrey_SHMA_Guildford_Addendum_Report_2017.pdf
15
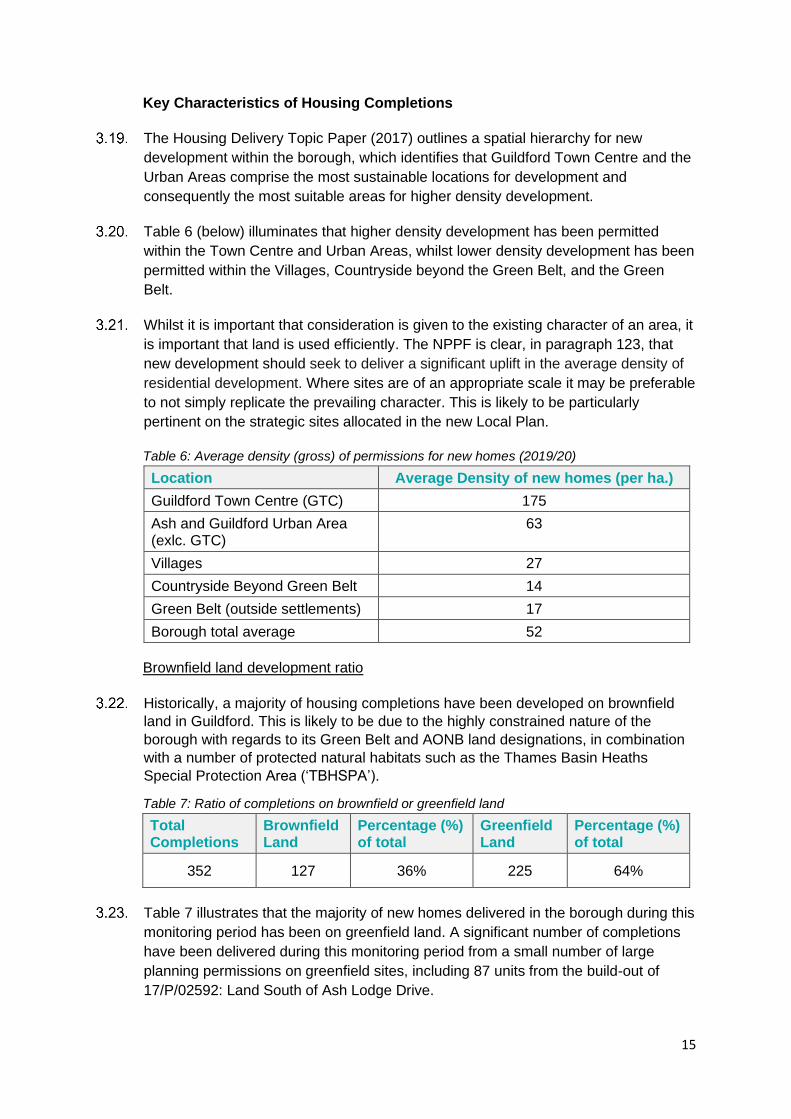
Key Characteristics of Housing Completions
The Housing Delivery Topic Paper (2017) outlines a spatial hierarchy for new
development within the borough, which identifies that Guildford Town Centre and the
Urban Areas comprise the most sustainable locations for development and
consequently the most suitable areas for higher density development.
Table 6 (below) illuminates that higher density development has been permitted
within the Town Centre and Urban Areas, whilst lower density development has been
permitted within the Villages, Countryside beyond the Green Belt, and the Green
Belt.
Whilst it is important that consideration is given to the existing character of an area, it
is important that land is used efficiently. The NPPF is clear, in paragraph 123, that
new development should seek to deliver a significant uplift in the average density of
residential development. Where sites are of an appropriate scale it may be preferable
to not simply replicate the prevailing character. This is likely to be particularly
pertinent on the strategic sites allocated in the new Local Plan.
Table 6: Average density (gross) of permissions for new homes (2019/20)
Location Average Density of new homes (per ha.)
Guildford Town Centre (GTC) 175
Ash and Guildford Urban Area (exlc. GTC)
63
Villages 27
Countryside Beyond Green Belt 14
Green Belt (outside settlements) 17
Borough total average 52
Brownfield land development ratio
Historically, a majority of housing completions have been developed on brownfield
land in Guildford. This is likely to be due to the highly constrained nature of the
borough with regards to its Green Belt and AONB land designations, in combination
with a number of protected natural habitats such as the Thames Basin Heaths
Special Protection Area (‘TBHSPA’).
Table 7: Ratio of completions on brownfield or greenfield land
Total Completions
Brownfield Land
Percentage (%) of total
Greenfield Land
Percentage (%) of total
352 127 36% 225 64%
Table 7 illustrates that the majority of new homes delivered in the borough during this
monitoring period has been on greenfield land. A significant number of completions
have been delivered during this monitoring period from a small number of large
planning permissions on greenfield sites, including 87 units from the build-out of
17/P/02592: Land South of Ash Lodge Drive.
16
The ratio of development on brownfield land is likely to decrease throughout the plan
period, particularly as a result of the site allocations as set out in the adopted Local
Plan: Strategy and Sites (2015 – 2034), which allocates a number of strategic sites
on greenfield land. However, opportunities for maximising brownfield land have been
taken and the Local Plan does allocate a number of ‘Previously Developed’ sites,
largely within the borough’s urban areas, which will continue to be delivered
throughout the plan period. Further Previously Developed Land (‘PDL’), also known
commonly as Brownfield Land, will continue to be identified for development through
the Land Availability Assessment (‘LAA’) and the Brownfield Land Register.
Brownfield Land Register
Local Authorities are required to prepare, maintain and publish a Brownfield Land
Register in accordance with the Town and Country Planning (Brownfield Land
Register) Regulations 2017. The Register comprises a list of Previously Developed
(Brownfield) sites that have the potential to accommodate residential development.
This includes sites from various sources, including sites allocated in the Local Plan,
whether they currently have planning permission or otherwise, provided they meet
certain specified criteria.
Part 1 of the most recently published Brownfield Land Register was published on
Friday 10 November 2020, containing 60 brownfield sites. The Brownfield Land
Register is available on the Council’s website at:
https://www.guildford.gov.uk/planningpolicy/brownfield-land-register.
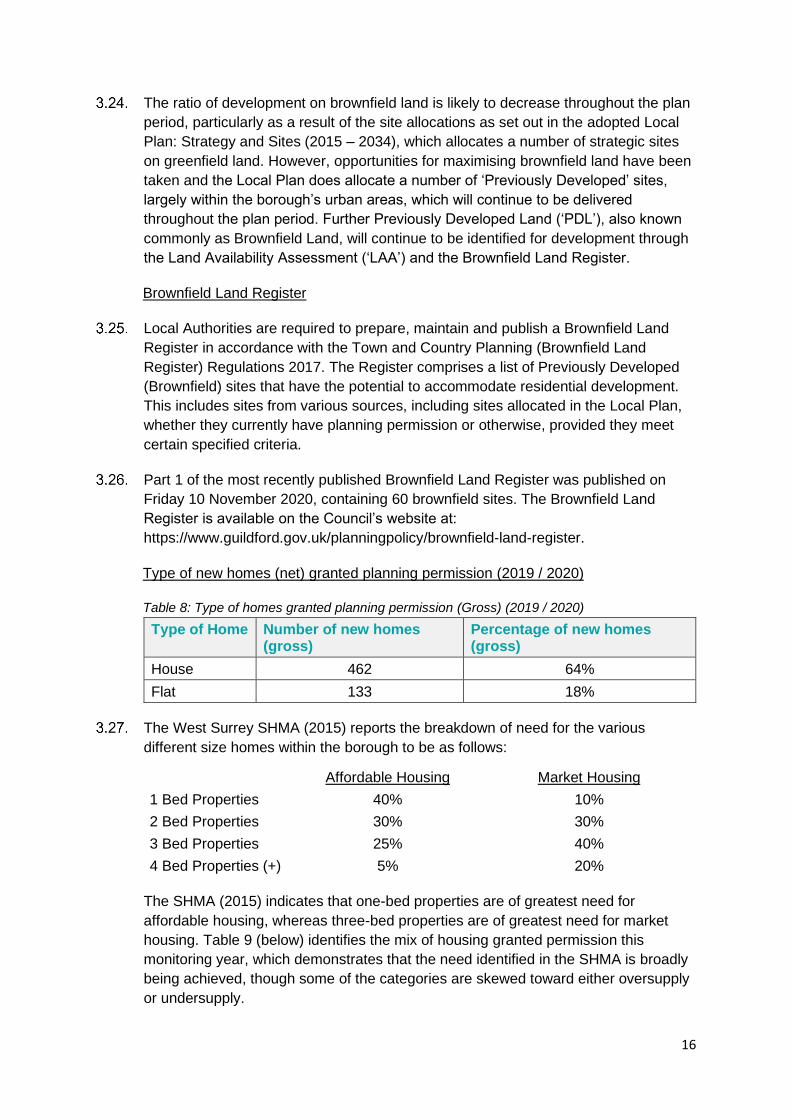
Type of new homes (net) granted planning permission (2019 / 2020)
Table 8: Type of homes granted planning permission (Gross) (2019 / 2020)
Type of Home Number of new homes (gross)
Percentage of new homes (gross)
House 462 64%
Flat 133 18%
The West Surrey SHMA (2015) reports the breakdown of need for the various
different size homes within the borough to be as follows:
Affordable Housing Market Housing
1 Bed Properties 40% 10%
2 Bed Properties 30% 30%
3 Bed Properties 25% 40%
4 Bed Properties (+) 5% 20%
The SHMA (2015) indicates that one-bed properties are of greatest need for
affordable housing, whereas three-bed properties are of greatest need for market
housing. Table 9 (below) identifies the mix of housing granted permission this
monitoring year, which demonstrates that the need identified in the SHMA is broadly
being achieved, though some of the categories are skewed toward either oversupply
or undersupply.

17
Table 9: Mix of housing sizes granted planning permission (2019 / 2020)
Type of homes Affordable Housing (%) (net) Market Housing (%) (net)
One Bedroom 14% 31%
Two Bedroom 71% 28%
Three Bedroom 14% 21%
Four Bedroom+ 1% 20%
Location of new homes granted permission
Table 10 (below) demonstrates the location of new homes granted permission during
this monitoring period and shows the historic trend from previous Monitoring Reports.
Table 10: Distribution of new homes granted permission by location (net)
Percentage of new homes granted permission
Location 2014/15 2015/16 2016/17 2017/18 2018/19 2019/20
Guildford Town Centre
2% 25% 27% 45% 3% 7%
Ash and Guildford Urban Area (excl. Town Centre)
27% 29% 31% 11% 10% 52%
Villages 9% 10% 8% 4% 5% 16%
Green Belt (outside settlements)
8% 12% 4% 39% 21% 24%
Countryside 51% 24% 24% 1% 61% 1%
The Loss of Homes
During the monitoring period, no planning permissions were granted which resulted
in the net loss of dwellings. The Council intends to increase housing delivery in the
borough, which means that applications involving the net loss of homes are generally
refused. The number of homes lost through permissions remains generally low.
18
Housing for Different Groups in the Community
Housing for older people and people with disabilities
Housing for older people and people with disabilities may fall within any of the C2, C3
or Sui Generis land use classes. Land use class C2 (residential institutions) includes
dwellings with an element of care, with residential care homes and nursing homes
falling within this category.
The West Surrey SHMA Guildford addendum (2017) excluded the borough’s
population in residential care from the general household projections for C3 use
housing and identified a separate need for 433 care home bed spaces between 2015
- 2034. Although there is no set target for C2 accommodation, the LPSS recognises
the importance of, and need for, this type of accommodation in the borough.
Importantly, the delivery of C2 accommodation now counts toward the council’s
housing supply in accordance with the Housing Delivery Test.
The West Surrey SHMA Guildford addendum Report (2017) identifies a need for
1,061 specialist homes for older persons between 2015 - 34. This forms part of our
overall housing need for C3 use class housing.
No planning applications for C2 housing for older people and people with disabilities
were approved during the monitoring period.
Housing for Students
The West Surrey SHMA Guildford addendum (2017) estimates the borough has a
need for a maximum of 3,800 additional student bedspaces over the plan period
(2015 – 2034). Within this figure, 2,090 students are assumed to live in student-halls
on-campus, which leaves a need of approximately 428 additional off-campus C3
dwellings (or 23 dwellings per year) to accommodate the remaining 1,710 new
students over the plan period. This figure rests on the assumption that there are circa
four students per C3 household on average. The separately-identified student
accommodation need for 428 C3 dwellings is included within the general housing
need figures.
The Manor Park Masterplan for the University of Surrey (02/P/02505) shows 145,200
square metres of student and staff residential accommodation, which has capacity for
approximately 4,171 bedspaces to be built. There have been no planning
permissions for Purpose Built Student Accommodation (PBSA) on-campus over the
monitoring period. However, it is worth noting that 477 bedspaces in PBSA at Manor
Park were completed by September 2019 and another 674 completed by September
2020.
Table 13 (below) shows the planning permissions that have been granted during this
monitoring period for purpose-built student accommodation. Further details can be
viewed in the Land Availability Assessment (2019)19.
19 Available to view online at: https://www.guildford.gov.uk/localplan/housing.

19
Table 13: Planning permissions for purpose-built student accommodation 1 April 2019 to 31
March 2020
Application Reference
Date Approved
Address Proposal
19/P/00267
04/07/2019 Kernal Court, Walnut Tree Close, GU1 4UD
Demolition of existing structures and construction of a part-4, part-5, part-7, part-8 storey student accommodation building (Sui Generis) and a basement plus part-4, part-5 storey Co-Living accommodation building (Sui Generis) with associated works including, parking, access, landscaping, plant, cycle and refuse enclosure. (Amendment to Planning Permission 18/P/01155 for an increase in Co-Living building from 4 to 5 stories (approximately 550mm in height) and an increase in Co-Living units from 85 to 113)
Self-build and Custom House Build
The Self-Build and Custom Housebuilding Act (2015) requires that local authorities
keep a register of individuals and associations interested in acquiring a serviced
plot(s) of land within their administrative area for the purpose of building houses to
occupy as a main residence. The Council meets this obligation and publicises the
register via its website (www.guildford.gov.uk/selfbuild). Local authorities must have
regard to the register when carrying out their Planning, Housing, Regeneration and
Land Disposal functions.
Self-build and Custom Housebuilding Planning Practice Guidance20 requires that
relevant authorities grant permission for enough suitable serviced plots of land to
meet the demand for self-build and custom housebuilding in their area. The
requirement is established with reference to the number of entries on Part 1 of the
authority’s register during the base period, which runs from 31 October to 30 October
annually. At the end of each base period, authorities are provided with three years to
grant permission for an equivalent number of plots of land that are suitable for self-
build and custom housebuilding21.
To be placed on the register, applicants must be: aged 18 years or older, a British
Citizen, a citizen of a European Economic Area (EEA) country or national of
Switzerland; they must be seeking to acquire a serviced plot of land in Guildford
borough to build a house to occupy as that individual’s sole or main residence. In the
case of associations, all individuals within the association must meet all of the criteria
specified above.
20 Available online at: https://www.gov.uk/guidance/self-build-and-custom-housebuilding.
21 PPG Paragraph 023; Reference ID 57-023-201760728.
20
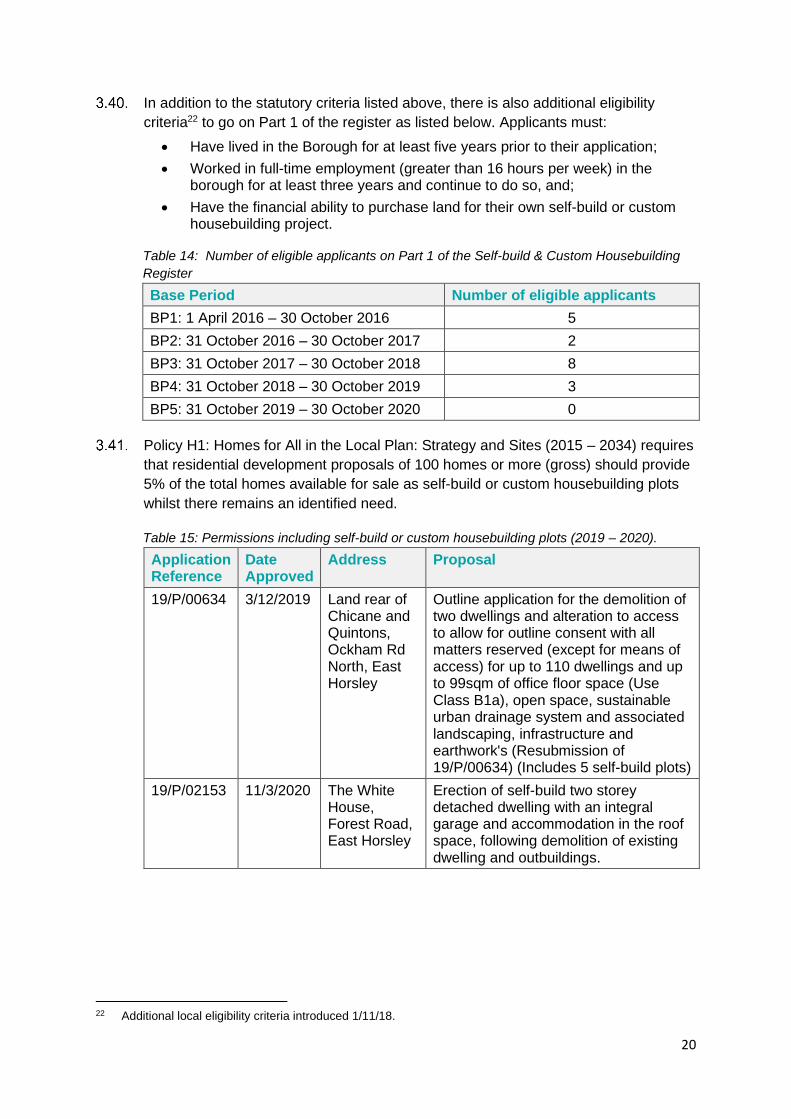
In addition to the statutory criteria listed above, there is also additional eligibility
criteria22 to go on Part 1 of the register as listed below. Applicants must:
• Have lived in the Borough for at least five years prior to their application;
• Worked in full-time employment (greater than 16 hours per week) in the borough for at least three years and continue to do so, and;
• Have the financial ability to purchase land for their own self-build or custom housebuilding project.
Table 14: Number of eligible applicants on Part 1 of the Self-build & Custom Housebuilding
Register
Base Period Number of eligible applicants
BP1: 1 April 2016 – 30 October 2016 5
BP2: 31 October 2016 – 30 October 2017 2
BP3: 31 October 2017 – 30 October 2018 8
BP4: 31 October 2018 – 30 October 2019 3
BP5: 31 October 2019 – 30 October 2020 0
Policy H1: Homes for All in the Local Plan: Strategy and Sites (2015 – 2034) requires
that residential development proposals of 100 homes or more (gross) should provide
5% of the total homes available for sale as self-build or custom housebuilding plots
whilst there remains an identified need.
Table 15: Permissions including self-build or custom housebuilding plots (2019 – 2020).
Application Reference
Date Approved
Address Proposal
19/P/00634
3/12/2019 Land rear of Chicane and Quintons, Ockham Rd North, East Horsley
Outline application for the demolition of two dwellings and alteration to access to allow for outline consent with all matters reserved (except for means of access) for up to 110 dwellings and up to 99sqm of office floor space (Use Class B1a), open space, sustainable urban drainage system and associated landscaping, infrastructure and earthwork's (Resubmission of 19/P/00634) (Includes 5 self-build plots)
19/P/02153 11/3/2020 The White House, Forest Road, East Horsley
Erection of self-build two storey detached dwelling with an integral garage and accommodation in the roof space, following demolition of existing dwelling and outbuildings.
22 Additional local eligibility criteria introduced 1/11/18.

21
Traveller Accommodation
The Traveller Accommodation Assessment (‘TAA’) (2017)23 sets out the expected
need for traveller pitches and travelling showpeople plots over the Local Plan period.
Policy S2 of the Local Plan: Strategy and Sites, adopted in April 2019, reflects the
identified need in the TAA (2017) and makes provision within the borough for 4
Gypsy and Traveller pitches and 4 Travelling Showpeople plots to meet the
accommodation needs for travellers (as defined by Planning Policy for Traveller Sites
(PPTS) August 2015) between 2017 and 2034.
Though the Council does not need to set targets to meet the needs of Gypsies,
Travellers and Travelling Showpeople who do not meet the planning definition, the
Council recognise from the findings of the TAA (2017) that there is an additional need for
41 permanent pitches for Gypsies and Travellers and 4 permanent plots for Travelling
Showpeople who do not meet the planning definition of traveller. There is also a likely
need for 8 permanent pitches to meet potential additional need of households of
unknown planning status. These identified needs are reflected in Policy S2.
Tables 16 and 17 (below) show the planning approvals and pending applications
respectively.
Table 16: Permissions for traveller pitches and plots (1 April 2019 to 31 March 2020)
App. Reference
Date Approved
Address Number of Pitches/Plots
18/P/01484 9/4/19 Roundoak, White Hart Lane, Wood Street Village
1
17/P/00092 3/7/19 The New Yard, Lysons Ave, Ash Vale 1
19/P/01136
8/11/19
Four Acres Stables, Aldershot Road, Guildford
6
19/P/01504
21/02/20
Valley Park Equestrian Centre, East Shalford Lane, Guildford
5
18/P/02435
24/02/20
Oaklands Farm (formerly Palm House Nurseries), Glaziers Lane, Guildford
6
Table 17: Pending planning applications for traveller pitches and plots during monitoring
period (1 April 2019 to 31 March 2020)
App. Reference
Date Address Number of Pitches/Plots
Pending 20/P/00232 The Paddocks, Land off Rose Lane, Ripley
4
The Land Availability Assessment (‘LAA’) (2020)24 includes an assessment of land
available for traveller accommodation. The LAA identifies sufficient potential land to
meet the need for traveller accommodation over the plan period (2015 – 2034).
Further details on traveller accommodation can be viewed in the LAA 2020.
23 Available online at: https://www.guildford.gov.uk/localplan/housing.
24 Available online at: https://www.guildford.gov.uk/localplan/housing.
22
Employment and Retail
Employment Floorspace
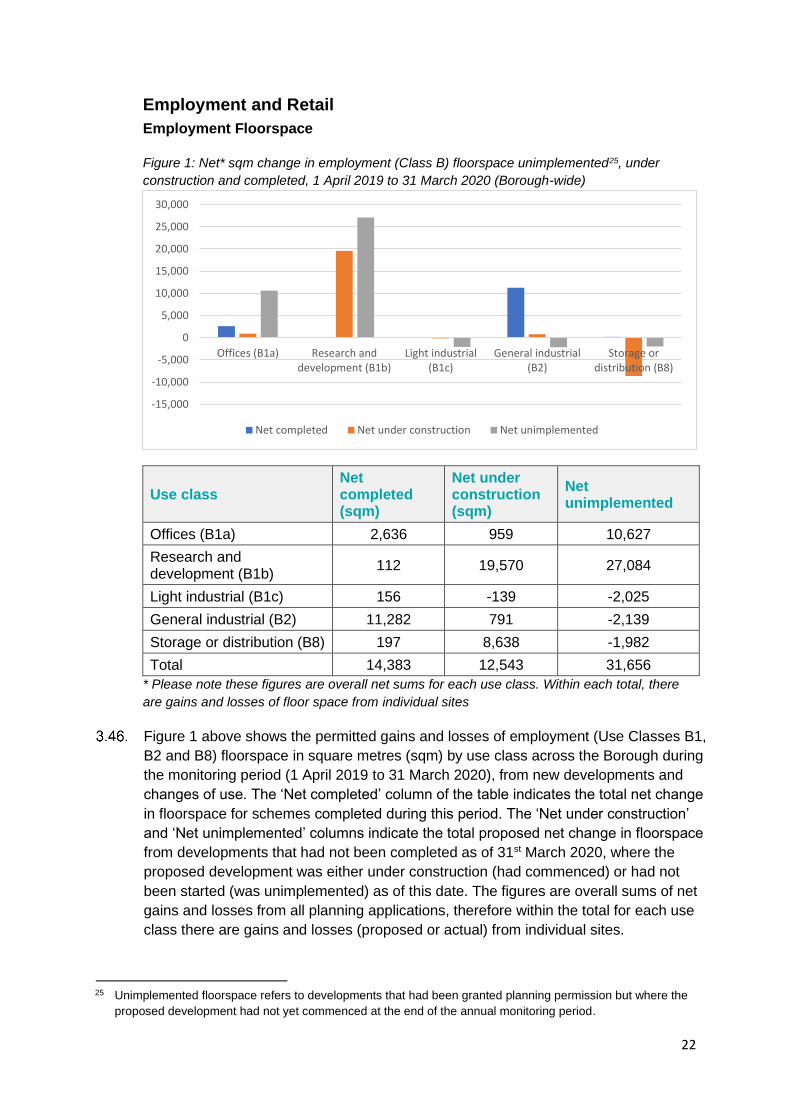
Figure 1: Net* sqm change in employment (Class B) floorspace unimplemented25, under
construction and completed, 1 April 2019 to 31 March 2020 (Borough-wide)
Use class Net completed (sqm)
Net under construction (sqm)
Net unimplemented
Offices (B1a) 2,636 959 10,627
Research and development (B1b)
112 19,570 27,084
Light industrial (B1c) 156 -139 -2,025
General industrial (B2) 11,282 791 -2,139
Storage or distribution (B8) 197 8,638 -1,982
Total 14,383 12,543 31,656
* Please note these figures are overall net sums for each use class. Within each total, there
are gains and losses of floor space from individual sites
Figure 1 above shows the permitted gains and losses of employment (Use Classes B1,
B2 and B8) floorspace in square metres (sqm) by use class across the Borough during
the monitoring period (1 April 2019 to 31 March 2020), from new developments and
changes of use. The ‘Net completed’ column of the table indicates the total net change
in floorspace for schemes completed during this period. The ‘Net under construction’
and ‘Net unimplemented’ columns indicate the total proposed net change in floorspace
from developments that had not been completed as of 31st March 2020, where the
proposed development was either under construction (had commenced) or had not
been started (was unimplemented) as of this date. The figures are overall sums of net
gains and losses from all planning applications, therefore within the total for each use
class there are gains and losses (proposed or actual) from individual sites.
25 Unimplemented floorspace refers to developments that had been granted planning permission but where the
proposed development had not yet commenced at the end of the annual monitoring period.
-15,000
-10,000
-5,000
0
5,000
10,000
15,000
20,000
25,000
30,000
Offices (B1a) Research anddevelopment (B1b)
Light industrial(B1c)
General industrial(B2)
Storage ordistribution (B8)
Net completed Net under construction Net unimplemented

23
Employment floorspace completed
The largest net gain of employment floorspace completed during the 2019/20
monitoring period was in the office (class B1a) floorspace category, which amounted
to an overall 2,636 sqm. This was from two permitted schemes. The first of these
comprised 1,416 sqm office space as part of construction of larger industrial units at
Henley Business Park, Pirbright Road, Normandy (which made up the 11,282 sqm
class B2 general industrial floorspace also completed during this period). The second
scheme involved subdivision of four previously approved office units to create eight
units (total additional floorspace of 1,220 sqm) for start-up businesses on land to the
north of Weyvern Park, Old Portsmouth Road. There was also a small net gain of
research and development (class B1b), light industrial (B1c) and storage or
distribution (B8) floorspace, arising from the above-mentioned expansion of Henley
Business Park.
Employment floorspace under construction
There was a total net gain of around 12,500 sqm of use class B1 (a, b and c), B2 and
B8 employment floorspace under construction (’Net under construction’ column) at
the end of the 2019-2020 monitoring period. Within the subtotals for each of these
types of employment use, the biggest change and net gain was for class light
industrial (B1b) floorspace. Two new medical research and development buildings at
Surrey Research Park comprising over 7,600 sq. m and two new laboratory buildings
comprising more than 11,700 sq. m at Pirbright Laboratory Institute for Animal Health
accounted for the bulk of the 19,570 sqm class B1b floorspace under construction at
the end of the 2019/20 monitoring period.
Class B8 storage and distribution space made up the largest net loss of employment
floorspace from schemes under construction during the 2019/2020 monitoring period,
comprising around 8,600 sqm. This was arising primarily from a scheme to redevelop
four large storage sheds at Tithebarns Farm, Tithebarns Lane, Send (comprising
nearly 6,000 sqm), to create 13 homes.
The office (B1a) floorspace under construction included a new office at Unit 5,
Guildford Business Park, and car parking deck on a nearby plot26. It also included
just over 2,500 sqm at Pembroke House, Mary Road, Guildford, from redevelopment
of an existing warehouse and offices.
Unimplemented schemes involving loss or gain of employment floorspace
Approved developments that remained unimplemented at the end of the monitoring
period proposed an overall net gain of 31,565 sqm total B class employment
floorspace across the borough. Within this total, a net gain of just over 27,000 sqm
research and development (B1b) floorspace and 10,600 office (B1a) floorspace was
proposed.
26 The floorspace that this planning application relates to (application ref. 12/P/01894) was for a new 2,664 sq m
office building and car parking deck. Work on the car parking deck had commenced prior to the original
planning application’s expiry date of May 2016.

24
More than 24,000 sqm of R&D (class B1b) floorspace remained unimplemented as
part of an approved outline planning application approved in 2016 for partial
demolition and redevelopment of the existing buildings at the Pirbright Laboratory
Institute for Animal Health. This scheme would create up to 40,000 sqm of additional
B1b research and development floorspace on the site and is due to take place in
several stages, with approval of reserved matters for the first phase due to be
submitted by July 2021.
The increase in B1a office floorspace was proposed to arise primarily from two
applications at Guildford Business Park – one for an additional 5,684 sqm on plot no.
5 (Unit 5)27 and the other for an additional 5,537 sqm net floorspace from the
proposed redevelopment of Unit 428. There were also applications for several
smaller schemes that remained unimplemented at the end of the 2019-2020
monitoring period that would result in the gain or loss of office space. Out of these,
the B1a losses approved were mainly to residential dwellings, and included a number
of applications for prior approval29, as well as planning applications.
Some overall net losses in the region of around 2,000 sqm remained unimplemented
within each of the B1c, B2 and B8 employment floorspace categories, from several
applications for smaller schemes of various types determined within the previous few
years, including the approved (in November 2016) change of use of an agricultural
barn to a gym at Valentines Farm, Rose Lane, Ripley.
Retail floorspace
Figure 2: Net* sqm retail (Class A) floorspace granted planning permission, under
construction and completed, 1 April 2019 to 31 March 2020 (Borough-wide)
27 See application ref. 17/P/00243. This floorspace represents an increase of more than double that of the
original scheme for Unit 5 proposed under application 12/P/01894.
28 See application ref. 17/P/02280.
29 Applications for prior notification for proposed changes of use, where the proposed use was permitted under
the Town and Country Planning (General Permitted Development) (England) Order 2015 (as amended)
-1000
-800
-600
-400
-200
0
200
400
600
800
Shops (A1) Financial andprofessionalservices (A2)
Restaurants andcafes (A3)
Drinkingestablishments
(A4)
Hot food takeaway(A5)
Net completed Net under construction Net unimplemented
25
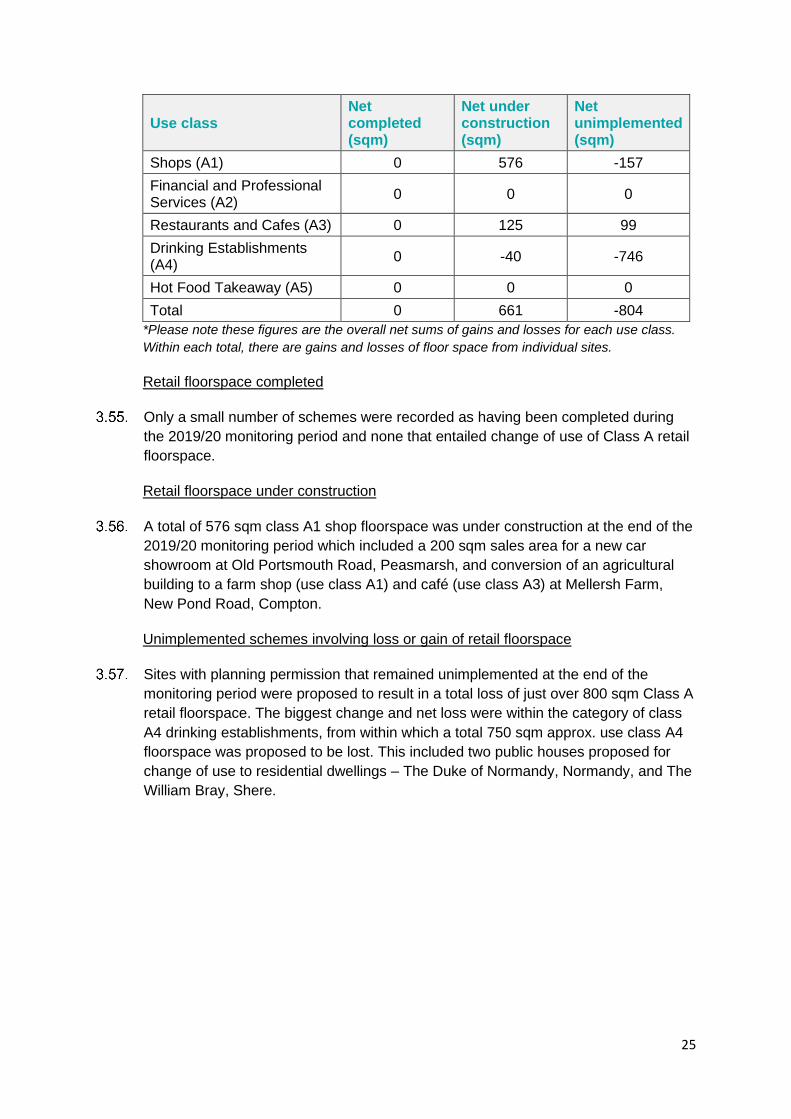
Use class Net completed (sqm)
Net under construction (sqm)
Net unimplemented (sqm)
Shops (A1) 0 576 -157
Financial and Professional Services (A2)
0 0 0
Restaurants and Cafes (A3) 0 125 99
Drinking Establishments (A4)
0 -40 -746
Hot Food Takeaway (A5) 0 0 0
Total 0 661 -804
*Please note these figures are the overall net sums of gains and losses for each use class.
Within each total, there are gains and losses of floor space from individual sites.
Retail floorspace completed
Only a small number of schemes were recorded as having been completed during
the 2019/20 monitoring period and none that entailed change of use of Class A retail
floorspace.
Retail floorspace under construction
A total of 576 sqm class A1 shop floorspace was under construction at the end of the
2019/20 monitoring period which included a 200 sqm sales area for a new car
showroom at Old Portsmouth Road, Peasmarsh, and conversion of an agricultural
building to a farm shop (use class A1) and café (use class A3) at Mellersh Farm,
New Pond Road, Compton.
Unimplemented schemes involving loss or gain of retail floorspace
Sites with planning permission that remained unimplemented at the end of the
monitoring period were proposed to result in a total loss of just over 800 sqm Class A
retail floorspace. The biggest change and net loss were within the category of class
A4 drinking establishments, from within which a total 750 sqm approx. use class A4
floorspace was proposed to be lost. This included two public houses proposed for
change of use to residential dwellings – The Duke of Normandy, Normandy, and The
William Bray, Shere.

26
A small net overall loss of 157 sqm30 of class A1 shop floorspace remained
unimplemented, arising from a handful of small schemes. This included the proposed
redevelopment of The Founders Studio Guildford School of Acting in Millbrook to a
new building incorporating class A1 shop, A2 financial and professional services and
B1a office uses on the ground floor, with six class C3 residential flats at first floor
level. This application was determined in March 2018, but construction had not
begun as of 31st March 2020.
There was also a net gain of just under 100 sqm of A3 floorspace unimplemented
from the proposed change of use of Portman Motorcycles showroom at 23-25
Woodbridge Hill, Guildford to a restaurant and café.
Retail floorspace surveys
The Council undertakes surveys on foot of the use classes and vacancies for ground
floor retail units in the Town Centre Primary Shopping Area (PSA) and the Borough’s
district and local shopping centres on an annual basis and for consistency of results
these surveys normally take place around May each year. The latest surveys were
undertaken in May 2019 and reported on in the 2018/19 Annual monitoring Report31,
alongside analysis and comparison with survey data for previous years from 2015
onwards.
Due to the impact of the Covid-19 coronavirus pandemic and the necessity for the
Council to take account of Government advice regarding working safely during this
period32, it was decided not to undertake any retail surveys in May 2020 due to the
heighted risk of infection to Council staff or anyone else who they may come into
contact with while doing so. The Council intends to undertake surveys when it
considers it reasonably safe to do so.
For this AMR, the results of quarterly surveys in the town centre undertaken by
Experience Guildford, Guildford’s Business Improvement District (BID), have been
published instead, in the table below. The data from these surveys is also published
by Springboard, which collate survey results from local authority districts and regions
around the country. The national and regional average vacancy rates have also been
included to indicate how Guilford town centre is performing overall as a whole
compared to other areas.
30 This compares to an overall proposed loss of -1,898 sq m of use class A1-A5 floorspace as of 31 March 2019
(see Monitoring Report 2017/2018, available at: http://www.guildford.gov.uk/media/19972/Monitoring-
Report/pdf/Monitoring_Report_2014_2015_(3).pdf).
31 Available at: https://www.guildford.gov.uk/media/31295/Annual-Monitoring-Report-2018-
2019/pdf/Annual_Monitoring_Report_2018-19.pdf?m=637124385667130000.
32 Available at: https://www.gov.uk/guidance/working-safely-during-coronavirus-covid-19.

27
The vacancy rate for Guildford town centre in October 2020 according to these
surveys was 14.8%. This was higher than in July 2020, which in turn was an increase
on the vacancy rate recorded for January 2020. The rates for the UK in the same
month (11.3%) and South East (11.2%) have also followed an upward trajectory
since January 2020 but not risen by as much as in Guildford, which saw a 4.8%
increase between January and July. This took the vacancy rate for Guildford above
both the national and regional average.
Figure 3: Vacancy rate (%) for ground floor town centre retail units, July 2019 – October 2020
Area October 2020 July 2020 January 2020 July 2019
Guildford 14.8 (14.7*) 12.4 7.6 7.6
South East 11.2 10.7 9.7 9.2
UK 11.3 10.8 9.8 10.10
Source: Experience Guildford and Springboard
* Adjusted % based on units within the PSA boundary
The BID retail surveys were carried out over a larger geographical area than covered
by the Council’s own retail surveys (which comprises only the PSA) and therefore it
would be expected that there would be a slight difference in the vacancy rate
compared to the rate for the PSA. 7 of the 65 units reported as being vacant by the
BID in October 2020 were located outside of the PSA boundary. Taking the number
of units reported as vacant in the BID survey that fell within the PSA, the vacancy
rate was 14.7%, which is marginally (0.1%) below the BID’s recorded vacancy rate
for its own town centre survey area.
The majority of the vacant units fell within the High Street, Upper High Street, North
Street, Friary Centre, Tunsgate and Tunsgate Quarter. However, there were also a
number in side streets between the main shopping streets. Only 1 out of 16 units in
Friary Street was vacant (the former New Look at no. 14-16) and 1 out of 20 units in
White Lion Walk was vacant (Unit 6 – formerly Trotters).
The incidence of vacant units was widespread across the PSA rather than
concentrated in any specific area(s), indicating that the whole of the main shopping
area of the town centre has felt the effects of the Covid-19 pandemic lockdowns and
restrictions on in-store shopping. They included units that were previously occupied
by restaurants, coffee shops and food-to-go outlets as well as by comparison
retailers. This is similar to the picture nationally, as many businesses that are reliant
on customer visits to physical high street outlets have been forced to close for part of
2020 due to restrictions and/or risk averse behaviour from shoppers affecting their
sales. It is anticipated that many stores that are temporarily vacant should be able to
reopen and trade successfully or may be occupied by new tenants once the risk from
the pandemic lessens and the Government’s current social distancing restrictions are
relaxed. The Council will continue to monitor vacancies and the extent to which there
is a recovery in this regard.
28
4. Planning Contributions
Community Infrastructure Levy (‘CIL’)
The Community Infrastructure Levy (CIL) is a charge on new development that would
be paid by landowners or developers when new developments are built. It can assist
in delivering infrastructure to support development. CIL is not currently in place in
Guildford and developer contributions toward infrastructure are primarily secured
through s106 agreements.
With an adopted CIL, landowners and developers are required to pay the relevant
amount of CIL when they build their new buildings or extensions. CIL is non-
negotiable but there are certain exceptions, such as affordable housing and
developments by charities and those used for charitable purposes. The amount to be
paid is based on the net floor area of a new building or extension, and its use. It
applies to most new buildings and extensions over 100 sq. m. (gross), and to new
homes regardless of their floor area.
The Council is undertaking further viability work during 2020-21 to support the
emerging Local Plan: Development Management Policies. This work would also
contribute to providing updated evidence to support the preparation of a draft
charging schedule (DCS) for consultation. In the Planning for the Future White Paper
(August 2020), the Government have proposed the introduction of a new
consolidated ‘Infrastructure Levy’ to replace the existing parallel regimes for securing
developer contributions. Progress in this regard will be monitored.
The CIL must be based on Local Plan development and infrastructure, and CIL rates
are informed by viability evidence.
The Local Plan and CIL Viability Study (2016) and the Local Plan Viability Study
Update (2017) were prepared as part of the evidence base for the Local Plan:
Strategy and Sites. The former study included recommendations for CIL charging
and rates. Further consultation on proposed rates (reflected in a draft charging
schedule) would be necessary prior to submission for examination and introduction of
CIL in Guildford.
Prior to these viability studies, the Council held a consultation between 19 January
and 1 March 2015 on initial proposals for CIL rates in the borough, which were set
out in a preliminary draft charging schedule. Whilst out of date, the preliminary draft
charging schedule and supporting documents are available at
https://www.guildford.gov.uk/newlocalplan/cil.
29
Section 106 Annual Review
Planning obligations assist in mitigating the impact of unacceptable development to
make it acceptable in planning terms. Planning obligations may only constitute a
reason for granting planning permission if they meet the tests that they are necessary
to make the development acceptable in planning terms. They must be:
• necessary to make the development acceptable in planning terms;
• directly related to the development; and
• fairly and reasonably related in scale and kind to the development.
During the monitoring period, the Council agreed 134 Section 106 agreements and
received £3,884,972.33. Additionally, £8,988,565.58 was negotiated during the
monitoring period, and a total of £762,392.13 was spent.
Thames Basin Heaths Special Protection Area
Detailed analysis of the S106 contributions relating to the Thames Basin Heaths
Special Protection Area (TBH SPA) are provided at Appendix 2: TBH SPA Position
Statement. The appendix details developer contributions towards both Suitable
Natural Alternative Greenspace (SANG) and Strategic Access Management and
Monitoring (SAMM).

30
5. Duty to Cooperate
The duty to cooperate (‘DtC’) was introduced by the Localism Act 201133. It places a
legal duty on local planning authorities, county councils in England and public bodies
to engage constructively, actively and on an ongoing basis to maximise the
effectiveness of local plan preparation in the context of strategic cross boundary
matters.
The Duty to Co-operate Matrix at Appendix 1 demonstrates the various organisations
that the Council consults and corresponds with for the purposes of the duty-to-
cooperate in plan-making, alongside the relevant strategic issues that they are
consulted upon.
During the Monitoring Period, the Council adopted the Local Plan: Strategy and Sites
(2015 – 2034) Development Plan Document. Following adoption of the plan, it was
subject to three separate Judicial Reviews. All three claims were dismissed at the
High Court. Following the dismissals, an appeal was lodged and was dismissed at
the first stage.
During the monitoring period, the Council commenced work on part 2 of the Local
Plan, the ‘Local Plan: Development Management Policies’ document. Shortly after
the monitoring period began, the seven week Regulation 18 consultation was
conducted, which sought feedback on the issues and preferred options. This included
feedback from the prescribed bodies on the policy approach being pursued. More
information will be reported regarding this in the next iteration of the Annual
Monitoring Report.
6. Evidence Base
Paragraph 31 of the NPPF states that:
The preparation and review of all policies should be underpinned by relevant
and up-to-date evidence. This should be adequate and proportionate, focused
tightly on supporting and justifying the policies concerned, and take into
account relevant market signals.
The Local Plan: Strategy and Sites (2015 – 2034) was adopted during this monitoring
period and the evidence-base documents that support the plan remain up-to-date.
The full list of supporting evidence-base documents submitted to the Local Plan
Examination in Public is available online at:
https://www.guildford.gov.uk/newlocalplan/media/26763/Submission-core-and-
supporting-documents/pdf/Submission_core_and_supporting_documents.pdf.
33 Available online at: http://www.legislation.gov.uk/ukpga/2011/20/contents/enacted.

31
Appendix 1 - Duty to cooperate matrix of prescribed bodies and strategic issues
Housing Gypsies
and Travellers
Employment and retail
Transport SPA / SANG
Green Belt
AONB
Infrastructure (incl. health &
schools)
Flooding and waterways
Waste Natural
environment & open space
Surrey County Council ✓ ✓ ✓ ✓ ✓ ✓ ✓ ✓ ✓ ✓ ✓
Elmbridge Borough Council ✓ ✓ ✓ ✓ ✓ ✓ ✓ ✓
Epsom and Ewell Borough Council
✓
Mole Valley District Council ✓ ✓ ✓ ✓ ✓ ✓
Reigate and Banstead Borough Council
✓ ✓
Runnymede Borough Council
✓ ✓ ✓
Spelthorne Borough Council
✓
Surrey Heath Borough Council
✓ ✓ ✓ ✓ ✓ ✓
Tandridge District Council ✓ ✓
Waverley Borough Council ✓ ✓ ✓ ✓ ✓ ✓ ✓ ✓ ✓ ✓
Woking Borough Council ✓ ✓ ✓ ✓ ✓ ✓ ✓ ✓ ✓
Hampshire County Council ✓ ✓ ✓ ✓ ✓
Hart District Council ✓
Rushmoor Borough Council
✓ ✓ ✓ ✓ ✓ ✓ ✓
✓

32
Prescribed Bodies
Civil Aviation Authority ✓
Clinical Commissioning Groups (CCG)
✓
Guildford and Waverley CCG
North West Surrey CCG
Surrey Heath CCG
Environment Agency ✓ ✓ ✓
Enterprise M3 LEP ✓ ✓ ✓ ✓
Highways England ✓
Historic England ✓ ✓
Homes and Communities Agency (HCA)
✓ ✓
Mayor of London ✓ ✓ ✓ ✓
National Health Service Commissioning Board
✓
Natural England ✓ ✓ ✓
Office of Rail and Road ✓
Surrey Nature Partnership ✓
Transport for London ✓
33
Appendix 2 – TBH SPA Position Statement 2020
Introduction
The Thames Basin Heaths Special Protection Area (‘TBH SPA’) Avoidance Strategy
2017 Supplementary Planning Document (‘the SPA strategy’) was adopted on 18
July 2017 and took effect on 28 July 201734. The strategy enables residential
development to take place that would otherwise be prevented by the provisions of
European and national legislation relating to the protection of the Special Protection
Area (‘SPA’).
Implementation and Monitoring
Officers from Planning, Parks and Countryside and Financial Services meet
periodically to assess the progress and to identify and address implementation issues
as they arise.
We report on an annual basis to the Joint Strategic Partnership Board (‘JSPB’) on:
• Suitable Alternative Natural Greenspace (‘SANG’) 35 delivery and capacity within the borough,
• Housing provision in the 400 metre exclusion zone and zone of influence36,
• Our programme for future provision of SANG,
• Monitoring data relating to Strategic Access Management and Monitoring (‘SAMM’)37 finances quarterly.
The responsibility for monitoring the effectiveness of the SANG and SAMM approach
falls to the JSPB. The JSPB has also taken on the role of organising and funding
visitor surveys on fully allocated SANGs across the TBH area in order to provide a
standardised consistent approach to monitoring. The evidence collected has shown
that there has been no significant increase in the levels of visitors on the SPA despite
an increase in the number of homes within the vicinity of the SPA38. Evidence
continues to be collected through the SAMM project and further reports will be
released in due course.
Financial Situation
The financial position with regard to each of the designated and operational SANG
sites at the end of March 2020 is shown in the following table.
34 Available online at: https://www.guildford.gov.uk/tbhspa.
35 See the SPA strategy page 15 for an explanation of SANGs
36 See the SPA strategy page 10 for an explanation of the exclusion zone and zone of influence.
37 See the SPA strategy page 27 for details of the SAMM project.
38 See Natural England Commissioned Report NECR136
http://publications.naturalengland.org.uk/publication/4514481614880768.

34
SANG Site Contributions received from September 2006 to end of March 2020
Expenditure incurred from September 2006 to end of March 2020
Chantry wood £4,592,092 £284,808
Effingham Common £2,092,953 £93,664
Lakeside Nature Reserve £765,399 £217,899
Riverside Nature Reserve and Parsonage Watermeadows
£3,469,349 £680,313
Sub Totals £10,919,793 £1,276,684
The table above does not include financial information for SANGs outside of Council
ownership as the Council does not receive money or spend money on works for these
SANGs. The Council does, however, monitor capacity in SANGs outside of Council ownership
(see next section).
Current SANG capacity
We closely monitor the amount of SANG allocated to housing developments as they
occur to ensure that sufficient SANG capacity is available. Since the previous
monitoring report, Ash Green Meadows SANG has been extended through the
addition of land at Bin Wood which provides 2.17 additional hectares. The table
below sets out the position at the end of December 2020.
SANG Site Total amount of SANG (hectares)
SANG already allocated (hectares)
Remaining SANG (hectares)
Riverside Nature Reserve and Parsonage Watermeadows
24 23.3 0.7
Effingham Common 34 14.5 19.5
Lakeside Nature Reserve 4 3.8 0.2
Chantry Wood 38 31.2 6.8
Ash Green Meadows (inc. Bin Wood)*
26.2 22.1 4
Runfold Bridge (Manor Farm)* 17.7 5.6 12
Remaining overall 43.2
*These are SANGs outside Council ownership.
Figures may not sum due to rounding.
Where developers have obtained planning permission and have been allocated
SANG but have not yet paid the fees required to secure the SANG capacity, it is
possible that the development will not be built out and the planning permission will
expire. In these circumstances the SANG allocation will be withdrawn and the
capacity will be made available for other developments.

35
The Local Plan: Strategy and Sites 2015 – 2034 includes a housing requirement of
562 homes per year (2015 – 2034). On the basis of this number, the existing
unallocated SANG capacity of 43.2 hectares, which equates to around 2,246 new
homes (assuming an average occupancy of 2.4 people per house and a provision of
8 hectares of SANG per thousand people which equates to 0.0192 hectares of SANG
per house), is expected to last 4 years (2,246 new homes, divided by 562 homes per
year = 4 years).
Emerging SANGs and additional capacity
There are a number of new SANGs expected to come online in the near future.
Tyting Farm, to the southeast of Guildford, will be a Council owned SANG and was
expected to come online early in 2020. Works were delayed due to Covid and it is
now expected to open in late 2021. It will provide around 40 additional hectares of
SANG capacity as an extension to the existing SANG at Chantry Wood. The SANG
will provide mitigation for developments in and around the Guildford urban area.
Horsley Meadows SANG (formerly referred to as Long Reach SANG) is a new 24
hectare SANG in West Horsley. It has been granted planning permission and work is
underway to bring the SANG online. The SANG is privately owned and has capacity
for approximately 1,250 homes with a catchment covering the east of the borough.
Wood Street Knoll SANG (formally referred to as Russell Place Farm SANG) is a
new 34 hectare SANG in Worplesdon parish near Wood Street Village. It has been
granted planning permission and works to bring it online are underway. The SANG is
privately owned and has capacity for approximately 1,770 homes, with a catchment
stretching from Guildford to Ash.
These three SANGs together would provide around 98 hectares of SANG, enough
land for just over 5,000 homes and nine years of housing supply.
Eashing Fields SANG near Eashing is within Guildford borough and has been
brought forward by the developer of a housing site over the borough boundary in
Waverley. The SANG is not yet online and it is not clear whether this SANG will have
capacity that could be available for developments in Guildford borough.
Burpham Court Farm is a Council owned site to the northeast of Guildford. The
Council has submitted a change of use planning application create new open space
and a Nature Reserve covering 45.9 hectares. It is not clear at this stage how much
of that land would be available for use as SANG.
The Local Plan: Strategy and Sites contain allocations for large strategic sites at
Gosden Hill Farm, Blackwell Farm and the Former Wisley Airfield. These strategic
site allocations will deliver bespoke SANGs to provide mitigation for their own
developments.

36
The Council continues to work to ensure enough SANG is in place:
• We are looking at options for a parking area for Effingham Common SANG. A parking area, which may need a Section 38 Agreement for the use of common land and planning permission, will significantly increase the development capacity of this SANG by widening its sphere of influence from 400 metres to 5 kilometres.
• The Council is working with the owners of privately owned SANGs that are not yet online to agree a mechanism that enables their SANGs to come online for new developments.
• We continue to engage with landowners who are considering offering their land for use as SANG, including developers proposing new SANGs.
Strategic Access Management and Monitoring (SAMM)
Hampshire County Council is the body that holds the funds provided by developers
for SAMM. This money is used by JSPB to fund monitoring and access management
on the SPA. Since 2011, and up to the end of March 2020 we have passed
£1,993,028 to Hampshire County Council (who host the SAMM project) for this
purpose