castlereagh borough council air quality review and ...
40
CASTLEREAGH BOROUGH COUNCIL AIR QUALITY REVIEW AND ASSESSMENT PROGRESS REPORT 2005 BY: RICHARD W HARVEY SENIOR ENVIRONMENTAL HEALTH OFFICER
-
Upload
khangminh22 -
Category
Documents
-
view
1 -
download
0
Transcript of castlereagh borough council air quality review and ...

CASTLEREAGH BOROUGH COUNCIL
AIR QUALITY REVIEW AND ASSESSMENT
PROGRESS REPORT
2005
BY: RICHARD W HARVEY
SENIOR ENVIRONMENTAL HEALTH OFFICER

CASTLEREAGH BOROUGH COUNCIL
AIR QUALITY REVIEW AND ASSESSMENT
PROGRESS REPORT
2005
BY: RICHARD W HARVEY
SENIOR ENVIRONMENTAL HEALTH OFFICER
TITLE PAGE

Abstract Page 1 Executive Summary Page 2/3 Table showing National Air Quality Standard Objectives Page 3 1 Introduction Page 4/5 Table 1 - How Progress Reports can assist Local Authorities Page 4 2 Monitoring Results Page 6/11 2.1 Table - Nitrogen Dioxide Tube Site Locations Page 6 2.2 Table - Annual Nitrogen Dioxide Levels for 2002/03/04/05 and 2010 Page 6 Figure 2.1 Annual Nitrogen Dioxide Levels for 2002/03/04 Page 7 Figure 2.2 Annual Nitrogen Dioxide Levels for 2004/05/2010 Page 8 2.3 Table - Automated Monitoring Data 2004 for Loughview Drive Page 8 2.4 Table - Automated Monitoring Data 2004 for Loughview Drive Page 9
Figure 2.3 Loughview Drive Air Monitoring hourly mean data for 2004 Page 9 2.5 Table - Automated Monitoring Data 2004 for Espie Way Page 9 2.6 Table - Automated Monitoring Data 2004 for Espie Way Page 10 Figure 2.4 Espie Way Air Monitoring hourly mean data for 2004 Page 10 2.7 Table - Breakdown of Air Quality Nuisance Investigations Page 11
3 New Local Developments Page 12 3.1 Table - New Developments with the potential to affect air quality Page 12 4 Action Plans Page 13 5 Air Quality Strategy Page 14/15 5.1 Table - Main Aspects of the Air Quality Strategy Page 14/15 6 Planning and Policies Page 16 6.1 Table - Planning Applications Requiring Air Quality Assessment Page 16 6.2 Table - Policies Designed to Help Improve Air Quality Page 16 7 Summary Page 17 Appendix Page 18/19
CONTENTS

The Progress Report 2004 forms an integral part of Castlereagh Borough Council’s Air
Quality Management. The overall aim is to report progress on implementing local air quality
management and progress in achieving, or maintaining, concentrations below air quality
objectives. Progress reports also help ensure continuity in resourcing air quality within Local
Authorities and provide a means for communicating air quality information to members of the
public.
The Progress Report 2005 focuses on information that might affect the air quality of
Castlereagh and provides information that will assist in other policy areas such as transport
and land use planning. This will allow Castlereagh Borough Council to be able to require the
potential impacts on air quality to be investigated and to identify areas to focus upon when
the next round of updating and screening assessments are due.
This report can be viewed at www.castlereagh.gov.uk once the Department has approved it.
Should you wish to discuss the content of this report, please do not hesitate to contact
Richard Harvey (028 9049 4646).
ABSTRACT

The UK Government published its Strategic Policy Framework for Air Quality Management in
1995 establishing national strategies and policies on air quality. The Northern Ireland
Environment Order came into operation in January 2003 and implements both the European
Air Framework Directive 96/62EC and the UK Air Quality Strategy. The Air Quality Strategy
provides a framework for air quality control through air quality management and air quality
objectives.
Under the Air Quality Strategy all Local Authorities are required to undertake an air quality
review. In areas where air quality objectives are not anticipated to be met by the specified date,
Local Authorities are required to establish Air Quality Management Areas to improve air quality.
Local Air Quality Management Policy Guidance (LAQM.PGNI (03)) is designed to help relevant
authorities with their Local Air Quality Management (LAQM) duties under Part III of the
Environment (NI) Order 2002. The Environment (NI) Order 2002 provides the framework for
LAQM across Northern Ireland. The Air Quality Objectives set out in the Air Quality Regulations
(NI) 2003 provide the statutory basis for the system of LAQM.
This report forms the Progress Report and the purpose of the report is to identify those
matters that have changed since the last review and assessment, which might lead to a risk
of an air quality objective being exceeded, the conclusions of the last review and assessment
report are:
Nitrogen Dioxide (NO2)
The modelling shows that levels of NO2 are likely to be below the annual mean objective for
2005 at relevant receptors at the assessed major links/roads. Therefore, an Air Quality
Management Area (AMQA) should not be declared on NO2.
Particulate Matter (PM10 gravimetric)
The modelling shows that an exceedence of the PM10 annual mean objective for 2004 is
unlikely at relevant receptors on the assessed major links/roads. The daily mean objective
will not be exceeded. Therefore, an Air Quality Management Area (AMQA) should not be
declared on PM10.
EXECUTIVE SUMMARY
2
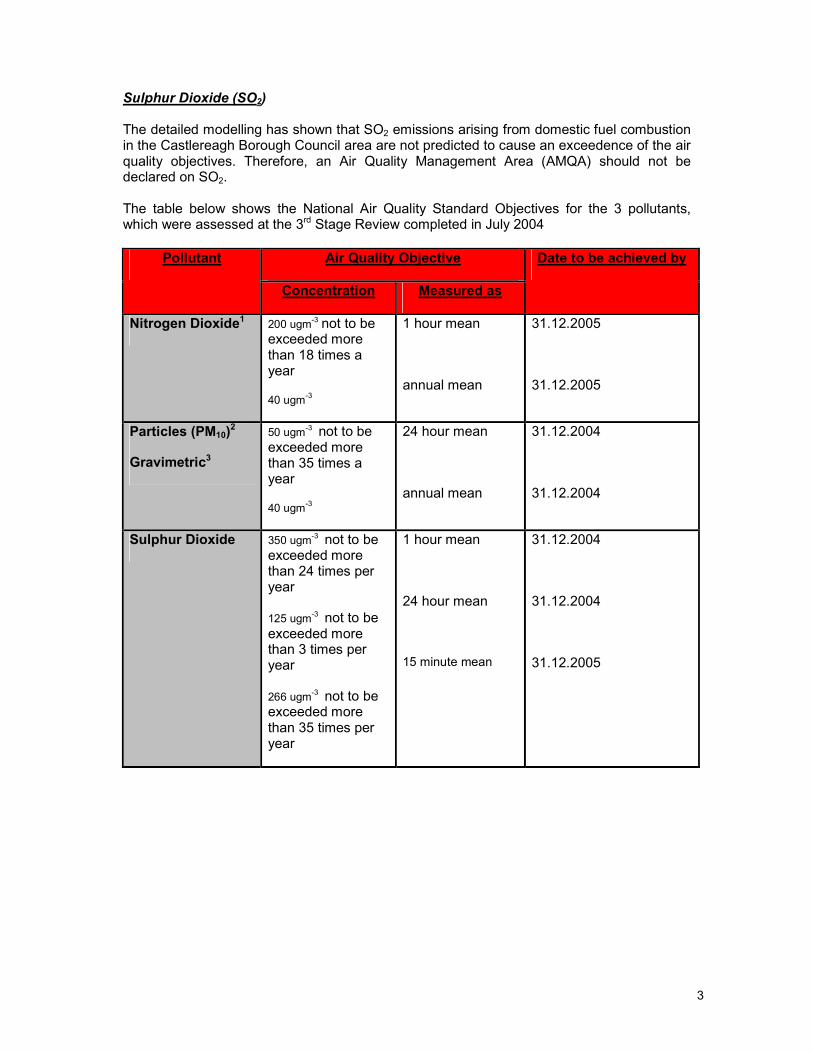
Sulphur Dioxide (SO2) The detailed modelling has shown that SO2 emissions arising from domestic fuel combustion in the Castlereagh Borough Council area are not predicted to cause an exceedence of the air quality objectives. Therefore, an Air Quality Management Area (AMQA) should not be declared on SO2. The table below shows the National Air Quality Standard Objectives for the 3 pollutants, which were assessed at the 3rd Stage Review completed in July 2004
Air Quality Objective Pollutant
Concentration Measured as
Date to be achieved by
Nitrogen Dioxide1 200 ugm-3 not to be
exceeded more than 18 times a year
40 ugm-3
1 hour mean
annual mean
31.12.2005
31.12.2005
Particles (PM10)2
Gravimetric3
50 ugm-3 not to be
exceeded more than 35 times a year
40 ugm-3
24 hour mean
annual mean
31.12.2004
31.12.2004
Sulphur Dioxide 350 ugm-3 not to be
exceeded more than 24 times per year
125 ugm-3 not to be
exceeded more than 3 times per year
266 ugm-3 not to be
exceeded more than 35 times per year
1 hour mean
24 hour mean
15 minute mean
31.12.2004
31.12.2004
31.12.2005
3

The progress report forms part of the Local Air Quality Management System (LAQM)
introduced in the Environment Northern Ireland Order and subsequent Regulations. The
progress report would help ensure continuity in resourcing air quality within local authorities
so as to maintain the capacity and skills required to manage LAQM.
Table 1 shows the different ways that progress reports will assist the local authorities with the
LAQM process.
Table 1 - How progress reports can assist local authorities
By helping retain a profile for LAQM within the authority, including the retention of staff with knowledge of air quality issues
By providing a means for communicating air quality information to members and the public.
By maximising the usefulness and interpretation of the monitoring effort being carried out by the local authority.
By maximising the value of the investment in monitoring equipment.
By making the next round of review and assessment that much easier, as there will be a ready available up-to-date source of information.
By helping authorities respond to requests for up-to-date information on air quality.
By providing information to assist in other policy areas, such as transport and land use planning.
By providing a ready source of information on air quality for developers carrying out environmental assessments for new schemes.
By demonstrating progress with implementation of air quality Action Plans and/or air quality strategies.
By providing a timely indication of the need for further measures to improve air quality, rather than delaying until the next full round of review and assessment.
Source: Progress Report Guidance LAQM.PRGNI (04)
1 INTRODUCTION
4

The overall aims of the progress report are to report progress on implementing local air
quality management and report progress in achieving or maintaining concentrations below
the air quality objectives. It is considered that these aims can be best achieved by addressing
new monitoring results and new local developments that might affect local air quality. The
last round of Review and Assessment was in July 2004. The Review and Assessment
concluded that there was not any air quality exceedences in Castlereagh Borough Council for
all seven pollutants. As a result there has not been any Air Quality Management Areas
declared in Castlereagh.
5

2.1 Passive Monitoring
Castlereagh Borough Council currently monitors Nitrogen Dioxide (NO2) at 5 sites (through
passive diffusion tubes) within the Local Authority Area. These sites are a mixture of urban
background, roadside and kerbside. Table 2.1 shows the different site types and a brief
description. The location plans for the different tubes can be found in Annex 1.
Table 2.1 - NO2 Tube Site Locations
Site number
Site address Site type Description
3 Everton Drive Urban Background
4 Downshire Park Urban Background
An urban location distanced from sources and therefore broadly representative of citywide background concentrations
1 Cregagh Road Kerbside
5 Upper Newtownards Road Kerbside
6 Newtownbreda Road Kerbside
Site sampling within 1m of the kerb of a busy road. The nearest relevant exposures are residential properties set back approximately 1 - 5 metres from the kerb.
Table 2.2 below shows the average nitrogen dioxide levels in micrograms per cubic metre
(ug/m3) for Castlereagh sites for the year 2002, 2003 and 2004, as well as the estimated values
for 2005 and 2010 using the conversion factor supplied in the technical guidance (LAQM.TG
(03).
Table 2.2 - Annual Nitrogen Dioxide levels for 2002/2003/2004/2005/and 2010
Site 2002 2003 2004 2005 2010
1 12.8 19.3 19.0 18.5 15.2
3 13.4 13.1 11.9 11.6 9.5
4 8.6 11.7 10.8 10.5 8.6
5 23.5 30.1 27.2 26.5 21.8
6 18.5 22.8 21.3 20.8 17.1
2 MONITORING RESULTS
6

The UK objectives give the annual mean for Nitrogen Dioxide to be at 40 ug/m3 at relevant
locations. Out of the sites in Castlereagh using the passive method of monitoring the last three
years of analysis have confirmed that the levels are significantly beneath that of the threshold,
this has been further illustrated in figure 2.1 highlighting that the greatest annual mean is that of
site 5 (Upper Newtownards Road) for 2003 which is 9.9 ug/m3 below that of the objective.
As can been seen from the estimated values for 2005 and 2010 there is a steady reduction in
the annual levels of NO2 over the 5 sites taking the monitored levels further away from the
national objective, this can be visualised in Fig 2.2 indicating that with regard to Nitrogen Dioxide
air quality is not deteriorating, even though traffic levels are increasing.
Laboratory bias has not been determined, as the tubes have been analysed in two different test
houses. There are insufficient results from co location tubes to determine bias. Castlereagh
Borough Council from May 2005 will implement three co location tubes at our automated Air
Quality Analyser to determine specific bias for our local air quality.
Figure 2.1 - Annual Nitrogen Dioxide Levels for 2002/2003/2004
0.0
5.0
10.0
15.0
20.0
25.0
30.0
35.0
ug/ m3
1 2 3 4 5
si t e s
NO2 Castlereagh Borough Council
annual mean 2002
annual meam 2003
annual mean 2004
40.0 Odj e c t iv e a nnua l me a n 4 0 ug/ m3
C r e ga gh Roa d Ev e r t on D r i v e D ownshi r e
P k .Ea st
Uppe r N ' a r ds Rd Ne wt ownbr e da
R d
7

8
Figure 2.2 - Annual Nitrogen Dioxide Levels for 2004/2005/2010
2.2 Automated monitoring
Castlereagh Borough Council also monitors local air quality through 2 automated air stations -
a roadside station which monitors for Nitrogen Dioxide (NO2) and particulate matter (PM10) and
an urban station which monitors for Sulphur Dioxide (SO2) and particulate matter ( PM10). The
location plans for the 2 different stations can be found in Annex 1.
Table 2.3 - Lough View Drive 2004 (This data is provisional from 01/09/2004 and as such is subject to further quality control)
POLLUTANT NO2 NOX PM10 Number Very High 0 - 0
Number High 0 - 0
Number Moderate 0 - 5
Number Low 7877 - 8138
Maximum 15-minute mean 222 µg m-3 898 µg m
-3 623 µg m
-3
Maximum hourly mean 128 µg m-3 789 µg m
-3 219 µg m
-3
Maximum running 8-hour mean 100 µg m-3 346 µg m
-3 68 µg m
-3
Maximum running 24-hour mean 71 µg m-3 210 µg m
-3 51 µg m
-3
Maximum daily mean 64 µg m-3 197 µg m
-3 44 µg m
-3
Average 25 µg m-3 48 µg m
-3 17 µg m
-3
Data capture 89.7 % 89.7 % 93.1 %
0.0
5.0
10.0
15.0
20.0
25.0
30.0
ug/m3
1 2 3 4 5
site
Projected NO2 CastlereaghBorough Council
annual mean 2004
annual mean 2005
annual mean 2010
40.0Odjective annual mean 40ug/m3
Cregagh Road Everton Drive Downshire Pk.East Upper N'ards Rd Newtownbreda Rd

NO2
150 µg/m³
Jan Feb Mar Apr May Jun Jul Aug Sep Oct Nov Dec
NOX
1000 µg/m³
PM10
300 µg/m³
9
Table 2.4
POLLUTANT AIR QUALITY
REGULATIONS (NORTHERN
IRELAND) 2003
EXCEEDENCES DAYS
Nitrogen Dioxide Annual mean > 40 µg m-3 0 -
Nitrogen Dioxide Hourly mean > 200 µg m-3 0 0
Nitrogen Oxides (NO2) Annual mean > 30 µg m-3 1 -
PM10 Particulate Matter
(Gravimetric)
Daily mean > 50 µg m-3 1 1
PM10 Particulate Matter
(Gravimetric)
Annual mean > 40 µg m-3 0 -
Figure 2.3 - Lough View Drive Air Monitoring Hourly Mean Data for 2004
Table 2.5 - Espie Way 2004 (This data is provisional from 01/09/2004 and as such is subject to further quality control)
POLLUTANT PM 10 SO 2
Number Very High 0 0
Number High 0 0
Number Moderate 0 0
Number Low 7966 34369
Maximum 15-minute mean 267 µg m-3 64 µg m-3
Maximum hourly mean 169 µg m-3 43 µg m-3
Maximum running 8-hour mean 78 µg m-3 23 µg m-3
Maximum running 24-hour mean 49 µg m-3 14 µg m-3
Maximum daily mean 43 µg m-3 13 µg m-3
Average 14 µg m-3 2 µg m-3
Data capture 91.0 % 99.9 %
PM10
200 µg/m³
Jan Feb Mar Apr May Jun Jul Aug Sep Oct Nov Dec
SO2
60 µg/m³
10
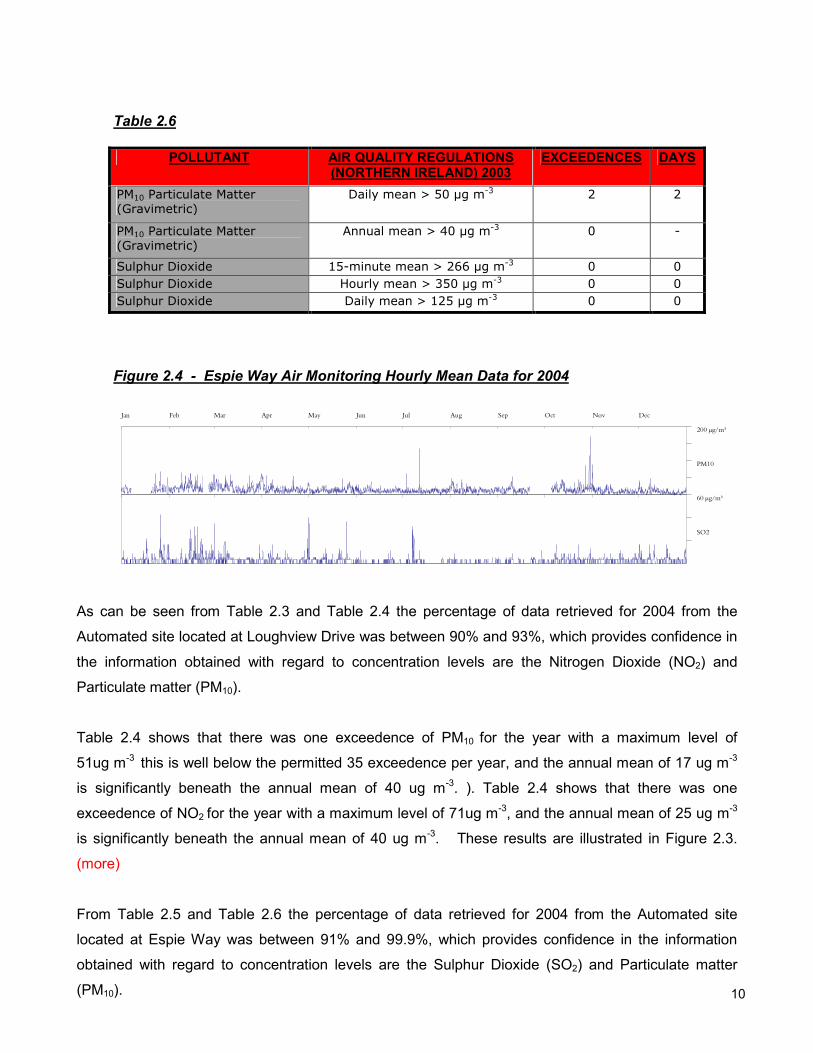
Table 2.6
POLLUTANT AIR QUALITY REGULATIONS (NORTHERN IRELAND) 2003
EXCEEDENCES DAYS
PM10 Particulate Matter
(Gravimetric)
Daily mean > 50 µg m-3 2 2
PM10 Particulate Matter
(Gravimetric)
Annual mean > 40 µg m-3 0 -
Sulphur Dioxide 15-minute mean > 266 µg m-3 0 0
Sulphur Dioxide Hourly mean > 350 µg m-3 0 0
Sulphur Dioxide Daily mean > 125 µg m-3 0 0
Figure 2.4 - Espie Way Air Monitoring Hourly Mean Data for 2004
As can be seen from Table 2.3 and Table 2.4 the percentage of data retrieved for 2004 from the
Automated site located at Loughview Drive was between 90% and 93%, which provides confidence in
the information obtained with regard to concentration levels are the Nitrogen Dioxide (NO2) and
Particulate matter (PM10).
Table 2.4 shows that there was one exceedence of PM10 for the year with a maximum level of
51ug m-3 this is well below the permitted 35 exceedence per year, and the annual mean of 17 ug m-3
is significantly beneath the annual mean of 40 ug m-3. ). Table 2.4 shows that there was one
exceedence of NO2 for the year with a maximum level of 71ug m-3, and the annual mean of 25 ug m-3
is significantly beneath the annual mean of 40 ug m-3. These results are illustrated in Figure 2.3.
(more)
From Table 2.5 and Table 2.6 the percentage of data retrieved for 2004 from the Automated site
located at Espie Way was between 91% and 99.9%, which provides confidence in the information
obtained with regard to concentration levels are the Sulphur Dioxide (SO2) and Particulate matter
(PM10).

11
Table 2.6 shows that there were two exceedences of PM10 for the year with a maximum level of
49ug m-3, these two exceedences are well below the permitted 35 exceedence per year, and the
annual mean of 14 ug m-3 is significantly beneath the annual mean of 40 ug m-3. ). Table 2.6 shows
that there was no exceedences of SO2 for the year with a maximum level of 13ug m-3, and the annual
mean of 2 ug m-3. These results are illustrated in Figure 2.4. (more)
In consultation with the helpdesk projecting the figures forward to 2005 and 2010 for PM10 would not
be required as we are beneath the 2010 objective already, Sulphur Dioxide is site specific and
therefore can not be estimated, however as our annual mean is so low, it is unlikely to be a significant
pollutant. The estimated values for Nitrogen Dioxide for 2005 and 2010 are 24.3 and 20.1
respectively, both of which are below the objective and show the trend in reduction similarly to the
passive monitoring.
2.3 Other Air Quality Data
Table 2.7 shows a list of air quality complaints that Castlereagh Borough Council’s Environmental Health team investigated in 2004, along with the number of abatement notices served. Table 2.7 - Breakdown of Air Quality Nuisance Investigations
TYPE NO OF COMPLAINTS NOTICES SERVED
Domestic Smoke Complaints 13 0
Commercial Smoke Complaints 7 0
Dust Complaints 0 0
Odour Industrial/ Commercial 4 0
Odour Domestic 4 0
Odour Agricultural 7 0
Odour cause unknown 3 0
Total 38 0
As can be seen from above air quality is generally perceived as good with in Castlereagh
Borough Council with few complaints received, and no notices having to have been served to
abate nuisance.

12
There are certain new developments that may affect the local air quality. Table 3.1 shows a list of
these developments. Some of these new sites are previously operational sites that have either moved
into the new PPC permitting regime or have recently been discovered, or by their sheer size may
impact on air quality.
Table 3.1 - New Developments with the potential to affect air quality
NEW LOCAL DEVELOPMENTS SITE LOCATION OTHER INFORMATION
Part A process (none)
Part B processes (2) Car sprayers
Dundonald Site was previously authorised, closed and was then reopened by a new operator.
Petrol Station Belvoir Site was previously authorised, closed and was then reopened by a new operator.
New retail development Belvoir Proposed
New road Scheme (none)
New mineral development (none)
New landfill development (none)
Carryduff Proposed
Dundonald Work has started
Castlereagh Continuation of existing site
Major New housing developments (4)
Castlereagh Proposed
3 NEW LOCAL DEVELOPMENTS

13
There are currently no action plans in Castlereagh Borough Council.
4 ACTION PLANS

Castlereagh Air Quality Strategy is currently going through its final draft and will be formally
released during the summer of 2004. Table 5.1 shows the summary section.
As the strategy is a working document for Castlereagh Borough Council consultation has
been limited to departments in Castlereagh Borough Council whose duties can affect air
quality and the elected members. The final version will be available on the Internet, and will
be open for public consultation.
Table 5.1 - Summary section of Castlereagh’s Air Quality Strategy 2005
Castlereagh’s air quality is currently within its target limits set by central government in the Air
Quality Strategy for England, Scotland, Wales and Northern Ireland published in January
2000. Therefore there have been no Air Quality Management Areas designated in
Castlereagh.
The aim of the Air Quality Strategy aim is therefore to keep air quality in Castlereagh below
these levels and to try to reduce the levels even further, whenever this is reasonably
practical.
Table 5.1 - Main Aspects of the Air Quality strategy
� The industrial processes authorised will continue to be regularly inspected and
their authorizations/ permits will be reviewed and varied as necessary. These premises continue to operate within the limits set by their authorisation/permit and in line with current Best Available Techniques (BAT).
• Nitrogen dioxide monitoring by diffusion tubes will continue to be used in
Castlereagh and this monitoring will be extended to areas where further monitoring will be beneficial.
• Automated air monitoring shall continue at the existing sites, co location tubes will
also be erected to confirm diffusion results.
• Castlereagh Borough Council will continue to consult with the planning service and
other external agencies with regards to planning applications for potentially pollution processes.
AIR QUALITY STRATEGY
14

• Castlereagh Borough Council’s Environmental Health Department will continue to
investigate complaints of smoke nuisances from both domestic and commercial properties. Should they witness any smoke nuisances they will take action as approved by Council.
• Castlereagh Borough Council will periodically review and update its smoke control
zones should this prove necessary.
• Castlereagh Borough Council Environmental Health Department will continue to
support and be an active member of the inter council and inter agencies for the routine consideration of current and potential air quality issues.
• Castlereagh Borough Council will continue to promote and encourage people to
reduce air pollution and develop ways to reduce traffic pollution.
• Castlereagh Borough Council will continue to educate its citizens, stakeholders
and businesses about air quality issues by different means including campaigns, leaflets and the Council Website.
• Castlereagh Borough Council will continue to be involved in partnerships with other
local authorities and agencies. Should any areas in Castlereagh require to be designated an Air Quality Management Area then a partnership shall be set up to include relevant local business, industry and the community.
15

Certain planning applications require further information supplied to the Environmental Health
Department in relation to their potential effect on the air quality before a consultation and comments
can be returned to the Planning Service before a decision is made. Table 6.1 shows a list of recent
applications that have had some air quality issues addressed in the application, the list also identifies
new developments at the planning stage that may have an impact on air quality.
Since the completion of the 3rd Stage Review this Department has addressed 39 different planning
applications highlighting the concerns regarding air quality. The concerns are forwarded to the
Planning Service at the time of consultation.
Table 6.1 - Planning Applications for which Air Quality Assessment is required
PLANNING APPLICATION LOCATION
Housing Carryduff
Housing Castlereagh
Housing Dundonald
New Shopping Centre Newtownbreda
Castlereagh Borough Council has various policies and have regard to policies, which all include ways
to help improve air quality. Table 6.2 shows a list of these policies and a brief description of how they
can improve air quality.
Table 6.2 - Policies Designed to Help Improve Air Quality
Local Agenda 21 Strategy
To promote sustainable development. Currently it may be integrated into the Community
Castlereagh Local Plan
To minimise adverse impacts of proposed development on the amenity.
Environment Strategy
To reduce to a minimum, emissions to air, water and land and reduce noise within the district.
Castlereagh Planning Strategy To ensure that new development does not exacerbate air quality in existing and potential Air Quality Management Areas (AQMAs); To seek to mitigate existing and potential air quality pollution problems
Belfast Metropolitan Area Plan The regeneration of areas of social need. Better integration between land use and transportation. Provide confidence for those wishing to develop.
Belfast Transport Area Plan To reduce the need to travel. To encourage the use of alternatives to the private car. To provide an efficient, safe and accessible transportation system.
6 PLANNING AND POLICIES
16

The monitoring of Nitrogen Dioxide (NO2) in Castlereagh show that the levels of NO2 are estimated
that they will be below the limits set by Government for both 2005 and 2010.
Castlereagh Borough Councils Air Quality Strategy is currently under draft form and is programmed
for release in the summer of 2005. While this strategy is only in draft form most of the strategies aims
are in progress. A multi-disciplined forum for air quality is currently being developed as part of the
Strategy.
There have been no new industrial processes opened in Castlereagh that may effect the air quality.
There have been some minor processes that have been discovered and are in the process of
obtaining permits. There are some processes that are moving into the Pollution Prevention Control
regime and this will be progressed as detailed in the guidance. There has not been any significant
increase in road traffic or any major new roads proposed. Planning applications are consulted and if
deemed necessary an air quality assessment is produced. Applications where air quality has been
considered all showed that air quality standards would not be exceeded.
There are various policies and strategies that have varying impacts on air quality. These policies and
strategies are updated periodically. Part of the multi-disciplined forum will be to help prepare
information for these reports, and this matter will be progressed once action plans are being
proposed.
MORE RQD
7 SUMMARY
17

APPENDIX
=
=
Appendices
CONTENTS
APPENDIX 1
AUTOMATIC MONITORING STATION DATA
APPENDIX 2
ALDERGROVE MET STATION DATA
APPENDIX 3
TRAFFIC DATA FROM OTHER LINKS/ROADS IN CASTLEREAGH/BELFAST
APPENDIX 4
MODEL VERIFICATION AND ADJUSTMENT

=
= = = = = = = = = = =
Appendix 1 Automatic Monitoring Station Data

=
= = = = = = = = = = =
CASTLEREAGH AMBIENT AIR MONITORING PROGRAMME
Castlereagh Borough Council has undertaken automatic ambient air monitoring of
NO2, SO2 and PM10 since September 2002. Monitoring is carried out at two different
locations: a roadside station measuring NO2 and PM10 (Castlereagh Lough View
Drive – 335749, 370711) and a suburban background station measuring SO2 and
PM10 (Castlereagh Espie Way – 337347, 371991). The instrumentation employed
uses UV fluorescence for the measurement of SO2, the TEOM technique for PM10,
and chemiluminescence for the measurement of NO2 these methods are appropriate
for Detailed Assessment under LAQM (LAQM TG(03)). All TEOM data are quoted as
gravimetric equivalent in accordance with the guidance.
Location of the Automatic Monitoring Stations in Castlereagh
Some data uncertainties and gaps have been overcome by comparing the data with
AURN stations located in Northern Ireland (Belfast Centre, Belfast East and Derry)
or by using an early period. Table A1.1 summarises the different cases:
Table A1.1 Summary of data verification and amendment
DATA REASON SOLUTION
Espie Way PM10 Low data capture
(66.8%)
Follow LAQM guidelines to obtain annual
average from a period of estimated mean
Espie Way SO2 Uncertainty on data Data from Sept 02 to August 03 used as
representative of 2003 data.
Lough View Drive PM10 and NO 2
Low data capture (75 and 63%)
Follow LAQM guidelines to obtain annual average from a period mean
1(i)

=
= = = = = = = = = = =
CASTLEREAGH ESPIE WAY AIR MONITORING
Table A1.2 - Air Quality Summary Statistics, Espie Way in 2003
POLLUTANT PM10 teom PM10 GRAVIMETRIC
SO2
Number Very High 0 0
Number High 0 0
Number Moderate 0 0
Number Low 5840 32877
Maximum 15-minute mean 165 µg m-3 112 µg m-3
Maximum hourly mean 68 µg m-3 93 µg m-3
Maximum running 8-hour mean 57 µg m-3 60 µg m-3
Maximum running 24-hour mean 44 µg m-3 44 µg m-3
Maximum daily mean 41 µg m-3 43 µg m-3
Average 14.5 µg m-3 19 µg m-3 4 µg m-3
Data capture 66.8 % 95.8 %
Note: A factor of 1.3 has been used to correct TEOM PM10 to gravimetric equivalent PM10
All mass units are at 20'C and 1013mb
Table A1.3 - Air Quality Exceedence Statistics, Espie Way in 2003
POLLUTANT AIR QUALITY REGULATIONS (NORTHERN IRELAND) 2003
EXCEEDENCES DAYS
PM10 Particulate Matter
(Gravimetric)
Daily mean > 50 µg m-3 4 4
PM10 Particulate Matter (Gravimetric)
Annual mean > 40 µg m-3 0 -
Sulphur Dioxide 15-minute mean > 266 µg m-3 0 0
Sulphur Dioxide Hourly mean > 350 µg m-3 0 0
Sulphur Dioxide Daily mean > 125 µg m-3 0 0
Sulphur Dioxide Annual mean > 20 µg m-3 0 -
Note: A factor of 1.3 has been used to correct TEOM PM10 to gravimetric equivalent PM10
(GR10 in Table A1.2)
1(ii)

=
= = = = = = = = = = =
PM10
80 µg/m³
Jan Feb Mar Apr May Jun Jul Aug Sep Oct Nov Dec
SO2
100 µg/m³
HOURLY MEAN DATA FOR 01 JANUARY TO 31 DECEMBER 2003
SO2 data from Espie Way compared to AURN Stations in Belfast
PM10
SO 2 SO 2
SO 2
SO 2
Belfast Centre
Belfast East
Espie Way
Data remains provisional
Period used for modelling verification
1(iii)

=
= = = = = = = = = = =
PM10 data from Espie Way compared to AURN Station in Belfast and Derry
Belfast Centre
Derry
Espie Way
1(iv)

=
= = = = = = = = = = =
CASTLEREAGH LOUGH VIEW DRIVE AIR MONITORING
Table A1.4 - Air Quality Summary Statistics, Lough View Drive in 2003
POLLUTANT PM10 NOX NO2
Number Very High 0 - 0
Number High 0 - 0
Number Moderate 4 - 0
Number Low 6619 - 5507
Maximum 15-minute mean 144 µg m-3 651 µg m-3 163 µg m-3
Maximum hourly mean 83 µg m-3 556 µg m-3 149 µg m-3
Maximum running 8-hour mean 57 µg m-3 273 µg m-3 119 µg m-3
Maximum running 24-hour mean 51 µg m-3 225 µg m-3 92 µg m-3
Maximum daily mean 47 µg m-3 205 µg m-3 80 µg m-3
Average 18 µg m-3 64 µg m-3 34 µg m-3
Data capture 75.7 % 62.9 % 62.9 %
Note: A factor of 1.3 should be used to correct TEOM PM10 to gravimetric equivalent PM10
All mass units are at 20'C and 1013mb
Table A1.5 - Air Quality Exceedence Statistics, Lough View Drive in 2003
POLLUTANT AIR QUALITY REGULATIONS (NORTHERN IRELAND) 2003
EXCEEDENCES DAYS
PM10 Particulate Matter
(Gravimetric)
Daily mean > 50 µg m-3 9 9
PM10 Particulate Matter
(Gravimetric)
Annual mean > 40 µg m-3 0 -
Nitrogen Oxides (NO2) Annual mean > 30 µg m-3 1 -
Nitrogen Dioxide Annual mean > 40 µg m-3 0 -
Nitrogen Dioxide Hourly mean > 200 µg m-3 0 0
1(v)

=
= = = = = = = = = = =
PM10
100 µg/m³
Jan Feb Mar Apr May Jun Jul Aug Sep Oct Nov Dec
NOX
600 µg/m³
0
NO2
150 µg/m³
PM10
NOx
NO2
1(vi)
=
= = = =
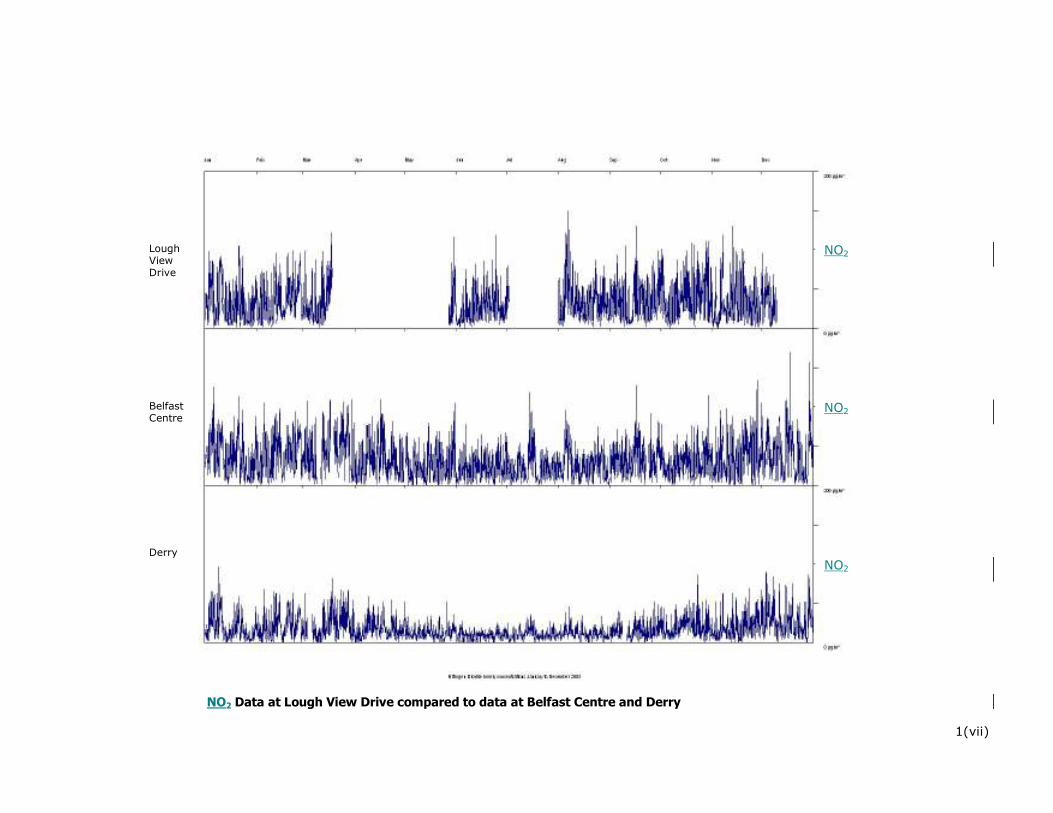
NO 2 Data at Lough View Drive compared to data at Belfast Centre and Derry
NO 2
NO 2
NO 2
Lough View Drive
Belfast Centre
Derry
1(vii)

=
= = = =
NOx Data at Lough View Drive compared to data at Belfast Centre and Derry
NOx
NOx
NOx
Lough View Drive
Belfast Centre
Derry
1(viii)

=
= = = =
PM10 Data at Lough View Drive compared to data at Belfast Centre and Derry
PM10
PM10
PM10
Lough View Drive
Belfast Centre
Derry
1(ix)

=
Appendix 2 Aldergrove Met Station Data

=
#
0
0
3
1.5
6
3.1
10
5.1
16
8.2
(knots)
(m/s)
Wind speed
0° 10°20°
30°
40°
50°
60°
70°
80°
90°
100°
110°
120°
130°
140°
150°
160°170°180°190°
200°
210°
220°
230°
240°
250°
260°
270°
280°
290°
300°
310°
320°
330°
340°350°
100
200
300
400
500
Figure A2- Location of Aldergrove Station
Table A2 - Characteristics of Aldergrove Station
Wind rose for the Aldergrove 2003 met data
Description – Aldergrove International airport
DCNN 9142
Eastings 314700
Northings 379800
Latitude Deg Min 54 39 N
Longtitude Deg Min 06 13 W
Station height AMSL (m) 68
Effective height of anemograph (m) 10
2(i)

=
Appendix 3 Traffic Data from other Links/
Roads in Castlereagh and Belfast

=
3(i)
Grid Ref No
Road
Location
Direction
24 Hr 2-
Way Flow
Year
32973697 M1 Blacks Road On Slip To Belfast 15065 2002
32983696 M1 Blacks Road Off Slip To Blacks Road 14119 2003
33083713 M1 At Stockmans Lane Bridge To Belfast 52390 2001
33173725 M1 Stockmans Lane to Broadway To Belfast 65152 2002
33263735 Westlink At Roden Street To City Centre 60308 2001
33353751 Westlink At Clifton Street (Southbound) Towards M1 33894 2002
33353752 Westlink At Clifton Street (Northbound) Towards M2 41140 2002
33153708 Lisburn Road At Kings Hall To City Centre 12381 2002
33733756 Sydenham By-Pass East of Airport Entrance To Belfast 53956 2002
33823726 Knock Road At Shell Service Station To Upper Knockbreda 38812 2002
33893743 Hawthornden Way At Campbell College To Parkway 27772 2002
33503725 Ravenhill Rd South of Broughton Gardens To Belfast 20717 2003
33333732 Donegall Road West of Sandy Row To City Centre 12371 2002
33723741 Upper Newtownards Rd Opposite Fire Station To City Centre 22275 2001
33443726 Ormeau Road North of Ormeau Bridge To City Centre 29602 2000
33443743 Oxford Street Opposite Court House To East Bridge Street 33998 2000
33423744 Victoria Street At Marlborough Street To Dunbar Link 38401 2000
33413739 May Street West of Montgomery Street To City Hall 21820 1999
33453744 Queen's Bridge Bridge End (In) To City Centre 18225 2000
33453744 Station Street Flyover Bridge End To Bridge End 10380 2000
33473739 East Bridge Street Albert Bridge To City Centre 29844 2002
33413741 Chichester Street At Multi Storey Car park To Victoria Street 14009 2000
33293738 Grosvenor Road West of Westlink To City Centre 17655 2002
33323744 Westlink At Divis Street (To M2) Towards M1 42111 2000
33323744 Westlink At Divis Street (To M1) Towards M2 45547 2000
33693744 Holywood Road West of Pomona Avenue To City Centre 17449 2002
33413750 Nelson Street At Little Patrick Street To City Centre 6655 2001
33453755 Garmoyle Street North of Dock Street To Corporation Street 14366 2001
33563744 Newtownards Road At Belvoir Street To City Centre 18483 2002
33593740 Albertbridge Road East of Templemore Street To City Centre 22163 2002
33423711 Annadale Embankment At Deramore High School To Kings Bridge 14820 2002
33543689 Saintfield Road South of Lenaghan Avenue To City Centre 24885 2002
33503706 Saintfield Road North of Church Drive To City Centre 23831 2001
33913739 Upper Newtownards Rd Near Cabinhill Park To City Centre 34468 2000
33153708 Lisburn Road At Kings Hall South Slip To Balmoral Avenue 12664 2002
33163709 Lisburn Road At Kings Hall North Slip To City Centre 12730 2002
34073739 Upper Newtownards Rd At Dundonald Cemetery To Belfast 37530 2002
32803675 Queensway At Derriaghy Cricket Club To Belfast 11128 2002
33443759 Duncrue Street South of Milewater Road To Garmoyle Street 5212 2002
33733737 North Road South of Kirkliston Drive To Grand Parade 14603 2002
33403723 Stranmillis Embankment Kings Bridge to Ormeau Bridge To Ormeau Bridge 7701 2002
33413721 Annadale Embankment Kings Bridge to Ormeau Bridge To Ormeau Bridge 10257 2002
33463729 Ormeau Embankment Ravenhill Road to Ormeau Road To Ormeau Road 12111 2002
33423754 York Street South of Brougham Street To York Road 18861 2002
33063696 Finaghy Road South - To Upper Malone Road 12918 2002
33023703 Finaghy Road North - To Upper Lisburn Road 11208 2001
33643680 Knockbracken Road - To Saintfield Road 3297 2002
33503743 Short Strand South of Mountpottinger Link To City Centre 27054 2002
33503743 Mountpottinger Link At Bus Depot To City Centre 7600 1999
33,423,753 York Street (Off) To Nelson Street 47158 2002
33423753 M3 M2 ONSLIP - 63453 2003
33623674 Saintfield Road At Ivanhoe Inn To City Centre 32886 2002

=
Appendix 4 Model Verification and Adjustment

= =
Data from the two monitoring stations in Castlereagh BC has been used to verify and adjust the
output results from DISP and LADSUrban models. The data used are:
� Castlereagh Espie Way (PM10 and SO2)
� Castlereagh Lough View Drive (PM10 and NO2)
NOX/NO2 VERIFICATION AND ADJUSTMENT
NOx-NO2 data from Lough View Drive roadside has been use to verify and adjust the model
results at Castlereagh Lough View Drive. As covered in Appendix 1, the NOx-NO2 data capture for
2003 in Lough View Drive was of 60%. In order to verify whether this result could be applied as
representative of the full dataset for 2003, the data was compared to Belfast Centre and Derry.
As specified in LAQM.TG(03), NOx-NO2 period averages from the two AURN station have been
compared to NOx-NO2 annual averages. Table A4.1 shows the corrected NOx-NO2 annual
average (NOx annual = 61 and NO2 annual = 33).
Table A4.1 - Corrected NOx-NO2 Annual Averages at Lough View Drive PERIOD/ANNUAL BELFAST
CENTRE AM/PM DERRY AM/PM LOUGH VIEW
DRIVE RA LOUGH VIEW DRIVE
ANNUAL 2003
NO2 period (Pm) 33 17 34
NO2 2003 (Am) 32 0.970 17 1.000 0.985 33
NOx period (Pm) 61 27 64
NOx 2003 (Am) 59 0.967 25 0.0926 0.946 61
(see LAQM.TG(03))
NOX
Rural background NOx levels of 25ugm-3 has been added to a modelled NOx (38ugm-3) given a
value of total NOx of 63ugm-3. This is very close result compared to the annual measured result
at Lough View Drive of 61 ugm-3.
NO2
NO2 road contribution has been calculated from the modelled NOx (38umg-3) road contribution
following recommendations in LAQM.TG(03). NO2 road contribution is of 9 umg-3. This added to
a background annual mean of 20ugm-3 gives a total modelled NO2 result of 29ugm-3. Therefore,
the following correction factor has been used:
NO2 monitoring data = backgroundNO2 + Modelled result + 4 [Annual mean]
SO2 VERIFICATION AND ADJUSTMENT
Annual average rural SO2 background was obtained from 1kmx1km maps (4 ugm-3). The
modelled contribution at the Espie Way monitoring station was of 3 ugm-3. Therefore, the
modelled results at Espie Way was of 7 ugm-31.
1 Please note that the monitoring data of SO2 for 2003 runs from September 2002 to August 2003. This is due to the 2003 data remains provisional pending engineers reports on the data compared to other SO2 concentrations across Northern Ireland
4(i)

= =
Table A4.2 - SO2 Model Verification BACKGROUND MODELLED CONTRIBUTION FINAL MODELLED
4 + 3 = 7
SO2 monitoring data = backgroundSO2 + Modelled result [Annual mean]
Pye and Vincent (2003) relationships from short-term concentration and annual mean were
obtained (see table A4.3). These following multipliers have been applied to adjust modelled
concentrations 15 minutes, hourly and daily with monitoring results
SO2 monitoring data = Modelled result x 1.18 [15min 99.9%ile] SO2 monitoring data = Modelled result x 1.07 [1-hour 99.7%ile] SO2 monitoring data = Modelled result x 1.80 [24-hour 99.189%ile]
:
Table A4.3 - SO2 Model Verification for short term concentrations
SHORT TERM CONCENTRATION MODELLED (USING PYE AND VINCENT, 2003)
MEASURED AT ESPIE WAY
MULTIPLIER
15 minute mean - 99.9th percentile 85.6 101 1.18
1 hour mean - 99.7th percentile 64.6 69 1.07
24 hour mean – 99.18th percentile 23.3 42 1.80
PM10
PM10 data from both monitoring stations have been used to verify and adjust model results. As
the data capture was below 90%, the data obtained from a period of monitoring, has been
converted to full 2003 following recommendations in the LAQM.TG(03). Table Table A2.1 show
the results obtained at both monitoring stations. The PM10 results from DISP do not have to be
adjusted as background plus DISP is equal to the monitoring data. However, the LADSUrban
results have to be adjusted by a factor of 2.25. This factor of 2.25 is probably due to
resuspention of dust which is not taken into account in LADSUrban. Table A4.1 - Corrected NOx-NO 2 Annual Averages at Lough View Drive
PERIOD/ANNUAL BELFAST CENTRE
AM/PM DERR
Y AM/PM LOUGH VIEW DRIVE RA LOUGH VIEW DRIVE
ANNUAL 2003
PM10 period (Pm) 19.0 19.1 17.7
PM10 2003 (Am) 18.5 0.974 18.1 0.948 - 0.961 17 (22.1 in grav)
Perid/Annual Belfast Centre
Am/Pm Derry Am/Pm Espie Way Ra Lough View Drive Annual 2003
PM10 period (Pm) 18 17.3 14.2
PM10 2003 (Am) 18.5 1.027 18.1 1.046 1.036 14.7 (19.1 in grav)
*Teom data (need to multiply it by a factor of 1.3 to obtain gravimetric)
4(ii)

= =
Table 3.1 - Summary of model bias correction
MONITORING
DATA 2003 BACKGROUND (FROM NAEI)
DISP (DOMESTIC FUEL)
LADSURBAN (ROAD EMISSIONS)
ADJUSTMENT
FACTOR
Espie Way
BACKGROUND 19.1 µg m-3 18 µg m-3 1.1 µg m-3 0 µg m-3 No factor
necessary
Lough View Drive
ROADSIDE
22.1 µg m-3 18 µg m-3 0.5 µg m-3 1.6 µg m-3 21.3=18+0.5+(1.6*2.25)
4(iii)