Air Quality School Toolkit - Oxford City Council
110
2 Air Quality School Toolkit Building a world-class city for everyone
-
Upload
khangminh22 -
Category
Documents
-
view
3 -
download
0
Transcript of Air Quality School Toolkit - Oxford City Council

2
Air Quality School Toolkit
Building a world-class city for everyone

Contents Section 1: Introduction ............................................................................................ 1
What is the main air pollutant in Oxford? ................................................................ 1
What is being done by the local authorities? .......................................................... 1
What is the STOP Project and what are its aims? .................................................. 1
Section 2: The STOP Project AQ Toolkit ................................................................ 3
What is Citizen Science? ........................................................................................ 3
How to deliver the STOP Project toolkit? ................................................................ 3
How does the AQ Toolkit link with the National Curriculum? .................................. 4
Timelines ................................................................................................................ 4
Section 3: Structure ................................................................................................. 6
Part 1: Introducing Air Quality and planning an investigation .................................. 6
Part 2: Investigating air quality .............................................................................. 12
Part 3: Analysing the data ..................................................................................... 13
Part 4: Action planning .......................................................................................... 15
Part 5: Taking action ............................................................................................. 17
Part 6: Evaluating success ................................................................................... 18
Section 4: Citizen Science Activities .................................................................... 19
a) Lichen Bio-Indicator Study .......................................................................... 20
b) Diffusion Tube Samples .............................................................................. 25
c) Ozone Badges ............................................................................................ 35
d) Surface Wipe Analysis ................................................................................ 39
e) Running Campaigns in School .................................................................... 45
Section 5: Extra Activities ..................................................................................... 53
Extra Activities – Key Stage 1 (Year 1) ................................................................. 54
Extra Activities – Key Stage 1 (Year 2) ................................................................. 60
Extra Activities – Key Stage 2 (Year 3 & 4) .......................................................... 64
Extra Activities – Key Stage 2 (Year 5) ................................................................. 71
Extra Activities – Key Stage 3 (Year 7 & 8) .......................................................... 76
Section 6: Helpful links and further resources .................................................. 106

1
Section 1: Introduction Impact on human health is the primary reason for efforts to improve air quality in the UK. Every year thousands of people in the UK are known to die prematurely due to the effects of air pollution. Thousands more have to be admitted to hospital. Most healthy adults are unlikely to be affected by the levels of air pollution normally found in the UK. However, some sections of society are more vulnerable to negative impacts of air pollution. Those most at risk are the young, the elderly and those who are already suffering from existing lung and heart conditions.
What is the main air pollutant in Oxford? To find what our air quality is like, we need to measure the concentration of pollutants (harmful gases and dust) in the air. Air quality is measured by monitoring stations across Oxford, and the results can be viewed online at https://oxfordshire.air-quality.info/ In Oxford, the pollutant of most concern is nitrogen dioxide (NO2). Nitrogen dioxide is a harmful gas produced by burning fossil fuels. Petrol and diesel fuels used in car engines are one of the biggest sources of NO2, so levels are highest near roads. Other sources include burning of coal and gas in power stations to produce electricity and gas boilers used for heating. NO2 can make it harder to breathe and can damage people’s lungs if they are exposed to it for a long time. NO2 particularly affects children, and people who already have breathing problems such as asthma.
The whole of Oxford is declared an Air Quality Management Area (AQMA) as the city fails to meet the annual mean objective for nitrogen dioxide (NO2) of 40 µg/m
3.
What is being done by the local authorities? In order to help tackle air pollution, the City Council have introduced the first extensive Low Emission Zone outside of London; launched the Oxfordshire Air Quality website to make historic and real time air quality data more readily accessible; increased the number of diffusion tube monitoring locations in the city by 50% from January 2015; launched Oxford Park and Pedal which has seen over 100 cycle parking spaces introduced at two of our park and ride sites; and expects to implement the worlds very first zero emission zone in the city centre, starting in 2020. However there is still more to do in order to reduce the air pollution we all face every day and we all play a role in helping to tackle it.
What is the STOP Project and what are its aims? The STOP project was created by Oxford City Council with the aim of raising awareness of the main sources and health effects of air pollution emissions among the school community.

2
The main objectives of the project are: It is expected that this initiative can contribute to the behavioural change that is needed to tackle air pollution. Every day decisions can have an impact on the air we breathe and we all have a role to play and we can all be part of the solution.
To increase awareness and understanding of air pollution issues amongst pupils, parents, teachers and school governors
To empower the entire school community to adopt less polluting behaviours such as walking to school – and to encourage others to do the same
To reduce car idling activities around sensitive areas
To increase cycling; and the use of public transport.

3
Section 2: The STOP Project AQ Toolkit This air quality toolkit provides science teachers with a series of interesting scientific activities to present to pupils, which are expected to promote understanding of the causes and impacts of air pollution, as well as tools to identify areas of poor air quality around the school. It is expected that the use of this air quality toolkit will:
This STOP Project toolkit has been adapted from:
A similar initiative previously developed by London Sustainability Exchange for schools around London area, and supported by Transport for London, the Mayor of London and Cleaner air for London.
Educational packages provided by Deliver Change Ltd. It is expected that the citizen science activities presented in this toolkit will help raise awareness and assist in reducing children’s exposure to air pollutants, within the school and through their travel in the city of Oxford.
What is Citizen Science? Citizen science is a fun and interesting way of getting people involved in understanding and tackling environmental issues. By collecting scientific data we can better understand an issue like poor air quality.
How to deliver the STOP Project toolkit? This toolkit includes a number of different science activities and experiments for your school to carry out as part of an air quality project. These can be integrated into a lesson, or completed as part of an extracurricular activity with an environment club, Green Team or Eco-committee. The full programme could be extended across a year group, or even as a whole school initiative with different classes and year groups carrying out different activities as part of a themed term or year.
Citizen Science and air quality activities can be of particular benefit to school children, because of their links to the National Curriculum. The following programme of activities
Provide tools to identify areas of poor air quality around your school
Promote pupil understanding of the causes and impacts of air pollution
Give ideas for engaging staff, pupils and parents/carers in improving air quality
Help to reduce children’s exposure to air pollutants, within the school
and through their travel.

4
can be used together or individually to introduce issues of air pollution to children, and to better understand the causes of pollution and how to effect change.
How does the AQ Toolkit link with the National Curriculum? This Toolkit develops key concepts and skills which are fundamental to curriculum subjects, including:
• Science: planning and carrying out scientific investigations; gathering, analysing
and evaluating evidence; generating and testing theories; and communicating scientific information.
• PSHE/Citizenship: recognising that individual choices and behaviour can affect
issues and political and social institutions; researching, debating, talking and writing about their own and others’ viewpoints on issues that affect themselves and society; and playing an active role as citizens, making real choices, participating in decision making and leading a healthier, safer lifestyle.
• English: developing skills of speaking, listening, reading and writing for a
purpose, investigating, planning, predicting, debating, and communicating to the wider community in the context of an issue which is real, relevant and motivating.
• Geography: undertaking a geographical enquiry, asking geographical questions,
collecting and recording evidence, recognising how people can improve or damage the environment, explaining their views on a geographical issue, identifying opportunities for their own involvement in managing environments sustainably and communicating in ways appropriate to the task and audience.
• ICT: developing research skills, preparing and interpreting information using ICT,
presenting information via desk-top publishing or multi-media presentations, sharing information via the internet.
Timelines The timeline below is an example and illustrates how this toolkit can be used as part of a 12 week programme investigating air quality. This shows how it is possible to carry out the programme over the course of a single term, but some schools may find it beneficial to spread the activities over a full academic year.
This would also have the added benefit of continually reinforcing messages about air pollution and sustainable travel, encouraging more staff and parents to take up sustainable travel over time. The City Council is happy to contribute to this activity by ordering and providing diffusion tubes and ozone badges* for activities B and C, as well as providing an air quality presentation for pupils at for example an Assembly related to air quality or on a day and time to be agreed with the school. * Contribution only available for schools enrolled in the STOP Project

5
Table 1: Example of possible timeline for the delivery of Oxford City Council’s Primary school Air Quality toolkit
Week 0 1 2 3 4 5 6 7 8 9 10 11 12
Lessons Teacher Preparation
Introduce Air Quality & Plan an Investigation
Investigating Air Quality Analysing data
Action Planning
Taking Action
Evaluating Success
Citizen Science Activities
Diffusion tubes Put Out Collect
Analyse Results
Surface Wipes
Ozone Badges
Lichen Study
Social Marketing Activities
Badges Competition Manufacture
Moth pledges
Other activities (Plays, AQ champions, poster & story competitions, letters to MP, etc)
Optional Surveys
Idling Survey 2nd Survey
Travel Questionnaire
2nd Survey
Evaluation Evaluate results
Present problem/Findings
Assembly 1 Air Quality
Officer
Assembly 2 –Findings presented by pupils

6
Section 3: Structure The following section introduces a six-part procedure, recommended to be followed by teachers for the implementation of the citizen science activities available in section 4.
Part 1: Introducing Air Quality and planning an investigation Objectives Pupils will learn how to:
• Make predictions
• Ask scientific questions
• Plan how to answer their questions
• Decide what kind of evidence to collect
• Use large-scale maps
• Research and discuss topical issues.
National Curriculum links
- Science SC1: 1b, 2a, b, - Geography 1a, 2c, 6a, e - PSHE/Citizenship 1a, c, 2a, 3a, - English Speaking and Listening 2a, b, e, 3a, b, c, d, f, 10b
Resources needed
- Air pollution Lesson Sheet (below)
- A big large-scale map of the area around the school (e.g. projector showing a Google Maps with a radius of approximately 500m around your school)
- Copies of large scale A4 maps showing the same area around the school (e.g. printouts from Google maps) – one for each group of 4-5 pupils
- Red and green sticky dots for each group
- You will need to decide in advance which of the Citizen Science methods of data-gathering you will be using in the next session and, if necessary, order the equipment (see “Section 4: Citizen Science Activities “, below).
Introduction Tell the class that they will be investigating air quality. Explain what this means. Explore types of pollution, causes and health effects (Use air pollution sheets 1 and 2 - below for support). Ask pupils:
How they think air quality might be different on a busy road and in a quiet area away from traffic

7
• To turn their predictions into a scientific question that can be investigated
• How they think they could find an answer to their question.
Tell them some of the ways that air quality can be measured (relating them to their suggestions) and the method they will be using in the next session.

8

9
Air Pollution Lesson Sheet What is air pollution?
Air pollution is anything that causes the air to become contaminated with pollutants at levels harmful to our health or the environment.
What makes the air dirty?
Generally, air pollution comes from the burning of fossil fuels such as coal, oil, natural gas, petrol or diesel. This happens when we use energy supplies to do everyday activities, such as cooking or washing at home and traveling by cars. The UK has suffered from air pollution since the beginning of the industrial revolution in the 18
th
century. Smoke and fog create “smog” which makes it really hard to breathe and see clearly. More than 4000 people died in London in the great London smog in 1952! Industrial processes and domestic heating were the main contributors to air pollution back then, and until the 1970s. Air pollution today
Today, when we think about air pollution, we should think of transport, especially cars. Today there are about 23 million vehicles on the road in Britain, and 20 million of them are cars!. The fuel they use – petrol and diesel – cause bad gases to be ejected from the exhaust. These gases can be very dangerous for children.
Health Alert – how does air pollution affect you?
Air pollution is known to cause breathing problems, lung and heart diseases, such as asthma. Children are particularly at risk, as your bodies are less resilient and the pollutants have a more concentrated effect. Air pollution can:
Affect your immune system, so that you can catch infections more easily
Make you cough, splutter, wheeze, sneeze, dizzy and it can make your eyes itch
Give you green snot, and more bogeys than your nostrils have space for
Pollution can be blamed for an estimated 276 premature deaths (Age 25+) in Oxfordshire and innumerable serious health incidents requiring hospital admission each year.
What are the pollutants?
Most pollutants are much too small to see without a microscope, but they still get into our lungs and affect our health. The main nasty pollutants in the UK are NO2 and PM:
NO2 – Nitrogen dioxide: also contributes to acid rain, which damages trees and the stone of buildings. You can see the effect of NO2 on a hot day in summer, when it combines with other chemicals to make the sky look heavy and brownish grey. PM – Particulates: tiny particles of dust and soot that are released into the air. When you breathe them in, they settle in the lower parts of your lungs. There are natural sources of particulates. However, the biggest source is attributed to traffic. Lorries and diesel vehicles produce the most particulates in cities.

10
Everyone can help make our air cleaner!
Travel to school
Walk, cycle or scooter to school! It is a good exercise and can reduce air pollution.
Use public transport: take the bus, tube or train instead of the car.
If you have to travel to school by car, try car-sharing with other friends
No Idling
If you have to be picked up by car, tell your parents not to leave the
engine on while they wait for you. This is called “idling” and it is a
big cause of air pollution around schools. Turning off the engine
could reduce air pollution and also save your parents money.
You can design signs and posters to tell people “no idling” around
your school.
Spread the word!
Discuss air quality issues with your teachers, friends and family.
Make sure everyone you know is aware of the dangers of air pollution.
Promote sustainable travel
Encourage your children and their friends to walk and cycle.
Encourage friends and family to walk and cycle or car-share.
Reduce the amount your family uses the car.
Discuss air quality issues with your school, friends and family.
If you must drive
Fully inflate car tyres so your car uses less petrol.
Switch the engine off while waiting for your children after school.
Ensure that you have your vehicle serviced at regular intervals.
Try to use your car less frequently to reduce pollution, particularly for journeys under 2km.
Don’t start your engine until you are ready to travel. Turn the engine off if you are waiting or
stuck in a traffic jam.
Avoid rapid acceleration and heavy braking: they both increase fuel consumption and air
pollution.
Stay within the speed limit: you use 30% more fuel to travel the same distance at 70 mph
instead of 50 mph.
Actions CHILDREN can take
Actions PARENTS & TEACHERS can take

11
Group activity Ask pupils to work in groups of 4-5. (If time is limited you can do this as a class activity and miss out the feedback stage below). Give each group a large-scale A4 map of the area around the school and some red and green stickers. Ask them to discuss in their groups where they think the air will be most polluted and why. They should mark these places on the map with a red dot. They should then discuss where they think the air will be cleanest and mark these on the map with a green dot. Class discussion Ask one group to tell the class one of the places where they thought the air would be most polluted and why. Did the other groups agree? Mark this place with a red dot on a large map displayed at the front of the class. Then ask the next group to say a different place and repeat the process until all the most polluted places have been marked. Now do the same with the least polluted places. Mark these with green dots. As a class, choose 6-8 places near to the school for investigation during the next session. Make sure these include a range of sites e.g. busy and quiet roads, inside school grounds away from roads, next to traffic lights, at school gates, in car park (or identify sites as suggested in the instructions for the chosen method of data-gathering). Give each site a name or number so that data can be easily referenced back to the map.
CLASS DISCUSSION

12
Part 2: Investigating air quality Objectives
Pupils will learn to:
• Collect scientific evidence
• Use scientific equipment
• Carry out fieldwork investigations
• Make a labelled field sketch.
National Curriculum links
Science SC1: 1b, 2e, f Geography 1b, 2b, 7c Resources needed:
- Activity sheets and worksheets for your chosen method of data-gathering (see
Section 4: Citizen Science Activities“ below).
Class/group activity
- Carry out your chosen method of data-gathering as advised in the relevant
Toolkit Resources. - Ask pupils to do a labelled field sketch of the place or places where they carry out
their data gathering. Some of the data-gathering methods will need two sessions – see instructions for each method.

13
Part 3: Analysing the data Objectives
Pupils will learn to:
• Draw conclusions from scientific data
• Recognise patterns
• Communicate data appropriately
• Recognise how people can improve or damage their environment
• Make informed choices
• Identify problems and suggest solutions.
National Curriculum links
Science SC1: 1b, 2h, i, j, k, l, Geography 1c, 2e, f, g, 3e, 5a, b, 6a, e PSHE/Citizenship 1a, c, 2a, 3a, e, English Speaking and Listening 2a, b, e, 3a, b, c, d, f, 10c ICT 1a, b, c Resources needed
- Data gathered in previous session or analysis from lab (as appropriate); - Equipment for chosen method of presenting data, e.g. plain and graph paper,
computers;
- Scrap paper and pencils for group note-taking;
- Large sheet of paper.
Introduction
Present the data analysis to the class, or ask groups to present their data, depending on data-gathering method used in Part 2. Class discussion
Discuss the results:
- What did pupils notice?
- In what kinds of places is the air most polluted?
- Did the evidence confirm or disprove their predictions?
- Did anything surprise them?
- What do they think happens when people breathe in air in the most polluted places?
- What could be done to reduce the amount of pollution in the air? - What could they do to limit their exposure to air pollution?

14
The class should decide on the most appropriate way of presenting the data, e.g. displayed around their ‘prediction’ map, on a sketch map of the area, in a graph or spread sheet - this could then be done as a class, group or individual activity. Group activity
In groups of 4 or 5, ask pupils to make a list of recommendations based on their findings. These could include:
- Long term (e.g. to reduce traffic, redesign engines to use less petrol, promote electric cars)
- Medium term (e.g. campaign to reduce idling outside school gates, develop a school travel plan)
- Short term (e.g. take a different route to school).
The groups should also think about who would be responsible for carrying out each of their recommendations (e.g. government, car manufacturers, the school, parents, children).
Take feedback from the groups and write up a class list of recommendations on a large sheet of paper. This should be kept for the next session. Extensions
1) Pupils could gather more evidence before finalising their recommendations, e.g.:
• Carry out traffic surveys • Survey and time engines left idling in particular places • Interview passers-by for their opinions on the issue of air pollution.
2) Pupils could investigate air quality on the internet, e.g.:
• compare their data to air quality information for other parts of Oxford on https://oxfordshire.air-quality.info/
• view a 4 minute video on the status of air pollution in Oxford https://www.youtube.com/watch?v=m2Uy54fmqes

15
Part 4: Action planning Objectives
Pupils will learn:
• How decisions and actions can affect the quality of people’s lives
• Different ways in which people can improve their environment
• How to present a persuasive argument
• To make real choices and decisions.
National Curriculum links
Geography 4g, 5a, b, 6a, e PSHE/Citizenship 1a, c, 2a, b, 3a, e, 5a, d English Speaking and Listening 1b, c, 2a, b, e, 3a, b, c, d, f, Resources needed
• Class list of recommendations from previous session
• Scrap paper and pencils – one per group.
Introduction
Display the list of recommendations from the previous session and read them through together. Group activity
Ask pupils to work in groups of 4 or 5. They should discuss the four points below and one person in each group should note down the group’s decisions. 1. Decide on one recommendation that they would like to take action on. 2. Discuss what would be the best way to take action: for example:
- influence someone in a position of power (e.g. by writing a letter or inviting them into school to respond to questions);
- influence their parents or local people (e.g. by designing a leaflet, putting on a play, sharing their findings in the school newsletter);
- take action as a school (e.g. by developing a school travel plan, a campaign, a walking bus);
- inform other pupils (e.g. through an assembly presentation, designing posters, talking to them in the playground, publicising quieter walking or cycling routes).
3. Think about the most effective way to influence, inform or encourage others by:
• Deciding on the message they want to get across
• Deciding who they want to share their message with

16
• Thinking about what will appeal to this group of people (e.g. Should their message seem ‘cool’, fun, important, interesting …? Would this audience respond best to facts, stories, pictures …?).
4. Decide how they would know whether their action had been successful. Class activity
- Ask each group to briefly present their ideas - Collect in the notes made by each group. They will be needed for Part 5 and 6.
Either: Vote on which action the class would like to carry forward together. Or: Each group could develop its own plan.

17
Part 5: Taking action Objectives
Pupils will learn how to:
• Explain their views on issues that affect them and others
• Communicate in ways appropriate to the task and audience
• Take responsibility for taking action to improve their health and environment.
National Curriculum links
Science SC1: 1b, 2b, g, m Geography 1d, e, 2a PSHE/Citizenship 1a, c, 5a, d English Speaking and Listening 1b, c, d, e, 10c, Writing 1a, c, e, 2a, b, c, d, e, f, 9a, b, c, 11 ICT 2a, 3a, b Resources needed
• Notes from Part 4
• Other resources will depend on the actions and methods pupils have chosen.
Individual, group and/ or class activity:
Write the letters, design the posters or leaflets, and decide how and where to distribute or display them, plan and deliver the presentation or campaign … Pupils could research further information to inform their actions, e.g. about air pollution and its impacts or about safe and clean air walking or cycling routes.

18
Part 6: Evaluating success Objectives
Pupils will learn how to:
• Evaluate the effectiveness of their chosen actions
• Identify what they need to do next to achieve their aims.
National Curriculum links
Science SC1: 1b, c, 2g, j, k, l, m PSHE/Citizenship 1c, 5a Resources needed
- Notes from Part 4
- Other equipment will depend on the activities taken but may include another set of the air quality measuring equipment used in Part 2.
Class activity After the actions have been implemented, discuss with the class:
• If they think their actions have achieved their aims
• How do they know?
• How they could find evidence that their actions worked.
Return to the suggestions the groups made in Part 4 and look at the ideas there. The best way to evaluate success will depend on the action taken. They might include:
- Re-measuring air quality outside the school gate after a campaign against idling cars,
- Surveying modes or routes of travel to school after implementing a school travel plan, using a hands up survey
- Considering the kinds of responses they had from parents or the local community to an article or leaflet
Once they have evaluated the effectiveness of their actions they should:
• Decide how to publicise results to the target audience
• Plan the next steps

19
Section 4: Citizen Science Activities Citizen Science Activities offer different methods of enabling pupils to see tangible indicators of air pollution. These vary in complexity, from activities which need no investment and little planning, to those which require more specialised equipment and span a period of weeks. In this chapter we describe the following citizen science activities:
a) Lichen Bio-Indicator Study
b) Diffusion Tube Samples
c) Ozone Badges
d) Surface Wipe Analysis
e) Running Campaigns in School, including:
• Badge competitions
• Plays
• Assemblies
• Anti – Idling Campaigns
• Peppered moth pledge.
We recommend you use as many of these activities as time allows to reinforce learning and spark action! The importance of citizen science is in the investigation, and in understanding the factors that contribute to your local air quality. Once you have received the results for the particular tests you have chosen to carry out, it’s time to consider how you want to best use this information in your school. The results can be analysed as closely as you feel useful to best identify sources and levels of air pollution, or can simply be used as a platform to communicate the concerns of air quality to others in your community. Consider, for example, some of the following:
- Create a large simplified road map of the school, and mark on it the areas of high/low pollution
- Create posters to display the test results, and the impacts this may have on the health of the school community
- Upload information to global community science projects, such as the Eye on Earth network or Mapping for Change Community Maps.

20
a) Lichen Bio-Indicator Study
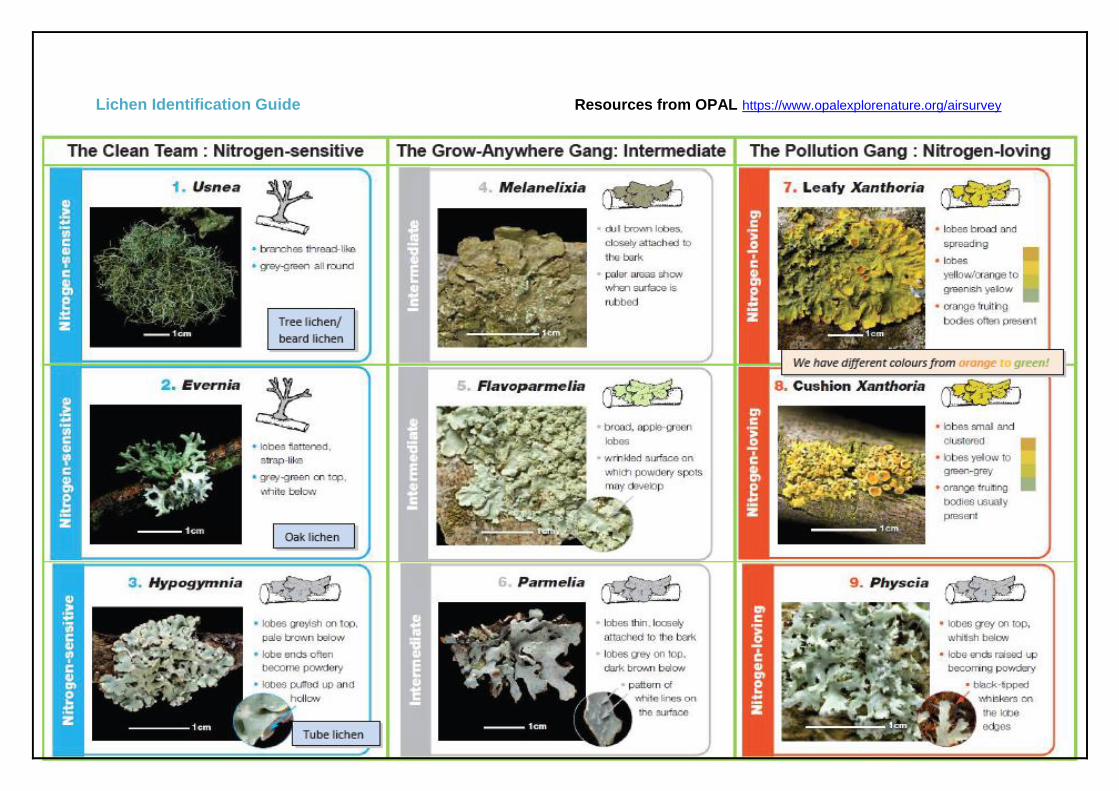
Suitable for Years: 4-6 Duration of Activity: 1 -1.5 hours (plus travel if offsite) What is it? Lichen monitoring is an easy way to observe the level of air pollution in your surrounding area, simply by identifying types of lichens that are present. This provides a basic idea of the extent of air pollution in your surrounding area, by identifying the presence of lichens which are sensitive to nitrogen and those which flourish in environments with high nitrogen level. How to use it: See the lichen identification guide and monitoring sheets for information on how to conduct your study. Lichen monitoring can be carried out as part of a lesson activity in and directly around the school or as an activity by those walking to and from school. This will help to identify levels of air pollution not just at the school site itself, but also along the primary travel routes to and from the school. As some lichens change colour in the rain, this activity is ideally carried out when the weather is dry. Costs of activity: This activity solely requires observation and monitoring, and should incur no additional costs. Magnifying glasses are useful tools for this activity. Resources Included: Lichen Identification Guide Lichen Monitoring Sheet The Open Air Laboratories (OPAL) network: Lichen and air survey, guide and quiz: https://www.opalexplorenature.org/airsurvey https://www.opalexplorenature.org/lichenquiz
21
Lichen Identification Guide Resources from OPAL https://www.opalexplorenature.org/airsurvey

22

23
dro
pp
ing
s d
o n
ot k
ill me
!

24

25
b) Diffusion Tube Samples
Suitable for Years: 3-6 Duration of Activity: Depends on the number of participants. A teacher and two pupils working together may take up to two hours to deploy 12 tubes across 12 different sites. After two weeks, collecting tubes may take one hour. What is it? Diffusion tubes are primarily used to measure the levels of harmful nitrogen dioxide in the air, by use of a specialised sampling tube. These provide an accurate measurement of levels of certain types of air pollution. How to use it: Tubes should be left outdoors on the school site for about two weeks. Children should follow the instructions included in the resources section on how to collect samples, which should then be returned to the supplier for analysis and report. Information can then be used to map out nitrogen dioxide levels around your school. Children will benefit from learning scientific sampling techniques, such as taking data samples along a transect, mapping and analysis of data. Resources Included: Diffusion Tube Factsheet Diffusion Tube Sampling Instructions Diffusion Tube Record Form Please contact Oxford City Councils air quality officer* via [email protected] to inform them of when you intend to do this activity, so that diffusion tubes can be ordered. * Activity costs are supported by OCC only for the schools that are enrolled in the STOP Project

26

27
Diffusion Tube Factsheet
Hello, I’m Paul, the Palmes Diffusion Tube! About me: I measure how much of different types of gases there are in the air, but my favourite thing to do is to measure Nitrogen Dioxide (NO2). If there is a lot of Nitrogen Dioxide in the air it usually means that the air is very polluted. A lot of this pollution is caused by cars, as Nitrogen Dioxide is one of the gases that come out of cars. How I work: I have a special steel mesh which is coated in a special chemical, which is hidden under my colour cap (it may be red, grey, or other colours!). When gases pass over this mesh the chemical changes slightly. This chemical change tells us how much Nitrogen Dioxide there is in the air. How to use me: The first thing to do is to take off the white plastic cap at the bottom of my tube. After that I need to be left outside, with my black mount stuck to a wall, for about two weeks. I need to have my colour cap pointing towards the sky; otherwise I will fill up with water if it rains. After two weeks I will have measured the gases in the air, the lab will analyse me and tell you if the amount of Nitrogen Dioxide is safe or dangerous to your health. Top Tips:
You need to be careful where you put me as I can’t measure gases well if I’m in a windy spot
Don’t put me in a doorway or hole in a wall because I won’t be able to reach the air.
It’s a good idea to write down what the weather is like when I’m outside because this can affect how much Nitrogen Dioxide I can reach
28
Diffusion Tube Instructions p1
Diffusion Tube Sampling Instructions What you will need:
13 Diffusion tubes (12 sampling tubes and 1 control tube)
13 black plastic diffusion tube mounts
12 “Do not disturb” signs
4 record forms
Map of your school neighbourhood. The map should have your school in the middle and cover 400m toward North, South, East and West.
Ruler
Pencil
Re-sealable plastic bag
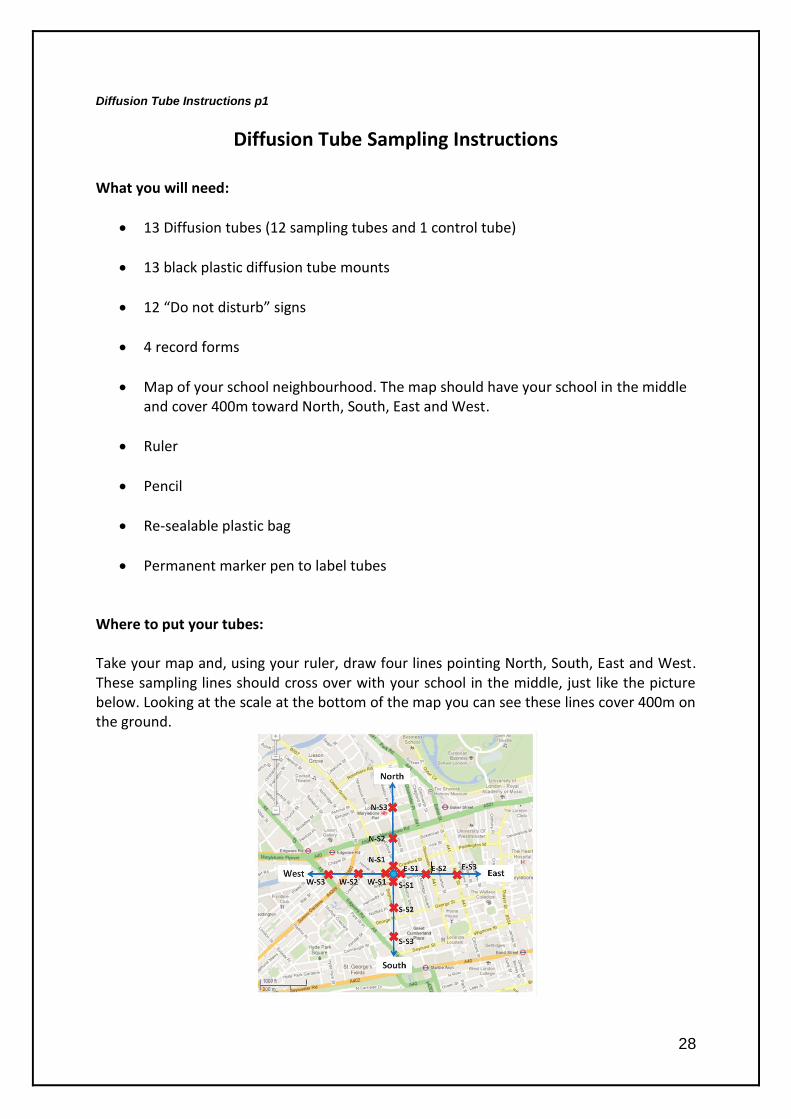
Permanent marker pen to label tubes Where to put your tubes: Take your map and, using your ruler, draw four lines pointing North, South, East and West. These sampling lines should cross over with your school in the middle, just like the picture below. Looking at the scale at the bottom of the map you can see these lines cover 400m on the ground.
29
Diffusion Tube Instructions page 2
On each of your lines draw three crosses. The first cross will be in your school building or the street next to your school. The next two crosses are 200m and 400m away from your school. These crosses show you where you will need to put your diffusion tubes.
1) On each line, number the crosses 1, 2 and 3 with number 1 closest to your school, number 2 in the middle (200 away from your school), and number 3 the furthest (400m away from your school).
2) Write your name, today’s date and the name of your school at the top of your sampling sheet. Write your name and the name of your sampling line (North, South, East or West) on your plastic bag. When you collect your tubes in two/three weeks’ time, you will put them into this bag.
3) Circle the name of your sampling line (North, South, East or West) at the top of your sampling record sheet.
4) Take three of your tubes and a waterproof marker pen. Write the name of your sampling line (N,S,E or W) and the tube number 1, 2 and 3 on their colour caps. These will be your “sampling tubes”. On your record sheet write the six digit ID number found on each tube, in the box that has the same number as the colour lid.
5) Take your map, sampling sheet, and diffusion tubes and walk north to cross 1 on your sampling line.
6) When you get to your first site, look for a good place to put your diffusion tubes. Remember! Your site needs to be:
a. Not covered by trees, bushes or other plants b. On an open wall
You might be able to minimise the risk of the tubes going missing by trying to site them in locations that you know (i.e. neighbours’ walls, other schools etc), or by placing them up to 3 meters high.
7) When you have picked a good place to put your tubes, measure between 2-3 meters
from the ground and mark a point on the wall. This is where you will put your first diffusion tube!
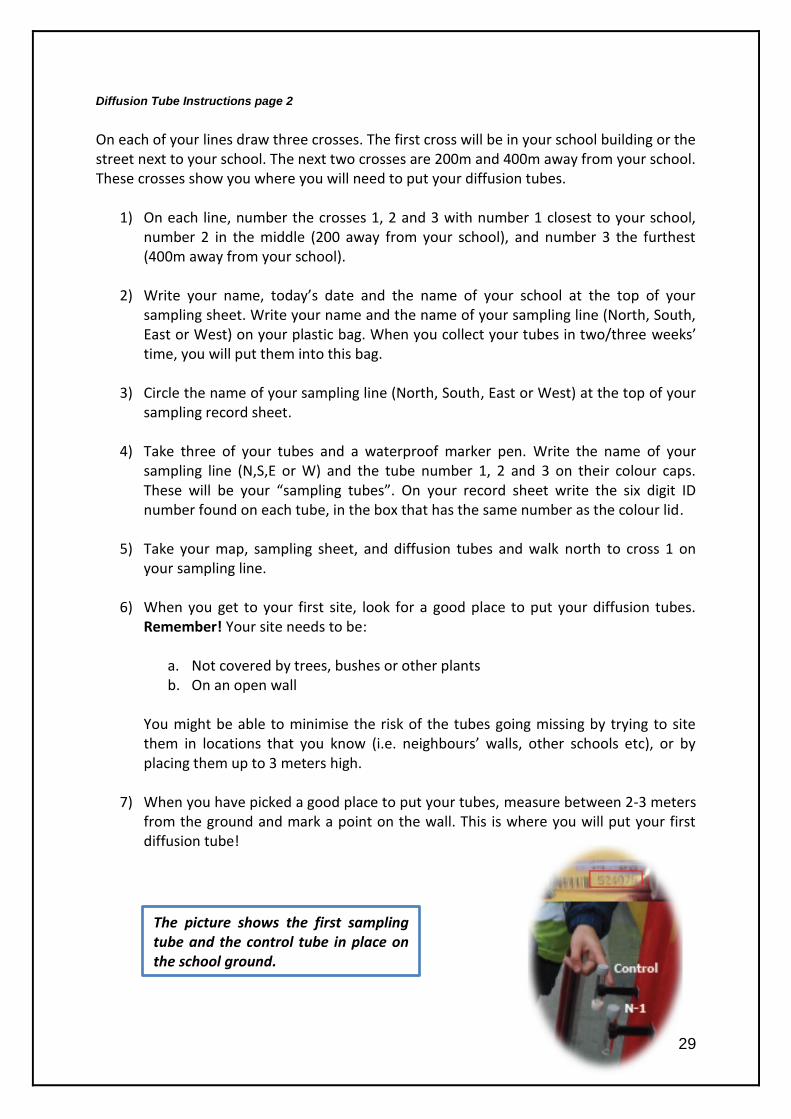
The picture shows the first sampling tube and the control tube in place on the school ground.

30
Diffusion Tube Instructions p3
Putting your tubes up
8) Take you tubes and put them into black plastic wall mounts. Peel the tape off the
back of the mounts and stick them onto the wall.
9) Write what time it is on your sampling sheet under “time cap removed”, and then
remove the white plastic cap on the bottom of the sampling tube with N-1 written
on it. Put the white plastic cap in your plastic bag.
10) Stick one of your signs underneath the tubes so that no one tries to move them.
11) When you have done this spend 5 minutes making some notes about the area
around your sampling site in the box labelled ‘Site Characteristics’. a) Are you near a main road? b) Are there any trees nearby? c) Is there a crossing near your tubes? d) Is there a car-park nearby? e) Write as much as you can because this will help you work out why pollution
levels might be different later on.
12) Go to your next sampling point and repeat steps 8 to 11 with your tube labelled ‘N-2’, making notes in the boxes for ‘Sample Site 2’.
13) Move onto your third and final sampling point and repeat steps 8 to 11 with the tube labelled ‘N-3’, writing your notes in the boxes for ‘Sample Site 3’
14) Repeat the process for the three other directions (East South and West).
15) Prepare the control tube, and put it up in the same way as the other tubes. Locate it somewhere in the school site, such as in your classroom or next to another tube in the school grounds. Do not remove either cap from the control tube.
16) Check that you’ve done everything correctly and give your sampling sheet and map back to your teacher. Everyone’s information is very important so we need to make sure it has all been collected the same way.
Well done! You have started your pollution monitoring!!!

31
Diffusion Tube Instructions p3
Collecting your tubes
17) After two weeks, go back to where you placed your tubes.
18) When you get to your first sampling site check that your open sampling tube is still
there. Have they been damaged at all? Has anything in the area changed? Write down anything that you think is interesting in the box on your sampling sheet labelled ‘Tube condition’.
19) Remove the open diffusion tube from where you stuck it, and put the white plastic lid back on the sampling tube, and place it back into the bag. Check the date and time and write this in the ‘date and time cap replaced’ box for this tube on your sampling sheet.
20) Walk along to your next sampling site and repeat steps 17 to 19.
21) Next, move to your last sampling site and repeat steps 17 to 19.
22) Repeat for each sampling line (North, South, East and West), until all tubes are collected.
23) When you get back to school, work out how many hours each of your tubes was outside for. Your teacher can help you with this. Write the number of hours the tubes at each sampling site were outside in the box ‘Hours tubes outside for’.
24) Once at school, take down your sealed control tube and check that it doesn’t have any cracks. If it does, make sure that you write these down in the ‘Tube conditions’ box on your sampling sheet. Then, put your sealed control tube into your plastic bag.
25) Make sure you check over all of your notes with your teacher and get them to check that everything is correct! We don’t want any little mistakes to mess up your results!
26) Once you have collected all the tubes, and made sure all the plastic lids were correctly inserted, preventing the exposure of the tube’s interior to air, you are ready to send the tubes to the lab for analysis. Please discuss this step with the Air Quality officer. He will be able to give you the address where to send the tubes to.
Congratulations! You are all finished!
Now you just have to wait to get your results back and look over them with your class.

32

33

34
35
c) Ozone Badges
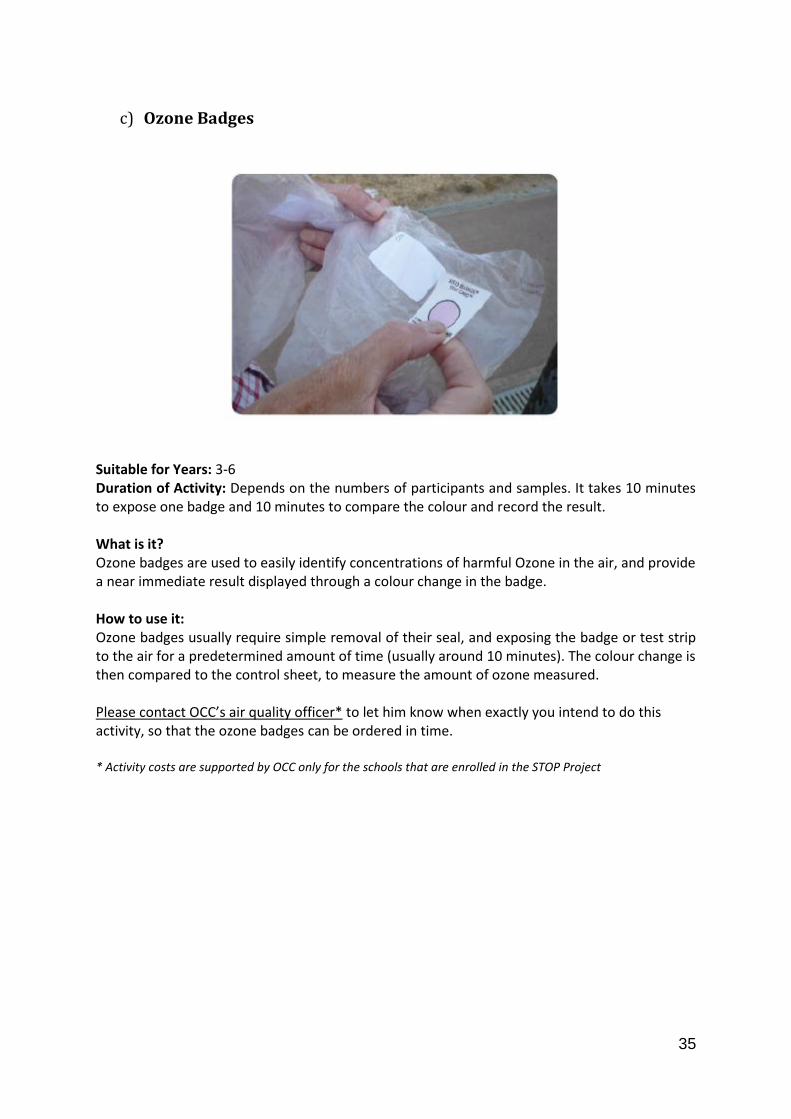
Suitable for Years: 3-6 Duration of Activity: Depends on the numbers of participants and samples. It takes 10 minutes to expose one badge and 10 minutes to compare the colour and record the result. What is it? Ozone badges are used to easily identify concentrations of harmful Ozone in the air, and provide a near immediate result displayed through a colour change in the badge. How to use it: Ozone badges usually require simple removal of their seal, and exposing the badge or test strip to the air for a predetermined amount of time (usually around 10 minutes). The colour change is then compared to the control sheet, to measure the amount of ozone measured. Please contact OCC’s air quality officer* to let him know when exactly you intend to do this activity, so that the ozone badges can be ordered in time. * Activity costs are supported by OCC only for the schools that are enrolled in the STOP Project

36

37
Ozone Badge Activity Sheet
How does it work?
Ozone badges are very easy to use - all you need to do is remove their seal and leave them for about 10 minutes. If you watch closely you will see the badge slowly change colour, you can then compare the final colour to the control sheet to see how much Ozone there is.
How many Ozone badges do you need? Around 10 badges should be enough for this activity. You can expose them at different locations (such as your school playground, a road and a park near the school) and/or at different date and times (such as morning, lunch time and afternoon).
How to organise your pupils:
Pupils should divide into two/three groups. Each group will spend half to one hour visiting different locations: school, roads and parks. You will need to spend about 20 minutes at each location to give 10 minutes to expose badges and 10 minutes to compare colours and record the data.

38

39
d) Surface Wipe Analysis
Suitable for Years: 3-6 Duration of Activity: 1 hour What is it? Surface wipe analysis is a cost-effective and easy way to identify levels of particulate matter, specifically in relation to their concentrations at different heights and locations. How to use it: Surface wipe analysis uses a piece of sticky tape or moist cotton wool ball to sample the particulate matter that is deposited on surfaces. You can use this technique to sample the deposition of particulate matter on surfaces in different locations, or at different heights. You can sample a range of surfaces using this technique including, leaves on trees, poles, walls or doors around school. Your sample provides an immediate visual indication of levels of pollution. It is also useful to explore how levels of pollution may vary depending on height and distance from roads. Greater concentrations of particulate matter at lower levels pose a greater risk to children. Costs of activity: Costs for this activity are minimal, requiring only cotton balls or sticky tape, to wipe surfaces. Resources Included: Surface Wipe Instructions Surface Wipe Record Form Basic info on: www.opalexplorenature.org/sites/default/files/7/file/OPAL-SE-Roadside-Soot-Activity.pdf

40

41
Surface Wipe Instructions What is it?
Surface wipe analysis is an easy way to measure how much particulate matter there is at different locations and different heights.
How to use it:
Surface wipe analysis uses a piece of sticky tape or a moist cotton wool ball to sample the particulate matter on surfaces. You can sample lots of surfaces using surface wipe analysis including leaves on trees, poles, walls or doors around school. Your sample will show you how much pollution there is straight away. It is also useful to explore how levels of pollution may be different at different heights and different distances from roads. If there is a lot of pollution at low heights this could be dangerous to children.
What do you need?
1) 2cm wide clear sticky tape or cotton wool balls 2) A tape measure at least 120 cm long
Sampling steps:
1) Find the surfaces you want to measure (tip: avoid wet surfaces). We suggest three different surfaces: a door inside school, a wall outside school, and a pole of street/traffic sign.
2. Use the tape measure to identify four spots at different heights: 120cm, 90cm, 60cm and 30cm.
3. For sticky tape - cut the clear tape into 10cm strips. Press the sticky side of the tape firmly onto the surface, leave for 10 seconds and then remove it. For cotton wool – dampen a cotton wool ball in a little water and wipe over a small area (about 10cm by 2cm)
4. Dirt and pollutants from the surface will have stuck to the tape or ball. Paste the tape or ball on the record sheet.
5. Repeat the steps above, and then compare the levels of pollution at different heights from the same surface.
6. Mark the pollution level from 1 to 4: 1 for the dirtiest sample and four for the cleanest sample. Could you tell if lower or higher heights are more polluted?
7. Repeat steps 1 to 6 for two other surfaces. Can you tell which surface is more polluted?

42

43

44

45
e) Running Campaigns in School There are a number of social marketing activities, designed to increase engagement and awareness of issues surrounding air quality which have proved successful in school. Badge competition – classes can compete to design the badges which best represent their understanding of air quality, the winner being made into a badge for Air Quality Champions to wear Estimated Cost: £0.20-£1.00 per badge depending on size and number required. Approximated cost for orders of 50 units. Equipment can be ordered from: www.ecoincentives.com/ www.ecoeveryday.biz www.simoney.co.uk Plays - these have been successful in several schools to promote green issues and sustainable transport in an easily accessible way to all ages. This can be especially useful to engage parents and increase awareness amongst them of their children’s and school’s endeavours. This has also been used as a successful method for fundraising, charging a nominal admission fee to parents and the community to attend. Assemblies – these can be delivered by a class or teachers to easily explain to the school community the efforts and activities designed to investigate and improve air quality. Some school events, such as cultural day, coffee mornings, and parents evening, are good opportunities to approach parents and raise their awareness of air quality. Peppered Moth Pledges – the Peppered Moth is a good case study that teaches students about air quality and air pollution. Story-telling or competitions about peppered moth can be used in conjunction with School Travel Plans to commit to more sustainable forms of travel into school. Resources Included: Peppered Moth Activity Sheet Peppered Moth Pledges Sheet Electing Air Quality Champions – pupils, teachers, parents and school governors can make up an Air Quality team, who will drive forward activities designed to investigate and improve air quality around school. The pupil members of air quality team should be gender-balanced and across different classes. Idling Surveys/Travel Questionnaires – surveys used in conjunction with School Travel Plans to investigate levels of idling cars outside of school, as well as most common methods of travel currently being used in schools. Resources Included: Idling Survey Instructions Idling Survey

46
Case Study: Green Theatre Touring Local Schools
Wandsworth Council used theatrical performances to successfully raise awareness of green issues and promote sustainable travel across the borough. Organising a tour of the Big Wheel Theatre Company, ten schools were visited with each performance providing practical examples of how pupils can improve their local environment. “This is a fantastic and fun way to get these important messages across. The children clearly loved every minute of it and went away thinking hard about how they can do their bit tackle climate change and pollution.” Cllr Jonathan Cook, Wandsworth Council’s Environment Spokesman.

47
Peppered Moth Activity Sheet Air pollution affects not only people but also plants and animals. The Peppered Moth is a
good example that students can learn air quality and air pollution! The Peppered Moth The Peppered Moth is widespread in Britain and Ireland and is frequently found in back gardens. It is one of the best known examples of evolution by natural selection, Darwin's great discovery, and is often referred to as 'Darwin's moth'. The Peppered Moth and Air Pollution
Peppered Moths are normally white with black speckles across the wings, giving it its name. Originally, the peppered moths wing colours camouflaged them against the light-coloured trees and lichens that they rested on. However, in the nineteenth century, during the Industrial Revolution in England, widespread pollution killed off lichens and blackened urban tree trunks and walls. Therefore the normal, pale, speckled forms of the Peppered Moth were no longer camouflaged from predators on the soot-blackened trees. Black Peppered Moths thrived in these situations and the
normal pale form became rare. Over successive generations, the black moths came to outnumber the pale forms in our towns and cities. In the mid-twentieth century controls were introduced to reduce air pollution and as the air quality improved tree trunks became cleaner and lichen growth increased. As pollution has been greatly reduced, the balance swung back the other way. Peppered Moth Activities Key Message: White peppered moths indicate less pollution, better air quality The peppered moth story: Tell students about the story, including the relationship between the moth and air quality, its evolution in UK history. Observation: Ask pupils if they have seen moths before? Are they peppered moths? What colour are they? Encourage pupils to observe moths in school, gardens, parks, and other places they visit. Moth competition: It can be an activity to promote sustainable travel. Get your class to draw and cut out a big black moth. Each member of the class can make an air quality pledge e.g. to walk or cycle to school, each morning the class can put a white dot on the black moth if they have done their pledge until covered in white dots. It can be competition between classes in your school, or between groups in one class. More information about peppered moth: http://www.mothscount.org/ (Photograph by Chris Manley from http://www.amentsoc.org/about/news/0111/)

48

49
Idling Survey Instructions
Is car idling contributing to air pollution around your school?
What is idling? When people leave their car engine running while they have stopped, this is called ‘idling’. A car is ‘idling’ if it has been left running for over one minute after stopping or parking. Idling can cause pollution around school when parents pick up or drop off children. Their cars cough out dirty, smelly fumes. Yuck! How do we monitor idling? To work out if idling is causing pollution around your school, you can count the number of parents’ cars outside your school that are idling. It’s best to count parents cars idling during the busy time in the morning before school starts and again in the afternoon when school ends. For example, if your school starts at 9:00 and ends at 3:30, you should do the survey from 8:30 - 9:00am and 3:15 - 3:45pm, because parents may come earlier to drop off or wait for their children. Choose to do your idling survey on a day when most pupils leave school around the same time. Your teacher will send you, in groups, to a location beside the road near your school where parents drop off their children. Instructions Fill out the form on the next page with your name, the date, and your location. You will be counting cars in two 15 minute blocks. Follow the steps below so we can compare everyone’s results later on. 1) In a group of three, choose who you will be:
o Champion 1 Observer : spot and identify parents’ cars o Champion 2 Timer: time how long parents’ cars are left idling o Champion 3 Recorder : record the number of cars idling and not idling
2) What is the time? Write the time in the column ‘Start Time’ (e.g. 8:30am). What time should you stop counting cars? The Timer should make sure that you stop counting cars after 15 minutes. 3) The Observer looks for parents’ cars that are idling and not idling and tells the Timer.
4) The Timer uses a stop watch to time if cars have been idling for at least one minute.
5) The Recorder puts one dash in the column ‘Number of cars idling’ every time the Observer and the Timer find an idling car, and one dash in the column ‘Number of cars not idling’ every time the Observer spots a parked car that is not idling.

50
6) At the end of 15 minutes, the Timer tells the Observer to stop counting and the Recorder writes the finish time in the column ‘End Time’ (e.g. 8:45 am). Add up the number of cars idling and not idling and record this in the ‘total’ column. 7) After a 1 minute break, you can swap jobs. Repeat steps 1-6 and record your findings in the second row. 8) When you finish counting cars for the second time, add up all the cars idling and put this number in the ‘total, column on the bottom row. Add up all the cars not idling and put this number in the ‘total’ column on the bottom row. 9) Repeat steps 1-8 again in the afternoon. 10) At the end of the day, give your record form to your teacher. Do you think idling is a
problem at your school? If yes, what can you do about it?
Congratulations!
You have completed your idling survey.

51

52

53
Section 5: Extra Activities This Chapter of the toolkit provides several air quality activities to be adopted by teachers, in addition to the citizen science activities previously described in section 4 of this toolkit. These can be used as an extra source of material, for teachers that want to explore the importance of air quality even more, or want to replace some of the activities proposed in section 4. The extra activities have been provided by Deliver Change Ltd, and are meant to address specifically different research areas and ages, with direct links to the national curriculums in England.

54
Extra Activities – Key Stage 1 (Year 1) (SCIENCE)
Lesson 1: “Some animals need air to breathe - How long can you hold your breath for?” Length of Lesson: 20 minutes National Curriculum in England, for teaching from September 2015 Curriculum Topic: Animals including humans https://www.gov.uk/government/uploads/system/uploads/attachment_data/file/425601/ PRIMARY_national_curriculum.pdf pages 148 – 149

55
Can you find out where their noses and mouths are, which let them breathe?
Sources:
Horse: http://forums.elderscrollsonline.com/en/discussion/169987/this-is-a-minor-thing-butzos-please-do-something-about-horses-rear-legs Cow:http://www.alternet.org/story/154567/holy_cow!_how_senators_and_movie_stars_use_livestock_to_game_the_tax_code Monkey: http://www.fastcompany.com/3034115/we-asked-a-bunch-of-lawyers-who-owns-thecopyright-to-this-amazing-monkey-selfie Snake: https://doowansnewsandevents.wordpress.com/2013/10/03/snake-medicine/ Polar bear: http://www.huffingtonpost.com/news/polar-bears/ Dog: http://www.sciencekids.co.nz/pictures/animals/dog.html Pig: http://www.sciencekids.co.nz/pictures/animals/piglet.html Eagle: http://www.sciencekids.co.nz/pictures/animals/baldeagle.html

56
Lesson 2: “The quality of the air in rural and urban areas” (GEOGRAPHY)
Length of Lesson: 30 minutes National Curriculum in England, for teaching from September 2015 Curriculum Topic: Place Knowledge; Geographical Skills and Fieldwork https://www.gov.uk/government/uploads/system/uploads/attachment_data/file/425601/ PRIMARY_national_curriculum.pdf pages 184 - 187

57

58

59
60
Extra Activities – Key Stage 1 (Year 2)
(SCIENCE)
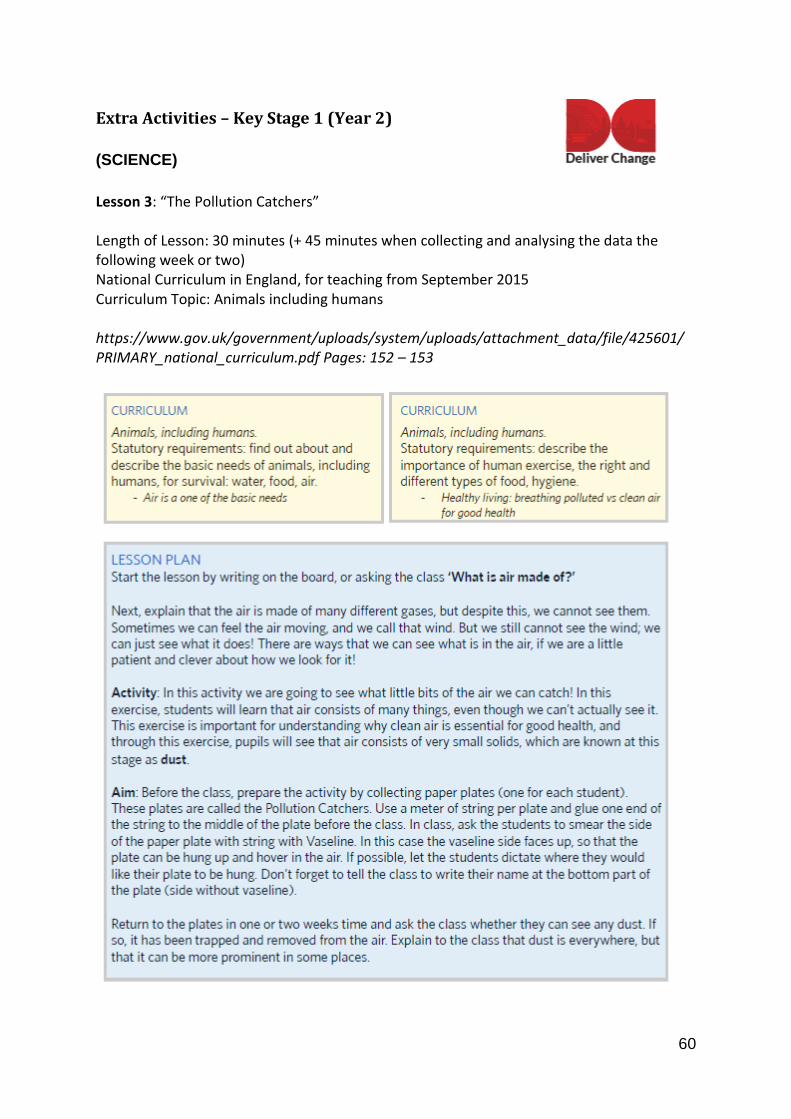
Lesson 3: “The Pollution Catchers” Length of Lesson: 30 minutes (+ 45 minutes when collecting and analysing the data the following week or two) National Curriculum in England, for teaching from September 2015 Curriculum Topic: Animals including humans https://www.gov.uk/government/uploads/system/uploads/attachment_data/file/425601/ PRIMARY_national_curriculum.pdf Pages: 152 – 153

61

62
Lesson 4: “Health impacts of air pollution” (SCIENCE)
Length of Lesson: 1.5 hours National Curriculum in England, for teaching from September 2015 Curriculum Topic: Animals including humans https://www.gov.uk/government/uploads/system/uploads/attachment_data/file/425601/ PRIMARY_national_curriculum.pdf Pages: 152 - 153

63

64
Extra Activities – Key Stage 2 (Year 3 & 4) (GEOGRAPHY)
Lesson 1: “Sources of air pollution” Length of Lesson: 40 minutes National Curriculum in England, for teaching from September 2015 Curriculum Topic: Locational Knowledge; Place Knowledge; Human and Physical Geography https://www.gov.uk/government/uploads/system/uploads/attachment_data/file/425601/ PRIMARY_national_curriculum.pdf pages 186 - 187

65

66
Lesson 2: “Sources of air pollution” (SCIENCE)
Length of Lesson: 50 minutes National Curriculum in England, for teaching from September 2015 Curriculum Topic: Animals including humans (Year 3); Living things and their habitats (Year 4) https://www.gov.uk/government/uploads/system/uploads/attachment_data/file/425601/ PRIMARY_national_curriculum.pdf pages 158 (year 3) & 161 (year 4)

67

68
Lesson 3: “Ways to travel and the impact on outdoor air” (SCIENCE & GEOGRAPHY)
Length of Lesson: 1 hour National Curriculum in England, for teaching from September 2015 Curriculum Topic: Working Scientifically (Year 4); Human and physical geography (Year 4 and year 6); Animals including humans (Year 6). Key Stage - Geography, Lower Key Stage 2: Year 4 - Science & Upper Key Stage 2: Year 6 - Science https://www.gov.uk/government/uploads/system/uploads/attachment_data/file/425601/ PRIMARY_national_curriculum.pdf pg 161: science Yr 4, 172: science Yr 6, 186: geography
CURRICULUM
Lower & Upper Key Stage 2 Geography: Human and physical Geography Statutory requirements: human geography: Types of settlement and land use, economic Activity including trade links, distribution of Natural resources including energy.
CURRICULUM
Place knowledge Year 6 Science: Animals including humans. Statutory requirements: recognise the impact

69
70
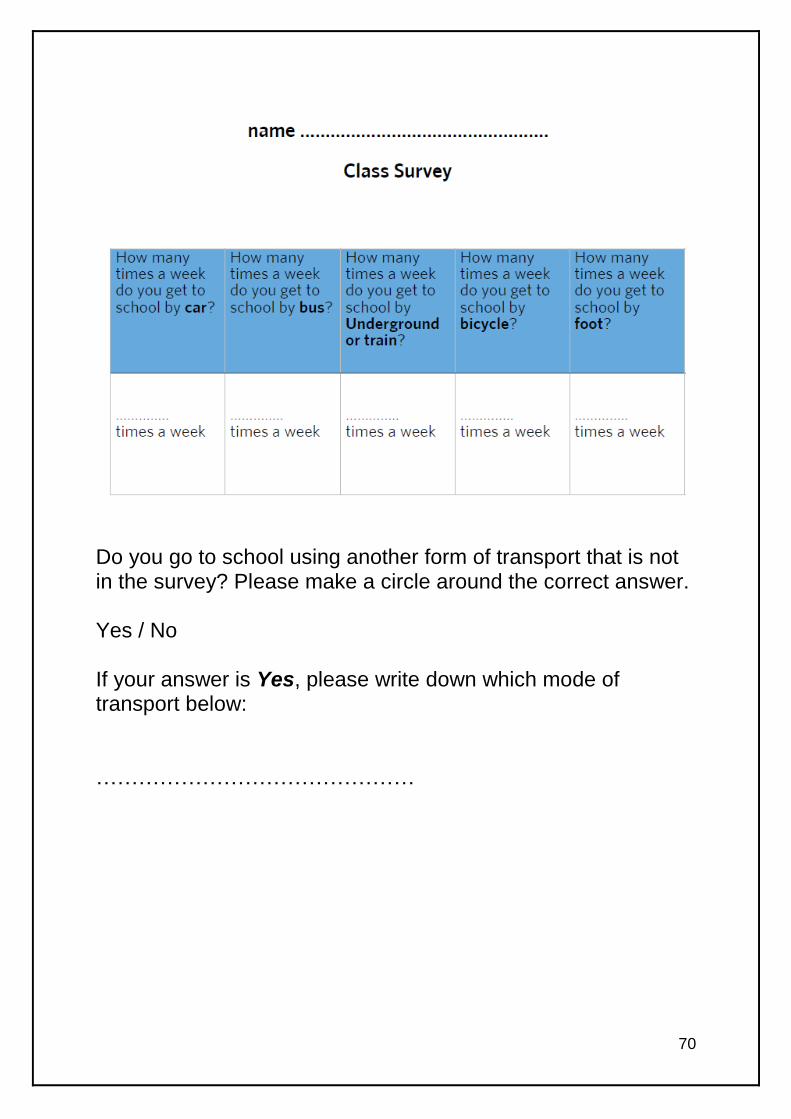
Do you go to school using another form of transport that is not in the survey? Please make a circle around the correct answer. Yes / No If your answer is Yes, please write down which mode of transport below: ………………………………………

71
Extra Activities – Key Stage 2 (Year 5)
Lesson 4: “Everyday activities and outdoor air pollutants”
(SCIENCE) Length of Lesson: 40 minutes National Curriculum in England, for teaching from September 2015 Curriculum Topic: Properties and changes of materials https://www.gov.uk/government/uploads/system/uploads/attachment_data/file/425601/ PRIMARY_national_curriculum.pdf pages: 170-173
CURRICULUM
Properties and changes of materials (Year 5) Statutory requirements: Understand how gases may be separated: filtering Give reasons for the particular uses of everyday materials: metals, wood and plastic
72

73
name ………………………………………………….
Sources of outdoor air pollutants
Reading Task
The Great London Smog of 1952
What happened in London on the 5th of December, 1952? A fog so thick and polluted it left thousands dead wreaked havoc on London in 1952. The Smoke-like pollution was so toxic it was even reported to have choked cows to death in the fields. It was so thick it brought road, air and rail transport to a virtual standstill. This was certainly an event to remember, but not the first smog of its kind to hit the capital. During the day on 5th December, the fog was not especially dense and generally possessed a dry, smoky character. When nightfall came, however, the fog thickened. Visibility dropped to a few metres. The following day, the sun was too low in the sky to burn the fog away. That night and on the Sunday and Monday nights, the fog again thickened. In many parts of London, it was impossible at night for pedestrians to find their way, even in familiar districts. In The Isle of Dogs area, the fog there was so thick people could not see their feet.
What is SMOG? SMOG is a type of large-scale outdoor pollution. It is caused by chemical reactions between pollutants derived from different sources, primarily automobile exhaust and industrial emissions. Cities are often centres of these types of activities, and many suffer from the effects of smog, especially during the warm months of the year. SMOG can easily be remembered as the combination of SMoke and fOG. Impacts of the smog: Officials believe that as many as 12,000 people may have died. Many of those killed were elderly people or those who were already weak or already suffered from chronic respiratory or cardiovascular complaints. - Many people suffered from breathing problems - Travel was disrupted for days

74
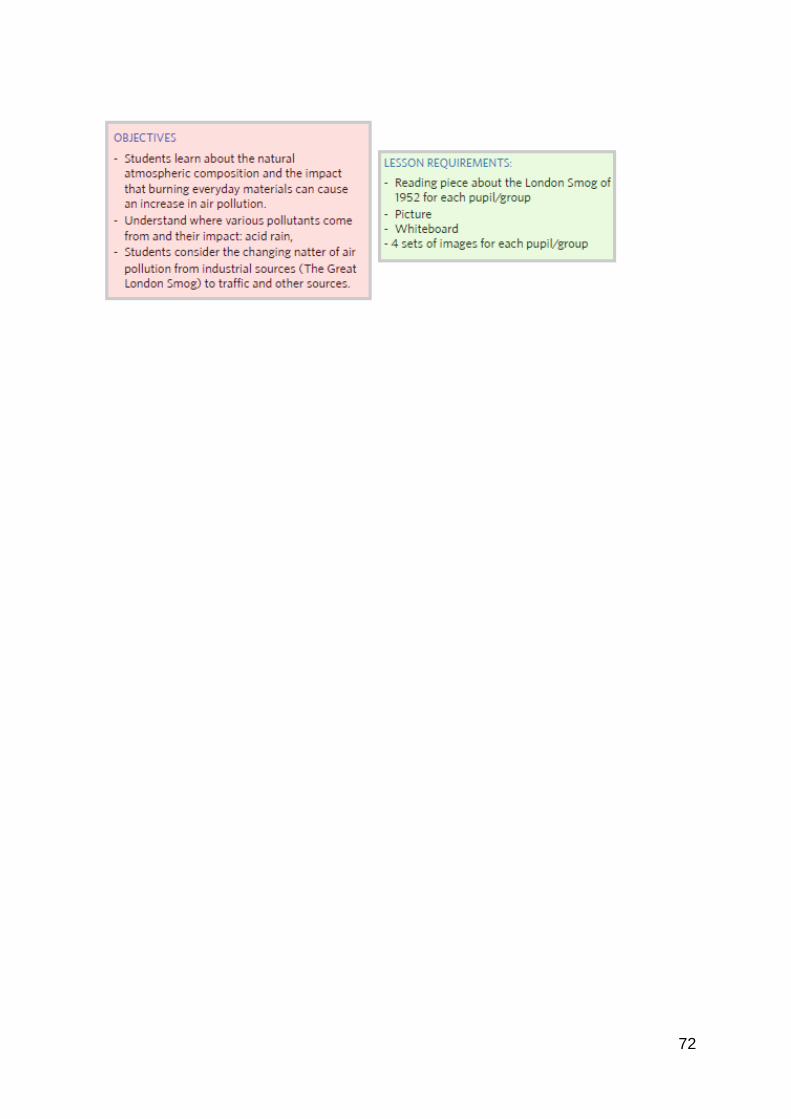
Teacher Information Part 1. Air Quality – A Global Problem Students will learn that air pollution has been around for a long time, as a result of natural influences (volcanoes and natural forest fires) but that since the industrial revolution the amount of fumes emitted into the atmosphere has increased substantially. Students will learn that there has been a changing nature of air pollution from industrial sources to traffic and other sources. Part 2. Gases in the atmosphere. - Students are taught that before there were humans, the Earth’s atmosphere was most likely formed by volcanic activity and consisted mainly of carbon dioxide and water vapour. This produced a natural atmospheric balance. - Students are taught about how human activity has changed the composition of the atmosphere by adding small pollutants as a result of daily activities. These activities include:
- burning waste such as plastic, - burning excess wood, - creating materials such as glass and plastic, - burning oil for transportation, - burning coal to heat the comes and produce electricity.
Part 3. What is emitted from the burning of everyday materials? Wood Wood is a very popular material to burn as it gives heat and is used mostly for cooking and heating the home. A lot of burning takes place inside the home, leaving air pollutants with no place to go. Carbon dioxide is the most common gas produced by burning wood. Wood is mostly made up of carbon, which during burning turns into the carbon dioxide gas. Plastic Home burning of waste is an activity that takes place daily all over the world. Air emissions from home burning are released directly into the house or outside. * Please note, students are expected to complete a homework task where they make a list of the plastic in their kitchen. They should look at packaging: in the shelves, fridge and cupboards. Oil for travel: cars, airplanes, boats, buses The pollutants emitted from transportation makes up a large proportion of the global atmospheric change and can alter the natural amount of gases in the air.

75
76
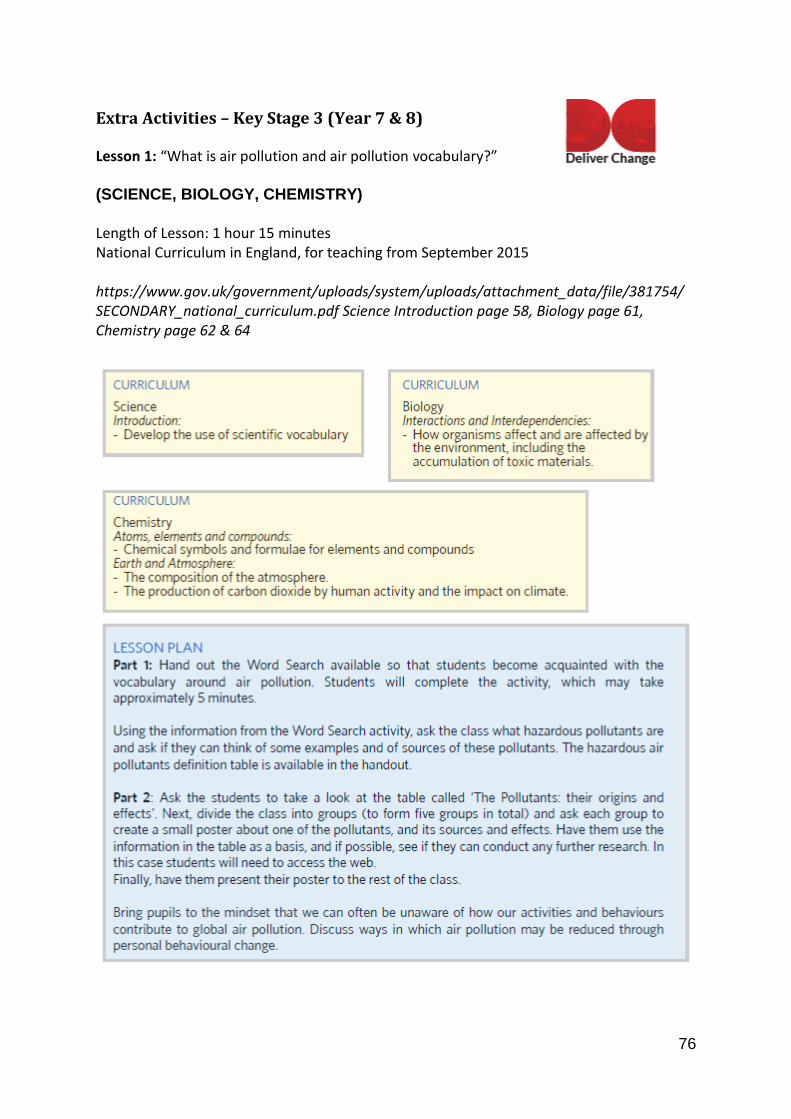
Extra Activities – Key Stage 3 (Year 7 & 8)
Lesson 1: “What is air pollution and air pollution vocabulary?” (SCIENCE, BIOLOGY, CHEMISTRY) Length of Lesson: 1 hour 15 minutes National Curriculum in England, for teaching from September 2015 https://www.gov.uk/government/uploads/system/uploads/attachment_data/file/381754/ SECONDARY_national_curriculum.pdf Science Introduction page 58, Biology page 61, Chemistry page 62 & 64

77

78

79

80

81

82
Lesson 2: “Global use of resources: The Air Pollution Edition” (SCIENCE, BIOLOGY, CHEMISTRY)
Length of Lesson: 1 hour 15 minutes National Curriculum in England, for teaching from September 2015 https://www.gov.uk/government/uploads/system/uploads/attachment_data/file/381754/ SECONDARY_national_curriculum.pdf Chemistry page 63 & 64, Physics page 64, Geography page 92

83

84
Part 1 Teacher Hand-out and Notes
1. Fossil Fuels
Fossil Fuels are made of organisms. That means things that are alive, like plants and animals. But fossil fuels were formed in the past over millions of years. The fuels might be:
Coal
Oil
(Natural) Gas
Natural gas forms from the plants, animals, and microorganisms that lived millions of
years ago
Natural gas deposits are often found near oil deposits.
All three are found under the Earth’s outer layer called the crust. Please see the images below for more information. Humans gather the fossil fuels by digging them out of the ground and then use them for energy. The problem with using fossil fuels is that they will run out! Because of this reason they are called non-renewable sources of energy. When they are gone, they are gone forever. For this reason, it is very important for us to recycle a lot of the products that these non-renewable energy sources can transform into. Ask the class: Which products are recycled in your household, and which products does the school recycle? Do you think that we recycle enough? Which products do you think are especially important to recycle?

85

86
Please read the following descriptions of non-renewable energy, and answer the following questions for each box: 1. What type of products can be created from each fossil fuel? 2. Of these products, which do you and your family use on a day to day scale? 3. On a global scale, how much of each fossil fuel do we use? 4. When do you think the global availability of each fossil fuel will run out?

87

88
Part 2
Fossil Fuel burning and the formation of Air Pollution Another problem with using fossil fuels is that when they are burned they release pollutants into the air. These tiny bits of fuel are so small that humans cannot see them, but in some places we can see where lots of tiny bits have grouped together. Like the black soot on some buildings in the city, or the smog hanging over the city. This pollution can also cause problems for people who already have difficulties breathing, like those who have asthma. Has air pollution been persistent? Air pollution has largely increased in the Earth’s atmosphere due to human activity. We call these pollutants anthropogenic, meaning they are caused by man-made sources or activity. However, the Earth has been around for far longer than human beings and long before we were here nature was pretty good at managing pollutants that were emitted from natural sources. Nature was able to move particulate matter (the dust and dirt solids that pollute the air) through wind based dispersal and the water cycle was able to dissolve many substances, locking it away in the oceans or the ground. At the same time, nature also had plants at work, cleaning the air of carbon dioxide and replacing that with oxygen through the process of photosynthesis (more on that another time). Additionally, the wind caused the dispersal of gases to other areas of lower concentrations. But it was the advancement of human society and the huge growth in urban living that lead to the exhaustion of nature’s own methods of pollution handling. There was suddenly too much pollution in the air for nature to cope with.
89
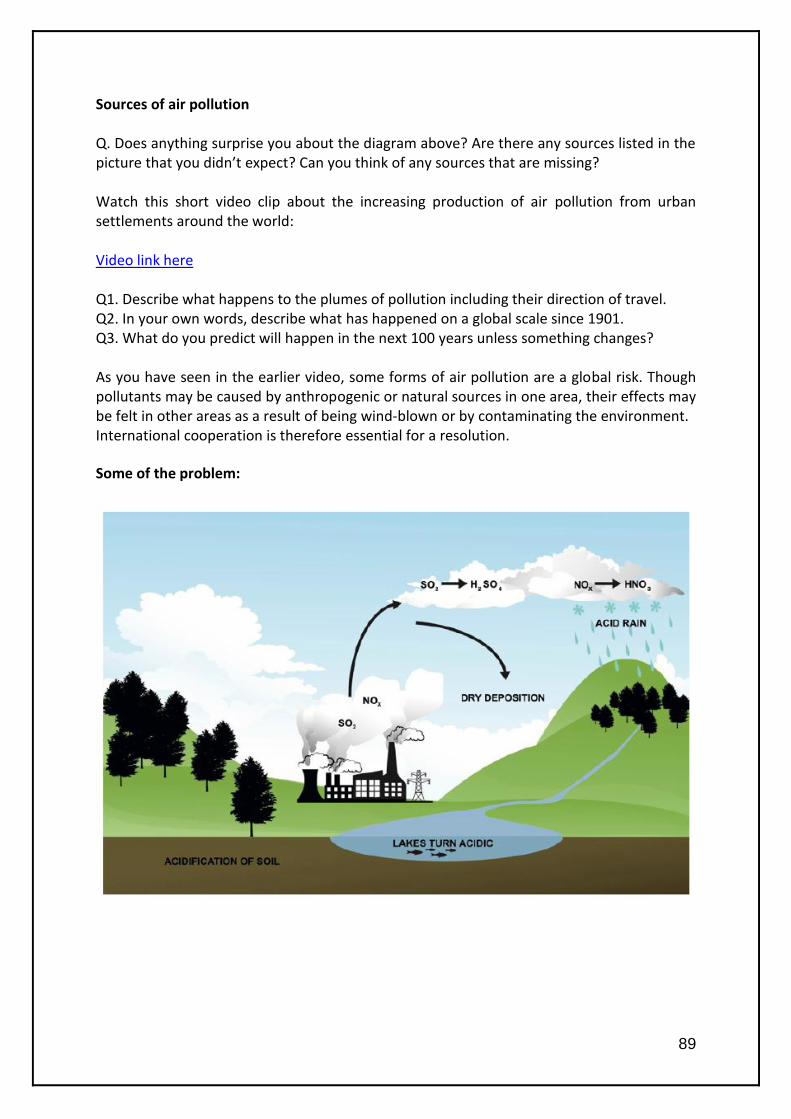
Sources of air pollution Q. Does anything surprise you about the diagram above? Are there any sources listed in the picture that you didn’t expect? Can you think of any sources that are missing? Watch this short video clip about the increasing production of air pollution from urban settlements around the world: Video link here Q1. Describe what happens to the plumes of pollution including their direction of travel. Q2. In your own words, describe what has happened on a global scale since 1901. Q3. What do you predict will happen in the next 100 years unless something changes? As you have seen in the earlier video, some forms of air pollution are a global risk. Though pollutants may be caused by anthropogenic or natural sources in one area, their effects may be felt in other areas as a result of being wind-blown or by contaminating the environment. International cooperation is therefore essential for a resolution.
Some of the problem:

90
Part 3 – in class or as a homework activity

91
Lesson 3: “Local & community-based solutions to air pollution” (PHYSICS, GEOGRAPHY)
Length of Lesson: 1 hour 15 minutes National Curriculum in England, for teaching from September 2015 https://www.gov.uk/government/uploads/system/uploads/attachment_data/file/381754/ SECONDARY_national_curriculum.pdf Science Introduction page 59, Physics page 64, Geography page 92

92
LEARNING OBJECTIVES
- Pupils will come up with ideas for how to reduce the usage of fossil fuels, from a global to local level.
- Students will work as a team, and create a presentation to present in front of the class.
- Students will learn to ask question and engage in class; before agreeing on which project they believe would work best
- Students will understand what it takes to set up a project on both a local and global scale
LESSON REQUIREMENTS
- White board - Poster paper - Pens

93
Part 1 Discussion
1. How dependent are you on: ▪ Plastic ▪ Metals ▪ Transportation: Cars, airplanes, buses, taxis ▪ Electricity in your home ▪ Heating. 2. Thinking about your own every day activities, how much do you rely on non-renewable fossil fuels? 3. Do you think many people on the planet also use fossil fuels for similar reasons? Discuss options for reducing the level of pollution created by people. Think of 5 ways in which the global consumption of fossil fuels and creation of air pollution can be reduced. Write down your thoughts on poster paper together with your group.
Part 2 Using what you know about air pollution and its sources, design a basic plan for London that helps reduce the level of pollutants that are emitted into the air. As you are planning strategies for combating air pollution, think about the challenges you might face changing peoples’ behaviours. For example, would it be easy to get everybody walking rather than driving? How likely is that to happen? You might start by thinking about how you could change your own behaviour. Student Group Activity: Think of a community project that would focus around improving the air quality in the local area. Each group will need to answer the following question: - Who the project would benefit - How the project would best be advertised and would the project cost any money? - whether the project is short or long term, and what would need to be changed or added in terms of policies, transport facilities, community development etc. for the project to be put into place for a more long term time scale. Ask each group to write their idea on the poster, which they will then present briefly in front of the rest of the class. Each team should be prepared to answer questions from the rest of the class. End the class by asking which project they think would work best. Maybe the class can even present it to the principal and get the project brought into action!

94
Local Action Tips! CONSERVE ENERGY — Your home energy consumption translates into air pollution, therefore any energy conservation or efficiency improvements you make will help. MODIFY YOUR TRANSPORTATION — share a ride to work or use electric vehicles. Bicycle or walk to errands when possible. Most of the journeys in London are fast by foot than taking a car! ELIMINATE TOXIC CHEMICAL USE AT HOME — A surprising number of household or home shop chemicals are toxic and volatile. Many release vapours into the air, inside the home and out. This can be serious health threat to your family, and contributes to community-wide levels of air pollutants. PLANT LEAFY TREES AND SHRUBS — Deciduous trees and shrubs (the kinds that drop leaves in the fall) are excellent air filters to help reduce smog and cool the air on hot summer days. GET INVOLVED AND TALK TO YOUR LEGISLATORS — Many of our current governmental regulations are not strong enough to address our air pollution problems. You need to work with your legislators and ask for better policies. If you want advice on how to do this, visit ChangeLondon.org and go to the pupil page.
Homework Activity. Please complete the following task: 1. Article “Journeys in London are no longer and no different to anywhere else” with questions provided. Access the following link to reach an article about transport in London: Journeys that could be done without a car / http://www.aviewfromthecyclepath.com/ 2013/08/journeys-in-london-are-no-longer-and-no.html Student activity: Read the article and digest the data that is presented in the pie charts and the comparative bar chart. - What are the major differences between the usage of cars between London and the
Netherlands?
- Consider your daily activities from the moment you wake up to when you fall asleep. Is
there anything you could do to cut down on the amount of waste you produce?
- Discuss your thoughts with those around you and see what similarities there are in your
daily habits.
- Appoint a spokesperson for your group and report back to the class about how you might
be able to change your behaviour and make a difference to the environment.

95
Lesson 4: “Diffusion and pollutants” (BIOLOGY, CHEMISTRY) Length of Lesson: 1 hour 15 minutes
National Curriculum in England, for teaching from September 2015
https://www.gov.uk/government/uploads/system/uploads/attachment_data/file/381754/
SECONDARY_national_curriculum.pdf Biology page 60, Chemistry page 62 & 63

96

97
Part 1 Diffusion - Catch up
Diffusion in Animal Cells: The cells in our body need glucose and oxygen for respiration. Both of these are carried in the blood. When blood reaches the cells the molecules of glucose and oxygen diffuse out of the blood and into the cells. As cells use up the glucose and oxygen they produce waste chemicals and carbon dioxide. If these were to build up in the cells they would poison them, therefore they diffuse out of the cells into the blood. The body is in a continual process of particle delivery and exchange, enabled by the transportation system of the blood. Cells require Oxygen for respiration and in doing so produce Carbon Dioxide as a waste product. It is important to understand that O2 is exhaled into the lungs, and gets transported into the blood to our cells, so our bodies and function properly. Carbon dioxide leaves the cells to go into the blood stream to enter the lungs, and it is this that we exhale. In the diagram below we see how the deoxygenated blood (which is high in CO2) sees the CO2 diffuse into the alveoli that is temporarily a site of low CO2 and high O2 concentration. At the very same time, the O2 in the alveoli diffuses out of the alveoli and into the cells in the blood where there is low O2 concentration. This exchange is happening continually whilst we are alive!
Deoxygenated and Oxygenated Blood

98
Diffusion Pop Quiz! Questions: - When does diffusion occur? - From which area of concentration do particles spread to (low to high, or high to low?) - Can you name an example of when particles diffuse? Answers: - Diffusion occurs when particles spread. They move from a region where they are in high concentration to a region where they are in low concentration. Diffusion happens when the particles are free to move. This is true in gases and for particles dissolved in solutions. - Particles diffuse down a concentration gradient, from an area of high concentration to an area of low concentration. - For example:
▪ Oxygen Particles diffuse out of the alveoli (lungs) and into the blood, and carbon dioxide diffuses out of the blood and back into the alveoli (lungs) which we breathe out. ▪ When the smell of cooking travels around the house from the kitchen, this is also particle diffusion.
Diffusion of Anthropogenic pollutants in the air
In the case of anthropogenic pollutants, diffusion is still the process by which gases travel around the nearby area. Thus gaseous pollution produced in one area can affect the environment and organisms in other areas. Remember, particles continue to move from a high to a low concentration while there is a concentration gradient. When the particles are equally diffused the process of diffusion stops. The composition of the atmosphere In certain parts of the world, where it is very urban or where there is a lot of industry, we often inhale other gases such as nitrogen oxides, carbon monoxide and sulphur dioxide. Some of these substances (called pollutants) are directly harmful to humans. For example, carbon monoxide reduces the amount of oxygen that blood can carry. Sulphur dioxide, for instance, is particularly harmful to the environment by causing harm to humans indirectly through producing acid rain. Key Words: Particles; Concentration gradient; Diffuse;

99
Part 2 Accessing the AirSensa data If a school has its own AirSensa, the individual AirSensa data can be accessed by adding in the school specific log-in code, which is shared with the head teacher or head of faculty. If you (the teacher) have not yet received access to the log-in code and data please contact the individual who is responsible for the AirSensa and its data. Once you have typed in the log-in code you will see a dashboard page which contains graphs of key air pollutants, with their level of pollution against a time gradient. Teachers can alter the time average by adding in the time-frame of pollutant measurements in the task bar at the top of the page. The data can also be downloadable as an Excel CVC file, allowing students to draw their own graph, if applicable. If the school does not have its own individual AirSensa, Deliver Change will be able to supply a prepared data set for students to work with. In this case, please contact [email protected] to receive this information. Questions for students: Using the graphs available, please write down for each pollutant, the time of day when the most pollution is recorded.
Please state a season why you think this may be the case (think about the type and amount of activity that goes on the road).

100
Lesson 5: “Health Effects of Air Pollution” (BIOLOGY)
Length of Lesson: 45 minutes National Curriculum in England, for teaching from September 2015 https://www.gov.uk/government/uploads/system/uploads/attachment_data/file/381754/ SECONDARY_national_curriculum.pdf Biology page 60 & 61

101

102
Part 1

103
Part 2 Health effects of air pollution
Please read the text below Air Pollution and its impact on everyone Air pollution is something we can’t escape. We breathe it every day. In fact, every minute of every day, we breathe six to ten litres of air. If the air around us carries pollutants, those pollutants enter our bodies and can affect us in many ways. The air pollution is such a health risk that it is said to have caused almost 9,500 premature deaths in London in 2010, and this is from only two key pollutants: particulate matter 2.5 and nitrogen dioxide. Enough people are affected, and affected badly enough, that just in London, the health impacts of air pollution costs us millions of pounds every year. Air pollution is especially harmful to the very young and old. Infants and young children are at risk because their lungs are not fully developed and because they breathe faster. The elderly are at risk because their bodies are no longer as effective at dealing with environmental stress. Of course, since the respiratory system comes in direct contact with the air we breathe, it is the body system most likely to be affected by air pollutants. So people, who already have asthma, emphysema, or other respiratory conditions, people with heart or circulatory problems, and cigarette smokers are especially susceptible to the effects of air pollution. People who are young and healthy can be affected by pollution too. Air pollution can affect anyone. Even healthy teenagers, young adults, and strong athletes can suffer negative effects from high pollution levels, especially when exercising outdoors. A Tricky Question It’s a real challenge for scientists to study the health effects of different air pollutants. It wouldn’t be ethical for researchers to just put people in a lab and expose them to high levels of a pollutant. Outside the lab, people who live in heavily polluted areas are exposed to not just one pollutant but to many pollutants. Also, the concentration of each pollutant is changing all the time, in some cases independently of other pollutants. All of this makes it difficult to separate out the effects of each pollutant. In addition, how susceptible people are to the effects of air pollutants can vary widely. Think about a roomful of healthy people who are all exposed to the same cold virus. Some will develop a bad cold, others a mild cold, and others no cold at all. In a similar way, susceptibility to pollutants can vary greatly even among a group of healthy individuals. Finally, there are always many influences on our health. If you develop symptoms that might be caused by air pollution, it’s often difficult to be sure that pollution was “the” cause. Just as with other health problems, there are likely to be several factors affecting your health.

104
How Much Do We Know? One way to study the relationship between air pollution and health is to compare hospital records and death records to pollutant levels. Researchers have found that during extreme air pollution events, hospital admittances for respiratory problems increase. Death rates also increase, especially among the elderly and those who already have respiratory problems. Another type of research involves evaluating the effects of long-term exposure to pollutant levels that are high but not extreme. In one study, scientists analysed medical records of several thousand people who lived in an area where pollutant levels went above the National Ambient Air Quality Standards for 42 days or more. These people were 33 per cent more likely to have bronchitis, 74 per cent more likely to have asthma, and 37 per cent more likely to have lung cancer than people who lived in an area with clean air. Other studies have found these kinds of results as well. Finally, being affected by air pollutants is not just an “either/or” question. People can suffer from pollution to varying degrees. Although they may not be diagnosed with a specific disease, their health may be affected on a long-term basis in a way that reduces their quality of life. In general, we know that long-term exposure to irritants in the air can cause swelling and constriction of the airways, increased production of mucous, and paralysis of bacterial destroying cells. Normally, the cilia of the epithelial cells that line the airways make sweeping movements to keep the airways clean. The cilia move mucous, along with germs and dirt caught in the mucous, out of the respiratory tract. Air pollutants can irritate the cilia, so that their protective action slows down or even stops. This leaves sensitive tissues unprotected. The microorganisms and bits of foreign matter in the air are more likely to remain in the lungs. Here they can cause infections, lead to the development of lung diseases like chronic bronchitis and emphysema, and increase the chances of lung cancer. Although the part of our bodies most affected by air pollutants is the respiratory system, the circulatory system works in close relationship with the respiratory system, so it can be affected too. If the respiratory system is damaged or diseased, then it will not be as effective at exchanging gases with the blood. With less oxygen in the blood, the heart must work harder, pumping more blood to deliver the same amount of oxygen to the body. In this way, the heart and arteries can be stressed. When we inhale particulate matter (PM10 and PM2.5), these tiny bits of foreign matter travel deep into the lungs where they become lodged in the alveoli. These small, balloon like sacs are the point in our bodies at which oxygen exchange occurs. This is where the lung removes carbon dioxide from the blood and replaces it with oxygen from the air. Very tiny particulates, those less than one micron, can stay trapped here for years. They can irritate the alveoli, reducing their ability to work properly, and cause long-term

105
chemical and structural damage to the lungs. In contrast, carbon monoxide is unusual in that it has no direct effect on the lungs but is absorbed by the blood. Carbon monoxide readily combines with haemoglobin in red blood cells, taking the place of some of the oxygen that should be entering the bloodstream. Every moment, we are interacting with the air around us. Our bodies are constantly exchanging molecules with the atmosphere. Just as breath is essential to life, so too is the quality of the air we breathe essential to good health and the quality of our lives. Source: Students For Clean Air. Clean Air Program. Pima County Department of Environmental Quality. Tucson, Arizona

106
Section 6: Helpful links and further resources Eye on Earth: Interactive tool to display and discover information about the environment, including air quality information from monitoring stations and user feedback. www.watch.eyeonearth.org/ British Gas’ Generation Green: Produces lessons plans and resources linking issues of sustainability into different areas of the curriculum. www.generationgreen.co.uk/resources/type/activity EDF’s Energy Programme for Greener Schools: Resources and information on renewable energy schemes for schools, including example lesson plans. www.jointhepod.org/activities/ DCSF’s Energy Display Meters Programme (scheme now closed) Lessons plans and resources for schools, broken down into different Key Stage groups. www.energydisplaymeter.co.uk/lesson-plans/default.aspx Suschool: Child-friendly explanations and ideas for action on themes such as climate change, transport and energy efficiency. www.suschool.org.uk/ The Open Air Laboratories (OPAL) network: Lichen and air survey, guide and quiz www.opalexplorenature.org/LichenGuide

107
108
Contact us: Department: Environmental Sustainability
Address: St Aldate's Chambers, 109 St Aldate's, Oxford, OX1 1DS
Telephone: 01865 249811
Email: [email protected]