Lake Monitoring Report - Extension Sheboygan County
307
2015 Lake Monitoring Report Random Lake
-
Upload
khangminh22 -
Category
Documents
-
view
2 -
download
0
Transcript of Lake Monitoring Report - Extension Sheboygan County

2015Lake Monitoring Report
Random Lake

2015
Lake Monitoring Report
Random Lake
Sydney Rader

Copyright © 2016 by Sydney Rader. All rights reserved. For information: 141 East Shore Drive, Random Lake, Wisconsin 53075 [email protected] @randomlakewi

Abstract
Random Lake is subject to continual monitoring by a scientific program that includes phosphorus and chlorophyll assays, Secchi depth determinations, temperature and dissolved oxygen profiles. The program is under the auspices of Citizen Lake Monitoring Network. New lake data were recorded in 2015. The data show that water quality in Random Lake is reasonably stable except by invasion of Eurasian watermilfoil and curly leaf pondweed. Inevitable climate warming will have unknown consequences for Random Lake. Ice-in ice-out dates and weather data are being monitored. A summer blue-green algal bloom was documented. Herbicide treatments were reviewed and a possible reduction of dissolved oxygen in the north basin was noted. The fall turnover was clearly observed at the deephole. Study topics were listed. An annual report was published.
Keywords: limnology, Random Lake

Contents
Introduction……………………………………………………………………………..6
Secchi Depth…………………………………………………………………………..14
Phosphorus and Chlorophyll…………………………………………………………..23
Dissolved Oxygen and Temperature Profiles…………………………………………26
Lake Water Level……………………………………………………………………...31
Weather………………………………………………………………………………..36
Algal Blooms………………………………………………………………………….42
Controlling Invasive Aquatic Plants with Herbicide Treatments……………………..52
Ice-In Ice-Out………………………………………………………………………..112
North Basin Monitoring……………………………………………………………..115
Study Topics………………………………………………………………………....118
Bibliography………………………………………………………………………....119
Appendix. Monitoring Methods and Procedures…………………………………....121
Appendix. Plant Surveys…………………………………………………………...,171

Introduction
The purpose of this annual report is to publish, for the record, the new data gathered in 2015 about Random Lake. A secondary purpose is provide some context and analysis, drawing from the field of limnology.
Wisconsin DNR has systematized the collection of lake data and maintains a vast database. Access the data here. It is interesting to work with this data, charting and analyzing it. The reader will find examples in this report.
Monitoring of the lake began later in the year than desired because new personnel were not in place until June. Some background: For many years Wayne Stroessner diligently monitored our lake until his retirement in 2013 following the completion of his 2013 report. Fortunately for us he remains a mentor and biologist emeritus, which enabled a successful transition of the responsibilities to Janet Eisenhut who monitored the lake through 2014. Those responsibilities include Secchi depth readings and temperature and dissolved oxygen profiles and preparing lake water samples for total phosphorus and chlorophyll-a assays.
Unfortunately, Janet’s time was cut short due to a career move to Madison, Wisconsin and she was relieved by Carol Hertlein Sells' and Sydney Rader’s timely appearance. At the June 10th 2015 Random Lake Association meeting Carol and Sydney were interviewed as potential lake monitors. The meeting attendees included: RLA president Joan Knorr, Holli Feutz, Wayne Stroessner, incoming Village president Matthew Brockmeier, outgoing Village president Robert McDermott, Carol Sells, Sydney Rader and others. The follow-up meeting was held on June 14, 2015 and among those present were Janet Eisenhut, Wayne Stroessner, Joan Knorr, Carol Sells, and Sydney Rader. Thismeeting confirmed Carol and Sydney as official lake monitors and the handoff of supplies and equipment from Janet to Sydney was completed. Included in that equipment was the project's impressive $1K dissolved oxygen meter generously provided by the Random Lake Association!
Wayne Stroessner provided the new monitors important “on the lake” training in certain key lake monitoring procedures, namely, Secchi depth and water sampling for phosphorus and chlorophyll assays. In addition Wayne took Carol Hertlein Sells and Sydney Rader to the location where most of the key observations are made, ensuring consistent and accurate identification of the 22-foot-deep “deephole”.
The expertise and continued mentoring by Biologist Emeritus Wayne Stroessner is a gift
6

to Random Lake that deserves to be highlighted. On June 21 he advised:
If you want to read about weed treatment results of past years, you can read Pp 35-38 in the 2013 monitoring booklet. There are descriptions of dying timeelement and general appearance of the treated plants. This might help inknowing what to look for.
Just today, with the wind blowing in our direction, our lakefront was loaded with floating plants - mostly Eurasian Water Milfoil, but also some Curly Leaf Pond Weed, Native Milfoil, Sago Pondweed, some Bladderwort and others.
In July Wayne sounded an alert regarding blue green algae (potentially toxic) that werethen blooming:I
I was able to collect two of those dark ±1” globs of decomposing floating algae - the ones that a rich supply of Planktothrix rubescens was found. The first one was the larger and fell apart as it flowed into the jar. Thesecond one stay together fairly well. I placed them in our freezer but, as you know, glass jars generally break as the water expands. I should have placed them in plastic containers but grabbed the most convenient one because I wanted to pick them up while they were near the pier. You can them up from me anytime.
This alert set off a flurry of activity that resulted in the microscopic confirmation of Planktothrix rubescens in colonies that resembled chunks of soft liver tissue floating in the lake water. We are grateful to Wayne for having the expertise and knowledge of this particular algae and that its blooms recur year after year. Wisconsin DNR experts weighed in on this bloom. (See report section 'Algal Blooms'.)
7

CITIZEN LAKE MONITORING PROGRAM
The Citizen Lake Monitoring Program began in 1986 under the auspices of the Wisconsin Lakes Partnership. Currently 1100 volunteers gather water quality data on 850 Wisconsin lakes. There are five types of monitoring:
• water clarity• water chemistry• ice-on/ice-off• aquatic invasive species• native aquatic plants, levels I, II and III
For 2015 information, raw data and questions contact:
Sydney Rader ([email protected]) for water clarity, water chemistry and ice-on/ice-off monitoring.
Carol Hertlein Sells ( [email protected] ) for aquatic invasive species and native aquatic plants, levels I, II and III monitoring.
8

UNDERSTANDING LAKE DATA
This short treatise on limnology is quite good background reading for this report. This, too.
THE PHYSICAL LAKE
Random Lake is a remnant of glacial action some thousands of years ago. Monumental glaciers gouged and scraped the terrain. Much rocky debris was entrained in the ice. When the ice melted, moving water eroded the terrain and copious deposits of rocks were left on the surface. The result was an irregular surface of lakes and hills, littered with glacial till.
As soon a suitable habitat opened up, plants, animals and microbes occupied biological niches in the terrain. Gradually, top soil accumulated, enabling more and more biomass to grow. Before European settlement, Wisconsin was home to natural ecosystems of stupendous beauty. Something has been lost since nature at its richest gave way to human settlement.
Presumably Random Lake was once much deeper. Gradual erosion of the banks and suspended solids carried by incoming stream water put sediments on the lake bottom. Wind blown dust makes a contribution to filling in the lake. Dead and decaying biomass makes a large contribution. A lack of oxygen in the lake bottom means that organic debris does not decompose, it accumulates. Some locals opine that some places in Random Lake have become shallower within their memory.
When one probes the lake bottom, it is found to be very soft and deep in most places. I had no trouble driving a pipe 8 feet deep on the eastern shore. How far down is bedrock?No less an authority than Dan Klotz believes the soft sediment is at least 30-40 feet deep. Bedrock has not been found. This is the sediment that has accumulated since the ice age.
Of the present day hydrology of Random Lake, a 'drainage lake,' note that Spring Lake overflows into Random Lake which overflows into Silver Creek which ultimately runs into Lake Michigan at Milwaukee. Add rainfall and snow to this. Subtract evaporation. But much is unknown, such as the movement of groundwater in and out of the lake. If we knew the hydraulic retention time, we could say something about the rate at which undesirable nutrients are cleared. We do know that phosphorus concentration has not clearly trended up or down over the years, meaning that phosphorus is entering the lake about as fast as it is leaving. Phosphorus could enter from Spring Lake water, from local
9

runoff of rainwater, from leachate, from organic matter that falls into the lake, from groundwater, and potentially from leaking sewer pipes. Nitrogen is not being monitored in Random Lake but it is undoubtedly there, an unwanted nutrient that fuels the growth of algae and plants.
Physical profile of Random Lake:
Area: 209-212 acresShoreline: 3.6 milesVolume: 1280 acre feetDeepest sounding: 23 feet verified by authorAverage depth: 6 feetUnder 3 ft depth: 14%Over 20 ft depth: 4%3D map of lake bottom: Bathymetric mapElevation: 867 feet above sea levelRange of water level: + 17.8 inches (2004) - 7.6 inches (2012)Bottom: 10% sand, 15% gravel, 0% rock, 75% muck Area of watershed: ?Alkalinity: 172 ppmMean phosphorus: 21.6 μg/LStratification dynamic: dimictic
10

Bathymetric map November 1968:
North Basin
Deephole`
11
owner
Line
owner
Line

TROPHIC STATE OF RANDOM LAKE
Random Lake has been scored as consistently eutrophic in recent years–as having waters rich in phosphates, nitrates, and organic nutrients that promote a proliferation of plant life, especially algae.
Source
It is some sort of consolation that Random Lake is, by several measures, stable. It is not getting worse—until invasive species are considered. Eurasian watermilfoil and curly leaf pondweed have invaded with serious consequences. Further invasions threaten and we need to be vigilant.
IS RANDOM LAKE BECOMING SHALLOWER?
It is normal for lakes to become shallower over a long period of time. Anecdotally some long-time residents have commented that the lake bottom has filled in or become shallower. Unfortunately there is no quantitative evidence to bear on the question, though the question itself is very interesting. At best there could be a study going forward. For starters the bathymetric map made in November 1968 could be re-done.It is left as an exercise for the reader to design a study of the question.
12

NOTES
This report was created in LibreOffice 5.0 free office suite and Adobe Acrobat DC.
Interested readers may enter Our Waters, Our Future Writing Contest, deadline February 1, 2016.
Please report errors and omissions in this report to the author.
13

Secchi Depth
Secchi depth is a measure of visibility down through a lake water column, as one looks down from the surface. If the water is clear and unturbid, the visibility may extend many feet down, perhaps even to the lake bottom. If the water is turbid, it is because particles of various kinds and sizes are suspended in the water, and these particles act as small obstructions to the passage of light. These small obstructions are cumulative until light no longer reaches below a critical depth. If light doesn't penetrate into deep water, then neither can we see things at that depth. (And neither can plants photosynthesize sugars.) Visibility requires that light be both incident and reflected. For example, to see the bottom of a lake, light must reach the bottom and be reflected back to the observer. Secchi depth and turbidity have a reciprocal relationship: when turbidity is high, Secchi depth is low.
The method for determining Secchi depth relies on a simple apparatus, the Secchi disc (Appendix: Methods and Procedures). The resulting visibility measurement is expressed in feet or meters. The Secchi method is used throughout the world as a quick and easy way of characterizing lake water quality.
Secchi depth has been monitored for many years at Random Lake and new data for 2015 are in:
06/05/15 06/25/15 07/15/15 08/04/15 08/24/15 09/13/15 10/03/15 10/23/150
1
2
3
4
5
6
7
Secchi Depth (Visibility) at Deephole and North Basin
Random Lake Time Series 2015
Secchi depth at deephole (ft) Secchi depth at north basin (ft)
Date
Se
cch
i De
pth
in F
ee
t
14

In 2015 monitoring began late. Springtime monitoring was missed. The 2015 Secchi data were uploaded to Wisconsin DNR SWIMS data base as a safe repository where all can access it. Two positions on Random Lake were monitored: the south basin deephole (N 43deg 32.998min W 87deg 57.423min) and the north basin deepest part (N 43deg 33.516min W 87deg 57.277min).
(See map on page 11 for monitoring locations.)
Not surprisingly there is little difference in Secchi depths at two locations on the same lake for a given date.
It is believed that in Random Lake the main detriment to water quality and clarity, as reflected in the Secchi measurement, is a suspended microbiome including algae: single-and multi-cellular plants that thrive because of unnaturally high nutrient levels. In other words, greenish algae are the main cause of the observed turbidity and murkiness. Certainly when lake water is filtered through a membrane filter, the greenish algae are retained on the filter. Another plausible cause of turbidity is a temporary stirring up of bottom sediment. At the deephole of Random Lake, the latter effect should be minor.
To put the 2015 Secchi data into perspective, we should compare Random Lake with other nearby lakes, and compare Random Lake 2015 data with previous years' data:
As this graph shows, all lakes are not the same when viewed from the perspective of
4/26/20155/16/2015
6/5/20156/25/2015
7/15/20158/4/2015
8/24/20159/13/2015
10/3/201510/23/2015
0
5
10
15
20
Comparison of Three Lakes' Secchi Depths 2015
Random Lake - Lake Ellen - Pigeon Lake
Secchi depth (ft) mesothrophic Lake Ellen 2015
Secchi depth (ft) euthrophic Random Lake 2015
Secchi depth (ft) mesotrophic Pigeon Lake 2015
Date
Se
cch
i De
pth
in F
ee
t
15

water clarity. The source of this data is the SWIMS database which holds water quality data on most Wisconsin lakes.
Now we are going to compare water clarity among several recent years. Secchi data from Random Lake deephole were collected for the years 2011-2015. Thesampling dates were converted to DAY of YEAR to facilitate inter-year comparisons. From the graph it appears that 2011 and 2014 (blue and green lines) had comparatively clearer lake water. 2012 (red line) was a year of comparatively turbid water. 2013 (yellow line) and 2015 (purple line) had water of intermediate turbidity. However, in late summer of 2015 the lake water was about as turbid as it has ever been in recent years at 3.5 ft Secchi depth. To visualize all of this, see the following graph:
16

120 140 160 180 200 220 240 260 280 3000
2
4
6
8
Comparative Secchi Depths in Various Years 2011-2015
Random Lake deephole
Secchi Depth in feet 2011 Secchi Depth in feet 2012Secchi Depth in feet 2013 Secchi Depth in feet 2014Secchi Depth in feet 2015
Day of Year
Se
cch
i De
pth
in f
ee
t
17

We will have more to say about it later, but Secchi depth is weakly correlated with two other measured variables: 1) total phosphorus concentration in lake water, r = -0.17 and 2) chlorophyll-a concentration in lake water, r = -0.33. Phosphorus and chlorophyll are weakly correlated, r = 0.34. Drawing on 2009-2015 data from Random Lake deephole, correlation plots were made. The elongation of the scatter plots is a graphical indication of correlation, be it strong or weak. See the following graphs:
18

4 6 8 10 12 14 160
1
2
3
4
5
6
7
8
Correla on: Chlorophyll and Secchi Depth 2009-2015Random Lake deephole
Pearson correla on coefficient = -0.33
Secchi Depth in feet
Ch
loro
ph
yll m
g/L
19

14 16 18 20 22 24 26 28 30 320
1
2
3
4
5
6
7
8
Correla on: Phosphorus and Secchi Depth 2009-2015Random Lake deephole
Pearson correla on coefficient = -0.17
Secchi Depth in feet
Ph
osp
ho
rus
mg/
L
20

14 16 18 20 22 24 26 28 30 320
2
4
6
8
10
12
14
16
Correla on: Phosphorus and Chlorophyll 2009-2015Random Lake deephole
Pearson correla on coefficient = 0.34
Chlorophyll mg/L
Ph
osp
ho
rus
mg/
L
21

390
10
8
E
-E 6 C. Q)
"O
� 'o
i 4
2
0
CHAPTER 20 APPPLIED LIMNOLOGY
5 10 15 20 25 30 35 40
Chlorophyll a, µg \iter-1
Figure 20-1 Generalized relationship between acetone extracts of chlorophyll a from phytoplankton and Secchi disk depth in lakes. The shaded area shows the variability to be expected with different lakes at different seasons. This relationship will be poor if algae are present in large clumps (Fig. 12-2). Water color or turbidity from suspended sediments m?Y also distort this relationship.
over a limited range do small changes in algal concentration produce large changes in transparency (Fig. 20-1 ).
A complicating factor in some eutrophic lakes is the presence of chlorophyll contained in large clumps of blue-green algae up to a few centimeters in diameter. Other phytoplankters are dispersed as individuals or short filaments. Clumps produce higher than expected transparency for any given chlorophyll level. Under such conditions, the Secchi disk may seriously underestimate nuisance conditions.
In very clear lakes, considerable eutrophication may occur before any change in Secchi depth is noted. In some cases, increased growth of attached algae at the edges may be the most obvious change. This has occurred in the clear littoral waters of oligotrophic Lake Tahoe (Goldman, 1981). Even though the Secchi disk is often a good indicator of lake eutrophication, no one measure is likely to establish the necessary criteria for lake restoration. This chapter discusses several measurements used to evalu-
ate the progress of lake restoration. These include Secchi disk, chlorophyll, attached algae, primary productivity, oxygen, an�changes in fish, zoobenthos, and zooplankton populations.
Dun st et al. ( 197 4) have listed 17 types of potential methods for lake restoration which involve both lake and watershed- management strategies. The best-known examples of watershed management concern sewage and other wastewater treatment or diversion, although reforestation may also be important. Diversion usually sends the problem elsewhere, yet has been the most widely used method of curbing wastewater inputs. Studies of wastewater diversion from lakes, such as in Lake Mendota, Lake Washington, Lake Tahoe, and Lake Zurich, are important because they illustrate the causes and effects of nutrient loading. First, diversion can prove that human pollution was responsible for much of the nuisance. Second, diversion shows that the gross features of eutrophication are, to a large extent, reversible in most lakes. Third. long-term inputs from old sewage leach fields.
CASE STU
sediment: for man)I sewage d
CASE Sl
Lake Wa
Lake W: is a larg1 type (A=
lessons tion are limnol� effect of over the 1972a, I
Early mesotro top Ian.kt minimu1 mid-19� by the f and thi
droppe< within 1
sightly duced tcleanuJl
Thee deteri01 restore sewage nearby in the from a, also e1 suggesl sewage could I loggini in the, ignore. proper tion, n to dra
22

Phosphorus and Chlorophyll
Of all the scientific measurements that could be performed on lake water, phosphorus and chlorophyll assays are the agreed essentials. Wisconsin DNR supports and pays for these tests which are done across most Wisconsin lakes in a routine manner. CLMN personnel collect water samples per schedule and ship them to Wisconsin State Laboratory of Hygiene for analysis.
When it comes to growing algae, phosphorus is usually the essential nutrient that is present in growth limiting quantity. Other growth factors are required, like nitrogen, but they are not usually limiting. Elemental phosphorus is a component atom of phospholipids, nucleotides, nucleic acids, and RNA and DNA macromolecules that are common to algae and all other organisms.
Phosphorus is contained in common items like detergents, fertilizer, manure, human waste and decaying plants. These can come from many sources, including runoff from agricultural and urban land, airborne particles, septic systems and industrial discharges, and fertilizer. There are also naturally-occurring sources ofphosphorus in lakes, such as decaying organic matter, and eroding rocks and soils. Source
Green colored Chlorophyll a is a specific form of chlorophyll present in algae and other plants and is essential for photosynthesis. Chlorophyll a in algae is on the order of 1% by dry weight. The biomass of the algae in the lake water is of the greatest interest, while the chlorophyll assay is merely a convenient indicator of that biomass. Measuring chlorophyll is much easier than counting or weighing algal cells.
Results of several years' monitoring of Random Lake for phosphorus and chlorophyll are presented. Included are the latest results in summer 2015. The general impression is that Random Lake is fairly stable. It would be hard to argue that phosphorus or chlorophyll is trending either up or down. Such stability is a consolation.
23

The highest phosphorus concentration ever recorded for Random Lake was 44 μg/L back in 1997. The least was 8 μg/L in 2006. These extreme values have the appearance of outliers.
Now a question is posed. Lawn fertilizer is undoubtedly used on lawns in Random Lake watershed. Making reasonable assumptions about its use, calculate the increase in concentration of phosphorus and nitrogen in lake water. This is left as an exercise for thereader. Note: most lawn fertilizer sold locally is phosphorus-free, but garden fertilizer is not.
Imagine if something happened to suddenly increase phosphorus concentration in lake water. This could be a heavy application of agricultural fertilizer in the watershed, followed by a heavy rain. Then we would expect growth of algae and perhaps we would observe an algal bloom. In our measurement of chlorophyll at the deephole, we would find increased chlorophyll concentration. In other words, we might predict a positive correlation between phosphorus and chlorophyll. Indeed, analysis of available data shows such a correlation (see Secchi Depth). And if phosphorus or chlorophyll should increase, Secchi depth is predicted to decrease as lake water becomes more turbid from algae. In other words, we predict that Secchi depth is negatively correlated with phosphorus or chlorophyll.
Too much algae in lake water is not only aesthetically displeasing, it could deplete dissolved oxygen, causing zooplankton and fish to die. This could happen in two ways:1) At night, algae respire, consuming oxygen2) Dead algae are decomposed by bacteria, a process requiring oxygen
02/22/08 07/06/09 11/18/10 04/01/12 08/14/13 12/27/14 05/10/160
5
10
15
20
25
30
35
Total Phosphorus and Chlorophyll a
Random Lake Deephole
phosphorus ug/L chlorophyll ug/L
Sampling Date
Co
nce
ntr
atio
n in
ug
/L
24

As far as I know, serious oxygen depletion has not yet happened in Random Lake. (Death of abundant Eurasian watermilfoil by herbicide treatment could also deplete oxygen.)
Collection of a water sample from the top six feet of the lake
25

Dissolved Oxygen and Temperature Profiles
WATER TEMPERATURE PROFILES
In the months June to November, the temperature profile of the lake from 0 to 22 feet deep was periodically measured and recorded. That is, the water temperature was repeatedly measured at various depths below the surface. The lake was temperature-stratified from June until the fall turnover on October 12. After October 12 the lake was isothermal from top to bottom.
The temperature and DO measurements were taken using a YSI dissolved oxygen meter.The probe that is lowered into the water has both temperature and DO sensors:
26

These results are neither surprising nor unexpected. With the onset of autumn, cooler air over the lake and reduced sunlight caused the lake water to cool until until mixing occurred on October 12. Then the lake water was isothermal from top to bottom. Whereas, for the warm months, the lake was stratified.
0 5 10 15 20 250
5
10
15
20
25
30
Temperature Profiles June-November 2015
Random Lake Deephole
06/24/15 07/01/15 07/09/15 07/10/15 07/15/15
08/11/15 09/11/15 10/12/15 10/14/15 11/02/15
Depth of Lake Water in Feet (Surface = 0)
Tem
pe
ratu
re in
De
gre
es
Ce
lciu
s
27

FALL TURNOVER
The fall turnover occurred on about October 12, 2015 on a day when temperature and dissolved oxygen profiles were fortuitously taken. Temperature and oxygen stratificationwere no longer. Given a thorough mixing of the lake water, the water at all depths was atthe same temperature or “isothermal”. The mechanics of fall turnover or overturn are explained here and in many other places. Random lake is dimictic, that is, it has both a spring and a fall overturn. The date of spring turnover 2015 is unknown but it would have followed closely on the date of ice-out (March 30, 2015).
06/05/15 06/25/15 07/15/15 08/04/15 08/24/15 09/13/15 10/03/15 10/23/15 11/12/150
5
10
15
20
25
30
Water Temperature at Surface and at Bottom
Random Lake Deephole
surface 22 foot depth
Date
Water temperature degrees C
28

DISSOLVED OXYGEN PROFILES JUNE-NOVEMBER 2015
On the same dates as the determination of temperature profiles, dissolved oxygen profiles were measured and recorded. One instrument, the YSI DO meter, was used to measure both temperature and DO simultaneously.
Typically, the top layers of the lake were always oxygenated, while the bottom layer contained little or no oxygen during the warm months. Oxygen was not being replenished to the stagnant bottom layer while bacterial decomposition of organic matterwas depleting any available oxygen. Decomposition of organic material at the bottom is limited by scarcely available oxygen, meaning that a lot of organic material remains undecomposed at the bottom. However,
Methane from freshwater is often a byproduct of bacterial metabolism, as bacteria break down organic matter under low-oxygen conditions, like in the
0 5 10 15 20 250
2
4
6
8
10
12
Dissolved Oxygen Profiles from June to November 2015
Random Lake Deephole
06/24/15 07/01/15 07/09/15 07/10/15 07/15/15
08/11/15 09/11/15 10/12/15 10/14/15 11/02/15
Depth below lake water surface in feet
Dis
so
lve
d O
xyg
en
Co
nce
ntr
atio
n u
g/L
29

sediment at the bottom of a lake. Source
At fall turnover on or about October 12 the lake water strata mixed and oxygen was reintroduced to the depths.
30

Lake Water Level
Monitoring of lake water level resumed in 2015 using a new gauge. The gauge was installed on the eastern shore at N 43deg 33.278min W 87deg 56.923min, situated among cattails on the author's shallow shoreline. The vertical gauge is a 10-foot long PVC electrical conduit pipe deeply embedded in bottom muck. About 8 feet of the pipe are embedded in muck, and about the top two feet are standing in water and then air. The“normal” mark corresponds with the normal mark on Wayne Stroessner's gauge which has been used for many years to record lake levels.
Unfortunately Random Lake lacks a properly surveyed water elevation gauge that wouldindicate water level as the number of feet and inches above sea level. It would be a costly undertaking to install a monument in the lake bed and to place a mark of accurately and precisely known elevation. Rachel Sabre of Wisconsin DNR said that their protocol for maintaining official elevation gauges calls for biannual checks by a surveyor. The nominal water elevation of Random Lake is 867 feet. Upstream Spring Lake is nominally 872 ft elevation.
In current practice lake level is reported in inches of water above (+) or below (-) the “normal” level mark, using the ad hoc gauge described above. In establishing the new gauge, called “gauge east”, pains were taken to calibrate the new gauge by bringing it into agreement with the old gauge. For the several near-simultaneous readings taken on old and new gauges, good agreement was found. The error or disagreement between Rader's and Stoessner's gauges is no more than about a half inch. Going forward more confidence-building checks can be made as long as Rader and Stroessner collaborate over their respective gauges.
31

A further defining note on “normal” lake level: the lake level is normal when Random Lake is brim full at the concrete outflow dam on Highway 144 and outflow of water is negligible.
Why measure lake level? For anyone interested in hydrology, lake level has implicationsfor water flow rates in and out of Random Lake which is a drainage lake, water availability, shoreline flooding or dessication, limnology, shoreline infrastructure planning, etc. For a personal and practical reason, I care about lake level because my basement slab is near the water table bordering Random Lake. When lake level is too high my sump pump runs continuously, threatening basement flooding.
Adding to lake water level are precipitation, in-flow from Spring Lake, and perhaps changes in ground water flow. Subtracting from lake water level are evaporation, out-flow into Silver Creek, and perhaps changes in ground water flow. The role of ground water movement, or swells in groundwater waves, is speculative. The hydraulic retention time for Random Lake has not been determined: the time needed for all of the water in the lake to flow into Silver Creek.
Historic water levels on Random Lake for the years 2003-2015 are in the author's database and would be shown succinctly in a graph except that it would take an
32

impractically wide graph. The lake level observations during this time period number over 500 and almost all of them were made by Wayne Stroessner. Exhibit A shows waterlevels in 2004, including the highest water level ever recorded on Random Lake. Water level on Random Lake can be higher than the dam at Highway 144, provided that water enters the lake much faster than it exits via the bottleneck at the dam. A heavy rain within Random Lake drainage basin, or a series of heavy rains, can certainly raise lake level. Exhibit B shows water levels in 2012, including the lowest water level ever recorded. Lack of rainfall together with evaporation explains why lake level can be lower than normal.
33

Exhibit A. Historic high water level on Random Lake
03/25/2004 05/25/2004 07/25/2004 09/25/2004 11/25/2004
-5
0
5
10
15
20
Random Lake Water Levels in 2004
...the year of historic high water level
Date
Deviation from "normal"
water level in inches
34

Exhibit B. Historic low water level on Random Lake
03/17/2012 05/17/2012 07/17/2012 09/17/2012
-10
-8
-6
-4
-2
0
2
4
Random Lake Water Levels in 2012
...the year of historic low water level
Date
Deviation from "normal"
water level in inches
35

Weather
Air temperature at Random Lake is recorded daily by a weather station at Random Lake School District. The station is a WeatherBug by Earth Networks operated by teacher Michael April. THE SOUNDER newspaper carries a weekly feature This Week's Weather on page 6, reporting this same air temperature and rainfall data.
36

04/06/15 05/26/15 07/15/15 09/03/15 10/23/15 12/12/150
10
20
30
40
50
60
70
80
90
100
Daily High and Low Air Temperatures at Random Lake
Compared with Normal Monthly Air Temperature at Plymouth WI
high temp(degF) low temp(degF)
Normal Monthly Temp. Plymouth WI (degF)
Date
Air
Te
mp
era
ture
in D
eg
ree
s F
ah
ren
he
it
37

Air temperature has a large effect on lake water temperature:
Because lake water is warmed by incident sunlight (as well as by contact with air) during the day, the surface water temperature at midday is more like the daily high air temperature than like the daily low (see foregoing graph).
05/16/15 06/05/15 06/25/15 07/15/15 08/04/15 08/24/15 09/13/15 10/03/15 10/23/15 11/12/15 12/02/150
10
20
30
40
50
60
70
80
90
100
Daily High and Low Air Temperature at Random Lake
Compared with Random Lake Water Surface Temperature
Air high temp(degF) Air low temp(degF) Water surface temp (degF)
Date
Tem
pe
ratu
re in
De
gre
es
Fa
hre
nh
eit
38

The Random Lake weather station also records daily rainfall:
Actual monthly rainfall at Random Lake is compared with climatological average rainfall at Plymouth WI:
06/02/15 07/02/15 08/02/15 09/02/15 10/02/15 11/02/150
0.2
0.4
0.6
0.8
1
1.2
Daily Rainfall at Random Lake
precipitation(in)
Date
Inch
es
of R
ain
fall
5.5 6 6.5 7 7.5 8 8.5 9 9.5 10 10.50
0.51
1.52
2.53
3.54
4.5
Monthly Rainfall at Random Lake 2015
Compared with Normal Rainfall at Nearby Plymouth WI
Monthly Rainfall Random Lake (in) Monthly Normal Rainfall Plymouth WI (in)
Month
Inch
es
of R
ain
fall
39

Thus Random Lake received less than average rainfall during the summer and fall months. (If we accept Plymouth WI rainfall norms as a fair substitute for Random Lake norms.)
2014 was the warmest year on record (globally). However, Central and Eastern North America was the only major region to experience a below-average annual temperature in2014. For instance Plymouth, Wisconsin, where a NOAA weather station is located, reported a 2014 mean surface air temperature of 42.2 deg F which is 3.5 degrees below normal. As shown below the Mississippi valley experienced an unusually cold year, while over coastal regions of the US were warmer than normal.
40

Mean temperature and precipitation in 2014Source: State of the Climate in 2014
2015 is considered certain to be even warmer than 2014.
Source: New York Times 21 October 2015
The Difference Between Climate and Weather
As background reading see this and this.
41

Algal Blooms
Wayne Stroessner noted algal blooms in Random Lake in past years. Especially concerning were those blooms involving blue-green algae that potentially contain cyanotoxins. He was first in 2015 to notice a recurrence of a bloom like earlier blooms associated with blue-green algae:
I did see four very dark ±1 inch diameter balls of slimy looking algae floating at the surface next to my pier. The last time those appeared, I took samples to John Masterson at the Plymouth DNR office and, with his microscope, we were able to find a rich supply of Planktothrix rubescens - the blue-green cyanobacteria (or algae - in the old book) "...they are known producers of potent hepatotoxins called microcystins." - Wikipedia [July 10, 2015]
And on a subsequent date:
I was able to collect two of those dark ±1” globs of decomposing floating algae - the ones that a rich supply of Planktothrix rubescens was found. The first one was the larger and fell apart as it flowed into the jar. Thesecond one stay together fairly well. I placed them in our freezer...[July 23, 2015]
On July 18 the author noticed an unusual organic glob of a different kind:
42

A glob of soft organic matter found in Random Lake near boat launch
Of this green glob Carol Sells observed:
I have observed these clumps in the lake for several weeks. They are near our pieras well as along the west and north shores and other piers. I don't recall them from past summers...[July 22, 2015]
On microscopic examination, the glob was found to contain a variety of unidentified organisms: algae, zooplankton, phytoplankton. We do not know if this green glob evolves into the dark glob (see below) or if it is a different kind of bloom altogether.
43

Microscopic study of a dark globular sample collected by Stroessner on July 23 led to a tentative identification of Plank t othrix rubescens, a blue-green algae:
Photomicrograph by the author, 400x bright field microscopy. Filament at centerresembles reference photos of Planktothrix rubescens. Filament diameter 5-10
micrometers.
44

Here is a reference photo of Planktothrix rubescens:
On July 29 Stroessner reported:
Today we noticed many of those ±1" diameter dark globs of algae and if the microcystin level is high, we may need an alert the public about the use of the beach and/or lake.
On July 30 the author replied:
In confirmation I've found a massive dark glob near library bay. First step: microscopic examination.
Further algal specimens were found in library bay on July 31, 2015. A sample is preserved in the freezer. The dark red-brown colonies have about the same density as lake water. The tissue is soft and cohesive yet easily torn. It is not known what precedes and what follows the emergence of this particular stage of the bloom. In general, algal blooms are finely divided or else coalesce as metaphyton. I am aware of no precedent for this particular form of bloom.
45

Dark globular organic masses in lake water in library bay(Two dark objects near center of photo)
46

Dark globular algal bloom (ChapStick for size reference)
47

Microscopic examination of a dark globular sample by the author again implicated Planktothrix rubescens:
Photomicrograph by author, 400x, bright field microscopy. The filaments resemblereference photos of Planktothrix rubescens
To summarize: during the algal bloom of July, dark globs were found scattered all over the lake. This discomfiting event set off a flurry of email traffic among lake monitors, Village officials, and DNR personnel (see Appendix. Algal Bloom July 2015). This way of communicating proved efficient and effective. Wisconsin DNR research scientist, Gina LaLiberte, had the last word on Random Lake's algal bloom of late July:
Heidi, John, or Rachel -- please forward to lake association members and homeowners as appropriate. I’m not sure of who everyone is in the email string below.
Yes, that micrograph looks like it might be Planktothrix rubescens. If any
48

advisories are going to be posted at Random Lake, Sheboygan County Public Health staff need to be involved, as only public health officers have the authority to post health advisories. I would recommend contacting David Roettger, who is the Environmental Health Supervisor. ([email protected], 920-459-0325)
This may or may not be a strain of Planktothrix that can produce microcystins. If it is, it is not likely to be producing toxins continuously. If the county or lake association want to pursue toxin testing, they can have that done through the Wisconsin State Laboratory of Hygiene – I can put them in contact with the lab if they are interested. However, please be aware that bloom conditions can change rapidly, and there will be a delay in getting results, so hypothetically a bloom thatisn’t producing toxins when you collected a sample on Monday might be producing them on Wednesday when you get sampling results back. For that reason, we want people to be cautious about exposure to blue-green algae, and in this sense exposure means ingesting it or inhaling it in water droplets. Some people may also experience skin irritation such as rashes from exposure.
Here are some commons sense recommendations for recreational safety. Althoughthese recommendations were written for planktonic blue-green algae blooms, which are suspended in lake water, they would also apply to the Planktothrix clumps that float on the surface of Random Lake.
Since we cannot determine if a blue-green algal bloom is producing toxins just by looking at it, we want people to be wary of any high concentration of blue-green algae in water. For a good rule of thumb, if you can wade knee-deep into water (without disturbing the sediment) and cannot see your feet because the water is green and opaque, or the water is any other unusual color, you should stay out. Algae cell densities are high enough that if the algae are producing toxins, you could become ill if you swallow water or inhale water droplets. Small children and pets should always be kept away from water in these conditions, since they are more likely to accidentally swallow water. At lower densities, you still want to avoid swallowing water as other pathogens may be present. Since the Planktothrix in Random Lake floats in colonies on the water, it’s a little harder to use the knee-deep test to gauge algae levels. Try to avoid swimming in areas with many floating clumps, and avoid swallowing them if they are present in areas where you are swimming. Most people will likely want to keep them out of their
49

mouth, but dogs might not, so try to keep dogs out of areas with the floating clumps.
If you use common-sense precautions, you can safely enjoy recreation on Wisconsin’s lakes and rivers:
· Choose locations without noticeably green water for swimming, because wind can concentrate blue-green algal blooms into near-shore areas. Do not swim in water that looks like "pea soup", green or blue paint, or that has a scum layer or puffy blobs floating on the surface.
· Do not boat, water ski, etc. over that looks like "pea soup", green or blue paint, or that has a scum layer or puffy blobs floating on the surface (people can be exposed through inhalation).
· Do not let children play with scum layers, even from shore.
· Always offer fresh, clean water for pets to drink. Do not let pets swim in, or drink, waters experiencing blue-green algae blooms or noticeably green water.
· Always take a shower after coming into contact with any surface water (whether or not a blue-green algae bloom appears to be present; surface waters may contain other species of potentially harmful bacteria and viruses).
· Pets should be washed off immediately after swimming, before they groom.
· Always avoid swallowing untreated surface water – it may contain pathogens other than blue-green algae which could make you ill.
The Wisconsin Department of Health Services has provided the following guidelines concerning fish consumption:
· Algal toxins have not shown to accumulate to acutely toxic levels in the fillet.
· Clean fish thoroughly and discard the viscera and guts, where toxins may accumulate.
· Wash hands after handling fish caught during an algal bloom.
There are still many unanswered questions about algal toxins in fish. The science is still emerging on chronic effects of consuming many fish meals over time when the fish live in water bodies that repeatedly experience heavy blooms. The DNR
50

has a website with more information on safe eating guidelines: http://dnr.wi.gov/topic/fishing/consumption/index.html
There is more information on blue-green algal blooms at the DNR’s website: http://dnr.wi.gov/lakes/bluegreenalgae/
and at the Department of Health Services’ website: https://www.dhs.wisconsin.gov/water/bg-algae/index.htm
51

Controlling Invasive Aquatic Plants with Herbicide Treatments
The Village of Random Lake has a program to control aquatic invasive weeds in the lake. The main pests are the abundantly growing Eurasian watermilfoil (exhibit A) and curly leaf pondweed (exhibit B) which interfere with recreational use of the lake. The “crown jewel” of the village needs care and grooming if it is to maintain its character as a recreational lake and home site. The invasive weed program involves the Village Board and the Lakes, Parks and Recreation Committee. Other parties to the program are Wisconsin Department of Natural Resources, Marine Biochemists, Random Lake Association, and the public.
Eurasian water milfoil curly leaf pondweed
Eurasian water milfoil was discovered in Random Lake in 1993. Curly leaf pondweed was discovered there in 2012. Efforts to control the latter are now being stepped up.
The program to control invasive weeds is of many years' standing and has evolved to thejudicious use of herbicides as the first and last choice of treatment (exhibit C). The public is kept informed and invited to participate through public notices (exhibit D). Theplants and animals that are native to Random Lake do not really have many influential advocates, let alone legal standing, and are seldom surveyed. Random Lake is not a wildlife preserve. But even if it were a preserve, manager-biologists would see a need to intervene against invasive species.
At the Random Lake Association picnic on June 28, Village president Matthew Brockmeier explained that the June 2015 herbicide treatments should have occurred earlier, not as late as June when the growth of Eurasian watermilfoil was well advanced. The reason that the treatments did not occur in a more timely way in the spring was because of a miscommunication between the Village and Marine Biochemists. Marine Biochemists received the approved herbicide permit from WI DNR approximately a month before notifying the Village.
52

Brockmeier was interviewed by the author about the weed program. $10K was budgetedin 2015 for weed control; $15708 was actually spent for two rounds of treatments. In 2016 $20K will be provided in order to do more. Brockmeier helped recover documents regarding 2014 herbicide treatments, alleviating a gap in knowledge for a year in which lake monitoring was sporadic. The Village is satisfied with Marine Biochemists' services.
Wisconsin DNR issues permits for management of aquatic plants (Wis. Stats. Chapter NR 107 Aquatic Plant Management). Before performing herbicide treatments, the Village must obtain such a permit (exhibit E).
Marine Biochemists is the firm currently employed by the Village to help obtain the WI DNR permit and accordingly to treat the lake with herbicides. They also survey the lake for invasive weeds and advise the Village. Their employees were on Random Lake on June 11-12 and August 13-14, 2015.
Random Lake Associatio n is comprised mainly of lake shore property owners who take a strong position on the control of aquatic weeds. On occasion RLA has contributed money for control of weedy lake plants, though not in 2015.
The herbicide treatment dates in 2015 were June 11-12 and August 13-14. Marine Biochemists applied the chemicals according to their detailed plan: Aquathol-K, Cutrine-Plus, DMA4-IVM, and Navigate (exhibits F-I). Good documentation is on record for the treatments (exhibits J-O). Advance legal notices for the June treatments were published in The Sounder and notices mailed to households. On the days of treatment, warning signs were placed on the shoreline of Lakeview Park. Following treatments, the efficacy was not measured and documented in any formal way, although many offending weeds were seen to die. Thus there was no suggestion that the Village did not get its money's worth out of the treatments.
53

Marine Biochemists on Random Lake
On the future horizon lie other well known and feared aquatic invasive species, namely zebra mussel and starry stonewort. If and when these invaders arrive in Random Lake, new control measures may have to be implemented.
54

The Facts . . .On
EurasianWater-Milfoil
locate a weevil, look in milfoil stemsfor signs of damage. There are oftensmall holes or weak spots in thestems that point to weevil damage.These holes allow water to enter thestem, expose the plant to bacterialinfection and decrease the plant’sbuoyancy. The plant will drop lowerinto the water column and will notcanopy out on the surface. Overtime, weevils can impact thepopulations of EWM, but completeeradication is unlikely. Additionalresearch and development is neededbefore biological control withweevils can be considered aneffective management tool.
How Can You Help?EWM is moved between waterbodies by small fragments trans-ported on recreational equipment.Commonly it is transported byboats, trailers, bait buckets, livewells and fishing equipment. Tohelp prevent the spread of EWMand other invasive species, pleasetake the following steps:
Inspect and remove any visiblemud, plants, fish or animalsbefore transporting.
Drain water from equipment(boat, motor, trailer, live wells)before transporting.
Dispose of unwanted live baitin the trash.
Wisconsin laws prohibitlaunching a boat or placing atrailer or boat equipment innavigable waters if it has aquaticplants or zebra mussels attached.
PUB-WT-781 2004 PRINTED ON RECYCLEDPAPER
How Do You Control EWM?Early detection ofEWM growth iscritical instopping the plantfrom becoming awidespreadproblem. The bestchance to haltthese non-nativeinvaders is whenthey first appearon the scene.EWM often appears near boatlandings and at disturbed sites.
New colonies are best removed beforethey expand. Hand pulling andremoval from the water is a simpleand effective control method for smallareas. Harvesting, raking orscreening the bottom also works well.Milfoil can be effectively treated withselected chemicals early in thesummer before plants flower. A permitis required from the DNR for chemicaltreatment or bottom screening.Whole-lake herbicide treatment isnot generally permitted because of thepotential to disrupt lake ecosystems byeliminating both invasive andbeneficial native plants.
For lakes dominated with beds ofmilfoil, control efforts must be focusedon reducing its spread. Mechanicalharvesting can open areas for boatingand swimming and cut fish cruisinglanes. Harvesting encourages growth ofnative plants while removing milfoilcanopies that limit native plant growth.
Biological control of EWM is stilluncertain. A small aquatic weevil(Euhrychiopsis lecontei) feeds on milfoiland actually prefers EWM. Weevils arefound in many Wisconsin lakes. To
The Clean Boats,Clean Waters ProgramBuilds Awareness About
Learn to recognize EWM.
Start a volunteer watercraftinspection program to helpeducate boaters on how andwhere EWM and other invasivesare most likely to hitch a rideinto water bodies.
Begin monitoring boat landings,marinas and inlets for the firstsign of invasion.
If you suspect a new infestation,report it to your local DNRservice center.
Remember, our waterways are thepride of Wisconsin and belong toall of us.
For more informationabout the “Clean Boats,Clean Waters” programcall 715/346-3366.
The Wisconsin Department of Natural Resources providesequal opportunity in its employment, programs, services,and functions under an Affirmative Action Plan. If youhave any questions, please write to Equal OpportunityOffice, Department of Interior, Washington, D.C. 20240.
This publication is available in alternative format (largeprint, Braille, audiotape, etc.) upon request. Please call608/267-7694 for more information.
Aquatic Weevil(Euhrychiopsislecontei)
Designed by L. Pohlod, Blue Sky Illustration & Design, LLC
Exhibit A. Eurasian watermilfoil
55

It is important to be able to distinguishEWM from similar aquatic plants.
EWM is a submersed aquatic plantwith feather-like leaves arrangedin whorls (circles) on the stem.
There are usually 12 to 21 pairs ofleaflets per leaf.
The leaves have a distinct feather-like appearance, with the lowerleaflet pairs about half the lengthof the midrib.
Stem tips are tassel-like.
Branching is abundantin water 3 to 10 feet deep.
Eurasian water-milfoil(Myriophyllum spicatum)
What is Eurasian Water-Milfoil (EWM)?Invasive species disrupt the stabilityof natural ecosystems and threatenbiodiversity. One invasive species ofspecial concern is Eurasian water-milfoil. EWM was introduced intoNorth America and has spread tonumerous water bodies across thenation. During the 1960’s thisaggressive submersed plant found itsway into Wisconsin waters. For acurrent list of EWM-infested waterbodies visit www.dnr.wi.gov/org/water/wm/GLWSP/exotics/milfoil.html
Eurasian water-milfoil threatensnative aquatic plant communitiesand forms thick underwater beds oftangled stems and vast mats ofvegetation at the water’s surface.These dense beds cause loss of plantdiversity, degrade water quality, andmay reduce habitat for fish, inverte-brates and wildlife. They also hinderboating, swimming and fishing.Many lake organizations and localgovernments devote much of theirmanagement budgets to control thisinvasive plant. EWM is an afflictionthat costs citizens of Wisconsinmillions of dollars in plant controland lost tourism revenue annually.
How DoesIt Spread?This prolificplant does notspread well byseeds. It spreadsby shoots andrunners thatcreep along thebeds of lakesand rivers.New plantsalso growfrom smallfragmentstransported from one water body toanother. Commonly it’s transported byboats and trailers but could also betransported on SCUBA gear, water skisor waterfowl. EWM has become asuccessful invader primarily by meansof its stem fragments. A singlefragment can take root and form anew colony.
EWM is most successful in waterdisturbed by cultural developmentssuch as shoreline construction,watershed runoff, aquatic invasivespecies control or heavy boat traffic.
EWM also has a competitiveadvantage in waters that are stressedby pollution. It has difficulty becomingestablished in waters with healthypopulations of native plants. Ahealthy ecosystem and preservation ofnative plants is protection against anEWM invasion.
Northern water-milfoil(Myriophyllum sibericum)
What Does Eurasian Water-Milfoil(Myriophyllum spicatum) Look Like?
EWM is one of eight water-milfoilspecies found in Wisconsin and theonly one that is not native. The mostcommon native water-milfoil in Wis-consin lakes is northern water-milfoil(Myriophyllum sibericum). It bears astrong resemblance to EWM but it is notprone to the rapid growth and canopyformation that make EWM a nuisance.
56

57

58

Eurasian water milfoil is one of eight water-milfoil species found in Wisconsin and theonly one that is not native. The most commonnative water-milfoil in Wisconsin lakes isnorthern water-milfoil. It bears a strongresemblance to Eurasin water-milfoil andidentification between the two plants can bedifficult. Using this guide helps to distinguishEurasian water-milfoil from similar nativeaquatic plants.
NorthernWater-milfoil(Myriophyllumsibericum)• Rigid feather-like leaves
forming a christmas treeshape. The lowerleaflets areusually quitelong.
• Leaves usually stiffwhen out of water.
• Leaves arranged inwhorls (circles) of four tosix around stem.
• Usually seven to tenleaflet pairs per leaf.
• Stem is usually whitishor whitish green in color.
Coontail(Ceratophyllumdemersum)Coontail is a free-floatingaquatic plant without roots.It may be completelysubmersed or partiallyfloating on the surface.
• The leaves arestiff and arrangedin whorls.
• Each leaf is divided in aforked pattern.
• Leaf divisions haveteeth along onemargin.
• Leaves are crowdedtoward the tip ofthe stem creatingthe “coontail”appearance.
Recognizing Eurasian Water-milfoiland Native Look-a-Likes
The Wisconsin Department of Natural Resources provides equal opportunity in its employment, programs, services, and functions under anAffirmative Action Plan. If you have any questions, please write to Equal Opportunity Office, Department of Interior, Washington, D.C. 20240.
This publication is available in alternative format (large print, Braille, audiotape, etc.) upon request. Please call 608/267-7694 for more information.
Eurasian Water-milfoil(Myriophyllum spicatum)• Delicate feather-like leaves. Leaflets are
mostly the same length.
• Leaves are usually limp when out ofthe water.
• Leaves arranged in whorls(circles) of three to fivearound the stem.
• Usuallytwelvetotwenty-one leafletpairs perleaf.
• Longspaghetti-like stems.
59

Water Marigold(Megalodonta beckii)• Submersed
leaves of watermarigold arearranged inwhorls andcut intomanythread-likedivisions.
• Leaves that growabove the waterare not divided.
• Produces yellow,daisy-likeflowers.
Common Bladderwort(Utricularia vulgaris)• Submersed plant with finely divided leaves.
• Leaves are arranged alternately on the stem.
• Most distinct characteristic is the presenceof “bladders” or sacs to capture smallanimal life.
• Bladders arescattered onleaves or sepa-rate stems andmay look likedark seeds.
PRINTED ON RECYCLEDPAPER
PUB-WT-783 2004
Illustrations by Carol Watkins reprinted with permission from“Through the Looking Glass, A Field Guide to Aquatic Plants”by Susan Borman, Robert Korth, and Jo Temke
Water Crowfoot(Ranunculus spp.)• Submersed plant
with finelydividedleaves.
• Leaves occuralternatelyalong thestem, not inwhorls.
• Smallbuttercup-likeflowers areproducedthat stickup out ofthe water.
Common Waterweed,Elodea (Elodea canadensis)• Submerged plant with slender stems.
• Small lance-shapedleaves attachdirectly to thestem.
• Leaves are inwhorls of three,or occasionallytwo near thestem tips.
Designed by L. Pohlod, Blue Sky Design, LLC
60

Native Water-milfoilsLate fall and early spring identification characteristics
Several native water-milfoils form winter turions (buds). Turions are overwintering structures that are comprised of densely packed leaves. These turions form on the upper portion of the plant and/or on the plant’s side branches during the fall of the year. The turions are often still attached to plants that are found washing up along shorelines in late fall (October-November). These turions break away from the plant and free-float to new areas. In the spring, the turions break dormancy and the small, thick, dark green turion leaves expand and grow. As the plant develops roots and continues to grow, the larger green summer leaves are produced at the tip of the plant. You can sometimes find the turion leaves at the base of the plant even into July. You may also see a “turionic arch” or U-shape at the base of northern water-milfoil throughout the year (early development of the arch is shown in pictures C and D on next page).
Eurasian water-milfoil (EWM) and some native water-milfoils (NWM) do not form winter turions. If you see turions or the turion leaves, you DO NOT have Eurasian water-milfoil. If you do not see turions, use other identification features to determine if you have a native water-milfoil or Eurasian water-milfoil. In 2007 some EWM/NWM hybrids were found to have turions. More research is needed in this area.
Whorled Water-milfoil (native)collected in October
turions
turions
flower spike remnant
DNR PUB WT-861 200861

turion leaves
Summer leaves
Northern Water-milfoil (native)
turionscollected in October
collected in May
A B
C D
Turions (pictures A & B). Turion leaf expansion and growth (picture C), followed by formation of summer leaves (picture D).
collected in October
collected in May
62

110 Chapter Seven
Curly-leaf pondweed
Potamogeton crispus
Description
Curly-leaf Pondweed was likely accidentally introduced to the U.S. along with the common carp in the1800s, and was established in the Midwest by the 1930s. It is a submersed aquatic plant, though its stemscan reach the surface, forming mats. Its leaves are reddish-green, oblong, and about 3 inches long, with distinct wavy edges that are finely toothed. The stem of the plant is flat and reddish-brown. Curly-leaf bedsmay start in 1-2 feet of water and extend out to 10-12 feet or more.
Curly-leaf pondweed reproduces/spreads through production of burr-like winterbuds (turions), which are moved among waterways. These plants can alsoreproduce by seed, but this plays a relatively small role compared to thevegetative reproduction through turions. New plants form under the ice inwinter, making curly-leaf pondweed one of the first nuisance aquaticplants to emerge in the spring. The plants usually drop to the lake bot-tom by early July.
Why is curly-leaf a concern?
Curly-leaf pondweed was the most severe nuisance aquatic plant in theMidwest until Eurasian water-milfoil appeared. It forms surface mats thatinterfere with aquatic recreation. It becomes invasive in some areas becauseof its tolerance for low light and low water temperatures. These tolerancesallow it to get a head start on and outcompete native plants in the spring. In mid-summer, when most aquatic plants are growing, curly-leaf pondweed plants are dying off.Plant die-offs may result in a critical loss of dissolved oxygen. Furthermore, the decaying plants can increasenutrients, which contribute to algal blooms, as well as create unpleasant stinking messes on beaches.
How does curly-leaf spread?
Similar to Eurasian water-milfoil, curly-leaf pondweed can be spread between waterbodies on boats andequipment.
How can you help prevent the spread?
✽ Inspect and remove aquatic plants, animals, and mud from boat, trailer, and equipment beforeleaving the water access;
✽ Drain water from boat, motor, bilge, live wells, and bait containers before leaving the water access;
✽ Dispose of unwanted bait in the trash;
✽ Spray/rinse boats and recreational equipment with high pressure and/or hot tap water (> 104˚ F),especially if moored for more than a day, OR
✽ Dry boats and equipment thoroughly for at least 5 days.
V. RA
ME
Y, UN
IVE
RS
ITY O
F FLOR
IDA
Exhibit B. Curly leaf pondweed
63

111
What are the regulations about curly-leaf pondweed in Wisconsin?
It is unlawful in Wisconsin to:
✽ Place a boat or trailer with attached aquatic plants or zebra mussels intoWisconsin waters.
Management and control
Once curly-leaf is well established in a lake, it is nearly impossible to eradicate. It does not causesevere problems in every water body, but when it does, several management options may beavailable. Just as with Eurasian water-milfoil, physical, mechanical, and chemical options are allused to control curly-leaf, depending upon the extent of the infestation and other characteristicsof the infested waterbody.
Long-term management requires the reduction or elimination of turions to interrupt the lifecycle. To have the maximum benefit, manual/mechanical efforts (such as raking, hand-cutting,or harvesting) as well as chemical control efforts should be undertaken in the spring or earlysummer, when native plants are still dormant.
Habitat manipulation such as drawdowns and dredging can also be used to manage curly-leafpondweed. Fall drawdown can kill the plants by exposing them to freezing temperatures anddessication. Dredging can be used as a control by increasing the water depth. In deep water, theplants do not receive enough light to survive. This method can be detrimental to desired plants,as all macrophytes would be prevented from growing for many years. This high level of distur-bance may also create favorable conditions for the invasion of other invasive species.
Most management options require a DNR permit. Before engaging in any aquatic plant management ornuisance control activities, contact your local Aquatic Plant Management Coordinator.Visit www.dnr.wi.gov/org/water/fhp/lakes/aquaplan.htm for more information.
Curly-leaf Pondweed Publication (see Publications section for more information):
Curly-leaf Wild Card (DNR Publication number WT-759)
*See accompanying CD for curly-leaf pondweed article from Lake Line, a publication of the North American Lake Management Society.
64

2x
65

66

67
owner
Typewritten Text
owner
Typewritten Text
Exhibit C. History of Herbicide Treatments

68

69

70

Random Lake—Sheboygan County, WI
July 9, 2014 Treatment Map
Note: No Curlyleaf Pondweed Present (dies back by 4th of July)
Marine Biochemists
6302 W. Eastwood Ct.
Mequon, WI 53092
www.marinebiochemists.com
(888) 558-5106
Location Acres
1 4.2
2 0
3 1.25
4 0
5 0
6 3.8
7 3.5
8 0.75
9 4.00
10 0.00
11 0.00
12 0.70
13 1.7
1
2
3
4
5
6
7
8
9
12
13
19.9
Algae Treated with-
Cutrine-Plus for
Filamentous Algae.
2
Areas #2,4,5 not treated due to limited
Milfoil growth (only a few plants)
Treated with Harvester and
Aquathol-K for all species adja-
cent to Beach (0.4 acre)
1
71

Aquatic Plant Management Herbicide Treatment Record
Notice: Completion of this form is a condition of Wl DNR permits and provides records required by WDNR (NR107, WPDES 5.1) and DATCP (ATCP 29.21g 29.221. The Department may not issue you future permits unless you complete and submit this form. Personally identifiable information required
on this form is not likely to be used for purposes other than that for which it is originally collected. lt may also be made available to requesters under
Wisconsin Open Records law (ss. 19.31-19.39 Wis. Stats.).
SubrnitThisForm:1) lmmediatelyifanyunusual circumstancesoccurredduringthetreatment,2) Assoonaspossible,nolaterthan30daysaftertreat-
rnent, 3) By October 1 if no treatment occurred
Cotpletion of this form along with the Permit satisfies the requirements of WDNR WDNR (NR107, WPDES 5.1) and DATCP (ATCP 29.21 &
General Permit lnformation Waterbody name (including ponds, eg., Smith Pond and Address) Treatment lnformation
waier L,lse Restristion Signs Posted in Accordance with NR107? [*oNote: Applicator Shall Provide request
Paul Hinterberg
reatment Area 9116 (Acres)
?,qeieOn Site DNR Supervision Present? f] ves Ef*o
Name of Applicator(s) Application Business lnformation
Marine Biochemists
6302 W. Eastwood Ct.
Mequon, Wl 53092
(888) ss8-s106
Jim Kannenbere ITcm Lloyd trMarc Schmitz tr
E.P-A. Registration No. Concentration (ppm) 0r Rate (gal,/acre) Applied
A E B.tr c.! D.fI
A. n B.n c.tr D.D
A.E B.tr c.! D.tr
A I B.E c.[] D.n
A.E 8.tr c.tr D.tr
A [ B.tr c.tr D.tr
A.! B.n c.E D.tr
A.fl 8.tr c.tr D.tr
contract Type: Per Treatment E sfsonar f] FoR oFFlcE usE ONLY
Additional lnstructions For lnvoicing:
72

Random Lake-Sheboygan County
August 5, 2014 Treatment Areas
5
Marine Biochemists
6302 W. Eastwood Ct.
Mequon, WI 53092
(888) 558-5106
www.marinebiochemists.com
Treatment Area (shown in Yellow): 0.34 Acres/3 ft. Aquathol-K: 2 gal. (3 ppm)
Cutrine-Plus: 0.75 gal. (0.25 ppm) Harvester: 0.5 gal (1.5 gal/acre)
73

Aquatic Plant Management Herbicide Treatment Record
on this form is not likely to be used for purposes other than that for which it is originally collected. lt may also be made available to requesters under
Wisconsin Open Records law (ss. 19.31-19.39 Wis. Stats.).
SubmitThisForm: 1) lmmediatelyifanyunusual circumstancesoccurredduringthetreatment,2) Assoonaspossible,nolaterthan30daysaftertreat-
ment, 3) By October 1 if no treatment occurred
ofCompletion of this form along with the Permit satisties the requirements ot WDNR WDNR (NR1O7, WPDES 5.1) and
General Permit lnformation Waterbody name (including ponds, eg., Smith Pond and Address) Treatment lnformatign
2s.21& 2"rfY+ / /
,*tl/ri,
Permit Number
;tzrstJ -h*?as ir/* 1",/* '6b"frlfft rrqlftTiffiD7E Endrime/ | t
oQao I
'4olsa,allt t/,WFA,JN M wflnorrt Air Temp (F)*77- *z:g\W""'"
i'"Jt."nt n,y' iy' tacresl
6"e4 *nvg. oep/h (rt.)
3tDissolved Oxygen (ppm) OnSiteDNRsupervisionPresentl- n Ves ,fl ruo
lf yes, Supervisor Name:
"1 ,an,rz M"tqb4s,
4#4 t"l^r/, ./'/a./.1p r,z-rlz*,/o/ r*4 ; 5" anz4
6o#>i r€=*,t- M-ia&"r{l* -r
E*o &E*a& aJ lAn:/,b"/n/ ANote: Applicator Shall Provide Customer tree cofiy of pesticide ladCl used upon request L-9a &r),
Name of Applicator(s) Certification # License # ApplicationBusinesslnformation IMarine Biochemists ^ /
6302 W. Eastwood ,r- frbMequon,Wl 53092 OJ,
(888) ss8-s106
Name of Person
Completing Form
Date
Paul Hinterberg f] 89833 440931
Jim Kannenberg T 28668 224269
Tom Lloyd tr s3869 746250
Marc Schmitz n 77687 280774
Brian Suffern tr L577 L42402
T-rrle larrufPond Product Used E.P.A. Registration No. Quantity Applied Concentration (ppm) 0r Rate (gal./acre) Applied
A.E B.E c.tr D.E Aquathol-K 70506-176 7, qd.l 4" ) .t) ft,{t
A. E B.[ c.D D.n CleariBate 8959-51 I //A.E B.tr c.I D.E Cutrine-Plus 8959-10 b"75 cal D A.26 vrD/rlA E B.n c.E D.[ DM44.IVM 627L9-3 (lA.fl B.tr c. tr D.tr Harpoon 8959-s4
t
A.[ 8.tr c.f] D.tr Harvester 100-1091-8959 6,5 +),t L l-{ ^t/ /azreA.E B.tr c. E D.tr Hydrothol 191 70506-175 0 (, /A.E B.tr c.tr D.[Contract Type: Per Treatment E Seasonal n FOR OFFICE USE ONLY
Product/ltem Code Amount Customer #
Additional lnstructions For lnvoicing:
MB s/1474

Random Lake-Sheboygan County
August 18, 2014 Treatment Areas
1 2
3
5
4 7
9
Marine Biochemists
6302 W. Eastwood Ct.
Mequon, WI 53092
(888) 558-5106
Areas 5,7,9 treated w/ DMA4-IVM (liquid) at concentration of 2 ppm. Total 4.1 A/4.5’ , 25.5 gal.
Areas 1-4 treated with Navigate Herbicide (granular) at 100#/acre. Total 1.5 acres. 150# Product.
75

Aquatic Plant Management Herbicide Treatment Record
Notice: Completion of this form is a condition of Wl DNR permits and provides records required by WDNR (NR107, WPDES 5.1) and DATCP (ATCP 29.21
& 29.221. The Department may not issue you future permits unless you complete and submit this form. Personally identifiable information requiredon this form is not likely to be used for purposes other than that for which it is originally collected. lt may also be made available to requesters uriderWisconsin Open Records law {ss. 19.31-19.39 Wis. Stats.}.
SubmitThisForm: 1) lmmediatelyifanyunusual circumstancesoccurredduringthetreatment,2) Assoonaspossible,nolaterthan30daysaftertreat-'ment, 3) By October 1 if no treatment occurred
Completion of this form along with the Permit satisfies the requirements of WDNR WDNR (NR107, WPDES 5.1) and DATCP (ATCP 29.21 &General Permit lnformation Waterbody name (including ponds, et., Smith Pond and Address) Treatment lnformation
Permit Number
5€ ;trtrd ln 1Aa fi;*d- /rh* fipff;t"Start Time5:45 End Time
//"+aco';lmti l'-\/r,/tat*vt a/n ffrlo,.iMr fu *"n7T/A',b
^79'['nWind Speed & Direction
.5 -ss'iieatment Ary'y' (Acres)
5 A".r*sAvs. Deoth (f
4s'Dissolved Oxygen (ppm) On Site DNR Supervision Present? fl V"r X *"
lf yes, Supervisor Name:
Visuat observations/Notes , ftrVe/ SfecDt L €dE,sdt, h-&"@nzi/fu-/
Tri./ dd/rrf"r;;,D U ?z f/*ilhd./r/ /+r*> /;4n {,l uo/ r. nf*r' o,Z? fub/"s 4,roa)'44- /r*6/ **76
D.L/tq(/,aokl). dt '/- i ( t,s n!*' iil-rtrd*J Lo;f,-l/*,ffu (
wateruseRestrictionsignsPostedinAccordancew,.t r*rorl ffit., Z *. /rh, S,, r).ur,ry 2l ./--.- )rrr'a.1rt)rnNote: Applicator Shall Provide free copy of label upon
Name of Applicator(s) Certification # License #
6302 W. Eastwood Ct.
Mequon, Wl 53092
(888) ss8-s106
Name of Person
Completing Form
Date
Paul Hinterbere E 89833 44093L
Jim Kannenberc E 28668 224269
Tom Lloyd tr s3859 t46250
Marc Schmitz tr 77687 280774
Brian Suffern U tEU t 742402
Gr,*Z lrnsrW 7ffi4{ 2qrPc'rJPond Product Used E.P.A. Registration No. Quantity Applied Concentration (ppm) 0r Rate (gal./acre) Applied
A.E B.tr c.tr D.tr Aquathol-K 70506-t76
A. E B.fl c. tr D.tr Clearigate 8959-51
A.E B.tr c.tr D.tr Cutrine-Plus 8959-10
A.E B.n c.n D.I DMA4-IVM 627L9-3 25.{riJ 2 nn* ?b 4" I p*a ht'noA E B.tr c.tr D.tr Harpoon 8959-54 - I /l- / /A.E 8.tr c.tr D.tr Harvester 100-1091-8959
A.E B.E c. E D.tr Hydrothol 191 70506-175
A.[ B.tr c.tr D.tr A/orlr;z# 929ffls95 /#a * /m#/e,z A' /.5 *rn*-<contract Type: Per Treatment fI sJasonat f] FoR oFFlcE usE ONLY I
Product/ltem Code Amount Customer S
Additional lnstructions For lnvoicing:
76

77
owner
Typewritten Text
owner
Typewritten Text
Exhibit D. Legal Notice

Exhibit E. approved permit
78

79

80

81

Exhibit F
82

83

84

85

86

87

ALGAECIDE and HERBICIDE
CUTRINE-PLUS ®
FOR USE IN: LAKES; POTABLE WATER RESERVOIRS; PONDS; FISH
HATCHERIES AND RACEWAYS; CROP AND NON-CROP IRRIGATION CONVEYANCE SYSTEMS (DITCHES,
CANALS AND LATERALS)ACTIVE INGREDIENTS:
Copper Ethanolamine Complex, Mixed (Mono CAS# 14215-52-2 and Tri CAS# 82027-59-6)*..........27.9%
OTHER INGREDIENTS........................................72.1%TOTAL................................................................100.0%
*Metallic copper equivalent, 9%. Contains 0.909 lbs. of elemental copper per gallon.
KEEP OUT OF REACH OF CHILDREN
CAUTIONSi usted no entiende la etiqueta, busque a alguien para que se la explique a usted en detalle. (If you do not understand the label, find someone to explain it to you in detail.)
See Additional Precautions on Back Panel
GENERAL INFORMATIONThis product is a liquid copper-based formulation con-taining ethanolamine chelating agents to prevent the precipitation of copper with carbonates and bicarbon-ates in the water. This product effectively controls a broad range of algae including: Planktonic (suspend-ed) forms such as the Cyanobacteria (Microcystis, Anabaena & Aphanizomenon), Green algae (Raphi-docelis & Cosmarium) Golden algae (Prymnesium parvum) and diatoms (Navicula & Fragilaria); Filamen-tous (mat-forming) forms such as the Green Algae (Spirogyra, Cladophora, Ulothrix & Rhizoclonium) and Benthic (bottom-growing) forms such as Chara and Nitella. This product has also been proven effective in controlling the rooted aquatic plant, Hydrilla verti-cillata. Waters treated with this product may be used for swimming, fishing, further potable water treatment, livestock watering or irrigating turf, ornamental plants or crops after treatment.
DIRECTIONS FOR USEIt is a violation of Federal Law to use this product in a manner inconsistent with its labeling. For applications in waters destined for use as drinking water, those waters must receive additional and separate potable water treatment. Do not apply more than 1.0 ppm as metallic copper in these waters. Read entire label and use strictly in accordance with precautionary statements and directions.GENERAL APPLICATION RESTRICTIONS: (For end-use products in containers ≥ 5 gallons or ≥ 50 pounds.) Do not apply this product in a way that will contact workers or other persons, either directly or through drift. Only protected handlers may be in the area during application. For any requirements specific to your State or Tribe, consult the State or Tribe agency responsible for pesticide regulation.(For end-use consumer products in containers less than 5 gallons or less than 50 pounds) Do not apply this product in a way that will contact adults, children, or pets, either directly or through drift. Some states may require permits for the application of this product to public waters. Check with your local authorities.(For all sizes) Do not enter or allow others to enter until application of product has been completed.
PRE-TREATMENT CONSIDERATIONS:(For end-use products in containers ≥ 5 gallons or ≥ 50 pounds.) In Potable Water Reservoirs, Lakes, Industrial Ponds & Wastewater or other monitored water systems, initial treatment with this product must be considered at the onset of nuisance bloom conditions as evidenced by initial taste and odor complaints; high cell counts or chlorophyll a concentrations; high MIB or geosmin concentrations; visible surface scum formations; low Secchi disk readings; significant daily fluctuations in dissolved oxygen; and/or sudden increases in pH. Monitoring of several of these parameters on a regular basis will assist in optimizing the timing of treatments and reducing the amounts of this product needed for seasonal control. Identification of primary nuisance species or genera may also be helpful in determining and refining dosage rates.(For end-use consumer products in containers less than 5 gallons or less than 50 pounds) In Ponds (Farm, Fire, Fish, Golf Course, Irrigation, Ornamental, Storm water Retention, Swimming), Small Lakes, Fish Hatcheries, Aquaculture Facilities, treatment with this product should be started when visible, actively growing algae and susceptible plants appear in spring, preferably before significant surface accumulations occur. Aeration and/or fountain system, where available, should be in operation at the time of treatment.Spray Drift ManagementA variety of factors including weather conditions (e.g., wind direction, wind speed, temperature, relative humidity) and the method of application (e.g., ground, aerial, airblast, chemigation) can influence pesticide drift. The applicator must evaluate all factors and make appropriate adjustments when applying this product.Droplet SizeApply only as a medium or coarser spray (ASAE standard 572) or a volume mean diameter of 300 microns or greater for spinning atomizer nozzles.Wind SpeedDo not apply at wind speeds greater than 15 mph. Only apply this product if the wind direction favors on-target deposition (approximately 3 to 10 mph), and there are no sensitive areas within 250 feet down wind.Temperature InversionsIf applying at wind speeds less than 3 mph, the applicator must determine if a) conditions of temperature inversion exist, or b) stable atmospheric conditions exist at or below nozzle height. Do not make applications into areas of temperature inversions or stable atmospheric conditions.Other State and Local RequirementsApplicators must follow all state and local pesticide drift requirements regarding application of copper compounds. Where states have more stringent regulations, they must be observed.EquipmentAll ground application equipment must be properly maintained and calibrated using appropriate carriers or surrogates.
SPECIMEN LABEL
Manufactured for: Applied BiochemistsW175 N11163 Stonewood DriveSuite 234Germantown, Wisconsin 530221-800-558-5106www.appliedbiochemists.comPat. No. 3,930,834EPA Reg. No. 8959-10EPA Est. No. 42291-GA-1
This specimen label is intended as informational purposes only and not for use as container labeling.
SCAN TO VIEW ON YOUR MOBILE PHONE
Exhibit G
88

SURFACE SPRAY / INJECTION SLOW-FLOWING OR QUIESCENT WATER BODIESALGAECIDE APPLICATIONFor effective control, proper chemical concentration must be maintained for a mini-mum of three hours contact time. The application rates in the chart are based on static or minimal flow situations. Where significant dilution or loss of water from un-regulated inflows or outflows occur (raceways) within a three hour period, chemical may have to be metered in.1. Identify the form of algae growth present as one of the following types: Planktonic
(suspended), Filamentous (mat forming), or Benthic (Chara/Nitella) and estimate the density of growth (Low, Medium, High). Use Table 1 - Copper Con-centration to select the desired PPM (Parts per Million) Copper needed, based upon the algal form and density.2. Refer to the Table 2 – Product Application Rate and determine gal-lons of product needed per Acre-foot corresponding to the desired PPM
concentration determined in Step #1.
3. Determine acre-feet within the intended treatment area (area of infestation) by measuring length, width plus averaging several depth readings within the treat-ment area. Use the formula:
Length (ft.) x Width (ft.) X Avg. Depth (ft.) = Acre-Feet43,5604. Multiply Acre-Feet calculated in Step #3 times the gallons of this product deter-
mined in Step #2 to determine number of gallons of this product required for the intended treatment area.
5. Before applying, dilute the required amount of this product with enough water to ensure even distribution with the type of equipment being used. Typical dilution range is 9:1 when using backpack-type sprayer or up to 50:1 when using water pump equipment or large tank sprayers.
6. Break up floating algae mats manually before spraying or with force of power sprayer if one is used. Use hand or power sprayer adjusted to rain-sized droplets to cover area evenly taking water depth into consideration. If using underwater injection systems such as drop hoses or booms with weighted drop hoses, ensure boat pattern is uniform throughout treatment area. Spray shoreline areas first to avoid trapping fish.
7. Clean spray equipment by flushing with clean water after treatment and follow STORAGE AND DISPOSAL instructions on the label for empty or remaining par-tial containers.
8. Under conditions of heavy infestation, treat only ⅓ to ½ of the water body at a time to avoid fish suffocation caused by oxygen depletion from decaying algae. (see additional Environmental Hazards).
OTHER TREATMENT FACTORS AND CONSIDERATIONS• Calm and sunny conditions when water temperature is at least 60ºF will usually
expedite control results.• Effective control of algae requires direct contact with all cells throughout the water
column, since these plants do not have vascular systems to transport copper from cell to cell.
• Visible reduction in algae growth should be observed in 24 to 48 hours following application with full infestation and water temperatures.
• Re-treat areas if re-growth or new growth begins to appear and seasonal control is desired. Identify new growth to re-check required copper concentration that may be needed for control. Apply treatment along the shore and proceed outwards in bands to allow fish to move into untreated areas.
• No more than ½ of the water body may be treated at one time. (refer to Environmen-tal Hazards for additional guidance)
• The minimum retreatment interval between consecutive treatments is 14 days.
CUTRINE-PLUS® Granular Algaecide may be used as an alternative in low volume flow situations, spot treatments or treatment of bottom-growing algae in deep water.
Permits: Some states may require permits for the application of this product to public waters. Check with your local authorities.HERBICIDE APPLICATION (For Hydrilla Control)
CUTRINE-PLUS®: Control of Hydrilla verticillata can be obtained from copper con-centrations of 0.4 to 1.0 ppm resulting from product treatment. Choose the applica-tion rate based upon stage and density of Hydrilla growth and respective water depth from the chart below.CUTRINE-PLUS® : HARVESTER® TANK MIX On waters where enforcement of use restrictions for recreational, domestic and ir-rigation uses are ac-ceptable, the follow-ing mixture can be used as an alterna-tive Hydrilla control method.Tank mix 3 gallons of CUTRINE-PLUS® with 2 gallons of HARVESTER®. Ap-ply mixture at the rate of 5 gallons per surface acre. Dilute with at least 9 parts water and apply as a surface spray or underwater injection. Observe all cautions and restrictions on the labels of both products used in this mixture.
FLOWING WATERDRIP SYSTEM APPLICATION - FOR USE IN POTABLE WATER AND IRRIGATION CONVEYANCE SYSTEMS
PRE-TREATMENT CONSIDERATIONSIn Crop and Non-Crop Irrigation Conveyance Systems: Ditches Canals & Lat-erals, product treatments must be applied as soon as algae or aquatic vascular plants begin to interfere noticeably with normal delivery of water (clogging of lateral headgates, suction screens, weed screens and siphon tubes). Delaying treatment could perpetuate the problem causing massing and compacting of plants. Heavy infestations and low flow conditions may require increasing water flow rate during application.Accurately determine water flow rates. In the absence of weirs, orifices, or similar devices which give accurate water flow measurements, volume of flow may be esti-mated by the following formula:
Average Width (feet) x Average Depth (feet) x Velocity* (feet/second) x 0.9 = Cubic Feet per Second (C.F.S.)
*Velocity is the time it takes a floating object to travel a given distance. Dividing the distance traveled (feet) by the time (seconds) will yield velocity (feet/second). Repeat this measurement at least three times at the intended application site then averaged. • After accurately determining the water flow rate in C.F.S. or gallons/minute, find the
corresponding product drip rate on the chart below.• Calculate the amount of this product needed to maintain the drip rate for a period
of 3 hours by multiplying Qts./Hr. x 3; ml/Min. x 180; or Fl. Oz./Min. x 180. Dos-age will maintain 1.0 ppm Copper concentration in the treated water for the 3 hour pe-riod. Introduction of the chemical should be made in the channel at weirs or other turbulence-creating structures to promote the dispersion of chemical.
• Pour the required amount of this product into a drum or tank equipped with a brass needle valve and constructed to maintain a constant drip rate. Use a stop watch and appropriate measuring container to set the desired drip rate. Readjust accord-ingly if flow rate changes during the 3 hour treatment period.
• Distance of control obtained down the waterway will vary depending upon density of vegetation growth. Treatment period may have to be extended up to 6 hours in areas where control may be difficult due to high flows or significant growth. Periodic maintenance treatments may be required to maintain seasonal control.
Form of Algal Growth
Table 1 - Copper Concentration
PlanktonicFilamentous
Benthic
0.40.60.7
0.60.81.0
0.20.20.4
LowDensity of Growth
Medium High
Table 2 - Product Application Rate (Gallons)PPM Copper
Gallon per Acre-ft0.30.9
0.41.2
0.51.5
0.61.8
0.72.1
0.82.4
0.92.7
1.03.0
0.20.6
12345
WATER FLOW RATEC.F.S.
450900135018002250
Gal./Min.12345
0.51.11.62.12.7
Qts./Hr.1632476379
Ml/Min. Fl.Oz./Min.PRODUCT DRIP RATE*
*Application rates for depths greater than six feet may be obtained by adding the rates given for the appropriate combination of depths. Application rates should not result in excess of 1.0 ppm copper concentration within treated water.
Application RatesGallons/Surface Acre*
Early SeasonLow Density
Mid-SeasonModerate Density
Late SeasonHigh Density
Growth/Stage Relative Density
PPMcopper
Depth (in feet)*
1 2 3 4 5 60.40.50.60.70.80.91.0
1.21.51.82.12.42.73.0
2.43.03.64.24.85.46.0
3.64.55.46.37.38.19.0
4.86.07.28.49.610.812.0
6.07.59.010.512.013.515.0
7.29.010.812.614.416.218.0
89

Chemigation System ApplicationThis product may be applied for the mainte-nance of chemigation systems. To control algae in chemigation systems this product should be applied continuously during water application. For continuous addition applica-tion apply 0.60 – 3.0 gallons of this product per 1,000,000 (one million) gallons of water (1.80 - 9.0 gallons of this product per acre-foot of water). The copper concentration range is 0.20 to 1.0 ppm. Do not exceed 1.0 ppm of copper or 2.75 gallons of this product per 100,000 gallons of water. For additional guid-ance regarding specific calibrations or appli-cation techniques contact application equip-ment manufacturer, supplier, or pest control advisor. It is not necessary to agitate or dilute this product in the supply tank before applica-tion to chemigation systems.CHEMIGATION SYSTEM APPLICATION• Apply product only through sprinkler and drip irrigation systems including: center
pivot, lateral move, end tow, side (wheel) roll, traveler, big gun, solid set, or hand move; flood (basin), furrow, border or drip systems.
• Crop injury, lack of effectiveness, or illegal pesticide residues in the crop can result from non-uniform distribution of treated water.
• If you have questions about calibration, contact Applied Biochemists, State Exten-sion Service, equipment manufacturer, or other experts.
• Do not connect an irrigation system (including greenhouse systems) used for pes-ticide application to a public water system unless the pesticide label-prescribed safety devices for public water systems are in place (refer to the Chemigation Systems Connected to a Public Water Supply section of this label).
• Trained personnel, knowledgeable of the Chemigation system and responsible for its operation or under the supervision of the responsible person, shall shut the system down and make necessary adjustments should the need arise. The system should be inspected, calibrated, and maintained before product application begins.
Chemigation Systems Connected to a Public Water Supply• Public water system is a system for the provision to the public of piped water for
human consumption if such system has at least 15 service connections or regularly serves an average of at least 25 individuals daily at least 60 days out of the year.
• Chemigation systems connected to public water systems must contain a functional, reduced-pressure zone, back flow preventer (RPZ) or the functional equivalent in the water supply line upstream from the point of pesticide introduction. There shall be a complete physical break (air gap) between the flow outlet end of the fill pipe and the top or overflow rim of the reservoir tank of at least twice the inside diameter of the fill pipe.
• The pesticide injection pipeline must contain a functional, automatic, quick-closing check valve to prevent the backflow of solution toward the injection.
• The pesticide injection pipeline must contain a functional, normally closed, solenoid operated valve located on the intake side of the injection pump and connected to the system interlock to prevent fluid from being withdrawn from the supply tank when the irrigation system is either automatically or manually shut down.
• The system must contain functional interlocking controls to automatically shut off the pesticide injection pump when the water pump motor stops or in cases where there is no water pump, when the water pressure decreases to the point where pesticide distribution is adversely affected.
• Systems must use a metering pump, such as a positive displacement injection pump (e.g.,diaphragm pump) effectively designed and constructed of materials that are compatible with pesticides in use and capable of being fitted with a system interlock.
• Inspect, calibrate and maintain the system before product application. Sprinkler Chemigation Requirements• The system must contain a functional check valve, vacuum relief valve, and low
pressure drain appropriately located on the irrigation pipeline to prevent water source contamination from back flow.
• The pesticide injection pipeline must contain a functional, automatic, quick-closing check valve to prevent the backflow of solution toward the injection pump.
• The pesticide injection pipeline must also contain a functional, normally closed, solenoid operated valve located on the intake side of the injection pump and con-nected to the system interlock to prevent fluid from being withdrawn from the sup-ply tank when the irrigation system is either automatically or manually shut down.
• The system must contain functional interlocking controls to automatically shut off the pesticide injection pump when the water pump motor stops.
• The irrigation line or water pump must include a functional pressure switch which will stop the water pump motor when the water pressure decreases to the point where pesticide distribution is adversely affected.
• Systems must use a metering pump, such as a positive displacement injection pump (e.g. diaphragm pump) effectively designed and constructed of materials that are compatible with pesticides and capable of being fitted with a system interlock.
• Do not apply when drift would extend beyond the area intended for treatment. Floor (Basin). Furrow and Border Chemigation Requirements• Gravity Flow Systems pesticide dispensing system must meter the pesticide into
the water at the head of the field and downstream of a hydraulic discontinuity such as a drop structure or weir box to decrease potential for water source contamina-tion from back flow if water flow stops.
• Pressurized water systems with a pesticide injection system must meet the follow-ing requirements:
• The system must contain a functional check valve, vacuum relief valve, and low pressure drain appropriately located on the irrigation pipeline to prevent water source contamination from back flow.
• The pesticide injection pipeline must contain a functional, automatic, quick-clos-ing check valve to prevent the backflow of solution toward the injection pump.
• The pesticide injection pipeline must also contain a functional, normally closed,solenoid-operated valve located on the intake side of the injection pump and connected to the system interlock to prevent fluid from being withdrawn from the supply tank when the irrigation system is either automatically or manu-ally shut down.
• The system must contain functional interlocking controls to automatically shut off the pesticide injection pump when the water pump motor stops.
• The irrigation line or water pump must include a functional pressure switch which will stop the water pump motor when the water pressure decreases to the point where pesticide distribution is adversely affected.
• Systems must use a metering pump, such as a positive displacement injection pump (e.g., diaphragm pump) effectively designed and constructed of materi-als that are compatible with pesticides and capable of being fitted with a system interlock.
Drip Chemigation Requirements• The system must contain a functional check valve, vacuum relief valve, and low
pressure drain appropriately located on the irrigation pipeline to prevent water source contamination from back flow.
• The pesticide injection pipeline must contain a functional, automatic, quick-closing check valve to prevent the backflow of solution toward the injection pump.
• The pesticide injection pipeline must also contain a functional, normally closed, solenoid operated valve located on the intake side of the injection pump and con-nected to the system interlock to prevent fluid from being withdrawn from the sup-ply tank when the irrigation system is either automatically or manually shut down.
• The system must contain functional interlocking controls to automatically shut off the pesticide injection pump when the water pump motor stops.
• The irrigation line or water pump must include a functional pressure switch which will stop the water pump motor when the water pressure decreases to the point where pesticide distribution is adversely affected.
• Systems must use a metering pump, such as a positive displacement injection pump (e.g.. diaphragm pump) effectively designed and constructed of materials that are compatible with pesticides and capable of being fitted with a system in-terlock.
Submersed Plant Control ApplicationsThis product can be applied to control hydrilla (Hydrilla verticillata), egeria (Egeria densa), and other aquatic weeds susceptible to copper treatment. Apply at a rate to achieve 0.70 to 1.0 ppm copper (3.72 to 5.32 Gallons/Acre foot). In heavily infested areas, a second application after the 14 day retreatment interval may be necessary.Tank Mix ApplicationsThis product can be tank mixed with other herbicides to improve efficacy; and to con-trol algae in areas where heavy algae growth may cover target submersed plant spe-cies and interfere with herbicide exposure. Do not mix concentrates in tank without first adding water. To ensure compatibility, conduct a jar test before application. This product must not be mixed with any product containing a label prohibition against such mixing and must be used in accordance with the most restrictive label limita-tions and precautions. Label dosage rates must not be exceeded.
0.20.30.40.50.6
Copper Concentration
(ppm)
0.600.901.201.501.80
0.70.80.91.0
2.102.402.703.00
Amount of This Product Per Acre-Foot
Gallons
Application Rates for Chemigation Systems
90

FIRST AIDIf on skin or clothing:• Take off contaminated clothing.• Rinse skin immediately with plenty of water for 15-20 minutes.• Call a Poison Control Center or doctor for treatment advice .If swallowed:• Call a Poison Control Center or doctor immediately for treatment advice.• Have person sip a glass of water if able to swallow.• Do not induce vomiting unless told to do so by a Poison Control Center or doctor.• Do not give anything by mouth to an unconscious person.If in eyes:• Hold eye open and rinse slowly and gently with water for 15-20 minutes. Remove
contact lenses, if present, after the first 5 minutes, then continue rinsing eye.• Call a Poison Control Center or doctor for treatment advice.If inhaled:• Move person to fresh air.• If person is not breathing, call 911 or an ambulance, then give artificial respira-
tion, preferably mouth-to-mouth if possible.• Call a Poison Control Center or doctor for further treatment advice.Have the product container or label with you when calling a Poison Control Center or doctor, or going for treatment. In case of emergency call 1-800-654-6911
PRECAUTIONARY STATEMENTSHAZARDS TO HUMANS AND DOMESTIC ANIMALS
CAUTION. Harmful if swallowed or absorbed through skin. Causes moderate eye irritation. Avoid contact with skin, eyes or clothing. Personal Protective Equipment (PPE)Mixers, loaders, applicators, and other handlers must wear the following:• Long-sleeved shirt and long pants,• Shoes and socks.
USER SAFETY REQUIREMENTSFollow manufacturer’s instructions for cleaning/maintaining PPE. If no such instruc-tions for washables exist, use detergent and hot water. Keep and wash PPE sepa-rately from other laundry. Discard clothing and other absorbent material that have been drenched or heavily contaminated with the product’s concentrate. Do not reuse them. Users must wash hands before eating, drinking, chewing gum, using tobacco or using the toilet. Remove clothing/PPE immediately if pesticide gets inside. Then wash thoroughly and put on clean clothing. Remove PPE immediately after handling this product. As soon as possible, wash thoroughly and change into clean clothing. Wash outside of gloves before removing.
Potable water sources treated with this copper product may be used as drinking water only after proper additional potable water treatments.
ENVIRONMENTAL HAZARDS: Do not use in waters containing Koi and hybrid goldfish. Not intended for use in small volume, garden pond systems.FISH AND AQUATIC ORGANISMS: Waters treated with this product may be hazardous to aquatic organisms. Treatment of aquatic weeds and algae can result in oxygen loss from decomposition of dead algae and weeds. This oxygen loss can cause fish and invertebrate suffocation. To minimize hazard, do not treat more than ½ of the water body to avoid depletion of oxygen due to decaying vegetation. Wait at least 10 to 14 days between treatments. Begin treatment along the shore and proceed outwards in bands to allow fish to move into untreated areas. In regions where ponds freeze in winter, treatment should be done 6 to 8 weeks before expected freeze time to prevent masses of decaying algae under an ice cover. Consult with the State or local agency with primary re-sponsibility for regulating pesticides before applying to public waters, to determine if a permit is required. This pesticide is toxic to some fish and aquatic invertebrates and may contaminate water through runoff. This product has a potential for runoff for several months or more after application. Poorly draining soils and soils with shallow water tables are more prone to produce runoff that contains this product. Do not contaminate water when disposing of equipment wash-waters or rinsate.
Certain water conditions including low pH (≤6.5) low dissolved organic carbon (DOC) levels (3.0 mg/L or lower), and “soft” waters (i.e., alkalinity less than 50 mg/L), in-creases the potential acute toxicity to non-target aquatic organism. Potable water sources treated with copper products may be used as drinking water only after prop-er additional potable water treatments. Trout and other species of fish may be killed at application rates recommended on the label, especially in soft or acidic waters as described above. Do not contaminate water when disposing of equipment wash-waters or rinsate.To protect listed species in California, contact your County Agricultural Commissioner or refer to the Department of Pesticide Regulation’s PRESCRIBE Internet Database: http://www.cdpr.ca.gov/docs/endspec/prescint
STORAGE & DISPOSAL:Do not contaminate water, food or feed by storage or disposal. Open dumping is prohibited.
PESTICIDE STORAGE: Keep container closed when not in use. Keep pesticide in original container. Do not put concentrate or dilute into food or drink containers. Do not reuse or refill container. Do not contaminate feed, feedstuffs, or drinking water. Do not store or transport near feed or food.
PESTICIDE DISPOSAL: Wastes resulting from the use of this product must be disposed of on site or at an approved waste disposal facility.
CONTAINER DISPOSAL: (For ≤5 gallon non-refillable containers only): Nonrefillable container. Do not reuse container. Triple rinse as follows: Empty the remaining contents into application equipment or a mix tank. Fill the container ¼ full with water and recap. Shake for 10 seconds. Pour rinsate into application equipment or a mix tank or store rinsate for later use or disposal. Drain for 10 seconds after the flow begins to drip. Repeat this procedure two more times. Then offer for recycling or reconditioning if available or puncture and dispose of in approved landfill, or in-cineration, or, if allowed by state and local authorities, by burning. If burned, stay out of smoke. Consult Federal, State or local authorities for approved alternative procedures. (For >5 gallon non-refillable containers only): Nonrefillable container. Do not reuse container. Triple rinse as follows: Empty the remaining contents into application equipment or a mix tank. Fill the container ¼ with water and recap. Replace and tighten closures. Tip container on its side and roll it back and forth, ensuring at least one complete revolution, for 30 seconds. Stand container on its end and tip it back and forth several times. Empty the rinsate into application equipment or a mix tank or store rinsate for later use or disposal. Repeat this procedure two more times. Then offer for recycling or reconditioning if available or puncture and dispose of in approved landfill, or incineration, or, if allowed by state and local authorities, by burning. If burned, stay out of smoke. Consult Federal, State or local authorities for approved alternative procedures.
(For 275 Gallon refillable container only): Refillable container. Cleaning the container before final disposal is the responsibility of the person disposing of the container. Cleaning before refilling is the responsibility of the refiller. To clean the container before final disposal, empty the remaining contents from this container into applica-tion equipment or mix tank. Fill container about 10 percent full with water. Agitate vigorously or recirculate water with pump for 2 minutes. Pour or pump rinsate into ap-plication equipment or rinsate collection system. Repeat rinsing procedure two more times. Then offer for recycling or reconditioning if available or puncture and dispose of in approved landfill, or incineration, or, if allowed by state and local authorities, by burning. If burned, stay out of smoke. Consult Federal, State or local authorities for approved alternative procedures.
WARRANTYTo the extent consistent with applicable law neither the manufacturer nor the seller makes any warranty, expressed or implied concerning the use of this product other than indicated on the label. To the extent consistent with applicable law buyer as-sumes risk of use of this material when such use is contrary to label instructions. Read and follow the label directions.
Cutrine-Plus® and Harvester® are registered trademarks of Arch Chemicals, Inc.
051815/ESL02051591

Exhibit H
92

93

94

95

96

97

98

99

100

EPA REG. NO. 228-378-8959EPA EST. NO. 42291-GA-1
ACTIVE INGREDIENT: Butoxyethyl Ester of 2,4-Dichlorophenoxyacetic Acid*.........................................................27.6%OTHER INGREDIENTS:..........................72.4%TOTAL:..................................................100.0%
*Isomer specifi c by AOAC Method, Equivalent to2,4-Dichlorophenoxyacetic Acid.........................19%
KEEP OUT OF REACH OF CHILDREN
CAUTIONSee Inside For
Additional Precautionary Statements
W175N11163 Stonewood Dr. Ste. 234, Germantown, WI 53022 • 1-800-558-5106
www.appliedbiochemists.com
A SELECTIVE HERBICIDEFOR CONTROLLING CERTAINUNWANTED AQUATIC PLANTS
DIRECTIONS FOR USEIt is a violation of Federal law to use this product in a manner inconsistent with its labeling. READ ENTIRE LABEL BEFORE USING THIS PRODUCT. USE STRICTLY IN ACCORDANCE WITH LABEL PRECAUTIONARY STATEMENTS AND DIRECTIONS.GENERAL PRECAUTIONS AND RESTRICTIONSDo not apply this product in a way that will contact workers or other persons, either directly or through drift. Only protected handlers may be in the area during application. Do not enter or allow others to enter the treated area until dusts have settled.Do not use in or near a greenhouse.OXYGEN RATIOFish breathe oxygen in the water and a water/oxygen ratio must be maintained. Decaying weeds use up oxygen, but during the period when this product should be used, the weed mass is fairly sparse and the weed decomposition rate is slow enough so that the water/oxygen ratio is not disturbed by treating the entire area at one time.If treatments must be applied later in the season when the weed mass is dense and repeat treatments are needed, spread granules in lanes, leaving buffer strips which can then be treated when vegetation in treated lanes has disintegrated. During the growing season, weeds decompose in a 2 to 3 week period following treatment.Buffer lanes should be 50 to 100 feet wide. Treated lanes should be as wide as the buffer strips. (See illustration to the right.)WATER pHBest results are generally obtained if the water to be treated has a pH less than 8. A pH of 8 or higher may reduce weed control. If regrowth occurs within a period of 6 to 8 weeks, a second application may be needed.PERMIT TO USE CHEMICALS IN WATERIn many states, permits are required to control weeds by chemical means in public water. If permits are required, they may be obtained from the Chief, Fish Division, State Department of Conservation or the State Department of Public Health.
GENERAL INFORMATIONThis product is formulated on special heat treated attaclay granules that resist rapid decomposition in water, sink quickly to lake or pond bottoms and release the weed killing chemical into the critical root zone area.This product is designed to selectively control the weeds listed on the label. While certain other weed may be suppressed, control may be incomplete. Reduced control may occur in lakes where water replacement comes from bottom springs.WHEN TO APPLYFor best results, spread this product in the spring and early summer, during the time weeds start to grow. If desired, this timing can be checked by sampling the lake bottom in areas heavily infested with weeds the year before. If treatments are delayed until weeds form a dense mat or reach the surface, two treatments may be nec-essary. Make the second treatment when weeds show signs of recovery. Treatments made after Septem-ber may be less effective depending upon water temperature and weed growth. Occasionally, a second application will be necessary if heavy regrowth occurs or weeds reinfest from untreated areas.
Manufactured for:
®
N
W E
SPECIMEN LABEL
Exhibit I
101

HOW TO APPLYFOR LARGE AREAS: Use a fertilizer spreader or mechanical seeder such as the Gerber or Gandy or other equipment capable of uniformly applying this product. Before spreading any chemical, calibrate your method of application to be sure of spreading the proper amount. When using boats and power equipment, you must determine the proper combination of (1) boat speed, (2) rate of delivery from the spreader, and (3) width of swath covered by the granules. FOR SMALL AREAS (Around Docks or Isolated Patches of Weeds): Use a por-table spreader such as the Cyclone seeder or other equipment capable of uniformly applying this product. Estimate or measure out the area you want to treat. Weigh out the amount of material needed and spread this uniformly over the area. More uniform coverage is obtained by dividing the required amount in two and covering the area twice, applying the second half at right angles to the fi rst.Use the following formula to calibrate your spreader’s delivery in pounds of this prod-uct per minute.
Miles per hour x spreader width x pounds per acre495
Example: To apply 100 pounds of this product per acre using a spreader that covers a 20 foot swath from a boat traveling at 4 miles per hour, set the spreader to deliver 16 pounds of this product per minute.
4 mph x 20 feet x 100 Ibs./A495
AMOUNTS TO USERates of application vary with resistance of weed species to the chemical, density of weed mass at time of treatment, stage of growth, water depth, and rate of water fl ow through the treated area. Use the higher rate for dense weeds, when water is more than 8 feet deep and where there is a large volume turnover.SUSCEPTIBLE WEEDSWater Milfoil (Myriophylum spp.)Water stargrass (Heteranthera dubia)SLIGHTLY TO MODERATELY RESISTANT WEEDSBladderwort (Utricularia spp.)White water lily (Nymphaea spp.)Yellow water lily or spatterdock* (Nuphar spp.)Water shield (Brasenia spp.)Water chestnut (Trapa natans)Coontail* (Ceratophyllum demersum)*Repeat treatments may be needed.
AQUATIC USE PRECAUTIONS AND RESTRICTIONSFLOATING AND EMERGENT WEEDSMaximum of 4.0 lbs 2,4-D ae or 21 lbs of this product per surface acre per applica-tion. Limited to 2 applications per season. Minimum of 21 days between applications. Spot treatments are permitted.Apply to emergent aquatic weeds in ponds, lakes, reservoirs, marshes, bayous, drainage ditches, non-irrigation canals, rivers, and streams that are quiescent or slow moving.Coordination and approval of local and state authorities may be required, either by letter of agreement or issuance of special permits for aquatic applications.Water Use for Floating and Emergent Weeds1. Water for irrigation or sprays:A. If treated water is intended to be used only for crops or non-crop areas that are
labeled for direct treatment with 2,4-D such as pastures, turf, or cereal grains, the treated water may be used to irrigate and/or mix sprays for these sites at anytime after the 2,4-D aquatic application.
B. Due to potential phytotoxicity considerations, the following restrictions are ap-plicable:If treated water is intended to be used to irrigate or mix sprays for plants grown in commercial nurseries and greenhouses; and other plants or crops that are not labeled for direct treatment with 2,4-D, the water must not be used unless one of the following restrictions has been observed:i. A setback distance from functional water intake(s) of greater than or equal to 600
feet was used for the application, or,ii. A waiting period of 7 days from the time of application has elapsed, or,iii. An approved assay indicates that the 2,4-D concentration is 100 ppb (0.1 ppm)
or less at the water intake. Wait at least 3 days after application before initial sampling at water intake.
2. Drinking water (potable water):A. Consult with appropriate state or local water authorities before applying this prod-
uct to public waters. State or local agencies may require permits. The potable water use restrictions on this label are to ensure that consumption of water by the public is allowed only when the concentration of 2,4-D in the water is less than the MCL (Maximum Contaminant Level) of 70 ppb. Applicators should consider the unique characteristics of the treated waters to assure that 2,4-D concentrations in potable water do not exceed 70 ppb at the time of consumption.
B. For fl oating and emergent weed applications, the drinking water setback distance from functioning potable water intakes is greater than or equal to 600 feet.
C. If no setback distance of greater than or equal to 600 feet is used for application, applicators or the authorizing organization must provide a drinking water notifi ca-tion prior to a 2,4-D application to the party responsible for public water supply or to individual private water users. Notifi cation to the party responsible for a public water supply or to individual private water users must be done in a manner to assure that the party is aware of the water use restrictions when this product is applied to potable water.The following is an example of a notifi cation via posting, but other methods of notifi cation which convey the above restrictions may be used and may be required in some cases under state or local law or as a condition of a permit.Example: Posting notifi cation should be located every 250 feet including the shoreline of the treated area and up to 250 feet of shoreline past the application site to include immediate public access points. Posting must include the day and time of application. Posting may be removed if analysis of a sample collected at the intake 3 or more days following application shows that the concentration in the water is less than 70 ppb (100 ppb for irrigation or sprays), or after 7 days follow-ing application, whichever occurs fi rst.Text of notifi cation: Wait 7 days before diverting functioning surface water in-takes from the treated aquatic site to use as drinking water, irrigation, or sprays, unless water at functioning drinking water intakes is tested at least 3 days after application and is demonstrated by assay to contain not more than 70 ppb 2,4-D (100 ppb for irrigation or sprays). Application Date:_____ Time:______
D. Following each application of this product, treated water must not be used for drinking water unless one of the following restrictions has been observed:i. A setback distance from functional water intake(s) of greater than or equal to 600
feet was used for the application, or,ii. A waiting period of at least 7 days from the time of application has elapsed, or,iii. An approved assay indicates that the 2,4-D concentration is 70 ppb (0.07 ppm)
or less at the water intake. Sampling for drinking water analysis should occur no sooner than 3 days after 2,4-D application. Analysis of samples must be completed by a laboratory that is certifi ed under the Safe Drinking Water Act to perform drinking water analysis using a currently approved version of analytical Method Number 515, 555, other methods for 2,4-D as may be listed in Title 40 CFR, Part 141.24, or Method Number 4015 (immunoassay of 2,4-D) from U.S. EPA Test Methods for Evaluating Solid Waste SW-846.
E. Note: Existing potable water intakes that are no longer in use, such as those replaced by a connection to a municipal water system or a potable water well, are not considered to be functioning potable water intakes.
F. Drinking water setback distances do not apply to terrestrial applications of 2,4-D adjacent to water bodies with potable water intakes.
3. Swimming:A. Do not swim in treated water for a minimum of 24 hours after application.B. Users must provide notifi cation prior to performing a 2,4-D BEE application. Notifi -
cation to the party responsible for the public swimming area or to individual private users must be done in a manner to assure that the party is aware of the water use swimming restrictions when this product is applied to water. The following is an example of a notifi cation via posting, but other methods of notifi cation which convey the above restrictions may be used and may be required in some cases under state or local law or as a condition of a permit.Example: Posting notifi cation should be located every 250 feet including the shoreline of the treated area and up to 250 feet of shoreline past the application site to include immediate public access points.Text of notifi cation: Do not swim in treated water for a minimum of 24 hours after application. Application Date: ______ Time: _____
4. Except as stated above, there are no restrictions on using water from treated areas for swimming, fi shing, watering livestock or domestic purposes.
102

SUBMERSED WEEDSMaximum of 10.8 lbs 2,4-D ae or 56.8 lbs of this product per acre-foot per ap-plication. Limited to 2 applications per season.Apply to aquatic weeds in ponds, lakes, reservoirs, marshes, bayous, drainage ditches, non-irrigation canals, rivers, and streams that are quiescent or slow moving. Do not apply within 21 days of previous application. When treating moving bodies of water, applications must be made while traveling upstream to prevent concentration of 2,4-D downstream from the application.Coordination and approval of local and state authorities may be required, either by letter of agreement or issuance of special permits for such use.
Note: The same “Water for Irrigation or Spray” restrictions for Floating and Emergent Weeds apply to Submersed Weeds.Water Use for Submersed Weeds1. Water for irrigation or sprays:A. If treated water is intended to be used only for crops or non-crop areas that are
labeled for direct treatment with 2,4-D such as pastures, turf, or cereal grains, the treated water may be used to irrigate and/or mix sprays for these sites at anytime after the 2,4-D aquatic application.
B. Due to potential phytotoxicity considerations, the following restrictions are ap-plicable: If treated water is intended to be used to irrigate or mix sprays for unlabeled crops, non-crop areas or other plants not labeled for direct treatment with 2,4-D, the wa-ter must not be used unless one of the following restrictions has been observed:i. A setback distance described in the Drinking Water Setback Table was used for
the application, or,ii. A waiting period of 21 days from the time of application has elapsed, or,iii. An approved assay indicates that the 2,4-D concentration is 100 ppb (0.1 ppm)
or less at the water intake. See Table 3 for the waiting period after application but before taking the initial sampling at water intake.
2. Drinking water (potable water):A. Consult with appropriate state or local water authorities before applying this prod-
uct to public waters. State or local agencies may require permits. The potable water use restrictions on this label are to ensure that consumption of water by the public is allowed only when the concentration of 2,4-D in the water is less than the MCL (Maximum Contaminant Level) of 70 ppb. Applicators should consider the unique characteristics of the treated waters to assure that 2,4-D concentrations in potable water do not exceed 70 ppb at the time of consumption.
B. For submersed weed applications, the drinking water setback distances from functioning potable water intakes are provided in Table 2. Drinking Water Setback Distance (on next page).
C. If no setback distance from the Drinking Water Setback Table (Table 2) is to be used for the application, applicators or the authorizing organization must provide a drinking water notifi cation and an advisory to shut off all potable water intakes prior to a 2,4-D application. Notifi cation to the party responsible for a public water supply or to individual private water users must be done in a manner to assure that the party is aware of the water use restrictions when this product is applied to potable water.The following is an example of a notifi cation via posting, but other methods of notifi cation which convey the above restrictions may be used and may be required in some cases under state or local law or as a condition of a permit.Example: Posting notifi cation should be located every 250 feet including the shoreline of the treated area and up to 250 feet of shoreline past the application site to include immediate public access points. Posting should include the day and
time of application. Posting may be removed if analysis of a sample collected at the intake no sooner than stated in Table 3 (below) shows that the concentration in the water is less than 70 ppb (100 ppb for irrigation or sprays), or after 21 days following application, whichever occurs fi rst.Text of notifi cation: Wait 21 days before diverting functioning surface water in-takes from the treated aquatic site to use as drinking water, irrigation, or sprays, unless water at functioning drinking water intakes is tested no sooner than (insert days from Table 3) and is demonstrated by assay to contain not more than 70 ppb 2,4-D (100 ppb for irrigation or sprays). Application Date: ______ Time: _____
D. Following each application of this product, treated water must not be used for drinking water unless one of the following restrictions has been observed:i. A setback distance described in the Drinking Water Setback Distance Table was
used for the application, or,ii. A waiting period of at least 21 days from the time of application has elapsed, or,iii. An approved assay indicates that the 2,4-D concentration is 70 ppb (0.07 ppm)
or less at the water intake. Sampling for drinking water analysis should occur no sooner than stated in Table 3. Analysis of samples must be completed by a laboratory that is certifi ed under the Safe Drinking Water Act to perform drinking water analysis using a currently approved version of analytical Method Num-ber 515, 555, other methods for 2,4-D as may be listed in Title 40 CFR, Part 141.24, or Method Number 4015 (immunoassay of 2,4-D) from U.S. EPA Test Methods for Evaluating Solid Waste SW-846.
E. Note: Existing potable water intakes that are no longer in use, such as those replaced by a connection to a municipal water system or a potable water well, are not considered to be functioning potable water intakes.
F. Drinking water setback distances do not apply to terrestrial applications of 2,4-D adjacent to water bodies with potable water intakes.
3. Swimming:A. Do not swim in treated water for a minimum of 24 hours after application.B. Users must provide the following notifi cation prior to performing a 2,4-D BEE ap-
plication. Notifi cation to the party responsible for the public swimming area or to individual private users must be done in a manner to assure that the party is aware of the water use swimming restrictions when this product is applied to water. The following is an example of a notifi cation via posting, but other methods of notifi cation which convey the above restrictions may be used and may be required in some cases under state or local law or as a condition of a permit.Example: Posting notifi cation should be located every 250 feet including the shoreline of the treated area and up to 250 feet of shoreline past the application site to include immediate public access points.Text of notifi cation: Do not swim in treated water for a minimum of 24 hours after application. Application Date: ______ Time: _____
4. Except as stated above, there are no restrictions on using water from treated areas for swimming, fi shing, watering livestock or domestic purposes.
Use of this product in certain portions of California, Oregon, and Washington is sub-ject to the January 22, 2004 Order for injunctive relief in Washington Toxics Coali-tion, et al. v. EPA, C01-0132C, (W.D. WA).For further information, please refer to http://www.epa.gov/espp/litstatus/wtc/index.htm.
Table 1. Amount of 2,4-D to Apply for a Target Subsurface ConcentrationSurface
AreaAverage Depth
For typical conditions2 ppm 2,4-D ae/acre-foot
For difficult conditions*4 ppm 2,4-D ae/acre-foot
1 Foot 5.4 pounds(28.4 lbs of this product)
10.8 pounds(56.8 lbs of this product)
2 Feet 10.8 pounds(56.8 lbs of this product)
21.6 pounds(110.8 lbs of this product)
3 Feet 16.2 pounds(85.2 lbs of this product)
32.4 pounds(170.5 lbs of this product)
4 Feet 21.6 pounds(110.8 lbs of this product)
43.2 pounds(227.3 lbs of this product)
1 Acre
*Examples include spot treatment of pioneer colonies of Eurasian Water Milfoil and certain difficult to control aquatic species.
5 Feet 27.0 pounds(142.1 lbs of this product)
54.0 pounds(284.2 lbs of this product)
Table 2. Drinking Water Setback Distance for Submersed Weed Applications
*ppm acid equivalent target water concentration
1 ppm*
600
2 ppm*
1200
3 ppm*
1800
4 ppm*
2400
Application Rate and Minimum Setback Distance (feet) From Functioning Potable Water Intake
Table 3. Sampling for Drinking Water Analysis After 2,4-D Applicationfor Submersed Weed Applications
*ppm acid equivalent target water concentration
1 ppm*
5
2 ppm*
10
3 ppm*
10
4 ppm*
14
Minimum Days After Application Before Initial Water Sampling at the Functioning Potable Water Intake
103

PRECAUTIONARY STATEMENTSHAZARDS TO HUMANS AND DOMESTIC ANIMALS
CAUTION Causes moderate eye irritation. Avoid contact with eyes or clothing.
PERSONAL PROTECTIVE EQUIPMENT (PPE): All loaders, applicators, and other handlers must wear:• long-sleeved shirt and long pants,• shoes plus socksFollow manufacturer’s instructions for cleaning/maintaining PPE. If no such instruc-tions for washables exist, use detergent and hot water. Keep and wash PPE sepa-rately from other laundry.
USER SAFETY RECOMMENDATIONSUsers Should:• Wash hands before eating, drinking, chewing gum, using tobacco, or using
the toilet.• Remove clothing/PPE immediately if pesticide gets inside. Then wash thor-
oughly and put on clean clothing. If pesticide gets on skin, wash immediately with soap and water.
• Remove PPE immediately after handling this product. Wash the outside of gloves before removing. As soon as possible, wash thoroughly and change into clean clothing.
FIRST AIDIF IN EYES• Hold eye open and rinse slowly and gently with water for 15 to 20 minutes.• Remove contact lenses, if present, after the fi rst 5 minutes, then continue
rinsing eye.• Call a poison control center or doctor for treatment advice.
IF SWALLOWED• Call a poison control center or doctor immediately for treatment advice.• Have person sip a glass of water if able to swallow.• Do not induce vomiting unless told to do so by a poison control center or
doctor.• Do not give anything by mouth to an unconscious person.
IF ON SKIN OR CLOTHING• Take off contaminated clothing.• Rinse skin immediately with plenty of water for 15 to 20 minutes.• Call a poison control center or doctor for treatment advice.
IF INHALED• Move person to fresh air.• If person is not breathing, call 911 or an ambulance, then give artifi cial respi-
ration, preferably mouth-to-mouth if possible.• Call a poison control center or doctor for further treatment advice.
HOT LINE NUMBERHave the product container or label with you when calling a poison control center or doctor, or going for treatment.IN CASE OF EMERGENCY CALL: 1-800-654-6911
ENVIRONMENTAL HAZARDSFish breathe dissolved oxygen in the water and decaying weeds also use oxygen. When treating continuous, dense weed masses, it may be appropriate to treat only part of the infestation at a time. For example, apply the product in lanes separated by untreated strips that can be treated after vegetation in treated lanes has disinte-grated. During the growing season, weeds decompose in a 2 to 3 week period fol-lowing treatment. Begin treatment along the shore and proceed outwards in bands to allow fi sh to move into untreated areas. Waters having limited and less dense weed infestations may not require partial treatments.
For Chemical Spill, Leak, Fire, or Exposure, Call CHEMTREC (800) 424-9300For Medical Emergencies Only, call (800)-654-6911
STORAGE AND DISPOSAL Do not contaminate water, food or feed by storage or disposal.
PESTICIDE STORAGE: Always use original container to store pesticides in a secured warehouse or storage building. Do not store near seeds, fertilizers, insecticides or fungicides. Do not stack more than two pallets high. It is recom-mended that a SARA Title III emergency response plan be created for storage facilities. Do not transport in the passenger compartment of any vehicle.PESTICIDE DISPOSAL: Pesticide wastes are toxic. If container is damaged or if pesticide has leaked, clean up all spilled material. Improper disposal of excess pesticide, spray mixtures or rinsate is a violation of Federal law and may contaminate groundwater. If these wastes cannot be disposed of by use according to label instructions, contact your State Pesticide or Environmental Control Agency, or the Hazardous Waste representative at the nearest EPA Regional Offi ce for guidance.CONTAINER DISPOSAL: Nonrefi llable container. Do not reuse or refi ll this container. Completely empty container into application equipment, then offer for recycling if available, or dispose of empty container in a sanitary landfi ll or by incineration or, if allowed by state and local authorities, by burning. If burned, stay out of smoke.
WARRANTY DISCLAIMERThe directions for use of this product must be followed carefully. TO THE EX-TENT CONSISTENT WITH APPLICABLE LAW, (1) THE GOODS DELIVERED TO YOU ARE FURNISHED “AS IS” BY MANUFACTURER OR SELLER AND (2) MANUFACTURER AND SELLER MAKE NO WARRANTIES, GUARANTEES, OR REPRESENTATIONS OF ANY KIND TO BUYER OR USER, EITHER EXPRESS OR IMPLIED, OR BY USAGE OF TRADE, STATUTORY OR OTHERWISE, WITH REGARD TO THE PRODUCT SOLD, INCLUDING, BUT NOT LIMITED TO MER-CHANTABILITY, FITNESS FOR A PARTICULAR PURPOSE, USE, OR ELIGIBIL-ITY OF THE PRODUCT FOR ANY PARTICULAR TRADE USAGE. UNINTENDED CONSEQUENCES, INCLUDING BUT NOT LIMITED TO INEFFECTIVENESS, MAY RESULT BECAUSE OF SUCH FACTORS AS THE PRESENCE OR ABSENCE OF OTHER MATERIALS USED IN COMBINATION WITH THE GOODS, OR THE MAN-NER OF USE OR APPLICATION, INCLUDING WEATHER, ALL OF WHICH ARE BEYOND THE CONTROL OF MANUFACTURER OR SELLER AND ASSUMED BY BUYER OR USER. THIS WRITING CONTAINS ALL OF THE REPRESENTATIONS AND AGREEMENTS BETWEEN BUYER, MANUFACTURER AND SELLER, AND NO PERSON OR AGENT OF MANUFACTURER OR SELLER HAS ANY AUTHOR-ITY TO MAKE ANY REPRESENTATION OR WARRANTY OR AGREEMENT RE-LATING IN ANY WAY TO THESE GOODS.
LIMITATION OF LIABILITY TO THE EXTENT CONSISTENT WITH APPLICABLE LAW, IN NO EVENT SHALL MANUFACTURER OR SELLER BE LIABLE FOR SPECIAL, INCIDENTAL, OR CON-SEQUENTIAL DAMAGES, OR FOR DAMAGES IN THEIR NATURE OF PENAL-TIES RELATING TO THE GOODS SOLD, INCLUDING USE, APPLICATION, HAN-DLING, AND DISPOSAL MANUFACTURER OR SELLER SHALL NOT BE LIABLE TO BUYER OR USER BY WAY OF INDEMNIFICATION TO BUYER OR TO CUS-TOMERS OF BUYER, IF ANY, OR FOR ANY DAMAGES OR SUMS OF MONEY, CLAIMS OR DEMANDS WHATSOEVER, RESULTING FROM OR BY REASON OF, OR RISING OUT OF THE MISUSE, OR FAILURE TO FOLLOW LABEL WARNINGS OR INSTRUCTIONS FOR USE, OF THE GOODS SOLD BY MANUFACTURER OR SELLER TO BUYER. ALL SUCH RISKS SHALL BE ASSUMED BY THE BUYER, USER, OR ITS CUSTOMERS. BUYER’S OR USER’S EXCLUSIVE REMEDY, AND MANUFACTURER’S OR SELLER’S TOTAL LIABILITY SHALL BE FOR DAMAGES NOT EXCEEDING THE COST OF THE PRODUCT.If you do not agree with or do not accept any of directions for use, the warranty disclaimers, or limitations on liability, do not use the product, and return it unopened to the Seller, and the purchase price will be refunded.
Navigate®, the ab logo, and Applied Biochemists are registered trademarks of Arch Chemicals, Inc.110111104

Random Lake—Sheboygan County
June 11,2015 Treatment Areas*
* Balance of Treatment Postponed by Weather
Area 4
Area 6
Area Acres Depth DMA4-IVM Aquathol-K
6 3 6 25.25
4a 4 4 22.5
4b 0.5 2 1.5 0.6
7.5 49.25 0.6
Treatment Concentrations
DMA4-IVM: 2.0 ppm
Aquathol-K: 1.0 ppm
Marine Biochemists
6302 W. Eastwood Ct.
Mequon, WI 53092
(888) 558-5106
www.marinebiochemists.com
Exhibit J
105

Aquatic Plant Management Herbicide Treatment Record
Notice: Completion of this form is a condition of Wl DNR permits and provides records required by WDNR (NR1O7, WPDES 5.1) and DATCP (ATCP 29.21&29,221. The Department may not issue you future permits unless you complete and submit this form. Personally identifiable information requiredon this form is not likely to be used for purposes other than that for which it is originally collected. !t may atso be made available to requesterc underWisconsin Open Records law (ss. 19.31-19.39 Wis. Stats.).
Submit This Form: 1) lmmediately if any unusual circumstances occurred during the treatment, 2) As soon as possible, no later than 30 days after treat-ment, 3) By October 1 if no treatment occurred
Completion of this form along with the Permit satisfies the requirements of WDNR WDNR (NRl07, WPDES 5.1) and DATCP (ATCP 29.21 &General Permit lnformation Waterbody name (including ponds, eg., Smith Pond and Address) Treatment lnforma6on
Permit Number
frzutsto'fr R*t'r^ 6'f in;x:" ;ffv , End Time/:do p//
'HUvqtur'wate? remp (r)7{ Air Temp (F)
b2" r Wind Speed &Direction
aJruTreatment {16 Size (Acres)
7.5
avera/e oepth
a ?;fttWater Volume (Acre-Ft.) Est. Water Volume (Acre-Ft) On Site DNR Supervision Present?
!r", ( *"lf yes, Supervisor Name:
Visual Observations/Notes ,{ b) /ryoarzsOn /rt lz,te dlb A tc,lfclq Q2rc1
d= ,4o
Z .hn i-:.-#Note: Applicator Shall Provide Customer 6e copy of pesticidgfpbe/used upon I
Name of Applicator(s) Certification # License # Application Business lnformation
Marine Biochemists
6302 W. Eastwood Ct.
Mequon, Wl 53092
(888) ss8-s106
Name of Person
Completing Form
Date
Paul HinterberC D 89833 44093t
Jim Kannenberg [-l 28658 224269
Tom Lloyd tr 53859 t46250
Marc Schmitz n 77687 280774
Brian Suffern EL L5t7 742402
nPond Product Used E.P.A. Registration No. Quantity Applied Concentration (ppm) 0r Rate (gal./acre) Applied
A.E B.tr c.trD.tr Aquathol-K 70506-L76 O. O, +y( / oa- ?A ro-a'+/z /A.E r.E ..t] D.tr Clearigate 8959-51
v // IA.r_.t B. E c.n D.n Cutrine-Plus 8959-10
A.fl B.n c. n D.f-l DMA4-IVM 627t9-3 4t/"25m ? nr- k 7,51 /47'atno.n r.l] c. E D.n Harpoon 8959-54 I // /A.r_1 B. n c. n D. r-l Harvester 10G1091-8959
A.E B.E c.t] D.E Hydrothol 191 70506-175
A.E 8.tr c. [o. IcontractType: PerTreatm"ntf]SeasonalI FoRoFFlcEUsEoNtY
Product/ltem Code Amount Customer #
Additional lnstructions For lnvoicingr
Exhibit K
106

Area Acres DMA4 Aquathol-K Navigate Cutrine-Plus
1a 7.6 41.5
1b 0.5 0.6
1c 0.2 0.5 0.25
3 0.5 2.25 1
7 1.4 6.5 2
8 0.7 70
9 3.4 19 3
10 1.3 130
11 1 5.5
12 1.1 4.75
17.7 80 6.25 200
1a
1b 1c
3
9
7
8
10
11
12
June 11/12, 2015 Totals by Product Type
DMA4-IVM @ 2 ppm: 22.7 acres, 129.25 gal (Eurasian Watermilfoil)
Aquathol-K @ 1ppm: 4.1 acres, 6.85 gal (Curlyleaf Pondweed)
Navigate (2,4-D Granular) @ 100#/acre: 2.0 acres, 200# (Eurasian Watermilfoil
Cutrine-Plus @ 0.2 ppm: 0.5 acres, 0.6 gal (filamentous algae)
Marine Biochemists
6302 W. Eastwood Ct.
Mequon, WI 53092
(888) 558-5106
www.marinebiochemists.com
Random Lake -Sheboygan County, WI
June 12, 2015 Treatment Areas
Exhibit L
107

Aquatic Plant Marragement l{erbicide Treatment Record
Notice: Cornpletion of this form is a condition of Wl DNR permits and provides records required by WDNR (NR107, WPDES 5.1) and DATCP (ATCP 29.21
&29.221. Tlre Depai'tr,rr:nt ,,r.rtri not issue you future permits unless you complete and submit this form. Personally identifiable information required
on this fornr is rrot likely to be used for purposes other than that for which it is originally collected. lt may also be made available to requesters under
Wisconsin Open Recurds law (ss. 19.31'-19.39 Wis. Stats.).
SubmitThisForrit:1) lnrr,rediatelyif anyunusual circumstancesoccurredduringthetreatment,2) Assoonaspossible,nolaterthan30daysaftertreat-
ment, 3) By Octc[rer .l- ii rro treatnrent occurred
Coriiplerion of this foi.rir alor.rg rarith the Pennit satisfies the requirements of WDNR WDNR (NR107, WPDES 5.1) and DATCP (ATCP 29.21 &
General Pernrit inforr,iatior Waterbody name (including ponds, eg., Smith Pond and Address) Treatment lnformation
Avg. Dept
I Visual Obsenrations/Notes
Note: Applicator Shall Provide Customer copy of pes label used
Certification # Application Business lnformation
Marine Biochemists
5302 W. Eastwood Ct.
Mequon, Wl 53092
(888) ss8-s106
Jirn Kannenberg
iTom Llovd
i trlarc Schmitz Name of Person
Completing Form
Date
n
I
:A.T:t B L-l c [] D ilF-.-.-_*--,.
: A n B.[.] c i.l o LlirA[]B[](.ilDtl
,n;1 a.ncilD.L.li;n "u.C;,.rL-.^.
--,-,*IlAIB.f_jciltr.ilB.fl c []r,.[]B.fl c fl D LJ
ContractType: PerTreatment nProduct/ltem Code
FOR OFFICE USE ONLY
Amount
on Site DNR Supervision Present? ! v"r E *o
lf yes, Supervisor NamA:
Product Used
Aquathol-K
Cutri ne- P lus
E.P.A. Registration No. Concentration (ppm) 0r Rate (gal./acre) Applied
] ndditiona t t nlfrridli6-ns Foiinvoicing:
Customer #
Exhibit M
108

Area Acres
1a 2.8
4 1.7
6a 1.5
6b 1.0
7 0.5
8 0.5
9 2.8
10 0.6
11.4
Random Lake—Sheboygan County
August 13/14, 2015 Eurasian Watermilfoil Treatment
1a
4
6a
6b
7
9 8
10
Marine Biochemists
6302 W. Eastwood Ct.
Mequon, WI 53092
(888) 558-5106
www.marinebiochemists.com
Non-Highlighted Areas treated on 8-13-15.
Highlighted Areas Postponed until 8-14-15 due to
wind/wave action within these areas.
Two Day Treatment Total: 11.4 acres
DMA4-IVM Herbicide Applied at 2 ppm concen-
tration. Total Quantity Used 69.75 gallons.
Exhibit N
109

Aquatic Plant Management Herbicide Treatment Record
Notice: completion of this form is a condition of wl DNR permits and provides records required by wDNR (NR1o7, wpDEs 5.1) and DATCP (ATCP 29.21&29.22t,, The Department may not issue you future permits unless you complete and submit this form. personally idenffiable information requiredon this form is not likely to be used for purposes other than that for which it is originally collected. lt may also be made available to requesters underWisconsin Open Records law (ss. 19.31-19.39 Wis. Stats.).
Submit This Form: 1) lmmediately if any unusual circumstances occurred during the treatment, 2) As soon as possible, no later than 30 days after treat-ment, 3) By October 1 if no treatment occurred
completion of this form along with the Permit satisfies the requirements of wDNR wDNR (NR1o7, wpDEs 5.1) and DATcp (ATCP 29.21 &General Permit lnformation Waterbody name (including ponds, et., Smith pond and Address) Treatment lnformation
Note: Applicator Shall Provide Customel
Water Temp (F)
?,s-1.-7,
Est. Water Volume (Acre-Ft) On Site DNR Supervision Present?
lf yes, Supervisor Name:
E r", {*"Visual Observations/Notes 7-visuarobservations/Notes
7ruM4ar,zas 4r k-r 66, ?"/. 7- 7o# 5nry.4,V'1 ,/For* /t /O a.z)/./ )a,t /r- ,;.f-?gififfis,ffim!trffi,{H'
signspostedinAccoriancewit-nrunrozrE v"' f] *o / d47 S/U/irlrl{>??- Z
Name of Applicator(s) Application Business lnformationMarine Biochemists
5302 W. Eastwood Ct.
Mequon, Wl 53092
(888) ss8-s106
Paul Hintei-be-g- tr
E.P.A. Registration No. Concentration (ppm) 0r Rate (gal./acre) Applied
A.E B.E c. trD.trAE B.E c. E D.
B.E c.E D.
o, E r.r-t c. r-.1
D,
o.r-l r. E c. E D.
A.EB.EcA.EB.trc.[o.Icontract Type: Per Treatment f] Seasonal f] FoR oFFICE UsE oNLy
Product/ltem Code Amount Customer f
Exhibit O
110

Aquatic Plant Management Herbicide Treatment Record
Notice: completion of this form is a condition of wl DNR permits and provides records required by wDNR (NR1o7, wpDEs 5.1) and DATcp (ATcp 29.21A29,221, The Department may not issue you future permits unless you complete and submit this form. personally identifiable information requiredon this form is not likely to be used for purposes other than that for which it is originally coltected. lt may also be made available to requesters underWisconsin Open Records law (ss. 19.31-19.39 Wis. Stats.).
Submit This Form: 1) lmmediately if any unusual circumstances occurred during the treatment, 2) As soon as possible, no later than 30 days after treat-ment, 3) By October 1 if no treatment occurred
completion of this form along with the Permit satisfies the requirements of wDNR wDNR (NR1o7, wpDEs 5.1) and DATCP (ATCP 29.21 &ceneral Permit lnformafion Waterbody name (including ponds, eg., Smith pond and Address) Treatment lnformationPermit Number
2ai5.r*-197 R*l* lr/@, rl;ut'ie* frWY t;y'ry7#J**n (ilrou tf /*rtn /a/u
WatJr remp (r)
86 vv Wind Speed &Direction
dt5-/oTreatmen/af,ea Size (Acres)
3"4averaq(oepth
3:4Water Volume (Acre-Ft.) Est. Water Volume (Acre-Ft) On Site DNR Supervision Present?
f] ,", X *"lf yes, Supervisor Name:
kDsI,TffiN
/" *lrqw. C,ildlwWater Use Restriction Signs Posted in Accordance with NR Yes E *o
Note: Applicator Shall Provide Customer Ce copy of pesticide/ used upon request
Name of Applicator(s) Certification # License # ' Ap6idtion Business tnformation
Marine Biochemists
6302 W. Eastwood Ct.
Mequon, Wl 53092
(888) ss8-s105
Name of Person
Completing Form
Date
Paul Hinterbc-g D 89833 440937
Jim Kannenberg [-l 28668 224269
Tom Lloyd tr s3869 146250
Marc Schmitz tr 77687 280774
Brian Suffern [. 7517 t42402
trPond Product Used E.P.A. Registration No. Quantity Applied Concentration (ppm) Or Rate (gal./acre) Applied
A.E B.tr c. tr D.tr Aquathol-X 70506-L76
A.E B,E ..I:] D.E Clearigate 8959-51
A.r-l B. E c.n D.n Cutrine-Pl us 8959-10I
A. f-l B.rr c. n D. f-.1
DMA4.IVM 62719-3 /705 € 2 mn tb sis,*s6T5a'nAE r.tr c. tr D.tr Harpoon 8959-54 tl I 'rA.t__.r B. n c.
r-.1 D. n Harvestel 10G1091-8959
A.E B.E c.E D.E Hydrothol 191 70506-175
A.EB.trc.[o.IContractType: PerTreatmentf]SeasonalI FORoFFICEUsEONty
Product/ltem Code Amount Customer #
Additional lnstructions For !nvoicing:
111
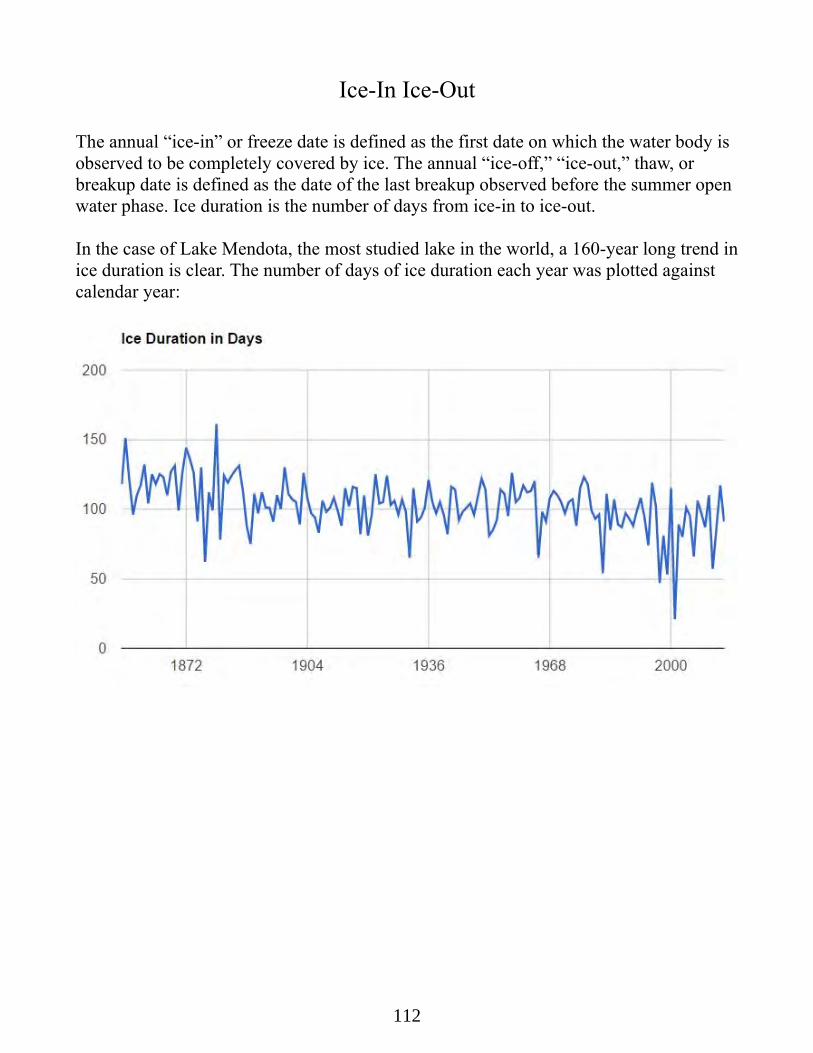
Ice-In Ice-Out
The annual “ice-in” or freeze date is defined as the first date on which the water body is observed to be completely covered by ice. The annual “ice-off,” “ice-out,” thaw, or breakup date is defined as the date of the last breakup observed before the summer open water phase. Ice duration is the number of days from ice-in to ice-out.
In the case of Lake Mendota, the most studied lake in the world, a 160-year long trend inice duration is clear. The number of days of ice duration each year was plotted against calendar year:
112

Here is the famous data set again with the trend line drawn:
The trend is hypothetically explained by climate change in Madison, Wisconsin from 1850 to now. It is left as an exercise for the reader to gather weather data from Madison, Wisconsin and to relate that data to ice duration.
113

The ice duration data for Random Lake only goes back to 2002. A plot of the data does not clearly show a trend because, if there were a trend, it is obscured by a high noise level or random variation in year-to-year ice duration. At any rate, here are the results:
A trend could be formally drawn but we would not have much statistical confidence in it. If we continue to collect ice duration data for Random Lake for many years to come, we will later be in a position to spot a trend. It is a good bet that Wisconsin will continueits gradual warming trend as green house gases increase their concentration in the atmosphere. Experts project that Wisconsin's mean annual temperature will increase by several degrees by the year 2050! Note: ice duration data for 2014 was not collected and data for 2015 is not in yet.
2000 2002 2004 2006 2008 2010 2012 20140
20
40
60
80
100
120
140
160
Ice Duration on Random Lake
Year
Nu
mb
er
of D
ays
of I
ce D
ura
tion
114

North Basin Monitoring
The North Basin of Random Lake is enveloped by Lake Drive, West Lake Drive, Jessie Lane, Highway 144, and Stark Road shorelines. A deep if not the deepest point is locatedat N 43deg 33.516min W 87deg 57.277min with a 10+ ft sounding. However, the area that is >10-ft deep is small such that a boat positioned over that point is likely to drift on slack anchor lines and get soundings of <10 ft. Thus, in practice, temperature and DO profiles may only go down to 8 feet deep before hitting bottom. It is fair to say that the North Basin has a Eurasian watermilfoil problem as the invader is abundant everywhere.
Wayne Stroessner last monitored the North Basin in 2004 and then stopped as WDNR did not support phosphorus and chlorophyll assays for a second sampling point on Random Lake. A summary 2004 report is archived here. Wayne found a location that was >= 12-ft deep. Next year I need to find this deepest location.
Monitored in 2015 were Secchi depth and temperature and DO profiles:
115

This is speculative, but the herbicide treatments in the North Basin in mid-June, aimed atkilling Eurasian water milfoil, may have led to the slight decline of dissolved oxygen observed in mid summer to levels of 7-8 mg/L DO. The dead and decaying plant tissue consumes DO under aerobic bacterial action. In worst case situations, rotting organic material can completely deplete a waterbody of dissolved oxygen and then fish die. To my knowledge this has not happened on Random Lake.We do not see much temperature stratification in the shallow North Basin:
06/25/15 07/15/15 08/04/15 08/24/15 09/13/15 10/03/15 10/23/150
2
4
6
8
10
12
Secchi Depth and Dissolved Oxygen Profiles
North Basin
Secchi Depth (ft) DO 0 DO 2
DO 4 DO 6 DO 8
Date
Se
cch
i De
pth
(ft)
or
Dis
so
lve
d O
xyg
en
(m
g/L
)
116

Not shown here, but we do not see any noteworthy temperature difference between the surface water of North Basin vs. surface water of the deephole of the south basin, given the same date and virtually the same sampling time for both locations.
06/25/15 07/15/15 08/04/15 08/24/15 09/13/15 10/03/15 10/23/150
5
10
15
20
25
30
Temperature Profiles
North Basin
temp 0ft temp 2ft temp 4ft temp 6ft temp 8ft temp 10ft
Date
Wa
ter
Tem
pe
ratu
re in
De
gre
es
Ce
lciu
s
117

Study Topics
Ambitious students might wish to research a topic:
• rate of sedimentation in lake bed• measurement of flow rate of water in and out of lake• determination of hydraulic retention time• investigation of ground water flow• automated monitoring of lake water level• improvements to static lake level gauge• mapping of Random Lake watershed• investigation of food web• determination of nitrogen and other analytes in lake water• implementation of chlorophyll assay at home• microscopy of zooplankton, phytoplankton, bacteria• plant survey• analysis of lake bottom sediments• involvement of students in lake monitoring• implementation of defenses against invasive species• effects of climate change on Random Lake• children's book on a theme of lake monitoring• calculation of phosphorus and nitrogen pollution from lawn and garden fertilizers• microbiological safety of swimming beach
118

Bibliography
Applied Biochemists. How to Identify and Control Water Weeds and Algae: an International Guide to Water Management 5th ed. Ed. James C. Schmidt et al. Germantown, Wisconsin: Applied Biochemists, 1998. Web.
Betz, Carolyn Rumery, et al. Wisconsin Citizen Lake Monitoring Training Manual (Chemistry Procedures) 3rd ed. Madison, Wisconsin: Bureau of Science Services, Wisconsin Department of Natural Resources, 2009. Web.
Betz, Carolyn Rumery, et al. Wisconsin Citizen Lake Monitoring Training Manual (Secchi Disk Procedures) 3rd ed. Madison, Wisconsin: Bureau of Science Services, Wisconsin Department of Natural Resources, 2009. Web.
Blunden, J. and D. S. Arndt, Eds., 2015: State of the Climate in 2014. Bull. Amer. Meteor. Soc., 96 (7), S1–S267.
Bras, Rafael L. Hydrology: An Introduction to Hydrologic Science. Reading, Massachusetts: Addison-Wesley Publishing Company, 1990. Print.
Brock, Thomas. A Eutrophic Lake: Lake Mendota, Wisconsin. New York: Springer-Verlag, 1985. Print.
Bronmark, Christer and Lars-Anders Hansson. The Biology of Lakes and Ponds. 2nd ed. New York: Oxford University Press Inc., 2005. Print.
Goldman, Charles R. and Alexander J. Horne. Limnology. New York: McGraw-Hill Book Company, 1983. Print.
Groves, Tony, et al. Mapping and Understanding your Lake's Watershed, W eb.
Miller Michael A., et al. Field Guide to Wisconsin Streams. Madison, Wisconsin: The University of Wisconsin Press, 2014. Print.
Shaw, Byron, et al. Understanding Lake Data. Madison, Wisconsin: Board of Regents ofthe University of Wisconsin System, Cooperative Extension Publishing Operations, 2004. Web.
Stroessner, Wayne. Random Lake Monitoring Program. Serial six volumes 2003-2013.
119

Self published. Print. Lakeview Community Library, Random Lake, Wisconsin.
Wisconsin's Changing Climate: Impacts and Adaptation. 2011. Wisconsin Initiative on Climate Change Impacts. Nelson Institute for Environmental Studies, University of Wisconsin-Madison and the Wisconsin Department of Natural Resources, Madison, Wisconsin. Web.
120

Appendix: Monitoring Methods and Procedures
Data Handling………………………………………………….122
Dissolved Oxygen Monitoring…………………………………123
Chlorophyll-a Wisconsin State Laboratory of Hygiene………..125
Total Phosphorus Wisconsin State Laboratory of Hygiene…….142
Microscopic Examination of Algae…………………………….154
How to Collect Water Samples…………………………………155
How to Use the Secchi Disk……………………………………166
Temperature Monitoring……………………………………….169

Data Handling
When out on the lake making observations and measurements, I enter the data on paper forms. On returning to the home office, I enter that data into spreadsheets (LibreOffice) and upload data to SWIMS (Surface Water Integrated Monitoring System). Paper records are then discarded. The spreadsheet files on the home office computer are periodically backed up on a USB thumbdrive. Anyone can request a copy of these spreadsheets. --Sydney Rader
122

page 59
How Do You Prepare to Sample?The Day You SampleOn the day you plan to sample, complete the top portion of your field data sheet by filling in the Waterbody # (or WBIC), Station # (or Storet #), and Volunteer IDs (or names). If you do not know what these numbers are contact your CLMN regional coordinator. Before you launch your boat, make sure you have an anchor, sufficient gas, and per-sonal flotation devices in your boat.
Before using your dissolved oxygen meter, be sure to read the owner’s manual. In order to get accurate data from your meter, you must learn how to calibrate your meter and use your meter properly. Please keep a Calibration Log (see Ap-pendix 7) to ensure good data.
If you use a YSI hand-held dissolved oxygen meter, please refer to the document “Helpful Tips When Calibrating YSI Hand-held Dissolved Oxy-gen Meter (Appendix 7) or refer to your manufac-turer’s instructions for calibration and use.
Sampling OverviewDissolved Oxygen MeterThe CLMN allows volunteers to use their own dis-solved oxygen meter to take your readings. If you choose to collect your dissolved oxygen data us-ing this method, it is important to remember that some meters must be calibrated every time they are used. A calibration log and tips for using a me-ter is included in Appendix 7. The calibration log will keep you in tune with the performance of you meter, which ultimately will help you collect qual-ity data. Please follow all instructions for care and maintenance found in the operation manual for your particular model as maintenance of the meter is imperative to get good data. If you choose this method you must inform your CLMN coordinator so they can flag the database with this information. At this time, the CLMN does not provide dissolved oxygen meters for volunteer use.
STEP 1. Your regional coordinator will assign 5 to 10 depths to sample for dissolved oxygen. Your meter will also record temperature. You will col-lect dissolved oxygen and temperature data at the same depths.
STEP 2. Follow manufacturer’s instruction for cali -bration and use.
STEP 3. Lower the probe to the assigned depth. Record temperature and dissolved oxygen reading from the meter onto your data sheet.
ON LAKEON LAKE PROCEDURESDissolved Oxygen MonitoringDissolved Oxygen Meter
NOTE: Dissolved oxygen should be collected in the “mg/L” mode only. Some meters are calibrated in percent saturation, so be sure to use the mg/L mode while gathering data.
Record the type of meter you are using under “observations” on your data sheet.
123

W I S C O N S I N C I T I Z E N L A K E M O N I T O R I N G T R A I N I N G M A N U A L
page 60
6. DISSOLVED OXYGEN
MONITORING:
Before you start sampling, be sure to read the following pages to familiarize yourself
with the equipment and the procedures that you will be using. All of the procedures that you will follow in sampling your lake are done for specific reasons. It is very important that you follow the sampling procedures exactly as they are laid out in the following pages to ensure good, consistent, high quality data. The following pages will provide you with sufficient background on the design of the equipment and proper procedures to use.
6. DISSOLVED OXYGEN MONITORING:Using the Titration Method
DN
R P
HO
TO
Please remember to keep all sampling equipment and chemicals out of the reach of children. Many of the chemicals you will be using are hazardous (see Appendix 1). After sampling, it is very important to rinse and thoroughly air dry all of the equipment that you used. As always keep paperwork and envelopes sepa-rate from equipment.
What Equipment Will You Need?At your training session, your CLMN regional coordinator will outline and provide all of the equipment that you will need to successfully monitor your lake.
Manual
Lake map with sampling sites marked
Life jackets (you provide)
Anchor and rope (you provide)
Field data sheets
Pencil and waterproof pen
Van Dorn sampling bottle
Safety gloves
Safety goggles
Chemicals and equipment in the LaMotte® titration kit (note: all chemicals should be replaced every year): manganous sulfate, alkaline potassium iodide azide, sulfuric acid, sodium thiosulfate, starch indicator solution, syringe, 25-ml graduated cylinder, eye dropper, dissolved oxygen sample bottles (labeled with appropriate depths) and rack, glass vial with plastic lid.
124

Chlorophyll a Fluorescence Wisconsin State Laboratory of Hygiene ESS INO METHOD 151.1 Environmental Health Division Revision 6 Inorganic Chemistry Depart. Effective date: March 2014 to Present Replaces Rev. 5, January 2012 Page 1 of 17
The current revision of this SOP is located at O:\EHD\ESS\Inorg\SOP\Final. Please confirm that this printed copy is the latest revision.
ESS INO METHOD 151.1
Chlorophyll a, Fluorescence
(EPA 445.0, rev. 1.2, Sept. 1997 and Welschmeyer, 1994) 1. Scope and Application
1.1. Chlorophyll a, a characteristic algal pigment, constitutes approximately 1 to 2% (dry weight) of planktonic algal biomass. This feature makes chlorophyll a a convenient indicator of algal biomass.
1.2. This method is applicable to the analysis of chlorophyll a in surface waters.
1.3. The Limit of Detection was determined according to ESS INO QA 116. The detection limit is dependent on sample volume filtered and fluorescence intensity. The detection limit for the instrument is 4 µg/L in the extract, which is always 13 mL. Based on a filtered volume of 200 mL, the sample limit of detection (LOD) is 0.26 µg/L, ((4 µg/L x 0.013L)/0.2 L) and the limit of quantification (LOQ) is 0.87 µg/L. Applicable concentration range for samples is dependent on volume filtered. The instrument is calibrated to approximately 800 µg/L.
2. Summary of Method
2.1. Algal cells are concentrated by filtering a known volume of water through a membrane filter (47 mm, 5.0 μm poresize). The pigments are extracted from the concentrated algal sample in a solution of aqueous 90% acetone aided by bath type sonication. The chlorophyll a concentration is determined by fluorescence. The excitation wavelength is 436 ηm with a slit width of 5.0 ηm. The fluorescence is measured at a wavelength of 680 ηm and a slit width of 3.0 ηm. The fluorescence spectrophotometer is calibrated with pure chlorophyll a standards of a known concentration. The resulting calibration curve is used to determine the chlorophyll a concentration in the sample extracts. The concentration of the chlorophyll a in the natural water sample is reported in μg/L
2.2. This method deviates from EPA 445.0 in the following ways:
2.2.1. Millipore type SM, 47 mm 5.0 μm membrane filters are used instead of the glass fiber filters recommended in the method to provide continuity with Wisconsin's historical chlorophyll data (WIDNR long-term trend monitoring data).
2.2.2. A Branson Ultrasonic Cleaner (Bath type sonication) is used to aid in extracting the chlorophyll from the algal cells instead of a tissue grinder. Bath type sonication is more efficient and is comparable to tissue grinding under most circumstances (see ref. 15.3, 15.4, and 15.5).
2.2.3 The instrument is calibrated every day of analysis. The instrument software uses linear regression rather than response factors for calibration.
2.2.4 A quality control sample (QCS) is run every day of analysis prior to sample analysis.
125

Chlorophyll a Fluorescence Wisconsin State Laboratory of Hygiene ESS INO METHOD 151.1 Environmental Health Division Revision 6 Inorganic Chemistry Depart. Effective date: March 2014 to Present Replaces Rev. 5, January 2012 Page 2 of 17
The current revision of this SOP is located at O:\EHD\ESS\Inorg\SOP\Final. Please confirm that this printed copy is the latest revision.
2.2.5 All sample results are determined "uncorrected", with no acidification for pheophytin correction according to Welschmeyer (15.1) and EPA 445.0, rev 1.2, 1997) (15.2). Because the fluorescence spectrometer used for this test is a higher resolution instrument, pheophytin correction is unnecessary (see reference 15.15).
2.2.6 Thirteen (13) mL of 90% acetone is used for extraction.
3. Safety and Waste Management
3.1 General safety practices for all laboratory operations are outlined in the Chemical Hygiene Plan and General Laboratory Safety Plan for the Agriculture Drive Facility, and the University of Wisconsin Laboratory Safety Guide (see ref. 15.6- 15.7).
3.2 All laboratory wastes, excess reagents and samples must be disposed of in a manner that is consistent with applicable rules and regulations.
4. Sample Preservation and Preparation
4.1 Samples for chlorophyll a analysis filtered in the field must be folded and put into a 15 mL polypropylene centrifuge tube, labeled with the sample volume filtered, wrapped in foil, and promptly shipped to the lab on ice.
4.2 Samples for chlorophyll a analysis to be filtered in the lab must be collected in a plastic quart bottle and be packed with ice in a dark cooler at the time of collection. These samples must be kept in the dark before filtering and filtering must occur within 48 hours of receipt. For these samples, filter no more than 200 mL of sample through a 47 mm, 5 μm pore size membrane filter and applying vacuum. Vacuum should not exceed 6 inches of mercury (20kPa). Less volume should be filtered if the chlorophyll concentration is expected to be high or filtering takes longer than 10 minutes. The filtration process must be performed in subdued light. For detailed filtering instructions please see appendix 2 at the end of this SOP. Refer to ESS INO GENOP 151 (15.19) to process these samples through HORIZON.
4.2.1 Fold the filter into quarters, insert into a graduated 15 mL polypropylene conical centrifuge tube with a screw cap, and store in a dark freezer. Be sure to record the appropriate information, including volume filtered, on the lab filtered chlorophyll log sheet.
4.3 Store field filtered samples in freezer upon arrival at the lab. Insert filters into graduated 15 mL polypropylene conical centrifuge tubes with screw caps when necessary.
4.4 Thirteen mL of 90% aqueous acetone solution is added to all samples prior to sonification.
4.5 Samples may be held at -20˚C for up to 3½ weeks after filtering. Although there is no mandated holding time for chlorophyll, the laboratory strives to complete analyses with the recommended 3½ week holding time.
126

Chlorophyll a Fluorescence Wisconsin State Laboratory of Hygiene ESS INO METHOD 151.1 Environmental Health Division Revision 6 Inorganic Chemistry Depart. Effective date: March 2014 to Present Replaces Rev. 5, January 2012 Page 3 of 17
The current revision of this SOP is located at O:\EHD\ESS\Inorg\SOP\Final. Please confirm that this printed copy is the latest revision.
4.6 Periphyton samples collected on filters will be handled in exactly the same manner as field filtered chlorophylls with any deviations mentioned in ESS INO GENOP 151 (15.19).
4.7 Periphyton samples collected on glass slides will be prepared according to Appendix 4 and processed through HORIZON according to ESS INO GENOP 151 (15.19).
5. Interferences and Comments
5.1. Any substance that fluoresces at 680 ηm may interfere in the accurate measurement of chlorophyll a. Using the narrow slit width (3.0 ηm) eliminates most common interferences.
5.2. Handle samples in subdued light to prevent photochemical breakdown of the chlorophyll.
5.3. Handle filters with forceps to prevent breakdown of chlorophyll from hand contact.
5.4. Protect the acetone extract from more than momentary exposure to light.
6. Reagents and Standards
6.1 Aqueous acetone solution (90%): Mix 90 parts reagent grade acetone with 10 parts reagent water. This solution has an expiration date of one year from date prepared. Record appropriate information in logbook #14 (under the 90% Acetone tab). The reagent code will also be written on the bench records, the bottle itself, and the repipettor. This logbook is located by the BOD computer in room 119.
6.2 Reagent water, ASTM Type I: Prepare by passing R.O. water through a U.S. Filter Pure-Plus Water System.
6.3. Chlorophyll a Standard stock: Obtained from Sigma Chemical (St. Louis, MO.) in dry form and diluted with aqueous 90% acetone (6.1). Sigma #C-6144, (chlorophyll a from Anacystis nidulans algae) 1 mg size.
6.3.1. In subdued light, quantitatively transfer the entire contents of the vial to a 100 mL volumetric flask using 90% acetone to rinse all material from the vial. Dilute to the mark with additional 90% acetone and mix thoroughly. The nominal concentration is about 10 mg/L. The actual chlorophyll a concentration is determined by averaging four replicate readings using the spectrophotometric method (uncorrected) described in ESS INO IOP 151.1 (see appendix 1). All pertinent information, including the stock standard code, manufacturer, lot#, date received, concentration, date prepared, analyst’s initials and expiration date must be recorded in the standards logbook #13, located in the Wet Chemistry area. The stock standard must be stored in a light tight box in the -20ºC freezer, located in the alcove in room 119. The expiration date is one year from the date prepared.
6.3.2. Working standards: Prepare the following working standards immediately after confirming the stock standard concentration as in 6.3.1. All standards are diluted
127

Chlorophyll a Fluorescence Wisconsin State Laboratory of Hygiene ESS INO METHOD 151.1 Environmental Health Division Revision 6 Inorganic Chemistry Depart. Effective date: March 2014 to Present Replaces Rev. 5, January 2012 Page 4 of 17
The current revision of this SOP is located at O:\EHD\ESS\Inorg\SOP\Final. Please confirm that this printed copy is the latest revision.
to volume with aqueous 90% acetone (6.1). Please note that the below working standards are nominal concentrations. The exact concentration will vary from lot to lot. All concentrations for the working standards need to be determined by averaging three replicate readings using the spectrophotometric method (uncorrected) described in ESS INO IOP 151.1 (see appendix 1). All pertinent information (as in 6.3.1) must be recorded in the standards logbook #ESS475, located in the Wet Chemistry area, room 119. Transfer working standards to screw capped amber bottles and label. The working standards must be stored in a light tight box in the -20ºC freezer, located in the alcove in room 119. The expiration date is six months from the date prepared.
Volume of stock (6.3.1) standard
(mL)
Diluted to volume
(mL)
Nominal concentration
mg/L
0.30* 250 0.012
2.5 500 0.050†
5 500 0.100†
10 500 0.200†
25 500 0.500†
20 250 0.800
*Use an electronic, variable volume Rainin pipette to prepare this standard. Class A volumetric pipettes may used for the rest.
† These standards are rotated as the IPC
6.4. Quality control sample (QCS): Prepare from a different Sigma lot than the stock standard. Sigma catalog # C5753 (chlorophyll a from spinach)
6.4.1. Prepare a 10 mg/L (nominal concentration) stock QCS and determine actual concentration as in 6.3.1 (average of four replicate readings). Transfer to a screw capped amber bottle, and label. All pertinent information must be recorded in the standards logbook #13, located in the Wet Chemistry area, room 119. The stock QCS must be stored in a light tight box in the -20ºC freezer, located in the alcove in room 119. The expiration date should be one year from the date prepared.
6.4.2. Prepare a 100 µg/L (nominal concentration) QCS (to be used with every analytical run) and determine actual concentration as in 6.3.2 (average of three replicate readings). Transfer to a screw capped amber bottle, and label. All pertinent information must be recorded in the standards logbook #ESS475,
128

Chlorophyll a Fluorescence Wisconsin State Laboratory of Hygiene ESS INO METHOD 151.1 Environmental Health Division Revision 6 Inorganic Chemistry Depart. Effective date: March 2014 to Present Replaces Rev. 5, January 2012 Page 5 of 17
The current revision of this SOP is located at O:\EHD\ESS\Inorg\SOP\Final. Please confirm that this printed copy is the latest revision.
located in the Wet Chemistry area. The QCS must be stored in a light tight box in the -20ºC freezer, located in the alcove in room 119. The expiration date is six months from the date prepared.
7. Apparatus
7.1 Standard laboratory glassware including membrane filtration apparatus.
7.2 Millipore Type SM, 47 mm, 5.0 μm pore size membrane filters.
7.3 Calibrated 15 mL polypropylene centrifuge tubes with screw caps.
7.4 Vacuum source with an adjustable vacuum gauge.
7.5 Light-tight box capable of holding a 40-tube test tube rack.
7.6 Branson Model 5210 MT Ultrasonic Cleaner for cell disruption.
7.7 International Equipment Company Model K centrifuge, capable of attaining 500XG.
7.8 Perkin-Elmer fluorescence spectrometer, model LS – 55.
7.9 Re-pipet dispenser, 25 mL capacity.
7.10 Rainin variable volume electronic pipettes, Eppendorf mechanical air displacement pipettes and standard class A volumetric pipettes.
8. Quality Control
8.1 Please refer to the Environmental Health Division Quality Assurance Manual (15.10) for general information on quality control procedures. Important specifics include:
8.1.1 Accuracy and precision calculations.
8.1.2 Corrective action procedures (including documentation requirements) for instrument problems or analytical problems.
8.2 A Laboratory Reagent Blank (LRB) will be analyzed with every analytical run. This is made by taking a membrane filter (7.2), placing it in a 15mL polypropylene centrifuge tube (7.3), adding 13mL of 90% acetone (6.1), and carrying it through the entire preparation procedure. This will be analyzed at the beginning of the analytical run, and after every 20 samples and must be within ±0.26 g/L, the LOD based on filtered volume of 200mL. If the LRB fails it should be re-analyzed. If it still fails the analyst should evaluate if recalibration would improve the blank reading. If recalibration is done the samples back to the last good LRB and IPC must be re-analyzed. If recalibration does not cause the blank to be acceptable, the 20 samples associated with that LRB must be qualified with a comment stating that the LRB exceeded acceptable limits.
8.3 A working QCS (see section 6.4.2) is run at the beginning of every analytical run. The observed concentration of the QCS must be within ± 10% of the true value (6.4.2) before proceeding with analysis. Re-prepare the QCS if prep error is suspected and reanalyze. If QCS still fails, re-calibrate and try again. If subsequent attempts fail and samples
129

Chlorophyll a Fluorescence Wisconsin State Laboratory of Hygiene ESS INO METHOD 151.1 Environmental Health Division Revision 6 Inorganic Chemistry Depart. Effective date: March 2014 to Present Replaces Rev. 5, January 2012 Page 6 of 17
The current revision of this SOP is located at O:\EHD\ESS\Inorg\SOP\Final. Please confirm that this printed copy is the latest revision.
cannot be stored, proceed with the analyses and qualify all results.
8.4 The Limit of Detection (LOD, the concentration at which the result is definitely distinguishable from a blank) must be verified annually, or after any significant work is done on the instrument. For more information on LOD protocol, see ESS INO QA 116 (15.13).
8.5 At least 10% of lab filtered chlorophyll samples are analyzed in duplicate. The difference between the duplicate measurements must be within control limits before sample results are considered acceptable. Samples that fail to meet QC limits will be qualified. Since the majority of samples are field filtered and planktonic material tends to be heterogenous in nature, little corrective action can be taken to improve precision. Visual examination of the extract, documentation and notification of data users through qualifiers is about all that can be done. Consequently, entire batches of data are not qualified based on duplicate QC failures.
8.5.1 The QC limits for duplicate analyses can be found in HORIZON or the duplicate must be within ± the LOD of the original result.
8.6 Field duplicate analyses are only analyzed when our clients provide us with duplicate filters. Therefore, separate QC limits have not been developed for these tests.
8.7 A 90% acetone blank (Calibration Blank—CB) is run at the beginning of each analytical run, every ten samples, and at the end of each analytical run. The blank must be < 0.26 μg/L based on a 200 mL volume (sample LOD). If the initial blank exceeds the LOD, the intercept from the calibration is examined to determine whether there was a problem at calibration, the initial blank is contaminated or if the fluorescence cell is dirty. If the intercept is high or the cell dirty, it is cleaned and the instrument re-calibrated. The initial blank and QCS must be acceptable before proceeding with analysis.
8.8 An Instrument Performance Check (IPC) (see section 6.3.1) is run every 10 samples. The IPC must be within ± 10% of the true value. If it deviates from this acceptable limit, the analyst will attempt to determine whether the cell has become dirty, the instrument has drifted, or the IPC is contaminated. If the problem can be identified, it is corrected, the instrument re-calibrated and all samples back to the last valid IPC will be reanalyzed.
8.9 Dilutions are typically made by adding 1mL of sample to 4mL of 90% acetone solution using mechanical air displacement pipettes (7.10). Dilute high samples, add the sample numbers to analytical run list, change the dilution factor to reflect the 5x dilution, and analyze along with an IPC and CB every ten samples and at end of the run of diluted samples. Dilution concentrations should be within 90%-110% of the original concentration. If dilutions do not agree with the initial concentration, another different dilution should be performed to verify. If two serial dilutions do not agree (90%-110%), the sample result must be qualified.
8.10 An initial demonstration of capability (DOC) and annual continued proficiency checks will be performed according to reference 15.12.
130

Chlorophyll a Fluorescence Wisconsin State Laboratory of Hygiene ESS INO METHOD 151.1 Environmental Health Division Revision 6 Inorganic Chemistry Depart. Effective date: March 2014 to Present Replaces Rev. 5, January 2012 Page 7 of 17
The current revision of this SOP is located at O:\EHD\ESS\Inorg\SOP\Final. Please confirm that this printed copy is the latest revision.
8.11 Record date, analyst, intensities of top standard and QCS, standards and QCS codes, HORIZON batch number, and any applicable comments in instrument logbook # 89.
9. Method Calibration
9.1 The calibration curve is constructed using a blank and six (6) standards of increasing concentration of chlorophyll a from approximately the limit of quantification (LOQ = 12 μg/L) up to approximately 800 μg/L (see section 6.3.2). These concentrations are for chlorophyll a in the acetone solution extract.
9.2 The working calibration standards (6.3.2) are set out on the counter and allowed to warm to room temperature in the dark and used to calibrate the instrument each analysis day. The stock working calibration standards are discarded after six (6) months.
9.3 The sample chlorophyll concentrations are calculated directly within the instrument software using a linear regression. The standards are entered in the instrument sequence in mg/L (ppm) even though the samples are reported out in μg/L (ppb) chlorophyll a. This is done due to limitations of the software correction factor field. Please refer to software printout in Figure 1 for further explanation. Since all standards and samples must have the same concentration units in the software, the reporting units for the samples must be changed manually after every analytical run. This is done by making a single line through the (ppm) above the sample results, and initial and date the correction.
9.4 The calibration curve must have a correlation coefficient r ≥0.999. The curve is printed out for visual verification. If unable to achieve the ≥0.999 r coefficient, visually check for standards that are obviously bad, re-make standards as needed, and recalibrate. DO
NOT proceed with the analysis until the problem is resolved.
10. Procedure
10.1 Refer to ESS INO GENOP 151 (15.19) to determine procedures necessary to process samples through HORIZON.
10.2 All tubes must be unwrapped, or unpackaged as necessary, being sure to place the barcode label (with the lab slip number) on the tube. Place any filters received in foil, or in a miscellaneous container, in a graduated 15 mL polypropylene conical centrifuge (7.3) tube with screw cap and be sure to transfer barcode label to tube. All tubes are placed in racks of 36 (due to max sample places in centrifuge), in the order of the worklist (field filtered first, then lab filtered).
10.3 Add 13 mL of aqueous 90% acetone (section 6.1), using a repipette dispenser, to each sample tube. Shake vigorously for 20 seconds to break up filter. Place tubes in the light-tight box when not being processed.
10.4 Suspend rack with tubes in the ultrasonic bath with water one inch from the top. Cover
131

Chlorophyll a Fluorescence Wisconsin State Laboratory of Hygiene ESS INO METHOD 151.1 Environmental Health Division Revision 6 Inorganic Chemistry Depart. Effective date: March 2014 to Present Replaces Rev. 5, January 2012 Page 8 of 17
The current revision of this SOP is located at O:\EHD\ESS\Inorg\SOP\Final. Please confirm that this printed copy is the latest revision.
(to exclude light) and sonicate for 25 minutes. Shake tubes vigorously for 20 seconds and return the rack to the light-tight box.
10.5 Place the light-tight box in the < 4C cold room and allow the extract to steep overnight.
10.6 Shake sample tubes vigorously after steeping overnight. Clarify the extract by centrifuging the tubes for 30 minutes at approximately 500XG (setting of 30-35 on International Equipment Company Model K centrifuge).
10.7 Put the pump tubing on the LS-55 fluorescence spectrometer (7.8) into the pump roller and adjust tension to obtain smooth flow. Rinse the fluorescence cell with 90% acetone.
10.8 Open FLWinlab software and select "chlorophyll.mth" under the applications listed.
10.9 Under the "Setup parameters" tab change the destination filename to: U<fiscal yr. Date>.rpt
10.10 Under the "References" tab change standard concentrations to 3 decimal places. The software automatically changes concentrations to 2 decimal places when closed.
10.11 Under "Samples" tab, enter QCS, IPC, (both corr. fact. = 1000), CB (corr.fact. = 65), the sample lab numbers and correction factors ((13/vol filtered) x 1000). Sample numbers may be entered using the barcode scanner attached to the instrument and the lab worklist which has all the barcodes printed out (and the volumes to calculate the correction factors).
10.12 Place aspiration tubing in blank 90% acetone and click on "Measure background" button, (value should be near 0.000). Calibrate the instrument by running a blank and subsequent standards in increasing concentration order (linear, with calculated intercept). The correlation coefficient (corr) must be ≥ 0.999 before samples can be analyzed.
10.13 After calibration, evaluate and verify the calibration process (QCS, IPC, and CB.) before beginning analysis of samples. Analyze the IPC and CB every ten samples and at the end of the run, and a LRB at the beginning and after every 20 samples. Take the appropriate corrective action described in the Quality Control Section (8) if any IPC, CB or LRB exceeds limits.
10.13.1 Record the fluorescence intensity of the QCS and the top calibration standard in the instrument logbook #89 along with the standard and QCS codes and HORIZON batch number.
10.14 Remove one tube at a time from the light-tight box and using the sipper system, aspirate sample into the instrument. The intensity will be measured and the concentration will be automatically calculated. Both values are recorded in the .rpt data file. Return the sample to the light tight box in case reanalysis is required. At end of run click on "Save Results" button.
10.15 If the fluorescence intensity of a sample is greater than the top standard intensity, return the sample tube to the light-tight box so it can be diluted and re-analyzed at the end of the analytical run by making a new "Samples" list, with a correction factor that reflects
132

Chlorophyll a Fluorescence Wisconsin State Laboratory of Hygiene ESS INO METHOD 151.1 Environmental Health Division Revision 6 Inorganic Chemistry Depart. Effective date: March 2014 to Present Replaces Rev. 5, January 2012 Page 9 of 17
The current revision of this SOP is located at O:\EHD\ESS\Inorg\SOP\Final. Please confirm that this printed copy is the latest revision.
the proper dilution.
10.16 When all samples have been analyzed, print the calibration and sample files using the printer icon. Data are saved on the network in G:/Flwinlab/Data/filename.rpt.
10.17 Transfer the data according to ESS INO GENOP 151 (ref. 15.19).
11. Calculations.
11.1 The sample intensities are converted to concentration by the software based on a linear regression calibration curve. A correction factor is applied to convert the concentration from the regression to the sample concentration in µg/L.
11.2 The general equation for determining the chlorophyll is as follows:
11.2.1 mg/L from regression*13 mL (extract volume)*1/mL sample filtered * 1000 μg/mg = chlorophyll a in µg/L.
11.3 The correction factor is used to convert the concentration of chlorophyll a in the extract to the concentration of chlorophyll a in the sample based on the extract volume and the volume of sample filtered. This process is accomplished using a correction factor.
11.3.1 The Perkin-Elmer instrument software has a limit of 2 decimal places. Consequently, we cannot calibrate in units of µg/L because the correction factor (see 11.2.1 ) has too few decimal places and it would be have to be rounded. For example, if calibrating in µg/L, the correction factor would be 0.065. However, the software would round that factor to 0.06, which would bias test results. To get around this problem, we calibrate in mg/L and add a multiplication factor so we can report in units of µg/L. Details of the correction factor follow.
11.3.2 Correction Factor = (13 mL of sample in extract / mL of sample filtered)*1000. For most samples, the factor is: (13mL / 200 mL)*1000=65.
11.3.3 For dilutions (section 8.9) the correction factor needs to reflect the dilution (multiplied by 5 for a fivefold dilution). For example, a sample diluted 1 to 5 that has 13 mL of extract and 200 mL of sample filtered would need a correction factor of 325 (65*5=325). This ensures that the result is properly calculated by the software. For the correct way to enter dilutions into the software see ESS INO GENOP 151 (15.19).
11.4 Duplicates and spikes are calculated as shown in the EHD QA manual (15.10). 12. Data Management
12.1 QC data will be evaluated in the HORIZON operating system.
12.2 The entire analytical run is passed on to another chemist for QC audit. An analytical run will include: cover sheet with queue, batch number, and HBN, a batch worklist for each of the prep batches and any and all analytical batches, and all raw data.
133

Chlorophyll a Fluorescence Wisconsin State Laboratory of Hygiene ESS INO METHOD 151.1 Environmental Health Division Revision 6 Inorganic Chemistry Depart. Effective date: March 2014 to Present Replaces Rev. 5, January 2012 Page 10 of 17
The current revision of this SOP is located at O:\EHD\ESS\Inorg\SOP\Final. Please confirm that this printed copy is the latest revision.
12.3 Once the QC audit has been completed the entire run is stapled together and filed with the other chlorophyll runs.
13. Definitions
13.1 Definitions of terms in this SOP may be found in section 3.0 of Method 445.0 (see ref. 15.2).
13.2 General definitions of other terms that may be used in this method are found in the EHD Quality Assurance Manual (see ref. 15.10).
14. Method Performance
14.1 Where applicable, the laboratory’s initial accuracy and precision data (LOD’s and DOC’s) were generated in compliance with the reference method and the Inorganic Chemistry Department’s standard operating procedures: ESS INO QA 115 (see ref. 15.12), and ESS INO QA 116 (see ref. 15.13). Data generated within the last two years will be kept on file within the Inorganic Chemistry Department. Data older than two years may be archived in the basement.
15. References
15.1 Welschmeyer, 1994 Fluorometric analysis of chlorophyll a in the presence chlorophyll b and pheopigments. Lmnol. Oceanogr. 39(8), pp. 1985-1992, (1994)
15.2 Environmental Protection Agency (EPA) Method 445.0 rev 1.2 (September, 1997).
15.3 Garrison, P., Comparison of Grinding samples vs. Sonicating, Memorandum, (1990).
15.4 Bowman, G. and Easterday, P. Proposed improvements in chlorophyll testing at the State Laboratory of Hygiene, Memorandum, (1995).
15.5 Nelson, D.H. Improved Chlorophyll Extraction Method, Science, 132, p. 351, (1960).
15.6 AG DR SAFETY GENOP 102, Chemical Hygiene Plan and General Laboratory Safety Plan, Wisconsin State Laboratory of Hygiene.
15.7 University of Wisconsin—Madison, Chemical & Radiation Protection Office, Safety Department (262-8769), “Laboratory Safety Guide,” 2004, http://www.fpm.wisc.edu/safety.
15.8 Axler, R.P, and C.J.Owen. Measuring Chlorophyll and Pheaophytin: Whom Should you Believe? Lake and Reserv. Manage. 8(2): pp. 143-151. (1994).
15.9 2009 TNI Standard, Volume 1: Management and Technical Requirements for Laboratories Performing Environmental Analysis, The NELAC Institute, 2009.
15.10 Quality Assurance Manual, Environmental Health Division, Wisconsin State Laboratory of Hygiene.
134

Chlorophyll a Fluorescence Wisconsin State Laboratory of Hygiene ESS INO METHOD 151.1 Environmental Health Division Revision 6 Inorganic Chemistry Depart. Effective date: March 2014 to Present Replaces Rev. 5, January 2012 Page 11 of 17
The current revision of this SOP is located at O:\EHD\ESS\Inorg\SOP\Final. Please confirm that this printed copy is the latest revision.
15.11 ESS INO METHOD 150.1, “Chlorophyll, Spectrophotometric, Trichromatic and Monochromatic Methods.” Archived.
15.12 ESS INO QA 115, “Initial DOC and Annual Continued Proficiency Check Procedures.”
15.13 ESS INO QA 116, “LOD Procedures.”
15.14 ESS INO QA 114, “LIMS Quality Assurance Worksheet Procedures.”
15.15 Kennedy-Parker, D., G. Krinke, G. Bowman, P. Rasmussen, and R. Arneson, “Maintaining Continuity in Chlorophyll Trend Data While Improving the Analytical Method,” poster presentation, Wisconsin State Laboratory of Hygiene, and Wisconsin Department of Natural Resources, Feb., 2003.
15.16 LS 55 Luminescence spectrometer User’s Guide, PerkinElmer Ltd., part # 09934436, release A, Aug. 2000.
15.17 FL WinLab Software User’s Guide, PerkinElmer Ltd., part # 09934434, release A, Aug. 2000.
15.18 Fl WinLab Software disk, V4.00.02, L225-8001 Issue B, June 2001.
15.19 ESS INO GENOP 151, “Chlorophyll HORIZON Procedure.”
Version Tracking
Version Date Ver # Revised by Changes Made
July, 2011 4.0 D. Kennedy-Parker Some formatting changes, updated section 6 to reflect new standards prep, using 1mg stock instead of 5mg stock for Sigma. Removed confusing language about minimum volume in section 1. Added corrective language about the LRB to section 8.3. Removed LDR definition since it is not acceptable for this method.
Jan. 2012 5.0 S. Hill/B. Clary Added outside document references to section 15. Added appendix 3, sample volume correction factor table. Added section 8.4, LOD information.
March 2014 6.0 B. Clary Updated sections 8.5.1, 10, and 12 and also Appendix 2 for HORIZON. Added to sample handling, section 4. Added appendix 4 for periphytons. Corrected some procedural issues. Added reference to HORIZON GENOP 151 (15.19). Corrected logbook references in Appendix 1 and section 6. Updated figure 1 to reflect actual run.
135

Chlorophyll a Fluorescence Wisconsin State Laboratory of Hygiene ESS INO METHOD 151.1 Environmental Health Division Revision 6 Inorganic Chemistry Depart. Effective date: March 2014 to Present Replaces Rev. 5, January 2012 Page 12 of 17
The current revision of this SOP is located at O:\EHD\ESS\Inorg\SOP\Final. Please confirm that this printed copy is the latest revision.
Appendix 1
ESS INO IOP 151.1
Determination of Chlorophyll a Standards
and Quality Control Sample Concentrations
The actual concentration of the stocks, standards, and the 2nd source quality control sample
(QCS) used to calibrate and verify the Perkin-Elmer LS-55 fluorescence spectrometer, must be determined by spectrophotometric means, prior to analysis of samples for chlorophyll a. The following process must be used for those determinations.
1. Prepare the standards and QCS as in ESS INO METHOD 151.1 section 6.3 and section 6.4.
2. Turn on the Beckman DU-650 spectrophotometer and click on the VIS lamp to ON.
Allow the instrument to warm up for one hour. The instrument will go through an automatic system check which includes wavelength calibration check, stray light and lamp intensity verification. DO NOT proceed if any error messages are displayed during the start-up sequence. Call for Beckman service if start-up problems cannot be corrected by the analyst. Install the cell holder in place on beam track. Use the 1mm cell holder for stock solutions, and the 5mm cell holder for working standards and QCS.
3. Select fixed wavelength, Method, A:\ Unchloro, Exit. The method and wavelengths
are now programmed. The analysis should be performed in dim light.
4. Fill the 5mm cell with 90% acetone and click on Blank at the bottom of the screen. This will zero the instrument on all wavelengths. Click on number 1 type in “CB” using keyboard, or screen keys, and right click on mouse to read. The intensities should be near zero.
5. Empty cell and fill with appropriate solution, select next number, type in nominal
concentration and right click to read. Empty cell and repeat for each replicate. Do four replicates for stock solutions, and three replicates for working solutions.
6. End with a blank (CB) and print results.
7. Enter values into R:\Ehd\ESS(4900)\ESS Inorg(4910)\General
Chemistry\Chlorophyll\unchlor.xls. This will calculate the actual chlorophyll a concentrations. Calculate average of replicates and record in logbook #ESS475, located in the General Chemistry area. Label amber solution bottles with reagent code, preparation date, analyst, and expiration date. Stock standards expire in one year, and working solutions expire in six months. Store all in chlorophyll freezer at -20ºC.
136

Chlorophyll a Fluorescence Wisconsin State Laboratory of Hygiene ESS INO METHOD 151.1 Environmental Health Division Revision 6 Inorganic Chemistry Depart. Effective date: March 2014 to Present Replaces Rev. 5, January 2012 Page 13 of 17
The current revision of this SOP is located at O:\EHD\ESS\Inorg\SOP\Final. Please confirm that this printed copy is the latest revision.
Appendix 2 Filtering Samples for
Chlorophyll a Analysis
1. Refer to ESS INO GENOP 151 (15.19) to determine the procedures necessary to process these samples through HORIZON.
2. Adjust vacuum gauge to approximately -6 inches Hg. Nearly all the way out. Make this adjustment with your finger completely covering the end of the vacuum jet.
3. Connect filtering flask to vacuum jet.
4. Insert bottom half of filtering funnel into flask.
5. Place 5.0 μm filter on fritted portion of filtering funnel.
6. Clamp upper portion of filtering funnel over filter.
7. Rinse entire apparatus with reagent water.
8. Shake sample container well and pour into graduated cylinder (max. volume 200 mL).
9. Immediately pour graduated cylinder contents into filtering funnel. Rinse the graduated
cylinder into the filtering funnel with reagent water.
10. As liquid level reaches filter, rinse the sides of the filtering funnel and close the vacuum jet.
11. Remove filter and place into 15 mL capped tube. Put lab number on tube and record the sample volume filtered on the batch worklist.
12. Place in light tight box, until all filtering is complete, then transfer to light tight box in -20º C
freezer.
13. Rinse all parts of filtering apparatus with reagent water and re-assemble with new filter.
14. When all samples are filtered, rinse apparatus, disassemble and store below counter.
137

Chlorophyll a Fluorescence Wisconsin State Laboratory of Hygiene ESS INO METHOD 151.1 Environmental Health Division Revision 6 Inorganic Chemistry Depart. Effective date: March 2014 to Present Replaces Rev. 5, January 2012 Page 14 of 17
The current revision of this SOP is located at O:\EHD\ESS\Inorg\SOP\Final. Please confirm that this printed copy is the latest revision.
Appendix 3
Chlorophyll a Sample Volume Correction Factor
for PE LS-55
VOLUME C.F.x1000
VOLUME C.F.x1000
10 1300.00
700 18.57
25 520.00
750 17.33
30 433.33
800 16.25
50 260.00
850 15.29
60 216.67
900 14.44
100 130.00
950 13.68
150 86.67
1000 13.00
200 65.00
1050 12.38
250 52.00
1100 11.82
300 43.33
1150 11.30
350 37.14
1200 10.83
400 32.50
1250 10.40
450 28.89
1300 10.00
500 26.00
1350 9.63
550 23.64
1400 9.29
600 21.67
1450 8.97
650 20.00
1500 8.67
138

Chlorophyll a Fluorescence Wisconsin State Laboratory of Hygiene ESS INO METHOD 151.1 Environmental Health Division Revision 6 Inorganic Chemistry Depart. Effective date: March 2014 to Present Replaces Rev. 5, January 2012 Page 15 of 17
The current revision of this SOP is located at O:\EHD\ESS\Inorg\SOP\Final. Please confirm that this printed copy is the latest revision.
Appendix 4
Procedure for Periphyton Samples
Collected on Glass Slides
1. Periphyton samples will arrive on a number of glass slides. For the procedure for
processing these through HORIZON see ESS INO GENOP 151 (15.19). All samples will be held in the freezer in the solids room in room 119 until preparation day. Make sure to follow proper safety procedures; wear gloves for this operation.
2. Label a 15mL centrifuge tube (7.3) for each periphyton sample and place all tubes in a green rack.
3. Rinse the plastic funnel into the waste bucket with the squeeze bottle of 90% Acetone (6.1). Place the funnel into the centrifuge tube.
4. Remove the first glass slide from the sample. Use a razorblade to scrape each side of the slide into the funnel. Rinse the razorblade into the funnel with the squeeze bottle. Make sure to use the squeeze bottle sparingly as the total volume in the tube will be 13mL.
5. After scraping both sides of the slide and rinsing the razorblade, rinse both sides of the slide with the acetone solution.
6. Repeat steps 4 and 5 for each slide in the sample. Make sure to record the number of slides in order to correctly compute the periphyton concentration and adjust the LODs in HORIZON according to ESS INO GENOP 151 (15.19).
7. After completing the process for each slide in the sample rinse the funnel with the acetone solution into the tube to make sure all the material makes it into the tube. Dilute the tube up to the 13mL mark with the acetone solution.
8. If over-dilution has occurred make a note of this and adjust the LOD in HORIZON accordingly.
9. Take these samples through the remaining preparation process as normal from this point. 10. Analyze the samples as any other chlorophyll samples with a correction factor of 1. 11. Hand-calculate the periphyton result per area using the following equation:
(Chlorophyll a result in µg/L*V)/(S*0.0038m2) = Periphyton concentration in µg/m2
Where V is the volume of extract in L (usually 0.013L) and S is the number of slides. This is the value that will be entered into HORIZON according to ESS INO GENOP 151 (15.19).
139

Chlorophyll a Fluorescence Wisconsin State Laboratory of Hygiene ESS INO METHOD 151.1 Environmental Health Division Revision 6 Inorganic Chemistry Depart. Effective date: March 2014 to Present Replaces Rev. 5, January 2012 Page 16 of 17
The current revision of this SOP is located at O:\EHD\ESS\Inorg\SOP\Final. Please confirm that this printed copy is the latest revision.
Figure 1
140

Chlorophyll a Fluorescence Wisconsin State Laboratory of Hygiene ESS INO METHOD 151.1 Environmental Health Division Revision 6 Inorganic Chemistry Depart. Effective date: March 2014 to Present Replaces Rev. 5, January 2012 Page 17 of 17
The current revision of this SOP is located at O:\EHD\ESS\Inorg\SOP\Final. Please confirm that this printed copy is the latest revision.
Written by: __ Brian Clary _________ Date: ___3/27/14______
Title: __ Senior Chemist _____________
Unit: ___EHD Metals__________________
Reviewed by: _ D. Kennedy-Parker _______ Date: ____3/27/14________
Title: __ Chemist Supervisor _____________
Unit: ___EHD Metals ____________
Approved by: _ Kevin Kaufman ________ Date: __3/27/2014____
Title: __ Advanced Chemist
Unit: ___EHD Metals_______
Certification Statements received from: D. Kennedy-Parker Kevin Kaufman Brian Clary
141

Total Phosphorus Wisconsin State Laboratory of Hygiene ESS INO METHOD 310.2 Environmental Health Division Revision 4 Inorganic Chemistry Dept. Effective date: September, 2014 to Present Replaces Revision 3, March, 2008 Page 1 of 12
The current revision of this SOP is located at O:\SOP\EHD\ESS\Inorg\Final. Please confirm that this printed copy is the latest revision.
ESS INO METHOD 310.2
Phosphorus, Total, Persulfate Digestion
(EPA/600/R-93/100, Method 365.1)
1. Scope and Application
1.1. This method is applicable to the determination of total phosphorus in drinking, ground and surface waters and domestic and industrial wastes in the range of 0.005 to 1.0 mg P/L.
1.2. The method limit of detection (LOD) = 0.005 mg/L
1.3. The method limit of quantification (LOQ) = 0.016 mg/L
2. Summary of Method
2.1. Samples are digested in an autoclave for 30 minutes at 121°C and 15-20 psi with ammonium persulfate and sulfuric acid to convert all phosphorus to orthophosphate. The orthophosphate ion (PO4) 3- reacts with ammonium molybdate and antimony potassium tartrate, under acidic, conditions to form a complex. This complex is reduced with ascorbic acid to form a blue complex which absorbs light at 880 nm. The absorbance is proportional to the concentration of the orthophosphate in the sample.
2.2. The determinative steps in this method are identical to EPA method 365.1 (15.1). However, because the EPA method is written specifically for air-segmented continuous flow technology that is no longer available, the specific “plumbing” scheme (pump tubes and reagent proportions, etc.) used are adapted to match the Lachat flow injection instrumentation. The specific flow scheme used in this SOP is from Lachat method 10-115-01-1-F (15.2).
3. Safety, Waste Management, & Pollution Prevention
3.1. General safety practices for all laboratory operations are outlined in the Chemical Hygiene Plan for the Agriculture Drive Facility (15.3).
3.2. All laboratory wastes, excess reagents and samples must be disposed of in a manner that is consistent with applicable rules and regulations.
3.3. Waste disposal guidelines are described in the University of Wisconsin Laboratory Safety Guide (15.4).
4. Sample Handling and Preservation
4.1. Samples are collected in a State Lab of Hygiene (SLH) 250 mL plastic bottle. Bottle quality is verified following the procedure outlined in reference (15.11).
142

Total Phosphorus Wisconsin State Laboratory of Hygiene ESS INO METHOD 310.2 Environmental Health Division Revision 4 Inorganic Chemistry Dept. Effective date: September, 2014 to Present Replaces Revision 3, March, 2008 Page 2 of 12
The current revision of this SOP is located at O:\SOP\EHD\ESS\Inorg\Final. Please confirm that this printed copy is the latest revision.
4.2. Samples are preserved in the field by the addition of 1 mL of 25% H2SO4 per 250 mL sample to a pH of less than 2. They are cooled to 4°C until analysis is performed.
4.3. Maximum holding time (after sample acidification) is 28 days from date of collection.
5. Interferences
5.1. Concentrations of ferric iron (Fe) 3- greater than 50 mg/L will cause a negative error due to precipitation of, and subsequent loss, of orthophosphate. Samples high in iron can be pretreated with sodium bisulfite to eliminate this interference. Treatment with bisulfite will also remove the interference due to arsenates.
5.2. Silica forms a pale blue complex which also absorbs at 880 nm. This interference is generally insignificant as a silicate concentration of approximately 30 mg SiO2/L would be required to produce a 0.005 mg/L positive error in orthophosphate.
5.3. A list of interferences is documented in Method 365.1, section 4 of EPA Methods for Chemical Analysis of Water and Wastes (1993) (15.1).
6. Reagents and Standards
6.1. Reagent water (ASTM Type I water): All reagents and standards must be made with ASTM Type I water (U.S. Filter Corp., Lowell, MA).
6.2. Stock acid solution, 5.6M Sulfuric Acid (H2SO4): Dilute 310 mL of concentrated H2SO4 to 1 L with ASTM Type I water (Caution: solution will get hot). Store in a glass container. Holding time = 6 months.
6.3. Working digestion acid solution: Dissolve 12.8 g ammonium persulfate ((NH4)2S2O8) and 32 mL of 5.6M H2SO4 (6.2) in a 100 mL volumetric flask. Dilute to mark with ASTM Type I water. Prepare daily.
6.4. Stock Ammonium Molybdate Solution: In a 1 L volumetric flask dissolve 40.0 g ammonium molybdate tetrahydrate [(NH4)6Mo7O24·4H20] in approximately 800 mL of ASTM Type I water. Dilute to the mark and invert to mix. Store in plastic and refrigerate at 4°C. Holding time = 6 months.
6.5. Stock Antimony Potassium Tartrate Solution: In a 1 L volumetric flask dissolve 3.0 g antimony potassium tartrate (potassium antimonyl tartrate hemihydrate K(SbO)C4H4O6·3·H2O) in approximately 800 mL of ASTM Type I water. Dilute to the mark and invert to mix. Store in a dark bottle and refrigerate at 4°C. Holding time = 6 months.
6.6. Molybdate Color Reagent: (Rinse down sides of flask and mix between each reagent). To a 1 L volumetric flask add approximately 500 mL ASTM Type I water and then add 21.0 mL concentrated H2SO4 (Caution: solution will get hot). When the flask can be comfortably handled, add 72.0 mL Stock Antimony Potassium Tartrate Solution (6.5) and 213 mL Ammonium Molybdate Solution (6.4). Dilute to mark. Store in glass jar
143

Total Phosphorus Wisconsin State Laboratory of Hygiene ESS INO METHOD 310.2 Environmental Health Division Revision 4 Inorganic Chemistry Dept. Effective date: September, 2014 to Present Replaces Revision 3, March, 2008 Page 3 of 12
The current revision of this SOP is located at O:\SOP\EHD\ESS\Inorg\Final. Please confirm that this printed copy is the latest revision.
and refrigerate at 4°C. To prevent bubble formation, degas with helium at 140 kPa (20 lb/in2) through a helium degassing tube for one minute prior to use. Holding time = 7 days.
6.7. Ascorbic Acid Reducing Solution (0.33M): In a 1 L volumetric flask dissolve 60.0 g ascorbic acid in about 700 mL of ASTM Type I water. Add 1.0 g dodecyl sulfate (CH3(CH2)11OSO3Na) (wetting reagent). Dilute to the mark and invert to mix. Filter through a 0.45 um filter and refrigerate at 4°C. Degas with helium prior to use. Discard if the solution becomes yellow. Holding time = 7 days.
6.8. Carrier: Sulfuric Acid 0.16M. In a 1 L volumetric flask add 500 mL ASTM Type I water and 9.0 mL concentrated H2SO4. Dilute to the mark and invert to mix. Use this reagent to perform any dilutions at the instrument. Degas with helium prior to use. Holding time = 7 days.
6.9. NaOH-EDTA Cleaning Solution: In a 1 L volumetric flask dissolve 65 g of NaOH and 6.0 g disodium EDTA in about 500 mL of ASTM Type I water. Dilute to mark and invert to mix. Store in a dark plastic bottle. Holding time = 6 months.
6.10. Stock phosphorus standard: Dissolve 0.4393 g of potassium phosphate monobasic (KH2PO4) (dried at 105°C for 1 h) in 900 mL ASTM Type I water. Add 1.0 mL of concentrated H2SO4 and dilute to 1 L: 1.0 mL = 0.100 mg P (100 mg P/L) and refrigerate at 4°C. Holding time = 6 months.
6.11. Working standard solutions: Prepare the following standards by diluting suitable volumes of standard solution (6.10) to 1 L with ASTM Type I water. Preserve standards with 1 mL/L concentrated H2SO4 before diluting to the mark and refrigerate at 4°C. Holding time = 28 days.
Concentration of Standard (mg P/L) Volume of stock standard 6.10 (mL)
0.00 (and Reagent Blank) 0.0 (1 L) 0.016 0.16 (1 L) 0.050 0.50 (1 L) 0.250 2.5 (1 L) 0.500 5.0 (1 L) 1.00 10.0 (1 L)
30 Spike Solution 30.0 (100 mL) Note:
1) Digest three to five tubes (depending on length of run) of each the zero (i.e. reagent blank) and 0.5 mg/L standards because they are used for the CBs and IPCs (8.7).
2) All working, stock, and QCS standards must be entered into the Standards Log located in the Wet Chemistry Laboratory.
3) All Stock and QCS standards must be entered into the Standards Log located in Horizon (15.17).
144

Total Phosphorus Wisconsin State Laboratory of Hygiene ESS INO METHOD 310.2 Environmental Health Division Revision 4 Inorganic Chemistry Dept. Effective date: September, 2014 to Present Replaces Revision 3, March, 2008 Page 4 of 12
The current revision of this SOP is located at O:\SOP\EHD\ESS\Inorg\Final. Please confirm that this printed copy is the latest revision.
6.12 Quality Control Standard (QCS): The stock solution used to prepare the QCS must originate from a different source than the calibration standards. A pre-made stock solution may be obtained from vendors like LabChem or VWR. Stock is refrigerated at 4°C. Holding time = 6 months after opening if no manufacturers expiration date is given.
6.12.1 Quality Control Working Standard (QCS): Dilute 4.0 mL of 50 mg/L Lab Chem Stock Standard (6.12) to 500 mL. 1.0 mL = 0.0004 mg P (0.4 mg P/L) (Add 0.5 mL of conc. H2SO4 before diluting to 500 mL). Holding time = 28 days.
7. Apparatus
7.1. Digestion tubes, 20 x 150 mm, disposable borosilicate glass.
7.2. Autoclave.
7.3. Lachat 8000 System.
7.3.1. Multichannel proportioning pump
7.3.2. Injection module with a 150 cm x 0.8 mm i.d. sample loop.
7.3.3. Reaction unit or manifold (Figure 1)
7.3.4. Colorimetric detector
7.3.5. Colorimeter equipped with 10 mm path length flow cell and 880 nm interference filter.
7.3.6. Data system
7.3.7. Heating unit: 37°C; use the 350 cm length tubing rather than 175 cm for better sensitivity.
7.4. Motorized pipette: 10 mL, 1.0 mL, and 0.1 mL (15.10).
7.5. Disposable culture tubes: 13 x 100 mm disposable glass.
7.6. Polypropylene caps for disposable digestion tubes.
7.7. Vortex mixer.
7.8. Autosampler.
8. Quality Control
8.1. Please refer to the Environmental Health Division Quality Assurance Manual (15.6) for general information on Quality Control Procedures. Important specifics include:
8.1.1. Accuracy and precision calculations.
8.1.2. Corrective action procedures (including documentation requirements) for instrument problems or analytical problems.
8.2. An instrument logbook is maintained for each Autoanalyzer. Maintenance, performance problems, date calibrated, analyst, and other pertinent information are documented in the logbook.
145

Total Phosphorus Wisconsin State Laboratory of Hygiene ESS INO METHOD 310.2 Environmental Health Division Revision 4 Inorganic Chemistry Dept. Effective date: September, 2014 to Present Replaces Revision 3, March, 2008 Page 5 of 12
The current revision of this SOP is located at O:\SOP\EHD\ESS\Inorg\Final. Please confirm that this printed copy is the latest revision.
8.3. A Quality Control Standard (QCS) is digested with each run (6.12). The analytical result must be within ±10% of the true value to continue the analysis. If the QCS exceeds the recommended recovery limits, corrective action includes reanalyzing the QCS, recalibrating, or redigesting and reanalyzing the run.
8.4. A Laboratory Reagent Blank (LRB) is digested and analyzed initially for the first 20 samples and for every 20 samples thereafter. The LRB must meet one of three criteria listed in the Wisconsin Department of Natural Resources Lab Certification Program (15.5). 1) Lab Reagent Blank must be less than the detection limit of the method (0.005 mg/L). 2) Lab Reagent Blank must be <5% of sample concentration. 3) Reagent Blank must be <5% of the regulatory limit. If the LRB does not meet one or more of these criteria, the recommended corrective action is re-digestion of the samples associated with the LRB in question. If the measured concentration of the LRB is more negative in magnitude than -LOD and there is no apparent source causing the problem (e.g., baseline drift, improper y-intercept, poor source material used to prepare the LRB, etc.) then the LRB may be accepted as having an estimated concentration of “zero” providing the logic supporting this decision is well documented.
8.5. A Laboratory Fortified Blank (LFB) is digested and analyzed initially for the first 20 samples and for every 20 samples thereafter. Exception to this frequency: If the acceptance criteria for the Matrix Spikes (8.6) are equal to or more stringent than the LFB, digestion and analysis of one LFB per analytical batch is adequate. Prepare a LFB by spiking 7.92 mL of LRB with 0.08 mL of spike solution (6.11). The spike recovery must be within ±10% of the true value to proceed. If the LFB exceeds the recommended recovery limits, corrective action includes reanalyzing the LFB, recalibrating, or redigesting and reanalyzing the run.
8.6. Matrix Spikes (MS) and Laboratory Duplicates (LD): Prepare a minimum of 10% of the samples, per matrix, with duplicates and spikes. Spikes are prepared by mixing 7.92 mL of a sample with 0.08 mL of spike solution (6.11). If the duplicate acceptance criteria (precision QA) is not met, the matrix group (including spike and duplicate) should be redigested and reanalyzed with the next analytical batch. If the duplicate limits are exceeded a second time, qualify all results within the matrix group. If the spike recovery (accuracy QA) does not fall within the specified control limits, the matrix group (including spike and duplicate) should be redigested and reanalyzed with the next analytical batch. If it fails a second time, qualify all results within the matrix group.
8.7. An Instrument Performance Check (IPC) and Calibration Blank (CB) must be analyzed immediately after calibration and then after every 10 cups. The IPC must be within ±10% of true value. Choose a standard with a concentration near the middle of the calibration range to use as the IPC. The CB must be less than the LOD (0.005 mg/L). In general, a CB is within acceptable QC limits if the observed concentration is less than the LOD, but greater than the negative LOD (<LOD and >-LOD). However, if the measured concentration of the CB is less than the negative LOD (<-LOD) and there is no apparent source causing the problem (e.g., baseline drift, improper-Y intercept, poor source material used to prepare the CB, etc.), then the CB may be accepted as “zero” providing the logic
146

Total Phosphorus Wisconsin State Laboratory of Hygiene ESS INO METHOD 310.2 Environmental Health Division Revision 4 Inorganic Chemistry Dept. Effective date: September, 2014 to Present Replaces Revision 3, March, 2008 Page 6 of 12
The current revision of this SOP is located at O:\SOP\EHD\ESS\Inorg\Final. Please confirm that this printed copy is the latest revision.
supporting this decision is well documented. All data reported from each analytical batch must be bracketed by acceptable IPCs and CBs. If an IPC or CB fails, corrective action is to reanalyze all samples back to the last acceptable IPC and CB.
8.8. Demonstration of Capability (DOC): An Initial DOC and annual continued proficiency checks are performed according to ESS INO QA 115 (15.8).
8.9. Limit of Detection (LOD): The LOD must be verified every six months or reestablished whenever there is a significant change in the method or instrumentation. Verify or establish the method LOD using the procedure outlined in ESS INO QA 116 (15.9).
8.10. Linear Calibration Range (LCR): The LCR must be verified every six months or whenever there is a significant change in the method or instrumentation. The initial demonstration of linearity must use sufficient standards to insure that the curve is linear. The verification of linearity must use a minimum of a blank and three standards. If any verification data exceeds the initial values by more than ±10%, linearity must be re-established. If any portion of the range is shown to be nonlinear, a sufficient number of standards must be used to clearly define the nonlinear portion.
8.11. Sample Dilution: If the estimated concentration of analyte in a sample exceeds the highest calibration standard a bench dilution should be performed. Dilutions at the bench are typically performed by diluting an appropriate volume of sample with the digested reagent blank. Motorized pipettes may be used to deliver/dilute volumes up to 10 mL. For volumes greater than 10 mL, Class A glass, volumetric pipettes should be used. Diluted samples should be mixed thoroughly prior to analysis. Samples may also be diluted prior to digestion.
8.11.1. Samples diluted prior to digestion should be edited in the prep batch (10.2) in Horizon. Double click on the CC section of the sample that was diluted. Change the Initial Volume amount to reflect the diluted sample.
Ex: 0.8 mL in initial volume and 8 mL in final volume for a 10:1 dilution
8.11.2. Samples diluted at the bench should be edited in the analytical batch (12.2) in Horizon. Double click on the CC section of the sample that was diluted. Change the Dilution factor in the upper right hand corner of the box that opens.
9. Method Calibration
9.1. Working standards (6.11) are digested along with the samples as described in section 10.
9.2. Calibration curve is a linear, 1st-order polynomial curve.
9.3. Set the data system parameters and operating conditions for the Lachat 8000 with the Omnion software (15.12).
9.4. The instrument is calibrated according to section 10.9.4. A minimum correlation coefficient (r) of 0.995 is required to continue with sample analysis. If this is not met, use an appropriate corrective action to diagnose possible causes and recalibrate.
147

Total Phosphorus Wisconsin State Laboratory of Hygiene ESS INO METHOD 310.2 Environmental Health Division Revision 4 Inorganic Chemistry Dept. Effective date: September, 2014 to Present Replaces Revision 3, March, 2008 Page 7 of 12
The current revision of this SOP is located at O:\SOP\EHD\ESS\Inorg\Final. Please confirm that this printed copy is the latest revision.
10. Procedure
10.1. See also Instrument Operating Procedure (15.12).
10.2. Create a worklist using Horizon and download it to the Lachat instrument as explained in the Horizon Procedures (15.17).
10.3. Load the test tube racks with disposable digestion tubes (7.1) so you have enough for your samples, standards, duplicates, spikes and blanks according to the analytical run.
10.3.1. Transfer 8 mL of each sample to a digestion tube with a 10 mL motorized pipette.
10.3.2. The LFB and spiked samples should be prepared according to 8.5 and 8.6.
10.4. Standards rack should be set up as shown below.
0.5 0.5 0.5 0 0 0
1.0 0.5 0.5 0.5 0.25 0.05 0.016 0 0 0
1.0 0.5 0.5 0.5 0.25 0.05 0.016 0 0 0
1.0 0.5 0.5 0.5 0.25 0.05 0.016 0 0 0
10.5. All digestion tubes should have 8 mL of liquid before the addition of digestion acid. Add 0.5 mL of working digestion acid solution (6.3) to each tube, vortex, and cover with caps (7.6) (do not press caps down).
10.6. Autoclave the digestion tubes for 30 minutes at 121°C, 15-20 psi.
10.7. Remove the tubes from the autoclave, press caps down securely, and allow them to cool.
10.8. Allow any particulate matter to settle overnight.
10.9. Calibration Procedure and Sample Analysis:
10.9.1. Turn on the instrument by flipping the switch on the back left corner of the machine.
10.9.2. Set up the manifold as shown in Figure 1.
10.9.3. The Color Reagent (6.6) and Carrier Reagent (6.8) need to be degassed prior to being pumped through the manifold.
Wand is in the drawer across from the machine and needs to be rinsed with 10% HCl followed by MQ water before being used.
148

Total Phosphorus Wisconsin State Laboratory of Hygiene ESS INO METHOD 310.2 Environmental Health Division Revision 4 Inorganic Chemistry Dept. Effective date: September, 2014 to Present Replaces Revision 3, March, 2008 Page 8 of 12
The current revision of this SOP is located at O:\SOP\EHD\ESS\Inorg\Final. Please confirm that this printed copy is the latest revision.
Degas each reagent using helium gas for 5-10 minutes. Be sure to rinse the wand between reagents.
10.9.4. Pump ASTM Type I water through all reagent lines and check for leaks. Switch to reagents and allow the system to equilibrate (about five minutes).
10.9.5. Open Omnion software on Lachat computer.
10.9.6. Open Total Phos. Template in Omnion.
10.9.7. Place samples and standards in the appropriate place on the autosampler racks. Import the sample worklist that was created in Horizon (10.2) by selecting Import Worksheet Data.
10.9.8. After the worklist has been imported, insert IPC and CB after every 10 samples. Highlight the IPC and CB in the template and right click to select Define DQM. Check the box for “After Every N” and type in 10. Make sure the box for “Close Run” is also checked.
10.9.9. Calibrate the instrument by analyzing the standards in order of decreasing concentration. The data system will associate the concentrations with the instrument responses for each standard and plot the calibration curve.
10.9.10. After the calibration passes (see section 9.4) the samples may be analyzed.
10.9.11. Watch for samples that have air spikes or necessary dilutions which would need to be rerun. Dilutions (8.11) should be added to the end of the run and inserted as the sample number followed by an X and the dilution factor.
10.9.11.1. ex: 123456789 X5
10.10. Shutdown procedure:
10.10.1. After the run is complete, switch reagent lines to the NaOH-EDTA solution (6.9) for approximately five minutes, then rinse with ASTM Type I water for five minutes.
10.10.2. Remove reagent lines from ASTM Type I water and pump air through in order to dry. Release pump-tubes from cartridges and turn off instrument.
10.10.3. Waste disposal: The waste will be acidic and will need to be neutralized according to the Laboratory Safety Guide (15.4).
11. Calculations
11.1. The phosphorus concentration in the unknown samples is calculated by the instrument software based on the standard calibration curve. The phosphorus concentration result is obtained by transferring the data from the Lachat instrument to Horizon (12.2) and can also be obtained directly from the Run Time Report, which should be printed for a hard copy.
149

Total Phosphorus Wisconsin State Laboratory of Hygiene ESS INO METHOD 310.2 Environmental Health Division Revision 4 Inorganic Chemistry Dept. Effective date: September, 2014 to Present Replaces Revision 3, March, 2008 Page 9 of 12
The current revision of this SOP is located at O:\SOP\EHD\ESS\Inorg\Final. Please confirm that this printed copy is the latest revision.
11.2 If the estimated phosphorus concentration exceeds the highest calibration standard, a manual dilution should be performed prior to digestion and documented on the benchsheet (8.11). The Lachat 8000 software does not incorporate the dilution correction into the result. The dilution factor and diluted result will be documented in Horizon. The result must also be calculated manually by the analyst and documented on the Run Time Report. The final result will be verified mathematically, by an experienced chemist who did not perform the original analysis, when the batch is checked for quality control (15.13).
12. Data Management
12.1. The analytical run, the Run Time Report, and the QC Parameters section in Horizon, where all quality control is calculated for pass/fail criteria, will be reviewed for quality control prior to accepting results (see section 8). The reviewer must be an experienced chemist who did not perform the original analysis (15.13). The reviewer must initial and date the analytical run.
12.2. Export results from Lachat 8000 to Horizon (see Horizon Procedures 15.17).
12.2.1. Review results by selecting Data Review under Batching.
12.2.2. Review QC Results by selecting QC Parameters under Batching. 13. Definitions
13.1 Definitions of terms in this SOP may be found in the reference method (EPA Method 365.1). General definitions of other terms that may be used in this method are found in the EHD Quality Assurance Manual (15.6).
14. Method Performance
14.1 Where applicable, the laboratory's initial accuracy and precision data (MDLs and IDOCs) are generated in compliance with the reference method and the Inorganic Chemistry Department’s standard operation procedures: ESS INO QA 115 (15.8) and ESS INO QA 116 (15.9). Data generated within the last two years will be kept on file within the Inorganic Chemistry Department. Data older than two years may be archived in the basement.
15. References
15.1. U.S. Environmental Protection Agency, Methods for the Determination of Inorganic Substances in Environmental Samples, EPA/600/R-93/100, Revised August 1993, Method 365.1
15.2. QuikChem Method 10-115-01-1-F Determination of Total Phosphorus by Flow Injection Analysis Colorimetry (Acid Persulfate Digestion Method), Revised October, 1994.
150

Total Phosphorus Wisconsin State Laboratory of Hygiene ESS INO METHOD 310.2 Environmental Health Division Revision 4 Inorganic Chemistry Dept. Effective date: September, 2014 to Present Replaces Revision 3, March, 2008 Page 10 of 12
The current revision of this SOP is located at O:\SOP\EHD\ESS\Inorg\Final. Please confirm that this printed copy is the latest revision.
15.3. AD Safety GENOP 102, Chemical Hygiene Plan and General Laboratory Safety Plan for the Agriculture Drive Facility, State Laboratory of Hygiene.
15.4. University of Wisconsin-Madison, Chemical & Radiation Protection Office, Safety Department (262-8769), “Laboratory Safety Guide,” 2004. http://www.fpm.wisc.edu/safety
15.5. Wisconsin Administrative Code NR149, Department of Natural Resources Lab Certification Program, effective Sept. 1, 2008.
15.6. Quality Assurance Manual, Environmental Health Division, Wisconsin State Laboratory of Hygiene.
15.7. 2009 TNI Standard, Volume 1: Management and Technical Requirements for Laboratories Performing Environmental Analysis, The NELAC Institute, 2009.
15.8. Wisconsin State Laboratory of Hygiene, ESS INO QA 115, Initial DOC and Annual
Continued Proficiency Check Procedures.
15.9. Wisconsin State Laboratory of Hygiene, ESS INO QA 116, LOD Procedures.
15.10. Wisconsin State Laboratory of Hygiene, ESS INO GENOP 200, Pipette Performance
Checks.
15.11. Wisconsin State Laboratory of Hygiene, ESS INO QA 101, Bottle Check Procedure.
15.12. Wisconsin State Laboratory of Hygiene, ESS INO IOP 105, Instrument Operating
Procedure for QuikChem 8000, Automated Ion Analyzer and Computer Protocol.
15.13. Wisconsin State Laboratory of Hygiene, ESS INO QA 107, Q.C. Audits of Analytical
Runs for ESS Wet Chemistry Area.
15.14. QuikChem 8000, Automated Ion Analyzer Continuum Series, Flow Injection Analyzer, Hardware Installation and System Operation Manual, Zellweger Analytics, Inc., Lachat Instruments Division, Milwaukee, WI, April 30, 1998.
15.15. Software User Guide, Omnion 3.0, Lachat Instruments, Hach Co., 2004.
15.16. QuikChem 8000 Automated Ion Analyzer Training Manual for Omnion 3.0, Lachat Instruments, Hach Co., 2002.
15.17. Wisconsin State Laboratory of Hygiene, ESS INO GENOP 113, HORIZON Procedures
for EHD Inorganic Chemistry
16. Revision Tracking Table:
Revision # Revision date Changes Made Revision author
4 Sept. 2014 Updated for Horizon WK
151

Total Phosphorus Wisconsin State Laboratory of Hygiene ESS INO METHOD 310.2 Environmental Health Division Revision 4 Inorganic Chemistry Dept. Effective date: September, 2014 to Present Replaces Revision 3, March, 2008 Page 11 of 12
The current revision of this SOP is located at O:\SOP\EHD\ESS\Inorg\Final. Please confirm that this printed copy is the latest revision.
PHOSPHORUS MANIFOLD DIAGRAM
CARRIER is 0.16 M sulfuric acid (6.8).
All manifold tubing is 0.8 mm (0.032 in) i.d. Lachat Part No. 50928. This is 5.2 µL/cm. APPARATUS: An injection valve, a 10 mm path length flow cell, and a colorimetric detector module is required. Note 1: 2 meter back pressure loop, 0.52 mm (0.022 in.) i.d. Note 2: 350 cm of 0.8 mm (0.032 in) i.d. tubing wrapped around the heater block.. Note 3: 70 cm of tubing on 5 cm coil support.
152

Total Phosphorus Wisconsin State Laboratory of Hygiene ESS INO METHOD 310.2 Environmental Health Division Revision 4 Inorganic Chemistry Dept. Effective date: September, 2014 to Present Replaces Revision 3, March, 2008 Page 12 of 12
The current revision of this SOP is located at O:\SOP\EHD\ESS\Inorg\Final. Please confirm that this printed copy is the latest revision.
Signature Page:
Written by: Wes Kotila Date: 09/10/14
Title: Project Chemist
Unit: EHD Inorganic Chemistry
Reviewed by: Graham Anderson Date: 09/16/2014
Title: Advanced Chemist
Unit: EHD Inorganic Chemistry Approved by: ___Tracy Hanke_______ Date: _09/16/2014__
Title: _Chemist Supervisor_____
Unit: EHD Inorganic Chemistry
Certification Statements Received From: Graham Anderson Wes Kotila Jordan Montpetit Tony Plourde Jenny Thorngate
153

Microscopic Examination of Algae
Materials
Bright-field microscope of magnification 400xDigital cameraGlass slide and cover glass
Procedure
A fresh sample of lake water, algal tissue, or metaphyton should be examined as soon as possible or else preserved frozen for later examination. A needle can be used to transfer a small amount of the sample to a glass slide, then covered. A small amount means about1 microliter of liquid or about 1 milligram of wet tissue. Under the microscope, objects of interest are brought into focus with adjustment of illumination. When the view is as good as it gets, the digital camera is held over the eyepiece for an exposure.
Identification of Algae
Often algae are seen together with unrelated zooplankton and phytoplankton. Identification is work for experts and specialists. But an amateur can at least make an attempt or guess at identification by comparison with reference photomicrographs of known species.
154

W I S C O N S I N C I T I Z E N L A K E M O N I T O R I N G T R A I N I N G M A N U A L
page 44
STEP 1. Before using the integrated sampler rinse with lakewater three times. Fill the sampler with lake water and empty the water out of the top of the sampler. This will clean out any dirt or dust that may have gotten in the sampler.
STEP 2. The water collection bottle should also be rinsedwith lake water three times. Once it is clean, remove the cap and place it in an accessible spot. Always place the cap top side down to prevent contamination of the inside of the cap.
STEP 3. While holding onto the rope end (top) of the integrat-ed water sampler, slowly lower the collection end (bottom) of the sampler tube vertically into the water column until the water level reaches the six-foot mark on the sampler. Raise the sampler out of the water.
STEP 4. Drain the integrated water sampler by touching thecollection end of the sampler to the rod in the neck of the water collection bottle. Water will drain from the integrated water sampler tube into the water collection bottle. This water is used for your phosphorus and chlorophyll samples.
STEP 5. Keep your water sample in a cool place and out ofdirect sunlight until you return to shore. A cooler is an ideal place to keep it. Algae in the lake water will continue to grow if the bottle remains in the sun.
STEP 6. Your integrated sampler should be rinsed out withdistilled water after use and stored topside down. This will prevent algal growth between the ball and the collection end of the sampler.
ON LAKEON LAKE PROCEDURESHow to Collect Water SamplesIntegrated Water SamplerThe integrated water sampler is used to collect the water sample for phosphorus and chlorophyll analysis on lakes that are deeper than ten feet. Chemistry volunteers collecting water samples on lakes less than ten feet in depth will use a Van Dorn sampling bottle to prevent getting bottom sediments mixed in with the water sam-ple.
DN
R P
HO
TOS
155

page 45
Before you begin processing your water samples and preparing them for the State Laboratory of Hygiene, here is a quick checklist to make sure that you have everything you will need.
Manual
Field Data Sheets
State Laboratory of Hygiene slip for your phosphorus and chlorophyll samples
Pencil and waterproof pen
Safety gloves
Safety goggles
Phosphorus sample sticker
Chlorophyll sample sticker
“Acid added” stickers (optional)
Three trays of ice cubes (you provide)
Styrofoam® mailer kit
Ziploc® bags
Packaging tape
Merchandise return label and priority mail stickers
Magnetic Filter Funnel (2 pieces)
Chlorophyll tube
Hand pump with plastic tubing
500 or 1000 ml plastic flask
250 or 500 ml graduated cylinder
Membrane filters
Test tubes
2 Tweezers
Paper towels (you provide)
Squeeze bottle filled with distilled water (you provide distilled water)
Acid vial
Phosphorus sample
Water sample in the 2-quart water collection bottle
ON SHOREON SHORE PROCEDURES
Before you start processing the sample(s), be sure
to read the following pages to familiarize yourself
with the equipment and the procedures that you will be
using. All of the procedures that you will follow in sampling
your lake are done for specific reasons. It is very important
that you follow the sampling procedures exactly as they are
laid out in the following pages to ensure good, consistent,
high quality data. The following pages will provide you with
sufficient background on the design of the equipment and
proper procedures to use.
156

W I S C O N S I N C I T I Z E N L A K E M O N I T O R I N G T R A I N I N G M A N U A L
page 46
STEP 4. Replace lid on acid vial andthe cap on your phosphorus sample. Mix your sample by inverting the bottle several times.
Attach a completed label with the name of your lake, site, county, and date. Don’t forget to mark on your bottle that it is preserved with H2SO4 (sulfuric acid), or as an option, attach the acid-added sticker to your bottle.
STEP 2. Remove the sulfuric acid vial fromyour kit.
STEP 3. Uncap your phosphorus bottle andempty contents of one acid vial into your phosphorus sample. This will “fix” your sample by inhibiting bacterial growth and keeping the phosphorus from sticking to the sides of the bottle.
Always place the cap topside down to prevent contamination.
STEP 1. To prepare your phosphorus sample, remove the cap from your250 ml State Laboratory of Hygiene bottle. Place cap topside down to prevent contamination. Gently mix the water in the water collection bottle and pour the water from the water collection bottle into the 250 ml bottle. Fill to the neck. Avoid touching the mouth of the water collection bottle and the phosphorus bottle lip to prevent contamination.
ON SHOREON SHORE PROCEDURESPhosphorus Sample PreparationBe sure to put on your gloves and safety goggles before beginning your phosphorus sample preparation!
DN
R P
HO
TOS
STEP 5. When you are done adding the sulfuric acid, rinseand dispose of the used vials in the garbage. Store unused vials out of the reach of children!
STEP 6. Refrigerate phosphorus sample until ready to mail.
157

page 47
STEP 4.
Squirt a small amount of distilled water on the black filter base before placing the membrane filter on it (see Step 5). This will help to hold the membrane filter in place until you can place the magnetic cup on top of it (see Step 6).
STEP 1. Place all the parts of your chlor ophyll filtering equipment at your work area.
STEP 2. Attach the plastic tubing of the hand pump to the spout of the 500 or 1000 ml plastic flask.
STEP 3. Insert the stopper of the filtering cup into the flask. You may want to moisten the stopper first to ensure a good seal.
ON SHOREON SHORE PROCEDURESChlorophyll Sample PreparationSince light can cause the algae to grow and alter your sample, this on shore procedure for preparing your chlorophyll sample should be conducted in the shade and out of direct sunlight.
DN
R P
HO
TOS
158

W I S C O N S I N C I T I Z E N L A K E M O N I T O R I N G T R A I N I N G M A N U A L
page 48
STEP 6. Carefully place the magnetic cup on top of the filter base. Be sure that the filter does not move! If the filter moves, wrinkles, or tears, remove the filter cup and discard the torn/wrinkled filter. Repeat steps 4 and 5 with a new filter.
STEP 5. Use the tweezers to pick up one membrane filter and place it on the center of the filter cup base (i.e. the black screen). Note that filters are white and the divider sheets are blue. Make sure you use a white filter and not a blue divider sheet!
Note: Never touch the filter with your fingers! Always use tweezers when removing it from the Ziploc®
bag or when placing it on the black screen.
STEP 7. Using the table on the right, look up the Secchi depth you measured earlier in the day. Use this to determine the volume of water that you need to filter to obtain your chlorophyll sample. Please be aware that this amount may change each time you sample. In general, the better the water clarity (i.e. deep Secchi depth), the fewer algae there are in the water, and the more water you need to filter in order to collect enough algae for analysis.
ON SHOREON SHORE PROCEDURESChlorophyll Sample Preparation (continued)
Volume of water to filter as determined by Secchi depth.
Secchi Depth Volume of Water (ft) to Filter (ml)
Less than 1 501 to 1.5 100Greater than 1.5 200
DN
R P
HO
TOD
NR
PH
OTO
S
159

page 49
STEP 9. To begin filtering, pour some of the measured water from the graduated cylinder into the filter apparatus. You don’t want to pour the full amount into the filter cup all at once. If your lake contains lots of algae or sediment, the filter will become clogged and you will not be able to empty the filter cup easily.
If the filter becomes clogged, try to filter the remaining water from the filter cup. You should remove the used filter using the filter forceps and place it in the chlorophyll tube provided by the WSLH. Put a new filter on the magnetic filter cup apparatus, replace the cup and continue to filter. You can send more than one filter successfully. OR: Try to filter as much water from the cup as possible and record only the amount of water you were able to filter.
STEP 8. Take out the plastic water collection bottle filled with water for your chlorophyll sample. Gently mix the water in the bottle by turning it upside down several times. Fill your 250 ml or 500 ml graduated cylinder with the appropriate volume of water needed to filter your sample (Refer to step 7). Note that although the upper cup of the filtering apparatus can be used to measure water volume, it is not an accurate measuring device and should not be used to measure the volume of water you need to filter.
ON SHOREON SHORE PROCEDURESChlorophyll Sample Preparation (continued)
STEP 10. Squeeze the hand pump to move the water through the filter. Once all the water has been filtered, wash down the sides of the filter cup with distilled water to ensure that all of the algae are washed onto the filter paper.
DN
R P
HO
TOS
160

W I S C O N S I N C I T I Z E N L A K E M O N I T O R I N G T R A I N I N G M A N U A L
page 50
STEP 12. Using tweezers, place the filter into the chlorophyll tube that came in the mailer from the WSLH. If the filter tears while you are removing it, it is okay to place it in the tube. Make sure that the algae that is on the filter does not get lost during transfer to the tube.
STEP 11. After you have filtered the appropriate volume of water, separate the filter apparatus by removing the top cup from the filter base.
STEP 13. Fill out the chlorophyll label and place it on the tube containing your chlorophyll sample. Be sure to include the volume filtered (mls) on the label.
STEP 14. Don’t forget to write the volume of water that you filtered for your chlorophyll sample on your lab slip.
ON SHOREON SHORE PROCEDURESChlorophyll Sample Preparation (continued)
IT IS BEST TO MAIL YOUR SAMPLE ON THE DAY YOU COLLECT IT. But, if it has to be mailed the next day, place your chlorophyll sample in the freezer until you’re ready to mail it!
DN
R P
HO
TOS
161

page 51
How to Fill Out Your Lab SheetWhen filling out your lab sheet, please make sure the following information listed is completed.
WBIC (should already be pre-filled in on your lab sheet)
Station ID (Storet #) (should already be pre-filled in on your lab sheet)
Collected By (name or names of all who sampled)
Phone (your phone number)
Begin or Grab Date (the date your sample was collected)
Begin Time (list this time in 24 hour or military time)
Depth of Sample or Sample Location (6 feet if you used the integrated water sampler; 3 feet if you used the Van Dorn sampling bottle.)
mls filtered (amount of water filtered for your chlorophyll sample in mls)
Do not forget to fill in the “Tot. Phosphorus” area of the lab sheet. Enclose the completed lab sheet in your sample mailer box.
Mailing Your SamplesFor the lab to get an accurate analysis of the phosphorus and chlorophyll in your lake, your samples must be handled and shipped properly. Try to collect your samples early in the week so that you are able to put them in the mail on a Monday, Tuesday, or Wednesday. You want your samples to reach the WSLH by Friday so they do not sit in the post office over the weekend. If you collect your samples on a Friday, Saturday, or Sunday put your chlorophyll sample in the freezer and keep your phosphorus sample in the refrigerator until you are able to mail them on Monday. Do not put your phosphorus sample in the freezer! Keep in mind that the sooner the lab is able to analyze your samples, the more accurate your results will be. The following steps are an efficient way to make sure that your samples are packaged properly and prepared to ship to the State Laboratory of Hygiene safely.
STEP 2. Gather all the materials you will need to mail your samples: Styrofoam®
mailer, completed lab sheet, merchandise return label (mailing label), three trays of ice cubes, one sandwich-size Ziploc® bag, 2 one-gallon Ziploc® bags, and Priority Mail® stickers.
STEP 1. Complete the laboratory data sheet for your phos-phorus and chlorophyll samples. All information must be complete for the lab to analyze the samples. If you are unsure of how to fill out your data sheet see the previous section “How to Fill Out Your Lab Sheet”.
MAILINGMAILING YOUR SAMPLES
DN
R P
HO
TOS
W I S C O N S I N C I T I Z E N L A K E M O N I T O R I N G T R A I N I N G M A N U A L
162

W I S C O N S I N C I T I Z E N L A K E M O N I T O R I N G T R A I N I N G M A N U A L
page 52
STEP 4. Prepare to mail your phosphorus sample by making sure that your sample was preserved with sulfuric acid and that you’ve checked the acidity. Attach the completed label with the name of your lake, site, county, and date. Don’t forget to mark on your bottle that it is preserved with H2SO4 (sulfuric acid), or as an option, attach the acid-added sticker to your bottle.
STEP 3. Prepare to mail your chlorophyll sample by mak-ing sure that the chlorophyll sticker is filled out complete-ly and attached to the tube. Don’t forget to include the volume of water that you filtered! Put your chlorophyll filter tube in the gallon Ziploc® bag.
MAILINGMAILING YOUR SAMPLES (continued)
STEP 5. Place your phosphorus sample in the sandwich-size Ziploc®
bag, seal the bag, and then put it in a one-gallon Ziploc® bag with three trays of ice cubes. Make sure this bag is sealed tightly or it will leak. If this bag leaks during mailing, the Post Office will not deliver it to the lab and your sample will be ruined.
STEP 6. Put your completed lab sheet in the one-gallon Ziploc®
bag with your chlorophyll tube. Seal the bag.
DN
R P
HO
TOS
NOTE: Always
mail the lab
slip with your
samples!
163

page 53
STEP 8. Gently fold the bagged lab sheet over the ice, close the Styrofoam® lid, and tape the cardboard mailing box shut.
STEP 9. Tape once around the cardboard sleeve. Attach the 4 inch x 6 inch white merchandise return label to the top of the mailer. Attach one priority mail sticker to the top of the package and one to the bottom. The mailer card should have your postal address on one side. The other side should be BLANK. You want the blank side facing out when the sample is sent to the WSLH.
STEP 10. Put your samples in the mail with your regular outgoing mail or at the post office. The mailing label is postage paid, so you will not need any stamps.
STEP 11. Once the WSLH has received your samples, they will send you a new mailer to use for your next collection of samples.
STEP 7. Place your bagged phosphorus sample containing the ice in the Styrofoam® mailer. Then place the bagged lab sheet with your chlorophyll sample and tube in the inside of the Styrofoam® mailer. Make sure that the chlorophyll sample is against the ice in the bag with your phosphorus sample!
MAILINGMAILING YOUR SAMPLES (continued)
DN
R P
HO
TOS
164

W I S C O N S I N C I T I Z E N L A K E M O N I T O R I N G T R A I N I N G M A N U A L
page 54
Quality Assurance Sampling Protocol
In 2007, the Citizen Lake Monitoring Network implemented procedures to document the accuracy and precision of the field data collected by volunteers.
These procedures are a way to look at natural variability and sampling error. The protocol that was designed mimicked the Quality Assurance/Quality Control (QA/QC) methods used by the Wisconsin Department of Natural Resources (Wisconsin DNR) water quality staff.
Approximately ten percent of the total phosphorus (TP) and chlorophyll stations are randomly selected each year to participate in collection of QA/QC samples. The Wisconsin DNR asks volunteers who are chosen to participate to collect two additional phosphorus samples – a field blank and a duplicate (also called a replicate) sample. Volunteers also collect a duplicate chlorophyll sample.
The phosphorus field blank is prepared using deionized water – this water is provided to the volunteer and comes from the State Lab of Hygiene (WSLH). Deionized water contains no nutrients. The blank phosphorus sample that the volunteer submits should be a “clean” sample – there should be no nutrients in it (which means your equipment is clean and does not have residual phosphorus). The blank sample is processed the same way that you process your regular phos-phorus sample except that you are using deionized water instead of lake water. The QA/QC procedures are meant to “mimic” the collection procedures that are used in phosphorus collection and processing.
Before going out in the field, you will prepare your blank sample by rinsing your Van Dorn or integrated sample with deionized water, and then placing deionized water in your integrated sampler or Van Dorn sampling bottle. This water will then be placed in the water collection bottle that you normally use. From the water collection bot-tle the water sample goes to a “phosphorus bottle” – the same kind you use to mail your water sample to the WSLH. This water sample is preserved with sulfuric acid. Ideally, when analyzed by WSLH, the sample will have no detectible phosphorus. If the blank sample does contain phosphorus it could be that your equipment con-tains residual amounts of phosphorus or that the sampling technique is faulty – for instance, phosphorus could show up in a blank sample if you used your finger to release the ball of your integrated sampler to release water. The field blank also tests laboratory processing once the sample arrives at the WSLH.
The duplicate phosphorus sample is taken from the same site, at the same time, using the same method as your normal phosphorus sample. The only difference is that you will use a separate water collection bottle for each sample collected using your integrated sampler. Your CLMN regional coordinator provides an extra water collection bottle for you to use. The original and duplicate samples are independently analyzed in the same manner. The duplicate sample can be used to detect both the natural variability in the environment and that caused by your collection method in the field.(continued on next page)
165

STEP 1. Before going out to take your Secchi disk readings, be sure the conditions are right for sampling. Ideal weather conditions include sunny or partly sunny/cloudy skies; wind-calm to breezy (there should be no whitecaps on the lake). Collect Secchi measurements between 10 am and 4 pm. If possible, try to collect Secchi readings when the satellite is overhead. Satellite paths are available at http://dnr.wi.gov/ lakes/CLMN/.
STEP 2. Your CLMN regional coordinator will provide you with a lake map with the sampling site marked. Be sure you have a station id number for each site you are monitoring.
STEP 3. Anchor your boat at your sampling site to prevent drifting. Be careful not to disturb the sediments on the lake bottom when anchor-ing since this could cloud the water. Remove your sun glasses. Wearing sun glasses will give you an unnatural reading. Unwind the Secchi disk rope from the holder.
STEP 4. Lean over the shady side of the boat and slowly lower the Secchi disk into the water until you can no longer see it. If you are sampling in a pontoon boat, be sure to kneel down on the floor of the boat when you take your readings so you are closer to the surface of the water. Be as close to the surface of the water as you can safely be. Secchi disk read-ings are taken on the shady side of the boat to reduce glare.
STEP 5. When the Secchi disk barely disap-pears from your view, mark the rope at the surface of the water with a clothespin.
page 26
ON LAKEON LAKE PROCEDURESHow to Use the Secchi Disk
DN
R P
HO
TOS
• Secchi values vary by about 6% due to change in sun’s angle in midsummer.
• 5” waves can decrease Secchi reading by 10%.
166

W I S C O N S I N C I T I Z E N L A K E M O N I T O R I N G T R A I N I N G M A N U A L
STEP 6. After you have marked this spot with the clothespin, lower the disk a few more feet into the water. Slowly raise the disk. When the Secchi disk reappears, mark the rope at the surface of the water with the second clothes-pin. The clothespin marks may be at the same spot, several inches or even several feet apart. The purpose of lowering the Secchi disk and raising it back into view is so your eyes become accustomed to looking into the water. The average of the two readings will be a more accurate result.
STEP 7. Bring the Secchi disk back into the boat.
STEP 8. Average your two Secchi disk read-ings by forming a loop between the two clothespins. Slide one clothespin into the cen-ter of the loop to mark it. Remove the other clothespin. The remaining clothespin mark will be your Secchi reading.
STEP 9. Your rope is marked in foot incre-ments. The red lines indicate five, fifteen, and twenty-five feet. The double black lines indicate ten, twenty, and thirty feet. Carefully measure the number of feet from the disk until you reach your clothespin mark. Round off to the nearest quarter foot.
STEP 10. Record this measurement on your data sheet and then fill out the rest of your data sheet.
(continued on next page)
page 27
ON LAKEON LAKE PROCEDURESHow to Use the Secchi Disk (continued)
DN
R P
HO
TOJI
M K
LOS
IEW
SK
I
167

W I S C O N S I N C I T I Z E N L A K E M O N I T O R I N G T R A I N I N G M A N U A L
STEP 11. Record your perception of water color and water appear-ance. Hold the Secchi disk one foot under the surface of the water to determine color and appearance. Record perception. This is your per-ception of the amount of algae that is in the water at the deep hole.
Perception Numbers
1 - Beautiful, could not be any nicer.
2 - Very minor aesthetic problems, excellent for swimming and boating.
3 - Swimming and aesthetic enjoyment of lake slightly impaired.
4 - Desire to swim and level of enjoyment of lake substantially reduced because of algae (would not swim, but boating is okay).
5 - Swimming and aesthetic enjoyment of the lake substantially reduced because of algal level.
STEP 12. If you are taking Secchi readings at more than one site or lake, proceed to your next location and repeat steps 1 through 10 above (step 11, perception, is recorded at the deep hole only.)
STEP 13. Report your data. Data can be submitted on the Internet at http://dnr.wi.gov/lakes/. Internet instructions are found in Appendix 2, page 50. If you enter data online, you do not need to submit data sheets by mail.
For those without Internet access – data sheets can be mailed to your CLMN regional coordinator to be entered into the database or mailed to the central office in Madison:
Department of Natural Resources, Lakes WT/4101 S. Webster St.P.O. Box 7921Madison, WI 53791-9087
page 28
ON LAKEON LAKE PROCEDURESHow to Use the Secchi Disk (continued)
168

W I S C O N S I N C I T I Z E N L A K E M O N I T O R I N G T R A I N I N G M A N U A L
page 36
How Do You Prepare to Sample?The Day You SampleOn the day you plan to sample, complete the top portion of your field data sheet by filling in the Waterbody # (or WBIC), Station # (or Storet #), and Volunteer IDs (or names). If you do not know what these numbers are, contact your regional coordinator. Check your monitoring equipment to make sure it is good working condition. If you have an electronic temperature meter, make sure the 9-volt battery is working. Before you launch your boat, make sure you have an anchor, sufficient gas, and personal flotation devices in your boat.
Sampling OverviewTemperature ReadingsSome limnologists believe that lake temperature profile data are very important to document the effects of climate change. Keep this in mind, as the accuracy of the data you collect is critical. Temperature readings are easy to take. When using a digital temperature meter, a measured cable with a probe is lowered into the water and a hand-held digital meter records the temperature. The cable is marked in one foot increments. Your regional coordinator will give you the depths at which the temperature should be recorded for your particular lake.
Your temperature profile will also tell you if your lake stratifies. You will be able to determine the depth of the epilimnion and where the thermocline is. Temperature profiles will also help determine if a fish kill is a possibility on your lake.
STEP 1. Your regional coordinator will assign you 5 to 10 depths at which you should sample the temperature of your lake. List these pre-determined depths on your field data sheet.
STEP 2. Plug cable into unit.
STEP 4. Once you are finished, raise probe and unplug the cable from unit to conserve the battery. Be sure to store the digital meter out of direct sunlight.
STEP 3. Lower the probe to your assigned depths and note the corresponding tempera-tures from the meter onto your data sheet.
ON LAKEON LAKE PROCEDURESTemperature MonitoringTemperature Probe Method
DN
R P
HO
TO
169

After sampling, it is very important to rinse and thoroughly air dry all of the equipment that you used. As always keep paperwork and envelopes separate from equipment.
3. TEMPERATURE
MONITORING:3. TEMPERATURE
MONITORING:Using a Van Dorn Sampling Bottle with a Thermometer
DN
R P
HO
TO
What Equipment Will You Need?At your training session, your CLMN regional coordinator will outline and provide all of the equipment that you will need to successfully monitor your lake.
Manual
Lake map with sampling site marked
Van Dorn sampling bottle with thermometer
Lifejackets (you provide)
Anchor and rope (you provide)
Field data sheets
Pencil and waterproof pen
Before you start sampling, be sure to read the following pages to familiarize yourself
with the equipment and the procedures that you will be using. All of the procedures that you will follow in sampling your lake are done for spe-cific reasons. It is very important that you follow the sampling procedures exactly as they are laid out in the following pages to ensure good, consistent, high quality data. The following pages will provide you with sufficient background on the design of the equipment and proper procedures to use.
page 37170

Appendix: Random Lake Plant Surveys
Random Lake Plant Survey 2005……………………………...172
Random Lake Plant Survey 2006……………………………...182
Random Lake Plant Survey 2008……………………………...271

RANDOM LAKE
Aquatic Plant Survey
Whole Lake Demonstration Project/AIS Grant - 2005 Report
INTRODUCTIONIn 2003, the Village of Random Lake received an Aquatic Invasive Species Grant from the
Wisconsin Department of Natural Resources (WDNR) to conduct a demonstration whole-
lake chemical treatment on Random Lake. The Grant application included the project
plan upon which the WDNR treatment permit will be based. That plan, and the subse-
quent grant, requires extensive monitoring to be conducted: the year prior to treatment,
the year of treatment, and three years post treatment. The aquatic plant community and
the water quality (Self-Help Volunteer Monitoring Program) are to be monitored.
A local volunteer collected the water quality samples throughout the summer of 2005.
The results are included in this report.
In July of 2005, Aron & Associates conducted the aquatic plant survey on Random Lake.
This survey is part of an ongoing demonstration project to document changes in the
aquatic plant community of Random Lake. This information can be compared with past
studies and may be used by future investigators to determine if the aquatic plant popula-
tion is changing. The impact of various management techniques may be evaluated based
on their respective impacts on the aquatic plants. This information should be used to
guide future lake management decisions on Random Lake.
Random Lake is located in the Village of Random Lake, Sheboygan County, in Southeast
Wisconsin. Hydrographic and morphometric data are presented in Table 2. A map of Ran-
dom Lake showing depth contours is presented in Map 1.
METHODOLOGYGeneral Survey
A preliminary survey of the lake was made by boat. An attempt was made to locate all
plant communities on the lake by region. Nomenclature follows Crow & Hellquist (2000).
No plants samples were collected and preserved since all species found had been col-
lected during previous surveys. The maximum rooting depth on Random Lake in 2005
was determined to be 13 feet, that is, no plants were found growing in water deeper than
13 feet.
172

Random Lake Aquatic Plant Survey, 2005 Page 2
Aron & Associates
Point Intercept Survey
The methodology for the point intercept survey was developed by the WDNR Bureau of
Research for the state’s Whole Lake Treatment Protocol. A grid and global positioning
satellite (GPS) coordinates for sampling, were developed by WDNR and provided to Aron
& Associates for use in the Demonstration Whole Lake Treatment Project surveys on
Random Lake.
The initial grid established 146 sample points. Of those, 13 were on land and were elimi-
nated from the list, resulting in 133 sample points.
Samples points were located using a 2004 Garmin GPS LMS330 with an LGC-2000
Receiver. Four rake tows were conducted at each sample point. Each plant species
retrieved was recorded and given a density rating in accordance with the WDNR criteria,
between 1 and 5. The dominant species at each sample point was also identified.
The data collected were then used to the mean density and percent of frequency for each
species. Lake depth at each sample point was determined by using the Garmin after cali-
bration in the field.
The abundance of each species was determined using four estimates:
1) The frequency is the rating of how often a species occurs in the sample points.
2) The average density rating, or the average density of a species in the sample point
where it occurred.
3) The relative density rating, or the average density of a species averaged over all
sample points whether or not any species were present.
4) The relative density rating averaged over all sample points in which any species
occurred.
EARLIER STUDIES
In October 1999, a whole-lake chemical treatment was conducted on Random Lake using
Sonar™ (SePRO Corporation). Eurasian watermilfoil (Myriophyllum spicatum) was the
primary target species. The goal of the project was to eliminate Eurasian watermilfoil,
enhancing conditions for native species. A condition of the WDNR permit for the project
required that aquatic plants in the lake be monitored. Pre-treatment monitoring was con-
ducted in 1999 and continued through 2002. The results of that monitoring are provided in
Table 1. The monitoring in 1999 through 2002 was conducted using the line-intercept
method for the establishment of sample points.
As Eurasian watermilfoil re-infested Random Lake, the Village has used harvesting and
2-4,D chemical spot treatments to slow the return of Eurasian watermilfoil. Curly-leaf
pondweed (Potamogeton crispus) increased significantly between 1999 and 2002. Long-
173

Random Lake Aquatic Plant Survey, 2005 Page 3
Aron & Associates
term historical data on the aquatic plant community is not available. It is, therefore unclear
if this is a new increase or the continuation of a longer trend.
A re-treatment of Random Lake was conducted in 2005 using fluridone. This survey is the
first post-treatment survey following treatment.
The 2005 treatment was done in spring 2005 while the 1999 treatment was conducted in
fall. It is not yet known if this will influence the results of the treatment.
RESULTS OF THE PRESENT STUDY
A total of 8 aquatic macrophytes were found during the survey in 2005, down from 16
species in 2004. All of the plants were found during the grid survey. No additional species
were located during the general survey even though specific plant beds were searched
for signs of additional pondweeds. Wetland fringe species are not included in the list of
species. It should be noted that large stands of bulrush are present in Random Lake. The
bulrushes were abundant and healthy.
The plants found in the lake in 2005 are listed in Table 2. Chara (Chara sp.) dominated
the plant community, throughout the depths. Water lilies (Nuphar and Nymphaea sp.)
were common in the shallow areas, while sago pondweed (Stuckenia pectinata) was
found in the deeper depths, from 6 to 11 feet deep. Two species were found that had not
been previously identified in Random Lake, small duckweed (Lemna minor) and Nitella
(Nitella sp.). Eleven species found in 2004, could not be located in the 2005 survey,
including two nuisance, exotic species, Eurasian watermilfoil and curly-leaf pondweed.
The results of the survey data for the July 2005 survey for all species at each sample
depth are included at the end of this report.
The maximum rooting depth in 2005 was 13 feet. Sediments in Random Lake range from
sand and gravel to muck. At 1.5 feet the substrate is primarily sand and gravel. At 15
feet the substrate is muck.
Table 1. Hydrographic and Morphometric Data Random Lake
Size of Lake 209 acres
Lake Volume 1279 acre feet
Length of Shoreline 3.6 miles
Maximum Depth 21 feet
Mean Depth 6 feet
Percent of area less than 3 feet deep 14%
Percent of area greater than 20 feet deep 4%
Source: WDNR
174

Random Lake Aquatic Plant Survey, 2005 Page 4
Aron & Associates
Map 1 - Bathymetric Map, Random Lake, Wisconsin.
175

Random Lake Aquatic Plant Survey, 2005 Page 5
Aron & Associates
Map 2 - Line Transect Survey Locations, Random Lake, Wisconsin, 1999.
176

Random Lake Aquatic Plant Survey, 2005 Page 6
Aron & Associates
Map 3 - Point Intercept Survey Sample Points on Random Lake, 2005.
#
#
#
#
#
#
N
1
2
4
5
6
7
8
9
10
11
12
13
14
15
17
18
19
20
21
22
23
24
25
26
27
28
29
30
31
32
33
34
35
36
37
38
39
40
41
42
43
44
45
46
47
48
49
50
51
52
53
54
55
56
57
58
59
60
61
62
63
64
65
66
67
68
69
70
71
72
73
74
75
76
77
78
79
80
81
82
83
84
85
86
87
88
89
90
91
92
93
94
95
96
97
98
99
100
101
102
103
104
105
106
107
108
109
110
111
112
113
114
115
116
117
118
119
120
121
122
123
124
125
126
127
128
129
130
131
132
133
134
135
136
137
138
139
140
141
142
143
144
145
146
3
16
177

Random Lake Aquatic Plant Survey, 2005 Page 7
Aron & Associates
Notes: a Found in only one sample point.
X Found only in the general survey.
WATER QUALITY 2005The water quality on Random Lake was monitored under the Self-Help Volunteer Monitor-
ing Program. The volunteer, Wayne Stroessner, collected the samples following the Self-
Help protocol. Complete results are available on the WDNR website, http://dnr.wi.gov/org/
water/fhp/lakes/lakesdatabase.asp.
Table 3 is a summary of the results for 2005. Table 4 is a comparison of the summary
results for both 2004 and 2005. 2005 data are included in the Appendix.
Table 2. Random Lake Aquatic Plant Species - 1999 to 2005
% Frequency
Species Common Name 1999 2000 2001 2002 2004 2005
Chara sp. Muskgrass, Chara 34 57 43 49 50 64
Elodea canadensis Waterweed 3 1
Lemna minor Small Duckweed 1a
Myriophyllum spicatum Milfoil 60 1a 9 69 8
Najas flexilis Slender Naiad 1 X 2 10
Najas marina Spiny Naid 10 X 13
Nitella sp. Nitella 10
Nuphar advena Yellow Water Lily 5 5 6 7 4 3
Nymphaea sp. White Water Lily 5 5 0 4 2 10
Potamogeton crispus Curly-leaf Pondweed 1 4 19 25 1
P. amplifolius Large-leaf Pondweed 1 3 6
P. Illinoensis Illinois Pondweed 14 18 17 34 8
P. foliosus Leafy Pondweed X 1
P. natans Floating-leaf Pondweed 1 5 5 7 6 5
P. zosterformis Flat-stem Pondweed X 10 7 X
Stuckenia pectinata Sago Pondweed 33 57 48 56 37 12
Utricularia vulgaris Great Bladderwort 1 2 3 9
Vallisneria americana Wild Celery, Eel Grass X X
178

Random Lake Aquatic Plant Survey, 2005 Page 8
Aron & Associates
*Complete data are provided in the Appendix or are available at www.dnr.state.wi.us.
Table 3. Random Lake Water Quality Data Summary for 2005*
Sampling
Date
Secchi
(ft)
Total
Phosphorus
(mg/l)
DO at
surface
(mg/l)
Temp at
surface (oF)
Chlorophyll
A
(ug/l)
5/17/06 7 22 9.93 54.5
5/31/06 4.25 10.89 67.5
6/14/06 5.5 19 7.73 78.6 3.21
6/23/06 5 8.91 75.9
7/8/06 5.25 8.05 75.2
7/28/06 5.75 19 7.44 76.3 7.43
8/10/06 5 6.78 79.2
8/23/06 4.5 23 7.35 73 9.2
9/6/06 3.5 7.95 74.8
9/16/06 4.5 6.23 72
10/1/06 4.5 7.45 61.2
10/17/06 4.25 25 7.81 56.7 9.23
10/26/06 4.25 8.27 48.4
Table 4. Comparison of 2004 and 2005 Water Quality Data on Random Lake
Sampling
Date
Average
Secchi (ft)
Average
Total Phosphorus
(mg/l)
Average Chlorophyll
A
(ug/l)
2004 5.2 26.8 5.2
2005 4.9 21.6 7.3
179

Random Lake Aquatic Plant Survey, 2005 Page 9
Aron & Associates
SUMMARYThe Village of Random Lake has conducted significant aquatic plant management activi-
ties over the years to keep Random Lake open to recreational use. As Eurasian watermil-
foil expanded its range, the management efforts have not always been able to keep pace
with the growth of the exotic plant. A demonstration chemical treatment was conducted
using Sonar in October 1999. Since 2002, the Village has used a combination of harvest-
ing and chemical treatment (using 2,4-D products) to control Eurasian watermilfoil. A sec-
ond Sonar treatment was conducted in spring 2005.
A comparison of 2005 data with the 1999 through 2004 project shows a number of differ-
ences:
— The 2004 and 2005 surveys were done using point-intercept while earlier surveys were
done using the line-transect method.
— Significant differences in frequency over the years are present. The reasons for the
disparity are unclear. It could be simply the difference in sampling protocols used, or other
factors could come into play. Actual reasons are most likely a combination of factors.
— There is significant difference in the lake’s response following the 2005 Sonar treat-
ment to that following the 1999 Sonar treatment. The fall 1999 treatment, conducted at a
higher rate, produced little impact on the native species. The Eurasian watermilfoil treat-
ment in 1999 was not 100%. The spring 2005 treatment was done at a much lower rate,
yet the impact on natives, at least the season of treatment, was significant. Whether that
will result in long term impacts is unknown. The timing of the treatment may have been a
factor in this difference. The native plants may already have started their seasonal growth
when the May 5, 2005 treatment was conducted.
—Clarity and Chlorophyll A concentrations increased from 2004 to 2005 while total phos-
phorus concentrations decreased (Table 4).
180

Random Lake Aquatic Plant Survey, 2005 Page 10
Aron & Associates
REFERENCES
Borman, S, B. Korth, and J. Tempte, 1997. Through the Looking Glass. Wisconsin
Department of Natural Resources, 248 pp.
Crows, G. and C. Hellquist, 2000. Aquatic and Wetland Plants, Vols 1 and 2. University of
Wisconsin Press.
Engel, S., 1989. Lake Use Planning in Local Efforts to Manage Lakes, Wisconsin Depart-
ment of Natural Resources, 5 pp.
Fassett, N.C., 1957. A Manual of Aquatic Plants. University of Wisconsin Press, Madi-
son, 405pp.
Fassett, N.C., 1969. A Manual of Aquatic Plants. University of Wisconsin Press, Madi-
son, 405pp.
Gleason, H.A., 1952. The New Britton and Brown Illustrated Flora of the Northeastern
United States and Adjacent Canada. Hafner Press, 483 pp.
Hoyer, M.V. and D. E. Canfield Jr., eds. 1997. Aquatic Plant Management in Lakes and
Reservoirs. Prepared by the North American Lake Management Society and the Aquatic
Plant Management Society for the US Environmental Protection Agency. 103 pp.
Nichols, S.A. and J. G. Vennie, 1991. Attributes of Wisconsin Lake Plants. University of
Wisconsin-Extension Geological and Natural History Survey, 19 pp.
Nichols, S. A. and Byron M. Shaw, 1986. Ecological Life Histories of the Three Aquatic
Nuisance Plants, Myriophyllum spicatum, Potamogeton crispus, and Elodea canaden-
sis. Hydrobiologia 131, 3-21.
Province of British Colombia, Informational Bulletin, A summary of Biological Research
on Eurasian Water Milfoil in British Colombia. vol. XI, 18 pp.
SePRO. Sonar Guide To Aquatic Habitat Management. SePRO Corporation, 23 pp.
Smith, C.S. and J. W. Barko, 1990, Ecology of Eurasian Watermilfoil. Journal of Aquatic
Plant Management. 28:55-64
Wagner, Kenneth, 1990, Assessing Impacts of Motorized Watercraft on Lakes: Issues
and Perceptions. North American Lake Management Society, 17pp.
Wisconsin Department of Natural Resources, 1985. Aquatic Community Interactions of
Submerged Macrophytes. Technical Bulletin No. 156, Wisconsin Department of Natural
Resources, 79 pp.
181

RANDOM LAKEAquatic Plant Survey
Whole Lake Demonstration Project/AIS Grant - 2006 ReportINTRODUCTIONIn 2003, the Village of Random Lake received an Aquatic Invasive Species Grant from the
Wisconsin Department of Natural Resources (WDNR) to conduct a demonstration whole-
lake chemical treatment on Random Lake. The Grant application included the project
plan upon which the WDNR treatment permit will be based. That plan, and the subse-
quent grant, requires extensive monitoring to be conducted: the year prior to treatment,
the year of treatment, and three years post treatment. The aquatic plant community and
the water quality (Self-Help Volunteer Monitoring Program) are to be monitored.
A local volunteer collected the water quality samples throughout the summer of 2006.
The results are included in this report.
In July of 2006, Aron & Associates conducted the aquatic plant survey on Random Lake.
This survey is part of an ongoing demonstration project to document changes in the
aquatic plant community of Random Lake. This information can be compared with past
studies and may be used by future investigators to determine if the aquatic plant popula-
tion is changing. The impact of various management techniques may be evaluated based
on their respective impacts on the aquatic plants. This information should be used to
guide future lake management decisions on Random Lake.
Random Lake is located in the Village of Random Lake, Sheboygan County, in Southeast
Wisconsin. Hydrographic and morphometric data are presented in Table 2. A map of Ran-
dom Lake showing depth contours is presented in Map 1.
METHODOLOGYGeneral Survey
A preliminary survey of the lake was made by boat. An attempt was made to locate all
plant communities on the lake by region. Nomenclature follows Crow & Hellquist (2000).
No plants samples were collected and preserved since all species found had been col-
lected during previous surveys. The maximum rooting depth on Random Lake in 2006
was determined to be 13.5 feet, that is, no plants were found growing in water deeper
than 13.5 feet.
182

Random Lake Aquatic Plant Survey, 2005 Page 2Aron & Associates
Point Intercept SurveyThe methodology for the point intercept survey was developed by the WDNR Bureau of
Research for the state’s Whole Lake Treatment Protocol. A grid and global positioning
satellite (GPS) coordinates for sampling, were developed by WDNR and provided to Aron
& Associates for use in the Demonstration Whole Lake Treatment Project surveys on
Random Lake.
The initial grid established 146 sample points. Of those, 13 were on land and were elimi-
nated from the list, resulting in 133 sample points.
Samples points were located using a 2004 Garmin GPS LMS330 with an LGC-2000
Receiver. Four rake tows were conducted at each sample point. Each plant species
retrieved was recorded and given a density rating in accordance with the WDNR criteria,
between 1 and 5. The dominant species at each sample point was also identified.
The data collected were then used to the mean density and percent of frequency for each
species. Lake depth at each sample point was determined by using the Garmin after cali-
bration in the field.
The abundance of each species was determined using four estimates:
1) The frequency is the rating of how often a species occurs in the sample points.
2) The average density rating, or the average density of a species in the sample point
where it occurred.
3) The relative density rating, or the average density of a species averaged over all
sample points whether or not any species were present.
4) The relative density rating averaged over all sample points in which any species
occurred.
EARLIER STUDIES
In October 1999, a whole-lake chemical treatment was conducted on Random Lake using
Sonar™ (SePRO Corporation). Eurasian watermilfoil (Myriophyllum spicatum) was the
primary target species. The goal of the project was to eliminate Eurasian watermilfoil,
enhancing conditions for native species. A condition of the WDNR permit for the project
required that aquatic plants in the lake be monitored. Pre-treatment monitoring was con-
ducted in 1999 and continued through 2002. The results of that monitoring are provided in
Table 1. The monitoring in 1999 through 2002 was conducted using the line-intercept
method for the establishment of sample points.
As Eurasian watermilfoil re-infested Random Lake, the Village has used harvesting and
2-4,D chemical spot treatments to slow the return of Eurasian watermilfoil. Curly-leaf
pondweed (Potamogeton crispus) increased significantly between 1999 and 2002. Long-
183

Random Lake Aquatic Plant Survey, 2005 Page 3Aron & Associates
term historical data on the aquatic plant community is not available. It is, therefore unclear
if this is a new increase or the continuation of a longer trend.
A re-treatment of Random Lake was conducted in 2005 using fluridone. This survey is the
second post-treatment survey following treatment.
The 2005 treatment was done in spring 2005 while the 1999 treatment was conducted in
fall. It is not yet known if this will influence the results of the treatment.
RESULTS OF THE PRESENT STUDY
A total of 14 aquatic macrophytes were found during the survey in 2006, up from the 8
found in 2005, but down from 16 species in 2004. Ten of the plants were found during the
grid survey and four were found during the general survey. Wetland fringe species are not
included in the list of species. It should be noted that large stands of bulrush are present
in Random Lake. The bulrushes were abundant and healthy.
The plants found in the lake in 2006 are listed in Table 2. Chara (Chara sp.) and sago
pondweed (Stuckenia pectinata) dominated the plant community, throughout the depths.
Water lilies (Nuphar and Nymphaea sp.) were common in the shallow areas, Two species
were found that had not been previously identified in Random Lake, small duckweed
(Lemna minor) and Nitella (Nitella sp.). Curly-leaf pondweed (P. crispus), an exotic spe-
cies, was found in nine sample points. Eurasian watermilfoil (Myriophyllum spicatum) was
not found in 2006. A native milfoil, whorled watermilfoil (Myriophyllum verticillatum) was
found in one area, on the Northeast side of the lake near the bulrushes.
The results of the survey data for the July 2006 survey for all species at each sample
depth are included at the end of this report.
The maximum rooting depth in 2005 was 13.5 feet. Sediments in Random Lake range
from sand and gravel to muck. At 1.5 feet the substrate is primarily sand and gravel. At
15 feet the substrate is muck.
Table 1. Hydrographic and Morphometric Data Random Lake
Size of Lake 209 acresLake Volume 1279 acre feetLength of Shoreline 3.6 milesMaximum Depth 21 feetMean Depth 6 feetPercent of area less than 3 feet deep 14%Percent of area greater than 20 feet deep 4%
Source: WDNR
184

Random Lake Aquatic Plant Survey, 2005 Page 4Aron & Associates
Map 1 - Bathymetric Map, Random Lake, Wisconsin.
185

Random Lake Aquatic Plant Survey, 2005 Page 5Aron & Associates
Map 2 - Line Transect Survey Locations, Random Lake, Wisconsin, 1999.
186

Random Lake Aquatic Plant Survey, 2005 Page 6Aron & Associates
Map 3 - Point Intercept Survey Sample Points on Random Lake, 2005.
#
#
#
#
#
#
N
1
2
4
5
6
7
8
9
10
11
12
13
14
15
17
18
19
20
21
22
23
24
25
26
27
28
29
30
31
32
33
34
35
36
37
38
39
40
41
42
43
44
45
46
47
48
49
50
51
52
53
54
55
56
57
58
59
60
61
62
63
64
65
66
67
68
69
70
71
72
73
74
75
76
77
78
79
80
81
82
83
84
85
86
87
88
89
90
91
92
93
94
95
96
97
98
99
100
101
102
103
104
105
106
107
108
109
110
111
112
113
114
115
116
117
118
119
120
121
122
123
124
125
126
127
128
129
130
131
132
133
134
135
136
137
138
139
140
141
142
143
144
145
146
3
16
187

Random Lake Aquatic Plant Survey, 2005 Page 7Aron & Associates
Notes: a Found in only one sample point.X Found only in the general survey.
WATER QUALITY 2006The water quality on Random Lake was monitored under the Self-Help Volunteer Monitor-
ing Program. The volunteer, Wayne Stroessner, collected the samples following the Self-
Help protocol. Complete results are available on the WDNR website, http://dnr.wi.gov/org/
water/fhp/lakes/lakesdatabase.asp.
Table 3 is a summary of the results for 2006. Table 4 is a comparison of the summary
results for both 2004, 2005, and 2006. 2006 data are included in the Appendix.
Table 2. Random Lake Aquatic Plant Species - 1999 to 2006
% Frequency
Species 1999 2000 2001 2002 2004 2005 2006
Chara sp. 34 57 43 49 50 64 50
Elodea canadensis 3 1
Lemna minor 1a X
Myriophyllum spicatum 60 1a 9 69 8
Myriophyllum verticillatum X
Najas flexilis 1 X 2 10 2
Najas marina 10 X 13 6
Nitella sp. 10
Nuphar advena 5 5 6 7 4 3 1
Nymphaea sp. 5 5 0 4 2 10 5
Potamogeton crispus 1 4 19 25 1 7
P. amplifolius 1 3 6 X
P. Illinoensis 14 18 17 34 8 X
P. foliosus X 1
P. natans 1 5 5 7 6 5 2
P. zosterformis X 10 7 X
Stuckenia pectinata 33 57 48 56 37 12 40
Utricularia vulgaris 1 2 3 9 1
Vallisneria americana X X
188

Random Lake Aquatic Plant Survey, 2005 Page 8Aron & Associates
*Complete data are provided in the Appendix or are available at www.dnr.state.wi.us.
Table 3. Random Lake Water Quality Data Summary for 2006*
Sampling Date
Secchi(ft)
Total Phosphorus
(mg/l)
DO at surface(mg/l)
Temp at
surface (oF)
Chlorophyll A
(ug/l)
5/29/06 4.25 8 5.55 70.8
6/13/06 3.51 21 7.57 69.9 10.7
6/21/06 3.5 6.51 73.7
6/30/06 3.75 7.98 76.2
7/07/06 3.5 7.92 78.1
7/15/06 4.75 7.03 79.2
7/23/06 3.5 23 6.8 77 8.13
7/31/06 3.51 6.44 81.1
8/16/06 3.75 25 7.11 75.9 7.41
8/24/06 3.75 7.1 74.6
9/01/06 4 6.76 71.9
9/14/06 4.25 6.52 63.7
9/17/06 4 7.48 67.3
9/25/06 4.25 7.31 60.9
10/06/06 4.25 25 7.68 59.8 7.18
10/20/06 5.51 8.21 46
Table 4. Comparison of 2004, 2005, and 2006 Water Quality Data on Random Lake
Sampling Date
Average Secchi (ft)
Average Total Phosphorus
(mg/l)
Average Chlorophyll A
(ug/l)
2004 5.2 26.8 5.2
2005 4.9 21.6 7.3
2006 4.0 20.4 8.4
189

Random Lake Aquatic Plant Survey, 2005 Page 9Aron & Associates
SUMMARYThe Village of Random Lake has conducted significant aquatic plant management activi-
ties over the years to keep Random Lake open to recreational use. As Eurasian watermil-
foil expanded its range, the management efforts have not always been able to keep pace
with the growth of the exotic plant. A demonstration chemical treatment was conducted
using Sonar in October 1999. Since 2002, the Village has used a combination of harvest-
ing and chemical treatment (using 2,4-D products) to control Eurasian watermilfoil. A sec-
ond Sonar treatment was conducted in spring 2005.
A comparison of 2006 plant data with the 1999 through 2005 project shows a number of
differences:
— The 2004, 2005, and 2006 surveys were done using point-intercept while earlier sur-
veys were done using the line-transect method.
— Significant differences in frequency over the years are present. The reasons for the
disparity are unclear. It could be simply the difference in sampling protocols used, or other
factors could come into play. Actual reasons are most likely a combination of factors.
— There is significant difference in the lake’s response following the 2005 Sonar treat-
ment to that following the 1999 Sonar treatment. The fall 1999 treatment, conducted at a
higher rate, produced little impact on the native species. The Eurasian watermilfoil treat-
ment in 1999 was not 100%. The spring 2005 treatment was done at a much lower rate,
yet the impact on natives, at least the season of treatment, was significant. Whether that
will result in long term impacts is unknown. The timing of the treatment may have been a
factor in this difference. The native plants may already have started their seasonal growth
when the May 5, 2005 treatment was conducted.
—More native plant species were found in 2006 than were found in 2005
—Clarity and Chlorophyll A concentrations increased from 2004 to 2006 while total phos-
phorus concentrations decreased (Table 4).
190

Random Lake Aquatic Plant Survey, 2005 Page 10Aron & Associates
REFERENCES
Borman, S, B. Korth, and J. Tempte, 1997. Through the Looking Glass. Wisconsin Department of Natural Resources, 248 pp.
Crows, G. and C. Hellquist, 2000. Aquatic and Wetland Plants, Vols 1 and 2. University of Wisconsin Press.
Engel, S., 1989. Lake Use Planning in Local Efforts to Manage Lakes, Wisconsin Depart-ment of Natural Resources, 5 pp.
Fassett, N.C., 1957. A Manual of Aquatic Plants. University of Wisconsin Press, Madi-son, 405pp.
Fassett, N.C., 1969. A Manual of Aquatic Plants. University of Wisconsin Press, Madi-son, 405pp.
Gleason, H.A., 1952. The New Britton and Brown Illustrated Flora of the Northeastern United States and Adjacent Canada. Hafner Press, 483 pp.
Hoyer, M.V. and D. E. Canfield Jr., eds. 1997. Aquatic Plant Management in Lakes and Reservoirs. Prepared by the North American Lake Management Society and the Aquatic Plant Management Society for the US Environmental Protection Agency. 103 pp.
Nichols, S.A. and J. G. Vennie, 1991. Attributes of Wisconsin Lake Plants. University of Wisconsin-Extension Geological and Natural History Survey, 19 pp.
Nichols, S. A. and Byron M. Shaw, 1986. Ecological Life Histories of the Three Aquatic Nuisance Plants, Myriophyllum spicatum, Potamogeton crispus, and Elodea canaden-sis. Hydrobiologia 131, 3-21.
Province of British Colombia, Informational Bulletin, A summary of Biological Research on Eurasian Water Milfoil in British Colombia. vol. XI, 18 pp.
SePRO. Sonar Guide To Aquatic Habitat Management. SePRO Corporation, 23 pp.
Smith, C.S. and J. W. Barko, 1990, Ecology of Eurasian Watermilfoil. Journal of Aquatic Plant Management. 28:55-64
Wagner, Kenneth, 1990, Assessing Impacts of Motorized Watercraft on Lakes: Issues and Perceptions. North American Lake Management Society, 17pp.
Wisconsin Department of Natural Resources, 1985. Aquatic Community Interactions of Submerged Macrophytes. Technical Bulletin No. 156, Wisconsin Department of Natural Resources, 79 pp.
191
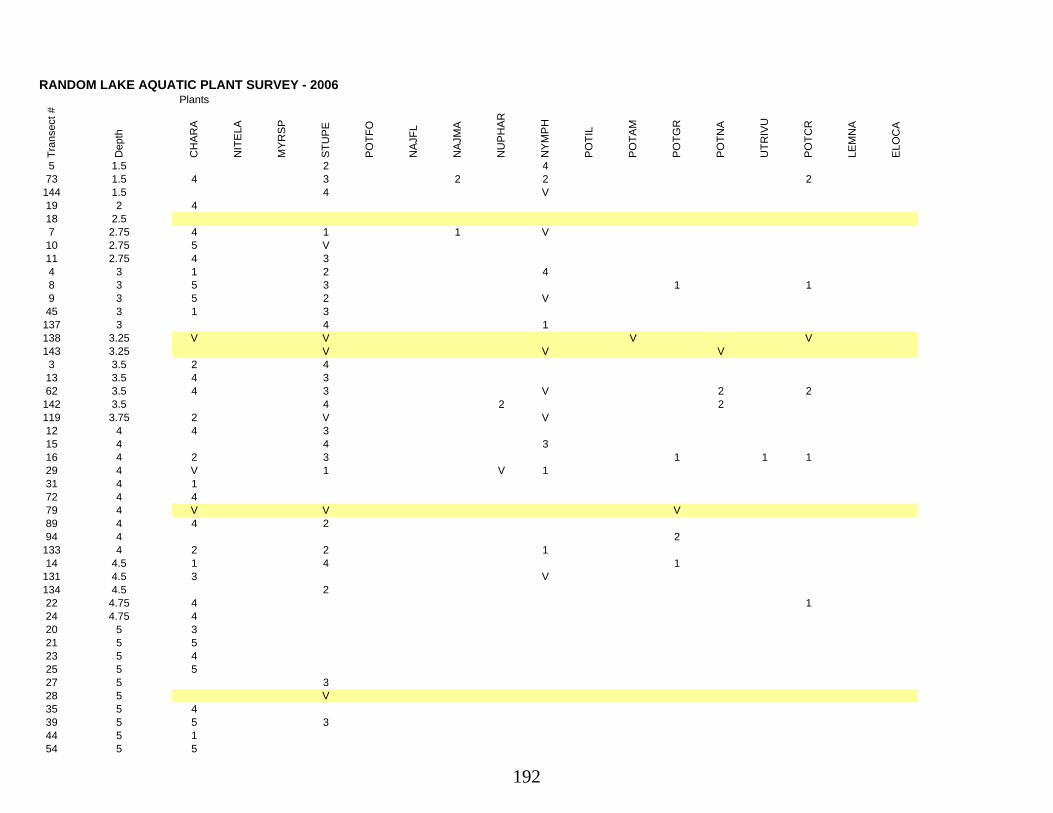
Plants
Tran
sect
#
Dep
th
CH
AR
A
NIT
ELA
MY
RS
P
STU
PE
PO
TFO
NA
JFL
NA
JMA
NU
PH
AR
NY
MP
H
PO
TIL
PO
TAM
PO
TGR
PO
TNA
UTR
IVU
PO
TCR
LEM
NA
ELO
CA
5 1.5 2 473 1.5 4 3 2 2 2
144 1.5 4 V19 2 418 2.57 2.75 4 1 1 V10 2.75 5 V11 2.75 4 34 3 1 2 48 3 5 3 1 19 3 5 2 V45 3 1 3
137 3 4 1138 3.25 V V V V143 3.25 V V V3 3.5 2 413 3.5 4 362 3.5 4 3 V 2 2
142 3.5 4 2 2119 3.75 2 V V12 4 4 315 4 4 316 4 2 3 1 1 129 4 V 1 V 131 4 172 4 479 4 V V V89 4 4 294 4 2
133 4 2 2 114 4.5 1 4 1
131 4.5 3 V134 4.5 222 4.75 4 124 4.75 420 5 321 5 523 5 425 5 527 5 328 5 V35 5 439 5 5 344 5 154 5 5
RANDOM LAKE AQUATIC PLANT SURVEY - 2006
192

Tran
sect
#
Dep
th
CH
AR
A
NIT
ELA
MY
RS
P
STU
PE
PO
TFO
NA
JFL
NA
JMA
NU
PH
AR
NY
MP
H
PO
TIL
PO
TAM
PO
TGR
PO
TNA
UTR
IVU
PO
TCR
LEM
NA
ELO
CA
55 5 361 5 4 470 5 4 277 5 4 1 1
103 5 5118 5 1135 5 5 2 1136 5 4 V38 5.25 540 5.25 4 271 5.25 5 175 5.25 5 2
121 5.25 1 226 5.5 141 5.5 576 5.5 378 5.5 4 1 380 5.5 290 5.5
105 5.5 1 2117 5.75 1 1 334 6 5 236 6 537 6 543 6 3 158 6 4 359 6 4 460 6 5
116 6 5125 6 4 3126 6 1 1 188 6.25 432 6.5 133 6.5 5 2 148 6.5
109 6.5 1 2141 6.5 342 746 753 7 5 293 7 2 3 1
122 7.5 5 3 252 8 2 1
123 8 1 4124 8 4 449 8.2563 8.569 8.75
102 8.75 2 3
193

Tran
sect
#
Dep
th
CH
AR
A
NIT
ELA
MY
RS
P
STU
PE
PO
TFO
NA
JFL
NA
JMA
NU
PH
AR
NY
MP
H
PO
TIL
PO
TAM
PO
TGR
PO
TNA
UTR
IVU
PO
TCR
LEM
NA
ELO
CA
87 9 3115 9127 9 4 4146 9 2 151 9.25
111 9.2547 9.5
139 9.599 10.2550 10.7586 11
101 11 2100 11.25 1108 11.5 4130 12.2595 12.5 V V
114 1385 13.2598 13.25 2
106 13.2568 13.592 14.2584 14.7591 14.7567 15.7566 16.2583 17.75
107 17.7565 18.25
140 1964 19.2581 19.25
128 19.2597 19.5
129 19.5113 19.75112 2096 20.2582 20.51 ON LAND2 ON LAND6 ON LAND17 ON LAND30 ON LAND56 ON LAND V V V V57 ON LAND V V V V74 ON LAND
104 ON LAND110 ON LAND
194

Tran
sect
#
Dep
th
CH
AR
A
NIT
ELA
MY
RS
P
STU
PE
PO
TFO
NA
JFL
NA
JMA
NU
PH
AR
NY
MP
H
PO
TIL
PO
TAM
PO
TGR
PO
TNA
UTR
IVU
PO
TCR
LEM
NA
ELO
CA
120 ON LAND132 ON LAND145 ON LAND
Total Sample Sites (146 - 13 on land) = 133Sample Sites w/ No Plants 44
CH
AR
A
NIT
ELL
A
MY
RS
P
STU
PE
PO
TFO
NA
JFL
NA
JMA
NU
PH
AR
NY
MP
H
PO
TIL
PO
TAM
PO
TGR
PO
TNA
UTR
IVU
PO
TCR
LEM
NA
ELO
CA
Sites found( Frequency) 68 0 0 55 0 2 9 1 9 0 0 5 2 1 10 0 0% Frequency 51.13 0.00 0.00 41.35 0.00 1.50 6.77 0.75 6.77 0.00 0.00 3.76 1.50 0.75 7.52 0.00 0.00 Density (Max = 5) 3.47 #DIV/0! #DIV/0! 2.55 #DIV/0! 1.50 1.56 2.00 1.33 #DIV/0! #DIV/0! 1.60 2.00 1.00 1.00 #DIV/0! #DIV/0!at sites foundRelative Density (Max = 5) 1.77 0.00 0.00 1.05 0.00 0.02 0.11 0.02 0.09 0.00 0.00 0.06 0.03 0.01 0.08 0.00 0.00
Whole Lake
Found Visually V V V V V V V V V
195

Lake Water Quality 2006 Annual Report
Lake Water Quality 2006 Annual Report
RANDOM LAKE Lake Type: DRAINAGE
Sheboygan County DNR Region: SE
Waterbody Number: 30300 GEO Region:SW
Site Name Storet #
RANDOM LAKE - DEEP HOLE 603312
DateSD
(ft)
SD
(m)
Hit
BottomCHL TP
TSI
(SD)
TSI
(CHL)
TSI
(TP)
Lake
LevelClarity Color Perception
05/29/2006 4.25 1.3 N 8 56 44 HIGH CLEAR GREEN 3
06/13/2006 3.5 1.1 N 10.7 21 59 53 52 HIGH MURKY GREEN 3
06/21/2006 3.5 1.1 N 59 HIGH MURKY GREEN 3
06/30/2006 3.75 1.1 N 58 HIGH MURKY GREEN 3
07/07/2006 3.5 1.1 N 59 NORMAL MURKY GREEN 3
07/15/2006 4.75 1.4 N 55 NORMAL MURKY GREEN 3
07/23/2006 3.5 1.1 N 8.13 23 59 51 52 NORMAL MURKY BROWN 3
07/31/2006 3.5 1.1 N 59 NORMAL MURKY BROWN 3
08/16/2006 3.75 1.1 N 7.41 25 58 50 53 LOW MURKY BROWN 3
08/24/2006 3.75 1.1 N 58 LOW MURKY GREEN 3
09/01/2006 4 1.2 N 57 LOW MURKY GREEN 3
09/14/2006 4.25 1.3 N 56 LOW CLEAR GREEN 3
09/17/2006 4 1.2 N 57 LOW MURKY GREEN 3
09/25/2006 4.25 1.3 N 56 NORMAL CLEAR GREEN 3
10/06/2006 4.25 1.3 N 7.18 25 56 50 53 NORMAL CLEAR BROWN 3
10/20/2006 5.5 1.7 N 53 HIGH CLEAR BROWN 3
05/29/2006
Depth Temp. D.O.
FEET DEGREES F mg/l
0 70.8 5.55
2 69.9 6.52
4 69.1 7.25
6 67.5 7.12
8 64.6 7.48
10 62.1 7.31
12 60 6.72
14 58.4 5.71
16 57.4 4.82
18 56.2 1.02
20 55.7 .35
22.2 55.1 .1
06/13/2006
Depth Temp. D.O.
FEET DEGREES F mg/l
0 69.9 7.57
2 69.1 8.01
4 68.5 8.17
6 68.2 8.09
8 67.6 8
10 66.9 7.74
12 65.8 7.35
14 63.1 4
16 59.8 .11
18 57 .02
20 56.1 .01
22 55.5 .01
22.2 55.1 0
06/21/2006
Depth Temp. D.O.
FEET DEGREES F mg/l
0 73.7 6.51
2 73.5 7.16
4 73.3 7.28
6 73.2 7.41
8 72.4 7.13
10 71.3 6.88
12 69.7 6.4
14 64.9 1.62
16 61.3 .14
18 58.8 .08
20 57.4 .06
22 56.4 .04
22.2 56.1 .03
http://prodoasjava.dnr.wi.gov/swims/public/reporting.do...&monitYear=2006&action=run&format=html&stationNo=603312 (1 of 4)8/3/2007 2:41:26 PM
196

Lake Water Quality 2006 Annual Report
06/30/2006
Depth Temp. D.O.
FEET DEGREES F mg/l
0 76.2 7.98
2 75.9 8.08
4 75 8.2
6 74.3 8.26
8 73.3 8.38
10 72.1 7.64
12 70.1 5.54
14 67.5 .59
16 65.1 .1
18 61.5 .07
20 59.2 .06
22 57.5 .04
22.2 56.8 .02
07/07/2006
Depth Temp. D.O.
FEET DEGREES F mg/l
0 78.1 7.92
2 78.1 7.95
4 77.9 8.02
6 77.5 7.99
8 76.6 7.77
10 75.5 6.89
12 74.1 5.41
14 71.2 .9
16 66.7 .07
18 62.6 .06
20 59.8 .03
22 58.4 .02
22.2 57.9 0
07/15/2006
Depth Temp. D.O.
FEET DEGREES F mg/l
0 79.2 7.03
2 78.8 7.16
4 78.4 7.09
6 77.7 7.02
8 76.4 7.03
10 75 6.55
12 73.3 4.94
14 71.3 2.85
16 69.1 .11
18 64.4 .07
20 61 .06
22 59.6 .04
22.2 59 .02
07/23/2006
Depth Temp. D.O.
FEET DEGREES F mg/l
0 77 6.8
2 77 6.86
4 77 6.89
6 76.8 6.89
8 76.8 6.83
10 76.4 6.69
12 75.2 5.73
14 73 1.51
16 68.9 .11
18 66 .11
20 63.1 .14
22 61.7 .16
07/31/2006
Depth Temp. D.O.
FEET DEGREES F mg/l
0 81.1 6.44
2 81 6.56
4 80.4 6.63
6 80.1 6.5
8 79.9 6.3
10 79.3 5.68
12 77.3 3.93
14 74.4 .93
16 70.6 .04
18 67.3 .03
20 64.6 .02
22 62.6 .01
22.1 62.1 .01
08/16/2006
Depth Temp. D.O.
FEET DEGREES F mg/l
0 75.9 7.11
2 75.9 7.13
4 75.5 7.18
6 75.5 7.19
8 75.2 7.17
10 75.2 7.08
12 74.8 6.87
14 74.3 6.93
16 73.2 4.69
18 70.1 .06
20 66 .03
22 63.9 .03
22.1 63 .02
08/24/2006
Depth Temp. D.O.
FEET DEGREES F mg/l
0 74.6 7.1
2 74.4 7.18
4 74.4 7.2
6 74.3 7.17
8 74.1 7.08
10 73.9 6.51
12 73.7 5.91
14 73.3 4.79
16 72.8 3.71
18 71 .04
20 67.6 .02
22 64.9 .01
09/01/2006
Depth Temp. D.O.
FEET DEGREES F mg/l
0 71.9 6.76
2 72.1 6.8
4 72.1 6.82
6 71.9 6.84
8 71.9 6.85
10 71.9 6.84
12 71.9 6.85
14 71.9 6.86
16 71.7 6.8
18 71 5.39
20 69.4 .6
22 67.5 .01
09/14/2006
Depth Temp. D.O.
FEET DEGREES F mg/l
0 63.7 6.52
2 63.3 6.57
4 63 6.65
6 62.8 6.58
8 62.8 6.52
10 62.6 6.43
12 62.6 6.41
14 62.6 6.42
16 62.6 6.36
18 62.4 6.26
20 62.4 5.73
22 62.6 .07
22.1 62.6 .03
http://prodoasjava.dnr.wi.gov/swims/public/reporting.do...&monitYear=2006&action=run&format=html&stationNo=603312 (2 of 4)8/3/2007 2:41:26 PM
197

Lake Water Quality 2006 Annual Report
09/17/2006
Depth Temp. D.O.
FEET DEGREES F mg/l
0 67.3 7.48
2 66.7 7.59
4 66.2 7.55
6 65.3 7.24
8 64 7.29
10 63.7 6.81
12 63.1 6.63
14 62.8 5.9
16 62.8 5.49
18 62.6 5.19
20 62.4 4.48
22 62.4 .09
22.1 62.4 .05
09/25/2006
Depth Temp. D.O.
FEET DEGREES F mg/l
0 60.9 7.31
2 60.7 7.38
4 60.7 7.45
6 60.7 7.51
8 60.5 7.54
10 60.5 7.55
12 60.5 7.55
14 60.3 7.52
16 60.3 7.49
18 60.1 7.43
20 60 7.31
22 60 .13
22.1 59.8 .05
10/06/2006
Depth Temp. D.O.
FEET DEGREES F mg/l
0 59.8 7.68
2 59.8 7.72
4 59.8 7.78
6 58.6 7.9
8 58.6 7.9
10 58.4 7.8
12 58.4 7.72
14 58.3 7.74
16 58.3 7.64
18 58.1 7.5
20 57.9 7.43
22 57.9 .16
22.2 58.1 .03
10/20/2006
Depth Temp. D.O.
FEET DEGREES F mg/l
0 46 8.21
2 46 8.32
4 46 8.38
6 46 8.45
8 46 8.48
10 46 8.52
12 46 8.53
14 46 8.55
16 46 8.56
18 46 8.55
20 46.2 8.49
22 46.2 6.1
22.2 46.6 .2
Date Collector Comments
06/21/2006 Fish (small) between 10-14'; Sprigs of curly leaf pondweed; pH=7; Satellite day; pH = 7.0
06/30/2006 Fish between 10-15'; much curly leaf- broad leaf and Sago pondweeds- much Chara; heavy traffic on lake;
pH = 6.8; (1 day after Satellite day
07/07/2006 Fish between 11-13'; much debris at surface (Potamogeton sprigs + grasslike leaves (not Aphanazomena);
clumps of filamentous algae appox. 30 cm diam; Satellite day; pH - 6.8
07/15/2006 Fish between 10-18'; much Sago pondweed; Satellite day; pH = 7.1
07/23/2006 Fish between 9-19'; much Sago pondweed; warm weather; Chlorophyll + Phosphorus samples sent; Satellite
day; pH = 6.9
07/31/2006 Fish between 10-18'; mostly Sago Pondweed; hot weather; Satellite day; pH = 7.3
08/16/2006 Fish between 7-17'; residents have asked for spraying of weeds - much Potamegeton but no Eurasian Water
Milfoil; warm- dry-but cool nights; Satellite day; pH = 7.0; Chlorophyll + Phosphorus samples sent in;
08/24/2006 Fish between 7-17'; many pondweed varieties; Satellite day; pH = 6.9; low water level - deepest point = 22'
09/01/2006 Fish between 9-18'; Satellite day; pondweed going to seed + turning brown however- at north end - still
green; pondweed spikes above water surface; one "whorled" water milfoil plant discovered on 8/25/06; pH =
7.1; low water- bottom = 22'
09/14/2006 Fish between 10-19'; mostly Sago and other pondweed abundant; pH = 7.1
http://prodoasjava.dnr.wi.gov/swims/public/reporting.do...&monitYear=2006&action=run&format=html&stationNo=603312 (3 of 4)8/3/2007 2:41:26 PM
198

Lake Water Quality 2006 Annual Report
09/17/2006 Fish between 6-17'; satellite day; no visible Eurasian Water Milfoil - same as rest of summer; pH = 6.9
09/25/2006 Fish between 11-19'; much Sago Pondweed 6-12" below surface; Village piers removed at park; maple
leaves turning red; Satellite day; pH = 7.1
10/06/2006 Fish between 9-19'; Sago Pondweed not as apparent + not at surface; Canada Geese population is high
(maybe migration); Phosphorus + Chlorophyll samples sent in; pH = 6.9; D.O. is very good down to 20'; no
temmperature stratification since Sept 14th
10/20/2006 Fish between 9-15'; Mudhens migrating thru; new sprouts of Lily Pads + Cattails; Rushes = brown;
Pondweeds = deep; good traveling + fishing
Date Lab Comments
05/29/2006 METHOD BLANK EXCEEDED LOD CRITERIA
Date Data Collectors Project
05/29/2006 Wayne Stroessner CLMN AT RANDOM LAKE; DEEP HOLE
06/13/2006 Wayne Stroessner CLMN AT RANDOM LAKE; DEEP HOLE
06/21/2006 Wayne Stroessner CLMN AT RANDOM LAKE; DEEP HOLE
06/30/2006 Wayne Stroessner CLMN AT RANDOM LAKE; DEEP HOLE
07/07/2006 Wayne Stroessner CLMN AT RANDOM LAKE; DEEP HOLE
07/15/2006 Wayne Stroessner CLMN AT RANDOM LAKE; DEEP HOLE
07/23/2006 Wayne Stroessner CLMN AT RANDOM LAKE; DEEP HOLE
07/31/2006 Wayne Stroessner CLMN AT RANDOM LAKE; DEEP HOLE
08/16/2006 Wayne Stroessner CLMN AT RANDOM LAKE; DEEP HOLE
08/24/2006 Wayne Stroessner CLMN AT RANDOM LAKE; DEEP HOLE
09/01/2006 Wayne Stroessner CLMN AT RANDOM LAKE; DEEP HOLE
09/14/2006 Wayne Stroessner CLMN AT RANDOM LAKE; DEEP HOLE
09/17/2006 Wayne Stroessner CLMN AT RANDOM LAKE; DEEP HOLE
09/25/2006 Wayne Stroessner CLMN AT RANDOM LAKE; DEEP HOLE
10/06/2006 Wayne Stroessner CLMN AT RANDOM LAKE; DEEP HOLE
10/20/2006 Wayne Stroessner CLMN AT RANDOM LAKE; DEEP HOLE
SD = Secchi depth measured in feet converted to meters; Chl = Chlorophyll a in micrograms per liter(ug/l); TP = Total
phosphorus in ug/l, surface sample only; TSI(SD), TSI(CHL), TSI(TP) = Trophic state index based on SD, CHL, TP
respectively; Depth measured in feet.
Wisconsin Department of Natural Resources Wisconsin Lakes Partnership
Report Generated: 08/03/2007
Last Revised: Thursday January 18 2007
dnr.wi.gov
The Official Internet Site for the Wisconsin Department of Natural Resources
101 S. Webster Street . PO Box 7921 . Madison, Wisconsin 53707-7921 . 608.266.2621
Legal Notices and Disclaimers | Accessibility Notice | Site Requirements
Employment | Feedback | Site Map
http://prodoasjava.dnr.wi.gov/swims/public/reporting.do...&monitYear=2006&action=run&format=html&stationNo=603312 (4 of 4)8/3/2007 2:41:26 PM
199

Secchi Graph
RANDOM LAKE Lake Type: DRAINAGE
Sheboygan County DNR Region: SE
Waterbody Number: 30300 GEO Region:SW
Avg
July-
Aug
Secchi
Depth
(ft)
5
10
15
20
25
30
35
40
3
1987
3
1988
7
1989
7
1990
6
1991
5
1992
6
1993
6
1994
7
1995
4
1999
3
2000
3
2001
6
2002
4
2003
5
2004
5
2005
4
2006
Past secchi averages in feet (July and August only). Report Generated: 08/03/2007
Last Revised: Thursday January 18 2007
dnr.wi.gov
The Official Internet Site for the Wisconsin Department of Natural Resources
101 S. Webster Street . PO Box 7921 . Madison, Wisconsin 53707-7921 . 608.266.2621
Legal Notices and Disclaimers | Accessibility Notice | Site Requirements
Employment | Feedback | Site Map
http://prodoasjava.dnr.wi.gov/swims/public/reporting.do?report=11&action=run&format=html&stationNo=6033128/3/2007 2:40:36 PM
200

TSI Graph
Trophic State Index Graph
Hypereutrophic
100
90
80
70
Eutrophic60
50
Mesotrophic 40
Oligotrophic
30
20
10
0
1985 1986 1987 1988 1989 1990 1991 1992 1993 1994 1995 1997 1999 2000 2001 2002 2003 2004 2005 2006 2007
Monitoring Station: RANDOM LAKE - DEEP HOLE, Sheboygan County
Past Summer (July-August) Trophic State Index (TSI) averages.
= Secchi = Chlorophyll = Total Phosphorus
TSI(Chl) = TSI(TP) = TSI(Sec) It is likely that algae dominate light attenuation.
TSI(Chl) > TSI(Sec) Large particulates, such as Aphanizomenon flakes dominate
TSI(TP) = TSI(Sec) > TSI(Chl) Non-algal particulate or color dominate light attenuation
TSI(Sec) = TSI(Chl) >= TSI(TP) The algae biomass in your lake is limited by phosphorus
TSI(TP) > TSI(Chl) = TSI(Sec)Zooplankton grazing, nitrogen, or some factor other than phosphorus is limiting
algae biomass
TSI TSI Description
TSI < 30Classical oligotrophy: clear water, many algal species, oxygen throughout the year in bottom water, cold
water, oxygen-sensitive fish species in deep lakes. Excellent water quality.
TSI 30-40Deeper lakes still oligotrophic, but bottom water of some shallower lakes will become oxygen-depleted
during the summer.
TSI 40-50Water moderately clear, but increasing chance of low dissolved oxygen in deep water during the
summer.
TSI 50-60Lakes becoming eutrophic: decreased clarity, fewer algal species, oxygen-depleted bottom waters
during the summer, plant overgrowth evident, warm-water fisheries (pike, perch, bass, etc.) only.
TSI 60-70Blue-green algae become dominant and algal scums are possible, extensive plant overgrowth problems
possible.
TSI 70-80Becoming very eutrophic. Heavy algal blooms possible throughout summer, dense plant beds, but
extent limited by light penetration (blue-green algae block sunlight).
http://prodoasjava.dnr.wi.gov/swims/public/reporting.do?report=33&action=run&format=html&stationNo=603312 (1 of 2)8/3/2007 2:41:09 PM
201

TSI Graph
TSI > 80 Algal scums, summer fishkills, few plants, rough fish dominant. Very poor water quality.
Trophic state index (TSI) is determined using a mathematical formula (Wisconsin has its own version). The TSI is a
score from 0 to 110, with lakes that are less fertile having a low TSI. We base the overall TSI on the Chlorophyll TSI
when we have Chlorophyll data. If we don't have chemistry data, we use TSI Secchi. We do this rather than averaging,
because the TSI is used to predict biomass. This makes chlorophyll the best indicator. Visit Bob Carlson's website,
dipin.kent.edu/tsi.htm, for more info.
dnr.wi.gov
The Official Internet Site for the Wisconsin Department of Natural Resources
101 S. Webster Street . PO Box 7921 . Madison, Wisconsin 53707-7921 . 608.266.2621
Legal Notices and Disclaimers | Accessibility Notice | Site Requirements
Employment | Feedback | Site Map
http://prodoasjava.dnr.wi.gov/swims/public/reporting.do?report=33&action=run&format=html&stationNo=603312 (2 of 2)8/3/2007 2:41:09 PM
202

RANDOM LAKEAquatic Plant Survey
Whole Lake Demonstration Project/AIS Grant - 2008 and Final Report
INTRODUCTIONIn 2003, the Village of Random Lake received an Aquatic Invasive Species Grant from the
Wisconsin Department of Natural Resources (WDNR) to conduct a demonstration whole-
lake chemical treatment on Random Lake. The Grant application included the project
plan upon which the WDNR treatment permit will be based. That plan, and the subse-
quent grant, requires extensive monitoring to be conducted: the year prior to treatment,
the year of treatment, and three years post treatment. The aquatic plant community and
the water quality (Self-Help Volunteer Monitoring Program) are to be monitored.
A local volunteer collected the water quality samples throughout the summer of 2008.
The results are included in this report.
In July of 2008, Aron & Associates conducted the aquatic plant survey on Random Lake.
This survey is part of an ongoing demonstration project to document changes in the
aquatic plant community of Random Lake. This information can be compared with past
studies and may be used by future investigators to determine if the aquatic plant popula-
tion is changing. The impact of various management techniques may be evaluated based
on their respective impacts on the aquatic plants. This information should be used to
guide future lake management decisions on Random Lake.
Random Lake is located in the Village of Random Lake, Sheboygan County, in Southeast
Wisconsin. Hydrographic and morphometric data are presented in Table 2. A map of Ran-
dom Lake showing depth contours is presented in Map 3.
METHODOLOGYGeneral Survey
A preliminary survey of the lake was made by boat. An attempt was made to locate all
plant communities on the lake by region. Nomenclature follows Crow & Hellquist (2000).
No plants samples were collected and preserved since all species found had been col-
lected during previous surveys. The maximum rooting depth on Random Lake in 2008
was determined to be 13 feet, that is, no plants were found growing in water deeper than
11 feet. This is an improvement from the 11 feet maximum rooting depth in 2007.
203

Random Lake Aquatic Plant Survey, 2008 Page 2Aron & Associates
Point Intercept Survey
The methodology for the point intercept survey was developed by the WDNR Bureau of
Research for the state’s Whole Lake Treatment Protocol. A grid and global positioning
satellite (GPS) coordinates for sampling, were developed by WDNR and provided to Aron
& Associates for use in the Demonstration Whole Lake Treatment Project surveys on
Random Lake.
The initial grid established 146 sample points. Of those, 13 were on land and were elimi-
nated from the list, resulting in 133 sample points. In 2008, because of the high water lev-
els, one sample point was inundated and had aquatic plants present.
Samples points were located using a 2004 Garmin GPS LMS330 with an LGC-2000
Receiver. Four rake tows were conducted at each sample point. Each plant species
retrieved was recorded and given a density rating in accordance with the current WDNR
criteria, between 1 and 3. The dominant species at each sample point was also identified.
The data collected were then used to the mean density and percent of frequency for each
species. Lake depth at each sample point was determined by using the Garmin after cali-
bration in the field.
The abundance of each species was determined using four estimates:
1) The frequency is the rating of how often a species occurs in the sample points.
2) The average density rating, or the average density of a species in the sample point
where it occurred.
3) The relative density rating, or the average density of a species averaged over all
sample points whether or not any species were present.
4) The relative density rating averaged over all sample points in which any species
occurred.
EARLIER STUDIES
In October 1999, a whole-lake chemical treatment was conducted on Random Lake using
Sonar™ (SePRO Corporation). Eurasian watermilfoil (Myriophyllum spicatum) was the
primary target species. The goal of the project was to eliminate Eurasian watermilfoil,
enhancing conditions for native species. A condition of the WDNR permit for the project
required that aquatic plants in the lake be monitored. Pre-treatment monitoring was con-
ducted in 1999 and continued through 2002. The results of that monitoring are provided in
Table 1. The monitoring in 1999 through 2002 was conducted using the line-intercept
method for the establishment of sample points.
204

Random Lake Aquatic Plant Survey, 2008 Page 3Aron & Associates
As Eurasian watermilfoil re-infested Random Lake, the Village used harvesting and 2-4,D
chemical spot treatments to slow the return of Eurasian watermilfoil. Curly-leaf pondweed
(Potamogeton crispus) increased significantly between 1999 and 2002. Long-term histor-
ical data on the aquatic plant community is not available. A second whole-lake treatment
of Random Lake was conducted in 2005 using Sonar (active ingredient, fluridone). This
survey is the third post-treatment survey following treatment.
The 2005 treatment was conducted in spring 2005 while the 1999 treatment was con-
ducted in fall. It is not yet known if this will influence the results of the treatment.
RESULTS OF THE 2008 SURVEY
A total of 12 aquatic macrophytes were found during the survey in 2008, similar to that
seen in 2006 and 2007 (Table 2). Eleven of the plants were found during the grid survey
and one was found during the general survey. Wetland fringe species are not included in
the list of species. It should be noted that large stands of bulrush are present in Random
Lake. In 2008, the bulrushes were abundant and healthy.
The plants found in the lake in 2008 are listed in Table 2. Chara (Chara sp.), sago pond-
weed (Stuckenia pectinata), and spiny naiad (Najas marina) dominated the plant commu-
nity, throughout the depths. Water lilies (Nuphar and Nymphaea sp.) were common in the
shallow areas. Curly-leaf pondweed (P. crispus), an exotic species, was not found in
2008. Eurasian watermilfoil (Myriophyllum spicatum) was found throughout the lake in
2008 (Map 1). It should be expected that because of its distribution in the lake, Eurasian
watermilfoil will continue its spread throughout the lake unless aggressive control mea-
sures are undertaken. A native milfoil, whorled watermilfoil (Myriophyllum verticillatum)
was found in one area, on the Northeast side of the lake near the bulrushes (Map 2).
2008 was a very unusual year, with record rains in June and high water levels through
July. High water levels and runoff that contributed to more suspended sediment, may
have influenced the plant growth of various species throughout the region, including that
on Random Lake.
205

Random Lake Aquatic Plant Survey, 2008 Page 4Aron & Associates
Map 1 - Location of Re-Infestation of Eurasian Watermilfoil, July 2008
206

Random Lake Aquatic Plant Survey, 2008 Page 5Aron & Associates
Map 2 - Location of Whorled Watermilfoil, 2008
The results of the survey data for the July 2008 survey for all species at each sample
depth are included at the end of this report.
The maximum rooting depth in 2008 was 13 feet. Sediments in Random Lake range from
sand and gravel to muck. At 1.5 feet the substrate is primarily sand and gravel. At 15 feet
the substrate is muck.
Area with Whorled watermilfoil (native)
207

Random Lake Aquatic Plant Survey, 2008 Page 6Aron & Associates
Table 1. Hydrographic and Morphometric Data Random Lake
Size of Lake 209 acresLake Volume 1279 acre feetLength of Shoreline 3.6 milesMaximum Depth 21 feetMean Depth 6 feetPercent of area less than 3 feet deep 14%Percent of area greater than 20 feet deep 4%
Source: WDNR
Map 3 - Bathymetric Map, Random Lake, Wisconsin.
208

Random Lake Aquatic Plant Survey, 2008 Page 7Aron & Associates
Map 4 - Line Transect Survey Locations, Random Lake, Wisconsin, 1999.
209

Random Lake Aquatic Plant Survey, 2008 Page 8Aron & Associates
Map 5 - Point Intercept Survey Sample Points on Random Lake, 2005-2008.
#
#
#
#
#
#
N
1
2
4
5
6
7
8
9
10
11
12
13
14
15
17
18
19
20
21
22
23
24
25
26
27
28
29
30
31
32
33
34
35
36
37
38
39
40
41
42
43
44
45
46
47
48
49
50
51
52
53
54
55
56
57
58
59
60
61
62
63
64
65
66
67
68
69
70
71
72
73
74
75
76
77
78
79
80
81
82
83
84
85
86
87
88
89
90
91
92
93
94
95
96
97
98
99
100
101
102
103
104
105
106
107
108
109
110
111
112
113
114
115
116
117
118
119
120
121
122
123
124
125
126
127
128
129
130
131
132
133
134
135
136
137
138
139
140
141
142
143
144
145
146
3
16
210

Random Lake Aquatic Plant Survey, 2008 Page 9Aron & Associates
Notes: a Found in only one sample point.b Fall 1999 whole lake treatment.c Spring 2005 whole lake treatment.X Found only in the general survey.
Table 2. Random Lake Aquatic Plant Species - 1999 to 2008
% Frequency
Species 1999b 2000 2001 2002 2004 2005c 2006 2007 2008
Chara sp. 34 57 43 49 50 64 50 56 53
Elodea canadensis 3 1
Lemna minor 1a X X
Myriophyllum spicatum
60 1a 9 69 8 X 5
Myriophyllum verticillatum
X X X
Najas flexilis 1 X 2 10 2 2 2
Najas marina 10 X 13 6 11 20
Nitella sp. 10
Nuphar advena 5 5 6 7 4 3 1 X 2
Nymphaea sp. 5 5 0 4 2 10 5 1 1
Potamogeton crispus
1 4 19 25 1 7 6
P. amplifolius 1 3 6 X 3 1
P. Illinoensis 14 18 17 34 8 X 1 9
P. foliosus X 1
P. natans 1 5 5 7 6 5 2 1 1
P. zosterformis X 10 7 X
Stuckenia pectinata 33 57 48 56 37 12 40 32 27
Utricularia vulgaris 1 2 3 9 1 4 8
Vallisneria americana
X X
Total Species 12 8 11 16 16 7 13 14 12
211

Random Lake Aquatic Plant Survey, 2008 Page 10Aron & Associates
WATER QUALITY 2008The water quality on Random Lake was monitored under the Self-Help Volunteer Monitor-
ing Program. The volunteer, Wayne Stroessner, collected the samples following the Self-
Help protocol. Complete results are provided in the appendix and are available on the
WDNR website, http://dnr.wi.gov.
Random Lake is considered eutrophic, with decreased clarity, warm-water fisheries, oxy-
gen-depleted bottom waters during summer, dense plant growth.
*Complete 2008 report is provided in the Appendix or are available at
www.dnr.state.wi.us.
Table 3. Random Lake Water Quality Data Summary for 2008*
Sampling Date
Secchi(ft)
Total Phosphorus
(mg/l)
DO at surface(mg/l)
Temp at
surface (oF)
Chlorophyll A
(ug/l)
5/09/08 4.25 6.8 60
5/28/08 3.5 6.76 63
6/18/08 3.25 33 5.43
7/21/08 17 .98
8/05/08 4 11.46 79
8/13/08 3.75 22 12 74 9.55
8/21/08 4.25 11.06 74
8/29/08 3.75 11.95 76
9/06/08 4.25 9.29 70
9/15/08 4.5 9.88 65
9/22/08 5 11.6 70
9/30/08 5.5
10/11/08 6.25
212

Random Lake Aquatic Plant Survey, 2008 Page 11Aron & Associates
SUMMARYThe Village of Random Lake has conducted significant aquatic plant management activi-
ties over the years to keep Random Lake open to recreational use. As Eurasian watermil-
foil expanded its range, the management efforts have not always been able to keep pace
with the growth of the exotic plant. A demonstration chemical treatment was conducted
using Sonar in October 1999. Since 2002, the Village has used a combination of harvest-
ing and chemical treatment (using 2,4-D products) to control Eurasian watermilfoil. A sec-
ond Sonar treatment was conducted in spring 2005.
An analysis of 2008 plant data from the 1999 through 2007 project shows a number of dif-
ferences:
— The 2004 through 2008 surveys were done using point-intercept while earlier surveys
were done using the line-transect method.
— Significant differences in frequency over the years are present. The reasons for the
disparity are unclear. It could be simply the difference in sampling protocols used, or
other factors could come into play, such as weather, treatments, etc. Actual reasons
are most likely a combination of factors.
— There is significant difference in the lake’s response following the 2005 Sonar treat-
ment to that following the 1999 Sonar treatment. The fall 1999 treatment, conducted
at a higher rate, produced significant impact on native species immediately after treat-
ment, but showed little impact long term as plants species increased 4 years post-tra-
etment.
— The Eurasian watermilfoil treatment in 1999 was not 100% successful, but the spring
2005 treatment appeared to be.
— The spring 2005 treatment was done at a much lower rate yet the impact on natives,
the season of treatment was significant.
Table 4. Comparison of 2004 through 2008 Water Quality Data on Random Lake
Sampling Date
Average Secchi (ft)
Average Total Phosphorus
(mg/l)
Average Chlorophyll A(ug/l)
2004 5.2 26.8 5.2
2005 4.9 21.6 7.3
2006 4.0 20.4 8.4
2007 3.89 24.5 9.5
2008 3.9 24 5.32
213

Random Lake Aquatic Plant Survey, 2008 Page 12Aron & Associates
— The number of plant species has returned to the pre-1999 treatment levels, but not
the pre-2005 treatment level. Whether that will result in long term impacts is unknown.
The timing of the treatment may have been a factor in this difference. The native
plants may already have started their seasonal growth when the May 5, 2005 treat-
ment was conducted.
— Fewer native plant species were found in 2008 than were found in 2005 survey follow-
ing the whole-lake treatment.
— Water clarity continues to be poor with a low of 3.25 feet and a high of 6.25 feet in
2008.
— Random Lake stratifies during the summer months, with the bottom waters, usually
those below 14-15 feet, being anoxic (devoid of oxygen).
— Eurasian watermilfoil has re-entered the lake even though spot treatments were con-
ducted in 2007 and 2008. Fragments were found throughout the lake during the sur-
vey, and were reported frequently by the volunteer monitor.
— After the fall 1999 treatment, there was a significant amount of Eurasian watermilfoil
back in the lake in 2002, while after the spring 2005 treatment Eurasian watermilfoil
was just beginning to spread throughout the lake in 2008.
— The Village should aggressively locate and chemically treat Eurasian watermilfoil
early in the season, as early as May 1 to May 15. This would allow control while the
plant biomass is low and before susceptible native species such as bladderwort begin
to grow. The treatment should be done as soon as the plants are showing signs of
active growth. The treatment should cover the areas identified in 2008 and any other
areas where Eurasian watermilfoil was found by the end of 2008. The North end of
the lake and the public boat launch and beach should be thoroughly checked and
treated.
DEFINITION OF A PROJECT’S SUCCESSHow one perceives whether or not a project is successful depends upon one’s perspec-
tive. A skier or swimmer may not like aquatic plants to the surface and will deem an erad-
ication successful. An angler may consider any plant beneficial and will deem a Eurasian
watermilfoil eradication of Eurasian watermilfoil a failure.
On Potters Lake, an early whole-lake treatment for Eurasian watemilfoil was considered
by WDNR to be unsuccessful because the number of plant species failed to increase
post-treatment. What was unknown going in to the project was whether there was ever
much diversity in the lake that might rebound. The community considered the treatment a
huge success because recreational opportunities improved, plant debris declined and the
community saved ten’s of thousands of dollars in plant management funds which they
used to fund wetland acquisitions.
Going into this multi-year project on Random Lake, much discussion took place on how to
better define success. WDNR set forth the following criteria to use to evaluate the suc-
214

Random Lake Aquatic Plant Survey, 2008 Page 13Aron & Associates
cess. These criteria are all based on the lake resource, and not on the communities qual-
ity-of-life considerations.
WDNR Criteria for Success
1 There shall be a reduction in the Eurasian watermilfoil frequency and/or density
from pretreatment survey conditions until August 2007.
2 There shall be no net reductions (+/-20%) in the frequency and or density of the
native plant community, with the exception of Elodea sp. and Najas sp.
3 There shall be no documented overall negative impacts to the fish population or
other aquatic organisms either directly or indirectly related to the use of herbi-
cides in the lake.
4 There shall be no reductions (+/-20%) in water quality trends throughout the
study.
Evaluation of the criteria
1. Eurasian watermilfoil has dropped post treatment regardless of which year starting
point is used (Table 2).
2. Using number of native species (16), minus Elodea and Najas (2), in 2004 as a start-
ing point (14), means up to a shift of +/-2.8 species is allowable. In 2006, and 2007
there were 13 and 14 species respectively. In 2008, there were 12 species, for a drop
of 15%.
3. There were no documented overall negative impacts to the fish or other aquatic organ-
isms reported.
4. Two of the water quality parameters, total phosphorus and Chlorophyll A improved or
remained the same post treatment. Water clarity, measured by a Secchi disk, dropped
from 5.2 to 3.9 feet, approximately 25% reduction. Graph 1 shows the Trophic State
Index for Random Lake from 1985 through 2008
Determination
Based on all four criteria, the project met or exceeded the expectations in all but a single
portion of one criteria, the secchi disk measurements. This project has been successful in
reducing the significant problems caused by Eurasian watermilfoil in Random Lake.
The DNR permit (which includes the evaluation criteria), the aquatic plant data, and the
water quality report for 2008, are included in the Appendix.
215

Random Lake Aquatic Plant Survey, 2008 Page 14Aron & Associates
Graph 1 - Trophic State Index, Random Lake, 1985 through 2008.
Trophic State Index Graph
Hypereutrophic
100908070
Eutrophic6050
Mesotrophic 40
Oligotrophic
3020100
1985 1986 1987 1988 1989 1990 1991 1992 1993 1994 1995 1997 1999 2000 2001 2002 2003 2004 2005 2006 2007 200899
= Secchi = Chlorophyll = Total Phosphorus
Fall 1999 TreatmentSpring 2005 Treatment
22
216

Random Lake Aquatic Plant Survey, 2008 Page 15Aron & Associates
REFERENCES
Borman, S, B. Korth, and J. Tempte, 1997. Through the Looking Glass. Wisconsin Department of Natural Resources, 248 pp.
Crows, G. and C. Hellquist, 2000. Aquatic and Wetland Plants, Vols 1 and 2. University of Wisconsin Press.
Engel, S., 1989. Lake Use Planning in Local Efforts to Manage Lakes, Wisconsin Depart-ment of Natural Resources, 5 pp.
Fassett, N.C., 1957. A Manual of Aquatic Plants. University of Wisconsin Press, Madi-son, 405pp.
Fassett, N.C., 1969. A Manual of Aquatic Plants. University of Wisconsin Press, Madi-son, 405pp.
Gleason, H.A., 1952. The New Britton and Brown Illustrated Flora of the Northeastern United States and Adjacent Canada. Hafner Press, 483 pp.
Hoyer, M.V. and D. E. Canfield Jr., eds. 1997. Aquatic Plant Management in Lakes and Reservoirs. Prepared by the North American Lake Management Society and the Aquatic Plant Management Society for the US Environmental Protection Agency. 103 pp.
Nichols, S.A. and J. G. Vennie, 1991. Attributes of Wisconsin Lake Plants. University of Wisconsin-Extension Geological and Natural History Survey, 19 pp.
Nichols, S. A. and Byron M. Shaw, 1986. Ecological Life Histories of the Three Aquatic Nuisance Plants, Myriophyllum spicatum, Potamogeton crispus, and Elodea canaden-sis. Hydrobiologia 131, 3-21.
Province of British Colombia, Informational Bulletin, A summary of Biological Research on Eurasian Water Milfoil in British Colombia. vol. XI, 18 pp.
SePRO. Sonar Guide To Aquatic Habitat Management. SePRO Corporation, 23 pp.
Smith, C.S. and J. W. Barko, 1990, Ecology of Eurasian Watermilfoil. Journal of Aquatic Plant Management. 28:55-64
Wagner, Kenneth, 1990, Assessing Impacts of Motorized Watercraft on Lakes: Issues and Perceptions. North American Lake Management Society, 17pp.
Wisconsin Department of Natural Resources, 1985. Aquatic Community Interactions of Submerged Macrophytes. Technical Bulletin No. 156, Wisconsin Department of Natural Resources, 79 pp.
217

218

219

220

221

222

223

224

225

226

227

228

229

230

231

232

233

234

235

236

237

238

239

RANDOM LAKE
Aquatic Plant Survey
Whole Lake Demonstration Project/AIS Grant - 2005 Report
INTRODUCTIONIn 2003, the Village of Random Lake received an Aquatic Invasive Species Grant from the
Wisconsin Department of Natural Resources (WDNR) to conduct a demonstration whole-
lake chemical treatment on Random Lake. The Grant application included the project
plan upon which the WDNR treatment permit will be based. That plan, and the subse-
quent grant, requires extensive monitoring to be conducted: the year prior to treatment,
the year of treatment, and three years post treatment. The aquatic plant community and
the water quality (Self-Help Volunteer Monitoring Program) are to be monitored.
A local volunteer collected the water quality samples throughout the summer of 2005.
The results are included in this report.
In July of 2005, Aron & Associates conducted the aquatic plant survey on Random Lake.
This survey is part of an ongoing demonstration project to document changes in the
aquatic plant community of Random Lake. This information can be compared with past
studies and may be used by future investigators to determine if the aquatic plant popula-
tion is changing. The impact of various management techniques may be evaluated based
on their respective impacts on the aquatic plants. This information should be used to
guide future lake management decisions on Random Lake.
Random Lake is located in the Village of Random Lake, Sheboygan County, in Southeast
Wisconsin. Hydrographic and morphometric data are presented in Table 2. A map of Ran-
dom Lake showing depth contours is presented in Map 1.
METHODOLOGYGeneral Survey
A preliminary survey of the lake was made by boat. An attempt was made to locate all
plant communities on the lake by region. Nomenclature follows Crow & Hellquist (2000).
No plants samples were collected and preserved since all species found had been col-
lected during previous surveys. The maximum rooting depth on Random Lake in 2005
was determined to be 13 feet, that is, no plants were found growing in water deeper than
13 feet.
240

Random Lake Aquatic Plant Survey, 2005 Page 2
Aron & Associates
Point Intercept Survey
The methodology for the point intercept survey was developed by the WDNR Bureau of
Research for the state’s Whole Lake Treatment Protocol. A grid and global positioning
satellite (GPS) coordinates for sampling, were developed by WDNR and provided to Aron
& Associates for use in the Demonstration Whole Lake Treatment Project surveys on
Random Lake.
The initial grid established 146 sample points. Of those, 13 were on land and were elimi-
nated from the list, resulting in 133 sample points.
Samples points were located using a 2004 Garmin GPS LMS330 with an LGC-2000
Receiver. Four rake tows were conducted at each sample point. Each plant species
retrieved was recorded and given a density rating in accordance with the WDNR criteria,
between 1 and 5. The dominant species at each sample point was also identified.
The data collected were then used to the mean density and percent of frequency for each
species. Lake depth at each sample point was determined by using the Garmin after cali-
bration in the field.
The abundance of each species was determined using four estimates:
1) The frequency is the rating of how often a species occurs in the sample points.
2) The average density rating, or the average density of a species in the sample point
where it occurred.
3) The relative density rating, or the average density of a species averaged over all
sample points whether or not any species were present.
4) The relative density rating averaged over all sample points in which any species
occurred.
EARLIER STUDIES
In October 1999, a whole-lake chemical treatment was conducted on Random Lake using
Sonar™ (SePRO Corporation). Eurasian watermilfoil (Myriophyllum spicatum) was the
primary target species. The goal of the project was to eliminate Eurasian watermilfoil,
enhancing conditions for native species. A condition of the WDNR permit for the project
required that aquatic plants in the lake be monitored. Pre-treatment monitoring was con-
ducted in 1999 and continued through 2002. The results of that monitoring are provided in
Table 1. The monitoring in 1999 through 2002 was conducted using the line-intercept
method for the establishment of sample points.
As Eurasian watermilfoil re-infested Random Lake, the Village has used harvesting and
2-4,D chemical spot treatments to slow the return of Eurasian watermilfoil. Curly-leaf
pondweed (Potamogeton crispus) increased significantly between 1999 and 2002. Long-
241

Random Lake Aquatic Plant Survey, 2005 Page 3
Aron & Associates
term historical data on the aquatic plant community is not available. It is, therefore unclear
if this is a new increase or the continuation of a longer trend.
A re-treatment of Random Lake was conducted in 2005 using fluridone. This survey is the
first post-treatment survey following treatment.
The 2005 treatment was done in spring 2005 while the 1999 treatment was conducted in
fall. It is not yet known if this will influence the results of the treatment.
RESULTS OF THE PRESENT STUDY
A total of 8 aquatic macrophytes were found during the survey in 2005, down from 16
species in 2004. All of the plants were found during the grid survey. No additional species
were located during the general survey even though specific plant beds were searched
for signs of additional pondweeds. Wetland fringe species are not included in the list of
species. It should be noted that large stands of bulrush are present in Random Lake. The
bulrushes were abundant and healthy.
The plants found in the lake in 2005 are listed in Table 2. Chara (Chara sp.) dominated
the plant community, throughout the depths. Water lilies (Nuphar and Nymphaea sp.)
were common in the shallow areas, while sago pondweed (Stuckenia pectinata) was
found in the deeper depths, from 6 to 11 feet deep. Two species were found that had not
been previously identified in Random Lake, small duckweed (Lemna minor) and Nitella
(Nitella sp.). Eleven species found in 2004, could not be located in the 2005 survey,
including two nuisance, exotic species, Eurasian watermilfoil and curly-leaf pondweed.
The results of the survey data for the July 2005 survey for all species at each sample
depth are included at the end of this report.
The maximum rooting depth in 2005 was 13 feet. Sediments in Random Lake range from
sand and gravel to muck. At 1.5 feet the substrate is primarily sand and gravel. At 15
feet the substrate is muck.
Table 1. Hydrographic and Morphometric Data Random Lake
Size of Lake 209 acres
Lake Volume 1279 acre feet
Length of Shoreline 3.6 miles
Maximum Depth 21 feet
Mean Depth 6 feet
Percent of area less than 3 feet deep 14%
Percent of area greater than 20 feet deep 4%
Source: WDNR
242

Random Lake Aquatic Plant Survey, 2005 Page 4
Aron & Associates
Map 1 - Bathymetric Map, Random Lake, Wisconsin.
243

Random Lake Aquatic Plant Survey, 2005 Page 5
Aron & Associates
Map 2 - Line Transect Survey Locations, Random Lake, Wisconsin, 1999.
244

Random Lake Aquatic Plant Survey, 2005 Page 6
Aron & Associates
Map 3 - Point Intercept Survey Sample Points on Random Lake, 2005.
#
#
#
#
#
#
N
1
2
4
5
6
7
8
9
10
11
12
13
14
15
17
18
19
20
21
22
23
24
25
26
27
28
29
30
31
32
33
34
35
36
37
38
39
40
41
42
43
44
45
46
47
48
49
50
51
52
53
54
55
56
57
58
59
60
61
62
63
64
65
66
67
68
69
70
71
72
73
74
75
76
77
78
79
80
81
82
83
84
85
86
87
88
89
90
91
92
93
94
95
96
97
98
99
100
101
102
103
104
105
106
107
108
109
110
111
112
113
114
115
116
117
118
119
120
121
122
123
124
125
126
127
128
129
130
131
132
133
134
135
136
137
138
139
140
141
142
143
144
145
146
3
16
245

Random Lake Aquatic Plant Survey, 2005 Page 7
Aron & Associates
Notes: a Found in only one sample point.
X Found only in the general survey.
WATER QUALITY 2005The water quality on Random Lake was monitored under the Self-Help Volunteer Monitor-
ing Program. The volunteer, Wayne Stroessner, collected the samples following the Self-
Help protocol. Complete results are available on the WDNR website, http://dnr.wi.gov/org/
water/fhp/lakes/lakesdatabase.asp.
Table 3 is a summary of the results for 2005. Table 4 is a comparison of the summary
results for both 2004 and 2005. 2005 data are included in the Appendix.
Table 2. Random Lake Aquatic Plant Species - 1999 to 2005
% Frequency
Species Common Name 1999 2000 2001 2002 2004 2005
Chara sp. Muskgrass, Chara 34 57 43 49 50 64
Elodea canadensis Waterweed 3 1
Lemna minor Small Duckweed 1a
Myriophyllum spicatum Milfoil 60 1a 9 69 8
Najas flexilis Slender Naiad 1 X 2 10
Najas marina Spiny Naid 10 X 13
Nitella sp. Nitella 10
Nuphar advena Yellow Water Lily 5 5 6 7 4 3
Nymphaea sp. White Water Lily 5 5 0 4 2 10
Potamogeton crispus Curly-leaf Pondweed 1 4 19 25 1
P. amplifolius Large-leaf Pondweed 1 3 6
P. Illinoensis Illinois Pondweed 14 18 17 34 8
P. foliosus Leafy Pondweed X 1
P. natans Floating-leaf Pondweed 1 5 5 7 6 5
P. zosterformis Flat-stem Pondweed X 10 7 X
Stuckenia pectinata Sago Pondweed 33 57 48 56 37 12
Utricularia vulgaris Great Bladderwort 1 2 3 9
Vallisneria americana Wild Celery, Eel Grass X X
246

Random Lake Aquatic Plant Survey, 2005 Page 8
Aron & Associates
*Complete data are provided in the Appendix or are available at www.dnr.state.wi.us.
Table 3. Random Lake Water Quality Data Summary for 2005*
Sampling
Date
Secchi
(ft)
Total
Phosphorus
(mg/l)
DO at
surface
(mg/l)
Temp at
surface (oF)
Chlorophyll
A
(ug/l)
5/17/06 7 22 9.93 54.5
5/31/06 4.25 10.89 67.5
6/14/06 5.5 19 7.73 78.6 3.21
6/23/06 5 8.91 75.9
7/8/06 5.25 8.05 75.2
7/28/06 5.75 19 7.44 76.3 7.43
8/10/06 5 6.78 79.2
8/23/06 4.5 23 7.35 73 9.2
9/6/06 3.5 7.95 74.8
9/16/06 4.5 6.23 72
10/1/06 4.5 7.45 61.2
10/17/06 4.25 25 7.81 56.7 9.23
10/26/06 4.25 8.27 48.4
Table 4. Comparison of 2004 and 2005 Water Quality Data on Random Lake
Sampling
Date
Average
Secchi (ft)
Average
Total Phosphorus
(mg/l)
Average Chlorophyll
A
(ug/l)
2004 5.2 26.8 5.2
2005 4.9 21.6 7.3
247

Random Lake Aquatic Plant Survey, 2005 Page 9
Aron & Associates
SUMMARYThe Village of Random Lake has conducted significant aquatic plant management activi-
ties over the years to keep Random Lake open to recreational use. As Eurasian watermil-
foil expanded its range, the management efforts have not always been able to keep pace
with the growth of the exotic plant. A demonstration chemical treatment was conducted
using Sonar in October 1999. Since 2002, the Village has used a combination of harvest-
ing and chemical treatment (using 2,4-D products) to control Eurasian watermilfoil. A sec-
ond Sonar treatment was conducted in spring 2005.
A comparison of 2005 data with the 1999 through 2004 project shows a number of differ-
ences:
— The 2004 and 2005 surveys were done using point-intercept while earlier surveys were
done using the line-transect method.
— Significant differences in frequency over the years are present. The reasons for the
disparity are unclear. It could be simply the difference in sampling protocols used, or other
factors could come into play. Actual reasons are most likely a combination of factors.
— There is significant difference in the lake’s response following the 2005 Sonar treat-
ment to that following the 1999 Sonar treatment. The fall 1999 treatment, conducted at a
higher rate, produced little impact on the native species. The Eurasian watermilfoil treat-
ment in 1999 was not 100%. The spring 2005 treatment was done at a much lower rate,
yet the impact on natives, at least the season of treatment, was significant. Whether that
will result in long term impacts is unknown. The timing of the treatment may have been a
factor in this difference. The native plants may already have started their seasonal growth
when the May 5, 2005 treatment was conducted.
—Clarity and Chlorophyll A concentrations increased from 2004 to 2005 while total phos-
phorus concentrations decreased (Table 4).
248

Random Lake Aquatic Plant Survey, 2005 Page 10
Aron & Associates
REFERENCES
Borman, S, B. Korth, and J. Tempte, 1997. Through the Looking Glass. Wisconsin
Department of Natural Resources, 248 pp.
Crows, G. and C. Hellquist, 2000. Aquatic and Wetland Plants, Vols 1 and 2. University of
Wisconsin Press.
Engel, S., 1989. Lake Use Planning in Local Efforts to Manage Lakes, Wisconsin Depart-
ment of Natural Resources, 5 pp.
Fassett, N.C., 1957. A Manual of Aquatic Plants. University of Wisconsin Press, Madi-
son, 405pp.
Fassett, N.C., 1969. A Manual of Aquatic Plants. University of Wisconsin Press, Madi-
son, 405pp.
Gleason, H.A., 1952. The New Britton and Brown Illustrated Flora of the Northeastern
United States and Adjacent Canada. Hafner Press, 483 pp.
Hoyer, M.V. and D. E. Canfield Jr., eds. 1997. Aquatic Plant Management in Lakes and
Reservoirs. Prepared by the North American Lake Management Society and the Aquatic
Plant Management Society for the US Environmental Protection Agency. 103 pp.
Nichols, S.A. and J. G. Vennie, 1991. Attributes of Wisconsin Lake Plants. University of
Wisconsin-Extension Geological and Natural History Survey, 19 pp.
Nichols, S. A. and Byron M. Shaw, 1986. Ecological Life Histories of the Three Aquatic
Nuisance Plants, Myriophyllum spicatum, Potamogeton crispus, and Elodea canaden-
sis. Hydrobiologia 131, 3-21.
Province of British Colombia, Informational Bulletin, A summary of Biological Research
on Eurasian Water Milfoil in British Colombia. vol. XI, 18 pp.
SePRO. Sonar Guide To Aquatic Habitat Management. SePRO Corporation, 23 pp.
Smith, C.S. and J. W. Barko, 1990, Ecology of Eurasian Watermilfoil. Journal of Aquatic
Plant Management. 28:55-64
Wagner, Kenneth, 1990, Assessing Impacts of Motorized Watercraft on Lakes: Issues
and Perceptions. North American Lake Management Society, 17pp.
Wisconsin Department of Natural Resources, 1985. Aquatic Community Interactions of
Submerged Macrophytes. Technical Bulletin No. 156, Wisconsin Department of Natural
Resources, 79 pp.
249

RANDOM LAKEAquatic Plant Survey
Whole Lake Demonstration Project/AIS Grant - 2006 ReportINTRODUCTIONIn 2003, the Village of Random Lake received an Aquatic Invasive Species Grant from the
Wisconsin Department of Natural Resources (WDNR) to conduct a demonstration whole-
lake chemical treatment on Random Lake. The Grant application included the project
plan upon which the WDNR treatment permit will be based. That plan, and the subse-
quent grant, requires extensive monitoring to be conducted: the year prior to treatment,
the year of treatment, and three years post treatment. The aquatic plant community and
the water quality (Self-Help Volunteer Monitoring Program) are to be monitored.
A local volunteer collected the water quality samples throughout the summer of 2006.
The results are included in this report.
In July of 2006, Aron & Associates conducted the aquatic plant survey on Random Lake.
This survey is part of an ongoing demonstration project to document changes in the
aquatic plant community of Random Lake. This information can be compared with past
studies and may be used by future investigators to determine if the aquatic plant popula-
tion is changing. The impact of various management techniques may be evaluated based
on their respective impacts on the aquatic plants. This information should be used to
guide future lake management decisions on Random Lake.
Random Lake is located in the Village of Random Lake, Sheboygan County, in Southeast
Wisconsin. Hydrographic and morphometric data are presented in Table 2. A map of Ran-
dom Lake showing depth contours is presented in Map 1.
METHODOLOGYGeneral Survey
A preliminary survey of the lake was made by boat. An attempt was made to locate all
plant communities on the lake by region. Nomenclature follows Crow & Hellquist (2000).
No plants samples were collected and preserved since all species found had been col-
lected during previous surveys. The maximum rooting depth on Random Lake in 2006
was determined to be 13.5 feet, that is, no plants were found growing in water deeper
than 13.5 feet.
250

Random Lake Aquatic Plant Survey, 2005 Page 2Aron & Associates
Point Intercept SurveyThe methodology for the point intercept survey was developed by the WDNR Bureau of
Research for the state’s Whole Lake Treatment Protocol. A grid and global positioning
satellite (GPS) coordinates for sampling, were developed by WDNR and provided to Aron
& Associates for use in the Demonstration Whole Lake Treatment Project surveys on
Random Lake.
The initial grid established 146 sample points. Of those, 13 were on land and were elimi-
nated from the list, resulting in 133 sample points.
Samples points were located using a 2004 Garmin GPS LMS330 with an LGC-2000
Receiver. Four rake tows were conducted at each sample point. Each plant species
retrieved was recorded and given a density rating in accordance with the WDNR criteria,
between 1 and 5. The dominant species at each sample point was also identified.
The data collected were then used to the mean density and percent of frequency for each
species. Lake depth at each sample point was determined by using the Garmin after cali-
bration in the field.
The abundance of each species was determined using four estimates:
1) The frequency is the rating of how often a species occurs in the sample points.
2) The average density rating, or the average density of a species in the sample point
where it occurred.
3) The relative density rating, or the average density of a species averaged over all
sample points whether or not any species were present.
4) The relative density rating averaged over all sample points in which any species
occurred.
EARLIER STUDIES
In October 1999, a whole-lake chemical treatment was conducted on Random Lake using
Sonar™ (SePRO Corporation). Eurasian watermilfoil (Myriophyllum spicatum) was the
primary target species. The goal of the project was to eliminate Eurasian watermilfoil,
enhancing conditions for native species. A condition of the WDNR permit for the project
required that aquatic plants in the lake be monitored. Pre-treatment monitoring was con-
ducted in 1999 and continued through 2002. The results of that monitoring are provided in
Table 1. The monitoring in 1999 through 2002 was conducted using the line-intercept
method for the establishment of sample points.
As Eurasian watermilfoil re-infested Random Lake, the Village has used harvesting and
2-4,D chemical spot treatments to slow the return of Eurasian watermilfoil. Curly-leaf
pondweed (Potamogeton crispus) increased significantly between 1999 and 2002. Long-
251

Random Lake Aquatic Plant Survey, 2005 Page 3Aron & Associates
term historical data on the aquatic plant community is not available. It is, therefore unclear
if this is a new increase or the continuation of a longer trend.
A re-treatment of Random Lake was conducted in 2005 using fluridone. This survey is the
second post-treatment survey following treatment.
The 2005 treatment was done in spring 2005 while the 1999 treatment was conducted in
fall. It is not yet known if this will influence the results of the treatment.
RESULTS OF THE PRESENT STUDY
A total of 14 aquatic macrophytes were found during the survey in 2006, up from the 8
found in 2005, but down from 16 species in 2004. Ten of the plants were found during the
grid survey and four were found during the general survey. Wetland fringe species are not
included in the list of species. It should be noted that large stands of bulrush are present
in Random Lake. The bulrushes were abundant and healthy.
The plants found in the lake in 2006 are listed in Table 2. Chara (Chara sp.) and sago
pondweed (Stuckenia pectinata) dominated the plant community, throughout the depths.
Water lilies (Nuphar and Nymphaea sp.) were common in the shallow areas, Two species
were found that had not been previously identified in Random Lake, small duckweed
(Lemna minor) and Nitella (Nitella sp.). Curly-leaf pondweed (P. crispus), an exotic spe-
cies, was found in nine sample points. Eurasian watermilfoil (Myriophyllum spicatum) was
not found in 2006. A native milfoil, whorled watermilfoil (Myriophyllum verticillatum) was
found in one area, on the Northeast side of the lake near the bulrushes.
The results of the survey data for the July 2006 survey for all species at each sample
depth are included at the end of this report.
The maximum rooting depth in 2005 was 13.5 feet. Sediments in Random Lake range
from sand and gravel to muck. At 1.5 feet the substrate is primarily sand and gravel. At
15 feet the substrate is muck.
Table 1. Hydrographic and Morphometric Data Random Lake
Size of Lake 209 acresLake Volume 1279 acre feetLength of Shoreline 3.6 milesMaximum Depth 21 feetMean Depth 6 feetPercent of area less than 3 feet deep 14%Percent of area greater than 20 feet deep 4%
Source: WDNR
252

Random Lake Aquatic Plant Survey, 2005 Page 4Aron & Associates
Map 1 - Bathymetric Map, Random Lake, Wisconsin.
253

Random Lake Aquatic Plant Survey, 2005 Page 5Aron & Associates
Map 2 - Line Transect Survey Locations, Random Lake, Wisconsin, 1999.
254

Random Lake Aquatic Plant Survey, 2005 Page 6Aron & Associates
Map 3 - Point Intercept Survey Sample Points on Random Lake, 2005.
#
#
#
#
#
#
N
1
2
4
5
6
7
8
9
10
11
12
13
14
15
17
18
19
20
21
22
23
24
25
26
27
28
29
30
31
32
33
34
35
36
37
38
39
40
41
42
43
44
45
46
47
48
49
50
51
52
53
54
55
56
57
58
59
60
61
62
63
64
65
66
67
68
69
70
71
72
73
74
75
76
77
78
79
80
81
82
83
84
85
86
87
88
89
90
91
92
93
94
95
96
97
98
99
100
101
102
103
104
105
106
107
108
109
110
111
112
113
114
115
116
117
118
119
120
121
122
123
124
125
126
127
128
129
130
131
132
133
134
135
136
137
138
139
140
141
142
143
144
145
146
3
16
255

Random Lake Aquatic Plant Survey, 2005 Page 7Aron & Associates
Notes: a Found in only one sample point.X Found only in the general survey.
WATER QUALITY 2006The water quality on Random Lake was monitored under the Self-Help Volunteer Monitor-
ing Program. The volunteer, Wayne Stroessner, collected the samples following the Self-
Help protocol. Complete results are available on the WDNR website, http://dnr.wi.gov/org/
water/fhp/lakes/lakesdatabase.asp.
Table 3 is a summary of the results for 2006. Table 4 is a comparison of the summary
results for both 2004, 2005, and 2006. 2006 data are included in the Appendix.
Table 2. Random Lake Aquatic Plant Species - 1999 to 2006
% Frequency
Species 1999 2000 2001 2002 2004 2005 2006
Chara sp. 34 57 43 49 50 64 50
Elodea canadensis 3 1
Lemna minor 1a X
Myriophyllum spicatum 60 1a 9 69 8
Myriophyllum verticillatum X
Najas flexilis 1 X 2 10 2
Najas marina 10 X 13 6
Nitella sp. 10
Nuphar advena 5 5 6 7 4 3 1
Nymphaea sp. 5 5 0 4 2 10 5
Potamogeton crispus 1 4 19 25 1 7
P. amplifolius 1 3 6 X
P. Illinoensis 14 18 17 34 8 X
P. foliosus X 1
P. natans 1 5 5 7 6 5 2
P. zosterformis X 10 7 X
Stuckenia pectinata 33 57 48 56 37 12 40
Utricularia vulgaris 1 2 3 9 1
Vallisneria americana X X
256

Random Lake Aquatic Plant Survey, 2005 Page 8Aron & Associates
*Complete data are provided in the Appendix or are available at www.dnr.state.wi.us.
Table 3. Random Lake Water Quality Data Summary for 2006*
Sampling Date
Secchi(ft)
Total Phosphorus
(mg/l)
DO at surface(mg/l)
Temp at
surface (oF)
Chlorophyll A
(ug/l)
5/29/06 4.25 8 5.55 70.8
6/13/06 3.51 21 7.57 69.9 10.7
6/21/06 3.5 6.51 73.7
6/30/06 3.75 7.98 76.2
7/07/06 3.5 7.92 78.1
7/15/06 4.75 7.03 79.2
7/23/06 3.5 23 6.8 77 8.13
7/31/06 3.51 6.44 81.1
8/16/06 3.75 25 7.11 75.9 7.41
8/24/06 3.75 7.1 74.6
9/01/06 4 6.76 71.9
9/14/06 4.25 6.52 63.7
9/17/06 4 7.48 67.3
9/25/06 4.25 7.31 60.9
10/06/06 4.25 25 7.68 59.8 7.18
10/20/06 5.51 8.21 46
Table 4. Comparison of 2004, 2005, and 2006 Water Quality Data on Random Lake
Sampling Date
Average Secchi (ft)
Average Total Phosphorus
(mg/l)
Average Chlorophyll A
(ug/l)
2004 5.2 26.8 5.2
2005 4.9 21.6 7.3
2006 4.0 20.4 8.4
257

Random Lake Aquatic Plant Survey, 2005 Page 9Aron & Associates
SUMMARYThe Village of Random Lake has conducted significant aquatic plant management activi-
ties over the years to keep Random Lake open to recreational use. As Eurasian watermil-
foil expanded its range, the management efforts have not always been able to keep pace
with the growth of the exotic plant. A demonstration chemical treatment was conducted
using Sonar in October 1999. Since 2002, the Village has used a combination of harvest-
ing and chemical treatment (using 2,4-D products) to control Eurasian watermilfoil. A sec-
ond Sonar treatment was conducted in spring 2005.
A comparison of 2006 plant data with the 1999 through 2005 project shows a number of
differences:
— The 2004, 2005, and 2006 surveys were done using point-intercept while earlier sur-
veys were done using the line-transect method.
— Significant differences in frequency over the years are present. The reasons for the
disparity are unclear. It could be simply the difference in sampling protocols used, or other
factors could come into play. Actual reasons are most likely a combination of factors.
— There is significant difference in the lake’s response following the 2005 Sonar treat-
ment to that following the 1999 Sonar treatment. The fall 1999 treatment, conducted at a
higher rate, produced little impact on the native species. The Eurasian watermilfoil treat-
ment in 1999 was not 100%. The spring 2005 treatment was done at a much lower rate,
yet the impact on natives, at least the season of treatment, was significant. Whether that
will result in long term impacts is unknown. The timing of the treatment may have been a
factor in this difference. The native plants may already have started their seasonal growth
when the May 5, 2005 treatment was conducted.
—More native plant species were found in 2006 than were found in 2005
—Clarity and Chlorophyll A concentrations increased from 2004 to 2006 while total phos-
phorus concentrations decreased (Table 4).
258

Random Lake Aquatic Plant Survey, 2005 Page 10Aron & Associates
REFERENCES
Borman, S, B. Korth, and J. Tempte, 1997. Through the Looking Glass. Wisconsin Department of Natural Resources, 248 pp.
Crows, G. and C. Hellquist, 2000. Aquatic and Wetland Plants, Vols 1 and 2. University of Wisconsin Press.
Engel, S., 1989. Lake Use Planning in Local Efforts to Manage Lakes, Wisconsin Depart-ment of Natural Resources, 5 pp.
Fassett, N.C., 1957. A Manual of Aquatic Plants. University of Wisconsin Press, Madi-son, 405pp.
Fassett, N.C., 1969. A Manual of Aquatic Plants. University of Wisconsin Press, Madi-son, 405pp.
Gleason, H.A., 1952. The New Britton and Brown Illustrated Flora of the Northeastern United States and Adjacent Canada. Hafner Press, 483 pp.
Hoyer, M.V. and D. E. Canfield Jr., eds. 1997. Aquatic Plant Management in Lakes and Reservoirs. Prepared by the North American Lake Management Society and the Aquatic Plant Management Society for the US Environmental Protection Agency. 103 pp.
Nichols, S.A. and J. G. Vennie, 1991. Attributes of Wisconsin Lake Plants. University of Wisconsin-Extension Geological and Natural History Survey, 19 pp.
Nichols, S. A. and Byron M. Shaw, 1986. Ecological Life Histories of the Three Aquatic Nuisance Plants, Myriophyllum spicatum, Potamogeton crispus, and Elodea canaden-sis. Hydrobiologia 131, 3-21.
Province of British Colombia, Informational Bulletin, A summary of Biological Research on Eurasian Water Milfoil in British Colombia. vol. XI, 18 pp.
SePRO. Sonar Guide To Aquatic Habitat Management. SePRO Corporation, 23 pp.
Smith, C.S. and J. W. Barko, 1990, Ecology of Eurasian Watermilfoil. Journal of Aquatic Plant Management. 28:55-64
Wagner, Kenneth, 1990, Assessing Impacts of Motorized Watercraft on Lakes: Issues and Perceptions. North American Lake Management Society, 17pp.
Wisconsin Department of Natural Resources, 1985. Aquatic Community Interactions of Submerged Macrophytes. Technical Bulletin No. 156, Wisconsin Department of Natural Resources, 79 pp.
259

Plants
Tran
sect
#
Dep
th
CH
AR
A
NIT
ELA
MY
RS
P
STU
PE
PO
TFO
NA
JFL
NA
JMA
NU
PH
AR
NY
MP
H
PO
TIL
PO
TAM
PO
TGR
PO
TNA
UTR
IVU
PO
TCR
LEM
NA
ELO
CA
5 1.5 2 473 1.5 4 3 2 2 2
144 1.5 4 V19 2 418 2.57 2.75 4 1 1 V10 2.75 5 V11 2.75 4 34 3 1 2 48 3 5 3 1 19 3 5 2 V45 3 1 3
137 3 4 1138 3.25 V V V V143 3.25 V V V3 3.5 2 413 3.5 4 362 3.5 4 3 V 2 2
142 3.5 4 2 2119 3.75 2 V V12 4 4 315 4 4 316 4 2 3 1 1 129 4 V 1 V 131 4 172 4 479 4 V V V89 4 4 294 4 2
133 4 2 2 114 4.5 1 4 1
131 4.5 3 V134 4.5 222 4.75 4 124 4.75 420 5 321 5 523 5 425 5 527 5 328 5 V35 5 439 5 5 344 5 154 5 5
RANDOM LAKE AQUATIC PLANT SURVEY - 2006
260

Tran
sect
#
Dep
th
CH
AR
A
NIT
ELA
MY
RS
P
STU
PE
PO
TFO
NA
JFL
NA
JMA
NU
PH
AR
NY
MP
H
PO
TIL
PO
TAM
PO
TGR
PO
TNA
UTR
IVU
PO
TCR
LEM
NA
ELO
CA
55 5 361 5 4 470 5 4 277 5 4 1 1
103 5 5118 5 1135 5 5 2 1136 5 4 V38 5.25 540 5.25 4 271 5.25 5 175 5.25 5 2
121 5.25 1 226 5.5 141 5.5 576 5.5 378 5.5 4 1 380 5.5 290 5.5
105 5.5 1 2117 5.75 1 1 334 6 5 236 6 537 6 543 6 3 158 6 4 359 6 4 460 6 5
116 6 5125 6 4 3126 6 1 1 188 6.25 432 6.5 133 6.5 5 2 148 6.5
109 6.5 1 2141 6.5 342 746 753 7 5 293 7 2 3 1
122 7.5 5 3 252 8 2 1
123 8 1 4124 8 4 449 8.2563 8.569 8.75
102 8.75 2 3
261

Tran
sect
#
Dep
th
CH
AR
A
NIT
ELA
MY
RS
P
STU
PE
PO
TFO
NA
JFL
NA
JMA
NU
PH
AR
NY
MP
H
PO
TIL
PO
TAM
PO
TGR
PO
TNA
UTR
IVU
PO
TCR
LEM
NA
ELO
CA
87 9 3115 9127 9 4 4146 9 2 151 9.25
111 9.2547 9.5
139 9.599 10.2550 10.7586 11
101 11 2100 11.25 1108 11.5 4130 12.2595 12.5 V V
114 1385 13.2598 13.25 2
106 13.2568 13.592 14.2584 14.7591 14.7567 15.7566 16.2583 17.75
107 17.7565 18.25
140 1964 19.2581 19.25
128 19.2597 19.5
129 19.5113 19.75112 2096 20.2582 20.51 ON LAND2 ON LAND6 ON LAND17 ON LAND30 ON LAND56 ON LAND V V V V57 ON LAND V V V V74 ON LAND
104 ON LAND110 ON LAND
262

Tran
sect
#
Dep
th
CH
AR
A
NIT
ELA
MY
RS
P
STU
PE
PO
TFO
NA
JFL
NA
JMA
NU
PH
AR
NY
MP
H
PO
TIL
PO
TAM
PO
TGR
PO
TNA
UTR
IVU
PO
TCR
LEM
NA
ELO
CA
120 ON LAND132 ON LAND145 ON LAND
Total Sample Sites (146 - 13 on land) = 133Sample Sites w/ No Plants 44
CH
AR
A
NIT
ELL
A
MY
RS
P
STU
PE
PO
TFO
NA
JFL
NA
JMA
NU
PH
AR
NY
MP
H
PO
TIL
PO
TAM
PO
TGR
PO
TNA
UTR
IVU
PO
TCR
LEM
NA
ELO
CA
Sites found( Frequency) 68 0 0 55 0 2 9 1 9 0 0 5 2 1 10 0 0% Frequency 51.13 0.00 0.00 41.35 0.00 1.50 6.77 0.75 6.77 0.00 0.00 3.76 1.50 0.75 7.52 0.00 0.00 Density (Max = 5) 3.47 #DIV/0! #DIV/0! 2.55 #DIV/0! 1.50 1.56 2.00 1.33 #DIV/0! #DIV/0! 1.60 2.00 1.00 1.00 #DIV/0! #DIV/0!at sites foundRelative Density (Max = 5) 1.77 0.00 0.00 1.05 0.00 0.02 0.11 0.02 0.09 0.00 0.00 0.06 0.03 0.01 0.08 0.00 0.00
Whole Lake
Found Visually V V V V V V V V V
263

Lake Water Quality 2006 Annual Report
Lake Water Quality 2006 Annual Report
RANDOM LAKE Lake Type: DRAINAGE
Sheboygan County DNR Region: SE
Waterbody Number: 30300 GEO Region:SW
Site Name Storet #
RANDOM LAKE - DEEP HOLE 603312
DateSD
(ft)
SD
(m)
Hit
BottomCHL TP
TSI
(SD)
TSI
(CHL)
TSI
(TP)
Lake
LevelClarity Color Perception
05/29/2006 4.25 1.3 N 8 56 44 HIGH CLEAR GREEN 3
06/13/2006 3.5 1.1 N 10.7 21 59 53 52 HIGH MURKY GREEN 3
06/21/2006 3.5 1.1 N 59 HIGH MURKY GREEN 3
06/30/2006 3.75 1.1 N 58 HIGH MURKY GREEN 3
07/07/2006 3.5 1.1 N 59 NORMAL MURKY GREEN 3
07/15/2006 4.75 1.4 N 55 NORMAL MURKY GREEN 3
07/23/2006 3.5 1.1 N 8.13 23 59 51 52 NORMAL MURKY BROWN 3
07/31/2006 3.5 1.1 N 59 NORMAL MURKY BROWN 3
08/16/2006 3.75 1.1 N 7.41 25 58 50 53 LOW MURKY BROWN 3
08/24/2006 3.75 1.1 N 58 LOW MURKY GREEN 3
09/01/2006 4 1.2 N 57 LOW MURKY GREEN 3
09/14/2006 4.25 1.3 N 56 LOW CLEAR GREEN 3
09/17/2006 4 1.2 N 57 LOW MURKY GREEN 3
09/25/2006 4.25 1.3 N 56 NORMAL CLEAR GREEN 3
10/06/2006 4.25 1.3 N 7.18 25 56 50 53 NORMAL CLEAR BROWN 3
10/20/2006 5.5 1.7 N 53 HIGH CLEAR BROWN 3
05/29/2006
Depth Temp. D.O.
FEET DEGREES F mg/l
0 70.8 5.55
2 69.9 6.52
4 69.1 7.25
6 67.5 7.12
8 64.6 7.48
10 62.1 7.31
12 60 6.72
14 58.4 5.71
16 57.4 4.82
18 56.2 1.02
20 55.7 .35
22.2 55.1 .1
06/13/2006
Depth Temp. D.O.
FEET DEGREES F mg/l
0 69.9 7.57
2 69.1 8.01
4 68.5 8.17
6 68.2 8.09
8 67.6 8
10 66.9 7.74
12 65.8 7.35
14 63.1 4
16 59.8 .11
18 57 .02
20 56.1 .01
22 55.5 .01
22.2 55.1 0
06/21/2006
Depth Temp. D.O.
FEET DEGREES F mg/l
0 73.7 6.51
2 73.5 7.16
4 73.3 7.28
6 73.2 7.41
8 72.4 7.13
10 71.3 6.88
12 69.7 6.4
14 64.9 1.62
16 61.3 .14
18 58.8 .08
20 57.4 .06
22 56.4 .04
22.2 56.1 .03
http://prodoasjava.dnr.wi.gov/swims/public/reporting.do...&monitYear=2006&action=run&format=html&stationNo=603312 (1 of 4)8/3/2007 2:41:26 PM
264

Lake Water Quality 2006 Annual Report
06/30/2006
Depth Temp. D.O.
FEET DEGREES F mg/l
0 76.2 7.98
2 75.9 8.08
4 75 8.2
6 74.3 8.26
8 73.3 8.38
10 72.1 7.64
12 70.1 5.54
14 67.5 .59
16 65.1 .1
18 61.5 .07
20 59.2 .06
22 57.5 .04
22.2 56.8 .02
07/07/2006
Depth Temp. D.O.
FEET DEGREES F mg/l
0 78.1 7.92
2 78.1 7.95
4 77.9 8.02
6 77.5 7.99
8 76.6 7.77
10 75.5 6.89
12 74.1 5.41
14 71.2 .9
16 66.7 .07
18 62.6 .06
20 59.8 .03
22 58.4 .02
22.2 57.9 0
07/15/2006
Depth Temp. D.O.
FEET DEGREES F mg/l
0 79.2 7.03
2 78.8 7.16
4 78.4 7.09
6 77.7 7.02
8 76.4 7.03
10 75 6.55
12 73.3 4.94
14 71.3 2.85
16 69.1 .11
18 64.4 .07
20 61 .06
22 59.6 .04
22.2 59 .02
07/23/2006
Depth Temp. D.O.
FEET DEGREES F mg/l
0 77 6.8
2 77 6.86
4 77 6.89
6 76.8 6.89
8 76.8 6.83
10 76.4 6.69
12 75.2 5.73
14 73 1.51
16 68.9 .11
18 66 .11
20 63.1 .14
22 61.7 .16
07/31/2006
Depth Temp. D.O.
FEET DEGREES F mg/l
0 81.1 6.44
2 81 6.56
4 80.4 6.63
6 80.1 6.5
8 79.9 6.3
10 79.3 5.68
12 77.3 3.93
14 74.4 .93
16 70.6 .04
18 67.3 .03
20 64.6 .02
22 62.6 .01
22.1 62.1 .01
08/16/2006
Depth Temp. D.O.
FEET DEGREES F mg/l
0 75.9 7.11
2 75.9 7.13
4 75.5 7.18
6 75.5 7.19
8 75.2 7.17
10 75.2 7.08
12 74.8 6.87
14 74.3 6.93
16 73.2 4.69
18 70.1 .06
20 66 .03
22 63.9 .03
22.1 63 .02
08/24/2006
Depth Temp. D.O.
FEET DEGREES F mg/l
0 74.6 7.1
2 74.4 7.18
4 74.4 7.2
6 74.3 7.17
8 74.1 7.08
10 73.9 6.51
12 73.7 5.91
14 73.3 4.79
16 72.8 3.71
18 71 .04
20 67.6 .02
22 64.9 .01
09/01/2006
Depth Temp. D.O.
FEET DEGREES F mg/l
0 71.9 6.76
2 72.1 6.8
4 72.1 6.82
6 71.9 6.84
8 71.9 6.85
10 71.9 6.84
12 71.9 6.85
14 71.9 6.86
16 71.7 6.8
18 71 5.39
20 69.4 .6
22 67.5 .01
09/14/2006
Depth Temp. D.O.
FEET DEGREES F mg/l
0 63.7 6.52
2 63.3 6.57
4 63 6.65
6 62.8 6.58
8 62.8 6.52
10 62.6 6.43
12 62.6 6.41
14 62.6 6.42
16 62.6 6.36
18 62.4 6.26
20 62.4 5.73
22 62.6 .07
22.1 62.6 .03
http://prodoasjava.dnr.wi.gov/swims/public/reporting.do...&monitYear=2006&action=run&format=html&stationNo=603312 (2 of 4)8/3/2007 2:41:26 PM
265

Lake Water Quality 2006 Annual Report
09/17/2006
Depth Temp. D.O.
FEET DEGREES F mg/l
0 67.3 7.48
2 66.7 7.59
4 66.2 7.55
6 65.3 7.24
8 64 7.29
10 63.7 6.81
12 63.1 6.63
14 62.8 5.9
16 62.8 5.49
18 62.6 5.19
20 62.4 4.48
22 62.4 .09
22.1 62.4 .05
09/25/2006
Depth Temp. D.O.
FEET DEGREES F mg/l
0 60.9 7.31
2 60.7 7.38
4 60.7 7.45
6 60.7 7.51
8 60.5 7.54
10 60.5 7.55
12 60.5 7.55
14 60.3 7.52
16 60.3 7.49
18 60.1 7.43
20 60 7.31
22 60 .13
22.1 59.8 .05
10/06/2006
Depth Temp. D.O.
FEET DEGREES F mg/l
0 59.8 7.68
2 59.8 7.72
4 59.8 7.78
6 58.6 7.9
8 58.6 7.9
10 58.4 7.8
12 58.4 7.72
14 58.3 7.74
16 58.3 7.64
18 58.1 7.5
20 57.9 7.43
22 57.9 .16
22.2 58.1 .03
10/20/2006
Depth Temp. D.O.
FEET DEGREES F mg/l
0 46 8.21
2 46 8.32
4 46 8.38
6 46 8.45
8 46 8.48
10 46 8.52
12 46 8.53
14 46 8.55
16 46 8.56
18 46 8.55
20 46.2 8.49
22 46.2 6.1
22.2 46.6 .2
Date Collector Comments
06/21/2006 Fish (small) between 10-14'; Sprigs of curly leaf pondweed; pH=7; Satellite day; pH = 7.0
06/30/2006 Fish between 10-15'; much curly leaf- broad leaf and Sago pondweeds- much Chara; heavy traffic on lake;
pH = 6.8; (1 day after Satellite day
07/07/2006 Fish between 11-13'; much debris at surface (Potamogeton sprigs + grasslike leaves (not Aphanazomena);
clumps of filamentous algae appox. 30 cm diam; Satellite day; pH - 6.8
07/15/2006 Fish between 10-18'; much Sago pondweed; Satellite day; pH = 7.1
07/23/2006 Fish between 9-19'; much Sago pondweed; warm weather; Chlorophyll + Phosphorus samples sent; Satellite
day; pH = 6.9
07/31/2006 Fish between 10-18'; mostly Sago Pondweed; hot weather; Satellite day; pH = 7.3
08/16/2006 Fish between 7-17'; residents have asked for spraying of weeds - much Potamegeton but no Eurasian Water
Milfoil; warm- dry-but cool nights; Satellite day; pH = 7.0; Chlorophyll + Phosphorus samples sent in;
08/24/2006 Fish between 7-17'; many pondweed varieties; Satellite day; pH = 6.9; low water level - deepest point = 22'
09/01/2006 Fish between 9-18'; Satellite day; pondweed going to seed + turning brown however- at north end - still
green; pondweed spikes above water surface; one "whorled" water milfoil plant discovered on 8/25/06; pH =
7.1; low water- bottom = 22'
09/14/2006 Fish between 10-19'; mostly Sago and other pondweed abundant; pH = 7.1
http://prodoasjava.dnr.wi.gov/swims/public/reporting.do...&monitYear=2006&action=run&format=html&stationNo=603312 (3 of 4)8/3/2007 2:41:26 PM
266

Lake Water Quality 2006 Annual Report
09/17/2006 Fish between 6-17'; satellite day; no visible Eurasian Water Milfoil - same as rest of summer; pH = 6.9
09/25/2006 Fish between 11-19'; much Sago Pondweed 6-12" below surface; Village piers removed at park; maple
leaves turning red; Satellite day; pH = 7.1
10/06/2006 Fish between 9-19'; Sago Pondweed not as apparent + not at surface; Canada Geese population is high
(maybe migration); Phosphorus + Chlorophyll samples sent in; pH = 6.9; D.O. is very good down to 20'; no
temmperature stratification since Sept 14th
10/20/2006 Fish between 9-15'; Mudhens migrating thru; new sprouts of Lily Pads + Cattails; Rushes = brown;
Pondweeds = deep; good traveling + fishing
Date Lab Comments
05/29/2006 METHOD BLANK EXCEEDED LOD CRITERIA
Date Data Collectors Project
05/29/2006 Wayne Stroessner CLMN AT RANDOM LAKE; DEEP HOLE
06/13/2006 Wayne Stroessner CLMN AT RANDOM LAKE; DEEP HOLE
06/21/2006 Wayne Stroessner CLMN AT RANDOM LAKE; DEEP HOLE
06/30/2006 Wayne Stroessner CLMN AT RANDOM LAKE; DEEP HOLE
07/07/2006 Wayne Stroessner CLMN AT RANDOM LAKE; DEEP HOLE
07/15/2006 Wayne Stroessner CLMN AT RANDOM LAKE; DEEP HOLE
07/23/2006 Wayne Stroessner CLMN AT RANDOM LAKE; DEEP HOLE
07/31/2006 Wayne Stroessner CLMN AT RANDOM LAKE; DEEP HOLE
08/16/2006 Wayne Stroessner CLMN AT RANDOM LAKE; DEEP HOLE
08/24/2006 Wayne Stroessner CLMN AT RANDOM LAKE; DEEP HOLE
09/01/2006 Wayne Stroessner CLMN AT RANDOM LAKE; DEEP HOLE
09/14/2006 Wayne Stroessner CLMN AT RANDOM LAKE; DEEP HOLE
09/17/2006 Wayne Stroessner CLMN AT RANDOM LAKE; DEEP HOLE
09/25/2006 Wayne Stroessner CLMN AT RANDOM LAKE; DEEP HOLE
10/06/2006 Wayne Stroessner CLMN AT RANDOM LAKE; DEEP HOLE
10/20/2006 Wayne Stroessner CLMN AT RANDOM LAKE; DEEP HOLE
SD = Secchi depth measured in feet converted to meters; Chl = Chlorophyll a in micrograms per liter(ug/l); TP = Total
phosphorus in ug/l, surface sample only; TSI(SD), TSI(CHL), TSI(TP) = Trophic state index based on SD, CHL, TP
respectively; Depth measured in feet.
Wisconsin Department of Natural Resources Wisconsin Lakes Partnership
Report Generated: 08/03/2007
Last Revised: Thursday January 18 2007
dnr.wi.gov
The Official Internet Site for the Wisconsin Department of Natural Resources
101 S. Webster Street . PO Box 7921 . Madison, Wisconsin 53707-7921 . 608.266.2621
Legal Notices and Disclaimers | Accessibility Notice | Site Requirements
Employment | Feedback | Site Map
http://prodoasjava.dnr.wi.gov/swims/public/reporting.do...&monitYear=2006&action=run&format=html&stationNo=603312 (4 of 4)8/3/2007 2:41:26 PM
267

Secchi Graph
RANDOM LAKE Lake Type: DRAINAGE
Sheboygan County DNR Region: SE
Waterbody Number: 30300 GEO Region:SW
Avg
July-
Aug
Secchi
Depth
(ft)
5
10
15
20
25
30
35
40
3
1987
3
1988
7
1989
7
1990
6
1991
5
1992
6
1993
6
1994
7
1995
4
1999
3
2000
3
2001
6
2002
4
2003
5
2004
5
2005
4
2006
Past secchi averages in feet (July and August only). Report Generated: 08/03/2007
Last Revised: Thursday January 18 2007
dnr.wi.gov
The Official Internet Site for the Wisconsin Department of Natural Resources
101 S. Webster Street . PO Box 7921 . Madison, Wisconsin 53707-7921 . 608.266.2621
Legal Notices and Disclaimers | Accessibility Notice | Site Requirements
Employment | Feedback | Site Map
http://prodoasjava.dnr.wi.gov/swims/public/reporting.do?report=11&action=run&format=html&stationNo=6033128/3/2007 2:40:36 PM
268

TSI Graph
Trophic State Index Graph
Hypereutrophic
100
90
80
70
Eutrophic60
50
Mesotrophic 40
Oligotrophic
30
20
10
0
1985 1986 1987 1988 1989 1990 1991 1992 1993 1994 1995 1997 1999 2000 2001 2002 2003 2004 2005 2006 2007
Monitoring Station: RANDOM LAKE - DEEP HOLE, Sheboygan County
Past Summer (July-August) Trophic State Index (TSI) averages.
= Secchi = Chlorophyll = Total Phosphorus
TSI(Chl) = TSI(TP) = TSI(Sec) It is likely that algae dominate light attenuation.
TSI(Chl) > TSI(Sec) Large particulates, such as Aphanizomenon flakes dominate
TSI(TP) = TSI(Sec) > TSI(Chl) Non-algal particulate or color dominate light attenuation
TSI(Sec) = TSI(Chl) >= TSI(TP) The algae biomass in your lake is limited by phosphorus
TSI(TP) > TSI(Chl) = TSI(Sec)Zooplankton grazing, nitrogen, or some factor other than phosphorus is limiting
algae biomass
TSI TSI Description
TSI < 30Classical oligotrophy: clear water, many algal species, oxygen throughout the year in bottom water, cold
water, oxygen-sensitive fish species in deep lakes. Excellent water quality.
TSI 30-40Deeper lakes still oligotrophic, but bottom water of some shallower lakes will become oxygen-depleted
during the summer.
TSI 40-50Water moderately clear, but increasing chance of low dissolved oxygen in deep water during the
summer.
TSI 50-60Lakes becoming eutrophic: decreased clarity, fewer algal species, oxygen-depleted bottom waters
during the summer, plant overgrowth evident, warm-water fisheries (pike, perch, bass, etc.) only.
TSI 60-70Blue-green algae become dominant and algal scums are possible, extensive plant overgrowth problems
possible.
TSI 70-80Becoming very eutrophic. Heavy algal blooms possible throughout summer, dense plant beds, but
extent limited by light penetration (blue-green algae block sunlight).
http://prodoasjava.dnr.wi.gov/swims/public/reporting.do?report=33&action=run&format=html&stationNo=603312 (1 of 2)8/3/2007 2:41:09 PM
269

TSI Graph
TSI > 80 Algal scums, summer fishkills, few plants, rough fish dominant. Very poor water quality.
Trophic state index (TSI) is determined using a mathematical formula (Wisconsin has its own version). The TSI is a
score from 0 to 110, with lakes that are less fertile having a low TSI. We base the overall TSI on the Chlorophyll TSI
when we have Chlorophyll data. If we don't have chemistry data, we use TSI Secchi. We do this rather than averaging,
because the TSI is used to predict biomass. This makes chlorophyll the best indicator. Visit Bob Carlson's website,
dipin.kent.edu/tsi.htm, for more info.
dnr.wi.gov
The Official Internet Site for the Wisconsin Department of Natural Resources
101 S. Webster Street . PO Box 7921 . Madison, Wisconsin 53707-7921 . 608.266.2621
Legal Notices and Disclaimers | Accessibility Notice | Site Requirements
Employment | Feedback | Site Map
http://prodoasjava.dnr.wi.gov/swims/public/reporting.do?report=33&action=run&format=html&stationNo=603312 (2 of 2)8/3/2007 2:41:09 PM
270

RANDOM LAKEAquatic Plant Survey
Whole Lake Demonstration Project/AIS Grant - 2008 and Final Report
INTRODUCTIONIn 2003, the Village of Random Lake received an Aquatic Invasive Species Grant from the
Wisconsin Department of Natural Resources (WDNR) to conduct a demonstration whole-
lake chemical treatment on Random Lake. The Grant application included the project
plan upon which the WDNR treatment permit will be based. That plan, and the subse-
quent grant, requires extensive monitoring to be conducted: the year prior to treatment,
the year of treatment, and three years post treatment. The aquatic plant community and
the water quality (Self-Help Volunteer Monitoring Program) are to be monitored.
A local volunteer collected the water quality samples throughout the summer of 2008.
The results are included in this report.
In July of 2008, Aron & Associates conducted the aquatic plant survey on Random Lake.
This survey is part of an ongoing demonstration project to document changes in the
aquatic plant community of Random Lake. This information can be compared with past
studies and may be used by future investigators to determine if the aquatic plant popula-
tion is changing. The impact of various management techniques may be evaluated based
on their respective impacts on the aquatic plants. This information should be used to
guide future lake management decisions on Random Lake.
Random Lake is located in the Village of Random Lake, Sheboygan County, in Southeast
Wisconsin. Hydrographic and morphometric data are presented in Table 2. A map of Ran-
dom Lake showing depth contours is presented in Map 3.
METHODOLOGYGeneral Survey
A preliminary survey of the lake was made by boat. An attempt was made to locate all
plant communities on the lake by region. Nomenclature follows Crow & Hellquist (2000).
No plants samples were collected and preserved since all species found had been col-
lected during previous surveys. The maximum rooting depth on Random Lake in 2008
was determined to be 13 feet, that is, no plants were found growing in water deeper than
11 feet. This is an improvement from the 11 feet maximum rooting depth in 2007.
271

Random Lake Aquatic Plant Survey, 2008 Page 2Aron & Associates
Point Intercept Survey
The methodology for the point intercept survey was developed by the WDNR Bureau of
Research for the state’s Whole Lake Treatment Protocol. A grid and global positioning
satellite (GPS) coordinates for sampling, were developed by WDNR and provided to Aron
& Associates for use in the Demonstration Whole Lake Treatment Project surveys on
Random Lake.
The initial grid established 146 sample points. Of those, 13 were on land and were elimi-
nated from the list, resulting in 133 sample points. In 2008, because of the high water lev-
els, one sample point was inundated and had aquatic plants present.
Samples points were located using a 2004 Garmin GPS LMS330 with an LGC-2000
Receiver. Four rake tows were conducted at each sample point. Each plant species
retrieved was recorded and given a density rating in accordance with the current WDNR
criteria, between 1 and 3. The dominant species at each sample point was also identified.
The data collected were then used to the mean density and percent of frequency for each
species. Lake depth at each sample point was determined by using the Garmin after cali-
bration in the field.
The abundance of each species was determined using four estimates:
1) The frequency is the rating of how often a species occurs in the sample points.
2) The average density rating, or the average density of a species in the sample point
where it occurred.
3) The relative density rating, or the average density of a species averaged over all
sample points whether or not any species were present.
4) The relative density rating averaged over all sample points in which any species
occurred.
EARLIER STUDIES
In October 1999, a whole-lake chemical treatment was conducted on Random Lake using
Sonar™ (SePRO Corporation). Eurasian watermilfoil (Myriophyllum spicatum) was the
primary target species. The goal of the project was to eliminate Eurasian watermilfoil,
enhancing conditions for native species. A condition of the WDNR permit for the project
required that aquatic plants in the lake be monitored. Pre-treatment monitoring was con-
ducted in 1999 and continued through 2002. The results of that monitoring are provided in
Table 1. The monitoring in 1999 through 2002 was conducted using the line-intercept
method for the establishment of sample points.
272

Random Lake Aquatic Plant Survey, 2008 Page 3Aron & Associates
As Eurasian watermilfoil re-infested Random Lake, the Village used harvesting and 2-4,D
chemical spot treatments to slow the return of Eurasian watermilfoil. Curly-leaf pondweed
(Potamogeton crispus) increased significantly between 1999 and 2002. Long-term histor-
ical data on the aquatic plant community is not available. A second whole-lake treatment
of Random Lake was conducted in 2005 using Sonar (active ingredient, fluridone). This
survey is the third post-treatment survey following treatment.
The 2005 treatment was conducted in spring 2005 while the 1999 treatment was con-
ducted in fall. It is not yet known if this will influence the results of the treatment.
RESULTS OF THE 2008 SURVEY
A total of 12 aquatic macrophytes were found during the survey in 2008, similar to that
seen in 2006 and 2007 (Table 2). Eleven of the plants were found during the grid survey
and one was found during the general survey. Wetland fringe species are not included in
the list of species. It should be noted that large stands of bulrush are present in Random
Lake. In 2008, the bulrushes were abundant and healthy.
The plants found in the lake in 2008 are listed in Table 2. Chara (Chara sp.), sago pond-
weed (Stuckenia pectinata), and spiny naiad (Najas marina) dominated the plant commu-
nity, throughout the depths. Water lilies (Nuphar and Nymphaea sp.) were common in the
shallow areas. Curly-leaf pondweed (P. crispus), an exotic species, was not found in
2008. Eurasian watermilfoil (Myriophyllum spicatum) was found throughout the lake in
2008 (Map 1). It should be expected that because of its distribution in the lake, Eurasian
watermilfoil will continue its spread throughout the lake unless aggressive control mea-
sures are undertaken. A native milfoil, whorled watermilfoil (Myriophyllum verticillatum)
was found in one area, on the Northeast side of the lake near the bulrushes (Map 2).
2008 was a very unusual year, with record rains in June and high water levels through
July. High water levels and runoff that contributed to more suspended sediment, may
have influenced the plant growth of various species throughout the region, including that
on Random Lake.
273

Random Lake Aquatic Plant Survey, 2008 Page 4Aron & Associates
Map 1 - Location of Re-Infestation of Eurasian Watermilfoil, July 2008
274

Random Lake Aquatic Plant Survey, 2008 Page 5Aron & Associates
Map 2 - Location of Whorled Watermilfoil, 2008
The results of the survey data for the July 2008 survey for all species at each sample
depth are included at the end of this report.
The maximum rooting depth in 2008 was 13 feet. Sediments in Random Lake range from
sand and gravel to muck. At 1.5 feet the substrate is primarily sand and gravel. At 15 feet
the substrate is muck.
Area with Whorled watermilfoil (native)
275

Random Lake Aquatic Plant Survey, 2008 Page 6Aron & Associates
Table 1. Hydrographic and Morphometric Data Random Lake
Size of Lake 209 acresLake Volume 1279 acre feetLength of Shoreline 3.6 milesMaximum Depth 21 feetMean Depth 6 feetPercent of area less than 3 feet deep 14%Percent of area greater than 20 feet deep 4%
Source: WDNR
Map 3 - Bathymetric Map, Random Lake, Wisconsin.
276

Random Lake Aquatic Plant Survey, 2008 Page 7Aron & Associates
Map 4 - Line Transect Survey Locations, Random Lake, Wisconsin, 1999.
277

Random Lake Aquatic Plant Survey, 2008 Page 8Aron & Associates
Map 5 - Point Intercept Survey Sample Points on Random Lake, 2005-2008.
#
#
#
#
#
#
N
1
2
4
5
6
7
8
9
10
11
12
13
14
15
17
18
19
20
21
22
23
24
25
26
27
28
29
30
31
32
33
34
35
36
37
38
39
40
41
42
43
44
45
46
47
48
49
50
51
52
53
54
55
56
57
58
59
60
61
62
63
64
65
66
67
68
69
70
71
72
73
74
75
76
77
78
79
80
81
82
83
84
85
86
87
88
89
90
91
92
93
94
95
96
97
98
99
100
101
102
103
104
105
106
107
108
109
110
111
112
113
114
115
116
117
118
119
120
121
122
123
124
125
126
127
128
129
130
131
132
133
134
135
136
137
138
139
140
141
142
143
144
145
146
3
16
278

Random Lake Aquatic Plant Survey, 2008 Page 9Aron & Associates
Notes: a Found in only one sample point.b Fall 1999 whole lake treatment.c Spring 2005 whole lake treatment.X Found only in the general survey.
Table 2. Random Lake Aquatic Plant Species - 1999 to 2008
% Frequency
Species 1999b 2000 2001 2002 2004 2005c 2006 2007 2008
Chara sp. 34 57 43 49 50 64 50 56 53
Elodea canadensis 3 1
Lemna minor 1a X X
Myriophyllum spicatum
60 1a 9 69 8 X 5
Myriophyllum verticillatum
X X X
Najas flexilis 1 X 2 10 2 2 2
Najas marina 10 X 13 6 11 20
Nitella sp. 10
Nuphar advena 5 5 6 7 4 3 1 X 2
Nymphaea sp. 5 5 0 4 2 10 5 1 1
Potamogeton crispus
1 4 19 25 1 7 6
P. amplifolius 1 3 6 X 3 1
P. Illinoensis 14 18 17 34 8 X 1 9
P. foliosus X 1
P. natans 1 5 5 7 6 5 2 1 1
P. zosterformis X 10 7 X
Stuckenia pectinata 33 57 48 56 37 12 40 32 27
Utricularia vulgaris 1 2 3 9 1 4 8
Vallisneria americana
X X
Total Species 12 8 11 16 16 7 13 14 12
279

Random Lake Aquatic Plant Survey, 2008 Page 10Aron & Associates
WATER QUALITY 2008The water quality on Random Lake was monitored under the Self-Help Volunteer Monitor-
ing Program. The volunteer, Wayne Stroessner, collected the samples following the Self-
Help protocol. Complete results are provided in the appendix and are available on the
WDNR website, http://dnr.wi.gov.
Random Lake is considered eutrophic, with decreased clarity, warm-water fisheries, oxy-
gen-depleted bottom waters during summer, dense plant growth.
*Complete 2008 report is provided in the Appendix or are available at
www.dnr.state.wi.us.
Table 3. Random Lake Water Quality Data Summary for 2008*
Sampling Date
Secchi(ft)
Total Phosphorus
(mg/l)
DO at surface(mg/l)
Temp at
surface (oF)
Chlorophyll A
(ug/l)
5/09/08 4.25 6.8 60
5/28/08 3.5 6.76 63
6/18/08 3.25 33 5.43
7/21/08 17 .98
8/05/08 4 11.46 79
8/13/08 3.75 22 12 74 9.55
8/21/08 4.25 11.06 74
8/29/08 3.75 11.95 76
9/06/08 4.25 9.29 70
9/15/08 4.5 9.88 65
9/22/08 5 11.6 70
9/30/08 5.5
10/11/08 6.25
280

Random Lake Aquatic Plant Survey, 2008 Page 11Aron & Associates
SUMMARYThe Village of Random Lake has conducted significant aquatic plant management activi-
ties over the years to keep Random Lake open to recreational use. As Eurasian watermil-
foil expanded its range, the management efforts have not always been able to keep pace
with the growth of the exotic plant. A demonstration chemical treatment was conducted
using Sonar in October 1999. Since 2002, the Village has used a combination of harvest-
ing and chemical treatment (using 2,4-D products) to control Eurasian watermilfoil. A sec-
ond Sonar treatment was conducted in spring 2005.
An analysis of 2008 plant data from the 1999 through 2007 project shows a number of dif-
ferences:
— The 2004 through 2008 surveys were done using point-intercept while earlier surveys
were done using the line-transect method.
— Significant differences in frequency over the years are present. The reasons for the
disparity are unclear. It could be simply the difference in sampling protocols used, or
other factors could come into play, such as weather, treatments, etc. Actual reasons
are most likely a combination of factors.
— There is significant difference in the lake’s response following the 2005 Sonar treat-
ment to that following the 1999 Sonar treatment. The fall 1999 treatment, conducted
at a higher rate, produced significant impact on native species immediately after treat-
ment, but showed little impact long term as plants species increased 4 years post-tra-
etment.
— The Eurasian watermilfoil treatment in 1999 was not 100% successful, but the spring
2005 treatment appeared to be.
— The spring 2005 treatment was done at a much lower rate yet the impact on natives,
the season of treatment was significant.
Table 4. Comparison of 2004 through 2008 Water Quality Data on Random Lake
Sampling Date
Average Secchi (ft)
Average Total Phosphorus
(mg/l)
Average Chlorophyll A(ug/l)
2004 5.2 26.8 5.2
2005 4.9 21.6 7.3
2006 4.0 20.4 8.4
2007 3.89 24.5 9.5
2008 3.9 24 5.32
281

Random Lake Aquatic Plant Survey, 2008 Page 12Aron & Associates
— The number of plant species has returned to the pre-1999 treatment levels, but not
the pre-2005 treatment level. Whether that will result in long term impacts is unknown.
The timing of the treatment may have been a factor in this difference. The native
plants may already have started their seasonal growth when the May 5, 2005 treat-
ment was conducted.
— Fewer native plant species were found in 2008 than were found in 2005 survey follow-
ing the whole-lake treatment.
— Water clarity continues to be poor with a low of 3.25 feet and a high of 6.25 feet in
2008.
— Random Lake stratifies during the summer months, with the bottom waters, usually
those below 14-15 feet, being anoxic (devoid of oxygen).
— Eurasian watermilfoil has re-entered the lake even though spot treatments were con-
ducted in 2007 and 2008. Fragments were found throughout the lake during the sur-
vey, and were reported frequently by the volunteer monitor.
— After the fall 1999 treatment, there was a significant amount of Eurasian watermilfoil
back in the lake in 2002, while after the spring 2005 treatment Eurasian watermilfoil
was just beginning to spread throughout the lake in 2008.
— The Village should aggressively locate and chemically treat Eurasian watermilfoil
early in the season, as early as May 1 to May 15. This would allow control while the
plant biomass is low and before susceptible native species such as bladderwort begin
to grow. The treatment should be done as soon as the plants are showing signs of
active growth. The treatment should cover the areas identified in 2008 and any other
areas where Eurasian watermilfoil was found by the end of 2008. The North end of
the lake and the public boat launch and beach should be thoroughly checked and
treated.
DEFINITION OF A PROJECT’S SUCCESSHow one perceives whether or not a project is successful depends upon one’s perspec-
tive. A skier or swimmer may not like aquatic plants to the surface and will deem an erad-
ication successful. An angler may consider any plant beneficial and will deem a Eurasian
watermilfoil eradication of Eurasian watermilfoil a failure.
On Potters Lake, an early whole-lake treatment for Eurasian watemilfoil was considered
by WDNR to be unsuccessful because the number of plant species failed to increase
post-treatment. What was unknown going in to the project was whether there was ever
much diversity in the lake that might rebound. The community considered the treatment a
huge success because recreational opportunities improved, plant debris declined and the
community saved ten’s of thousands of dollars in plant management funds which they
used to fund wetland acquisitions.
Going into this multi-year project on Random Lake, much discussion took place on how to
better define success. WDNR set forth the following criteria to use to evaluate the suc-
282

Random Lake Aquatic Plant Survey, 2008 Page 13Aron & Associates
cess. These criteria are all based on the lake resource, and not on the communities qual-
ity-of-life considerations.
WDNR Criteria for Success
1 There shall be a reduction in the Eurasian watermilfoil frequency and/or density
from pretreatment survey conditions until August 2007.
2 There shall be no net reductions (+/-20%) in the frequency and or density of the
native plant community, with the exception of Elodea sp. and Najas sp.
3 There shall be no documented overall negative impacts to the fish population or
other aquatic organisms either directly or indirectly related to the use of herbi-
cides in the lake.
4 There shall be no reductions (+/-20%) in water quality trends throughout the
study.
Evaluation of the criteria
1. Eurasian watermilfoil has dropped post treatment regardless of which year starting
point is used (Table 2).
2. Using number of native species (16), minus Elodea and Najas (2), in 2004 as a start-
ing point (14), means up to a shift of +/-2.8 species is allowable. In 2006, and 2007
there were 13 and 14 species respectively. In 2008, there were 12 species, for a drop
of 15%.
3. There were no documented overall negative impacts to the fish or other aquatic organ-
isms reported.
4. Two of the water quality parameters, total phosphorus and Chlorophyll A improved or
remained the same post treatment. Water clarity, measured by a Secchi disk, dropped
from 5.2 to 3.9 feet, approximately 25% reduction. Graph 1 shows the Trophic State
Index for Random Lake from 1985 through 2008
Determination
Based on all four criteria, the project met or exceeded the expectations in all but a single
portion of one criteria, the secchi disk measurements. This project has been successful in
reducing the significant problems caused by Eurasian watermilfoil in Random Lake.
The DNR permit (which includes the evaluation criteria), the aquatic plant data, and the
water quality report for 2008, are included in the Appendix.
283

Random Lake Aquatic Plant Survey, 2008 Page 14Aron & Associates
Graph 1 - Trophic State Index, Random Lake, 1985 through 2008.
Trophic State Index Graph
Hypereutrophic
100908070
Eutrophic6050
Mesotrophic 40
Oligotrophic
3020100
1985 1986 1987 1988 1989 1990 1991 1992 1993 1994 1995 1997 1999 2000 2001 2002 2003 2004 2005 2006 2007 200899
= Secchi = Chlorophyll = Total Phosphorus
Fall 1999 TreatmentSpring 2005 Treatment
22
284

Random Lake Aquatic Plant Survey, 2008 Page 15Aron & Associates
REFERENCES
Borman, S, B. Korth, and J. Tempte, 1997. Through the Looking Glass. Wisconsin Department of Natural Resources, 248 pp.
Crows, G. and C. Hellquist, 2000. Aquatic and Wetland Plants, Vols 1 and 2. University of Wisconsin Press.
Engel, S., 1989. Lake Use Planning in Local Efforts to Manage Lakes, Wisconsin Depart-ment of Natural Resources, 5 pp.
Fassett, N.C., 1957. A Manual of Aquatic Plants. University of Wisconsin Press, Madi-son, 405pp.
Fassett, N.C., 1969. A Manual of Aquatic Plants. University of Wisconsin Press, Madi-son, 405pp.
Gleason, H.A., 1952. The New Britton and Brown Illustrated Flora of the Northeastern United States and Adjacent Canada. Hafner Press, 483 pp.
Hoyer, M.V. and D. E. Canfield Jr., eds. 1997. Aquatic Plant Management in Lakes and Reservoirs. Prepared by the North American Lake Management Society and the Aquatic Plant Management Society for the US Environmental Protection Agency. 103 pp.
Nichols, S.A. and J. G. Vennie, 1991. Attributes of Wisconsin Lake Plants. University of Wisconsin-Extension Geological and Natural History Survey, 19 pp.
Nichols, S. A. and Byron M. Shaw, 1986. Ecological Life Histories of the Three Aquatic Nuisance Plants, Myriophyllum spicatum, Potamogeton crispus, and Elodea canaden-sis. Hydrobiologia 131, 3-21.
Province of British Colombia, Informational Bulletin, A summary of Biological Research on Eurasian Water Milfoil in British Colombia. vol. XI, 18 pp.
SePRO. Sonar Guide To Aquatic Habitat Management. SePRO Corporation, 23 pp.
Smith, C.S. and J. W. Barko, 1990, Ecology of Eurasian Watermilfoil. Journal of Aquatic Plant Management. 28:55-64
Wagner, Kenneth, 1990, Assessing Impacts of Motorized Watercraft on Lakes: Issues and Perceptions. North American Lake Management Society, 17pp.
Wisconsin Department of Natural Resources, 1985. Aquatic Community Interactions of Submerged Macrophytes. Technical Bulletin No. 156, Wisconsin Department of Natural Resources, 79 pp.
285

286

287

288

289

290

291

292

293

294

295

296

297

298

299

300

301

302

303

304

305

306

307