The Revolution that Faltered: Two Decades of Reform of Australia's Retirement Income System

Chemosphere 90 (2013) 887–894
Contents lists available at SciVerse ScienceDirect
Chemosphere
journal homepage: www.elsevier .com/locate /chemosphere
Review
The natural rehabilitation of an anthropogenically acidified tropical Lake:Two decades of monitoring
Cristiano V.M. Araújo a,b,⇑, Salomão J. Cohin-de-Pinho a, Carla B.A. Chastinet c, Sandro L. Machado d,Eduardo M. da Silva a
a Instituto de Biologia, Federal University of Bahia, Campus de Ondina, 40170-115 Salvador, BA, Brazilb IMAR – Instituto do MAR, Department of Life Sciences, University of Coimbra, Apartado 3046, 3001-401 Coimbra, Portugalc Instituto do Meio Ambiente e Recursos Hídricos, Rua São Francisco, No. 1, 40245-060 Salvador, BA, Brazild Departamento de Ciência e Tecnologia dos Materiais, Escola Politécnica, Federal University of Bahia, 40210-630 Salvador, BA, Brazil
h i g h l i g h t s
" Natural rehabilitation of an acidified Lake was monitored during two decades." pH, conductivity, sulphate, iron and toxicity of the water were monthly recorded." Toxicity levels were related to Lake pH values which ranged with rain and dry regime." Moving average approach using pH data showed clearly the Lake recovery process." Recent data highlight Lake rehabilitation and the efficiency of the containment plan.
a r t i c l e i n f o
Article history:Received 7 November 2011Received in revised form 21 May 2012Accepted 23 June 2012Available online 21 July 2012
Keywords:AcidificationMonitoringpHRehabilitationToxicity
0045-6535/$ - see front matter � 2012 Elsevier Ltd. Ahttp://dx.doi.org/10.1016/j.chemosphere.2012.06.029
⇑ Corresponding author at: Instituto de Biologia,Campus de Ondina, 40170-115 Salvador, BA, Brazil. Te71 3263 6511.
E-mail address: [email protected] (C.V
a b s t r a c t
The rehabilitation of a pond after approximately 20 years of strong acidified conditions due to industrialand domestic waste deposition in its catchment basin is reviewed. We describe in this study the acidifi-cation process that occurred in a tropical pond in Northeast Brazil (Dunas Lake), the rehabilitation planfor the pond and the subsequent monitoring conducted over two decades. After the contaminationassessment by the late 80s, a rehabilitation plan was carried out in the early 90s, in which the contam-inated soil and water have been removed and reduced, respectively. No further attempt to neutralize thewater or any remediation has been carried out. A toxicity monitoring plan based on toxicity assays withthe fish Poecilia reticulata was employed to verify the natural rehabilitation of the pond. The data on tox-icity, pH, conductivity, sulphate and dissolved iron recorded from 1994 to 2010 were also compiled anddiscussed. The collected data in 2003 and 2004 indicated changes in water quality and from them com-plementary management actions, namely improvement in the containment plant, were conducted in2005. Results for toxicity assays and pH results indicated interannual changes in the water quality similarto rainy-dry periods. Moving average approach using pH data clearly showed the recovery process ofDunas Lake as well as the importance of the containment plan to reduce the contamination. Finally, asummary of the recent situation after two decades of rehabilitation is provided.
� 2012 Elsevier Ltd. All rights reserved.
Contents
1. Introduction . . . . . . . . . . . . . . . . . . . . . . . . . . . . . . . . . . . . . . . . . . . . . . . . . . . . . . . . . . . . . . . . . . . . . . . . . . . . . . . . . . . . . . . . . . . . . . . . . . . . . . . . . 8882. Material and methods . . . . . . . . . . . . . . . . . . . . . . . . . . . . . . . . . . . . . . . . . . . . . . . . . . . . . . . . . . . . . . . . . . . . . . . . . . . . . . . . . . . . . . . . . . . . . . . . . 888
2.1. Dunas Lake: general description and origin of contamination . . . . . . . . . . . . . . . . . . . . . . . . . . . . . . . . . . . . . . . . . . . . . . . . . . . . . . . . . . . . 8882.2. Rehabilitation plan and monitoring . . . . . . . . . . . . . . . . . . . . . . . . . . . . . . . . . . . . . . . . . . . . . . . . . . . . . . . . . . . . . . . . . . . . . . . . . . . . . . . . . 8882.3. Physical–chemical analysis . . . . . . . . . . . . . . . . . . . . . . . . . . . . . . . . . . . . . . . . . . . . . . . . . . . . . . . . . . . . . . . . . . . . . . . . . . . . . . . . . . . . . . . . 889
ll rights reserved.
Federal University of Bahia,l.: +55 71 3263 6525; fax: +55
.M. Araújo).

888 C.V.M. Araújo et al. / Chemosphere 90 (2013) 887–894
2.4. Toxicity assays. . . . . . . . . . . . . . . . . . . . . . . . . . . . . . . . . . . . . . . . . . . . . . . . . . . . . . . . . . . . . . . . . . . . . . . . . . . . . . . . . . . . . . . . . . . . . . . . . . 8892.5. Statistical analysis . . . . . . . . . . . . . . . . . . . . . . . . . . . . . . . . . . . . . . . . . . . . . . . . . . . . . . . . . . . . . . . . . . . . . . . . . . . . . . . . . . . . . . . . . . . . . . . 889
3. Results and discussion . . . . . . . . . . . . . . . . . . . . . . . . . . . . . . . . . . . . . . . . . . . . . . . . . . . . . . . . . . . . . . . . . . . . . . . . . . . . . . . . . . . . . . . . . . . . . . . . . 889
3.1. Monitoring sulphate and dissolved iron . . . . . . . . . . . . . . . . . . . . . . . . . . . . . . . . . . . . . . . . . . . . . . . . . . . . . . . . . . . . . . . . . . . . . . . . . . . . . 8893.2. Monitoring conductivity values . . . . . . . . . . . . . . . . . . . . . . . . . . . . . . . . . . . . . . . . . . . . . . . . . . . . . . . . . . . . . . . . . . . . . . . . . . . . . . . . . . . . 8893.3. Monitoring pH values . . . . . . . . . . . . . . . . . . . . . . . . . . . . . . . . . . . . . . . . . . . . . . . . . . . . . . . . . . . . . . . . . . . . . . . . . . . . . . . . . . . . . . . . . . . . 8903.4. Toxicity levels: laboratory and in situ assays. . . . . . . . . . . . . . . . . . . . . . . . . . . . . . . . . . . . . . . . . . . . . . . . . . . . . . . . . . . . . . . . . . . . . . . . . . 8914. Conclusions. . . . . . . . . . . . . . . . . . . . . . . . . . . . . . . . . . . . . . . . . . . . . . . . . . . . . . . . . . . . . . . . . . . . . . . . . . . . . . . . . . . . . . . . . . . . . . . . . . . . . . . . . . 893Acknowledgements . . . . . . . . . . . . . . . . . . . . . . . . . . . . . . . . . . . . . . . . . . . . . . . . . . . . . . . . . . . . . . . . . . . . . . . . . . . . . . . . . . . . . . . . . . . . . . . . . . . 893References . . . . . . . . . . . . . . . . . . . . . . . . . . . . . . . . . . . . . . . . . . . . . . . . . . . . . . . . . . . . . . . . . . . . . . . . . . . . . . . . . . . . . . . . . . . . . . . . . . . . . . . . . . 893
1. Introduction
Acidification from anthropogenic sources has attracted muchattention during the past 50 years because it is one of the principaldrivers of environmental disruption in many parts of the world(Gorham, 1998; Driscoll et al., 2003). Such acidification arises pri-marily from the consequences of acid rain and acid mine drainage,although other types of anthropogenic activities, such as vegeta-tion burning (Geller et al., 1998; Ribeiro et al., 2002; Mello et al.,2006), and natural causes of regional importance, such as volcanicactivity, may also play a role. Unfortunately, studies of acidificationare primarily focused on highly developed and temperate-zonecountries. In Brazil, studies of acidification are most frequentlyperformed in the subtropical south-eastern, most industrialized re-gion, where mining, industries, biogenic emissions and sugar-caneburning could be related to the acidification of soils and waters(Moreira-Nordemann et al., 1988; Rodhe et al., 1988; de Mello,2001; Lara et al., 2001; Krusche et al., 2003; Martinelli et al.,2006; Mello et al., 2006).
According to da Silva et al. (2000, 1999a, 1999b), by the end of80’s, some industrial and domestic solid residues, whose principalsource was a titanium dioxide plant, were deposited on the dunesadjacent to the Dunas Lake (Camaçari, Bahia, Brazil), a pond lo-cated between coastal secondary dunes. The residues were subse-quently leached by rainwater percolating through the dunes sandysoil, contaminating the ground- and the surface water. Ground-and surface water pH decreased to values as low as 1.8 (Gomes,1994). Chemical intervention to neutralize the deleterious effectsof acidification should be the most reasonable alternative becauseunder extremely acid conditions, the natural rehabilitation of Dun-as Lake would not be considered feasible in practice. Nevertheless,these conditions could offer an excellent opportunity to monitorthe capacity and time necessary for the natural rehabilitation ofthat ecosystem. Thus, a rehabilitation plan with no chemical inter-vention and, subsequently, a monitoring plan based on the mea-surements of a number of parameters (pH, conductivity, sulphateand dissolved iron concentration, and toxicity assay) were de-signed. The basic focus of the current review is the ecotoxicologicalstudies that were conducted over eighteen years to monitor thereduction in toxicity and the role played by pH in producing thetoxicity. Because the pH was determined to be the factor primarilyresponsible for the toxicity (Araújo et al., 2008a), we also decidedto verify the existence of seasonal fluctuations and interannualtrends of the pH data using moving average analysis.
2. Material and methods
2.1. Dunas Lake: general description and origin of contamination
Dunas Lake is located in Camaçari (Bahia, Brazil), along theSouth Atlantic coast (12.803003 S, 38.219324 W). It consists of anarrow, shallow body of freshwater located in a depression sur-
rounded by secondary dunes, adjacent to a wetland system thatruns parallel to the coast and presents no surface connection be-tween them. Groundwater inflow is the primary source of waterinput to the wetland system. A more detailed description of DunasLake is given in da Silva et al. (2000, 1999a, 1999b).
At the end of the 80’s, large quantities of solid residues (sulphur,iron, titanium dioxide, ilmenite and domestic wastes, mostly pa-per, cardboard, plastic bags and wood) from the industrial activityfrom a titanium dioxide plant have been dumped on the dunesadjacent to the pond. The groundwater and surface waters wereheavily contaminated, and the pH decreased to an extremely acidvalue (1.8). Additionally, the concentrations of dissolved iron andsulphate and the subsequent precipitation of humic acidsincreased. These changes affected the transparency of the waterand disrupted the biological communities in the pond (da Silvaet al., 2000, 1999a, 1999b). The contamination plume in thegroundwater did not reach Jauá Lake, which maintained its originalcharacteristics and has been considered to represent a referencesite (da Silva et al., 2000).
2.2. Rehabilitation plan and monitoring
In 1992, a rehabilitation program was initiated to restoregroundwater and surface water quality as well as to reduce the lev-els of contamination regarding to acidification (da Silva et al., 2000,1999a, 1999b; Gomes, 1994). Initially, 34,000 Mg of residues wereremoved; groundwater was continuously pumped out to reducethe contamination plume, which was discharged through a marineoutfall; and 16,400 m3 of industrial waste and approximately15,500 m3 of domestic waste were hydraulically encapsulated inthe dune (da Silva et al., 2000, 1999a, 1999b; Gomes, 1994). Theresidues confinement consisted of a cover layer with three sub-lay-ers of soil, composed of a 20 cm uniform eolian sand, 40 cm of apoorly compacted layer of residual soil, product of the weatheringof a granite/gneiss bedrock and, a 60 cm of compacted materialsimilar to the previous one, from top to bottom. The water col-lected by the drainage system was removed through a peripheraldrain installed around the system.
In 2003 data of the monitoring wells installed in the area indi-cated a decrease in pH, and ecotoxicity assays using surface watersindicated a reverse trend in toxicity reduction (see subsequentsubsections). These results were immediately related to failuresin the containment system performance and, between 2003 and2004, a geotechnical investigation detected failures in the coverlayers, as soil permeability values in the containment layers werehigh and, in some points tree roots were found further bottomlayer, indicating poor system performance.
Having detected that, a new cover layer was set up by October2005 after the removal of the sand and intermediate layers, usingbentonite in the bottom layer to ensure low permeability andabove the new compacted layer of soil, a 2 mm layer of high den-sity polyethylene (HDPE) membrane was installed to produce a
C.V.M. Araújo et al. / Chemosphere 90 (2013) 887–894 889
double layer of low permeability. Finally, the sand layer was reusedas part of the drainage system and for plant support. In the sandlayer surface hydro-seeding technique was employed for grasssupport. The collected rainfall water was conducted to an infiltra-tion pond located around 200 m from confinement.
2.3. Physical–chemical analysis
Between 1993 and 2010, surface water monthly data of pH andconductivity values were measured in the field, using a Digi-Sense(Cole Parmer) and Hanna HI 9033 electrodes, respectively. Sul-phate (like sulphate ion: turbidimetric method) and dissolved iron(phenanthroline method) were also determined in the same sam-ples according to APHA (1992).
2.4. Toxicity assays
Samples used for toxicity assays were collected in 5 L plasticbottles, transported to laboratory and kept at 4 ± 1.0 �C until thenext day (less than 24 h) when assays were performed. Poeciliareticulata, the guppy, was chosen due to its presence previouslyto the impact in the nearby wetlands and, the recommendationfrom OECD (1992) for use in ecotoxicity assays. The fish, nativefrom Trinidad and Tobago, and the coastal zone of NE South Amer-ica (Magurran, 2005), is a feral species, very abundant in tropicalfreshwaters, due to human interventions (Deacon et al., 2011).Only neonates younger than 15 d old, length less than 1.0 cm, con-sidered more sensitive (Farag et al., 1993; Petersen and Kristensen,1998), were used in the toxicity assays. Fingerlings were obtainedfrom a local aquarist, who bred and kept the organisms in a head-water valley stream, under natural conditions following OECD(1992) and after ABNT (2002). The organisms were transportedto the laboratory in a plastic bag with sufficient air and in darkness(Baumans, 2005). In the laboratory, the fish were sorted out for sizeand acclimated for 24 h in 20 L glass aquaria initially containingthe creek water, which was gradually replaced with dechlorinatedtap water, within this period previous to experiments, under con-stant aeration, and used as control. Food was not provided duringthis period and during the experiments. The temperature(26.0 ± 1.0 �C) and photoperiod (12:12 h light: dark) were main-tained throughout the experiments, and static and acute toxicitywith a maximum exposure time of 96 h (OECD, 1992; ABNT,2002) were carried out. Briefly, the samples were placed in testvessels (1.2 L capacity), each containing ca. 900–1000 mL of sam-ple. Eight to ten fish were randomly exposed in each vessel, andtime was the independent variable, using five replicates per watersample. Fish mortality was checked every 10 min in the first 3 h ofthe tests, 30 min of the third until the 10th h, and at longer timeintervals in the following hours. Living animals were recordedand dead fish removed (da Silva et al. 2000; Araújo et al. 2006,2008a, 2008b).
2.5. Statistical analysis
For toxicity tests, the median lethal time (LT50: time at which50% of the test animals were dead) was determined by Probit Anal-ysis. Considering that pH seemed to be the toxicity factor mostdeterminant (Araújo et al., 2008a), to verify the presence of sea-sonal fluctuations and the interannual data trend, a moving aver-age of the pH values was employed, as they are to identify trendsin a given measurement and to eliminate unwanted fluctuationsin time series analysis (Spiegel, 1981). In this procedure, a datasubset was chosen from the data set collected over a given period.This first subset was then averaged. Later, the first value used inthe data subset was removed, and a subsequent data value insertedto determine the new value of the moving average. In the present
study, two different criteria for calculating moving averages wereemployed. The first criterion produced a seasonal moving averagebased on 6-month subsets. The principal goal of this approach wasto detect the seasonal fluctuations related to the rainy-dry periods,March to August, and September to February, respectively (da Silvaet al., 2000). No reliable continuous rain data was available for thearea, or even nearby sites, although a definite rain pattern isknown. The second criterion used to calculate the moving averageaimed to verify interannual trends in the ecosystem rehabilitationassociated with the increase in pH. This procedure was similar tothe previous procedure, but the subsets included 12 months ofdata.
Linear correlation coefficients between sulphate and dissolvediron levels, conductivity, pH, and toxicity were also calculated.
3. Results and discussion
3.1. Monitoring sulphate and dissolved iron
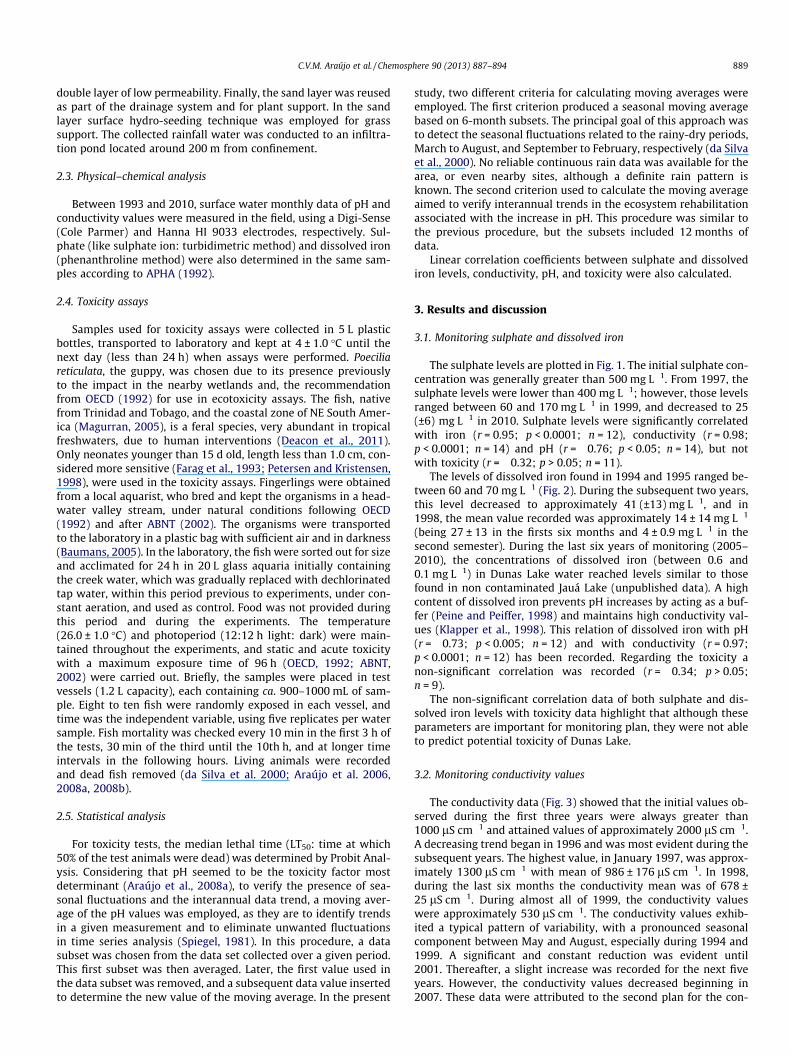
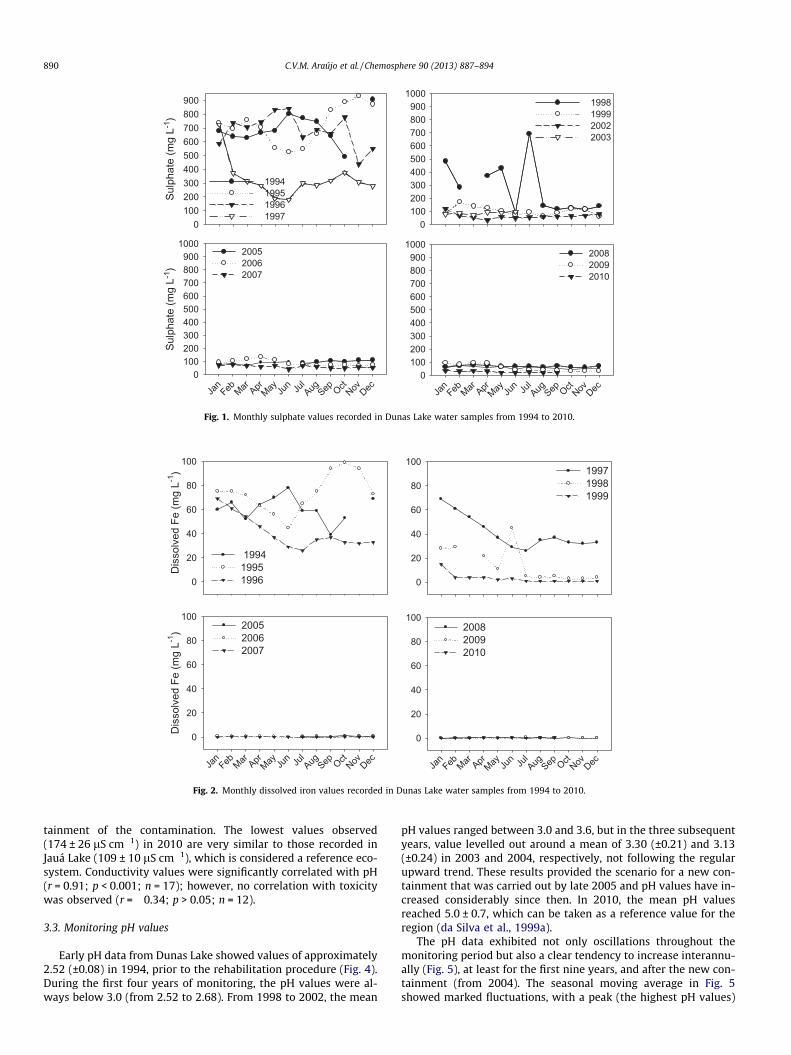
The sulphate levels are plotted in Fig. 1. The initial sulphate con-centration was generally greater than 500 mg L�1. From 1997, thesulphate levels were lower than 400 mg L�1; however, those levelsranged between 60 and 170 mg L�1 in 1999, and decreased to 25(±6) mg L�1 in 2010. Sulphate levels were significantly correlatedwith iron (r = 0.95; p < 0.0001; n = 12), conductivity (r = 0.98;p < 0.0001; n = 14) and pH (r = �0.76; p < 0.05; n = 14), but notwith toxicity (r = �0.32; p > 0.05; n = 11).
The levels of dissolved iron found in 1994 and 1995 ranged be-tween 60 and 70 mg L�1 (Fig. 2). During the subsequent two years,this level decreased to approximately 41 (±13) mg L�1, and in1998, the mean value recorded was approximately 14 ± 14 mg L�1
(being 27 ± 13 in the firsts six months and 4 ± 0.9 mg L�1 in thesecond semester). During the last six years of monitoring (2005–2010), the concentrations of dissolved iron (between 0.6 and0.1 mg L�1) in Dunas Lake water reached levels similar to thosefound in non contaminated Jauá Lake (unpublished data). A highcontent of dissolved iron prevents pH increases by acting as a buf-fer (Peine and Peiffer, 1998) and maintains high conductivity val-ues (Klapper et al., 1998). This relation of dissolved iron with pH(r = �0.73; p < 0.005; n = 12) and with conductivity (r = 0.97;p < 0.0001; n = 12) has been recorded. Regarding the toxicity anon-significant correlation was recorded (r = �0.34; p > 0.05;n = 9).
The non-significant correlation data of both sulphate and dis-solved iron levels with toxicity data highlight that although theseparameters are important for monitoring plan, they were not ableto predict potential toxicity of Dunas Lake.
3.2. Monitoring conductivity values
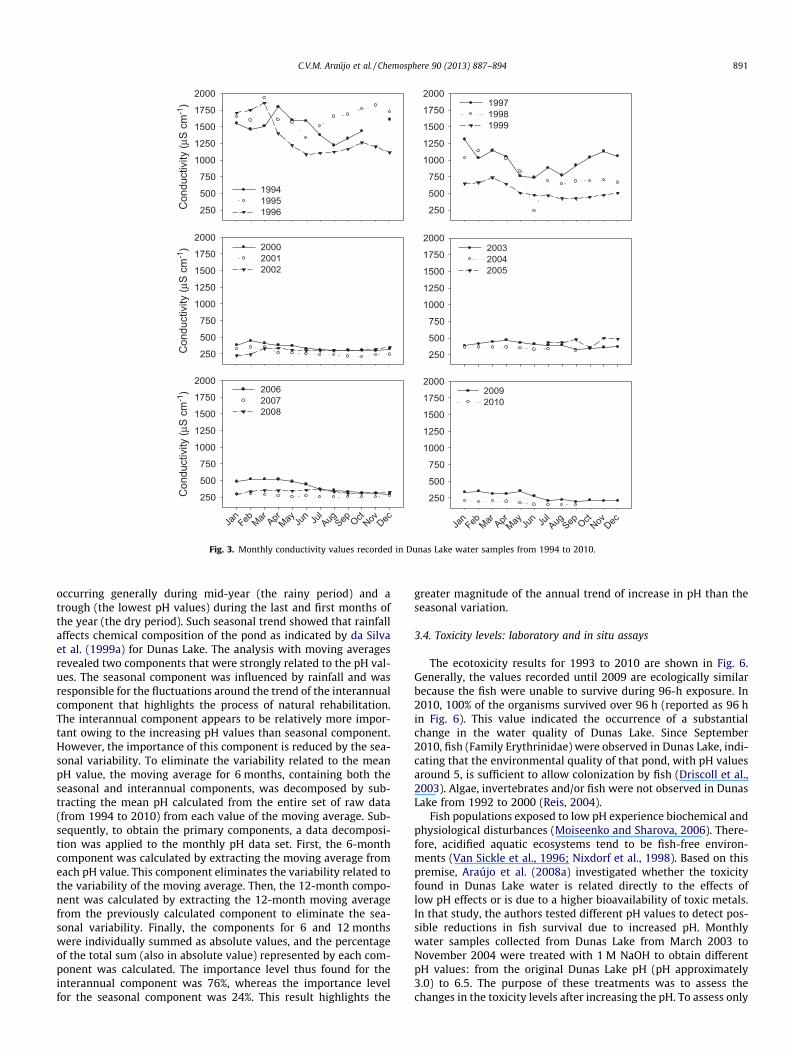
The conductivity data (Fig. 3) showed that the initial values ob-served during the first three years were always greater than1000 lS cm�1 and attained values of approximately 2000 lS cm�1.A decreasing trend began in 1996 and was most evident during thesubsequent years. The highest value, in January 1997, was approx-imately 1300 lS cm�1 with mean of 986 ± 176 lS cm�1. In 1998,during the last six months the conductivity mean was of 678 ±25 lS cm�1. During almost all of 1999, the conductivity valueswere approximately 530 lS cm�1. The conductivity values exhib-ited a typical pattern of variability, with a pronounced seasonalcomponent between May and August, especially during 1994 and1999. A significant and constant reduction was evident until2001. Thereafter, a slight increase was recorded for the next fiveyears. However, the conductivity values decreased beginning in2007. These data were attributed to the second plan for the con-
0100200300400500600700800900
1994199519961997
0100200300400500600700800900
10001998199920022003
Jan
Feb Mar AprMay Ju
n JulAug Sep Oct
Nov Dec
Sulp
hate
(mg
L-1)
Sulp
hate
(mg
L-1)
0100200300400500600700800900
1000200520062007
Jan
Feb Mar AprMay Ju
n JulAug Sep Oct
Nov Dec0
100200300400500600700800900
1000200820092010
Fig. 1. Monthly sulphate values recorded in Dunas Lake water samples from 1994 to 2010.
Dis
solv
ed F
e (m
g L-1
)D
isso
lved
Fe
(mg
L-1)
0
20
40
60
80
100
1994 19951996 0
20
40
60
80
100199719981999
Jan
Feb Mar AprMay Ju
n JulAug Sep Oct
Nov Dec
0
20
40
60
80
100200520062007
Jan
Feb Mar AprMay Ju
n JulAug Sep Oct
Nov Dec
0
20
40
60
80
100200820092010
Fig. 2. Monthly dissolved iron values recorded in Dunas Lake water samples from 1994 to 2010.
890 C.V.M. Araújo et al. / Chemosphere 90 (2013) 887–894
tainment of the contamination. The lowest values observed(174 ± 26 lS cm�1) in 2010 are very similar to those recorded inJauá Lake (109 ± 10 lS cm�1), which is considered a reference eco-system. Conductivity values were significantly correlated with pH(r = 0.91; p < 0.001; n = 17); however, no correlation with toxicitywas observed (r = �0.34; p > 0.05; n = 12).
3.3. Monitoring pH values
Early pH data from Dunas Lake showed values of approximately2.52 (±0.08) in 1994, prior to the rehabilitation procedure (Fig. 4).During the first four years of monitoring, the pH values were al-ways below 3.0 (from 2.52 to 2.68). From 1998 to 2002, the mean
pH values ranged between 3.0 and 3.6, but in the three subsequentyears, value levelled out around a mean of 3.30 (±0.21) and 3.13(±0.24) in 2003 and 2004, respectively, not following the regularupward trend. These results provided the scenario for a new con-tainment that was carried out by late 2005 and pH values have in-creased considerably since then. In 2010, the mean pH valuesreached 5.0 ± 0.7, which can be taken as a reference value for theregion (da Silva et al., 1999a).
The pH data exhibited not only oscillations throughout themonitoring period but also a clear tendency to increase interannu-ally (Fig. 5), at least for the first nine years, and after the new con-tainment (from 2004). The seasonal moving average in Fig. 5showed marked fluctuations, with a peak (the highest pH values)
Con
duct
ivity
(µS
cm-1
)C
ondu
ctiv
ity (µ
S cm
-1)
Con
duct
ivity
(µS
cm-1
)
250
500
750
1000
1250
1500
1750
2000
199419951996 250
500
750
1000
1250
1500
1750
2000199719981999
250
500
750
1000
1250
1500
1750
2000200020012002
250
500
750
1000
1250
1500
1750
2000200320042005
Jan
Feb Mar AprMay Ju
n JulAug Sep Oct
Nov Dec
250
500
750
1000
1250
1500
1750
2000200620072008
Jan
Feb Mar AprMay Ju
n JulAug Sep Oct
Nov Dec
250
500
750
1000
1250
1500
1750
200020092010
Fig. 3. Monthly conductivity values recorded in Dunas Lake water samples from 1994 to 2010.
C.V.M. Araújo et al. / Chemosphere 90 (2013) 887–894 891
occurring generally during mid-year (the rainy period) and atrough (the lowest pH values) during the last and first months ofthe year (the dry period). Such seasonal trend showed that rainfallaffects chemical composition of the pond as indicated by da Silvaet al. (1999a) for Dunas Lake. The analysis with moving averagesrevealed two components that were strongly related to the pH val-ues. The seasonal component was influenced by rainfall and wasresponsible for the fluctuations around the trend of the interannualcomponent that highlights the process of natural rehabilitation.The interannual component appears to be relatively more impor-tant owing to the increasing pH values than seasonal component.However, the importance of this component is reduced by the sea-sonal variability. To eliminate the variability related to the meanpH value, the moving average for 6 months, containing both theseasonal and interannual components, was decomposed by sub-tracting the mean pH calculated from the entire set of raw data(from 1994 to 2010) from each value of the moving average. Sub-sequently, to obtain the primary components, a data decomposi-tion was applied to the monthly pH data set. First, the 6-monthcomponent was calculated by extracting the moving average fromeach pH value. This component eliminates the variability related tothe variability of the moving average. Then, the 12-month compo-nent was calculated by extracting the 12-month moving averagefrom the previously calculated component to eliminate the sea-sonal variability. Finally, the components for 6 and 12 monthswere individually summed as absolute values, and the percentageof the total sum (also in absolute value) represented by each com-ponent was calculated. The importance level thus found for theinterannual component was 76%, whereas the importance levelfor the seasonal component was 24%. This result highlights the
greater magnitude of the annual trend of increase in pH than theseasonal variation.
3.4. Toxicity levels: laboratory and in situ assays
The ecotoxicity results for 1993 to 2010 are shown in Fig. 6.Generally, the values recorded until 2009 are ecologically similarbecause the fish were unable to survive during 96-h exposure. In2010, 100% of the organisms survived over 96 h (reported as 96 hin Fig. 6). This value indicated the occurrence of a substantialchange in the water quality of Dunas Lake. Since September2010, fish (Family Erythrinidae) were observed in Dunas Lake, indi-cating that the environmental quality of that pond, with pH valuesaround 5, is sufficient to allow colonization by fish (Driscoll et al.,2003). Algae, invertebrates and/or fish were not observed in DunasLake from 1992 to 2000 (Reis, 2004).
Fish populations exposed to low pH experience biochemical andphysiological disturbances (Moiseenko and Sharova, 2006). There-fore, acidified aquatic ecosystems tend to be fish-free environ-ments (Van Sickle et al., 1996; Nixdorf et al., 1998). Based on thispremise, Araújo et al. (2008a) investigated whether the toxicityfound in Dunas Lake water is related directly to the effects oflow pH effects or is due to a higher bioavailability of toxic metals.In that study, the authors tested different pH values to detect pos-sible reductions in fish survival due to increased pH. Monthlywater samples collected from Dunas Lake from March 2003 toNovember 2004 were treated with 1 M NaOH to obtain differentpH values: from the original Dunas Lake pH (pH approximately3.0) to 6.5. The purpose of these treatments was to assess thechanges in the toxicity levels after increasing the pH. To assess only

pH
2
3
4
5
6
7199419951996
2
3
4
5
6
7199719981999
pH
2
3
4
5
6
7200020012002
2
3
4
5
6
7200320042005
Jan
Feb Mar AprMay Ju
n JulAug Sep Oct
Nov Dec
pH
2
3
4
5
6
7200620072008
Jan
Feb Mar AprMay Ju
n JulAug Sep Oct
Nov Dec2
3
4
5
6
720092010
Fig. 4. Monthly pH values recorded in Dunas Lake water samples from 1994 to 2010.
2
3
4
5
6
Moving average- 6 months
Mean pH
1994 1996 1998 2000 2002 2004 2006 2008 2010
Importance level:Seasonal: 24%Inter-annual: 76%
Fig. 5. Yearly mean of pH and moving averages using pH data subsets of 6 monthsof Dunas Lake water recorded from 1994 to 2010.
LT50
(h)
010203040
94
95
96
1993
1994
1995
1996
2002
2003
2004
2005
2006
2007
2008
2009
2010
Fig. 6. Values of LT50 obtained for Poecilia reticulata exposed in the laboratory toDunas Lake water during 1993 and 2010.
892 C.V.M. Araújo et al. / Chemosphere 90 (2013) 887–894
the toxic effect of pH, the pH of the control water (dechlorinatedtap water) was decreased with 1 M H2SO4 to the same pH value re-corded in Dunas Lake. The results obtained from a predictive modelindicated that 80% of the toxicity observed in the Dunas Lake wateris due to pH (p < 0.0001) (Araújo et al., 2008a). This model indi-
cated that the change in pH values simulated in the laboratorywas able to predict the actual situation in the field (p < 0.0001).Based on the results of that study, a pH of 5 should represent thethreshold that would allow the presence of fish in the lake.
Although laboratory assays are widely employed in ecotoxico-logical studies, they have an inconvenient feature: their resultscannot be extrapolated successfully to natural ecosystems. There-fore, an in situ ecotoxicity assay was adopted beginning in July2003 to compare the results from the field with those obtainedin the laboratory. Certain discrepancies between the results ofthe two types of assays have been attributed to the lack of the abil-ity to create a laboratory environment with conditions similar to
Feb-
05Ap
r-05
Jun-
05Au
g-05
Oct
-05
Dec
-05
Feb-
06Ap
r-06
Jun-
06Au
g-06
Oct
-06
Dec
-06
Feb-
07Ap
r-07
Jun-
07Au
g-07
Oct
-07
Dec
-07
Feb-
08Ap
r-08
Jun-
08Au
g-08
Oct
-08
LT50
(h)
0.01.53.04.56.07.59.0
10.512.0 No-acclimated
Acclimated
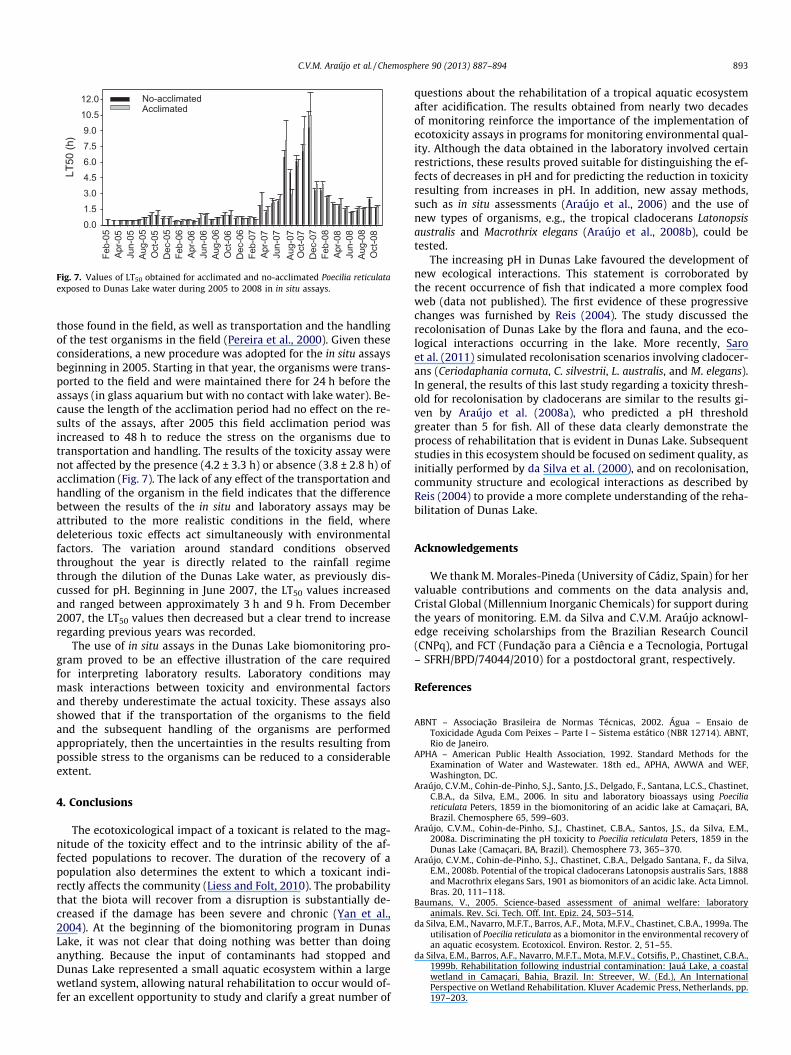
Fig. 7. Values of LT50 obtained for acclimated and no-acclimated Poecilia reticulataexposed to Dunas Lake water during 2005 to 2008 in in situ assays.
C.V.M. Araújo et al. / Chemosphere 90 (2013) 887–894 893
those found in the field, as well as transportation and the handlingof the test organisms in the field (Pereira et al., 2000). Given theseconsiderations, a new procedure was adopted for the in situ assaysbeginning in 2005. Starting in that year, the organisms were trans-ported to the field and were maintained there for 24 h before theassays (in glass aquarium but with no contact with lake water). Be-cause the length of the acclimation period had no effect on the re-sults of the assays, after 2005 this field acclimation period wasincreased to 48 h to reduce the stress on the organisms due totransportation and handling. The results of the toxicity assay werenot affected by the presence (4.2 ± 3.3 h) or absence (3.8 ± 2.8 h) ofacclimation (Fig. 7). The lack of any effect of the transportation andhandling of the organism in the field indicates that the differencebetween the results of the in situ and laboratory assays may beattributed to the more realistic conditions in the field, wheredeleterious toxic effects act simultaneously with environmentalfactors. The variation around standard conditions observedthroughout the year is directly related to the rainfall regimethrough the dilution of the Dunas Lake water, as previously dis-cussed for pH. Beginning in June 2007, the LT50 values increasedand ranged between approximately 3 h and 9 h. From December2007, the LT50 values then decreased but a clear trend to increaseregarding previous years was recorded.
The use of in situ assays in the Dunas Lake biomonitoring pro-gram proved to be an effective illustration of the care requiredfor interpreting laboratory results. Laboratory conditions maymask interactions between toxicity and environmental factorsand thereby underestimate the actual toxicity. These assays alsoshowed that if the transportation of the organisms to the fieldand the subsequent handling of the organisms are performedappropriately, then the uncertainties in the results resulting frompossible stress to the organisms can be reduced to a considerableextent.
4. Conclusions
The ecotoxicological impact of a toxicant is related to the mag-nitude of the toxicity effect and to the intrinsic ability of the af-fected populations to recover. The duration of the recovery of apopulation also determines the extent to which a toxicant indi-rectly affects the community (Liess and Folt, 2010). The probabilitythat the biota will recover from a disruption is substantially de-creased if the damage has been severe and chronic (Yan et al.,2004). At the beginning of the biomonitoring program in DunasLake, it was not clear that doing nothing was better than doinganything. Because the input of contaminants had stopped andDunas Lake represented a small aquatic ecosystem within a largewetland system, allowing natural rehabilitation to occur would of-fer an excellent opportunity to study and clarify a great number of
questions about the rehabilitation of a tropical aquatic ecosystemafter acidification. The results obtained from nearly two decadesof monitoring reinforce the importance of the implementation ofecotoxicity assays in programs for monitoring environmental qual-ity. Although the data obtained in the laboratory involved certainrestrictions, these results proved suitable for distinguishing the ef-fects of decreases in pH and for predicting the reduction in toxicityresulting from increases in pH. In addition, new assay methods,such as in situ assessments (Araújo et al., 2006) and the use ofnew types of organisms, e.g., the tropical cladocerans Latonopsisaustralis and Macrothrix elegans (Araújo et al., 2008b), could betested.
The increasing pH in Dunas Lake favoured the development ofnew ecological interactions. This statement is corroborated bythe recent occurrence of fish that indicated a more complex foodweb (data not published). The first evidence of these progressivechanges was furnished by Reis (2004). The study discussed therecolonisation of Dunas Lake by the flora and fauna, and the eco-logical interactions occurring in the lake. More recently, Saroet al. (2011) simulated recolonisation scenarios involving cladocer-ans (Ceriodaphania cornuta, C. silvestrii, L. australis, and M. elegans).In general, the results of this last study regarding a toxicity thresh-old for recolonisation by cladocerans are similar to the results gi-ven by Araújo et al. (2008a), who predicted a pH thresholdgreater than 5 for fish. All of these data clearly demonstrate theprocess of rehabilitation that is evident in Dunas Lake. Subsequentstudies in this ecosystem should be focused on sediment quality, asinitially performed by da Silva et al. (2000), and on recolonisation,community structure and ecological interactions as described byReis (2004) to provide a more complete understanding of the reha-bilitation of Dunas Lake.
Acknowledgements
We thank M. Morales-Pineda (University of Cádiz, Spain) for hervaluable contributions and comments on the data analysis and,Cristal Global (Millennium Inorganic Chemicals) for support duringthe years of monitoring. E.M. da Silva and C.V.M. Araújo acknowl-edge receiving scholarships from the Brazilian Research Council(CNPq), and FCT (Fundação para a Ciência e a Tecnologia, Portugal– SFRH/BPD/74044/2010) for a postdoctoral grant, respectively.
References
ABNT – Associação Brasileira de Normas Técnicas, 2002. Água – Ensaio deToxicidade Aguda Com Peixes – Parte I – Sistema estático (NBR 12714). ABNT,Rio de Janeiro.
APHA – American Public Health Association, 1992. Standard Methods for theExamination of Water and Wastewater. 18th ed., APHA, AWWA and WEF,Washington, DC.
Araújo, C.V.M., Cohin-de-Pinho, S.J., Santo, J.S., Delgado, F., Santana, L.C.S., Chastinet,C.B.A., da Silva, E.M., 2006. In situ and laboratory bioassays using Poeciliareticulata Peters, 1859 in the biomonitoring of an acidic lake at Camaçari, BA,Brazil. Chemosphere 65, 599–603.
Araújo, C.V.M., Cohin-de-Pinho, S.J., Chastinet, C.B.A., Santos, J.S., da Silva, E.M.,2008a. Discriminating the pH toxicity to Poecilia reticulata Peters, 1859 in theDunas Lake (Camaçari, BA, Brazil). Chemosphere 73, 365–370.
Araújo, C.V.M., Cohin-de-Pinho, S.J., Chastinet, C.B.A., Delgado Santana, F., da Silva,E.M., 2008b. Potential of the tropical cladocerans Latonopsis australis Sars, 1888and Macrothrix elegans Sars, 1901 as biomonitors of an acidic lake. Acta Limnol.Bras. 20, 111–118.
Baumans, V., 2005. Science-based assessment of animal welfare: laboratoryanimals. Rev. Sci. Tech. Off. Int. Epiz. 24, 503–514.
da Silva, E.M., Navarro, M.F.T., Barros, A.F., Mota, M.F.V., Chastinet, C.B.A., 1999a. Theutilisation of Poecilia reticulata as a biomonitor in the environmental recovery ofan aquatic ecosystem. Ecotoxicol. Environ. Restor. 2, 51–55.
da Silva, E.M., Barros, A.F., Navarro, M.F.T., Mota, M.F.V., Cotsifis, P., Chastinet, C.B.A.,1999b. Rehabilitation following industrial contamination: Jauá Lake, a coastalwetland in Camaçari, Bahia, Brazil. In: Streever, W. (Ed.), An InternationalPerspective on Wetland Rehabilitation. Kluver Academic Press, Netherlands, pp.197–203.

894 C.V.M. Araújo et al. / Chemosphere 90 (2013) 887–894
da Silva, E.M., Navarro, M.F.T., Barros, A.F., Mota, M.F.V., Chastinet, C.B.A., 2000.Metals in the sediments of Jauá Lake (Camaçari, Bahia, Brazil) following anepisode of industrial contamination. Aquatic Ecosyst. Health Manage. 3, 509–514.
Deacon, A.E., Ramnarine, I.W., Magurran, A.E., 2011. How reproductive ecologycontributes to the spread of a globally invasive fish. PLoS ONE 6 (9), e24416.
de Mello, W.Z., 2001. Precipitation chemistry in the coast of the MetropolitanRegion of Rio de Janeiro. Brazil. Environ. Pollut. 114, 235–242.
Driscoll, C.T., Driscoll, K.M., Mitchell, M.J., Raynal, D.J., 2003. Effects of acidicdeposition on forest and aquatic ecosystems in New York state. Environ. Pollut.123, 327–336.
Farag, A.M., Woodward, D.F., Little, E.E., 1993. The effects of low pH and elevatedaluminum on yellowstone cutthroat trout (Oncorhynchus clarki bouvieri).Environ. Toxicol. Chem. 12, 719–731.
Geller, W., Klapper, H., Schultze, M., 1998. Natural and anthropogenic sulphuricacidification of lakes. In: Geller, W., Klapper, H., Salomons, W. (Eds.), AcidicMine Lakes: Acid Mine Drainage, Limnology and Reclamation. Springer, Berlin,pp. 3–14.
Gomes, D.C., 1994. Poluição de aqüífero costeiro de Arembepe-BA por ácidosulfúrico e compostos inorgânicos oriundos da produção de dióxido de titânio.MSc. Dissertation, Universidade de São Paulo, p. 116.
Gorham, E., 1998. Acid deposition and its ecological effects: a brief history ofresearch. Environ. Sci. Policy 1, 153–166.
Klapper, H., Friese, K., Scharf, B., Schimmele, M., Schultze, M., 1998. Ways ofcontrolling acid by ecotechnology. In: Geller, W., Klapper, H., Salomons, W.(Eds.), Acidic Mine Lakes: Acid Mine Drainage, Limnology and Reclamation.Springer, Berlin, pp. 401–416.
Krusche, A.V., Camargo, P.B., Cerri, C.E., Ballester, M.V., Lara, L.B.L.S., Victoria, R.L.,Martinelli, L.A., 2003. Acid rain and nitrogen deposition in a sub-tropicalwatershed (Piracicaba): ecosystem consequences. Environ. Pollut. 121, 389–399.
Lara, L.B.L.S., Artaxo, P., Martinelli, L.A., Victoria, R.L., Camargo, P.B., Krusche, A.,Ayers, G.P., Ferraz, E.S.B., Ballester, M.V., 2001. Chemical composition ofrainwater and anthropogenic influences in the Piracicaba River Basin,Southeast Brazil. Atmos. Environ. 35, 4937–4945.
Liess, M., Folt, K., 2010. Intraspecific competition delays recovery of populationstructure. Aquat. Toxicol. 97, 15–22.
Magurran, A.E., 2005. Evolutionary Ecology: The Trinidadian guppy. OxfordUniversity Press, Oxford.
Martinelli, L.A., Howarth, R.W., Cuevas, E., Filoso, S., Austin, A., Lara, L.B.S.L., Medina,E., 2006. Sources of reactive nitrogen affecting ecosystems in Latin America andthe Caribbean: current trends and future perspectives. Biogeochemistry 79, 3–24.
Mello, J.W.V., Dias, L.E., Daniel, A.M., Abrahão, W.A.P., Dechamps, E., Schaefer,C.E.G.R., 2006. Preliminary evaluation of acid mine drainage in Minas Geraisstate, Brazil. R. Bras. Ci. Solo 30, 365–375.
Moiseenko, T.I., Sharova, O.N., 2006. Physiological mechanisms of degradation offish populations in acidified water bodies. Russ. J. Ecol. 37, 257–263.
Moreira-Nordemann, L.M., Forti, M.C., Di Lascio, V.L., do Espírito Santo, C.M.,Danelon, O.M., 1988. Acidification in Southeastern Brazil. In: Rodhe, H., Herrera,R. (Eds.), Acidification in Tropical Countries. John Wiley & Sons, Chichester, pp.257–296.
Nixdorf, B., Wollmann, K., Deneke, R., 1998. Ecological potentials for planktonicdevelopment and food web interactions in extremely acidic mining lakes inLusatia. In: Geller, W., Klapper, H., Salomons, W. (Eds.), Acidic Mine Lakes:Acid Mine Drainage, Limnology and Reclamation. Springer, Berlin, pp. 147–166.
OECD – Organisation Economic Co-operation and Development, 1992. Guideline fortesting of chemicals. Fish Acute Toxicity Test. OECD Guideline for Testing ofChemicals, Paris.
Peine, A., Peiffer, S., 1998. In-lake neutralization of acid mine lakes. In: Geller, W.,Klapper, H., Salomons, W. (Eds.), Acidic Mine Lakes: Acid Mine Drainage,Limnology and Reclamation. Springer, Berlin, pp. 47–63.
Pereira, A.M.M., Soares, A.M.V.M., Gonçalves, F., Ribeiro, R., 2000. Water-column,sediment, and in situ chronic bioassays with cladocerans. Ecotoxicol. Environ.Saf. 47, 27–38.
Petersen, G., Kristensen, P., 1998. Bioaccumulation of lipophilic substances in fishearly life stage. Environ. Toxicol. Chem. 17, 1385–1395.
Reis, I.S., 2004. Monitoramento da evolução das comunidades biológicas da Lagoadas Dunas após episódios de contaminação ácida, Camaçari – Bahia – Brasil.MSc. Dissertation, Universidade Federal da Bahia, p. 73.
Ribeiro, R., Lopes, I., Pereira, A.M.M., Gonçalves, F., Soares, A.M.V.M., 2002. Survivaltime of Ceriodaphia dubia in acid waters with metal contamination. Bull.Environ. Contam. Toxicol. 64, 130–136.
Rodhe, H., Cowling, E., Galbally, I., Galloway, J., Herrera, R., 1988. Acidification andregional air pollution in the tropics. In: Rodhe, H., Herrera, R. (Eds.),Acidification in Tropical Countries. SCOPE 36. John Wiley and Sons,Chichester, pp. 3–39.
Saro, L., Lopes, I., Chastinet, C.B.A., Cohin-de-Pinho, S.J., Moreira-Santos, M., da Silva,E.M., Ribeiro, R., 2011. Potential re-colonisation by cladocerans of an acidictropical pond. Chemosphere 82, 1072–1079.
Spiegel, M.R., 1981. Theory and problem of statistics. MsGraw-Hill International,Singapore. p. 359.
Van Sickle, J., Baker, J.P., Simonin, H.A., Baldigo, B.P., Kretser, W.A., Sharpe, W.E.,1996. Episodic acidification of small streams in the northeastern United States:fish mortality in field bioassays. Ecol. Appl. 6, 408–421.
Yan, N.D., Girard, R., Heneberry, J.H., Keller, W.B., Gunn, J.M., Dillon, P.J., 2004.Recovery of copepod, but not cladoceran, zooplankton from severe and chroniceffects of multiple stressors. Ecol. Lett. 7, 452–460.
Copyright © 2022 FDOKUMEN