National Cervical Screening Programme Monitoring Report ...
265
National Cervical Screening Programme Monitoring Report Number 52 National Cervical Screening Programme Monitoring Report Number 52
-
Upload
khangminh22 -
Category
Documents
-
view
1 -
download
0
Transcript of National Cervical Screening Programme Monitoring Report ...

National Cervical Screening Programme
Monitoring Report Number 52
National Cervical Screening Programme Monitoring Report Number 52

National Cervical Screening Programme – Monitoring Report – Number 52 Page i
National Cervical Screening Programme Monitoring Report Number 52 Prepared April 2020 Revised September 2021 Finalised November 2021 By Megan Smith, Maddison Sherrah, Leanne Rumlee and Karen Canfell
Cancer Research Division, Cancer Council NSW Australia, Sydney NSW Australia Suggested citation: Smith M, Sherrah M, Rumlee L, Canfell K. National Cervical Screening Programme Monitoring Report Number 52 (National Cervical Screening Programme Monitoring Report Number 52). National Screening Unit: Wellington, 2021.

National Cervical Screening Programme – Monitoring Report – Number 52 Page ii
Acknowledgements This report was prepared by the authors in collaboration with the National Screening Unit (NSU), Ministry of Health. We would like to acknowledge the contribution from Ronnie de Does, NCSP Register Central Team, for data extraction; and Simon Edwards, Robert Walker, Sarsha Yap and Dr Mark Clements for assistance with code development and importing data for analysis.
About the authors The authors are based at Cancer Research Division at Cancer Council NSW, Sydney, Australia. They are part of a research group (led by Prof Karen Canfell) which has as its core research focus the epidemiology of cervical cancer, cervical screening and human papillomavirus (HPV) vaccination. This research group has established an extensive track record both in research publication and in successful completion of commissioned projects related to national cervical screening programmes in New Zealand, Australia and England. The group has extensive experience in the analysis of descriptive data from cervical cancer screening programmes. The team also has a range of related skills in the analysis of linked datasets, systematic review and meta-analysis, biostatistics, health economics, and advanced statistical modelling techniques.

National Cervical Screening Programme – Monitoring Report – Number 52 Page iii
Contents
1. EXECUTIVE SUMMARY ............................................................................................................................... 1
2. BACKGROUND .......................................................................................................................................... 12
3. METHODS ................................................................................................................................................ 13
DATA USED ............................................................................................................................................................. 13 AGE....................................................................................................................................................................... 13 HYSTERECTOMY-ADJUSTED POPULATION ....................................................................................................................... 13 ETHNICITY ANALYSIS ................................................................................................................................................. 14 CALCULATING NCSP COVERAGE.................................................................................................................................. 14
4. BIANNUAL NCSP MONITORING INDICATORS ........................................................................................... 16
INDICATOR 1 – COVERAGE ......................................................................................................................................... 16 Indicator 1.1 – Three-year coverage ............................................................................................................... 17 Indicator 1.2 – Regularity of screening ........................................................................................................... 33
INDICATOR 2 – FIRST SCREENING EVENTS ...................................................................................................................... 45 INDICATOR 3 – WITHDRAWAL RATES ........................................................................................................................... 51 INDICATOR 4 – EARLY RE-SCREENING ........................................................................................................................... 55 INDICATOR 5 – LABORATORY INDICATORS ..................................................................................................................... 61
Indicator 5.1 – Laboratory cytology reporting ................................................................................................ 62 Indicator 5.2 – Accuracy of cytology predicting HSIL ...................................................................................... 74 Indicator 5.3 – Accuracy of negative cytology reports ................................................................................... 80 Indicator 5.4 – Histology Reporting ................................................................................................................ 84 Indicator 5.5 - Laboratory turnaround times .................................................................................................. 95
INDICATOR 6 – FOLLOW-UP WOMEN HIGH-GRADE CYTOLOGY, NO HISTOLOGY ................................................................... 101 INDICATOR 7 – COLPOSCOPY INDICATORS ................................................................................................................... 116
Indicator 7.1 – Timeliness of colposcopic assessment – high-grade cytology .............................................. 117 Indicator 7.2 – Timeliness of colposcopic assessment – low-grade cytology ............................................... 125 Indicator 7.3 – Adequacy of documenting colposcopy assessment .............................................................. 131 Indicator 7.4 – Timeliness and appropriateness of treatment...................................................................... 137 Indicator 7.5 – Timely discharging of women after treatment ..................................................................... 146
INDICATOR 8 – HPV TESTS ...................................................................................................................................... 150 Indicator 8.1 – Triage of low-grade cytology ................................................................................................ 151 Indicator 8.2 – HPV test volumes .................................................................................................................. 164 Indicator 8.3 – HPV tests for follow-up of women with a historical high-grade abnormality ...................... 174
APPENDIX A – ADDITIONAL DATA ................................................................................................................... 150
INDICATOR 1 - COVERAGE ........................................................................................................................................ 181 Indicator 1.1 – Three-year coverage ............................................................................................................. 181 Indicator 1.2 – Regularity of screening ......................................................................................................... 194
INDICATOR 2 – FIRST SCREENING EVENTS .................................................................................................................... 199 INDICATOR 3 – WITHDRAWAL RATES ......................................................................................................................... 203 INDICATOR 4 – EARLY RE-SCREENING ......................................................................................................................... 204 INDICATOR 5 – LABORATORY INDICATORS ................................................................................................................... 206
Indicator 5.1 – Laboratory cytology reporting .............................................................................................. 206 Indicator 5.2 – Accuracy of cytology predicting HSIL .................................................................................... 207 Indicator 5.4 – Histology Reporting .............................................................................................................. 209 Indicator 5.5 – Laboratory turnaround time ................................................................................................. 214
INDICATOR 6 – FOLLOW-UP OF WOMEN WITH HIGH-GRADE CYTOLOGY ............................................................................. 217 INDICATOR 7 – COLPOSCOPY INDICATORS ................................................................................................................... 219
Indicator 7.1 – Timeliness of colposcopic assessment – high-grade cytology .............................................. 219 Indicator 7.2 – Timeliness of colposcopic assessment – low-grade cytology ............................................... 221 Indicator 7.3 – Adequacy of documenting colposcopic assessment ............................................................. 223
National Cervical Screening Programme – Monitoring Report – Number 52 Page iv
Indicator 7.5 – Timely discharge of women after treatment ........................................................................ 226 INDICATOR 8 – HPV TESTS ...................................................................................................................................... 228
Indicator 8.1 – Triage of low-grade cytology ................................................................................................ 228 Indicator 8.2 – HPV test volumes .................................................................................................................. 231 Indicator 8.3 –HPV tests for follow-up of women with a historical high-grade abnormality ....................... 235
APPENDIX B – BETHESDA 2001 NEW ZEALAND MODIFIED .............................................................................. 240
APPENDIX C – SNOMED CATEGORIES FOR HISTOLOGICAL SAMPLES ............................................................... 242
APPENDIX D – INDICATOR DEFINITIONS TARGETS AND REPORTING DETAILS ................................................. 244
POSITIVE PREDICTIVE VALUE CALCULATIONS ................................................................................................................. 244
APPENDIX E – DHB ASSIGNMENT FOR COLPOSCOPY CLINICS .......................................................................... 245
APPENDIX F – GLOSSARY ................................................................................................................................ 247
REFERENCES .................................................................................................................................................... 248

National Cervical Screening Programme – Monitoring Report – Number 52 Page v
List of Tables Table 1 - Satisfactory and unsatisfactory cytology reporting by laboratory (1 July – 31 December
2019) ...................................................................................................................................... 68
Table 2 - Laboratory cytology reporting by general result (1 July – 31 December 2019) – percentage of satisfactory samples ....................................................................................... 68
Table 3 - Laboratory cytology reporting by type of cytological category (1 July – 31 December 2019) – counts of all satisfactory samples ............................................................................. 69
Table 4 - Laboratory cytology reporting by cytological category (1 July – 31 December 2019) – percentage of all satisfactory samples ................................................................................... 69
Table 5 - Laboratory reporting of cytological category by five-year age group (1 July – 31 December 2019) – counts of all satisfactory samples ........................................................... 70
Table 6 - Laboratory reporting of cytological category by five-year age group (1 July – 31 December 2019) – percentage of all satisfactory samples in women of that age group ...... 71
Table 7 - Histology results reporting by SNOMED category .......................................................... 88
Table 8 - Histology results reporting by diagnostic category ........................................................ 89
Table 9 - Histology results by age – counts .................................................................................... 90
Table 10 - Histology results by age – percentages ......................................................................... 91
Table 11 - Histology results reporting by diagnostic category excluding samples from partial* or total hysterectomy specimens and where the result was negative/ benign. ....................... 92
Table 12 - Women with a histology report within 90 and 180 days of a high-grade cytology report, by DHB ..................................................................................................................... 107
Table 13 - Women with a histology report within 90 and 180 days of a high-grade cytology report, by age ....................................................................................................................... 108
Table 14 - Women with a histology report within 90 days of a high-grade cytology report, by DHB and ethnicity ........................................................................................................................ 108
Table 15 - Women with a histology report within 180 days of a high-grade cytology report, by DHB and ethnicity ................................................................................................................ 109
Table 16 - Women with high-grade cytology who have follow-up within 90 and 180 days recorded on the NCSP Register, by urgency of referral and type of follow-up ................... 109
Table 17 - Women without any follow-up test within 90 and 180 days of a high-grade cytology report recorded on the NCSP Register, by DHB ................................................................... 111
Table 18 - Women without any follow-up test within 180 days of a high-grade cytology report recorded on the NCSP Register, by ethnicity ....................................................................... 111
Table 19 - Women with a high-grade cytology report (suspicion of invasive disease), accepted referral and colposcopy visit, by ethnicity ........................................................................... 122
Table 20 - Timeliness and appropriateness of treatment, by DHB .............................................. 143
Table 21 - Timeliness and appropriateness of treatment, by ethnicity ....................................... 144

National Cervical Screening Programme – Monitoring Report – Number 52 Page vi
Table 22 - Timeliness and appropriateness of treatment, by age ............................................... 144
Table 23 - Timeliness and appropriateness of treatment (HSIL), by age (20-69) and ethnicity .. 145
Table 24 - Timeliness and appropriateness of treatment (LSIL), by age (20-69) and ethnicity ... 145
Table 25 - HPV triage test results following ASC-US cytology, by age and cytology laboratory . 158
Table 26 - HPV triage test results following LSIL cytology, by age and cytology laboratory ....... 159
Table 27 - Three-year coverage by DHB (women 25-69 years screened in the three years prior to 31 December 2019, hysterectomy adjusted) ...................................................................... 181
Table 28 - Three-year coverage by ethnicity (women 25-69 years screened in the three years prior 31 December 2019, hysterectomy adjusted) .............................................................. 181
Table 29 - Three-year coverage by age (women 20-69 years screened in the three years prior to 31 December 2019, hysterectomy adjusted) ...................................................................... 182
Table 30 – Three-year coverage (women aged 25-69 years screened in the three years prior to 31 December 2019, hysterectomy adjusted), by ethnicity and DHB ................................... 183
Table 31 – Three-year coverage (women aged 25-69 years screened in the three years prior to 31 December 2019 hysterectomy adjusted), by ethnicity and age ..................................... 184
Table 32 - Coverage by DHB (women aged 25-69 years screened in the five years prior to 31 December 2019, hysterectomy adjusted) ........................................................................... 185
Table 33 - Coverage by ethnicity – women aged 25-69 years screened in the five years prior to 31 December 2019, hysterectomy adjusted ............................................................................. 185
Table 34 - Coverage by age (women 20-69 years screened in the five years prior to 31 December 2019, hysterectomy adjusted) ............................................................................................. 186
Table 35 - Women aged 25-69 years screened in the five years prior to 31 December 2019, by ethnicity and DHB (hysterectomy adjusted) ........................................................................ 187
Table 36 - Women under 20 years of age, and aged 15-19 years, screened in the three years prior to 31 December 2019, by DHB. ................................................................................... 188
Table 37 - Women screened under 20 years of age, as a proportion of all women screened in the three years to 31 December 2019, by DHB ......................................................................... 189
Table 38 - Women screened under 20 years of age, and women aged 18-19 years when they were screened, in the three years to 31 December 2019, by DHB ..................................... 190
Table 39 - Women (25-69 years) screened in the three years to 31 December 2019, as a percentage of the i) hysterectomy-adjustment NZ female population and ii) total NZ female population, by DHB .............................................................................................................. 191
Table 40 - Trends in three-year coverage by DHB (women screened in the previous three years, as a percentage of the hysterectomy-adjusted female population) ................................... 192
Table 41 - Trends in three-year coverage by age (women screened in the previous three years, as a percentage of the hysterectomy-adjusted female population) ....................................... 192
Table 42 - Trends in three-year coverage by ethnicity (women screened in the previous three years, as a percentage of the hysterectomy-adjusted female population)......................... 193
Table 43 - Routine (3-yearly) repeat screening interval (number of cytology tests), by ethnicity, 2015-2019 ............................................................................................................................ 194

National Cervical Screening Programme – Monitoring Report – Number 52 Page vii
Table 44 - Routine (3-yearly) repeat screening interval (number of cytology tests), by age, 2015-2019 ..................................................................................................................................... 195
Table 45 - 12 month repeat screening interval (number of cytology tests), by ethnicity, 2015-2019 ..................................................................................................................................... 196
Table 46 - 12 month repeat screening interval (number of cytology tests), by age, 2015-2019 197
Table 47 - Timeliness of re-attendance in 2015 and 2019 following a routine (3-year) repeat screening recommendation, by ethnicity ............................................................................ 198
Table 48 - Timeliness of re-attendance in 2015 and 2019 following a routine (3-year) repeat screening recommendation, by age .................................................................................... 198
Table 49 - Age distribution of first screening events for period 1 July - 31 December 2019 ...... 199
Table 50 - Women (ages 20-69 years) with first screening events as a proportion of total number of women with screening events 31 December 2019 ......................................................... 199
Table 51 - Women (aged 20-69 years) with first screening events as a proportion of i) total number of women with screening events, and ii) eligible women, by DHB, for period 1 July - 31 December 2019. .............................................................................................................. 201
Table 52 - Women (ages 20-69 years) with first screening events as a proportion of i) total number of women with screening events, and ii) eligible women, by ethnicity, for period 1 July - 31 December 2019 ...................................................................................................... 201
Table 53 – 25th and 75th Percentile, median and mean age of women with a first screening event, by ethnicity, for period 1 July - 31 December 2019 ............................................................. 202
Table 54 - Number of women who withdrew from the NCSP Register 1 July – 31 December 2019 by age, and proportion of women who were enrolled at the start of the monitoring period who withdrew ...................................................................................................................... 203
Table 55 - Number of women (aged 20-69 years) who withdrew from the NCSP Register Jan - 31 December 2019 by ethnicity, and proportion of women who were enrolled at the start of the monitoring period who withdrew ................................................................................. 203
Table 56 - Early re-screening by five-year age group .................................................................. 204
Table 57 - Early re-screening by DHB ........................................................................................... 204
Table 58 - Early re-screening by ethnicity .................................................................................... 205
Table 59 - Age-standardised percentage of satisfactory cytology samples reported as HSIL, by laboratory ............................................................................................................................. 206
Table 60 - Positive predictive value of a report of HSIL + SC cytology by laboratory .................. 207
Table 61 - Positive predictive value of a report of ASC-H cytology by laboratory ....................... 207
Table 62 - Positive predictive value of a report of ASC-H + HSIL + SC cytology by laboratory .... 208
Table 63 - Rate of women with CIN 2/3 per 1,000 women screened, by age and ethnicity and for NZ overall, 1 July – 31 December 2019 ................................................................................ 209
Table 64 - Rate of women, per 1,000 women screened, with CIN 2/3 histology, by age and ethnicity, July-Dec 2007 to Jul-Dec 2019 ............................................................................. 210
Table 65 - Number of women screened, by age and ethnicity, July-Dec 2007 to Jan-Jun 2019 . 212
Table 66 - Timeliness of cytology reporting by laboratory, 31 December 2019 ......................... 214

National Cervical Screening Programme – Monitoring Report – Number 52 Page viii
Table 67 - Timeliness of histology reporting by laboratory, 31 December 2019 ........................ 215
Table 68 - Timeliness of reporting for cytology with associated HPV testing by laboratory, 31 December 2019 .................................................................................................................... 216
Table 69 - Women with a histology report within 90 days of a high-grade cytology report, by DHB and age ................................................................................................................................. 217
Table 70 - Women with a histology report within 180 days of a high-grade cytology report, by DHB and age ......................................................................................................................... 218
Table 71 - Women with high-grade cytology (including cytological suspicion of invasive disease), by DHB .................................................................................................................................. 219
Table 72 - Women with a high-grade cytology report (no suspicion of invasive disease), accepted referral and a colposcopy visit within 20 and 40 working days, by ethnicity ...................... 219
Table 73 - Women with a high-grade cytology report (no suspicion of invasive disease), accepted referral and a colposcopy visit within 20 and 40 working days, by DHB ............................. 220
Table 74 - Women with cytological suspicion of invasive disease, by cytology result subcategory .............................................................................................................................................. 220
Table 75 - Follow-up of women with persistent low-grade cytology/ low-grade cytology and positive hrHPV test, by DHB ................................................................................................. 221
Table 76 - Follow-up of women with persistent low-grade cytology/ low-grade cytology and positive hrHPV test, by ethnicity .......................................................................................... 222
Table 77 - Completion of colposcopic assessment fields, by DHB ............................................... 223
Table 78 - Summary of colposcopic appearance findings, by DHB .............................................. 224
Table 79 - Biopsies by colposcopic appearance and DHB ............................................................ 225
Table 80 - Follow-up of treated women with colposcopy and cytology in the period up to nine months post-treatment, and discharge of eligible women ................................................. 226
Table 81 - Follow-up of treated women in the period up to nine months post-treatment ........ 227
Table 82 - Triage testing of women with ASC-US cytology .......................................................... 228
Table 83 - Triage testing of women with LSIL cytology ............................................................... 229
Table 84 - Histological outcomes within 12 months in women with ASC-US cytology and positive HPV triage test ..................................................................................................................... 229
Table 85 - Histological outcomes within 12 months in women with LSIL cytology and positive HPV triage test ............................................................................................................................. 230
Table 86 - Volume of HPV test samples received during the monitoring period, by laboratory 231
Table 87 - Invalid HPV tests, by laboratory .................................................................................. 231
Table 88 - Validity of HPV triage tests, by test technology .......................................................... 231
Table 89 - Volume of HPV test samples received during the monitoring period, by purpose and ethnicity ............................................................................................................................... 232
Table 90 - Volume of HPV test samples received during the monitoring period, by purpose and age ........................................................................................................................................ 232

National Cervical Screening Programme – Monitoring Report – Number 52 Page ix
Table 91 - Volume of HPV test samples received during the monitoring period, by purpose and laboratory ............................................................................................................................. 233
Table 92 - HPV test samples collected at colposcopy, in relation to total colposcopies performed in the period, by DHB ........................................................................................................... 234
Table 93 - Women eligible for and proportion who have received HPV testing for a historical high-grade abnormality, by age at 31 December 2019 ....................................................... 235
Table 94 - Women eligible for and proportion who have received historical HPV testing, by DHB .............................................................................................................................................. 236
Table 95 - Women eligible for and proportion who have received historical HPV testing, by ethnicity ............................................................................................................................... 236
Table 96 - Women screened in the previous five years and proportion of women with historical round 1 and 2 tests recorded, by DHB ................................................................................. 239
Table 97 - Definition used for positive predictive value calculations .......................................... 244

National Cervical Screening Programme – Monitoring Report – Number 52 Page x
List of Figures Figure 1 - Three-year coverage by ethnicity (women 25-69 years screened in the three years
prior to 31 December 2019, as a proportion of hysterectomy-adjusted female population) ................................................................................................................................................ 22
Figure 2 - Three-year coverage by five-year age group (women 20-69 years screened in the three years prior to 31 December 2019, as a proportion of hysterectomy-adjusted female population) ............................................................................................................................. 22
Figure 3 - Three-year coverage by DHB (women 25-69 years screened in the three years prior to 31 December 2019, as a proportion of hysterectomy-adjusted female population) ........... 23
Figure 4 - Three-year coverage in Māori women (women 25-69 years screened in the three years prior to 31 December 2019, as a proportion of hysterectomy-adjusted female population), by DHB .................................................................................................................................... 23
Figure 5 - Three-year coverage in Pacific women (women 25-69 years screened in the three years prior to 31 December 2019, as a proportion of hysterectomy-adjusted female population), by DHB ............................................................................................................... 24
Figure 6 - Three-year coverage in Asian women (women 25-69 years screened in the three years prior to 31 December 2019, as a proportion of hysterectomy-adjusted female population), by DHB .................................................................................................................................... 24
Figure 7 - Three-year coverage in European/ Other women (women 25-69 years screened in the three years prior to 31 December 2019, as a proportion of hysterectomy-adjusted female population), by DHB ............................................................................................................... 25
Figure 8 - Three-year coverage (women 25-69 years screened in the three years prior to 31 December 2019, as a proportion of hysterectomy-adjusted female population), by ethnicity and five-year age group ......................................................................................................... 25
Figure 9 - Five-year coverage by DHB (women screened in the five years prior to 31 December 2019, as a proportion of hysterectomy-adjusted female population) .................................. 26
Figure 10 - Five-year coverage by five-year age-group (women screened in the five years prior to 31 December 2019, as proportion of hysterectomy-adjusted female population) .............. 26
Figure 11 - Five-year coverage by ethnicity (women screened in the five years prior to 31 December 2019, as a proportion of hysterectomy-adjusted female population) ................ 27
Figure 12 - Five-year coverage in Māori women (women 25-69 years screened in the five years prior to 31 December 2019, as a proportion of hysterectomy-adjusted female population), by DHB .................................................................................................................................... 27
Figure 13 - Five-year coverage in Pacific women (women 25-69 years screened in the five years prior to 31 December 2019, as a proportion of hysterectomy-adjusted female population), by DHB .................................................................................................................................... 28
Figure 14 - Five-year coverage in Asian women (women 25-69 years screened in the five years prior to 31 December 2019, as a proportion of hysterectomy-adjusted female population), by DHB .................................................................................................................................... 28
Figure 15 - Five-year coverage in European/ Other women (women 25-69 years screened in the five years prior to 31 December 2019, as a proportion of hysterectomy-adjusted female population), by DHB ............................................................................................................... 29

National Cervical Screening Programme – Monitoring Report – Number 52 Page xi
Figure 16 - Number of women screened who were aged less than 20 years at the time of their cervical sample in the three years to 31 December 2019, by DHB ....................................... 29
Figure 17 - Trends in three-year coverage by DHB (women aged 25-69 years screened in the previous three years, as a proportion of hysterectomy-adjusted female population) ......... 30
Figure 18 - Trends in three-year coverage by age (women screened in the previous three years, as a proportion of hysterectomy-adjusted female population)* .......................................... 30
Figure 19 - Trends in three-year coverage by ethnicity (women aged 25-69 years screened in the previous three years, as a proportion of hysterectomy-adjusted female population)* ....... 31
Figure 20 - Trends in the number of women screened in the preceding three years who were aged less than 20 years at the time of their cervical sample, by DHB ................................... 31
Figure 21 - Trends in the percent of women aged less than 20 years at the time of their cervical sample who were aged 18 or 19 years, by DHB .................................................................... 32
Figure 22 - Timeliness of re-attendance in 2019 following a routine (3-year) repeat screening recommendation ................................................................................................................... 38
Figure 23 - Timeliness of re-attendance following a routine (3-year) repeat screening recommendation among women re-attending for screening in 2019, by ethnicity ............. 38
Figure 24 - Timeliness of re-attendance in 2019 following a routine (3-year) repeat screening recommendation among women re-attending for screening in 2019, by age...................... 39
Figure 25 - Timeliness of re-attendance among women re-attending for screening in 2019 following a 12-month repeat screening recommendation .................................................... 39
Figure 26 - Timeliness of re-attendance among women re-attending for screening in 2019 following a 12-month repeat screening recommendation, by ethnicity ............................... 40
Figure 27 - Timeliness of re-attendance among women re-attending for screening in 2019 following a 12-month repeat screening recommendation, by age ....................................... 40
Figure 28 - Trends in the timeliness of re-attendance following a routine (3-year) repeat screening recommendation ................................................................................................... 41
Figure 29 - Timeliness of re-attendance following a routine (3-year) repeat screening recommendation (percent), 2015-2019, by ethnicity ........................................................... 42
Figure 30 - Timeliness of re-attendance following a routine (3-year) repeat screening recommendation (percent), 2015-2019, by age .................................................................... 42
Figure 31 - Trends in the timeliness of re-attendance following a 12-month repeat screening recommendation ................................................................................................................... 43
Figure 32 - Timeliness of re-attendance following a 12-month repeat screening recommendation (percent), 2015-2019, by ethnicity ........................................................................................ 44
Figure 33 - Timeliness of re-attendance following a 12-month repeat screening recommendation (percent), 2015-2019, by age ................................................................................................. 44
Figure 34 - Women with first screening events during the monitoring period, by five-year age group (women aged 20-69 years at 31 December 2019) ...................................................... 47
Figure 35 - Women with first screening events as a proportion of all women screened in that age group during the monitoring period, by five-year age group (women aged 20-69 years at 31 December 2019) ..................................................................................................................... 47

National Cervical Screening Programme – Monitoring Report – Number 52 Page xii
Figure 36 - Women with first screening events as a proportion of all women screened during the monitoring period, by DHB (women aged 20-69 years at 31 December 2019) .................... 48
Figure 37 - Women with first screening events as a proportion of all women screened during the monitoring period, by ethnicity (women aged 20-69 years at 31 December 2019) ............. 48
Figure 38 - Trends in the number of women with a first screening event, by age ........................ 49
Figure 39 - Trends in the number of women with a first screening event, by DHB ...................... 49
Figure 40 - Trends in the number of women with a first screening event, by ethnicity ............... 50
Figure 41 - Number of women (aged 20-69 years) who withdrew from the NCSP Register by DHB, 1 July – 31 December 2019 .................................................................................................... 53
Figure 42 - Number of women who withdrew from the NCSP Register by age, 1 July – 31 December 2019. ..................................................................................................................... 53
Figure 43 - Number of women (aged 20-69 years) who withdrew from the NCSP Register by ethnicity, 1 July – 31 December 2019 .................................................................................... 54
Figure 44 - Proportion of women recommended to return at the routine interval (three years) who were re-screened early, by DHB .................................................................................... 58
Figure 45 - Proportion of women recommended to return at the routine interval (three years) who were re-screened early, by five-year age group ............................................................ 58
Figure 46 - Proportion of women recommended to return at the routine interval (three years) who were re-screened early, by ethnicity ............................................................................. 59
Figure 47 - Trends in the proportion of women recommended to return at the routine interval (three years) who were re-screened early, by DHB ............................................................... 59
Figure 48 - Trends in the proportion of women recommended to return at the routine interval (three years) who were re-screened early, by age ................................................................ 60
Figure 49 - Trends in the proportion of women recommended to return at the routine interval (three years) who were re-screened early, by ethnicity ........................................................ 60
Figure 50 - Proportion of total LBC samples reported as unsatisfactory by laboratory, 1 July – 31 December 2019 ...................................................................................................................... 66
Figure 51 - Proportion of total satisfactory samples reported as negative by laboratory, ........... 66
Figure 52 - Proportion of total satisfactory samples reported as abnormalities by laboratory, 1 July – 31 December 2019 ....................................................................................................... 67
Figure 53 - Proportion of total satisfactory samples reported as HSIL by laboratory, 1 July – 31 December 2019 ...................................................................................................................... 67
Figure 54 - Trends in the proportion of total satisfactory samples reported as HSIL (last four monitoring periods), by age ................................................................................................... 72
Figure 55 - Longer term trends in the proportion of total satisfactory samples reported as ASC-H or HSIL (to 1 July – 31 December 2019) ................................................................................. 72
Figure 56- Longer term trends in the proportion of total satisfactory samples reported as HSIL (to 1 July – 31 December 2019), selected age groups ................................................................. 73
Figure 57 - Trends in the proportion of total satisfactory samples reported as HSIL, by laboratory ................................................................................................................................................ 73

National Cervical Screening Programme – Monitoring Report – Number 52 Page xiii
Figure 58 - Positive predictive value for CIN 2+ in women with HSIL or SC cytology reports (i.e. collected from 1 January – 30 June 2019 inclusive), by laboratory ....................................... 77
Figure 59 - Positive predictive value for CIN 2+ in women with other high-grade cytology results (i.e. collected from 1 January – 30 June 2019 inclusive), by laboratory ................................ 77
Figure 60 - Trends in the positive predictive value for CIN 2+ in women with HSIL or SC cytology results, by laboratory ............................................................................................................. 78
Figure 61 - Trends in the positive predictive value for CIN 2+ in women with ASC-H cytology results, by laboratory ............................................................................................................. 78
Figure 62 - Trends in the positive predictive value for CIN 2+ in women with ASC-H, HSIL or SC cytology results, by laboratory .............................................................................................. 79
Figure 63 - Rate of women with CIN 2/3 per 1,000 women screened, by age and ethnicity for the period 1 July – 31 December 2019......................................................................................... 93
Figure 64 - Trends in the age standardised rate of women with CIN 2/3 per 1,000 women screened, by ethnicity ............................................................................................................ 93
Figure 65 - Longer term trends in the rate of women with CIN 2/3 per 1,000 women screened, by age .......................................................................................................................................... 94
Figure 66 – Longer term trends in the rate of women with CIN 2/3 per 1,000 women screened, by ethnicity and selected ages ............................................................................................... 94
Figure 67 - Proportion of cytology samples reported within seven working days by laboratory, 1 July to 31 December 2019 ..................................................................................................... 98
Figure 68 - Proportion of cytology samples reported within 15 working days by laboratory, 1 July to 31 December 2019 ............................................................................................................ 98
Figure 69 - Proportion of histology samples reported within ten working days by laboratory, 1 July to 31 December 2019 ..................................................................................................... 99
Figure 70 - Proportion of histology samples reported within 15 working days by laboratory, 1 July to 31 December 2019 ............................................................................................................ 99
Figure 71 - Proportion of cytology samples with associated HPV triage testing and of all cytology samples reported within 15 days by laboratory, 1 July to 31 December 2019 ................... 100
Figure 72 - Proportion of women (ages 20-69) with a histology report within 90 days, and within 180 days of their high-grade cytology report, by DHB ........................................................ 107
Figure 73 - Proportion of women without any follow-up test within 90 days and within 180 days of a high-grade cytology report recorded on the NCSP Register, by DHB ........................... 110
Figure 74 - Proportion of women without any follow-up test within 90 days and within 180 days of a high-grade cytology report recorded on the NCSP Register, by ethnicity .................... 110
Figure 75 – Trends in the proportion of women with high-grade cytology who have follow-up within 90 days recorded on the NCSP Register, by DHB ...................................................... 112
Figure 76 – Trends in the proportion of women with high-grade cytology who have follow-up within 180 days recorded on the NCSP Register, by DHB.................................................... 112
Figure 77 - Trends in the proportion of women with high-grade cytology who have follow-up within 90 days recorded on the NCSP Register, by ethnicity .............................................. 113

National Cervical Screening Programme – Monitoring Report – Number 52 Page xiv
Figure 78 - Trends in the proportion of women with high-grade cytology who have follow-up within 180 days recorded on the NCSP Register, by ethnicity ............................................ 113
Figure 79 - Trends in the proportion of women with high-grade cytology who have follow-up within 90 days recorded on the NCSP Register, by age group ............................................ 114
Figure 80 - Trends in the proportion of women with high-grade cytology who have follow-up within 180 days recorded on the NCSP Register, by age group .......................................... 114
Figure 81 - Trends in the proportion of women with high-grade cytology who have no follow-up within 90 days recorded on the NCSP Register, by DHB ...................................................... 115
Figure 82 - Trends in the proportion of women with high-grade cytology who have no follow-up within 180 days recorded on the NCSP Register, by DHB.................................................... 115
Figure 83 - Percentage of women with a high-grade cytology (no suspicion of invasive disease) with a colposcopy visit within 20 and 40 working days, by ethnicity .................................. 122
Figure 84 - Percentage of women with a high-grade cytology (no suspicion of invasive disease) with a colposcopy visit within 20 and 40 working days, by DHB ......................................... 123
Figure 85 – Trends of the proportion of women with a high-grade cytology report (no suspicion of invasive disease) seen within 4 weeks (20 working days), by ethnicity .......................... 123
Figure 86 – Trends of the proportion of women with a high-grade cytology report (no suspicion of invasive disease) seen within 4 weeks (20 working days), by DHB ................................. 124
Figure 87 - Follow-up recorded* for women with persistent LG cytology/ LG cytology and positive hrHPV test, by DHB ................................................................................................. 128
Figure 88 - Follow-up recorded* for women with persistent LG cytology/ LG cytology and positive hrHPV test, by ethnicity .......................................................................................... 128
Figure 89 - Women with persistent LG cytology/ LG cytology and positive hrHPV test and an accepted referral for colposcopy: percentage with a colposcopy visit recorded within 26 weeks of the date the referral was accepted, by DHB ........................................................ 129
Figure 90 - Women with persistent LG cytology or LG cytology and positive hrHPV test and an accepted referral for colposcopy: percentage with a colposcopy visit recorded within 26 weeks of the date the referral was accepted, by ethnicity ................................................. 129
Figure 91 - Trends in the proportion of women with persistent LG cytology or LG cytology and positive hrHPV test and an accepted referral for colposcopy who have a colposcopy visit recorded within 26 weeks of the date the referral was accepted, by DHB ......................... 130
Figure 92 - Trends in proportion of women with persistent LG cytology or LG cytology and positive hrHPV test and an accepted referral for colposcopy who have a colposcopy visit recorded within 26 weeks of the date the referral was accepted, by ethnicity .................. 130
Figure 93 - Completion of colposcopic assessment fields, by DHB ............................................. 135
Figure 94 - Trends in the completion of all required colposcopic assessment fields, by DHB .... 135
Figure 95 - Trends in the number of colposcopies recorded on the NCSP Register, by DHB ...... 136
Figure 96 - Proportion of women treated within eight weeks of histological confirmation of HSIL, by DHB .................................................................................................................................. 140
Figure 97 - Proportion of women treated within eight weeks of histological confirmation of HSIL, by ethnicity ........................................................................................................................... 140

National Cervical Screening Programme – Monitoring Report – Number 52 Page xv
Figure 98 - Proportion of women treated within eight weeks of histological confirmation of HSIL, by age ................................................................................................................................... 141
Figure 99 - Trends in the proportion of women treated within eight weeks of histological confirmation of HSIL, by DHB ............................................................................................... 141
Figure 100 - Timeliness and appropriateness of treatment (HSIL), by age (20-69) and ethnicity 142
Figure 101 - Percentage of women treated with colposcopy, and both colposcopy and cytology, within nine months post-treatment, by DHB ...................................................................... 149
Figure 102 - Percentage of women discharged appropriately within 12 months of treatment, by DHB ...................................................................................................................................... 149
Figure 103 - Proportion of women (aged 30 years or more) with low-grade cytology who have a subsequent HPV test, by laboratory and cytology result .................................................... 156
Figure 104 - Proportion of HPV triage tests which are positive following ASC-US cytology (women aged 30 years or more), by cytology laboratory .................................................................. 156
Figure 105 - Proportion of HPV triage tests which are positive following LSIL cytology (women aged 30 years or more), by cytology laboratory .................................................................. 157
Figure 106 - Proportion of women with an HPV triage test who are HPV positive, by age and cytology result ...................................................................................................................... 157
Figure 107 – Triage-positive women with histologically-confirmed CIN 2+ within 12 months, as a percentage of all women with histology, by laboratory ...................................................... 160
Figure 108 – Triage-positive women with histologically-confirmed CIN 2+ within 12 months, as a percentage of all women who attended colposcopy, by laboratory ................................... 160
Figure 109 - Women with histologically-confirmed CIN 2+ within 12 months, as a percentage of all women who attended colposcopy, by laboratory and referral cytology........................ 161
Figure 110 – Triage-positive women with histologically-confirmed CIN 2+ within 12 months, as a percentage of women with histology recorded, by age ...................................................... 161
Figure 111 – Triage-positive women with histologically-confirmed CIN 2+ within 12 months, as a percentage of women with colposcopy recorded, by age................................................... 162
Figure 112 – Trends in ASC-US triage-positive women with histologically-confirmed CIN 2+ within 12 months, as a percentage of women with colposcopy recorded, by laboratory ............. 162
Figure 113 – Trends in LSIL triage-positive women with histologically-confirmed CIN 2+ within 12 months, as a percentage of women with colposcopy recorded, by laboratory .................. 163
Figure 114 - Volume of HPV test samples received by laboratories during the monitoring period, by age ................................................................................................................................... 169
Figure 115 - Volume of HPV test samples received by laboratories during the monitoring period, by laboratory ........................................................................................................................ 169
Figure 116 - HPV test samples as a percentage of cytology test samples received during the monitoring period, by laboratory ........................................................................................ 170
Figure 117 - Volume of HPV test samples received during the monitoring period, by purpose . 170
Figure 118 - HPV test samples received during the monitoring period, by purpose and age ..... 171

National Cervical Screening Programme – Monitoring Report – Number 52 Page xvi
Figure 119 - HPV test samples received during the monitoring period, by purpose and laboratory .............................................................................................................................................. 171
Figure 120 - HPV test samples collected at colposcopy, in relation to total colposcopies* performed in the period, by DHB......................................................................................... 172
Figure 121 - Trends in volumes of HPV test samples received, by laboratory ............................ 172
Figure 122 - Trends in volumes of HPV test samples received, by purpose ................................ 173
Figure 123 - Trends in HPV test samples collected at colposcopy, in relation to total colposcopies* performed in the period, by DHB ................................................................. 173
Figure 124 - Proportion of eligible women with squamous high-grade abnormality more than 3 years ago for whom an historical test is recorded on the NCSP Register, by age at 31 December 2019 .................................................................................................................... 178
Figure 125 - Proportion of eligible women with squamous high-grade abnormality more than 3 years ago for whom an historical test is recorded on the NCSP Register, by DHB at 31 December 2019 .................................................................................................................... 178
Figure 126 - Proportion of eligible women with squamous high-grade abnormality more than 3 years ago for whom an historical test is recorded on the NCSP Register, by ethnicity at 31 December 2019. ................................................................................................................... 179
Figure 127 - Trends in the proportion of eligible women with squamous high-grade abnormality more than 3 years ago for whom a round 1 historical test is recorded on the NCSP Register, by DHB .................................................................................................................................. 179
Figure 128 - Trends in the proportion of eligible women with squamous high-grade abnormality more than 3 years ago for whom a round 1 historical test is recorded on the NCSP Register, by ethnicity ........................................................................................................................... 180
Figure 129 - Trends in the proportion of eligible women with squamous high-grade abnormality more than 3 years ago for whom a round 1 historical test is recorded on the NCSP Register, by age ................................................................................................................................... 180
Figure 130 - Proportion of population* in that age group with their first screening event during the monitoring period (women aged 20-69 years at 31 December 2019) .......................... 200
Figure 131 - Trends in histologically-confirmed HSIL as a percentage of all women with histology (To 1 July 2011 – 31 December 2019). ................................................................................. 209
Figure 132 - Number of women eligible for historical testing within a DHB versus the percentage with a Round 1 historical HPV test recorded ....................................................................... 237
Figure 133 - Relationship between women screened in the previous five years and proportion of women with historical tests recorded, by DHB ................................................................... 237
Figure 134 - Relationship between women screened in the previous five years and proportion of women with historical tests recorded, by ethnicity ............................................................ 238

National Cervical Screening Programme – Monitoring Report – Number 52 Page 1
1. Executive Summary
Purpose This report provides data on performance indicators of the National Cervical Screening Programme (NCSP) for the period 1 July to the 31 December 2019.
Key points on performance/trends
Indicator 1 Coverage
Indicator 1.1
Three-year coverage
Target: 80% of eligible women screened within the previous three years.
• Among an estimated 1,314,891 eligible women aged 25-69 years at the end of the monitoring period, 950,679 (72.3%) had a screening test in the previous three years.
• The coverage target was not met nationally (80% of women aged 25-69 years screened in the previous three years).
• The coverage target was not met in any five-year age group.
• No DHB met the coverage target.
• Nationally, screening coverage targets were not met in any ethnic group (European/ Other: 78.9%; Māori: 58.7%; Pacific: 65.7%; Asian: 61.7%).
• Three-year coverage among women aged 25-69 years (72.3%) is higher than that reported in the previous monitoring report (71.4%).
• Three-year coverage is lower in four of the ten age groups, one ethnic group and fourteen of the twenty DHBs.
• Five-year coverage among women aged 25-69 years (86.2%) is higher than that reported in the previous monitoring report (85.5%).
• Five-year coverage among women aged 25-69 years exceeded 80% in all twenty DHBs, in Pacific and European/ Other women, and in all five-year age groups between 30-69 years.
Screens in women aged less than 20 years
Target: None
• In the three years to 31 December 2019, 4,179 women had a cervical sample taken when they were aged less than 20 years. This is fewer than in the previous monitoring period (4,499 women).
• This represents 0.4% of all women (of any age) who were screened in the three-year period (which is similar to the previous monitoring period, 0.4%).
• Most of these women (89.1%) were aged 18-19 years at the time of their cervical sample, similar to the previous monitoring period (89.4%).
National Cervical Screening Programme – Monitoring Report – Number 52 Page 2
Indicator 1.2 Regularity of screening
Target: Not yet defined
Routine screening (3-year recall)
• Among women attending for screening in 2019 following a 3-year recall recommendation, 62.7% were attending on-time; 11.4% more than six months early; and 25.9% more than six months late.
• Between the period 2015 to 2019, the proportion of women who were screened on-time increased in three of the four ethnic groups and increased or remained similar in each of the ten-year age groups. This predominantly reflected a reduction in early re-screening.
• The proportion re-attending more than six months late for their routine screen was consistently higher in Māori and Pacific women than in Asian and European/ Other women, and was generally highest in women aged 30-39 years.
12-month re-screening
• Among women attending for screening in 2019 following a 12-month repeat recommendation, 39.8% were attending on-time; 2.2% more than three months early; and 58.0% more than three months late.
• In all ethnic groups, and all age groups, the majority of women who were re-attending after a recommendation to return in 12 months were re-attending more than three months later than recommended.
• The proportion who were re-attending more than 15 months after a recommendation to return in 12 months was consistently higher in Māori and Pacific women than in Asian and European/ Other women.
• Over the period 2015 to 2019, the proportion of women who were re-attending more than three months early and on-time decreased but the proportion who were re-attending more than three months late for 12-month follow-up increased.
Indicator 2 First screening events
Target: None
• There were 21,091 women who had their first screening event during the current monitoring period – lower than in the previous monitoring period (23,374).
• First screening events generally occur among young women (median age 28 years).
• Asian women appear to have their first screening event at a later age (median age of Asian women attending for their first screening event was 32 years).
• The proportion of women screened who were being screened for the first time was highest for Asian women.

National Cervical Screening Programme – Monitoring Report – Number 52 Page 3
Indicator 3 Withdrawal rates
Target: Zero between ages 20-69 years
• There were six women aged between 20-69 years who withdrew from the NCSP Register during this six-month period. This is fewer than the number of women in this age range who withdrew during the previous monitoring period (12 women).
Indicator 4 Early re-screening
Target: Not yet defined
Currently reporting on the percentage of women in routine screening (previous cytology sample negative and recommended to return in 36 months (3 years) who returned for a cytology sample within 30 months (2.5 years) of their index cytology sample.
• 10.5% of a cohort of women with a recommendation to return at the routine interval had at least one cytology sample within 30 months of their index cytology sample.
• Early re-screening varies widely between DHBs, from 7.3% in Mid Central to 14.4% in Waitemata.
• Early re-screening occurs in all ethnic groups but is most common among European/ Other (10.8%) and least common among Pacific women (8.1%).
• Early re-screening occurs in all age groups, but is most common in women aged 20-24 years at the end of the period (14.7%) and least common in women aged 60-64 years at the end of the period (7.4%).
• Early re-screening has decreased overall since the previous report, from 11.4% to 10.5%.
Indicator 5 Laboratory Indicators
Indicator 5.1 Cytology reporting
Unsatisfactory cytology
Target: 0.1% - 3% for LBC
• The target for the percentage of LBC samples reported as unsatisfactory was met by four of the six laboratories and was met nationally (1.3%). Both of the laboratories that were outside the target range exceeded the upper target of 3%.
• The rate of unsatisfactory LBC samples is only slightly lower than in the previous report (1.4%).
Negative cytology
Target: No more than 96% of satisfactory cytology samples
• The target for the percent of samples reported as negative was met nationally (93.7%) and met by all six laboratories.

National Cervical Screening Programme – Monitoring Report – Number 52 Page 4
• Nationally, the percent of samples which are negative (93.7%) is higher than what was reported in the previous period (93.0%).
Abnormal cytology
Target: No more than 10% of satisfactory cytology samples
• The target for the percent of samples reported as abnormal was met nationally (6.3%) and by five of the six laboratories.
• Nationally, the percent of samples which are abnormal (6.3%) is lower than what was reported in the previous period (7.0%).
HSIL cytology
Target: No less than 0.5% of satisfactory cytology samples
• The target for the percent of HSIL samples was met nationally and met by five of six laboratories.
• Nationally the percent of HSIL samples (0.7%) decreased since the last monitoring report (0.8%). This rate has reduced or remained similar in all ages; however, in women aged 20-24 years this rate is lower than has ever been previously reported.
Indicator 5.2 Cytology positive predictive value
HSIL + SC
Target: 65% - 85% of HSIL+SC cytology samples should be histologically confirmed as high-grade
• Four of the six laboratories met the target range for HSIL + SC.
• Nationally, the positive predictive value of HSIL + SC (80.0%) has increased since the previous monitoring period (76.1%).
Other cytological abnormalities
Target: None
• Nationally, the positive predictive value of ASC-H has increased since the previous report (50.3% in this report, 48.0% in the previous report).
• Nationally, the positive predictive value of the combination of ASC-H + HSIL + SC has increased since the previous report (69.4% in this report, compared to 66.6% in the previous report).
• Nationally, the percent of glandular cytological abnormalities identified as histological high-grade has decreased since the previous report, from 39.9% to 38.1% (however this measure is generally based on a comparatively small number of samples; 139 samples with histology in the current report).

National Cervical Screening Programme – Monitoring Report – Number 52 Page 5
Indicator 5.3 Accuracy of negative cytology reports
Among cytology slides within the 42 months preceding a histological diagnosis of high -grade/invasive disease originally reported as negative, benign/reactive or unsatisfactory:
Target: Not more than 10% identified as HS1, HS2, SC, AIS or AC1-AC5 (HSIL+) on review
• Nationally, 3.4% of slides originally reported as negative, benign/ reactive or unsatisfactory were consistent with HSIL+ on review.
• All laboratories met the target. Target: Not more than 20% identified as ASC-H, HS1, HS2, SC, AG4-AG5, AIS or AC1-AC5 (ASC-H+) on review; aim for less than 15%
• Nationally, 6.4% of slides originally reported as negative, benign/ reactive or unsatisfactory were consistent with ASC-H+ on review.
• All laboratories met the target of less than 20% and achieved rates of less than 15%.
Indicator 5.4 Histology reporting
Target: None
• 12,636 histology samples were taken during the current monitoring period. 478 (3.8%) of these were insufficient for diagnosis.
• Results for most severe histology from 10,851 women with samples which were sufficient for diagnosis are presented.
• 57.9% of women had histology samples which were negative/ benign. This reduced to 46.7% of women when negative/ benign hysterectomy samples (total hysterectomy and partial hysterectomy with cervical component) were excluded.
• 18.8% of women had CIN 2/CIN 3 or HSIL histology results.
• 73 (0.67%) women had histology results indicating adenocarcinoma in situ (AIS).
• 70 (0.65%) women had invasive squamous cell carcinoma (ISCC) histology results, 32 (0.29%) women had adenocarcinomas not arising from the endocervix and 18 women had (0.17%) adenocarcinoma arising from the endocervix histology results. One woman (<0.05%) had an adenosquamous carcinoma histology result.
Indicator 5.5 Turnaround times
Cytology
Target: 90% within seven working days; 98% within 15 working days
• The seven-working-days target for cytology was met nationally (96.2%), and by all six laboratories.
• The 15-working-days target was met nationally (99.3%), and by all six laboratories.

National Cervical Screening Programme – Monitoring Report – Number 52 Page 6
• Performance against the seven-working-days target increased since the previous report (95.8% in the previous report, 96.2% in the current monitoring period).
• The overall percent of cytology samples reported within 15-working-days has increased since the previous report (98.8% in the previous report, 99.3% in the current monitoring period).
Histology
Target: 90% within 10 working days; 98% within 15 working days
• Turnaround time target for histology reporting within 10 working days was not met nationally for (89.9%), but was met by five of fourteen laboratories.
• The target for reporting within 15 working days was not met nationally (95.9%), but was met by six of fourteen laboratories.
• The overall proportion of histology samples reported within 15 days decreased since the previous report (96.2% in the previous report, 95.9% in the current monitoring period).
Low-grade cytology with associated HPV triage testing
Target: 98% within 15 working days
• There were 2,990 cytology samples with associated HPV triage testing in the current monitoring period.
• The 15-working-days target for turnaround time for cytology with associated HPV triage testing was met nationally (99.0%).
• Five of the six laboratories met the target.
Indicator 6 Follow-up of women with high-grade cytology – no histology
Histological follow-up
Target: 90% of women should have a histology report within 90 days of their high-grade cytology report date; 99% should have a histology report within 180 days of their cytology report.
• Targets were not met nationally (for either 90 days or 180 days).
• 79.6% of women had a histology report within 90 days of their high-grade cytology report; 87.7% of women had one within 180 days.
• Three DHBs met the target for histological follow-up within 90 days and no DHBs met the target for 180 days.
• Nationally, the proportion of women with histological follow-up is lower within 90 days (from 81.2% to 79.6%) and slightly lower within 180 days (from 87.8% to 87.7%) since the previous monitoring period.
• Compared to the previous monitoring period, the proportion of women with follow-up histology within 90 days is lower for Māori women (from 82.1% to 80.4%), European/ Other women (from 83.4% to 82.3%), Pacific (from 60.2% to 51.5%) and Asian women (from 77.3% to 74.9%).

National Cervical Screening Programme – Monitoring Report – Number 52 Page 7
• The proportion of women with follow-up histology within 180 days is lower for Pacific and European/ Other women, but higher for Māori and Asian women.
Women with no follow-up tests
Target: None
• Nationally, 223 (11.5%) women have no report of a follow-up test of any kind (colposcopy, subsequent cytology, histology or HPV test) within 90 days of their high-grade cytology report, and 121 (6.3%) women have no follow-up test report within 180 days.
• Nationally, the proportion of women with no record of a follow-up test report at 90 days is higher (from 10.9% in the previous period to 11.5% in the current reporting period) while the proportion at 180 days is unchanged (6.3% in both periods).
• Compared to the previous monitoring period, the proportion of women with no follow-up test recorded at 180 days is lower for Māori women (from 7.2% to 6.4%), European/ Other women (from 5.0% to 4.7%) and Asian women (from 8.1% to 7.3%) but higher for Pacific women (from 16.5% to 24.3%).
Indicator 7 Colposcopy
Indicator 7.1 Timeliness of colposcopic assessment – high-grade cytology
Target: 95% or more of women who have evidence of clinical suspicion of invasive carcinoma, or a suspicion of invasive disease (TBS codes HS2, SC, AC1-AC5), receive colposcopy or a gynaecological assessment within 10 working days of receipt of referral. 95% or more of women who have other high-grade cytology samplecytology sample abnormalities (TBS codes ASH, HS1, AG1-AG5, AIS) receive colposcopy within 20 working days of receipt of referral.
• There were 1,933 women with high-grade cytology results who were not already under specialist management (the same women reported on in Indicator 6).
• This comprised 70 women with high-grade results indicating a suspicion of invasive disease and 1,863 women with other high-grade results.
• Nationally, the proportion of women with accepted referrals recorded on the NCSP Register is lower than the previous report (from 87.9% to 87.3%).
Suspicion of Invasive Disease
• Among the 70 women with high-grade cytology results indicating a suspicion of invasive disease, 37 (52.9%) had an accepted referral. Of the women with an accepted referral, 83.8% were seen within 10 working days of their referral being accepted. This is higher than in the previous report (81.3%).

National Cervical Screening Programme – Monitoring Report – Number 52 Page 8
• A colposcopy visit was recorded for 55 of the 70 women (78.6%) up to 31 December 2019 (follow-up time of at least six and up to 12 months).
No Suspicion of Invasive Disease
• Among the 1,863 women with other high-grade cytology results, 1,650 (88.6%) had an accepted referral. Of the women with an accepted referral, 71.5% were seen within 20 working days of their referral being accepted. This is lower than the proportion seen within 20 working days in the previous monitoring period (72.9%).
• A colposcopy visit is recorded for 1,761 (94.5%) of these women up to 31 December 2019 (follow-up time of at least six and up to 12 months).
Indicator 7.2 Timeliness of colposcopic assessment – low-grade cytology
Target: 95% of women who have persistent low-grade abnormalities or a low-grade abnormality and positive HPV test, must receive a date for a colposcopy appointment within a period that does not exceed 26 weeks of the colposcopy unit accepting the referral from the sample taker.
• There were 3,737 women with persistent low-grade cytology or low-grade cytology and a positive hrHPV test collected in the 6-month period ending 12 months prior to the end of the current monitoring period, i.e. between 1 July - 31 December 2018.
• Subsequent accepted referrals are recorded for 3,215 (86.0%) of these women, and subsequent colposcopy (by 31 December 2019) for 3,414 (91.4%) of these women.
• Nationally, 78.9% of women attended for colposcopy within 26 weeks of their accepted referral. This is lower than in the previous monitoring report (80.1%).
Indicator 7.3 Adequacy of reporting colposcopy
Target: 100% of medical notes will accurately record colposcopic findings including visibility of the squamo-columnar junction, presence, or absence of a visible lesion, and colposcopic opinion regarding the nature of the abnormality.
• Based on 12,146 colposcopy visits in the current monitoring period recorded on the NCSP Register, no DHB nor the aggregate of colposcopy visits to private practice met the target of 100% completion of all recommended fields.
• All items (degree of visibility of the squamo-columnar junction, presence or absence of a lesion and colposcopic opinion regarding abnormality) were documented for 93.1% of colposcopy visits. Reporting was 100% complete for presence/absence of a lesion, but not for degree of visibility of the squamo-columnar junction, nor for colposcopic opinion regarding abnormality.

National Cervical Screening Programme – Monitoring Report – Number 52 Page 9
• The type of recommended follow-up was recorded for 92.2% of colposcopy visits, and the recommended timeframe for this follow-up was recorded for 91.6% of colposcopy visits.
• Colposcopic appearance was reported as abnormal in 55.1% of colposcopies, and inconclusive in 4.5% of colposcopies.
• Completion of most recommended fields is broadly similar to what was reported in the previous monitoring period.
• Overall completion is slightly higher in this monitoring period (93.1%) than in the previous monitoring period (93.0%).
• The number of colposcopies recorded on the NCSP Register has decreased by 1.0%.
• All DHBs were reporting colposcopy data electronically to the NCSP Register throughout the current monitoring period.
Indicator 7.4 Timeliness and appropriateness of treatment
Target: 90% or more of women with HSIL should be treated within eight weeks of histological confirmation.
• 61.4% of 2,054 women with HSIL histology (CIN 2/3) during the period 1 January to 30 June 2019 have a record of treatment within eight weeks of their histology report.
• The proportion of women with histologically confirmed CIN 2/3 treated within eight weeks of their histology result being reported is higher than the previous monitoring period (from 61.1% to 61.4%).
• No DHB met the target.
Indicator 7.5 Timeliness of discharge following treatment
Target: 90% or more of women treated for CIN 2/3 should have a colposcopy and cytology within the nine-month period post treatment.
• Based on NCSP Register records, 1,268 women were treated for high-grade lesions in the period 1 July to 31 December 2018.
• 68.3% of women treated have a record of both colposcopy and cytology within the nine months after their treatment visit. 69.7% have a record of at least a colposcopy visit (with or without cytology) in the same time period.
• No DHB met the target for follow-up within nine months post-treatment.
Target: 90% or more of women treated for CIN 2/3 should be discharged back to the sample taker as appropriate.
• There were 900 women who were eligible for appropriate discharge within 12 months of their treatment (71.0% of all women treated for CIN 2/3). Of these women, 742 (82.4%) were discharged to their sample taker within 12 months.
• Nine DHBs met the target of discharging 90% or more women who were eligible for discharge within 12 months.

National Cervical Screening Programme – Monitoring Report – Number 52 Page 10
Indicator 8 HPV testing
Indicator 8.1 HPV triage of low-grade cytology
Target: None set.
HPV triage
• Nationally, 97.1% of women aged 30 years or more with an eligible ASC-US cytology result, and 97.4% of women aged 30 years or more with an eligible LSIL cytology result are recorded as having a subsequent HPV triage test.
• Small numbers of HPV triage tests occur in women aged under 30 years (in 1.0% of women with an ASC-US result, and 0.9% of women with an LSIL result; 22 women in total).
• The proportion of women aged 30 years and over who were eligible for HPV triage of low-grade cytology who subsequently received a triage test is lower than that in the previous monitoring period for women with ASC-US results (97.1% compared to 97.6% in the previous report) but higher for women with LSIL results (97.4% compared to 96.0% in the previous report).
Positive triage tests
• Among women aged 30 years or more with a valid HPV triage test results, 22.3% of women with ASC-US results and 59.4% of women with LSIL results were positive for high-risk HPV (hrHPV).
• Positivity for hrHPV varied by laboratory (from 11.9% to 28.7% for ASC-US, and from 42.9% to 78.1% for LSIL).
• Positivity for hrHPV generally decreased with increasing age.
• The proportion of women whose HPV tests were positive decreased compared to the previous monitoring period for ASC-US (22.3% compared to 23.7% in the previous period), and for LSIL (59.4% compared to 61.2% in the previous period).
Histological outcomes in triage-positive women who attended colposcopy
• Among women with ASC-US cytology and a positive HPV triage test in the six-month period one year prior to the current monitoring period, 91.8% of women have a record of colposcopy and 62.6% have a record of histology within 12 months of their triage test. The corresponding percentages for LSIL are 92.4% with colposcopy and 65.7% with histology within 12 months.
• Among women with colposcopy recorded within 12 months of a positive triage test, the proportion of women that had a CIN 2 or more severe outcome (CIN 2+) was 14.8% for women with triage-positive ASC-US cytology and 13.3% for women with triage-positive LSIL cytology. This corresponded to 53 of the women with ASC-US cytology and 113 of the women with LSIL cytology.
• Among women with histology recorded within 12 months of a triage test, 21.7% of women with ASC-US cytology and 18.7% of women with LSIL cytology had a histological outcome of CIN 2+.

National Cervical Screening Programme – Monitoring Report – Number 52 Page 11
Indicator 8.2 HPV test volumes
Target: None set.
• Nationally, there were 15,736 cervical samples received at laboratories for HPV testing during the current monitoring period.
• Nationally, 15.4% of HPV tests were taken for follow-up of women treated for confirmed high-grade squamous abnormalities in the previous four years (post-treatment follow-up), 36.6% were taken to manage women with high-grade squamous cytology or histology more than three years ago (historical testing), 9.5% were taken at colposcopy (potentially to assist in resolving discordant results), and 17.8% were taken for HPV triage of low-grade cytology in women aged 30 years or more. The remaining 28.4% of HPV tests did not fit into any of the previously described categories, and so the reason for testing was unclear.
• The proportion of HPV tests which are invalid is very small (0.03%).
• Overall HPV test volumes have decreased by 3.4% since the previous monitoring period. The reduction does not appear to be linked to any particular purpose.
Indicator 8.3 Historical HPV tests for follow-up of women with previous high-grade abnormality
Target: None set.
• This analysis followed up 48,896 women who were eligible for historical HPV testing as at 1 October 2009 to ascertain how many women had received an HPV test for management of their historical (more than three years prior) high-grade squamous abnormality.
• There were 34,950 women (71.5%) with a Round 1 historical HPV test recorded, and 30,358 women (62.1%) with a Round 2 historical HPV test recorded.
• The proportion of women who had received a historical HPV test varied by DHB, from 61.2% to 82.2% for Round 1 tests and from 50.3% to 75.0% for Round 2 tests.
• There was variation by age in the proportion of women who had received a historical HPV test. For women aged 25 to 69 years this varied from 60.0% (25-29 years) to 74.4% (60-64 years) for Round 1 tests, and from 40.0% (25-29 years) to 65.3% (65-69 years) for Round 2 tests.
• The proportion of women who had received a historical HPV test varied somewhat by ethnicity, from 54.9% (Pacific women) to 73.3% (European/ Other women) for Round 1 tests and from 42.8% (Pacific women) to 64.6% (European/ Other women) for Round 2 tests.
• The proportion of eligible women with an HPV test recorded is higher than in the previous report, from 70.5% to 71.5% for Round 1 tests, and from 60.5% to 62.1% for Round 2 tests.

National Cervical Screening Programme – Monitoring Report – Number 52 Page 12
2. Background
An organised National Cervical Screening Programme (NCSP) was established in New Zealand in 1990, to reduce the number of women who develop cervical cancer and the number who die from it. The Programme recommends regular cervical screening at three-year intervals for women aged between 20 and 69 years who have ever been sexually active. Part 4A of the Health Act 1956, which came into effect in 2005, underpins the NCSP’s operations to ensure the co-ordination of a high -quality screening programme for all women in New Zealand. Ongoing systematic monitoring is a requirement of an organised screening programme. Such monitoring allows the performance of the Programme to be evaluated and corrective action to be taken as required. Monitoring is carried out through a set of key indicators which cover all aspects of the screening pathway, including participation by women, their clinical outcomes, NCSP provider performance and the Programme overall. Monitoring reports were produced quarterly from December 2000 to June 2007 (Report 27); and six-monthly thereafter. The audience for these monitoring reports includes the general public, NCSP providers, and the Programme itself. Technical information on the indicators are available from the Ministry of Health on request. From Report 30 (July-December 2008) onwards, monitoring has been undertaken with the technical assistance of researchers based at the Cancer Research Division at Cancer Council NSW, Sydney, Australia. This has coincided with the use of a new reporting format, incorporating more explicit definitions and utilising data from the newly developed NCSP Register, so earlier reports are not fully comparable with Report 30 onwards. The development of these reports has been ongoing, however it is anticipated that from Report 44 going forward, there will be minimal further changes until the NCSP transitions to primary HPV screening in the near future. NCSP biannual monitoring reports are reviewed by a multidisciplinary advisory and monitoring group, representing NCSP providers and consumers. The group may make recommendations to the NSU for follow-up actions. Further information about the NCSP Advisory Group and the monitoring and performance of the NCSP is available on https://www.nsu.govt.nz/health-professionals/national-cervical-screening-programme/independent-monitoring-reports and on request from the NCSP: Email: [email protected] Phone: (04) 816 3345, 021 711 432 or Fax: (04) 816 4484

National Cervical Screening Programme – Monitoring Report – Number 52 Page 13
3. Methods
Data used The analyses in this report are based on data extracted from the NCSP Register on 5 March 2020.
Age Unless otherwise specified, age is defined as the woman’s age at the end of the monitoring period, i.e. the women’s age at 31 December 2019.
Hysterectomy-adjusted population Measures such as coverage require an estimate of the population eligible for cervical screening. This is approximated by applying a hysterectomy-adjustment to the estimated New Zealand female population, to exclude women with a hysterectomy from the eligible population. This is an imperfect adjustor of the proportion of the population eligible for screening, since women with a hysterectomy may or may not require further cervical cytology samples, depending on the type of hysterectomy that they received. Since Report 49, the hysterectomy-adjustment has used estimates of the hysterectomy prevalence in the New Zealand population from Cleary and Wright.1 Cleary and Wright used similar modelling techniques to those used by Gray2 to provide hysterectomy estimates used in previous monitoring reports (Reports 37-48). Alterations to the methods used by Gray2 include: slight modifications to the model used; additional procedure data and procedure codes were included (to include previously overlooked procedures where the cervix is removed, but did not include sub-total hysterectomies which leave part of the cervix intact); and attempts to account for mortality and migration. Hysterectomy incidence was estimated by fitting models to observed data on hysterectomies obtained from public and private hospital discharge data from the National Minimum Dataset and the Mortality collection and applied these incidence estimates to estimates of the usually resident female population from Statistics New Zealand. The New Zealand Health Survey was used to calibrate the estimates. The resulting estimates of hysterectomy incidence and survival in single-year age groups by calendar year were then used to estimate the prevalence of hysterectomy by five-year age group (among women aged 20-69 years) and calendar year (1957 to 2019). The 31 December 2019 estimates used from Report 49 on and that were employed in this monitoring report were updated to include actual hysterectomy data to 31 December 2016 (supplemented by New Zealand Health Survey data) in five-year age groups to better reflect the hysterectomy prevalence in the population, and have been projected forward using methods similar to previously applied. A known limitation of previous estimates of hysterectomy prevalence is that they did not take into account deaths or women who leave New Zealand after they have a hysterectomy (which would tend to result in an overestimate of hysterectomy prevalence), nor women who migrate to New Zealand who have previously had a hysterectomy (which would tend to underestimate hysterectomy prevalence). In these new estimates attempts to account for mortality and migration have been applied, to reduce these limitations. The estimates of hysterectomy prevalence used in the current report are included in Table 39.

National Cervical Screening Programme – Monitoring Report – Number 52 Page 14
The hysterectomy prevalence data were applied to New Zealand population estimates from Statistics New Zealand so that estimates of the number of women in the New Zealand population (by age, ethnicity and DHB) who had not had a hysterectomy prior to 31 December 2019 were obtained. Hysterectomy prevalence figures for the whole population (the denominator) were age-specific hysterectomy adjustments and were applied equally across the estimated population within each DHB and ethnicity grouping. These adjusted population estimates were then used as the denominator in the hysterectomy-adjusted calculations. The estimates used for the New Zealand female population (as at 31 December 2019) were also updated from Report 49 onwards, from projections made in 2016 based on 2013 Census data, to projections made in 2018, also based on 2013 Census data3 .
Ethnicity analysis The analysis by ethnicity considered four groups – Māori, Pacific, Asian, or European/ Other, based on women’s prioritised ethnicity derived from level two ethnicity codes recorded on the NCSP Register. Women for whom ethnicity information was not available were included in the “European/ Other” ethnicity category. The data download used for the current analysis (NCSP Register data as at 5 March 2020) contained ethnicity codes for approximately 99.1% of women on the NCSP Register. Ethnicity data in New Zealand is collected during encounters with the health system, such as registering with primary care, during an admission to hospital, or during surveys. The Ministry of Health has undertaken a number of activities to improve the quality of ethnicity data, including the development in 2004 of protocols for the collection and recording of ethnicity data.2 Coding of ethnicity on the NCSP Register follows the classification used by the Ministry of Health. The NCSP is continuing with work to improve the accuracy of ethnicity recording on the NCSP Register. This has included matching women’s NHIs for which there is no ethnicity on the register with the Ministry of Health’s NHI register to include ethnicities. This matching is done every three months.
Calculating NCSP coverage The methods developed for calculating the indicators used to monitor the NCSP are reviewed and revised approximately every three years, consistent with other international programmes. In addition, revisions to calculations are made in accordance with changes to New Zealand statistics, such as the population census data and ethnicity recordings. These changes reflect Statistics New Zealand modifications to methods for estimating population statistics. Any changes to methods for numerators or denominators are discussed with and supported by the NCSP Advisory Group. These changes are then approved by the National Screening Unit. In 2008 the NCSP Advisory Group agreed that NCSP report coverage for women aged 25-69 years at the end of the monitoring period. This includes women aged 22 and over at the beginning of the three-year period but excludes women aged 20 or 21 years at the beginning. This approach is consistent with practice in Australia and England. In England, until 2003, the target age range for screening was 20-64 years, but coverage was calculated for women aged 25-64 years, to ensure only women eligible throughout the period were included. Similarly, in Australia, women are eligible to start screening from 18 years, but coverage is measured among women aged 20-69

National Cervical Screening Programme – Monitoring Report – Number 52 Page 15
years. The difference between the starting ages (two years) is the same as the recommended screening interval in Australia. The advantage of measuring coverage at ages 25-69 are that it provides a fairer estimate of coverage (by excluding women who are not eligible for the full three-year period) and allows international benchmarking with important peer group countries, including Australia and UK. In addition to three-year coverage, (discussed above) we also report five-year coverage (as is also done internationally). The change in method is even more important here as women aged 20-24 all need to be excluded as they are not eligible for screening for the full five years prior to the end of the assessment period. Restricting the coverage estimate to the 25-69 age group rather than the 20-69 age group is even more advantageous with respect to the five-year coverage indicator than the three-year coverage indicator. As with all indicators, coverage indicators and the statistics on which they are based continue to evolve and further changes in the construction of these indicators are to be expected in the future.

National Cervical Screening Programme – Monitoring Report – Number 52 Page 16
4. Biannual NCSP Monitoring Indicators
Indicator 1 – Coverage This indicator includes two sub-indicators – three-year coverage (Indicator 1.1) and regularity of screening (Indicator 1.2). Indicator 1.1 also describes participation at longer intervals (five-year coverage). These two sub-indicators complement each other, in that the first allows monitoring of women who are screened versus those who are not screened over various timeframes; whereas the second (regularity of screening) allows more detailed monitoring of the timeliness among women who have attended for screening.
This is a re-structure compared to reports prior to Report 44, where only three-year (and five-year) coverage were included in the biannual monitoring reports, and regularity of screening was included in the annual reports. Indicator 1.2, regularity of screening, is analysed annually to allow for the full year to be examined, and so is only included in every second monitoring report.

National Cervical Screening Programme – Monitoring Report – Number 52 Page 17
Indicator 1.1 – Three-year coverage
Definition The proportion of all 25-69 year old women who have had a screening event (cytology sample, HPV sample or histology sample) taken in the three years prior to the end of the monitoring period. This definition restricts the measure of coverage to the five-year age groups who were eligible for the entire duration of the three-year period, i.e. women aged 25-69 years at the end of the monitoring period. Screening coverage in women aged 20-69 years is also presented, for comparability with previous reports. The denominator (eligible population) for this indicator is adjusted for the estimated proportion of women who have had a total hysterectomy. Women who have withdrawn from or are not enrolled on the NCSP Register are excluded from the counts of women screened. Screening of women aged less than 20 years at the time of their cervical sample is also reported by DHB.
Target 80% of eligible women (aged 25-69 years at the end of the period) within three years.
This target applies nationally, and also to each ethnicity group (80% for Māori, 80% for Asian, 80% for Pacific, 80% for European/ Other women).
Current Situation
Coverage
950,679 (72.3%) women aged 25-69 at the end of the current monitoring period (31 December 2019) had at least one cervical sample taken during the previous three years. This does not yet meet the target of 80%. 1,133,025 (86.2%) women aged 25-69 at the end of the current monitoring period had at least one cervical sample taken during the previous five years. Three-yearly coverage varied by ethnicity. Coverage targets of 80% were not met for any ethnic group. Coverage among women aged 25-69 years was 58.7%, 65.7%, 61.7% and 78.9% for Māori, Pacific, Asian and European/ Other women, respectively (Figure 1, Table 28). The target coverage of 80% of women screened at least once within the previous three years was not achieved in any of the five-year age groups between 25 and 69 years. Among women aged 25-69 years at the end of the period, coverage was lowest for women aged 25-29 years (61.7%) and was highest for women aged 45-49 (77.8%; Figure 2, Table 29). Coverage was also low for women aged 20-24 years (43.8%), however many women in this age group were not eligible for screening for the entire three-year period as the minimum screening age has increased, and so the target is not applied to this age group.

National Cervical Screening Programme – Monitoring Report – Number 52 Page 18
Three-yearly coverage in women aged 25-69 years varied by DHB from 66.5% (Northland) to 77.0% (Taranaki). No DHBs achieved the 80% target for women aged 25-69 years at the end of the period (Figure 3, Table 27). Coverage for each of Māori, Pacific, Asian or European/ Other women was also explored at the DHB level (Table 30), and by age group (Table 31). Three-yearly coverage for Māori women ranged from 52.6% (Canterbury) to 66.7% (Tairawhiti; Figure 4). The target level of 80% of Māori women screened within the previous three years was not achieved in any DHB. Three-yearly coverage for Pacific women ranged from 49.9% (Northland) to 75.8% women (Nelson Marlborough; Figure 5). The target level of 80% of Pacific women screened within the previous three years was not achieved in any DHB. Three-yearly coverage in Asian women ranged from 49.8% (South Canterbury) to 74.1% (Tairawhiti; Figure 6). The target level of 80% of Asian women screened within the previous three years was not met in any DHB. Three-yearly coverage for European/ Other women ranged from 70.5% (Wairarapa) to 88.1% (Auckland; Figure 7). The target level of 80% of European/ Other women screened within the previous three years was achieved in seven DHBs (Auckland, Bay of Plenty, Capital and Coast, Lakes, Tairawhiti, Taranaki and Waitemata). Three-yearly coverage for Māori women ranged from 55.0% (25-29 years) to 63.6% (55-59 years; Figure 8). The target level of 80% of Māori women screened within the previous three years was not achieved in any age group. Three-yearly coverage for Pacific women ranged from 49.5% (25-29 years) to 82.0% of women (60-64 years). The target level of 80% of Pacific women screened within the previous three years was met in one age group (60-64 years). Three-yearly coverage in Asian women ranged from 39.5% (25-29 years) to 75.2% (60-64 years). The target level of 80% of Asian women screened within the previous three years was not met in any age group. Three-yearly coverage for European/ Other women ranged from 70.7% (65-69 years) to 83.2% (45-49 years). The target level of 80% of European/ Other women screened within the previous three years was achieved in four age groups (each of the five-year age groups between ages 35 and 54 years). When compared to the findings for three-year coverage, five-year coverage had broadly similar patterns of variation by age, DHB, and ethnicity. For women aged 25-69 years at the end of the monitoring period, five-year coverage varied from 80.6% for Northland to 91.0% for Capital & Coast (Figure 9, Table 32); by age from 75.4% for women aged 25-29 years to 92.4% for women aged 45-49 years (Figure 10, Table 34) and from 72.5% (Asian) to 92.8% (European/ Other; Figure 11, Table 33). Five-yearly coverage for Māori women ranged from 64.3% (Canterbury) to 82.9% (Tairawhiti; Figure 12, Table 35). Five-yearly coverage for Pacific women ranged from 63.2% (Northland) to 91.5% (Auckland; Figure 13, Table 35). Five-yearly coverage for Asian women ranged from 58.5% (South Canterbury) to 85.4% (Tairawhiti; Figure 14, Table 35). Five-yearly coverage in European/ Other women ranged from 83.7% (Wairarapa) to all women (Auckland and Tairawhiti; Figure 14, Table 35). Coverage was estimated to be over 100% of the eligible population in some cases (Table 35); this is likely
National Cervical Screening Programme – Monitoring Report – Number 52 Page 19
to be due to limitations in the estimates for population and hysterectomy prevalence. Screens in women aged less than 20 years A total of 4,179 women who were aged less than 20 years at the time of their cervical sample had a cervical sample taken in the three years to the 31 December 2019. This represents 0.4% of women who were screened at any age (Table 37). The number of women who were aged less than 20 years at the time they were screened varied by DHB from West Coast (25) to Canterbury (771), however some differences in counts are to be expected due to differences in population size and age structure between DHBs. In order to take differences in population size between DHBs into account, the number of women who were screened in the previous three years and aged 15-19 years at the time of their cervical sample in each DHB was divided by the estimated population of females aged 15-19 years in that DHB. Note that as the events occurred over a three-year period, and the population estimate is for a single year, this cannot be interpreted directly as the proportion of 15-19 year old females in each DHB who have been screened in the last three years. However, this does allow the variation in DHB populations to be partly accounted for, and thus can give an indication of where screening among women aged less than 20 years is more or less common. Estimates for this proportion ranged from Northland (1.3%) to Canterbury (4.5%). Some DHBs screen a relatively low number of women when they are younger than 20 years, but at a comparatively high rate, because their population is small (for example West Coast). Details of screens of women aged less than 20 years by DHB are presented in Figure 15, and Table 36 to Table 38) . Further exploratory analysis determined that a very high proportion of the women who were aged less than 20 years at the time of their cervical sample were aged 18-19 years at the time (89.1%; Table 38). This may represent opportunistic screening of women aged 18-19 years. This proportion varied from 72.0% in West Coast to 96.3% in Capital & Coast. Where this proportion is higher, it indicates that a larger proportion of screening in women aged less than 20 years may be attributable to opportunistic screening of women aged 18-19 years; as this proportion decreases, it indicates that more of the screening in women aged under 20 years is occurring in women aged under 18 years, and less may be attributed to opportunistic screening of women aged 18-19 years.
Trends Coverage Overall coverage in New Zealand among women aged 25-69 years is higher in the current monitoring report (72.3% within the last three years, and 86.2% within the last five years) compared to the previous monitoring period (71.4% within the last three years, and 85.5% within the last five years). Over the last two monitoring periods the proportion of Asian women screened is higher: from 59.8% in the previous period to 61.7% in the current

National Cervical Screening Programme – Monitoring Report – Number 52 Page 20
period. Māori women screened is lower: from 61.6% in the previous period to 58.7% in the current period. Pacific women screened is higher: from 65.1% in the previous period to 65.7% in the current period. European/ Other women screened is higher; from 77.2% in the previous period to 78.9% in the current period (Figure 19, Table 42). Trends over the last four monitoring periods by DHB are shown in Figure 17 and Table 40. Screens in women aged less than 20 years The number of women screened who were aged under 20 years is lower; from 4,499 in the previous monitoring period to 4,179 in the current monitoring period. The proportion of all women with screening events who were aged less than 20 years at the time of the event is similar (0.4% in both periods; Figure 20). The proportion of these women who were aged 18-19 years is lower than in the previous monitoring period (89.1%, compared to 89.4% previously; Figure 21). As in previous reports, it would appear that in New Zealand overall, screens in very young women are reducing, and when women aged less than 20 years are screened, it mostly reflects opportunistic screening of women aged 18-19 years.
Comments As noted in the Trends section, the estimates for the number of women eligible for screening including hysterectomy adjustment were updated in previous and current reports, and these changes mean that differences in coverage compared to prior reports should be interpreted with caution, as these may partially reflect differences in the population estimates. The estimates of age-specific hysterectomy prevalence used in the current report are included in Appendix A (Table 39). Table 39 also includes a comparison with the hysterectomy prevalence estimates used in the previous monitoring report. As discussed in the Methods section of this report (Hysterectomy-adjusted population; page 13), the hysterectomy prevalence estimates used to make the adjustment includes all women with a hysterectomy, some of whom may still require cervical screening. These women will have been removed from the denominator but may still appear in the numerator. As a result of these limitations, coverage must be interpreted with some caution. We explored the impact of the hysterectomy-adjustment on the results by calculating coverage as a proportion of the total New Zealand female population (i.e. regardless of whether they have had a hysterectomy or not). Results for this analysis appear in Table 39. Counts of women screened used to estimate coverage (numerator) exclude women who are not enrolled on the NCSP Register, whereas the hysterectomy-adjusted population estimates (denominator) represent all women in New Zealand without a hysterectomy, regardless of whether they are enrolled on the NCSP Register. Therefore, the coverage estimates may be an underestimate of the actual coverage rates achieved; however, the impact is likely to be very small.
National Cervical Screening Programme – Monitoring Report – Number 52 Page 21
Concerns about under- and over-counting of different ethnicity groups have led the Ministry to use the NHI for ethnicities as other Ministry collections do. This report relies on NCSP Register ethnicities; however regular matching is done with the NHI register for women on the NCSP Register who have no ethnicity recorded on the NCSP Register. In November 2019, National Cervical Screening Programme increased the recommended starting age for cervical screening from 20 to 25 years, based on evidence that screening women between the ages of 20 and 24 provides little benefit to women and can cause harm.4 This change is in line with the screening start age in many other countries. Coverage in women aged 20-24 years is likely to gradually decrease as a result of this change, and will no longer be routinely reported after this monitoring report, consistent with the change in recommended starting age. Another effect of this change is that as women respond to the updated recommendations, coverage in women aged 25-29 years will need to be interpreted with some caution, as over time women will have had a shorter period in which they were eligible for screening.

National Cervical Screening Programme – Monitoring Report – Number 52 Page 22
Figure 1 - Three-year coverage by ethnicity (women 25-69 years screened in the three years prior to 31 December 2019, as a proportion of hysterectomy-adjusted female population)
Note: Coverage calculated using population projection for 31 December 2019 based on 2013 Census data. Target: 80% for ages 25-69 years, hysterectomy adjusted. See also Table 28. Figure 2 - Three-year coverage by five-year age group (women 20-69 years screened in the three years prior to 31 December 2019, as a proportion of hysterectomy-adjusted female population)
Note: Coverage calculated using population projection for 31 December 2019 based on 2013 Census data. Target: 80% for ages 25-69 years, hysterectomy adjusted. See also Table 29.

National Cervical Screening Programme – Monitoring Report – Number 52 Page 23
Figure 3 - Three-year coverage by DHB (women 25-69 years screened in the three years prior to 31 December 2019, as a proportion of hysterectomy-adjusted female population)
Note: Coverage calculated using population projection for 31 December 2019 based on 2013 Census data. Target 80%, hysterectomy adjusted. See also Table 27. Figure 4 - Three-year coverage in Māori women (women 25-69 years screened in the three years prior to 31 December 2019, as a proportion of hysterectomy-adjusted female population), by DHB
Note: Coverage calculated using population projection for 31 December 2019 based on 2013 Census data. Target 80%, hysterectomy adjusted.

National Cervical Screening Programme – Monitoring Report – Number 52 Page 24
Figure 5 - Three-year coverage in Pacific women (women 25-69 years screened in the three years prior to 31 December 2019, as a proportion of hysterectomy-adjusted female population), by DHB
Note: Coverage calculated using population projection for 31 December 2019 based on 2013 Census data. Target 80%, hysterectomy adjusted. Figure 6 - Three-year coverage in Asian women (women 25-69 years screened in the three years prior to 31 December 2019, as a proportion of hysterectomy-adjusted female population), by DHB
Note: Coverage calculated using population projection for 31 December 2019 based on 2013 Census data. Target 80%, hysterectomy adjusted.

National Cervical Screening Programme – Monitoring Report – Number 52 Page 25
Figure 7 - Three-year coverage in European/ Other women (women 25-69 years screened in the three years prior to 31 December 2019, as a proportion of hysterectomy-adjusted female population), by DHB
Note: Coverage calculated using population projection for 31 December 2019 based on 2013 Census data. Target 80%, hysterectomy adjusted.
Figure 8 - Three-year coverage (women 25-69 years screened in the three years prior to 31 December 2019, as a proportion of hysterectomy-adjusted female population), by ethnicity and five-year age group
Note: Coverage calculated using population projection for 31 December 2019 based on 2013 Census data. Target 80%, hysterectomy adjusted.

National Cervical Screening Programme – Monitoring Report – Number 52 Page 26
Figure 9 - Five-year coverage by DHB (women screened in the five years prior to 31 December 2019, as a proportion of hysterectomy-adjusted female population)
Note: Coverage calculated using population projection for 31 December 2019 based on 2013 Census data. See also Table 32.
Figure 10 - Five-year coverage by five-year age-group (women screened in the five years prior to 31 December 2019, as proportion of hysterectomy-adjusted female population)
Note: Coverage calculated using population projection for 31 December 2019 based on 2013 Census data. See also Table 34.

National Cervical Screening Programme – Monitoring Report – Number 52 Page 27
Figure 11 - Five-year coverage by ethnicity (women screened in the five years prior to 31 December 2019, as a proportion of hysterectomy-adjusted female population)
Note: Coverage calculated using population projection for 31 December 2019 based on 2013 Census data.
See also Table 33. Figure 12 - Five-year coverage in Māori women (women 25-69 years screened in the five years prior to 31 December 2019, as a proportion of hysterectomy-adjusted female population), by DHB
Note: Coverage calculated using population projection for 31 December 2019 based on 2013 Census data.

National Cervical Screening Programme – Monitoring Report – Number 52 Page 28
Figure 13 - Five-year coverage in Pacific women (women 25-69 years screened in the five years prior to 31 December 2019, as a proportion of hysterectomy-adjusted female population), by DHB
Note: Coverage calculated using population projection for 31 December 2019 based on 2013 Census data. Figure 14 - Five-year coverage in Asian women (women 25-69 years screened in the five years prior to 31 December 2019, as a proportion of hysterectomy-adjusted female population), by DHB
Note: Coverage calculated using population projection for 31 December 2019 based on 2013 Census data.

National Cervical Screening Programme – Monitoring Report – Number 52 Page 29
Figure 15 - Five-year coverage in European/ Other women (women 25-69 years screened in the five years prior to 31 December 2019, as a proportion of hysterectomy-adjusted female population), by DHB
Note: Coverage calculated using population projection for 31 December 2019 based on 2013 Census data.
Figure 16 - Number of women screened who were aged less than 20 years at the time of their cervical sample in the three years to 31 December 2019, by DHB
See also Table 36.

National Cervical Screening Programme – Monitoring Report – Number 52 Page 30
Figure 17 - Trends in three-year coverage by DHB (women aged 25-69 years screened in the previous three years, as a proportion of hysterectomy-adjusted female population)
Figure 18 - Trends in three-year coverage by age (women screened in the previous three years, as a proportion of hysterectomy-adjusted female population)*

National Cervical Screening Programme – Monitoring Report – Number 52 Page 31
Figure 19 - Trends in three-year coverage by ethnicity (women aged 25-69 years screened in the previous three years, as a proportion of hysterectomy-adjusted female population)*
*Note: Coverage calculated using population projection at the date shown based on 2013 Census data. Updated population and hysterectomy 2013 Census population projection was used to calculate coverage for
31 December 2019. Target 80%. See also Table 42.
Figure 20 - Trends in the number of women screened in the preceding three years who were aged less than 20 years at the time of their cervical sample, by DHB
See also Table 36.

National Cervical Screening Programme – Monitoring Report – Number 52 Page 32
Figure 21 - Trends in the percent of women aged less than 20 years at the time of their cervical sample who were aged 18 or 19 years, by DHB

National Cervical Screening Programme – Monitoring Report – Number 52 Page 33
Indicator 1.2 – Regularity of screening
Definition This indicator reports on the timeliness of attendance, both for women recommended to return at the routine time of three years, or at an earlier interval of 12 months (for example following a recent abnormality).
For women recommended to return at a three-year interval, on-time screening is defined as attending between 30-42 months of their previous test (that is, within +/- six months of their due date). Early and late screening are therefore respectively defined as women who attend either within 30 months (<2.5 years), or more than 42 months (>3.5 years) of their previous test. The timing of early re-screening in this context matches the definition used within Indicator 4 (the differences between early re-screening in this Indicator and in Indicator 4 are described in the Comments section).
For women recommended to return at a 12-month interval, on-time screening is defined as attending between 9-15 months of their previous test (that is, within +/- three months of their due date). Early and late screening are therefore respectively defined as women who attend either within 9 months, or more than 15 months of their previous test.
The measure is calculated by constructing a reference cohort consisting of satisfactory cytology samples (“reference samples”) collected from women aged 20-69 years in the five years prior to the end of the current monitoring period (31 December 2019).
The most recent satisfactory cytology sample from these women prior to the reference sample was identified on the NCSP Register. The recommendation code of these prior samples was used to classify the reference samples as either early, on-time, or late. Only reference samples where the prior sample indicated an expected screening interval or either three years (recommendation code R1 or B2B0) or 12 months (recommendation code R6, R7, R8, B2B7, B2B7A, or B2B7H) were included. Reference samples where no prior satisfactory cytology sample was identified on the register with a collection date of 1 January 2000 or later, or where the prior sample had any other recommendation code, were excluded from the analysis. These women were either under specialist management, had an expected screening interval of less than 12 months, or there was insufficient information to infer an expected screening interval. Reference samples collected at colposcopy were also excluded as these may have arisen in relation to symptoms or other clinical indications.
Results over the observed year are presented based on the quarter of the year the reference cytology sample was collected. Therefore, a result for the first quarter of 2019 reports the percentage of women who attended for screening within that quarter, who were attending either early, on-time or late in relation to the recommendation associated with their prior cytology test (i.e. the total of these three categories in each quarter sums to 100%).

National Cervical Screening Programme – Monitoring Report – Number 52 Page 34
For this measure age relates to the woman’s age on the date of her reference cytology sample (i.e. the attendance which is classified as either early, on-time or late).
Target Not yet defined, however aim to maximise on-time attendance.
Current Situation
In total over the period 2015-2019, satisfactory cytology samples were collected from 1,241,086 women aged 20-69 years (based on their age at the time of the sample). Of these, 1,112,150 women met all inclusion criteria and 1,707,530 cytology samples collected from these women are included as reference cytology samples for analysis in this report. This section will focus on the results for the 12 months prior to the end of the current monitoring period (31 December 2019), while trends over the past five years are described in the Trends section. Routine screening (3-year recall) Among women attending for screening in 2019 following a 3-year recall recommendation, 62.7% were attending on-time; 11.4% more than six months early; and 25.9% more than six months late (Figure 22). By ethnicity The proportion of women re-attending in 2019 who were on-time was highest for European/ Other (64.4%), and lowest in Pacific women (53.5%) (Figure 23). The proportion of women returning for routine screening who were re-attending early was highest for European/ Other women (11.7%) and lowest for Pacific women (8.6%). The proportion of women screened who were re-attending later than recommended was highest for Pacific women (38.0%), and lowest for European/ Other women (23.9%). Details of the number of re-attendances in each category are shown in (Table 43). By age The proportion of women attending for screening in 2019 who were re-attending on-time was highest for women aged 60-69 years (71.6%) and lowest for women aged 30-39 years (56.1%) (Figure 24). The proportion of women who were re-attending early, ranged from 7.3% (60-69 years) to 17.9% (20-29 years). The proportion of women screened who were re-attending later than recommended was highest for women aged 30-39 years (31.3%) and lowest for women aged 60-69 years (21.1%). Details of the number of re-attendances in each category are shown in (Table 44). 12-month re-screening Among women attending for screening in 2019 following a 12-month repeat recommendation, 39.8% were attending on-time; 2.2% attended screening more than three months early; and 58.0% more than three months late (Figure 25). By ethnicity The proportion of women re-attending in 2019 who were on-time was highest for Asian (42.8%), and lowest in Pacific women (26.6%). The proportion of

National Cervical Screening Programme – Monitoring Report – Number 52 Page 35
women returning for 12-month repeat screening who were re-attending early was very small in all groups but was highest for European/ Other women (2.4%) and lowest for Pacific and Asian women (1.6%). The proportion of women screened who were re-attending later than recommended was relatively high in all groups, but was highest for Pacific women (71.8%), and lowest for European/ Other women (55.4%; Figure 26). Details of the number of re-attendances in each category are shown in (Table 45). By age The proportion of women attending for screening in 2019 following a 12-month repeat recommendation who were re-attending on-time was highest for women aged 20-29 years (44.8%) and lowest for women aged 40-49 years (35.9%). Very few women were re-attending early; this ranged from 1.8% (60-69) to 2.5% (20-29 years). The proportion of women screened who were re-attending later than recommended was over 50% in all age groups but was highest for women aged 40-49 years (62.1%) and lowest for women aged 20-29 years (52.8%; Figure 27). Details of the number of re-attendances in each category are shown in (Table 46).
Trends Routine screening (3-year recall)
Over the period 2015 to 2019, the proportion of women who were screened on-time increased from 61.3% to 62.7%. This predominantly reflected a reduction in the proportion of women who were being screened early (fell from 16.1% to 11.4%). There was also an increase in the proportion of women who were returning late (from 22.6% to 25.9%; Figure 28). By ethnicity Over the period 2015 to 2019, the proportion of women who were screened on-time increased in three of the four ethnic groups, with the increase being largest in Asian women and the largest decrease, from 55.0% in 2015 to 53.5% in 2019, being in Pacific women. In all groups, this predominantly reflected a reduction in the proportion of women who were being screened early, as this fell in all groups. There were also increases in the proportion of women who were returning late in every group (Table 47). The proportion returning late was higher in Pacific and Asian women than in Māori and European/ Other women (Figure 29). By age Over the period 2015 to 2019, the proportion of women who were screened on-time increased or remained similar in all age groups, with the increase being largest in women aged 20-29 years. In all groups, there was a substantial reduction in the proportion of women who were being screened early, however there was also an increase in the proportion of women who were returning late (Table 48). The increase in the proportion of women returning late was highest for women aged 60-69 years, and lowest for women aged 30-39 years. On-time screening tended to increase with increasing age and was consistently highest in women aged 60-69 years. On-time screening was lower for women aged 20-29 years at the beginning of the 5-year period but by the

National Cervical Screening Programme – Monitoring Report – Number 52 Page 36
end of the observation period the 30-39 age group had the lowest on-time screening proportion (Figure 30). 12-month re-screening Over the period 2015 to 2019, the proportion of women who were re-attending on-time for 12-month follow-up decreased somewhat, from 41.5% in 2015 to 39.8% in 2019, as did the proportion who were re-attending more than three months early, which decreased from 3.1% to 2.2%. There was a corresponding increase in the proportion of women who were re-attending more than 15 months after a recommendation to return in 12 months, which increased from 55.4% in 2015 to 58.0%. This means that over the entire period 2015-2019, the majority of women who were re-attending after a recommendation to return in 12 months were re-attending more than three months later than recommended (Figure 31). By ethnicity Over the period 2015 to 2019, the proportion of women who were re-attending on-time for 12-month follow-up decreased in all ethnic groups, as did the proportion who were re-attending early. The proportion of women who were re-attending at more than 15 months after a recommendation to return at 12 months increased or remained similar in all ethnic groups, with a maximum increase of 3.7% in Pacific women (68.0% in 2015 to 71.8% in 2019). The proportion of women returning less than nine months after a recommendation to return in 12 months was generally small but still decreased in all groups. The proportion returning on-time was consistently higher in Asian and European/ Other women than in Māori and Pacific women. Conversely, the proportion who were re-attending more than 15 months after a recommendation to return in 12 months was consistently higher in Māori and Pacific women than in Asian and European/ Other women. By 2019, and in all ethnic groups, the majority of women who were re-attending after a recommendation to return in 12 months were re-attending more than three months later than recommended (Figure 32). By age Over the period 2015 to 2019, the proportion of women who were re-attending on-time and early for 12-month follow-up decreased or increased only slightly in all age groups. The proportion of women who were re-attending at more than 15 months after a recommendation to return at 12 months increased in all age groups, but the increase was comparatively small in women aged 20-39 years (0.9% and 1.0% for women aged 20-29 and 30-39, respectively), whereas it ranged from 3.3% (40-49 years) to 7.4% (60-69 years) in women in older age groups. The proportion of women returning less than nine months after a recommendation to return in 12 months was very small and broadly similar in all age groups, however the proportion returning on-time was consistently highest in women aged 20-29 years in 2015 and 2019. The proportion returning on-time was lowest in women aged 30-39 years in 2015 but lowest in women aged 40-49 in 2019. The proportion who were re-attending more than 15 months after a recommendation to return in 12 months was highest in women aged 30-39 years in 2015 and 40-49 years in 2019. The proportion returning

National Cervical Screening Programme – Monitoring Report – Number 52 Page 37
late was initially lowest in women 60-69 years, but this proportion increased in this age group over the time period, and so by 2019 the proportion returning at least 3 months late was lowest in women aged 20-29 years. By 2019, and in all age groups, the majority of women who were re-attending after a recommendation to return in 12 months were re-attending more than three months later than recommended (Figure 33).
Comments This indicator is reported in every second monitoring period to allow for the full year to be examined. It has been included in the biannual monitoring report since Report 44 (July – December 2015). Earlier versions of regularity of screening were included in the NCSP Annual Reports for 2012 and 2013, however this indicator has been moved to the biannual reports for easier comparison with other screening-related indicators. The NCSP Annual Reports now contain cancer (incidence and mortality) data only, and all screening-related indicators are in biannual reports. This indicator reports on regularity of screening among women who have attended for screening; however, it does not capture women who have not attended for screening at all. Indicator 1.1, Coverage, is able to provide some insight into the overall proportion of women who have not attended (for example, those not screened in the previous five years). Indicators 1.2 and 4 both examine women recommended to return at the routine interval of three years who return early. The difference between these indicators are the women observed (cohorts) and how proportions are calculated. Indicator 4 identifies women with a cytology test taken in a specific earlier time period (between 1 February – 31 March 2017 in the current report) with a recommendation that the next test should be taken at the usual screening interval of three years (“routine screening”). Women with a subsequent cytology test taken within 30 months (i.e. at least six months early) are then identified – that is, this is a prospective investigation of all women within an historical cohort, including those who have re-attended, and those who have not. As described above, Indicator 1.2 identifies cytology tests within specific time periods (e.g. October - December 2019), then identifies the recommendation associated with the immediately preceding cytology test in each woman (whenever that occurred), and assesses whether the woman was returning early, on-time, or late. The proportion reported is women attending in the given time period who are attending for routine screening at least six months early, as a proportion of all women re-attending for routine screening in the same time period. That is, Indicator 1.2 is a proportion of women attending in the relevant time period (and does not take into account women not attending for screening), and it addresses the question – “What proportion of women who are re-attending for routine screening in a particular time period are returning at least six months early?”. Indicator 4 takes into account all women who were given the recommendation to return at the routine interval, regardless of whether they return or not. It addresses the question – “What proportion of women recommended to return in three years for routine screening return at least six months early?”

National Cervical Screening Programme – Monitoring Report – Number 52 Page 38
Figure 22 - Timeliness of re-attendance in 2019 following a routine (3-year) repeat screening recommendation
Figure 23 - Timeliness of re-attendance following a routine (3-year) repeat screening recommendation among women re-attending for screening in 2019, by ethnicity

National Cervical Screening Programme – Monitoring Report – Number 52 Page 39
Figure 24 - Timeliness of re-attendance in 2019 following a routine (3-year) repeat screening recommendation among women re-attending for screening in 2019, by age
Figure 25 - Timeliness of re-attendance among women re-attending for screening in 2019 following a 12-month repeat screening recommendation

National Cervical Screening Programme – Monitoring Report – Number 52 Page 40
Figure 26 - Timeliness of re-attendance among women re-attending for screening in 2019 following a 12-month repeat screening recommendation, by ethnicity
Figure 27 - Timeliness of re-attendance among women re-attending for screening in 2019 following a 12-month repeat screening recommendation, by age

National Cervical Screening Programme – Monitoring Report – Number 52 Page 41
Figure 28 - Trends in the timeliness of re-attendance following a routine (3-year) repeat screening recommendation

National Cervical Screening Programme – Monitoring Report – Number 52 Page 42
Figure 29 - Timeliness of re-attendance following a routine (3-year) repeat screening recommendation (percent), 2015-2019, by ethnicity
Figure 30 - Timeliness of re-attendance following a routine (3-year) repeat screening recommendation (percent), 2015-2019, by age

National Cervical Screening Programme – Monitoring Report – Number 52 Page 43
Figure 31 - Trends in the timeliness of re-attendance following a 12-month repeat screening recommendation

National Cervical Screening Programme – Monitoring Report – Number 52 Page 44
Figure 32 - Timeliness of re-attendance following a 12-month repeat screening recommendation (percent), 2015-2019, by ethnicity
Figure 33 - Timeliness of re-attendance following a 12-month repeat screening recommendation (percent), 2015-2019, by age

National Cervical Screening Programme – Monitoring Report – Number 52 Page 45
Indicator 2 – First screening events
Definition Women with no cervical samples (cytology, histology, or HPV) taken prior to the current monitoring period, who have had a cervical sample taken during the monitoring period (first event). A woman’s age is defined as her age at the end of the current monitoring period (i.e. the women’s age at 31 December 2019). This indicator is presented as the number of women by age, DHB and ethnicity. It is also presented as a proportion of all women in the eligible population (defined as the hysterectomy-adjusted population, aged 20-69 years), and as a proportion of all women with a cervical sample taken during this monitoring period (screening event), by DHB.
Target There are no targets for first screening events
Current Situation
There were 21,091 women aged 20-69 years at the end of the period who had their first screening event in the period 1 July - 31 December 2019. This constituted 10.1% of the 208,390 women aged 20-69 years with a cervical sample taken in the period (screening event), and 1.4% of the eligible population. The median age (at the end of the monitoring period) of women with a first event recorded was 28 years. The lower to higher quartile range (25th and 75th percentiles) was 21 to 26 years, 22 to 36 years, 27 to 38 years, 21 to 34 years for Māori, Pacific, Asian and European/ Other women, respectively. The lower to higher quartile range (25th and 75th percentiles) for all women was 22 to 35 years (Table 53). The age group with the highest number of first screening events was women aged 20-24. 7,004 women aged 20-24 had their first screening event recorded on the register during this monitoring period, accounting for 33.2% of all women aged 20-69 years with first screening events (Figure 34, Table 49). First screening events then tended to decrease with increasing age. Women aged 20-24 years also had the highest proportion of women screened in their age group who were being screened for the first time (37.8%; Figure 35, Table 50), and the highest proportion of the eligible population at that age with a first screening event recorded in the current monitoring period (4.3%; Figure 133). The DHBs with the highest number of women aged 20-69 years with first screening events were Auckland (3,255) and Waitemata (3,135). The DHBs where women with first screening events, as a proportion of all women with screening events, were the highest in Auckland (13.9%) followed by Counties Manukau (12.1%), Capital & Coast and Waitemata (11.5%). The DHBs where this proportion was lowest was West Coast (4.1%), Taranaki (5.2%) and Wairarapa (6.6%; Figure 36, Table 51). The ethnic group with the highest number of women with first screening events was European/ Other (10,645 women; Figure 37, Table 52). The group with the highest proportion of their eligible population being screened for the first time was Asian women (2.7%), and the lowest was Māori women (0.9%; Table 52). The proportion

National Cervical Screening Programme – Monitoring Report – Number 52 Page 46
of women screened who were being screened for the first time was highest for Asian women (22.1%; Figure 37, Table 52). This proportion is likely to be related to the median age of women with a first screening event, which is comparatively high for Asian women (32 years, compared with 22 years for Māori women, 27 years for Pacific women, and 26 years for European/ Other women; Table 53).
Trends The number of women with a first screening event recorded on the NCSP Register has decreased from 23,374 women in the previous period to 21,091 in the current period. Across the overall eligible population aged 20-69 years, the proportion of women with screening events that are their first screening event being recorded on the NCSP Register is lower in this period (1.4%) than in the previous period (1.6%). Patterns by age, DHB, and ethnicity are broadly similar to those seen in the previous report although first screens in 20-24 year old women decreased by 29% due to the change in starting age in 2019. Trends by age show an increase of first screens in most five-year age groups when compared to the previous report. The number and proportion of women with first screening events decreased in all ethnic groups.
Comments This indicator can only measure the number of women with their first screening event in New Zealand, recorded on the register since its introduction (1990). It does not capture screening events which occurred outside New Zealand, or among women who are not enrolled on the NCSP Register. Some differences in counts and proportion of women with first screens among screened women between DHBs are to be expected due to differences in population size, immigration and age structure. Proportions have been provided to partially account for this, however they should be interpreted with caution. For example, a relatively low number of women with first screens as a proportion of all women screened could be due to either a lower number of women with first events, or a higher number of women with screening events. For example, the DHB with the highest coverage, Taranaki, does not have a particularly high proportion of women with first events. If coverage remains high, then this proportion will inevitably decrease, as fewer women are available to be screened for the first time. Conversely, a relatively high number of women with first screens as a proportion of all women screened could be due to either a higher number of women with first events (due to increasing coverage), or a lower number of women with screening events (for example due to less frequent screening among women who have been screened at least once since the inception of the NCSP Register).

National Cervical Screening Programme – Monitoring Report – Number 52 Page 47
Figure 34 - Women with first screening events during the monitoring period, by five-year age group (women aged 20-69 years at 31 December 2019)
Figure 35 - Women with first screening events as a proportion of all women screened in that age group during the monitoring period, by five-year age group (women aged 20-69 years at 31 December 2019)

National Cervical Screening Programme – Monitoring Report – Number 52 Page 48
Figure 36 - Women with first screening events as a proportion of all women screened during the monitoring period, by DHB (women aged 20-69 years at 31 December 2019)
Figure 37 - Women with first screening events as a proportion of all women screened during the monitoring period, by ethnicity (women aged 20-69 years at 31 December 2019)

National Cervical Screening Programme – Monitoring Report – Number 52 Page 49
Figure 38 - Trends in the number of women with a first screening event, by age
Figure 39 - Trends in the number of women with a first screening event, by DHB

National Cervical Screening Programme – Monitoring Report – Number 52 Page 50
Figure 40 - Trends in the number of women with a first screening event, by ethnicity

National Cervical Screening Programme – Monitoring Report – Number 52 Page 51
Indicator 3 – Withdrawal rates
Definition The number of women, by age-group, DHB, and ethnicity not currently enrolled in the NCSP Register and whose enrolment ended during the monitoring period (withdrawals). Withdrawals relate to active withdrawals, where women specifically elect to be removed from the NCSP Register. Withdrawals are also reported as a proportion of women who were enrolled on the NCSP Register at 30 June 2019 (i.e. just prior to the commencement of the current monitoring period). This is also reported by age group, DHB, and ethnicity. Age is defined as a woman’s age at the end of the monitoring period (i.e. at 31 December 2019).
Target Zero for ages 20-69 years.
Current Situation
At the end of the previous monitoring period, 1,640,904 women aged 20-69 years were enrolled on the NCSP Register. During the current monitoring period, 6 of these women (0.0004%) withdrew from the NCSP Register. In all DHBs, the number and proportion of women who withdrew was extremely small (maximum one woman in the Bay of Plenty, Canterbury, Capital & Coast, Southern and Waitemata DHB). No women withdrew in fifteen of the twenty DHB regions (Figure 41). The number and proportion of women withdrawing was extremely small for all age groups, but were largest among women aged 45-49 years (2 women, 0.001% of those enrolled at the end of the previous monitoring period; Figure 42, Table 54). The number and proportion of women withdrawing was extremely small for all ethnic groups. One woman in Māori and 5 women in the European/ Other ethnic groups (0.0005%) withdrew during this monitoring period. No women in the Pacific and Asian ethnic groups withdrew over the same period (Figure 43, Table 55).
Trends The number of women who withdrew in the current monitoring period (6 women) is lower than in the previous monitoring period (12 women). The overall number of withdrawals and the withdrawals as a proportion of all women enrolled both continue to be extremely small.
Comments The proportion of women choosing to withdraw from the NCSP Register is extremely small.

National Cervical Screening Programme – Monitoring Report – Number 52 Page 52
Withdrawals relate to active withdrawals, where women specifically elect to be removed from the NCSP Register. It does not include, for example, women who have moved overseas, or who have died during the period, and who therefore are not having tests recorded on the NCSP Register or who ask for no more communications but still participate in the Programme and have their results recorded on the NCSP Register.

National Cervical Screening Programme – Monitoring Report – Number 52 Page 53
Figure 41 - Number of women (aged 20-69 years) who withdrew from the NCSP Register by DHB, National Cervical Screening Programme Monitoring Report Number 52
Excludes 1 women who withdrew whose DHB was not recorded.
Figure 42 - Number of women who withdrew from the NCSP Register by age, National Cervical Screening Programme Monitoring Report Number 52.

National Cervical Screening Programme – Monitoring Report – Number 52 Page 54
Figure 43 - Number of women (aged 20-69 years) who withdrew from the NCSP Register by ethnicity, National Cervical Screening Programme Monitoring Report Number 52
National Cervical Screening Programme – Monitoring Report – Number 52 Page 55
Indicator 4 – Early re-screening
Definition The proportion of women who returned for a cytology sample within 30 months (2.5 years) of their index cytology sample is calculated for a cohort of women. The cohort comprises of women with an index cytology sample taken between 1 February – 31 March 2017 (inclusive), who i) were aged 20-66 years at the time the cytology sample was taken (and hence remained within the screening target age throughout the period); and ii) were given a recommendation to return at the regular interval of three years as a result of their cytology sample in February/March 2017 (NZ Modified Bethesda code R1). Using this method of calculating the measure allows follow-up to be considered over 30 months for every individual woman. This measure excludes women who return early but are being followed according to Guidelines for Cervical Screening in New Zealand, for example, those with a recent report of an abnormality. It also excludes from the count of women screened early those whose “early” cytology sample recommended urgent referral regardless of cytological findings, in view of the abnormal clinical history provided (NZ Modified Bethesda code R14). In some cases, early re-screening may be the result of women being re-screened early in response to clinical symptoms, and this is appropriate. For the purposes of analysis by age group, a woman’s age is defined as her age at the end of the current monitoring period (i.e. a women’s age at 31 December 2019).
Target A target has not been set for this cohort-based calculation method.
Current Situation
There were 47,993 women who had a cytology sample taken between 1 February and 31 March 2017, were aged between 20-66 years at the time of their cytology sample, and were given a recommendation to return for their next cytology sample at the routine interval of three years. Among these women, 5,026 (10.5%) had at least one subsequent cytology sample in the following 30 months (6 months earlier than recommended). There was wide variation in early re-screening by DHB. Early re-screening was most common in Waitemata (14.4%) and Wairarapa (14.1%) and was least common in Mid Central (7.3%; Figure 44, Table 57). There was also variability by age. Younger women (aged 20-24 years at the end of the period) were most likely to be re-screened early (14.7%) and older women, aged 60-64 years, were the least likely to be re-screened early (7.4%; Figure 45, Table 56).

National Cervical Screening Programme – Monitoring Report – Number 52 Page 56
Among the ethnic groups considered, European/ Other were the most likely to be re-screened early (10.8%) followed by Māori (10.2%), while early re-screening was least common among Pacific women (8.1%; Figure 46, Table 58).
Trends The level of early re-screening (10.5%) is lower to what was reported in the previous monitoring period (11.4%) and has been declining over the last nine years of reporting. The DHB with the highest level of early rescreening in this report was Waitemata (14.4%). In most DHBs, early rescreening is decreasing; however early rescreening increased in the current report in five DHBs (Counties Manukau, Nelson Marlborough, Tairawhiti, West Coast, Whanganui). Trends over the two years ending 31 December 2019 by DHB are shown in Figure 47. A reduction in the level of early re-screening was seen for nine of the ten five-year age groups between 20 and 69 years since the previous report. A small increase was seen in the 65-69 age group (from 7.8% to 7.9%). Trends over the two years ending 31 December 2019 by five-year age group are shown in Figure 48. Small decreases in early re-screening were also seen in most ethnic groups with the greatest drop seen in Asian women (from 10.8% to 9.6%) since the last monitoring period. The only increase in early rescreening was in Pacific women (from 7.6% to 8.1%; Figure 49).
Comments Early re-screening was assessed based on cytology recommendation codes, in order to exclude from the early re-screening group women with a negative cytology sample for whom an earlier screening visit is appropriate. Thus, only women with a recommendation that their next screening visit be in three years were eligible for inclusion in the early re-screening group (that is, in both the numerator and the denominator). Women excluded from the early re-screening group would include those who just had their first cytology sample or more than five years have elapsed since their previous cytology sample (NCSP policy is to recommend a one-year follow-up), women with atrophic changes for whom a repeat after oestrogen is recommended, women with an abnormal history or clinical symptoms, and those already under specialist care. In some cases, early re-screening may be the result of women being re-screened early in response to clinical symptoms, and this is appropriate. We have used the NZ Modified Bethesda recommendation code for urgent referral regardless of cytological findings (R14) to try and exclude some of these cases from the count of women re-screened early, but this does not exclude all screens performed in response to clinical symptoms. There are some similarities between Indicator 4 and Indicator 1.2, although they examine different groups of women and the proportions reported answer somewhat different questions (as is described in more detail in the Definition and Comments section of Indicator 1.2). Indicator 1.2 addresses the question – “What proportion of women who are re-attending for routine screening in a

National Cervical Screening Programme – Monitoring Report – Number 52 Page 57
particular time period are returning at least six months early?”, and does not take into account women who did not attend for screening; whereas Indicator 4 addresses the question – “What proportion of women recommended to return in three years for routine screening return at least six months early?”, and takes into account all women given a routine screening recommendation, whether they re-attend or not.

National Cervical Screening Programme – Monitoring Report – Number 52 Page 58
Figure 44 - Proportion of women recommended to return at the routine interval (three years) who were re-screened early, by DHB
See also Table 57. Figure 45 - Proportion of women recommended to return at the routine interval (three years) who were re-screened early, by five-year age group
See also Table 56.

National Cervical Screening Programme – Monitoring Report – Number 52 Page 59
Figure 46 - Proportion of women recommended to return at the routine interval (three years) who were re-screened early, by ethnicity
See also Table 58. Figure 47 - Trends in the proportion of women recommended to return at the routine interval (three years) who were re-screened early, by DHB

National Cervical Screening Programme – Monitoring Report – Number 52 Page 60
Figure 48 - Trends in the proportion of women recommended to return at the routine interval (three years) who were re-screened early, by age
Figure 49 - Trends in the proportion of women recommended to return at the routine interval (three years) who were re-screened early, by ethnicity

National Cervical Screening Programme – Monitoring Report – Number 52 Page 61
Indicator 5 – Laboratory indicators The indicators include cytology, histology reports (encompassing cytology and histology reporting rates, positive predictive value of cytology predicting HSIL), laboratory turnaround times, the accuracy of negative cytology reports (future development), and unsatisfactory samples. Volumes of high risk HPV (hrHPV) tests according to NCSP guidelines are included in Indicator 8.

National Cervical Screening Programme – Monitoring Report – Number 52 Page 62
Indicator 5.1 – Laboratory cytology reporting
This includes the breakdown of cytology reporting by category for squamous and glandular abnormalities reported
• Negative
• ASC-US
• LSIL
• ASC-H
• HSIL
• SC
• AGC/AIS
• Adenocarcinoma
• Malignant neoplasm
• Total abnormalities
• Unsatisfactory samples
Definition Bethesda codes used are provided in Appendix B. The Bethesda reporting system (TBS), introduced in New Zealand on 1 July 2005, is a New Zealand modification of the Bethesda 2001 cytology reporting system. The NCSP Register collects cytology results of samples taken from the cervix and vagina. Total samples include all cytology samples (satisfactory and unsatisfactory) taken during the monitoring period, including conventional, LBC, and combined samples. Reporting rates for negative cytology, total abnormal cytology, and other reporting categories are as a percentage of all satisfactory cytology samples.
Target 0.1% - 3.0% of LBC samples reported as unsatisfactory. No more than 96% of satisfactory samples reported as negative. No more than 10% of satisfactory samples reported as abnormal. No less than 0.5% of satisfactory samples reported as HSIL (Bethesda HS1 or HS2).
Current Situation
Six laboratories reported on cytology taken during the current monitoring period, the same number as in the previous monitoring period. A total of 209,554 cytology samples were taken, almost all of which (>99.99%) were coded as liquid-based cytology (LBC) samples. The other <0.01% of cytology tests were miscoded. Unsatisfactory cytology 2,622 cytology samples (1.3%) were unsatisfactory. The unsatisfactory rate for LBC is 1.3%, which is within the 0.1% - 3.0% target range for LBC samples. Four of the six laboratories had unsatisfactory rates within the target range; the
National Cervical Screening Programme – Monitoring Report – Number 52 Page 63
other two laboratories had a rate that exceeded the maximum target of 3.0% (LabPLUS and Medlab Central Ltd had unsatisfactory rates of 3.3% and 3.1%, respectively). Canterbury Health Laboratories had the lowest unsatisfactory percentage of 0.4% (Figure 50, Table 1).
Unsatisfactory samples are reported in more detail in Table 1. The remaining satisfactory samples are reported on below and in more detail in Table 2 to Table 6.
Negative cytology reports 93.7% of satisfactory cytology results were negative (Figure 51, Table 2), consistent with the target of no more than 96%. The proportion of samples which were negative varied by laboratory from 76.9% (LabPLUS) to 95.6% (Southern Community Labs; Figure 51, Table 2). All six laboratories met the target of no more than 96%. Abnormal cytology reports Nationally, the proportion of satisfactory samples which were abnormal (6.3%) was less than the target of no more than 10% (Figure 52, Table 2). This varied by laboratory, from 4.4% (Southern Community Labs) to 23.1% (LabPLUS; Figure 52). One laboratory (LabPLUS) exceeded the target (23.1%). Abnormal cytology results were most common in younger women and LSIL was the most common abnormal result (Table 5, Table 6). HSIL cytology reports Overall, 0.7% of satisfactory cytology samples were HSIL, consistent with the target of at least 0.5% of samples (Table 4). Rates varied by laboratory from 0.4% (Pathlab) to 2.2% (LabPLUS). Five of the six laboratories met the HSIL target (Table 4, Figure 53). Among women aged 20-69 years, the proportion of HSIL or worse in all satisfactory samples was most common in women aged 25-29 years (Table 5, Table 6). In the current report we additionally examined age-standardised rates of HSIL cytology reports. This was done to partially account for different rates which may arise in different laboratories due to differences in the age of the population whose cytology tests they process. The age-standardised HSIL rates were very similar to the crude rates, both nationally and within each laboratory, but tended to be slightly lower (Table 59).
Trends Unsatisfactory cytology Overall, the percentage of unsatisfactory LBC samples for the current monitoring period 1.3% is lower than that seen in the previous monitoring period (1.4% in the previous monitoring period). Two laboratories have exceeded the target for the past two monitoring periods (LabPlus and Medlab Central Ltd) but the percentages are lower in this report. Negative vs abnormal cytology reports The proportion of satisfactory cytology samples which are negative for intraepithelial lesion or malignancy (93.7%) is higher than the previous
National Cervical Screening Programme – Monitoring Report – Number 52 Page 64
monitoring period (93.0%), and correspondingly the proportion of cytology samples reported as abnormal (6.3%) is lower than in the previous monitoring period (7.0%). All six laboratories continued to meet the target for negative cytology. LabPLUS had abnormal cytology rates again, as in previous reports, but Canterbury Health Laboratories was below the target as opposed to previous reports. HSIL cytology reports The proportion of satisfactory cytology samples reported as HSIL (0.7%) is lower than that reported in the previous monitoring report (0.8%). Five of the six laboratories met the target, which is less than the previous report (six). Longer term trends in the proportion of satisfactory cytology samples reported as HSIL are shown in Figure 54, Figure 55 (trends by age) and Figure 57 (trends by laboratory). Figure 54 and Figure 57 show trends over the last four monitoring report periods (two years), consistent with other trends presented in this report. Figure 55 shows longer term trends (1 July 2008 to 31 December 2019) in rates of HSIL cytology by age. The younger age groups in this figure would be the first to be potentially affected by HPV vaccination (the oldest birth cohorts eligible for vaccination through the publicly funded programme would be aged up to 29 years at the time of the current monitoring period). HSIL rates in women aged less than 20 years are quite variable; this is likely to be because far fewer women of this age group attend for screening, since routine screening was not recommended for women aged less than 20 years (this changed to 25 years in 2019). HSIL reporting rates in women aged 20-24 years had been increasing prior to 2013 and reached a high of 2.2% for the July-December 2012 period (Report 38). HSIL rates then fell for four monitoring periods between January 2013 and December 2014. However, in the July-December 2015 monitoring period (Report 44) an increase was seen in virtually all age groups, including women aged 20-24 years (from 1.6% in January to June 2015, Report 43, to 2.0% in July to December 2015, Report 44). There has been a plateau or small decline in HSIL rates observed over the last five monitoring reports up to 31 December 2019, with rates being below or very similar to what they were prior to the increase in the latter half of 2015 especially for women 20-24 years and 25-29 years. For women aged 20-24 years HSIL reporting rates remain lower than the latter half of 2008 (around the time that the HPV vaccination programme began). In this report HSIL reporting rates declined or remained similar to the previous report.
Comments High rates of abnormal samples from LabPLUS are consistent with previous reports, and as discussed in previous monitoring reports, investigation into this has shown that the case-mix of this laboratory (i.e. a significant proportion of samples received from colposcopy clinics compared to other laboratories) is an underlying factor. Workload catchments for laboratories may be regional or nationwide and may change because of laboratory service restructuring. As a result, it is not always straightforward to determine the catchment population for a laboratory. Rates of negative and abnormal results for individual laboratories therefore need to

National Cervical Screening Programme – Monitoring Report – Number 52 Page 65
be interpreted with some care, to allow for this difference in workloads and case-mix. The national Human Papillomavirus (HPV) Immunisation Programme was introduced in New Zealand in September 2008 and involves routine vaccination of girls 12-13 years and catch-up vaccination has previously been offered to young women born in 1990 or later. International and New Zealand data indicate that most high-grade squamous cytology reports are associated with HPV types which are potentially preventable by vaccination (approximately 53% by first generation vaccines against HPV16/18; >70% with 9-valent vaccines),5-8 and that this is particularly true for younger women.5,9-11 It is anticipated that data will also soon be available from New Zealand to further quantify the potential impact of the Human Papillomavirus Immunisation Programme in New Zealand. As vaccinated cohorts enter the screening programme, it is anticipated that the proportion of satisfactory cytology samples reported as HSIL will gradually reduce, and that this will occur in younger age groups first (the oldest birth cohorts eligible for vaccination through the publicly funded programme would be aged up to 29 years at the time of the current monitoring period, while the oldest birth cohorts offered vaccination at the target age of 12-13 years would be aged up to 23 years). Therefore, trends in the proportion of satisfactory cytology samples reported as HSIL by age are included in these monitoring reports, in order to monitor the impact of HPV vaccination over time. This proportion of satisfactory cytology samples reported as HSIL in the 20-24 years age group, in the current report, is the lowest it has been since the latter half of 2008 (around the time that the HPV vaccination programme began), and is consistent with an HPV vaccine effect. At the current time, it is not possible to present HSIL rates separately for vaccinated and unvaccinated women, because information relating to whether or not individual women have been vaccinated is not available on the NCSP Register. This data therefore needs to be interpreted with some care, as they include results in all women, both vaccinated and unvaccinated. In the current report we additionally examined age-standardised rates of HSIL cytology reports, in order to partially account for differences in the age of the population whose cytology tests each laboratory processes. This could be an additional factor in some laboratories having higher or lower HSIL reporting rates. As the target does not specifically relate to age-standardised rates, these results cannot be directly compared to the target; however, as the target was set in 2013, standardising was done using the 2013 Census population (females). As the age-standardised HSIL rates were very similar to the crude rates within each laboratory, differences in age distribution of cytology tests reported do not appear to be a factor in differences between laboratories in HSIL reporting rates, or in why some laboratories are outside the target range.

National Cervical Screening Programme – Monitoring Report – Number 52 Page 66
Figure 50 - Proportion of total LBC samples reported as unsatisfactory by laboratory, National Cervical Screening Programme Monitoring Report Number 52
Target for LBC: 0.1-3.0% (Red line-upper target limit; black line-lower target limit). Figure 51 - Proportion of total satisfactory samples reported as negative by laboratory,
Note: Line shows negative target of no more than 96%.

National Cervical Screening Programme – Monitoring Report – Number 52 Page 67
Figure 52 - Proportion of total satisfactory samples reported as abnormalities by laboratory, National Cervical Screening Programme Monitoring Report Number 52
Note: Line shows abnormal target of no more than 10%.
Figure 53 - Proportion of total satisfactory samples reported as HSIL by laboratory, National Cervical Screening Programme Monitoring Report Number 52
Note: Line shows HSIL target of no less than 0.5%.

National Cervical Screening Programme – Monitoring Report – Number 52 Page 68
Table 1 - Satisfactory and unsatisfactory cytology reporting by laboratory (National Cervical Screening Programme Monitoring Report Number 52)
Laboratory All samples Satisfactory Unsatisfactory
N N % N %
Canterbury Health Laboratories 9,784 9,748 99.6 36 0.4 Anatomical Pathology Services 41,849 41,084 98.2 765 1.8 LabPLUS 8,409 8,130 96.7 279 3.3 Medlab Central Ltd 17,188 16,663 96.9 525 3.1 Pathlab 27,211 26,974 99.1 237 0.9 Southern Community Labs 105,113 104,333 99.3 780 0.7 Total 209,554 206,932 98.7 2,622 1.3
Target total unsatisfactory: 0.1%-3.0% reported as unsatisfactory. Table 2 - Laboratory cytology reporting by general result (National Cervical Screening Programme Monitoring Report Number 52) – percentage of satisfactory samples
Laboratory Negative Abnormal
N % N %
Canterbury Health Laboratories 8,784 90.1 964 9.9 Anatomical Pathology Services 38,686 94.2 2,398 5.8 LabPLUS 6,252 76.9 1,878 23.1 Medlab Central Ltd 15,335 92.0 1,328 8.0 Pathlab 25,125 93.1 1,849 6.9 Southern Community Labs 99,722 95.6 4,611 4.4 Total 193,904 93.7 13,028 6.3
Target total negative: ≤ 96% reported as negative. Target total abnormal: ≤ 10% reported as abnormal.

National Cervical Screening Programme – Monitoring Report – Number 52 Page 69
Table 3 - Laboratory cytology reporting by type of cytological category (National Cervical Screening Programme Monitoring Report Number 52) – counts of all satisfactory samples
Laboratory Result
Negative ASC-US LSIL ASC-H HSIL SC AGC/AIS Adeno-
carcinoma Malignant Neoplasm Total
Canterbury Health Laboratories 8,784 330 449 97 73 1 9 4 1 9,748
Anatomical Pathology Services 38,686 685 1,343 130 197 2 30 9 2 41,084
LabPLUS 6,252 612 775 283 176 - 23 9 - 8,130
Medlab Central Ltd 15,335 498 515 148 145 1 19 2 - 16,663
Pathlab 25,125 623 951 127 115 5 23 5 - 26,974
Southern Community Labs 99,722 918 2,437 304 784 4 135 29 - 104,333
Total 193,904 3,666 6,470 1,089 1,490 13 239 58 3 206,932
Table 4 - Laboratory cytology reporting by cytological category (National Cervical Screening Programme Monitoring Report Number 52) – percentage of all satisfactory samples
Laboratory Result
Negative ASC-US LSIL ASC-H HSIL SC AGC/AIS Adeno-
carcinoma Malignant Neoplasm
Canterbury Health Laboratories 90.1 3.4 4.6 1.0 0.7 0.01 0.09 0.04 0.0 Anatomical Pathology Services 94.2 1.7 3.3 0.3 0.5 <0.005 0.07 0.02 <0.005
LabPLUS 76.9 7.5 9.5 3.5 2.2 - 0.28 0.11 - Medlab Central Ltd 92.0 3.0 3.1 0.9 0.9 0.01 0.11 0.01 -
Pathlab 93.1 2.3 3.5 0.5 0.4 0.02 0.09 0.02 - Southern Community Labs 95.6 0.9 2.3 0.3 0.8 <0.005 0.13 0.03 - Total 93.7 1.8 3.1 0.5 0.7 0.01 0.12 0.03 <0.005
Target: HSIL ≥ 0.5% reported as HSIL.

National Cervical Screening Programme – Monitoring Report – Number 52 Page 70
Table 5 - Laboratory reporting of cytological category by five-year age group (National Cervical Screening Programme Monitoring Report Number 52) – counts of all satisfactory samples
Age Group Cytology Result
Negative ASC-US LSIL ASC-H HSIL SC AGC/AIS Adeno-
carcinoma Malignant Neoplasm
Total
<20 444 15 53 4 4 - - - - 520 20-24 16,578 590 1,854 188 207 - 2 - - 19,419 25-29 21,604 529 1,193 196 310 - 23 - - 23,855 30-34 23,289 483 832 174 317 - 12 1 - 25,108 35-39 21,746 367 505 114 195 1 21 1 - 22,950 40-44 20,308 315 431 74 144 - 17 3 2 21,294 45-49 21,458 381 430 74 108 2 19 6 - 22,478 50-54 20,147 341 354 80 65 - 38 2 - 21,027
55-59 19,233 275 313 72 61 1 34 10 - 19,999 60-64 15,538 182 258 49 41 4 31 9 - 16,112 65-69 11,600 137 174 41 29 3 18 6 - 12,008 70+ 1,959 51 73 23 9 2 24 20 1 2,162
Total 193,904 3,666 6,470 1,089 1,490 13 239 58 3 206,932

National Cervical Screening Programme – Monitoring Report – Number 52 Page 71
Table 6 - Laboratory reporting of cytological category by five-year age group (National Cervical Screening Programme Monitoring Report Number 52) – percentage of all satisfactory samples in women of that age group
Age Group
Cytology Result
Negative ASC-US LSIL ASC-H HSIL SC AGC/AIS Adeno-
carcinoma Malignant Neoplasm
<20 85.4 2.9 10.2 0.8 0.8 - - - - 20-24 85.4 3.0 9.5 1.0 1.1 - 0.01 - - 25-29 90.6 2.2 5.0 0.8 1.3 - 0.10 - - 30-34 92.8 1.9 3.3 0.7 1.3 - 0.05 <0.005 - 35-39 94.8 1.6 2.2 0.5 0.8 <0.005 0.09 <0.005 - 40-44 95.4 1.5 2.0 0.3 0.7 - 0.08 0.01 0.01 45-49 95.5 1.7 1.9 0.3 0.5 0.01 0.08 0.03 - 50-54 95.8 1.6 1.7 0.4 0.3 - 0.18 0.01 -
55-59 96.2 1.4 1.6 0.4 0.3 0.01 0.17 0.05 - 60-64 96.4 1.1 1.6 0.3 0.3 0.02 0.19 0.06 - 65-69 96.6 1.1 1.4 0.3 0.2 0.02 0.15 0.05 - 70+ 90.6 2.4 3.4 1.1 0.4 0.09 1.11 0.93 0.05
Total 93.7 1.8 3.1 0.5 0.7 0.01 0.12 0.03 <0.005

National Cervical Screening Programme – Monitoring Report – Number 52 Page 72
Figure 54 - Trends in the proportion of total satisfactory samples reported as HSIL (last four monitoring periods), by age
Note: women aged less than 20 years are not routinely screened. Figure 55 - Longer term trends in the proportion of total satisfactory samples reported as ASC-H or HSIL (to National Cervical Screening Programme Monitoring Report Number 52)

National Cervical Screening Programme – Monitoring Report – Number 52 Page 73
Figure 56- Longer term trends in the proportion of total satisfactory samples reported as HSIL (to National Cervical Screening Programme Monitoring Report Number 52), selected age groups
Note: women aged less than 20 years are not routinely screened.
Figure 57 - Trends in the proportion of total satisfactory samples reported as HSIL, by laboratory
Note: Line shows HSIL target of no less than 0.5%.

National Cervical Screening Programme – Monitoring Report – Number 52 Page 74
Indicator 5.2 – Accuracy of cytology predicting HSIL
Definition The accuracy of cytology predicting HSIL/SC (positive predictive value – PPV) is defined as the probability of a high-grade histological report (CIN 2/3 or higher) given an HSIL/invasive squamous carcinoma cytology report.
Refer to Appendix D for detailed definitions of histological confirmation.
All satisfactory cytology samples collected in the six months prior to the current monitoring period (i.e. collected from 1 January – 30 June 2019 inclusive) were identified. Where a woman had multiple samples, or a report had multiple interpretation codes, the most serious cytology result category reported was used. If there were two cytology test results for a woman of the same grade, the earliest one was used. Histology samples taken up to six months after the cytology sample (but not on the same day) were included. Where there were multiple histology reports for a woman in the period, the most serious abnormality category was used.
Target Not less than 65% and not greater than 85% for cytology reported as HSIL or SC.
Current Situation
HSIL + SC 1,107 women with HSIL or SC cytology reports were identified. 88 of these women (7.9%) had no histology taken in the six months after the cytology sample was taken. Among the remaining 1,019 for whom there was histology, 815 (80.0%) had their HSIL or SC cytology report confirmed as high-grade by histology (Figure 58, Table 60). By laboratory, the proportion of HSIL + SC being confirmed as high-grade by histology ranged from 77.6% for Anatomical Pathology Services to 91.7% for LabPLUS. All six laboratories achieved the minimum target of at least 65% of cytological HSIL + SC being confirmed by histology. Four of the six laboratories met the 85% upper target margin of HSIL + SC being histologically confirmed (Figure 58, Table 60). Other cytological abnormalities Similar calculations for positive predictive value were performed for ASC-H; glandular abnormalities (AG1-AG5, AIS, AC1-AC4); and the combination of ASC-H, HSIL and SC. There are no targets for these measures. ASC-H 684 women with a cytology report of ASC-H were identified. 121 (17.7%) had no histology taken in the six months after the cytology sample. Among the remaining 563 women, 283 (50.3%) were histologically confirmed as high-grade.

National Cervical Screening Programme – Monitoring Report – Number 52 Page 75
This proportion varied by laboratory, from 36.1% (LabPLUS) to 69.7% (Medlab Central Ltd; Figure 59, Table 61). ASC-H + HSIL + SC A total of 1,791 women had a cytology report of ASC-H, HSIL or SC. 209 (11.7%) had no histology taken in the six months after the cytology sample. Among the remaining 1,582 women, 1,098 (69.4%) were histologically confirmed as high-grade. This proportion varied by laboratory, from 51.8% (LabPLUS) to 79.9% (Medlab Central Ltd; Figure 59, Table 62). Glandular abnormalities There were 205 women with a glandular abnormality (AG1-AG5, AIS, AC1-AC4) identified. 66 women (32.2%) had no histology taken in the six months after the cytology sample. Among the remaining 139 women, 53 (38.1%) were identified as having high-grade histology. This was not analysed by laboratory, as the number of samples reported on by some laboratories were small.
Trends HSIL + SC Positive predictive value for HSIL and SC cytology is higher than in the previous monitoring report (76.1% in the previous period; 80.0% in the current period). In both the previous and current monitoring periods, all six laboratories had greater than 65% of their HSIL + SC cytology results confirmed by histology. The number of laboratories with PPVs above the upper target of 85% is lower in this report (four laboratories compared to five in the previous report). The proportion of cytology reports with histology available following HSIL or SC results is similar to previously reported (92.1% in the current report; 92.2% in the previous report). Trends in the positive predictive value for HSIL and SC cytology by laboratory are shown in Figure 60 and Figure 61. Decreases in the positive predictive value for HSIL and SC cytology were evident for two laboratories (Anatomical Pathology Services and Canterbury Health Laboratories). ASC-H Positive predictive value for ASC-H cytology is higher, from 48.0% to 50.3%, however there is no target for this measure. The proportion of ASC-H cytology reports with histology available is higher in the current report compared to the previous monitoring report (81.2% in previous report; 82.3% in the current report; Figure 61). Decreases in the positive predictive value for ASC-H cytology were evident in three laboratories of the six. ASC-H + HSIL + SC The positive predictive value for the combined group ASC-H, HSIL and SC is higher in the current report (69.4%, compared to 66.6% in the previous report). Note that there is no target for the positive predictive value of this combined group. Trends in the positive predictive value for the combined group ASC-H, HSIL and SC cytology by laboratory are shown in Figure 62. Decreases in the positive predictive value for the combined group of ASC-H, HSIL and SC cytology were evident for two of six laboratories.

National Cervical Screening Programme – Monitoring Report – Number 52 Page 76
Glandular abnormalities The positive predictive value of glandular abnormalities is lower (from 39.9% in the previous report to 38.1% in the current report). Compared to both ASC-H cytology, and the combined group of HSIL and SC cytology, there are far fewer glandular abnormalities, and an even smaller number with histology available. The proportion of glandular abnormalities with histology available (67.8%) is lower than in the previous monitoring period (72.4%) and remains less than ASC-H (82.3%) and HSIL + SC (92.1%). As a result, the positive predictive value of glandular abnormalities is more prone to fluctuations than positive predictive values for other high-grade abnormalities. Due to the small number of samples involved, glandular abnormalities were not analysed in further detail by laboratory.
Comments This estimate does not take into account cytology predicting HSIL for which there is no histology available. Histology may be unavailable because the woman does not attend for follow-up colposcopy, or a biopsy may not be taken if the colposcopic impression is normal. When the monitoring period for this indicator is after all DHBs have started reporting in accordance the 2013 Colposcopy Standards (September 2017), it should be possible to better distinguish between these two possibilities. This can also be examined by calculating the probability of a high-grade histological report (CIN 2/3 or higher) among all women attending colposcopy after a high-grade cytology report (rather than only among the subset of women where a biopsy is taken). These results are presented in and compared with those for women with low-grade cytology results with a positive HPV triage test.
Commencing from Report 49, cytology samples were excluded from this measure if they were collected at a colposcopy visit (assessed by excluding cytology samples collected at the same facility and on the same date as either a colposcopy or a histology sample in the same woman; “excluding samples from colposcopy”). Prior to Report 49, this restriction had not been applied (“original method”). Additionally, reports prior to Report 49 included histology collected on the same day or up to five days prior to the cytology report. For this reason, results in the current report are not comparable to those in Report 48 or earlier, and so comparisons are restricted to Reports 49 and onwards.
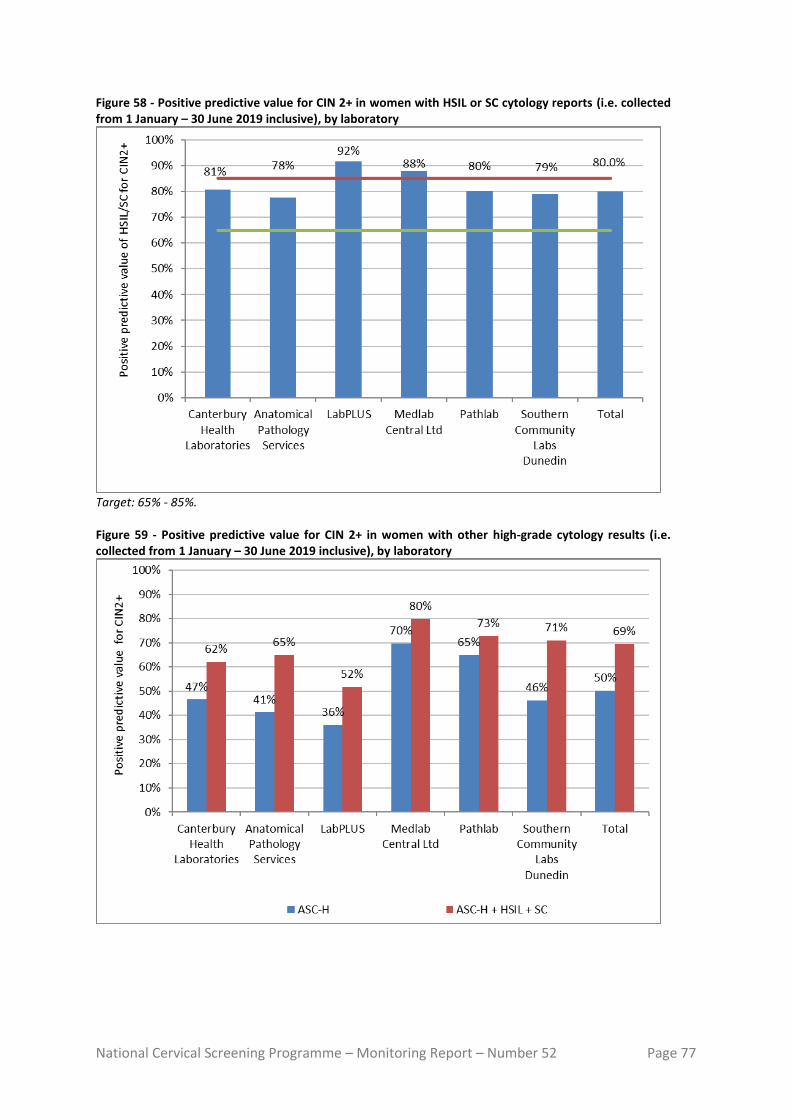
National Cervical Screening Programme – Monitoring Report – Number 52 Page 77
Figure 58 - Positive predictive value for CIN 2+ in women with HSIL or SC cytology reports (i.e. collected from 1 January – 30 June 2019 inclusive), by laboratory
Target: 65% - 85%. Figure 59 - Positive predictive value for CIN 2+ in women with other high-grade cytology results (i.e. collected from 1 January – 30 June 2019 inclusive), by laboratory

National Cervical Screening Programme – Monitoring Report – Number 52 Page 78
Figure 60 - Trends in the positive predictive value for CIN 2+ in women with HSIL or SC cytology results, by laboratory
Time period relates to monitoring report period; cytology samples were collected in the period six months prior. Figure 61 - Trends in the positive predictive value for CIN 2+ in women with ASC-H cytology results, by laboratory
Time period relates to monitoring report period; cytology samples were collected in the period six months prior.

National Cervical Screening Programme – Monitoring Report – Number 52 Page 79
Figure 62 - Trends in the positive predictive value for CIN 2+ in women with ASC-H, HSIL or SC cytology results, by laboratory
Time period relates to monitoring report period; cytology samples were collected in the period six months prior.

National Cervical Screening Programme – Monitoring Report – Number 52 Page 80
Indicator 5.3 – Accuracy of negative cytology reports
Definition This indicator currently has two parts to its definition. 1. For women with a histological diagnosis of CIN 2, CIN 3, invasive SCC, AIS
or invasive endocervical adenocarcinoma, the proportion of cytology slides originally reported within the preceding 42 months as negative, benign/reactive or unsatisfactory which on review are consistent with high -grade or worse category (Standard 522).
2. The ability of a laboratory to correctly identify a negative sample. All cases with a high -grade or invasive diagnosis on histology (CIN 2, CIN 3, invasive SCC, AIS or invasive endocervical adenocarcinoma) must have a review of any cytology slides that have been reported as negative, benign/reactive or unsatisfactory in the previous 42 months. Any abnormality identified as high -grade or worse on review of a previously reported negative or unsatisfactory cytology slide must be documented by the laboratory. Cumulative data must be forwarded to the National Screening Unit to help ensure the accuracy of submitted negative cytology reports.
Target No more than 10% of cytology originally identified as negative is identified as consistent with a cytological interpretation of HS1, HS2, SC, AIS or AC1-AC5 (HSIL+) on review. Aim for less than 15%, but not more than 20% of cytology originally identified as negative is identified as consistent with a cytological interpretation of ASC-H, HS1, HS2, SC, AG4-AG5, AIS or AC1-AC5 (ASC-H +) on review.
Current Situation
Data required for this measure were not available directly from the NCSP Register for the current reporting period, but were provided by the National Screening Unit in a way that did not identify laboratories.
Data were provided for women with a histological diagnosis of high -grade/ invasive disease in the period 1 January – 31 December 2019, for whom the previous cervical smear, within the 42 months prior, was negative. Nationally, 3.4% of these previous negative smears were consistent with HSIL+ on review, and 6.4% were consistent with ASC-H+ on review (Figure 63). These results varied by laboratory, from 0.6% to 6.2% for HSIL+ and from 2.8% to 12.4% for ASC-H+ (Figure 63). No laboratory exceeded the targets, and all achieved the additional aim of less than 15% for ASC-H+.
Trends Overall, the proportion of slides that were consistent with a high -grade or worse abnormality is lower in 2019 compared to 2018. Between this report and monitoring report 50, the proportion of negative slides which on review were

National Cervical Screening Programme – Monitoring Report – Number 52 Page 81
consistent with HSIL+ decreased from 5.5% to 3.4%, and from 10.0% to 6.4% for ASC-H+. Trends by laboratory are shown in Figure 64 (HSIL+) and Figure 65 (ASC-H+).
Comments Laboratories are not identified for this indicator.

National Cervical Screening Programme – Monitoring Report – Number 52 Page 82
Figure 63 - Proportion of cytology slides within the 42 months preceding a high -grade/ invasive histological diagnosis, originally reported as negative, which on review are consistent with a high -grade abnormality
HSIL+ includes cytology interpretation codes HS1, HS2, SC, AIS or AC1-5; ASC-H+ includes cytology interpretation codes ASH, HS1, HS2, SC, AIS, AC1-5 or AG4-5 (see Appendix B – Bethesda 2001 New Zealand Modified). Figure 64 – Trends in the proportion of cytology slides within the 42 months preceding a high -grade/ invasive histological diagnosis, originally reported as negative, which on review are consistent with HSIL or worse abnormality
HSIL+ includes cytology interpretation codes HS1, HS2, SC, AIS or AC1-5; (see Appendix B – Bethesda 2001 New Zealand Modified).

National Cervical Screening Programme – Monitoring Report – Number 52 Page 83
Figure 65 – Trends in the proportion of cytology slides within the 42 months preceding a high -grade/ invasive histological diagnosis, originally reported as negative, which on review are consistent with ASC-H or worse abnormality
ASC-H+ includes cytology interpretation codes ASH, HS1, HS2, SC, AIS AC1-5 or AG4-5 (see Appendix B – Bethesda 2001 New Zealand Modified).

National Cervical Screening Programme – Monitoring Report – Number 52 Page 84
Indicator 5.4 – Histology Reporting
Definition The NCSP Register collects histology results of samples taken from the cervix and vagina. Histology samples include diagnostic biopsies, treatment biopsies, cervical polyps and the cervical tissue of total hysterectomy specimens. All histology samples taken during the current monitoring period were retrieved. Where a histology sample had more than one SNOMED code, or a woman had more than one histology result, the most serious (highest) ranked code was used (see Appendix C). Results are presented both according to the detailed SNOMED category, and by broader histology diagnostic category. The mapping between SNOMED codes and diagnostic category is detailed in Appendix C. Two versions of SNOMED are used by laboratories (1986 and 1993) depending on the laboratory software. The NCSP Register accepts both versions and for statistical purposes maps the 1986 codes to the 1993 codes. A woman’s age is defined as her age at the end of the monitoring period (i.e. a woman’s age at 31 December 2019). Where trends are shown, a woman’s age is her age at the end of the 6-month period in which the result was reported.
Target None
Current Situation
There were 12,636 histology samples taken during the current monitoring period. Of these, 478 (3.8%) were insufficient for diagnosis. These samples were taken from 474 women, 74 (15.6%) of whom have a record of a subsequent sufficient histology test. The remaining 12,158 samples were taken from 10,851 women. Results for these women are reported on in Table 7 to Table 10.
Table 7 shows histology results by SNOMED category, based on the most serious (highest) ranked result for each woman in the monitoring period. Table 8 to Table 11 show histology results by broader histology diagnostic category. Among women with histology tests, 57.9% had negative or benign histology results (Table 8), 18.8% had high-grade squamous (CIN 2/3) histology results, and 73 women (0.67%) had adenocarcinoma in situ. There were 70 women (0.65%) with invasive squamous cell carcinoma (ISCC) histology, 5 (<0.05%) with microinvasive squamous cell carcinoma (SCC) histology and 50 (0.46%) with invasive adenocarcinoma; 18 (0.17%) were adenocarcinomas arising from the endocervix and 32 (0.29%) were adenocarcinomas not arising from the endocervix. There was one woman with adenosquamous carcinoma (<0.05%) as their most serious histology result.

National Cervical Screening Programme – Monitoring Report – Number 52 Page 85
The age group with the largest number of women with histology samples was women aged 45-49 years (1,494 women, Table 9). Among women aged 20-69 years, the age group with the lowest rate of women with results which were negative was women aged 20-24 years (25.3%; Table 10). Histology samples were additionally analysed after excluding 2,267 women whose only histology result(s) originated from a hysterectomy (partial with cervical component or total hysterectomy) and were negative/ benign (non-neoplastic; Table 11). This represented approximately 36.1% of the women with negative/ benign histology. This reduced the proportion with a histology result being negative/ benign from 57.9% to 46.7% of all women with a histology sample. If negative/ benign histology is removed from the hysterectomy samples, the new proportion of HSIL or worse histological abnormalities becomes: 23.3% for CIN2/3, 0.82% for invasive squamous cell carcinoma (ISCC), 0.06% for microinvasive SCC, 0.85% for adenocarcinoma in situ and <0.05% for adenosquamous carcinoma (Table 11). The number of women with CIN 2/3 histology within the monitoring period was further explored as a rate per 1,000 women screened within the period (where a screening event included a cytology, histology or HPV event). There were 2,035 women with CIN 2/3 histology, corresponding to a rate of 10.6 women with CIN 2/3 histology per 1,000 women screened (age-standardised to the WHO population aged 20-69 years12). Among women aged 20-69, the rate of women with CIN 2/3 histology samples taken per 1,000 women screened was highest in women aged 30-34 (18.3 per 1,000 women screened) and lowest in women aged 65-69 years (2.3 per 1,000 women screened; Figure 66). By ethnicity, Māori women had the highest rates of CIN2/3 per 1,000 women screened (13.4 per 1,000 women screened) and Pacific women the lowest (7.1 per 1,000 women screened; age-standardised to WHO population aged 20-69 years; Table 63, Table 64). The differences in the rates of CIN2/3 per 1,000 women screened by ethnicity were greatest in younger women, with Māori and European/Other women aged 20-34 years tending to have higher rates than Pacific and Asian women that age (Figure 66).
Trends The proportion of women with negative or benign histology (57.9%; or 46.7% if benign hysterectomy samples are excluded; Table 8, Table 11) is higher than in the previous period (55.5%; 45.2% if benign hysterectomy samples are excluded). The proportion of women with HSIL histology (18.8%) is lower than in the previous monitoring period (18.9 %). Excluding women whose only histology result(s) originated from a hysterectomy and were negative/ benign (non-neoplastic) the proportion of women with histological results of HSIL or worse were generally higher in the current monitoring period: invasive adenocarcinoma not arising from the endocervix is higher in the current monitoring period (0.35% to 0.37% in the current period), adenocarcinoma arising from the endocervix is higher (0.12% to 0.21% in the current period), adenocarcinoma in situ is higher (0.75% in the previous period and 0.85% in the current period), and the proportion of women with ISCC increased since the previous period (0.68% in the previous period and 0.82% in the current period) however, adenosqamous carcinoma is similar (<0.05%).

National Cervical Screening Programme – Monitoring Report – Number 52 Page 86
Longer term trends in detection of CIN 2/3 per 1,000 women screened are shown by ethnicity in Figure 67, and by age in Figure 68. Over this longer term, rates of CIN2/3 per 1,000 women screened have been decreasing in women aged 20-24 and 25-29, from the latter half of 2012 and early 2016, respectively (Figure 68). However there has been an increase in the detection of CIN 2/3 per 1,000 women screened in 20-24 year olds since the previous report. This may be a reflection of routine screening no longer being recommended for women aged less than 25 from November 2019. Longer term trends by ethnicity are shown in Figure 69 for selected age groups (20-24 and 25-29), based on those ages which would include a proportion of women who have been vaccinated against HPV (cohorts offered vaccination would have been aged up to 29 in the current monitoring period). As for the results across all women aged 20-24 years, rates of CIN2/3 detection per 1,000 women screened increased in Māori, Asian, and European/Other women aged 20-24 years in the latter half of 2019 compared to the first half of 2019 (following a period of decreases in Māori and European/Other women this age since around Jul-Dec 2012). In women aged 25-29 years, there appears to have been a decline in detection of CIN2/3 per 1,000 women screened between Jul-Dec 2013 and the current monitoring period for Māori women, between Jul-Dec 2014 and the current monitoring period for Pacific women, and between Jul-Dec 2014 and the current monitoring period for European/ Other women. There is no clear trend for Asian women aged 25-29 years.
Comments Histology samples include diagnostic biopsies, treatment biopsies, cervical polyps and the cervical tissue of total hysterectomy specimens. Histology samples may also include samples from non-cervical sites, where there is also a cervical component in the sample, for example endometrial samples. Also, pathologists are not always able to determine the site of origin particularly in small biopsies. “Adenocarcinoma not endocervical type” is the code that pathologists use for adenocarcinomas involving the cervix, but not primarily arising from the cervix. This means that the code category of “Adenocarcinoma endocervical type” should equate much more closely with data held on the Cancer Registry. In addition, it has been identified that the SNOMED codes that distinguish the two categories of adenocarcinoma have not been utilised consistently by some laboratories. Consequently, “invasive adenocarcinoma not endocervical type” may be over reported and “invasive adenocarcinoma endocervical type” under-reported in these laboratories. This is in the process of being corrected. In the current report, an additional analysis was undertaken which excluded any samples which originated from a hysterectomy sample (partial with cervical component or total) which were negative/ benign. These supplementary results may more closely reflect the results of histology which were collected in relation to the NCSP. Prior to Report 49, biannual monitoring reports examined trends in high grade abnormalities by looking at the rate of women with CIN 2/3 histology, as a

National Cervical Screening Programme – Monitoring Report – Number 52 Page 87
proportion of all women with histology; while trends in the more widely-used standard measure of CIN 2/3 histology per 1,000 women screened was included in Annual Reports (up to 2013). Since Report 49, this latter measure of examining trends in high-grade histological abnormalities has been brought across from the NCSP Annual Reports into the biannual monitoring reports. The previous measure has been included in this report in Figure 134, to allow comparison with earlier reports. Earlier declines in CIN 2/3 histology per 1,000 women screened among women aged 20-24 and 25-29 years are consistent with the anticipated effect of HPV vaccination. In the current report, rates of CIN2/3 per 1,000 women aged 20-24 years have increased. Potentially this is a result of the increase in the recommended starting for routine screening from 20 to 25 years from November 2019, which would have affected two of the six months reported on here. There would likely be a bias to higher CIN2/3 detection rates in women aged 20-24 who continued to attend after the change, since women with a previous abnormality were generally recommended to continue to attend (for example, if they were under surveillance), whereas lower risk women in routine screening were no longer recommended to attend. This effect of women aged 20-24 years who are being screened tending to be a subgroup at higher risk of disease is likely to increase over time. As a result, while CIN2/3 detection rates per 1,000 women screened is still an important indicator that can be monitored regularly to look for the impact of HPV vaccination (and supplements proxy measures such as trends in genital warts, reported elsewhere13), the results in women aged 20-24 years will be a less useful going forward. Ecological measures such as this have played an important role in many countries in documenting the impact of HPV vaccination,14 but have well-known limitations. Individual vaccination status is not available on the NCSP Register.

National Cervical Screening Programme – Monitoring Report – Number 52 Page 88
Table 7 - Histology results reporting by SNOMED category
SNOMED category
Women with that diagnosis
N %
Negative/normal 3,436 31.7 Inflammation 773 7.1 Microglandular hyperplasia 17 0.16 Squamous metaplasia 300 2.8 Polyp 1,420 13.1 Other* 332 3.1 Atypia 53 0.49 Benign glandular atypia - - HPV 599 5.5 Condyloma acuminatum 2 <0.05 CIN 1 (LSIL) or VAIN 1 1,602 14.8 Dysplasia/CIN NOS 32 0.29 Glandular dysplasia 2 <0.05 CIN 2 (HSIL) or VAIN 2 798 7.4 HSIL not otherwise specified 37 0.34 CIN 3 (HSIL) or VAIN 3 1,200 11.1 Adenocarcinoma in situ 73 0.67 Microinvasive squamous cell carcinoma 5 <0.05 Invasive squamous cell carcinoma 70 0.65 Adenocarcinoma endocervical type 18 0.17 Invasive adenocarcinoma (not endocervical type) 32 0.29 Adenosquamous carcinoma 1 <0.05 Undifferentiated carcinoma 2 <0.05 Sarcoma - - Carcinosarcoma 4 <0.05 Choriocarcinoma - - Miscellaneous primary tumour 3 <0.05 Metastatic tumour 25 0.23 Small cell carcinoma - - Malignant tumour, small cell type - - Melanoma - - Other primary epithelial malignancy 15 0.14 Total 10,851 100
NOS = not otherwise specified; HSIL not otherwise specified = high-grade squamous intraepithelial lesion, not otherwise specified/ CIN 2/3 (SNOMED code M67017; see Appendix C) * Other morphologic abnormality, not dysplastic or malignant. Note: the SNOMED codes that distinguish the two categories of adenocarcinoma have not been utilised consistently by some laboratories. Consequently, “invasive adenocarcinoma not endocervical type” may be over reported and “invasive adenocarcinoma endocervical type” under-reported in these laboratories.
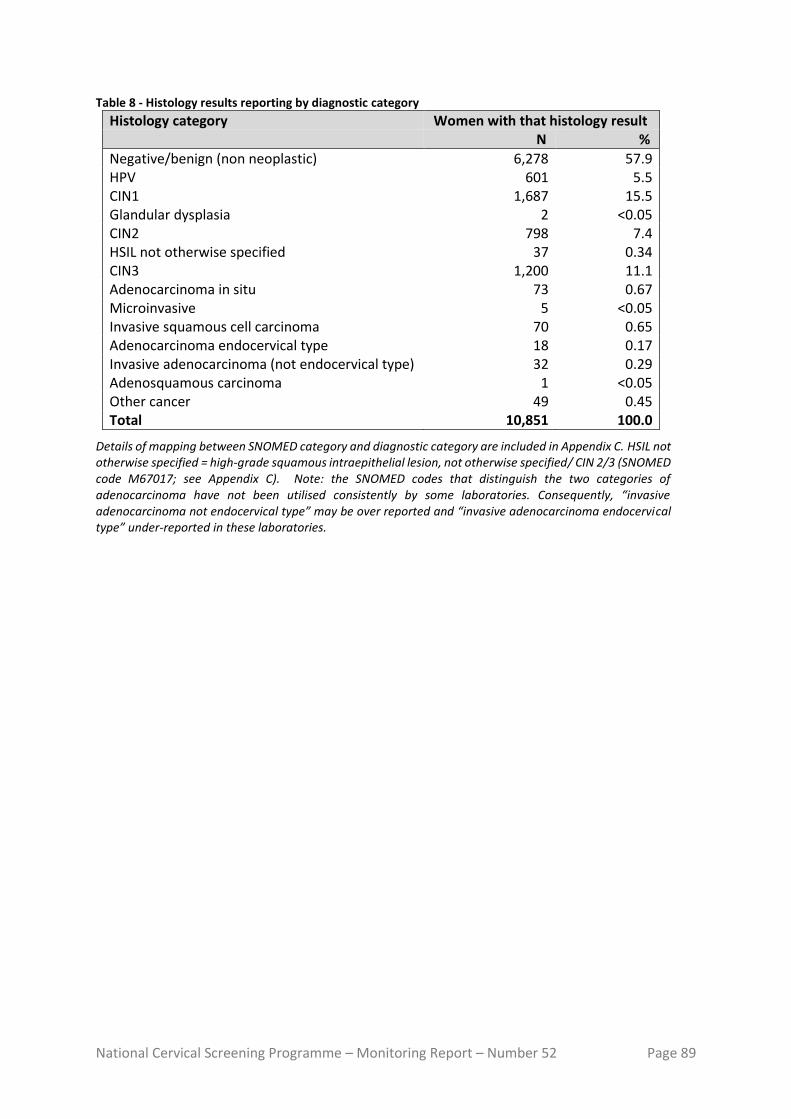
National Cervical Screening Programme – Monitoring Report – Number 52 Page 89
Table 8 - Histology results reporting by diagnostic category
Histology category Women with that histology result N %
Negative/benign (non neoplastic) 6,278 57.9 HPV 601 5.5
CIN1 1,687 15.5
Glandular dysplasia 2 <0.05
CIN2 798 7.4
HSIL not otherwise specified 37 0.34
CIN3 1,200 11.1
Adenocarcinoma in situ 73 0.67
Microinvasive 5 <0.05
Invasive squamous cell carcinoma 70 0.65
Adenocarcinoma endocervical type 18 0.17
Invasive adenocarcinoma (not endocervical type) 32 0.29
Adenosquamous carcinoma 1 <0.05
Other cancer 49 0.45
Total 10,851 100.0
Details of mapping between SNOMED category and diagnostic category are included in Appendix C. HSIL not otherwise specified = high-grade squamous intraepithelial lesion, not otherwise specified/ CIN 2/3 (SNOMED code M67017; see Appendix C). Note: the SNOMED codes that distinguish the two categories of adenocarcinoma have not been utilised consistently by some laboratories. Consequently, “invasive adenocarcinoma not endocervical type” may be over reported and “invasive adenocarcinoma endocervical type” under-reported in these laboratories.

National Cervical Screening Programme – Monitoring Report – Number 52 Page 90
Table 9 - Histology results by age – counts
Histology Diagnostic Category Age group <20 20-24 25-29 30-34 35-39 40-44 45-49 50-54 55-59 60-64 65-69 70+ Total
Negative/benign (non-neoplastic)
17 250 419 516 615 829 1,138 839 620 444 282 309 6,278
HPV 1 97 106 85 74 50 51 43 42 22 23 7 601
CIN1 4 338 333 273 182 149 138 104 69 55 26 16 1,687
Glandular dysplasia - - - - - - 2 - - - - - 2
CIN2 3 168 165 157 89 75 47 31 31 15 10 7 798
HSIL not otherwise specified - 6 12 10 6 1 - - - 1 1 - 37
CIN3 - 129 235 300 182 118 95 37 48 28 18 10 1,200
Adenocarcinoma in situ - 1 8 25 17 6 10 1 3 1 - 1 73
Microinvasive - - 2 - 1 1 - - - 1 - - 5 Invasive squamous cell carcinoma
- 1 4 10 14 9 7 3 5 7 3 7 70
Adenocarcinoma endocervical type
- - 1 1 5 2 1 1 1 1 2 3 18
Invasive adenocarcinoma (not endocervical type)
- - - 2 2 2 2 3 5 2 2 12 32
Adenosquamous carcinoma - - 1 - - - - - - - - - 1 Other cancer - - - 1 1 3 3 2 8 4 7 20 49 Total 25 990 1,286 1,380 1,188 1,245 1,494 1,064 832 581 374 392 10,851
HSIL not otherwise specified = high-grade squamous intraepithelial lesion, not otherwise specified/ CIN 2/3 (SNOMED code M67017; see Appendix C). Note: the SNOMED codes that distinguish the two categories of adenocarcinoma have not been utilised consistently by some laboratories. Consequently, “invasive adenocarcinoma not endocervical type” may be over reported and “invasive adenocarcinoma endocervical type” under-reported in these laboratories.
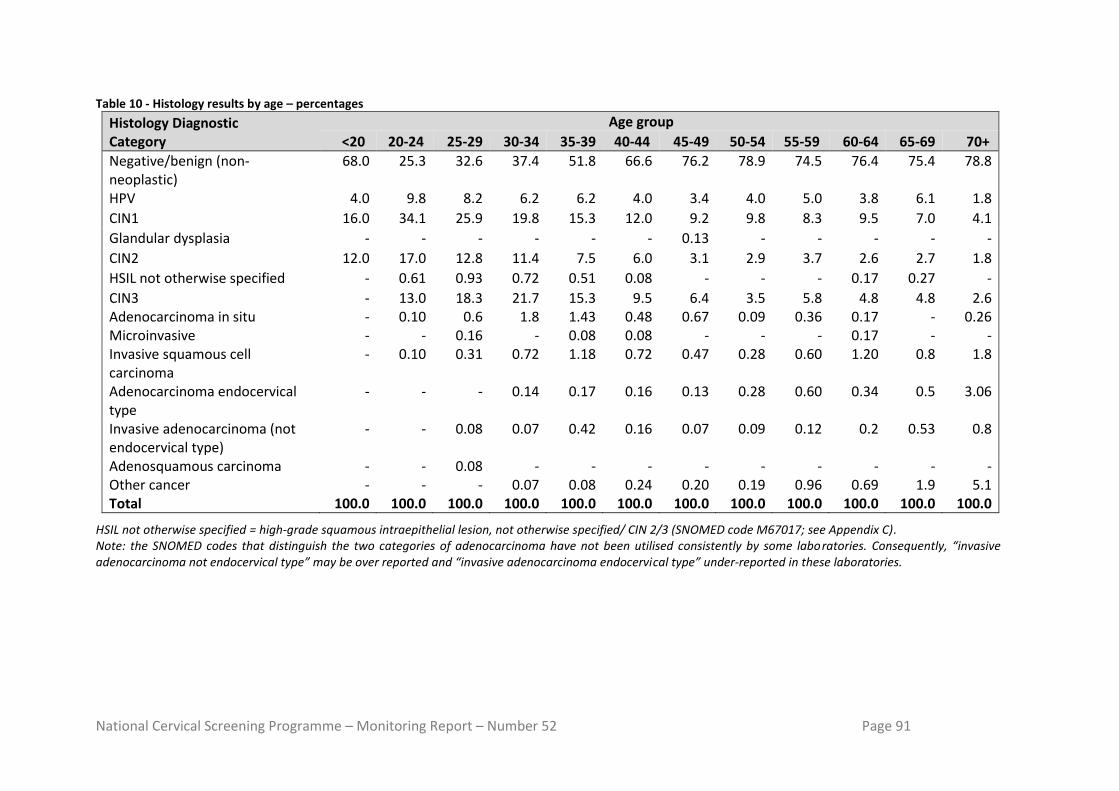
National Cervical Screening Programme – Monitoring Report – Number 52 Page 91
Table 10 - Histology results by age – percentages
Histology Diagnostic Category
Age group
<20 20-24 25-29 30-34 35-39 40-44 45-49 50-54 55-59 60-64 65-69 70+
Negative/benign (non-neoplastic)
68.0 25.3 32.6 37.4 51.8 66.6 76.2 78.9 74.5 76.4 75.4 78.8
HPV 4.0 9.8 8.2 6.2 6.2 4.0 3.4 4.0 5.0 3.8 6.1 1.8
CIN1 16.0 34.1 25.9 19.8 15.3 12.0 9.2 9.8 8.3 9.5 7.0 4.1
Glandular dysplasia - - - - - - 0.13 - - - - -
CIN2 12.0 17.0 12.8 11.4 7.5 6.0 3.1 2.9 3.7 2.6 2.7 1.8
HSIL not otherwise specified - 0.61 0.93 0.72 0.51 0.08 - - - 0.17 0.27 -
CIN3 - 13.0 18.3 21.7 15.3 9.5 6.4 3.5 5.8 4.8 4.8 2.6 Adenocarcinoma in situ - 0.10 0.6 1.8 1.43 0.48 0.67 0.09 0.36 0.17 - 0.26 Microinvasive - - 0.16 - 0.08 0.08 - - - 0.17 - - Invasive squamous cell carcinoma
- 0.10 0.31 0.72 1.18 0.72 0.47 0.28 0.60 1.20 0.8 1.8
Adenocarcinoma endocervical type
- - - 0.14 0.17 0.16 0.13 0.28 0.60 0.34 0.5 3.06
Invasive adenocarcinoma (not endocervical type)
- - 0.08 0.07 0.42 0.16 0.07 0.09 0.12 0.2 0.53 0.8
Adenosquamous carcinoma - - 0.08 - - - - - - - - - Other cancer - - - 0.07 0.08 0.24 0.20 0.19 0.96 0.69 1.9 5.1 Total 100.0 100.0 100.0 100.0 100.0 100.0 100.0 100.0 100.0 100.0 100.0 100.0
HSIL not otherwise specified = high-grade squamous intraepithelial lesion, not otherwise specified/ CIN 2/3 (SNOMED code M67017; see Appendix C). Note: the SNOMED codes that distinguish the two categories of adenocarcinoma have not been utilised consistently by some laboratories. Consequently, “invasive adenocarcinoma not endocervical type” may be over reported and “invasive adenocarcinoma endocervical type” under-reported in these laboratories.

National Cervical Screening Programme – Monitoring Report – Number 52 Page 92
Table 11 - Histology results reporting by diagnostic category excluding samples from partial* or total hysterectomy specimens and where the result was negative/ benign.
Histology category Women with that histology result N %
Negative/benign (non neoplastic) 4,011 46.7 HPV 601 7.0 CIN1 1,687 19.7 Glandular dysplasia 2 <0.05 CIN2 798 9.3 HSIL not otherwise specified - - CIN3 1,200 14.0 Adenocarcinoma in situ 73 0.85 Microinvasive 5 0.06 Invasive squamous cell carcinoma 70 0.82 Adenocarcinoma endocervical type 18 0.21 Invasive adenocarcinoma (not endocervical type) 32 0.37 Adenosquamous carcinoma 1 <0.05 Other cancer 49 0.57 Total 8,584 100.0
*Partial with cervical component. Details of mapping between SNOMED category and diagnostic category are included in Appendix C. HSIL not otherwise specified = high-grade squamous intraepithelial lesion, not otherwise specified/ CIN 2/3 (SNOMED code M67017; see Appendix C). Results differ from those in Table 8 due to the exclusion of negative/ benign results from partial/ total hysterectomy samples.
Note: the SNOMED codes that distinguish the two categories of adenocarcinoma have not been utilised consistently by some laboratories. Consequently, “invasive adenocarcinoma not endocervical type” may be over reported and “invasive adenocarcinoma endocervical type” under-reported in these laboratories.

National Cervical Screening Programme – Monitoring Report – Number 52 Page 93
Figure 66 - Rate of women with CIN 2/3 per 1,000 women screened, by age and ethnicity for the period National Cervical Screening Programme Monitoring Report Number 52
Figure 67 - Trends in the age standardised rate of women with CIN 2/3 per 1,000 women screened, by ethnicity
Age-standardised rate, standardised to the WHO population (ages 20-69 years)12.

National Cervical Screening Programme – Monitoring Report – Number 52 Page 94
Figure 68 - Longer term trends in the rate of women with CIN 2/3 per 1,000 women screened, by age
Figure 69 – Longer term trends in the rate of women with CIN 2/3 per 1,000 women screened, by ethnicity and selected ages

National Cervical Screening Programme – Monitoring Report – Number 52 Page 95
Indicator 5.5 - Laboratory turnaround times
Definition Turnaround time is defined as the number of working days from the date a sample is received by a laboratory, and the date which it is reported to the sample taker (for cytology and hrHPV samples) or referring colposcopist (for histology samples). For the purposes of this measure, samples received and reported on the same day are defined as having a turnaround time of one day.
Target Cytology Laboratories are required to report 90% of final gynaecological cytology results to sample takers within seven working days of receipt of the sample and 98% within 15 working days (Standard 51315). Histology Laboratories are required to report 90% of final histology results to referring colposcopists within ten working days of receipt of the sample and 98% of final histology results within 15 working days of receiving the sample (Standard 51615). Cytology with associated hrHPV testing Laboratories are required to report 98% of final cytology test results (including those associated with HPV test) within 15 working days of receiving the sample. Here, the turnaround time is measured specifically for cytology where HPV testing is performed for low-grade triage. Low-grade triage is defined further in Indicator 8; here it relates to cytology samples received at the laboratory in the monitoring period (as opposed to samples collected in the period, in Indicator 8). It is restricted to triage testing of women aged 30 years or more. These samples form a subset of those considered in the overall measure of turnaround time for cytology. Note that since reporting of cytology with adjunctive hrHPV testing requires that both test results be reported together (hrHPV test results must not be issued independently when adjunct to a cytology request), the turnaround time of the hrHPV test should not exceed that of the accompanying cytology, except where the HPV test was added after cytology was already reported.
Current Situation
Cytology Six laboratories received 210,149 cytology samples during the current monitoring period. Overall, 96.2% of cytology samples were reported on within seven working days, which is above the target of 90% (Table 66). Nationally, 99.3% were reported on within 15 working days, which meets the target of 98%. All six laboratories met the target for 90% of cytology samples to be reported to sample takers in seven working days or less (Figure 70, Table 66). All six laboratories also met the target of 98% of samples reported within 15 working days (Figure 71, Table 66).

National Cervical Screening Programme – Monitoring Report – Number 52 Page 96
Histology Fourteen laboratories received 12,649 histology samples in the current monitoring period. Overall, 89.9% of samples were reported on within ten working days, which is below the target of 90%. Nationally 95.9% were reported on in 15 working days or less, which is below the target of 98% (Figure 70, Table 67). Five of the fourteen laboratories met the target of 90% of final histology results to referring colposcopists within ten working days of receipt of the sample (Medlab Central Ltd, Nelson Hospital Laboratory, Southern Community Labs Dunedin, Southern Community Labs Wellington, Taranaki Medlab; Figure 72). Six laboratories met the target of 98% of final histology results reported to the requestor within 15 working days of receiving the sample (Figure 73, Table 67). Seven of the remaining laboratories had reported on at least 95% of samples within 15 days (Figure 73, Table 67). The proportion of histology samples reported on within 15 days ranged from 81.0% (Northland DHB Laboratory) to 100.0% (Nelson Hospital Laboratory and Taranaki Medlab). Low-grade cytology with associated HPV triage testing Six laboratories received 2,990 cytology samples during the current monitoring period which were associated with HPV testing for the purpose of triage of low-grade abnormalities. Overall, 99.0% of these cytology samples were reported on within 15 working days, which meets the target of 98%. The proportion of cytology samples with HPV triage tests reported on within 15 days ranged from 94.4% (Canterbury Health Laboratories) to 99.6% (Pathlab; Figure 74, Table 68). The target of 98% of tests reported within 15 working days was met by five of the six laboratories. Nationally, the proportion of cytology reported within 15 days for cytology associated with low-grade triage HPV testing (99.0%) was similar to the cytology reported overall (99.3%). At most laboratories, the proportion of cytology tests reported within 15 working days was similar regardless of whether there is an associated HPV triage test (Figure 74).
Trends Cytology The overall proportion of samples reported on within seven working days in the current report (96.2%) is higher than the proportion reported in the previous monitoring period (95.8%). All six laboratories met the target in this monitoring period which is higher than in the previous reporting period (five). The proportion of samples reported on within 15 working days was higher than in the previous monitoring period (99.3% compared to 98.8% in the previous monitoring period). All six laboratories met the target of reporting 98% of samples within 15 working days, which is two more than the previous report. Histology The proportion of histology samples reported on within ten working days is lower than in the previous report (from 91.0% to 89.9%). Five laboratories achieved the ten-working-days target in this monitoring period compared to nine in the last period. The proportion of histology samples reported on within 15 working days is lower than in the previous report (95.9%, compared to 96.2% in the previous report). Six laboratories met the target in this period compared to five in the previous report. In the current period, seven of the

National Cervical Screening Programme – Monitoring Report – Number 52 Page 97
fourteen laboratories had reported on at least 95% of samples within 15 days, compared to ten in the previous period. Cytology with associated HPV triage testing The proportion of cytology samples with an associated HPV triage test reported within 15 working days is higher than the previous report: from 98.9% to 99.0%.
Comments Note that the total number of cytology samples reported on in this Indicator is different from that reported in Indicator 5.1, as the inclusion criteria for the current indicator was all cytology samples received by laboratories within the monitoring period, rather than cytology samples where the specimen was collected during the monitoring period, which is the criteria for Indicator 5.1. The definition used by individual laboratories for turnaround time differs. For example, depending on the definition used by the laboratory, a turnaround time of one day can mean the results are reported within 24 hours, on the same day the sample is received, or on the day after the sample is received. Therefore, we have applied the same definition to all laboratories in these calculations, but because of the variation between laboratories in their internal definition, it has not been possible in this report to use a definition here which is consistent with what each individual laboratory uses. Turnaround time performance may be underestimated due to limitations in the report date recorded on the NCSP Register. When amended reports are sent to the NCSP Register, the report date in the NCSP Register is updated to reflect the date on which the report was re-transmitted after the amendments are made. The occurrence of these amended reports can therefore distort (and lengthen) turnaround time, as in these cases the report date recorded in the NCSP Register does not reflect the date on which results were first communicated to the sample taker or colposcopist. The extent of this cannot be directly determined from the NCSP Register, however audit results (which invariably find better turnaround time performance) suggest that it is a factor which should be considered in interpretation of these results. There are some possible explanations why in some laboratories the turnaround time for cytology with associated HPV triage testing is longer than for other cytology. As the HPV triage test is performed in response to low-grade cytology results in a subset of women (those aged 30 years or more without a recent cytological abnormality), the need for the HPV test is only apparent after the cytology result is available. Additionally, as HPV tests are generally performed in batches, laboratories with smaller HPV test volumes may take longer to accrue the required batch sizes, and therefore perform HPV tests less frequently. Caution must be taken when comparing percentages of reporting from this monitoring period to previous monitoring periods due to changes in the number of reporting laboratories. Differences in percentages from this and previous monitoring reports may be due to differences in caseloads.

National Cervical Screening Programme – Monitoring Report – Number 52 Page 98
Figure 70 - Proportion of cytology samples reported within seven working days by laboratory, Cancer Council NSW
Target: 90% within seven working days (red line).
Figure 71 - Proportion of cytology samples reported within 15 working days by laboratory, Cancer Council NSW
Target: 98% within 15 working days (red line).

National Cervical Screening Programme – Monitoring Report – Number 52 Page 99
Figure 72 - Proportion of histology samples reported within ten working days by laboratory, Cancer Council NSW
Target: 90% within ten working days (red line).
Figure 73 - Proportion of histology samples reported within 15 working days by laboratory, Cancer Council NSW
Target: 98% within 15 working days (red line).

National Cervical Screening Programme – Monitoring Report – Number 52 Page 100
Figure 74 - Proportion of cytology samples with associated HPV triage testing and of all cytology samples reported within 15 days by laboratory, Cancer Council NSW
Target: 98% within 15 working days (black line).

National Cervical Screening Programme – Monitoring Report – Number 52 Page 101
Indicator 6 – Follow-up women high-grade cytology, no histology
Definition The proportion of women who have had a cervical sample showing a high-grade cytology result for whom a histological report has been received by the NCSP Register. This proportion is a measure of the completeness of follow-up of women with high-grade cytology. Each woman with a high-grade cytology result, relating to a cytology sample taken in the six months preceding the current monitoring period (i.e. sample taken in the period of 1 January - 30 June 2019), is followed for any histology samples taken on or after the date of the cytology sample. The period of time between the cytology and histology reports relating to these samples is calculated. The proportion of women with a histology report up to and including 90 days after their cytology report is calculated. Histology reports which occur prior to the cytology report are included, as long as the histology sample was not taken before the cytology sample, to allow for differences in turnaround times between cytology and histology. Analyses were also performed which calculated the proportion of women with a high-grade cytology result who have a histology report within 180 days of their cytology report. For the purposes of this indicator, the following Bethesda 2001 (New Zealand modified; TBS 2001 NZ modified)16 interpretation codes are included as high-grade cytology: ASH, HS1, HS2, SC, AG1-AG5, AIS, AC1-AC5. Within this group, women are considered as having an urgent referral, due to suspicion of invasive disease if they have an interpretation code of HS2, SC, or AC1-AC5 and/or a recommendation code of R10 or R14. High-grade cytology reports that indicated women were already under specialist management (TBS 2001 NZ modified recommendation code R13) are excluded. After these are excluded, follow-up of women who have more than one high-grade cytology sample is based on the first cytology sample collected in the period. Note that some women may be assessed at colposcopy but have no biopsy taken. The colposcopy visit data for this group of women (Indicator 7.1) will supplement this indicator. An exploratory analysis was also performed here which calculated the proportion of women with high-grade cytology who had no follow-up test of any kind (including colposcopy, histology sample, HPV sample, or subsequent cytology sample) within 180 days. Note that the Programme also attempts to facilitate the follow-up of all women with absent histology so that they may receive appropriate care where possible. A woman’s age is defined as her age at the end of the current monitoring period (i.e. A woman’s age at 31 December 2019).

National Cervical Screening Programme – Monitoring Report – Number 52 Page 102
Target 90% of women should have a histology report within 90 days of their cytology report date. 99% of women should have a histology report within 180 days of their cytology report.
Current Situation
There were 3,105 high-grade cytology results relating to samples collected in the period 1 January - 30 June 2019; 1,166 of these cytology samples were collected at a colposcopy visit or the results indicated that a woman was already under specialist management. It was assumed that these results were already being followed up in the course of this management, and so the cytology tests were excluded from this measure. This left 1,939 cytology results, which related to 1,933 women. Histological follow-up for these 1,933 women is considered in this indicator. Where women had more than one high-grade cytology result relating to a sample taken in the period, histological follow-up of the earliest cytology sample taken in the period was assessed. Histological follow-up Nationally, 1,538 women (79.6%) had a histology report within 90 days of their cytology report, and 1,695 (87.7%) had a histology report within 180 days. These were below the targets of 90% within 90 days and 99% within 180 days. The proportion of women with a histology report varied by DHB from 43.8% (Counties Manukau) to 95.2% (Lakes) within 90 days of their cytology report, and from 77.3% (Counties Manukau) to 96.8% (Tairawhiti) within 180 days of their cytology report (Figure 75, Table 12). Three DHBs met the target for the proportion of women with histology within 90 days (Lakes, Tairawhiti, Whanganui). However, no DHBs met the target for 180 days. As shown in Table 12, some DHBs had a relatively small number of women with a high-grade cytology result recorded in the period (including West Coast with 9 women with a high-grade result), and this should be taken into account when interpreting these results. The proportion of women with a histology report also varied by age. Among women aged 20-69 years, the proportion varied from 45.7% (ages 60-64) to 90.7% (ages 30-34 years) within 90 days, with the target met for one age group (30-34 years). The target was not met in any age group for 180 days and ranged from 70.2% (ages 60-64 years) to 95.3% (ages 30-34 years) within 180 days (Table 13). There was some variation by ethnicity in the proportion of women with histological follow-up, however the targets were not met by any group of women. At 90 days, the proportion of women with histological follow-up ranged from 51.5% (Pacific women) to 82.3% (European/ Other women; Table 14). By 180 days, however, the difference had narrowed, and the proportion with histology reports ranged from 71.8% (Pacific women) to 89.1% (European/ Other women; Table 15). Further breakdown by DHB and ethnicity is also shown in

National Cervical Screening Programme – Monitoring Report – Number 52 Page 103
Table 14 and Table 15, and breakdown by DHB and age is shown in Table 69 and Table 70. Among women with an urgent referral, due to a suspicion of invasive disease, (N=70), a histology report was available within 90 days for 68.6% of women and within 180 days for 81.4% of women (Table 16). Among the remaining women where there was no suspicion of invasive disease (TBS 2001 NZ modified Bethesda codes ASH, HS1, AG1-AG5, AIS), 80.0% had a histology report available within 90 days and 87.9% within 180 days. Women with no follow-up tests When follow-up tests of any kind (colposcopy, histology, HPV test, or subsequent cytology test) were considered, there were 223 women (11.5%) who had no record of any subsequent follow-up within 90 days and 121 women (6.3%) who had no record of any subsequent follow-up within 180 days on the NCSP Register (Table 17). This varied by DHB, from no women without follow-up (Wairarapa and West Coast) to 45.4% (Counties Manukau) of women without a record of follow-up of some kind by 90 days, and from no women (Wairarapa and West Coast) to 17.3% (Counties Manukau) of women without a record of follow-up of some kind by 180 days (Figure 76, Table 17). Among the DHBs where there remained women without a record of follow-up at 90 days, the number remaining was generally small (ten or fewer women in 15 DHBs) but was larger in one DHB (Counties Manukau; 84 women, 45.4%). At 180 days, the number remaining without a record of follow-up was ten or fewer in 17 DHBs, with a maximum of 32 women (17.3%) without a record of follow-up, also in Counties Manukau. The proportion of women who had no record of any subsequent follow-up also varied by ethnicity, from 8.3% (European/ Other women) to 40.8% (Pacific women) at 90 days and from 4.7% (European/ Other women) to 24.3% (Pacific women) at 180 days (Table 18, Figure 77). Among women with an urgent referral, due to a suspicion of invasive disease, a follow-up test of some kind was available within 90 days for 72.9% of women and 78.6% within 180 days (Table 16). At 180 days, there remained fifteen women (21.4%) for whom no follow-up tests were recorded. Among women where there was no suspicion of invasive disease, 89.0% had a follow-up test report available within 90 days and 94.3% within 180 days (Table 16). At 180 days, there remained 106 women (5.7%) for whom no follow-up tests were recorded.
Trends Histological follow-up The proportion of women with a histology report within 90 days is lower than the previous monitoring period (from 81.2% to 79.6% in the current period). However, the proportion of women with a histology report within 180 days is similar (from 87.8% in the previous period to 87.7% in the current period).

National Cervical Screening Programme – Monitoring Report – Number 52 Page 104
While the proportion of women with histological follow-up at 90 days is lower overall and follow-up at 180 days is similar, this varies for individual DHBs (Figure 78, Figure 79). In eight DHBs the proportion of women with histological follow-up is higher at 90 days (Auckland, Canterbury, Hutt Valley, Lakes, Southern, Tairawhiti, Taranaki, Wairarapa) and in twelve it is lower. The proportion with histological follow-up is particularly low and has decreased noticeably in the current report for Counties Manukau. Consistent decreases have also been seen in at least two recent reports for Bay of Plenty and Hawkes Bay. At 180 days, the proportion of women with histological follow-up is higher in seven DHBs (Bay of Plenty, Hawke's Bay, Northland, Southern, Tairawhiti, Taranaki, Wairarapa), the same in one DHB (West Coast) and lower in the remaining DHBs. The proportion of women with follow-up histology at 90 days in the current monitoring period is lower than the previous report for all four groups of women, but the difference is most marked for Pacific women (from 60.2% to 51.5%), compared to Māori women (from 82.1% to 80.4%), Asian women (from 77.3% to 74.9%) and European/ Other women (from 83.4% to 82.3%; Figure 80). The proportion of women with follow-up histology at 180 days is higher for Māori women (from 87.3% to 89.1%), lower for Pacific women (from 75.7% to 71.8%), higher for Asian women (from 84.4% to 84.9%), and lower for European/ Other women (from 89.5% to 89.1%; Figure 81). The proportions of women with follow-up histology are quite variable within individual DHBs when broken down by DHB and ethnicity, as the number of women with high-grade cytology generally becomes comparatively small when broken down in those categories (except in some cases such as for European/ Other women, and Māori women in a few DHBs). As in previous reports, the proportion of women with histological follow-up varied substantially by age and is generally lower in women aged 50 years or more than in women younger than 50 years. Increases in the proportion of women with histological follow-up were seen in four of the ten age groups at 90 days follow-up, and in four age groups at 180 days (Figure 82, Figure 83). Decreases were seen in the five-year age groups 20-24, 30-34, 50-54 and 55-59 years at 90 days, and 20-24, 30-34, 40-44 and 50-54 years at 180 days. Follow-up at 90 days was substantially lower for women aged 60-64 years in this report, compared to the previous report (70.2% in the previous report; 45.7% in the current report). Women with no follow-up tests The proportion of women with no record of a follow-up test is higher than in the previous report at 90 days (from 10.9% to 11.5% in the current report), but the same at 180 days (6.3% in both reports). Trends by DHB were complex (Figure 84, Figure 85), but the proportion of women with no follow-up test recorded at 180 days reduced in eleven of the twenty DHBs. In the current monitoring period, the proportion of women for whom there was no follow-up test recorded is higher for Pacific women at 90 days (from

National Cervical Screening Programme – Monitoring Report – Number 52 Page 105
28.2% to 40.8%) and at 180 days (from 16.5% to 24.3%). For Māori women, it was higher, from 11.7% to 13.6% at 90 days, but lower at 180 days from 7.2% to 6.4%. For Asian women, it was higher, from 13.3% to 15.1% at 90 days, but lower at 180 days from 8.1% to 7.3%. For European/ Other women, it was lower, from 8.9% to 8.3% at 90 days, and at 180 days from 5.0% to 4.7%.
Comments The proportion of women with a follow-up test of any kind provides useful additional information. While 20.4% of women with high-grade cytology reports had no record of a histology report within 90 days, the proportion without a record of a follow-up test of any kind was much lower (11.5%). The same was also true at 180 days, where 12.3% of women with high-grade cytology reports had no record of a histology report within 180 days, but the proportion without a record of a follow-up test of any kind was much lower (6.3%). Consistent with previous monitoring reports, many of the women with no follow-up histology recorded do have a record of some follow-up test. This provides reassurance that many women without histology have not been lost to follow-up. The measure of whether or not there has been a follow-up test of any sort considers cytology, colposcopy, histology and HPV tests. Therefore, changes in women with a follow-up test of any kind may also reflect changes in the completeness of reporting colposcopy data to the NCSP Register. This is expected to be stable now that the time period of the data used to report on this indicator is after all DHBs began electronically reporting 2013 Colposcopy Standards data to the Register for the full reporting period. Note that some women presenting with high grade glandular cytology or cancer may be referred directly to gynae-oncology and therefore follow-up not be recorded on the NCSP Register. Analyses undertaken for the related performance measure, Indicator 7.1, show that women with abnormal glandular results consistent with adenocarcinoma (Bethesda codes AC1-5) were less likely to have a colposcopy referral recorded than other women with cytological suspicion of invasive disease (Table 74). While these represent a small number of women in absolute terms, they are potentially a noticeable proportion of the women with an urgent referral (for example, the six women with no follow-up within 180 days). This may have contributed to the lower rates of follow-up recorded for women with an urgent referral due to a suspicion of invasive disease. Note that while all cytology results which indicated that a woman was under specialist management were excluded from the measure of follow-up, not all women who had these cytology results were. If all cytology results for a woman indicated that she was under specialist management, she was excluded. However, any woman with at least one high-grade cytology result which did not indicate that she was under specialist management was included in the group in whom histological follow-up was measured. It was assumed that any high-grade cytology result without this indication should have been followed up in some way, regardless of other cytology results in the period. All of the

National Cervical Screening Programme – Monitoring Report – Number 52 Page 106
cytology tests selected for follow-up indicated that referral or further assessment was recommended. The risk level for women with no recorded biopsy is difficult to ascertain because a lack of histology can be due to a number of reasons, including:
i) examined but no biopsy taken, ii) did not attend (DNA) or refusal to attend iii) wait time issue iv) died or left New Zealand
Risk is also related to the degree of abnormality including microinvasive/ invasive carcinoma. Women who do not or refuse to attend are at highest risk due to no colposcopic examination. Due to the significant risk for this group of women if not followed up, NCSP Portfolio Managers ensure that priority is given to follow-up of these women through DHBs.

National Cervical Screening Programme – Monitoring Report – Number 52 Page 107
Figure 75 - Proportion of women (ages 20-69) with a histology report within 90 days, and within 180 days of their high-grade cytology report, by DHB
Target: 90% within 90 days; 99% within 180 days.
Table 12 - Women with a histology report within 90 and 180 days of a high-grade cytology report, by DHB
DHB High-grade cytology
Follow-up histology within 90 days
Follow-up histology within 180 days
N N % N %
Auckland 220 172 78.2 183 83.2
Bay of Plenty 82 63 76.8 75 91.5
Canterbury 222 190 85.6 201 90.5
Capital & Coast 117 97 82.9 100 85.5
Counties Manukau 185 81 43.8 143 77.3
Hawke's Bay 76 54 71.1 61 80.3
Hutt Valley 61 51 83.6 53 86.9
Lakes 42 40 95.2 40 95.2
Mid Central 84 68 81.0 77 91.7
Nelson Marlborough 53 43 81.1 48 90.6
Northland 52 37 71.2 43 82.7
South Canterbury 27 23 85.2 25 92.6
Southern 161 144 89.4 149 92.5
Tairawhiti 31 28 90.3 30 96.8
Taranaki 61 53 86.9 55 90.2
Waikato 147 129 87.8 133 90.5
Wairarapa 17 15 88.2 15 88.2
Waitemata 256 217 84.8 228 89.1
West Coast 9 6 66.7 7 77.8
Whanganui 30 27 90.0 29 96.7
Total 1,933 1,538 79.6 1,695 87.7

National Cervical Screening Programme – Monitoring Report – Number 52 Page 108
Table 13 - Women with a histology report within 90 and 180 days of a high-grade cytology report, by age
Age (years) High-grade cytology
Follow-Up histology Within 90 days
Follow-up histology Within 180 days
N N % N %
<20 1 0 0.0 0 0.0 20-24 245 207 84.5 229 93.5 25-29 353 291 82.4 313 88.7 30-34 364 330 90.7 347 95.3 35-39 249 212 85.1 229 92.0 40-44 155 132 85.2 143 92.3 45-49 151 109 72.2 125 82.8 50-54 104 75 72.1 85 81.7 55-59 127 87 68.5 96 75.6 60-64 94 43 45.7 66 70.2 65-69 50 31 62.0 37 74.0 70+ 40 21 52.5 25 62.5 Total 1,933 1,538 79.6 1,695 87.7
Table 14 - Women with a histology report within 90 days of a high-grade cytology report, by DHB and ethnicity
DHB Māori Pacific Asian European/ Other
N % N % N % N %
Auckland 10 71.4 7 43.8 45 75.0 110 84.6
Bay of Plenty 11 78.6 1 33.3 4 80.0 47 78.3
Canterbury 16 80.0 2 100.0 4 80.0 168 86.2
Capital & Coast 9 90.0 6 85.7 6 60.0 76 84.4
Counties Manukau 14 48.3 13 31.0 16 45.7 38 48.1
Hawke's Bay 10 62.5 1 100.0 4 66.7 39 73.6
Hutt Valley 11 91.7 2 100.0 7 87.5 31 79.5
Lakes 7 87.5 1 100.0 3 100.0 29 96.7
Mid Central 10 83.3 3 100.0 5 83.3 50 79.4
Nelson Marlborough 3 75.0 1 100.0 3 100.0 36 80.0
Northland 11 100.0 - - 2 100.0 24 61.5
South Canterbury 1 50.0 - - 1 50.0 21 91.3
Southern 12 92.3 3 60.0 4 100.0 125 89.9
Tairawhiti 12 85.7 - - - - 16 94.1
Taranaki 10 90.9 - - 1 100.0 42 85.7
Waikato 36 87.8 2 66.7 8 80.0 83 89.2
Wairarapa 4 80.0 - - - - 11 91.7
Waitemata 15 83.3 10 66.7 50 86.2 142 86.1
West Coast 1 100.0 0 0.0 - - 5 71.4
Whanganui 10 100.0 1 100.0 1 100.0 15 83.3
Total 213 80.4 53 51.5 164 74.9 1,108 82.3
‘ – ‘ indicates there were no women in this sub-category with a high-grade cytology report.

National Cervical Screening Programme – Monitoring Report – Number 52 Page 109
Table 15 - Women with a histology report within 180 days of a high-grade cytology report, by DHB and ethnicity
DHB
Māori Pacific Asian European/ Other
N % N % N % N %
Auckland 10 71.4 8 50.0 49 81.7 116 89.2
Bay of Plenty 14 100.0 3 100.0 5 100.0 53 88.3
Canterbury 17 85.0 2 100.0 5 100.0 177 90.8
Capital & Coast 9 90.0 6 85.7 7 70.0 78 86.7
Counties Manukau 24 82.8 26 61.9 26 74.3 67 84.8
Hawke's Bay 11 68.8 1 100.0 6 100.0 43 81.1
Hutt Valley 12 100.0 2 100.0 7 87.5 32 82.1
Lakes 7 87.5 1 100.0 3 100.0 29 96.7
Mid Central 12 100.0 3 100.0 5 83.3 57 90.5
Nelson Marlborough 3 75.0 1 100.0 3 100.0 41 91.1
Northland 11 100.0 - - 2 100.0 30 76.9
South Canterbury 1 50.0 - - 2 100.0 22 95.7
Southern 12 92.3 4 80.0 4 100.0 129 92.8
Tairawhiti 14 100.0 - - - - 16 94.1
Taranaki 11 100.0 - - 1 100.0 43 87.8
Waikato 37 90.2 3 100.0 8 80.0 85 91.4
Wairarapa 4 80.0 - - - - 11 91.7
Waitemata 16 88.9 12 80.0 52 89.7 148 89.7
West Coast 1 100.0 1 100.0 - - 5 71.4
Whanganui 10 100.0 1 100.0 1 100.0 17 94.4
Total 236 89.1 74 71.8 186 84.9 1199 89.1
‘ – ‘ indicates there were no women in this sub-category with a high-grade cytology report.
Table 16 - Women with high-grade cytology who have follow-up within 90 and 180 days recorded on the NCSP Register, by urgency of referral and type of follow-up
Urgent referral
(HS2, SC, AC1-AC5) No suspicion of invasion
(ASH, HS1, AG1-AG5, AIS)
N % N %
Follow-up within 90 days
- histology 48 68.6 1,490 80.0
- any follow-up 51 72.9 1,659 89.0
- no follow-up 19 27.1 204 11.0
Follow-up within 180 days
- histology 57 81.4 1,638 87.9
- any follow-up 55 78.6 1,757 94.3
- no follow-up 15 21.4 106 5.7

National Cervical Screening Programme – Monitoring Report – Number 52 Page 110
Figure 76 - Proportion of women without any follow-up test within 90 days and within 180 days of a high-grade cytology report recorded on the NCSP Register, by DHB
There were no women without follow-up recorded within 180 days in Wairarapa, West Coast and Whanganui.
Figure 77 - Proportion of women without any follow-up test within 90 days and within 180 days of a high-grade cytology report recorded on the NCSP Register, by ethnicity

National Cervical Screening Programme – Monitoring Report – Number 52 Page 111
Table 17 - Women without any follow-up test within 90 and 180 days of a high-grade cytology report recorded on the NCSP Register, by DHB
DHB High-grade cytology
Without a follow-up test by 90 days
Without a follow-up test by 180
days
N N % N %
Auckland 220 27 12.3 21 9.5
Bay of Plenty 82 9 11.0 3 3.7
Canterbury 222 16 7.2 10 4.5
Capital & Coast 117 6 5.1 3 2.6
Counties Manukau 185 84 45.4 32 17.3
Hawke's Bay 76 8 10.5 2 2.6
Hutt Valley 61 2 3.3 2 3.3
Lakes 42 2 4.8 2 4.8
Mid Central 84 7 8.3 4 4.8
Nelson Marlborough 53 5 9.4 2 3.8
Northland 52 6 11.5 4 7.7
South Canterbury 27 3 11.1 1 3.7
Southern 161 8 5.0 6 3.7
Tairawhiti 31 3 9.7 1 3.2
Taranaki 61 3 4.9 2 3.3
Waikato 147 12 8.2 10 6.8
Wairarapa 17 - 0.0 - 0.0
Waitemata 256 21 8.2 16 6.3
West Coast 9 - 0.0 - 0.0
Whanganui 30 1 3.3 - 0.0
Unspecified - - -
Total 1,933 223 11.5 121 6.3 ‘ – ‘ indicates there were no women in this sub-category with a high-grade cytology report. Table 18 - Women without any follow-up test within 180 days of a high-grade cytology report recorded on the NCSP Register, by ethnicity
Ethnicity High-grade cytology
Without follow-up by 90 days
Without follow-up by 180 days
N N % N %
Māori 265 36 13.6 17 6.4
Pacific 103 42 40.8 25 24.3
Asian 219 33 15.1 16 7.3
European/ Other 1,346 112 8.3 63 4.7
Total 1,933 223 11.5 121 6.3

National Cervical Screening Programme – Monitoring Report – Number 52 Page 112
Figure 78 – Trends in the proportion of women with high-grade cytology who have follow-up within 90 days recorded on the NCSP Register, by DHB
Figure 79 – Trends in the proportion of women with high-grade cytology who have follow-up within 180 days recorded on the NCSP Register, by DHB

National Cervical Screening Programme – Monitoring Report – Number 52 Page 113
Figure 80 - Trends in the proportion of women with high-grade cytology who have follow-up within 90 days recorded on the NCSP Register, by ethnicity
Figure 81 - Trends in the proportion of women with high-grade cytology who have follow-up within 180 days recorded on the NCSP Register, by ethnicity
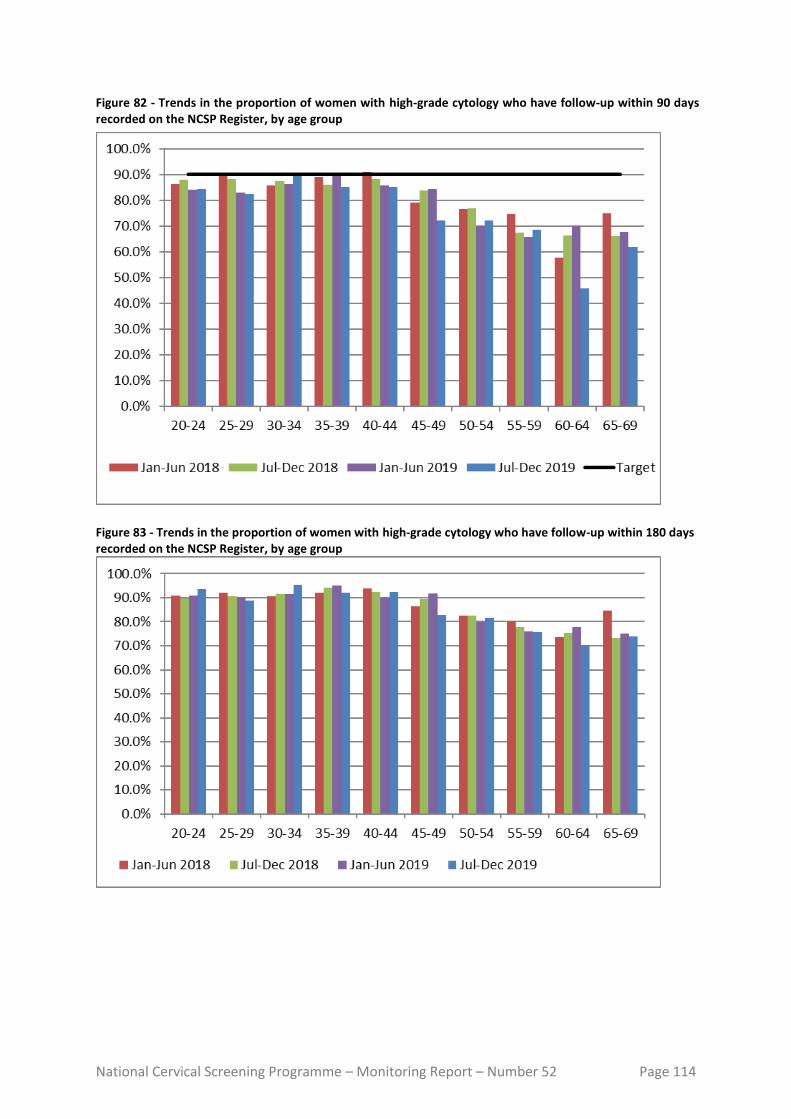
National Cervical Screening Programme – Monitoring Report – Number 52 Page 114
Figure 82 - Trends in the proportion of women with high-grade cytology who have follow-up within 90 days recorded on the NCSP Register, by age group
Figure 83 - Trends in the proportion of women with high-grade cytology who have follow-up within 180 days recorded on the NCSP Register, by age group

National Cervical Screening Programme – Monitoring Report – Number 52 Page 115
Figure 84 - Trends in the proportion of women with high-grade cytology who have no follow-up within 90 days recorded on the NCSP Register, by DHB
Figure 85 - Trends in the proportion of women with high-grade cytology who have no follow-up within 180 days recorded on the NCSP Register, by DHB
National Cervical Screening Programme – Monitoring Report – Number 52 Page 116
Indicator 7 – Colposcopy Indicators These indicators report on colposcopy, against the 2013 NCSP Policies and Standards, Section 6. They include the following aspects:
7.1. Timeliness of colposcopic assessment of high-grade cytology results (Standard 602)
7.2. Timeliness of colposcopic assessment of low-grade cytology results (Standard 602)
7.3. Adequacy of documenting colposcopy assessment (Standard 603)
7.4. Timeliness of treatment (Standard 605)
7.5. Timely discharging of women after treatment (Standard 608)
7.6. Failure or refusal to attend appointments (Standard 609)
7.7. Maintaining staff skill levels - minimum colposcopy volumes (Standard 611) Some of these indicators (7.6 and 7.7) have not been developed. It is envisioned that all indicators will be reviewed as part of the planned transition to primary HPV screening, and so these may be included in future monitoring reports after the programme transitions. Colposcopy data has been recorded on the NCSP Register for a relatively short time, compared to cytology and histology data. There is incomplete reporting of colposcopy data to the NCSP Register, and therefore results for these indicators may need to be interpreted with some caution. However, it was and is felt that colposcopy indicators were an important quality measure of the NCSP, and reporting on them should not be unduly delayed. This was also a recommendation of the 2011 Parliamentary Review into the NCSP.17 It is anticipated that completeness of colposcopy data on the NCSP Register will continue to improve over time. The 2015 Parliamentary Review again emphasised that achieving complete recording of colposcopy data on the NCSP Register is essential. 18 Additionally, not all DHBs were yet reporting the full data required by Colposcopy Policies and Standards 2013 for the full -time periods reported on in this report (as all indicators other than 7.3 can report on colposcopy which occurred earlier than the current monitoring period); the last three DHBs went live with the 2013 Standards in August 2016. This means that in many cases performance indicators are not directly compared to the targets or have had to rely on proxy data to measure performance. Where relevant, this is described in the sections relating to the individual indicators.

National Cervical Screening Programme – Monitoring Report – Number 52 Page 117
Indicator 7.1 – Timeliness of colposcopic assessment – high-grade cytology
Definition This indicator measures performance against Standard 602. It relates to the proportion of women seen at colposcopy within the recommended time period, from the time of the receipt of a referral from the sample taker for a high-grade cytology. As in Indicator 6, high-grade cytology results are included if the cytology sample was collected in the six months preceding the current monitoring period (i.e. 1 January - 30 June 2019). High-grade cytology is defined as that associated with any of the TBS codes ASH, HS1, HS2, SC, AG1-AG5, AIS, AC1-AC5. Where a woman has more than one high-grade cytology result in the relevant time period, the result from the first high-grade cytology sample collected is used. Timeliness of colposcopic assessment is calculated separately for those women with clinical suspicion of invasive carcinoma, or a suspicion of invasive carcinoma (based on either cytological interpretation TBS codes HS2, SC, AC1-AC5 or recommendation codes R10 or R14 that may be used in the context of symptoms); and for women with other high-grade cytology results (TBS codes ASH, HS1, AG1-AG5, AIS), since the timeframes differ for these two groups. Referrals and colposcopy visits for these women were retrieved from the NCSP Register. The standard requires that a woman be seen within a time period from when the colposcopy unit received the referral. However due to the completeness of the accepted referral date compared to the received date, referral accepted date is used in this indicator as a proxy for the date the referral was received, and the start date for calculating timeliness. Referrals were retrieved where the date on which the referral was accepted occurred after the date the cytology sample was collected, and the referral was accepted no later than four weeks prior to the end of the current monitoring period. Colposcopy visits recorded on the NCSP Register were retrieved if they occurred after an accepted referral (to the same DHB) and no later than the end of the current monitoring period. The difference of four weeks between the two was to ensure that there were at least four weeks of data following every accepted referral which could be searched for colposcopy visits. In the current report, histology data are also used to supplement colposcopy data and help ascertain if a colposcopy visit occurred. Women with a histology sample collected after their cytology sample are assumed to have attended a colposcopy clinic for follow-up on the date the histology sample was collected, even if a colposcopy visit is not explicitly recorded on the NCSP Register. Histology results have been used by the NCSP Register to follow up missing colposcopy visit data to improve the quality of colposcopy data on the Register. During the previous and current monitoring periods all DHBs adopted electronic reporting of the 2013 Standards, with the last three DHBs going live in August 2016. This has greatly improved the data on the Register and for public DHBs and when data are sufficiently complete future reports will be able to report directly against the 2013 Standards without using the current proxies for DHBs (with limited exceptions). Whereas, for private clinics complete reporting against the 2013 Standards is taking more time with the majority still

National Cervical Screening Programme – Monitoring Report – Number 52 Page 118
reporting against 2008 standards. Therefore, values reported for the private aggregate will need to continue to use histology proxies (where necessary) until all private data is in accordance with the 2013 Standards.
Results are reported by ethnicity and DHB. For women who attended colposcopy, DHB is assigned on the basis of the DHB of the colposcopy facility where they attended for colposcopy. The date on which the referral to that DHB was accepted is used to calculate timeliness. If there are multiple referrals for the same woman to that DHB, the date of the first accepted referral following the cytology sample is used. Women who attended colposcopy but had no relevant referral to that DHB recorded on the NCSP Register were excluded from the calculations of timeliness (since the time between the acceptance of the referral and the colposcopy visit could not be calculated). However, these women were reported on separately.
For women who did not attend colposcopy prior to the end of the current monitoring period, DHB is assigned based on the DHB of the facility which accepted the referral for that woman (where the referral was accepted no later than four weeks prior to the end of the current monitoring period). If there were multiple referrals for the same woman which occurred after the cytology sample, the most recently accepted referral within the timeframe was used.
For women who neither attended colposcopy nor had an accepted referral with any DHB, DHB is assigned on the basis of the health facility where their high-grade cytology sample was collected. Since cytology samples were collected in the six months prior to the current monitoring period, this allows a follow-up period of at least six months for all women (and up to 12 months for some women) where a woman can attend colposcopy and be assigned to a DHB, or alternately have a referral accepted by a DHB.
High-grade cytology tests indicating that a woman was already under specialist management (TBS=R13) were excluded from this measure.
Target Timeliness – high-grade cytology indicating suspicion of invasive disease
95% or more of women who have evidence of clinical suspicion of invasive carcinoma, or a laboratory report indicating ‘features suspicious for invasion’, or ‘changes consistent with squamous cell carcinoma’ (TBS codes HS2, SC, AC1-AC5), or similar, must receive a date for a colposcopy appointment or a gynaecological assessment that is within 10 working days from when the colposcopy unit received the referral from the cytology sample taker/ referrer. Timeliness – high-grade cytology (no suspicion of invasive disease) 95% or more of women who have high-grade cervical cytology sample abnormalities (but no suspicion of invasive disease; TBS codes ASH, HS1, AG1-AG5, AIS) must receive a date for a colposcopy appointment within 20 working days from when the colposcopy unit received the referral from the cytology sample taker/ referrer.
National Cervical Screening Programme – Monitoring Report – Number 52 Page 119
The targets for this indicator rely on records of colposcopy appointments on the NCSP Register. As advised by the Ministry and NCSP Advisory Group for all women with a high-grade cytology test in the six months prior to the current monitoring period, timeliness is instead measured from the time between a referral is accepted to when women have their first subsequent colposcopy visit, acknowledging that this is not exactly as stated in the Standard target above.
Current Situation
In the period 1 January - 30 June 2019, there were 1,933 women with high-grade cytology results who were not already under specialist management. There were 70 women who had results indicating suspicion of invasive disease, and the remaining 1,863 had other high-grade cytology results. In total, accepted referrals were found for 1,687 (87.3%) of the 1,933 women (Table 71). Timeliness – high-grade cytology indicating suspicion of invasive disease Accepted referrals for colposcopy were found for 37 (52.9%) of the 70 women who had high-grade cytology indicating suspicion of invasive disease. For those with an accepted colposcopy referral recorded, referrals are broken down by the detailed cytological result in Table 74. Of these 37 women with a referral, 31 (83.8%) have a record of a colposcopy visit on the NCSP Register within ten working days of their referral, and 33 (89.2%) have a visit within 20 working days (Table 19). Considering all 70 women with high-grade cytology indicating suspicion of invasive disease, regardless of whether or not a referral to colposcopy was recorded, a total of 55 (78.6%) have a record of a colposcopy visit prior to 31 December 2019 representing a follow-up period of at least six and up to 12 months after their high-grade cytology report. Timeliness – high-grade cytology (no suspicion of invasive disease) Accepted referrals for colposcopy were found for 1,650 women (88.6%) of the 1,863 women who had high-grade cytology not indicating suspicion of invasive disease. Among the women with accepted referrals, 1,179 (71.5%) were seen at colposcopy within 20 working days of their referral, and 1,424 (86.3%) were seen within 40 working days (Table 72). The proportion of women seen within 20 working days varied by ethnicity, from 34.6% (Pacific women) to 76.8% (European/ Other women; Figure 86, Table 72). This proportion also varied by DHB from 4.6% (Counties Manukau) to 100.0% (Whanganui; Figure 87, Table 73). The proportion of women seen within 20 and 40 working days was low in Counties Manukau, so the time period was additionally extended to a period of 80 working days; by this time, 87.0% of women had been seen in this DHB. In total, 1,761 (94.5%) of the 1,863 women with high-grade cytology (but no suspicion of invasive disease) relating to a sample collected in the period 1 January - 30 June 2019 have a record of a colposcopy visit prior to 31 December 2019 (representing a follow-up period of at least six and up to 12 months after their high-grade cytology).

National Cervical Screening Programme – Monitoring Report – Number 52 Page 120
Trends Nationally, the proportion of women with high-grade cytology indicating suspicion of invasive disease and an accepted colposcopy referral who were seen within the target timeframe (10 working days) has increased from 81.3% to 83.8%. The percentage of women with high-grade cytology indicating suspicion of invasive disease and an accepted colposcopy referral who were seen within 20 working days (89.2%) is also higher than the previous report (85.4%). The proportion of women with high-grade cytology (but no suspicion of invasive disease) and an accepted colposcopy referral was considerably lower in Counties Manukau in this report (from 36.0% to 4.6% within 20 working days and 64.7% to 19.1% within 40 working days). The proportion of women seen within 20 working days has been decreasing for at least the last two reporting periods in Counties Manukau, Hawke’s Bay, and Mid Central (Figure 89). The proportion of women with high-grade cytology (but no suspicion of invasive disease) and an accepted colposcopy referral who were seen within 20 working days (71.5%) is lower than in the previous report (72.9%). This proportion was also lower in three ethnic groups (Māori: 70.2% to 62.2%; Pacific: 47.7% to 34.6%; Asian: 68.1% to 66.0%; Figure 88). The proportion of all women with high-grade results for whom an accepted referral was available on the NCSP Register is lower in the current report compared to the previous report (87.3% in the current report; 87.9% in the previous report).
Comments Since this indicator relies on colposcopy data in the NCSP Register, any incompleteness in reporting of referrals and colposcopy visits at the time of the data extract from the NCSP Register (March 2020 for the current report) would lead to an underestimate of the number of women with referrals and/or follow-up colposcopy visits. In order to help address this, in the current report, histology data are also used to help ascertain if a colposcopy visit occurred. Women with a histology sample collected after their cytology sample are assumed to have attended a colposcopy clinic for follow-up, even if a colposcopy visit is not explicitly recorded on the NCSP Register. Among the 1,816 women (with or without a referral) who had a colposcopy visit by the end of the current monitoring period, there were 112 (7.1%) women where the colposcopy visit was not explicitly recorded on the NCSP Register and was inferred by using the histology result proxy. For women with high-grade cytology indicating suspicion of invasive disease, the number referred for colposcopy is likely to be an underestimation of women with appropriate follow-up. Many women referred with suspicion of invasive disease are referred directly to gynae-oncology for a cone biopsy instead of colposcopy. This likely explains the comparatively low proportion of women with AC1-5 results who have a record of colposcopy referral (50% or less). Therefore, the proportion with colposcopy in this group does not fully reflect the level of performance. Additional information about follow-up tests performed in women with high-grade cytology is included in Indicator 6. The same 1,933 women (70 with

National Cervical Screening Programme – Monitoring Report – Number 52 Page 121
suspicion of invasive disease, 1,863 with other high-grade cytology) are included in both this measure and Indicator 6. In Indicator 6, it was found that 1,694 (87.9%) had histology within 180 days and 1,812 (93.7%) had a follow-up test of some sort within 180 days. While in this indicator, colposcopy and histology records indicate that 1,816 (93.9%) women had attended colposcopy prior to 31 December 2019 (i.e. in a period of at least 181 days and up to one year after their high-grade cytology sample). Note that there may be some differences in results by DHB, however, since in Indicator 6 the DHB assigned to a woman is her own DHB (or, where this information is not available on the NCSP Register, the DHB of her responsible health facility, based on the clinic’s geographic location). In this indicator, women are assigned to a DHB based on either the DHB where they attended colposcopy, or the most recent DHB to which they have been referred (for women without colposcopy visits), or to the DHB of the health facility where the high-grade cytology sample was collected (for women with no referral and no colposcopy visit). Additionally, only public clinics are assigned a DHB within Indicator 7.1; private clinics are separated out and reported on as a group. Reasons why a woman may not attend colposcopy within the recommended timeframe include both capacity limitations within the clinic, and potentially factors related to the woman requiring follow-up. Currently there is incomplete information available on the NCSP Register about colposcopy appointments which are scheduled for women where the woman reschedules or does not attend. Therefore, in this indicator it is not possible to distinguish delays in attending colposcopy following high-grade cytology which are due to capacity constraints which restrict the clinic’s ability to offer timely appointments, and delays which may be due to an individual woman’s need to reschedule an appointment or failure to attend. Factors which may lead a woman to delay a recommended visit include caring responsibilities, planned travel, competing prior commitments, illness, or menstruation.

National Cervical Screening Programme – Monitoring Report – Number 52 Page 122
Table 19 - Women with a high-grade cytology report (suspicion of invasive disease), accepted referral and colposcopy visit, by ethnicity
Ethnicity HG women (suspicion
of invasion)
Urgent referrals received
Women seen within:
10 working days 20 working days
N N N % N %
Māori 10 8 7 87.5 8 100.0
Pacific 9 2 1 50.0 1 50.0
Asian 4 2 2 100.0 2 100.0
European/ Other 47 25 21 84.0 22 88.0
Total 70 37 31 83.8 33 89.2
Figure 86 - Percentage of women with a high-grade cytology (no suspicion of invasive disease) with a colposcopy visit within 20 and 40 working days, by ethnicity
95% target relates to colposcopy visits within 20 working days.

National Cervical Screening Programme – Monitoring Report – Number 52 Page 123
Figure 87 - Percentage of women with a high-grade cytology (no suspicion of invasive disease) with a colposcopy visit within 20 and 40 working days, by DHB
95% target relates to colposcopy visits within 20 working days. Figure 88 – Trends of the proportion of women with a high-grade cytology report (no suspicion of invasive disease) seen within 4 weeks (20 working days), by ethnicity
95% target relates to colposcopy visits within 20 working days.

National Cervical Screening Programme – Monitoring Report – Number 52 Page 124
Figure 89 – Trends of the proportion of women with a high-grade cytology report (no suspicion of invasive disease) seen within 4 weeks (20 working days), by DHB
95% target relates to colposcopy visits within 20 working days.
National Cervical Screening Programme – Monitoring Report – Number 52 Page 125
Indicator 7.2 – Timeliness of colposcopic assessment – low-grade cytology
Definition This indicator measures performance against Standard 602. It reports on the timeliness of colposcopic assessment of women with either persistent low-grade cytology, or low-grade cytology and concurrent positive hrHPV test. Women were included in this measure if they had a cytology sample collected in the 6-month period ending 12 months prior to the end of the current monitoring period (1 July – 31 December 2018 for the current report) where the results were low-grade (ASC-US or LSIL), and either a positive hrHPV test (within four weeks of the cytology result) or a previous low-grade cytology result (within the previous five years). Women undergoing test-of-cure management for a recent treatment of a high-grade squamous lesion (within the previous 4 years) were excluded. Referrals and colposcopy visits for these women were retrieved from the NCSP Register. Referrals were retrieved where the date on which the referral was accepted occurred after the date the cytology sample was collected, and at least 26 weeks before the end of the current monitoring period (i.e. 26 weeks before 31 December 2019, to allow at least 26 weeks following the referral for colposcopy to occur). Colposcopy visits recorded on the NCSP Register were retrieved if they occurred after the cytology test and no later than the end of the current monitoring period. In addition to explicit colposcopy visit records, histology samples in the same timeframe were used as a proxy for a colposcopy visit, to supplement colposcopy visit data. Results are reported by ethnicity and DHB. DHB is assigned in the same way as in Indicator 7.1. For women who attended colposcopy, DHB is assigned on the basis of the DHB of the colposcopy facility where they attended for colposcopy (or where the histology sample was collected if a visit is not explicitly recorded). If there are multiple referrals for the same woman to that DHB, the date of the first accepted referral following the cytology sample is used. For women who did not attend colposcopy prior to the end of the current monitoring period, DHB is assigned based on the DHB of the facility which accepted the referral for that woman. If there were multiple referrals for the same woman which occurred after the cytology sample, the most recently accepted referral within the timeframe was used. For women who neither attended colposcopy nor had an accepted referral with any DHB, DHB is assigned on the basis of the geographic region of the health facility where their low-grade cytology sample was collected. Since cytology samples were collected in the 6-month period ending 12 months prior to the end of the current monitoring period, this allows a follow-up period of at least twelve months for all women (and up to 18 months for some women) where a woman can attend colposcopy and be assigned to a DHB.
National Cervical Screening Programme – Monitoring Report – Number 52 Page 126
Target 95% of women who have persistent low-grade abnormalities, or a low-grade abnormality and positive HPV test, must receive a date for a colposcopy appointment that does not exceed 26 weeks of receipt of the referral. At present, this indicator reports on aspects of follow-up, but not specifically on timeliness in relation to the standard, as the date of the first colposcopic assessment is not yet available for all women with a low-grade cytology test in the 6-month period 12-months prior to the end of the current monitoring period. In the interim, it reports on the number and percentage of women for whom a subsequent accepted referral and/ or a colposcopy visit are recorded, and the number and proportion of women who attended colposcopy within 26 weeks of an accepted referral.
Current situation
There were 3,737 women with either persistent low-grade cytology or low-grade cytology and a positive hrHPV test collected in the period 1 July – 31 December 2018. Nationally, subsequent accepted referrals are recorded for 3,215 (86.0%) of these women, and subsequent colposcopy for 3,414 (91.4%). The proportion of women for whom a subsequent referral and colposcopy visit are recorded are shown by DHB in Figure 90, and by ethnicity in Figure 91. The proportion of women for whom an accepted referral was recorded on the NCSP Register ranged from 88.3% (Hawke's Bay) to 100.0% (South Canterbury, Wairarapa; Figure 90). The proportion of women with a subsequent colposcopy visit (which occurred by the end of the current monitoring period) recorded on the NCSP Register ranged from 85.1% (Hawke's Bay) to all women (South Canterbury, West Coast, Wairarapa; Figure 90). For ethnicity, the proportion of women for whom an accepted referral was recorded on the NCSP Register ranged from 83.5% for Asian women to 90.4% for Māori women (Figure 91). The proportion of women with a subsequent colposcopy visit recorded on the NCSP Register (regardless of whether or not a referral was recorded) ranged from 82.1% (Pacific women) to 93.3% (European/ Other women; Figure 91). Timeliness of colposcopic assessment is provided by examining the time between when a referral is accepted for a colposcopy and when a woman attended for colposcopy. Among the 3,215 women with an accepted referral nationally, 2,536 (78.9%) women attended for colposcopy within 26 weeks of their accepted referral (Table 75). By DHB, the proportion of women who attended for colposcopy within 26 weeks of their accepted referral ranged from 8.4% (Hawke's Bay) to all women (Taranaki, West Coast, Wairarapa; Figure 92, Table 75). By ethnicity, this figure ranged from 70.9% of Māori women attending for colposcopy within 26 weeks of their accepted referral, to 82.7% of Asian women (Figure 93, Table 76) Overall, 3,012 women attended colposcopy following an accepted referral on the NCSP Register, and by the end of the current monitoring period (a follow-up period of 12 - 18 months after their cytology sample). This is equivalent to 80.6% of all women with persistent low-grade cytology or low-grade cytology and a positive hrHPV test, and 93.7% of women who had an accepted referral following their low-grade cytology.

National Cervical Screening Programme – Monitoring Report – Number 52 Page 127
Trends Nationally, the proportion of women with a record of colposcopy within 26 weeks of being referred is lower (78.9% in the current report, compared to 80.1% in the previous report). It is lower in two ethnic groups (Māori and Pacific women) and higher in two (Asian and European/ Other women; Figure 94). The proportion of women seen within 26 weeks is higher than in the previous report in ten out of twenty DHBs (Figure 95). A substantial decrease (greater than 10 percentage points) in the proportion seen within 26 weeks was observed in four DHBs (Hawke’s Bay, Mid Central, Southern and Tairawhiti). Conversely, a substantial increase (greater than 10 percentage points) in the proportion of women with colposcopy within 26 weeks compared to the previous report was seen in one DHB (Waikato). The decrease in the number of women seen within 26 weeks appears to be associated with an substantial increase in the number of colposcopies performed in some of these DHB’s (see Figure 98).
Comments Since this indicator relies on colposcopy data in the NCSP Register, any incompleteness in reporting of referrals and colposcopy visits as at the time of the data extract from the NCSP Register (March 2020 for the current report) would lead to an underestimate of the number of women with referrals and/ or follow-up colposcopy visits. In order to help address this, in the current report, histology data are also used to help ascertain if a colposcopy visit occurred. Women with a histology sample collected after their cytology sample are assumed to have attended a colposcopy clinic for follow-up, even if a colposcopy visit is not explicitly recorded on the NCSP Register. As has been the case for previous monitoring periods, it is evident that referrals are incompletely recorded on the NCSP Register, as some women have a record of a colposcopy visit, but no record of an accepted referral.

National Cervical Screening Programme – Monitoring Report – Number 52 Page 128
Figure 90 - Follow-up recorded* for women with persistent LG cytology/ LG cytology and positive hrHPV test, by DHB
* For colposcopies ‘follow-up’ includes colposcopies or histology samples recorded on the NCSP Register which occurred no later than the end of the current monitoring period, regardless of whether there is a referral or not. Referrals includes those recorded on the NCSP Register that were accepted no later than 26 weeks prior to the end of the current monitoring period.
Figure 91 - Follow-up recorded* for women with persistent LG cytology/ LG cytology and positive hrHPV test, by ethnicity
* For colposcopies ‘follow-up’ includes colposcopies or histology samples recorded on the NCSP Register which occurred no later than the end of the current monitoring period, regardless of whether there is a referral or not. Referrals includes those recorded on the NCSP Register that were accepted no later than 26 weeks prior to the end of the current monitoring period.

National Cervical Screening Programme – Monitoring Report – Number 52 Page 129
Figure 92 - Women with persistent LG cytology/ LG cytology and positive hrHPV test and an accepted referral for colposcopy: percentage with a colposcopy visit recorded within 26 weeks of the date the referral was accepted, by DHB
Figure 93 - Women with persistent LG cytology or LG cytology and positive hrHPV test and an accepted referral for colposcopy: percentage with a colposcopy visit recorded within 26 weeks of the date the referral was accepted, by ethnicity

National Cervical Screening Programme – Monitoring Report – Number 52 Page 130
Figure 94 - Trends in the proportion of women with persistent LG cytology or LG cytology and positive hrHPV test and an accepted referral for colposcopy who have a colposcopy visit recorded within 26 weeks of the date the referral was accepted, by DHB
Figure 95 - Trends in proportion of women with persistent LG cytology or LG cytology and positive hrHPV test and an accepted referral for colposcopy who have a colposcopy visit recorded within 26 weeks of the date the referral was accepted, by ethnicity

National Cervical Screening Programme – Monitoring Report – Number 52 Page 131
Indicator 7.3 – Adequacy of documenting colposcopy assessment
Definition This indicator measures performance against Standard 603. The proportion of colposcopies which occurred within the monitoring period with complete reporting of
i) visibility of the squamo-columnar junction
ii) presence or absence of a visible lesion
iii) colposcopic opinion regarding the nature of the abnormality
iv) recommended management and follow-up
v) timeframe recommended for follow-up
vi) items i), ii), and iii) completed
Results are reported by DHB, based on the DHB of the facility where colposcopy was performed.
Target 100% of medical notes will accurately record colposcopic findings at first and any subsequent assessments, including:
i) visibility of the squamo-columnar junction
ii) presence or absence of a visible lesion
iii) visibility of the limits of lesion
iv) colposcopic opinion regarding the nature of the abnormality and the requirement for treatment
v) recommended management and follow-up
vi) timeframe recommended for follow-up. Items i), ii), v), vi) and the first of the items in iv) can be assessed using data in the NCSP Register, and are reported on below. Item iii) and the second half of item iv) cannot currently be assessed as although all DHBs have transitioned to reporting using 2013 Standards these fields cannot be fully utilised due to a lack of completeness. For private clinics, however, complete reporting against the 2013 Standards is likely to take more time with the majority still reporting against 2008 standards. Therefore, values reported for the private aggregate will continue to use proxies for a much longer period until complete 2013 reporting occurs. When calculating the completeness of recording of the colposcopic opinion regarding the nature of the abnormality, this was restricted to those colposcopy visits where the presence of a lesion was either noted (colposcopic appearance recorded as abnormal), or could not be ruled out (colposcopic appearance recorded as inconclusive).

National Cervical Screening Programme – Monitoring Report – Number 52 Page 132
When calculating the overall completeness of items i), ii), and iii), colposcopic opinion regarding the nature of the abnormality was only required where colposcopic appearance was recorded as either abnormal or inconclusive.
Current Situation
There were 12,146 colposcopy visits within the current monitoring period recorded on the NCSP Register. Documentation relating to these visits was analysed (Table 77). Nationally, the visibility of the squamo-columnar junction was documented for 97.3% of visits; the presence or absence of a lesion was documented for all visits; and an opinion regarding the lesion grade was documented for 92.5% of visits where the presence of a lesion could not be ruled out. Additionally, the type of follow-up was documented for 92.2% of visits and the timeframe for follow-up was documented for 91.6% of visits. The visibility of the squamo-columnar junction, presence or absence of a visible lesion, and the colposcopic opinion regarding the nature of the abnormality (where relevant) were all documented for 93.1% of visits. The colposcopic appearance was reported to be abnormal in 55.1% of colposcopies, and inconclusive in 4.5% of colposcopies (Table 77). Biopsies were taken at 91.9% of colposcopies when the colposcopic appearance was abnormal; 35.0% of colposcopies where the colposcopic appearance was reported as inconclusive, and 20.1% of colposcopies where colposcopic appearance was reported as normal (Table 78). Documentation varied by DHB, as shown in Figure 96 and Table 77. Documentation of visibility of the squamo-columnar junction varied from 92.3% (South Canterbury) to 99.5% of cases in Tairawhiti. In all DHBs, all colposcopy reports documented the presence or absence of a lesion. Recording of the opinion regarding the abnormality grade (which was only assessed if the colposcopic appearance was recorded as abnormal or inconclusive), ranged from 84.3% (South Canterbury) to 97.4% (Tairawhiti). Recording of the recommended type of follow-up ranged from 54.8% (Nelson Marlborough) to 99.2% of cases (Taranaki) and recording of the recommended timeframe for follow-up ranged from 54.8% (Nelson Marlborough) to 99.2% (Taranaki). Complete documentation of the visibility of the squamo-columnar junction, presence or absence of a visible lesion, and the colposcopic opinion regarding the nature of the abnormality (where required) ranged from 85.7% (South Canterbury) to 97.8% (Tairawhiti; Figure 97, Table 77). Abnormal colposcopic appearance ranged from 41.7% of colposcopies (South Canterbury) to 67.1% of colposcopies (West Coast). Inconclusive colposcopic appearance ranged from 1.6% of colposcopies (Tairawhiti) to 11.0% of colposcopies (West Coast; Table 78). The proportion of colposcopies where a biopsy was taken also varied by DHB. This proportion ranged from 86.6% of visits in Bay of Plenty, up to 97.6% (Whanganui) when the colposcopic appearance was abnormal, and from South Canterbury (7.1%) up to Wairarapa (37.5%) when the colposcopic appearance was normal (Table 79).

National Cervical Screening Programme – Monitoring Report – Number 52 Page 133
Colposcopies performed in private practice accounted for 10.9% of all colposcopies recorded on the NCSP Register in New Zealand in the current monitoring period. The documentation rate varied according to the recorded section in private practice when compared with public clinics overall (Table 77). Documentation completion rate was similar in private and public clinics overall for the proportion of colposcopies documenting visibility of the squamo-columnar junction (97.7% for private practice and 97.3% for public clinics overall) and for documenting the presence or absence of a lesion (100.0% in both private and public clinics). An opinion regarding the lesion grade was documented for 94.9% of visits in public practice where the presence of a lesion could not be ruled out and 92.2% of visits in private clinics. The proportion completed was lower in public clinics compared to private clinics overall for documenting follow-up timeframe (92.0% public clinics; 88.3% for private practice) and somewhat higher in private clinics overall for follow-up type (92.6% for public clinics and 89.4% for private practice). Complete documentation of the visibility of the squamo-columnar junction, presence or absence of a visible lesion, and the colposcopic opinion regarding the nature of the abnormality lower in public clinics compared to private clinics (94.9% for private practice vs 92.9% for public clinics overall.
Trends For New Zealand as a whole, documentation of colposcopy visit items has remained fairly consistent over the last four monitoring periods. In the current period visibility of the squamo-columnar junction was documented for 97.3% of colposcopies, compared with between 97.1% and 97.3% over the previous three monitoring periods. The presence or absence of a lesion was documented for all visits in the last four monitoring periods. In the current period an opinion regarding the lesion grade was documented for 92.5% of visits where the presence of a lesion could not be ruled out, compared with between 91.6% and 92.7% for the previous three monitoring periods. Recording of recommended follow-up type was documented for 92.2% of visits in the current period, which is within the range seen for the previous three periods (90.1% - 95.6%). This was also the case for recommended timeframe for follow-up, which was recorded for 91.6% of visits in the current period compared with 89.4% - 94.9% in the previous three periods. Trends in the completion of all required fields by DHB are shown in Figure 97. In total 60.3% of colposcopies had an associated biopsy compared to 59.4% in the previous report. Of these, biopsies were taken in 91.9% of colposcopies with an abnormal appearance in this report and 91.3% in the previous report. 20.1% of colposcopies with a normal appearance also had documentation of a biopsy taken in this reporting period and between 18.8% and 21.4% in previous reporting periods. Trends in the number of colposcopies recorded on the NCSP Register by DHB are shown in Figure 98. The number of colposcopies decreased in the current monitoring period in eight of the twenty DHBs with an overall decrease in the number of colposcopies of 1.0%.
Comments The current colposcopy standard was published in July 2013 (available at https://www.nsu.govt.nz/health-professionals/national-cervical-screening-programme/policies-and-standards). This indicator is only able to assess

National Cervical Screening Programme – Monitoring Report – Number 52 Page 134
adequacy of documentation where colposcopy visits have been entered onto the NCSP Register in accordance with the 2013 Colposcopy Standard. Therefore, it cannot provide an absolute estimate of adequacy if these data are incomplete on the NCSP Register (that is, if the colposcopy visit itself is not recorded on the NCSP Register). The data used in this analysis was extracted from the NCSP Register in March 2020. Some items required by the standard, such as the recording of recommended follow-up type and timeframe, cannot necessarily be completed at the time of the colposcopy visit – for example because they will depend on results of histology tests or other reviews. For DHBs that electronically report data to the NCSP Register, the completeness of these fields is likely to lag behind that of other fields, because the colposcopy visit data will be loaded onto the NCSP Register soon after the visit and before this information is available. As more DHBs have moved to electronic reporting, this lag could explain the reduction in the percentage of colposcopies where these items are complete, compared to previous reports. Additionally, since there is a lag in reporting recommended type and timeframe for follow-up, these two items were removed from the calculation of ‘all items complete’ in Report 43 and this has remained the case in subsequent reports. These are often not the fields with the lowest completion rates however, and therefore removing them from the calculation made a relatively small difference to ‘all items complete’. In the majority of the DHBs, the field with the lowest completion rate is the documentation of the opinion regarding the nature of abnormality grade (only required where the presence of a lesion could not be ruled out). It is possible that the low completion rate for predicted abnormality grade could be because some clinics are incorrectly interpreting the requirement to document a predicted abnormality grade (which should be documented at the time of colposcopy) as a requirement to document the diagnosed abnormality grade, which can only be done after histology results are available. Some items in the 2013 colposcopy standard are not included in the 2008 colposcopy visit form or on the NCSP Register, in particular the visibility of the limits of the lesion, the biopsy site, and an explicit colposcopic opinion regarding the need for treatment (although a recommended follow-up timeframe is recorded, and whether follow-up is recommended with a colposcopist, oncology services, or sample taker). It is also not possible to determine the reason for the visit from the colposcopy visit form, for example if this is a first visit or a follow-up visit; or whether it was prompted by a high-grade cytology result, a low-grade cytology result which is either persistent or accompanied by a positive high -risk HPV test result, a request for referral regardless of cytology results, or another reason. As most private colposcopists were still reporting to the NCSP Register using the 2008 standard and due to the low completeness of the fields required to calculate the additional items for those DHBs using 2013 Standards, these items could not be taken into account in this indicator for the current report.

National Cervical Screening Programme – Monitoring Report – Number 52 Page 135
Figure 96 - Completion of colposcopic assessment fields, by DHB
Figure 97 - Trends in the completion of all required colposcopic assessment fields, by DHB

National Cervical Screening Programme – Monitoring Report – Number 52 Page 136
Figure 98 - Trends in the number of colposcopies recorded on the NCSP Register, by DHB
National Cervical Screening Programme – Monitoring Report – Number 52 Page 137
Indicator 7.4 – Timeliness and appropriateness of treatment
Definition This indicator measures performance against Standard 605. It reports on the proportion of women with histological high-grade squamous intraepithelial lesions (HSIL) who are treated within eight weeks of histological confirmation. Histological HSIL is defined as CIN 2, CIN 3, CIN 2/3 or HSIL not otherwise specified (SNOMED codes M74007, M74008, M80102, M80702 and M67017). Histological LSIL is not routinely treated, as treatment is not recommended for women with low-grade abnormalities in the 2013 Colposcopy Standards (consistent with 2008 NCSP Guidelines for Cervical Screening in New Zealand). The 2013 Colposcopy Standard recommends that the number of women who are treated with low-grade lesions (less than CIN 2 on histology) be minimised. Therefore, treatment of LSIL is included in this report for descriptive purposes and to examine the appropriateness (not timeliness) of treatment. This report describes the number and proportion of women with histological low-grade squamous intraepithelial lesions (LSIL) who are treated. To ensure consistency in the follow-up time examined for each woman and in order to allow timely reporting, treatments are included if they occur within 26 weeks of histological confirmation. Histological LSIL is defined as CIN1 or CIN not otherwise specified (SNOMED codes M74006, M67016, M74000 and M67015). Women with histological LSIL who are treated but who also have a record of histological HSIL in the six-month period prior to their treatment are excluded, as their treatment in considered appropriate. Women are included in this indicator if they have a histology sample where the result is HSIL or LSIL (as previously defined, above), and the sample was collected in the six-month period immediately prior to the current monitoring period (i.e. in the period 1 January - 30 June 2019). HSIL results must have been reported at least 8 weeks prior to the end of the current monitoring period, and LSIL results must have been reported at least 26 weeks prior to the end of the current monitoring period, in order to allow sufficient follow-up time for this indicator. Treatment was defined as a colposcopy visit where there was a record of electrosurgical excision, laser ablation or excision, cold knife cone biopsy, or total hysterectomy. Colposcopy visits involving punch biopsies only are not included. DHB is assigned based on the clinic where the histology sample was collected.
Target 90% or more of women with HSIL are treated within 8 weeks of histological confirmation of CIN 2/3. There is no explicit target relating to low-grade lesions, but the standard recommends that the number of women who are treated with low-grade lesions (less than CIN 2 on histology) be minimised.

National Cervical Screening Programme – Monitoring Report – Number 52 Page 138
Current Situation
There were 2,054 women with a histological diagnosis of CIN 2/3 (associated with histology samples collected in the previous six months and reported at least eight weeks prior to 31 December 2019). Of these women, 1,262 women (61.4%) were treated within eight weeks of HSIL being histologically confirmed. The proportion of women treated within eight weeks varied widely by DHB, from 55.6% (Hawke's Bay) to 87.9% of women (Whanganui). No DHBs met the target of at least 90% of women treated within eight weeks of histological confirmation of HSIL (Figure 99, Table 20). No ethnicity group met the target with the proportion of women treated within eight weeks ranging from 53.5% in Pacific women to a maximum of 65.0% in Asian women (Figure 100). Similarly, no age group met the target, with the proportion of women treated within eight weeks ranging from 37.9% in 20-24 year old women to a maximum of 70.7% in 40-44 year old women (Figure 101). The age-specific proportions of women treated within eight weeks of histological confirmation of HSIL are shown by ethnicity in Figure 103 and Table 23. There were 1,872 women with a histological diagnosis of LSIL (associated with histology samples collected in the previous six months and reported at least 26 weeks prior to 31 December 2019). Treatment for histological LSIL is not routinely recommended in the 2013 Colposcopy Standards or the 2008 NCSP Guidelines for Cervical Screening in New Zealand19, and so timeliness of treatment is not examined or compared to a target for LSIL. However, for descriptive purposes and to examine appropriateness of treatment, follow-up records were retrieved for the 1,872 women with histological LSIL. Of these women, 114 (6.1%) women were subsequently treated within 26 weeks of LSIL being histologically confirmed and had no additional record of high-grade histology in the six months preceding their treatment. The proportion of women subsequently treated varied widely by DHB, from no women (Wairarapa and West Coast) to 16.7% (Northland and Taranaki; Table 20). The DHB where the largest number of women were treated was Canterbury (26 women). The minimum proportion of women treated within 26 weeks was 5.5% in Maori women and a maximum of 7.9% in Pacific women. The minimum proportion of women treated within 26 weeks was 0.0% in women <20 years and 0.3% in women 20-24 years old and a maximum of 15.8% in 60-64 year old women. The proportion treated by age and ethnicity are shown in Table 24.
Trends Nationally, the proportion of women with histological HSIL who were treated within eight weeks of histological confirmation is slightly higher than the previous monitoring report (61.1% in the previous report, 61.4% in the current report). The proportion of women with histological HSIL who were treated within eight weeks for the current report period is higher in thirteen of the twenty DHBs when compared with the previous report (Figure 102). The proportion treated within eight weeks has decreased over the last two monitoring periods in seven DHBs. The proportion of women with histological LSIL who were subsequently treated (within 26 weeks of LSIL being histologically confirmed) has increased, from 5.9% for the previous report to 6.1% in the current report.
Comments Whether or not treatment has occurred is determined for this indicator via colposcopy data in the NCSP Register. Trends may reflect changes in the

National Cervical Screening Programme – Monitoring Report – Number 52 Page 139
completeness of colposcopy data recording treatment within a DHB rather than necessarily true increases or decreases in the proportion of women treated. This incomplete recording of treatment potentially affects the results for treatments for both HSIL and LSIL. In some cases, treatment may have occurred in a different clinic to that where the original histology sample was collected. Facilities not explicitly defined as DHB (public) clinics are aggregated together as private practice. It is possible that women whose original HSIL (or LSIL) histology sample was collected outside a DHB clinic may in practice have been treated at a DHB clinic (or conversely a woman whose histology sample was collected at a DHB clinic may have been treated outside a DHB clinic). Note, however, that timeliness is assessed here by including any treatment visits, regardless of where they occurred. The 2013 National Cervical Screening Programme Policies and Standards: ‘Section 6 – Providing a Colposcopy Service’ requires colposcopy clinics to provide information about the “decision to treat date” and “date histology result is received”. At present, these dates are not available to use due to low completeness of this item on the NCSP Register. When this information is available for all DHBs for a full monitoring period, it will be used to calculate timeliness of treatment for women with histological HISL.

National Cervical Screening Programme – Monitoring Report – Number 52 Page 140
Figure 99 - Proportion of women treated within eight weeks of histological confirmation of HSIL, by DHB
Date that histology results were reported to requesting clinician is used as the date of histological confirmation. DHB is assigned based on the clinic where the original HSIL histology sample was collected, however treatments will be included regardless of where they occurred. Figure 100 - Proportion of women treated within eight weeks of histological confirmation of HSIL, by ethnicity

National Cervical Screening Programme – Monitoring Report – Number 52 Page 141
Figure 101 - Proportion of women treated within eight weeks of histological confirmation of HSIL, by age
Figure 102 - Trends in the proportion of women treated within eight weeks of histological confirmation of HSIL, by DHB

National Cervical Screening Programme – Monitoring Report – Number 52 Page 142
Figure 103 - Timeliness and appropriateness of treatment (HSIL), by age (20-69) and ethnicity

National Cervical Screening Programme – Monitoring Report – Number 52 Page 143
Table 20 - Timeliness and appropriateness of treatment, by DHB
Age Women with CIN 2/3
Treated within 8 weeks Women with histological LSIL*
Women subsequently treated†
N N % N N %
Public clinics (overall) 1,704 1,128 66.2 1,458 97 6.7 Auckland 139 88 63.3 136 7 5.1 Bay of Plenty 84 59 70.2 70 6 8.6 Canterbury 226 140 61.9 384 26 6.8 Capital & Coast 80 59 73.8 85 12 14.1 Counties Manukau 104 64 61.5 165 8 4.8 Hawke's Bay 54 30 55.6 15 1 6.7 Hutt Valley 51 37 72.5 33 3 9.1 Lakes 55 43 78.2 40 1 2.5 Mid Central 106 73 68.9 42 1 2.4 Nelson Marlborough 40 33 82.5 20 1 5.0 Northland 59 43 72.9 18 3 16.7 South Canterbury 29 24 82.8 8 1 12.5 Southern 157 93 59.2 58 1 1.7 Tairawhiti 43 31 72.1 15 1 6.7 Taranaki 44 25 56.8 30 5 16.7 Waikato 165 92 55.8 108 2 1.9 Wairarapa 14 10 71.4 11 0 0.0 Waitemata 180 119 66.1 165 17 10.3 West Coast 16 14 87.5 17 0 0.0 Whanganui 58 51 87.9 38 1 2.6 Private Practice 350 134 38.3 414 17 4.1 Total 2,054 1,262 61.4 1,872 114 6.1
DHB is assigned based on the clinic where the original HSIL histology sample was collected, however treatments will be included regardless of where they occurred. * CIN1, CIN not otherwise specified (SNOMED codes M67015, M67016, M74000 and M74006). CIN1 is not routinely treated (consistent with 2008 NCSP Guidelines for Cervical Screening in New Zealand), so these results are not compared to a target. They appear here for descriptive purposes to show how frequently the women with histologically confirmed LSIL were treated. † Includes women treated within 26 weeks of the date that LSIL histology results were reported to requesting clinician.

National Cervical Screening Programme – Monitoring Report – Number 52 Page 144
Table 21 - Timeliness and appropriateness of treatment, by ethnicity
Age Women with CIN 2/3
Treated within 8 weeks Women with histological LSIL*
Women subsequently treated†
N N % N N %
Māori 307 196 63.8 181 10 5.5 Pacific 86 46 53.5 76 6 7.9 Asian 206 134 65.0 230 18 7.8 European/ Other 1,455 886 60.9 1,385 80 5.8 NZ overall 2,054 1,262 61.4 1,872 114 6.1
* CIN1, CIN not otherwise specified (SNOMED codes M67015, M67016, M74000 and M74006). CIN1 is not routinely treated (consistent with 2008 NCSP Guidelines for Cervical Screening in New Zealand), so these results are not compared to a target. They appear here for descriptive purposes to show how frequently the women with histological LSIL were treated. † Includes women treated within 26 weeks of the date that LSIL histology results were reported to requesting clinician. Table 22 - Timeliness and appropriateness of treatment, by age
Age Women with CIN 2/3
Treated within 8 weeks Women with histological LSIL*
Women subsequently treated†
N N % N N %
<20 - - - 2 - - 20-24 272 103 37.9 339 1 0.3 25-29 436 265 60.8 342 9 2.6 30-34 470 324 68.9 319 20 6.3 35-39 304 193 63.5 231 9 3.9 40-44 181 128 70.7 186 19 10.2 45-49 140 90 64.3 166 20 12.0 50-54 91 60 65.9 110 14 12.7 55-59 74 45 60.8 90 10 11.1 60-64 44 29 65.9 38 6 15.8 65-69 31 18 58.1 35 4 11.4 70+ 11 7 63.6 14 2 14.3 NZ overall 2,054 1,262 61.4 1,872 114 6.1
* CIN1, CIN not otherwise specified (SNOMED codes M67015, M67016, M74000 and M74006). CIN1 is not routinely treated (consistent with 2008 NCSP Guidelines for Cervical Screening in New Zealand), so these results are not compared to a target. They appear here for descriptive purposes to show how frequently the women with histological LSIL were treated. † Includes women treated within 26 weeks of the date that LSIL histology results were reported to requesting clinician.

National Cervical Screening Programme – Monitoring Report – Number 52 Page 145
Table 23 - Timeliness and appropriateness of treatment (HSIL), by age (20-69) and ethnicity
Age Women with CIN2/3 (N) Treated within 8 weeks (%)
Māori Pacific Asian European/Other Māori Pacific Asian European/Other
20-24 40 10 7 215 47.5 60.0 28.6 35.3 25-29 59 16 30 331 61.0 62.5 53.3 61.3 30-34 64 20 55 331 67.2 65.0 69.1 69.5 35-39 36 12 45 211 72.2 41.7 68.9 62.1 40-44 31 12 14 124 77.4 50.0 78.6 70.2 45-49 30 3 21 86 53.3 33.3 81.0 65.1 50-54 22 8 11 50 63.6 25.0 45.5 78.0 55-59 13 1 14 46 76.9 100.0 64.3 54.3 60-64 6 3 4 31 66.7 33.3 50.0 71.0 65-69 4 - 5 22 50.0 - 60.0 59.1 70+ 2 1 - 8 100.0 100.0 - 50.0 NZ overall 307 86 206 1455 63.8 53.5 65.0 60.9
Table 24 - Timeliness and appropriateness of treatment (LSIL), by age (20-69) and ethnicity
Age Women with CIN2/3 (N) Treated within 8 weeks (%)
Māori Pacific Asian European/Other Māori Pacific Asian European/Other
<20 1 - - 1 - - - - 20-24 36 12 16 275 - - 6.3 - 25-29 35 11 31 265 2.9 - - 3.0 30-34 28 12 48 231 - 16.7 8.3 6.1 35-39 29 13 49 140 6.9 7.7 4.1 2.9 40-44 14 9 23 140 7.1 - 13.0 10.7 45-49 15 9 29 113 33.3 11.1 10.3 9.7 50-54 10 5 10 85 - 20.0 10.0 14.1 55-59 6 2 13 69 - - 15.4 11.6 60-64 4 - 4 30 25.0 - 25.0 13.3 65-69 3 2 6 24 - - 16.7 12.5 70+ - 1 1 12 - 100.0 - 8.3 NZ overall 181 76 230 1385 5.5 7.9 7.8 5.8
‘ – ‘ indicates there were no women in this sub-category with histological HSIL/ LSIL.
National Cervical Screening Programme – Monitoring Report – Number 52 Page 146
Indicator 7.5 – Timely discharging of women after treatment
Definition This indicator measures performance against Standard 608. It reports on the proportion of women treated for a high-grade lesion who:
• receive colposcopy within the period up to nine months after their treatment
• receive colposcopy and cytology within the period up to nine months after their treatment
• are discharged appropriately within 12 months of their treatment. Treatment was defined as a colposcopy visit where there was a record of electrosurgical excision, laser ablation or excision, cold knife cone biopsy, or total hysterectomy. Colposcopy visits involving punch biopsies only are not included. Treatment was included if it was for a high-grade lesion (CIN 2 or CIN 3), based on histology results for any histology specimen collected concurrent with or up to six months prior to treatment. To allow for 12 months of follow-up information to be available, this indicator reports on women treated in the six-month period ending 12 months prior to the end of the current monitoring period (i.e. 1 July - 31 December 2018). Records for each woman treated in the six-month period ending 12 months prior to the end of current monitoring period were retrieved from the NCSP Register. Among these treated women, the number of women with a colposcopy visit, and with both a colposcopy visits and a cytology sample was calculated. Follow-up colposcopy visits were not restricted to only those within the same DHB as where initial treatment occurred; rather any colposcopy visit recorded on the NCSP Register for that woman was included. Follow-up visits were retrieved for the period up to nine months after the treatment visit. Eligibility for discharge is not explicitly defined in the NCSP Colposcopy Standard, so based on advice from the NCSP Advisory Group, women were defined as eligible for discharge if they had a colposcopy visit and cytology test following their treatment, and their cytology result was negative. Women were defined as having been discharged when their colposcopy report form recommended follow-up by their sample taker/ referring practitioner. Results are reported by DHB, based on the DHB of the facility where the treatment colposcopy was performed. Therefore, for the purpose of this indicator, the DHB where treatment occurred was regarded as the DHB responsible for ensuring a treated woman was followed up. However, as previously described, the follow-up colposcopy visit need not have occurred within that DHB.
Target 90% or more of women treated for CIN 2 or 3 should have a colposcopy and cytology sample within the nine-month period post-treatment

National Cervical Screening Programme – Monitoring Report – Number 52 Page 147
90% or more of women treated for CIN 2 or 3 should be discharged back to the sample taker as appropriate.
Current Situation
There were 1,268 women treated for CIN 2 or CIN 3 lesions in the six-month period from 1 July - 31 December 2018. These women were followed up for 12 months from the date of their treatment visit. Follow-up post treatment There were 884 women (69.7%) with a follow-up colposcopy, and 866 women (68.3%) with both a follow-up colposcopy and a cytology sample in the nine-month period after their treatment visit. Figure 104 shows the percentage of treated women with a record of follow-up colposcopy, and both follow-up colposcopy and a cytology sample, in the period up to nine months post-treatment by DHB. Generally, the number of women with both cytology and colposcopy was very similar to the number of women with at least colposcopy (Table 81). The maximum number of women with colposcopy only and no record of a cytology sample in the timeframe was at most three in Canterbury. Nationally, the percentage of women treated for high-grade lesions with a record of colposcopy and cytology within the nine-month period post-treatment (68.3%) is below the target value of 90%. No DHBs met the target of at least 90% of women receiving cytology and colposcopy within nine months post-treatment (Figure 104, Table 81) The percentage of treated women with a record of both follow-up colposcopy and a cytology sample in the period up to nine months post-treatment varied by DHB from 26.3% (Bay of Plenty) to 89.2% women (Nelson Marlborough). Women discharged appropriately In total, 900 women (71.0% of those treated) were eligible to be discharged by 12 months after their treatment visit, and 742 of these women (82.4%) were discharged within 12 months of treatment (Table 80). Figure 105 shows how these percentages varied by DHB. The percentage of women eligible for discharge who were discharged within 12 months of treatment ranged from 52.6% (Bay of Plenty) to all eligible women (Hutt Valley, Waikato, Wairarapa, West Coast; Table 80). In some cases, the number of women eligible for discharge was small, so these results should be interpreted with caution (ten or fewer women in West Coast, Wairarapa, South Canterbury). Nine DHBs met the target of discharging 90% of women where appropriate within 12 months (Auckland, Capital & Coast, Counties Manukau, Hutt Valley, Nelson Marlborough, Southern, Waikato, Wairarapa, West Coast). In total (that is, without considering whether or not women met the criteria suggested by the NCSP Advisory Group to be eligible for discharge), 855 women were discharged within 12 months of being treated for a high-grade lesion (67.4% of all women treated for a high-grade lesion).
Trends The proportion of women with follow-up is lower overall (from 74.4% to 69.7% for colposcopy, and from 73.1% to 68.3% for both cytology and colposcopy). No DHBs

National Cervical Screening Programme – Monitoring Report – Number 52 Page 148
met the target of 90% of women having colposcopy and cytology within nine months of treatment, compared to four DHBs in the previous report. The proportion of women discharged appropriately to their sample taker by 12 months is lower (84.9% in the previous report; 82.4% in the current report). The number of DHBs meeting the target of 90% remained similar (nine in this report and the previous report).
Comments Since this indicator relies on colposcopy data in the NCSP Register, there is the possibility that incomplete reporting of colposcopy visits has led to an underestimate of the number of women with follow-up colposcopy visits and the number discharged in a given time period. The data used in this analysis was extracted from the NCSP Register in late March 2020. The target that 90% or more of women treated for CIN 2 or 3 should be discharged back to the sample taker as appropriate was assessed in this monitoring report, based on guidance from the NCSP Advisory Group as to when discharge would be appropriate. However, it should be noted that neither the 2008 NCSP Guidelines for Cervical Screening in New Zealand nor the 2013 Colposcopy Standards themselves provide explicit guidance for when discharge back to the sample taker is appropriate. In some circumstances, women may be treated within one DHB, but referred to another DHB for follow-up. This information is not always recorded in the NCSP Register, however this measure does take into account all follow-up visits which women attend, regardless of the DHB in which they occurred. For clarity in this report, women remain assigned to the DHB where their treatment was performed.

National Cervical Screening Programme – Monitoring Report – Number 52 Page 149
Figure 104 - Percentage of women treated with colposcopy, and both colposcopy and cytology, within nine months post-treatment, by DHB
Figure 105 - Percentage of women discharged appropriately within 12 months of treatment, by DHB
National Cervical Screening Programme – Monitoring Report – Number 52 Page 150
Indicator 8 – HPV tests The indicators report on the use of HPV testing. At present, they incorporate the following indicators:
8.1 Triage of low-grade cytology
8.2 HPV test volumes (including purpose for which the test was performed)
8.3 HPV tests for follow-up of women with a historical high-grade abnormality Other than HPV test volumes (indicator 8.2) specific monitoring of the other uses of HPV testing is not yet included. These other purposes include:
• Management of women previously treated for CIN
• Management of women with a high-grade squamous cytology result in the past followed by negative cytology
• Resolution of discordant cytology, colposcopy and histology

National Cervical Screening Programme – Monitoring Report – Number 52 Page 151
Indicator 8.1 – Triage of low-grade cytology
Definition For women with an ASC-US or LSIL (low-grade) cytology result relating to a cervical sample taken in the monitoring period, and with no recent abnormal cytology (i.e. abnormal cytology results relating to specimens taken in the preceding five years), the following are reported on as follows:
• The number and proportion of women with a subsequent HPV triage test (by age group, and cytology laboratory)
• Women with positive HPV triage result, as a proportion of women with a valid HPV test (by age group, and cytology laboratory)
• Histological outcomes in women with a positive triage test, where this information is available within 12 months following a positive HPV triage test
Where a woman has two different low-grade cytology results, relating to a sample or samples collected on the same date, she is grouped in accordance with the most serious result (i.e. LSIL). A subsequent HPV triage test is defined as an HPV test where the sample was collected at the same time or after the cytology sample, and where there is a result available (including invalid results). Women whose ASC-US or LSIL cytology test is associated with a recommendation code of R14 (refer regardless of cytology result) are excluded, as they may be symptomatic. Women who are aged less than 30 years are excluded from this indicator if they have ever had either a high-grade squamous cytology result (ASC-H, HSIL) or a high-grade squamous histology result (CIN 2/3), as they may be having an HPV test in order to follow-up a previous high-grade squamous abnormality (cytology or histology, i.e. historical testing or as a test-of-cure following treatment for CIN2/3). If a laboratory which performed the cytology refers the HPV test to a different laboratory, measures are based on the laboratory which performed the cytology test. Measures reported by age are based on the age of the women on the date that the cytology sample was collected.
Target Targets have not yet been set.
Current Situation
There were 578 women aged less than 30 years and 1,521 women aged 30 years or more with an ASC-US cytology result relating to a sample collected in the current monitoring period, and who had no abnormal cytology results relating to samples taken in the previous five years. The corresponding figures

National Cervical Screening Programme – Monitoring Report – Number 52 Page 152
for LSIL are 1,738 women aged less than 30 years and 1,544 women aged 30 years or more. HPV triage NCSP Guidelines (2008) recommend that women aged 30 years or more who have not had an abnormal cytology report in the previous five years are offered a HPV triage test following ASC-US or LSIL cytology. Among these eligible women, 97.1% of women aged 30 years or more with an ASC-US cytology result, and 97.4% of women aged 30 years or more with an LSIL cytology result are recorded as having a subsequent HPV test (Table 82, Table 83). These proportions ranged from 93.3% (Medlab Central Ltd) to 98.7 (Anatomical Pathology Services) for ASC-US cytology results and from 94.8% (LabPLUS) to 100.0% (Canterbury Health Laboratories) for LSIL cytology results (Figure 106, Table 82, Table 83). HPV triage is not included in the recommendations for women aged less than 30 years, and accordingly the proportions of women aged less than 30 years with a subsequent HPV test are very small. Subsequent HPV tests are recorded in the NCSP Register for 1.0% of women aged less than 30 years with ASC-US results, and 0.9% of women aged less than 30 years with LSIL results. These proportions ranged from no women (Canterbury Health Laboratories, LabPLUS, Pathlab) to 2.5% (Medlab Central Ltd) for women with ASC-US results, and from no women (Pathlab) to 1.6% (Southern Community Labs) for women with LSIL results (Table 82, Table 83). Positive triage tests Among women aged 30 years or more with a valid HPV triage test results, the proportion who were positive for high-risk HPV (hrHPV) was 22.3% for women with ASC-US results, and 59.4% for women with LSIL results. These proportions varied by laboratory from 11.9% (Canterbury Health Laboratories) to 28.7% (Anatomical Pathology Services) for women with ASC-US cytology (Figure 107), and from 42.9% (LabPLUS) to 78.1% (Canterbury Health Laboratories) for women with LSIL cytology (Figure 108). The proportion of women whose HPV triage test was positive also varied by age. Among women aged 30-69 years, HPV positivity rates were highest for those aged 30-39 years for women with ASC-US cytology (30.7%), and 30-39 years for those with LSIL cytology (65.5%). HPV positivity rates generally decreased with increasing age but were broadly similar for women in each of the 10-year age groups between 40 and 69 years. For women with ASC-US results, the positivity rates in the 10-year age groups between 40 and 69 years ranged between 16.5% and 26.0% (Figure 109, Table 25). For women with LSIL results, the positivity rates were between 53.4% and 54.5% for these 10-year age groups (Figure 109, Table 26). Histological outcomes in triage-positive women who attended colposcopy In order to allow sufficient time for women to have attended colposcopy following a positive triage test, histological outcomes were assessed in women with low-grade cytology and a positive HPV triage test in the six-month period 1 July – 31 December 2018. In this period, there were 390 women with an ASC-

National Cervical Screening Programme – Monitoring Report – Number 52 Page 153
US cytology result and positive HPV triage test, and 920 who had an LSIL cytology result and positive HPV triage test. 358 (91.8%) of the women with ASC-US who were triage-positive and 850 (92.4%) of the women with LSIL who were triage-positive had a record of colposcopy and/or histology within the 12 months following their initial test results. Among the women with a record of colposcopy, 244 (68.2%) and 604 (71.1%) of the women with ASC-US and LSIL respectively have a histology record. Histological outcomes in these women were initially considered in an analogous manner to Indicator 5.2 – that is, the number of women with CIN 2 or worse histology (CIN 2+; also see Appendix D), as a percentage of women who had a histology result available. The percentage of women with histology whose histology result was CIN 2+ was 21.7% for HPV triage-positive ASC-US and 18.7% for HPV triage-positive LSIL (Table 84, Table 85). These percentages varied by laboratory from 14.3% (Canterbury Health Laboratories) to 25.9% (Medlab Central Ltd) for HPV triage-positive ASC-US and from 10.0% (Canterbury Health Laboratories) to 30.2% (Medlab Central Ltd) for HPV triage-positive LSIL (Figure 110). We additionally considered histological outcomes as a percentage of women who attended colposcopy (rather than only those with a histology result), as some women may have no histology because colposcopic impression was normal. The corresponding percentages of women with CIN 2+ histology was 14.8% for HPV triage-positive ASC-US and 13.3% for HPV triage-positive LSIL (Table 84, Table 85). These percentages varied by laboratory from 10.5% (Canterbury Health Laboratories) to 16.3% (Anatomical Pathology Services) for HPV triage-positive ASC-US and from 8.8% (Canterbury Health Laboratories) to 22.2% (Medlab Central Ltd) for HPV triage-positive LSIL (Figure 111). For context, these are also compared with the corresponding percentages for women with ASC-H and HSIL cytology with CIN 2+ histology (among women who attended colposcopy within six months), by laboratory, in Figure 111 and Figure 112. Histological outcomes within 12 months in women with triage-positive test results are shown by age, as a percentage of women with histology recorded (Figure 113), and as a percentage of women with colposcopy recorded (Figure 114). Among women aged 30-69 years, the percentage of women with CIN 2+ histology within 12 months generally decreased with increasing age for HPV triage-positive ASC-US and LSIL. There were no cases of CIN 2+ among women aged 70+ years with ASC-US and a positive HPV triage test. There were no cases for women ages 70+ years with LSIL. The age group with the highest proportion of triage positive women with CIN2+ histology was 30-39 years for both ASC-US and LSIL (30.1% and 22.8%, respectively).
Trends HPV triage The proportion of women aged 30 years or more with low-grade cytology (and no recent abnormal cytology in the preceding five years) who received a subsequent HPV test is lower than the previous report for women with ASC-US results (97.6% in the previous period compared to 97.1% in the current period),

National Cervical Screening Programme – Monitoring Report – Number 52 Page 154
but women with LSIL results are higher than the previous period (96.0% in the previous period compared to 97.4% in the current period). The proportion of women aged less than 30 years with a subsequent HPV test is lower than the previous monitoring period for ASC-US but higher for LSIL results (1.1% in the previous period compared to 1.0% in the current period for ASC-US; and 0.6% in the previous period compared to 0.9% in the current period for LSIL). Positive triage tests The proportion of women aged 30 years or more who tested positive for a high risk HPV type is lower than the current report for ASC-US (23.7% in the previous report; 22.3% in the current report), and lower for LSIL (61.2% in the previous report; 59.4% in the current report). Histological outcomes in triage-positive women who attended colposcopy 91.8% of women with ASC-US cytology and a positive HPV triage test in the six-month reference period for the current report had a record of colposcopy and/or histology within the 12 months following their test result, which is higher than in the previous report (91.7%). For the current report, 68.2% of these women with colposcopy also had a histology record, which is lower than the previous report (69.8%). Of these women with a histology record, the histology result was CIN 2+ for 21.7% of women in the current report, compared with 19.6% in the previous report. When histological CIN 2+ outcomes were considered as a proportion of women with colposcopy, rather than histology, the corresponding figures were 14.8% in the current report versus 13.7% in the previous report. The proportion of triage-positive ASC-US women with CIN 2+ histology (among those who attended colposcopy) decreased compared to the previous report at three of six laboratories (Canterbury Health Laboratories, Medlab, Southern Community Labs; Figure 115). Caution must be taken when interpreting differences at LabPLUS due to frequently having small numbers of triage-positive women and therefore highly variable percentages). For women with LSIL cytology and a positive HPV triage test in the reference period for the current report, 92.4% had a record of colposcopy and/ or histology within 12 months of their result, which is higher than the 92.2% of women in the previous report. For the current report 71.1% of these women with colposcopy also had a histology record, compared with 70.8% in the previous report. Of those women with a histology record, the histology result was CIN 2+ for 18.7% of women in the current report, compared with 19.7% in the previous report. When histological CIN 2+ outcomes were considered as a proportion of women with colposcopy, rather than histology, the corresponding figures were 13.3% for the current report and 13.9% for the previous report. Trends in this proportion of LSIL triage-positive women with CIN 2+ histology (among those who attended colposcopy) are shown in Figure 116. The proportion with CIN2+ histology decreased in three laboratories (Canterbury Health Laboratories, LabPLUS, Southern Community Labs Dunedin).

National Cervical Screening Programme – Monitoring Report – Number 52 Page 155
Comments A small number of women aged less than 30 years with low-grade results, no recent abnormalities (in the previous five years) and no record at any time of a previous high-grade squamous abnormality (cytological or histological), have a record of a subsequent HPV test (22 women). This is the same number of women as in the previous report. It is uncertain whether these HPV tests were performed for the purpose of triage, or for other reasons. In this report, we excluded women aged less than 30 years from this indicator if they had ever had a previous high-grade squamous abnormality (either ASC-H/ HSIL cytology, or CIN 2/3 histology). This was done in order to avoid potential inadvertent inclusion in this group of women being tested for HPV in concordance with the guidelines as part of “historical testing”. This could occur as a result of a previous high-grade squamous abnormality (either ASC-H/ HSIL cytology, or CIN 2/3 histology) currently managed by annual cytology, which occurred more than five years earlier (since abnormalities within the previous five years are already taken into account). It is also possible that some women were aged 29 years at the time of their cytology sample, but 30 years at the time of the cytology result, although previous exploration has suggested that the extent of this is likely to be small.20,21 Another possible explanation is that these women are being followed up for a previous high-grade result but this is not recorded on the NCSP Register (for example because this occurred overseas). The HPV test may also have been ordered by a specialist. However note that inadvertent inclusion of HPV tests ordered by a specialist to resolve discordant results (or for historical testing) should be minimised since women were excluded from this indicator if they had any recent abnormalities (past five years, any abnormality grade); if they had ever had a high-grade squamous abnormality (but no glandular abnormality) recorded on the NCSP Register; if the sample for HPV testing was collected on the same day as a recorded colposcopy visit for that woman; or if the sample for HPV testing was collected more than five weeks after the cytology sample.

National Cervical Screening Programme – Monitoring Report – Number 52 Page 156
Figure 106 - Proportion of women (aged 30 years or more) with low-grade cytology who have a subsequent HPV test, by laboratory and cytology result
Excludes women with abnormal cytology in the five years preceding their low-grade cytology sample.
Figure 107 - Proportion of HPV triage tests which are positive following ASC-US cytology (women aged 30 years or more), by cytology laboratory
Note that LabPLUS results are based in very small numbers of triage-positive women (see Table 84).

National Cervical Screening Programme – Monitoring Report – Number 52 Page 157
Figure 108 - Proportion of HPV triage tests which are positive following LSIL cytology (women aged 30 years or more), by cytology laboratory
Figure 109 - Proportion of women with an HPV triage test who are HPV positive, by age and cytology result
Note: Excludes results for women aged less than 30 years and aged 70 years or more, since these are based on very small numbers of women with valid HPV test results.

National Cervical Screening Programme – Monitoring Report – Number 52 Page 158
Table 25 - HPV triage test results following ASC-US cytology, by age and cytology laboratory
Laboratory Women with valid HPV test
results Women with positive HPV test results (number and % within each age group)
< 30yrs* 30+ yrs < 30yrs* 30-39 yrs 40-49 yrs 50-59 yrs 60-69 yrs 70+ yrs
N N N % N % N % N % N % N %
Canterbury Health Laboratories 0 126 0 0.0 6 14.3 4 11.8 2 5.6 3 23.1 0 0.0
Anatomical Pathology Services 2 296 2 100.0 42 44.2 16 18.4 18 22.8 9 27.3 0 0.0
LabPLUS 0 148 0 0.0 9 19.6 9 17.3 4 12.9 5 29.4 1 50.0
Medlab Central Ltd 2 210 2 100.0 12 20.3 9 12.5 8 15.1 7 28.0 0 0.0
Pathlab 0 273 0 0.0 27 31.8 19 23.8 11 16.2 7 18.4 1 50.0
Southern Community Labs 2 424 1 50.0 50 33.8 16 15.4 19 17.4 16 29.1 0 0.0
Total 6 1477 5 83.3 146 30.7 73 17.0 62 16.5 47 26.0 2 12.5
Excludes women with abnormal cytology in the five years preceding their low-grade cytology sample. * Additionally excludes women with any previous squamous high-grade (cytology or histology).

National Cervical Screening Programme – Monitoring Report – Number 52 Page 159
Table 26 - HPV triage test results following LSIL cytology, by age and cytology laboratory
Laboratory Women with valid HPV test
results Women with positive HPV test results (number and % within each age group)
< 30yrs* 30+ yrs < 30yrs* 30-39 yrs 40-49 yrs 50-59 yrs 60-69 yrs 70+ yrs
N N N % N % N % N % N % N %
Canterbury Health Laboratories 1 64 1 100.0 29 80.6 9 69.2 9 75.0 3 100.0 0 0.0
Anatomical Pathology Services 1 351 1 100.0 96 57.5 49 52.7 31 47.7 13 56.5 2 66.7
LabPLUS 1 91 0 0.0 20 46.5 13 40.6 4 40.0 2 33.3 0 0.0
Medlab Central Ltd 1 111 0 0.0 40 76.9 17 50.0 8 61.5 5 41.7 0 0.0
Pathlab 0 243 - - 79 75.2 37 54.4 23 51.1 12 52.2 2 100.0
Southern Community Labs 12 644 10 83.3 191 65.4 104 57.8 65 56.0 28 54.9 2 40.0
Total 16 1504 12 75.0 455 65.5 229 54.5 140 53.6 63 53.4 6 60.0
Excludes women with abnormal cytology in the five years preceding their low-grade cytology sample. * Additionally excludes women with any previous squamous high-grade (cytology or histology).

National Cervical Screening Programme – Monitoring Report – Number 52 Page 160
Figure 110 – Triage-positive women with histologically-confirmed CIN 2+ within 12 months, as a percentage of all women with histology, by laboratory
Note that LabPLUS results are based in very small numbers of triage-positive women (see Table 84 and Table 85). Figure 111 – Triage-positive women with histologically-confirmed CIN 2+ within 12 months, as a percentage of all women who attended colposcopy, by laboratory
Note that LabPLUS results are based in very small numbers of triage-positive women (see Table 84 and Table 85).

National Cervical Screening Programme – Monitoring Report – Number 52 Page 161
Figure 112 - Women with histologically-confirmed CIN 2+ within 12 months, as a percentage of all women who attended colposcopy, by laboratory and referral cytology
Figure 113 – Triage-positive women with histologically-confirmed CIN 2+ within 12 months, as a percentage of women with histology recorded, by age

National Cervical Screening Programme – Monitoring Report – Number 52 Page 162
Figure 114 – Triage-positive women with histologically-confirmed CIN 2+ within 12 months, as a percentage of women with colposcopy recorded, by age
Figure 115 – Trends in ASC-US triage-positive women with histologically-confirmed CIN 2+ within 12 months, as a percentage of women with colposcopy recorded, by laboratory
Time periods relate to monitoring report periods; results relate to samples collected in the 6-month period 12 months prior to the monitoring period, to allow for sufficient follow-up time for colposcopy/ histology. See Table 84.

National Cervical Screening Programme – Monitoring Report – Number 52 Page 163
Figure 116 – Trends in LSIL triage-positive women with histologically-confirmed CIN 2+ within 12 months, as a percentage of women with colposcopy recorded, by laboratory
Time periods relate to monitoring report periods; results relate to samples collected in the 6-month period 12 months prior to the monitoring period, to allow for sufficient follow-up time for colposcopy/ histology. Note that this graph excludes LabPLUS due to frequently having small numbers of triage-positive women and highly variable percentages. See Table 85.

National Cervical Screening Programme – Monitoring Report – Number 52 Page 164
Indicator 8.2 – HPV test volumes
Definition All HPV tests received by laboratories within the monitoring period were retrieved. This volume of HPV tests (performed for any purpose) is reported on by:
• Laboratory
• Ethnicity
• Age group
• Purpose Purpose is defined as one of the following categories:
i) Post-treatment (women treated for high-grade squamous lesions (specifically CIN 2/3) in the period six months to four years prior to the HPV sample date, to capture two rounds of testing)
ii) Historical (high-grade squamous cytology (ASC-H/ HSIL) or histology (CIN 2/3) more than three years prior to the HPV test sample)
iii) Taken at colposcopy (HPV sample collected on the same date as a colposcopy visit or a histology sample in the same woman)
iv) HPV triage (as defined in Indicator 8.1, but restricted to women aged 30 years or more at the time of the cytology specimen, and where the low-grade cytology (ASC-US or LSIL) was no more than six months prior to the HPV test)
v) Other (tests which do not fit into any of the above categories) These categories are defined hierarchically in the order shown; that is, a test cannot fit into more than one category, and tests are only considered for inclusion in a category if no previous categories in the list apply. The purpose of tests is not at its final stage of development and is an item that is under ongoing review. Tests in the ‘Other’ category were explored further. The number of tests that fell into the ‘Other’ category was found to be relatively high in this report, but this analysis is nonetheless indicative of the appropriate purposes. It is also useful to report the extent of hrHPV tests for other purposes and the need to eliminate hrHPV tests for other purposes that are not within the NCSP guidelines. For this reason, the purpose of hrHPV tests are discussed in this report. Rates of invalid HPV tests are also reported on. Measures reported by age are based on the age of the women on the date that the HPV test sample was collected.
Target Targets have not yet been set.
National Cervical Screening Programme – Monitoring Report – Number 52 Page 165
Current Situation
Overall volumes There were 15,736 samples received by laboratories for HPV testing within the current monitoring period. These are reported on further in Table 86 to Table 92. Virtually all (98.0%) samples for HPV testing were from women aged 20-69 years. The large majority of women (87.2%) were aged 30 years or more (Figure 117, Table 90). The number of samples received by laboratories for HPV testing ranged from 812 (LabPLUS; 5.2% of all HPV tests) to 6,879 (Southern Community Labs; 43.7% of all HPV tests; Figure 118, Table 86). Figure 119 and Table 86 show for each laboratory the ratio of the number of HPV tests received, divided by the number of cytology tests received (expressed as a percentage). This measure provides some correction for the variation in workloads between different laboratories. It is likely, for example, that laboratories which process a larger volume of cytology tests would also undertake a larger volume of HPV tests. The ratio of HPV tests to cytology tests reported was on average 7.5% across New Zealand – that is, on average 7.5% of cytology tests are associated with an HPV test. This ratio varied by laboratory from 6.5% (Southern Community Labs; i.e. fewer HPV tests processed in relation to cytology tests processed than the national average) to 12.3% (Canterbury Health Laboratories; i.e. more HPV tests processed in relation to cytology tests processed than the national average). The distribution of HPV tests by ethnicity is shown in Table 89. The overall proportion of HPV tests with invalid results was 0.03% (Table 87). The proportion was small for the HPV test technologies reported (Table 88). Purpose of HPV tests These HPV tests were further analysed in order to ascertain the purpose for which they were performed. Nationally, it was calculated that 2,429 (15.4%) were for post-treatment management for women treated in the past four years (Figure 120); 5,758 (36.6%) were for follow-up management of women with high-grade squamous cytology or histology more than three years previously (historical testing); 1,500 (9.5%) were on samples collected at a colposcopy visit which did not fit into a previous category (possibly for resolution of discordant results); and 2,805 (17.8%) were for triage of low-grade cytology in women aged 30 years or more. There were 3,244 (20.6%) HPV tests that did not fit into any of the previously described categories (Figure 120). Further breakdowns of HPV tests by purpose are presented by age (Figure 121, Table 90), laboratory (Figure 122), and ethnicity (Table 89, Table 91). There were variations in HPV test purpose by age (Figure 121, Table 90). HPV triage (by the definition used here, and consistent with NCSP Guidelines) did not occur in women aged less than 30 years. In women aged less than 30 years, a comparatively larger proportion were taken for post-treatment management (30.8%) or at colposcopy (19.8%). For women aged 20-24 years the most common reason that HPV tests were performed were for colposcopy. For all 5-year age groups from 25 to 59 years the most common reason that HPV tests were performed were for historical high-grade squamous abnormalities (more than three years ago). For women aged 60-64 years and older the most common reason that HPV tests were performed were for Other.

National Cervical Screening Programme – Monitoring Report – Number 52 Page 166
HPV test purpose also varied by laboratory (Figure 122, Table 91). Among tests for which the purpose could be determined, the most common reason for HPV testing for all laboratories except LabPLUS was historical high-grade squamous abnormalities (more than three years ago. For LabPLUS, HPV triage was the most common reason for HPV testing. In all laboratories, however, tests for which the purpose was unclear were quite common, varying from 12.4% at LabPLUS to 26.5% Southern Community Labs. The proportion of tests performed for post-treatment management varied from 13.9% (Southern Community Labs) to 21.3% (Canterbury Health Laboratories), while the proportion performed to follow up women with historical high-grade squamous abnormalities varied from 21.3% (LabPLUS) to 42.1% (Anatomical Pathology Services). The proportion of tests where the sample was collected at colposcopy but not for one of the previous purposes ranged from 2.6% (Anatomical Pathology Services) to 22.7% (LabPLUS). The proportion of tests performed for HPV triage ranged from 14.3% (Southern Community Labs) to 28.7% (LabPLUS). The most common reason for HPV testing for Māori, Pacific and European/ Other women was historical high-grade squamous abnormalities (more than three years ago), whilst HPV triage was the most common reason for Asian women (Table 89). Tests in the ‘Other’ category were further explored. A proportion of the ‘Other’ tests (3.9%; 125 tests) were potentially tests performed for post-treatment management, because the same woman had CIN 2/3 histology recorded on the NCSP Register, however there was no explicit record of treatment available on the NCSP Register, potentially due to incomplete colposcopy data on the NCSP Register. Another 5.2% occurred after treatment, but did not meet the criteria for post-treatment management because they occurred within 6 months of treatment (1.0%; 32 tests), or after treatment of either a non-squamous high-grade (1.5%; 49 tests), or a non-high-grade (2.6%; 85 tests) or following treatment of cervical cancer (0.06%; 2 tests). A further 20.2% of the ‘Other’ HPV tests occurred after a previous abnormality but one which did not meet the criteria for historical testing either because it was non-squamous (9.9%; 321 tests), the high-grade squamous cytology was less than three years ago (10.1%; 329 tests), or the histology diagnosis was cervical cancer (0.2%; 5 tests). A larger proportion of the ‘Other’ tests (27.4%; 890 tests) occurred in women who did not have any specific high-grade abnormality recorded on the NCSP Register, but who did have a record on the NCSP Register suggesting that they had a previous high-grade abnormality (although the Register does not record whether it was a squamous abnormality or not; consequently, HPV testing is not indicated in these women by the NCSP guidelines). These records predominantly indicated prior high-grade cytology (22.0%; 714 tests), but some suggested prior high-grade histology (5.4%; 176 tests). Smaller proportions of HPV tests were associated with a low-grade abnormality, including either a current low-grade cytology result which did not meet the criteria for triage because the woman had another recent abnormality and triage was not required (3.0%; 97 tests), a record suggesting a previous low-grade cytology
National Cervical Screening Programme – Monitoring Report – Number 52 Page 167
not explicitly recorded on the NCSP Register (3.2%; 105 tests), or collected by a specialist where none of the above reasons applied (7.6%; 246 tests). After this exploration, there remained 958 tests (29.5% of ‘Other’ tests; 6.1% of all HPV tests in the monitoring period) where purpose still could not be determined. HPV tests at colposcopy HPV tests taken at colposcopy, were further explored based on the DHB of the colposcopy clinic where the sample was taken and whether or not it was a public or a private clinic. This included only HPV tests where a colposcopy record exists and not those inferred by a histology result. Nationally, more of the HPV tests that were taken at colposcopy came from public facilities (88.7%; 1,205 tests) than from private facilities (11.3%; 154 tests). As the number of HPV tests collected at a colposcopy clinic is potentially reflective of the number of colposcopies performed there, a rate of HPV tests at colposcopy which takes this variation into account was derived, in order to provide more information. The rate of HPV tests at colposcopy was calculated by dividing the number of HPV tests collected at colposcopy by the total number of colposcopies within that DHB or across private colposcopy clinics, expressed as a percentage. This rate can be broadly interpreted as the percentage of colposcopies (within a given DHB or sector) where an HPV test sample is collected. Across New Zealand, HPV test samples were collected in approximately 11.2% of colposcopies. In DHBs where HPV tests were collected at colposcopy, this value ranged from 3.1% (Auckland) to 35.7% (Lakes), and was 11.1% overall across all public DHB clinics (Figure 123, Table 92). In private practice, this rate was 11.6%. No HPV tests were conducted in Hutt Valley and Tairawhiti.
Trends A lower volume of HPV samples was received at laboratories for testing in the current (15,736) compared to the previous monitoring period (16,282; a decrease of 3.4%). Two laboratories experienced an increase in the number of samples received between the current monitoring period compared with the previous report period (LabPLUS and Medlab Central). The laboratory with the largest percentage decrease in the number of tests between the previous and current period was Anatomical Pathology Services (from 3,332 to 3,085; 7.4% decrease). Trends by laboratory can be seen in Figure 124. Changes in HPV test volumes varied across all test purpose categories. The greatest increase in the number of tests performed for the four guidelines categories (post-treatment, historical testing, HPV triage or tests at colposcopy) occurred in HPV tests taken at colposcopy (9.7% increase; 133 tests) and the greatest decrease was seen in HPV tests taken for ’Other’ reasons (decrease of 15.5% or 596 tests; Figure 125). A decrease was also seen in the number of HPV tests taken for post-treatment (107 tests). The proportion of HPV tests which are invalid remains very small (Table 88).
Comments HPV volumes by laboratory will vary for a number of reasons, one of which being the general volume of work in that laboratory. In order to provide some correction for the variation in workloads between different laboratories, we calculated the ratio of HPV tests received to cytology tests reported on (Figure
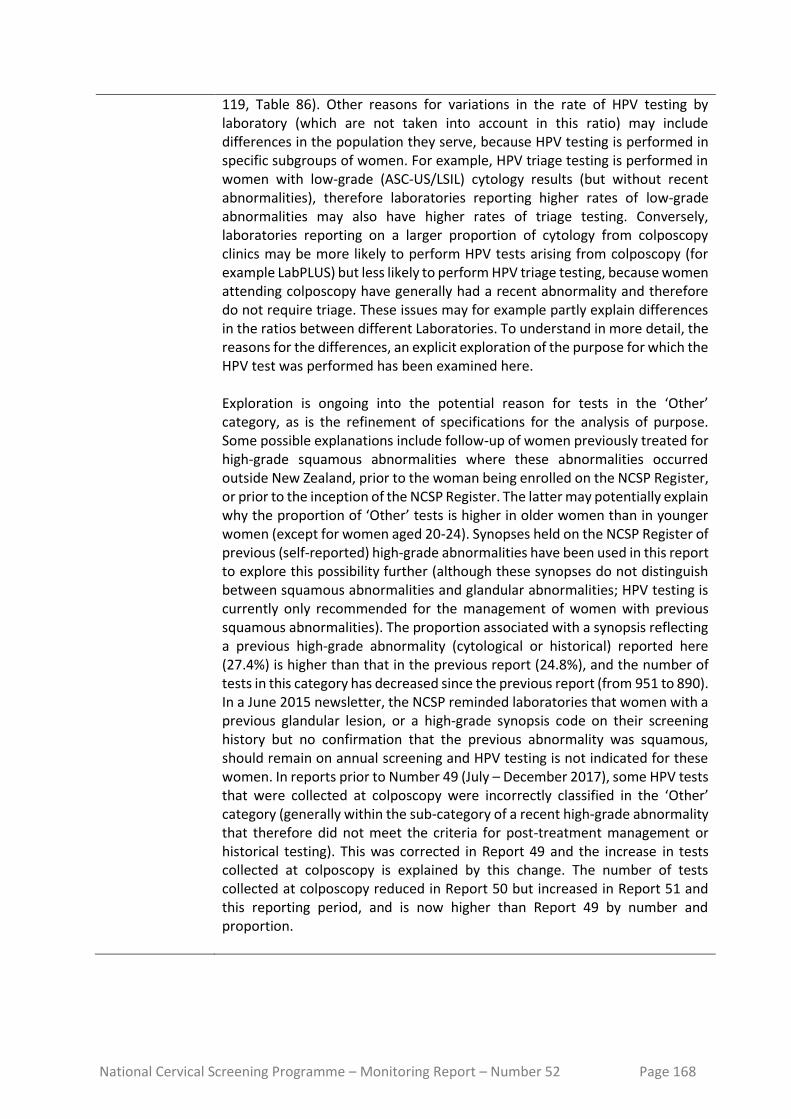
National Cervical Screening Programme – Monitoring Report – Number 52 Page 168
119, Table 86). Other reasons for variations in the rate of HPV testing by laboratory (which are not taken into account in this ratio) may include differences in the population they serve, because HPV testing is performed in specific subgroups of women. For example, HPV triage testing is performed in women with low-grade (ASC-US/LSIL) cytology results (but without recent abnormalities), therefore laboratories reporting higher rates of low-grade abnormalities may also have higher rates of triage testing. Conversely, laboratories reporting on a larger proportion of cytology from colposcopy clinics may be more likely to perform HPV tests arising from colposcopy (for example LabPLUS) but less likely to perform HPV triage testing, because women attending colposcopy have generally had a recent abnormality and therefore do not require triage. These issues may for example partly explain differences in the ratios between different Laboratories. To understand in more detail, the reasons for the differences, an explicit exploration of the purpose for which the HPV test was performed has been examined here. Exploration is ongoing into the potential reason for tests in the ‘Other’ category, as is the refinement of specifications for the analysis of purpose. Some possible explanations include follow-up of women previously treated for high-grade squamous abnormalities where these abnormalities occurred outside New Zealand, prior to the woman being enrolled on the NCSP Register, or prior to the inception of the NCSP Register. The latter may potentially explain why the proportion of ‘Other’ tests is higher in older women than in younger women (except for women aged 20-24). Synopses held on the NCSP Register of previous (self-reported) high-grade abnormalities have been used in this report to explore this possibility further (although these synopses do not distinguish between squamous abnormalities and glandular abnormalities; HPV testing is currently only recommended for the management of women with previous squamous abnormalities). The proportion associated with a synopsis reflecting a previous high-grade abnormality (cytological or historical) reported here (27.4%) is higher than that in the previous report (24.8%), and the number of tests in this category has decreased since the previous report (from 951 to 890). In a June 2015 newsletter, the NCSP reminded laboratories that women with a previous glandular lesion, or a high-grade synopsis code on their screening history but no confirmation that the previous abnormality was squamous, should remain on annual screening and HPV testing is not indicated for these women. In reports prior to Number 49 (July – December 2017), some HPV tests that were collected at colposcopy were incorrectly classified in the ‘Other’ category (generally within the sub-category of a recent high-grade abnormality that therefore did not meet the criteria for post-treatment management or historical testing). This was corrected in Report 49 and the increase in tests collected at colposcopy is explained by this change. The number of tests collected at colposcopy reduced in Report 50 but increased in Report 51 and this reporting period, and is now higher than Report 49 by number and proportion.

National Cervical Screening Programme – Monitoring Report – Number 52 Page 169
Figure 117 - Volume of HPV test samples received by laboratories during the monitoring period, by age
Figure 118 - Volume of HPV test samples received by laboratories during the monitoring period, by laboratory

National Cervical Screening Programme – Monitoring Report – Number 52 Page 170
Figure 119 - HPV test samples as a percentage of cytology test samples received during the monitoring period, by laboratory
HPV tests/ colposcopy can be interpreted as the percentage of cytology tests which have an associated HPV test.
Figure 120 - Volume of HPV test samples received during the monitoring period, by purpose

National Cervical Screening Programme – Monitoring Report – Number 52 Page 171
Figure 121 - HPV test samples received during the monitoring period, by purpose and age
Figure 122 - HPV test samples received during the monitoring period, by purpose and laboratory

National Cervical Screening Programme – Monitoring Report – Number 52 Page 172
Figure 123 - HPV test samples collected at colposcopy, in relation to total colposcopies* performed in the period, by DHB
HPV tests/ colposcopy can be interpreted broadly as the percentage of colposcopies within this DHB/ sector where a sample is collected for HPV testing. *the number of HPV tests here includes only HPV test samples where a colposcopy report record exists and is not inferred by a histology result. Figure 124 - Trends in volumes of HPV test samples received, by laboratory

National Cervical Screening Programme – Monitoring Report – Number 52 Page 173
Figure 125 - Trends in volumes of HPV test samples received, by purpose
Figure 126 - Trends in HPV test samples collected at colposcopy, in relation to total colposcopies* performed in the period, by DHB
HPV tests/ colposcopy can be interpreted broadly as the percentage of colposcopies within this DHB/ sector where a sample is collected for HPV testing. *the number of HPV tests here includes only HPV test samples where a colposcopy report record exists and is not inferred by a histology result.

National Cervical Screening Programme – Monitoring Report – Number 52 Page 174
Indicator 8.3 – HPV tests for follow-up of women with a historical high-grade abnormality
Definition NCSP Guidelines for Cervical Screening in New Zealand state that women with a previous high-grade squamous abnormality (ASC-H, HSIL, CIN 2/3) more than three years ago may benefit from two rounds of dual cytology and hrHPV testing (“historical testing”). If women test negative on both tests over two years, they can safely be screened according to the routine screening recommendations (cytology alone every three years until 70). HPV testing is not recommended for management of women with a historic non-squamous high-grade abnormality. The purpose of this indicator is to examine the extent to which historical testing is being used for women who are eligible for it, and the outcomes of these tests. Predominantly, women who are eligible for historical testing will be those who were eligible for it at the time it was introduced (1 October 2009), because women with more recent high-grade squamous abnormalities will be followed up with hrHPV testing in other ways (as part of standard post-treatment management and/ or use of hrHPV testing to assist in resolving discordant cytology and colposcopy/ histology). Women are considered to have been eligible for historical testing as at 1 October 2009 if:
i) They had a high-grade squamous abnormality (cytology or histology) more than three years prior to 1 October 2009, as per the definition of historical testing (i.e. prior to 1 October 2006) and
ii) They had no previous glandular abnormality (i.e. prior to 1 October 2009); and
iii) Between their historical high-grade squamous abnormality and 1 October 2009, they had either no cytology OR only negative cytology OR three consecutive negative cytology tests as their most recent cytology results; and
iv) They were alive on 1 October 2009.
Women were excluded, however, if they had been treated for a high-grade squamous abnormality within the three years prior to 1 October 2009, because this meant they met the criteria for post-treatment women, rather than historical testing. Note that this indicator also does not report on historical testing in any women who became eligible for it after 1 October 2009 (although as noted above, this should be a small group as women with more recent high-grade squamous abnormalities will be followed up with hrHPV testing in other ways). Within the current report, Round 1 and Round 2 historical tests are only considered for women who were both eligible for historical testing on 1 October 2009 and who also remained eligible for it throughout the current monitoring period. Therefore, in the current report, women were excluded if:

National Cervical Screening Programme – Monitoring Report – Number 52 Page 175
i) They were not still alive at the end of the current monitoring period (follow-up no longer possible); or
ii) They had a non-squamous high-grade abnormality between becoming eligible (on 1 October 2009) and the end of the current monitoring period (no longer eligible for historical testing)
HPV tests in these women from 1 October 2009 were retrieved. HPV tests which appeared to have been carried out for other recommended uses of HPV testing (such as HPV triage of low-grade cytology; HPV tests taken at colposcopy; or HPV tests performed to follow-up treatment of a high-grade squamous abnormality within the previous three years) were excluded since they were not performed for the purpose of historical testing. After excluding those tests, the first HPV test in each woman was defined as her Round 1 historical test. A Round 2 historical test was defined as the first HPV test which occurred at least 9 months after a Round 1 historical test. Measures reported by age are based on the age of the women at the end of the current monitoring period (i.e. a woman’s age at 31 December 2019). Measures reported by DHB are based on the geographic area relating to the woman’s residence (or if this information is not available, that of her responsible health provider).
Target Targets have not yet been set.
Current Situation
Overall women eligible for historical testing There were 50,511 women who, at 1 October 2009, were eligible for HPV testing to follow-up a historical squamous high-grade abnormality (“historical testing”). Of these women, 48,896 are considered in the current report (the remaining women were excluded because they were no longer alive at the end of the current monitoring period or were no longer eligible for historical testing because they had a non-squamous high-grade abnormality since 1 October 2009). There were no women eligible for historical testing who were aged less than 25 years at the end of the current monitoring period; however, this is not unexpected, as women in this age group would have been aged less than 18 years old on 1 October 2009 and few women this age are screened or treated for high-grade abnormalities (Table 93). HPV tests performed for historical reasons Overall, 34,950 (71.5%) of the women eligible for historical testing have a Round 1 historical test recorded on the NCSP Register. There were 30,358 women who also have a Round 2 historical tests (62.1% of eligible women; 86.9% of those with a Round 1 test). The proportion of women with historical tests varied by age. Among women aged 25 to 69 years at the end of the current monitoring period, the proportion of eligible women with a historical test varied from 60.0% (25-29 years) to 74.4% (60-64 years) for Round 1 tests, and from 40.0% (25-29 years) to 65.3% (65-69 years) for Round 2 tests (Figure 127, Table 93).

National Cervical Screening Programme – Monitoring Report – Number 52 Page 176
The proportion of eligible women with historical tests also varied by DHB, from 61.2% (Auckland) to 82.2% (Nelson Marlborough) for Round 1 tests, and from 50.3% (Counties Manukau) to 75.0% (Nelson Marlborough) for Round 2 tests ( Figure 128, Table 94). The number of women eligible for historical testing in a given DHB did not appear to have any relationship with the proportion who had received a historical test (Figure 135). The proportion of eligible women with Round 1 historical tests ranged from 54.9% in Pacific women to 73.3% in European/ Other women (Figure 129, Table 95). For Round 2 tests, this proportion ranged from 42.8% in Pacific women to 64.6% in European/ Other women. We explored whether the proportion of women with a historical HPV test was influenced by screening participation within the previous five years (asking the question does higher screening participation for any test, increase the likelihood of initiating a historical test). The variation in the proportion of women with historical tests recorded did not appear to be fully explained by variations in screening participation, either by DHB (Figure 136, Table 96) or by ethnicity (Figure 137).
Trends As this Indicator is reporting on the cumulative proportion of women who were eligible for HPV testing for the management of a historical high-grade squamous lesion as at 1 October 2009, the proportion is generally expected to increase over time. The proportion of eligible women with an HPV test recorded is higher than in the previous report from 70.5% to 71.5% for Round 1 tests, and from 60.5% to 62.1% for Round 2 tests. It has also done so in every DHB (Figure 130), ethnicity (Figure 131) and age group (Figure 132) between this and the previous report.
Comments This indicator currently only considers women who had a high-grade squamous abnormality more than three years prior to 1 October 2009. It is anticipated that women with more recent high-grade squamous abnormalities will be followed up via standard post-treatment management which also includes hrHPV testing. It was intended that future monitoring reports would also incorporate reporting on the use of hrHPV tests for the purpose of post-treatment management as a separate sub-indicator within Indicator 8. However, development of additional indicators has been suspended prior to the programme’s planned transition to primary HPV screening, as indicators will be reviewed as part of the transition process.
Planned future refinements include reporting on the proportion of the Round 1 and Round 2 historical tests where hrHPV was detected, and on how many women are able to be returned to routine screening after two rounds of negative cytology and hrHPV tests; considering women with a historical high-grade squamous abnormality who became eligible for historical testing after 1 October 2009; and taking into account whether women have attended for any screening test, since women who have not attended for any testing could not be offered historical testing. This last point has been partially explored within

National Cervical Screening Programme – Monitoring Report – Number 52 Page 177
the current report, by considering whether there was any relationship between the variations in women with Round 1 and Round 2 historical tests by DHB or ethnicity and the variations in screening participation within the previous five years by DHB or ethnicity. An extended period of five-years was examined for screening participation (rather than three, which is the usual measure), since it corresponds more closely than three-year participation during which we searched for HPV tests in this group of women (i.e. from 1 October 2009 to the time of the data download from NCSP Register used within this report, early March 2019). However, as women with a previous abnormality are recommended to re-attend for screening more frequently than the routine interval, the variations in overall attendance by DHB or by ethnicity may differ from the variations by DHB or ethnicity in this subgroup of women who have had a previous abnormality. It is possible that in some cases eligible women were offered historical HPV testing, but did not consent to the test. It has not been possible to take this into account within the current report. While this affects Round 1 tests, this should be less of an issue for Round 2 tests, because in June 2015 the NCSP requested that laboratories prompt sample takers to add on an HPV test where this is indicated by the Guidelines, but was not requested by the sample taker. Additionally, for women who had already consented to the Round 1 HPV test, separate consent was not required for a Round 2 HPV test.
It is also possible that the reason some women underwent Round 1 tests, but not Round 2 tests, is because their concurrent cytology result indicated that other management (for example colposcopy referral) was required. This might be explored when this indicator is further refined to report on the test results in women who have undergone historical testing.

National Cervical Screening Programme – Monitoring Report – Number 51Number 52 Page 178
Figure 127 - Proportion of eligible women with squamous high-grade abnormality more than 3 years ago for whom an historical test is recorded on the NCSP Register, by age at 31 December 2019
No women aged less than 25 years at the end of the current monitoring period were eligible for historical testing on 1 October 2009. Figure 128 - Proportion of eligible women with squamous high-grade abnormality more than 3 years ago for whom an historical test is recorded on the NCSP Register, by DHB at 31 December 2019

National Cervical Screening Programme – Monitoring Report – Number 51Number 52 Page 179
Figure 129 - Proportion of eligible women with squamous high-grade abnormality more than 3 years ago for whom an historical test is recorded on the NCSP Register, by ethnicity at 31 December 2019.
–
Figure 130 - Trends in the proportion of eligible women with squamous high-grade abnormality more than 3 years ago for whom a round 1 historical test is recorded on the NCSP Register, by DHB

National Cervical Screening Programme – Monitoring Report – Number 51Number 52 Page 180
Figure 131 - Trends in the proportion of eligible women with squamous high-grade abnormality more than 3 years ago for whom a round 1 historical test is recorded on the NCSP Register, by ethnicity
Figure 132 - Trends in the proportion of eligible women with squamous high-grade abnormality more than 3 years ago for whom a round 1 historical test is recorded on the NCSP Register, by age
No women aged less than 25 years at the end of the current monitoring period were eligible for historical testing on 1 October 2009.

National Cervical Screening Programme – Monitoring Report – Number 51Number 52 Page 181
Appendix A – Additional data
Indicator 1 - Coverage
Indicator 1.1 – Three-year coverage
Table 27 - Three-year coverage by DHB (women 25-69 years screened in the three years prior to 31 December 2019, hysterectomy adjusted)
DHB Hysterectomy adjusted population Women screened in the last 3 years
N N %
Auckland 139,511 105,141 75.4
Bay of Plenty 66,385 49,365 74.4
Canterbury 151,430 109,262 72.2
Capital & Coast 87,395 66,957 76.6
Counties Manukau
148,405 100,187 67.5
Hawke's Bay 44,797 31,476 70.3
Hutt Valley 42,093 30,410 72.2
Lakes 30,170 21,886 72.5
Mid Central 46,976 33,053 70.4
Nelson Marlborough
41,922 31,535 75.2
Northland 48,417 32,216 66.5
South Canterbury 15,954 11,341 71.1
Southern 88,462 64,631 73.1
Tairawhiti 12,405 9,385 75.7
Taranaki 31,911 24,575 77.0
Waikato 110,200 79,907 72.5
Wairarapa 12,479 8,620 69.1
Waitemata 170,189 122,410 71.9
West Coast 8,644 6,287 72.7
Whanganui 17,146 12,035 70.2
Total 1,314,891 950,679 72.3
Table 28 - Three-year coverage by ethnicity (women 25-69 years screened in the three years prior 31 December 2019, hysterectomy adjusted)
Ethnicity Hysterectomy adjusted population (ages 25-69 years)
Women screened in the last 3 years (ages 25-69 years)
N %
Māori 185,951 109,177 58.7
Pacific 75,569 49,683 65.7
Asian 230,475 142,315 61.7
European/ Other 822,896 649,504 78.9
Total 1,314,891 950,679 72.3

National Cervical Screening Programme – Monitoring Report – Number 51 Page 182
Table 29 - Three-year coverage by age (women 20-69 years screened in the three years prior to 31 December 2019, hysterectomy adjusted)
Age Hysterectomy adjusted population
Women screened in the last 3 years N %
20-24 163,062 71,396 43.8
25-29 177,672 109,570 61.7
30-34 176,892 119,116 67.3
35-39 157,711 115,055 73.0
40-44 144,511 109,478 75.8
45-49 153,905 119,734 77.8 50-54 143,832 111,710 77.7
55-59 140,901 107,844 76.5
60-64 120,338 89,004 74.0
65-69 99,129 69,168 69.8
20-69 1,477,953 1,022,075 69.2
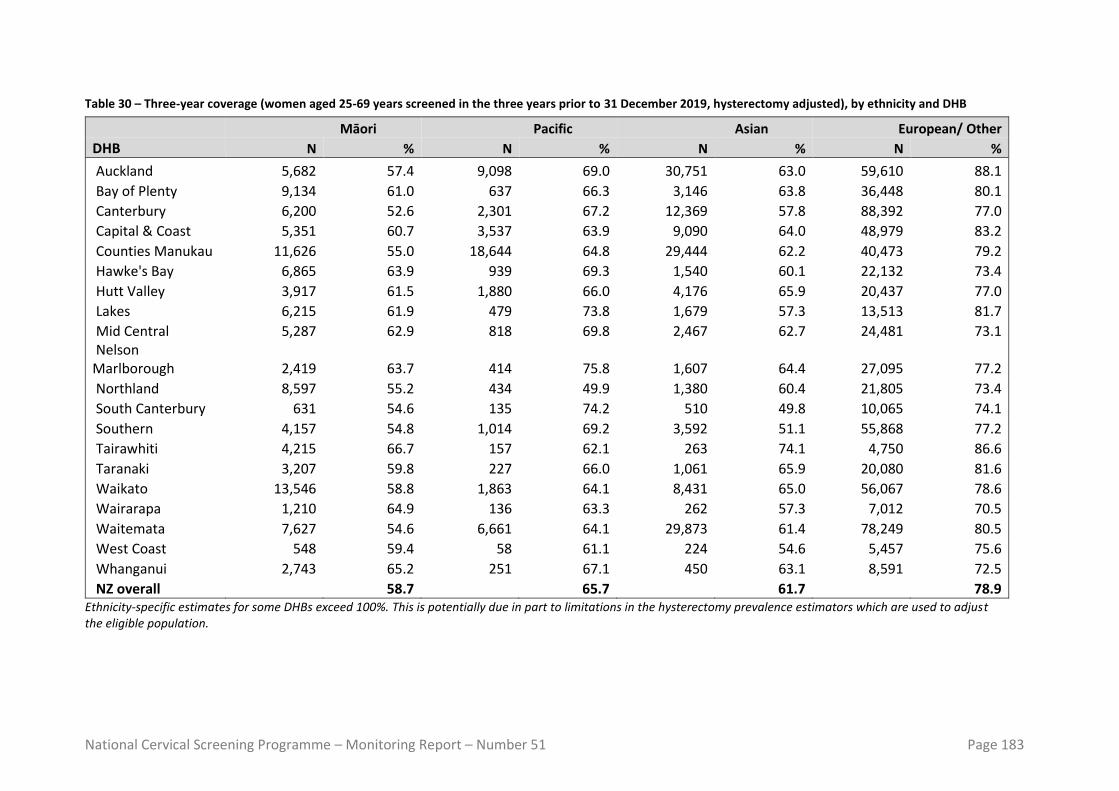
National Cervical Screening Programme – Monitoring Report – Number 51 Page 183
Table 30 – Three-year coverage (women aged 25-69 years screened in the three years prior to 31 December 2019, hysterectomy adjusted), by ethnicity and DHB
Māori Pacific Asian European/ Other
DHB N % N % N % N %
Auckland 5,682 57.4 9,098 69.0 30,751 63.0 59,610 88.1
Bay of Plenty 9,134 61.0 637 66.3 3,146 63.8 36,448 80.1
Canterbury 6,200 52.6 2,301 67.2 12,369 57.8 88,392 77.0
Capital & Coast 5,351 60.7 3,537 63.9 9,090 64.0 48,979 83.2
Counties Manukau 11,626 55.0 18,644 64.8 29,444 62.2 40,473 79.2
Hawke's Bay 6,865 63.9 939 69.3 1,540 60.1 22,132 73.4
Hutt Valley 3,917 61.5 1,880 66.0 4,176 65.9 20,437 77.0
Lakes 6,215 61.9 479 73.8 1,679 57.3 13,513 81.7
Mid Central 5,287 62.9 818 69.8 2,467 62.7 24,481 73.1 Nelson Marlborough 2,419 63.7 414 75.8 1,607 64.4 27,095 77.2
Northland 8,597 55.2 434 49.9 1,380 60.4 21,805 73.4
South Canterbury 631 54.6 135 74.2 510 49.8 10,065 74.1
Southern 4,157 54.8 1,014 69.2 3,592 51.1 55,868 77.2
Tairawhiti 4,215 66.7 157 62.1 263 74.1 4,750 86.6
Taranaki 3,207 59.8 227 66.0 1,061 65.9 20,080 81.6
Waikato 13,546 58.8 1,863 64.1 8,431 65.0 56,067 78.6
Wairarapa 1,210 64.9 136 63.3 262 57.3 7,012 70.5
Waitemata 7,627 54.6 6,661 64.1 29,873 61.4 78,249 80.5
West Coast 548 59.4 58 61.1 224 54.6 5,457 75.6
Whanganui 2,743 65.2 251 67.1 450 63.1 8,591 72.5
NZ overall 58.7 65.7 61.7 78.9 Ethnicity-specific estimates for some DHBs exceed 100%. This is potentially due in part to limitations in the hysterectomy prevalence estimators which are used to adjust the eligible population.

National Cervical Screening Programme – Monitoring Report – Number 51 Page 184
Table 31 – Three-year coverage (women aged 25-69 years screened in the three years prior to 31 December 2019 hysterectomy adjusted), by ethnicity and age
Māori Pacific Asian European/ Other
Age group N % N % N % N %
25-29 16,966 55.0 6,979 49.5 15,961 39.5 69,664 75.5
30-34 15,476 55.5 6,668 59.2 24,717 54.3 72,255 78.3
35-39 12,951 57.2 6,296 63.3 25,379 65.2 70,429 81.7
40-44 12,825 59.3 6,251 69.6 18,231 68.4 72,171 82.7
45-49 13,774 62.0 6,112 71.3 15,852 71.5 83,996 83.2
50-54 12,249 62.2 5,876 73.6 13,559 73.8 80,026 81.8
55-59 11,421 63.6 4,999 75.9 11,843 75.0 79,581 79.1
60-64 8,158 59.7 3,801 82.0 9,945 75.2 67,100 75.5
65-69 5,357 56.9 2,701 76.4 6,828 72.8 54,282 70.7
NZ overall 58.7 65.7 61.7 78.9

National Cervical Screening Programme – Monitoring Report – Number 52 Page 185
Table 32 - Coverage by DHB (women aged 25-69 years screened in the five years prior to 31 December 2019, hysterectomy adjusted)
DHB Hysterectomy adjusted population Women screened in the last 5 years
N N %
Auckland 139,511 126,764 90.9
Bay of Plenty 66,385 57,550 86.7
Canterbury 151,430 128,728 85.0
Capital & Coast 87,395 79,543 91.0
Counties Manukau
148,405 124,483 83.9
Hawke's Bay 44,797 37,960 84.7
Hutt Valley 42,093 35,977 85.5
Lakes 30,170 25,737 85.3
Mid Central 46,976 38,903 82.8
Nelson Marlborough
41,922 36,717 87.6
Northland 48,417 39,036 80.6 South Canterbury 15,954 13,449 84.3
Southern 88,462 76,323 86.3
Tairawhiti 12,405 11,260 90.8
Taranaki 31,911 28,687 89.9
Waikato 110,200 93,707 85.0
Wairarapa 12,479 10,331 82.8
Waitemata 170,189 146,165 85.9
West Coast 8,644 7,441 86.1
Whanganui 17,146 14,264 83.2
Total 1,314,891 1,133,025 86.2 Table 33 - Coverage by ethnicity – women aged 25-69 years screened in the five years prior to 31 December 2019, hysterectomy adjusted
Ethnicity Hysterectomy adjusted population
Women screened in the last 5 years N %
Māori 185,951 136,694 73.5
Pacific 75,569 65,644 86.9
Asian 230,475 167,026 72.5
European/ Other 822,896 763,661 92.8
Total 1,314,891 1,133,025 86.2
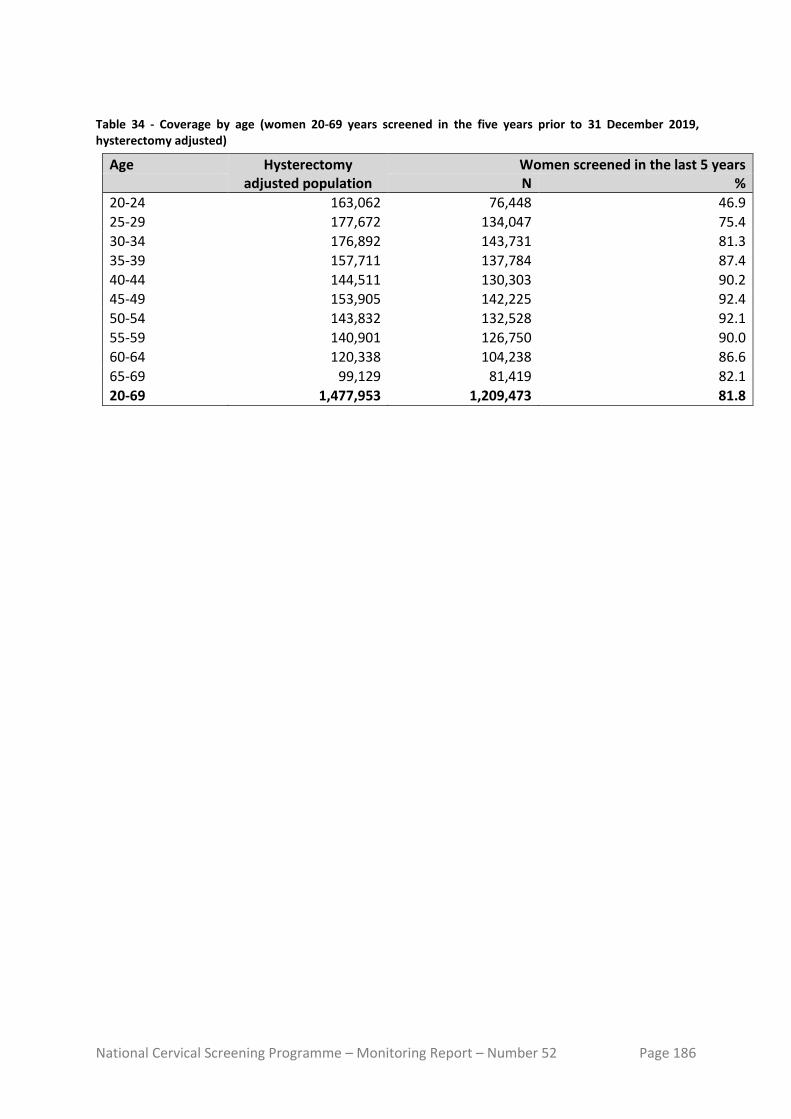
National Cervical Screening Programme – Monitoring Report – Number 52 Page 186
Table 34 - Coverage by age (women 20-69 years screened in the five years prior to 31 December 2019, hysterectomy adjusted)
Age Hysterectomy adjusted population
Women screened in the last 5 years N %
20-24 163,062 76,448 46.9
25-29 177,672 134,047 75.4
30-34 176,892 143,731 81.3
35-39 157,711 137,784 87.4
40-44 144,511 130,303 90.2
45-49 153,905 142,225 92.4
50-54 143,832 132,528 92.1
55-59 140,901 126,750 90.0
60-64 120,338 104,238 86.6
65-69 99,129 81,419 82.1
20-69 1,477,953 1,209,473 81.8
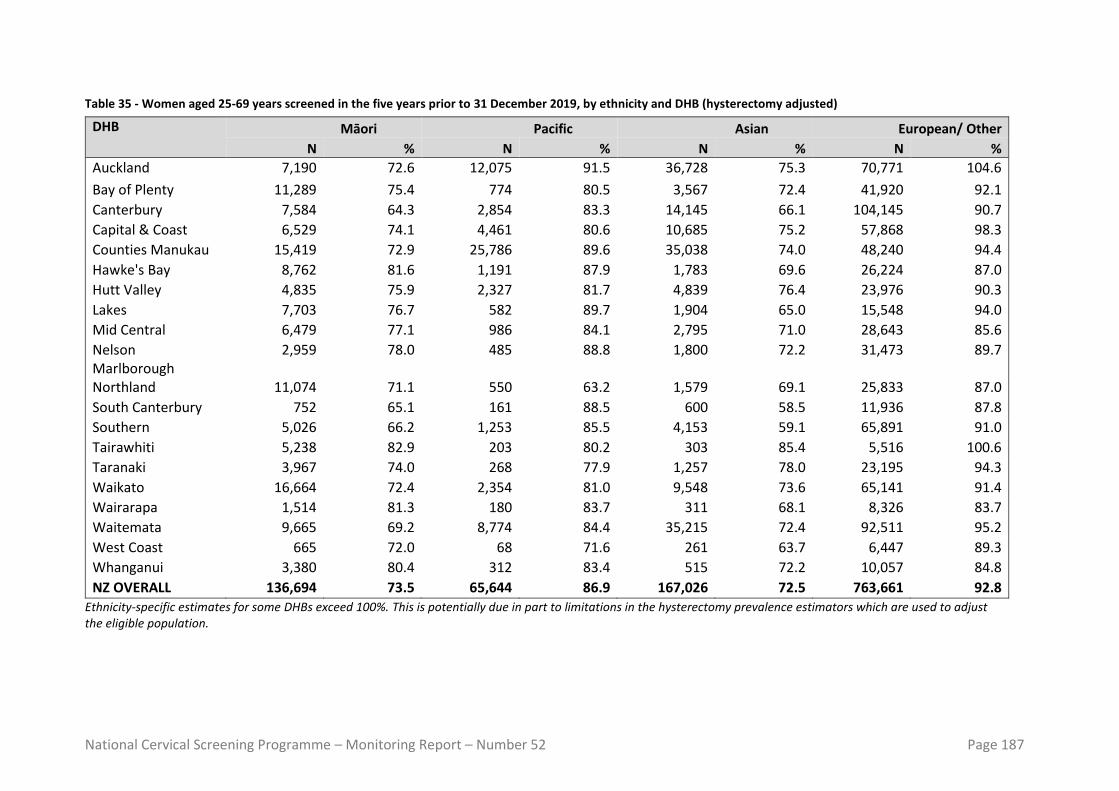
National Cervical Screening Programme – Monitoring Report – Number 52 Page 187
Table 35 - Women aged 25-69 years screened in the five years prior to 31 December 2019, by ethnicity and DHB (hysterectomy adjusted)
DHB Māori Pacific Asian European/ Other
N % N % N % N %
Auckland 7,190 72.6 12,075 91.5 36,728 75.3 70,771 104.6
Bay of Plenty 11,289 75.4 774 80.5 3,567 72.4 41,920 92.1
Canterbury 7,584 64.3 2,854 83.3 14,145 66.1 104,145 90.7
Capital & Coast 6,529 74.1 4,461 80.6 10,685 75.2 57,868 98.3
Counties Manukau 15,419 72.9 25,786 89.6 35,038 74.0 48,240 94.4
Hawke's Bay 8,762 81.6 1,191 87.9 1,783 69.6 26,224 87.0
Hutt Valley 4,835 75.9 2,327 81.7 4,839 76.4 23,976 90.3
Lakes 7,703 76.7 582 89.7 1,904 65.0 15,548 94.0
Mid Central 6,479 77.1 986 84.1 2,795 71.0 28,643 85.6
Nelson Marlborough
2,959 78.0 485 88.8 1,800 72.2 31,473 89.7
Northland 11,074 71.1 550 63.2 1,579 69.1 25,833 87.0
South Canterbury 752 65.1 161 88.5 600 58.5 11,936 87.8
Southern 5,026 66.2 1,253 85.5 4,153 59.1 65,891 91.0
Tairawhiti 5,238 82.9 203 80.2 303 85.4 5,516 100.6
Taranaki 3,967 74.0 268 77.9 1,257 78.0 23,195 94.3
Waikato 16,664 72.4 2,354 81.0 9,548 73.6 65,141 91.4
Wairarapa 1,514 81.3 180 83.7 311 68.1 8,326 83.7
Waitemata 9,665 69.2 8,774 84.4 35,215 72.4 92,511 95.2
West Coast 665 72.0 68 71.6 261 63.7 6,447 89.3
Whanganui 3,380 80.4 312 83.4 515 72.2 10,057 84.8
NZ OVERALL 136,694 73.5 65,644 86.9 167,026 72.5 763,661 92.8
Ethnicity-specific estimates for some DHBs exceed 100%. This is potentially due in part to limitations in the hysterectomy prevalence estimators which are used to adjust the eligible population.

National Cervical Screening Programme – Monitoring Report – Number 52 Page 188
Table 36 - Women under 20 years of age, and aged 15-19 years, screened in the three years prior to 31 December 2019, by DHB.
DHB Number of women screened in last 3 years % of population aged 15-19 years screened aged 10-20 years aged 15-19 years
Auckland 389 388 2.6
Bay of Plenty 189 189 2.7
Canterbury 771 770 4.5
Capital & Coast 326 325 2.9
Counties Manukau
299 298 1.5
Hawke's Bay 154 154 2.9
Hutt Valley 101 100 2.1
Lakes 78 77 2.2
Mid Central 123 123 2.1
Nelson Marlborough
120 118 2.8
Northland 68 67 1.3
South Canterbury 52 52 3.4
Southern 439 439 3.6
Tairawhiti 27 27 1.7
Taranaki 95 95 2.8
Waikato 309 308 2.3
Wairarapa 35 35 2.7
Waitemata 540 538 2.9 West Coast 25 25 3.2
Whanganui 39 38 1.9
Unspecified - - -
Total 4,179 4,166 2.7

National Cervical Screening Programme – Monitoring Report – Number 52 Page 189
Table 37 - Women screened under 20 years of age, as a proportion of all women screened in the three years to 31 December 2019, by DHB
DHB Number of women screened in last 3 years Proportion of women screened who were aged < 20 years (%) aged < 20 years all ages
Auckland 389 114,924 0.3
Bay of Plenty 189 54,270 0.3
Canterbury 771 122,187 0.6
Capital & Coast 326 75,530 0.4 Counties Manukau
299 109,381 0.3
Hawke's Bay 154 34,807 0.4
Hutt Valley 101 33,146 0.3
Lakes 78 23,961 0.3
Mid Central 123 36,869 0.3
Nelson Marlborough
120 34,506 0.3
Northland 68 35,249 0.2
South Canterbury 52 12,572 0.4 Southern 439 73,436 0.6
Tairawhiti 27 10,357 0.3
Taranaki 95 27,110 0.4
Waikato 309 89,142 0.3
Wairarapa 35 9,555 0.4
Waitemata 540 134,055 0.4 West Coast 25 6,828 0.4
Whanganui 39 13,255 0.3
Unspecified - -
Total 4,179 1,051,140 0.4

National Cervical Screening Programme – Monitoring Report – Number 52 Page 190
Table 38 - Women screened under 20 years of age, and women aged 18-19 years when they were screened, in the three years to 31 December 2019, by DHB
DHB Number of women screened in last 3 years aged 10-19 years aged 18-19 years % aged 18-19 years
Auckland 389 354 91.0
Bay of Plenty 189 169 89.4
Canterbury 771 667 86.5
Capital & Coast 326 314 96.3
Counties Manukau
299 264 88.3
Hawke's Bay 154 130 84.4
Hutt Valley 101 90 89.1
Lakes 78 72 92.3
Mid Central 123 116 94.3
Nelson Marlborough
120 104 86.7
Northland 68 57 83.8
South Canterbury 52 42 80.8
Southern 439 398 90.7
Tairawhiti 27 23 85.2
Taranaki 95 88 92.6
Waikato 309 280 90.6
Wairarapa 35 31 88.6
Waitemata 540 473 87.6 West Coast 25 18 72.0
Whanganui 39 34 87.2
Unspecified - - -
Total 4,179 3,724 89.1

National Cervical Screening Programme – Monitoring Report – Number 52 Page 191
Table 39 - Women (25-69 years) screened in the three years to 31 December 2019, as a percentage of the i) hysterectomy-adjustment NZ female population and ii) total NZ female population, by DHB
DHB Women screened in the last 3 years
(hysterectomy-adjusted) (no hysterectomy
adjustment)
Auckland 75.4 69.8
Bay of Plenty 74.4 67.3
Canterbury 72.2 65.9
Capital & Coast 76.6 70.4
Counties Manukau 67.5 62.2
Hawke's Bay 70.3 63.5
Hutt Valley 72.2 66.1
Lakes 72.5 66.0
Mid Central 70.4 63.8
Nelson Marlborough 75.2 67.6
Northland 66.5 59.8
South Canterbury 71.1 64.1
Southern 73.1 66.5
Tairawhiti 75.7 68.6
Taranaki 77.0 69.9
Waikato 72.5 66.0
Wairarapa 69.1 62.0
Waitemata 71.9 66.0
West Coast 72.7 65.4
Whanganui 70.2 63.2
Total 72.3 66.0

National Cervical Screening Programme – Monitoring Report – Number 52 Page 192
Table 40 - Trends in three-year coverage by DHB (women screened in the previous three years, as a percentage of the hysterectomy-adjusted female population)
DHB To 30 Jun 2018 To 31 Dec 2018 To 30 Jun 2019 To 31 Dec 2019
Auckland 67.6% 66.8% 65.5% 75.4% Bay of Plenty 78.4% 78.6% 78.3% 74.4% Canterbury 72.4% 72.7% 72.4% 72.2% Capital & Coast 75.6% 75.7% 75.1% 76.6% Counties Manukau 68.0% 67.4% 65.5% 67.5% Hawke's Bay 73.0% 73.1% 72.9% 70.3% Hutt Valley 73.4% 73.7% 73.2% 72.2% Lakes 76.1% 76.1% 75.7% 72.5% Mid Central 71.8% 72.1% 72.3% 70.4% Nelson Marlborough 77.7% 77.8% 77.5% 75.2% Northland 69.4% 69.8% 69.3% 66.5% South Canterbury 75.1% 74.0% 73.2% 71.1% Southern 75.3% 76.0% 75.4% 73.1% Tairawhiti 73.7% 74.1% 75.3% 75.7% Taranaki 78.8% 78.9% 78.1% 77.0% Waikato 73.3% 73.9% 73.4% 72.5% Wairarapa 71.1% 71.1% 71.1% 69.1% Waitemata 70.0% 70.0% 69.3% 71.9% West Coast 72.2% 72.0% 71.3% 72.7% Whanganui 72.5% 72.2% 71.7% 70.2% Total 72.1% 72.1% 71.4% 72.3%
Note: Coverage calculated using population projection at the date shown based on 2013 Census data. Updated population and hysterectomy 2013 Census population projection was used to calculate coverage for 31 December 2019..
Table 41 - Trends in three-year coverage by age (women screened in the previous three years, as a percentage of the hysterectomy-adjusted female population)
Age To 30 Jun 2018 To 31 Dec 2018 To 30 Jun 2019 To 31 Dec 2019
20-24 45.9% 45.1% 44.5% 43.8% 25-29 58.9% 58.4% 57.6% 61.7% 30-34 67.6% 67.1% 66.1% 67.3% 35-39 74.1% 74.2% 73.4% 73.0% 40-44 77.2% 77.1% 76.6% 75.8% 45-49 78.3% 78.5% 78.0% 77.8% 50-54 77.9% 78.1% 77.4% 77.7% 55-59 76.2% 76.4% 75.8% 76.5% 60-64 73.6% 74.0% 73.4% 74.0% 65-69 68.9% 69.4% 68.9% 69.8% Total 69.0% 69.0% 68.3% 69.2%
Note: Coverage calculated using population projection at the date shown based on 2013 Census data. Updated population and hysterectomy 2013 Census population projection was used to calculate coverage for 31 December 2019. Original population projection estimates were used to calculate coverage for 30 June 2017 and prior.

National Cervical Screening Programme – Monitoring Report – Number 52 Page 193
Table 42 - Trends in three-year coverage by ethnicity (women screened in the previous three years, as a percentage of the hysterectomy-adjusted female population)
Ethnicity To 30 Jun 2018 To 31 Dec 2018 To 30 Jun 2019 To 31 Dec 2019
Māori 61.8% 62.1% 61.6% 58.7% Pacific 68.6% 67.3% 65.1% 65.7% Asian 59.1% 59.9% 59.8% 61.7% European/ Other 78.0% 77.9% 77.2% 78.9% Total 72.1% 72.1% 71.4% 72.3%
Note: Coverage calculated using population projection at the date shown based on 2013 Census data. Updated population and hysterectomy 2013 Census population projection was used to calculate coverage for 31 December 2019.

National Cervical Screening Programme – Monitoring Report – Number 52 Page 194
Indicator 1.2 – Regularity of screening Table 43 - Routine (3-yearly) repeat screening interval (number of cytology tests), by ethnicity, 2015-2019
Māori women Pacific women Asian women European/ Other women
Quarter Early On-time Late Early On-time Late Early On-time Late Early On-time Late
Jan-Mar 2015 992 2,889 1,838 311 1,336 822 1,073 3,337 1,207 7,537 26,231 9,116
Apr-Jun 2015 1,000 3,291 2,076 311 1,541 988 1,147 3,869 1,454 7,710 28,461 9,852
Jul-Sep 2015 892 3,606 2,077 309 1,508 850 1,046 3,806 1,141 7,018 29,211 9,037
Oct-Dec 2015 864 3,343 1,944 323 1,509 916 939 3,619 1,150 6,760 27,721 9,109
Jan-Mar 2016 963 3,096 1,930 314 1,395 996 1,036 3,593 1,217 7,133 26,488 9,077
Apr-Jun 2016 900 3,359 2,174 311 1,557 1,070 1,030 4,073 1,383 7,009 28,308 9,561
Jul-Sep 2016 801 3,392 2,042 273 1,518 846 979 4,374 1,245 6,300 29,207 9,212
Oct-Dec 2016 672 2,855 1,758 230 1,312 724 779 3,492 1,147 5,682 25,657 8,468
Jan-Mar 2017 831 3,019 1,917 294 1,372 868 929 3,788 1,336 6,523 26,729 9,657
Apr-Jun 2017 785 3,306 2,027 277 1,483 913 953 4,164 1,466 6,111 27,850 9,824
Jul-Sep 2017 745 3,404 2,084 252 1,465 923 922 4,537 1,505 5,674 28,492 9,721
Oct-Dec 2017 608 3,107 2,050 241 1,324 815 735 3,990 1,376 5,123 27,153 9,475
Jan-Mar 2018 810 3,557 2,303 269 1,385 958 891 4,028 1,541 6,177 28,364 10,978
Apr-Jun 2018 834 3,798 2,338 271 1,504 1,080 919 4,668 1,697 5,828 30,238 10,807
Jul-Sep 2018 743 4,094 2,587 285 1,631 993 895 4,885 1,872 5,374 30,649 10,547
Oct-Dec 2018 597 3,521 2,063 210 1,435 891 823 4,288 1,622 4,952 28,394 9,659
Jan-Mar 2019 773 3,511 2,351 220 1,480 1,033 896 4,359 1,863 5,343 27,537 10,562
Apr-Jun 2019 677 3,609 2,204 268 1,492 1,010 894 4,594 1,861 5,479 28,906 10,619
Jul-Sep 2019 663 3,860 2,356 255 1,511 1,147 830 5,226 1,961 5,222 30,440 11,154
Oct-Dec 2019 570 3,220 2,186 199 1,405 992 805 4,447 1,686 4,719 27,469 10,180

National Cervical Screening Programme – Monitoring Report – Number 52 Page 195
Table 44 - Routine (3-yearly) repeat screening interval (number of cytology tests), by age, 2015-2019
20-29 30-39 40-49 50-59 60-69
Quarter Early On-time Late Early On-time Late Early On-time Late Early On-time Late Early On-time Late
Jan-Mar 2015 1,833 3,051 1,381 2,289 6,347 3,591 2,571 9,023 3,698 2,151 8,958 2,829 1,069 6,414 1,484
Apr-Jun 2015 1,709 3,158 1,415 2,379 6,778 3,846 2,717 10,003 4,131 2,239 9,983 3,151 1,124 7,240 1,827
Jul-Sep 2015 1,516 3,248 1,346 2,133 6,944 3,620 2,497 10,223 3,733 2,062 10,476 2,911 1,057 7,240 1,495
Oct-Dec 2015 1,446 3,230 1,368 1,934 6,366 3,521 2,417 9,678 3,724 2,054 9,711 2,979 1,035 7,207 1,527
Jan-Mar 2016 1,801 3,236 1,413 2,296 6,803 3,701 2,393 9,049 3,733 1,957 8,994 2,822 999 6,490 1,551
Apr-Jun 2016 1,571 3,324 1,454 2,196 6,803 3,768 2,466 9,684 4,015 2,027 9,964 3,220 990 7,522 1,731
Jul-Sep 2016 1,393 3,268 1,349 1,911 7,005 3,601 2,166 10,104 3,829 1,904 10,473 2,935 979 7,641 1,631
Oct-Dec 2016 1,202 2,845 1,221 1,616 5,954 3,211 1,959 8,548 3,307 1,704 9,071 2,757 882 6,898 1,601
Jan-Mar 2017 1,553 3,263 1,448 1,970 6,587 3,689 2,226 9,014 3,829 1,910 9,254 3,014 918 6,790 1,798
Apr-Jun 2017 1,381 3,320 1,445 1,853 6,820 3,696 2,171 9,434 3,951 1,790 9,921 3,243 931 7,308 1,895
Jul-Sep 2017 1,183 3,362 1,464 1,856 6,957 3,751 1,984 9,782 3,849 1,686 10,326 3,301 884 7,471 1,868
Oct-Dec 2017 1,056 3,122 1,375 1,433 6,333 3,652 1,811 8,954 3,775 1,583 9,630 3,128 824 7,535 1,786
Jan-Mar 2018 1,401 3,585 1,577 1,910 7,281 4,271 2,108 9,496 4,222 1,834 9,806 3,538 894 7,166 2,172
Apr-Jun 2018 1,272 3,666 1,558 1,803 7,527 4,040 2,107 10,198 4,338 1,784 10,688 3,679 886 8,129 2,307
Jul-Sep 2018 1,140 3,658 1,520 1,727 7,617 4,120 1,942 10,500 4,291 1,674 11,219 3,824 814 8,265 2,244
Oct-Dec 2018 990 3,319 1,401 1,476 6,889 3,541 1,728 9,333 3,840 1,577 10,235 3,430 811 7,862 2,023
Jan-Mar 2019 1,206 3,737 1,570 1,847 7,427 4,280 1,849 9,163 4,090 1,593 9,423 3,652 737 7,137 2,217
Apr-Jun 2019 1,139 3,609 1,519 1,758 7,334 4,050 1,910 9,537 4,066 1,613 10,224 3,680 898 7,897 2,379
Jul-Sep 2019 1,054 3,612 1,631 1,574 7,999 4,322 1,848 10,207 4,407 1,688 10,923 3,959 806 8,296 2,299
Oct-Dec 2019 1,009 3,102 1,424 1,479 6,816 3,872 1,601 8,878 3,978 1,455 9,928 3,492 749 7,817 2,278

National Cervical Screening Programme – Monitoring Report – Number 52 Page 196
Table 45 - 12 month repeat screening interval (number of cytology tests), by ethnicity, 2015-2019
Māori women Pacific women Asian women European/ Other women
Quarter Early On-time Late Early On-time Late Early On-time Late Early On-time Late
Jan-Mar 2015 128 1,284 2,759 37 490 1,173 119 1,377 1,960 763 8,383 10,498
Apr-Jun 2015 114 1,400 2,706 43 528 1,291 113 1,538 2,118 692 8,527 10,248
Jul-Sep 2015 108 1,473 2,722 34 555 1,115 72 1,530 1,922 577 8,839 9,773
Oct-Dec 2015 109 1,355 2,713 28 580 1,308 77 1,455 1,870 562 8,408 9,466
Jan-Mar 2016 133 1,314 2,707 38 550 1,309 92 1,463 1,872 655 7,884 9,853
Apr-Jun 2016 125 1,445 2,646 41 607 1,255 100 1,540 1,963 613 8,388 9,372
Jul-Sep 2016 77 1,337 2,533 27 586 1,124 60 1,693 2,019 502 8,147 9,285
Oct-Dec 2016 70 1,197 2,318 26 481 952 53 1,407 1,744 444 7,336 8,368
Jan-Mar 2017 91 1,226 2,250 34 521 994 82 1,465 1,983 512 7,290 9,201
Apr-Jun 2017 79 1,202 2,427 28 489 1,066 77 1,581 2,063 460 7,236 8,708
Jul-Sep 2017 57 1,188 2,565 18 493 1,121 68 1,656 2,211 372 7,179 8,858
Oct-Dec 2017 62 1,022 2,485 17 373 981 60 1,430 1,984 348 6,409 8,512
Jan-Mar 2018 66 1,046 2,666 32 397 1,073 77 1,351 2,094 429 6,274 9,599
Apr-Jun 2018 68 1,100 2,597 22 413 1,083 64 1,530 2,096 427 6,304 9,172
Jul-Sep 2018 62 1,171 2,743 23 449 1,097 60 1,762 2,290 349 6,589 8,721
Oct-Dec 2018 52 1,073 2,331 19 387 985 62 1,546 2,037 325 6,171 7,979
Jan-Mar 2019 69 1,001 2,305 30 337 997 71 1,405 2,116 423 6,024 8,361
Apr-Jun 2019 79 1,042 2,182 24 374 960 52 1,642 2,045 376 6,248 8,029
Jul-Sep 2019 65 1,181 2,483 24 381 1,029 57 1,874 2,302 358 6,791 8,687
Oct-Dec 2019 40 1,042 2,069 10 363 934 61 1,671 2,102 289 5,877 7,695

National Cervical Screening Programme – Monitoring Report – Number 52 Page 197
Table 46 - 12 month repeat screening interval (number of cytology tests), by age, 2015-2019
20-29 30-39 40-49 50-59 60-69
Quarter Early On-time Late Early On-time Late Early On-time Late Early On-time Late Early On-time Late
Jan-Mar 2015 457 4,096 5,098 238 2,329 4,198 153 2,189 3,628 129 1,786 2,320 70 1,134 1,146
Apr-Jun 2015 398 4,103 4,830 220 2,488 4,135 170 2,351 3,654 106 1,876 2,506 68 1,175 1,238
Jul-Sep 2015 326 4,278 4,872 169 2,551 3,928 128 2,377 3,396 107 2,011 2,295 61 1,180 1,041
Oct-Dec 2015 341 4,134 4,728 160 2,301 4,019 120 2,267 3,219 101 1,915 2,278 54 1,181 1,113
Jan-Mar 2016 407 4,062 5,075 205 2,317 4,100 144 2,100 3,255 100 1,664 2,225 62 1,068 1,086
Apr-Jun 2016 384 4,184 4,644 182 2,480 4,012 153 2,313 3,183 105 1,793 2,232 55 1,210 1,165
Jul-Sep 2016 257 4,139 4,579 178 2,454 3,994 116 2,234 3,233 76 1,785 2,119 39 1,151 1,036
Oct-Dec 2016 223 3,690 4,091 149 2,178 3,493 105 1,919 2,830 69 1,597 1,969 47 1,037 999
Jan-Mar 2017 301 3,981 4,545 166 2,301 3,697 124 1,865 3,032 85 1,433 2,046 43 922 1,108
Apr-Jun 2017 266 3,897 4,457 157 2,283 3,776 114 1,797 2,792 69 1,507 2,112 38 1,024 1,127
Jul-Sep 2017 208 3,912 4,667 131 2,305 3,919 89 1,894 3,015 56 1,453 2,078 31 952 1,076
Oct-Dec 2017 195 3,539 4,505 117 1,956 3,584 89 1,566 2,737 47 1,334 2,023 39 839 1,113
Jan-Mar 2018 271 3,556 4,999 140 2,019 4,204 105 1,513 3,088 54 1,204 2,018 34 776 1,123
Apr-Jun 2018 238 3,576 4,587 136 2,138 4,124 96 1,539 2,986 68 1,254 2,003 43 840 1,248
Jul-Sep 2018 204 3,899 4,515 113 2,248 4,075 93 1,624 2,988 54 1,280 2,118 30 920 1,155
Oct-Dec 2018 172 3,599 4,082 104 2,015 3,715 90 1,540 2,630 52 1,208 1,847 40 815 1,058
Jan-Mar 2019 256 3,546 4,485 131 2,042 3,808 99 1,383 2,599 71 1,067 1,880 36 729 1,007
Apr-Jun 2019 206 3,654 4,277 136 2,191 3,555 86 1,534 2,557 67 1,145 1,809 36 782 1,018
Jul-Sep 2019 194 3,968 4,591 121 2,453 4,074 92 1,627 2,787 59 1,280 1,975 38 899 1,074
Oct-Dec 2019 145 3,389 3,816 104 2,110 3,618 50 1,461 2,431 76 1,196 1,883 25 797 1,052

National Cervical Screening Programme – Monitoring Report – Number 52 Page 198
Table 47 - Timeliness of re-attendance in 2015 and 2019 following a routine (3-year) repeat screening recommendation, by ethnicity
Ethnicity 2019 2015
Early On-time Late Early On-time Late
Māori 10.3% 54.7% 35.0% 15.1% 52.9% 32.0% Pacific 8.6% 53.5% 38.0% 11.7% 55.0% 33.3% Asian 11.6% 63.3% 25.1% 17.7% 61.5% 20.8% European/ Other 11.7% 64.4% 23.9% 16.3% 62.8% 20.9%
Table 48 - Timeliness of re-attendance in 2015 and 2019 following a routine (3-year) repeat screening recommendation, by age
Age group 2019 2015
Early On-time Late Early On-time Late
20-29 17.9% 57.1% 25.0% 26.3% 51.4% 22.3% 30-39 12.6% 56.1% 31.3% 17.6% 53.1% 29.3% 40-49 11.7% 61.4% 26.9% 15.8% 60.4% 23.7% 50-59 10.3% 65.7% 24.0% 14.3% 65.8% 19.9% 60-69 7.3% 71.6% 21.1% 11.1% 72.6% 16.4%

National Cervical Screening Programme – Monitoring Report – Number 52 Page 199
Indicator 2 – First screening events Table 49 - Age distribution of first screening events for period 1 July - 31 December 2019
Age Women with first events
% of first events (ages 20-69 yrs) which occurred in that age
group
20-24 7,004 33.2 25-29 4,689 22.2
30-34 3,793 18.0
35-39 2,209 10.5
40-44 1,220 5.8 45-49 781 3.7
50-54 468 2.2
55-59 345 1.6
60-64 320 1.5
65-69 262 1.2
20-69 yrs 21,091 100.0 Percentage = number of first screens in age group divided by total number of first screens x 100. Table 50 - Women (ages 20-69 years) with first screening events as a proportion of total number of women with screening events 31 December 2019
Percentage = number of first screens in age group divided by all women with a screening event within that age group (first or subsequent events) x 100.
Age Women with first events
As a proportion of women with a screening event
N %
20-24 7,004 18,506 37.8 25-29 4,689 23,978 19.6
30-34 3,793 25,553 14.8
35-39 2,209 23,544 9.4 40-44 1,220 21,880 5.6 45-49 781 23,405 3.3
50-54 468 21,564 2.2
55-59 345 20,693 1.7 60-64 320 16,712 1.9 65-69 262 12,555 2.1 20-69 yrs 21,091 208,390 10.1

National Cervical Screening Programme – Monitoring Report – Number 52 Page 200
Figure 133 - Proportion of population* in that age group with their first screening event during the monitoring period (women aged 20-69 years at 31 December 2019)
*Hysterectomy adjusted, 2013 Census data projected to 31 December 2019.

National Cervical Screening Programme – Monitoring Report – Number 52 Page 201
Table 51 - Women (aged 20-69 years) with first screening events as a proportion of i) total number of women with screening events, and ii) eligible women, by DHB, for period 1 July - 31 December 2019.
DHB Women with first events
As a proportion of women with a screening
event
As a proportion of eligible population
N N % N %
Auckland 3,255 23,464 13.9 161,281 2.0
Bay of Plenty 798 10,676 7.5 72,274 1.1 Canterbury 2,445 24,568 10.0 170,235 1.4
Capital & Coast 1,689 14,704 11.5 101,683 1.7
Counties Manukau 2,583 21,433 12.1 168,661 1.5
Hawke's Bay 514 6,695 7.7 49,237 1.0 Hutt Valley 627 6,555 9.6 46,573 1.3
Lakes 398 4,543 8.8 33,290 1.2
Mid Central 529 7,155 7.4 53,260 1.0
Nelson Marlborough 472 6,757 7.0 45,232 1.0
Northland 465 6,595 7.1 52,742 0.9
South Canterbury 184 2,528 7.3 17,339 1.1
Southern 1,511 14,544 10.4 101,445 1.5
Tairawhiti 153 1,977 7.7 13,760 1.1 Taranaki 282 5,444 5.2 34,909 0.8 Waikato 1,672 17,529 9.5 123,952 1.3
Wairarapa 122 1,836 6.6 13,544 0.9
Waitemata 3,135 27,195 11.5 190,435 1.6 West Coast 57 1,394 4.1 9,322 0.6 Whanganui 200 2,798 7.1 18,779 1.1
Total 21,091 208,390 10.1 1,477,953 1.4 Note: Proportions shown are women with first screening event within a DHB, divided by i) all women with a screening event within that DHB (first or subsequent events) and ii) the hysterectomy-adjusted 2013 Census population projected to 31 December 2019 for that DHB, as a percent. Total women screened and women with first events exclude those for whom DHB could not be ascertained. Table 52 - Women (ages 20-69 years) with first screening events as a proportion of i) total number of women with screening events, and ii) eligible women, by ethnicity, for period 1 July - 31 December 2019
Ethnicity Women with first events
As a proportion of women with a screening eventi
As a proportion of eligible populationii
N % N %
Māori 1,948 24,002 8.1 220,112 0.9 Pacific 1,375 10,463 13.1 91,188 1.5
Asian 7,123 32,182 22.1 260,943 2.7
European/ Other 10,645 141,743 7.5 905,710 1.2
Total 21,091 208,390 10.1 1,477,953 1.4 Note: Proportions shown are women with first screening event in an ethnicity group, divided by i) all women with a screening event within that ethnicity group (first or subsequent events) and ii) the hysterectomy-adjusted 2013 Census population projected to 31 December 2019 for that ethnicity group, as a percent.

National Cervical Screening Programme – Monitoring Report – Number 52 Page 202
Table 53 – 25th and 75th Percentile, median and mean age of women with a first screening event, by ethnicity, for period 1 July - 31 December 2019
Ethnic Group 25th Percentile 75th Percentile Median Age Mean Age
Māori 21 26 22 25.3
Pacific 22 36 27 30.8
Asian 27 38 32 34.0
European/ Other 21 34 26 29.4
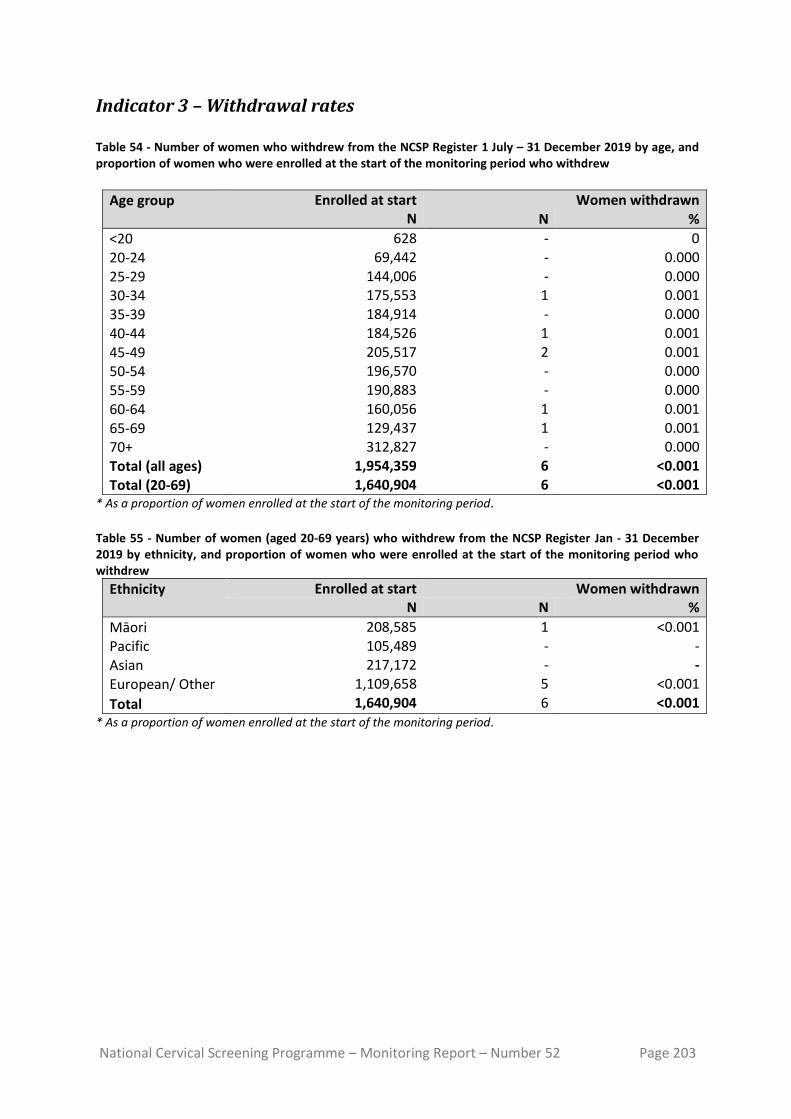
National Cervical Screening Programme – Monitoring Report – Number 52 Page 203
Indicator 3 – Withdrawal rates Table 54 - Number of women who withdrew from the NCSP Register 1 July – 31 December 2019 by age, and proportion of women who were enrolled at the start of the monitoring period who withdrew
Age group
Enrolled at start Women withdrawn N N %
<20 628 - 0
20-24 69,442 - 0.000
25-29 144,006 - 0.000
30-34 175,553 1 0.001
35-39 184,914 - 0.000
40-44 184,526 1 0.001
45-49 205,517 2 0.001
50-54 196,570 - 0.000
55-59 190,883 - 0.000
60-64 160,056 1 0.001
65-69 129,437 1 0.001 70+ 312,827 - 0.000
Total (all ages) 1,954,359 6 <0.001
Total (20-69) 1,640,904 6 <0.001 * As a proportion of women enrolled at the start of the monitoring period.
Table 55 - Number of women (aged 20-69 years) who withdrew from the NCSP Register Jan - 31 December 2019 by ethnicity, and proportion of women who were enrolled at the start of the monitoring period who withdrew
Ethnicity
Enrolled at start Women withdrawn N N %
Māori 208,585 1 <0.001 Pacific 105,489 - - Asian 217,172 - -
European/ Other 1,109,658 5 <0.001
Total 1,640,904 6 <0.001 * As a proportion of women enrolled at the start of the monitoring period.

National Cervical Screening Programme – Monitoring Report – Number 52 Page 204
Indicator 4 – Early re-screening Table 56 - Early re-screening by five-year age group
Age group
Women recommended to return in 3 years
Women with >1 subsequent test N %
20-24 1,179 173 14.7
25-29 4,350 534 12.3 30-34 4,979 585 11.7
35-39 5,443 616 11.3
40-44 5,638 584 10.4
45-49 6,495 720 11.1 50-54 5,917 648 11.0
55-59 5,725 535 9.3
60-64 4,723 351 7.4
65-69 3,544 280 7.9
All ages 47,993 5,026 10.5
Table 57 - Early re-screening by DHB
DHB
Women recommended to return in 3 years
Women with >1 subsequent test N %
Auckland 5,329 680 12.8
Bay of Plenty 2,469 295 11.9
Canterbury 5,717 662 11.6 Capital & Coast 3,559 306 8.6 Counties Manukau
4,843 482 10.0
Hawke's Bay 1,561 149 9.5
Hutt Valley 1,587 119 7.5
Lakes 1,059 93 8.8 Mid Central 1,612 118 7.3 Nelson Marlborough
1,564 126 8.1
Northland 1,516 130 8.6 South Canterbury
587 68 11.6
Southern 3,262 311 9.5
Tairawhiti 432 33 7.6
Taranaki 1,202 89 7.4 Waikato 4,048 301 7.4
Wairarapa 491 69 14.1
Waitemata 6,286 908 14.4 West Coast 324 39 12.0
Whanganui 545 48 8.8
Unspecified - - -
Total 47,993 5,026 10.5

National Cervical Screening Programme – Monitoring Report – Number 52 Page 205
Table 58 - Early re-screening by ethnicity
Ethnicity
Women recommended to return in 3 years
Women with >1 subsequent test N %
Māori 5,000 509 10.2
Pacific 2,364 191 8.1 Asian 6,100 584 9.6
European/ Other 34,529 3,742 10.8
Total 47,993 5,026 10.5

National Cervical Screening Programme – Monitoring Report – Number 52 Page 206
Indicator 5 – Laboratory indicators
Indicator 5.1 – Laboratory cytology reporting
Table 59 - Age-standardised percentage of satisfactory cytology samples reported as HSIL, by laboratory
Laboratory % satisfactory cytology samples reported as HSIL
Age-standardised rate* (20-69 years)
Crude rate
Anatomical Pathology Services 0.47% 0.48% Canterbury Health Laboratories 0.76% 0.75% LabPLUS 2.09% 2.16% Medlab Central Ltd. 0.91% 0.87% Pathlab 0.44% 0.43% Southern Community Laboratories 0.76% 0.75% Total 0.73% 0.72%
* Age-standardised to the NZ 2013 Census population (females, ages 20-69 years).

National Cervical Screening Programme – Monitoring Report – Number 52 Page 207
Indicator 5.2 – Accuracy of cytology predicting HSIL
Table 60 - Positive predictive value of a report of HSIL + SC cytology by laboratory
Laboratory Histology available HSIL confirmed by histology
No histology Total reports
N % N % N % N
Canterbury Health Laboratories 36 94.7 29 80.6 2 5.3 38
Anatomical Pathology Services 210 92.9 163 77.6 16 7.1 226
LabPLUS 24 96.0 22 91.7 1 4.0 25
Medlab Central Ltd 98 91.6 86 87.8 9 8.4 107
Pathlab 96 97.0 77 80.2 3 3.0 99
Southern Community Labs Dunedin 555 90.7 438 78.9 57 9.3 612
Total 1,019 92.1 815 80.0 88 7.9 1,107 Target: 65% - 85%.
Table 61 - Positive predictive value of a report of ASC-H cytology by laboratory
Laboratory Histology available HSIL confirmed by histology
No histology Total reports
N % N % N % N
Canterbury Health Laboratories 43 87.8 20 46.5 6 12.2 49 Anatomical Pathology Services 114 82.0 47 41.2 25 18.0 139 LabPLUS 61 81.3 22 36.1 14 18.7 75 Medlab Central Ltd 76 87.4 53 69.7 11 12.6 87 Pathlab 91 91.0 59 64.8 9 9.0 100 Southern Community Labs Dunedin 178 76.1 82 46.1 56 23.9 234 Total 563 82.3 283 50.3 121 17.7 684

National Cervical Screening Programme – Monitoring Report – Number 52 Page 208
Table 62 - Positive predictive value of a report of ASC-H + HSIL + SC cytology by laboratory
Laboratory Histology available HSIL confirmed by histology
No histology Total reports
N % N % N % N
Canterbury Health Laboratories 79 90.8 49 62.0 8 9.2 87 Anatomical Pathology Services 324 88.8 210 64.8 41 11.2 365 LabPLUS 85 85.0 44 51.8 15 15.0 100 Medlab Central Ltd 174 89.7 139 79.9 20 10.3 194 Pathlab 187 94.0 136 72.7 12 6.0 199 Southern Community Labs Dunedin 733 86.6 520 70.9 113 13.4 846 Total 1,582 88.3 1,098 69.4 209 11.7 1,791

National Cervical Screening Programme – Monitoring Report – Number 52 Page 209
Indicator 5.4 – Histology Reporting
Figure 134 - Trends in histologically-confirmed HSIL as a percentage of all women with histology (To 1 July 2011 – 31 December 2019).
Table 63 - Rate of women with CIN 2/3 per 1,000 women screened, by age and ethnicity and for NZ overall, National Cervical Screening Programme Monitoring Report Number 52
Age Ethnicity
Māori Pacific Asian European/ Other NZ overall
<20 19.2 0.0 0.0 7.3 8.6
20-24 21.3 6.9 8.9 16.8 16.4
25-29 20.4 10.4 6.3 20.2 17.2
30-34 25.4 11.1 10.3 20.5 18.3
35-39 12.2 14.4 7.8 13.0 11.8
40-44 15.0 4.8 10.0 7.9 8.9
45-49 5.9 4.3 6.8 6.1 6.1
50-54 4.7 1.8 2.7 3.1 3.2
55-59 3.8 3.4 5.2 3.6 3.8
60-64 1.3 3.0 5.2 2.4 2.6
65-69 3.2 2.0 3.1 2.1 2.3
70+ 0.0 0.0 6.0 6.2 5.7
ASR (20-69 years)^ 13.4 7.1 7.2 11.4 10.6
^Age Standardised to the WHO population (ages 20-69 years)12.

National Cervical Screening Programme – Monitoring Report – Number 52 Page 210
Table 64 - Rate of women, per 1,000 women screened, with CIN 2/3 histology, by age and ethnicity, July-Dec 2007 to Jul-Dec 2019
Age
Period
Jul-Dec
2007
Jan-Jun
2008
Jul-Dec
2008
Jan-Jun
2009
Jul-Dec
2009
Jan-Jun
2010
Jul-Dec
2010
Jan-Jun
2011
Jul-Dec
2011
Jan-Jun
2012
Jul-Dec
2012
Jan-Jun
2013
Jul-Dec
2013
Jan-Jun
2014
Jul-Dec
2014
Jan-Jun
2015
Jul-Dec
2015
Jan-Jun
2016
Jul-Dec
2016
Jan-Jun
2017
Jul-Dec
2017
Jan-Jun
2018
Jul-Dec
2018
Jan-Jun
2019
Jul-Dec
2019
Māo
ri
<20 15.2 14.6 18.4 20.9 22.9 8.5 18.9 13.7 23.8 22.8 16.1 4.6 0.0 0.0 13.6 6.8 7.8 7.4 0.0 20.2 0.0 10.3 0.0 0.0 19.2 20-24 29.1 28.1 25.7 29.9 32.1 24.3 28.1 23.8 32.0 32.2 28.8 27.1 30.1 25.5 24.3 20.2 21.4 21.8 20.8 20.7 18.0 15.4 12.7 12.5 21.3 25-29 32.4 25.8 31.2 32.6 31.3 28.5 27.7 30.9 34.3 33.5 42.9 37.9 39.0 38.3 40.3 31.8 32.5 27.5 35.0 26.0 28.5 21.2 23.7 16.7 20.4 30-34 18.1 26.7 26.6 20.5 18.2 24.2 30.4 25.9 21.7 27.4 34.3 30.0 29.6 29.5 25.7 31.2 31.3 23.4 31.3 27.8 28.1 23.3 23.6 21.5 25.4 35-39 12.7 11.8 13.8 16.4 16.3 19.7 17.5 15.3 17.1 16.5 13.7 18.8 21.0 16.8 17.1 16.9 22.3 18.1 19.7 21.0 19.9 12.2 13.7 13.1 12.2 40-44 9.7 9.6 10.4 9.7 9.2 10.7 9.9 12.1 11.1 11.0 9.9 10.3 12.8 10.5 13.2 12.6 11.2 15.3 15.5 14.5 9.6 8.7 12.9 11.0 15.0 45-49 10.6 6.5 6.5 11.5 9.8 5.0 8.1 6.4 6.6 6.3 5.9 9.4 7.3 7.5 9.0 9.0 10.6 5.4 8.3 5.9 7.2 7.3 6.3 9.2 5.9 50-54 3.4 4.2 7.6 6.5 2.4 3.9 5.0 4.5 2.2 7.5 8.8 5.9 3.9 5.0 7.6 7.9 4.2 4.9 7.7 4.0 4.8 4.1 4.5 12.0 4.7 55-59 6.0 6.6 5.1 3.3 5.2 0.7 4.1 2.0 8.4 5.8 4.9 3.7 1.8 3.5 2.9 3.2 3.0 4.7 3.8 3.8 3.9 6.0 4.1 4.1 3.8 60-64 2.6 2.3 5.8 4.9 2.2 4.6 2.8 2.0 4.0 3.9 2.7 3.7 2.7 5.2 10.1 8.5 4.6 6.0 3.8 2.4 3.7 2.7 6.5 3.4 1.3 65-69 2.0 2.1 6.0 1.9 3.8 5.6 1.7 1.7 3.4 0.0 6.5 6.4 1.6 1.4 1.4 2.5 5.0 3.7 11.0 1.2 0.0 1.1 2.2 3.3 3.2 70+ 7.3 7.5 8.6 0.0 0.0 0.0 0.0 0.0 7.9 7.5 7.4 8.5 17.5 13.3 0.0 0.0 7.8 8.9 0.0 0.0 7.8 14.4 17.1 13.2 0.0
Pac
ific
<20 7.2 4.2 10.8 11.9 7.4 7.5 0.0 0.0 0.0 10.2 0.0 0.0 25.0 20.4 0.0 0.0 0.0 0.0 0.0 50.0 0.0 0.0 0.0 0.0 0.0 20-24 11.2 11.0 11.0 11.1 12.2 14.2 16.1 12.2 11.9 15.1 18.1 14.0 13.4 8.2 9.1 9.5 14.4 8.3 10.1 7.7 6.4 9.3 9.6 9.1 6.9 25-29 6.9 7.9 11.0 6.2 7.4 8.8 16.9 15.1 14.3 14.9 15.1 12.5 13.2 15.6 24.4 18.8 13.5 13.7 16.4 16.8 16.0 12.4 10.4 12.5 10.4 30-34 2.3 7.4 10.5 9.3 10.7 11.9 10.4 10.7 6.3 18.9 18.6 11.1 13.0 13.6 17.4 16.0 13.8 13.7 18.2 16.1 14.7 14.8 12.2 15.6 11.1 35-39 9.0 10.5 4.8 8.9 7.3 7.2 9.5 6.4 7.4 8.8 13.6 13.4 11.7 10.0 12.4 8.8 8.5 6.6 11.4 7.0 11.6 10.6 10.0 7.6 14.4 40-44 6.3 5.6 8.1 5.3 3.0 4.2 4.8 5.3 8.3 7.4 10.3 6.5 7.4 7.0 10.0 5.3 3.5 8.4 12.1 8.4 5.5 3.2 8.9 9.4 4.8 45-49 7.9 3.4 7.5 7.8 4.1 3.3 4.7 4.2 4.8 7.3 8.1 5.6 3.7 4.6 5.5 4.3 5.1 5.8 6.8 3.3 4.3 5.0 4.4 1.7 4.3 50-54 0.0 6.1 4.4 1.3 2.4 1.1 6.0 3.2 2.0 5.7 7.1 8.0 2.7 3.9 1.8 5.2 5.1 5.0 2.7 2.5 5.9 3.7 1.7 6.5 1.8 55-59 1.8 1.5 2.8 1.6 4.3 1.4 2.7 1.4 1.5 2.7 2.8 6.5 6.4 5.3 3.3 2.1 1.2 1.1 3.5 4.7 5.5 6.7 2.3 2.2 3.4 60-64 0.0 4.7 2.4 2.3 4.1 2.1 5.6 8.2 3.8 5.2 3.6 1.7 1.6 0.0 3.3 1.5 1.5 2.9 2.9 3.2 4.5 6.2 3.1 3.0 3.0 65-69 0.0 0.0 3.6 0.0 0.0 0.0 0.0 3.2 3.1 2.8 0.0 2.6 5.1 2.4 2.5 2.3 0.0 2.2 7.0 7.0 4.7 2.2 0.0 0.0 2.0 70+ 0.0 0.0 0.0 15.9 15.6 15.6 13.2 0.0 0.0 0.0 0.0 0.0 17.2 0.0 0.0 15.4 0.0 0.0 12.5 15.2 14.1 14.9 12.7 12.7 0.0
Asi
an
<20 0.0 10.5 0.0 13.7 19.2 0.0 20.4 0.0 0.0 0.0 0.0 0.0 0.0 0.0 0.0 0.0 0.0 0.0 0.0 0.0 0.0 0.0 0.0 0.0 0.0 20-24 8.9 7.7 7.8 4.9 8.8 5.7 6.1 7.2 6.6 9.0 13.5 10.7 10.3 7.8 12.0 5.9 10.6 12.2 11.9 9.8 5.3 7.4 5.8 6.8 8.9 25-29 10.2 8.0 8.4 9.0 6.3 6.0 6.8 8.9 10.7 7.5 12.8 9.8 8.4 8.4 11.4 7.3 14.0 12.0 11.1 4.7 7.7 5.7 7.1 6.6 6.3 30-34 10.0 7.1 6.9 6.5 6.6 9.0 7.8 9.5 14.5 9.4 11.5 9.7 10.0 9.4 7.4 9.4 10.9 12.3 11.2 8.8 9.9 7.9 9.4 11.1 10.3 35-39 9.0 8.4 8.0 8.7 6.7 7.5 10.5 9.4 10.9 7.7 12.5 7.8 10.4 10.3 8.3 8.6 6.6 7.7 9.4 7.2 6.7 9.5 8.6 7.9 7.8 40-44 8.2 2.2 7.4 5.3 4.1 8.1 8.8 5.4 5.8 8.7 11.4 9.3 9.5 4.9 9.8 5.2 7.8 9.3 8.5 5.7 4.5 7.2 5.3 3.4 10.0 45-49 7.5 6.7 5.0 4.3 4.8 3.4 6.2 4.4 5.6 2.2 9.9 6.0 4.3 6.5 6.4 4.4 6.3 5.2 4.7 4.3 4.6 4.9 4.6 6.4 6.8 50-54 2.6 1.7 3.3 1.1 3.6 3.2 2.5 3.5 2.4 3.8 5.0 3.5 5.8 3.0 3.6 4.2 6.3 4.7 5.6 4.4 4.5 4.0 2.9 3.6 2.7 55-59 3.0 2.8 0.0 3.5 2.4 4.0 1.5 6.4 6.3 3.8 4.2 2.3 3.2 2.8 3.8 3.3 1.0 2.0 4.2 1.9 3.2 4.2 2.2 5.6 5.2 60-64 1.8 0.0 8.8 4.4 1.2 1.2 2.2 5.5 4.1 5.2 2.8 4.3 3.0 3.1 4.2 2.6 1.3 5.7 2.8 4.1 3.8 2.2 2.0 2.2 5.2 65-69 0.0 0.0 5.1 0.0 2.3 2.2 8.3 0.0 3.8 3.9 0.0 1.6 0.0 3.0 1.3 0.0 3.7 3.1 6.3 6.0 1.9 4.8 2.6 4.2 3.1 70+ 0.0 17.2 12.5 0.0 10.4 0.0 0.0 0.0 0.0 0.0 10.8 9.5 28.6 0.0 0.0 9.3 8.4 0.0 0.0 0.0 0.0 7.4 0.0 0.0 6.0
Euro
pe
an/
Oth
er <20 23.1 13.9 23.4 18.7 22.9 7.3 11.6 11.8 19.8 18.9 16.5 20.9 16.8 12.0 7.0 8.8 25.0 6.8 10.4 16.8 18.1 4.7 15.2 8.4 7.3
20-24 28.9 23.5 27.5 28.1 26.1 24.8 25.7 28.4 27.2 31.2 28.6 26.8 24.2 23.2 22.1 20.2 21.2 20.0 20.5 18.3 17.4 14.7 15.4 15.3 16.8 25-29 27.2 23.3 27.2 27.5 25.6 25.1 27.1 27.2 30.1 29.2 30.2 31.2 32.9 29.9 29.9 28.0 31.0 30.4 28.4 24.1 23.6 21.8 21.2 21.5 20.2 30-34 17.1 14.5 16.1 16.5 18.0 16.5 20.4 19.8 17.7 18.1 22.6 22.5 21.1 21.3 21.4 19.4 22.2 21.7 22.1 19.7 18.6 19.9 18.4 19.0 20.5

National Cervical Screening Programme – Monitoring Report – Number 52 Page 211
Age
Period
Jul-Dec
2007
Jan-Jun
2008
Jul-Dec
2008
Jan-Jun
2009
Jul-Dec
2009
Jan-Jun
2010
Jul-Dec
2010
Jan-Jun
2011
Jul-Dec
2011
Jan-Jun
2012
Jul-Dec
2012
Jan-Jun
2013
Jul-Dec
2013
Jan-Jun
2014
Jul-Dec
2014
Jan-Jun
2015
Jul-Dec
2015
Jan-Jun
2016
Jul-Dec
2016
Jan-Jun
2017
Jul-Dec
2017
Jan-Jun
2018
Jul-Dec
2018
Jan-Jun
2019
Jul-Dec
2019 35-39 10.8 8.6 10.4 10.5 9.8 10.0 11.9 11.0 12.2 11.8 14.3 10.5 12.8 12.9 13.3 11.5 12.2 13.2 13.3 11.3 14.6 10.9 11.7 13.2 13.0 40-44 6.5 6.0 6.4 5.8 5.9 6.5 7.3 7.5 7.0 7.9 8.5 9.3 8.6 8.2 8.8 7.3 7.3 8.4 7.5 7.1 7.3 7.4 8.9 7.5 7.9 45-49 4.2 4.0 5.0 3.7 3.8 4.5 4.6 3.4 4.5 4.6 5.5 5.2 5.9 5.2 6.0 4.5 5.0 5.7 5.9 4.1 4.2 5.1 5.1 5.1 6.1 50-54 2.2 2.8 2.6 2.5 2.4 2.7 3.2 2.2 2.8 2.8 2.8 3.6 3.2 3.1 3.6 2.4 3.1 3.5 4.3 3.2 3.5 2.9 3.1 2.9 3.1 55-59 1.7 1.7 1.9 1.2 1.2 1.9 1.9 1.7 1.9 2.1 1.9 1.9 1.7 2.1 2.6 1.9 2.8 3.2 2.8 2.7 2.3 2.4 3.0 3.3 3.6 60-64 1.8 1.6 2.0 2.2 1.7 0.7 1.5 1.2 1.7 1.7 2.2 2.0 1.4 1.7 2.6 2.6 2.4 1.4 2.4 2.6 2.7 2.1 2.0 2.5 2.4 65-69 2.3 1.7 1.4 1.8 1.3 0.9 2.2 1.6 1.1 1.2 1.5 1.6 1.7 1.8 1.7 2.0 1.8 1.8 2.4 2.7 2.3 2.4 2.1 1.8 2.1 70+ 4.6 3.0 2.1 4.9 2.4 2.6 5.0 3.8 2.0 3.0 1.7 7.9 5.1 1.8 3.6 1.9 4.5 7.6 2.6 4.3 5.9 6.2 4.8 2.8 6.2
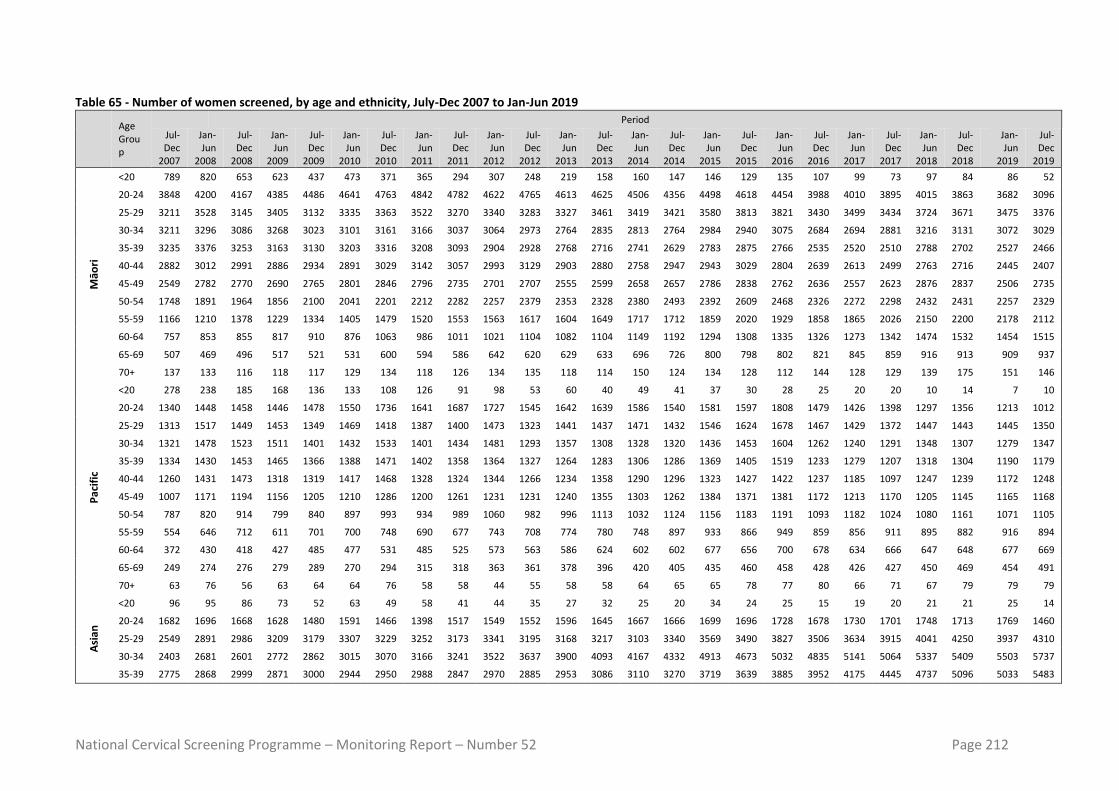
National Cervical Screening Programme – Monitoring Report – Number 52 Page 212
Table 65 - Number of women screened, by age and ethnicity, July-Dec 2007 to Jan-Jun 2019
Age Group
Period
Jul-Dec
2007
Jan-Jun
2008
Jul-Dec
2008
Jan-Jun
2009
Jul-Dec
2009
Jan-Jun
2010
Jul-Dec
2010
Jan-Jun
2011
Jul-Dec
2011
Jan-Jun
2012
Jul-Dec
2012
Jan-Jun
2013
Jul-Dec
2013
Jan-Jun
2014
Jul-Dec
2014
Jan-Jun
2015
Jul-Dec
2015
Jan-Jun
2016
Jul-Dec
2016
Jan-Jun
2017
Jul-Dec
2017
Jan-Jun
2018
Jul-Dec
2018
Jan-Jun
2019
Jul-Dec
2019
Māo
ri
<20 789 820 653 623 437 473 371 365 294 307 248 219 158 160 147 146 129 135 107 99 73 97 84 86 52
20-24 3848 4200 4167 4385 4486 4641 4763 4842 4782 4622 4765 4613 4625 4506 4356 4498 4618 4454 3988 4010 3895 4015 3863 3682 3096
25-29 3211 3528 3145 3405 3132 3335 3363 3522 3270 3340 3283 3327 3461 3419 3421 3580 3813 3821 3430 3499 3434 3724 3671 3475 3376
30-34 3211 3296 3086 3268 3023 3101 3161 3166 3037 3064 2973 2764 2835 2813 2764 2984 2940 3075 2684 2694 2881 3216 3131 3072 3029
35-39 3235 3376 3253 3163 3130 3203 3316 3208 3093 2904 2928 2768 2716 2741 2629 2783 2875 2766 2535 2520 2510 2788 2702 2527 2466
40-44 2882 3012 2991 2886 2934 2891 3029 3142 3057 2993 3129 2903 2880 2758 2947 2943 3029 2804 2639 2613 2499 2763 2716 2445 2407
45-49 2549 2782 2770 2690 2765 2801 2846 2796 2735 2701 2707 2555 2599 2658 2657 2786 2838 2762 2636 2557 2623 2876 2837 2506 2735
50-54 1748 1891 1964 1856 2100 2041 2201 2212 2282 2257 2379 2353 2328 2380 2493 2392 2609 2468 2326 2272 2298 2432 2431 2257 2329
55-59 1166 1210 1378 1229 1334 1405 1479 1520 1553 1563 1617 1604 1649 1717 1712 1859 2020 1929 1858 1865 2026 2150 2200 2178 2112
60-64 757 853 855 817 910 876 1063 986 1011 1021 1104 1082 1104 1149 1192 1294 1308 1335 1326 1273 1342 1474 1532 1454 1515
65-69 507 469 496 517 521 531 600 594 586 642 620 629 633 696 726 800 798 802 821 845 859 916 913 909 937
70+ 137 133 116 118 117 129 134 118 126 134 135 118 114 150 124 134 128 112 144 128 129 139 175 151 146
Pac
ific
<20 278 238 185 168 136 133 108 126 91 98 53 60 40 49 41 37 30 28 25 20 20 10 14 7 10
20-24 1340 1448 1458 1446 1478 1550 1736 1641 1687 1727 1545 1642 1639 1586 1540 1581 1597 1808 1479 1426 1398 1297 1356 1213 1012
25-29 1313 1517 1449 1453 1349 1469 1418 1387 1400 1473 1323 1441 1437 1471 1432 1546 1624 1678 1467 1429 1372 1447 1443 1445 1350
30-34 1321 1478 1523 1511 1401 1432 1533 1401 1434 1481 1293 1357 1308 1328 1320 1436 1453 1604 1262 1240 1291 1348 1307 1279 1347
35-39 1334 1430 1453 1465 1366 1388 1471 1402 1358 1364 1327 1264 1283 1306 1286 1369 1405 1519 1233 1279 1207 1318 1304 1190 1179
40-44 1260 1431 1473 1318 1319 1417 1468 1328 1324 1344 1266 1234 1358 1290 1296 1323 1427 1422 1237 1185 1097 1247 1239 1172 1248
45-49 1007 1171 1194 1156 1205 1210 1286 1200 1261 1231 1231 1240 1355 1303 1262 1384 1371 1381 1172 1213 1170 1205 1145 1165 1168
50-54 787 820 914 799 840 897 993 934 989 1060 982 996 1113 1032 1124 1156 1183 1191 1093 1182 1024 1080 1161 1071 1105
55-59 554 646 712 611 701 700 748 690 677 743 708 774 780 748 897 933 866 949 859 856 911 895 882 916 894
60-64 372 430 418 427 485 477 531 485 525 573 563 586 624 602 602 677 656 700 678 634 666 647 648 677 669
65-69 249 274 276 279 289 270 294 315 318 363 361 378 396 420 405 435 460 458 428 426 427 450 469 454 491
70+ 63 76 56 63 64 64 76 58 58 44 55 58 58 64 65 65 78 77 80 66 71 67 79 79 79
Asi
an
<20 96 95 86 73 52 63 49 58 41 44 35 27 32 25 20 34 24 25 15 19 20 21 21 25 14
20-24 1682 1696 1668 1628 1480 1591 1466 1398 1517 1549 1552 1596 1645 1667 1666 1699 1696 1728 1678 1730 1701 1748 1713 1769 1460
25-29 2549 2891 2986 3209 3179 3307 3229 3252 3173 3341 3195 3168 3217 3103 3340 3569 3490 3827 3506 3634 3915 4041 4250 3937 4310
30-34 2403 2681 2601 2772 2862 3015 3070 3166 3241 3522 3637 3900 4093 4167 4332 4913 4673 5032 4835 5141 5064 5337 5409 5503 5737
35-39 2775 2868 2999 2871 3000 2944 2950 2988 2847 2970 2885 2953 3086 3110 3270 3719 3639 3885 3952 4175 4445 4737 5096 5033 5483

National Cervical Screening Programme – Monitoring Report – Number 52 Page 213
Age Group
Period
Jul-Dec
2007
Jan-Jun
2008
Jul-Dec
2008
Jan-Jun
2009
Jul-Dec
2009
Jan-Jun
2010
Jul-Dec
2010
Jan-Jun
2011
Jul-Dec
2011
Jan-Jun
2012
Jul-Dec
2012
Jan-Jun
2013
Jul-Dec
2013
Jan-Jun
2014
Jul-Dec
2014
Jan-Jun
2015
Jul-Dec
2015
Jan-Jun
2016
Jul-Dec
2016
Jan-Jun
2017
Jul-Dec
2017
Jan-Jun
2018
Jul-Dec
2018
Jan-Jun
2019
Jul-Dec
2019
40-44 2673 2750 2840 2819 2901 2839 2967 2957 2930 3004 2906 3018 3050 3066 3073 3260 3073 3321 3188 3181 3298 3322 3594 3579 3815
45-49 2265 2390 2583 2583 2693 2625 2735 2708 2675 2715 2735 2679 2821 2778 2798 2967 2850 2890 3003 3038 3076 3075 3290 3126 3224
50-54 1542 1716 1811 1743 1937 1859 1972 1977 2092 2101 2206 2258 2403 2326 2507 2595 2538 2543 2481 2480 2458 2515 2780 2535 2602
55-59 1000 1080 1131 1128 1270 1265 1355 1416 1577 1575 1672 1712 1885 1787 2082 2112 2020 2017 2130 2055 2181 2140 2223 2302 2315
60-64 558 582 685 684 802 851 909 911 971 962 1065 1164 1313 1274 1434 1545 1561 1577 1766 1712 1844 1790 1970 1819 1939
65-69 326 373 395 394 435 454 480 498 526 516 568 638 713 659 768 886 820 971 955 1000 1039 1033 1158 1180 1297
70+ 75 58 80 86 96 93 103 87 100 99 93 105 105 111 113 108 119 93 127 132 134 135 165 139 167
Eur/
Oth
er
<20 2298 2583 1970 1981 1443 1507 1210 1267 1058 1006 850 812 653 664 573 565 519 584 384 475 386 422 328 359 274
20-24 1735
1 1861
0 1772
5 1859
1 1775
9 1844
1 1871
3 1879
2 1907
9 1874
4 1860
5 1851
7 1848
4 1799
4 1780
2 1828
3 1771
3 1801
4 1628
3 1661
5 1578
0 1627
5 1535
7 15430
12938
25-29 1515
5 1659
5 1514
8 1654
3 1460
6 1576
1 1492
1 1514
7 1496
1 1521
7 1467
6 1512
0 1493
5 1515
0 1497
2 1590
5 1562
1 1622
0 1480
9 1570
5 1485
8 1631
4 1469
9 15838
14942
30-34 1747
3 1868
1 1681
1 1778
8 1569
2 1685
7 1575
6 1569
3 1540
5 1565
8 1496
4 1526
4 1473
5 1466
0 1440
7 1515
0 1451
9 1514
7 1417
5 1467
6 1421
0 1602
1 1480
2 15627
15440
35-39 2106
5 2253
4 2063
3 2165
1 1972
2 2010
3 1941
0 1870
7 1797
8 1795
6 1680
3 1658
1 1566
9 1558
5 1480
7 1545
8 1491
8 1521
9 1421
6 1438
2 1372
3 1490
6 1396
7 14590
14416
40-44 2077
7 2146
4 2048
5 2062
4 1995
4 2032
1 2038
0 1983
6 2026
4 1990
9 1948
7 1878
6 1890
0 1819
0 1791
0 1846
3 1737
2 1669
3 1585
0 1557
6 1456
3 1570
0 1468
4 14444
14410
45-49 2017
3 2085
0 2074
1 2021
1 2060
3 1992
7 2020
7 1910
4 1940
7 1863
3 1876
4 1775
9 1795
2 1706
9 1759
4 1763
1 1780
3 1735
0 1680
3 1675
6 1677
5 1747
8 1694
6 16268
16278
50-54 1614
0 1661
5 1661
4 1649
0 1706
1 1678
9 1755
5 1692
1 1782
1 1749
0 1767
5 1711
0 1772
4 1667
5 1731
4 1730
4 1730
6 1616
9 1586
5 1542
2 1551
5 1586
3 1578
0 14888
15528
55-59 1315
7 1338
7 1349
9 1307
9 1391
1 1356
0 1391
6 1340
8 1408
4 1398
3 1421
6 1356
6 1438
4 1388
5 1443
6 1445
6 1509
5 1441
6 1449
5 1465
0 1473
9 1534
0 1550
9 14519
15372
60-64 1005
7 1041
8 1082
2 1065
5 1143
5 1140
9 1164
0 1123
3 1194
4 1132
6 1158
6 1107
1 1167
9 1107
1 1187
1 1172
1 1197
2 1168
0 1154
2 1157
3 1185
6 1224
1 1264
7 11948
12589
65-69 7031 7091 7325 7192 7595 7633 7643 7393 7932 8174 8621 8578 9072 8928 9571 9741 9762 9562 9449 9298 9506 1004
9 9888 9597 9830
70+ 2396 2351 2402 2250 2486 2337 2382 2355 2462 2357 2327 2158 2341 2192 2248 2162 2200 2229 2351 2352 2382 2586 2477 2479 2599

National Cervical Screening Programme – Monitoring Report – Number 52 Page 214
Indicator 5.5 – Laboratory turnaround time
Table 66 - Timeliness of cytology reporting by laboratory, 31 December 2019
Laboratory Laboratory turnaround time - cytology
Within 7 days 8-15 days Total within 15 days More than 15 days Total
N % N % N % N % N
Canterbury Health Laboratories 8,975 91.0 810 8.2 9,785 99.2 76 0.8 9,861 Anatomical Pathology Services 40,239 95.9 1,620 3.9 41,859 99.7 115 0.3 41,974 LabPLUS 7,881 92.9 498 5.9 8,379 98.8 103 1.2 8,482 Medlab Central Ltd 16,228 94.2 716 4.2 16,944 98.4 279 1.6 17,223 Pathlab 26,900 98.8 253 0.9 27,153 99.8 64 0.2 27,217 Southern Community Labs Dunedin 101,926 96.7 2,618 2.5 104,544 99.2 848 0.8 105,392 Total 202,149 96.2 6,515 3.1 208,664 99.3 1,485 0.7 210,149
Target: 90% within seven working days and 98% within 15 working days. Note: total samples reported on for this Indicator is different from that reported in Indicator 5.1. Here, ‘total samples’ refers to all cytology samples received by laboratories within the monitoring period. Indicator 5.1 shows the total number of cytology samples taken during the period.

National Cervical Screening Programme – Monitoring Report – Number 52 Page 215
Table 67 - Timeliness of histology reporting by laboratory, 31 December 2019
Laboratory Laboratory turnaround time - histology
Within 10 days 10-15 days Total within 15 days More than 15 days Total N % N % N % N % N
Canterbury Health Laboratories 1,222 87.4 148 10.6 1,370 98.0 28 2.0 1,398 Anatomical Pathology Services 1,367 89.9 132 8.7 1,499 98.6 21 1.4 1,520 LabPLUS 708 86.2 70 8.5 778 94.8 43 5.2 821 Medlab Central Ltd 993 96.1 7 0.7 1,000 96.8 33 3.2 1,033 Memorial Hospital Hastings Lab 65 84.4 5 6.5 70 90.9 7 9.1 77 Middlemore Hospital Laboratory 617 72.2 106 12.4 723 84.7 131 15.3 854 Nelson Hospital Laboratory 103 98.1 2 1.9 105 100.0 - 0.0 105 North Shore Hospital Laboratory 827 84.7 47 4.8 874 89.5 102 10.5 976 Northland DHB Laboratory 124 53.7 63 27.3 187 81.0 44 19.0 231 Pathlab 928 84.7 91 8.3 1,019 93.0 77 7.0 1,096 Southern Community Labs Dunedin 2,857 98.2 50 1.7 2,907 99.9 2 0.1 2,909 Southern Community Labs Wellington 1,003 96.5 32 3.1 1,035 99.6 4 0.4 1,039 Taranaki Medlab 371 100.0 - 0.0 371 100.0 - 0.0 371 Waikato Hospital Laboratory 181 82.6 11 5.0 192 87.7 27 12.3 219 Total 11,366 89.9 764 6.0 12,130 95.9 519 4.1 12,649
Target: 90% within ten working days and 98% within 15 working days of receipt of the sample. Note: total histology samples reported on for this Indicator is different from that reported in Indicator 5.4. Indicator 5.5 includes all histology samples received by laboratories within the monitoring period, while 5.4 includes all histology samples taken within the monitoring period.

National Cervical Screening Programme – Monitoring Report – Number 52 Page 216
Table 68 - Timeliness of reporting for cytology with associated HPV testing by laboratory, 31 December 2019
Laboratory Laboratory turnaround time - cytology with HPV testing
Within 15 days More than 15 days Total
N % N % N
Canterbury Health Laboratories 184 94.4 11 5.6 195
Anatomical Pathology Services 649 99.5 3 0.5 652
LabPLUS 245 98.0 5 2.0 250
Medlab Central Ltd 319 98.5 5 1.5 324
Pathlab 512 99.6 2 0.4 514
Southern Community Labs 1,050 99.5 5 0.5 1,055
Total 2,959 99.0 31 1.0 2,990
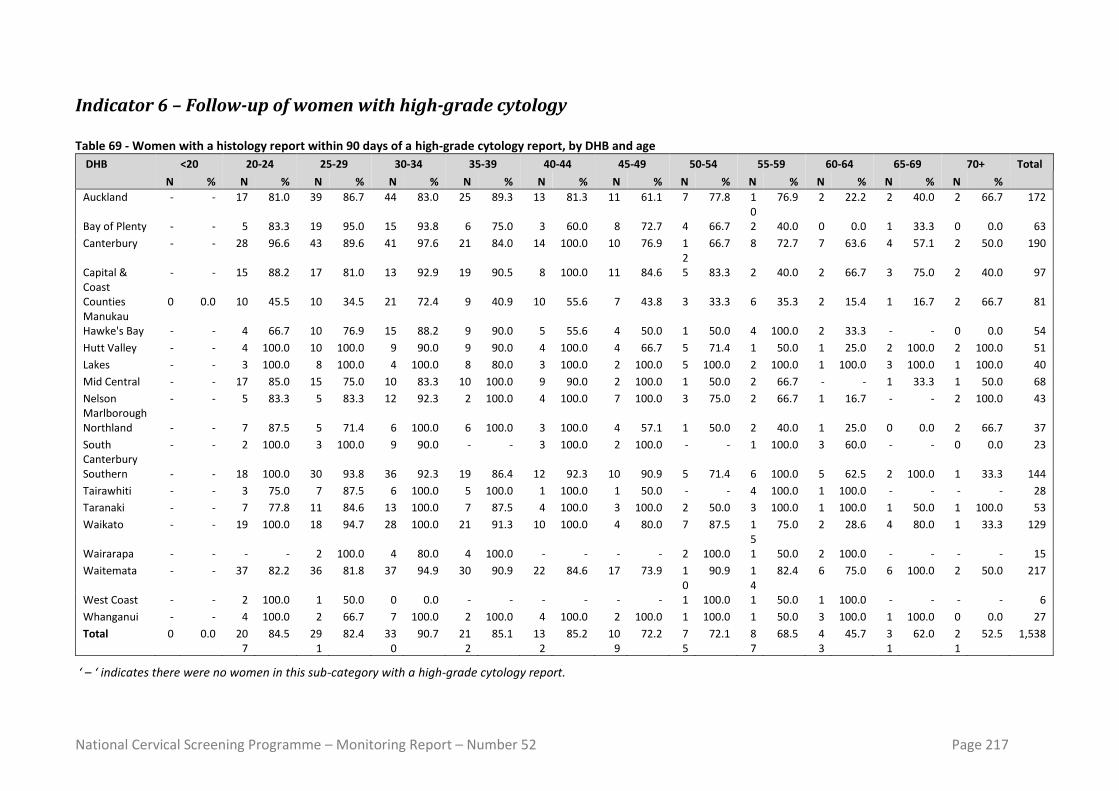
National Cervical Screening Programme – Monitoring Report – Number 52 Page 217
Indicator 6 – Follow-up of women with high-grade cytology Table 69 - Women with a histology report within 90 days of a high-grade cytology report, by DHB and age
DHB <20 20-24 25-29 30-34 35-39 40-44 45-49 50-54 55-59 60-64 65-69 70+ Total
N % N % N % N % N % N % N % N % N % N % N % N %
Auckland - - 17 81.0 39 86.7 44 83.0 25 89.3 13 81.3 11 61.1 7 77.8 10
76.9 2 22.2 2 40.0 2 66.7 172
Bay of Plenty - - 5 83.3 19 95.0 15 93.8 6 75.0 3 60.0 8 72.7 4 66.7 2 40.0 0 0.0 1 33.3 0 0.0 63
Canterbury - - 28 96.6 43 89.6 41 97.6 21 84.0 14 100.0 10 76.9 12
66.7 8 72.7 7 63.6 4 57.1 2 50.0 190
Capital & Coast
- - 15 88.2 17 81.0 13 92.9 19 90.5 8 100.0 11 84.6 5 83.3 2 40.0 2 66.7 3 75.0 2 40.0 97
Counties Manukau
0 0.0 10 45.5 10 34.5 21 72.4 9 40.9 10 55.6 7 43.8 3 33.3 6 35.3 2 15.4 1 16.7 2 66.7 81
Hawke's Bay - - 4 66.7 10 76.9 15 88.2 9 90.0 5 55.6 4 50.0 1 50.0 4 100.0 2 33.3 - - 0 0.0 54
Hutt Valley - - 4 100.0 10 100.0 9 90.0 9 90.0 4 100.0 4 66.7 5 71.4 1 50.0 1 25.0 2 100.0 2 100.0 51
Lakes - - 3 100.0 8 100.0 4 100.0 8 80.0 3 100.0 2 100.0 5 100.0 2 100.0 1 100.0 3 100.0 1 100.0 40
Mid Central - - 17 85.0 15 75.0 10 83.3 10 100.0 9 90.0 2 100.0 1 50.0 2 66.7 - - 1 33.3 1 50.0 68
Nelson Marlborough
- - 5 83.3 5 83.3 12 92.3 2 100.0 4 100.0 7 100.0 3 75.0 2 66.7 1 16.7 - - 2 100.0 43
Northland - - 7 87.5 5 71.4 6 100.0 6 100.0 3 100.0 4 57.1 1 50.0 2 40.0 1 25.0 0 0.0 2 66.7 37
South Canterbury
- - 2 100.0 3 100.0 9 90.0 - - 3 100.0 2 100.0 - - 1 100.0 3 60.0 - - 0 0.0 23
Southern - - 18 100.0 30 93.8 36 92.3 19 86.4 12 92.3 10 90.9 5 71.4 6 100.0 5 62.5 2 100.0 1 33.3 144
Tairawhiti - - 3 75.0 7 87.5 6 100.0 5 100.0 1 100.0 1 50.0 - - 4 100.0 1 100.0 - - - - 28
Taranaki - - 7 77.8 11 84.6 13 100.0 7 87.5 4 100.0 3 100.0 2 50.0 3 100.0 1 100.0 1 50.0 1 100.0 53
Waikato - - 19 100.0 18 94.7 28 100.0 21 91.3 10 100.0 4 80.0 7 87.5 15
75.0 2 28.6 4 80.0 1 33.3 129
Wairarapa - - - - 2 100.0 4 80.0 4 100.0 - - - - 2 100.0 1 50.0 2 100.0 - - - - 15
Waitemata - - 37 82.2 36 81.8 37 94.9 30 90.9 22 84.6 17 73.9 10
90.9 14
82.4 6 75.0 6 100.0 2 50.0 217
West Coast - - 2 100.0 1 50.0 0 0.0 - - - - - - 1 100.0 1 50.0 1 100.0 - - - - 6
Whanganui - - 4 100.0 2 66.7 7 100.0 2 100.0 4 100.0 2 100.0 1 100.0 1 50.0 3 100.0 1 100.0 0 0.0 27
Total 0 0.0 207
84.5 291
82.4 330
90.7 212
85.1 132
85.2 109
72.2 75
72.1 87
68.5 43
45.7 31
62.0 21
52.5 1,538
‘ – ‘ indicates there were no women in this sub-category with a high-grade cytology report.

National Cervical Screening Programme – Monitoring Report – Number 52 Page 218
Table 70 - Women with a histology report within 180 days of a high-grade cytology report, by DHB and age
DHB <20 20-24 25-29 30-34 35-39 40-44 45-49 50-54 55-59 60-64 65-69 70+ Total
N % N % N % N % N % N % N % N % N % N % N % N %
Auckland - - 18 85.7 40 88.9 46 86.8 26 92.9 14 87.5 13 72.2 8 88.9 10 76.9 4 44.4 2 40.0 2 66.7 183
Bay of Plenty - - 6 100.0 19 95.0 15 93.8 8 100.0 4 80.0 11 100.0 6 100.0 2 40.0 1 100.0 3 100.0 0 0.0 75
Canterbury - - 28 96.6 43 89.6 42 100.0 21 84.0 14 100.0 12 92.3 14 77.8 8 72.7 9 81.8 6 85.7 4 100.0 201
Capital & Coast
- - 15 88.2 18 85.7 13 92.9 19 90.5 8 100.0 12 92.3 5 83.3 2 40.0 3 100.0 3 75.0 2 40.0 100
Counties Manukau
0 0.0 20 90.9 21 72.4 27 93.1 19 86.4 16 88.9 10 62.5 5 55.6 12 70.6 9 69.2 2 33.3 2 66.7 143
Hawke's Bay - - 5 83.3 13 100.0 15 88.2 9 90.0 6 66.7 5 62.5 1 50.0 4 100.0 3 50.0 - - 0 0.0 61
Hutt Valley - - 4 100.0 10 100.0 10 100.0 9 90.0 4 100.0 5 83.3 5 71.4 1 50.0 1 25.0 2 100.0 2 100.0 53
Lakes - - 3 100.0 8 100.0 4 100.0 8 80.0 3 100.0 2 100.0 5 100.0 2 100.0 1 100.0 3 100.0 1 100.0 40
Mid Central - - 19 95.0 17 85.0 12 100.0 10 100.0 10 100.0 2 100.0 1 50.0 2 66.7 - - 2 66.7 2 100.0 77
Nelson Marlborough
- - 5 83.3 5 83.3 12 92.3 2 100.0 4 100.0 7 100.0 3 75.0 2 66.7 6 100.0 - - 2 100.0 48
Northland - - 8 100.0 6 85.7 6 100.0 6 100.0 3 100.0 5 71.4 1 50.0 4 80.0 2 50.0 0 0.0 2 66.7 43
South Canterbury
- - 2 100.0 3 100.0 10 100.0 - - 3 100.0 2 100.0 - - 1 100.0 4 80.0 - - 0 0.0 25
Southern - - 18 100.0 30 93.8 39 100.0 20 90.9 12 92.3 10 90.9 6 85.7 6 100.0 5 62.5 2 100.0 1 33.3 149
Tairawhiti - - 3 75.0 8 100.0 6 100.0 5 100.0 1 100.0 2 100.0 - - 4 100.0 1 100.0 - - - - 30
Taranaki - - 8 88.9 11 84.6 13 100.0 7 87.5 4 100.0 3 100.0 3 75.0 3 100.0 1 100.0 1 50.0 1 100.0 55
Waikato - - 19 100.0 19 100.0 28 100.0 22 95.7 10 100.0 4 80.0 8 100.0 15 75.0 3 42.9 4 80.0 1 33.3 133
Wairarapa - - - - 2 100.0 4 80.0 4 100.0 - - - - 2 100.0 1 50.0 2 100.0 - - - - 15
Waitemata - - 42 93.3 37 84.1 37 94.9 32 97.0 23 88.5 18 78.3 10 90.9 14 82.4 7 87.5 6 100.0 2 50.0 228
West Coast - - 2 100.0 1 50.0 1 100.0 - - - - - - 1 100.0 1 50.0 1 100.0 - - - - 7
Whanganui - - 4 100.0 2 66.7 7 100.0 2 100.0 4 100.0 2 100.0 1 100.0 2 100.0 3 100.0 1 100.0 1 100.0 29
Total 0 0.0 229 93.5 313 88.7 347 95.3 229 92.0 143 92.3 125 82.8 85 81.7 96 75.6 66 70.2 37 74.0 25 62.5 1,695
‘ – ‘ indicates there were no women in this sub-category with a high-grade cytology report.

National Cervical Screening Programme – Monitoring Report – Number 52 Page 219
Indicator 7 – Colposcopy indicators
Indicator 7.1 – Timeliness of colposcopic assessment – high-grade cytology
Table 71 - Women with high-grade cytology (including cytological suspicion of invasive disease), by DHB
DHB HG women HG women with referral recorded on the NCSP Register
N N
Auckland 155 136
Bay of Plenty 73 63
Canterbury 191 178
Capital & Coast 109 95
Counties Manukau 150 134
Hawke's Bay 71 64
Hutt Valley 46 41
Lakes 42 37
Mid Central 75 70
Nelson Marlborough 47 42
Northland 47 42
South Canterbury 26 24
Southern 146 136
Tairawhiti 31 30
Taranaki 56 52
Waikato 126 123
Wairarapa 14 11
Waitemata 196 184
West Coast 8 8
Whanganui 30 29
Private practice 294 188
Total 1,933 1,687
Table 72 - Women with a high-grade cytology report (no suspicion of invasive disease), accepted referral and a colposcopy visit within 20 and 40 working days, by ethnicity
Ethnicity HG women
Accepted referrals
recorded on NCSP Register
Women seen within 20 working days
Women seen within 40 working days
N N N % N %
Māori 255 241 150 62.2 191 79.3
Pacific 94 78 27 34.6 38 48.7
Asian 215 191 126 66.0 157 82.2
European/ Other 1,299 1,140 876 76.8 1,038 91.1
Total 1,863 1,650 1,179 71.5 1,424 86.3

National Cervical Screening Programme – Monitoring Report – Number 52 Page 220
Table 73 - Women with a high-grade cytology report (no suspicion of invasive disease), accepted referral and a colposcopy visit within 20 and 40 working days, by DHB
DHB HG women Accepted referrals recorded on NCSP Register
Women seen within 20 working
days
Women seen within 40 working
days
N N N % N %
Public clinics overall 1,576 1,466 1,057 72.1 1,282 87.4
Auckland 148 134 106 79.1 122 91.0
Bay of Plenty 69 61 52 85.2 58 95.1
Canterbury 185 173 141 81.5 163 94.2
Capital & Coast 105 95 77 81.1 92 96.8
Counties Manukau 143 131 6 4.6 25 19.1
Hawke's Bay 69 63 35 55.6 57 90.5
Hutt Valley 45 41 28 68.3 38 92.7
Lakes 36 33 28 84.8 31 93.9
Mid Central 73 69 36 52.2 61 88.4
Nelson Marlborough 47 42 30 71.4 39 92.9
Northland 44 40 32 80.0 40 100.0
South Canterbury 26 24 19 79.2 22 91.7
Southern 144 135 107 79.3 131 97.0
Tairawhiti 28 28 21 75.0 23 82.1
Taranaki 56 52 35 67.3 47 90.4
Waikato 119 117 107 91.5 112 95.7
Wairarapa 14 11 10 90.9 11 100.0
Waitemata 189 181 152 84.0 175 96.7
West Coast 8 8 7 87.5 7 87.5
Whanganui 28 28 28 100.0 28 100.0
Private Practice 287 184 122 66.3 142 77.2
Total 1,863 1,650 1,179 71.5 1,424 86.3
Table 74 - Women with cytological suspicion of invasive disease, by cytology result subcategory
Cytology result sub-category
Total women Accepted referrals recorded on NCSP Register*
N N
HS2 21 18
SC 15 10
AC1-AC5 24 3
R10, R14 10 6
Total 70 37
* Referral accepted date no later than four weeks prior to the end of the current monitoring period, in order to allow at least four weeks of follow-up time available.

National Cervical Screening Programme – Monitoring Report –Number 52 Page 221
Indicator 7.2 – Timeliness of colposcopic assessment – low-grade cytology
Table 75 - Follow-up of women with persistent low-grade cytology/ low-grade cytology and positive hrHPV test, by DHB
DHB LG women Women with subsequent referral recorded
Women with subsequent colposcopy visit recorded
Women with colposcopy subsequent to referral
recorded
Women with colposcopy subsequent to referral
recorded AND referral:colposcopy
interval <= 26 weeks N N %* N % * N % † N % †
Auckland 415 380 91.6 364 87.7 359 94.5 315 82.9
Bay of Plenty 225 201 89.3 210 93.3 192 95.5 133 66.2
Canterbury 270 256 94.8 255 94.4 249 97.3 247 96.5
Capital & Coast 147 138 93.9 133 90.5 133 96.4 104 75.4
Counties Manukau 350 334 95.4 307 87.7 301 90.1 287 85.9
Hawke's Bay 94 83 88.3 80 85.1 76 91.6 7 8.4
Hutt Valley 61 59 96.7 59 96.7 58 98.3 58 98.3
Lakes 81 75 92.6 74 91.4 69 92.0 46 61.3
Mid Central 169 164 97.0 159 94.1 156 95.1 51 31.1
Nelson Marlborough 72 68 94.4 66 91.7 66 97.1 57 83.8
Northland 86 83 96.5 79 91.9 77 92.8 65 78.3
South Canterbury 22 22 100.0 22 100.0 22 100.0 21 95.5
Southern 144 140 97.2 133 92.4 133 95.0 85 60.7
Tairawhiti 44 43 97.7 40 90.9 39 90.7 23 53.5
Taranaki 62 55 88.7 60 96.8 55 100.0 55 100.0
Waikato 321 308 96.0 290 90.3 284 92.2 270 87.7
Wairarapa 15 15 100.0 15 100.0 15 100.0 15 100.0
Waitemata 414 379 91.5 361 87.2 354 93.4 331 87.3
West Coast 16 15 93.8 16 100.0 15 100.0 15 100.0
Whanganui 71 68 95.8 67 94.4 64 94.1 60 88.2
Private practice 658 329 50.0 624 94.8 295 89.7 291 88.4
Total 3,737 3,215 86.0 3,414 91.4 3,012 93.7 2,536 78.9
LG women = women with persistent LG/ who are LG & hrHPV positive. * Percentage of women with persistent LG/ who are LG & hrHPV positive; † percentage of women with a referral.

National Cervical Screening Programme – Monitoring Report –Number 52 Page 222
Table 76 - Follow-up of women with persistent low-grade cytology/ low-grade cytology and positive hrHPV test, by ethnicity
Ethnicity LG women Women with subsequent referral recorded
Women with subsequent colposcopy visit recorded
Women with colposcopy subsequent to referral
recorded
Women with colposcopy subsequent to referral recorded AND referral:
colposcopy interval <= 26 weeks
N N %* N % * N % † N % †
Māori 418 378 90.4 362 86.6 335 88.6 268 70.9
Pacific 184 164 89.1 151 82.1 140 85.4 126 76.8
Asian 484 404 83.5 428 88.4 373 92.3 334 82.7
European/ Other 2,651 2,269 85.6 2,473 93.3 2,164 95.4 1,808 79.7
Total 3,737 3,215 86.0 3,414 91.4 3,012 93.7 2,536 78.9 LG women = women with persistent LG/ who are LG & hrHPV positive. * Percentage of women with persistent LG/ who are LG & hrHPV positive; † percentage of women with a referral.

National Cervical Screening Programme – Monitoring Report –Number 52 Page 223
Indicator 7.3 – Adequacy of documenting colposcopic assessment Table 77 - Completion of colposcopic assessment fields, by DHB
DHB Total colposcopies
N
% of colposcopies performed where items are completed
SCJ visibility(i)
Presence/ absence lesion(ii)
Opinion re abnormality
grade(iii)
Follow-up type
Follow-up timeframe
Items i, ii, & iii complete
Public clinics overall 10,819 97.3 100.0 92.2 92.6 92.0 92.9
Auckland 939 97.3 100.0 91.8 97.9 97.0 93.2
Bay of Plenty 573 97.2 100.0 84.6 96.0 95.6 87.3
Canterbury 1,509 97.0 100.0 94.5 93.2 93.0 93.9
Capital & Coast 726 99.2 100.0 94.7 96.8 96.1 96.4
Counties Manukau 833 97.4 100.0 93.4 98.3 97.8 93.3
Hawke's Bay 425 96.5 100.0 93.4 70.4 70.4 93.2
Hutt Valley 274 97.8 100.0 91.3 93.8 93.1 93.1
Lakes 266 98.5 100.0 88.8 92.1 92.1 91.0
Mid Central 774 96.8 100.0 94.2 99.1 98.3 93.7
Nelson Marlborough 290 98.3 100.0 92.7 54.8 54.8 93.8
Northland 300 97.0 100.0 88.2 98.0 96.7 91.3
South Canterbury 168 92.3 100.0 84.3 93.5 91.1 85.7
Southern 797 96.7 100.0 85.1 96.6 95.2 87.7
Tairawhiti 182 99.5 100.0 97.4 97.8 97.3 97.8
Taranaki 389 96.1 100.0 94.3 99.2 99.2 94.1
Waikato 632 98.1 100.0 96.0 96.7 96.5 95.6
Wairarapa 99 97.0 100.0 94.9 96.0 93.9 93.9
Waitemata 1,375 97.2 100.0 93.1 82.8 82.1 93.8
West Coast 82 97.6 100.0 85.9 97.6 96.3 86.6
Whanganui 186 96.8 100.0 93.9 97.3 96.8 92.5
Private practice 1,327 97.7 100.0 94.9 89.4 88.3 94.9
Total 12,146 97.3 100.0 92.5 92.2 91.6 93.1

National Cervical Screening Programme – Monitoring Report –Number 52 Page 224
Table 78 - Summary of colposcopic appearance findings, by DHB
DHB Total colposcopies
SCJ visible* Colposcopic appearance (as % of colposcopies where items are
completed)
Total colposcopies
N N Abnormal Inconclusive
Public clinics overall 10,819 10,525 55.3 4.7
Auckland 939 914 54.7 4.9
Bay of Plenty 573 557 54.8 9.9
Canterbury 1,509 1,464 58.6 3.4
Capital & Coast 726 720 53.9 3.0
Counties Manukau 833 811 58.2 4.1
Hawke's Bay 425 410 50.1 3.5
Hutt Valley 274 268 57.7 5.5
Lakes 266 262 59.8 7.5
Mid Central 774 749 57.1 3.5
Nelson Marlborough 290 285 57.2 4.5
Northland 300 291 42.3 5.7
South Canterbury 168 155 41.7 7.7
Southern 797 771 52.9 9.3
Tairawhiti 182 181 62.6 1.6
Taranaki 389 374 55.5 3.3
Waikato 632 620 60.6 2.5
Wairarapa 99 96 56.6 3.0
Waitemata 1,375 1,337 50.3 3.7
West Coast 82 80 67.1 11.0
Whanganui 186 180 66.7 4.3
Private practice 1,327 1,297 52.9 2.9
Total 12,146 11,822 55.1 4.5 * Field has been completed

National Cervical Screening Programme – Monitoring Report – Number 52 Page 225
Table 79 - Biopsies by colposcopic appearance and DHB
DHB Colposcopic appearance Abnormal Inconclusive Normal Total Biopsy taken Total Biopsy taken Total Biopsy taken
N N % N N % N N %
Public clinics overall 5,985 5,543 92.6 508 167 32.9 4,326 860 19.9
Auckland 514 462 89.9 46 15 32.6 379 56 14.8
Bay of Plenty 314 272 86.6 57 17 29.8 202 24 11.9
Canterbury 885 832 94.0 52 21 40.4 572 137 24.0
Capital & Coast 391 355 90.8 22 6 27.3 313 87 27.8
Counties Manukau 485 464 95.7 34 12 35.3 314 41 13.1
Hawke's Bay 213 195 91.5 15 8 53.3 197 34 17.3
Hutt Valley 158 149 94.3 15 4 26.7 101 30 29.7
Lakes 159 142 89.3 20 4 20.0 87 21 24.1
Mid Central 442 410 92.8 27 5 18.5 305 51 16.7
Nelson Marlborough 166 154 92.8 13 5 38.5 111 37 33.3
Northland 127 119 93.7 17 2 11.8 156 34 21.8
South Canterbury 70 63 90.0 13 5 38.5 85 6 7.1
Southern 422 399 94.5 74 33 44.6 301 92 30.6
Tairawhiti 114 111 97.4 3 2 66.7 65 22 33.8
Taranaki 216 203 94.0 13 2 15.4 160 35 21.9
Waikato 383 362 94.5 16 10 62.5 233 48 20.6
Wairarapa 56 54 96.4 3 2 66.7 40 15 37.5
Waitemata 691 625 90.4 51 12 23.5 633 79 12.5
West Coast 55 51 92.7 9 1 11.1 18 4 22.2
Whanganui 124 121 97.6 8 1 12.5 54 7 13.0
Private practice 702 600 85.5 38 24 63.2 587 129 22.0
Total 6,687 6,143 91.9 546 191 35.0 4,913 989 20.1

National Cervical Screening Programme – Monitoring Report – Number 52 Page 226
Indicator 7.5 – Timely discharge of women after treatment
Table 80 - Follow-up of treated women with colposcopy and cytology in the period up to nine months post-treatment, and discharge of eligible women
DHB Total treatments Eligible for discharge* Women discharged appropriately
N N
% of women treated N
% of eligible
Auckland 104 59 56.7 55 93.2 Bay of Plenty 57 38 66.7 20 52.6 Canterbury 152 101 66.4 78 77.2 Capital & Coast 49 39 79.6 36 92.3 Counties Manukau 113 64 56.6 62 96.9 Hawke's Bay 45 32 71.1 28 87.5 Hutt Valley 27 21 77.8 21 100.0 Lakes 35 25 71.4 20 80.0 Mid Central 76 62 81.6 53 85.5 Nelson Marlborough 37 27 73.0 26 96.3 Northland 46 33 71.7 24 72.7 South Canterbury 12 11 91.7 6 54.5 Southern 90 67 74.4 63 94.0 Tairawhiti 25 17 68.0 13 76.5 Taranaki 38 29 76.3 25 86.2 Waikato 92 69 75.0 69 100.0 Wairarapa 11 10 90.9 10 100.0 Waitemata 104 70 67.3 50 71.4 West Coast 9 7 77.8 7 100.0 Whanganui 43 34 79.1 30 88.2 Private practice 103 85 82.5 46 54.1 Total 1,268 900 71.0 742 82.4
* Based on advice from the NCSP Advisory Group, women were defined as eligible for discharge if they had a cytology test following their treatment, and their cytology result was negative.
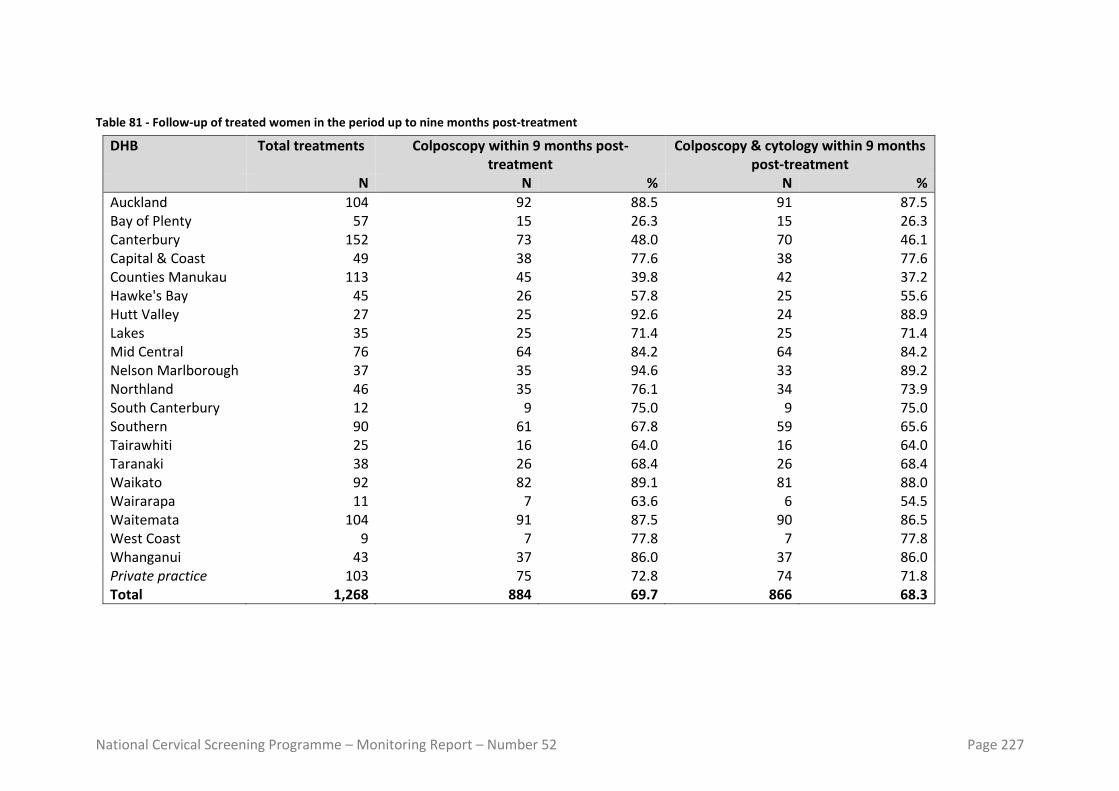
National Cervical Screening Programme – Monitoring Report – Number 52 Page 227
Table 81 - Follow-up of treated women in the period up to nine months post-treatment
DHB Total treatments Colposcopy within 9 months post-treatment
Colposcopy & cytology within 9 months post-treatment
N N % N %
Auckland 104 92 88.5 91 87.5 Bay of Plenty 57 15 26.3 15 26.3 Canterbury 152 73 48.0 70 46.1 Capital & Coast 49 38 77.6 38 77.6 Counties Manukau 113 45 39.8 42 37.2 Hawke's Bay 45 26 57.8 25 55.6 Hutt Valley 27 25 92.6 24 88.9 Lakes 35 25 71.4 25 71.4 Mid Central 76 64 84.2 64 84.2 Nelson Marlborough 37 35 94.6 33 89.2 Northland 46 35 76.1 34 73.9 South Canterbury 12 9 75.0 9 75.0 Southern 90 61 67.8 59 65.6 Tairawhiti 25 16 64.0 16 64.0 Taranaki 38 26 68.4 26 68.4 Waikato 92 82 89.1 81 88.0 Wairarapa 11 7 63.6 6 54.5 Waitemata 104 91 87.5 90 86.5 West Coast 9 7 77.8 7 77.8 Whanganui 43 37 86.0 37 86.0 Private practice 103 75 72.8 74 71.8 Total 1,268 884 69.7 866 68.3

National Cervical Screening Programme – Monitoring Report – Number 52 Page 228
Indicator 8 – HPV tests
Indicator 8.1 – Triage of low-grade cytology Table 82 - Triage testing of women with ASC-US cytology
Laboratory Total ASC-US results Women with an HPV test aged < 30yrs aged 30+ yrs aged < 30yrs aged 30+ yrs
N N N % N %
Canterbury Health Laboratories 32 130 0 0.0 126 96.9
Anatomical Pathology Services 114 300 2 1.8 296 98.7
LabPLUS 64 154 0 0.0 148 96.1
Medlab Central Ltd 80 225 2 2.5 210 93.3
Pathlab 105 280 0 0.0 273 97.5
Southern Community Labs 183 432 2 1.1 424 98.1
Total 578 1,521 6 1.0 1,477 97.1
* Where the laboratory which performed the cytology test differs from the laboratory which performed the HPV test, classification is according to the laboratory which performed the cytology test.

National Cervical Screening Programme – Monitoring Report – Number 52 Page 229
Table 83 - Triage testing of women with LSIL cytology
Laboratory Total LSIL results Women with an HPV test aged < 30yrs aged 30+ yrs aged < 30yrs aged 30+ yrs N N N % N %
Canterbury Health Laboratories 89 64 1 1.1 64 100.0
Anatomical Pathology Services 407 357 1 0.2 351 98.3
LabPLUS 91 96 1 1.1 91 94.8
Medlab Central Ltd 132 116 1 0.8 111 95.7
Pathlab 260 247 0 0.0 243 98.4
Southern Community Labs 759 664 12 1.6 644 97.0
Total 1,738 1,544 16 0.9 1,504 97.4
* Where the laboratory which performed the cytology test differs from the laboratory which performed the HPV test, classification is according to the laboratory which performed the cytology test Table 84 - Histological outcomes within 12 months in women with ASC-US cytology and positive HPV triage test
Laboratory Women with ASC-US cytology & positive HPV
triage test
Triage -positive women who
attended colposcopy
Triage -positive women with
histology recorded
Triage -positive women with CIN 2+ histology
N N %* N %* N %† %‡
Anatomical Pathology Services 86 80 93.0 57 66.3 13 16.3 22.8
Canterbury Health Laboratories 20 19 95.0 14 70.0 2 10.5 14.3
LabPLUS 26 24 92.3 19 73.1 5 20.8 26.3
Medlab Central Ltd 53 47 88.7 27 50.9 7 14.9 25.9
Pathlab 69 61 88.4 40 58.0 9 14.8 22.5
Southern Community Labs 136 127 93.4 87 64.0 17 13.4 19.5
Total 390 358 91.8 244 62.6 53 14.8 21.7
* % of women with ASC-US cytology and positive triage test † expressed as a percentage of women with colposcopy ‡ expressed as a percentage of women with histology. Results are for ASC-US cytology collected in the 6-month period 12 months prior to the current monitoring period (i.e. in 1 July – 31 December 2018), to allow for sufficient follow-up time for colposcopy/ histology.

National Cervical Screening Programme – Monitoring Report – Number 52 Page 230
Table 85 - Histological outcomes within 12 months in women with LSIL cytology and positive HPV triage test
Laboratory Women with LSIL cytology &
positive HPV triage test
Triage -positive women who
attended colposcopy
Triage -positive women with
histology recorded
Triage -positive women with CIN 2+ histology
N N %* N %* N %† %‡
Anatomical Pathology Services 210 194 92.4 143 68.1 22 11.3 15.4
Canterbury Health Laboratories 35 34 97.1 30 85.7 3 8.8 10.0
LabPLUS 33 27 81.8 22 66.7 3 11.1 13.6
Medlab Central Ltd 76 72 94.7 53 69.7 16 22.2 30.2
Pathlab 166 152 91.6 96 57.8 20 13.2 20.8
Southern Community Labs 400 371 92.8 260 65.0 49 13.2 18.8
Total 920 850 92.4 604 65.7 113 13.3 18.7
* % of women with LSIL cytology and positive triage test † expressed as a percentage of women with colposcopy ‡ expressed as a percentage of women with histology. Results are for ASC-US cytology collected in the 6-month period 12 months prior to the current monitoring period (i.e. in 1 July – 31 December 2018), to allow for sufficient follow-up time for colposcopy/ histology.

National Cervical Screening Programme – Monitoring Report – Number 52 Page 231
Indicator 8.2 – HPV test volumes
Table 86 - Volume of HPV test samples received during the monitoring period, by laboratory
Laboratory HPV tests received Ratio HPV tests: cytology samples
received (%) N % of
national total
Anatomical Pathology Services 3,085 19.6 7.3 Canterbury Health Laboratories 1,209 7.7 12.3 LabPLUS 812 5.2 9.6 Medlab Central Ltd 1,629 10.4 9.5 Pathlab 2,122 13.5 7.8 Southern Community Labs 6,879 43.7 6.5 Total 15,736 100.0 7.5
Table 87 - Invalid HPV tests, by laboratory
Laboratory Total Valid Invalid
N N % N %
Anatomical Pathology Services 3,085 3,085 100.0 - 0.00
Canterbury Health Laboratories 1,209 1,209 100.0 - 0.00
LabPLUS 812 811 99.9 1 0.12
Medlab Central Ltd 1,629 1,629 100.0 - 0.00
Pathlab 2,122 2,122 100.0 - 0.00
Southern Community Labs 6,879 6,876 100.0 3 0.04
Total 15,736 15,732 100.0 4 0.03
Table 88 - Validity of HPV triage tests, by test technology
Test technology Total HPV tests Valid Invalid
N % N % N %
Abbott RealTime High Risk HPV
8,088 51.4 8,085 100.0 3 0.04
BD Onclarity 2,122 13.5 2,122 100.0 - 0.00
Roche COBAS 4800 HPV 5,526 35.1 5,525 100.0 1 0.02
Total 15,736 100.0 15,732 100.0 4 0.03

National Cervical Screening Programme – Monitoring Report –Number 52 Page 232
Table 89 - Volume of HPV test samples received during the monitoring period, by purpose and ethnicity
Ethnicity Post-treatment Historical Taken at colposcopy HPV triage Other Total N % N % N % N % N % N
Māori 382 16.5 1,020 44.0 166 7.2 327 14.1 421 18.2 2,316 Pacific 81 13.5 204 34.0 49 8.2 156 26.0 110 18.3 600 Asian 226 15.8 366 25.7 139 9.7 469 32.9 226 15.8 1,426
European/ Other 1,740 15.3 4,168 36.6 1,146 10.1 1,853 16.3 2,487 21.8 11,394 Total 2,429 15.4 5,758 36.6 1,500 9.5 2,805 17.8 3,244 20.6 15,736
Table 90 - Volume of HPV test samples received during the monitoring period, by purpose and age
Age Post-treatment Historical Taken at colposcopy HPV triage Other Total N % N % N % N % N % N
<20 - 0.0 - - - 0.0 - 0.0 3 100.0 3 20-24 133 24.7 52 9.6 186 34.5 - 0.0 168 31.2 539 25-29 487 33.1 512 34.8 213 14.5 - 0.0 259 17.6 1,471 30-34 600 22.5 897 33.6 237 8.9 623 23.4 311 11.7 2,668 35-39 415 19.2 856 39.5 163 7.5 463 21.4 268 12.4 2,165 40-44 267 14.6 812 44.5 134 7.3 373 20.4 238 13.0 1,824 45-49 173 9.2 819 43.4 116 6.1 423 22.4 356 18.9 1,887 50-54 148 8.6 667 38.7 116 6.7 351 20.4 440 25.6 1,722 55-59 84 6.0 511 36.4 135 9.6 241 17.2 433 30.8 1,404 60-64 65 6.2 331 31.3 103 9.8 190 18.0 367 34.8 1,056 65-69 40 5.9 189 27.8 63 9.3 108 15.9 280 41.2 680 70+ 17 5.4 112 35.3 34 10.7 33 10.4 121 38.2 317 Total 2,429 15.4 5,758 36.6 1,500 9.5 2,805 17.8 3,244 20.6 15,736
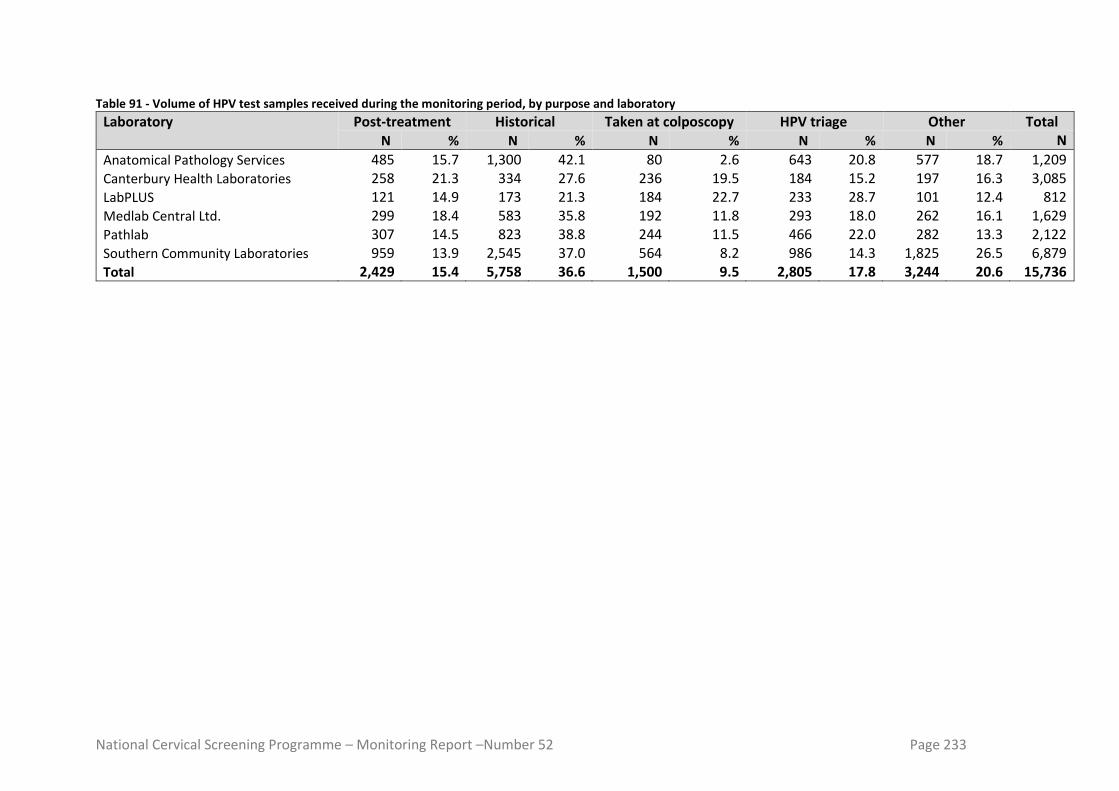
National Cervical Screening Programme – Monitoring Report –Number 52 Page 233
Table 91 - Volume of HPV test samples received during the monitoring period, by purpose and laboratory
Laboratory Post-treatment Historical Taken at colposcopy HPV triage Other Total N % N % N % N % N % N
Anatomical Pathology Services 485 15.7 1,300 42.1 80 2.6 643 20.8 577 18.7 1,209 Canterbury Health Laboratories 258 21.3 334 27.6 236 19.5 184 15.2 197 16.3 3,085 LabPLUS 121 14.9 173 21.3 184 22.7 233 28.7 101 12.4 812 Medlab Central Ltd. 299 18.4 583 35.8 192 11.8 293 18.0 262 16.1 1,629 Pathlab 307 14.5 823 38.8 244 11.5 466 22.0 282 13.3 2,122 Southern Community Laboratories 959 13.9 2,545 37.0 564 8.2 986 14.3 1,825 26.5 6,879 Total 2,429 15.4 5,758 36.6 1,500 9.5 2,805 17.8 3,244 20.6 15,736
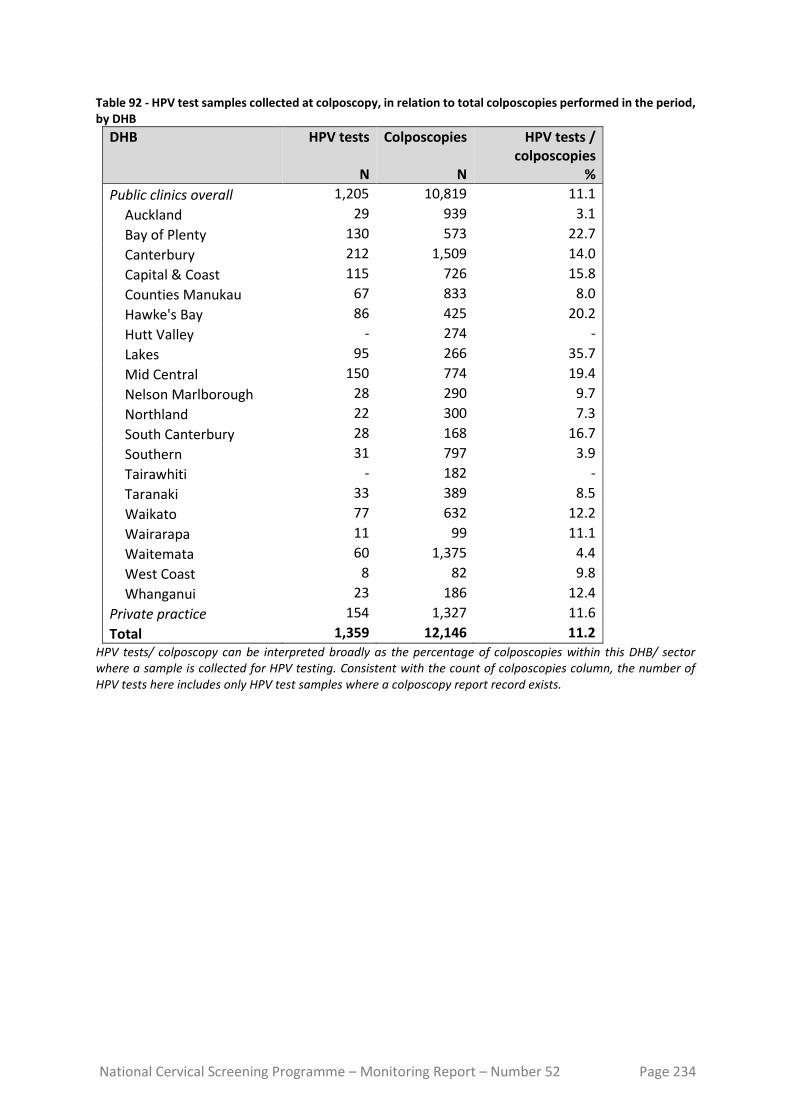
National Cervical Screening Programme – Monitoring Report – Number 52 Page 234
Table 92 - HPV test samples collected at colposcopy, in relation to total colposcopies performed in the period, by DHB
DHB HPV tests
N
Colposcopies
N
HPV tests / colposcopies
%
Public clinics overall 1,205 10,819 11.1
Auckland 29 939 3.1
Bay of Plenty 130 573 22.7
Canterbury 212 1,509 14.0
Capital & Coast 115 726 15.8
Counties Manukau 67 833 8.0
Hawke's Bay 86 425 20.2
Hutt Valley - 274 -
Lakes 95 266 35.7
Mid Central 150 774 19.4
Nelson Marlborough 28 290 9.7
Northland 22 300 7.3
South Canterbury 28 168 16.7
Southern 31 797 3.9
Tairawhiti - 182 -
Taranaki 33 389 8.5
Waikato 77 632 12.2
Wairarapa 11 99 11.1
Waitemata 60 1,375 4.4
West Coast 8 82 9.8
Whanganui 23 186 12.4
Private practice 154 1,327 11.6
Total 1,359 12,146 11.2 HPV tests/ colposcopy can be interpreted broadly as the percentage of colposcopies within this DHB/ sector where a sample is collected for HPV testing. Consistent with the count of colposcopies column, the number of HPV tests here includes only HPV test samples where a colposcopy report record exists.
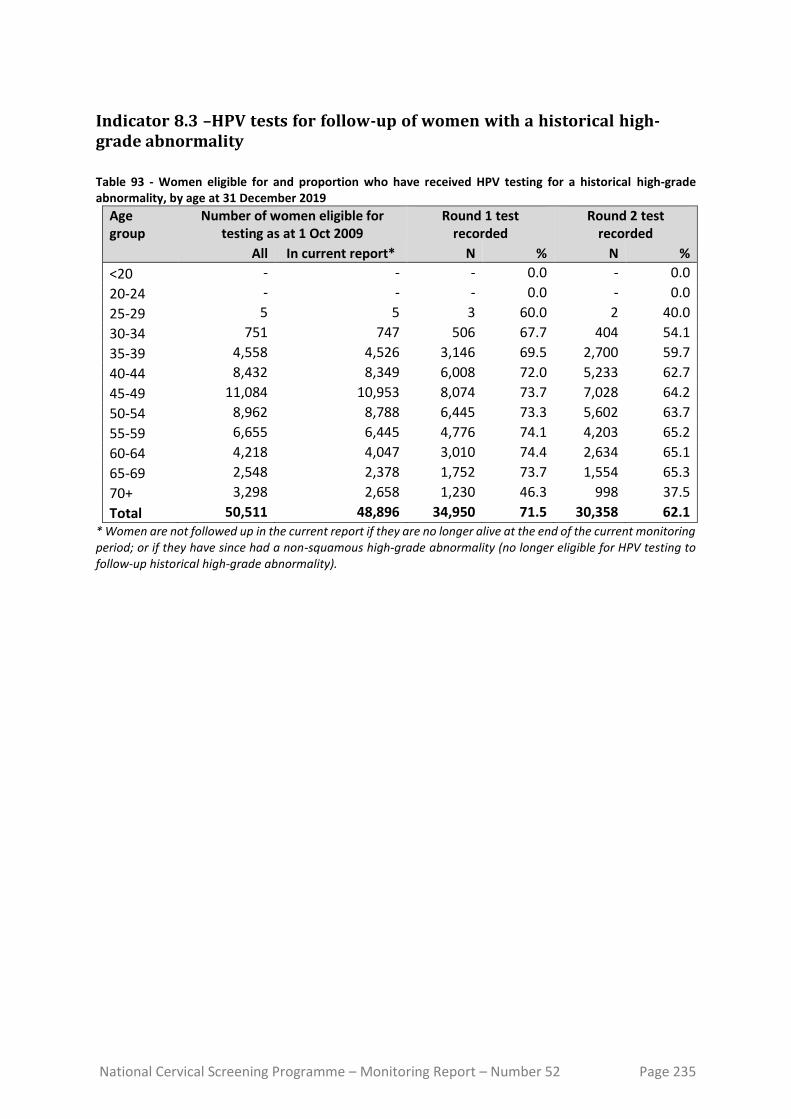
National Cervical Screening Programme – Monitoring Report – Number 52 Page 235
Indicator 8.3 –HPV tests for follow-up of women with a historical high-grade abnormality
Table 93 - Women eligible for and proportion who have received HPV testing for a historical high-grade abnormality, by age at 31 December 2019
Age group
Number of women eligible for testing as at 1 Oct 2009
Round 1 test recorded
Round 2 test recorded
All In current report* N % N %
<20 - - - 0.0 - 0.0
20-24 - - - 0.0 - 0.0
25-29 5 5 3 60.0 2 40.0
30-34 751 747 506 67.7 404 54.1
35-39 4,558 4,526 3,146 69.5 2,700 59.7
40-44 8,432 8,349 6,008 72.0 5,233 62.7
45-49 11,084 10,953 8,074 73.7 7,028 64.2
50-54 8,962 8,788 6,445 73.3 5,602 63.7
55-59 6,655 6,445 4,776 74.1 4,203 65.2
60-64 4,218 4,047 3,010 74.4 2,634 65.1
65-69 2,548 2,378 1,752 73.7 1,554 65.3
70+ 3,298 2,658 1,230 46.3 998 37.5
Total 50,511 48,896 34,950 71.5 30,358 62.1 * Women are not followed up in the current report if they are no longer alive at the end of the current monitoring period; or if they have since had a non-squamous high-grade abnormality (no longer eligible for HPV testing to follow-up historical high-grade abnormality).
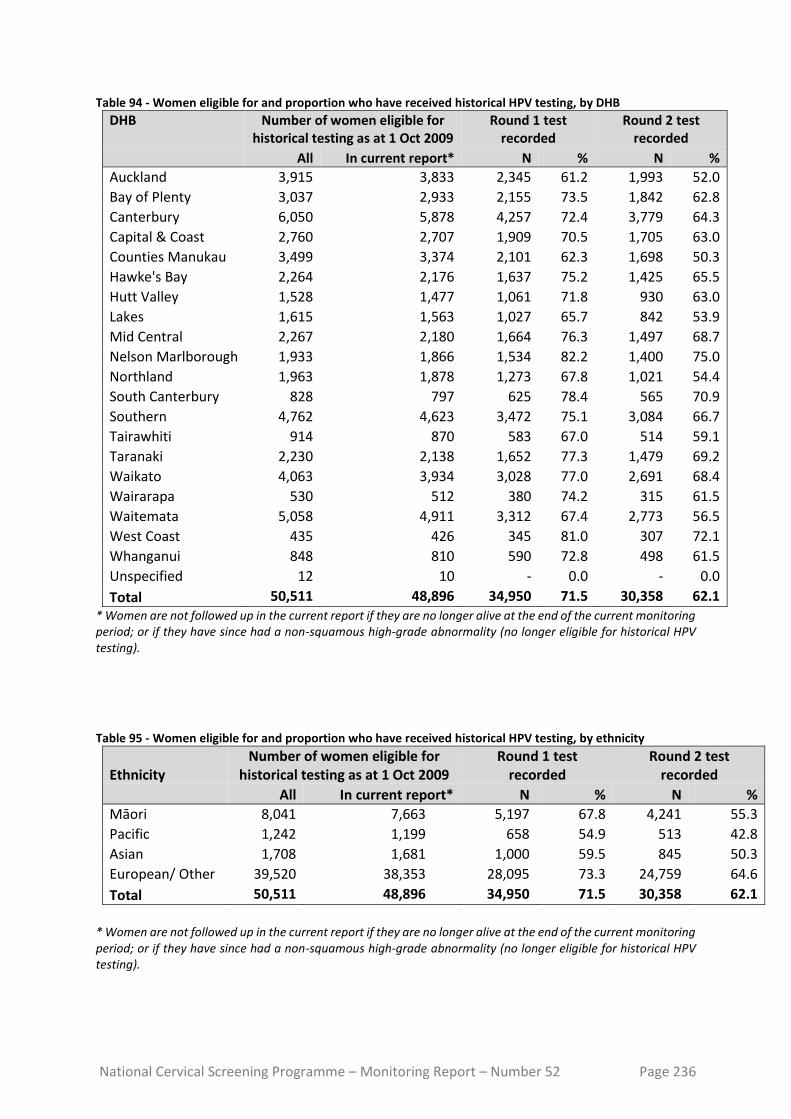
National Cervical Screening Programme – Monitoring Report – Number 52 Page 236
Table 94 - Women eligible for and proportion who have received historical HPV testing, by DHB
DHB Number of women eligible for historical testing as at 1 Oct 2009
Round 1 test recorded
Round 2 test recorded
All In current report* N % N %
Auckland 3,915 3,833 2,345 61.2 1,993 52.0
Bay of Plenty 3,037 2,933 2,155 73.5 1,842 62.8
Canterbury 6,050 5,878 4,257 72.4 3,779 64.3
Capital & Coast 2,760 2,707 1,909 70.5 1,705 63.0
Counties Manukau 3,499 3,374 2,101 62.3 1,698 50.3
Hawke's Bay 2,264 2,176 1,637 75.2 1,425 65.5
Hutt Valley 1,528 1,477 1,061 71.8 930 63.0
Lakes 1,615 1,563 1,027 65.7 842 53.9
Mid Central 2,267 2,180 1,664 76.3 1,497 68.7
Nelson Marlborough 1,933 1,866 1,534 82.2 1,400 75.0
Northland 1,963 1,878 1,273 67.8 1,021 54.4
South Canterbury 828 797 625 78.4 565 70.9
Southern 4,762 4,623 3,472 75.1 3,084 66.7
Tairawhiti 914 870 583 67.0 514 59.1
Taranaki 2,230 2,138 1,652 77.3 1,479 69.2
Waikato 4,063 3,934 3,028 77.0 2,691 68.4
Wairarapa 530 512 380 74.2 315 61.5
Waitemata 5,058 4,911 3,312 67.4 2,773 56.5
West Coast 435 426 345 81.0 307 72.1
Whanganui 848 810 590 72.8 498 61.5
Unspecified 12 10 - 0.0 - 0.0
Total 50,511 48,896 34,950 71.5 30,358 62.1
* Women are not followed up in the current report if they are no longer alive at the end of the current monitoring period; or if they have since had a non-squamous high-grade abnormality (no longer eligible for historical HPV testing).
Table 95 - Women eligible for and proportion who have received historical HPV testing, by ethnicity
Ethnicity Number of women eligible for
historical testing as at 1 Oct 2009 Round 1 test
recorded Round 2 test
recorded
All In current report* N % N %
Māori 8,041 7,663 5,197 67.8 4,241 55.3
Pacific 1,242 1,199 658 54.9 513 42.8
Asian 1,708 1,681 1,000 59.5 845 50.3
European/ Other 39,520 38,353 28,095 73.3 24,759 64.6
Total 50,511 48,896 34,950 71.5 30,358 62.1
* Women are not followed up in the current report if they are no longer alive at the end of the current monitoring period; or if they have since had a non-squamous high-grade abnormality (no longer eligible for historical HPV testing).

National Cervical Screening Programme – Monitoring Report – Number 52 Page 237
Figure 135 - Number of women eligible for historical testing within a DHB versus the percentage with a Round 1 historical HPV test recorded
Each dot represents a DHB. This chart does not suggest that there is any relationship between the number of women eligible for testing and percent of women who have been tested, therefore this does not seem a likely explanation for the variation in women tested in different DHBs.
Figure 136 - Relationship between women screened in the previous five years and proportion of women with historical tests recorded, by DHB
Each dot represents a DHB. See also Table 96.

National Cervical Screening Programme – Monitoring Report – Number 52 Page 238
Figure 137 - Relationship between women screened in the previous five years and proportion of women with historical tests recorded, by ethnicity
Each dot represents an ethnicity.
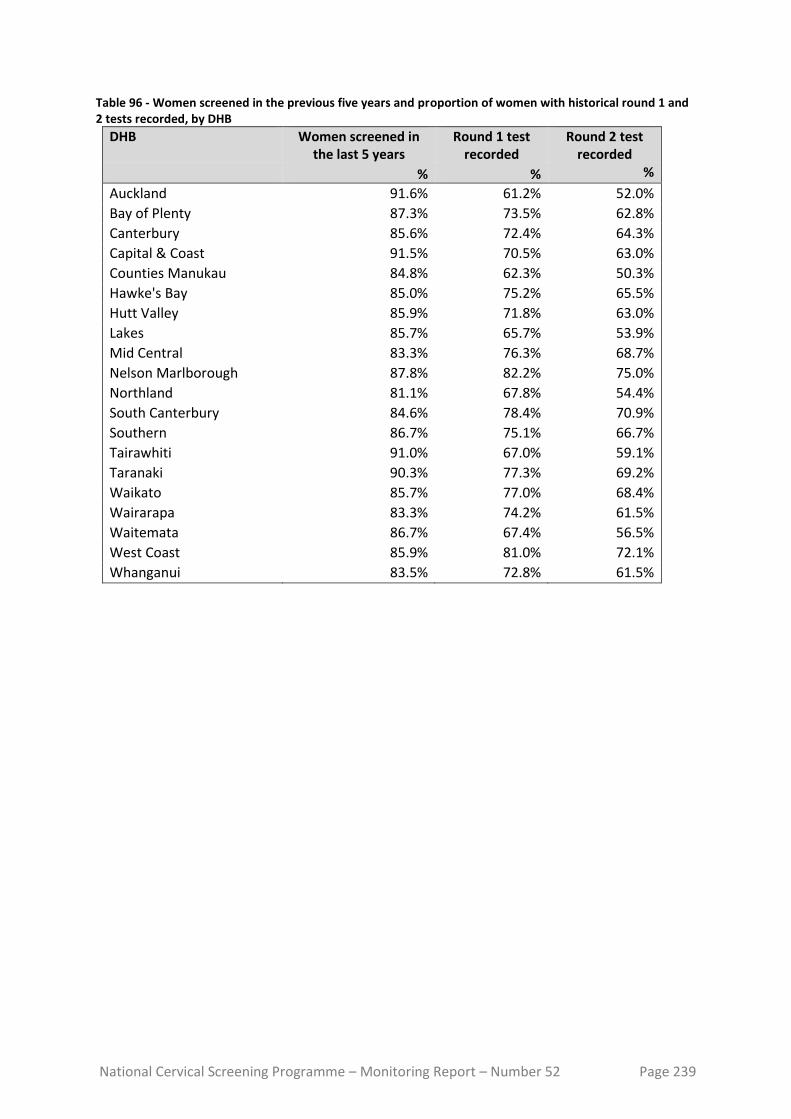
National Cervical Screening Programme – Monitoring Report – Number 52 Page 239
Table 96 - Women screened in the previous five years and proportion of women with historical round 1 and 2 tests recorded, by DHB
DHB Women screened in the last 5 years
Round 1 test recorded
Round 2 test recorded
% % %
Auckland 91.6% 61.2% 52.0%
Bay of Plenty 87.3% 73.5% 62.8%
Canterbury 85.6% 72.4% 64.3%
Capital & Coast 91.5% 70.5% 63.0%
Counties Manukau 84.8% 62.3% 50.3%
Hawke's Bay 85.0% 75.2% 65.5%
Hutt Valley 85.9% 71.8% 63.0%
Lakes 85.7% 65.7% 53.9%
Mid Central 83.3% 76.3% 68.7%
Nelson Marlborough 87.8% 82.2% 75.0%
Northland 81.1% 67.8% 54.4%
South Canterbury 84.6% 78.4% 70.9%
Southern 86.7% 75.1% 66.7%
Tairawhiti 91.0% 67.0% 59.1%
Taranaki 90.3% 77.3% 69.2%
Waikato 85.7% 77.0% 68.4%
Wairarapa 83.3% 74.2% 61.5%
Waitemata 86.7% 67.4% 56.5%
West Coast 85.9% 81.0% 72.1%
Whanganui 83.5% 72.8% 61.5%

National Cervical Screening Programme – Monitoring Report – Number 52 Page 240
Appendix B – Bethesda 2001 New Zealand Modified
TBS code Descriptor
Specimen type
CPS Conventional pap cytology sample
LBC Liquid based cytology
COM Combined (conventional and liquid based)
Specimen site
T Vault
R Cervical
V Vaginal
Adequacy
S1 The specimen is satisfactory for evaluation (optional free text)
S2 The specimen is satisfactory for evaluation (optional free text). No endocervical/ transformation zone component present
UA The specimen is unsatisfactory for evaluation because of insufficient squamous cells
UB The specimen is unsatisfactory for evaluation because of poor fixation/preservation
UC The specimen is unsatisfactory for evaluation because foreign material obscures the cells
UD The specimen is unsatisfactory for evaluation because inflammation obscures the cells
UE The specimen is unsatisfactory for evaluation because blood obscures the cells
UF The specimen is unsatisfactory for evaluation because of cytolysis/autolysis
UG The specimen is unsatisfactory for evaluation because … (free text)
General
G1 Negative for intraepithelial lesion or malignancy
G2 Epithelial cell abnormality: See interpretation/result
G3 Other: See interpretation/result
Interpretation
O1 There are organisms consistent with Trichomonas species
O2 There are fungal organisms morphologically consistent with Candida species
O3 There is a shift in microbiological flora that may represent bacterial vaginosis
O4 There are bacteria morphologically consistent with Actinomyces species
O5 There are cellular changes consistent with Herpes simplex virus
OT1 There are reactive cellular changes present (optional free text)
OT2 There are endometrial cells present in a woman over the age of 40 years
OT3 There are atrophic cellular changes present
ASL There are atypical squamous cells of undetermined significance (ASC-US) present
ASH There are atypical squamous cells present. A high-grade squamous intraepithelial lesion cannot be excluded (ASC-H)
LS There are abnormal squamous cells consistent with a low-grade squamous intraepithelial lesion (LSIL; CIN1/HPV)
HS1 There are abnormal squamous cells consistent with a high-grade squamous intraepithelial lesion (HSIL). The features are consistent with CINII or CINIII
HS2 There are abnormal squamous cells consistent with a high-grade squamous intraepithelial lesion (HSIL) with features suspicious for invasion

National Cervical Screening Programme – Monitoring Report – Number 52 Page 241
TBS code Descriptor
SC There are abnormal squamous cells showing changes consistent with squamous cell carcinoma
AG1 There are atypical endocervical cells present
AG2 There are atypical endometrial cells present
AG3 There are atypical glandular cells present
AG4 There are atypical endocervical cells favouring a neoplastic process
AG5 There are atypical glandular cells favouring a neoplastic process
AIS There are abnormal endocervical cells consistent with adenocarcinoma in-situ (AIS)
AC1 There are abnormal glandular cells consistent with endocervical adenocarcinoma
AC2 There are abnormal glandular cells consistent with endometrial adenocarcinoma
AC3 There are abnormal glandular cells consistent with extrauterine adenocarcinoma
AC4 There are abnormal glandular cells consistent with adenocarcinoma
AC5 There are abnormal cells consistent with a malignant neoplasm
Recommendation
R1 The next cytology sample should be taken in three years, based on the information held on the NCSP Register
R2 Please repeat the cytology sample within three months
R3 Please repeat the cytology sample within three months of the end of pregnancy
R4 Please repeat the cytology sample in three months
R5 Please repeat the cytology sample in six months
R6 Please repeat the cytology sample in 12 months
R7 Because a previous cytology sample showed atypical squamous cells or low-grade changes, please repeat the cytology sample in 12 months
R8 Annual cytology samples are indicated because of previous high-grade abnormality
R9 Referral for specialist assessment is indicated
R10 Urgent referral for specialist assessment is indicated
R11 [not in use]
R12 Please repeat the cytology sample shortly after a course of oestrogen treatment
R13 Under specialist care
R14 In view of the abnormal clinical history provided, urgent referral for assessment is recommended regardless of cytological findings

National Cervical Screening Programme – Monitoring Report – Number 52 Page 242
Appendix C – SNOMED categories for histological samples
Adequacy of specimen 1986
Code
1993
Code
Insufficient or unsatisfactory material for
diagnosis
M09000 M09010
There is no code for satisfactory materials.
Site (topography) of specimen 1986 Code 1993 Code
Vagina T81 T82000
Cervix (includes endocervix and exocervix) T83 T83200
Summary diagnosis Code stored on
register
1986 Code 1993 Code Diagnostic
category
Rank*
There will be a maximum of four M codes transmitted to the register.
Negative result - normal tissue M00100 M60000 Negative/benign 1
Inflammation M40000 M40000 Negative/benign 2
Microglandular hyperplasia M72480 M72480 Negative/benign 3
Squamous Metaplasia M73000 M73000 Negative/benign 4
Polyp M76800 M76800 Negative/benign 5
Other (Morphologic abnormality, not dysplastic or
malignant)
M01000 M01000 Negative/benign 6
Atypia M69700 M67000 CIN 1 7
Benign glandular atypia M81400 M67030 Negative/benign 8
HPV, koilocytosis, condyloma
(NOS)
Condyloma acuminatum
M76700 M76700
M76720
M76700
M76720
HPV 9
CIN I (LSIL)
(VAIN I when used with T81/ T82000)
M74006 M67016 CIN 1 10
Dysplasia / CIN NOS M74000 M67015 CIN 1 11
Glandular dysplasia M81401 M67031 Glandular dysplasia 12
CIN II (HSIL)
(VAIN II when used with T81/ T82000)
M74007 CIN 2 13
HSIL NOS M67017 M67017 HSIL 14
CIN III (HSIL) M74008 CIN 3 17
(VAIN III when used with T81/ T82000)
Carcinoma in situ
M80102
M80702
M80102
M80702
15
16
Adenocarcinoma in situ M81402 M81402 Adenocarc. in situ 18
Microinvasive squamous cell carcinoma M80765 M80763 Micro-invasive 19
Invasive squamous cell carcinoma M80703 M80703 Invasive SCC 20
Adenocarcinoma (endocervical type) M83843 M83843 Adenocarcinoma
(endocervical type)
21
Adenosquamous carcinoma M85603 M85603 Adenosquamous
carcinoma
22
Invasive adenocarcinoma (not endocervical
type)
M81403 M81403 Invasive
adenocarcinoma
(not endocervical type)
23
Metastatic tumour M80006 M80006 Other cancer 29
Undifferentiated carcinoma M80203 M80203 Other cancer 24
Sarcoma M88003 M88003 Other cancer 25
Other codes accepted Code stored
on register
1986
Code
1993
Code
Diagnostic
category
Rank
Carcinosarcoma M88003 M89803 M89803 Other cancer 26
Choriocarcinoma M80003 M91003 M91003 Other cancer 27
Miscellaneous primary tumour M80003 M80003 M80003 Other cancer 28
Small cell carcinoma M80003 M80413 M80413 Other cancer 30
Malignant tumour, Small cell type M80003 M80023 M80023 Other cancer 31

National Cervical Screening Programme – Monitoring Report – Number 52 Page 243
Other codes accepted Code stored on
register
1986
Code
1993
Code
Diagnostic category
Rank
Melanoma M80003 M87203 M87203 Other cancer 32
Other primary epithelial
malignancy
M80003 M80103 M80103 Other cancer 33

National Cervical Screening Programme – Monitoring Report – Number 52 Page 244
Appendix D – Indicator Definitions Targets and Reporting Details
Positive predictive value calculations Table 97 - Definition used for positive predictive value calculations
Histology Diagnosis G1 Squamous (G2) Glandular (G2)
Other (G3) Total
G1 ASL LS ASH HS1/2 SC AG1-5 AIS AC1-4 AC5
Negative q y y a a a
Squam-Atypia NOS q y y a a a
Squam-Low-grade/CIN1/HPV q y y a a a
Squam-High-grade/CIN 2-3 p x x b b b
Squam Microinvasive SCC p x x b b b
Squam-Invasive SCC p x x b b b
Gland-Benign Atypia q y y a a a
Gland-Dyplasia p x x b b b
Gland-AIS p x x b b b
Gland-Invasive Adeno p x x b b b
Other Malignant Neoplasm p x x b b b
PPV% (ASC-H)= sum(p) / (sum(p)+sum(q)) PPV% (HSIL)= sum(x) / (sum(x)+sum(y)) PPV% (ASC-H + HSIL + SC)= (sum(p) + sum(x))/ (sum(p)+sum(q) +sum(x) + sum(y)

National Cervical Screening Programme – Monitoring Report – Number 52 Page 245
Appendix E – DHB assignment for colposcopy clinics
Where results in Indicator 7 (colposcopy indicators) are provided by DHB, the clinics included in each DHB are as listed below. Assignment of individual facilities to specific DHBs was provided by the NCSP. All other colposcopy clinics were grouped together as “Private practice”.
DHB Colposcopy clinics included* Auckland Ward 97 - Gynae Inpatient Auckland City Hospital
General Surgery – Auckland City Hospital Colposcopy Clinic - Greenlane Clinical Centre Gynae Outpatient Clinic – Greenlane Clinical Centre Short Stay Surgical Unit – Greenlane Clinical Centre Emergency Medicine – North Shore Hospital
Bay of Plenty Whakatane Hospital (G) Opotiki Hospital Outpatients’ Department Tauranga Hospital (G)
Canterbury Ashburton Hospital Christchurch Hospital Christchurch Sexual Health Centre Christchurch Women's Hospital - Colposcopy Christchurch Women's Hospital - Gynaecology
Capital & Coast Colposcopy Clinic – Wellington Women’s Hospital Outpatients Department Kenepuru Women's Outpatients’ Department Women's Clinic – Wellington Regional Hospital
Counties Manukau Manukau Super Clinic Gynaecology Clinic – [Middlemore Hospital] Colposcopy Clinic – Manukau Super Clinic
Hawke's Bay Chatham Islands Health Centre Outpatients Dept – Napier Health Centre Villa 4, Gynaecology, Hawke’s Bay Hospital Hawkes Bay Regional Hospital Wairoa Cervical Screening Wairoa Hospital
Hutt Valley Women's Health Clinic – Hutt Hospital Gynaecology Clinic - Hutt Hospital
Lakes Rotorua Hospital (Gynae Dept) Taupo Hospital
Mid Central Colposcopy Clinic – Palmerston North Hospital Gynaecology Clinic - Palmerston North Hospital Gynaecology Clinic Horowhenua Hospital
Nelson Marlborough Marlborough Maternity & Gynae Nelson Outpatients Department
Northland Colposcopy Clinic Whangarei Hospital Kaitaia Hospital Colp Outpatients’ Department Bay Of Islands Hospital Outpatients’ Department Gynaecology Clinic Whangarei Hospital
South Canterbury Timaru Hospital - Colp/Gynae Southern General Gynae Department – Dunedin Hospital

National Cervical Screening Programme – Monitoring Report – Number 52 Page 246
DHB Colposcopy clinics included* Dunedin Public Hospital Dunedin Colposcopy Clinic Southland Hospital Gynaecology
Tairawhiti Gisborne Hospital Taranaki Taranaki Health Base Hospital - Outpatients Department
Hawera Outpatients Waikato Te Kuiti Hospital
Womens Outpatient Services – Waikato Hospital Tokoroa Hospital - Bev Thorn
Wairarapa Gynaecology Clinic – Wairarapa Hospital Waitemata Colposcopy Clinic- Waitakere Hospital
Gynaecology Clinic –North Shore Hospital Colposcopy Clinic- North Shore Hospital Peri-Operative Department - North Shore Hospital
West Coast Greymouth Hospital Gynaecology Clinic Greymouth
Whanganui Wanganui Hospital Gynaecology Clinic – Good Health Wanganui
* Assignment of specific facilities to a DHB was provided by the NCSP, in order to distinguish between DHB clinics and private practice, because the NCSP Register records geographic DHB and does not record public vs private clinic.

National Cervical Screening Programme – Monitoring Report – Number 52 Page 247
Appendix F – Glossary
Term Definition AGC Atypical glandular cells AIS Adenocarcinoma in situ. High-grade changes to the glandular (endocervical)
cells of the cervix ASC-H Atypical squamous cells of undetermined significance, cannot exclude high-
grade ASC-US Atypical squamous cells of undetermined significance ASR Age standardised rate CI Confidence interval CIN Cervical intra-epithelial neoplasia; CINI: low-grade; CIN 2 or 3: high-grade CIS Carcinoma in situ. An older classification of CIN 3. Abnormal cells that are
confined to the surface epithelium of the cervix. CPS Conventional Pap (Papanicolaou) Cytology sample DHB District Health Board European/ Other
European women and women from non-Māori, non-Pacific, and non-Asian ethnic groups
HPV Human papillomavirus HPV test Testing for a high risk (oncogenic) subtype of human papillomavirus hrHPV A high risk (oncogenic) subtype of human papillomavirus HSIL High-grade squamous intra-epithelial lesion ISC Invasive squamous carcinoma LBC Liquid based cytology LSIL Low-grade squamous intra-epithelial lesion NCSP National Cervical Screening Programme NHI National Health Index NILM Negative for intraepithelial lesion or malignancy (a negative cytology report) NSU National Screening Unit of the Ministry of Health NPV Negative predictive value. The proportion of the screened population with
negative test results who do not have the disease being tested for. OR Odds ratio PCR Polymerase chain reaction. A technique in molecular genetics used in many
types of HPV testing PPV Positive predictive value. The proportion of the screened population with
positive test results who have the disease being tested for. RR Relative risk SC Squamous cell carcinoma (TBS 2001) SCC Squamous cell carcinoma SNOMED Systematised Nomenclature of Medicine. A systematically organised collection
of medical terminology including histopathological diagnoses. TBS 2001 (New Zealand Modified)
The Bethesda System 2001 NZ Modified. A management system based on categorising the cytological interpretation of cellular abnormality as negative, low-grade or high-grade.
TZ Transformation zone. The region of the cervix where the glandular precursor cells change to squamous cells

National Cervical Screening Programme – Monitoring Report – Number 52 Page 248
References
1. Cleary L, Wright C. Estimating hysterectomy prevalence in New Zealand 2010-2018: Report on methods, 2018. 2. Gray A. Methodology for estimating hysterectomy prevalence in women 20-69. Wellington, New Zealand, 2011. 3. Aotearoa SNT. NZ.Stat. 2013. http://nzdotstat.stats.govt.nz/wbos/index.aspx. 4. National Screening Unit. Age range change for cervical screening. 7th June 2018 2018. https://www.nsu.govt.nz/health-professionals/national-cervical-screening-programme/age-range-change-cervical-screening (accessed 4th July 2018. 5. Simonella L, Lewis H, Smith M, Neal H, Bromhead C, Canfell K. The prevalence of type-specific oncogenic human papillomavirus infection in high grade cervical disease in New Zealand. BMC Infect Dis 2013; 13(114). 6. Smith JS, Lindsay L, Hoots B, et al. Human papillomavirus type distribution in invasive cervical cancer and high-grade cervical lesions: a meta-analysis update. Int J Cancer 2007; 121(3): 621-32. 7. Stevens MP, Garland SM, Tan JH, Quinn MA, Petersen RW, Tabrizi SN. HPV genotype prevalence in women with abnormal pap cytology samples in Melbourne, Australia. J Med Virol 2009; 81(7): 1283-91. 8. Brestovac B, Harnett GB, Smith DW, Shellam GR, Frost FA. Human papillomavirus genotypes and their association with cervical neoplasia in a cohort of Western Australian women. J Med Virol 2005; 76(1): 106-10. 9. Porras C, Rodriguez AC, Hildesheim A, et al. Human papillomavirus types by age in cervical cancer precursors: predominance of human papillomavirus 16 in young women. Cancer Epidemiol Biomarkers Prev 2009; 18(3): 863-5. 10. Baandrup L, Munk C, Andersen KK, Junge J, Iftner T, Kjaer SK. HPV16 is associated with younger age in women with cervical intraepithelial neoplasia grade 2 and 3. Gynecol Oncol 2012; 124(2): 281-5. 11. Miyamoto J, Berkowitz Z, Unger E, et al. Vaccine-type HPV distribution in CIN3/AIS: 3 U.S. cancer registries, 1994-2005. International Papillomavirus Conference and Clinical Workshop; 2011 17-22/9/2011; Berlin, Germany; 2011. 12. Ahmad OB, Boschi-Pinto C, Lopez AD, Murray CJL, Lozano R, Inoue M. Age standardization of rates: A new WHO standard. Geneva: World Health Organization; 2001. 13. Sherwood J, Borman A, Scullion L, Gray R. Sexually Transmitted Infections in New Zealand: Annual Surveillance Report 2016. Porirua, New Zealand, 2019. 14. Drolet M, Bénard É, Pérez N, et al. Population-level impact and herd effects following the introduction of human papillomavirus vaccination programmes: updated systematic review and meta-analysis. Lancet 2019; 394(10197): 497-509. 15. National Cervical Screening Programme. NCSP Operational Policy and Quality Standards, Section 5. 16. National Cervical Screening Programme. Bethesda 2001 (NZ Modified) codes for Cytology Laboratories: Codes, descriptors and assessment of sample adequacy for cytology laboratories. Wellington, 2014. 17. Ministry of Health. Report of the Parliamentary Review Committee regarding the New Zealand Cervical Screening Programme Wellington: Ministry of Health, 2011. 18. Parliamentary Review Committee. Report of the Parliamentary Review Committee regarding the New Zealand Cervical Screening Programme, June 2015. Wellington, 2015. 19. National Screening Unit. Guidelines for Cervical Screening in New Zealand: Incorporating the management of women with abnormal cervical cytology samples. Wellington: National Screening Unit, Ministry of Health, 2008. 20. Smith M, Walker R, Canfell K. National Cervical Screening Programme Monitoring Report Number 33. Wellington, 2012. 21. Smith M, Walker R, Canfell K. National Cervical Screening Programme Monitoring Report Number 34. Wellington, 2012.