Monitoring Report - Amazon S3
36
Monitoring Report Prepared on 12/1/2018. Investment Data as of 9/30/2018. Prepared By: Ennea Wealth Solutions, 1051 Perimeter Dr. #1110 Schaumburg, IL 60173 United States www.enneawealthsolutions.com 123-456-7890 This report has been created by your financial advisor under a license agreement with Fi360, Inc. Your financial advisor and Fi360 are not affiliated. This report is designed to provide performance data and other information regarding a portfolio of investments. Your financial advisor is solely responsible for any advice or recommendations provided. In some cases, this portfolio may be an investment option that is available (or proposed to be made available) in a defined contribution plan. To the extent that this report is used by the financial advisor with respect to any defined contribution plan, any such use, advice, or recommendation is solely the responsibility of such financial advisor, including advice or recommendations as to the suitability of any investment options for the defined contribution plan. Please see important disclosures in the Statement of Additional Disclosures. Investors should consider the investment objectives, risks, charges, and expenses of a fund before investing. Prospectuses containing this and other information about the underlying funds included in a portfolio are available by contacting your financial advisor. Please read the prospectus carefully before investing to make sure that the fund is appropriate for your goals and risk tolerance. Past performance is no guarantee of future results. Any asset and/or fund expense information contained in this report is based on information provided to your financial advisor by your plan administrator/record-keeper. While we believe this information to be reliable, its accuracy and completeness are not guaranteed. The actual value of these assets may differ from that shown. You should contact your plan administrator/record-keeper for additional information. Some data in this report was obtained from third parties. Although Fi360 obtains data from sources it deems to be reliable, it does not independently verify the data, and does not warrant or represent that the data is timely, complete, or accurate. Investment and insurance products: NOT FDIC-INSURED / NO Bank Guarantee / MAY Lose Value
-
Upload
khangminh22 -
Category
Documents
-
view
0 -
download
0
Transcript of Monitoring Report - Amazon S3
Monitoring ReportPrepared on 12/1/2018. Investment Data as of 9/30/2018.
Prepared By:
Ennea Wealth Solutions, 1051 Perimeter Dr. #1110Schaumburg, IL 60173 United States
www.enneawealthsolutions.com 123-456-7890
This report has been created by your financial advisor under a license agreement with Fi360, Inc. Your financial advisor and Fi360 are not affiliated. This report is designed to provide performance data and other information regarding a portfolio of investments. Your financial advisor is solely responsible for any advice or recommendations provided. In some cases, this portfolio may be an investment option that is available (or proposed to be made available) in a defined contribution plan. To the extent that this report is used by the financial advisor with respect to any defined contribution plan, any such use, advice, or recommendation is solely the responsibility of such financial advisor, including advice or recommendations as to the suitability of any investment options for the defined contribution plan.
Please see important disclosures in the Statement of Additional Disclosures. Investors should consider the investment objectives, risks, charges, and expenses of a fund before investing. Prospectuses containing this and other information about the underlying funds included in a portfolio are available by contacting your financial advisor. Please read the prospectus carefully before investing to make sure that the fund is appropriate for your goals and risk tolerance. Past performance is no guarantee of future results.
Any asset and/or fund expense information contained in this report is based on information provided to your financial advisor by your plan administrator/record-keeper. While we believe this information to be reliable, its accuracy and completeness are not guaranteed. The actual value of these assets may differ from that shown. You should contact your plan administrator/record-keeper for additional information.
Some data in this report was obtained from third parties. Although Fi360 obtains data from sources it deems to be reliable, it does not independently verify the data, and does not warrant or represent that the data is timely, complete, or accurate.
Investment and insurance products: NOT FDIC-INSURED / NO Bank Guarantee / MAY Lose Value

Client Monitoring ReportInvestment Data as of 9/30/2018. Account holdings as of 9/30/2018.
Please see important disclosures in the Statement of Additional Disclosures. © 2018, Fi360. All rights reserved. The analysis and opinions generated by Fi360 do not constitute professional investment advice and are provided solely for informational purposes.
For CLIENT_NAME
STATE OF AFFAIRS
ASSET ALLOCATION
INVESTMENTS ON WATCH
INVESTMENTS ON WATCH
WEIGHTED AVERAGE Fi360 FIDUCIARY SCORE®
WEIGHTED AVERAGE NET EXP RATIO
IPS ALIGNMENT WARNINGS
2 18 / 100 10.77 %
The Fi360 Fiduciary Score® is a peer percentile ranking of an investment against a set of quantitative due diligence criteria selected to re�ect pruden��duciary management. All Scores are color coded based on the quartile they fall in (1st - Green; 2nd - Light Green; 3rd - Yellow; 4th - Red).
INVESTMENT CHANGES
BROAD ASSET CLASS # INVESTMENTS $ ASSETS % OF TOTAL ASSETS
U.S. Equity 5 407,839 81.12
Taxable Bond 1 94,910 18.88
TOTAL 7 502,749 100
INVESTMENT NAME TICKER PEER GROUPFi360
FIDUCIARY SCORE® $ ASSETS% OF
TOTAL ASSETS
iShares Intermediate Govt/Crdt Bd ETF GVI Intermediate Term Bond 80 94,910 18.88
Vanguard Dividend Growth Inv VDIFX Blend 52 3,795 0.75
INVESTMENT NAME TICKER PEER GROUPFi360
FIDUCIARY SCORE®
iShares Intermediate Govt/Crdt Bd ETF GVI Intermediate Term Bond 80
American Funds Govt. Credit Bond AFGIX Intermediate Term Bond 10
Pioneer Bond A PTDOX Intermediate Term Bond 3
Vanguard Total Return Bond VDIFX Intermediate Term Bond 8
Replacement options for iShares Intermediate Govt/Crdt Bd ETF
Page 2 of 36
Please see important disclosures in the Statement of Additional Disclosures. © 2018, Fi360, Inc. All rights reserved. The analysis and opinionsgenerated by Fi360, Inc. do not constitute professional investment advice and are provided solely for information purposes.
Client Monitoring ReportInvestment Data as of 9/30/2018. Account holdings as of 9/30/2018.
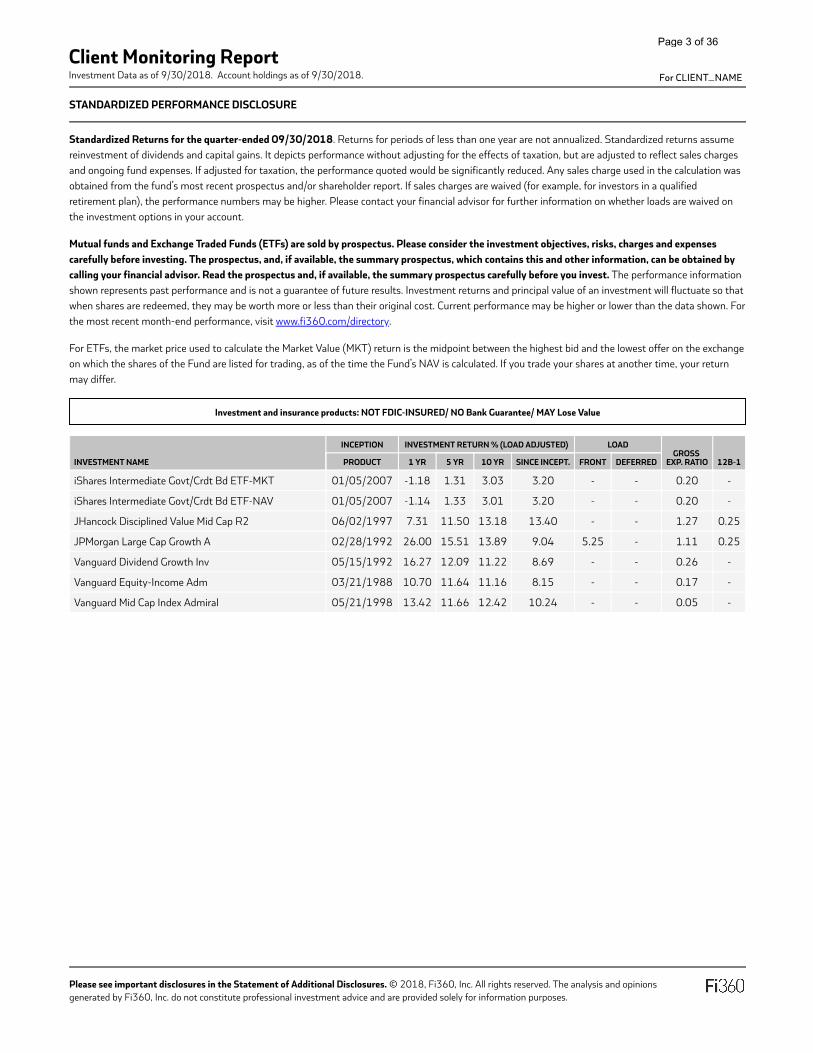
STANDARDIZED PERFORMANCE DISCLOSURE
Standardized Returns for the quarter-ended 09/30/2018. Returns for periods of less than one year are not annualized. Standardized returns assumereinvestment of dividends and capital gains. It depicts performance without adjusting for the effects of taxation, but are adjusted to reflect sales chargesand ongoing fund expenses. If adjusted for taxation, the performance quoted would be significantly reduced. Any sales charge used in the calculation wasobtained from the fund’s most recent prospectus and/or shareholder report. If sales charges are waived (for example, for investors in a qualifiedretirement plan), the performance numbers may be higher. Please contact your financial advisor for further information on whether loads are waived onthe investment options in your account.
Mutual funds and Exchange Traded Funds (ETFs) are sold by prospectus. Please consider the investment objectives, risks, charges and expensescarefully before investing. The prospectus, and, if available, the summary prospectus, which contains this and other information, can be obtained bycalling your financial advisor. Read the prospectus and, if available, the summary prospectus carefully before you invest. The performance informationshown represents past performance and is not a guarantee of future results. Investment returns and principal value of an investment will fluctuate so thatwhen shares are redeemed, they may be worth more or less than their original cost. Current performance may be higher or lower than the data shown. Forthe most recent month-end performance, visit www.fi360.com/directory.
For ETFs, the market price used to calculate the Market Value (MKT) return is the midpoint between the highest bid and the lowest offer on the exchangeon which the shares of the Fund are listed for trading, as of the time the Fund’s NAV is calculated. If you trade your shares at another time, your returnmay differ.
Investment and insurance products: NOT FDIC-INSURED/ NO Bank Guarantee/ MAY Lose Value
INVESTMENT NAME
INCEPTION INVESTMENT RETURN % (LOAD ADJUSTED) LOADGROSS
EXP. RATIO 12B-1PRODUCT 1 YR 5 YR 10 YR SINCE INCEPT. FRONT DEFERRED
iShares Intermediate Govt/Crdt Bd ETF-MKT 01/05/2007 -1.18 1.31 3.03 3.20 - - 0.20 -
iShares Intermediate Govt/Crdt Bd ETF-NAV 01/05/2007 -1.14 1.33 3.01 3.20 - - 0.20 -
JHancock Disciplined Value Mid Cap R2 06/02/1997 7.31 11.50 13.18 13.40 - - 1.27 0.25
JPMorgan Large Cap Growth A 02/28/1992 26.00 15.51 13.89 9.04 5.25 - 1.11 0.25
Vanguard Dividend Growth Inv 05/15/1992 16.27 12.09 11.22 8.69 - - 0.26 -
Vanguard Equity-Income Adm 03/21/1988 10.70 11.64 11.16 8.15 - - 0.17 -
Vanguard Mid Cap Index Admiral 05/21/1998 13.42 11.66 12.42 10.24 - - 0.05 -
group@@@IlN0YW5kYXJkaXplZCBQZXJmb3JtYW5jZSBEaXNjbG9zdXJlIg==@@@
For CLIENT_NAME
Page 3 of 36

Client Monitoring ReportInvestment Data as of 9/30/2018. Account holdings as of 9/30/2018.
Please see important disclosures in the Statement of Additional Disclosures. © 2018, Fi360. All rights reserved. The analysis and opinions generated by Fi360 do not constitute professional investment advice and are provided solely for informational purposes.
For CLIENT_NAME
MARKET PERFORMANCE OVERVIEW
Mutual funds and Exchange Traded Funds (ETFs) are sold by prospectus. Please consider the investment objectives, risks, charges and expenses carefully before investing. The prospectus, and, if available, the summary prospectus, which contains this and other information, can be obtained by calling you��nancial advisor. Read the prospectus and, if available, the summary prospectus carefully before you invest.The performance information shown represents past performance for the median mutual fund/etf manager in each peer group and is not a guarantee of future results. Investment returns and principal value of an investment wil��uctuate so that when shares are redeemed, they may be worth more or less than their original cost. The performance information shown re�ects performance without adjusting for sales charges. If adjusted, the load would reduce the performance quoted. Current performance may be higher or lower than the data shown. For the most recent month-end performance, visit www.�360.com/directory.
For each time period, the three peer groups with the highest median returns will be colored in shades of green (darkest being the highest return). The three peer groups with the lowest median returns will be colored in shades of blue (darkest being the lowest return).
EQUITY
MF/ETF PEER GROUP MEDIAN RETURNS 1-MO QTR 1YR 3YR 5 YR 10YR
Large Value 4.91 2.71 11.15 9.34 9.79 8.82
Large Growth 7.29 10.26 20.69 12.54 14.09 10.90
Large Blend 6.26 5.51 14.98 10.92 11.82 9.76
Mid-Cap Value 4.45 2.96 9.33 8.73 9.42 9.36
Mid-Cap Growth 6.62 8.60 18.59 10.12 11.61 10.05
Mid-Cap Blend 5.51 4.05 12.34 8.88 10.18 9.84
Small Value 6.97 4.91 12.92 10.63 9.43 9.74
Small Growth 8.82 12.33 22.36 11.13 11.71 11.01
Small Blend 7.84 7.48 16.18 10.78 10.28 9.96
Foreign Large Blend -1.22 -0.92 5.44 4.98 5.41 3.24
World Large Stock 2.87 2.50 10.20 8.20 8.79 6.75
FIXED INCOME
MF/ETF PEER GROUP MEDIAN RETURNS 1-MO QTR 1YR 3YR 5 YR 10YR
Money Market Taxable 0.33 0.71 1.00 0.39 0.23 0.18
Short-Term Bond 0.45 0.05 0.15 1.05 1.12 2.24
Intermediate-Term Bond 0.53 -1.57 -0.87 1.48 2.22 4.14
Intermediate Government 0.42 -1.41 -1.33 0.41 1.36 3.25
Long-Term Bond 0.89 -4.13 -0.43 3.99 5.28 6.87
High Yield Bond 1.15 0.75 1.94 4.67 4.28 6.93
World Bond -1.34 -1.34 -0.40 2.53 1.66 3.61
Page 4 of 36

Client Monitoring ReportInvestment Data as of 9/30/2018. Account holdings as of 9/30/2018.
Please see important disclosures in the Statement of Additional Disclosures. © 2018, Fi360. All rights reserved. The analysis and opinions generated by Fi360 do not constitute professional investment advice and are provided solely for informational purposes.
For CLIENT_NAME
HOLDINGS SUMMARY
LARGE BLEND
INVESTMENT NAME TYPE TICKER WATCH LIST STATUS $ ASSETS % OF TOTAL ASSETS
Vanguard Dividend Growth Inv MF VDIFX OFF 3,795 0.75
LARGE GROWTH
INVESTMENT NAME TYPE TICKER WATCH LIST STATUS $ ASSETS % OF TOTAL ASSETS
JPMorgan Large Cap Growth A MF JPMIX OFF 265,581 52.83
LARGE VALUE
INVESTMENT NAME TYPE TICKER WATCH LIST STATUS $ ASSETS % OF TOTAL ASSETS
Vanguard Equity-Income Adm MF VEIRX OFF 12,840 2.55
MID-CAP BLEND
INVESTMENT NAME TYPE TICKER WATCH LIST STATUS $ ASSETS % OF TOTAL ASSETS
JHancock Disciplined Value Mid Cap R2 MF JVMSX ON 57,032 11.34
Vanguard Mid Cap Index Admiral MF VIMAX OFF 68,591 13.64
125,623 24.99
INTERMEDIATE TERM BOND
INVESTMENT NAME TYPE TICKER WATCH LIST STATUS $ ASSETS % OF TOTAL ASSETS
iShares Intermediate Govt/Crdt Bd ETF MF GVI ON 94,910 18.88
INVESTMENTS ON WATCH TOTAL ASSETS
2$502,749INVESTMENTS
6
Page 5 of 36

Please see important disclosures in the Statement of Additional Disclosures. © 2018, Fi360. All rights reserved. The analysis and opinions generated by Fi360 do not constitute professional investment advice and are provided solely for informational purposes.
STYLE SUMMARY
U.S. EQUITY
TARGET DATE FUNDS
INTERNATIONAL EQUITY FIXED INCOME
1 1 1
LAR
GE
1 1
MED
IUM
SMAL
L
VALUE BLEND GROWTH
LAR
GE
MED
IUM
SMAL
L
VALUE BLEND GROWTH
HIG
H
1
MED
IUM
LOW
LTD MOD EXT
TARGET DATE YEAR # INVESTMENTS
2000-2010 -
2015 -
2020 -
2025 -
2030 -
2035 -
2040 -
2045 -
2050 -
2055 -
2060+ -
Retirement -
OTHER STYLE CATEGORIES
This section groups each investment into a style category. The top charts show the # of investments grouped by their current Morningstar Style Box. The bottom tables include investments within other style categories based on their current peer group. The Morningstar Style Box™ is a nine-square grid that provides a graphical representation of the investment style of mutual funds, exchange traded funds, group retirement plan annuities, variable annuity sub-accounts and separately managed accounts. US and Intl. equities are classified according to market capitalization (the vertical axis) and growth and value factors (the horizontal axis). Fixed income funds are classified according to credit quality of the long bonds owned (the vertical axis) and interest rate sensitivity as measured by a bond’s effective duration (the horizontal axis).
STYLE CATEGORY # INVESTMENTS
Allocation -
Alternative -
Commodities -
Money Market -
Sector Equity -
Stable Value -
Client Monitoring ReportInvestment Data as of 9/30/2018. Account holdings as of 9/30/2018. For CLIENT_NAME
Page 6 of 36

Please see important disclosures in the Statement of Additional Disclosures. © 2018, Fi360. All rights reserved. The analysis and opinions generated by Fi360 do not constitute professional investment advice and are provided solely for informational purposes.
STYLE DETAILS
U.S. EQUITY
INVESTMENT NAME TICKER PEER GROUP STYLE BOX $ ASSETS % OF TOTAL ASSETS
Vanguard Dividend Growth Inv VDIFX Large Blend Large Blend 3,795 0.75
JPMorgan Large Cap Growth A JPMIX Large Growth Large Growth 265,581 52.83
Vanguard Equity-Income Adm VEIRX Large Value Large Value 12,840 2.55
JHancock Disciplined Value Mid Cap R2
JVMSX Mid-Cap Blend Mid-Cap Value 57,032 11.34
Vanguard Mid Cap Index Admiral VIMAX Mid-Cap Blend Mid-Cap Blend 68,591 13.64
407,839 81.22
FIXED INCOME
INVESTMENT NAME TICKER PEER GROUP STYLE BOX $ ASSETS % OF TOTAL ASSETS
iShares Intermediate Govt/Crdt Bd ETF
GVI Intermediate Term Bond High Qual Ltd Dura 94,910 18.88
Client Monitoring ReportInvestment Data as of 9/30/2018. Account holdings as of 9/30/2018. For CLIENT_NAME
Page 7 of 36
Please see important disclosures in the Statement of Additional Disclosures. © 2018, Fi360. All rights reserved. The analysis and opinions generated by Fi360 do not constitute professional investment advice and are provided solely for informational purposes.
Sample Client Name
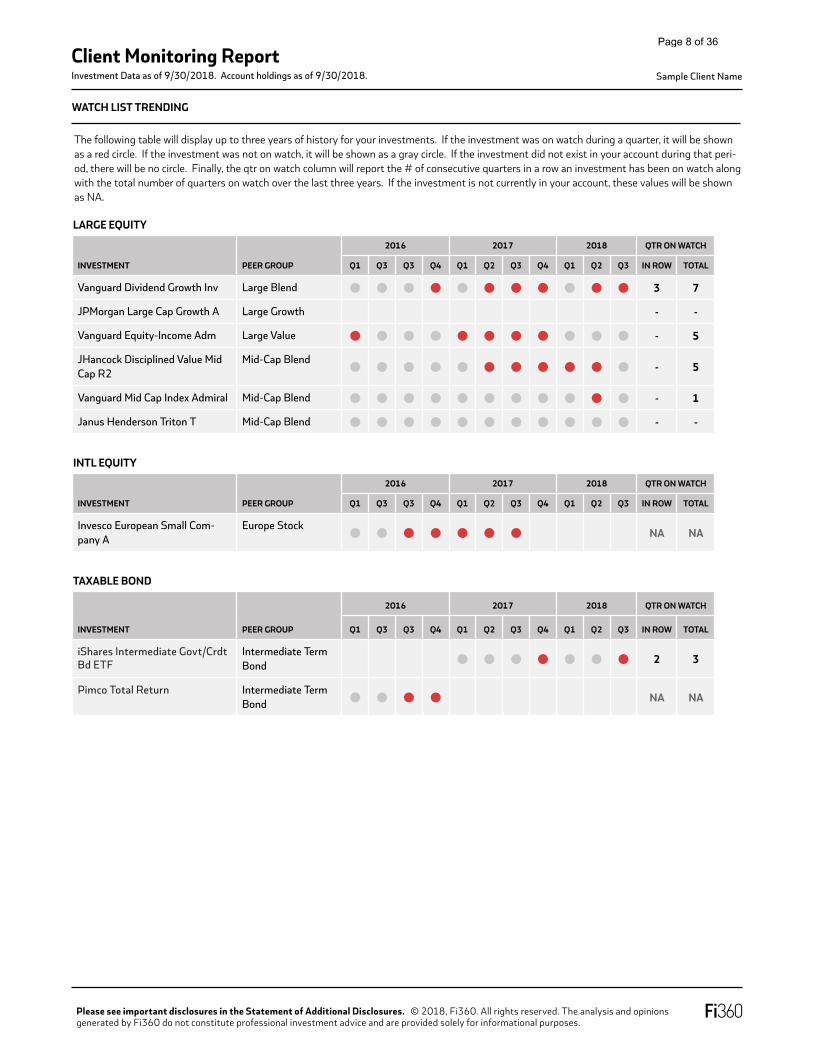
WATCH LIST TRENDING
LARGE EQUITY
INVESTMENT PEER GROUP
2016 2017 2018 QTR ON WATCH
Q1 Q3 Q3 Q4 Q1 Q2 Q3 Q4 Q1 Q2 Q3 IN ROW TOTAL
Vanguard Dividend Growth Inv Large Blend 3 7
JPMorgan Large Cap Growth A Large Growth - -
Vanguard Equity-Income Adm Large Value - 5
JHancock Disciplined Value Mid Cap R2
Mid-Cap Blend - 5
Vanguard Mid Cap Index Admiral Mid-Cap Blend - 1
Janus Henderson Triton T Mid-Cap Blend - -
INTL EQUITY
INVESTMENT PEER GROUP
2016 2017 2018 QTR ON WATCH
Q1 Q3 Q3 Q4 Q1 Q2 Q3 Q4 Q1 Q2 Q3 IN ROW TOTAL
Invesco European Small Com-pany A
Europe Stock NA NA
TAXABLE BOND
INVESTMENT PEER GROUP
2016 2017 2018 QTR ON WATCH
Q1 Q3 Q3 Q4 Q1 Q2 Q3 Q4 Q1 Q2 Q3 IN ROW TOTAL
iShares Intermediate Govt/Crdt Bd ETF
Intermediate Term Bond 2 3
Pimco Total Return Intermediate Term Bond NA NA
The following table will display up to three years of history for your investments. If the investment was on watch during a quarter, it will be shown as a red circle. If the investment was not on watch, it will be shown as a gray circle. If the investment did not exist in your account during that peri-od, there will be no circle. Finally, the qtr on watch column will report the # of consecutive quarters in a row an investment has been on watch along with the total number of quarters on watch over the last three years. If the investment is not currently in your account, these values will be shown as NA.
Client Monitoring ReportInvestment Data as of 9/30/2018. Account holdings as of 9/30/2018.
Page 8 of 36

Client Monitoring ReportInvestment Data as of 9/30/2018. Account holdings as of 9/30/2018.
Please see important disclosures in the Statement of Additional Disclosures. © 2018, Fi360. All rights reserved. The analysis and opinions generated by Fi360 do not constitute professional investment advice and are provided solely for informational purposes.
For CLIENT_NAME
WATCH LIST SUMMARY
TAXABLE BOND
INVESTMENT NAME REQ R1 R3 R5 STATUS
iShares Intermediate Govt/Crdt Bd ETF 1 ON
All of following criteria are required for the investment to pass (REQ):
LABEL DATA POINT THRESHOLD
R1 1 YR Return - % Rank Top 25% of peer
R3 3 YR Return - % Rank Top 25% of peer
R5 5 YR Return - % Rank Top 25% of peer
CRITERIA FOR: PASSIVE
US EQUITY
INVESTMENT NAME REQ MT FLEX R1 R3 R5 SH ER FLEX r2 YS NA STATUS
Vanguard Dividend Growth Inv 1 3 2 OFF
JPMorgan Large Cap Growth A 1 5 3 OFF
Vanguard Equity-Income Adm 1 3 2 OFF
JHancock Disciplined Value Mid Cap R2 0 4 1 ON
Vanguard Mid Cap Index Admiral 1 5 3 OFF
All of the following criteria are required for the investment to pass (REQ):
LABEL DATA POINT THRESHOLD
MT Manager Tenure > 3 Years
3 of the 5 following criteria are required for the investment to pass (FLEX):
LABEL DATA POINT THRESHOLD
R1 1 YR Return - % Rank Top 25% of peer
R3 3 YR Return - % Rank Top 25% of peer
R5 5 YR Return - % Rank Top 25% of peer
SH Sharpe 3YR - % Rank Top 50% of peer
ER Prospectus Net Expense Ratio - % Rank Top 50% of peer
2 of the 3 following criteria are required for the investment to pass (FLEX):
LABEL DATA POINT THRESHOLD
r2 R-Squared 3YR - % Rank Top 25% of peer
YS Years Since Inception Top 25% of peer
NA Net Assets (mil) Top 25% of peer
Client Monitoring ReportInvestment Data as of 9/30/2018. Account holdings as of 9/30/2018.
Each investment will be evaluated against the watch list criteria applicable to its investment type (active, passive, target date or money market/stable value). Each criteria section outlines the investment type(s) it is applied against along with the data points being evaluated and their corresponding thresholds. Any groups within the criteria will be displayed along with the respective number of criteria needed to pass within that group. The criteria label can be used as quick reference when looking at the subsequent investment table which will display a check or x for each criteria. Also within the investment table, the number of passed criteria for each required (REQ) and/or flexible (FLEX) group will be displayed. Finally, the status column in the investment table indicates the overall watch list status for the investment based on the criteria and any qualitative decisions.
Page 9 of 36
Client Monitoring ReportInvestment Data as of 9/30/2018. Account holdings as of 9/30/2018.
Please see important disclosures in the Statement of Additional Disclosures. © 2018, Fi360. All rights reserved. The analysis and opinions generated by Fi360 do not constitute professional investment advice and are provided solely for informational purposes.
For CLIENT_NAME
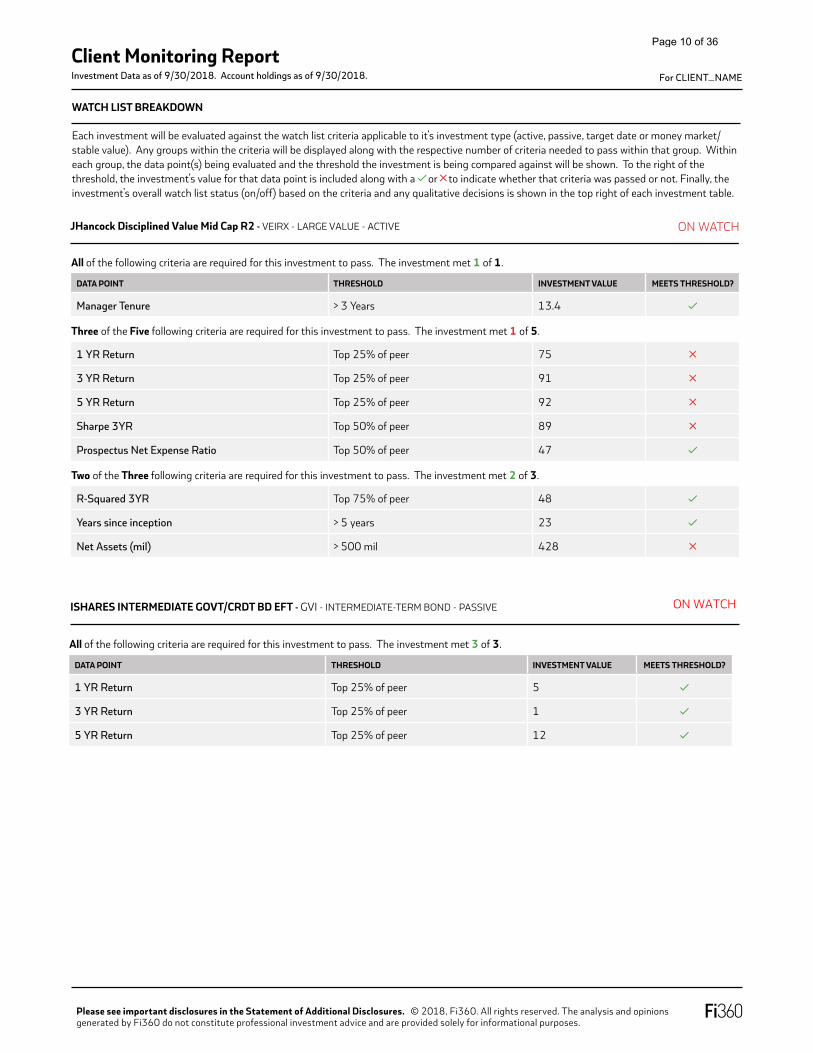
WATCH LIST BREAKDOWN
JHancock Disciplined Value Mid Cap R2 - VEIRX - LARGE VALUE - ACTIVE
ISHARES INTERMEDIATE GOVT/CRDT BD EFT - GVI - INTERMEDIATE-TERM BOND - PASSIVE
All of the following criteria are required for this investment to pass. The investment met 3 of 3.
DATA POINT THRESHOLD INVESTMENT VALUE MEETS THRESHOLD?
1 YR Return Top 25% of peer 5
3 YR Return Top 25% of peer 1
5 YR Return Top 25% of peer 12
ON WATCH
ON WATCH
All of the following criteria are required for this investment to pass. The investment met 1 of 1.
DATA POINT THRESHOLD INVESTMENT VALUE MEETS THRESHOLD?
Manager Tenure > 3 Years 13.4
Three of the Five following criteria are required for this investment to pass. The investment met 1 of 5.
1 YR Return Top 25% of peer 75
3 YR Return Top 25% of peer 91
5 YR Return Top 25% of peer 92
Sharpe 3YR Top 50% of peer 89
Prospectus Net Expense Ratio Top 50% of peer 47
Two of the Three following criteria are required for this investment to pass. The investment met 2 of 3.
R-Squared 3YR Top 75% of peer 48
Years since inception > 5 years 23
Net Assets (mil) > 500 mil 428
Each investment will be evaluated against the watch list criteria applicable to it’s investment type (active, passive, target date or money market/stable value). Any groups within the criteria will be displayed along with the respective number of criteria needed to pass within that group. Within each group, the data point(s) being evaluated and the threshold the investment is being compared against will be shown. To the right of the threshold, the investment’s value for that data point is included along with a or to indicate whether that criteria was passed or not. Finally, the investment’s overall watch list status (on/off) based on the criteria and any qualitative decisions is shown in the top right of each investment table.
Page 10 of 36
Please see important disclosures in the Statement of Additional Disclosures. © 2018, Fi360, Inc. All rights reserved. The analysis and opinionsgenerated by Fi360, Inc. do not constitute professional investment advice and are provided solely for information purposes.
Client Monitoring ReportInvestment Data as of 09/30/2018. Account holdings as of 9/30/2018..
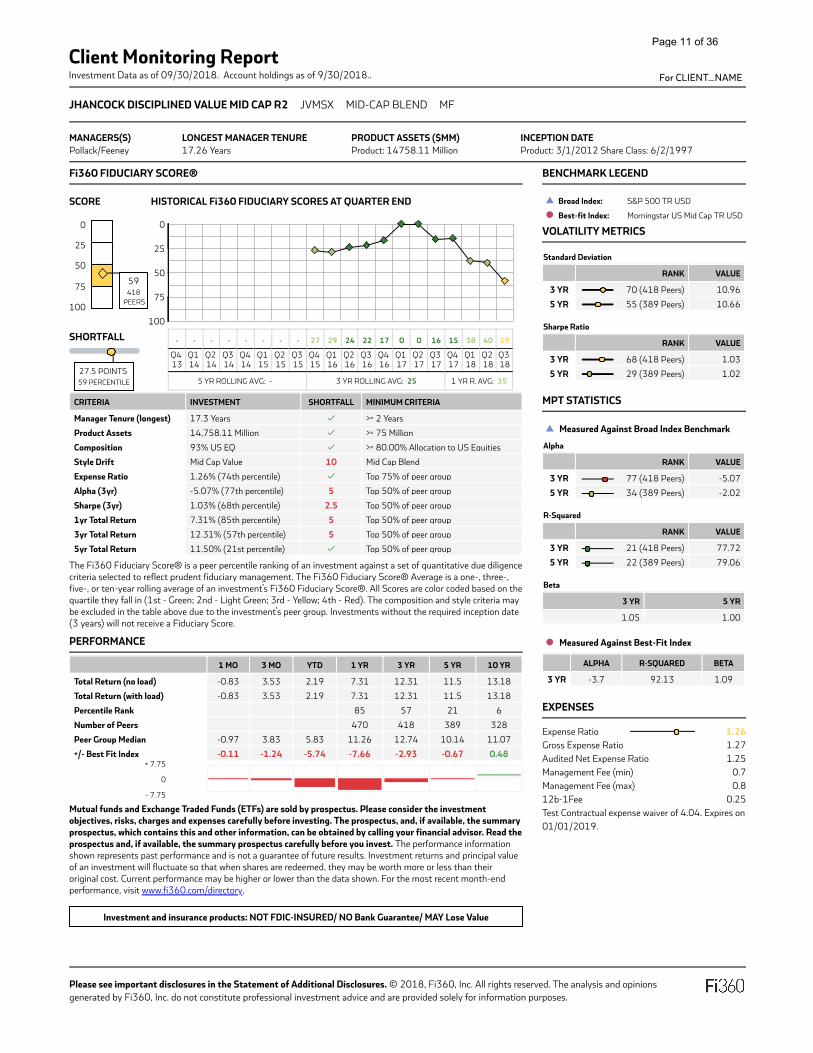
JHANCOCK DISCIPLINED VALUE MID CAP R2 JVMSX MID-CAP BLEND MF
Fi360 FIDUCIARY SCORE®
CRITERIA INVESTMENT SHORTFALL MINIMUM CRITERIA
Manager Tenure (longest) 17.3 Years >= 2 Years
Product Assets 14,758.11 Million >= 75 Million
Composition 93% US EQ >= 80.00% Allocation to US Equities
Style Drift Mid Cap Value 10 Mid Cap Blend
Expense Ratio 1.26% (74th percentile) Top 75% of peer group
Alpha (3yr) -5.07% (77th percentile) 5 Top 50% of peer group
Sharpe (3yr) 1.03% (68th percentile) 2.5 Top 50% of peer group
1yr Total Return 7.31% (85th percentile) 5 Top 50% of peer group
3yr Total Return 12.31% (57th percentile) 5 Top 50% of peer group
5yr Total Return 11.50% (21st percentile) Top 50% of peer group
The Fi360 Fiduciary Score® is a peer percentile ranking of an investment against a set of quantitative due diligencecriteria selected to reflect prudent fiduciary management. The Fi360 Fiduciary Score® Average is a one-, three-,five-, or ten-year rolling average of an investment’s Fi360 Fiduciary Score®. All Scores are color coded based on thequartile they fall in (1st - Green; 2nd - Light Green; 3rd - Yellow; 4th - Red). The composition and style criteria maybe excluded in the table above due to the investment’s peer group. Investments without the required inception date(3 years) will not receive a Fiduciary Score.
PERFORMANCE
1 MO 3 MO YTD 1 YR 3 YR 5 YR 10 YR
Total Return (no load) -0.83 3.53 2.19 7.31 12.31 11.5 13.18
Total Return (with load) -0.83 3.53 2.19 7.31 12.31 11.5 13.18
Percentile Rank 85 57 21 6
Number of Peers 470 418 389 328
Peer Group Median -0.97 3.83 5.83 11.26 12.74 10.14 11.07
+/- Best Fit Index -0.11 -1.24 -5.74 -7.66 -2.93 -0.67 0.48+ 7.75
0
- 7.75
Mutual funds and Exchange Traded Funds (ETFs) are sold by prospectus. Please consider the investmentobjectives, risks, charges and expenses carefully before investing. The prospectus, and, if available, the summaryprospectus, which contains this and other information, can be obtained by calling your financial advisor. Read theprospectus and, if available, the summary prospectus carefully before you invest. The performance informationshown represents past performance and is not a guarantee of future results. Investment returns and principal valueof an investment will fluctuate so that when shares are redeemed, they may be worth more or less than theiroriginal cost. Current performance may be higher or lower than the data shown. For the most recent month-endperformance, visit www.fi360.com/directory.
Investment and insurance products: NOT FDIC-INSURED/ NO Bank Guarantee/ MAY Lose Value
BENCHMARK LEGEND
VOLATILITY METRICS
Standard Deviation
RANK VALUE
3 YR 70 (418 Peers) 10.96
5 YR 55 (389 Peers) 10.66
Sharpe Ratio
RANK VALUE
3 YR 68 (418 Peers) 1.03
5 YR 29 (389 Peers) 1.02
MPT STATISTICS
Measured Against Broad Index Benchmark
Alpha
RANK VALUE
3 YR 77 (418 Peers) -5.07
5 YR 34 (389 Peers) -2.02
R-Squared
RANK VALUE
3 YR 21 (418 Peers) 77.72
5 YR 22 (389 Peers) 79.06
Beta
3 YR 5 YR
1.05 1.00
Measured Against Best-Fit Index
ALPHA R-SQUARED BETA
3 YR -3.7 92.13 1.09
EXPENSES
Expense Ratio 1.26Gross Expense Ratio 1.27Audited Net Expense Ratio 1.25Management Fee (min)Management Fee (max) 0.812b-1Fee 0.25Test Contractual expense waiver of 4.04. Expires on01/01/2019.
group@@@IjxkaXYgY2xhc3M9XCJmbGV4LWNvbnRhaW5lclwiPjxkaXYgY2xhc3M9XCJvdmVyZmxvdy1lbGxpcHNpc1wiIHN0eWxlPVwibWF4LXdpZHRoOjQwMHB4O1wiPkpIYW5jb2NrIERpc2NpcGxpbmVkIFZhbHVlIE1pZCBDYXAgUjI8L2Rpdj48ZGl2PiZlbXNwOzwvZGl2PjxkaXYgY2xhc3M9XCJvdmVyZmxvdy1lbGxpcHNpcyBmb250LXdlaWdodC1ub3JtYWxcIiBzdHlsZT1cIm1heC13aWR0aDo5MHB4O1wiPkpWTVNYPC9kaXY+PGRpdj4mZW1zcDs8L2Rpdj48ZGl2IGNsYXNzPVwiZm9udC13ZWlnaHQtbm9ybWFsXCI+TWlkLUNhcCBCbGVuZDwvZGl2PjxkaXY+JmVtc3A7PC9kaXY+PGRpdiBjbGFzcz1cImZvbnQtd2VpZ2h0LW5vcm1hbFwiPk1GPC9kaXY+PC9kaXY+Ig==@@@MANAGERS(S)Pollack/Feeney
LONGEST MANAGER TENURE17.26 Years
PRODUCT ASSETS ($MM)Product: 14758.11 Million
INCEPTION DATEProduct: 3/1/2012 Share Class: 6/2/1997
SCORE
SHORTFALL
0
25
50
75
100
59418
PEERS
27.5 POINTS 59 PERCENTILE
HISTORICAL Fi360 FIDUCIARY SCORES AT QUARTER END
100
75
50
25
0
- - - - - - - - 27 29 24 22 17 0 0 16 15 38 40 59
Q4 13
Q1 14
Q2 14
Q3 14
Q4 14
Q1 15
Q2 15
Q3 15
Q4 15
Q1 16
Q2 16
Q3 16
Q4 16
Q1 17
Q2 17
Q3 17
Q4 17
Q1 18
Q2 18
Q3 18
5 YR ROLLING AVG: - 3 YR ROLLING AVG: 25 1 YR R. AVG: 35
Broad Index: S&P 500 TR USD
Best-fit Index: Morningstar US Mid Cap TR USD
0.7
For CLIENT_NAME
Page 11 of 36
Please see important disclosures in the Statement of Additional Disclosures. © 2018, Fi360, Inc. All rights reserved. The analysis and opinionsgenerated by Fi360, Inc. do not constitute professional investment advice and are provided solely for information purposes.
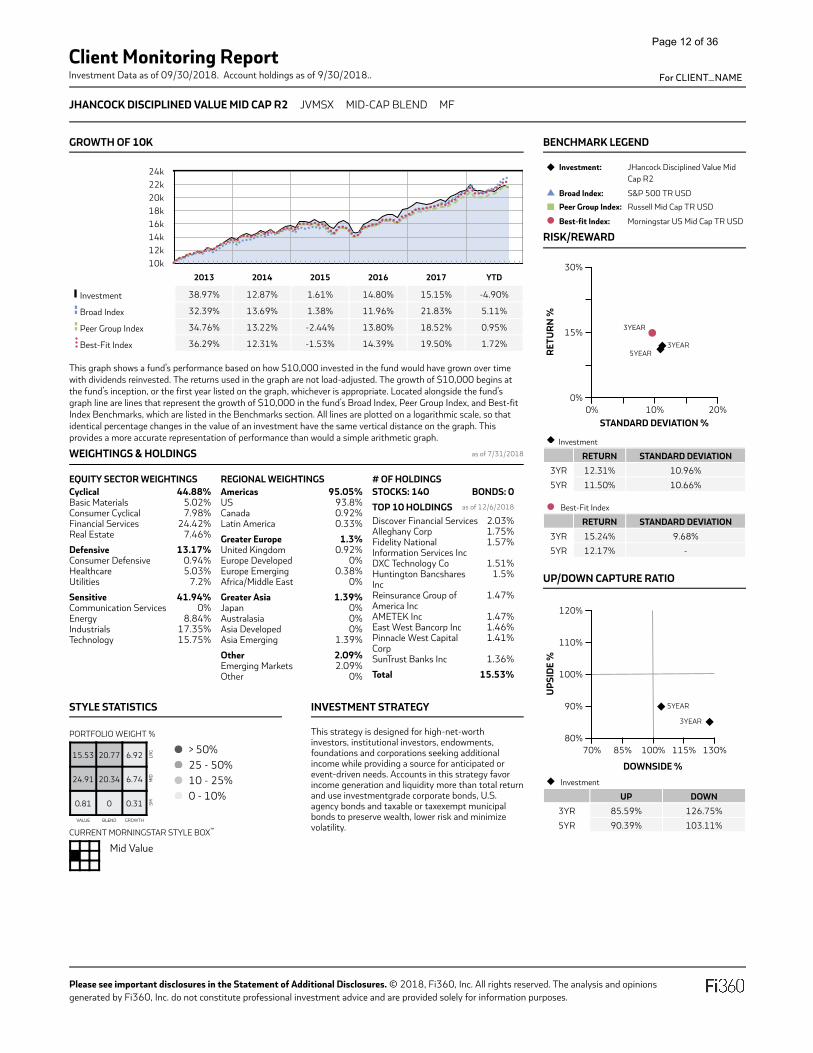
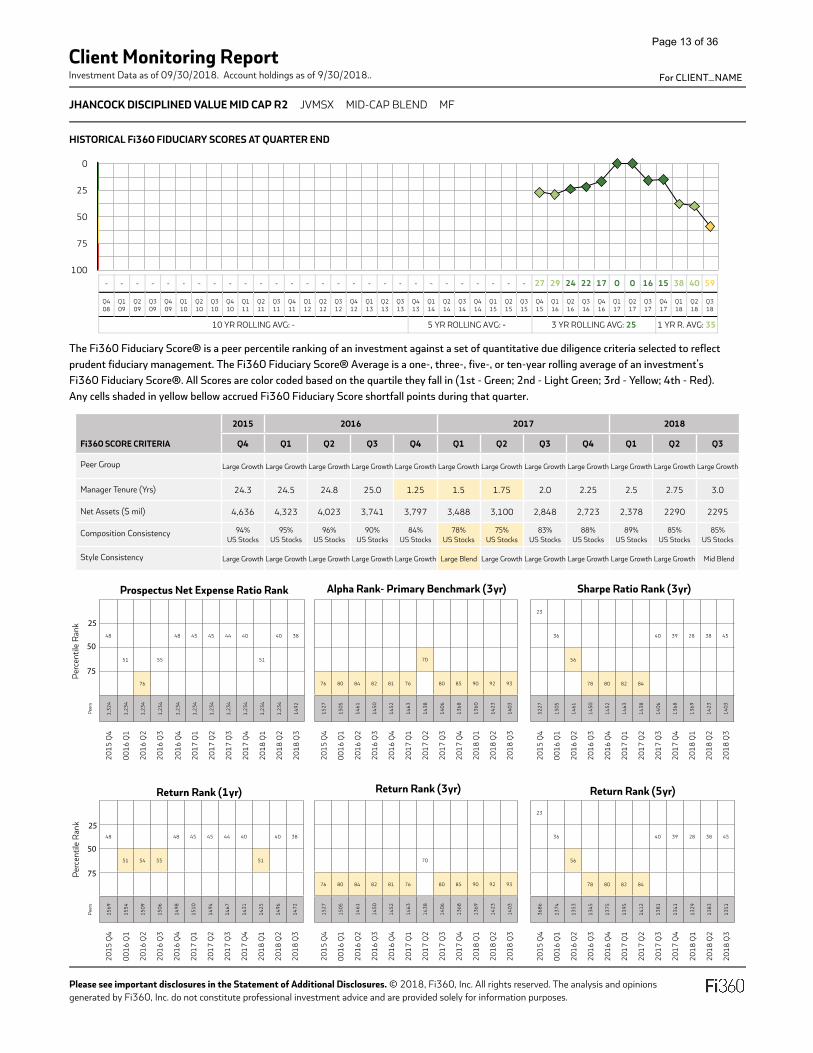
JHANCOCK DISCIPLINED VALUE MID CAP R2 JVMSX MID-CAP BLEND MF
GROWTH OF 10K
10k12k14k16k18k20k22k24k
2013 2014 2015 2016 2017 YTD
Investment 38.97% 12.87% 1.61% 14.80% 15.15% -4.90%
Broad Index 32.39% 13.69% 1.38% 11.96% 21.83% 5.11%
Peer Group Index 34.76% 13.22% -2.44% 13.80% 18.52% 0.95%
Best-Fit Index 36.29% 12.31% -1.53% 14.39% 19.50% 1.72%
This graph shows a fund’s performance based on how $10,000 invested in the fund would have grown over timewith dividends reinvested. The returns used in the graph are not load-adjusted. The growth of $10,000 begins atthe fund’s inception, or the first year listed on the graph, whichever is appropriate. Located alongside the fund’sgraph line are lines that represent the growth of $10,000 in the fund’s Broad Index, Peer Group Index, and Best-fitIndex Benchmarks, which are listed in the Benchmarks section. All lines are plotted on a logarithmic scale, so thatidentical percentage changes in the value of an investment have the same vertical distance on the graph. Thisprovides a more accurate representation of performance than would a simple arithmetic graph.
WEIGHTINGS & HOLDINGS as of 7/31/2018
EQUITY SECTOR WEIGHTINGS REGIONAL WEIGHTINGS # OF HOLDINGS
TOP 10 HOLDINGS as of 12/6/2018
BENCHMARK LEGEND
RISK/REWARD
0% 10% 20%0%
15%
30%
STANDARD DEVIATION %
RET
UR
N %
3YEAR5YEAR
3YEAR
Investment
RETURN STANDARD DEVIATION
3YR 12.31% 10.96%
5YR 11.50% 10.66%
Best-Fit Index
RETURN STANDARD DEVIATION
3YR 15.24% 9.68%
5YR 12.17% -
UP/DOWN CAPTURE RATIO
70% 85% 100% 115% 130%
120%
110%
100%
90%
80%
DOWNSIDE %
UPS
IDE
%
3YEAR
5YEAR
Investment
UP DOWN
3YR 85.59% 126.75%
5YR 90.39% 103.11%
Cyclical 44.88%Basic Materials 5.02%Consumer Cyclical 7.98%Financial Services 24.42%Real Estate 7.46%
Defensive 13.17%Consumer Defensive 0.94%Healthcare 5.03%Utilities 7.2%
Sensitive 41.94%Communication Services 0%Energy 8.84%Industrials 17.35%Technology 15.75%
Americas 95.05%US 93.8%Canada 0.92%Latin America 0.33%
Greater Europe 1.3%United Kingdom 0.92%Europe Developed 0%Europe Emerging 0.38%Africa/Middle East 0%
Greater Asia 1.39%Japan 0%Australasia 0%Asia Developed 0%Asia Emerging 1.39%
Other 2.09%Emerging Markets 2.09%Other 0%
STOCKS: 140 BONDS: 0
Discover Financial Services 2.03%Alleghany Corp 1.75%Fidelity NationalInformation Services Inc
1.57%
DXC Technology Co 1.51%Huntington BancsharesInc
1.5%
Reinsurance Group ofAmerica Inc
1.47%
AMETEK Inc 1.47%East West Bancorp Inc 1.46%Pinnacle West CapitalCorp
1.41%
SunTrust Banks Inc 1.36%
Total 15.53%
STYLE STATISTICS
PORTFOLIO WEIGHT %
15.53 20.77 6.92
24.91 20.34 6.74
0.81 0 0.31
VALUE BLEND GROWTH
> 50%25 - 50%10 - 25%0 - 10%
CURRENT MORNINGSTAR STYLE BOX
Mid Value
LRG
MID
SM
™
INVESTMENT STRATEGY
This strategy is designed for high-net-worthinvestors, institutional investors, endowments,foundations and corporations seeking additionalincome while providing a source for anticipated orevent-driven needs. Accounts in this strategy favorincome generation and liquidity more than total returnand use investmentgrade corporate bonds, U.S.agency bonds and taxable or taxexempt municipalbonds to preserve wealth, lower risk and minimizevolatility.
Investment: JHancock Disciplined Value MidCap R2
Broad Index: S&P 500 TR USD
Peer Group Index: Russell Mid Cap TR USD
Best-fit Index: Morningstar US Mid Cap TR USD
Client Monitoring ReportInvestment Data as of 09/30/2018. Account holdings as of 9/30/2018.. For CLIENT_NAME
Page 12 of 36
Please see important disclosures in the Statement of Additional Disclosures. © 2018, Fi360, Inc. All rights reserved. The analysis and opinionsgenerated by Fi360, Inc. do not constitute professional investment advice and are provided solely for information purposes.
JHANCOCK DISCIPLINED VALUE MID CAP R2 JVMSX MID-CAP BLEND MF
HISTORICAL Fi360 FIDUCIARY SCORES AT QUARTER END
- - - - - - - - - - - - - - - - - - - - - - - - - - - - 27 29 24 22 17 0 0 16 15 38 40 59
Q408
Q109
Q209
Q309
Q409
Q110
Q210
Q310
Q410
Q111
Q211
Q311
Q411
Q112
Q212
Q312
Q412
Q113
Q213
Q313
Q413
Q114
Q214
Q314
Q414
Q115
Q215
Q315
Q415
Q116
Q216
Q316
Q416
Q117
Q217
Q317
Q417
Q118
Q218
Q318
10 YR ROLLING AVG: - 5 YR ROLLING AVG: - 3 YR ROLLING AVG: 25 1 YR R. AVG: 35
The Fi360 Fiduciary Score® is a peer percentile ranking of an investment against a set of quantitative due diligence criteria selected to reflect prudent fiduciary management. The Fi360 Fiduciary Score® Average is a one-, three-, five-, or ten-year rolling average of an investment’s Fi360 Fiduciary Score®. All Scores are color coded based on the quartile they fall in (1st - Green; 2nd - Light Green; 3rd - Yellow; 4th - Red).Any cells shaded in yellow bellow accrued Fi360 Fiduciary Score shortfall points during that quarter.
100
75
50
25
0
Prospectus Net Expense Ratio Rank Alpha Rank- Primary Benchmark (3yr) Sharpe Ratio Rank (3yr)
Return Rank (1yr) Return Rank (3yr) Return Rank (5yr)
48 48 45 45 44 40 40 38
51 55 51
76
Pee
rs
1,3
24
1,2
34
1,2
34
1,2
34
1,2
34
1,2
34
1,2
34
1,2
34
1,2
34
1,2
34
1,2
34
14
92
20
15
Q4
00
16
Q1
20
16
Q2
20
16
Q3
20
16
Q4
20
17
Q1
20
17
Q2
20
17
Q3
20
17
Q4
20
18
Q1
20
18
Q2
20
18
Q3
70
76 80 84 82 81 76 80 85 90 92 93
15
27
15
05
14
61
14
50
14
52
14
63
14
38
14
06
13
68
13
60
14
23
14
03
20
15
Q4
00
16
Q1
20
16
Q2
20
16
Q3
20
16
Q4
20
17
Q1
20
17
Q2
20
17
Q3
20
17
Q4
20
18
Q1
20
18
Q2
20
18
Q3
23
36 40 39 28 38 45
56
78 80 82 84
52
27
15
05
14
61
14
50
14
52
14
63
14
38
14
06
13
68
13
69
14
23
14
03
20
15
Q4
00
16
Q1
20
16
Q2
20
16
Q3
20
16
Q4
20
17
Q1
20
17
Q2
20
17
Q3
20
17
Q4
20
18
Q1
20
18
Q2
20
18
Q3
48 48 45 45 44 40 40 38
51 54 55 51
Pee
rs
15
69
15
54
15
09
15
06
14
98
15
10
14
94
14
67
14
31
14
25
14
96
14
72
20
15
Q4
00
16
Q1
20
16
Q2
20
16
Q3
20
16
Q4
20
17
Q1
20
17
Q2
20
17
Q3
20
17
Q4
20
18
Q1
20
18
Q2
20
18
Q3
70
76 80 84 82 81 76 80 85 90 92 93
15
27
15
05
14
61
14
50
14
52
14
63
14
38
14
06
13
68
13
69
14
23
14
03
20
15
Q4
00
16
Q1
20
16
Q2
20
16
Q3
20
16
Q4
20
17
Q1
20
17
Q2
20
17
Q3
20
17
Q4
20
18
Q1
20
18
Q2
20
18
Q3
23
36 40 39 28 38 45
56
78 80 82 84
36
86
13
74
13
53
13
45
13
75
13
95
14
12
13
81
13
41
13
29
13
83
13
51
20
15
Q4
00
16
Q1
20
16
Q2
20
16
Q3
20
16
Q4
20
17
Q1
20
17
Q2
20
17
Q3
20
17
Q4
20
18
Q1
20
18
Q2
20
18
Q3
Per
cent
ile R
ank
Per
cent
ile R
ank
75
50
25
75
50
25
Fi360 SCORE CRITERIA
2015 2016 2017 2018
Q4 Q1 Q2 Q3 Q4 Q1 Q2 Q3 Q4 Q1 Q2 Q3
Peer Group Large Growth Large Growth Large Growth Large Growth Large Growth Large Growth Large Growth Large Growth Large Growth Large Growth Large Growth Large Growth
Manager Tenure (Yrs) 24.3 24.5 24.8 25.0 1.25 1.5 1.75 2.0 2.25 2.5 2.75 3.0
Net Assets ($ mil) 4,636 4,323 4,023 3,741 3,797 3,488 3,100 2,848 2,723 2,378 2290 2295
Composition Consistency 94% US Stocks
95% US Stocks
96% US Stocks
90% US Stocks
84% US Stocks
78% US Stocks
75% US Stocks
83% US Stocks
88% US Stocks
89% US Stocks
85% US Stocks
85% US Stocks
Style Consistency Large Growth Large Growth Large Growth Large Growth Large Growth Large Blend Large Growth Large Growth Large Growth Large Growth Large Growth Mid Blend
Client Monitoring ReportInvestment Data as of 09/30/2018. Account holdings as of 9/30/2018.. For CLIENT_NAME
Page 13 of 36

Please see important disclosures in the Statement of Additional Disclosures. © 2018, Fi360, Inc. All rights reserved. The analysis and opinionsgenerated by Fi360, Inc. do not constitute professional investment advice and are provided solely for information purposes.
Fi360 FIDUCIARY SCORE® SUMMARY
The Fi360 Fiduciary Score® is a peer percentile ranking of an investment against a set of quantitative due diligence criteria selected to reflect prudentfiduciary management. The Fi360 Fiduciary Score® Average is a one-, three-, five-, or ten-year rolling average of an investment’s Fi360 FiduciaryScore®. All Scores are color coded based on the quartile they fall in (1st - Green; 2nd - Light Green; 3rd - Yellow; 4th - Red).
The ID column can be used to reference the investment on the following Scatterplot chart. Investments which do not have both Scores will not have an IDas they cannot be plotted on the chart. If multiple investments have the same Scores, they will be plotted together under 1 ID.
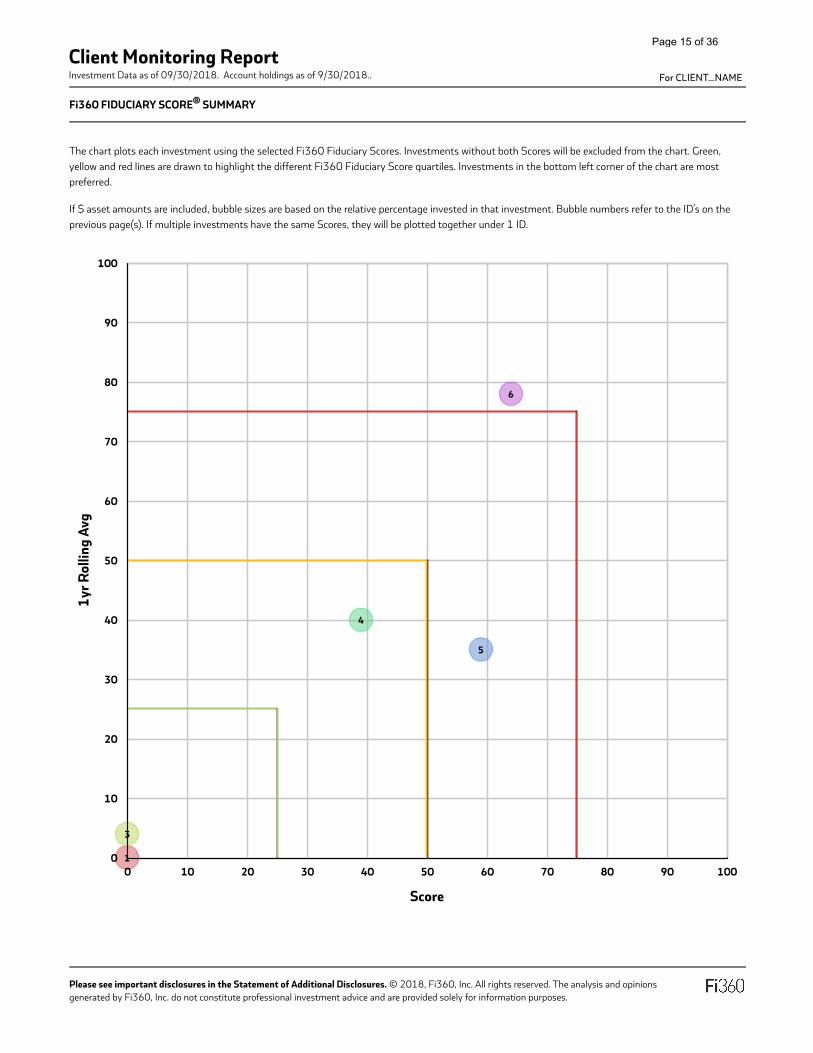
ID INVESTMENT NAME TICKER TYPE PEER GROUPSCORE (PEERS)
1YR ROLLING AVG (PEERS)
1 JPMorgan Large Cap Growth A OLGAX MF Large Growth 0 (1403)
0 (1338)
1 Vanguard Equity-Income Adm VEIRX MF Large Value 0 (1214)
0 (1145)
3 Vanguard Mid Cap Index Admiral VIMAX MF Mid-Cap Blend 0 (418)
4 (398)
4 Vanguard Dividend Growth Inv VDIGX MF Large Blend 39 (1307)
40 (1231)
5 JHancock Disciplined Value Mid Cap R2 JVMSX MF Mid-Cap Blend 59 (418)
35 (398)
6 iShares Intermediate Govt/Crdt Bd ETF GVI ETF Intermediate-Term Bond 64 (993)
78 (934)
group@@@IjxzcGFuIGNsYXNzPVwibm8tdGV4dC10cmFuc2Zvcm1cIj5GaTM2MDwvc3Bhbj4gRmlkdWNpYXJ5IFNjb3JlPHNwYW4gY2xhc3M9XCJzdXBcIj4mcmVnOzwvc3Bhbj4gU3VtbWFyeSI=@@@
Client Monitoring ReportInvestment Data as of 09/30/2018. Account holdings as of 9/30/2018.. For CLIENT_NAME
Page 14 of 36
Please see important disclosures in the Statement of Additional Disclosures. © 2018, Fi360, Inc. All rights reserved. The analysis and opinionsgenerated by Fi360, Inc. do not constitute professional investment advice and are provided solely for information purposes.
Fi360 FIDUCIARY SCORE® SUMMARY
The chart plots each investment using the selected Fi360 Fiduciary Scores. Investments without both Scores will be excluded from the chart. Green,yellow and red lines are drawn to highlight the different Fi360 Fiduciary Score quartiles. Investments in the bottom left corner of the chart are mostpreferred.
If $ asset amounts are included, bubble sizes are based on the relative percentage invested in that investment. Bubble numbers refer to the ID’s on theprevious page(s). If multiple investments have the same Scores, they will be plotted together under 1 ID.
1
3
4
5
6
0 10 20 30 40 50 60 70 80 90 100
Score
0
10
20
30
40
50
60
70
80
90
100
1yr R
ollin
g Av
g
Client Monitoring ReportInvestment Data as of 09/30/2018. Account holdings as of 9/30/2018.. For CLIENT_NAME
Page 15 of 36

Please see important disclosures in the Statement of Additional Disclosures. © 2018, Fi360, Inc. All rights reserved. The analysis and opinionsgenerated by Fi360, Inc. do not constitute professional investment advice and are provided solely for information purposes.
Fi360 FIDUCIARY SCORE® BREAKDOWN
The Fi360 Fiduciary Score® is a peer percentile ranking of an investment against a set of quantitative due diligence criteria selected to reflect prudentfiduciary management. The Fi360 Fiduciary Score® Average is a one-, three-, five-, or ten-year rolling average of an investment’s Fi360 FiduciaryScore®. All Scores are color coded based on the quartile they fall in (1st - Green; 2nd - Light Green; 3rd - Yellow; 4th - Red).
* For separately managed accounts, r-squared in the top 75% of it’s peer group is used as a replacement criterion for Exp Ratio.
LARGE BLEND
INVESTMENT NAME TICKERSCORE (PEERS)
SCORE CRITERIAROLLING AVERAGES
(PEERS)
IN MT NA CO SS ER A3 S3 R1 R3 R5 1 YR 3 YR 5 YR 10 YR
Vanguard Dividend Growth Inv VDIGX 39 (1,307) 40
(1,231)
31(1,105)
30(958)
20(660)
LARGE GROWTH
INVESTMENT NAME TICKERSCORE (PEERS)
SCORE CRITERIAROLLING AVERAGES
(PEERS)
IN MT NA CO SS ER A3 S3 R1 R3 R5 1 YR 3 YR 5 YR 10 YR
JPMorgan Large Cap Growth A OLGAX 0 (1,403) 0
(1,338)
29(1,229)
30(1,023)
19(680)
LARGE VALUE
INVESTMENT NAME TICKERSCORE (PEERS)
SCORE CRITERIAROLLING AVERAGES
(PEERS)
IN MT NA CO SS ER A3 S3 R1 R3 R5 1 YR 3 YR 5 YR 10 YR
Vanguard Equity-Income Adm VEIRX 0 (1,214) 0
(1,145)
3(1,017)
6(845)
5(574)
MID-CAP BLEND
INVESTMENT NAME TICKERSCORE (PEERS)
SCORE CRITERIAROLLING AVERAGES
(PEERS)
IN MT NA CO SS ER A3 S3 R1 R3 R5 1 YR 3 YR 5 YR 10 YR
Vanguard Mid Cap Index Admiral VIMAX 0 (418) 4
(398)
7(344)
6(286)
9(173)
JHancock Disciplined Value Mid Cap R2 JVMSX 59 (418) 35
(398)
25(344)
24(286)
-
group@@@IjxzcGFuIGNsYXNzPVwibm8tdGV4dC10cmFuc2Zvcm1cIj5GaTM2MDwvc3Bhbj4gRmlkdWNpYXJ5IFNjb3JlPHNwYW4gY2xhc3M9XCJzdXBcIj4mcmVnOzwvc3Bhbj4gQnJlYWtkb3duIg==@@@
Score Criterion
IN. Inception Date. Must have at least a 3 year track historyMT. Manager Tenure. Must have at least a 2 year track history. (Most senior manager's tenure)NA. Net Assets. Must have >= 75 million under management. (Total across all share classes)CO. Composition. Must have >= 80% allocation to primary asset (Not applied to all peer groups)SS. Style. Must have current style box match the peer group. (Not applied to all peer groups)ER. Prospectus Net Exp Ratio. * Must place in the top 75% of its peer group.A3. Alpha - Broad Market (3 YR). Must place in the top 50% of its peer group.S3. Sharpe (3 YR). Must place in the top 50% of its peer group.R1. Return (1 YR). Must place in the top 50% of its peer group.R3. Return (3 YR). Must place in the top 50% of its peer group.R5. Return (5 YR). Must place in the top 50% of its peer group.
Summary Legend
Investment meets the criterion
Investment does not meet the criterion
- Investment data is not available
NA Investment is not screened on the criterion
NS Investment doesn't have the history to bescored
Client Monitoring ReportInvestment Data as of 09/30/2018. Account holdings as of 9/30/2018.. For CLIENT_NAME
Page 16 of 36
Please see important disclosures in the Statement of Additional Disclosures. © 2018, Fi360, Inc. All rights reserved. The analysis and opinionsgenerated by Fi360, Inc. do not constitute professional investment advice and are provided solely for information purposes.
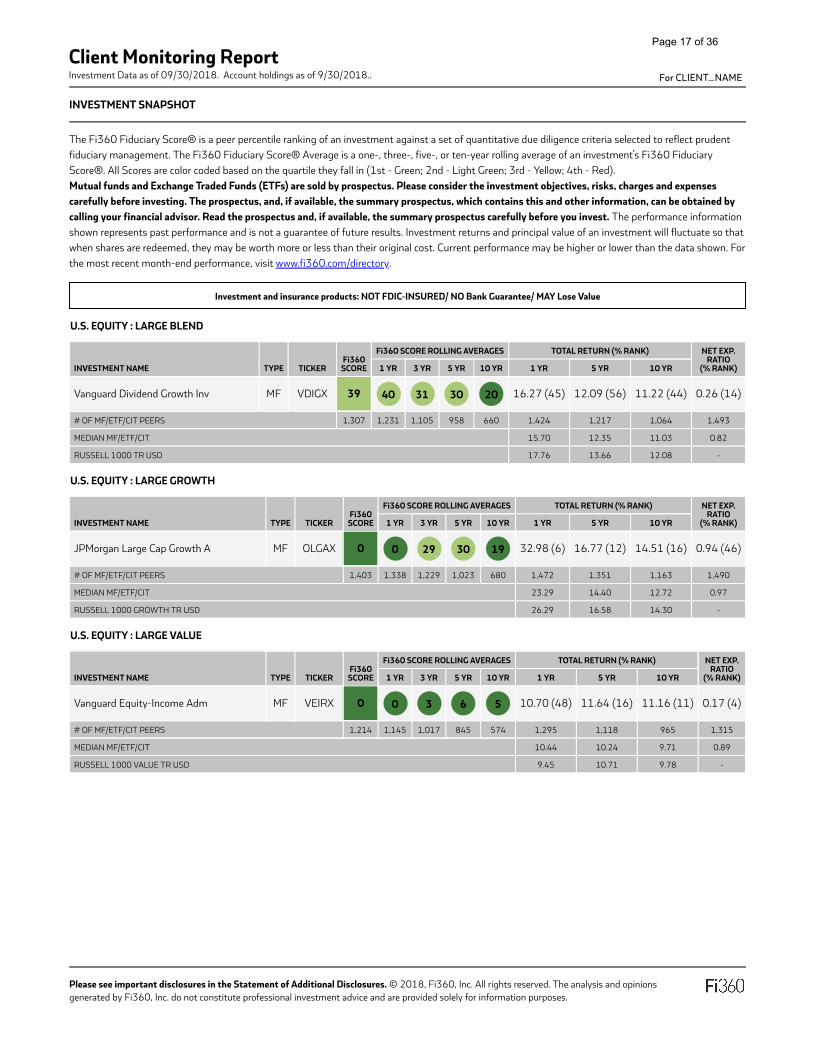
INVESTMENT SNAPSHOT
The Fi360 Fiduciary Score® is a peer percentile ranking of an investment against a set of quantitative due diligence criteria selected to reflect prudentfiduciary management. The Fi360 Fiduciary Score® Average is a one-, three-, five-, or ten-year rolling average of an investment’s Fi360 FiduciaryScore®. All Scores are color coded based on the quartile they fall in (1st - Green; 2nd - Light Green; 3rd - Yellow; 4th - Red).Mutual funds and Exchange Traded Funds (ETFs) are sold by prospectus. Please consider the investment objectives, risks, charges and expensescarefully before investing. The prospectus, and, if available, the summary prospectus, which contains this and other information, can be obtained bycalling your financial advisor. Read the prospectus and, if available, the summary prospectus carefully before you invest. The performance informationshown represents past performance and is not a guarantee of future results. Investment returns and principal value of an investment will fluctuate so thatwhen shares are redeemed, they may be worth more or less than their original cost. Current performance may be higher or lower than the data shown. Forthe most recent month-end performance, visit www.fi360.com/directory.
Investment and insurance products: NOT FDIC-INSURED/ NO Bank Guarantee/ MAY Lose Value
U.S. EQUITY : LARGE BLEND
INVESTMENT NAME TYPE TICKERFi360
SCORE
Fi360 SCORE ROLLING AVERAGES TOTAL RETURN (% RANK) NET EXP.RATIO
(% RANK)1 YR 3 YR 5 YR 10 YR 1 YR 5 YR 10 YR
Vanguard Dividend Growth Inv MF VDIGX 39 40 31 30 20 16.27 (45) 12.09 (56) 11.22 (44) 0.26 (14)
# OF MF/ETF/CIT PEERS 1,307 1,231 1,105 958 660 1,424 1,217 1,064 1,493
MEDIAN MF/ETF/CIT 15.70 12.35 11.03 0.82
RUSSELL 1000 TR USD 17.76 13.66 12.08 -
U.S. EQUITY : LARGE GROWTH
INVESTMENT NAME TYPE TICKERFi360
SCORE
Fi360 SCORE ROLLING AVERAGES TOTAL RETURN (% RANK) NET EXP.RATIO
(% RANK)1 YR 3 YR 5 YR 10 YR 1 YR 5 YR 10 YR
JPMorgan Large Cap Growth A MF OLGAX 0 0 29 30 19 32.98 (6) 16.77 (12) 14.51 (16) 0.94 (46)
# OF MF/ETF/CIT PEERS 1,403 1,338 1,229 1,023 680 1,472 1,351 1,163 1,490
MEDIAN MF/ETF/CIT 23.29 14.40 12.72 0.97
RUSSELL 1000 GROWTH TR USD 26.29 16.58 14.30 -
U.S. EQUITY : LARGE VALUE
INVESTMENT NAME TYPE TICKERFi360
SCORE
Fi360 SCORE ROLLING AVERAGES TOTAL RETURN (% RANK) NET EXP.RATIO
(% RANK)1 YR 3 YR 5 YR 10 YR 1 YR 5 YR 10 YR
Vanguard Equity-Income Adm MF VEIRX 0 0 3 6 5 10.70 (48) 11.64 (16) 11.16 (11) 0.17 (4)
# OF MF/ETF/CIT PEERS 1,214 1,145 1,017 845 574 1,295 1,118 965 1,315
MEDIAN MF/ETF/CIT 10.44 10.24 9.71 0.89
RUSSELL 1000 VALUE TR USD 9.45 10.71 9.78 -
group@@@IkludmVzdG1lbnQgU25hcHNob3Qi@@@
Client Monitoring ReportInvestment Data as of 09/30/2018. Account holdings as of 9/30/2018.. For CLIENT_NAME
Page 17 of 36

Client Monitoring ReportInvestment Data as of 9/30/2018. Account holdings as of 9/30/2018.
Please see important disclosures in the Statement of Additional Disclosures. © 2018, Fi360. All rights reserved. The analysis and opinions generated by Fi360 do not constitute professional investment advice and are provided solely for informational purposes.
SHARE CLASS COMPARISON
VANGUARD DIVIDEND GROWTH
CLASS TICKER 12B-1MINIMUM
INVEST
NET EXP RATIO (Rank)
Fi360 SCORE
Fi360 SCORE ROLLING AVERAGES TOTAL RETURN % (Rank)
1 YR 3 YR 5 YR 10 YR 1 YR 5 YR 10 YR
I VDIGX - 0.26 41 40 30 30 19 16.26 (89) 12.38 (64) 10.36 (34)
# OFPEERS 1,350 1,302 1,235 1,101 957 624 1,411 1,221 1,067
JPMORGAN LARGE CAP GROWTH
CLASS TICKER 12B-1MINIMUM
INVEST
NET EXP RATIO (Rank)
Fi360 SCORE
Fi360 SCORE ROLLING AVERAGES TOTAL RETURN % (Rank)
1 YR 3 YR 5 YR 10 YR 1 YR 5 YR 10 YR
R6 JLGMX 15M 0.44 0 0 22 22 - 33.77 (5) 18.55 (6) 13.31 (11)
R5 JLGRX - 0.54 0 0 24 24 - 33.63 (6) 18.44 (7) 13.28 (12)
I SEEGX 1M 0.69 0 0 25 26 17 33.44 (6) 18.23 (8) 13.07 (14)
R4 JLGQX - 0.69 0 0 - - - 33.42 (6) 18.23 (8) 13.07 (14)
A OLGAX 1K 0.94 0 3 30 30 19 33.10 (6) 18.02 (11) 12.85 (17)
R3 JLGPX - 0.94 21 5 - - - 33.08 (7) 17.93 (11) 12.79 (18)
R2 JLGZX - 1.19 21 8 38 36 - 32.74 (7) 17.71 (14) 12.57 (22)
C OLGCX 1K 1.44 41 39 58 59 35 32.43 (7) 17.44 (18) 12.28 (28)
# OF PEERS 1,510 1,400 1,339 1,224 1,021 658 1,474 1,357 1,168
This section displays a table for each mutual fund/ETF investment. Your selected share class(es) are colored in a blue background and any other related share classes will be displayed for analysis. Depending on the platform you are using and the amount of money you have to invest, a given share class may not be available. Consult your advisor for additional details.
The Fi360 Fiduciary Score® is a peer percentile ranking of an investment against a set of quantitative due diligence criteria selected to reflect prudent fiduciary management. The Fi360 Fiduciary Score® Average is a one-, three-, five-, or ten-year rolling average of an investment’s FI360 Fiduciary Score®. All Scores are color coded based on the quartile they fall in (1st - Green; 2nd - Light Green; 3rd - Yellow; 4th - Red).
Mutual funds and Exchange Traded Funds (ETFs) are sold by prospectus. Please consider the investment objectives, risks, charges and expenses carefully before investing. The prospectus, and, if available, the summary prospectus, which contains this and other information, can be obtained by calling your financial advisor. Read the prospectus and, if available, the summary prospectus carefully before you invest.The performance information shown represents past performance and is not a guarantee of future results. Investment returns and principal value of an investment will fluctuate so that when shares are redeemed, they may be worth more or less than their original cost. The performance information shown reflects performance without adjusting for sales charges. If adjusted, the load would reduce the performance quoted. Current performance may be higher or lower than the data shown. For the most recent month-end performance, visit www.fi360.com/directory.
Investment and insurance products: NOT FDIC-INSURED / NO Bank Guarantee / MAY Lose Value
For CLIENT_NAME
Page 18 of 36
Client Monitoring ReportInvestment Data as of 9/30/2018. Account holdings as of 9/30/2018.
Please see important disclosures in the Statement of Additional Disclosures. © 2018, Fi360. All rights reserved. The analysis and opinions generated by Fi360 do not constitute professional investment advice and are provided solely for informational purposes.
For CLIENT_NAME
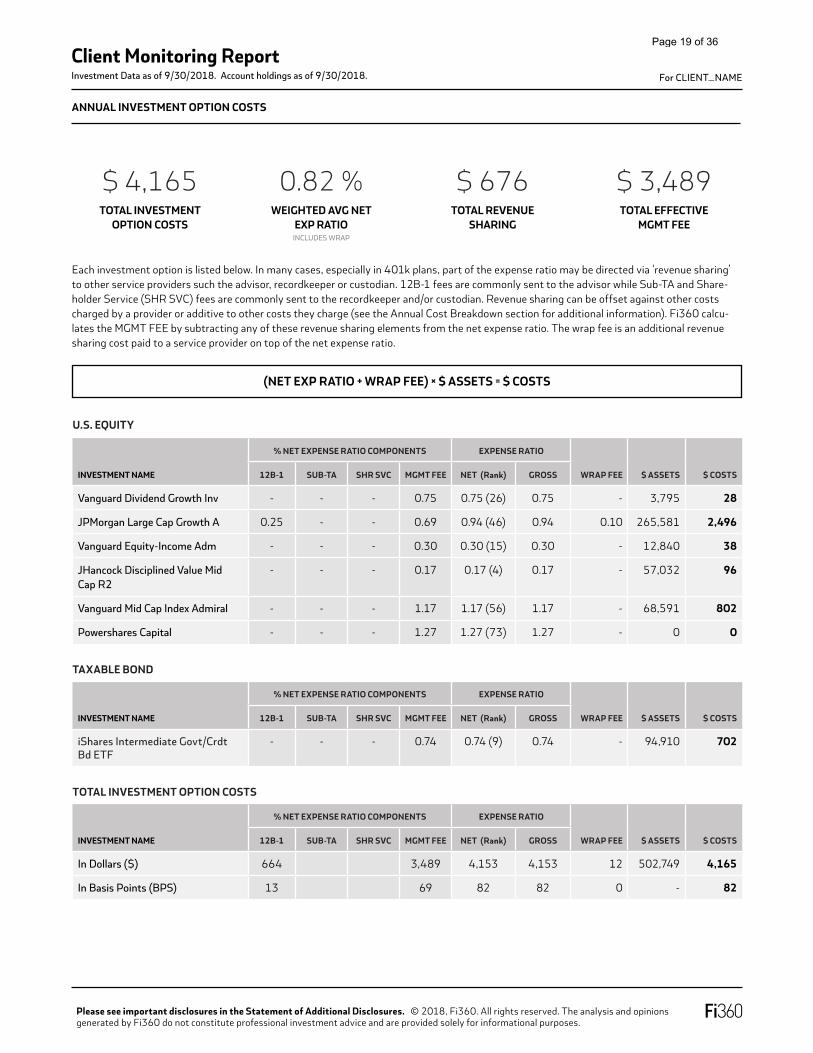
ANNUAL INVESTMENT OPTION COSTS
U.S. EQUITY
INVESTMENT NAME
% NET EXPENSE RATIO COMPONENTS EXPENSE RATIO
WRAP FEE $ ASSETS $ COSTS12B-1 SUB-TA SHR SVC MGMT FEE NET (Rank) GROSS
Vanguard Dividend Growth Inv - - - 0.75 0.75 (26) 0.75 - 3,795 28
JPMorgan Large Cap Growth A 0.25 - - 0.69 0.94 (46) 0.94 0.10 265,581 2,496
Vanguard Equity-Income Adm - - - 0.30 0.30 (15) 0.30 - 12,840 38
JHancock Disciplined Value Mid Cap R2
- - - 0.17 0.17 (4) 0.17 - 57,032 96
Vanguard Mid Cap Index Admiral - - - 1.17 1.17 (56) 1.17 - 68,591 802
Powershares Capital - - - 1.27 1.27 (73) 1.27 - 0 0
TAXABLE BOND
INVESTMENT NAME
% NET EXPENSE RATIO COMPONENTS EXPENSE RATIO
WRAP FEE $ ASSETS $ COSTS12B-1 SUB-TA SHR SVC MGMT FEE NET (Rank) GROSS
iShares Intermediate Govt/Crdt Bd ETF
- - - 0.74 0.74 (9) 0.74 - 94,910 702
TOTAL INVESTMENT OPTION COSTS
INVESTMENT NAME
% NET EXPENSE RATIO COMPONENTS EXPENSE RATIO
WRAP FEE $ ASSETS $ COSTS12B-1 SUB-TA SHR SVC MGMT FEE NET (Rank) GROSS
In Dollars ($) 664 3,489 4,153 4,153 12 502,749 4,165
In Basis Points (BPS) 13 69 82 82 0 - 82
Each investment option is listed below. In many cases, especially in 401k plans, part of the expense ratio may be directed via ‘revenue sharing’ to other service providers such the advisor, recordkeeper or custodian. 12B-1 fees are commonly sent to the advisor while Sub-TA and Share-holder Service (SHR SVC) fees are commonly sent to the recordkeeper and/or custodian. Revenue sharing can be offset against other costs charged by a provider or additive to other costs they charge (see the Annual Cost Breakdown section for additional information). Fi360 calcu-lates the MGMT FEE by subtracting any of these revenue sharing elements from the net expense ratio. The wrap fee is an additional revenue sharing cost paid to a service provider on top of the net expense ratio.
(NET EXP RATIO + WRAP FEE) × $ ASSETS = $ COSTS
TOTAL INVESTMENT OPTION COSTS
WEIGHTED AVG NET EXP RATIO
TOTAL REVENUE SHARING
TOTAL EFFECTIVE MGMT FEE
$ 4,165 0.82 % $ 676 $ 3,489
INCLUDES WRAP
Page 19 of 36
Please see important disclosures in the Statement of Additional Disclosures. © 2018, Fi360. All rights reserved. The analysis and opinions generated by Fi360 do not constitute professional investment advice and are provided solely for informational purposes.
Sample Client Name
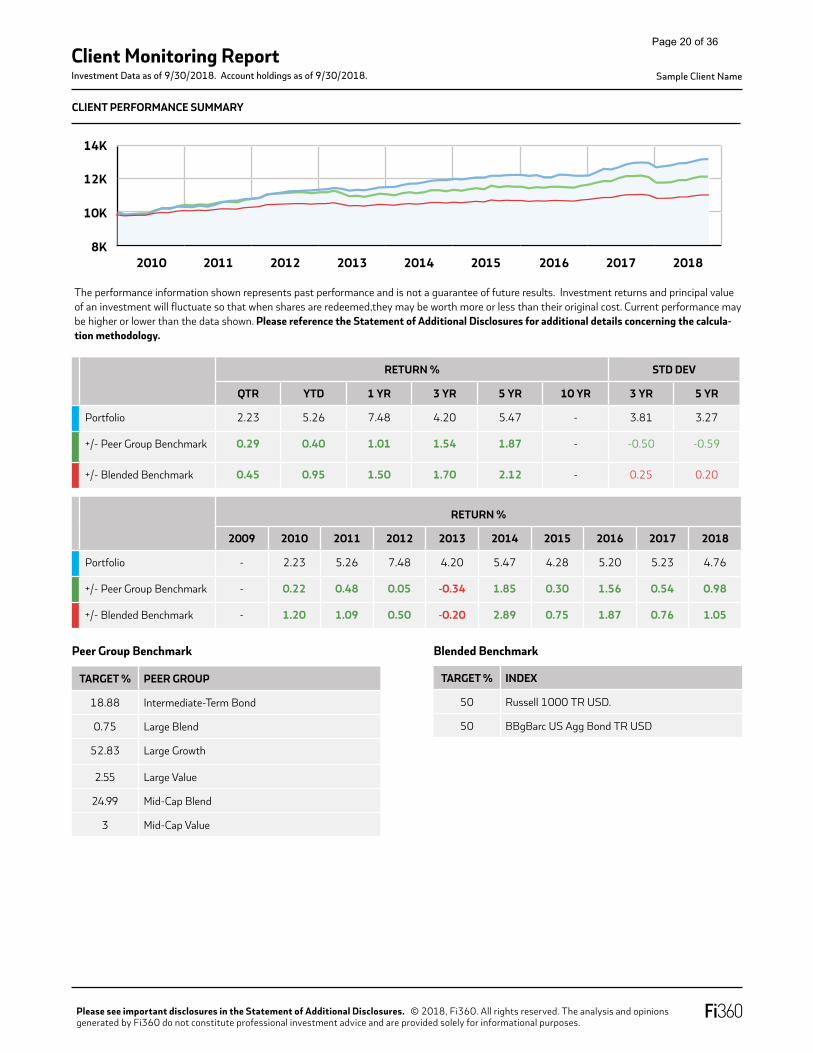
CLIENT PERFORMANCE SUMMARY
14K
12K
10K
8K2010 2011 2012 2013 2014 2015 2016 2017 2018
The performance information shown represents past performance and is not a guarantee of future results. Investment returns and principal value of an investment will fluctuate so that when shares are redeemed,they may be worth more or less than their original cost. Current performance may be higher or lower than the data shown. Please reference the Statement of Additional Disclosures for additional details concerning the calcula-tion methodology.
RETURN % STD DEV
QTR YTD 1 YR 3 YR 5 YR 10 YR 3 YR 5 YR
Portfolio 2.23 5.26 7.48 4.20 5.47 - 3.81 3.27
+/- Peer Group Benchmark 0.29 0.40 1.01 1.54 1.87 - -0.50 -0.59
+/- Blended Benchmark 0.45 0.95 1.50 1.70 2.12 - 0.25 0.20
TARGET % PEER GROUP
18.88 Intermediate-Term Bond
0.75 Large Blend
52.83 Large Growth
2.55 Large Value
24.99 Mid-Cap Blend
3 Mid-Cap Value
Peer Group Benchmark
TARGET % INDEX
50 Russell 1000 TR USD.
50 BBgBarc US Agg Bond TR USD
Blended Benchmark
RETURN %
2009 2010 2011 2012 2013 2014 2015 2016 2017 2018
Portfolio - 2.23 5.26 7.48 4.20 5.47 4.28 5.20 5.23 4.76
+/- Peer Group Benchmark - 0.22 0.48 0.05 -0.34 1.85 0.30 1.56 0.54 0.98
+/- Blended Benchmark - 1.20 1.09 0.50 -0.20 2.89 0.75 1.87 0.76 1.05
Client Monitoring ReportInvestment Data as of 9/30/2018. Account holdings as of 9/30/2018.
Page 20 of 36

Client Monitoring ReportInvestment Data as of 9/30/2018. Account holdings as of 9/30/2018.
Please see important disclosures in the Statement of Additional Disclosures. © 2018, Fi360. All rights reserved. The analysis and opinions generated by Fi360 do not constitute professional investment advice and are provided solely for informational purposes.
INVESTMENT PERFORMANCE
U.S EQUITY - LARGE BLEND
INVESTMENT NAME TYPE TICKER
TOTAL RETURN TOTAL ANNUALIZED RETURN (Rank)
3MO YTD 1 YR 3 YR 5 YR 10 YR
Vanguard Dividend Inv MF VDIGX 8.06 10.08 16.26 (69) 14.70 (65) 12.38 (64) 10.36 (34)
# OF MF/ETF PEERS 1,475 1,449 1,411 1,306 1,221 1,067
MEDIAN MUTUAL FUND/ETF 7.00 8.78 18.05 15.50 13.06 9.90
RUSSELL 1000 TR USD 7.42 10.48 19.81 17.06 14.36 10.92
U.S EQUITY - LARGE GROWTH
INVESTMENT NAME TYPE TICKER
TOTAL RETURN TOTAL ANNUALIZED RETURN (Rank)
3MO YTD 1 YR 3 YR 5 YR 10 YR
JPMorgan Large Cap Growth A MF OLGAX 9.17 23.19 33.10 (6) 21.26 (9) 18.02 (11) 12.85 (17)
# OF MF/ETF PEERS 1,486 1,483 472 1,403 390 330
MEDIAN MUTUAL FUND/ETF 7.60 15.66 24.30 18.11 15.45 11.27
RUSSELL 1000 GROWTH TR USD 9.17 17.08 27.22 20.55 19.32 17.47
U.S EQUITY - MID-CAP BLEND
INVESTMENT NAME TYPE TICKER
TOTAL RETURN TOTAL ANNUALIZED RETURN (Rank)
3MO YTD 1 YR 3 YR 5 YR 10 YR
JHancock Disciplined Value Mid Cap R2 MF JVMSX 3.53 2.19 12.02 (83) 0.72 (88) 12.62 (27) 12.21 (6)
# OF MF/ETF PEERS 473 472 172 993 390 330
MEDIAN MUTUAL FUND/ETF 3.83 5.83 15.55 1.52 11.75 9.88
RUSSELL MID CAP TR USD 4.99 7.46 17.89 1.31 12.80 10.92
Mutual funds and Exchange Traded Funds (ETFs) are sold by prospectus. Please consider the investment objectives, risks, charges and expenses carefully before investing. The prospectus, and, if available, the summary prospectus, which contains this and other information, can be obtained by calling your financial advisor. Read the prospectus and, if available, the summary prospectus carefully before you invest.The performance information shown represents past performance and is not a guarantee of future results. Investment returns and principal value of an investment will fluctuate so that when shares are redeemed, they may be worth more or less than their original cost. The performance information shown reflects performance without adjusting for sales charges. If adjusted, the load would reduce the performance quoted. Current performance may be higher or lower than the data shown. For the most recent month-end performance, visit www.fi360.com/directory.
Investment and insurance products: NOT FDIC-INSURED / NO Bank Guarantee / MAY Lose Value
For CLIENT_NAME
Page 21 of 36

Please see important disclosures in the Statement of Additional Disclosures. © 2018, Fi360. All rights reserved. The analysis and opinions generated by Fi360 do not constitute professional investment advice and are provided solely for informational purposes.
INVESTMENT COMPARISON
The Fi360 Fiduciary Score® is a peer percentile ranking of an investment against a set of quantitative due diligence criteria selected to reflect prudent fiduciary management. The Fi360 Fiduciary Score® Average is a one-, three-, five-, or ten-year rolling average of an investment’s FI360 Fiduciary Score®. All Scores are color coded based on the quartile they fall in (1st - Green; 2nd - Light Green; 3rd - Yellow; 4th - Red).
Mutual funds and Exchange Traded Funds (ETFs) are sold by prospectus. Please consider the investment objectives, risks, charges and expenses carefully before investing. The prospectus, and, if available, the summary prospectus, which contains this and other information, can be obtained by calling you��nancial advisor. Read the prospectus and, if available, the summary prospectus carefully before you invest.The performance information shown represents past performance and is not a guarantee of future results. Investment returns and principal value of an investment will fluctuate so that when shares are redeemed, they may be worth more or less than their original cost. The performance information shown reflects performance without adjusting for sales charges. If adjusted, the load would reduce the performance quoted. Current performance may be higher or lower than the data shown. For the most recent month-end performance, visit www.fi360.com/directory.
Investment and insurance products: NOT FDIC-INSURED / NO Bank Guarantee / MAY Lose Value
Client Monitoring ReportInvestment Data as of 09/30/2018. Account holdings as of 9/30/2018.. For CLIENT_NAME
Page 22 of 36

Client Monitoring ReportInvestment Data as of 9/30/2018. Account holdings as of 9/30/2018.
Please see important disclosures in the Statement of Additional Disclosures. © 2018, Fi360. All rights reserved. The analysis and opinions generated by Fi360 do not constitute professional investment advice and are provided solely for informational purposes.
For CLIENT_NAME
IPS ALLOCATION ALIGNMENT
U.S. EQUITY
PEER GROUPINVESTMENT
POLICY
HOLDINGS
ALIGNMENT# % OF TOTAL ASSETS
Large Blend 1 0.75
Large Growth 1 52.83
Large Value 1 2.55
Mid-Cap Blend 2 24.98
Small Value - - No holding
TAXABLE BOND
PEER GROUPINVESTMENT
POLICY
HOLDINGS
ALIGNMENT# % OF TOTAL ASSETS
Intermediate Term Bond 1 18.88 Not in IPS
This section displays the Investment Policy Statement (IPS) target allocation along with min and max rebalancing ranges for each peer group. If the current holdings do not fit within the ranges of the IPS, an alignment notice is displayed with the % above (or below) the max or min accordingly. A notice can occur due to temporary style drift in an investment, a difference in categorization methodology between or a gap in allocation.
Page 23 of 36

Client Monitoring ReportInvestment Data as of 09/30/2018. Account holdings as of 09/30/2018.
Please see important disclosures in the Statement of Additional Disclosures. © 2018, Fi360. All rights reserved. The analysis and opinions generated by Fi360 do not constitute professional investment advice and are provided solely for informational purposes.
Sample Client Name
INVESTMENT COMMENTARY
FIDELITY EQUITY-INCOME ADV - VEINX - LARGE VALUE - ACTIVE ON WATCH
FIDEITY ADVISOR LARGE CAP STOCK - INTERMEDIATE-TERM BOND - PASSIVE OFF WATCH
INVESTMENT NOTES AS OF 9/30/2018
Despite posting subpar returns in recent years, this investment has a lot going for it. A distinct process and a talented manager surrounded by
a solid fundamental analyst team justify a Morningstar Analyst Rating of Bronze. Manager Matt Fruhan compares estimates of future earnings
and growth from Fidelity's fundamental equity analysts with the Wall Street consensus estimates. When the difference is wide, he dives into
financial statements and talks with the analysts to understand why. Fruhan fills the portfolio with cyclical opportunities, where the Wall Street
consensus is too pessimistic on a stock's short-term prospects, and secular opportunities, where the consensus is not optimistic enough about
long-term growth prospects. As a result, the fund's price/earnings and price/book multiples and quality metrics such as return on invested
capital and return on equity tend to be lower than the S&P 500 and large-blend Morningstar Category average.
INVESTMENT NOTES AS OF 9/30/2018
Despite posting subpar returns in recent years, Fidelity Advisor Large Cap Stock has a lot going for it. A distinct process and a talented manager
surrounded by a solid fundamental analyst team justify a Morningstar Analyst Rating of Bronze. Manager Matt Fruhan compares estimates of
future earnings and growth from Fidelity's fundamental equity analysts with the Wall Street consensus estimates. When the difference is wide,
he dives into financial statements and talks with the analysts to understand why. Fruhan fills the portfolio with cyclical opportunities, where the
Wall Street consensus is too pessimistic on a stock's short-term prospects, and secular opportunities, where the consensus is not optimistic
enough about long-term growth prospects. As a result, the fund's price/earnings and price/book multiples and quality metrics such as return on
invested capital and return on equity tend to be lower than the S&P 500 and large-blend Morningstar Category average.
INVESTMENT NOTES AS OF 3/31/2018
Since Fruhan started managing this fund in October 2005 through May 2016, its 8.2% annualized gain beat the benchmark's 7.6% gain and
91% of its large-blend peers. Fruhan's tendency to buy stocks that are out of favor and his patience while his theses play out have contributed
to the fund's long-term success, but that also leaves it prone to stretches of underperformance. The fund was hammered in 2008 when Fruhan
prematurely bet on financials and other cyclicals as the financial crisis progressed.
INVESTMENT NOTES AS OF 1/31/2018
No current action required. This fund is currently meeting the requirements stated in the Investment Policy Statement.
Page 24 of 36

Client Monitoring ReportInvestment Data as of 09/30/2018. Account holdings as of 09/30/2018.
Please see important disclosures in the Statement of Additional Disclosures. © 2018, Fi360. All rights reserved. The analysis and opinions generated by Fi360 do not constitute professional investment advice and are provided solely for informational purposes.
Sample Client Name
CLIENT NOTES
New Business: The committee voted to replace Franklin Income Fund (FRSTX) with Baird Aggregate Bond (BAGSX). Franklin hasn't been
meeting the screening criteria for the I.P.S. for the last 3 to 4 quarters. It also is taking some additional risks as it is classified as a Multi-sector
Bond when it's peer group is in the Intermediate Term space. It has been struggling with 1,3,5,10 return rank; and sharpe rank. Baird is a very
consistent, pure alternative for the Intermediate term bond space.sdfd
Aston Fairpoint - Was voted on to stay on WATCH status. It has slightly improved from the previous quarter, however, still is showing some
warning signs regarding 1, 5 yr. return rank; and sharpe and style consistency issues (dating back to 12/31/2014)
We discussed Participant Plan Education and agreed on the following topics for 2016;
1. Retirement Checklist: 5 Steps
2. Finding Extra Dollars for Retirement
3. 10 Reason to Save for Retirement
4. The need for Regular Retirement Plan Maintenance.
I will be emailing these over to Joe within the next few weeks. It also is taking some additional risks as it is classified as a Multi-sector Bond
when it's peer group is in the Intermediate Term space. It has been struggling with 1,3,5,10 return rank; and sharpe rank. Baird is a very c
onsistent, pure alternative for the Intermediate term bond space.
Page 25 of 36

Client Monitoring ReportInvestment Data as of 09/30/2018. Account holdings as of 09/30/2018.
Please see important disclosures in the Statement of Additional Disclosures. © 2018, Fi360. All rights reserved. The analysis and opinions generated by Fi360 do not constitute professional investment advice and are provided solely for informational purposes.
Sample Client Name
MEETING MINUTES RECAP FROM LAST QUARTER
AttendeesCommissioner Matt Jones; Controller Tom Adsen; Treasurer Virginia Richard;
Absent: Commissioners John Point and Brian Bead C.S. MCKEE ATTENDEE: Jeff Lauren
MDC WEALTH ADVISORS ATTENDEES: Karen Jones; Deborah Thomas
Fund terminationsAllianz NFJ GI International Value (ANJIX) was terminated. Sector overweights to basic materials and energy and large allocations to emerging
markets were detracting from performance of ANJIX. The plan has Oppenheimer Developing Markets (ODVYX) available for the diversified
emerging markets category. The investment committee evaluated available investment options and selected Oakmark International (OAKIX) for
lower expenses, greater risk-return compensation, and diversification.
General notesNew Business: The committee voted to replace Franklin Income Fund (FRSTX) with Baird Aggregate Bond (BAGSX). Franklin hasn't been meeting
the screening criteria for the I.P.S. for the last 3 to 4 quarters. It also is taking some additional risks as it is classified as a Multi-sector Bond when
it's peer group is in the Intermediate Term space. It has been struggling with 1,3,5,10 return rank; and sharpe rank. Baird is a very consistent, pure
alternative for the Intermediate term bond space.
Aston Fairpoint - Was voted on to stay on WATCH status. It has slightly improved from the previous quarter, however, still is showing some warn-
ing signs regarding 1, 5 yr. return rank; and sharpe and style consistency issues (dating back to 12/31/2014).
American Beacon-Soft Watch because of recent scores related to 1,3,5,10 Return and Sharpe Rank. We went through the next education meeting
and talking about Self Directed Brokerage.
I also stated I will be talking about Market Volatility as it is on participant’s minds.
Lastly, we discussed Participant Plan Education and agreed on the following topics for 2016;
1. Retirement Checklist: 5 Steps
2. Finding Extra Dollars for Retirement
3. 10 Reason to Save for Retirement
4. The need for Regular Retirement Plan Maintenance.
I will be emailing these over to Joe within the next few weeks.
Page 26 of 36

Client Monitoring ReportInvestment Data as of 9/30/2018. Account holdings as of 9/30/2018.
Please see important disclosures in the Statement of Additional Disclosures. © 2018, Fi360. All rights reserved. The analysis and opinions generated by Fi360 do not constitute professional investment advice and are provided solely for informational purposes.
INVESTMENT DESCRIPTIONS
iShares Intermediate Govt/Crdt Bd ETF. The investment seeks to track the investment results of the Bloomberg Barclays U.S. Intermediate Government/Credit Bond Index. The fund generally invests at least 90% of its assets in securities of the underlying index. The index measures the performance of U.S. dollar-denominated U.S. Treasury bonds, government-related bonds (i.e., U.S. and non-U.S. agencies, sovereign, supranational and local authority debt) and investment-grade U.S. corporate bonds that have a remaining maturity of greater than one year and less than or equal to ten years.
JPMorgan Large Cap Growth A. The investment seeks long-term capital appreciation. Under normal circumstances, at least 80% of the fund’s assets will be invested in the equity securities of large, well-established companies. “Assets” means net assets, plus the amount of borrowings for investment purposes. Large, well-established companies are companies with market capitalizations equal to those within the universe of the Russell 1000 Growth Index at the time of purchase
JHancock Disciplined Value Mid Cap R2. The investment seeks long-term growth of capital with current income as a secondary objective. Under normal circumstances, the fund seeks to achieve its investment objectives by investing at least 80% of its net assets (including borrowings for investment purposes) in a diversified portfolio consisting primarily of equity securities, such as common stocks, of issuers with medium market capitalizations, and identified by the manager as having value characteristics. It may also invest up to 20% of its total assets in foreign currency-denominated securities.
Vanguard Dividend Growth Inv. The investment seeks to provide, primarily, a growing stream of income over time and, secondarily, long-term capital appreciation and current income. The fund invests primarily in stocks that tend to offer current dividends. It focuses on high-quality companies that have prospects for long-term total returns as a result of their ability to grow earnings and their willingness to increase dividends over time. These stocks typically-but not always-will be large-cap, will be undervalued relative to the market, and will show potential for increasing dividends. The fund seeks to be diversified across industry sectors.
For CLIENT_NAME
Page 27 of 36

Please see important disclosures in the Statement of Additional Disclosures. © 2018, Fi360, Inc. All rights reserved. The analysis and opinionsgenerated by Fi360, Inc. do not constitute professional investment advice and are provided solely for information purposes.
STATEMENT OF ADDITIONAL DISCLOSURES
INTRODUCTION
This report is for informational purposes only and does not constitute professional investment advice. Some data in this report was obtained from thirdparties. Although Fi360 obtains data from sources it deems to be reliable, it does not independently verify the data, and does not warrant or representthat the data is timely, complete, or accurate. The investment data source is © 2018 Morningstar, Inc. All rights reserved. The data contained herein: (1)is proprietary to Morningstar, Inc. and/or its content providers; (2) may not be copied or distributed; and (3) is not warranted to be accurate, complete ortimely. Neither Morningstar, Inc. nor its content providers are responsible for any damages or losses arising from any use of this information. Pastperformance is no guarantee of future results.
Mutual funds and Exchange Traded Funds (ETFs) are sold by prospectus. Please consider the investment objectives, risks, charges and expensescarefully before investing. The prospectus and, if available, the summary prospectus, which contains this and other information, can be obtained bycalling your financial advisor. Read the prospectus and, if available, the summary prospectus carefully before you invest.
Investing in mutual funds involves risk. The principal value and investment return will fluctuate so that your shares, when redeemed, may be worthmore or less than the original cost. All investing involves risk, including the possible loss of principal.
This Statement of Additional Disclosures includes important information regarding the information provided in the report. If an investor does notunderstand any term or data presented herein, he/she should consult with his/her financial advisor.
FI360 FIDUCIARY SCORE®
Fi360 Fiduciary Score®. The Score is a peer percentile ranking of an investment against a set of quantitative due diligence criteria selected to reflectprudent fiduciary management. The Rolling Averages are a one-, three-, five- or ten-year equal-weighted average of an investment’s Fi360 FiduciaryScores during that corresponding time period. The Historical Fi360 Fiduciary Scores at Quarter End trend chart (if included) displays the Fi360 FiduciaryScore for each calendar quarter-end during that year.
If an investment does not meet an individual due diligence criterion, points are tallied. Investments that satisfy all of the due diligence criteria receive anFi360 Fiduciary Score of 0. Every other investment is given a Score of 1-100 based on their point total, and representing their percentile ranking withintheir peer group. The Fi360 Fiduciary Score represents a suggested course of action and is not intended, nor should it be used, as the sole source ofinformation for reaching an investment decision. Visit www.fi360.com/fi360-Fiduciary-Score for the complete methodology document.
Criteria. The following criteria are included as part of the Score calculation.
Weighted Fi360 Fiduciary Score. The Weighted Score is calculated by taking the Fi360 Fiduciary Score for each holding within the model (as shown inthe Holdings table on the Factsheet) and weighting it by its respective target allocation. This is then summed to represent the Weighted Score across themodel’s holdings. If a holding does not have a Score, it is excluded from the calculation.
PERFORMANCE
Total Return (No Load). Expressed in percentage terms, an investment’s total return is determined each month by taking the change in monthly net assetvalue, reinvesting all income and capital gains distributions during that month, and dividing by the starting NAV. Reinvestments are made using the
group@@@IlN0YXRlbWVudCBvZiBBZGRpdGlvbmFsIERpc2Nsb3N1cmVzIg==@@@
Inception Date. The investment must have at least a 3 year track history1.
Manager Tenure. The investment manager must have at least a 2 year track history. (Most senior manager’s tenure)2.
Net Assets. The investment must have at least 75 million under management (Total across all share classes for funds/ETFs)3.
Composition. The investments allocation to its primary asset class should be greater than or equal to 80%. (Not applied to all peer groups)4.
Style. The investment's current style box5.
Prospectus Net Exp Ratio. The investment must place in the top 75% of its peer group6.
Alpha (3yr) - Primary Benchmark. The investment must place in the top 50% of its peer group7.
Sharpe (3yr). The investment must place in the top 50% of its peer group8.
Return (1yr). The investment must place in the top 50% of its peer group9.
Return (3yr). The investment must place in the top 50% of its peer group10.
Return (5yr). The investment must place in the top 50% of its peer group11.
Client Monitoring ReportInvestment Data as of 09/30/2018. Account holdings as of 9/30/2018.. For CLIENT_NAME
Page 28 of 36

Please see important disclosures in the Statement of Additional Disclosures. © 2018, Fi360, Inc. All rights reserved. The analysis and opinionsgenerated by Fi360, Inc. do not constitute professional investment advice and are provided solely for information purposes.
STATEMENT OF ADDITIONAL DISCLOSURES
actual reinvestment NAV, and daily payoffs are reinvested monthly. Total Return (No Load) is not adjusted for sales charges (such as front-end loads,deferred loads and redemption fees), but do reflect management, administrative, 12b-1 fees and other costs taken out of fund assets. Total returns forperiods longer than one year are expressed in terms of compounded average annual returns (also known as geometric total returns).
Total Return (With Load). Expressed in percentage terms, an investment’s total return is determined each month by taking the change in monthly netasset value, reinvesting all income and capital gains distributions during that month, and dividing by the starting NAV. Reinvestments are made using theactual reinvestment NAV, and daily payoffs are reinvested monthly. Total Return (With Load) is adjusted for front-end loads, deferred loads andredemption fees, but not taxes. For funds with front-end loads, the full amount of the load is deducted. For deferred loads and redemption fees, thepercentage charged often declines the longer the shares are held. Total returns for periods longer than one year are expressed in terms of compoundedaverage annual returns (also known as geometric total returns).
Percentile Rank. The relative ranking of an investment within its peer group on a scale of 1-100 (1 being the best) for the data point and time periodbeing measured. Rankings are calculated against the corresponding Peer Group and Number of Peers as explained in the following paragraph.Performance ranks do not account for an investment’s sales charge (if applicable). Ranks will not be provided for periods less than one year.
Number of Peers. The number of investments in the same peer group which were used to calculate any percentile rank or Fi360 Fiduciary Score. Onlyinvestments which had the given data point being ranked are included in this number, so the number of peers can change for the same investment bydata point being ranked. For Mutual funds (MF) and Exchange Traded Funds (ETF), we combine both sets of investments together to form one peergroup for ranking purposes. For Collective Investment Trusts (CIT), since many do not report timely, we utilize the pre-defined MF/ETF peer group andcalculate the ranks as an overlay on that peer group. For Group Retirement Plan Annuities (GRPA), we combine this universe with all mutual funds andETFs to form one peer group for ranking purposes. For Separately managed accounts (SMA) and Variable annuity sub accounts (VA), we use theirrespective universe of investments only.
Growth of 10k Chart. This chart shows an investment’s performance based on how $10,000 invested in the fund would have grown over time withdividends reinvested. The returns used in the graph are not load-adjusted. The growth of $10,000 begins at the investment’s inception, or the first yearlisted on the graph, whichever is appropriate. Located alongside the investment’s graph line are lines that represent the growth of $10,000 in theinvestment’s Broad Index, Peer Group Index, and Best-fit Index Benchmarks, which are listed in the Benchmarks section. All lines are plotted on alogarithmic scale, so that identical percentage changes in the value of an investment have the same vertical distance on the graph. This provides a moreaccurate representation of performance than would a simple arithmetic graph.
Upside/Downside Capture Ratio. This ratio shows whether a given fund has outperformed?gained more or lost less than?a broad market benchmarkduring periods of market strength and weakness, and if so, by how much. Upside capture ratios for funds are calculated by taking the fund’s monthlyreturn during months when the benchmark had a positive return and dividing it by the benchmark return during that same month. Downside captureratios are calculated by taking the fund’s monthly return during the periods of negative benchmark performance and dividing it by the benchmark return.Upside and downside capture ratios over three- and five-year periods are determined by calculating the geometric average for both the fund and indexreturns during the up and down months, respectively, over each time period. An upside capture ratio over 100 indicates a fund has generallyoutperformed the benchmark during periods of positive returns for the benchmark. Meanwhile, a downside capture ratio of less than 100 indicates that afund has lost less than its benchmark in periods when the benchmark has been in the red. All stock funds’ upside and downside capture ratios arecalculated versus the S&P 500, whereas bond and international funds’ ratios are calculated relative to the Barclays Capital U.S. Aggregate Bond Index andMSCI EAFE Index, respectively.
Risk/Reward Chart. This chart helps to visually review the relative reward (measured by investment return) received by a fund for the risk or volatility(measured by standard deviation) of the fund over a three or five-year period. Relatively speaking, it is preferable for the diamond to fall in the upper leftquadrant of the graph.
Benchmarks. A benchmark gives an investor a point of reference for evaluating a fund’s performance by comparing benchmark returns to the fund’sreturns. This report may utilize one or many of these benchmarks:
Broad Index. The index used in the calculation of metrics such as Alpha, Beta, and R-Squared. The Broad Index provides a common comparison point forfunds with similar investing styles across different peer groups.
Peer Group Index. The index assigned to the fund’s peer group, which is a group of funds with similar investment style. Each peer group has its own indexwhich can be used as a common comparison point between funds.
Best-fit Index. The market index that shows the highest correlation with a fund over the most-recent 36 months, as measured by the highest R-Squared.In addition, the Best-fit Index can be used to compare the betas and alphas of similar funds that show the same Best-fit Index. The Best-fit Index may
Client Monitoring ReportInvestment Data as of 09/30/2018. Account holdings as of 9/30/2018.. For CLIENT_NAME
Page 29 of 36
Please see important disclosures in the Statement of Additional Disclosures. © 2018, Fi360, Inc. All rights reserved. The analysis and opinionsgenerated by Fi360, Inc. do not constitute professional investment advice and are provided solely for information purposes.
STATEMENT OF ADDITIONAL DISCLOSURES
not be the fund’s benchmark, nor does it necessarily contain the types of securities that may be held by the fund.
Indices are unmanaged and cannot be invested in directly. Please reference the Index Descriptions section for more specific detail on each index that isincluded in this report.
VOLATILITY METRICS
Standard Deviation. A statistical measure of the historical volatility. It depicts how widely the returns varied over a certain period of time. Investors usestandard deviation to try to predict the range of returns that are most likely for a given time period. When an investment has a high standard deviation,the predicted range of performance is wide, implying greater volatility. If the investment is the only holding in an investor’s portfolio, then it is anappropriate measure of risk. If the returns follow a normal distribution, then approximately 68 percent of the time they will fall within one standarddeviation of the mean return for the investment and 95 percent of the time within two standard deviations.
Sharpe Ratio. A risk-adjusted measure developed by Nobel Laureate William Sharpe. The higher the Sharpe ratio, the better the investment’s historicalrisk-adjusted performance. The Sharpe ratio is calculated for the past three or five-year period by dividing the investment’s annualized excess return bythe standard deviation of an investment’s annualized excess return. Since this ratio uses standard deviation as its risk measure, it is most appropriatelyapplied when analyzing an investment that is an investor’s sole holding. The Sharpe ratio can be used to compare two funds directly on how much risk aninvestment had to bear to earn excess return over the risk-free rate.
MPT STATISTICS
Alpha. A measure of the difference between an investment’s actual returns and its expected performance, given its level of risk as measured by beta.Alpha is often seen as a measure of the value added or subtracted by a manager. A positive alpha figure indicates the investment has performed betterthan its beta (or expected return) would predict. In contrast, a negative alpha indicates the investment underperformed, given the expectationsestablished by the investment’s beta.
Beta. A measure of an investment’s sensitivity to market movements. The beta of the market is 1.00 by definition. An investment with a beta greaterthan 1.00 is more volatile than the market, and an investment with a beta less than 1.00 is less volatile than the market.
R-Squared. This statistic reflects the percentage of an investment’s movements that can be explained by movements in its benchmark index, showing thedegree of correlation between the investment and the benchmark. An R-squared of 100 indicates that all movements of an investment can be explainedby movements in the index. Thus, index funds that invest only in S&P 500 stocks will have an R-squared very close to 100. Conversely, a low R-squaredindicates that very few of the investment’s movements can be explained by movements in its benchmark index. An R-squared measure of 35, forexample, means that only 35% of the investment’s movements can be explained by movements in the benchmark index. R-squared can be used toascertain the significance of a particular beta. Generally, a higher R-squared will indicate a more reliable beta figure. If the R-squared is lower, then thebeta is less relevant to the investment’s performance.
EXPENSES
Prospectus Net Expense Ratio. This value is from the investment’s most recent prospectus. The percentage of investment assets used to pay foroperating expenses and management fees, including 12b-1 fees, administrative fees, and all other asset-based costs incurred by the fund, exceptbrokerage costs. Fund expenses are reflected in the fund’s Net Asset Value. Sales charges are not included in the expense ratio. The expense ratio for fundof funds is the aggregate expense ratio defined as the sum of the wrap or sponsor fees plus the estimated weighted average of the underlying fund fees.A higher expense ratio will "drag" on the overall performance of a fund compared to peers with a lower expense ratio.
Net Expense Ratio (Rank). The percentile rank for the Net Expense Ratio within the investment’s peer group. 1 being the best and 100 the worst.
Prospectus Gross Expense Ratio. This value is from the investment’s most recent prospectus. The total gross expenses (net expenses with waiver addedback in) divided by the fund’s average net assets. If it is not equal to the net expense ratio, the gross expense ratio portrays the fund’s expenses had themanager not waived a portion, or all, of its fees. Thus, to some degree, it is an indication of fee contracts. Some fee waivers have an expiration date; otherwaivers are in place indefinitely.
Audited Net Expense Ratio. The percentage of fund assets paid for operating expenses and management fees, including 12b-1 fees, administrative fees,and all other asset-based costs incurred by the fund, except brokerage costs. Fund expenses are reflected in the fund’s NAV. This expense ratio is pulleddirectly from the investment’s annual report. Sales charges are not included in the expense ratio. For fund of funds, the underlying fund expense ratios arenot included in the expense ratio.
Client Monitoring ReportInvestment Data as of 09/30/2018. Account holdings as of 9/30/2018.. For CLIENT_NAME
Page 30 of 36

Please see important disclosures in the Statement of Additional Disclosures. © 2018, Fi360, Inc. All rights reserved. The analysis and opinionsgenerated by Fi360, Inc. do not constitute professional investment advice and are provided solely for information purposes.
STATEMENT OF ADDITIONAL DISCLOSURES
Management Fee. Fee charged for the management of pooled investments such as collective investment funds, insurance/annuity products, mutualfunds and individually managed accounts.
12b-1 Fee. This value is usually taken from the fund’s prospectus but may have been edited by your financial advisor if the prospectus amount was notaccurate for your given situation. This value is part of the Net Expense Ratio. It represents a maximum annual charge deducted from investment assets topay for distribution and marketing costs. This value can be rebated back to the client to offset other expenses.
Front Load. A one-time deduction from a purchase made into the fund. The amount is relative to the amount of the investment, so that largerinvestments incur smaller rates of charge. The sales charge serves as a commission for the broker who sold the fund. Potential fees and sales charges arean important factor to consider before making an investment. The load compensates the broker or financial planner for the service of providingprofessional investment advice.
Deferred Load. A one-time charge paid at the time of the sale of the fund. The amount is relative to the amount of the investment, so that largerinvestments incur smaller rates of charge. The sales charge serves as a commission for the broker who sold the fund. Potential fees and sales charges arean important factor to consider before making an investment. The load compensates the broker or financial planner for the service of providingprofessional investment advice.
Redemption fee. Amount charged when money is withdrawn from the fund. This fee does not go back to the investment company, but rather into thefund itself and thus does not represent a net cost to shareholders. Also, unlike contingent deferred sales charges, redemption fees typically operate only inshort, specific time clauses, commonly 30, 180, or 365 days. However, some redemption fees exist for up to five years. Charges are not imposed afterthe stated time has passed. These fees are typically imposed to discourage market timers, whose quick movements into and out of an investment can bedisruptive. The charge is normally imposed on the ending share value, appreciated or depreciated from the original value.
Initial Minimum Investment. The smallest investment amount accepted for establishing a new investment in the fund. Funds often charge a lower fee forlarger initial investments and will have several share classes that provide an alternative initial investment.
Fee Waiver/Cap. This value is from the investment’s most recent prospectus. The elimination of all or part of a fund’s expense or the cap or maximum feecharged by the portfolio manager. Some fee waivers and caps have an expiration date; others are in place indefinitely. Some funds adopt this practice atvarious times to make their returns more competitive.
INVESTMENT STRATEGY & STYLE
Peer Group. Fi360 utilizes the Morningstar Category for peer group assignment. In an effort to distinguish funds by what they own, as well as by theirprospectus objectives and styles, Morningstar developed the Morningstar Categories. While the prospectus objective identifies a fund’s investment goalsbased on the wording in the fund prospectus, the Morningstar Category identifies funds based on their actual investment styles as measured by theirunderlying portfolio holdings (portfolio and other statistics over the past three years). Peer groups are for comparison only, and do not represent anyinvestable products. Please reference the Peer Group Descriptions section for more specific detail on each peer group that is included in this report.
Investment Strategy. A written summary of the Investment Objectives and Policy section found in every fund prospectus. It states the objective of thefund, and how the managers intend to invest to achieve this objective. It includes any limitations as to the fund’s investment policies, as well as any shareclass structure difference, previous names, merger, liquidation, and opening or closing information. This statement is from the fund prospectus.
Morningstar Equity Style Box™. Morningstar classifies funds as being large-cap, mid-cap, or small-cap based on the market capitalization of long stocksowned; and as value, blend, or growth based on the value-growth orientation of the stock holdings. The nine possible combinations of thesecharacteristics correspond to the nine squares of the Morningstar Style Box-size is displayed along the vertical axis and style is displayed along thehorizontal axis. The referenced data elements below are a weighted average of the long equity holdings in the portfolio.
Price/Earnings Ratio is a weighted average of the price/earnings ratios of the stocks in the underlying fund’s portfolio. The P/E ratio of a stock iscalculated by dividing the current price of the stock by its trailing 12-months’ earnings per share. In computing the average, portfolio holding is weightedby the percentage of equity assets it represents.
Price/Cash Flow Ratio is a weighted average of the price/cash-flow ratios of the stocks in a fund’s portfolio. Price/cash-flow shows the ability of abusiness to generate cash and acts as a gauge of liquidity and solvency.
Price/Book Ratio is a weighted average of the price/book ratios of all the stocks in the underlying fund’s portfolio. The P/B ratio of a company iscalculated by dividing the market price of its stock by the company’s per-share book value. Stocks with negative book values are excluded from this
Client Monitoring ReportInvestment Data as of 09/30/2018. Account holdings as of 9/30/2018.. For CLIENT_NAME
Page 31 of 36

Please see important disclosures in the Statement of Additional Disclosures. © 2018, Fi360, Inc. All rights reserved. The analysis and opinionsgenerated by Fi360, Inc. do not constitute professional investment advice and are provided solely for information purposes.
STATEMENT OF ADDITIONAL DISCLOSURES
calculation.
Geometric Average Market Capitalization of a fund’s equity portfolio offers a measure of the size of the companies in which the mutual fund invests.
Morningstar Fixed Income Style Box™. Morningstar classifies bond funds in its style box based on their interest rate sensitivity as limited, moderate andextensive measured by the average effective duration of the fund’s holdings; and their credit quality as high, medium, or low based on letter (oralphanumeric) credit ratings of the long bonds owned by third party credit rating agencies. The nine possible combinations of these characteristicscorrespond to the nine squares of the Morningstar Style Box -- quality is displayed along the vertical axis and sensitivity to interest rate along thehorizontal axis.
Morningstar seeks credit rating information from fund companies on a periodic basis (e.g., quarterly). In compiling credit rating information Morningstaraccepts credit ratings reported by fund companies that have been issued by all Nationally Recognized Statistical Rating Organizations (NRSROs). For alist of all NRSROs, please visit http://www.sec.gov/divisions/marketreg/ratingagency.htm. Additionally, Morningstar accepts foreign credit ratings fromwidely recognized or registered rating agencies. If two rating organizations/agencies have rated a security, fund companies are to report the lower rating; ifthree or more organizations/agencies have rated a security, fund companies are to report the median rating, and in cases where there are more than twoorganization/agency ratings and a median rating does not exist, fund companies are to use the lower of the two middle ratings. PLEASE NOTE:Morningstar, Inc. is not itself an NRSRO nor does it issue a credit rating on the fund. An NRSRO or rating agency ratings can change from time-to-time.
For credit quality, Morningstar combines the credit rating information provided by the fund companies with an average default rate calculation to come upwith a weighted-average credit quality. The weighted-average credit quality is currently a letter that roughly corresponds to the scale used by a leadingNRSRO. Bond funds are assigned a style box placement of ""low"", ""medium"", or ""high"" based on their average credit quality. Funds with a low creditquality are those whose weighted-average credit quality is determined to be less than ""BBB-""; medium are those less than ""AA-"", but greater or equalto ""BBB-""; and high are those with a weighted-average credit quality of ""AA-"" or higher. When classifying a bond portfolio, Morningstar first maps theNRSRO credit ratings of the underlying holdings to their respective default rates (as determined by Morningstar’s analysis of actual historical defaultrates). Morningstar then averages these default rates to determine the average default rate for the entire bond fund. Finally, Morningstar maps thisaverage default rate to its corresponding credit rating along a convex curve.
For interest-rate sensitivity, Morningstar obtains from fund companies the average effective duration. Generally, Morningstar classifies a fixed-incomefund’s interest-rate sensitivity based on the effective duration of the Morningstar Core Bond Index (MCBI), which is currently three years. Theclassification of Limited will be assigned to those funds whose average effective duration is between 25% to 75% of MCBI’s average effective duration;funds whose average effective duration is between 75% to 125% of the MCBI will be classified as Moderate; and those that are at 125% or greater of theaverage effective duration of the MCBI will be classified as Extensive.
For municipal bond funds, Morningstar also obtains from fund companies the average effective duration. In these cases, static breakpoints are utilized.These breakpoints are as follows: (i) Limited: 4.5 years or less; (ii) Moderate: more than 4.5 years but less than 7 years; and (iii) Extensive: more than 7years. In addition, for non-US taxable and non-US domiciled fixed income funds static duration breakpoints are used: (i) Limited: less than or equal to 3.5years; (ii) Moderate: greater than 3.5 and less than equal to 6 years; (iii) Extensive: greater than 6 years.
The referenced data elements below are a weighted average of the long fixed income holdings in the portfolio.
Average Effective Duration is a weighted average of the duration of the underlying fixed income securities within the portfolio.
Average Effective Maturity is a weighted average of all the maturities of the bonds in a portfolio, computed by weighting each maturity date by themarket value of the security.
Average Weighted Price is generated from the fund’s portfolio by weighting the price of each bond by its relative size in the portfolio. This number revealsif the fund favors bonds selling at prices above or below face value (premium or discount securities, respectively). A higher number indicates a bias towardpremiums. This statistic is expressed as a percentage of par (face) value.
Credit Quality Breakdowns are shown for corporate-bond holdings and depict the quality of bonds in the underlying portfolio. The report shows thepercentage of fixed-income securities that fall within each credit quality rating as assigned by an NRSRO. Bonds not rated by an NRSRO are included inthe not rated (NR) category.
Turnover Ratio is a decent proxy for how frequently a manager trades his or her portfolio. The inverse of a fund’s turnover ratio is the average holdingperiod for a security in the fund. As turnover increases, a fund’s brokerage costs typically rise as well.
WEIGHTINGS & HOLDINGS
Client Monitoring ReportInvestment Data as of 09/30/2018. Account holdings as of 9/30/2018.. For CLIENT_NAME
Page 32 of 36
Please see important disclosures in the Statement of Additional Disclosures. © 2018, Fi360, Inc. All rights reserved. The analysis and opinionsgenerated by Fi360, Inc. do not constitute professional investment advice and are provided solely for information purposes.
STATEMENT OF ADDITIONAL DISCLOSURES
Sector Weightings. Calculated for all stock and bond funds based on the securities in the fund’s most recent portfolio. For stock funds, this statistic shows the percentage of the fund’s stock assets invested in each of the 12 major equity sectors. For taxable bond funds, this statistic shows the percent of the fund’s cash and bond assets invested in each of the 14 fixed-income sectors. For municipal bond funds, this statistic shows the percentage of the fund’s municipal assets invested in each of the 11 muni sectors.
Regional Weightings. This data set provides a broad breakdown of a fund’s geographical exposure for a region. Each region’s exposure is presented as a percentage of non-cash equity assets held by the fund. Regional exposure information summarizes a portfolio’s exposure to geopolitical risk.
CLIENT PERFORMANCE SUMMARYWith the exception of any custom investments, the underlying investments and their monthly return streams used in the calculations are sourced from © 2019 Morningstar, Inc. All rights reserved . Performance is calculated by taking the current investments and allocations (as they exist today) and assume they have remained this way over the last 10 years with annual rebalancing back to the original allocations. Performance represents historical performance of the current investments in the portfolio.
The monthly investment returns used in the calculations are Total Returns (with no loads included) so they are not adjusted for sales charges (such as front-end loads, deferred loads and redemption fees), but do reflect management, administrative, 12b-1 fees and other costs taken out of fund assets. If an investment does not have a return for a given month, the weighted return for only that month is calculated excluding the investment’s allocation. The individual investment monthly returns are compounded to result in the portfolio return and risk metrics shown in this report.
A benchmark gives an investor a point of reference for evaluating a portfolio’s performance by comparing benchmark returns to the portfolio returns This report may use the following types of benchmarks:
Peer Group Benchmark. Fi360 will automatically take each investment in the portfolio and map it to their corresponding peer group for each historical period used in the calculations. We then use the median manager return for that peer group and calculate a weighted monthly return based on these median manager returns. This provides a benchmark as if you were invested in the median manager of a given peer group instead of the actual investment manager that was selected. So, any outperformance of the portfolio to this benchmark usually denotes that you have selected investments which have consistently outperformed the median of their peer groups.
Blended Benchmark. This custom benchmark is specified by the financial advisor or other third party who constructed the portfolio. It usually contains a blended set of indices which best represent the underlying risks and objectives of a given portfolio. A weighted monthly return is calculated based on these underlying indices. This provides a representative benchmark to compare the portfolio performance against.
Performance Chart. The Growth of 10k chart shows the portfolio performance based on how $10,000 invested in the portfolio would have grown over time with dividends reinvested. The returns used in the graph are not load-adjusted. The growth of $10,000 begins 10 years ago unless none of the investments have a 10yr history. Located alongside the portfolio graph line are lines that represent the growth of $10,000 in the Peer Group Benchmark, and if selected, the Blended Benchmark. The Peer Group Benchmark and the Blended Benchmark are detailed in the Client Performance Summary Section.. All lines are plotted on a logarithmic scale, so that identical percentage changes in the value of a fund have the same vertical distance on the graph. This provides a more accurate representation of performance than would a simple arithmetic graph.
Client Monitoring ReportInvestment Data as of 09/30/2018. Account holdings as of 9/30/2018.. For CLIENT_NAME
Page 33 of 36
Please see important disclosures in the Statement of Additional Disclosures. © 2018, Fi360, Inc. All rights reserved. The analysis and opinionsgenerated by Fi360, Inc. do not constitute professional investment advice and are provided solely for information purposes.
STATEMENT OF ADDITIONAL DISCLOSURES: INDEX DESCRIPTIONS
Barclays.
This following indices are part of this family:
BBgBarc US Agg Bond TR USD. The index measures the performance of investment grade, U.S. dollar-denominated, fixed-rate taxable bondmarket, including Treasuries, government-related and corporate securities, MBS (agency fixed-rate and hybrid ARM passthroughs), ABS, and CMBS.It rolls up into other Barclays flagship indices, such as the multi-currency Global Aggregate Index and the U.S. Universal Index, which includes highyield and emerging markets debt.
Russell. Russell Investment Group is the source and owner of the trademarks, service marks and copyrights related to the Russell Indexes. Russell® is atrademark of Russell Investment Group.
This following indices are part of this family:
Russell 1000 Growth TR USD. The index measures the performance of the large-cap growth segment of the US equity securities. It includes theRussell 1000 index companies with higher price-to-book ratios and higher forecasted growth values. It is market-capitalization weighted. RussellInvestment Group is the source and owner of the trademarks, service marks and copyrights related to the Russell Indexes. Russell® is a trademark ofRussell Investment Group.
Russell 1000 TR USD. The index measures the performance of the large-cap segment of the US equity securities. It is a subset of the Russell3000 index and includes approximately 1000 of the largest securities based on a combination of their market cap and current index membership.
Russell 1000 Value TR USD. The index measures the performance of the large-cap value segment of the US equity securities. It includes theRussell 1000 index companies with lower price-to-book ratios and lower expected growth values. It is market-capitalization weighted. RussellInvestment Group is the source and owner of the trademarks, service marks and copyrights related to the Russell Indexes. Russell® is a trademark ofRussell Investment Group.
Russell Mid Cap TR USD. The index measures the performance of the mid-cap segment of the US equity universe. It is a subset of Russell 1000index and includes approximately 800 of the smallest securities based on a combination of their market cap and current index membership. Theindex represents approximately 31% of the total market capitalization of the Russell 1000 companies.
group@@@IlN0YXRlbWVudCBvZiBBZGRpdGlvbmFsIERpc2Nsb3N1cmVzOiBJbmRleCBEZXNjcmlwdGlvbnMi@@@
Client Monitoring ReportInvestment Data as of 09/30/2018. Account holdings as of 9/30/2018.. For CLIENT_NAME
Page 34 of 36

Please see important disclosures in the Statement of Additional Disclosures. © 2018, Fi360, Inc. All rights reserved. The analysis and opinionsgenerated by Fi360, Inc. do not constitute professional investment advice and are provided solely for information purposes.
STATEMENT OF ADDITIONAL DISCLOSURES: PEER GROUP DESCRIPTIONS
Intermediate-Term Bond. Intermediate-term bond portfolios invest primarily in corporate and other investment-grade U.S. fixed-income issuesand typically have durations of 3.5 to 6.0 years. These portfolios are less sensitive to interest rates, and therefore less volatile, than portfolios thathave longer durations. Morningstar calculates monthly breakpoints using the effective duration of the Morningstar Core Bond Index in determiningduration assignment. Intermediate-term is defined as 75% to 125% of the three-year average effective duration of the MCBI.
Large Blend. Large-blend portfolios are fairly representative of the overall US stock market in size, growth rates and price. Stocks in the top 70% ofthe capitalization of the US equity market are defined as large cap. The blend style is assigned to portfolios where neither growth nor valuecharacteristics predominate. These portfolios tend to invest across the spectrum of US industries, and owing to their broad exposure, the portfolios'returns are often similar to those of the S&P 500 Index.
Large Growth. Large-growth portfolios invest primarily in big U.S. companies that are projected to grow faster than other large-cap stocks. Stocksin the top 70% of the capitalization of the U.S. equity market are defined as large cap. Growth is defined based on fast growth (high growth rates forearnings, sales, book value, and cash flow) and high valuations (high price ratios and low dividend yields). Most of these portfolios focus oncompanies in rapidly expanding industries.
Large Value. Large-value portfolios invest primarily in big U.S. companies that are less expensive or growing more slowly than other large-capstocks. Stocks in the top 70% of the capitalization of the U.S. equity market are defined as large cap. Value is defined based on low valuations (lowprice ratios and high dividend yields) and slow growth (low growth rates for earnings, sales, book value, and cash flow).
Mid-Cap Blend. The typical mid-cap blend portfolio invests in U.S. stocks of various sizes and styles, giving it a middle-of-the-road profile. Mostshy away from high-priced growth stocks but aren't so priceconscious that they land in value territory. The U.S. mid-cap range for marketcapitalization typically falls between $1 billion and $8 billion and represents 20% of the total capitalization of the U.S. equity market. The blend styleis assigned to portfolios where neither growth nor value characteristics predominate.
group@@@IlN0YXRlbWVudCBvZiBBZGRpdGlvbmFsIERpc2Nsb3N1cmVzOiBQZWVyIEdyb3VwIERlc2NyaXB0aW9ucyI=@@@
Client Monitoring ReportInvestment Data as of 09/30/2018. Account holdings as of 9/30/2018.. For CLIENT_NAME
Page 35 of 36

Please see important disclosures in the Statement of Additional Disclosures. © 2018, Fi360, Inc. All rights reserved. The analysis and opinionsgenerated by Fi360, Inc. do not constitute professional investment advice and are provided solely for information purposes.
Bonds. Bonds are subject to interest rate risk. As the prevailing level of bond interest rates rise, the value of bonds already held in a portfolio decline.Portfolios that hold bonds are subject to declines and increases in value due to general changes in interest rates. Bonds are also subject toprepayment risk, which is the chance that an issuer may exercise its right to prepay its security, if falling interest rates prompt the issuer to do so.Forced to reinvest the unanticipated proceeds at lower interest rates, the fund would experience a decline in income and lose the opportunity foradditional price appreciation.
Large Cap Equities. Concentrating assets in large-capitalization stocks may subject the portfolio to the risk that those stocks underperform othercapitalizations or the market as a whole. Large-cap companies may be unable to respond as quickly as small- and mid-cap companies can to newcompetitive pressures and may lack the growth potential of those securities. Historically, large-cap companies do not recover as quickly as smallercompanies do from market declines.
Small/Mid Cap Equities. Portfolios that invest in stocks of small- to mid-cap companies involve additional risks. Smaller companies typically have ahigher risk of failure and are not as well established as larger blue-chip companies. Historically, smaller company stocks have experienced a greaterdegree of market volatility that the overall market average.
Taxable Bond. Investments in taxable bonds such as government bonds, long-term and short-term bonds, bank loans, corporate bonds, preferredstock, high-yield bonds, etc. are subject to numerous risks including those relating to reinvestment, inflation, market, selection, timing, and duration.
Client Monitoring ReportInvestment Data as of 09/30/2018. Account holdings as of 9/30/2018.
STATEMENT OF ADDITIONAL DISCLOSURES: RISKS
grIoup@@@IlnN0YXRlbWVvudCBvZiBBZGRpdesGlvbmFsIERpc2Nsb3N1cmVzOiBSaXNrcyI=@@@ting involves risk. Loss of principal is possible. An investment in a fund is not a bank deposit, and it is not insured or guaranteed by the Federal
Deposit Insurance Corporation (FDIC) or any other government agency. Each fund carries its own specific risks which depend on the types of investments
in the fund. Investors should review the fund’s prospectus carefully to understand the risks before investing.
In general, some of the risks associated with the Morningstar Categories shown in this report are as follows:
For CLIENT_NAME
Page 36 of 36