Sheetlines - Amazon S3
63
Sheetlines The journal of THE CHARLES CLOSE SOCIETY for the Study of Ordnance Survey Maps This edition of Sheetlines was published in 2010 and the articles may have been superseded by later research. Please check the index at http://www.charlesclosesociety.org/sheetlinesindex for the most up-to-date references This article is provided for personal, non-commercial use only. Please contact the Society regarding any other use of this work. Published by THE CHARLES CLOSE SOCIETY for the Study of Ordnance Survey Maps www.CharlesCloseSociety.org The Charles Close Society was founded in 1980 to bring together all those with an interest in the maps and history of the Ordnance Survey of Great Britain and its counterparts in the island of Ireland. The Society takes its name from Colonel Sir Charles Arden-Close, OS Director General from 1911 to 1922, and initiator of many of the maps now sought after by collectors. The Society publishes a wide range of books and booklets on historic OS map series and its journal, Sheetlines, is recognised internationally for its specialist articles on Ordnance Survey-related topics.
-
Upload
khangminh22 -
Category
Documents
-
view
0 -
download
0
Transcript of Sheetlines - Amazon S3

SheetlinesThe journal of
THE CHARLES CLOSE SOCIETYfor the Study of Ordnance Survey Maps
This edition of Sheetlines was publishedin 2010 and the articles may have been
superseded by later research.Please check the index at
http://www.charlesclosesociety.org/sheetlinesindexfor the most up-to-date references
This article is provided for personal, non-commercial use only.Please contact the Society regarding any other use of this work.
Published byTHE CHARLES CLOSE SOCIETY
for the Study of Ordnance Survey Mapswww.CharlesCloseSociety.org
The Charles Close Society was founded in 1980 to bring together all those withan interest in the maps and history of the Ordnance Survey of Great Britain andits counterparts in the island of Ireland. The Society takes its name from ColonelSir Charles Arden-Close, OS Director General from 1911 to 1922, and initiator ofmany of the maps now sought after by collectors.
The Society publishes a wide range of books and booklets on historic OS mapseries and its journal, Sheetlines, is recognised internationally for its specialistarticles on Ordnance Survey-related topics.

Number 89 December 2010
SheetlinesThe Journal of
THE CHARLES CLOSE SOCIETYfor the Study of Ordnance Survey Maps
Published byThe Charles Close Society for the Study of Ordnance Survey Mapswww.charlesclosesociety.org© Copyright 2010The various authors and the Charles Close Society
Printed by Winfield Print & Design Ltd
Sheetlines Number 89 - December 2010
Ordnance Survey consultation Richard OliverD F WattAnthony Cartmell 3Imortant new listings on CCS website 7Alan Sillitoe (1928-2010) David Archer 9Ordnance Survey and cartographic style Alexander J Kent 11Oxbridge ramblings Chris Higley 17More New Popular printings and KS Andrewsother discoveries and PS Welham 25Cover up:recent changes to OS leisure map covers Ed Fielden 33More battles John Cole 36My great, great grandfatherwas a leveller and contourer Bob Shannon 37Surveyor's name on an OS map Richard T Porter 41Not such a Scilly map? Gerry Zierler 45Puzzle corner 88 46Kerry musings David Archer 47Review: The landscape of London Richard Oliver 50Letters 52
Sheetlines Number 89 December 2010
Sadly, two of the earliest members of the Society, John Beer and Campbell Ballantyne have died recently. They and their contributions will be missed and we extend sympathies to their respective families.
Our member Rachel Hewitt’s Map of a nation: a biography of the Ordnance Survey was published in October to much acclaim in the national press. Richard Oliver’s comprehensive review appears on page 40.
We also have in this issue John King’s review of Cassini map teaching set and Gerry Zierler’s note about Anderson Geographic’s new Windsor Great Park map. Both are offered to CCS members at special discount; details on page 32.
You may have thought that the reason the Irish don’t have postcodes is, ‘To be sure, just ask, everyone knows where you live’. But, as Paul Ferguson explains on page 16 it’s more complicated than that.
What is the connection between OS and Oz? The answer is Felix Dennis and the explanation is that the print company Butler, Tanner and Dennis of Frome, owned by Felix Dennis, has just won a four-year contract to print OS maps. The contract, said to be worth £8-10 million and call for an annual print run of 2.3 million maps, results from the closure of OS own in-house print facilities. At time of writing production has not yet started as the necessary folding machines have not yet been transferred from OS. On page 33 of this issue David Archer considers the role of OS as a ‘map producer’. And Oz? Older members will recall that Felix Dennis was one of the defendants in the notorious 1971 Oz magazine obscenity trial at the Old Bailey.
Elsewhere this issue, both John Cruickshank and John Davies report new research into Cold War mapping of Britain. Coincidentally, Landmark’s website www.old-maps.co.uk has been enhanced to offer Soviet military maps of many towns and cities, as well as the existing extensive range of historic OS maps.
Our own website www.CharlesCloseSociety.org has also been greatly extended recently and now has an extensive library of Sheetlines articles, more digital images from the CCS Archives and updated listings of OS ancillary publications.
Some errors unfortunately crept into the accounts published in the 2010 Almanack, which accompanied Sheetlines 88. Footnotes 2 and 3 on page 20 were transposed and the final item in the Publications fund receipts column on page 21 should read ‘Excess of payments over receipts’. We apologise for these mistakes in transcription. The version issued at the AGM was correct.
Summer expeditions have been arranged for members to visit Gotha and Dublin. See page 53 for details. Numbers are strictly limited; book early!

2
Diary 2011
20 January, Warburg. Gillian Hutchinson (National Maritime Museum, Greenwich). The first two centuries of Mercator projection sea charts: positioning the practitioners, leaving the ships at sea?
17 February, Warburg. Emeritus Professor Roy Bridges (U. of Aberdeen). Cartography and credulity: mapping the sources of the Nile since 150 AD.
22 February, Cambridge. Allison Ksiazkiewicz (Cambridge University). Colour and problems of visualising space in early nineteenth-century geological maps of Britain.
3 March, Warburg. Dr John Montague (Royal Irish Academy, Dublin). London 1747 and Dublin 1756: John Rocque’s capital city maps.
10 March, Oxford. David Fletcher (London Met. University). The Commission on the Royal Forests 1787-93: Maps and parliamentary scrutiny in Britain.
31 March, Warburg. Tom Harper (British Library). A window on the world: Maps in the European schoolroom in nineteenth and twentieth centuries.
31 March, University of Nottingham. Peter Barber (British Library). Maps to the public: What use, lies, London and magnificent maps. 5pm, Lecture theatre A40, Sir Clive Granger Building. Details from [email protected]
4-5 April, Natural History Museum, London. Conference on Geological collectors and collecting organised by the History of Geology Group. Details from Nina Morgan at [email protected]
5 May, Warburg. Dr Diarmuid Scully (University College, Cork). Mapping the farthest Western lands: Gerald of Wales on Ireland and English imperium in the twelfth century.
7 May, CCS Annual General Meeting, Kingston-on-Thames
10 May, Cambridge. Nessa Cronin (National University of Ireland, Galway). Number, weight or measure: Mapping colonial governmentality in William Petty's political anatomy of Ireland.
May or June, (date to be agreed). CCS visit to Gotha. See page 53.
7-9 July. CCS visit to Dublin. See page 53.
Cambridge: Meetings held at Gardner Room, Emmanuel College, St Andrew’s Street, Cambridge, CB2 3AP at 5.30pm. Admission free, all welcome.
Oxford: Seminars run from 5.00pm to 6.30pm at the University of Oxford Centre for the Environment, South Parks Road, Oxford, OX1 3QY.
Warburg: Maps & Society Series. Meetings held at The Warburg Institute, University of London, Woburn Square, London WC1H OAB at 5.00pm. Admission free, all welcome. Meetings are followed by refreshments.
3
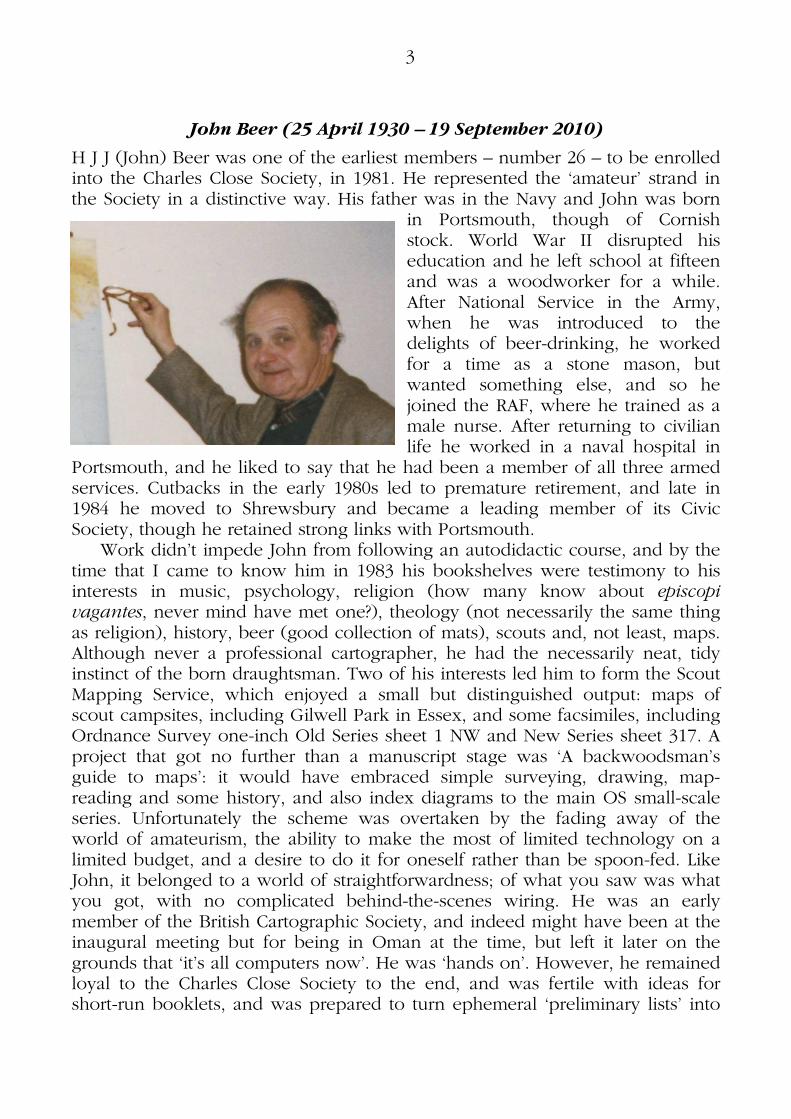
John Beer (25 April 1930 – 19 September 2010)
H J J (John) Beer was one of the earliest members – number 26 – to be enrolled into the Charles Close Society, in 1981. He represented the ‘amateur’ strand in the Society in a distinctive way. His father was in the Navy and John was born
in Portsmouth, though of Cornish stock. World War II disrupted his education and he left school at fifteen and was a woodworker for a while. After National Service in the Army, when he was introduced to the delights of beer-drinking, he worked for a time as a stone mason, but wanted something else, and so he joined the RAF, where he trained as a male nurse. After returning to civilian life he worked in a naval hospital in
Portsmouth, and he liked to say that he had been a member of all three armed services. Cutbacks in the early 1980s led to premature retirement, and late in 1984 he moved to Shrewsbury and became a leading member of its Civic Society, though he retained strong links with Portsmouth.
Work didn’t impede John from following an autodidactic course, and by the time that I came to know him in 1983 his bookshelves were testimony to his interests in music, psychology, religion (how many know about episcopi vagantes, never mind have met one?), theology (not necessarily the same thing as religion), history, beer (good collection of mats), scouts and, not least, maps. Although never a professional cartographer, he had the necessarily neat, tidy instinct of the born draughtsman. Two of his interests led him to form the Scout Mapping Service, which enjoyed a small but distinguished output: maps of scout campsites, including Gilwell Park in Essex, and some facsimiles, including Ordnance Survey one-inch Old Series sheet 1 NW and New Series sheet 317. A project that got no further than a manuscript stage was ‘A backwoodsman’s guide to maps’: it would have embraced simple surveying, drawing, map-reading and some history, and also index diagrams to the main OS small-scale series. Unfortunately the scheme was overtaken by the fading away of the world of amateurism, the ability to make the most of limited technology on a limited budget, and a desire to do it for oneself rather than be spoon-fed. Like John, it belonged to a world of straightforwardness; of what you saw was what you got, with no complicated behind-the-scenes wiring. He was an early member of the British Cartographic Society, and indeed might have been at the inaugural meeting but for being in Oman at the time, but left it later on the grounds that ‘it’s all computers now’. He was ‘hands on’. However, he remained loyal to the Charles Close Society to the end, and was fertile with ideas for short-run booklets, and was prepared to turn ephemeral ‘preliminary lists’ into

4
neat little booklets to grace his shelves. His last appearance at a CCS AGM was at Ludlow in 2009.
Mention of Oman prompts mention of possibly John’s most remarkable map: certainly the most controversial. Around 1963 he was posted to Salālah as part of a small medical team attending a British base there. There was an agreement with the Sultan that there would be no mapping, but John managed to compile a 1:100,000 of the district around Salālah from various sources. It was practically desert, and much of the map was pretty empty, but nonetheless the British authorities weren’t happy, and Aircraftsman Beer gained what might be termed a certain limited notoriety, not least at what was then Survey Production Centre, RE, which added a copy of the map to its collection. (One wonders if it is still there.)
In losing John we have lost a good friend. Richard Oliver
We hope to be able to include Campell Ballantyne’s obituary in our next issue.
Engineering the Olympic Park
This newly-published customised OS map of the London 2012 Olympic Park at a scale of 1:4000 is distributed free of charge in co-operation with the Institution of Civil Engineers. Its purpose is to celebrate the work of the Olympic Delivery Authority, recognising the outstanding achievements of civil engineers in creating a lasting legacy in the regeneration of east London.

5
How big a map does it take to build socialism?
John L Cruickshank
We are now accustomed to the idea that the USSR mapped this country along with everybody else’s. Since John Davies introduced us to the appearance and arrangement of the Soviet military-topographic maps at various scales we have got used to their rigid standardisation, and their system of small sheet sizes based on subdivisions of the sheets of the International Map of the World (IMW).1 We are familiar with the Gauss-Krüger projection on which they are constructed, and the Gauss-Krüger grids that sheets at 1:200,000 and larger carry. We have also become accustomed to the enormous numbers of these small sheets that were produced.
But John only discussed some of the Soviet military map series covering the United Kingdom; there are others! In particular not all Soviet military maps were plotted on Gauss-Krüger or IMW projections, nor were they all structured according to IMW sheet lines.
Maps constructed using the standard system of projections and sheet lines have many advantages: the whole world can be mapped uniformly, and for artillery the use of a projection and grid that preserve angular relationships is essential. However these maps have a major disadvantage when sheets are assembled together to portray a large area. The area within the margins of each sheet is not rectangular, but is approximately trapezoidal. Furthermore the edges of the trapezium are curved, sometimes markedly so. In practice when such sheets are stuck together, particularly those at the scales of 1:500,000 and 1:1,000,000, there has to be some fudging at the joins if the resulting composite map is to lie on a flat surface. And the greater the number of sheets to be assembled, the greater the fudge required.
Nevertheless, every military headquarters in every army in the world requires a large map of its entire command area on a wall, the scale of the map usually being chosen such that the whole of the available wall is covered. The size of the wall is generally related to the status of the commanding officer. Since the Red Army (subsequently the Soviet Army) was especially large, it in particular had many high-status commanders requiring large wall-maps.
To satisfy this need the Soviet Military-Topographic Service thus produced a succession of map series with rectangular sheets that could be assembled together. Not all these series had to cover the whole world; their projections and sheet lines were chosen to accommodate the requirements of commanders for large maps of ‘their’ part of the earth’s surface.
1 John Davies, Uncle Joe knew where you lived, Sheetlines 72 (2005), 26-38, and Sheetlines 73 (2005), 6-20.
6
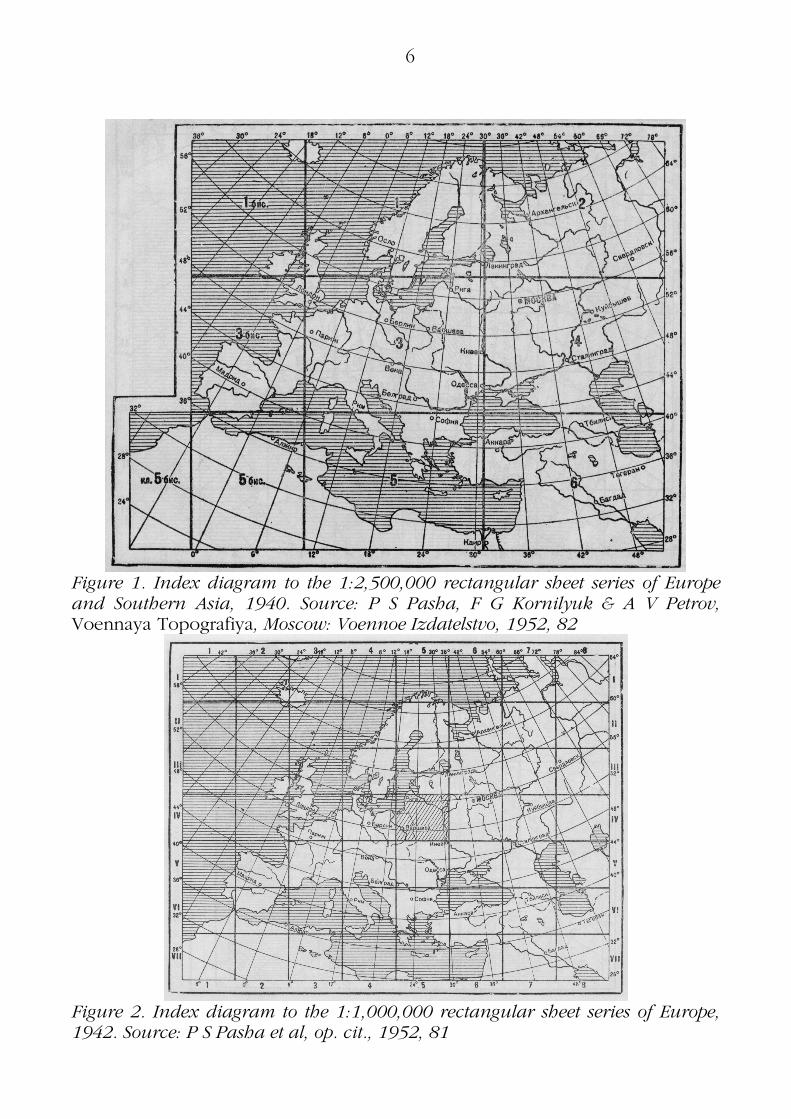
Figure 1. Index diagram to the 1:2,500,000 rectangular sheet series of Europe and Southern Asia, 1940. Source: P S Pasha, F G Kornilyuk & A V Petrov, Voennaya Topografiya, Moscow: Voennoe Izdatelstvo, 1952, 82
Figure 2. Index diagram to the 1:1,000,000 rectangular sheet series of Europe, 1942. Source: P S Pasha et al, op. cit., 1952, 81

7
The first of these series covering Britain was a 1:2,500,000 map issued in 1940. Originally comprising six sheets covering European Russia, the Near East, and Central Europe as far west as Glasgow, by the early 1950s it had been augmented with four extension sheets to cover all of Europe (including the West of England and Ireland) and much of North Africa (figure 1). This was followed in 1942 by a rectangular sheet map in fifty-six sheets at 1:1,000,000 of almost the same area (figure 2). The compilation notes on the sheets make clear that they were derived from the already existing Soviet 1:1,000,000 sheets on the IMW projection. The sheets do not make clear precisely what projection was used for either series. An apparently similar series in six sheets at 1:3,000,000 covered the eastern part of the USSR and its neighbours including Japan, Mongolia and much of China.
All these series remained current into the 1950s and beyond, but by the post-war period the political and military situation had changed substantially. Further wall-maps were needed, although not all of these were for military purposes. An important group of these comprised large display-maps of the Soviet Union itself, many of which were thematic rather than topographical. Perhaps the most celebrated of these was the huge map of the Soviet Union used as the backdrop to Lenin’s speech to the All-Russian Congress of Soviets in December 1920 when he announced the project to electrify the whole of the USSR.2 The author’s collection includes a now rather battered civil wall-map of the whole Soviet Union with its adjacent states (including much of Western Europe), comprising thirty-two printed rectangular sheets mounted onto a muslin backing. The date has been lost to fire and water damage, but the European political boundaries shown are those established at Potsdam in August 1945. The subsequent partition of Germany between the occupying powers is not shown, and nor is a boundary line marked between the USSR and Japan. The city of Breslau, while shown to be in Poland, still carries its German name (in Cyrillic letters) rather than its post-war Polish name, Wrocław. Assembled, the map measures 3.5 metres by 2.2 metres. In the 1970s a similar size geological map of the USSR used to decorate one of the stair-lobbies in the Earth Sciences Department of Leeds University.
In the early 1970s the Soviet military decided that they needed something bigger and better. By then they had prepared extensive topographic mapping of Western Europe using the standard projections and IMW-based sheet lines, and in particular the Russian-language 1:500,000 mapping of the whole continent had finally been completed. It was therefore decided to produce an additional 1:500,000 series of maps with rectangular sheets that could be assembled to create a single map covering the whole of the anticipated Western theatre of military action, plus most of the European part of the Soviet Union. The whole area between Connemara and the Urals could thus be shown on a single map (if you had a room big enough).
2 This was the occasion when Communism was defined as being ‘Soviet power plus electrification of the whole country’.
8
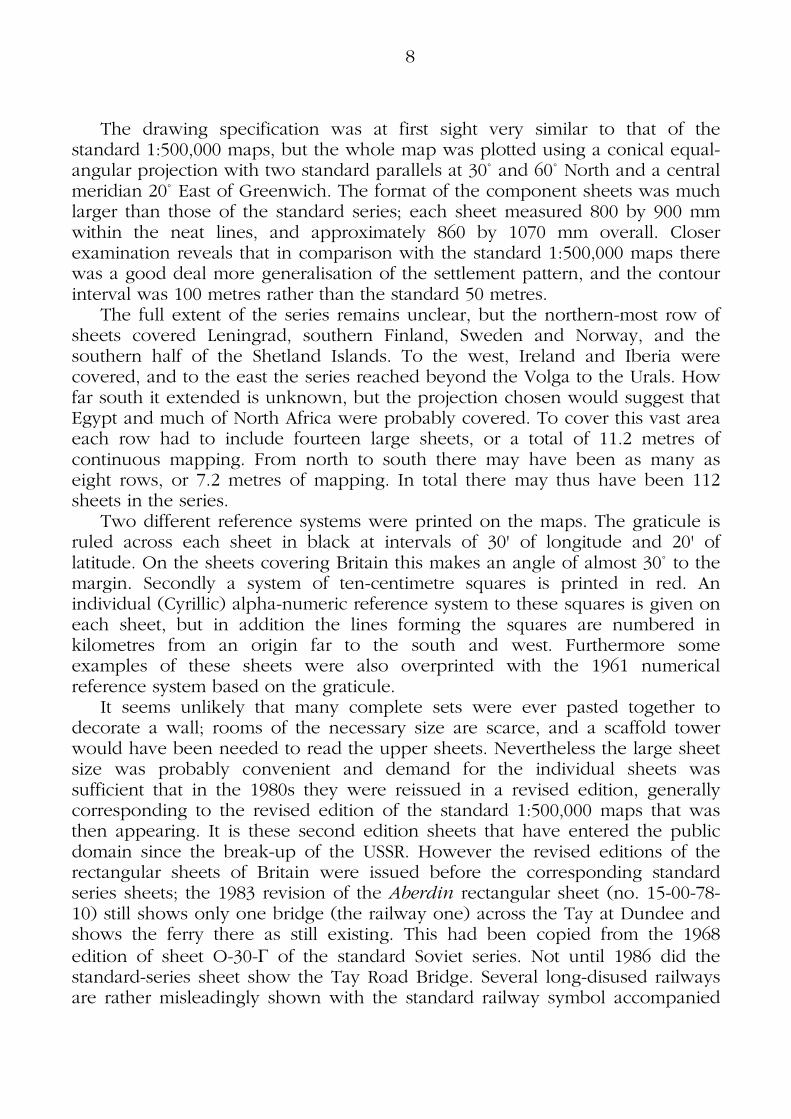
The drawing specification was at first sight very similar to that of the standard 1:500,000 maps, but the whole map was plotted using a conical equal-angular projection with two standard parallels at 30˚ and 60˚ North and a central meridian 20˚ East of Greenwich. The format of the component sheets was much larger than those of the standard series; each sheet measured 800 by 900 mm within the neat lines, and approximately 860 by 1070 mm overall. Closer examination reveals that in comparison with the standard 1:500,000 maps there was a good deal more generalisation of the settlement pattern, and the contour interval was 100 metres rather than the standard 50 metres.
The full extent of the series remains unclear, but the northern-most row of sheets covered Leningrad, southern Finland, Sweden and Norway, and the southern half of the Shetland Islands. To the west, Ireland and Iberia were covered, and to the east the series reached beyond the Volga to the Urals. How far south it extended is unknown, but the projection chosen would suggest that Egypt and much of North Africa were probably covered. To cover this vast area each row had to include fourteen large sheets, or a total of 11.2 metres of continuous mapping. From north to south there may have been as many as eight rows, or 7.2 metres of mapping. In total there may thus have been 112 sheets in the series.
Two different reference systems were printed on the maps. The graticule is ruled across each sheet in black at intervals of 30' of longitude and 20' of latitude. On the sheets covering Britain this makes an angle of almost 30˚ to the margin. Secondly a system of ten-centimetre squares is printed in red. An individual (Cyrillic) alpha-numeric reference system to these squares is given on each sheet, but in addition the lines forming the squares are numbered in kilometres from an origin far to the south and west. Furthermore some examples of these sheets were also overprinted with the 1961 numerical reference system based on the graticule.
It seems unlikely that many complete sets were ever pasted together to decorate a wall; rooms of the necessary size are scarce, and a scaffold tower would have been needed to read the upper sheets. Nevertheless the large sheet size was probably convenient and demand for the individual sheets was sufficient that in the 1980s they were reissued in a revised edition, generally corresponding to the revised edition of the standard 1:500,000 maps that was then appearing. It is these second edition sheets that have entered the public domain since the break-up of the USSR. However the revised editions of the rectangular sheets of Britain were issued before the corresponding standard series sheets; the 1983 revision of the Aberdin rectangular sheet (no. 15-00-78-10) still shows only one bridge (the railway one) across the Tay at Dundee and shows the ferry there as still existing. This had been copied from the 1968 edition of sheet O-30-Г of the standard Soviet series. Not until 1986 did the standard-series sheet show the Tay Road Bridge. Several long-disused railways are rather misleadingly shown with the standard railway symbol accompanied

9
Figure 3. Extract from the 1983 edition of sheet 15-00-78-10 Aberdin showing two underwater gas pipelines (black lines with open circles) meeting off-shore before reaching land north of Peterhead, and an oil pipeline (black line with solid circles) reaching land at Cruden Bay south of Peterhead. The pipelines join on land south of Cruden Bay and continue southwards, marked as an oil pipeline. Note the obliquity of the graticule to the red ruled lines which are parallel to the sheet margins
by the Russian word for ‘disused’ in very small letters. However even more misleadingly, the Kyle of Lochalsh railway line is also shown as disused!
What is however especially notable is that the 1983 Aberdin rectangular sheet shows several sub-sea oil and gas pipelines that are not shown on either edition of the standard series, including an oil pipeline in the Moray Firth landing at Balintore, another landing at Flotta in the Orkneys, and gas and oil
pipelines landing north and south of Peterhead (figure 3). From these last an oil pipeline is shown on land passing Forfar to Perth and onward on the Birmingem sheet (15-00-78-00), eventually reaching Eston on Teesside, where another oil pipeline from the North Sea is marked as landing. Further south, a North-Sea gas pipeline is marked crossing Spurn (where there is a strange discontinuity) and the Humber to reach Immingham and a further one reaches land north of Mablethorpe. None of these pipelines appear on the standard-series sheets, and nor indeed are they mapped by the Ordnance Survey. It would thus be interesting to know the source of this (then very recent) data.
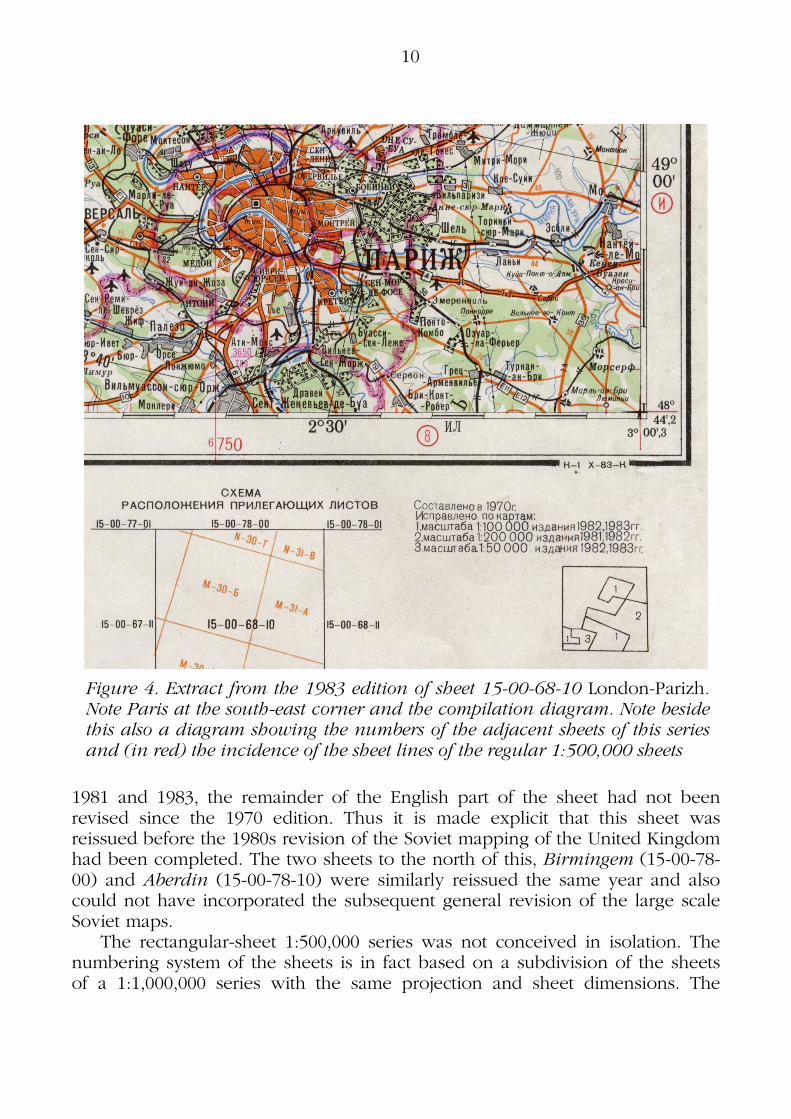
The compilation notes on these sheets are generally very brief, giving no more than the dates of compilation and revision. However one sheet provides more detail. The 1983 edition of the London-Parizh sheet (15-00-68-10) carries a diagram of the different materials used for its revision (figure 4). This confirms that while the London area and much of France had been revised from larger-scale Soviet maps dated between
10
1981 and 1983, the remainder of the English part of the sheet had not been revised since the 1970 edition. Thus it is made explicit that this sheet was reissued before the 1980s revision of the Soviet mapping of the United Kingdom had been completed. The two sheets to the north of this, Birmingem (15-00-78-00) and Aberdin (15-00-78-10) were similarly reissued the same year and also could not have incorporated the subsequent general revision of the large scale Soviet maps.
The rectangular-sheet 1:500,000 series was not conceived in isolation. The numbering system of the sheets is in fact based on a subdivision of the sheets of a 1:1,000,000 series with the same projection and sheet dimensions. The
Figure 4. Extract from the 1983 edition of sheet 15-00-68-10 London-Parizh. Note Paris at the south-east corner and the compilation diagram. Note beside this also a diagram showing the numbers of the adjacent sheets of this series and (in red) the incidence of the sheet lines of the regular 1:500,000 sheets

11
sheets of this 1:1,000,000 series have a matching drawing specification, but their compilation dates are slightly later that those of their four component 1:500,000 sheets. Thus both the 1:1,000,000 sheet Parizh (14-00-68), within which the London-Parizh 1:500,000 sheet falls, and Birmingem (14-00-78), which covers Birmingem and Aberdin at the larger scale, were originally compiled in 1973 and revised in 1986 for re-issue in 1987. The sheet numbers of the two series correspond in that all the 1:1,000,000 sheets have numbers beginning with 14 followed by a hyphen and two more pairs of digits separated by hyphens. The numbers of the corresponding 1:500,000 sheets begin with 15, followed by the same two pairs of digits plus an additional pair which identifies (in binary notation) the quarter of the 1:1,000,000 sheet. For both series the second pair of digits is ‘00’ for all sheets west of the central meridian (20˚ E) and ‘01’ for all sheets to the east of this.
In the 1980s the 1:1,000,000 series was extended one row further north than
the 1:500,000 one, to include new sheets for Tronheim (14-00-89) and Arkhangel’sk (14-01-81). The original issues at this scale extended at least as far south and east as Bagdad (14-01-42).
Assembled, of course the 1:1,000,000 map still required a very big wall, but it becomes a little easier to visualise how a map of such a size could be useable. Even so, assembling only a limited part of the series was probably more usual.
Finally it must be appreciated that these maps were merely part of a spectrum of multi-sheet wall-maps produced by the Military-Topographic Service of the Soviet General Staff. There was also a map at 1:2,500,000 of ‘The USSR and Adjacent States’3 in twenty-four rectangular sheets plotted on an ‘arbitrary pseudo-conic projection’, issued in the late 1970s. From the index diagram for this series (figure 5) it can be seen that that the definition of ‘adjacent’ was a highly inclusive one. Since each sheet measured 940 by 480 mm within the neat lines, the total size of this map was 5.76 metres long and 1.93 metres tall, plus the outside margins. There was then a military map of the whole world at 1:15,000,000 in nine similarly large sheets. There is even an
3 SSSR i Prilegayushchue Gosudarstva.
Figure 5. Index diagram to the 1:2,500,000 Soviet General Staff map in twenty-four rectangular sheets of ‘The USSR and Adjacent States’. Source: sheet 7 Parizh (1977) of the series

12
enormous 1:1,000,000 rectangular-sheet map of North and Central America produced in the early 1970s, although this does not carry a General Staff title.
Large multi-sheet wall-maps have a very long, but chequered, history. A recent British Library exhibition was devoted to the genre, emphasising their importance in symbolic, political and propaganda terms within many power and command contexts. However it also emphasised the poor survival rate of such maps.4 Their size makes them liable to damage when in use and difficult to store out of use. When political or organisational change makes them obsolete in their original contexts and locations they are prone to early destruction. Soviet military wall-maps are no exception. Even the individual component sheets are too big to store in standard plan-chests without folding. Political change has rendered their original functions obsolete. Many of their original locations have been abandoned as military sites, both inside and outside the present Russian Federation. Furthermore the Russian language with its Cyrillic alphabet is no longer quite the lingua franca it once was. While large numbers of the standard Soviet topographic series sheets have survived to enter collections around the world, the wall-maps are already much scarcer. They deserve to be more familiar, and perhaps even to be preserved preferentially.
Isle of Blue?
The Isle of ‘white’ becomes a sea of blue in the current London Connections rail map, published by Association of Train Operating Companies.
4 Peter Barber and Tom Harper, Magnificent maps; power, propaganda and art, London: The British Library, 2010, 9-10.
13
Touring amidst the tors
John Cole
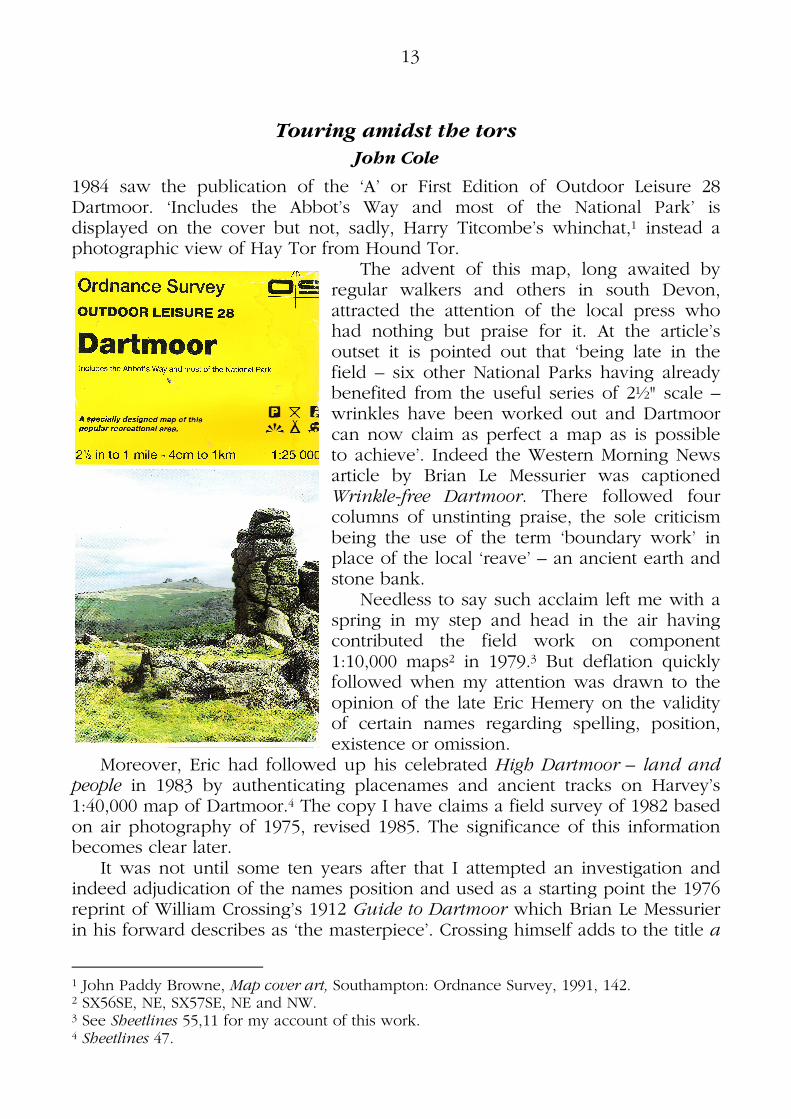
1984 saw the publication of the ‘A’ or First Edition of Outdoor Leisure 28 Dartmoor. ‘Includes the Abbot’s Way and most of the National Park’ is displayed on the cover but not, sadly, Harry Titcombe’s whinchat,1 instead a photographic view of Hay Tor from Hound Tor.
The advent of this map, long awaited by regular walkers and others in south Devon, attracted the attention of the local press who had nothing but praise for it. At the article’s outset it is pointed out that ‘being late in the field – six other National Parks having already benefited from the useful series of 2½" scale – wrinkles have been worked out and Dartmoor can now claim as perfect a map as is possible to achieve’. Indeed the Western Morning News article by Brian Le Messurier was captioned Wrinkle-free Dartmoor. There followed four columns of unstinting praise, the sole criticism being the use of the term ‘boundary work’ in place of the local ‘reave’ – an ancient earth and stone bank.
Needless to say such acclaim left me with a spring in my step and head in the air having contributed the field work on component 1:10,000 maps2 in 1979.3 But deflation quickly followed when my attention was drawn to the opinion of the late Eric Hemery on the validity of certain names regarding spelling, position, existence or omission.
Moreover, Eric had followed up his celebrated High Dartmoor – land and people in 1983 by authenticating placenames and ancient tracks on Harvey’s 1:40,000 map of Dartmoor.4 The copy I have claims a field survey of 1982 based on air photography of 1975, revised 1985. The significance of this information becomes clear later.
It was not until some ten years after that I attempted an investigation and indeed adjudication of the names position and used as a starting point the 1976 reprint of William Crossing’s 1912 Guide to Dartmoor which Brian Le Messurier in his forward describes as ‘the masterpiece’. Crossing himself adds to the title a
1 John Paddy Browne, Map cover art, Southampton: Ordnance Survey, 1991, 142. 2 SX56SE, NE, SX57SE, NE and NW. 3 See Sheetlines 55,11 for my account of this work. 4 Sheetlines 47.
14
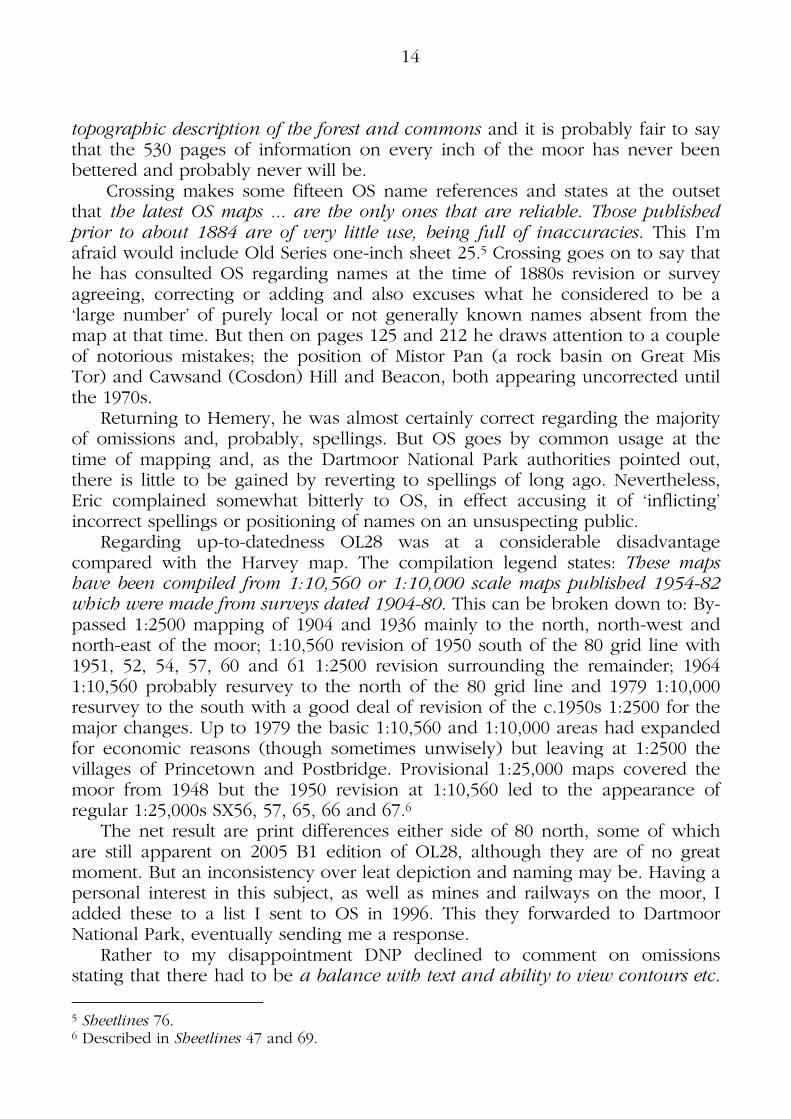
topographic description of the forest and commons and it is probably fair to say that the 530 pages of information on every inch of the moor has never been bettered and probably never will be.
Crossing makes some fifteen OS name references and states at the outset that the latest OS maps ... are the only ones that are reliable. Those published prior to about 1884 are of very little use, being full of inaccuracies. This I’m afraid would include Old Series one-inch sheet 25.5 Crossing goes on to say that he has consulted OS regarding names at the time of 1880s revision or survey agreeing, correcting or adding and also excuses what he considered to be a ‘large number’ of purely local or not generally known names absent from the map at that time. But then on pages 125 and 212 he draws attention to a couple of notorious mistakes; the position of Mistor Pan (a rock basin on Great Mis Tor) and Cawsand (Cosdon) Hill and Beacon, both appearing uncorrected until the 1970s.
Returning to Hemery, he was almost certainly correct regarding the majority of omissions and, probably, spellings. But OS goes by common usage at the time of mapping and, as the Dartmoor National Park authorities pointed out, there is little to be gained by reverting to spellings of long ago. Nevertheless, Eric complained somewhat bitterly to OS, in effect accusing it of ‘inflicting’ incorrect spellings or positioning of names on an unsuspecting public.
Regarding up-to-datedness OL28 was at a considerable disadvantage compared with the Harvey map. The compilation legend states: These maps have been compiled from 1:10,560 or 1:10,000 scale maps published 1954-82 which were made from surveys dated 1904-80. This can be broken down to: By-passed 1:2500 mapping of 1904 and 1936 mainly to the north, north-west and north-east of the moor; 1:10,560 revision of 1950 south of the 80 grid line with 1951, 52, 54, 57, 60 and 61 1:2500 revision surrounding the remainder; 1964 1:10,560 probably resurvey to the north of the 80 grid line and 1979 1:10,000 resurvey to the south with a good deal of revision of the c.1950s 1:2500 for the major changes. Up to 1979 the basic 1:10,560 and 1:10,000 areas had expanded for economic reasons (though sometimes unwisely) but leaving at 1:2500 the villages of Princetown and Postbridge. Provisional 1:25,000 maps covered the moor from 1948 but the 1950 revision at 1:10,560 led to the appearance of regular 1:25,000s SX56, 57, 65, 66 and 67.6
The net result are print differences either side of 80 north, some of which are still apparent on 2005 B1 edition of OL28, although they are of no great moment. But an inconsistency over leat depiction and naming may be. Having a personal interest in this subject, as well as mines and railways on the moor, I added these to a list I sent to OS in 1996. This they forwarded to Dartmoor National Park, eventually sending me a response.
Rather to my disappointment DNP declined to comment on omissions stating that there had to be a balance with text and ability to view contours etc.
5 Sheetlines 76. 6 Described in Sheetlines 47 and 69.
15
when in fact most omissions (agreed by Crossing and Hemery) fall in empty spaces. However the Park went into the rest in considerable detail, with the majority of the comment not in my favour but much inclined to the status quo. In all fairness I could appreciate the reasons for this. But then in a couple of cases OS went against DNP opinion by introducing a couple of disused mine names and adding ‘ruin’ in brackets to half-a-dozen moorland locations on the B edition. Against this there appeared a leat name for which I could find no trace; a mine name which appears difficult to justify and a spelling of a tor which reverts to that on Old Series one-inch sheet 25.
There is now a certain irony in this as the 2006 version of the Harvey map (now at 1:50,000) adopts current spelling, acknowledges Eric Hemery’s contribution to the old map and lists 28 names with their old and current spelling. Regarding leats and mines there is a degree of inconsistency on both OL28 B2 edition and Harvey 2006. Whereas the 1983 Harvey had indicated dry leats, only OL28 now does so, though due to compilation date range the depiction inconsistency persists.
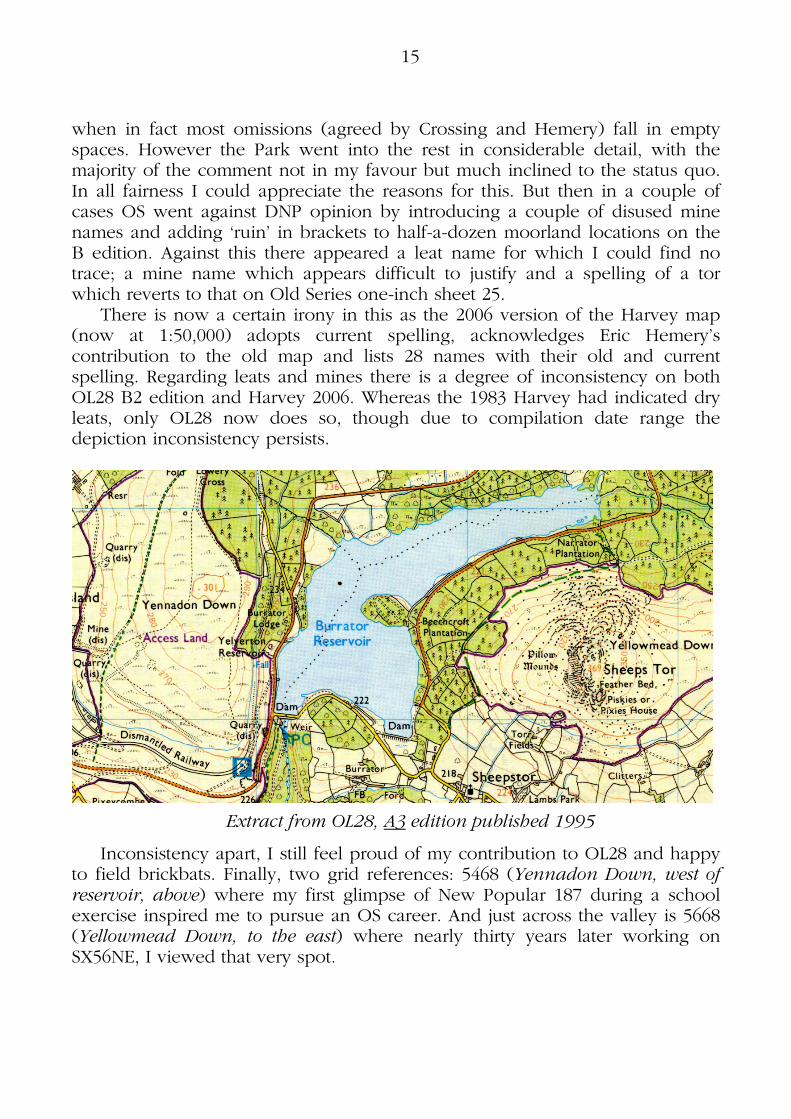
Extract from OL28, A3 edition published 1995
Inconsistency apart, I still feel proud of my contribution to OL28 and happy to field brickbats. Finally, two grid references: 5468 (Yennadon Down, west of reservoir, above) where my first glimpse of New Popular 187 during a school exercise inspired me to pursue an OS career. And just across the valley is 5668 (Yellowmead Down, to the east) where nearly thirty years later working on SX56NE, I viewed that very spot.

16
Postcodes in Ireland
Paul Ferguson 1
With the exception of Dublin and Northern Ireland, postal addresses do not use a postcode system in Ireland. Instead addresses are made up of a house number or name, street, town and county names. However, moves are afoot to introduce a national postcode system in anticipation of deregulation of postal services across Europe by the end of 2010. While a standardised system may increase efficiencies in deliveries and spatial planning there are fears for the high costs involved and the possible erosion of local placenames, especially townland names so carefully mapped by Ordnance Survey in the 1830s and 40s.
Responsibility for the Irish postal service is currently devolved to the semi-state organisation An Post which enjoys a monopoly in mail delivery. Manual sorting of post had long been labour intensive and expensive and An Post was slow to modernise. Centralisation and an automated sorting system were introduced in the 1990s. The new system relies on optical character recognition (OCR) to read full mail addresses rather than just postcodes, as well as a sophisticated address database to locate each building and house. The database was developed by GeoDirectory, a partnership between An Post and Ordnance Survey Ireland using up-to-date mapping and air photography to geo-reference every building in the country, estimated at 1.87 million properties (see www.geodirectory.ie). This technical leap has allowed An Post to skip a generation and it has argued that postcodes are unnecessary, that they are ‘a 1960s solution to a twenty-first century problem’. GeoDirectory is now used widely by the emergency services, logistics, electricity providers, insurance, local authorities, waste collection, and even pizza delivery. It is the index behind Looking for an address on the OSI website www.osi.ie which allows browsers to go straight to a map of a specific address. Occasionally there are gaps in coverage but overall it is direct and fast.
However, liberalisation of the market is not best served while An Post controls the leading address database as well as mail delivery. The Irish Government, together with the communications regulator ComReg which controls the standard and form of addresses, has strongly disagreed with An Post about the need for postcodes.2 In 2005 the Minister for Communications came out in favour of the introduction of a postcode system and optimistically announced implementation by January 2008. By August 2007 the introduction of postcodes was postponed indefinitely pending public consultation and further benefit analysis. A new minister announced in October 2007 that postcodes would be introduced ‘as a matter of priority’. A proposal was brought to cabinet in February 2008 with a view to implementation that summer. However, tenders for project management services to ‘advise on, lead and drive the
1 The author is the Map Librarian, Trinity College Library, Dublin. 2 For a fully-referenced account of the postcodes debate in Ireland see the article in Wikipedia (http://en.wikipedia.org/wiki/Republic_of_Ireland_postal_addresses).
17
implementation of a national postcode system’ were delayed until September 2010. No contract has yet been awarded.
There has been plenty of time in the interim to debate the benefits and costs of postcodes. A government report in 2008 found that benefits went beyond mail delivery or street navigation, citing the ‘need for efficient databases based on postcodes reducing inefficient service delivery and infrastructure planning’. They are essential for spatial planning, health research, education, housing, social care, etc. Increased efficiency in business could result in savings of €40 million which would more than offset the estimated €2.5 million annual maintenance costs. In 2005 the National Statistics Board welcomed the development of postcodes as they would be useful for the collection and organisation of social and economic data. While the arguments for post codes seem compelling, those against argue that a pinpoint system already exists in GeoDirectory, and that any efficiencies in a new system that only locates groups of twenty to fifty houses would be negligible. Such a postcode system would hardly repay the initial investment of up to €50 million and ongoing maintenance costs.
Apart from financial considerations, is likely that the use of postcodes will gradually erode knowledge and usage of local placenames, especially the names of townlands, the smallest administrative unit in Ireland. This was a contentious issue when postcodes were introduced in Northern Ireland. Townland names have evolved over hundreds of years and resonate with meaning. Many were originally in the Irish language until they were standardised in English by Ordnance Survey in the nineteenth-century. Research into the form and meaning of the names has been ongoing for years at both academic and official levels. The Placenames Branch (formerly OSI and now part of the Department of Community, Equality and Gaeltacht Affairs) maintains an online database of placenames at www.logainm.ie and similar work is carried out in Northern Ireland (www.placenamesni.org). When postcodes were introduced in Northern Ireland unnamed roads were given the name of the townland through which they passed. Fermanagh District Council refused this solution and a postcode was assigned to each townland instead. This is not an ideal solution as townlands vary greatly in size and some names are already archaic. However, the loss of names as a direct result of postcodes has not been demonstrated in Northern Ireland.
The likely format of a postcode has also been debated, some advocating an alpha-numeric code incorporating the county name, e.g. G08 123, the ‘G’ referring to County Galway and the ‘123’ fixed to a group of buildings as in UK codes. In anticipation of the introduction of postcodes private companies such as GPS Ireland have developed their own system. Loc8Codes are aimed at the satnav, mobile phone, iPhone, PC and web-based markets and cover both the Republic and Northern Ireland using mapping from OSI and OSNI (see www.myloc8ion.com). Their eight digit postcodes are clunky, alpha-numeric codes for specific 120 by 120m areas which, though hierarchical in content, lack

18
obvious intelligence, e.g. LSD-78-PY9, Y9S-73-NQ8. Despite Loc8Code’s claim that the codes are easy to remember their use may be best suited to Garmin or similar navigation devices rather than as postcodes.
Given the current difficulties in the Republic’s state finances it seems unlikely that funds will be available for the design and implementation of postcodes in the short term. Postcodes will only be introduced by the state if they will bring about savings and greater efficiencies in the public service.
Hadrian’s Wall
Ordnance Survey at one time published a series of archaeological and historical maps, such as Ancient Britain, Roman Britain, Antonine Wall, Hadrian’s Wall and several others. These have long been discontinued, but in 2008 a new version of the Antonine Wall map1 was published by RCAHMS.2
Now a welcome replacement for the Hadrian’s Wall map has been published by English Heritage.3 This introduces several attractive improvements over the OS original. Coverage extends beyond Bowness-on-Solway, south down the Cumbrian coast to Maryport; the base 1:25,000 OS mapping is rendered in soft grey such that modern roads and buildings are visible without intruding on the historical detail and an innovative system of relief shading – a continuous spectrum from green (0m) to brown (350m) – gives a vivid picture of the landform.
Features visible on the ground are coloured black, those less readily visible, red. The National Trail, Hadrian’s Wall path, which makes the whole Wall accessible, is marked with a yellow dashed line. The map is printed on two sides on waterproof paper and includes a map of the frontiers of the Roman Empire in second century AD.
John Davies
1 Reviewed by Bill Shirreffs in Sheetlines 83, 47. 2 Royal Commission on the Ancient and Historical Monuments of Scotland. 3 An archaeological map of Hadrian’s Wall, English Heritage, 2010, ISBN 978-1-848020-59-7, £7.99.
©English Heritage, 2010
19
Ordnance Survey ‘Free maps for schools’ scheme
John King
Since autumn 2002, OS has each year given Year 7 (first year secondary) pupils a free 1:25,000 Explorer map of the area in which their school is located. From the start of the scheme, following consultations with teachers, it was the larger 1:25,000 scale Explorer mapping that was made available in preference to the 1:50,000 Landranger map. Since the start of the scheme over 5.75 million children have benefited from this scheme. In addition each pupil receives a small leaflet explaining the key features of 1:25,000 mapping.
Whilst teachers across the country welcomed the scheme, there was one problem. Some schools were on the edge of their respective maps, which did not facilitate the study of their local region. (Site-centred maps were not available, all maps being ‘off the shelf’ products.) Following feedback from teachers, OS recognised that many learners now prefer to be able to create their own maps using computers. Hence OS has introduced the new ‘Digimaps for Schools’ service. As a result, this will be the last year that the ‘Free maps for 11 year olds’ scheme will run and OS has allowed schools this year to order extra maps for teachers.
Digimaps for Schools is a simple map-browsing service tailor-made for schools that gives access to view and print all the maps needed for teaching geography from primary level through to ‘A Level’ examinations. This includes access to the most detailed mapping of Great Britain, OS MasterMap, which means that large scale data is now available to all schools, as well as 1:25,000 (Explorer) and 1:50,000 (Landranger) which, under the National Curriculum, are the two specified scales for teaching and learning map skills. Digimaps for Schools is available to all teachers and learners in a school. Until the end of 2011 the service is free to all schools already registered to receive free maps for eleven year olds. In addition OS has increased support for the use of Geographic Information Systems (GIS) in schools by introducing ‘Digimap Mapstream’ which is accessible using separate GIS software.
Both new services have been developed following extensive discussions with teachers, Becta (a quango shortly to be abolished), The Geographical Association and the Royal Geographical Society (with IBG). The Digimap services are provided by EDINA and JISC who offer similar services for higher and further education.
My school has already made use of the Digimaps for Schools service for Year 11 river work, Year 10 coast work and ‘A’ level fieldwork investigations and at a variety of different scales including 1:2500. Definitely a most useful tool for schools.

20
A great map for a Great Park
Gerry Zierler
Squeezing extra value out of our bus pass recently took my friends and me for a splendid day’s walking in Windsor Great Park, the beautiful tract of land spreading south from Windsor Castle to Virginia Water in Surrey.
Using our trusty OS Explorer 160, we got by well enough and of course reading an OS map is second nature to all of us, right? Well, actually there were moments when we couldn’t quite make out some of the detail, in order to try and avoid being arrested as a trespasser in some grace-and-favour back garden.
Part of Anderson Geographics map of Windsor Great Park reduced by about 50% Imagine our delight, over lunch in the pub by Virginia Water, to discover
that we could buy over the bar a splendid privately-produced map of Windsor Great Park, backed with Central Windsor & Eton. Not just any old map this, but an exceptionally clear map for walkers and visitors in general.

21
And now, there’s a second edition from the same publishers Anderson Geographics, complete with hill shading on the Great Park side of the map, making for still more attractive and useful map than before.
How does this compare with our old friend, Explorer 160? Well of course scale is on the side of the specialist map. Compared with the OS 1:25,000, the scale is approx 1:5300 for the town map and roughly 1:14,000 for the park map. Thus 126 square inches of OS map covers the same territory as 464 square inches of the Anderson map.
The most useful feature of the Anderson map is its easier fold and overall size. Inevitably, the OS map’s halfway fold is right across Virginia Water and to walk round this lake in the park means unfolding your Explorer to the full sheet size of 50 by 37 inches. Not easy on a blowy day! The Windsor Great Park map is just 26 by 17 inches so is rather more manageable. This is not to criticise the OS offering however, since that map provides a lot more country than just Windsor, and a price quite reasonable when compared with the £4.49 guide price suggested by Anderson. Of course, Windsor along with its Great Park, castle and Eton, is one of Britain’s biggest tourist attractions, and if anywhere deserve its own large scale map for visitors and walkers, it’s here, and Anderson Geographics have exploited this quicker than the OS, or anyone else for that matter. It’s surprising perhaps that the Crown Estate haven’t done their own: they can offer only a small scale cycling map leaflet. But have they welcomed Anderson’s initiative? Well, no! Actually it seems they have been rather uncooperative with the publishers, to the point of raising security issues: rather pointless when all the information is in the public domain.
The Windsor Great Park map shows clearly the private areas using both darker tint, boundary lines, and even the word Private on each parcel. So in this respect, it is more useful than the OS map, so perhaps the Crown Estate should be grateful. The scale bars are in metres and yards, since apparently joggers prefer this to miles!
Although not covering a particularly hilly area, the new edition’s hill-shading and 2m-interval contours make for very easy navigation, whereas the OS 5m contours can present only a generalised picture. But why a 2 metre interval? Well, the clever cartographer realised that data could be taken without royalty from the USGS Shuttle Radar Topography Mission and combined with heights from out-of-copyright OS historical mapping. He also admits to being ‘a bit of a nut’ about hill shading!
Apart from the single example of the Long Walk, shown by OS as part of the Three Castles Path, there is no indication of any of the open walking areas of the Great Park, shown clearly on the Anderson map by lighter green tint and a myriad of footpaths, shown as you’d expect by dashed thin black lines.
The town side of the map, ‘Central Windsor & Eton’, is superbly clear, thanks largely to its large scale (about 12 inches to the mile) but also its clever choice of both bold and subtle colours to show castle and college (deep red), shopping and pedestrian areas (yellow and orange), famous and other buildings
22
(shades of pink), and public and private park land (shades of green). The OS has nothing to compete with this, and the only other local offering of note is by the Ramblers’ Association, which is highly generalised and in a pocket leaflet.
So how did ‘The Essential Maps of Windsor Great Park and Central Windsor & Eton’ come about? Anderson Geographics is a private venture of James Anderson and his wife, Jane Voss. James is one of the directors of Cassini Publishing Ltd, well known to CCS members and public alike for their reproductions of old OS maps. Anderson also published the London Landscape map, previously reviewed in Sheetlines.1 Living in Berkshire, he saw the opportunity for a map of Windsor Great Park and produced the first edition in 2004, now sold out.
The new edition is worth buying even if you have indulged in the first edition, since it is a very pleasing cartographic product – and may even be useful!
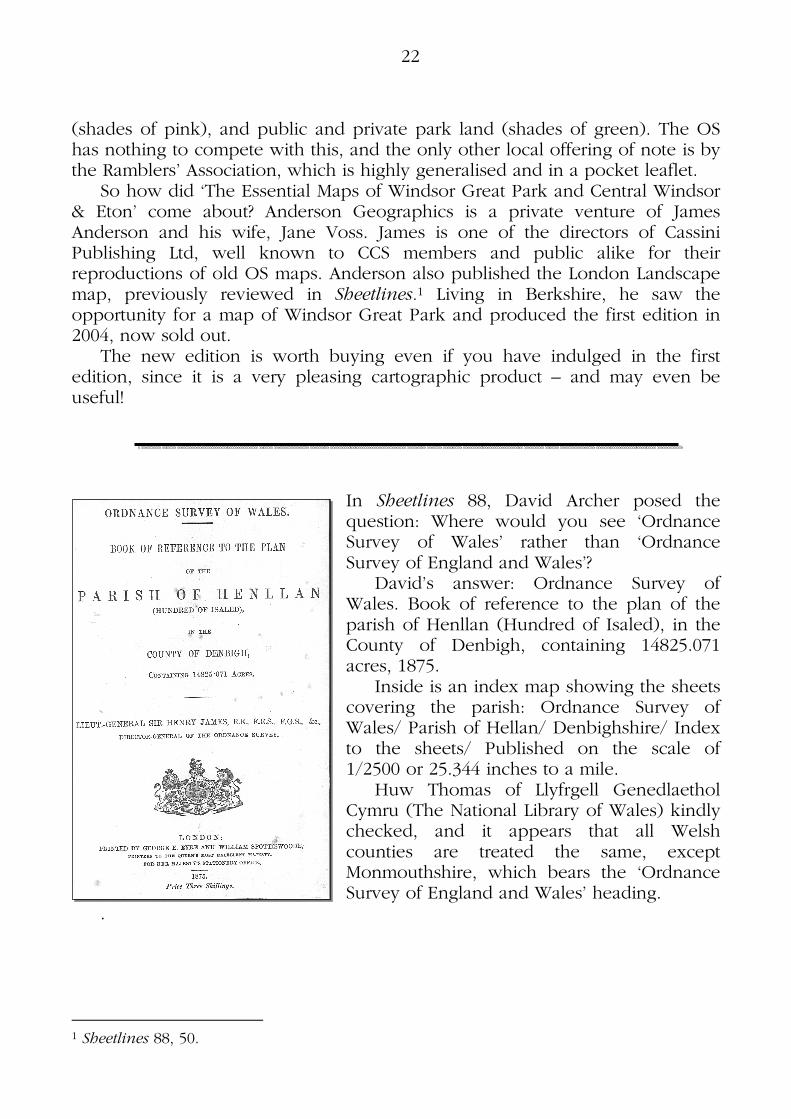
In Sheetlines 88, David Archer posed the question: Where would you see ‘Ordnance Survey of Wales’ rather than ‘Ordnance Survey of England and Wales’?
David’s answer: Ordnance Survey of Wales. Book of reference to the plan of the parish of Henllan (Hundred of Isaled), in the County of Denbigh, containing 14825.071 acres, 1875.
Inside is an index map showing the sheets covering the parish: Ordnance Survey of Wales/ Parish of Hellan/ Denbighshire/ Index to the sheets/ Published on the scale of 1/2500 or 25.344 inches to a mile.
Huw Thomas of Llyfrgell Genedlaethol Cymru (The National Library of Wales) kindly checked, and it appears that all Welsh counties are treated the same, except Monmouthshire, which bears the ‘Ordnance Survey of England and Wales’ heading.
.
1 Sheetlines 88, 50.

23
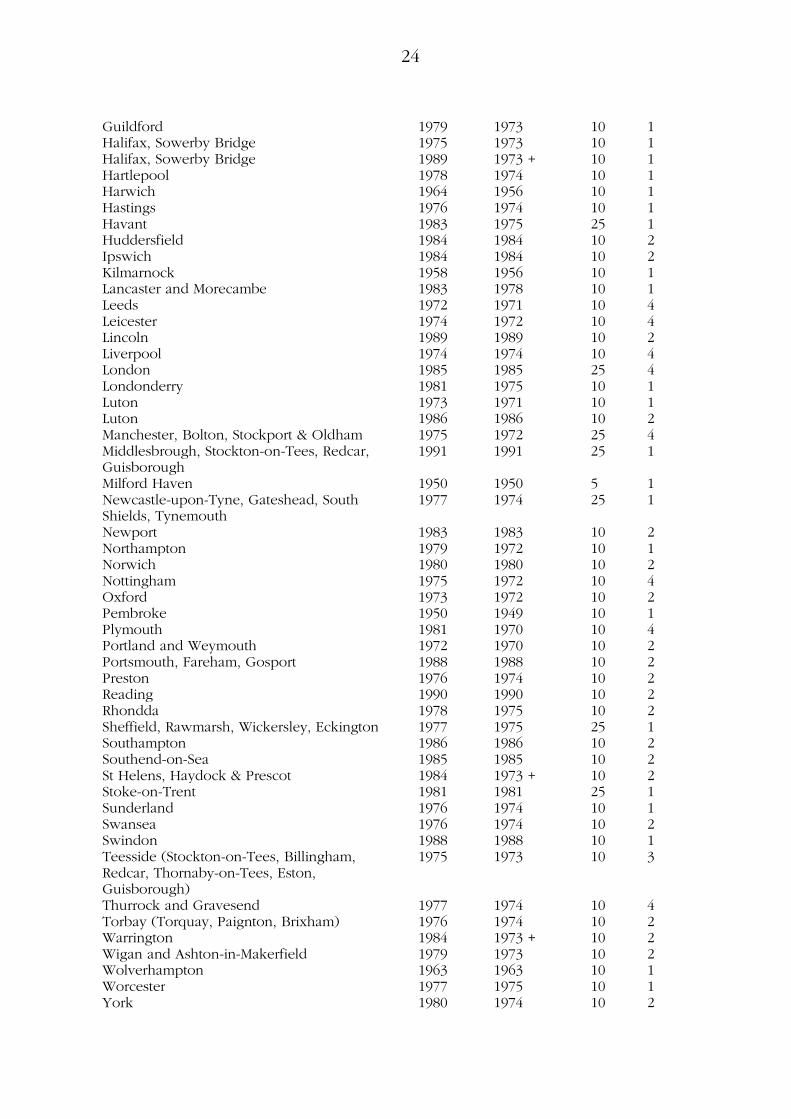
Soviet military city plans of British Isles
John Davies
In Uncle Joe knew where you lived in Sheetlines 72 (2005) a list was given of 80 known plans of British and Irish towns and cities produced by the Soviet military during the cold war. Subsequently, more have come to light and the following table shows the latest list of 91 known plans, comprising 164 sheets. Names are as shown on the sheets; the symbol + after compilation date indicates later revision; scale is 1:10,000 or 1:25,000.
Name Printed Compiled Scale Sheets
Aberdeen 1981 1981 10 2 Barrow-in-Furness 1975 1973 10 1 Bath 1973 1971 10 1 Bedford 1971 1970 10 1 Belfast 1964 1951 10 1 Birmingham, Wolverhampton, Walsall, Dudley, West Bromwich & Solihull
1977 1975 25 2
Blackburn 1974 1972 10 1 Blackpool, Cleveleys, Thornton, Poulton-le-Fylde
1976 1974 10 2
Blyth 1971 1970 10 1 Bournemouth and Poole 1974 1972 10 4 Bournemouth and Poole 1990 1990 25 1 Bradford 1990 1990 10 2 Brighton and Hove 1990 1974 + 10 2 Bristol 1972 1971 10 4 Burnley and Padiham 1976 1975 10 1 Cambridge 1989 1989 10 1 Cardiff 1972 1970 10 2 Cardiff 1982 1982 10 2 Chatham, Gillingham, Rochester 1984 1984 10 2 Chester 1973 1972 10 1 Colchester 1975 1973 10 1 Coventry 1972 1971 10 2 Crewe 1957 1956 10 1 Darlington 1976 1974 10 1 Derby 1991 1991 10 2 Dewsbury, Batley, Mirfield 1983 1983 10 2 Doncaster and Bentley 1976 1975 10 1 Dover 1974 1972 10 1 Dublin 1980 1970 10 4 Dundee 1992 1992 10 2 Dunfermline 1979 1974 10 1 Edinburgh 1983 1983 10 3 Exeter 1982 1976 10 1 Falmouth 1997 1997 25 1 Gainsborough 1975 1973 10 1 Glasgow, Paisley 1981 1975 25 2 Gloucester 1989 1989 10 2 Greenock 1979 1977 10 2 Grimsby 1986 1986 10 2 Great Yarmouth 1972 1970 10 1
24
Guildford 1979 1973 10 1 Halifax, Sowerby Bridge 1975 1973 10 1 Halifax, Sowerby Bridge 1989 1973 + 10 1 Hartlepool 1978 1974 10 1 Harwich 1964 1956 10 1 Hastings 1976 1974 10 1 Havant 1983 1975 25 1 Huddersfield 1984 1984 10 2 Ipswich 1984 1984 10 2 Kilmarnock 1958 1956 10 1 Lancaster and Morecambe 1983 1978 10 1 Leeds 1972 1971 10 4 Leicester 1974 1972 10 4 Lincoln 1989 1989 10 2 Liverpool 1974 1974 10 4 London 1985 1985 25 4 Londonderry 1981 1975 10 1 Luton 1973 1971 10 1 Luton 1986 1986 10 2 Manchester, Bolton, Stockport & Oldham 1975 1972 25 4 Middlesbrough, Stockton-on-Tees, Redcar, Guisborough
1991 1991 25 1
Milford Haven 1950 1950 5 1 Newcastle-upon-Tyne, Gateshead, South Shields, Tynemouth
1977 1974 25 1
Newport 1983 1983 10 2 Northampton 1979 1972 10 1 Norwich 1980 1980 10 2 Nottingham 1975 1972 10 4 Oxford 1973 1972 10 2 Pembroke 1950 1949 10 1 Plymouth 1981 1970 10 4 Portland and Weymouth 1972 1970 10 2 Portsmouth, Fareham, Gosport 1988 1988 10 2 Preston 1976 1974 10 2 Reading 1990 1990 10 2 Rhondda 1978 1975 10 2 Sheffield, Rawmarsh, Wickersley, Eckington 1977 1975 25 1 Southampton 1986 1986 10 2 Southend-on-Sea 1985 1985 10 2 St Helens, Haydock & Prescot 1984 1973 + 10 2 Stoke-on-Trent 1981 1981 25 1 Sunderland 1976 1974 10 1 Swansea 1976 1974 10 2 Swindon 1988 1988 10 1 Teesside (Stockton-on-Tees, Billingham, Redcar, Thornaby-on-Tees, Eston, Guisborough)
1975 1973 10 3
Thurrock and Gravesend 1977 1974 10 4 Torbay (Torquay, Paignton, Brixham) 1976 1974 10 2 Warrington 1984 1973 + 10 2 Wigan and Ashton-in-Makerfield 1979 1973 10 2 Wolverhampton 1963 1963 10 1 Worcester 1977 1975 10 1 York 1980 1974 10 2

25
The Bartholomew half-inch series– many layers of colourful archives
Christopher Fleet 1
When David Archer kindly sent me a draft of his latest Sheetlines contribution,2 with a suggestion perhaps to write something to accompany it, I immediately felt I had to leap to the defensive; protecting the beloved Barts half-inch series from such cruel and dismissive remarks. How could such a broad-minded and kindly fellow possibly be so rude and unfair? But on a second read, I realised that much of his criticism is in fact directed at the covers and the difficulty in distinguishing the various series. True enough, as a map collector or dealer these are serious matters, but even he has to admit that once one focuses on the map content itself as a user, things look rather different. The map-buying public in their day thought so too – thank goodness Bartholomew didn’t just rely on collectors!
Whilst Sheetlines may not be quite the right place to initiate a new wave of research interest into what is, after all, not an Ordnance Survey series, there are in fact many good reasons for taking a closer look at the Bartholomew half-inch. The maps themselves are stunningly attractive, representing a perfection in technique and aesthetics that cannot fail to move the heart. In purpose and content, they are also so evocative of leisure and pleasure – enhancing the landscape and inviting all to head off out and explore it. Not least for CCS members, Bartholomew’s multi-faceted and often tense relations with OS in fact worked both ways. On the one hand there were continuing complaints by OS over Bartholomew’s cheery attitude to copyright and their successful commercial exploitation of OS’ hard-earned topographic information, but on the other, OS learned much from Bartholomew on matters of colour, aesthetics, the orthography of names, printing and marketing. Finally, not only were the maps commercially successful – a trademark series for the first half of the twentieth century – but they also reflected broader ideals beyond the map itself. John George Bartholomew held sincere convictions that the world would become a better place through better cartography.
Tim Nicholson’s research3 on the genesis and early years of the half-inch is an excellent starting point, placing the maps in their broader context, including the Bartholomew’s emulation of German cartography and layer colouring, the experiments with half-inch district sheets before gaining the confidence to bring out a fully-fledged series, and their gradual move from printer to publisher. The half-inch maps were not an instant success, and in overcoming the commercial and practical difficulties of the 1880s, repackaging of the half-inch maps in the Survey Atlases, and moving south of the Border to the more lucrative but competitive market in England and Wales, the first national coverage was achieved by 1903.
1 The author is Senior Map Curator at the National Library of Scotland. 2 See page 54. 3 T Nicholson, ‘Bartholomew and the half-inch layer coloured map 1883-1903’, Cartographic Journal 37 (2000), 123-145.
26
Figure 1a. 1890 Figure 1b. 1892
Figure 1c. 1894 Figure 1d. 1899
Figure 1e. 1902 Figure 1f. 1905
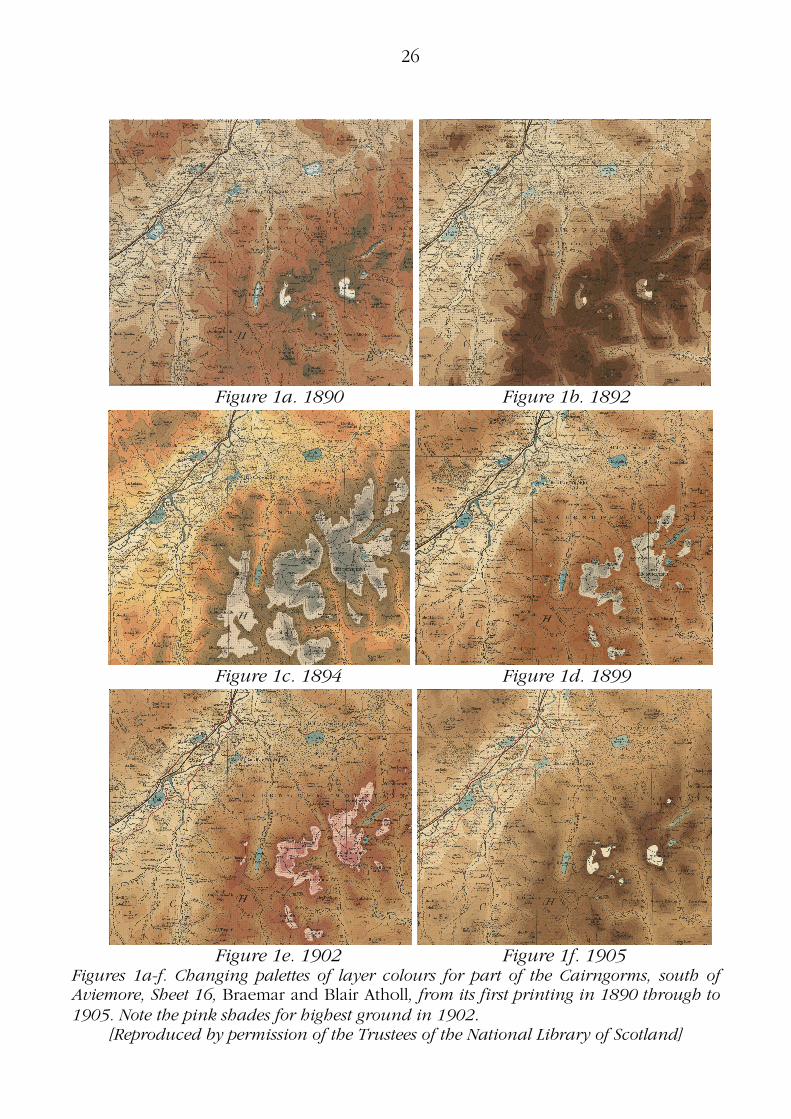
Figures 1a-f. Changing palettes of layer colours for part of the Cairngorms, south of Aviemore, Sheet 16, Braemar and Blair Atholl, from its first printing in 1890 through to 1905. Note the pink shades for highest ground in 1902.
[Reproduced by permission of the Trustees of the National Library of Scotland]
27
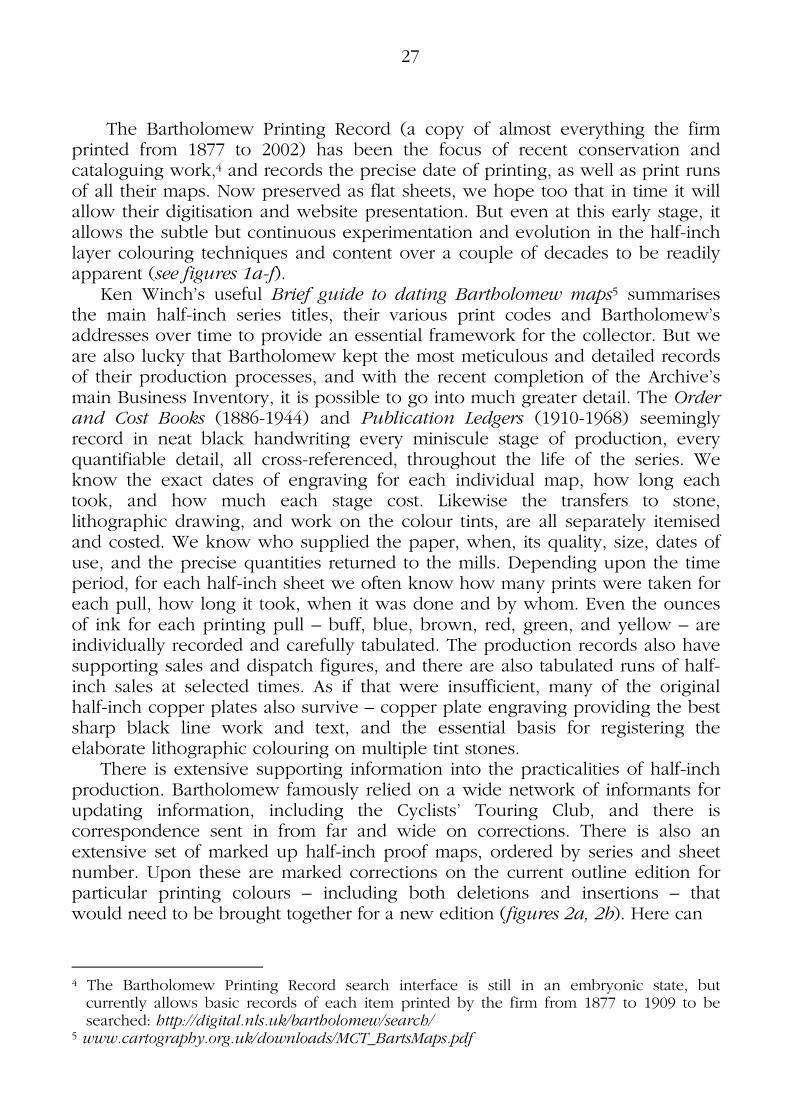
The Bartholomew Printing Record (a copy of almost everything the firm printed from 1877 to 2002) has been the focus of recent conservation and cataloguing work,4 and records the precise date of printing, as well as print runs of all their maps. Now preserved as flat sheets, we hope too that in time it will allow their digitisation and website presentation. But even at this early stage, it allows the subtle but continuous experimentation and evolution in the half-inch layer colouring techniques and content over a couple of decades to be readily apparent (see figures 1a-f).
Ken Winch’s useful Brief guide to dating Bartholomew maps5 summarises the main half-inch series titles, their various print codes and Bartholomew’s addresses over time to provide an essential framework for the collector. But we are also lucky that Bartholomew kept the most meticulous and detailed records of their production processes, and with the recent completion of the Archive’s main Business Inventory, it is possible to go into much greater detail. The Order and Cost Books (1886-1944) and Publication Ledgers (1910-1968) seemingly record in neat black handwriting every miniscule stage of production, every quantifiable detail, all cross-referenced, throughout the life of the series. We know the exact dates of engraving for each individual map, how long each took, and how much each stage cost. Likewise the transfers to stone, lithographic drawing, and work on the colour tints, are all separately itemised and costed. We know who supplied the paper, when, its quality, size, dates of use, and the precise quantities returned to the mills. Depending upon the time period, for each half-inch sheet we often know how many prints were taken for each pull, how long it took, when it was done and by whom. Even the ounces of ink for each printing pull – buff, blue, brown, red, green, and yellow – are individually recorded and carefully tabulated. The production records also have supporting sales and dispatch figures, and there are also tabulated runs of half-inch sales at selected times. As if that were insufficient, many of the original half-inch copper plates also survive – copper plate engraving providing the best sharp black line work and text, and the essential basis for registering the elaborate lithographic colouring on multiple tint stones.
There is extensive supporting information into the practicalities of half-inch production. Bartholomew famously relied on a wide network of informants for updating information, including the Cyclists’ Touring Club, and there is correspondence sent in from far and wide on corrections. There is also an extensive set of marked up half-inch proof maps, ordered by series and sheet number. Upon these are marked corrections on the current outline edition for particular printing colours – including both deletions and insertions – that would need to be brought together for a new edition (figures 2a, 2b). Here can
4 The Bartholomew Printing Record search interface is still in an embryonic state, but currently allows basic records of each item printed by the firm from 1877 to 1909 to be searched: http://digital.nls.uk/bartholomew/search/
5 www.cartography.org.uk/downloads/MCT_BartsMaps.pdf
28
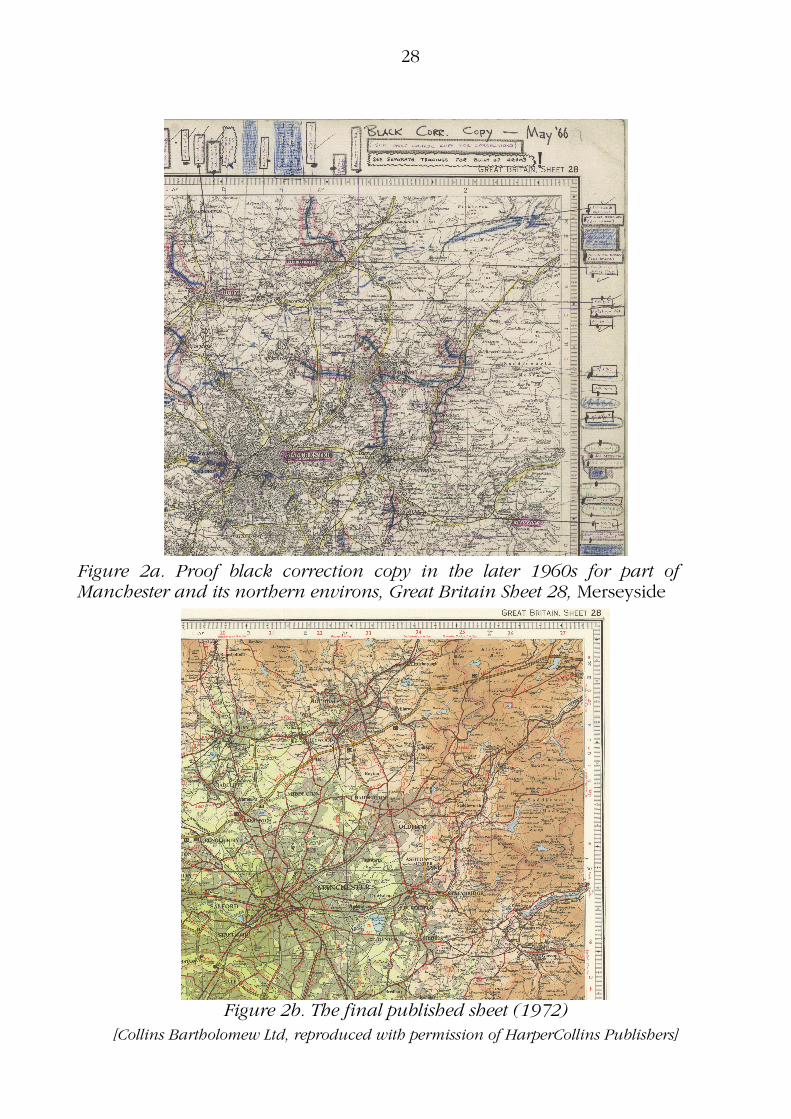
Figure 2b. The final published sheet (1972)
[Collins Bartholomew Ltd, reproduced with permission of HarperCollins Publishers]
Figure 2a. Proof black correction copy in the later 1960s for part of Manchester and its northern environs, Great Britain Sheet 28, Merseyside

29
be found an expanding hand-written network of roads, motorways, airports and suburbs, as well as new golf courses, reservoirs, forests, and (often disappearing) railways, with margins filled with place-name corrections. There are even touches of drawing office humour – a note on the Cheshire sheet warns colleagues to ‘See new strippers for Manchester and Liverpool areas!’ – a reference to the strips of corrections on transparent overlays for linear features.
Another plus point for collectors is of course that the series is no more. Metrication and republication at 1:100,000 in the 1970s was not enough to save it as sales steadily dropped, and the firm itself then went through an era of profound transition. Following its acquisition by Reader’s Digest in 1980, and then News International in 1985, the Bartholomew family sold their stake by 1987. Digital technologies, brought in gradually from the 1980s, rapidly expanded, printing was outsourced in 1993, and in 1995, all production moved from Duncan Street (their home from 1911) to Bishopbriggs. But all is far from lost, given the influence of the series on a whole myriad of other publications, and the continuing appreciation of it. Collins Geo retain a real interest and respect for their Bartholomew heritage, and still employ some of the qualities, in terms of layer colouring, accuracy, and aesthetics, behind the half-inch series. Fortunately too, Bartholomew’s former employees have often retained a great loyalty and affection for the firm after retirement, and today there is an active ex-staff club. In the last few months, the Scottish Working Peoples’ History Trust has undertaken a selective oral history programme with us, interviewing staff about the particularities of life in the firm, to help support and understand the Archive, and build up knowledge of the production processes and craft of cartography. But that’s another story...
The Bartholomew half-inch is very much in need of its personal Hellyer, Herbert, Hodson or Oliver and hopefully this brief piece has whetted the appetite, not just to collect the maps, but to take advantage of its uniquely significant archive. The Bartholomew Archive website at digital.nls.uk/ bartholomew provides summary information, and under the Resources page are links to detailed PDFs of the Business record and Summary list of maps and plans. Karla Baker, the Bartholomew Archive Curator, also writes a regular lively and fully illustrated Bartholomew blog, which amongst other things, highlights the diversity of the firm’s output – not just far beyond the half-inch maps, but far beyond maps as well.
Zoomable versions of the whole of the Cairngorm sheets (figures 1a-f) can be viewed at www.nls.uk/blogs/bartholomew/index.cfm/2010/10/22/The-Evolution-of-a-Map
30
A map in my collection
Aidan de la Mare
Ordnance Survey of Northern Ireland, Lough Erne, Activity Map 1:25,000
Well, it is actually part of my ‘accumulation of maps’1, as it was bought in 2009 for a cruise on Lough Erne this year, but it is such an interesting and satisfactory map that it is now a valued addition to the collection. Being the OSNI’s take on the 1:25,000 tourist map, it invites comparison with the OS Explorer and Outdoor Leisure series; a comparison that is generally, but not entirely, in favour of the OSNI.
Lough Erne is in two parts separated by a stretch of the River Erne that follows more than one channel, and this river is straddled by the city of Enniskillen in the southwest corner of the province of Northern Ireland. The map is double-sided with Lower Lough Erne in the northern half in a landscape format of 121 by 80 cm area of map, and Upper Lough Erne to the south-east in a portrait format of 81 by 120 cm. The maps join conveniently at the bottom right-hand corner and the top left-hand corner respectively so there is little nuisance when changing from one side to the other, but there is a minor criticism that Enniskillen is on the corner of one side of the map, but the inset plan at 1:5000 is on the other side. Both sides also have insets for integral cover, notes, legend etc. but have commendably small margins and cover approximately 30 by 20 kilometres. It is printed on what is described as ‘water resistant paper’, and, although it did not get rained on, it returned from a week of continuous use in an open sailing boat without any signs of suffering. The map is copyright dated for the Crown and for the Government of Ireland 2008 and costs £7.20.
The waters of the river and Lough Erne are 42 metres above sea level. The map has bathymetric layers in three shades of blue: less than 1.5m, up to 15m and over 15m. The lowest contour on the map is 50m, then at 10m intervals; the layer colour is pale green up to 100m changing to a slightly darker green up to 200m, to a pale brown up to 300m and a slightly darker brown above that. There is no ground higher than 370m. The roads are conventionally coloured red (A), brown (B), yellow (unclassified) and white (minor untarred roads),2 these latter also seem to represent footpaths as there is no single pecked line for them. Green and pecked green roads also appear in the small area of the Republic of Ireland, and there is blue for motorway in the legend although there are none on the map. National Cycle Routes, waymarked walks and scenic routes are marked by green, red and purple dashes respectively alongside the road or track; otherwise there are no rights of way shown. In the country areas individual buildings and groups of buildings are meticulously shown, but curiously towns and other built up areas are completely generalized
1 Sheetlines 81, 54 and 87, 37. 2 There is an error in the French translation of minor untarred roads in the legend, OSNI please note.
31
as areas of screened black only interspersed by coloured roads. But public buildings are shown in red and churches by conventional symbols in black.
All this is quite straightforward, but then we come to the differences. There are thirty symbols of tourist information and a further nine features notated by initials; this compares with thirty-nine and twelve respectively on Explorer
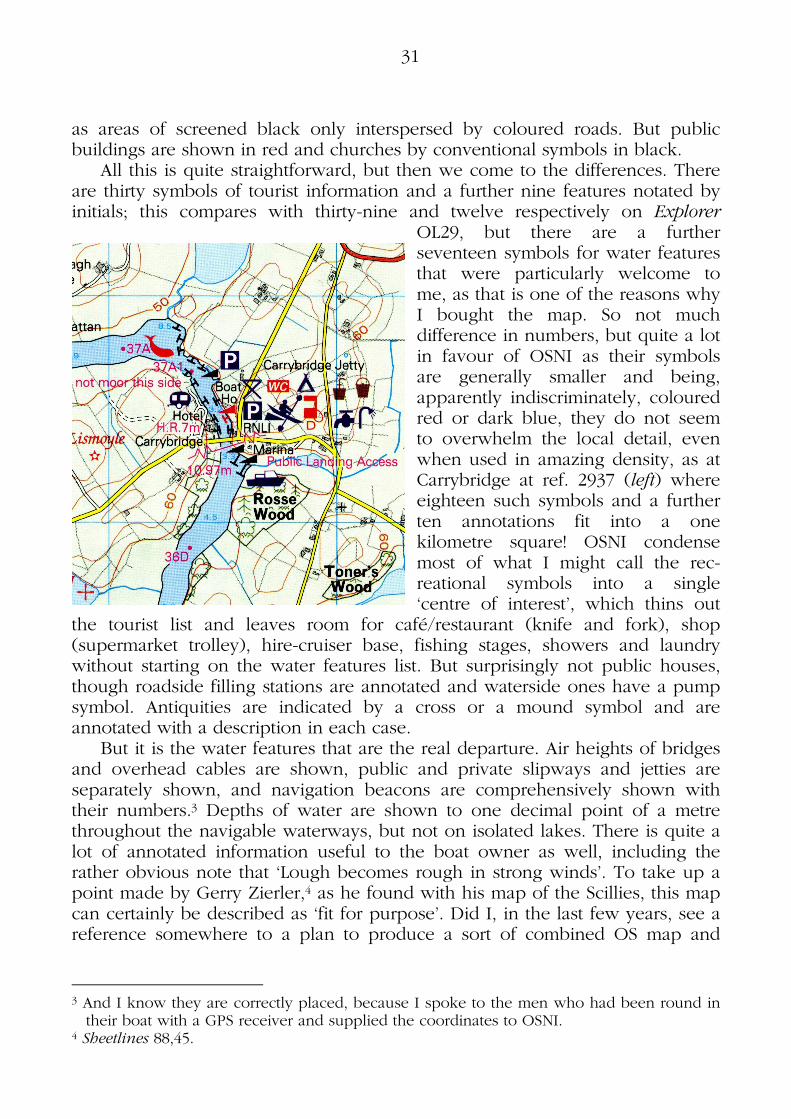
OL29, but there are a further seventeen symbols for water features that were particularly welcome to me, as that is one of the reasons why I bought the map. So not much difference in numbers, but quite a lot in favour of OSNI as their symbols are generally smaller and being, apparently indiscriminately, coloured red or dark blue, they do not seem to overwhelm the local detail, even when used in amazing density, as at Carrybridge at ref. 2937 (left) where eighteen such symbols and a further ten annotations fit into a one kilometre square! OSNI condense most of what I might call the rec-reational symbols into a single ‘centre of interest’, which thins out
the tourist list and leaves room for café/restaurant (knife and fork), shop (supermarket trolley), hire-cruiser base, fishing stages, showers and laundry without starting on the water features list. But surprisingly not public houses, though roadside filling stations are annotated and waterside ones have a pump symbol. Antiquities are indicated by a cross or a mound symbol and are annotated with a description in each case.
But it is the water features that are the real departure. Air heights of bridges and overhead cables are shown, public and private slipways and jetties are separately shown, and navigation beacons are comprehensively shown with their numbers.3 Depths of water are shown to one decimal point of a metre throughout the navigable waterways, but not on isolated lakes. There is quite a lot of annotated information useful to the boat owner as well, including the rather obvious note that ‘Lough becomes rough in strong winds’. To take up a point made by Gerry Zierler,4 as he found with his map of the Scillies, this map can certainly be described as ‘fit for purpose’. Did I, in the last few years, see a reference somewhere to a plan to produce a sort of combined OS map and
3 And I know they are correctly placed, because I spoke to the men who had been round in their boat with a GPS receiver and supplied the coordinates to OSNI.
4 Sheetlines 88,45.

32
Hydrographic Office sea chart? If I did not dream it, this map has done just that, and very satisfactory in use it was.
A footnote on Foot Sticks: The legend of this map has ‘fs’ for fishing stage and they are much found along the river banks but also ‘FS’ for Foot Stick. This rang a bell and I looked up the references in Sheetlines,5 but these were on nineteenth century maps so their appearance on a 2008 map seemed remarkable. I found three marked on the map and went looking for two of them, but after quite a long walk on a hot afternoon I found neither. One at 383264 was supposedly on the site of a farm bridge over the stream, so obviously had long been superseded. The other at 388268 was in a patch of derelict land with no sign of a path or foot stick (the third one at 312252 was not sought). From this small amount of evidence and the present state of general prosperity of most of the land I draw the conclusion that these marked foot sticks owe their presence on the map not to the diligence of the surveyor, but to information derived from obsolete larger scale maps. As the French and German translation of foot stick is the same as for footbridge, it suggests that the translator knew what they were, but then he may have just been guessing.
5 Sheetlines 63,55 and 64,57. According to Richard Oliver: a tree trunk or pole forming a very narrow crossing of a stream, just adequate for someone on foot, rather than a flood gauge.
Special offers
Anderson Geographics is offering CCS members the Windsor Great Park map (see page 20) at a cost of £3 including postage. Please send cheques payable to Anderson Geographics Ltd for the correct amount based on the quantity required to 21 Seddon Hill, Bracknell RG42 2PF. Maps will be sent by second class post and despatched within five working days of receipt of order. Please supply either a contact phone number or email address with your order.
The Cassini map teaching set (see page 50) can be ordered by visiting www.cassinimaps.com/schools, emailing [email protected] or phoning 0845 9000 174. CCS members can claim a 10% discount by using or quoting the code P-EDCCS. This discount is also available to any friends, relatives or colleagues with whom you wish to share the offer. It may also be used for purchasing a wide range of historical-map gift products from Cassini’s website at www.cassinimaps.com.
Cassini has republished the Old Series, Revised New Series (in Colour) and Popular Edition maps of England & Wales so that they match the present-day OS Landrangers. Complete sets (122 maps per series) are available at the very special price of £2.99 per map, or £365 per series, delivery to UK destinations included. No map collection is complete without them! Please call Brian Quinn on 08452 300 952 to discuss your requirements.

33
No more Ordnance Survey maps as we know them?
David Archer
Referring to the Ordnance Survey in the last issue of Sheetlines,1 D F Watt wrote: ‘It should not be a producer/distributor of any ‘mapping’ either paper, raster or vector and it should be allowed to resell its trade names should it wish’.2
The Ordnance Survey should not produce maps, and if it sells its trade names, other people can produce maps and call them Ordnance Survey maps. This is how I read the above. Of course, my initial reaction was that it would be unthinkable not to have the Ordnance Survey producing printed maps, quickly followed by a realisation that it would not surprise me if it happens; something like this had to happen. That is what all the build-up has been about. When libraries started copying old deteriorating newspapers and bulky runs of journals onto microfilm, they immediately said that the originals were no longer needed. So, when Landmark began scanning all that they could lay their hands on at the OS, I knew that the items scanned would be disposed of in the near future. And once you are in the mood for getting rid of things, there is no stopping.
How can you have the Ordnance Survey without it producing paper maps? This, to most of our members, is what the Ordnance Survey does; it publishes maps. Right from the OS year dot, it triangulated, surveyed, collected names, engraved copper plates, printed maps and sold them. Why should it even consider stopping? But D F Watt is a close observer of these things, and usually reports informed current thinking, so what he writes merits consideration.
If the OS were to stop producing maps, it would be the culmination of a process that I believe began in the late 1970s.3 Since 1923 there had usually been a separate military printing of the standard civil one-inch or 1:50,000 map, the main difference being that the military version had a coloured grid overprinted. Nothing secret about it, just the extravagance of two print runs. By 1982, it had been agreed that this would cease, and the military grid would appear in pale blue on the civil 1:50,000 map, an innovation which was hardly noticed. Money might have been saved but the significance as I see it, was that the dual function of the OS in providing maps for the military and the general public was greatly lessened. The key word in all of this, ‘rational’, had appeared. It was rational to have a single all purpose printing of the 1:50,000. Rationalisation has continued ever since, and the opening quotation would see the end of this process. Maybe.
At some point about 1998, after a ‘what is our business?’ discussion, the OS must have decided that they were map makers and decided to concentrate on that again. No longer were they to be publishers or joint publishers of a whole range of glossy books, and no longer would they print location postcards for clients. So
1 Sheetlines 88, 6. 2 An internet search gives a trade name as ‘the name a business uses to identify itself’. I will assume this to include trademarks and registered trademarks such as Landranger and Explorer.
3 Or, it might be 1974, when the post of Director General was last filled by a military officer.

34
these activities ceased, just as the technological revolution of recent years really took off. In 1994, Landmark had negotiated to be allowed to scan most of the OS Record Map Library and to offer the scans for sale. In 2008, after a respectable period, the OS announced that its Historical Mapping Enquiry Service had closed. Then the Record Map Library was deemed un-necessary, and the maps were found new homes. The OS was only concerned with producing new maps. And if a map library was not needed, then the book library could go as well, and has been closed, with the service having effectively been ‘run down’ since about 1999 after the departure of the last full-time librarian. Storing and providing copies of old maps, and having a library were not considered core elements of what the OS does, especially as they brought in little revenue. All the while, staff numbers had been falling, and the smaller organisation did not need such a large building, so that could go as well. Once rationalisation grips an organisation, the words jettison and inevitable appear more frequently.
Thus, we have a much reduced Ordnance Survey that is increasingly concerned only with acquiring, manipulating and selling data. Plus the niggling obligation to produce maps. An inconvenience of having to produce maps. If the enemy can be divided, perhaps it can be conquered and eliminated. Therefore let us say that the Ordnance Survey creates and prints maps, rather than produces them. Last autumn, it was announced that the OS would cease to print maps by the end of 2010, and interested parties were sought to take over the work and have been found. Early in 2010, they began to drop maps from their catalogue, leaving only the Explorer, Landranger and Tour. Fewer maps to be updated for someone else to print, leaving more time for acquiring, manipulating and selling data.4
If indeed the OS becomes solely a data provider (meaning seller), it might then be suggested that this does not include ‘on the ground’ data acquisition, nor data storage or manipulation. If everything were ‘put out’ to other concerns, we could end up with a few people in a room stuffed with modern communications, just organising. Acquiring data from various sources, paying someone to store and manage it, and then selling it to the final user, without ever having seen a theodolite or data capture gizmo. A sort of brokerage system, similar to the Stock Exchange where companies are bought and sold with those involved never having entered a factory.
If the OS is allowed to sell its trade names, how will this affect our society? What will be the response from The Charles Close Society for the study of Ordnance Survey maps? Maps being the key word. We study the Ordnance Survey as an organisation, to help us understand the maps, so if the OS were to stop producing maps it would not be within our remit to be interested in the Ordnance Survey any longer. Wrong. Our constitution says that we are interested in ‘....the maps, plans and other activities of the Ordnance Surveys....’. Therefore, an Ordnance Survey that just sells data will still be of interest to our society. To some members of our society.
4 They might of course, have been dropped because sales were insufficient. Conspiracy theory does not always hold true.
35
But will we be interested in the maps any longer? Of course we will keep an eye on them, if only to report what happens after the OS is no longer responsible for them, but they will not be within our remit under the constitution, no longer being an activity of the Ordnance Survey. I must admit that I am not sure what selling a trade name involves, but would assume from my argument above, that if the names Landranger and Explorer were sold, the OS would want to be rid of them and to have no involvement in the maps thereafter. Thus, I assume a purchaser could re-design the maps as they wished, otherwise they would become fossilised with the current specification. If this were to happen in 2011 (say), do we tag this date onto the end of the society name, in an unspoken manner? The Charles Close Society for the study of Ordnance Survey maps (published before 2011).
If HarperCollins (say) buy the OS trade names in 2011,5 and our members were to greet with enthusiasm the Landranger maps they produced, what would the ‘official, AGM agreed’ CCS position be? If favourable, how would we react if the trade name were to be sold again, the maps re-designed and the result be considered ghastly? Would we become : The Charles Close Society for the study of Ordnance Survey maps (published before 2011, and between 2011-2021, but not those for the next five years.)? Perhaps the OS are softening us up, getting us used to the idea that maps come from other than themselves by currently having non-OS historical maps from different publishers on their website. Note the plural. An even bigger problem would arise if the name Ordnance Survey were to be sold. What would the residual concern selling data then be called, and would we be interested in it, as it would no longer be the Ordnance Survey, in name? I would suggest that Ordnance Survey maps produced by a commercial company, to their own specification6 (like Landranger maps), would not be part of our remit under the constitution. But as Richard Oliver noted in the last issue of Sheetlines,7 commercial maps, so obviously produced by adapting OS data, and bearing all the hallmarks of OS maps can be very attractive. So where would these fit in? Will it all end up being very subjective, with maps having to have ‘the feel’ of an Ordnance Survey map to be of interest to our society? Not that an editor of Sheetlines would be able to stop endless arguments about the merits or otherwise of particular offerings.
Surely, if the opening suggestion becomes fact, we will have come full circle since 1801, when Faden published the first OS map, using data supplied by the yet to be named Ordnance Survey.8
5 Though there is no reason that all should be bought by the same concern. HarperCollins also own the Bartholomew trade name, giving the possibility of seeing Bartholomew’s Landranger maps.
6 Taking OS data and using new station symbols, new thicknesses for road casings, different lettering; changing everything except the position of features on a map.
7 Sheetlines 88, 51. 8 Richard Oliver kindly read drafts of this piece and beefed up some dates and facts. I also ‘borrowed selectively’ from his comments, and am grateful to him for allowing this.

36
The hills are stuffed with OS lawyers
Mike Parker
When Ordnance Survey’s massive database was partially prised open earlier this year, I’m sure I cannot have been alone in idly wondering how this would affect their legal team. After all, it was the protection of OS copyright that had kept them busy for so long, and they’d not been shy about asserting it in the physical and digital realms alike. Now that so much of the data was available for free re-use, what would the future hold for such a crack squad of highly-trained professionals?
One answer erupted almost simultaneously. Young writer Richard Happer had just published a raunchy novel about three student mates carousing their way along the West Highland Way in Scotland. The cover of the novel, entitled The hills are stuffed with Swedish girls,1 was loosely based on an OS Landranger map cover of the late 1980s: a familiar magenta colour formed the backdrop, a photo of a Swedish girl’s denim hotpant-clad bottom filled the lower half, above which the ‘scale’ was marked as ‘1 beer to 1 mile’. In place of the tourist information symbols placed on the OS covers of the day, Happer’s publishers, a tiny Edinburgh outfit called JonesCat, had used pictograms of a tent, a pint of beer, a bra, a cat and an unspecified pill. The OS compass logo had been reworked to include the author’s initials. It was highly effective, very eye-catching – and unmistakeably a spoof.
Enter OS lawyers. Demanding that the book be withdrawn, they stated: ‘we have a brand which is more than 200 years old and it is our job to protect the reputation of our brand. People are very passionate about our maps. Families use them and we have to look at our core customers and if they would be offended.’ They pursued the case with ruthless efficiency, demanding the excision of the offending cover from all publications, and even the internet. As usually happens with any controversy, the case hit the papers and the blogosphere, helping raise the profile of Happer’s book and sell more copies than he could ever have hoped otherwise. In the meanwhile though, trying to take on OS meant that his tiny publishers were nearly bankrupted. Eventually, OS lawyers agreed that the book could be sold if the cover was reprinted to a new design. It still looks much like a map, but not quite so explicitly, and – most importantly, it seems – not with Landranger magenta as its base colour (it has been changed to a deep sky blue).
While the whole saga might have been good for Happer’s publicity and sales, it’s not been good for OS, who – yet again, it has to be said – have come out of this looking as fusty and archaic as the Edwardian gentleman on Ellis Martin’s old map covers. And in this age of hyper-sensitivity to perceptions of wasted government spending, the case gave the tabloids every opportunity to
1 Details of the book, the cover and the controversy are at www.the-hills-are-stuffed-with-swedish-girls.com/

37
bleat about the waste of ‘taxpayers’ money’ being used to strong-arm small Scottish publishers.
I had a small measure of self-interest in the case too. When my publishers, HarperCollins, were trying to come up with a cover for my book Map Addict, I was keen on the idea of a reworked 1970s Landranger cover, and even mocked one up to show them. They ran that, and two other possible covers, past a focus group (sadly, I’m not making this up), and my Landranger-inspired cover came bottom of the heap by some distance. The focus group hated it (‘reminded me of boring school geography lessons’ was one comment). But I sneakily felt sure that a parody Landranger cover would leap off the bookshop shelves and into the baskets of the many cartophiliacs I knew to be out there. Reaction to Richard Happer’s book has, I think, proved me right. Though I’m quite glad I didn’t have to suffer the attention of the OS legal department to confirm it.
The original (left) and revised (right) covers
38
Arnhem revisted
Francis Herbert
A few comments on Rob Wheeler’s article.1 Here I merely add one or two auxiliary sources that might be of future use to Rob or to anyone else intending to focus on such material or WW2 activities in Europe or ‘The East’.
1. I.S.T.D. Special Report on main roads in the Belgian Ardennes, Luxembourg and eastern Netherlands (Supplementary to BR 876 K, Part III B.) dated March 1944; the preliminary leaf of this reproduced typescript item states ‘This issue is PROVISIONAL only, to be replaced later by a printed text’ (for which see below). Folded in the back pocket, as a visual guide, is a January 1944-dated black and white map The Netherlands, Belgium, and Luxembourg with a note that ‘Numbers refer to routes described in the text’. Leaves 28-53 comprise a section Roads in eastern Netherlands consisting of roads 65 to 84 inclusive, and provide information, for example, on road 71 ‘Arnhem-Oldenzaal-German frontier’ on leaves 36 and 37 and road 74 ‘Nijmegen-Zwolle’ on leaves 40 and 41. Each road description is preceded by its itinerary, its class, the maps used and local road numbers. For road 71 the ‘class’ is given as ‘A 40-70’, and ‘Maps used’ as ‘(G.S.G.S. 4083, sheets 40,33,34,28,29)’; for road 74 the parallel data are typed as ‘A 11-70’ and ‘G.S.G.S. 4083. Sheets 40,33,27,21’. As Rob referred, with illustrations, to one particular stretch of an uncompleted new road on road 74 south of Arnhem, this is what is written on leaf 40 of this Special Report, sub-section Deployment and Cover: ‘Elden is by-passed to the east by a new road from 715737 to a new bridge over the lower Rhine at 748767 leading into Arnhem’. The last sub-section to each road is – when relevant – entitled ‘Method of construction (For bridges see Annex)’.
The March 1944 report’s second part or ‘Annex’ on leaves 54-115 is devoted specifically to ‘bridge details’, ordered by road number, with option of various types of data being entered in a maximum 14 columns. Each road number is ordered by a ‘Serial no.’ followed in the next column by ‘Location and/or Name’, and afterwards the ‘Map Reference’. At the top of road 71 (leaves 91- 93), Arnhem is given ‘G.S.G.S. Map No. 4083, Sheet 40 [:] 750780’; only the 14th column (Remarks) is filled in here with ‘No bridges on route’. The first entry in road 74 (leaves 96-99) – for serial No. 1 Nijmegen – also has same ‘Map Reference’ citation but giving grid ref. as 717632.
For road 74’s Arnhem (serial Nos.2,2A,3,4,& 5) five bridges are documented (leaves 97 and 98) of which serial Nos. 2A-4 only are immediately relevant here (in that the locations/bridges were mentioned by Rob): at map refs 746768, 736767, & 738774. Bridge 2A’s construction note reads: ‘1 no. fixed span approx 500ft, steel through elliptical arch. 1 no. north end and 8 no. south end equal, fixed approach spans, steel, plate girder. Cantilever footwalk each side. Raised approaches each end’. The ‘Load Class’ is of ‘Probably 70’, the ‘Remarks’ column has ‘Over R. Rhine completed in 1939; destroyed in 1940; in course of
1 Arnhem 1944: were the maps good enough?, Sheetlines 87 (2010) 11-18.

39
reconstruction in 1943. Ref. photograph Library No. 389477 pre-demolition’. The third bridge, relevant only in so far that it is on the Nijmegen-Elden-Arnhem road, has a remark: ‘Similar in every respect to bridge No. 2 above’ [sic]. Bridge no. 4’s construction is noted as ‘Floating, 18 No. pontoons. Central portion on 3 no. pontoons moveable to allow for navigation’; ‘Load Class’ is 24; ‘Nature of banks’ has ‘North bank vertical, masonry; quays. South bank sloping, dressed at water edge’; and ‘Remarks’ column has ‘Over R. Rhine. Reinstated in 1941. Ref. photograph Library No. 109075’. This fourth bridge is that labelled ‘Pontoon’ on GSGS 2541,1:100K, sheet 5,3rd edition,1943, print code ‘50,000/1/44. Wa’.
As March 1944 saw the issue of the ‘PROVISIONAL’ reproduced typescript, described above, the ‘normal’ quality printed version – of 170 text pages and 71 pages of photographic plates - became I.S.I.S. Report on the Netherlands and Belgium, Part III (continued) Roads ; B.R. 876 K (3) (1) (Restricted), dated July 1944, with note on front cover: ‘This fascicle supersedes pages 1-142 of B.R. 876 K (3), Part III, Communications. The photographs included in this fascicle are additional to those already published in B.R. 876 K (5)’. The main text descriptions section for roads 71 and 74 are now found on pp.68-70; the statement about the new by-pass road east of Elden remains unchanged. What is now sub-titled the section ‘Bridge schedules’ (pp.74-163, now of 13 columns, with running title ‘Annex to Road [-]’) appears on pp.149-152 inclusive. Apart from a more ‘civilian’ (versus armed forces) style of English the ‘Remarks’ column for road 74’s bridge 2A now notes ‘(See photograph 514, pre-demolition)’. There is nothing new regarding bridge 3. A similar re-designation, for bridge 4, of its illustration is seen: ‘(see photograph 515)’. In the photograph section at the back road 74’s ‘Arnhem’ bridges 2A and 4 are shown in photos nos. 514 and 515: these captioned ‘Road 74, bridge 2A. Arnhem. Alternative bridge in town over river Rijn.’ and ‘Road 74, bridge 4. Arnhem. Pontoon bridge over river Rijn (re-instated 1941)’ respectively.
2. I.S.T.D./Tn/480 (Restricted) [s.d.] includes two small-scale general thematic maps (print-coded for March and January 1944 respectively) whilst the remaining 80 or so items are town and/or port plans and photo-mosaics dating from 1940 to January 1945. Although containing nothing of Arnhem ‘Plan 42’ is ‘Nijmegen [station and bridge. (Mosaic)]’, where the approx 250m to 1inch scale photo-mosaic is annotated to indicate ‘Single Track Span’ for a section of the bridge.
3. Netherlands zone handbook No. 3 : Gelderland, Overijssel, Drenthe, Groningen and Friesland : map section (‘Confidential May, 1944’) has, of its ten items, ‘Map 3 Arnhem town plan’. This is a reproduction of the Bartholomew Arnhem plan, at scale ca 1:17,000, 14 by 9 cm, job no. 1269;2 the pontoon bridge (marking the seven pontoons) only is shown.
2 Chris Fleet comments: The NLS Bartholomew Archive records that Job 1269 was an order from the War Office to Bartholomew, received on 23 March 1944, for 1000 copies of 18 town plans in Holland. The maps were printed on 7 April 1944.
40
Reviews Rachel Hewitt, Map of a nation: a biography of the Ordnance Survey, London: Granta, 2010, ISBN 978-1-84708-098-1, hardback, £25.00
The late J Brian Harley observed somewhere, in the late 1980s, that at that time the best work in North America on the history of cartography was being undertaken in university departments of English. What he was referring to was the treating of the map as a ‘text’ that could be ‘read’, with all that that implied in the way of theoretical baggage. In Rachel Hewitt’s Map of a nation we have little of reading maps in that sense – for which, I suspect, many readers will be heartily glad – but we do have the first full-length book on the Ordnance Survey to emerge from an English department. Even before it reached the bookshops it was winning praise, including the Jerwood Award for Non-Fiction. Curiosity is stimulated: expectations are high.
Readers who know nothing of the history of the Ordnance Survey, and are apt be vague about its output – which seems to include the four specimens of ‘advance praise’ on the back of the dust wrapper – will no doubt lap it up eagerly. It is for those of us who have spent a good many years researching and writing about aspects of the Survey, past, present, and future, to say whether it is really ‘a biography’, and whether it deserves its accolades.
Before going further, it is necessary to say something of the scheme of the book. It derives from a University of London doctoral thesis of 2007 ‘Dreaming o’er the map of things: the Ordnance Survey and the literature of the British Isles 1747-1842’, which I confess to not having read, so I don’t know how much of it is reproduced or paraphrased in Map of a nation. The central assumption seems to be that the backbone of the Ordnance Survey was the creating of what is now known as the Old Series one-inch map of England and Wales, and that it was completed in 1870, at which point this ‘biography’ ends. As the parent thesis ended in 1842 and a single chapter (12, ‘A great national survey’) in the book continues the narrative to 1870, there is a certain tension apparent. Should you happen to light upon Chapter 12 first, then you may form a very unfavourable, and very unfair, impression of the work as a whole.1 But of that more later.
Whilst the broad outlines of the story will contain nothing new for many readers, at any rate of Sheetlines, ‘the devil is in the detail’ and a considerable quantity of diverse material, some published, some not, is drawn together here for the first time: the bibliography runs to 32 pages. There are some eccentric inclusions and omissions: amongst the former may be instanced works on the 1:25,000 First Series and twentieth century one-inch military maps, and amongst the latter of ‘Boud’ and ‘Delano-Smith-&-Kain’.2 Thirty two pages notwith-
1 This will perhaps be testified to by members of the Society’s Committee present at the meeting in Harmston on 9 October 2010.
2 R C Boud, The Highland and Agricultural Society of Scotland and the Ordnance Survey of Scotland, 1837-75, Cartographic Journal 23 (1986), 3-26; Catherine Delano-Smith and Roger J P Kain, English maps: a history, London: British Library, 1999; Roger Hellyer, A guide to

41
standing, it is unfortunate that there is no summary listing of the references to the Ordnance Survey (by whatever name) in late eighteenth and early nineteenth century newspapers that are cited in the notes: anyone who has undertaken newspaper-trawling will know that there is hard graft implied, far beyond leafing through Palmer’s indexes to The Times. The notes, by the way, are of a sort that has become fashionable in recent years: after the last chapter, and not numbered, but rather cued by repetition of the start of a quotation. Whilst there are those who argue that for many readers even note numbers are distracting, and footnotes are frankly off-putting, for the serious reader the method used here is thoroughly irritating: the old excuse for endnotes of economy in typesetting has long ceased to apply. Now, this may well be the fault of the publishers rather than of the author, but the end-result is that more paper is consumed: Mudge’s letter to Colby of 1 October 1811, quoted from in several places on page 214 and referenced on pages 360-1, is a case in point: nearly half a page of references could have been compressed into two or three footnotes. A ‘green’ generation should think of these things.3
The story starts with a ‘prologue’, centring around the Battle of Culloden in 1746, and immediately displays the quality of the writing. One might perhaps quibble with some of the subsidiary information: for example, whilst it is certainly true that there were those who acquired Saxton’s maps as symbols (page xx), there is clear evidence that his was a ‘state survey’ for utilitarian purposes, for which one need look no further than William Cecil, Lord Burghley, acquiring proof copies as soon as they were available for purposes of statecraft, including the surveillance of Catholics, and the grant of an estate to Saxton by Queen Elizabeth. Reference to ‘Delano-Smith-&-Kain’ would have revealed this, and a more careful reading of this and of Brian Harley’s introductory chapter in ‘Seymour’ would have shown that Saxton and Ogilby represent strands in a story of state map-making that began long before the ‘Ordnance Survey’ was ever thought of.4 But it’s a good read, and I liked both the citation and illustration of Wenceslaus Hollar’s ‘The scale’s but small, Expect not truth in all’ on a late seventeenth century map of London. All the same, there is scope for disagreement here: Hollar is interpreted as warning against the defects in contemporary surveying instruments, whereas surely he was cautioning against cartographic generalisation.5 Actually, the scale is not that
the Ordnance Survey 1:25,000 First Series, London: Charles Close Society, 2003; Roger Hellyer and Richard Oliver, Military maps: the one-inch series of Great Britain and Ireland, London: Charles Close Society, 2004.
3 Admittedly, I do not have a particularly high opinion of publishers’ editors and copy-editors: for the present it can be left to others to ‘deconstruct’ why this might be so.
4 J B Harley in W A Seymour (ed.), A history of the Ordnance Survey, Folkestone: Dawson, 1980, 2-4, 9-10.
5 ‘A new mapp of the cityes of London and Westminster with the borough of Southwark & all the suburbs shewing the severall streets, lanes, alleys, and most of the throwgh-faires,

42
small (1:7040, much larger than many later ‘handy’ London maps), and the rhyme might well replace the verbiage that users of contemporary OS maps are subjected to. As it’s out of copyright, no time need be spent tracing the representatives of author or publisher.6
Chapter 1, ‘A magnificent military sketch’, describes more than the Military Survey of Scotland of 1747-55: it also draws together material on David Watson and William Roy as never before. Immediately the book’s ‘biography’ subtitle is shown to be justified, and the pages are eagerly turned. The climax comes on the last two pages: whereas ‘the nobility of Enlightenment Scotland’ wanted the country to be mapped, ‘“barbarian” Highlanders… had no choice but to be mapped’. This expression of disunity between highland and lowland Scotland is quickly driven home by a quotation from Robert Louis Stevenson: ‘Scotland has no unity except on the map’. (Quotes on page 42: italics in originals.) Yet there are occasional drawbacks: there seems to be a confusion of surveying compass and theodolite on pages 21-2. Had Roy and his colleagues been able to use a theodolite, they might have been able to provide a trigonometrical framework, and the result would have been much more than just a ‘sketch’. We do desperately need clear expositions of these technical points, but it would be useful if passages such as this could be checked by an ‘expert’.
Chapter 2, ‘The propriety of making a general military map of England’ describes the background to Roy’s proposal of 1766 for a national survey to complement that of Scotland. This involves a detailed description of Roy’s likely circle at the Royal Society and elsewhere. Many of us will be grateful that the necessary discursion into contemporary geodesy enables Charles Hutton’s contour map of Schiehallion of 1777 to be illustrated, at long last. It is interesting that only Roy’s proposal of 1766 is described: it is unclear from the literature whether there was a separate proposal in 1763 which has not survived (which has tended to be my assumption hitherto), or whether he had the idea in 1763 but only actually submitted it in 1766. Either way, it does seem clear from the 1766 proposal that he envisaged a national map that would at least partly be compiled from contemporary ‘commercial’ one-inch county surveys, and this is far more in the line of development of public-private collaboration exemplified by Saxton and Ogilby. Yes, Roy was a visionary, but it took time for the vision to develop.
being a ready guide for all strangers to find any place therein. Drawne by W. Hollar, the like never done before. Sold by Robert Greene at the Rose and Crowne in Budge Row London, where you may have all sorts of mapps’: copy in Cambridge University Library, Maps aa.17.G.62 [Darlington & Howgego’s no.35; University of Exeter pre-1900 town-map project 22296], where likewise you may have all manner of maps: even, now, a large number of OS 1:2500 County Series – to say nothing of the Charles Close Society Archive.
6 ‘Whilst we have endeavoured to ensure that the information in this product is accurate, we cannot guarantee that it is free…’ – and that’s by no means the half of it. Future historians of cartography will no doubt comment on the influence of the OS’s six in-house lawyers.

43
Chapter 3, ‘The French connection’, describes the London-Paris triangulation of the 1780s. The opening of the chapter is a nice combination of a few facts, good imagination, and understated contemporary relevance (an Icelandic volcanic ash-cloud). Much of what follows quotes from and paraphrases Roy’s own account in Philosophical Transactions, but is likely to reach a much wider audience, and enhances it with glosses and new insights such as ‘The supposedly supreme accuracy of Roy’s triangulation also became a patriotic weapon… Rather than celebrate the enterprise for the amicability between the French and British surveying parties, most people in Britain, including Roy himself, seem to have been more interested in the project for its national merits.’ (page 91).
Chapter 4, ‘The aristocrat and the revolution’, concentrates on Charles Lennox, Third Duke of Richmond, and the group of episodes around 1791 that are usually taken as the ‘foundation’ of the Ordnance Survey. However, it has very properly been pointed out on page xxv that there are other dates: 1783, or 1766, or even 1746. The paradox is that whilst the Ordnance Survey can be seen as a good exemplar of the ‘Age of Reason’ or ‘Age of Enlightenment’ (the latter term is used throughout the book, and is the current academically favoured one, but the former is more likely to be recognised by older readers), with its precise quantification of distance, measured to a new standard of accuracy, yet trying to pin down its institutional origins takes us into an imprecise shadow-world. The officially-favoured ‘1791’ is really an accountancy device, which perhaps explains its current appeal in a world of number-fixing and the triumph of the letter over the spirit. Much more OS history hinges around accountancy than historians have properly acknowledged so far.
Chapter 5, ‘Theodolites and triangles’, is remarkable for its exploration of the OS’s first official head, Edward Williams, ‘one of those people whose names one instinctively forgets’ (we could never forget yours, could we, Winterbo’?).7 Whilst even Rachel Hewitt cannot rehabilitate Williams, nonetheless he emerges as something more than the half-dimensional figure that he has hitherto been chronicled as. Whilst there is nothing new in knowledge of the connection between Joshua Reynolds and the Mudge family, it receives here a detailed, readable exposition. The chapter includes an account of the completion of work on what was published as the Gream-Faden map of Sussex in 1795, for which there is a retrospective case for classification as ‘the first Ordnance Survey map’, though it is duly acknowledged that at this time there was no national mapping scheme. A problem with the early history of the Ordnance Survey, as with the military survey of Scotland, Ogilby, Saxton and other episodes, is that it was an occasion, an answer to an immediate problem, rather than an institution: it is possible that the OS only became completely an institution as late as the early twentieth century.8
7 H StJ L Winterbotham, A key to maps, second edition, London & Glasgow: Blackie, 1939, 68. 8 This point will be explored further in Richard Oliver, The Ordnance Survey in the nineteenth century: maps, money and growth of government, for publication by the Charles

44
Chapter 6, ‘The first map’, includes an account of the Mudge-Faden map of Kent, published in 1801. It is unfortunate that such a ground-breaking exploration of connections between the Survey and contemporary literature and thought should perpetuate the old idea that this map was published on 1 January: Donald Hodson demonstrated in these pages back in 1997 that the real date was mid-February or later.9 It is also unfortunate that there is not a more detailed exploration of the background to Faden’s undertaking the work: he wasn’t just any old map publisher. But throughout the chapter Rachel Hewitt demonstrates that she can write, and subtly: there is no overt mention of New Labour or Google Earth on pages 157-8, but the implications of contemporary quotations criticising William Pitt’s de facto surveillance state are clear enough. Once settled at Adanac Park, the present OS management might care to consider the use of ‘hover over the kingdom in an Ordnance balloon’ in their current publicity. A few pages later (164), an interesting parallel is drawn between ‘cartography’ and ‘cartoon’.
Chapter 7, ‘A wild and most arduous service’, takes its title from words of the younger Robert Dawson, who joined the survey after the period of this chapter, which is largely concerned with Thomas Colby and the increasing difficulties faced by William Mudge in discharging his growing responsibilities. It is a pleasure to have on page 178 the Brockledon portrait of Colby of 1837, which I think has only been reproduced once before, in preference to the much more often seen one used by Close in Early years, the original of which (is it a daguerreotype?) must date from a decade later, but it does draw attention to deficiencies in portraiture: what did Colby look like in 1827 (the early and difficult years of Irish survey), 1817 (in the Shetlands), or 1807? It would help flesh out a fine word-portrait, which must make us thankful that shell-suits had not been invented in the early nineteenth century (read the book to work out why this should be), but is unfortunately spoilt by a misreading of Portlock’s Memoir of Colby on page 180: it was Colby proffering steak, not a friend.10 Readers without ready access to the cornucopia of sources exploited in Map of a nation will hope that such mistakes are rare.
Close Society: this is a development of Richard Oliver, The Ordnance Survey in Great Britain, 1835-1870, unpublished D.Phil. thesis, University of Sussex, 1985.
9 Donald Hodson, ‘On 1st January 1801 the first Ordnance Survey map was published…’, Sheetlines 48 (1997), 3.
10 ‘Friends remembered bumping into him as he jogged his way to the Tower, yelling after him to “come back, my boy, and take a beefsteak with me’: Hewitt, 180. ‘… all who served under him… will remember to have, on some occasion, met him running rather than walking (for such was his custom) along the street… and to have been greeted by the hearty invitation, “Come back, my boy, and take a beefsteak with me” (which steak often expanded into excellent fish and a good fat turkey)…’: J E Portlock, Memoir of the life of Major-General Colby, London: Seeley, etc, 1869, 5.

45
Chapter 8, ‘Mapping the imagination’, is the one least about the Ordnance Survey as I suspect that many of us understand it and, with the exception of Chapter 12, may be found to be the least satisfactory. May: a note on page 357 refers to ‘fictional and poetic descriptions’, and reactions to the more imaginative passages are likely to be highly personal. Having been good-naturedly described by Brian Harley himself as ‘too b****y empirical’, I am more impressed with the examples of mapping as illustration and metaphor in eighteenth and nineteenth century literature, which includes a substantial section on Samuel Taylor Coleridge having to make his own map of part of the Lake District in 1802.11 Indeed, if the author is looking for a new project, she could do worse than carry the connection of mapping and literature forward into the later nineteenth and earlier twentieth centuries: she has form.
Chapter 9 is ‘The French disconnection’ and is centred round geodesy and in particular the unsatisfactory joint Anglo-French operations in Shetland in 1817. Again, on the face of it there is nothing new, but the account has a highly personal – in more than one sense – point to it.
Chapter 10, ‘Ensign of Empire’, is the first of two concerned mainly with the survey of Ireland. A writer here needs to proceed with care: there is really nothing of substance to add to John Andrews’s magisterial account of the general development, and recently there has been a flurry of interest in various more detailed aspects from Irish scholars. It is here that the book begins to fall off, and there are unfortunate misstatements or misreadings, not least on the conception of the Irish survey (pages 240-2). It is clear from Andrews that the original concept was a six-inch survey, a scale adopted only in order that the townland boundaries could be shown adequately, which would remain in manuscript and would form the basis of publication at the one-inch scale. Further, whilst the Ordnance probably had one-inch mapping of Ireland in view as a long-term project, before early 1824 they had shown no disposition whatever to make a start. Their reaction, when pushed into it, was to say, in effect, ‘Well, there’s a thing, we were just about to start it, do you know!’ It is true that by 1827 Colby had arranged to engrave the six-inch and, to be charitable, was dilatory about starting the one-inch, but the fact remains that what was completed in 1846 was rather different from what had been visualised in 1824. Against this, there is a much more detailed treatment of William Rowan Hamilton’s dealings with the Survey in Ireland than is offered by Andrews. This chapter includes a photograph (page 261) of one of the more remarkable personalities associated with the Survey, Thomas Aiskew Larcom: it is relatively late (1865), and leaves one wondering at Larcom’s appearance thirty years earlier, when he probably had more hair on top and less at the side.
The second Irish chapter, 11, ‘All the rhymes and rags of history’, is concerned with the memoir project and the other ‘non-geometric’ aspects of the Irish Ordnance Survey. This inevitably brings in John O’Donovan, but also a number of other personalities probably much less known on the British side of 11 Brian Harley to author, probably on licensed premises, certainly later 1980s.

46
the water, including James Clarence Mangan, poet, eccentric and opium-addict. Mangan is treated by Gillian Doherty in her study of cultural aspects of the Irish survey, but there is more of him here, including a likeness that appears to have been drawn shortly after he died (page 279).12 For the more conventionally-minded who may have wondered about these things in the past, there are a few specimens of the ‘scurrility’ and ‘ribaldry’ in O’Donovan’s letters of which Larcom complained so much. An acknowledgement of a quotation from Brian Friel’s notorious Translations on the title page verso raises fears of the worst in political correctness and false history, but all is well: indeed, there are some interesting quotations from Mr Friel on pages 280-1. Thank goodness that we have one writer, at least, who does not take this Donegal drama at face value. By the way, you may be surprised to learn the identity of one of the purchasers of the Templemore memoir, published in 1837.
The final main chapter, ‘A great national survey’, is by far the least successful. There is no falling-off in the quality of the writing, but there is of the source-materials, and this leads to unfortunate errors. For example, on page 291 the move of the Survey to Southampton is described as occurring on 31 December 1841, and as due to the fire at the Tower two months earlier. This is based on a newspaper reminiscence of fifty years later quoted in ‘Seymour’, and whilst it may well be that the first party to turn up did indeed have difficulty in gaining admission, there is evidence that this episode would have taken place at least a fortnight, even a month, earlier. In any case, the move to Southampton was less sudden that it is presented here: by July 1841 the Survey urgently needed more accommodation and the vacant barracks at Southampton had been selected a fortnight before the fire at the Tower on 30 October, which enforced the move.13 Also deriving from Seymour is a seriously mistaken view of the first Ordnance five-feet-scale survey of London, of 1848-52, on page 298.14 It did not cost £104,000 and it was certainly not ‘the most minute… survey of London then in existence’: that honour was taken by the later survey of 1862-71, several sheets of which have been reissued by Alan Godfrey. Colby’s estimate of £104,000 was for survey and publication in the style of the Dublin Castle five-foot sheet, completed in 1841, and of an elaboration of finish and content that would never be quite equalled: the survey of 1848-52 was a ‘skeleton’ survey, of streets and levels only, and cost £24,212 15s 9d. A third mistake, here and elsewhere (pages 246, 299), is the belief that the Irish survey distracted effort from the one-inch mapping of England and Wales, and that the latter was desperately needed. Yet in 1986, if not before, Brian Harley exposed the truth: progress with the one-inch in England and Wales was hampered by Colby’s insistence on revising all the unpublished work before new survey was
12 Gillian Doherty, The Irish Ordnance Survey: history, culture and memory, Dublin: Four Courts Press, 2004.
13 E J S Parsons in Seymour (ed.), A history …, 111; Richard Oliver, ‘The transfer of the Ordnance Survey to Southampton in 1841’, Sheetlines 33 (1992), 35-8.
14 See Seymour (ed.), A history, 120.

47
resumed around 1835, and Andrews made it equally clear that a wholly separate, new, force was raised for Ireland. It is equally misleading – no, ridiculous is a better word – to suggest that the completion of the one-inch of northern England in the later 1860s was held up by the surveys of Jerusalem and Sinai (pages 302-5). I find it odd that my doctoral thesis, which ‘sets the record straight’ on all these points, has apparently not been consulted, though it is listed in the bibliography.15 The description of the completion of the one-inch of England and Wales conjured up in this writer’s mind something of the climax of an Ealing comedy: ‘One can imagine the maps being delicately carried from the printing room at Southampton by military engineers flushed with excitement… we can imagine the crowds clustering around this historic artefact as shopkeepers proudly positioned them in their windows.’ (page 305) Yes, I can just see Sid James, perhaps, at the head of the queue… Victorian Ordnance Survey maps just didn’t sell like that. I’m not sure that they have done so more recently, either, even before satnav started eating at the paper map market.
The narrative is rounded off by an epilogue, ‘Maps of freedom’, which is epitomised by ‘one of the reasons I find Ordnance Survey maps so seductive is the promise they seem to offer of the unfettered freedom to wander across the British landscape’ (pages 309-10).
This is a remarkable book, and is as much a landmark in publishing about the Ordnance Survey as was Mike Parker’s rather different Map addict in 2009: reservations about details tend to be swept away by the radical approach. Indeed, 2010 has proved to be something of an annus mirabilis in publishing about mapping, in the broader sense, with two television series, at least one radio series, a major exhibition at the British Library, and several books. It is just a pity that certain points and Chapter 12, in particular, detract from an approach to perfection: but if the advance publicity and stocking by the likes of Waterstones has done its work, there ought to be a paperback edition sooner rather than later, and that would give an opportunity to rectify the deficiencies.16 By the way, there is an excellent section of colour plates.
There remain two points: first, how far a claim to ‘biography’ is actually justified; and second, whether creating a coherent one-inch map of England and Wales really was fundamental to the Ordnance Survey.
At one level, the ‘biography’ element succeeds admirably; everyone appears in sharper focus than we have known them before, and there is a sense of interaction both with the immediate organisation and with the wider world outside. At another level, though, these are largely people who are accessible in
15 Oliver, ‘The Ordnance Survey in Great Britain, 1835-1870’, cited by Hewitt, 402. 16 These include some eccentric citations in the notes and bibliography, e.g. the Margary facsimiles being ‘edited’ by J B Harley and others (except, oddly, vols 4 and 5, which are attributed to Harley alone) (page 393), and the frequent citation of The National Archives at Kew as ‘NA’ whereas elsewhere ‘TNA’ has established itself (or ‘TNA [PRO]’ if you want to enter a protest). I am also puzzled by the date 2006 for the Four Courts Press edition of J H Andrews, A paper landscape: should it not be 2002?

48
print or secondary literature: if it is true that ‘history is written by the winners’, then it is also largely the case that it is written by the bosses and, if not by them, at any rate about them. A high proportion of those brought to life here are, if not ‘bosses’, at any rate ‘middle management’: the shop floor’s voice is largely absent. Whilst it is true that sources are relatively exiguous before the late nineteenth century, they are not wholly absent, and both the Ordnance Survey letter-book of circa 1817-22 and the so-called De la Beche papers of a decade later contain useful snippets. For Ireland and for the early six-inch in Britain there is some material, referred to by Andrews, for John Tyndall, who admittedly was exceptional in starting as a civil assistant and, developing instead as a physicist, rose to be a Fellow of the Royal Society; and there is George Parker Bidder, the ‘calculating boy’, who was briefly on the Survey’s staff in 1824-5.17 The range of material may be relatively limited compared with the ‘bosses’, but it is not wholly lacking.
The ‘one-inch map’ presents several problems. In the first place, there are references to the contemporary OS 1:25,000 Explorer series at several points in the text, and it is unclear how we pass from the one-inch to the larger scale. In the second, the one-inch symbolises the Ordnance Survey and is, or was, its ‘public face’, for most of the population in Britain, but it is a very misleading symbol. From the start in Ireland in 1824, and in Great Britain from 1841, the primary scale of survey was the six-inch, and from 1853-4 it was the 1:2500. Whilst it was central to the case for the 1:2500 that its cost was considerably less than 25.344 times (the lineal increase), never mind 642.32 times (the increase in area) that of the one-inch, and the sales per acre were admittedly rather less, nonetheless the increase in both survey effort and paper output was vastly greater. Thus, the essence of the Ordnance Survey for most of its history (taking its institutional origins as in 1783 or 1791) has been something much greater than the sideshow of the one-inch map. The rundown of paper mapping since the 1980s means that the only obvious evidence of large-scale survey in the shops at present is the depiction of field boundaries on the Explorer map, and even that connection is not advertised: the introduction of these maps from 1994 coincided with the omission of the note that the 1:25,000s were compiled from larger-scale surveys. Seemingly, to much of the public the Explorers and the 1:50,000 Landrangers are the full extent of the Ordnance Survey, particularly with the recent withdrawal of most of the smaller-scale paper mapping. The great LandLine database, with its 440 million TOIDs, is publicly invisible, yet it is the real meaning of the Ordnance Survey, and is the real background to the ‘free our data’ movement.
There are two more fundamental problems with the treatment of the one-inch here. There is no mention of Scotland or Ireland, yet the pressure for the adoption of the six-inch in Britain came mainly from Scotland, and the ‘Battle of
17 J H Andrews, A paper landscape: the Ordnance Survey in nineteenth century Ireland, Oxford: Clarendon Press, 1975, 92, 181; E F Clark, George Parker Bidder the calculating boy, Bedford: KSL Publications, 1983, 18-22.

49
the Scales’ in 1851-8 was sparked off at least partly by the Scots’ desire for a one-inch as well. Though the one-inch of England and Wales may have dragged its weary way to completion in 1870, that of Scotland, started in 1853, was still very incomplete: the outline-with-contours version (a form that Mudge, for one, would perhaps not have recognised) was completed in 1887 and the hachured version, which made it comparable with the Old Series of England and Wales, not until 1895. (The hachured one-inch of Ireland was also completed in 1895.) Though sheet 108 is described, correctly, as the last sheet to be completed for England, it was very far from the last sheet for Britain, and it is unclear exactly what was the intention for publishing up to the 1820s: more and more evidence is emerging that at least three groups of sheets – Essex (published 1805), Devon (1809) and the Isle of Wight (nominally 1810) – were originally conceived as independent entities, and that a national sheet line scheme may only have been devised in 1809-10, and then designed to cover Britain rather than England and Wales.18
And this leads to the final point: throughout, the original one-inch map of England and Wales, which is generally known as the Old Series, is called ‘the First Series’. Where did this come from? Now it is true that, around the 1980s, the Ordnance Survey themselves were wont to use this term, but protests were made, and the fruits of them can be seen in the Owen and Pilbeam history (which, by the way, ought to be updated for recent developments and reissued), which gave scholarship something of an official imprimateur.19 At the risk of repeating what many will know already, Brian Harley, the first specialist in Ordnance Survey history, fought ‘tooth and nail’ to get David and Charles to call their series of reissues ‘Old Series’ rather than ‘First Edition’, and failure there was followed by success first with Harry Margary and then (by proxy of associates) with Ordnance Survey itself. So far as I know, the OS has only ever issued two ‘First Series’: the civil 1:25,000 – renamed thus halfway through its career, having started as a ‘Provisional Edition’ – and the 1:50,000, for the three-quarters or so of sheets that were issued in what earlier would have been called what it was, a ‘Provisional Edition’.
There is a fundamental matter here: calling something a ‘First Series’ implies at least a Second Series, and at any rate something more than an occasion. No-one calls the military survey of Scotland a ‘first series’, partly perhaps because no other national mapping has been prepared at 1:36,000, but primarily because of its ‘occasional’ nature. Likewise the six-inch Townland survey of Ireland was an ‘occasion’; Colby had to fight hard to stop the residual organisation being completely shut down in the mid 1840s. To the Victorians, what we know as the Old Series was simply ‘the Ordnance map’; even F W Maitland, writing
18 Richard Oliver, ‘The sheet sizes and Delamere sheet lines of the one-inch Old Series’,
Sheetlines 77 (2006), 27-51; I am indebted to Roger Hellyer for recent work on Essex, Devon and the Isle of Wight.
19 Tim Owen and Elaine Pilbeam, Ordnance Survey, map makers to Britain since 1791, London: HMSO, and Southampton: Ordnance Survey, 1992, esp.180.

50
around 1896 when it was on the point of being completely superseded, referred to it as ‘the original one-inch ordnance map’.20 Whilst there were a great many indications that by 1870 the Ordnance Survey was here to stay, for many its output seemed essential static: ‘the Ordnance map’, ‘the townland survey’, ‘the cadastral survey’, the great triangulation: the moment, the occasion, the passing phenomenon, the supreme authority.
These reservations apart, this is a book that deserves to be read. I hope that we have not heard the last of Rachel Hewitt in a cartographic history context.
Richard Oliver
Cassini map teaching set (CMTS), Cassini Maps, 2010, (no ISBN), £49.95 + VAT
The first thing that must be stated about this teaching set is that it comes as a digital resource and that it is only available to schools. It matches the other commercial products available from Cassini. In buying this resource a school is able to create a matching set of historical Ordnance Survey maps from five periods over the last two hundred years, centred on any point they choose. All maps exactly match each other in scale, projection and area of coverage. As well as the maps CMTS comes with background notes, a set of twelve worksheets and a lifetime licence for the school.
In practice, most schools will use their postcode for centring the maps which can be printed out A3 size, and also projected onto an electronic white board. Each map covers an area of approximately 19 km by 12 km (some 230 sq km). For all the maps both the scale 1:50,000 and the projection is consistent with present day OS map, and the National Grid has been added together with a simplified map key which allows direct comparison between each map.
20 References in Victorian fiction are admittedly not common: see [R S Surtees], Handley Cross [1854: London: Methuen, 1911 [1950]], [p.641], Chapter LXIII (where it is unclear whether a fictional or real newspaper report is being cited), and Anthony Trollope, Phineas Redux [1874: Oxford University Press [The Worlds Classics series], 1983], [p.139], Chapter XVI. There seem to be no references in Dickens and Thackeray, but then, unlike Surtees and Trollope, they were not hunting men. F W Maitland’s famous reference is in Domesday Book and beyond [originally published Cambridge University Press, 1897], [London:] Collins/Fontana, 1960, 39. [This Collins/Fontana edition, by the way, is a minor ‘collector’s piece’, in that whereas the original edition of 1897 duly used reproductions from the Old Series, it uses the first edition of the New Series for the Berks-Oxon border extract (fp 32) and, mirabile dictu, the Advanced Edition published by Photozincography for the Devon-Somerset border extract (fp 33). Either Old or New Series make Maitland’s point, though the Old Series rather than the New Series would be essential were one to illustrate Maitland’s point further down page 39 on open fields in Cambridgeshire.] There are three references by Conan Doyle in Sherlock Holmes stories to OS maps (‘The engineer’s thumb’ (written 1891-2), The Hound of the Baskervilles (1901-2) and ‘The Adventure of the Priory School’ (1903-4), but they are not what might be termed technically reliable.
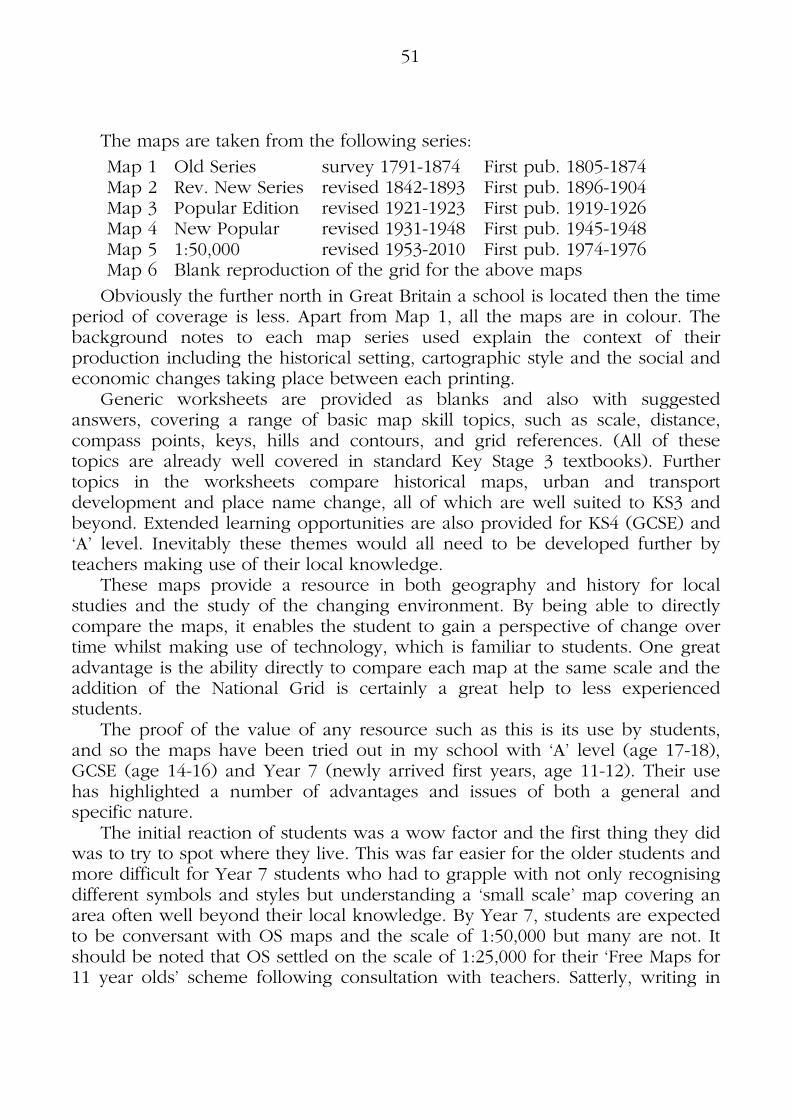
51
The maps are taken from the following series:
Map 1 Old Series survey 1791-1874 First pub. 1805-1874 Map 2 Rev. New Series revised 1842-1893 First pub. 1896-1904 Map 3 Popular Edition revised 1921-1923 First pub. 1919-1926 Map 4 New Popular revised 1931-1948 First pub. 1945-1948 Map 5 1:50,000 revised 1953-2010 First pub. 1974-1976 Map 6 Blank reproduction of the grid for the above maps
Obviously the further north in Great Britain a school is located then the time period of coverage is less. Apart from Map 1, all the maps are in colour. The background notes to each map series used explain the context of their production including the historical setting, cartographic style and the social and economic changes taking place between each printing.
Generic worksheets are provided as blanks and also with suggested answers, covering a range of basic map skill topics, such as scale, distance, compass points, keys, hills and contours, and grid references. (All of these topics are already well covered in standard Key Stage 3 textbooks). Further topics in the worksheets compare historical maps, urban and transport development and place name change, all of which are well suited to KS3 and beyond. Extended learning opportunities are also provided for KS4 (GCSE) and ‘A’ level. Inevitably these themes would all need to be developed further by teachers making use of their local knowledge.
These maps provide a resource in both geography and history for local studies and the study of the changing environment. By being able to directly compare the maps, it enables the student to gain a perspective of change over time whilst making use of technology, which is familiar to students. One great advantage is the ability directly to compare each map at the same scale and the addition of the National Grid is certainly a great help to less experienced students.
The proof of the value of any resource such as this is its use by students, and so the maps have been tried out in my school with ‘A’ level (age 17-18), GCSE (age 14-16) and Year 7 (newly arrived first years, age 11-12). Their use has highlighted a number of advantages and issues of both a general and specific nature.
The initial reaction of students was a wow factor and the first thing they did was to try to spot where they live. This was far easier for the older students and more difficult for Year 7 students who had to grapple with not only recognising different symbols and styles but understanding a ‘small scale’ map covering an area often well beyond their local knowledge. By Year 7, students are expected to be conversant with OS maps and the scale of 1:50,000 but many are not. It should be noted that OS settled on the scale of 1:25,000 for their ‘Free Maps for 11 year olds’ scheme following consultation with teachers. Satterly, writing in

52
1964, commented that ‘maps of large areas on a small scale are not the best introduction to school mapwork’.1
Older (GCSE and ‘A’ level) students found little difficulty in understanding and comparing the maps. However they were quick to spot a drawback of this particular map set for their own school located on the south-western fringes of London. The 75 year time period between Map 1 (1805/1822) and Map 2 (1897/1909)2 misses out on some of the most significant changes in this particular area in terms of railway development and urban growth. By 1897 the railway network is almost complete and therefore the understanding of the urban geography would be significantly improved by the addition of a mid-nineteenth century map. The change between Map 2 and Map 3 (1897/1909 to 1920) covers a relatively short time period with only some minor urban change just before the housing explosion in this area of the 1920s and 1930s. Map 4 (1940-1947) amply shows this suburban development. Map 5 is undated and titled ‘Present day OS mapping’ (copyright 2010).
The length of time between maps could be an issue for teaching purposes as there may be parts of the country like SW London where there have been dramatic changes and the provision of more maps would be useful as a teaching tool. Likewise there may be parts of Great Britain where there have been relatively few changes and the themes suggested in the teaching notes are more difficult to identify on the maps.
In the late 1970s The Schools’ Council Geography project encouraged teachers to produce local resources. In my school’s case, we are fortunate to have a ‘Kingston in Maps’3 resource, and despite being published in 1979, still providing good service thirty years after publication. The map set, produced by teachers, is No. 4 in Archive Teaching Units ‘to introduce students to the use of local documentary source material in the study of history and geography’. Besides reproducing Rocque’s eighteenth century map and an early nineteenth century town plan, the great advantage of the set is the reproduction of six-inch (1:10,560) maps from the 1860s, 1890s, 1920 and 1932/33 which provides for the detailed analysis of urban and industrial change. These maps complement the CMTS by filling in some of the gaps identified above.
With the CMTS, both hard and electronic formats can be used although for the younger students the hard map copy proved more useful; whilst the ‘A’ level students enjoyed finding that they could overlay the maps electronically on each other – a most useful way of showing change. Likewise it is possible to print the maps on acetate sheets, which physically allows the maps to be overlaid and compared, helpful to the younger students. Strangely this was not suggested in the teaching notes provided by Cassini. 1 D Satterly, Skills and concepts involved in map drawing and map interpretation, New Era, 45 (1964), 260-3.
2 It is not clear whether the dates on each map refer to revision or publication. 3 Kingston in Maps - Archive Teaching Unit No. 4, published by Royal Borough of Kingston upon Thames, 1979, ISBN 903183080. Now sadly out of print but copies are quickly snapped up if they are spotted locally.

53
Aimed at secondary and primary schools, the former will almost certainly have the ability to use the map set to its full potential whilst primary schools may not always have access to colour/A3 photocopiers or electronic whiteboards. It is not clear whether this resource will be available to the tertiary market. The background notes do suggest the possibility of selecting another area for comparison with the local region which would also be useful for any fieldwork study.
The CMTS certainly allows broad themes of study to be followed but inevitably students studying urban change will want to study larger scale maps (and exam board specifications will often point them to historic maps at larger scales such as Alan Godfrey’s successful map series). The CMTS must be regarded as another useful (but relatively expensive for a school) educational resource which will have to be used alongside other local resources to realise its full potential. John King
Richard Kirwan, If maps could speak, Dublin: Londubh Books, ISBN 978-1-907535-09-3, paperback, 192 pages, €14.99
The author was director of Ordnance Survey Ireland from 1996 until 2006. He takes the reader behind the scenes into the minds and work of the early map-makers with accounts of their adventures, endurance, heroism and inventions in pre-famine Ireland. Their achievements and struggles are counterpointed by the successful efforts of OSI to bring the mapping of Ireland up to date in the final decades of the twentieth century. Rodney Leary
Summer expeditions for members
Gotha in former East Germany has close associations with two legendary cartographers, Justus Perthes and Hermann Haack. There is much of interest in and around the town, which was capital of Saxe-Coburg-Gotha, home of Queen Victoria’s husband Albert.
Anne Stauche a native of Gotha and publisher of map2: the zoomable map of London (www.thezoomablemap.com) will lead a small group to visit the area in May or June. Gerry Zierler is co-ordinating the trip; contact him now at [email protected] or 020 7284 2848 (office hours) for further information. Rodney Leary writes: A plethora of venues have been arranged for your delectation in Dublin on the 7-9 July 2011. They include Ordnance Survey Ireland, National Archives of Ireland, the Royal Irish Academy, Glucksman Map Library at Trinity College and hopefully another not yet confirmed. And so that we might all be together, I have also negotiated a good bargain price for three or four nights bed, breakfast and evening meal at a four star hotel in central Dublin near to Trinity and other national museums and galleries which you might just find time to visit. If you are interested please contact me on 01584 874246 before 10 January 2011.
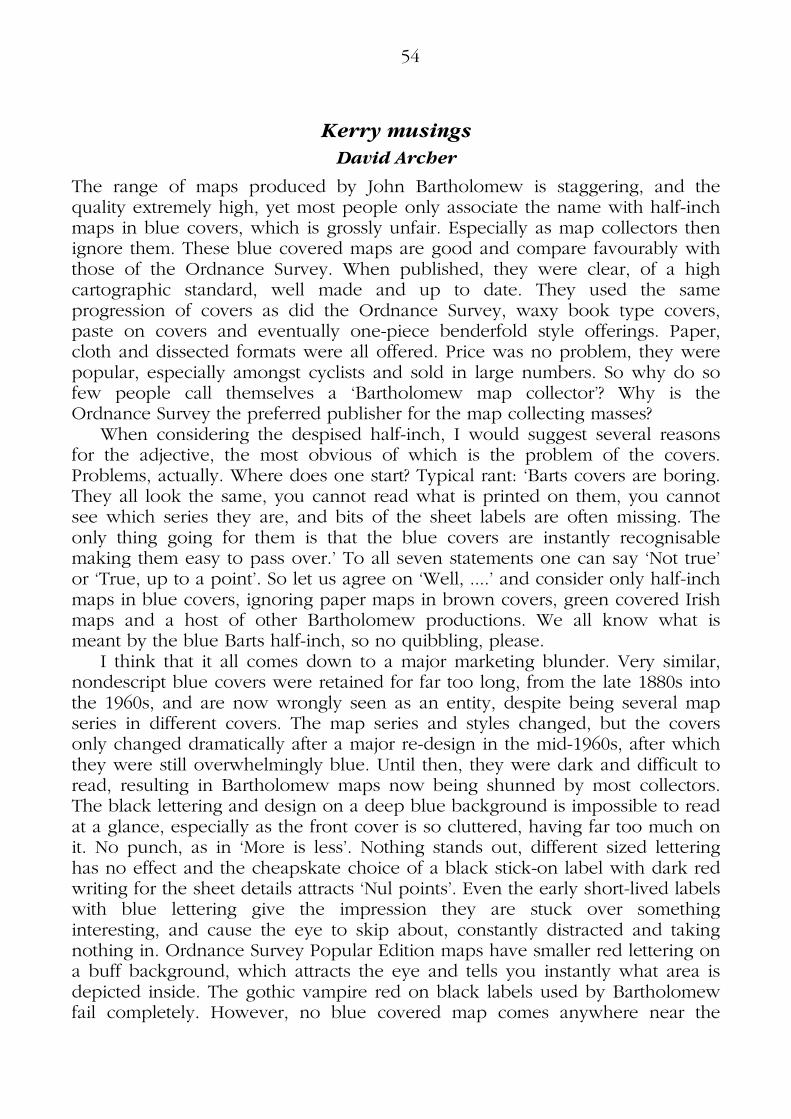
54
Kerry musings
David Archer
The range of maps produced by John Bartholomew is staggering, and the quality extremely high, yet most people only associate the name with half-inch maps in blue covers, which is grossly unfair. Especially as map collectors then ignore them. These blue covered maps are good and compare favourably with those of the Ordnance Survey. When published, they were clear, of a high cartographic standard, well made and up to date. They used the same progression of covers as did the Ordnance Survey, waxy book type covers, paste on covers and eventually one-piece benderfold style offerings. Paper, cloth and dissected formats were all offered. Price was no problem, they were popular, especially amongst cyclists and sold in large numbers. So why do so few people call themselves a ‘Bartholomew map collector’? Why is the Ordnance Survey the preferred publisher for the map collecting masses?
When considering the despised half-inch, I would suggest several reasons for the adjective, the most obvious of which is the problem of the covers. Problems, actually. Where does one start? Typical rant: ‘Barts covers are boring. They all look the same, you cannot read what is printed on them, you cannot see which series they are, and bits of the sheet labels are often missing. The only thing going for them is that the blue covers are instantly recognisable making them easy to pass over.’ To all seven statements one can say ‘Not true’ or ‘True, up to a point’. So let us agree on ‘Well, ....’ and consider only half-inch maps in blue covers, ignoring paper maps in brown covers, green covered Irish maps and a host of other Bartholomew productions. We all know what is meant by the blue Barts half-inch, so no quibbling, please.
I think that it all comes down to a major marketing blunder. Very similar, nondescript blue covers were retained for far too long, from the late 1880s into the 1960s, and are now wrongly seen as an entity, despite being several map series in different covers. The map series and styles changed, but the covers only changed dramatically after a major re-design in the mid-1960s, after which they were still overwhelmingly blue. Until then, they were dark and difficult to read, resulting in Bartholomew maps now being shunned by most collectors. The black lettering and design on a deep blue background is impossible to read at a glance, especially as the front cover is so cluttered, having far too much on it. No punch, as in ‘More is less’. Nothing stands out, different sized lettering has no effect and the cheapskate choice of a black stick-on label with dark red writing for the sheet details attracts ‘Nul points’. Even the early short-lived labels with blue lettering give the impression they are stuck over something interesting, and cause the eye to skip about, constantly distracted and taking nothing in. Ordnance Survey Popular Edition maps have smaller red lettering on a buff background, which attracts the eye and tells you instantly what area is depicted inside. The gothic vampire red on black labels used by Bartholomew fail completely. However, no blue covered map comes anywhere near the

55
dreadfully dull, brown covers of the Ordnance Survey 1946 Ten Mile Road map. Dead, and totally lacking in appeal.
True, the blue got lighter and the red lettering brightened as the last century progressed, but to no avail, still a fussy cover. It might have been a good marketing ploy for Kit-Kat to keep the same packaging for decades, but collectors demand an attractive subject and seek variety. They want variations to be pretty obvious, so a vast expanse of blue is fine for the sea, but not for over seventy years of map covers. The front covers are overwhelmed by irrelevant text or are considered advertising hoardings. Why the publisher’s full address appears, goodness knows, whilst it would be better mentioned elsewhere that the King and late King favoured this product, leaving much needed blank space. That the maps were for cyclists, motorists, and tourists should not have appeared either. A greatly slimmed text would be thought far more attractive today.
Most members have probably never considered the different map series within the blue covers. Yet, if each series was in a strikingly different coloured cover, I am certain far more would be collected, even with the cluttered design, which would be much easier to read on a pale background for example. People use covers to help identify different series, so there needs to be diversity to appeal. Towards the end, Bartholomew did introduce different covers, which stand in contrast to what went before, but for a different scale: the metric half-inch. The red and black covers of the 1:100,000 National Map Series and the bright yellow of the little known 1:100,000 Leisure Map series are so different to anything previously issued. Alas, too late.
Another disaster is that Bartholomew used long and very similar cover titles: Bartholomew’s Reduced Ordnance Survey for Tourists & Cyclists Bartholomew’s New Reduced Survey for Tourists & Cyclists Bartholomew’s Revised Half-Inch to Mile for Motorists & Cyclists Like those for their map series, they are impossible to take in at a glance: Bartholomew’s “Half-inch to mile” map of England and Wales Bartholomew’s Revised Half-Inch Map What are we to call them? Sometimes the long map title differs from the
long cover title. Is it possible to shorten them? Nobody ever attempts to. Has anyone ever referred to the ‘Reduced’ or the ‘New Reduced’? Meaningless. No, the shortest we ever hear is ‘Bart’s half-inch’, with no attempt to identify a particular series. The titles were and still are too long and too similar, with the result that map enthusiasts get confused. Very confused, but more often just do not bother. If you sit down and work it all out to your own satisfaction, as I have done several times, ending by saying ‘Right, I think I know my way around the different series now’, should you fail to look at them for three months, all or most will be forgotten. Barts are certainly difficult. By contrast, the early Ordnance Survey covers are so clear, even the darkish red covers are saved by the clean and uncluttered design, which can only be called powerful on the white covers. Not a long edition title anywhere, yet perfectly informative.

56
With the publication of the one-inch Third Edition, the OS began using snappy edition titles, usually a number, short name or both. Thus we get the Coloured or Third Edition, Popular Edition, Fifth Edition. Even with fifty per cent of the title repeated they are strikingly different. Thirds, Pops and Fifths. Just asking to be sought, studied and collected.
So, the covers all look the same, and the lengthy titles are similar and confusing. If the situation had been saved by attractive and desirable covers, what do we find inside? A very nice cartographic product, the famous Barts half-inch layered map, one basic style that changed little over many decades, essentially the same from the 1880s to the 1970s, again continuing for far too long, and considered uninspiring today. During this time the OS one-inch had at least seven incarnations, ever changing. With OS maps, even the general public can suggest that one map is older than another, but with Bartholomew maps, a CCS member is hard put to do the same, especially with full dates of printing not appearing on maps until 1946. Another problem, so why bother?
The Ordnance Survey also published half-inch maps, but with a mix that attracts collectors. Small and large sheet series, three distinct styles plus outline versions, and a choice of cover styles. Plenty of interest here. Had Bartholomew issued a wide range of half-inch tourist and district maps, interest would have been added for collectors. Certainly if one has a stall at an event, maps with picture covers are the big attraction for the general public. Try to imagine the Ordnance Survey pre-war range without tourist maps. Far duller. Most who collect Ordnance Survey series maps also collect tourist and district maps. They add colour and variety to a collection. Variety being very important to collectors.
Might it have been different? Maybe, but not very. We should not compare Bartholomew’s lack of appeal with the whole of the Ordnance Survey’s output, just their half-inch maps. Fact: Ordnance Survey half-inch maps are collected far less than the one-inch. For almost all collectors, the half-inch are a secondary interest. They are collected because they are OS maps, not because half-inch maps are interesting. If the scale is unattractive, any fragile enthusiasm will be easily dampened. However, there are a lot of advantages to collecting Bartholomew’s blue covered maps, and for those lucky few who can focus on them, things are very promising. Collecting a less popular publisher means that prices are lower, things sit around longer and are not snapped up, little is known about them and scarce maps are priced as any other. I have heard people say that they have never paid any attention to Bartholomew maps as there is virtually nothing written about them to help the novice collector. A feeble excuse, as very little had been written about OS maps when our society was formed, yet extremely large private collections existed and many people had been collecting for years.
Most Bartholomew maps are not found in blue covers. Far more exist than is commonly realised; a truly vast and varied output, with wonderful things to be found. One can build as fine a collection of Bartholomew maps as OS maps,
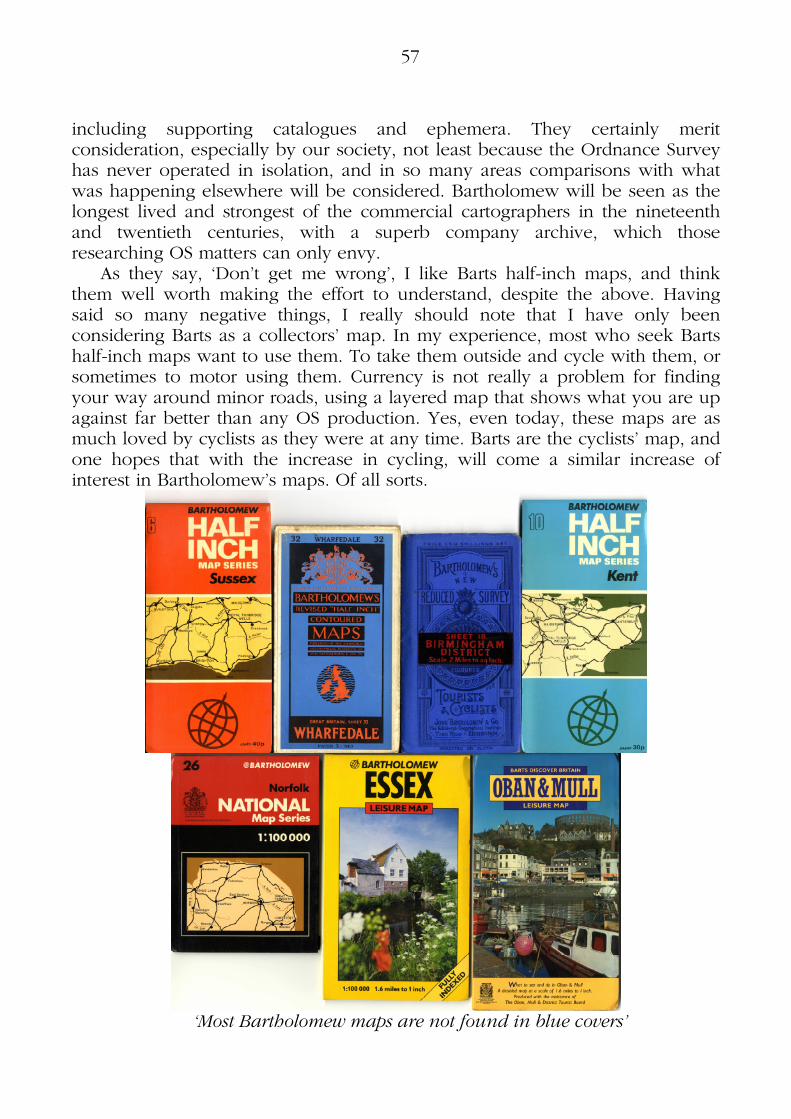
57
including supporting catalogues and ephemera. They certainly merit consideration, especially by our society, not least because the Ordnance Survey has never operated in isolation, and in so many areas comparisons with what was happening elsewhere will be considered. Bartholomew will be seen as the longest lived and strongest of the commercial cartographers in the nineteenth and twentieth centuries, with a superb company archive, which those researching OS matters can only envy.
As they say, ‘Don’t get me wrong’, I like Barts half-inch maps, and think them well worth making the effort to understand, despite the above. Having said so many negative things, I really should note that I have only been considering Barts as a collectors’ map. In my experience, most who seek Barts half-inch maps want to use them. To take them outside and cycle with them, or sometimes to motor using them. Currency is not really a problem for finding your way around minor roads, using a layered map that shows what you are up against far better than any OS production. Yes, even today, these maps are as much loved by cyclists as they were at any time. Barts are the cyclists’ map, and one hopes that with the increase in cycling, will come a similar increase of interest in Bartholomew’s maps. Of all sorts.
‘Most Bartholomew maps are not found in blue covers’

58
Letters
Whilst preparing for a holiday in Snowdonia, I was surprised to notice that on my 2005 edition of Explorer OL18 (Harlech, Porthmadog & Bala/Y Bala) the town of Blaenau Ffestiniog is misspelt (right). It is shown correctly on the area map on the rear cover.
Bill Mason
Members of the society (to which I am a recent recruit) may be interested in articles I have recently posted on the Geograph website.
At www.geograph.org.uk/article/Ordnance-Survey-Map-Symbols I have listed all the symbols appearing on Landranger mapping and for each displayed a 1km square section of map and a photograph of the relevant feature.
A similar facility for Explorer maps, with link to Get-a-map, appears at www.geograph.org.uk/article/OS-25K-map-symbols.
Examples of the use of abbreviations and descriptive words on OS mapping, again linked to photographs and map extracts, are at www.geograph.org.uk/-article/Ordnance-Survey---More-abbreviations and www.geograph.org.uk/article/Descriptive-words-on-OS-maps respectively.
When I started I thought words would come from a standard list, but there seems to be a great variety of wording for basically similar features.
David Hawgood
On my farm in the Vale of Aylesbury near Aston Clinton (once well known for a pub called The Bell) we have planted a small wood which is now known as Keystone Copse (the subtlety of this may be lost on your younger readers). [Oh, come on – subtlety? Keystone Cops? Ed.]
Ordnance Survey has kindly confirmed that they ‘have added a task to our intelligence system for the name of the wood to be added once the area has been updated in the revision programme’.
Although planted in winter 2007, and now well established, the trees (at SP 882127) don't show on Google Earth, which says something about the frequency of some of their updates. Mike Shepherd-Smith
I used to live at Stanmore, so Richard Oliver’s review of the Anderson Geographics map in the last Sheetlines, with an extract almost centred on Stanmore, attracted my close attention. I do not share Richard’s enthusiasm for the product.
59
Had it been titled A relief map of London, I would have been reasonably content, although the spot height of 154m at 147930 perplexes me: the OS shows a trig at 144m and there is no indication on the Explorer of a 150m contour near it. But landscape is more than relief. If modern landscape is intended, then undifferentiated brown for everything from large suburban gardens to skyscrapers appears to ignore the elephant in the room: London is a major city. If prehistoric landscape is meant, then we are back to a Physical Features map and that has to include streams and rivers. Indeed, in order to understand suitability for early settlement (as well as more technical matters like hydrology) one would particularly like to know where the natural springs were.
Now I used to live next to Stanmore Pond. I presumed this to be an artificial creation but it implies that, even at 140-odd metres, there was water available. One would not deduce this from the Anderson map, at least not for the southern slopes of this ridge. And what happens to the stream flowing NW from the (modern) Hilfield Park Reservoir? Does it encounter a Sink on the edge of Watford? Questions like this can be answered most easily by consulting the Old Series one-inch, which enables one to trace streams much higher up than modern mapping shows them. Doubtful points, like whether the blob at Stanmore Pond is indeed a water feature, can be resolved from the OSDs. The subtler points of relief are shown just as clearly by hachures as they are by contours. So if I need a Physical Features map of London, I shall look at the Old Series, supplemented where necessary by the reproductions of the London OSDs issued by the London Topographical Society in 1991 (and with an introduction by Yolande Hodson).
Of course, one could do better with all the digital resources available today. A scan of the Old Series, with water features changed to blue and contours added in brown would offer the best of both worlds. With a little cartographic research, one might even recover the natural line of the streams underlying such features as Aldenham Reservoir which pre-date the Old Series. A mash-up like that really would be useful.
Rob Wheeler
Congratulations to Sheetlines editors, printers, et al., on the increased use of colour – so often essential to better map interpretation.
Francis Herbert
Vic Harris writes: Would any member consider a map exchange please? I want Folkestone (sheet 128) Third Edition one-inch and a pre-1914 six-inch of Folkestone. To swap I have a choice of several other Third Edition sheets. Please contact me at [email protected] or 01223 843428.

60
Puzzle corner 89
In Sheetlines 87 and 88 Alexander Kent1 compared OS mapping with that of other European national mapping agencies. He made the point that cultural differences are reflected in the various topographic map symbologies. To illustrate this, Alex has taken ten symbols from official 1:50,000 topographic maps of various European countries. Below are the symbols followed by a list of countries and pictures of the objects represented. They are in different sequences and you are invited to match each symbol to its country and photograph and to identify the object.
1
2
3
4
5
6
7
8
9
10
Countries: Austria, Belgium, Denmark, Finland, France, Iceland, Ireland, Latvia, Poland, Spain.
Objects represented: a
b
c
d
e
f
g
h
i
j
Answers opposite. 1 Ordnance Survey and cartographic style, Sheetlines 87,19 and 88,11.
We wish you a very Happy Christmas!