2 3 Response of Masonry Walls Strengthened with CFRP and Steel Strips
Upload
khangminh22Category
view
0download
0
LICENTIATE T H E S I S
Luleå University of TechnologyDepartment of Civil, Mining and Environmental Engineering
Division of Structural engineering
2008:32|: 02-757|: -c -- 08 ⁄32 --
2008:32
Mechanical Anchorage of Prestressed CFRP Tendons
Theory and Tests
Universitetstryckeriet, Luleå
Anders BennitzA
nders Bennitz
Mechanical A
nchorage of Prestressed CFR
P Tendons Theory and Tests
2008:3
2


Mechanical Anchorage of Prestressed CFRP Tendons
Theory and Tests


Preface
i
Preface
Fibre reinforced composites are a tool for the civil engineering community to join the course of recycling. It makes it possible to use otherwise deficient structures for a longer period and hence reduce production of new building materials. Since the work in this thesis has been focused on prestressing of concrete using CFRPs, a further reduction in material for strengthening can be obtained. It has then been easy, as an environmentally friendly PhD student, to embrace the subject.
My predecessor on the subject, Tech. Lic. Håkan Nordin, and our common supervisor, Prof. Björn Täljsten, set the course for the work on prestressing using CFRP tendons on the department of Structural Engineering at Luleå University of Technology. This was done already in the year 2000 and the subject is still of great interest both to the engineering society and to me as a researcher.
Encouragement on the way to this half time check point in my PhD studies has come from several directions. For financial support I would like to acknowledge the Development Fund of the Swedish Construction Industry (SBUF) together with Skanska AB as well as the European Community who through the research program “Sustainable Bridges” facilitated the interesting and rewarding case study. I would also like to thank the foundations of Åke & Greta Lisshed, Helge Ax:son Johnsson and Claes Adelskjölds fund of medal and memory for their contributions that allowed me to attend interesting conferences throughout Europe. Also Banverket should be mentioned for their contribution. They seem to have a never ending interest in the development of new methods to rehabilitate old concrete structures and did not hesitate to do that on the Frövi Bridge.
In addition to the above mentioned organizations several colleagues have crossed my way during the first two and a half years in work. It is not within the scope of this thesis to list them all. I do however hope that you can feel included in some of the groupings I would like to thank. First of all three persons at Denmark’s University of Technology have played a key role in the execution of performed laboratory experiments on the anchorages. M. Sc. Jacob W. Schmidt, and master students Finnur Gíslason and Guðjón Magnússon, without you the thesis would not have been what it is today.

Mechanical Anchorage of Prestressed CFRP Tendons
ii
Prof. Björn Täljsten and Tech. Dr. Anders Carolin, thank you for your supervision. You contribute with years of knowledge and never ending energy. I am looking forward to continue the work with Björn and it would have been my pleasure to also continue working with Anders, but as it is now I wish you good luck with your new job.
Furthermore I would like to thank all helpful and interesting colleagues at the division of structural engineering, especially Tech. Lic. Thomas Blanksvärd and Tech. Lic. Markus Bergström for their support and co-operation. It will be harder to continue the work without you two in the future.
M. Sc. Georg Danielsson, Mr Thomas Forsberg, Mr Lars Åström and Tech. Dr. Claes Fahlesson and the rest of the laboratory crew, your work and knowledge are highly appreciated and I know that it will be necessary also in the future of this project.
Dipl. Ing. Rose-Marie Helmerich and the rest of the German crew, you have been great to work with on the Frövi Bridge and I hope that you return to Sweden in new interesting projects.
During the work on this thesis I have been fortunate to meet a wonderful new partner in Ann Enman, my thoughts, during all the hours spent on the thesis do repeatedly return to you. Together with friends, family and bitter enemies in the forests of Norrbotten you make me feel alive.
Anders Bennitz
Luleå September 2008

Abstract
iii
Abstract
Fibre Reinforced Polymers (FRPs) are slowly becoming important materials to consider also for a structural engineer. They are light-weight, insensitive to corrosion and have highly modifiable mechanical properties. Strengths five times higher than that of ordinary reinforcing steel are common and that combined with the possibility to vary the modulus of elasticity makes them suitable to use in combination with concrete. Carbon fibre based polymers (CFRPs) especially serve as an excellent substitute for steel in the rehabilitation of structures. A case study on that subject is presented in this thesis while the focus lies on the use of CFRP as a material for use in prestressing tendons, and to be more precise, on the anchorage of prestressed CFRP tendons.
FRPs orthotropic properties highly influence their behaviour in different directions. The best properties are reached through tension in the fibre direction, and as such CFRP is as good for prestressing tendons as any prestressing steel. It is also not sensitive to corrosion and easy to work with due to its light weight. Mechanical properties in the transverse direction are however not that advantageous and early attempts to anchor CFRP bars by traditional mechanical prestressing anchorages have consistently failed. A thorough program for the development of a successful anchorage has therefore been undertaken.
In a first step a literature review was conducted to investigate CFRPs possibilities to replace steel in prestressing applications, internally and externally, as well as traditional anchorage techniques for steel tendons. From the literature study it was concluded that CFRP may very well serve as tendons but some doubts also arose concerning the environmental effect on the CFRPs long term behaviour and the materials ability to work under bent conditions in multispan applications. The traditional anchorages will however not work properly, all of them use mechanical grip to keep the steel stressed. This is possible through the steels capacity to yield but not suitable to anchor the brittle CFRP. A state-of-the-art survey on attempts made globally during the last 15 years to come up with a suitable frictional anchorage has also been performed. It can be seen that several ideas are discussed, often in one or two publications. One Canadian research team, Al-Mayah et al. (2001-2008), has taken the development further and focused on variations of the traditional wedge anchorage. Based on the knowledge

Mechanical Anchorage of Prestressed CFRP Tendons
iv
gained from the literature it was decided to further concentrate on a conical anchorage with a barrel of steel and three smooth wedges in aluminium.
Simple analytical approaches to the conical wedge anchorage with smooth interior surfaces prove the importance of the angle in the wedge-barrel interface. Also frictional behaviour in the rod-wedge and wedge-barrel interfaces proves to be important factors.
Numerical studies of these and other geometrical and mechanical properties give further input into the development of a pilot anchorage to be tested in the laboratory. The optimum angle of the wedge towards the barrel seems to be between 2-3°. The thickness of the wedge should be kept as small as possible and it is favourable with high strength steel in the barrel. A small displacement of the wedges towards the unloaded end of the tendon in the design of the anchorage does also reduce the overall slip of the rod during tension.
After overcoming initial problems not discovered in the analytical or numerical models the developed anchorage performed well during laboratory tests. In short term tests performed on an 8 mm thick circular rod 100 % of the rods ultimate capacity was reached. During the tests measurements of displacements and strains were performed. Fibre Optical Sensors (FOS – Bragg gratings) were for the first time included in the interior of the anchorage to give a complete picture of the load phase. These measurements were compared to a refined finite element model and show reasonable agreement. The largest source of error is assumed to be the complicated frictional behaviour in the material interfaces and the transverse material properties of the CFRP.
Lastly a case study on the strengthening of a 50 year old trough bridge in Frövi is included. The bridge was successfully strengthened for bending in the transverse direction with 23 Near Surface Mounted Reinforcement (NSMR) bars in the lower part of the slab while 11 holes are drilled underneath the upper steel reinforcement to facilitate CFRP tubes with an outer diameter of 32 mm and a thickness of 4 mm.
The lack of bending capacity was discovered by a consultant in 2005 and calculations with a new approach in this thesis show that the strengthening was necessary although on a minor scale. New calculations of the capacity show that the bridge’s capacity after strengthening is well above the design load and measurements on site secure that the CFRP is utilized correctly as a load carrier.
Keywords: CFRP, Concrete, Prestress, Anchorage, Tendon, FEM, Frövi Bridge, Strengthening, Tubes

Sammanfattning
v
Sammanfattning
Fiberkompositer (FRP) håller sakta men säkert på att etablera sig som ett viktigt material också för byggbranschen. De är lätta, okänsliga för korrosion och dess egenskaper kan i stor utsträckning anpassas efter ändamålet. Möjligheten att variera elasticitetsmodulen tillsammans med hållfastheter som inte sällan är upp till fem gånger högre än för normalt armeringsstål gör dem utmärkta att använda i kombination med betong. Speciellt kolfiberkompositer (CFRP) kan i många fall med fördelaktigt resultat ersätta stålet vid rehabilitering av konstruktioner. I den här avhandlingen presenteras en fallstudie på det området medan fokus ligger på möjligheterna att använda CFRP som förspänningsmaterial samt också på en lösning av förankringsproblematiken vid förspänning med CFRP.
FRP är ortotropt vilket i stor utsträckning påverkar dess beteende i olika riktningar. Bäst egenskaper fås om materialet sträcks i fiberriktningen och i den riktningen har CFRP minst lika bra egenskaper som förspänningsstål. Utöver det är det också okänsligt för korrosion och mycket lätt. De mekaniska egenskaperna i transversell riktning är dock inte lika fördelaktiga och tidiga försök att förankra CFRP stänger med traditionella förspänningslås har varit misslyckade. Ett omfattande projekt för att utforma ett användbart och pålitligt lås har därför genomförts.
I ett första steg utfördes en litteraturstudie avseende CFRPs möjligheter att ersätta stål vid invändig och utvändig förspänning samt också med avseende på traditionella förankringar för spännarmering. Där framkom att CFRP mycket väl kan fungera som spännarmering men några frågetecken uppstod angående miljöns påverkan på dess långtidsegenskaper och dess böjförmåga vid förspänning över flera spann. De traditionella låsen kommer dock inte att fungera på CFRP, samtliga traditionella lås bygger på att mer än bara friktionen används för att hålla stålet sträckt. Det är möjligt tack vare stålets plastiska egenskaper men fungerar inte i kombination med det spröda beteendet hos CFRP. Dessutom gjordes en sammanställning av de senaste 15 årens forskningsresultat med avseende på friktionsförankringar av FRP. Från den kan man utläsa att flera idéer har diskuterats i en eller två publikationer men inte mer. Ett kanadensiskt forskarlag, Al-Mayah et al. (2001-2008), har dock tagit utvecklingen längre och koncentrerat sig på varianter av det traditionella killåset. Baserat på det som litteraturstudien gett tas ett beslut om att gå vidare med ett koniskt lås med en hylsa av stål och tre kilar i aluminium.

Mechanical Anchorage of Prestressed CFRP Tendons
vi
En statisk 2D analys och en matematisk axisymmetrisk modell visar på betydelsen av vinkeln i gränsytan mellan kilen och hylsan. Likaså visar det sig att friktionen i ytorna mellan CFRP stav och kil samt kil och hylsa är viktiga parametrar som styr låsets beteende.
Inför laboratorieförsöken krävdes ytterligare kunskap om vilka parametrar som påverkar beteendet mest. Till den parameterstudien användes numeriska modeller. Optimal vinkel hos gränsytan mellan kil och hylsa ska ligga mellan 2 och 3°. Tjockleken på kilen ska vara så liten som möjligt och ett starkt stål minskar rörelserna i låset. En design med en liten utdragning av kilarna i det obelastade stadiet ger också det mindre total longitudinell rörelse i låset.
Efter ett par mindre lyckade laboratorieförsök då flera mindre problem, som inte kunde förutses med de analytiska eller numeriska modellerna, rättades till så uppnåddes till slut mycket lyckade resultat. I de korttidsförsök som genomfördes på en 8 mm tjock cirkulär stav uppnåddes 100 % av stavens hållfasthet. För utvärdering av testen så mäts både förskjutningar och töjningar. Fiber Optiska Sensorer (FOS) används för första gången inuti låset för att ge en komplett bild av hur låset beter sig under belastning. Mätningarna jämförs med en uppdaterad variant av den finita element modellen som tar hänsyn till ankarets slutliga utformning. Resultaten stämmer delvis överens men osäkerheten kring de komplicerade friktionsförhållandena och kolfiberkompositens transversella egenskaper gör modelleringen och avläsningen av den svår.
Sist presenteras en fallstudie på förstärkningen av en 50 år gammal trågbro i Frövi. Bron förstärks med 23 stycken Near Surface Mounted Reinforcement (NSMR) stänger i underkant av bottenplattan och 11 stycken rör i överkant av plattan. Rören har ytterdiametern 32 mm och en tjocklek av 4 mm, de installeras i hål som borrats genom plattan under överkantsarmeringen. Förstärkningen var mycket lyckad.
Kapacitetsbristen hos bron upptäcktes av en konsultfirma under 2005 och nya beräkningar i den här avhandlingen med en ny beräkningsmodell visar att förstärkningen var nödvändig, om än i en något mindre omfattning. Nya beräkningar av den förstärkta kapaciteten visar att bron nu har en kapacitet som med god marginal tar hand om de pålagda lasterna. Långtidsmätningar på plats visar också att kolfiberkompositen är ordentligt utnyttjad.
Nyckelord: CFRP, Betong, Förspänning, Förankring, Spännarmering, FEM, Frövibron, Förstärkning, Rör

Notations and Abbrevations
vii
Notations and Abbrevations
Explanations of notations or abbreviations in the text in direct conjunction to their appearance have preference over what is presented here. Units are consistently given in SI-units in this table. Throughout the thesis the SI-unit may be varied with an even number of power of tens to suit the variables application.
Roman Upper Case Letters
Description Unit
A Area of tensile steel reinforcement [m2]
A’s Area of tensile steel reinforcement in upper part of slab [m2]
Ab,mean Mean cross sectional area of barrel [m2]
Ac Area of concrete [m2]
Acm Mean area of FRP tendons [m2]
Across Area of cross section [m2]
AHS Area of high strength steel [m2]
ANS Area of normal strength steel [m2]
Ar Cross sectional area of rod [m2]
As Area of tensile steel reinforcement in lower part of slab [m2]
As(I) Area of tensile steel reinforcement counteracted by the concrete [m2]
As(II) Area of tensile steel reinforcement counteracted by compressed steelreinforcement
[m2]
As,comp Area of transverse steel reinforcement used as compressive steel reinforcementin calculations
[m2]
As,tens Area of transverse steel reinforcement used as tensile steel reinforcement incalculations
[m2]

Mechanical Anchorage of Prestressed CFRP Tendons
viii
C1 Arbitrary constant in the solution of an integral equation [-]
C1 Constant [-]
C2 Arbitrary constant in the solution of an integral equation [-]
C4 Constant [-]
C5 Constant [-]
cal Fctm Calculated mean force at failure of tendon [N]
E Modulus of elasticity [Pa]
Ec Modulus of elasticity for concrete [Pa]
Ecd Modulus of elasticity for concrete used in design [Pa]
Ecm Mean modulus of elasticity of FRP tendon [Pa]
Eef Concrete’s effective modulus of elasticity [Pa]
Ef Modulus of elasticity in fibre [Pa]
Ef Modulus of elasticity for CFRP [Pa]
Efd Modulus of elasticity for CFRP used in design [Pa]
EL Modulus of elasticity in longitudinal direction [Pa]
Em Modulus of elasticity in matrix [Pa]
Emean Mean modulus of elasticity [Pa]
Emin Minimum modulus of elasticity [Pa]
Er Modulus of elasticity of the rod [Pa]
Er Modulus of elasticity of the barrel [Pa]
Er Modulus of elasticity in radial and circumferential directions [Pa]
Es Modulus of elasticity for steel [Pa]
Esd Modulus of elasticity for steel used in design [Pa]
Estd.dev. Standard deviation of modulus of elasticity [Pa]
ET Modulus of elasticity transverse direction [Pa]
ET1 Modulus of elasticity in first transverse direction [Pa]
ET2 Modulus of elasticity in second transverse direction [Pa]
F Applied force [N]

Notations and Abbrevations
ix
F95%, manuf. 95% of force at failure of tendon given by manufacturer [N]
F95%, tests. 95% of force at failure of tendon from proof tests [N]
FAnchorage Force at failure in one specific anchorage [N]
Fjack Jacking force during presetting [N]
Fmax Maximum force reached in an anchorage test [N]
Fnewpre,max Updated maximum prestressing force possible to apply [N]
Fpre Prestressing force [N]
Fpre,a Estimated maximum prestressing force along a tendon [N]
Fpre,b Effective prestressing force at position b [N]
FPre,HS Prestressing force in high strength steel [N]
Fpre,max Maximum prestressing force possible to apply without slip of tendon [N]
FPre,NS Prestressing force in normal strength steel [N]
Fset Presetting force [N]
Fset,barrel Compressive force between barrel and concrete during presetting [N]
FTtm Mean measured force at failure of tendon-anchorage system [N]
Gf Modulus of shear in fibre [Pa]
GLT Modulus of shear in longitudinal direction on a transverse face [Pa]
Gm Modulus of shear in matrix [Pa]
GTL Modulus of shear in transverse direction on a longitudinal face [Pa]
GTT Modulus of shear in transverse direction on a transverse face [Pa]
I Moment of inertia for calculated section [m4]
K Constant accounting for unintentional curvatures [-]
Lan Length of anchorage [m]
Lcomp Compressed length of barrel [m]
Lfr Length of free part of rod [m]
Lrod Length of rod [m]
M Total bending moment capacity of loaded section [Nm]

Mechanical Anchorage of Prestressed CFRP Tendons
x
M(I) Bending moment capacity of a section with compressive stresses handled bythe concrete
[Nm]
M(II) Bending moment capacity of a section with compressive stresses handled bycompressed steel reinforcement
[Nm]
Mdead Bending moment due to dead weight of the section [Nm]
Mneg Negative bending moment capacity [Nm]
Mpos Positive bending moment capacity [Nm]
N Normal force [N]
Nb Normal force on barrel’s inner face [N]
Nr Normal force on rod’s face [N]
Nwb Normal force on wedge’s outer face [N]
Nwb ,x Component of normal force on wedge’s outer face along x-axis [N]
Nwb ,y Component of normal force on wedge’s outer face along y-axis [N]
Nwr Normal force on wedge’s inner face [N]
S Frictional shear force [N]
Sb Frictional shear force on barrel’s inner face [N]
Sr Frictional shear force on rod’s face [N]
Swb Frictional shear force on wedge’s outer face [N]
Swb ,x Frictional shear force on wedge’s outer face along x-axis [N]
Swb ,y Frictional shear force on wedge’s outer face along y-axis [N]
Swr Frictional shear force on wedge’s inner face [N]
Swr,available Frictional shear force on wedge’s inner face available for utilization [N]
Roman Lower Case Letters
Description Unit
b Width of cross section used for calculations [m]
cal Fctm Calculated mean force at failure of tendon [N]
cc’s Distance between upper transverse steel reinforcement [m]

Notations and Abbrevations
xi
ccs Distance between lower transverse steel reinforcement [m]
d Diameter of core sample [m]
d’s Distance from concrete’s upper surface to centre of upper tensile reinforcement [m]
d’s,comp Distance from concrete’s compressed surface to centre of compressed transversereinforcement
[m]
db Barrel’s outer diameter [m]
dib Barrel’s inner diameter [m]
dr Rod’s outer diameter [m]
ds Distance from concrete’s upper surface to centre of lower tensile reinforcement [m]
ds,tens Effective depth of calculated section [m]
fcc Compressive strength of concrete [Pa]
fcc,just Compressive strength of concrete, adjusted for bridges older than 10 years [Pa]
fccd Compressive strength of concrete used in design [Pa]
fccd,just Compressive strength of concrete used in design, adjusted for bridges older than10 years
[Pa]
fct Tensile strength of concrete [Pa]
fctd Tensile strength of concrete, use din design [Pa]
fctm Mean tensile strength of FRP tendon [Pa]
ff Failure strength of CFRP [Pa]
ft Tensile strength [Pa]
fy Yield strength [Pa]
fy,HS Yield strength in high strength steel [Pa]
fy,NS Yield strength in normal strength steel [Pa]
fyd Yield strength used in design [Pa]
h Height [m]
hc Height of concrete used in design [m]
l Length in longitudinal direction [m]
lb Barrel’s length [m]
lr Rod’s length [m]

Mechanical Anchorage of Prestressed CFRP Tendons
xii
lw Wedge’s length [m]
n1 Radius of rod-wedge interface after deformation [m]
n2 Radius of wedge-barrel interface after deformation [m]
n3 Radius of barrel’s outer surface after deformation [m]
p1 Radial pressure in rod-wedge interface [Pa]
p2 Radial pressure in wedge-barrel interface [Pa]
p3 Radial pressure on barrel’s outer surface [Pa]
pi Inner pressure [Pa]
po Outer pressure [Pa]
r Length in radial direction [m]
r Radial position at which the calculations are carried out [m]
rbi Barrels inner radius [m]
rbi Initial radius of the barrel’s inner surface [m]
rbo Barrels outer radius [m]
rbo Initial radius of the barrel’s outer surface [m]
rf Radius of rod [m]
ri Inner radius [m]
ro Outer radius [m]
rro Initial radius of the rod’s outer surface [m]
rwi Initial radius of the wedge’s inner surface [m]
rwo Initial radius of the wedge’s outer surface [m]
tb Barrel’s thickness [m]
tb1 Barrel’s thickness in thick end [m]
tb2 Barrel’s thickness in thin end [m]
tw1 Wedge’s thickness in thin end [m]
tw2 Wedge’s thickness in thick end [m]
u Radial displacement [m]
ubi Radial displacement of the barrel’s inner surface [m]
ubo Radial displacement of the barrel’s outer surface [m]

Notations and Abbrevations
xiii
uLVDT Displacement measured by LVDT [m]
uro Radial displacement of the rod’s outer surface [m]
uwedge Sliding of wedge into barrel [m]
uwi Radial displacement of the wedge’s inner surface [m]
uwo Radial displacement of the wedge’s outer surface [m]
v Circumferential displacement [radians]
vf Volume fraction of fibre [-]
vm Volume fraction of matrix [-]
x Distance to neutral layer [m]
xa Distance to point a [m]
xneg Distance to neutral layer if negative bending moment is applied [m]
xpos Distance to neutral layer if positive bending moment is applied [m]
b Width of cross section used for calculations [m]
Greek Upper Case letters
Description Unit
Difference [-]
Diameter [m]
Greek Lower Case letters
Description Unit
Angle in polygon of forces [°]
Proportionality factor for concrete [-]
s Proportionality factor concrete/steel [-]
xa Intentional changes of curvature along xa [radians]
Angle in polygon of forces [°]

Mechanical Anchorage of Prestressed CFRP Tendons
xiv
Angle between direction of principal stress and rod’s axis of symmetry [°]
m Material safety factor [-]
m,E Material safety factor concerning modulus of elasticity of material [-]
m,strength Material safety factor concerning strength of material [-]
n Safety class [-]
Angle between symmetry axis and wedge-barrel interface [°]
Deformation of concrete [m]
Deformation in high strength steel [m]
Deformation in normal strength steel [m]
cm Mean strain at failure of FRP tendon [-]
cu Strain in concrete at failure [-]
dead Strain due to dead weight [-]
dead,l Strain in lower part of section due to dead weight [-]
dead,u Strain in upper part of section due to dead weight [-]
f Strain at failure of CFRP [-]
fd Strain at failure of CFRP used in design [-]
min Minimum strain at failure [-]
r Strain in radial direction [-]
sy Strain in steel at yielding [-]
u Strain at failure [-]
Strain in circumferential direction [-]
,centre Circumferential strain on barrel measured at central position of wedge [-]
,mean Mean circumferential strain [-]
,quarter Circumferential strain on barrel measured at a position between the wedge’s centreand the spacing between the wedges
[-]
,space Circumferential strain on barrel measured between wedges [-]
A Efficiency factor for a prestressing anchorage [-]
Length in circumferential direction [radians]
w Wedge’s length in circumferential direction [°]

Notations and Abbrevations
xv
Ratio between longitudinal tensile and transverse compressive stresses [-]
Coefficient of friction [-]
rw Coefficient of friction in the rod-wedge interface [-]
wb Coefficient of friction in the wedge-barrel interface [-]
Poisson’s ratio [-]
1 Parameter [-]
2 Parameter [-]
3 Parameter [-]
f Poisson’s ratio in fibre [-]
LT Poisson’s ratio in longitudinal direction on a transverse face [-]
m Poisson’s ratio in matrix [-]
r Poisson’s ratio in radial and circumferential directions [-]
TL Poisson’s ratio in transverse direction on a longitudinal face [-]
TT Poisson’s ratio in transverse direction on a transverse face [-]
1 Substitute for E in the transformation to plane strain conditions [Pa]
2 Substitute for in the transformation to plane strain conditions [-]
f1 Comparison parameter, reinforcement ratio of composite [-]
f1,neg Comparison parameter used for negative bending moment [-]
f1,pos Comparison parameter used for positive bending moment [-]
f2 Comparison parameter, reinforcement ratio of composite [-]
fn Comparison parameter, reinforcement ratio of composite [-]
fn,neg Comparison parameter used for negative bending moment [-]
fn,pos Comparison parameter used for positive bending moment [-]
fo Comparison parameter, reinforcement ratio of composite [-]
fo,neg Comparison parameter used for negative bending moment [-]
fo,pos Comparison parameter used for positive bending moment [-]
fu Comparison parameter, reinforcement ratio of composite [-]
neg Comparison parameter used for negative bending moment [-]
pos Comparison parameter used for positive bending moment [-]

Mechanical Anchorage of Prestressed CFRP Tendons
xvi
s,comp Ratio between cross sectional area of compressive steel and concrete [-]
s,tens Ratio between cross sectional area of tensile steel and concrete [-]
’s Compressive stress in steel reinforcement [Pa]
1 Principal stress [Pa]
l Longitudinal stress [Pa]
l Longitudinal force on infinitesimal element [N]
mean Mean failure strength [Pa]
min Minimum failure strength [Pa]
pre Prestress in tendon [Pa]
r Radial stress [Pa]
r Radial force on infinitesimal element [N]
s Stress in tensile steel reinforcement [Pa]
std.dev. Standard deviation of failure strength [Pa]
u Stress at failure [Pa]
u,5th Fifth percentile strength [Pa]
ul,tens Ultimate tensile capacity in fibre direction [Pa]
ut,comp Ultimate compressive capacity transverse to fibre direction [Pa]
wb Internal radial pressure on barrel’s inner face [Pa]
Circumferential stress [Pa]
Circumferential force on infinitesimal element [N]
lr Shear force on longitudinal face in radial direction [N]
l Shear force on longitudinal face in circumferential direction [N]
rl Shear force on radial face in longitudinal direction [N]
r Shear force on radial face in circumferential direction [N]
l Shear force on circumferential face in longitudinal direction [N]
r Shear force on circumferential face in radial direction [N]
Creep coefficient [-]
Angle between two directions of fibres [°]
ef Effective creep coefficient [-]

Notations and Abbrevations
xvii
bal Balanced mechanical amount of reinforcement [-]
s Mechanical amount of reinforcement [-]
Abbrevations
Description
2D Two-Dimensional
3D Three-Dimensional
AFRP Aramid Fibre Reinforced Polymers
CFRP Carbon Fibre Reinforced Polymers
FRP Fibre Reinforced Polymers
GFRP Glass Fibre Reinforced Polymers
RC Reinforced Concrete
PS Prestressing
FIP The International Federation for Structural Concrete
PTI The American Post-Tensioning Institute
FE Finite Element
FEM Finite Element Model
UHPC Ultra High Performance Concrete
EMPA The Swiss Federal Laboratories for Materials, Testing and Research
AEA Air Entrainment Agents
ISO International Organization for Standardization
LVDT Linear Variable Differential Transformer
FOS Fibre Optical Sensor
LS-# Longitudinal Sensor
CS-# Circumferential Sensor
FBG Fibre Bragg Grating
NSMR Near Surface Mounted Reinforcement

Mechanical Anchorage of Prestressed CFRP Tendons
xviii
BAM German Federal Institute for Materials Research and Testing
CBI The Swedish Cement and Concrete Institute
CSHM Civil Structural Health Monitoring
LTU Luleå University of Technology
CTOD Crack Tip Opening Displacement sensor
USB Universal Serial Bus
BBK Swedish Code for Concrete Design

Definitions
xix
Definitions
Prestressing Prestressed concrete provides a way to overcome the combined tensile stresses, due to own weight and design loads in beams and slabs, by introducing a compressive stress in the structural element prior to the superimposed design loads coming into play. The net effect in a properly designed prestressed structural element is a stress condition that satisfies the stress limits in the concrete for both compression and tension. Thereby limiting the cracking and making it possible to create more slender structures.
TendonsTendon is a generic term including all types of reinforcement used in the prestressing process to create the prestressing force. For high strength steel the possible types are wires, strands and bars, where they also can be combined into multi-wire-, multi-strand- and multi-bar-tendons. The most common strand type is the 7-wire-strand with a centre wire and six exterior winded wires. FRP tendons are divided into sheets, laminates and bars with differing shapes and sizes. These tendons are orthotropic with strong tensile behaviour in the longitudinal direction while the transverse properties are largely unfavourable, which decrease the combination and anchoring possibilities.
Pre- and Post-Tensioned Tendons Concrete can be prestressed in a factory by tensioning the reinforcement first and then casting concrete to surround the pre-tensioned reinforcement. Alternatively, the concrete can be cast in place and the reinforcement tensioned after the concrete has reached a required strength; this is denoted post-tensioned reinforcement. Posttensioning can be used for strengthening of an existing structure as well as in the production of a new one while pretensioning is only possible to carry out during the production process.
Internal and External Tendons Tendons running completely or mainly inside the concrete cross-section are called internal tendons. External tendons include the remaining types of tendon placements. See Figure i.

Mechanical Anchorage of Prestressed CFRP Tendons
xx
a b c d
Figure i a: internal pretensioned and bonded tendons; b: internal posttensioned and bonded tendons in a duct; c: internal posttensioned and bonded tendons, in this case post-tensioned NSMR bars; d: external posttensioned tendons
Bonded and Unbonded Tendons A bonded tendon transmits its inherent stress to the concrete along its full length. This can be due to direct contact between the tendon and the concrete, as is the case in pre-tensioned structures. Other possible solutions to reach bonded conditions are through grouting of post-tensioning ducts or the use of glue-like adhesives when, for example, applying NSMR (Near Surface Mounted Reinforcement) rods. The unbonded conditions are characterized by an anchorage in each end of the tendon that transmits the stress to the concrete. Externally applied tendons are often unbonded. See Figure i.
Anchorages To transmit the stress from an unbonded tendon to the concrete structure two anchorages are necessary. Several types are available. One of the more common types is the wedge anchor. It uses the increasing stress in the tendon to tighten the grip. See Figure ii. It can also be useful to name a short distance of bonding as an anchorage if the tendon in one end is glued into a drill hole in an adjacent structure.
Tendon
Casing
WedgeFpost-tension
FrictionConcrete
Figure ii Example of the wedge anchorage principle

Table of content
xxi
Table of content
PREFACE...................................................................................................................................I
ABSTRACT.............................................................................................................................III
SAMMANFATTNING ............................................................................................................ V
NOTATIONS AND ABBREVATIONS .............................................................................. VII
DEFINITIONS .....................................................................................................................XIX
TABLE OF CONTENT.......................................................................................................XXI
1 INTRODUCTION ........................................................................................................... 1
1.1 OBJECTIVE ................................................................................................................ 31.2 RESEARCH QUESTIONS ............................................................................................. 41.3 METHOD ................................................................................................................... 41.4 LIMITATIONS............................................................................................................. 41.5 THESIS GUIDE ........................................................................................................... 5
2 PRESTRESSING ANCHORING SYSTEMS ............................................................... 7
2.1 GENERAL .................................................................................................................. 72.2 LOSS OF PRESTRESS .................................................................................................. 8
2.2.1 System Losses ...................................................................................................... 82.2.2 Losses in Concrete............................................................................................... 92.2.3 Losses in Steel ................................................................................................... 11
2.3 STEEL SYSTEMS ...................................................................................................... 122.3.1 General.............................................................................................................. 122.3.2 Systems for Anchorage of High Strength Steel .................................................. 142.3.3 Commercial Tensioning Systems....................................................................... 17
2.4 CFRP AS PRESTRESSING MATERIAL ....................................................................... 262.5 SYSTEMS FOR ANCHORAGE OF CFRP ..................................................................... 27
2.5.1 Orthotropic Effects on FRP’s Mechanical Properties ...................................... 282.5.2 Expectations Confronting FRP Anchoring Systems .......................................... 292.5.3 Unbonded System Designs ................................................................................ 332.5.4 Evaluation of Existing Systems.......................................................................... 48
3 FORCE DISTRIBUTION ANALYSIS OF A WEDGE ANCHORAGE.................. 51
3.1 STATIC RIGID BODY ANALYSIS .............................................................................. 523.1.1 Presetting .......................................................................................................... 523.1.2 Removal of Fset .................................................................................................. 57

Mechanical Anchorage of Prestressed CFRP Tendons
xxii
3.1.3 Application of Prestress .................................................................................... 583.1.4 Circumferential Stresses.................................................................................... 603.1.5 Discussion Concerning the 2D Static Rigid Body Model .................................. 63
3.2 MAXIMUM FORCE TRANSFER ................................................................................. 633.2.1 Limiting Factors ................................................................................................ 63
3.3 THEORY OF THICK-WALLED CYLINDER ................................................................. 693.3.1 Introduction....................................................................................................... 693.3.2 Basic Equations................................................................................................. 71
3.4 APPLICATION OF THE THICK-WALLED CYLINDER THEORY .................................... 783.4.1 Minimum Radial Barrel Thickness .................................................................... 783.4.2 Setting of Wedge................................................................................................ 79
4 NUMERICAL MODEL ................................................................................................ 85
4.1 ANCHORAGE MODELS IN LITERATURE ................................................................... 854.1.1 Axisymmetric ..................................................................................................... 864.1.2 3D...................................................................................................................... 90
4.2 NEW MODEL........................................................................................................... 934.2.1 General Approach ............................................................................................. 944.2.2 Initial Design..................................................................................................... 974.2.3 Element Distribution ....................................................................................... 101
4.3 PARAMETRIC STUDY............................................................................................. 1024.3.1 Combination of Variables ............................................................................... 108
4.4 DISCUSSION AND CONCLUSIONS ........................................................................... 109
5 LABORATORY TESTS ............................................................................................. 111
5.1 INTRODUCTION ..................................................................................................... 1115.2 DEAD END ANCHORAGE DESIGN .......................................................................... 1115.3 MECHANICAL PROPERTIES OF CFRP ROD ............................................................ 1135.4 DEVELOPMENT OF THE WEDGE ANCHORAGE ....................................................... 115
5.4.1 Discovered Failure Modes .............................................................................. 1155.4.2 First Design..................................................................................................... 1195.4.3 Second Design ................................................................................................. 1205.4.4 Third Design.................................................................................................... 1225.4.5 Fourth Design ................................................................................................. 1235.4.6 Fifth Design..................................................................................................... 124
5.5 FINAL WEDGE ANCHORAGE DESIGN .................................................................... 1275.5.1 Material Properties ......................................................................................... 128
5.6 TEST EQUIPMENT.................................................................................................. 1305.6.1 Presetting ........................................................................................................ 1305.6.2 Tensile Loading ............................................................................................... 131
5.7 INSTRUMENTATION............................................................................................... 1315.7.1 Strain Gauges.................................................................................................. 1315.7.2 Displacement Sensors...................................................................................... 1345.7.3 Fibre Optical Sensors (FOS)........................................................................... 135
5.8 LOADING............................................................................................................... 1385.9 DISCUSSION .......................................................................................................... 139
6 EVALUATION OF LABORATORY TESTS........................................................... 141
6.1 UNPROCESSED DATA ............................................................................................ 141

Table of content
xxiii
6.2 ULTIMATE FAILURE .............................................................................................. 1426.3 DISPLACEMENTS ................................................................................................... 144
6.3.1 Slip in Dead End Anchorage ........................................................................... 1446.3.2 Strain in Free Part of the Rod ......................................................................... 1456.3.3 Slip and Wedge Sliding in the Wedge Anchorage ........................................... 146
6.4 STRAIN.................................................................................................................. 1486.4.1 Weighted Circumferential Stress..................................................................... 1496.4.2 Variation of Mean Strains due to Load and Location ..................................... 1516.4.3 Fibre Optical Sensors (FOS)........................................................................... 155
6.5 RADIAL PRESSURE FROM THICK-WALLED CYLINDER THEORY ............................ 1576.6 COMPARISON OF MEASUREMENTS WITH FE-MODEL ............................................ 162
6.6.1 Refined FE-Model ........................................................................................... 1626.6.2 Confirmation of Units...................................................................................... 1666.6.3 Wedge Sliding.................................................................................................. 1676.6.4 Longitudinal Strains on Barrel........................................................................ 1686.6.5 Longitudinal Strains on Rod............................................................................ 1736.6.6 Circumferential Strains ................................................................................... 1766.6.7 Radial Pressure ............................................................................................... 1786.6.8 Longitudinal Stresses on Rod .......................................................................... 182
7 CASE STUDY - THE FRÖVI BRIDGE PROJECT ................................................ 185
7.1 INTRODUCTION ..................................................................................................... 1857.1.1 Background ..................................................................................................... 1867.1.2 Aim of the Project............................................................................................ 1887.1.3 Project Outline ................................................................................................ 189
7.2 CONCRETE COVER AND REINFORCEMENT DETECTION ......................................... 1897.2.1 Ultrasonic Echo............................................................................................... 1907.2.2 Ground Penetrating Radar.............................................................................. 1917.2.3 Electromagnetic Induction and Boreholes ...................................................... 192
7.3 INSTALLATION OF CFRP....................................................................................... 1947.3.1 Strengthening Design ...................................................................................... 1947.3.2 Installing of NSMR .......................................................................................... 1957.3.3 Installation of CFRP Tubes ............................................................................. 197
7.4 MONITORING ........................................................................................................ 1997.4.1 CSHM Plan ..................................................................................................... 1997.4.2 Results ............................................................................................................. 2087.4.3 Discussion and Conclusions............................................................................ 214
7.5 REFINED CALCULATIONS...................................................................................... 2177.5.1 New vs. Old approach ..................................................................................... 2177.5.2 Before Strengthening....................................................................................... 2207.5.3 After Strengthening.......................................................................................... 2247.5.4 Discussion and Conclusions............................................................................ 230
7.6 DISCUSSION AND CONCLUSIONS ........................................................................... 231
8 CONCLUDING REMARKS ...................................................................................... 233
8.1 FUTURE IMPROVEMENTS AND RESEARCH ............................................................. 235
REFERENCES...................................................................................................................... 237
APPENDIX A - MATERIAL DATA................................................................................... 247

Mechanical Anchorage of Prestressed CFRP Tendons
xxiv
APPENDIX B - WEDGE ANCHORAGE TEST RESULTS ............................................ 253
APPENDIX C - DESIGN DRAWINGS OF THE FRÖVI BRIDGE ................................ 273
APPENDIX D - CFRP DISTRIBUTION ON THE FRÖVI BRIDGE ............................. 277
APPENDIX E - FRÖVI RESULTS ..................................................................................... 279
DOCTORAL AND LICENTIATE THESES...................................................................... 289

Introduction
1
1 Introduction
FRP is the commonly used abbreviation for Fibre Reinforced Polymers. It refers to a composite material composed of fibres and a polymer matrix. Fibres are used as reinforcement for strength and stiffness, the matrix as a transferring medium and for protection of the fibres. The composite concept is not new and already in ancient times composites consisting of straw reinforced clay were used for construction of small huts. This simple form of composites has from its ancient predecessors evolved into today’s highly advanced composites. The constituents of fibre reinforced polymer composite are dependent on each other to work properly. A bundle of fibres will be impossible to handle and vulnerable to mechanical damage without its matrix. On the other hand the matrix alone would not have the mechanical properties necessary for structural use. By combining the two materials a new material is created, the composite, with commonly better properties than the separate constituents. For carbon fibre reinforced polymers (CFRP) this means a material which in several critical aspects is superior to the most favourable high strength steel. Several similar systems using other fibre materials, such as GFRP (Glass) and AFRP (Aramid) are also available today. GFRP is commonly used for internal reinforcement, but also for bridge decks and retrofitting. CFRP is the dominant composite material regarding external strengthening and is also used for prestressing purposes and stay cables. AFRP is used to a minor extent when large deformations are required, such as for example impact absorption and seismic strengthening.
Even though high performing fibre reinforced polymers have been available to the industry for more than 30 years its use in civil engineering structures has in comparison been limited. The main reason for this is probably the comparable high material cost. Pioneers have in the meantime been the defence industry, aerospace and aviation engineers working with the development of new products. Here the driving force has

Mechanical Anchorage of Prestressed CFRP Tendons
2
been the light weight and high stiffness, often related to small production volumes (at least in comparison to the building industry). These industries are technology driven and have financial resources to carry out a vast amount of research and development. Also the sports industry has been of utmost importance for increased demands for FRP goods. The high costs can relatively easy be transferred to the customer for high performance gadgets. Most civil engineering applications are very different from the industries just described. The building industry is firstly governed by many regulations, codes and standards, which do not cover FRPs. Secondly the life of building structures often exceeds 50 years, which is considerably longer in comparison to other industries. In addition, a civil engineering structure often has a high dead load and is exposed to aggressive environments. Thirdly, the building industry is time and cost driven – if new products and systems are introduced they should be both time and cost saving. This might explain in part why composites have not gained any significant impact in the construction industry – up until now.
The change came during the nineteen-nineties when the use of FRPs for construction gained interest. Much of this was related to the governments and their authorities concerned with the infrastructure. Once they started to realize that a large amount of the structures built during the post-war era were about to reach the end of their service lives they also realized that something had to be done. In addition to the degradation experienced during these structures’ service lives they have also experienced a great change in use expressed in increased load levels and traffic flows. A larger number of vehicles carrying heavier loads at higher speeds stressed the demands of the bridges. Either these bridges had to be repaired, upgraded or in worse cases exchanged for new structures to fulfil the requirements of the twenty-first century. Consequently more effective repair and strengthening methods to improve the load carrying capacity were searched for.
Based upon traditional techniques for steel plate bonding and external prestressing a new branch evolved, FRP strengthening. By using the light weight, non-corrosive and elastic FRPs it became possible to design strengthening systems for a wide range of structures and applications. Civil engineering structures are however often exposed to challenges not found in other industries. The environments are never as controlled as they can be in a factory; structures are affected by weather with rain, snow, wind and temperature changes. In addition often difficult working conditions may limit the possibilities to practice good workmanship. This is very important in relation to external strengthening with FRPs. Before FRPs could get any impact as a strengthening material it was therefore necessary with extensive laboratory testing, development of guidelines and demonstration projects. Today several national guidelines for FRP usage in the building industry have been published. The first was presented in Japan in 1993, Sonobe et al. (1997), and was then followed by other countries such as United Kingdom, ISE (1999), Canada, CSA (2000), USA, ACI (2001), Egypt, EMHUUD (2005). More about the development in guides throughout

Introduction
3
the world can also be studied in ACI (2007) Bakis et al. (2002), Täljsten (2003) and Nordin (2003).
In this thesis a narrow approach to CFRP in civil engineering is adopted, focusing on pre-stressing in general and on post-tensioning in particular; and ways to use the new material in external post-tensioning and strengthening of existing concrete structures. By the use of pre-stressing it is possible to reach a higher utilization of the CFRP. In excess to the higher ultimate capacity it gives a structure it also increases its ability to resist service loads compared to CFRP reinforcement that is not prestressed. This is particularly interesting in aggressive environments where the crack width must be kept below stated a maximum value. It also limits the deflection, which without prestressing might be a problem in slender structures. The process can be described as an activation of the CFRPs capacity before any live load is applied. In the case of strengthening this may result in closing of cracks in concrete structures and a straightening of a structure that might be deformed due to its dead weight or repeated loading.
So far the majority of attempts with CFRP in post-tensioning applications have used continuous bonding for transmission of stresses between CFRP and concrete, Teng et al. (2003). Such a system requires a bonding agent, large contact areas or end-peel protection and direct contact between CFRP and concrete. If a system instead could use mechanical anchoring for the stress transmission no epoxy on the worksite would be necessary and it would be possible to re-tense the tendon if creep or relaxation occurs. In addition no grinding, sawing or drilling would be necessary to provide good bonding and flat surfaces. Problems are however present also with this type of system. In contrast to steel CFRPs are often anisotropic with a majority of the fibres in one direction which in a sense make them vulnerable for transverse stresses, which is crucial for a mechanical anchoring system to work. The solution is to decrease these forces, but how is that carried out without losing the necessary friction to resist a tendon stress of up to approximately 3000 MPa. Several attempts have been made, more or less successfully. Naturally a longer anchorage length will provide greater resistance with a lower transverse pressure and such attempts generally also work well but are too large to be useful in the field. A small and reliable system for mechanical anchoring of external post-tensioning tendons is definitely necessary to utilize the full potential of the CFRP-materials. In this thesis the focus is the force transfer in the mechanical anchorage. The main objectives of the research are given in the next section.
1.1 Objective The main objectives of the research presented in this thesis are to investigate, understand and to further develop mechanical wedge anchorage systems for CFRP tendons. The investigation is made by studying existing literature and earlier research, which should lead to an increased understanding of the studied topic. Further

Mechanical Anchorage of Prestressed CFRP Tendons
4
developments have been obtained by analytical and numerical studies together with laboratory testing.
1.2 Research Questions Based on the objectives a number of research questions have been raised, and these questions have also to a high degree determined the outline of the work carried out in the thesis. The following questions are asked: 1. What problems are related to prestressing of CFRP tendons? 2. How do the forces in the mechanical wedge anchorage device affect the CFRP
tendon? 3. Can a suitable mechanical wedge anchorage be developed that fulfils the force
transferring demands?
1.3 Method The study presented in this thesis has followed a traditional research path. In that spirit a literature review of existing mechanical anchoring systems has been the starting point. By covering systems extensively used on steel-tendon systems and how they have been converted into systems suitable for CFRP-tendons a focus for a new system can be found.
After the literature study an analytical and numerical investigation was carried out. This study formed the basis for the laboratory testing where a suitable test matrix was developed. After pilot tests the numerical model was updated and new tests carried out. The results of the present research have then been summarised in this thesis.
1.4 Limitations In the area of rehabilitation and strengthening of existing concrete structures with fibre reinforced polymers several material combinations as well as strengthening methods are available. First this thesis focuses on carbon fibre composites as the load carrying component. Furthermore the optimization focuses on one type of anchorage system, the unbonded conical wedge anchorage system, which is selected in an early stage of the project.
For the analytical part a 2D-modell with elastic behaviour is used although it is known that the system behaves somewhat differently in the 3D-space. These aspects are however considered in the numerical analysis and commented more on in the thesis.
Laboratory tests are limited to one type of circular CFRP-tendon, one cross-section and the same material properties of the tendon in all tests. Other CFRPs with different

Introduction
5
cross sections or different material parameters might behave differently but the one chosen here is considered representative for the purpose. Additionally, output from the laboratory tests are limited to force, strain in the CFRP and the anchorage and slip of the CFRP in relation to the anchorage.
1.5 Thesis Guide During the work on the thesis three distinct parts have evolved, based on each of the research questions respectively. For an introduction to these parts a brief description is given below.
Part A - Anchoring systems
This section includes Chapter 2 and deals with different mechanical anchoring systems. It is a literature review of the existing market and research for systems anchoring steel as well as CFRP tendons.
Part B - Optimization
In Chapter 3 properties of the chosen system are looked upon and optimized through an analytical approach and in Chapter 4 a numerical study is presented. Several parameters are considered and the output for the next part is an optimized design within the limitations given.
Part C - Laboratory tests
To investigate the developed design laboratory tests are performed with set up, loading and samples described in Chapter 5 while the results are presented in Chapter 6.
In addition an in-situ application is presented in Chapter 7 where the strengthening of a railway bridge is followed closely and evaluated with focus on possible advantages found by the use of FRPs. In this chapter it is also discussed to what extent a different assumption of model for the bearing capacity calculations would change the necessity of the strengthening.
In Chapter 8 the findings are summarized, discussed and concluded. Finally I propose areas for future research and possible improvements concerning external prestressing of CFRP tendons with mechanical wedge anchorages.


Prestressing Anchoring Systems
7
2 Prestressing Anchoring Systems
2.1 General The overall plan for this literature review is to give a status report on current research in the area of anchorages related to prestressing tendons. Focus will be placed on the attempts made to anchor FRP, with special interest in CFRP.
Prestressing FRP, and in particular GFRP, was investigated already in the seventies. However, it was found that GFRP was not the most suitable material for prestressing. The main reason for this was its susceptibility to stress corrosion above stress levels of approximately 25-30 %, Myers et al. (2007), and bad creep behaviour ACI (2004). The research regarding prestressing FRP was then dormant for some time. However, when cost for CFRP started to decrease during the beginning of the nineties and when external FRP bonding of concrete structures became more frequently used during the end of the eighties and beginning of the nineties FRP prestressing also became a research topic. This was partly due to the beneficial effect of prestressing to concrete structures and partly due to a more efficient use of the CFRP material. In addition to this CFRP does not undergo stress corrosion and has superb fatigue properties. Today research in this field is carried out at several research locations in the world, Reda Taha (2003a), and the anchoring detail has obtained in comparison extensive interest.
In the present study an overview of existing anchoring systems for steel tendons are presented together with existing anchorage systems for CFRP tendons. Drawbacks and benefits of the systems are in particular addressed. However, before different prestressing systems are presented, losses related to prestressing structures will be discussed.

Mechanical Anchorage of Prestressed CFRP Tendons
8
2.2 Loss of Prestress By the introduction of prestress into a RC (Reinforced Concrete) structure a relatively high and constant load is applied. To some extent this prestress can be compared to a dead load that affects the structures long-term behaviour. It give rise to considerable creep in the concrete as well as relaxation of the steel, which both have to be considered in the design together with the assumed load-independent shrinkage of the concrete. All of them result in the so-called loss of prestress over time. More instantaneous losses are seating of anchorages, friction along the tendon and elastic shortening of the RC member.
Guidelines and codes use different approaches and equations to calculate these losses. They do however all agree that the six previously mentioned contributions to the loss of prestress should be included in the design process in one way or another. Swedish codes, Boverket (2004), with its interpretation in Svensk Byggtjänst (1990) state simple design equations for all losses except for the anchorage seating. For the seating a slip for the specific anchorage used has to be found. The equations include safety margins so that the material safety factor, m, can be set to 1.0. Also the new European code, CEN (2004), presents equations for calculations of all losses but the anchorage seating. The equations are comparable to the ones found in Boverket (2004) but give more opportunities for optimized design. This means that the equations are open for larger variations, include more parameters and that consideration has to be taken to safety factors. The United States bases their design upon ACI (2005) which briefly touches upon the losses but also refers their readers to suggestions given elsewhere. The parameters given are similar to the ones in the Swedish and European codes. For post-tensioning guidelines are given in PTI (2006) which also presents equations for calculations of anchorage seating. Several books that among others also give help in the design process have been published as well, for example, Collins & Mitchell (1991), Nawy (2000) and Branson (1977).
Fundamental theories on the different types of losses are presented in the following sections but for a more thorough discussion of the design process the mentioned codes should be studied.
2.2.1 System Losses Frictional losses and seating of anchorages are both more inherent to the prestressing system chosen than to the materials chosen. Both are also short term, or instantaneous, losses. This implies that they occur during stressing or at the moment that the prestressing force is transferred from the jack to the concrete.
Frictional Losses During stressing it is probable that the tendon will come in contact with the surrounding materials in one way or another. A curved duct induces the largest

Prestressing Anchoring Systems
9
contacts where the tendon along large distances is forced against the walls of the duct, but the risk of friction should be considered also in other types of prestressing applications. Harpings may for example introduce friction into pre-tensioned or externally post-tensioned tendons while unintended bends of ducts also may produce friction into seemingly straight cases.
With the introduction of friction it is problematic to know the actual state of stress along the tendon, which is generally lower than the stress measured at the anchorage. If the structure then is designed with the high stress measured at the tendons end its strength is overestimated further inside the structure. Frictional losses naturally increase with the distance from the jacking end. For long tendons with curved paths it may therefore be necessary with a jack in each end to thereby decrease the loss to half.
Swedish, European and American recommendations all use the same method to calculate this loss, with some differences in the appearance. Eq. (2.1) is from Collins & Mitchell (1991)
, ,xa aKxF F epre b pre a (2.1)
where Fpre,b is the effective prestressing force at position b, xa meters away from position a, and a preferably is at the jack or where maximum stress can be expected. Fpre,a is the estimated maximum prestressing force along the tendon, is the coefficient of friction between the tendon and adjacent material, xa is the sum, in radians, of intentional changes of curvature along the length xa and K is a number that take unintentional curvatures into account. Examples of coefficients of friction are generally given in the codes. In Boverket (2004) K has the value 0.01/
To overcome frictional losses it is suggested to initially increase Fpre b with up to 10%.
Seating of Anchorage As the determined jacking load is reached the process of transferring the applied load from the jack to the anchorage begins. During this process the anchorage is seated, how much depends on the type of system, through two mechanisms. The larger one is the draw-in, or sliding, of the wedges into the barrel, but account is also taken for deformations of the anchorage. Seating is less pronounced in bar systems where no wedges are used.
This loss of prestress decreases further in along the tendon due to frictional forces inverse to those described in the section above and they can also be calculated in the same manner.
2.2.2 Losses in Concrete Shortening of the concrete member that is reinforced with the prestress also shortens the tendon, by doing so it also relieves the tendon from some of the applied stress. This

Mechanical Anchorage of Prestressed CFRP Tendons
10
is a natural result based on Hooke’s law and has to be accounted for in the design process. In a short term aspect the concrete is exposed to elastic shortening, later on shortening also occurs due to the long term effects of shrinkage and creep.
Elastic Shortening In a process where all tendons are post-tensioned simultaneously the effect of elastic shortening never becomes visible if the stress or strain is measured in the tendon. The elastic shortening of the concrete due to the successively applied compressive force is then compensated with a longer stroke in the jack. It is however more pronounced for pre-tensioning applications or applications where the jacking is performed tendon by tendon.
When the tendon used in a pre-tensioned member is tensioned this is normally done against a frame. If no account then is taken to the elastic shortening of the concrete an instantaneous prestress less than the designed is the result after the tendons release from the frame. The problem is easily solved by an increase in the initial stressing force based upon simple linear elastic calculations.
In a tendon by tendon post-tensioning procedure the first tensioned tendons will experience all the loss as the rest of the cables are tensioned and compressing the concrete further. This is compensated for by a calculation of the concrete’s total shortening after tension of all tendons followed by a calculation of the elongation that every cable should have in that phase to achieve the designing stress.
ShrinkageShrinkage is an inherent part of a concretes ageing and the long term losses are calculated based on the final estimated shrinkage strain of the concrete. Since the tendon experiences a shortening equal to the concrete’s shrinkage and if the tendon’s length is the same as the concrete member’s the loss simply is the tendons Young’s modulus times the estimated shrinkage strain of the concrete.
The estimated final shrinkage strain may, depending on the guideline chosen, vary between 0 and 600·10-6. High relative humidity in the surrounding environment and good concrete qualities result in the lower values, Boverket (2004) does for example give a value of 250·10-6 for outside environments without any consideration to the concrete’s strength class. This would with a Young’s modulus on the tendon of 190 GPa result in a prestressing loss of 47.5 MPa which has to be compensated for through an initial higher stress in the tendon above the design stress.
CreepConcrete experiences creep during long term loading, such as the applied prestress. The result of this creep is a shortening of the concrete member which successively gives a loss of prestress in the tendon. As the prestress decreases, so does the load that creates the creep and a level on the load should be used that is positioned in between

Prestressing Anchoring Systems
11
the load for the initial prestress and that for the prestress after creep. This is seldom done and Boverket (2004) and Svensk Byggtjänst (1990) describe the more nuanced calculation with inclusion of the estimated stress after creep while CEN (2004) uses the applied prestress after short term losses in their equations. The general equation for the calculation of creep losses appears as in Eq. (2.2)
spre pre
c
EE
(2.2)
where is the creep coefficient for the specific concrete and environmental conditions, Es and Ec is the Young’s modulus for the tendon and concrete respectively and pre is the tendon’s stress.
Different codes state different ways of achieving the creep number. It may vary from 0 to 7 depending on the relative humidity, the concrete’s age at application of the stress, size of the member and concrete class. Boverket (2004) gives the value of 2 for an outside environment with the stress applied after 28 days of hardening. That would if the steel’s and concrete’s Young’s moduli are 190 and 30 GPa respectively and result in a 12% loss of prestress, minus the amount removed from the applied stress.
2.2.3 Losses in Steel In the codes long term losses are gathered into one governing equation that in excess of the concrete’s shortening also take the relaxation of the steel into consideration. Those equations may make the calculation process faster but an understanding of the integral parts is nevertheless necessary to achieve the correct coefficient. In that sense the relaxation of the steel might be the easiest to grip, at least according to the Swedish codes.
RelaxationThis loss due to relaxation occurs when the tendon is withheld at a certain elongation for a longer time. In the simplest case a relaxation coefficient of 0.12 is multiplied with the stress level in the tendon after all initial losses and half of the long term losses. That only half of the long term losses should be accounted for is due to the slight shortening that the concrete contributes to over time which lowers the effective relaxation of the steel.
European standards, CEN (2004), use a more variable approach with relaxation coefficients that takes the type of tendon, its tensile strength and time under elongated conditions into consideration. The best source on this coefficient is however the manufacturer’s test certificates. In all cases a value that covers the intended life span of the structure must be chosen, which usually is around 50 or 100 years.
The importance of high quality steel due to the above described prestressing losses is exemplified in the next section.

Mechanical Anchorage of Prestressed CFRP Tendons
12
2.3 Steel Systems
2.3.1 General Several systems for anchorage of prestressing steel tendons have been developed after the breakthrough started by Freyssinet in 1936. At a meeting with the Institution of Structural Engineers T. J. Gueritte presented a translated paper originally written in French by Freyssinet, Freyssinet (1936). In the paper Freyssinet’s theories and discoveries concerning the use of high strength steel in prestressing applications were presented for the first time. Ordinary steel with its limited possibilities of elongation was not enough to overcome creep and shrinkage in the concrete and this is still the case. By applying the latest Eurocode 2, CEN (2004) the necessity of high strength tendons is exemplified in the following case, see Figure 2.1.
, ,, , 0.9 0.9y HS y NS
Pre HS Pre NSHS NS
f fF F
A A
HSA
NSA
,Pre NSF
HS
NS
,Pre HSF
,c tot
,0.75 Pre HSF
,0.2 Pre NSF
Figure 2.1 Loss of effective prestressing for high strength, HS, and normal strength, NS, steel tendons due to creep and shrinkage of concrete.

Prestressing Anchoring Systems
13
90% utilization of a tendons yield stress in the prestressing process is allowed; which for a high strength steel tendon with yield stress 1600 MPa and length, L, give an elongation of
0.9 0.9 1.60.00739
195y
HS
fL
E
In comparison an equally long normal strength reinforcement bar with yield stress 500 MPa can reach an elongation of
0.9 0.50.00214
210NS L
These two elongations should be compared to possible shrinkage and creep in the concrete, caused by drying and constant loading. Shrinkage, without the autogenous part, is calculated by
,0 0.95 0.00046 0.000437cd h cdk L L L
where a relative humidity of 40% (inside conditions) is assumed; together with cement class 40/50 and a 200·400 mm rectangular concrete cross section. Similarly the creep can be calculated by
0.6 401,5 0.45
1,5 0.45 480 3
0.6 40, 1.8 0.00133
35 10k c
ccc
t e L e L LE
with an
assumed application of prestress after 28 days and a stress in the concrete according to the limiting value of 60% of the concretes characteristic cylinder strength. Together the shrinkage and creep creates a total shortening of the part over time of
, 0.000437 0.00133 0.00177c tot cs cc L L L
This corresponds for the normal strength steel to a 80% loss of prestress while it for the high strength steel only gives a 25% loss. Considering this Freyssinet realized that utilization of high strength steel would become the revolution in prestressing of concrete. He also developed an anchor capable of handling the large stresses developed when the high strength steel is fully utilized which he mention in the original paper but did not describe in more detail.

Mechanical Anchorage of Prestressed CFRP Tendons
14
2.3.2 Systems for Anchorage of High Strength Steel Research on new anchorage systems for steel tendons has since the days of Freyssinet been successful and is today limited to development of existing systems and predominantly pushed forward by economical interests rather than scientific. Generally the requirements stated for an efficient anchoring system are already met concerning anchorage of steel tendons. They are today sufficiently small and satisfactorily easy to handle compared to the gain in strength they can create. The systems are often also industrialized and capable of handling several tendons at a time. Slippage between tendon and anchoring is no longer a problem and setting in the anchorage upon release of tendons has been minimized.
Prestressing Systems
Typically producers of a prestressing system supply the complete chain of products necessary to carry out a pre- or post- tensioning application. These systems are protected by patents and typically designers of prestressed structures choose one of the available systems for their specific project. Differences between one system and another are of little importance to the overall purpose, i.e. all systems are developed to handle general design issues with the same type of equipment, only differing in the details and shapes of each component. For further reading on the basic theories that prestressing is based upon and for insight into the complex behaviour of prestressed concrete an extensive range of literature is available. Nawy (2000) give a comprehensive and up-to-date review of prestressing theories and designs. He also includes easy-to-use schemes for computations of stress losses in pre- and post- tensioned beams as well as schemes for design of more complex structures. Also Collins & Mitchell (1991) and Lin & Burns (1982) have gathered knowledge and design principles together with examples of applications and a brief history of prestressing. The two latter references include descriptions of several prestressing systems marketed by four manufacturers. Due to proprietary of the systems these manufacturers are the same as the ones that can be found today with some exceptions. This lack of competition might have slowed development down but some advancement can anyway be seen between the systems used 25 years ago and today’s systems described later in this section. In Hurst (1998) focus is on design issues and principles used are based upon Eurocode 2 as the drafted version looked at that day, which to a great extent coincided with the final version of Eurocode. More recent design handbooks based on Eurocode are on their way but not yet published.
Prestressing Tendons
During the process of developing prestressing technology three types of high strength steel tendons have emerged, Collins & Mitchell (1991). They are made by one or several pieces of steel and are often coated by a protective duct or sheathing. In many cases a layer of grease is also applied between the coating and the tendon to create frictionless behaviour when concrete or grout is embedding the tendon.

Prestressing Anchoring Systems
15
Prestressing bars are essentially ordinary smooth or ribbed reinforcement bars with a higher strength in the steel. Failure strength of 1030 MPa is standard with bar diameters ranging from 20 to 40 mm according to Svensk Byggtjänst (1997). Bars provide simple and reliable means of anchorage but have limited abilities to handle complex tendon profiles with small radii. This type of tendons does therefore suit column applications well while its usage in beams is limited.
Prestressing wires consist of a smooth cold-drawn rolled wire with a high content of carbon. Properties for these steels are according to Svensk Byggtjänst (1997) a failure strength between 1670 and 2060 MPa and diameters ranging from 2.1 to 8.0 mm. The steel producer Voestalpine has in their assortment wires in the range of 3 - 11 mm with failure strengths from 1570 - 1860 MPa, Voestalpine (2007). Wires are used in special applications such as railway sleepers and other places were space is limited.
Prestressing strands represent the majority of the prestressing tendons produced in the world today. Several designs of these strands exist, the most common is the 7-wire strand where six wires are wrapped around one central. The steel producer Ovako, apart from the 7-wire strand also produces a 3-wire strand Ovako (2006). Voestalpine has a compacted wire in their assortment, Voestalpine (2007). This gives a better utilization of the total cross sectional area occupied together with larger contact surfaces against ducts in curved applications and anchorages. Producers offer a range from 6.9 to 15.7 mm with strengths from 1770 to 1960 MPa which is about the same as the Swedish design guidelines suggest. Strands are used in almost any prestressing application and are favourable both for their versatility and ease of use.
Both wires and strands can be put parallel inside the same duct to achieve higher total cross sectional area. They are then named multistrand or multiwire applications. Anchorages for such applications are available and it is an advantageous way to increase efficiency of the prestressing further.
Prestressing Options
Prestressing operations are traditionally divided into pre- and post- tensioned prestressing. In pretensioning systems concrete is cast around, and embedding, the already tensioned tendon while the tension in post-tensioning systems is applied with hardened concrete as counteracting member during the jacking procedure. These differences in force application do not necessarily give any major differences in the final result. A pretensioned tendon embedded by concrete has the same behaviour as a posttensioned tendon positioned in a duct and there grouted by injected grout. In both cases the force is transmitted along the entire length of the tendon. It is likewise also possible to construct both pre- and post- tensioned structures with unbonded tendons. The choice of method is therefore more a product of the building process and economical considerations rather than design issues. A role of thumb is however that pre-tension is applied to prefab elements such as hollow core slabs or shorter beams while post-tensioning is used in larger and more massive structures cast in place.

Mechanical Anchorage of Prestressed CFRP Tendons
16
A special case of post-tensioning that doesn’t conform to this is external prestressing. In many strengthening situations the only possibility is to position the tendons outside a construction anchored via abutments to the concrete, see Figure 2.2.
Figure 2.2 Example of what an external prestressing application may look like
Such applications give rise to some possibilities as well as drawbacks compared to internally positioned prestressing. A summary of advantages and disadvantages presented by Picard et al. (1995) is given here in Table 2.1. It is presented here not only to discuss benefits with external prestressing; by reflecting over the statements it is also possible to get a good overview of considerations that have to be done when dealing with prestress.
Table 2.1 Advantages and disadvantages with external prestressing
Advantages Disadvantages
Less internal reinforcement gives better compacting of the concrete. Dimensions of a member’s cross section can be reduced, resulting in less dead weight. Stresses in, and longitudinal profiles of external tendons are easier to check. Improved control of protection against corrosion and easier inspection is obtained. Replacement of a single damaged tendon is possible. Loss of stressing due to friction against the structure is reduced. Construction of concrete member and prestressing are more independent of each other.
Easy access to tendons makes them more vulnerable to sabotage and fire. Limited length of tendons due to possible vibrations. Deviators and anchorage zones introduce large concentrated shear forces into the cross section. External deviators give rise to high transverse stresses in the tendons. Loss of anchoring means loss of all prestress in a tendon in contrast to the case for a bonded tendon. Contribution to flexural strength in ULS is limited for unbonded tendons. Insufficient ductility in ULS demands other solutions to guarantee enough warning in the case of a failure. The actual eccentricities of external tendons are generally smaller compared to internal tendons.

Prestressing Anchoring Systems
17
From Table 2.1 it can be concluded that reliable anchorage is crucial for a successful strengthening with external prestressing. Limitations in the free tendon length do for example demand less setting of the anchorage to retain enough elongation and stressing of the tendon. It is also obvious that a failure of an anchorage immediately releases all the stress and removes all load bearing capacity of the anchored tendon. In that sense a bonded system is more favourable since large amounts of stress are still preserved through the interaction between grout and tendon. A failure in an unbonded tendon is always brittle and so the failure of the entire structure will become brittle if no precautions are taken. This in comparison to the case for bonded tendons is similar to the earlier reasoning concerning preservation of some stress in bonded tendons although the end anchorage is lost. A counterpart to the necessity of anchorages for preserving the stress is a pretensioning system where concrete is applied directly onto the tendon. All end anchorage is in that case removed after concrete hardening, leaving all the transfer to the concrete-tendon interaction.
The following sections of this review are devoted to these anchorages. What types are available, which are useful in which situation and how do they work?
2.3.3 Commercial Tensioning Systems This section gives a brief introduction to different types of systems and five of the suppliers of systems that are active on the market today, Freyssinet, VSL, Dywidag, BBR and CCL. Differences are in general small between their systems and they all aim for compact and reliable ones, possible to handle in most work site situations.
Bar Systems Bar systems comprise threaded high strength steel bars, anchorages, couplers, sheathings, jacks, injection pumps and more. Two of the better known bar systems are the systems from Freyssinet, Freyssinet Group (2008a), and from Dywidag, DSI (2006a & 2007).
Bars
Processing of the bars can be done in several ways and differs between the manufacturers. The main characteristic that also makes the type of system unique is however the same. That is the threading on the bars, Figure 2.3.
The Freyssibar system offers bars with a full length cold rolled thread while Dywidag’s Threadbar system is hot rolled. Dywidag also offers a system of smooth bars with a rolled threading only in the ends. These bars have to be individually produced in the right lengths while continuous threading allows for on site cutting. Maximum bar length available is 30 m, if it is necessary for longer tendons couplers are used to connect two bars, and the available bar diameters range from 26.5 to 65 mm.

Mechanical Anchorage of Prestressed CFRP Tendons
18
Figure 2.3 Upper left: End-threaded smooth bar; Lower left: Threadbar Dywidag; Right: Threading of a Freyssibar Freyssinet
Couplers, anchorages and more
In the case of two threaded bars the coupling procedure is particularly easy. A casing with a threaded interior is screwed on to the two bars. If the bars have different threading couplers are also available for that case, Figure 2.4.
Anchoring uses the same principle with an embedded threaded steel plate in the dead end and nuts transferring the force to a steel plate in the active end, Figure 2.5. For special cases hinged nuts, shims and inclined plates might be used, this is necessary since bars in general, and particularly with the large diameters involved, are difficult to adjust.
Figure 2.4 Couplers for bars with the same threading and bars with different threading Dywidag
Figure 2.5 Left: Ordinary nut anchorage for the Freyssibar system; Centre: Hinged nut anchorage; Right: Dead end anchorage. All including protective sheathing and protective caps for the bars as well as an air vent. Freyssinet
For stressing specific hydraulic jacks weighing between 25 and 230 kilos are used, also stressing of the smallest bar is consequently in need of some kind of lifting device. In the jack a threaded casing connects a shorter tie rod to the prestressing bar. On the tie rod a nut serves as counter-stay for the tensioning procedure while the nut on the bar

Prestressing Anchoring Systems
19
can be adjusted by an internal socket wrench to keep the elongation of the bar after the hydraulic force is released, see Figure 2.6.
Figure 2.6 Hydraulic jack for stressing of threaded bars
Protection of the steel parts is ensured by ducts in galvanized steel or plastic. This can be seen in Figure 2.5. For the nuts and anchorage plates sealed caps are available with different sizes depending on whether the bar shall be kept long enough to facilitate prestressing and destressing of the bars. At coupling positions wider ducts are used with allowance for motion of the coupling during tensioning. It is also possible to inject ducts with wax, grease or mortar for additional protection and frictionless or semi-bonded conditions.
Advantages with this type of system are the easy and reliable anchoring while disadvantages can be found in the lack of versatility and deformability as well as ultimate stress of the steel. Due to the low deformability no multi-bar systems are available, as the case is for strands.
Strand Systems This type of system is the most versatile for prestressing. A schematic depiction of the principles is shown in Figure 2.7. By the use of couplers long continuous sections of prestressing can be achieved. These sections are in each end closed by an anchorage, either an anchorage prepared for application of stress or a dead end anchorage. For different applications different types of anchorages are used. The strands may be anchored together in a multi-strand system as the case is in Figure 2.8, or anchored one by one in single-strand systems. These one-by-one applications are often used in pretensioning and where strict limitations in space are present. In some tight situations, such as plates or narrow webs, a flat type of anchorage head is also available from most suppliers.
Nut
Casing
Temporary nut

Mechanical Anchorage of Prestressed CFRP Tendons
20
Figure 2.7 Schematic depiction of a complete prestressing system. DSI
Figure 2.8 Strand configurations for the C-type anchorage. The Freyssinet Group
Furthermore the systems may be varied considering the degree of bonding throughout the tendons. A common solution for post-tensioning applications is ducts embedded in the concrete through which the tendons can be pulled or pushed. Afterwards the ducts can be left without fill but sealed at the ends for corrosion protection of the tendons or injected with grease, wax or grout. For this cause ventilation is provided at all high points in the systems while the fill usually is injected in the lower parts. Alternative solutions are direct embedment of the strands, as the case is in pretensioning applications, or one by one ducting. Ducts injected with grease or wax as well as tendons covered with grease and a plastic sheathing can in different degrees be considered as frictionless while embedded or grouted tendons are continuously bonded.
Strands
Strands are composed of several cold drawn high strength steel wires; the most common type is the 7-wire strand with six external stress released wires that can be seen in Figure 2.9. Some suppliers of prestressing systems also offer 3-wire systems with strand diameters ranging from 6.5 to 8.6 mm while the 7-wire strands range between 8.0 and 15.7 mm. Most anchorage systems are however suited for 13 or 15 mm strands, BBR (2006 & 2007), CCL (2008a & b), VSL (2008) and DSI (2006b).The strands have strengths between 1770 MPa and 1960 MPa and are delivered in coils with continuous strand lengths of up to 10000 m, (Voestalpine 2007 & Ovako 2006).

Prestressing Anchoring Systems
21
Figure 2.9 Left: Ends of 7-wire strands; Centre: Different sizes of 3 and 7-wire strands; Right: Coils of 7-wire strands
Figure 2.10 Left: Close up on greased 7-wire strand with HDPE sheathing; Right: Compacted 7-wire strand
For special applications custom-made strands can be produced. It is for example possible to find pre-greased strands with plastic sheathing, for unbonded applications, as well as compacted strands with a better utilization of the gross cross sectional area, see Figure 2.10. In applications sensitive to corrosion expensive but resistant galvanized strands are available.
Stressing Anchorages
Figure 2.11 Two types of wedge anchorages for pretensioning of high strength steel, CCL (2008b)
These anchorages are used in the accessible end of the tendons, where the stress is applied. Consequently the anchorage allows motion of the tendon in the tensile direction while it prevents motion in the opposite direction. Each system supplier has their own anchorages with minor differences in design between different suppliers; a couple of anchorage types do however exist. A simple one that also may be considered as the fundamental design behind more advanced steel anchorages is the single-strand

Mechanical Anchorage of Prestressed CFRP Tendons
22
pretensioning wedge type anchorage. Pictures on two variations of this anchorage are presented in Figure 2.11.
In the first type an anchorage consists of a casing with smooth interior as well as exterior together with three toothed wedges held together by a rubber ring. A cross section of the anchorage can be seen to the right in the figure. With such a system the wedges have to be kept inside the casing by the jack during stressing. To overcome this a second type is available with a spring and threaded cap included. This system allows the wedges to open up, but not more than is necessary for the tendon to move smoothly. Parts and cross section also for this anchorage can be seen in Figure 2.11.
Figure 2.12 Multi-strand type anchorage head, Freyssinet Group (2008b)
Posttensioning requires some additional features not included in the pretensioning anchorage to work properly. Two major concerns are the amount of strands that often have to be anchored and the corrosive environment that unprotected posttensioned tendons are exposed to. Typically solutions to these problems have the characteristics that can be seen in Figure 2.12. Force transfer is secured by an anchorage block, having the same purpose as the casing in the previous anchorage type. This block handles an impressive force which has to be spread into the concrete so that the concrete is prevented from bursting. Above the task of directing strands into the duct the guide has also been designated this task in the present anchorage. Other system manufacturers sometimes also use a spring of reinforcement embedded in the concrete around the guide and beginning of the duct to spread the forces BBR (2006 & 2007).
A special case of the multi-strand anchorage that is a natural part of most manufacturers’ assortments is the flat anchorage. It has the same features as the round anchorages but is more suitable for prestressing of slabs and webs, Figure 2.13.

Prestressing Anchoring Systems
23
Figure 2.13 Flat anchorages from Freyssinet Group (2008b); DSI (2006b) and VSL (2006)
Dead-End Anchorages
In the passive end, or dead end, the anchorages can be simpler since a locked anchorage should remain locked. In many cases the same anchorages are nevertheless used with an extra stop plate to prevent the wedges from falling out during casting and compacting of the concrete.
In Figure 2.14 three specific dead anchorages are shown from the VSL assortment. Other manufacturers keep these types as well and they are commonly used in various projects.
Figure 2.14 Loop, plate and bulb dead ends for anchoring of prestressing tendons, VSL (2006)
The loop anchorage lets tendons through and back to the entrance surface again by turning it 180°. It is in that sense not an anchorage, since the anchoring is secured by two stressing anchorages at the concrete surface. It does however transfer the stressing force from the passive end and is in that sense an anchorage.
Plate and bulb anchorages transfer the force through their embedment in the cast concrete, if these are to be used the tendons therefore have to be installed, but not stressed before concrete is applied. In order to resist slippage the plate anchorage is equipped with compression fittings that hold plates, bolted together, apart. For the bulb anchorage it is the large steel area exposed to concrete and the concrete filled basket construction that prevent the tendons from pulling out.
Couplers
Sometimes it is favourable, or even necessary to extend a prestressing tendon. This might be due to the building process or limited tendon lengths. Some possibilities are

Mechanical Anchorage of Prestressed CFRP Tendons
24
then available but the principles are basically the same between manufacturers. For multi-strand applications the system seen in Figure 2.15 is the most common, where the compression fittings in this example might be exchanged for wedges.
Several solutions for coupling of singular strands also exist other than using a pair of connected wedge anchorages or compression fittings.
Figure 2.15 Principle and picture of a multi-strand coupling, Freyssinet Group (2008b) & VSL (2006)
Ducts
It is not always necessary to include ducts into a prestressing system; it depends on the rest of the system. Their major purposes are to enable corrosion protection, tendon insertion after concrete casting and in some cases frictionless tendon behaviour. Both corrosion protection and frictionless behaviour are to some extent also possible to reach through individual sheathing, as in Figure 2.10, but if multi-strand systems are to be used the duct is a space saving alternative.
Figure 2.16 Steel and plastic ducts for corrosion protection of prestressing steel
The ducts are either produced by corrugated steel or plastics, see Figure 2.16, and can cover all dimensions of a prestressing system. Most anchorages are also designed to allow for connection to a duct. This can be seen in Figure 2.12, Figure 2.13 and Figure 2.14. In those figures it is also possible to see how different producers prepare their systems for injection of grease or grout, depending on whether a frictionless or bonded environment is sought. In addition to injection points the duct systems also need ventilation points in the high points for outflow of compressed air when the system is filled from below, see Figure 2.7.

Prestressing Anchoring Systems
25
Jacks and Stressing Procedure
Each system for prestressing also has its own system for jacking and appliance of force onto the tendons. Due to the minor differences in design between anchorages of different brands it is also impossible to mix anchorages and jacks from diverse brands. Nevertheless they all use the same principle irrespective of size and number of strands stressed at a time, see Figure 2.17.
Figure 2.17 Stressing procedure and six jack models, CCL (2008a & b) & Freyssinet Group (2008b)
In step 1 the wedges that will be left in the bearing plate after jacketing are assembled and the strand ends are inserted into a lock-off plate. This plate fits into the jack and prevents the bearing plate wedges from falling out during stressing as well as it helps pushing them back in again once the desired stress level is reached.
During steps 2 and 3 the jack is threaded onto the loose tendon ends and pushed against the anchorage before the interior pulling plate and the wedges used for the tensioning are assembled.
After those steps stressing can start. Once the desired stress is reached the lock-off plate is pushed forward to tighten the grip against the tendon and minimize destressing stress losses. Finally the piston is retracted to free the wedges used for tensioning and they can be disassembled.
Lock-off plate
Bearing plate wedges
Pulling plate
Tensioning wedges

Mechanical Anchorage of Prestressed CFRP Tendons
26
Pushers, Pullers, Pumps and Grouting Machinery
Figure 2.18 Pushing and pulling systems for insertion of prestressing strands, DSI (2006b)
Some additional accessories to a prestressing system are machinery for insertion, as in Figure 2.18, pumps and mixers for grout and grease, ultrasonic cleaners to prolong the lives of toothed wedges.
All together the prestressing systems of today for stressing of high strength steel can be said to be highly developed with considerations taken to many troublesome factors. This section about the systems has given a brief insight and it describes some of the fundamental functions that have to be considered also while working with prestressing using other materials.
2.4 CFRP as Prestressing Material Today’s manufacturers of prestressing steel wires and strands keep an assortment with ultimate strengths ranging from 1770 to 1860 MPa and a Young’s modulus of 195 GPa, Ovako (2006). These mechanical properties can to a large extent be attained also by the use of FRPs which therefore would serve as excellent substitutes for the corrosion sensitive and heavy high strength steel tendons. Sayed-Ahmed & Shrive (1998) present a comprehensive table with mechanical as well as thermal properties for several brands and types of FRPs. A summary of that, also including CFRP-values from a Swedish distributor, STO (2005), is presented in Table 2.2.
It can from Table 2.2 be concluded that in comparison to glass fibre laminates, aramid and carbon fibre composites have properties that are closer to those of PS (prestressing)-steels, which is usually used to prestress concrete. Both of them include the longitudinal tensile strength of PS-steel in their ranges but only CFRP can match the modulus of elasticity. This lower strength to modulus ratio is advantageous compared to the ratios for GFRP and AFRP, which may give rise to extensive elongations during prestressing. Such elongations are not always possible to handle due to limited space for anchorage or capacities of machinery. Normal strength steel contradicts this reasoning; with its even higher ratio it should be optimal concerning production, but as the example showed in section 2.3.1 some elongation of the tendon is necessary to overcome creep

Prestressing Anchoring Systems
27
and shrinkage. Concerning GFRP Schupack (2001) also mention the lack of compatibility between ordinary Portland cement and GFRP reinforcement due to the low elastic modulus of GFRP. Furthermore as along with other such as Dolan (1993) and Miyano et al. (2005) he stresses the question of GFRP’s fatigue resistance and its durability problems. Efforts are put into solving fibre degradation by encapsulation and alkali-resistant glass; this could make the material somewhat more competitive but it does not overcome the poor fatigue behaviour. Miyanos flexural fatigue tests show residual strengths of GFRP below half of the strengths of CFRP for the same temperatures and number of load cycles. CFRP has because of these favourable properties been the choice of tendon material in many of the latest applications of external prestressing with FRPs while AFRP is close behind and GFRP still struggles to overcome questions about its long term performance, in particular related to stress corrosion.
Table 2.2 Summary of FRPs mechanical properties compared to prestressing steels according to Sayed-Ahmed & Shrive (1998) and STO (2005)
Carbon-FRP (CFRP) Glass-FRP
(GFRP)
Aramid-FRP
(AFRP) Sayed-Ahmed STO PS-steel
Long. tensile strength [GPa]
1.08 - 1.28 1.2 - 2.1 1.8 - 2.55 2.0 - 3.1 1.86
Transverse tensile strength [MPa]
39 - 49 ~30 ~57 - 1860
Long. modulus [GPa]
39 - 43 54 - 120 142 - 150 155 - 260 190
Transverse modulus [GPa]
8.6 - 8.9 ~5.5 ~10.3 - 190
In-plane shear modulus [GPa]
3.8 - 4.5 ~2.2 ~7.2 - 73.1
Major Poisson’s ratio [-]
0.27 - 0.28 0.35 - 0.6 ~0.27 - 0.3
Minor Poisson’s ratio [-]
~0.06 ~0.02 ~0.02 - 0.3
Maximum long. strain [%]
2.8 - 2.9 1.5 - 3.7 1.3 - 1.57 0.8 - 1.6 4.0 (yield 0.2)
Transverse comp. strength [MPa]
128 - 158 ~158 ~228 - 1860
2.5 Systems for Anchorage of CFRP CFRP, as well as all composites included in the abbreviation FRPs, does despite of its advantageous similarities to high strength steel and good long term behaviour have some drawbacks. No plastic region or yield point can be found on the stress-strain curve, often leading to limited ductility in the prestressing system. This problem can be solved relatively easily through clever design or lower utilization of the composites

Mechanical Anchorage of Prestressed CFRP Tendons
28
capacity. Compared to steel CFRPs might initially also be expensive, but seen over the entire lifetime, with no corrosion problems and limited maintenance, a life cycle analysis would give another picture Meier (1996). The one major cause of its relatively slow development into the preferred prestressing material is however its poor behaviour in other loading directions than tensile loading parallel to fibres. Due to this, ordinary methods of high strength steel anchorages, similar to the systems seen in Figure 2.11, are not possible to use. Low compressive and flexural strengths also affect FRPs possibilities to work in a continuous system over several spans as well as it limits minimum bending radius of the tendon for eccentricity optimization.
2.5.1 Orthotropic Effects on FRP’s Mechanical Properties Literature exists on how to calculate transverse mechanical properties for unidirectional orthotropic materials but verification of the models compatibility with civil engineering CFRPs is limited. Zenkert (1995) gives a brief and simple derivation of longitudinal and transverse E-modulus together with shear modulus and Poisson’s ratio for longitudinal/transverse direction
1,
1,
f m
f m
f m
f m
L f f m m T v v
E E
LT f f m m LT v v
G G
E E v E v E
v v G 2.3
where subscripts f and m denote fibre and matrix respectively and v is the volume fraction. By using Eq. 2.3 an upper limit value of EL is received while the value for ET
is the lower limit value. Now, assuming a fibre content of 60% and the Young’s modulus of the matrix being only 2% of the fibres modulus, 10/500 GPa, the longitudinal modulus of the composite reaches 60.8% of the fibres modulus. This should be compared with the transverse composite modulus reaching only 4.8% of the fibres modulus. In these numbers an assumption of isotropic properties for both fibres and matrix is included.
For refined calculations, taking also possible orthotropy in the constituents into account, equations in Tsai & Hahn (1980) or Rosen & Hashin (1987) can be used. These are far more cumbersome and require further knowledge about the properties of each constituent, thus making them improper for simple composite property calculations. As previously mentioned the verification of the analytical models is also a limiting factor. Producers of unidirectional CFRPs aimed for use in civil engineering applications are focused on longitudinal strength and Young’s modulus. Values of mechanical properties in other directions and for each material are because of this harder to get; which makes analytical and numerical modelling less representative.
Table 2.3 does however show a simple graphical analysis of the major principle behind some of the most interesting mechanical properties.

Prestressing Anchoring Systems
29
Table 2.3 Composite mechanical properties in relation to each constituent’s properties
(Fibres)
EL GTL TL
(Matrix)
ET1 GTT TT
(Matrix)
ET2 GLT LT
Adopting the same notation as in Eq. 2.3 Table 2.3 shows how the composite Young’s modulus in the longitudinal, L, direction is dominated by the fibre’s modulus while it in any of the transverse, T, directions is governed by the matrix’ modulus. For the shear modulus, properties of the matrix are more important, GTT and GLT, except for the cases when shear is applied in any of the transverse directions and on a face cutting the fibres, GTL. Poisson’s ratio is equally more dependent on the matrix in all cases but two, those are when force is applied transversely and deformation is looked upon in longitudinal direction, TL.
In addition to the poor transverse properties for uni-directional composites carbon fibre composites are generally of a brittle nature with limited elongation to failure. This means that an external force, either pinching into the matrix or bending the composite easily can cut and break the fibres that are necessary to preserve the longitudinal strength. Examples of such forces are the ones resulting from the anchorages used in prestressing operations. Overcoming this obstacle is one of the major challenges facing the industrialisation of CFRP-based post-tensioning systems, and the necessity is stressed by several researchers. It is also brought to attention by Harries et al. (2003) and the American Concrete Institute in ACI (2004).
2.5.2 Expectations Confronting FRP Anchoring Systems At this point it is reasonable to divide use of FRP tendons and applications into the options mentioned in Section 2.3.2 - “Prestressing options”. Completely different conditions apply for anchorages involved in pretensioning operations compared to the

Mechanical Anchorage of Prestressed CFRP Tendons
30
anchorages necessary for post-tensioning, unbonded post-tensioning or external prestressing. While pretensioning most often is conducted under controlled conditions in an environment built for that purpose the other options require an adaptation of the stressing process to the conditions available on site. Large and complicated anchorages are therefore not a desired alternative in post-tensioning or external applications even though due to the large forces handled it is sometimes necessary. This implies that the largest challenges lie in the development of these post-tensioning anchorages. As an anchorage gets smaller in size the effective force transferring area between anchorage and tendon decreases. Requirements of force per area transfer capability on the chemical bonds or mechanical friction is therefore less on anchorages used in pre-tensioning and they do not have to be optimized in that sense. Also the need for less complicated anchorages in field operations makes that challenge greater. In a pre-cast shop it is easier to handle anchorages with more complexity even if it in the process of anchorage of steel tendons seldom is necessary.
Another important factor is the amount of force each anchorage has to handle. In bonded applications, such as pretensioning or post-tensioning with continuous bonding to the concrete the force in each anchorage is less than in an unbonded situation. Once a jack stress of 50-65% is reached, anchorages in the mentioned cases, are relieved and the remaining percentagess are left for the continuous bond to handle as the structure is exposed to live loads, ACI (2004). This limit stress is about 25% lower than the jacking stresses allowed in high strength steel due to larger standard deviations for ultimate strength and the lack of yield behaviour. The Swedish code, Boverket (2004), applies the same concept where complete interaction between the tendon and grout is assumed; thus allowing for plane cross sections to be assumed plane during the loading process. If no bonding is applied the anchorages have to be able to handle 100% of the ultimate tensile strength of the tendon; thus leading to rupture of the tendon outside the anchorage zone.
Altogether challenges are the largest for unbonded post-tensioned field applications and perhaps more precisely for external post-tensioning applications where the aesthetic factors also have an important role to play. Focus should with that in mind be on developing a small, simple, strong, durable and aesthetic anchorage suitable for industrialised prestressing of FRPs.
Guidelines for Acceptance Testing of New Unbonded Tendon Systems It may be easy to say that a system should be robust enough, but what does the robustness refer to? During start-up of research on FRP:s in civil engineering applications a working group from the FIP Commission 2 started to work on guidelines for these questions and the results are summarized in Rostásy & Budelmann (1993) and Rostásy (1998). From the former reference the following general recommendations can be retrieved:

Prestressing Anchoring Systems
31
The axial tensile strength, ft, of the FRP elements should not be significantly reduced by anchorage effects. The long-term static stresses (e.g. prestress) and the dynamic stress amplitudes of the service load state should not reduce the original tensile strength, fct, of the FRP. Adequate creep rupture strength and dynamic strength must be ensured. Environmental effects must not significantly reduce the strength of the FRP during service life.
By development of test methods ensuring that these recommendations are fulfilled for a new tendon-anchorage assembly it should be possible to have FRP systems as reliable as prestressing steel systems. In conformity with this relation of FRP performance to the well known performance of steel and to some extent make the economical efficiency comparable between materials test procedures have been adopted from guidelines for steel. In Rostásy (1998) Rostásy reports how the FIP Commission 2 has been influenced by FIP recommendations for acceptance testing and quality assurance of steel, FIP (1993). He also briefly walks through some of the more essential tests proposed, which also are presented below.
FIP Tests
In a first phase essential material properties should be investigated. Larger concern has, in the case of FRPs, to be taken to the standard deviation of the properties and the lack of standards. For calculations of mean tensile strength, fctm, mean Young’s modulus, Ecm,and mean failure strain, cm, at least 15 tests with proven anchorages should be performed and evaluated. That is if no values are supplied from the producer or if any uncertainties concerning them exist. It is also necessary to know fatigue and stress-rupture strength to be able to evaluate tendon-anchorage assembly in relation to just a tendon. Further these values are necessary to deduce partial safety factors.
The next step is a short-term tensile test where the assembly is evaluated for the anchorage efficiency factor
whereTtuA ctm cm ctm
ctm
meas Fcal F A f
cal F 2.4
In this test a long tendon of at least 3m shall be anchored with one of the anchorages in question in each end and incrementally loaded until failure. When loading has reached 70% of the calculated failure load it should be kept constant for 1 hour before the final loading up to measured ultimate force is reached, Figure 2.19 (left). For steel the requirements are A 0.95 and u 0.02, but no recommendations are made for FRPs, besides that it should be high. By executing this test satisfaction of point one in the general recommendations can be secured.

Mechanical Anchorage of Prestressed CFRP Tendons
32
Figure 2.19 Left: Loading history and design of short-term tensile test; Right: Results from a successful set of stress-rupture test, Rostásy (1998)
Stress-rupture tests are performed on identical samples as the short-term tests. Each sample is loaded until the desired load level and then held constant until failure of the system is achieved. No recommendations for number of load levels or number of tests on each load level are stated but it should be possible to estimate and extrapolate a mean stress-rupture line for the assembly, FTtm(t); i.e. at least a time range of 3000 hours should be covered. This should be compared to the corresponding mean stress-rupture line for the tendon, Fctm(t), and not fall too low below it, Figure 2.19 (right).
The same sample configuration as for the previous tests is also used in the fatigue tests.During these tests an upper limit of the force range should correspond to 110% of the allowable prestressing force and the range correspond to realistic in-situ conditions. Prestressing force and load ranges should be based upon fatigue tests of tendons and design calculations respectively. By a combination of the fatigue test and stress-rupture test also satisfaction of point three in the general recommendations can be secured.
For the tendon anchorage assemblies that still have not failed after fatigue or stress-rupture tests a residual strength test remains. The procedure is the same as in the short-term test and it is naturally desired that the remaining strength remains high. Through this point two is investigated and only point four in the general recommendations remains without adequate tests.
PTI Tests
Some researchers, predominantly from North America, have as an extension to Rostásy’s work also involved the American recommendations for acceptance testing of steel post-tensioning systems, for example Sayed-Ahmed & Shrive (1998), Reda Taha & Shrive (2003 a and b), Shaheen & Shrive (2006) and Elrefai et al. (2007). In PTI (2006) as well as in the previous editions referred to in some literature, PTI (1985) and PTI (1997), some further recommendations for fatigue testing are suggested.
Three phases are recommended. In the first phase 500,000 cycles with five cycles per second shall be performed within a stress range between 60 and 66% of the specified

Prestressing Anchoring Systems
33
tendon strength. Then the same sample shall withstand 50 cycles with one cycle per second in the stress range 50-80% before a final static tensile test reveals the remaining residual capacity of the tendon in a third phase. For the tendon to pass the test the residual capacity of the tendon shall be at least 95% of the initially specified tendon strength.
2.5.3 Unbonded System Designs Several conceptual anchorages are already produced in attempts of finding a good solution and they can be divided into a number of categories. Different writers use different classifications, here clamped, swaged, spike, potted sleeve, wedge and combined anchorages are used.
Typical Failure Modes to Consider Four major classes of failure exist in the evaluation of a tendon anchorage assembly’s efficiency and reliability. The classes are described in Figure 2.20 and the paragraphs below.
Rupture of Tendon, (a)
It is desirable for a failure where the full capacity of the tendon is reached before the system ultimately fails. Based on that definition it is concluded that such a failure can only occur through failure of the tendon, also called tendon, rod, strip or laminate rupture.
(a) (b)
(c)(d)
Figure 2.20 The four typical classes of failure of an anchorage

Mechanical Anchorage of Prestressed CFRP Tendons
34
Premature Rupture of Tendon, (b)
If an anchorage has any limitations in the design it may cause stress concentrations in the tendon-anchorage interface and thus give raise to the second failure mode, premature rupture of the tendon. Differences in the modes are the failure load and longitudinal position of the rupture. As long as the rupture occurs 2-3 tendon diameters outside of the anchorage mode number one has been the governing. If it occurs inside the anchorage or within the stated distance from the loaded end the size of the failure load is the only clue to which failure mode is governing. A lower tensile load than the ultimate strength stated by manufactures indicates premature failure and insufficient anchorage design.
Slip, (c)
Separation of tendon from any part of the anchorage is a third failure mode. This might happen due to low friction in wedge anchorages, insufficient bonding between tendon and epoxy or epoxy and sleeve in sleeve anchorages. These are just a few examples since slipping or pull-out failures are the more common ones when anchorage lengths become too short.
Failure of Anchorage, (d)
Least common is the fourth mode. It collects all the types of failures that can occur to the anchorage. Fracture of concrete barrel or shear failure of too weak bolts are two types of this failure mode. Generally most anchorages found in literature for the anchorage of FRPs are designed with an inherent capacity widely exceeding the capacity to keep the tendon in place.
For the test of the tendon-anchorage system’s ultimate capacity a tendon rupture is the most favourable since it utilizes the full capacity. In an in-situ application it might however be favourable to design for a pull-out or anchorage failure since it might give a more ductile behaviour. Tendon rupture is extremely brittle and several reports exist on how personnel working with tests have been injured by failing rods and strips. It gives no forewarning and such failures may be catastrophic in structures without protection against structural collapse.
Clamped Anchorages Clamped anchorages are a simple type of anchorage that might be effective in some occasions for dead-end anchorage or in laboratory work where a reliable system is crucial. Generally two steel plates with longitudinal grooves are bolted together around the tendon with four or six bolts. By making them long enough, applying the right torque to the bolts and roughening the groove surface enough shear can be transferred to avoid slip and allow for tendon rupture. To further avoid risk of stress concentrations a soft metal sleeve can be used between the plates and the tendon. Al-Mayah et al. (2001b and 2005b) has used two sizes of this anchorage in his laboratory tests. In pull out tests to investigate frictional behaviour an anchorage with dimensions

Prestressing Anchoring Systems
35
75·75·25 mm is used together with four bolts. For the tests executed to test anchorage efficiency longer, 152 mm, clamp plates with six bolts are used. In both cases a soft aluminium sleeve is also applied to increase force transfer. For the longer anchorage the bolts are tightened with 135 Nm in the loaded end and 95 Nm in the other. Braimah (2006) use the smaller type as well, but as second anchorage in the jacking process. In all cases the reliability is unquestionable while tightening of bolts requires space and is a time consuming task.
Figure 2.21 Extension of fibres in an anchorage with the length, , Jing et al. (2007)
A different type of clamping anchorage has been developed by Jing et al. (2007). By the anchorage of the FRP with wave shaped anchorages an extension of the fibres is attained, Figure 2.21, this tensioning works as prestress at the same time as the FRP is firmly kept in place. The two big advantages are the possibility to adjust the level of prestress along the beam, Figure 2.22, and that no jack is necessary. Unfortunately also some serious drawbacks can be seen with the system. Perhaps the largest is the difficulty to tighten the clamps without breakage of the fibres as long as non-aramid fibres without any matrix are used.
A B C D E
lAE
F1 F1 F1 F1F1F1
lBD
F1 F1 F1 F1
F1+ F2 F1+ F2 F1+ F2 F1+ F2
2 f fBD
F E Al1
2f f
AEF E A
l
Figure 2.22 Working principle of prestressing FRP with several WSGG anchorages, after Jing et al. (2007)

Mechanical Anchorage of Prestressed CFRP Tendons
36
Swaged (Die-cast or Die-moulded) Anchorages By applying pressure onto a metallic sheeting during production of the tendons the anchorage can be ensured by wedge anchorages similar to those available for pre-stressing steel. This type of force transfer can to a high degree be compared to the one used in systems named wedge anchorage systems with an internal sleeve. In both cases the soft metal closest to the tendon has the function of smoothing forces applied by the wedges. In a system where they are applied to the tendon beforehand one great disadvantage exists, they have to be pre-cut already during the manufacturing process. Metallic parts are also incorporated which may harm the durability of the system if not properly protected. Pincheira & Woyak (2001) report successful tests on this type of anchorage, also saying that the swaging can be done on site with portable machinery. In the specific case they used 1.2 mm thick stainless steel tubes. During swaging the outer diameter of the tube decreased from 9.5 to 8.6 mm and two lengths of swaging were used, 63.5 and 89 mm. For gripping one 40 mm long ordinary wedge system for steel tendons was compared to a 70 mm long custom-made system. By using the ordinary system failure occurred either by rod pullout or sleeve yielding while all rods failed through rupture in the custom-made cases. Further a comparison was made to resin-filled sleeve anchorages gripped by the same type of wedges. They all failed by pullout of the rod.
In Matta et al. (2007) a new type of swaged stainless steel anchorage/couplers is developed, see Figure 2.23. All force there is transferred through the friction and interlocking produced by the swaging process. In the end of the swaged part a thread adapter is positioned so that a threaded bar can be attached and transfer prestressing from the turnbuckle used for stressing. No lengths of the anchorages or specified strengths of the tendons are reported, but during static tensile testing they all experienced rupture of the rods. Although the system might seem promising it must be stressed that it possesses several severe drawbacks. Large portions that will be hard to protect are made of steel, the tendons have to be pre-cut and too many pieces are involved.
Figure 2.23 Anchorage assembly, Matta et al. (2007)

Prestressing Anchoring Systems
37
Spike Anchorages These anchorages feature a steel barrel with a conical shaped interior and a central softer spike, plug or cone. This spike is pushed into the barrel from the unloaded end and by that it anchorages the tendon with friction between itself and the barrel, see Figure 2.24. Burgoyne (1990) tested a system of multi-strand tendons where the intact aramid tendons are distributed evenly around the spike. Results show that this system performed reasonably well under static conditions but no effort has been put into further development. Focus has instead moved into using the system on single-strand tendons. There a tendon of Kevlar 49 aramid fibres without binding between the fibres is spread evenly around the cone-spike interface. Nanni et al. (1998 a and b) report reasonably good results from tests made on these anchorages. Failure occurred 10% below the tensile strength specified by the supplier and was initiated by slip inside the anchorage. After three days of short-term sustained loading at 65% of specified tensile strength the prestress had decreased with 10%. Some damage could also be seen on the fibres, probably due to slip in the anchorage.
Notes from the tests also mention the time-consuming installation where plastic sheetings have to be removed and the fibres combed. Accurate spreading of the fibres is necessary for good friction and less slip. Once the anchorage is installed it is therefore difficult to release it and prestress the system. These systems also suffer from disadvantages of the necessity of pre-cut tendons and metallic anchorages.
Figure 2.24 Assembly and presetting of spike anchorage, Nanni (1996b)
Sleeve Anchorages No other types of anchorages have been as thoroughly investigated as this one. They may be difficult to manufacture and handle. Curing of the sleeve material is often time consuming and the probability is great that the application will not be executed correctly. Still it is the most widely-used system. In addition, these types of systems generally need a long anchorage length and experience poor creep-rupture behaviour

Mechanical Anchorage of Prestressed CFRP Tendons
38
due to the often low stiffness bonding material. Some of the problems are possible to handle through a proper choice of bonding agent, but not all.
Construction of a sleeve anchorage is initially very simple. A metallic or concrete sleeve is filled with some kind of binding mixture. This might for example be epoxy or grout. Force transfer is generally ensured through bonding and interlocking between rod and fill and between fill and sleeve. To compensate for bad bonding between fill and sleeve the interior can be threaded.
Ground anchorages do preferably rely on this anchorage type. In these systems longer anchorage lengths can be allowed, and with that comes the possibility to anchorage several tendons at a time. Investigations on such anchorages with lengths between 250 and 7500 mm have been conducted with satisfactory results by Benmokrane et al. (1997) and Zhang et al. (2001). As long as this type of bond is used strain measurements on the tendons inside the anchorage are possible. From Zhang & Benmokrane (2004) it can be seen that the majority of the stresses are transferred in the loaded end of the anchorage and that the distribution is unevenly spread along the anchorage. By better grip in the unloaded end it should be possible to handle larger forces before pull out occurs. Even though it shows good behaviour in these tests, this type of anchorage is not possible to use in prestressing of buildings or bridges due to its size and curing time.
In 1996 Nanni et al. (1996 a and b) investigated some of the then available commercial anchorage systems concerning ultimate tensile capacity and capacity during short-term sustained loading. Grout was used to anchorage the Technora tendon in a 500 mm long sleeve while the CFCC tendon used high performance epoxy and a 165 mm long sleeve. Both were cut and equipped with anchorages before arrival and both were then further anchored to the machinery by nuts via threads on the sleeves outer surface. This nut connection can then be treated in the same way as the steel bar systems in Figure 2.4 and Figure 2.5. Ultimate tensile strength according to the manufacturer was reached in all four tests but the 500 mm grouted anchorages failed due to pull-out and the 165 mm epoxied anchorages failed because of stress concentrations close to the anchorage. For the sustained loading both types performed well with a 2% loss in stress for the epoxied anchorage and a 10% loss for the grouted over a 3 day time range. From this it should be possible to conclude that for sleeve anchorages epoxy works far better than grout concerning the bond.
Lees et al. (1995) has used expansive cement to couple AFRP tendons. This worked well and with strain measurements on the outer high strength steel tube estimations of an internal radial pressure could be made. After 72 hours the pressure reached 30 MPa. With this feature force can be transferred also by friction and thereby increase the pull-out resistance of the anchorage. In the test AFRP tendons with diameters 3.7 and 4 mm were used. The ultimate strength for these tendons was 1430 and 1810 MPa respectively and the resulting maximum loading force should therefore only be 15 or 23 kN respectively. Based on these small forces it must be stressed that it is not a

Prestressing Anchoring Systems
39
surprise that failure occurred in the tendons away from the anchorage. Bonding lengths of the tendons were 150-200 mm which gives a low kN/mm transfer ratio.
In accordance with the work of Nanni, results from Koller et al. (2007) conclude that epoxy works far better than grout in the sleeve anchorage. Using the same 153 mm sleeve, rupture of high strength CFRP could be achieved with epoxy while expansive grout resulted in pull-out failure. GFRP bars with one third of the strength of the CFRP were however not any problem to anchorage.
For comparison to the swaged anchorages Pincheira & Woyak (2001) also performed tests on epoxy filled sleeve anchorages with lengths between 152 mm and 381 mm. All tendons had a nominal diameter of 6 mm and a specified strength of 1470 MPa. Only two of the tendons with the longest bond lengths failed in rupture, and only one of them reached 1470 MPa. The remaining tendons failed in three cases by pull-out in the rod-epoxy interface and in one case in the epoxy sleeve interface. Compared to behaviour of the same type of tendons in the swaged system these results must be considered as poor.
Several separate sources report major difficulties with the assembly of the sleeve anchorage with the tendon. The first step is to align tendon and sleeve so that no bending occurs during loading and so that the epoxy/grout has the same thickness along the bonded length. The next problem faced is the time aspect; where several resins or grouts need a considerable time before they reach enough strength to be prestressed.
Figure 2.25 Steel sleeves held by hydraulic grips after pull-out of CFRP rod, Koller et al. (2007)
Wedge Anchorages Steel tendon systems rely to a great extent on this type of system. It has been developed over several decades and is still the unquestionable choice because of its versatility,

Mechanical Anchorage of Prestressed CFRP Tendons
40
reliability and user friendliness. For the steel systems several details in addition to the single strand anchorages are developed, as can be seen in section 2.3.3. Many of these are requested also for FRP tendon systems if they are about to challenge the steel systems. Two of the more important ones are the multi-strand anchorages and couplers. Through their use the prestressing process can be more time effective and less space demanding. Wedges in these anchorages are between 25 and 50 mm long, Freyssinet Group (2008b) and CCL (2008b). This short grip can be achieved through toothed insides which can not be allowed in the anchorage of FRP tendons. FRP tendon anchorages are therefore at this date only reliable if they have a length between 70 and 100 mm. If those numbers could be decreased with about one third it would be possible to use them in larger systems. FRPs however do not have the same mechanical properties as steel and therefore other parts of anchorages also need to be revised even if the particular wedge grip is functional. Furthermore, metallic anchorages are not optimal since one of the advantages of FRP tendons is the resistance to corrosion. With steel anchorages some protection is still necessary.
Al-Mayah’s Work
For optimization of the wedge anchorages several aspects have been investigated, perhaps most thoroughly by a Canadian research team driven by the research assistant professor Adil Al-Mayah. In 2001 the team presented their first results in Al-Mayah et al. (2001a and b). Then the anchorages consisted of an 80 mm steel barrel, four steel wedges and a drawn aluminium (elastic modulus 68.9 GPa) or copper sleeve. Spirally indented, 7.9 mm, CFRP Leadline tendons with a 104 kN breaking load were tested. Developments and improvements compared to previous anchorages are the soft sleeves (0.64 mm thick) and a difference between the interior angle of the barrel and the exterior angle of the wedges, Figure 2.26 (left). In this way the authors aimed to first grip the tendon in the free and with the soft sleeve digging into small irregularities in the tendon surface get a better grip. The same anchorages were tested with success by Sayed-Ahmed & Shrive (1998) according to the PTI recommendations described in section 2.5.2. Al-Mayah’s work continues from those tests and further investigates some different parameters. As Figure 2.26 (right) shows it is preferable to exert some presetting force before prestressing begins. As a recommendation the authors mention a presetting force between 60 and 80% of the tendons ultimate strength.

Prestressing Anchoring Systems
41
Figure 2.26 Left: Details of anchorage with different wedge and barrel angles; Upper right: Details of test setup; Lower right: Effect of presetting on rod displacement for tests with aluminium sleeves; Al-Mayah et al. (2001b)
Further the effect of sleeve material and reuse of steel parts were tested. Copper sleeves behaved poorly when a low presetting load was applied compared to the ones of aluminium. For high presetting loads they gave similar slip. No need for exchange of steel parts between applications could be seen when reused and new anchorages were compared. The sleeve did however deform heavily and is necessary to exchange each time before the anchorage is to be used.
Pilot FEM studies and one experimental test of the influence of the barrel thickness on anchorage behaviour are presented in Al-Mayah et al. (2005a). In this test FE-analyses show that a reduced thickness of the barrel in the loaded end gives significant decrease in contact pressure in that region. No difference in angle between barrel and wedges was used and the one experimental anchorage used threaded wedges causing premature failure of the tendons. Due to this lack of experimental verification it is dangerous to take the FEM results as a fact.

Mechanical Anchorage of Prestressed CFRP Tendons
42
Figure 2.27 Left: Test setup for tests investigating different slip parameters; Right: Drawing of clamping plates and short sleeve; Al-Mayah et al. (2008)
In Al-Mayah et al. (2005b) the sleeve is modified through sandblasting of the interior surface and annealing of both copper and aluminium sleeves, resulting in a softer metal (also reported about in Al-Mayah et al. (2006c)). Here rods are pulled through a short sleeve, designed to allow for tendon slip, Figure 2.27, displacements are therefore larger than allowable in an ordinary anchorage.
Figure 2.28 Left: Effect of clamping force and sandblasting on slip behaviour of CFRP rod in contact with an annealed copper sleeve; Right: Variation of pullout stress with clamping force and material hardness; Al-Mayah et al. (2005b)
This leads to a better understanding of the factors influencing the slip behaviour. In Figure 2.28 (left) typical slip behaviour can be seen for annealed copper sleeves with and without sandblasting and with 50 and 200 MPa clamping force on the sleeve. For the 50 MPa clamping force slip occurred already at a pulling force of 4 kN and continued without the distinct force increase that the two samples with 200 MPa clamping force displayed. Also the fluctuation is a typical feature in sliding of FRPs resulting from building up of wear debris, and the release of it, Schön (2004a and b). Post-test inspections clearly visualise this, see Figure 2.29 (upper).
The increase in pulling force occurred earlier when a sandblasted sleeve was used, Figure 2.28 (left). This is due to a rougher surface and larger wear that creates debris enough to finally stop the sliding, Figure 2.30. Effect of sandblasting was particularly visible as the clamping force increased. A softer annealed metal compared to the ordinary metal, Figure 2.28 (right), as well as aluminium compared to copper resulted in increased pullout force. The latter is in accordance with results from previous tests.

Prestressing Anchoring Systems
43
Figure 2.29 Upper: Remains of copper and debris on rods after pullout; Lower: Principle behind sleeve deformation for indented and smooth rods, Al-Mayah et al. (2008)
Smooth rods are investigated in comparison to spirally indented in Al-Mayah et al. (2008). As Figure 2.29 (lower) shows the contact surface between the smooth rod and the sleeve is larger than the surface between an indented rod and the sleeve. Clamping force can thereby be transformed to pullout-resisting shear force through friction over a larger area; thus allowing for less slip. Also effects of rod strength on the slip behaviour were sought for but these tests showed no consistent results. More important were soft sleeves and smooth rods.

Mechanical Anchorage of Prestressed CFRP Tendons
44
Figure 2.30 Principle behind debris build-up, Al-Mayah et al. (2005b)
Al-Mayah’s team has based on the above mentioned research results constructed a new anchorage, Al-Mayah et al. (2006a and 2007). This anchorage has a longitudinal radius on the wedge/barrel interface; see Figure 2.31, instead of, as in the previous case, a difference in the angle. Theory and FE-analyses suggest that such a design shall give the same effect with larger contact pressure at the free end where the tensile force in the rod is less. In the tests 0.64 mm thick annealed copper and aluminium sleeves are used and the radii tested are those seen in Figure 2.31. From results it can be concluded that the anchorages work well and that all tendons fracture away from the anchorage. Displacements are more dependent on the wedge’s slip into the barrel rather than the tendon’s in relation to the sleeve. Enough shear force can be transferred with the system regardless of which of the four radii that are chosen. A smaller radius does thereby give less displacement; this can be compared to the behaviour of a larger angle compared to a small. Less contact pressure is transferred to the rod but the wedge is better held at its position. Presetting is due to this behaviour of the new anchorage a powerful tool to minimize displacements in the anchorage. Once the tip of the wedges has reached the loaded end of the barrel and come in contact with the bearing plate, displacement stops immediately. This can be seen as another proof of the anchorages ability to transfer the necessary shear force.
Fatigue life of this new anchorage design has been evaluated by Elrefai et al. (2007). Twelve tendon samples were tested and all ultimately failed by rupture outside the anchorage zone, all PTI recommendations were met. The stress range was more important than minimum stress concerning fatigue life of the tendon-anchorage assembly and no significant effects on the CFRP’s mechanical properties could be seen after the tests. The proposed allowable stress range based upon this test series is 10% of

Prestressing Anchoring Systems
45
the tendon-anchorage assembly’s ultimate capacity. With a range below that the fatigue life is expected to be infinite.
Figure 2.31 Design of new anchorage with a longitudinal radius on the wedge/barrel interface, Al-Mayah (2006a)
Concrete Wedge Anchorages
Simultaneously and to some extent in cooperation with Al-Mayah’s team another Canadian group of researchers has investigated the possibility to use cementitious materials in the same type of anchorages. Advantages with this type of tendon-anchorage systems are mainly that they are completely unaffected by corrosive or galvanic reactions, Campbell et al. (2000). Disadvantages are several but perhaps their complicated manufacturing process is the primary one. The anchorages used by Campbell as well as Reda Taha & Shrive (2003a, b and c) are designed based on principles from the metallic anchorage with difference in angle between wedges and the barrel. Ultra High Performance Concrete, UHPC, with a 28-day compressive strength of 240 MPa is produced for the purpose as a major constituent of these anchorages. Both wedges and barrels are cast in special moulds and after that the barrel is wrapped with a 0.11 mm thick CFRP sheet to resist the tensile hoop stresses appearing. Indented 8 mm CFRP tendons with an ultimate strength of 104 kN, as in Al-Mayah’s tests, are tested also in this tendon-anchorages system and for that a 180 mm long, 120 mm wide anchorage is estimated to be enough.
After optimization concerning the number of wrapped CFRP layers, size of the parts and presetting load the anchorage was able to pass the PTI tests. Questions do however remain about the usefulness of a 180·120 mm anchorage with a to some extent

Mechanical Anchorage of Prestressed CFRP Tendons
46
unreliable capacity that also has to be protected against UV-light. No continuation of this project has been found after the results presented in 2003.
Multi-strand anchorages are the ultimate aim and challenge met in the development of effective FRP tendon-anchorage systems. To this day no research on that issue is reported but in 2002 the design of a nine-strand anchorage was proposed by Sayed-Ahmed (2002). The anchorage system has not yet been produced or tested; this should probably be the next step once a reliable single-strand has been developed.
Combined Anchorages Previously some typical anchorage designs have been described. Those types more or less summarize the major techniques possible to use in the anchoring of FRPs. By combining the ideas and results from one or several of these techniques some writers have produced combined systems.
Figure 2.32 Double-lap anchoring of FRP strips, Triantafillou & Fardis (1997)
Greek researchers have in Maravegias & Triantafillou (1996) and Triantafillou & Fardis (1997) presented an anchorage for prestressing of masonry structures with FRP-strips. It is a combination of clamps and a 300 mm long double lapped epoxy connection, Figure 2.32. For prestressing, as in the example with swaged anchorages, turnbuckles are used. In that way stressing with minimum attachment to the structure can be made in circumferential confinement projects or as in the example around sharp corners. No further development of these anchorages can be found.

Prestressing Anchoring Systems
47
Figure 2.33 Gradient anchoring method with the force gradient distribution at the plate’s end, Czaderski & Motavalli (2007)
Figure 2.33 (right) presents the principle used in recent work presented by Czaderski & Motavalli (2007) and Aram et al. (2008). CFRP-plates are bonded to the concrete with epoxy; during the curing process heat is applied step by step to gradually reduce the epoxy’s ability to transfer stress. Theory then states that the risk for end peeling of the plate should be effectively reduced. This method is still in development and more reports are necessary to determine whether it is a practically and technically working solution or not. On smaller beams its capacity seems to be limited while on larger full scale beams it gives satisfactory results. Disadvantages that might be hard to handle are unfortunately the use of epoxy and long curing time. The machinery, based on pictures, also looks complicated and heavy.
Figure 2.34 Design of bar system for multiple sheets, Wight et al. (2001)
Strips anchored with the gradient method as well as the sheets anchored by the bar and flat plate methods presented in El-Hacha et al. (1999 and 2003) and Wight et al. (2001) can in excess of the end anchorage also be continuously bonded. That would give another type of prestress transfer than the type utilized by the other systems described

Mechanical Anchorage of Prestressed CFRP Tendons
48
in this study. Results from such tests are therefore not focused on anchorage efficiency; but instead on strengthening efficiency. Limited tendon-anchorage tests on the bar and flat plate systems seen in Figure 2.34 and Figure 2.35 report that the system has difficulties to reach the manufacturer’s ultimate tensile strength of the sheets.
Among the anchorages evaluated the flat plate type with sheet configuration as in Figure 2.35 gives the best results. During final application to the structure only 50% of the systems tested maximum strength was utilized before the sheets were bonded to the concrete.
Figure 2.35 Design of flat plate anchorages, El-Hacha et al. (2003)
Epoxy and wedge effects are combined by Burtscher (2006). By application of a layer of epoxy with longitudinal thickness differences on the strip/wedge interface two thin CFRP strips can be anchored until rod fractures. The publication is limited in its content and further tests on the anchorages long-term and fatigue behaviours are necessary to get a complete picture of the overall efficiency.
Already in 1996 Meier & Farshad (1996) presented a design based on a conical barrel filled with material with changing elastic modulus. Soft material close to the loaded end is supposed to longitudinally level out the force transferred between tendon and anchorage. Several anchorages have been tested at EMPA (The Swiss Federal Laboratories for Materials, Testing and Research) but lack of numbers makes the results hard to evaluate.
2.5.4 Evaluation of Existing Systems The majority of the systems developed so far have at least one if not more drawbacks. In the case of strengthening these might be surmountable; most strengthening projects have to be individually designed anyway. Economical and reliability effects are more

Prestressing Anchoring Systems
49
pronounced as prestressing with FRPs moves into an industrialized phase with prefab factories and multi-strand applications.
Size of the anchorages is in large scale projects an important factor. With the smaller size of the tendon compared to equally strong steel tendons it would be unfortunate if the anchorages neutralize that. Consequently a larger anchorage implies a larger anchorage zone and heavier jacking equipment. Prefab is to a great extent successful due to its effective use of material and large machinery on a tight worksite is undesired. Several of the projects looked into in this report are aimed at minimizing anchorage length; and development has reached a minimum anchorage length of 70 mm using wedge anchorages. This is a step forward but not enough if compared to the sizes for steel anchorages. For concrete wedge anchorages, sleeve and clamped anchorages the lengths are even longer.
Resin bonding seems to be able to keep anchorage lengths down to reasonable levels but as shear stress increases on the tendon/epoxy or epoxy/sleeve interface the resin has a tendency to creep. Eventually given time it will fail if the stress level is above some estimated limit. The limit is tested in creep-rupture tests but in addition to that also variations in temperature will affect it. Systems including epoxy are therefore unreliable if exposed to high forces over a longer time, as the case is with unbonded post-tensioning.
Corrosion may considerably affect the anchorages with steel parts involved. It reduces the advantage that FRP tendons give concerning the same aspect when other parts of the system have to be protected. For anchorages in steel to become sustainable they have to be covered and protected from moisture just as wedge systems are protected in the case with steel tendons. Such systems are available and they should definitely be transformable as long as the anchorages are kept small enough
Another problem involved with the use of metallic materials is the risk for galvanic reactions. The potential for this problem lies in the contact between different metallic anchorage materials. Severe cases may occur if the environment is alkaline which for example an embedment in concrete may cause. The reaction is further described in Campbell et al. (2000). It is there reported that the entire aluminium sleeve is dissolved if in contact with steel wedges in a harmful environment. Copper had better properties and was not dissolved. Copper is however more expensive and its behaviour is more unpredictable.
All systems where the tendon-anchorage assembly to some extent relies on bonding are necessary to pre-cut, and that includes all but clamped and wedge anchorages. Pre-cutting means that no changes to the original design can be made once the order is laid. It also means that prestressing has to be withheld either with the jacking machinery left in place or with additional shims. Alternatively the tendons are prestressed with temporary anchorages and the anchorages used for continuous force transfer are applied afterwards. This is possible but the procedure is complicated and often so time consuming that it is not an alternative at all. In some applications, such as cable stayed

Mechanical Anchorage of Prestressed CFRP Tendons
50
bridges, pre-cut tendons are inserted in externally threaded grout anchorages. With such a system the stress level can be withheld in a process similar to the one for steel bars, see Figure 2.4.
If sleeve anchorages or any other anchorage involving resin or grout are to be used without the necessity of pre-cutting it requires a long curing time on site. Since time is often related to money it is undesirable to rely on such systems. Construction projects in an outside environment, in addition to the time aspect, also present changing weather conditions that might influence the bond’s quality. A suggestion must be that curing on site in prestressing applications should be avoided in all cases.
Freeze-thaw cycles should not only be a problem for the FRP itself, but also for some of the anchorages. As long as no moisture reaches concrete it is insensitive to freezing but once any free moisture is available the concrete may start to crack due to the expansion during transformation of the water to a solid state. In ordinary constructional concrete this is solved by addition of air entrainment agents, AEAs, but in for example the UHPC the necessity of strength makes it impossible. A danger would consequently be cracking of barrels and wedges; this should be a concern also when confinement by FRP sheets is applied.
For the stressing procedure it is favourable with anchorages that need little or no manual attention concerning the individual anchorage. Such requirements are reached in the case of multi-strand anchorages by the use of lock-plates and presetting mechanisms built in into the jack, see Figure 2.17. Similar systems should also be possible to construct for FRPs. Other anchorages than the wedge type anchorages are tougher to apply the same principles to. In clamp anchorages individual bolts have to be stressed, spike anchorages need arrangement of fibres and sleeve anchorages need application of resin.

Force Distribution Analysis of a Wedge Anchorage
51
3 Force Distribution Analysis of a Wedge Anchorage
In the case of an unbonded CFRP tendon that is attached via a wedge anchorage to a structure the applied tensile stress in the tendon must be transferred through the anchorage before it is transferred to the structure. Figure 3.1 illustrates the load in the tendon and the resisting load Fpre. These are the outer forces that facilitate the anchorage’s external force equilibrium, one tensile that pulls the rod and one compressive that resists the barrel’s motion, both with the size Fpre.
Anchorage Unloaded/dead end
Loaded end
preF
Figure 3.1 External force equilibrium for an anchorage used to anchor unbonded tendons
These outer forces will be transferred to inner forces in the anchorage. From the rod with its inherently limited capacity for handling transverse forces the forces path must continue into the wedges by friction. The homogenous wedge handles the force until it reaches the wedge-barrel interface where the forces component acting perpendicular to the interface transfers the entire pulling force of the rod into the barrel and further to the concrete. A static analysis of this path is done in the following section, based on initial inspiration from Leonhardt (1973).

Mechanical Anchorage of Prestressed CFRP Tendons
52
3.1 Static Rigid Body Analysis A basic attempt to describe the complex behaviour of the wedge anchorage is the 2D model that can be seen in Figure 3.2. Each part is assumed to be elastically rigid, that is that no deformation occurs due to the applied forces. The entire component is in static equilibrium and the picture is simplified by the inclusion of symmetry along the central axis of the CFRP rod.
x
y
Barrel
Wedge
Rod
Barrel
Wedge
(Fjack)
(x,y)
(x ,y )
Nb Nwb
Sb
Swb
Nwr Nr
Swr
Sr
Fpre
(Fpre)
Sym
met
ry
Hoop s
tres
ses
(Fset)
Rod
wb
rw
Fset,barrel
Figure 3.2 2D static rigid body model for a wedge anchorage with the use of symmetry
3.1.1 Presetting Two steps have to be considered in the static model. In the first one a presetting force of Fset is applied. The way in which this presetting force is counteracted globally may differ. In a case where the rod is restricted to move in the y-direction the wedge must slide in between barrel and the rod; thus overcoming both the friction in the wedge-barrel interface, wb, and in the rod-wedge interface, rw. This might be the case when the wedge is preset in connection with a prestressing procedure. A jacking force, Fjack,is then applied in the dead end of the rod which keeps it in position. Global

Force Distribution Analysis of a Wedge Anchorage
53
equilibrium in the y-direction is withheld according to Eq. (3.1) where, Fset,barrel, is the force in the barrel-concrete interface and, Fpre, the effective prestress.
, set preset barrel jackF F F F (3.1)
The second case occurs when no jacking force is applied to the rod and the rod moves along with the setting of the wedge. Such a case might be when a dead end anchorage is preset. All setting force, Fset, is then handled by, Fset,barrel, which reduces Eq. (3.1) to:
, setset barrelF F (3.2)
In both cases equilibrium of the wedge can be derived from Figure 3.3. Forces on the wedge do directly also give the magnitude of all unknown forces on the other interior faces of the anchor.
x
y
Nwb ,x
Swb
Nwr
Swr = Fjack - Fpre
Fset
wb rw
NwbNwb ,y
Swb ,x
Swb ,y
Fset
Nwr
Swr
Swb
Nwb
Fset
Nwr
Swb
Nwb
Presetting
Fjack = 0 Swr = 0
Fjack = Fpre + Fset - Fset,barrel
2 2wb wbN S
2 2N S
+
Figure 3.3 Static equilibrium for the wedge during the two different cases of presetting
Solutions may either be derived from the free body diagram on the left part of Figure 3.3 or from the polygons of forces on the right-hand part. First a solution for the more complicated case with a jacking force present is given based upon the free body diagram. Afterwards a solution for the same load case with the use of the polygons is presented. Based on these two thorough calculations equations for the forces in the following load cases may be more easily expressed.

Mechanical Anchorage of Prestressed CFRP Tendons
54
Fixed Rod First equilibrium of the wedge in the y-direction may be written as
, , 0set wr wb y wb yF S S N (3.3)
where Swr and Swb ,y are the frictional shear force components acting in the y-direction on the wedge-rod and wedge-barrel interfaces respectively. Nwb ,y is the normal force component acting in the y-direction on the wedge-barrel interface and Fset is the presetting force applied to the wedge.
With a classical assumption of a constant coefficient of friction, irrespective of normal pressure or sliding conditions, the components of the forces can be expressed as:
,,
cossinwb y wb
wr rw wr wb y wbwb wb wb
S SS N N N
S N (3.4)
Substitution of Eq. (3.4) into Eq. (3.3) results in a representation of Fset based upon the coefficients of friction in the rod-wedge, rw, and the wedge-barrel, wb, interfaces, the angle described by the wedge-barrel interface in relation to the y-axis, , and the two normal forces acting on the interfaces, Nwr and Nwb .
cos sinset rw wr wb wb wbF N N N (3.5)
Similarly the equilibrium in the x-direction can be stated as:
, , 0wb x wr wb xN N S (3.6)
where Nwr and Nwb ,x are the normal force components acting along the x-axis and Swb ,x the frictional shear force component in the x-direction.
,,
sincos wb x wb
wb x wbwb wb wb
S SN N
S N (3.7)
As in Eq. (3.5) it is now, with the help of Eq. (3.7), possible to express Eq. (3.6) in coefficients of friction, angle of the interface and normal forces:
cos sin 0cos sin
wrwb wr wb wb wb
wb
NN N N N (3.8)
To solve the system of two equations, Eq. (3.5) and Eq. (3.8), either the coefficients of friction, the angle or one of the forces must be known. Here it is assumed that the presetting force is known. Substitution of Eq. (3.8) into Eq. (3.5), then produces an expression for the normal force acting on the wedge-rod interface, Eq. (3.9):
cos sincos sin cos sin
wr wrset rw wr wb
wb wb
N NF N

Force Distribution Analysis of a Wedge Anchorage
55
tancos sin1 tancos sin
set setwr
wbwbrwrw
wbwb
F FN (3.9)
Following this, Eq. (3.9) can be used to calculate the frictional shear force in the wedge-rod interface, Eq. (3.10), and the forces on the wedge-barrel interface, Eq. (3.11) and Eq. (3.12):
tan1 tan
rw setwr rw wr wr
wbrw
wb
FS N S (3.10)
cos sin cos 1 sinwr set
wbwb rw wb rw wb
N FN (3.11)
cos 1 sinwb set
wb wb wb wbrw wb rw wb
FS N S (3.12)
The second choice for derivation of the participating forces is the use of the polygons of forces, see Figure 3.3. Angles and can according to Eq. (3.13) be expressed in the two coefficients of friction.
1 1tan tanwr wbrw rw wb wb
wr wb
S SN N
(3.13)
By geometry an equation that relates the presetting force to the angles may be derived as in Eq. (3.14). The left hand side of the expression represents the two y-directional parts of the triangles with the length along the x-axis of Nwr.
tan tanwr wr setN N F (3.14)
Furthermore, Eq. (3.13) in Eq. (3.14), together with basic trigonometric equations produce the same equation that can be found in Eq. (3.9), which is then used to solve Swr.
tantan tan1 tan
set setwr
wbrw
wb
F FN Eq. (3.9)
tan1 tan
rw setwr rw wr wr
wbrw
wb
FS N S Eq. (3.10)
Nwb and Swb are found through the trigonometric relationships found in Figure 3.4 which is an enlarged part of the upper polygon in Figure 3.3 with some modifications to magnify the relations.

Mechanical Anchorage of Prestressed CFRP Tendons
56
Swb
Nwb
Nwr
Figure 3.4 Enlarged and modified part of Figure 3.3
cos sin cos sinwr wb wb wb wbN N S N
cos sin cos 1 sinwr set
wbwb rw wb rw wb
N FN Eq. (3.11)
cos 1 sinwb set
wb wb wb wbrw wb rw wb
FS N S Eq. (3.12)
Substitution of Fset = 1, rw = 0.3, wb = 0.1 and = 2° into the above derived equations give the values of the interfacial forces, see Table 3.1. Coefficients of friction and the angle are taken from Al-Mayah et al. (2001b). The table also show what impact a small change in the assumed parameters has on the result.
Table 3.1 Interfacial forces during presetting if motion of the rod is restrained and a presetting force of with value 1 is used. Maximum and minimum values for each reaction force are marked with dark and light grey shading respectively.
Assumed conditions Nwr Swr Nwb Swb
Original 2.30 0.69 2.31 0.23rw = 0.25 2.59 0.65 2.61 0.26rw = 0.35 2.06 0.72 2.07 0.21wb = 0.05 2.60 0.78 2.60 0.13wb = 0.15 2.06 0.62 2.07 0.31
= 1° 2.39 0.72 2.40 0.24= 3° 2.21 0.66 2.22 0.22
Movable Rod For this load case the lower polygon of forces in Figure 3.3 is used. Since Swr = 0, Eq. (3.13) is reduced to:
1tanwbwb wb
wb
SN
Which in turn reduces Eq. (3.9), Eq. (3.11) and Eq. (3.12) to:

Force Distribution Analysis of a Wedge Anchorage
57
; ;tan cos sin cos sin
1 tan
set set wb setwr wb wb
wb wb wb
wb
F F FN N S (3.15)
Following from that a table of resulting forces with the same assumed values and unit presetting force as in Table 3.1 can be found in Table 3.2.
Table 3.2 Interfacial forces during presetting if the rod is moving with the wedge and a presetting force with value 1 is used.
Assumed conditions Nwr Swr Nwb Swb
Original 7.39 0.00 7.42 0.74rw = 0.25 7.39 0.00 7.42 0.74rw = 0.35 7.39 0.00 7.42 0.74wb = 0.05 11.76 0.00 11.78 0.59wb = 0.15 5.38 0.00 5.41 0.81
= 1° 8.50 0.00 8.52 0.85= 3° 6.53 0.00 6.57 0.66
3.1.2 Removal of Fset
Once the presetting is completed the presetting force is removed and a new state of equilibrium is achieved, with or without allowance for movement of the rod. Frictional shear forces do in this phase change direction and provide a force that keeps the wedges from being pushed back out of the barrel. Descriptive polygons of forces are presented in Figure 3.5.
Nwr
SwbNwb
NwrSwr
SwbNwb
Swr 0 Swr = 0Figure 3.5 Polygons of forces after removal of the presetting load
With a value on the normal force on the rod-wedge interface, Nwr, that remains constant a slight reduction in Nwb is the outcome from the change in direction that occurs for Swb ,x. The size of the frictional shear forces are in this load case not related to the normal forces acting on the interfaces through the conditions in Eq. (3.4) and Eq. (3.7). The frictional forces are only utilized in such a degree that they together can resist Nwb ,y and make the system statically indeterminate.
To ensure that the wedges do not “pop out” the combined maximum available frictional shear force in the y-direction must be larger than the y-component of the normal force, Swb ,y + Swr > Nwb ,y.
, ,cos cos sinwb y wr wb wr wb wb rw wr wb wb yS S S S N N N N (3.16)

Mechanical Anchorage of Prestressed CFRP Tendons
58
or as the case is when the rod moves along with the wedge, based on Eq. (3.16):
cos sin tanwb wb wb wbN N (3.17)
The coefficient of friction in the wedge barrel interface must thus be larger than the tangent of the interface’s angle to the y-axis. For an angle of 2° the necessary friction coefficient is 0.035.
3.1.3 Application of Prestress During service, Fset = 0 and global equilibrium is withheld through Eq. (3.18) and Eq. (3.19), where the jacking force, Fjack, in Eq. (3.18) is gradually removed to a final value of zero which gives the global equilibrium shown in Figure 3.1.
, where 0set barrel pre jack jack preF F F F F (3.18)
,set barrel preF F (3.19)
Eq. (3.18) relates to the case where the service load is applied to the anchorage through a gradual release of the jacking stress in the dead end of the anchorage, while Eq. (3.19) relates to the case where the service load is applied through a gradual increase of the prestressing load of the tendon. Both these cases are continuations of the cases referred to in Sections 3.1.1 and 3.1.2.
Once these loads are fully applied, the final force distribution within the anchorages is the same in the two cases but the process of getting there is slightly different.
When the rod was restricted to move during presetting the wedge’s motion was controlled by frictional shear forces along both interfaces while in the case with a moveable rod it was only controlled by a force in the wedge-barrel interface. This can be seen in Figure 3.3. Due to this difference in force transfer the normal forces necessary to handle the presetting force were considerably larger in the case with a movable rod than in the case with a fixed rod. A comparison between Table 3.1 and Table 3.2 show that the difference is fivefold.
In this step, where the rod in both cases is moving along with the wedge, the only frictional shear force that restricts the wedge’s movement into the barrel is that on the wedge-barrel interface. With the application of a force in the rod-wedge interface with a value equal to the earlier applied and removed Fset the earlier differences between the case with a movable rod and the case with a fixed rod are erased. The different forces are instead replaced with a new common force that acts on the wedge. This force can be seen in Figure 3.6 and exchange Swr for either Fpre - Fjack = Fset or Fpre =F set,depending on the application procedure.

Force Distribution Analysis of a Wedge Anchorage
59
x
y
Nwb ,x
Swb
Nwr
Swr = Fpre (Fpre-Fjack)
wb rw
NwbNwb ,y
Swb ,x
Swb ,y Nwr
Swb
Nwb
Service
2 2wb wbN S
+
Swr = (Fset)
Figure 3.6 Static equilibrium for the wedge during application of service load
In the case with a moveable rod Swr was equal to zero during presetting. If this now is replaced with a value equal to Fset, and Fset is equal to zero, the resulting polygon of forces can be expressed as in the right part of Figure 3.6. This is identical to the polygon during presetting and presented in Figure 3.3. The same polygon is also valid for the case with an initially fixed rod, since Swr in that case now has changed direction, adopted the value Fset and left Swb as the only frictional force restricting the wedges motion into the barrel.
Available frictional shear force, Swr,available, is in a state of loading equal to the coefficient of friction for the rod-wedge interface times the normal force acting there. This is also the maximum prestressing load, Fpre,max, that the rod can handle without slipping out of the anchorage after presetting. That may be shown by static equilibrium calculations of the rod in the y-direction based on the forces in Figure 3.2.
,max , ,maxpre wr available pre rw wrF S F N (3.20)
Inserting Eq. (3.15) into Eq. (3.20), which is based on the same polygon of forces, creates an expression that relates the available maximum prestressing force to the applied force during presetting.
,max
1 tantan
rw set wbpre
wb
FF (3.21)
This also implies that the values for Nwr in Table 3.2 together with rw may be used to calculate the available prestressing force for the same variations of parameters. The original parameters were then, Fset = 1, rw = 0.3, wb = 0.1 and = 2°, which also is the case in Table 3.3.

Mechanical Anchorage of Prestressed CFRP Tendons
60
In fact, all coefficients in Table 3.2 and Table 3.3 can be used to calculate the maximum forces possible based on the applied prestressing force, as long as the parameters in the table correspond to the anchorages design. They just have to be multiplied with the, in each case, applied presetting force. If any other variations of the included parameters are sought Eq. (3.15) and Eq. (3.21), should be used.
Table 3.3 Calculated maximum available prestressing capability if a presetting of unit size has been applied.
Assumed conditions
(Fset = 1) Nwr Fpre,max = Nwr rw
Original 7.39 2.22rw = 0.25 7.39 1.85rw = 0.35 7.39 2.59wb = 0.05 11.76 3.53wb = 0.15 5.38 1.61
= 1° 8.50 2.55= 3° 6.53 1.96
There is however no limit on the anchorages ultimate gripping capability as long as the sliding functions properly. Once Swr grow above Fset more normal forces are built up in analogy with the polygon of forces in Figure 3.6 so that when Swr reaches Fpre,max, the new available prestressing force equals
,max,max ,max
1 tan1 tantan tan
rw pre wbrw wr wbnewwr pre pre
wb wb
FSS F F (3.22)
which again may be repeated until some part of the anchorage fails due to stresses exceeding the ultimate stresses of the materials included. Then with the new maximum available prestressing force inserted at the position of Fpre,max in Eq. (3.22), which will lead to an updated and higher new available maximum prestressing force.
3.1.4 Circumferential Stresses Earlier work performed on static rigid body models in Campbell et al. (2000), Reda Taha & Shrive (2003a) and Shaheen & Shrive (2006) focused on finding the designing circumferential (hoop) stresses in the barrel. In their attempts to develop a non-metallic anchorage UHPC (ultra high performance concrete) were used and the researchers needed an approximate value on the stresses to decide upon a thickness of the barrel. With a length on the barrel of 180 mm, the concrete’s tensile strength 9 MPa and a maximum prestressing force of 104 kN a barrel thickness of 140 mm was necessary according to Campbell et al. (2000). With that in mind they decided to wrap the concrete barrel with CFRP sheets on the outside. The calculation was performed according to the thin cylinder theory which in accordance to Roark & Young (1975) is only reliable for shells with a thickness below one tenth of the cylinders radius. The

Force Distribution Analysis of a Wedge Anchorage
61
same equations, that are presented in Eq. (3.23), with the same discouraging outcome were also presented in Reda Taha & Shrive (2003a).
( ) ( )( )
( )
( ) 2( )
( )( )
2
2
iwb y b y
yb y
wby
b b ywbb
wb y ib y b
dt
yNy l tNld l
(3.23)
and wb are the circumferential stress and internal pressure, dib, tb and lb are the inner
diameter, thickness and length of the barrel. (y) is the notation used to define the thin section along the y-axis, defined in Figure 3.2.
If the same model is used to calculate a minimum barrel thickness Eq. (3.23) can be rewritten as Eq. (3.24), where Nwb is taken from Eq. (3.15) and the reasoning in Section 3.1.3. That is, with a 100 mm long steel barrel with yield strength fy = 400 MPa and remaining characteristics as in the original model used for Table 3.2. Consideration is taken here to the fact that the component of the normal force acting in the x-direction should be used.
,( ) 2
( )
cos cos 2;
100 400 cos sinprewb x wb wb
y b wbb y wbb b y
FyN N Nt N
l fl t (3.24)
To solve this it is necessary to find a proper presetting force to work with. If a CFRP rod with radius rf = 4 mm and an ultimate stress at failure, u, of 2500 MPa, were to be prestressed a maximum prestressing load of
2 22500 4 125.7 kNpre u fF r
can be reached. Using Eq. (3.24) gives a thickness of the barrel of 7.4 mm:
cos 2 cos 2125700 7.4 mmcos sin 100 400 100 4000.1cos 2 sin 2
preb
wb
Ft
All of the parameters in these calculations are chosen to exemplify how the different equations derived can be used for calculations of the necessary thickness of the barrel.

Mechanical Anchorage of Prestressed CFRP Tendons
62
In Shaheen & Shrive (2006) the same equation, Eq. (3.23), returned once again for the evaluation of a laboratory test performed. The calculations for Nwb are achieved from a static rigid body analysis and results in that the normal force equals seven times the tensile force in the tendon, Nwb = 7Fpre. No consideration is taken to the fact that the internal pressure exerted by the wedges is unevenly distributed in the circumferential direction or that Nwb also includes a component working in the y-direction. All three publications that used these equations, Campbell et al. (2000), Reda Taha & Shrive (2003a) and Shaheen & Shrive (2006), dealt with an anchorage design where the outer face of the wedge had a slightly larger angle than the inner face of the barrel. Shaheen & Shrive (2006) then assumed that the internal pressure would be at its maximum in the unloaded end of the anchorage, y = lb, and that it would be twice the size of the average pressure there, see Figure 3.7. That point coincides with where the barrel has its thinnest section.
Wedge
Barrel
Figure 3.7 Assumed radial pressure distribution in the anchorage tested by Shaheen & Shrive (2006)
Since the failure load of the test was known it could be used in Eq. (3.23) to calculate the circumferential stress present in the concrete. Failure occurred at Fpre= 40 kN, the length of the barrel, lb, was 100 mm and the thickness of the barrel in the thinnest section, tb(100), is 11.5 mm. This inserted in Eq. (3.23) gives a circumferential stress at failure of 76.5 MPa:
(100) 2 2(100)
100 100 7 40000 76.5100 11.5
wb
b b
Nl t
Shaheen & Shrive (2006) did however with the same equation and the same values on the parameters get a circumferential stress at failure of 8 MPa. It might be due to an editing mistake. In any case both of the values are far from the expected tensile strength of the concrete which was 25 MPa. They did due to this discard the model as inappropriate.

Force Distribution Analysis of a Wedge Anchorage
63
3.1.5 Discussion Concerning the 2D Static Rigid Body Model Mathematical models are always a course representation of the real behaviour of structures. Furthermore, static rigid body models do not consider deformations or movements of the structure, and very seldom take 3D (three dimensional) aspects into account. In this particular case with the wedge anchorage it is probable that those shortcomings are at a significant level; hence the outcome must be studied with some scepticism. Due to the high forces during pre-stressing and loading pronounced elastic, or even plastic, behaviour of the anchorage may be expected. It is also probable that normal forces applied to the CFRP rod will be substantially smaller than the 2D model suggest because of the in reality applied constrain of circumferential deformation of the parts included in the anchorage. Some conclusions can nevertheless be drawn also from 2D static rigid body model. From Table 3.2 it can for example be seen that a minimum of friction between the wedge and barrel is largely beneficial for the grip around the rod. The same is valid also for a small angle on the wedge-barrel interface. Optimization of these variables must also consider the transverse strength of the rod and the relation in Eq. (3.17), so that no “pop out” of the wedges occurs.
With a well adjusted presetting force the forces in the anchorages interior seem easy to control. It can be calculated to handle the maximum prestressing force and thus balance the benefit of minimum motion of the wedges against the drawback of too large radial stress on the rod. Some more aspects of this are considered and discussed in the following section.
3.2 Maximum Force Transfer As briefly mentioned in the literature review and the previous section there are some limiting factors that influence the capacity of a wedge anchorage. This becomes particularly evident when the material to anchor lacks yielding capabilities and is orthotropic; such as the case is with CFRP.
3.2.1 Limiting Factors Small anchorages with a high reliability concerning its capacities are a key issue in the development of an anchorage for external CFRP tendons, in particular for retrofitting of concrete structures. With such an anchorage at hand the system may be industrialized and used in a wide range of prestressing applications. A small anchorage does however require that the large longitudinal forces handled by the tendon can also be properly transferred into the wedges and barrel on a minimum of transferring area. How this can be dealt with is divided into three sections, one that discusses optimized transfer size in a perfect case, one that deals with effects that constrain the possibilities to achieve a perfect case and one that discusses the problem of slippage.

Mechanical Anchorage of Prestressed CFRP Tendons
64
Transverse Strength of Tendon FRPs are highly anisotropic materials. Material properties can therefore never be expressed in just a few parameters covering the entire x-y-z space of spatial directions, see Figure 3.8. This is in contrast to the nature of steel where one value on each of the parameters of elastic modulus, yield and ultimate strengths, Poisson’s ratio, coefficient of thermal expansion and so on can thoroughly describe the material’s behaviour. Concrete is another isotropic material but with differences in mechanical properties depending on whether it is subjected to compressive or tensile loading. FRP is on the other hand typically orthotropic with different properties in different spatial directions and also different properties depending on whether it is loaded in compression or tension.
z
x
y
t
t
lr
Figure 3.8 Material directions in an orthotropic material
In Figure 3.8 an example with a bidirectional fibre design is shown. The fibres are in this case aligned along the x and y axes with set to 90° but that may be varied to desired specifications. 3D fibre grids are not manufactured and to do so would require complicated weaving patterns. Benefits from that would also be relatively small since isotropic behaviour still can not be reached. For prestressing applications a unidirectional FRP is used. This material can be mechanically described in two directions, one transverse/radial and one longitudinal. These can be seen in Figure 3.8 on the laminate and circular rod.
As briefly mentioned in the literature study in Chapter 2 the properties of the composite in the two different directions are mostly influenced on either the properties of the fibres or the polymer matrix. For the anchorage of a prestressing tendon through a wedge anchorage the tensile properties in the longitudinal and compressive properties in the transverse direction are the more interesting. Fibres are primary carriers of load for the longitudinal pull and the composite is so far utilized in its strongest direction. It is however considerably weaker in the transverse direction where the matrix acts as the major load carrier. Bech et al. (2006) report a tensile strength in the longitudinal direction of 2206 MPa while the transverse compressive strength was limited to 207

Force Distribution Analysis of a Wedge Anchorage
65
MPa; which gives a ratio = l,tens/ t,comp of 10.7. The British material distributor Goodfellow report available values between 1100-1900 and 50-250 MPa for their CFRP rods which gives ratios ranging between 7-22. Sayed-Ahmed & Shrive (1998) give values of 1800-2550 and approximately 228 MPa with the resulting span of ratios ranging between 7.9-11.2. A reasonable overall approximation of the strength ratio would, based on these numbers, be somewhere around 10. Testing of the transverse, and also compressive, properties are difficult both to perform and to evaluate due to secondary effects induced by the set up. Data are therefore hard to find in literature but this approximation should be enough for the reasoning performed here.
The CFRP available for laboratory tests carried out in this study is a high strength composite with a mean longitudinal tensile strength of 2500 MPa provided by Sto Scandinavia. If this rod has a diameter of 10 mm, which may be a reasonable size for a prestressing rod, the force to transfer is 196 kN. Eq. (3.15), and the values on angle and friction in the wedge-barrel interface from the original model used to calculate the values in Table 3.2 show that the size on the transverse compressive force then will be approximately 7.4 times the applied pulling force. This corresponds in this case to 1450 kN. A strength ratio, , of 10 then makes it necessary with a contact area of at least 580 mm2.
580 mm2 is a fairly small surface and only requires an 18 mm long interface between the wedge and rod. As mentioned earlier in Chapter 2 wedges for the anchorage of steel tendons are 30 to 40 mm long in their smallest design. For the anchorage of FRPs no wedges shorter than 70 mm can be found in literature. Since 580 mm2 is calculated with a perfect 2D case in mind, which should give the highest normal forces possible for a specific anchorage design, factors other than the total transverse compressive capacity of the rod must be the limiting factors. The question is when the rod due to sufficient friction is prevented from slippage, what is it then that causes premature failure also for anchorages as long as 70 mm? CFRP is sensitive to pinching, i.e. gripping through sharp edges, which may snap individual fibres and decrease the total strength of the rod. It is also probable that the anchorage imposes stresses onto the rod so that the maximum principal stress at some point exceeds also the ultimate strength in the composites strongest direction. These issues are discussed more in detail in the following section.
Pinching and Principal Stresses in Tendon Steel tendons can be anchored with wedges that are slightly toothed to increase its capability to transfer sheer forces across the rod-wedge interface. The tendon is then plastically deformed and keeps its strength intact. With the same system used on CFRP tendons the teeth will dig into the vulnerable fibres and create sharp bends that breaks them one by one, thus decreasing the total strength of the rod. Similar phenomena may also be seen at the other critical points shown in Figure 3.9.

Mechanical Anchorage of Prestressed CFRP Tendons
66
Teeth
Edges
Corners
Nwr
Figure 3.9 Pinching and critical points where pinching may occur
To avoid pinching, all edges and corners should be rounded and no teeth may be used. For the edges this rounding decreases the effective contact area between the rod and the wedge and the smooth surface allows no mechanical transfer of forces. The longitudinal edges are especially difficult to round off, partly due to production efficiency but mostly because that decrease in internal surface area together with the millimetres of spacing required between the wedges must be compensated with a good increase in length.
Another cause of stress concentrations that may lead to premature failure is the combination of forces acting on the rod. They produce resulting force components in all spatial directions at every point in every part of the anchorage which in some directions may exceed the available strength. From the reasoning in the previous sections it is known that it will not happen in any of the two radial or longitudinal directions. It is, however, neither known what size on the force nor what capacity that is present in any of the other spatial directions.
If, as the static rigid body model shows, the normal pressure onto the rod is evenly distributed it creates a constant stress component in the radial direction along the rod. This can be seen in Figure 3.10.
r
x
Rod
Wedge
Radial pressure
Figure 3.10 Evenly distributed radial stress on the rods surface in the case of a 2D static rigid model
The radial stress creates the possibility to utilize the friction for transfer of the longitudinal pulling force in the rod so that it from its maximum value in the loaded

Force Distribution Analysis of a Wedge Anchorage
67
end has a zero value at the unloaded end. With the assumed even distribution of normal pressure and also an assumed even coefficient of friction along the rod this decrease in longitudinal stress will be linear, as in Figure 3.11.
l
x
Rod
Longitudinal stress
Wedge
Figure 3.11 Linearly decreasing longitudinal stress along the rod
These longitudinal stresses and the radial pressure can be seen as two components of a combined stress, 1, describing an angle, , to the rods central axis, see Figure 3.12.
r1
l
Figure 3.12 Stress components at some arbitrary point on the rod within the anchorage zone
The size and angle of the principal stress is given by
2 2 11 ; tan r
l rl
(3.25)
Since the longitudinal stresses are at their maximum at the rods entrance into the anchorage that would be the most critical point. Assuming a worst case scenario with l= 2500 MPa and r = 250 MPa the size of the principal stress would be 2512.5 MPa according to Eq. (3.25), and the angle 5.7°. That is a limited increase of the maximum stress in the rod compared to the applied longitudinal stress of 2500 MPa. It will have minimal impact on the ultimate failure stress of the rod, at most decrease it with 1%. Deviation of this highest principal stress from the longitudinal axis, which is the strongest, is also limited and should only cause a minimal decrease in ultimate failure stress.
It would, at this point, be interesting with a failure envelope for CFRP to relate to. In literature premature failure of the rod within the anchorage is a common failure mode but nothing based on the 2D static rigid body analysis point out any weaknesses. The problem must therefore be addressed through analyses that take 3D, motion of the wedges and elasticity into consideration.

Mechanical Anchorage of Prestressed CFRP Tendons
68
SlipAs long as consideration is only given to the 2D analyses performed, no risk of slippage seems to be present. The truth is that slip is the hardest obstacle to overcome in the creation of a reliable anchor. That has been found out through the literature study performed in Chapter 2 and also through trifling with rough anchorage models in the laboratory.
No mechanical force transfer through the act of non-frictional forces can be relied on in the rod-wedge interface. Such non-frictional forces can be created by threads on either the inner surface of the wedge or the outer surface of the rods. In the former case the threads cause stress concentrations and pinching of the fibres and in the later case shear failure will occur in the weak matrix. All transfer must therefore occur through friction along the interface. Friction is difficult to model. Traditionally the Coulomb’s friction law is used where the available force to resist sliding in an interface is described as a coefficient of friction times the normal pressure. This is also the relation used in Eq. (3.4) and Eq. (3.7). It is used mostly due to its simplicity but its accuracy may be discussed. For higher accuracy some non-classical laws of friction should be applied, see Man (1994).
Al-Mayah et al. (2001b) found that a coefficient of 0.3 between the rod and wedge should be a reasonable number. For a rod with the diameter of 10 mm and failure strength of 2500 MPa the maximum applied force is 196 kN. If this is about to be anchored with a 100 mm long anchorage, that is on a surface of 100 · · 10 = 3141 mm2, the necessary normal force to resist global motion of the rod would be 208 kN. For a 50 mm long anchorage it would be 416 kN. Both the numbers are well below the available normal force according to the static rigid body analysis for the longitudinal stress of 2500 MPa, which turned out to be 1450 kN.
Through simple calculations it has now been shown that a 2D model that does not consider deformation of the bodies or their motion in relation to each other gives limited knowledge about the anchorages ultimate behaviour and capacity. According to such an analysis neither the transverse compressive capacity nor the principal stresses or slippage should introduce any limitations. At least not as long as the anchorage is longer than 30 mm. Next step in the search on why these failures nevertheless occur is an axi-symmetric model based on the theory of thick-walled cylinders. For a full 3D analysis a parametric study of the anchorage through finite modelling is performed in the next chapter.

Force Distribution Analysis of a Wedge Anchorage
69
3.3 Theory of Thick-Walled Cylinder
3.3.1 Introduction Stresses in hollow cylindrical structures that have a thickness greater than one tenth of the radius should according to Roark & Young (1975) and Pilkey (1994) be modelled so that stresses may vary in the structures radial direction. A rough visualisation of this variation for an applied constant inner pressure can be seen in the left part of Figure 3.13. The modelling can be carried out through linearly elastic axi-symmetric theory of thick-walled cylinders. This will correspond to the type of anchorage developed in this thesis, where the thicknesses of the parts are approximately 1/1 to 1/2 of the total inner radius. Results are however also valid for thin-walled structures.
r
Figure 3.13 Segments of a thick-walled cylinder and a thin-walled cylinder and a rough visualisation of how the stresses are modelled throughout the thickness of the cylinder
To begin with, three types of conditions must be defined. These are; the equilibrium of forces, the compatibility equations and the stress-strain relationships. Finally adequate boundary conditions must be applied to eliminate unknown variables. A system with this configuration of boundary conditions and equations based upon the theory of elasticity is, according to Lundh (2000), difficult to use in practice. Only a few cases with closed analytical solutions are available and a thick-walled cylinder is one of them. Due to its axial symmetry and the possibility to assume either plane strain or plane stress conditions the number of variables can be reduced significantly and facilitate a solution with a reasonable amount of boundary conditions.
Different ways to both derive and utilize the equations of the theory may be found in numerous publications in the area of elasticity and mechanics of materials and structures. Burr & Cheatham (1995), Wang (1953) and Lundh (2000) all derive the basic equations and develop them further. Pilkey (1994) and Roark & Young (1975) present equations for different loading conditions listed in tables without the basic derivations recorded. In the case of a wedge anchorage the theory has been used in some applications, for example Shaheen & Shrive (2006) use it in its simplest form to

Mechanical Anchorage of Prestressed CFRP Tendons
70
find a minimum thickness of the barrel, as they also did with the thin walled theory. As boundary conditions they use a zero pressure on the outer surface and the stress obtained from static rigid body calculations on the inner surface. No discussion on how well it corresponds to the actual case is available and its appropriateness can consequently not be evaluated. Al-Mayah et al. (2001a and 2007) developed the application a bit further and combined calculations for the rod, an internal sleeve, the wedge and the barrel into one. In that way they could obtain a better understanding of the radial stress distribution within the anchorage. The result compared with the results from an axi-symmetric finite element model can be seen in Figure 3.14. The anchorage modelled has a slight curvature on the wedge-barrel interface and high stresses are therefore reached in the back of the anchor, this feature is also discussed in Chapter 2. Differences between the analytical and numerical models are according to the authors due to the orthotropy that the rod in reality possesses but which is excluded in the analytical model used.
Figure 3.14 Contact-pressure distribution on the rod using mathematical and axi-symmetric finite element models, Al-Mayah et al. (2007)
Due to the nature of the type of solution presented a number of limitations must be stressed:
The material models used are all linearly elastic. This results in that one value on Young’s modulus and one on Poisson’s ratio for each material describe the entire behaviour of the particular material in all directions and both in tension and compression. CFRP is clearly orthotropic and therefore not well modelled in this particular case, while for steel and aluminium it might be a good model up until yielding. Assuming axial symmetry around the longitudinal axis is reasonable for the barrel. The wedges, which are cut at several locations, create a force distribution that is not symmetrical around that axis and the model consequently does not model the stresses in such parts correctly. Al-Mayah et al. (2007) solved this problem by making the barrel rigid. Nor this corresponds

Force Distribution Analysis of a Wedge Anchorage
71
to reality, but gave more correct stress distributions if compared to a 3D finite element model. In reality the wedges are forced into the barrel along the longitudinal axis with a longitudinal force vector acting in each point of the anchorage. No influences of such forces are included in the model. In all interfaces between the materials some frictions exist, they are not considered at all since no longitudinal forces are considered and since axial symmetry is assumed. To solve stated systems of equations either plane stress or plane strain conditions must be assumed. In plane stress conditions no longitudinal stress exists and the body is in every point free to deform along the longitudinal axis in a constant manner. Plane strain implies that no deformation occurs in the longitudinal direction and that the stress in the same direction is constant. Boundary conditions inherent in the structure of the anchorage belong to neither of the two cases. Each part in the anchorage is partly allowed to deform but is also partly restricted due to friction and resulting longitudinal forces from the longitudinal motion.
3.3.2 Basic Equations To derive the basic equations for a thick-walled cylinder a cylindrical system of coordinates is applied. As in the case with uni-directional fibre composites in Figure 3.8 the system has a longitudinal direction, designated l, and a radial direction, r. For the circumferential direction the system uses the notation , which also can be found in Eq. (3.23) and Eq. (3.24), see also Figure 3.15.
EquilibriumIn the upper part of Figure 3.15 all forces acting on the visible faces of an infinitesimal 3D element in the cylindrical coordinate system are shown. The element has the radial length of r, the inner arc length of r , the outer arc length of (r + r) and the height of l. The normal forces in the radial, r, longitudinal, l, and circumferential,
, directions are acting on each face. Shear forces present on the faces are designated with the notation xx, where the first subscript denotes the face it acts on and the second in what direction it acts.
Under plane stress conditions the small element may be projected onto the r - plane as is shown in the lower part of Figure 3.15. All components of forces acting in the longitudinal direction are then by the definition of plane stress equal to zero.
For radial equilibrium any of the two cases may be considered, but if a general equation is to be written lr must be included as well, see Eq. (3.26).

Mechanical Anchorage of Prestressed CFRP Tendons
72
sin ...2
... sin cos ...2 2
... cos ...2 2
...
rr r
r
rr lr
lrlr
r l r r r l l rr
l r l r
r r rl r r
rl r
l0
2r r
(3.26)
rr r
r
rr r
rr
r
( )r r
r
y
,z l
x
r r
l
r
l
r
r
l
l
lr
2
rl
r
rr
Figure 3.15 Forces acting on a general infinitesimal 3D-element in the cylindrical coordinate system and its projection onto the r - space
Similar equations may also be written in the circumferential and longitudinal directions but in a state of plane stress or plane strain it is not necessary to solve for radial and circumferential stresses. Although the wedge anchorages, as previously mentioned, do not correspond to either of the cases an assumption of plane stress will be adopted later for further derivations. This may be a reasonable simplification due to the lack of end constraints. Every point in each part of the anchorage is also free to slide against the adjacent parts as long as the friction is overcome. The most important aspect is

Force Distribution Analysis of a Wedge Anchorage
73
however that the system of partial differential equations resulting from combinations of equilibrium, compatibility and stress-strain relations by this simplification will be solvable.
Plane stress as well as plane strain simplifies Eq. (3.26) by setting all shear stress components acting in the longitudinal direction to zero; thus eliminating the two last terms since lr = rl = 0, according to the theory of elasticity. Further the rotational symmetry implies constant stress conditions in the circumferential direction. That gives
r/ = / = 0 and the third, fourth, fifth and sixth terms eliminate each other. A small angle makes it possible to assume that sin( /2) tan( /2) /2 and Eq. (3.26) is reduced to.
0 02 2
rr r
r rl r r r rr
which through division with l and factorization of the parenthesis gives
2 0r rrrr r r r
r r
now the earlier undefined r is set to the element size r, the expression is divided by r r and the small term of r/r 0. This produces the simplified final radial equilibrium equation:
0rr
r r (3.27)
Compatibility Plane stress or plane strain is again addressed and the constant strain or stress in the longitudinal direction over an area in the r- plane may at a later stage be solved through the use of Poisson’s ratio, Young’s modulus and radial and circumferential stresses.
The 2D case in polar coordinates for all possible deformations is shown in Figure 3.16. As can be noticed in Figure 3.16, no circumferential displacements, v
, are possible in a rotationally symmetric system. Lengths of the arcs do however change but that is only due to the radial displacement u.
Based on the definition of engineering strain, (change in length divided by the total length), relations for the strain in the polar directions follows from Figure 3.16:
r
uu r uur
r rr u r u
r r
(3.28)

Mechanical Anchorage of Prestressed CFRP Tendons
74
r
r
u
uu rr
r u
r
Figure 3.16 Displacement of an infinitesimal element in a state of rotational symmetry
Stress-Strain Relations The expressions for stress-strain are necessary to connect the stresses in Eq. (3.27) with the displacement and deformation expressions in Eq. (3.28). They are found by substitution of cylindrical coordinates into Hooke’s generalized law so that the coordinate system (x,y,z) is substituted by the polar coordinate system (r, ,l).
1
11 1 1
11
r r l
r r
r l
l l
l l r
E
E E
E
(3.29)
In a case of plane stress, l = 0, Eq. (3.29) becomes
1
1
r r
r
E
E
(3.30)
l rE (3.31)
while for plane strain conditions, l = 0, it becomes:
1
1
r r l
r l
E
E
(3.32)

Force Distribution Analysis of a Wedge Anchorage
75
10 l r l rE (3.33)
Eq. (3.33) in Eq. (3.32) gives:
2
2
21
21
1 1 1 1 ...
11 1...1 1
1 1
r r r r
r r
r r r
E E
E
E
(3.34)
which is the same equations as Eq. (3.30) if
1 22 ;11
EE (3.35)
These variations only include material constants and the solution to the system of equations will therefore be valid for both plane stress and plane strain conditions with the substitution of E into 1 and into 2.
Differential Equation First a solution for plane stress is presented.
Eq. (3.28) in Eq. (3.30) and solution of the two variable system for radial and circumferential stresses give
2
2
11
11
rr
r
E du ududr rdr E
u E u dur E r dr
(3.36)
From this equation it is possible to see that the only parameters influencing the state of stress of the structure are the material parameters and radial geometry. The Eq. (3.36) is a combination of the compatibility conditions and stress-strain relationships, these combinations are now substituted into the equilibrium equation, Eq. (3.27).
2 2 2
1 01 1 1
d E du u E du u E u dudr dr r r dr r r dr
(3.37)
After division with the term E/(1- 2) independent of r, the resulting differential equation is reduced to:
2 2 0d du d u du u u dudr dr dr r rdr rdrr r
(3.38)

Mechanical Anchorage of Prestressed CFRP Tendons
76
which in turn through simple differential formulas, for example found in Råde & Westergren (2004), can be reduced to:
2 2
2 2 2 2 2 2 0d u du u du u u du d u du urdr rdr rdr rdrdr r r r dr r
(3.39)
Solution of the Differential Equation Eq. (3.39) is a homogenous second order differential equation with the general solution u = C1f(r) + C2g(r). This equation is explicitly possible to solve in the present shape. It can however more easily be solved through the recognition that the two last terms are the derivative of u/r with respect to r. This implies that Eq. (3.39) can be written as in Eq. (3.40). In the last step the sum within the parenthesis is exchanged for the derivative of ur with respect to r. Differential laws for quotients and products are used.
2
2
1 1 0d u d u d du d dr u urdr r dr r dr dr r drdr
(3.40)
Eq. (3.40) is now integrated twice with respect to r2
2
2 21 1
1 10 ...2
... ;2 2
d d d rur drdr ur C dr ur C Cdr r dr r dr
C Cr Cu C C r where Cr r
(3.41)
Substitution of Eq. (3.41) into Eq. (3.36) gives expressions for the radial and circumferential stresses in each point of the rotationally symmetric structure under plane stress conditions.
2 2 21 1 12 2 2
212 2
1 11 1
1 11
rC C CE d EC r C r C
dr r r r rCE Cr
(3.42)
For a solid circular shaft the radius in the centre is zero. For Eq. (3.42) to be valid, C2must equal zero as well. r and are then equal and independent of the distance where stress is sought for. The radial displacement does however vary linearly with the radial position according to Eq. (3.41).
The constants C1 and C2 have to be found before the derived equations can give any useful results. This is done through application of suitable boundary conditions explained in the next section.
Boundary Conditions A wide range of conditions can be utilized, see Figure 3.17, but they are all more or less difficult to achieve with a good accuracy.

Force Distribution Analysis of a Wedge Anchorage
77
r
iu
ouop
l
ip
Figure 3.17 Boundary conditions that may be used to achieve values on the constants from the solution of the differential equation
If a uniform radial stress on the inner, ri, or outer, ro, surface, pi or po, are known Eq. (3.42) may be used. In the case of the barrel in the wedge anchorage it is known that the outer pressure, pbo, is equal to zero.
212 20 1 1 0
1r bo bobo
CEr r p Cr
(3.43)
In a general case, where the pressures on the outer and inner surfaces are inserted as compressive variables, the solution can be expressed as in Eq. (3.44):
212 2
212 2
1 11
1 11
r i i ii
r o o oo
CEr r p C pr
CEr r p C pr
(3.44)
When the system of two equations with the two unknowns is solved the outcome is 22 2
1 22 2 2 2
1 1; i o i oi i o o
o i o i
p p r rr p r pC C
E Er r r r (3.45)
Inserted in Eq. (3.41) and Eq. (3.42) they give solutions for the radial deformation, radial stress and circumferential stress at an arbitrary point in the cylinder expressed in the outer and inner pressures. For plane strain conditions E and should now be replaced according to Eq. (3.35):
22 2
2 2 2 2
1 1r i o i oi i o or
ro i o i
r p p r rr p r pu r r
E Err r r r (3.46)
22 2
2 2 2 2 2
22 2
2 2 2 2 2
1
1
i o i oi i o or r
o i o i r
i o i oi i o or
o i o i r
p p r rr p r pr r
r r r r r
p p r rr p r pr r
r r r r r
(3.47)

Mechanical Anchorage of Prestressed CFRP Tendons
78
Also displacements or strains that are known may be used to find the constants C1 and C2; then through Eq. (3.41) for displacements and Eq. (3.30) or Eq. (3.31) for known strains. These variables may typically be known from measurements or from constrained displacements due to assumed rigid body behaviour of adjacent structures.
3.4 Application of the Thick-Walled Cylinder Theory In Section 3.1.4 the thin-walled approximation estimated the required thickness of the thinnest part of an anchorage to be 7.4 mm. Shaheen & Shrive (2006) however discarded that theory as inappropriate for a wedge anchorage and the minimum thickness should therefore be controlled in some other way, of which the thick-walled cylinder theory is one.
The theory may also be used to model stress distributions along the interfaces of the anchorage as the wedge is pushed into the barrel; thus creating deformations on itself as well as on the rod and barrel. An attempt to do this for a 10 mm setting of the wedge will be further described. For these calculations the anchorage named “original model” in the static rigid body analysis will be used.
3.4.1 Minimum Radial Barrel Thickness Maximum radial stress at the thinnest longitudinal section of the barrel that the original anchorage model, according to the static rigid body model, can reach is found through Eq. (3.23), Eq. (3.7) and Eq. (3.15). Fset can be replaced with Fpre and Nwb ,x is the radial force.
2
,2
( ) ( )( )
( ) ( )
N
mm
2 cos cos ...cos sin2
125700 cos 2 2966...1000.1cos 2 sin 2
b b
b b
prewb x wbi b wb b
bi l b wb bi l bbi l b
bi l bi l
FlN Np l l l l
r l r lr l
r r
(3.48)
l is the longitudinal section that the calculations are made in measured from the loaded end of the anchorage. lb is the length of the anchorage and the thinnest section of the barrel is at the distance lb from the loaded end. is the angle of the wedge-barrel interface and rbi(l) is the inner radius at position l of the barrel.
Outer pressure is equal to zero which included in Eq. (3.47) give the equation for circumferential stresses:
2 22 22
2 2 2 2 2 2 2 2
1; 0 i i o r i i oi i ir o
o i o i r r o i
p r r r r r rr p pr r p
r r r r r r r r (3.49)

Force Distribution Analysis of a Wedge Anchorage
79
Eq. (3.49) can be shown to have its maximum at the inner surface and is, with the subscript for barrel included, reduced to
2 2
,max 2 2; 0 bi bob bi bo bi
bo bi
r rr r p p
r r (3.50)
Here, in contrast to the thin-walled theory, either the inner or outer radius must be known to solve minimum thickness of the barrel. Since a rod with the radius of 4 mm is assumed in the thin-walled case, the same is used here. Furthermore, it may be assumed that 5 mm is a minimum thickness of the wedge, and a 2° angle on a 100 mm barrel makes another 3.5 mm. Summed up this creates an inner radius of the barrel of 12.5 mm in the unloaded end. With a yield stress, fy, of the steel of 400 MPa inserted in Eq. (3.48) the minimum outer radius of the barrel becomes:
2
2 2
2 2
NMPa = 1
mm
400 12.5112.52966 2966400 12.5 24.7 mm
400 12.512.5 12.5 12966
boy bo
bo
rf r
r
If the barrels outer radius rbo=24.7 mm is subtracted by the inner radius, rbi, it gives the thickness of 12.23 mm, which is 5 mm thicker than the thin-walled theory gave in Section 3.1.4. By taking uneven stress distribution into account the higher circumferential stresses obtained at the inner surface can be obtained. It should however be remembered that both this calculation and the one for the thickness with the thin-walled theory are based on forces obtained through the 2D static rigid body model. To use that model to obtain the necessary forces is however a simplification that creates larger forces than in reality. Those exaggerated forces are then also doubled to account for the desired longitudinal distribution of the radial forces onto the rod which is described in Section 3.1.4.
3.4.2 Setting of Wedge
Axial symmetry
Loaded end
Barrel
Wedge Rod
l
r
Figure 3.18 Design of the anchorage that will be used during the evaluation of stresses
In this section the anchorage that through assumptions has been created during the derivation of the 2D static rigid body model and the thick-walled cylinder theory will be analyzed. Its final scaled design is shown in Figure 3.18 and the values on geometrical and mechanical properties for each part are found in Table 3.4. Young’s

Mechanical Anchorage of Prestressed CFRP Tendons
80
modulus, Possoin’s ratio and yield strength for each material are taken from Elfgren & Vikström (1999), Boverket (2003) and Miyagawa et al. (2006).
Table 3.4 Geometrical and mechanical properties of the wedge anchorage in Figure 3.18
ri (l = 0)
[mm]
ri (l = 100)
[mm]
ro (l = 0)
[mm]
ro (l = 100)
[mm]
l
[mm] [°]Material
Er
[GPa]r
[-]
fy
[MPa]Rod - - 4.0 4.0 - CFRP 10 0.30 -
Wedge 4.0 4.0 9.0 12.5 100 2.0 Aluminium 70 0.34 145 Barrel 9.0 12.5 24.7 24.7 100 2.0 Steel 210 0.30 400
During setting of the wedge, which is during its motion into the barrel, a radial displacement of all surfaces occur. These displacements are not known and neither are their relations to each other in size. Relations for the displacement for each surface of each part are therefore necessary. The equations are based upon Eq. (3.46) and related through five geometrical equations that will be derived in the following sections.
Initially a set of the wedge is assumed. This set is of the magnitude l and in the negative longitudinal direction, see Figure 3.19. In this state three radial positions of the interfaces between the materials can be found for each point along the longitudinal axis, they are denoted, n1, n2 and n3 for the rod-wedge, wedge-barrel and outer barrel interfaces respectively. Similarly three radial force components can be found at each longitudinal point, p1, p2 and p3. In Figure 3.19 all positions and forces are defined for the longitudinal position of lb - l where lb is the length of the barrel.
Barrel
Wedge Rod
l
r l
n3
n2 n1
p3
p2
p1
Figure 3.19 Definition of radial positions and forces at the interfaces of the wedge anchorage after setting of the wedge with a distance of l
Derivations for the equations governing the displacement of the parts from an initial radius, rxy, where x = r,w,b (rod, wedge, barrel) and y = i,o (inner face, outer face), to the final position, n, follow the same principle independent of interface. Assumed that the deformed radiuses of the parts would have been the original ones a force would be required to deform them. That force would, if they are to be deformed to the radius they actually have, be equal in size but in the opposite direction to the now arising radial force. This is true as long as the materials are linearly elastic with the same

Force Distribution Analysis of a Wedge Anchorage
81
modulus of elasticity both in compression and tension. Further details of the derivations are given in the following section.
Rod
After setting
p1
p1
rro n1
uro
Before setting
Figure 3.20 Deformation of rod during setting of the wedge
With the notation and direction of the displacement, uro, as in Figure 3.20 the following equation can be written:
1ro rou r n (3.51)
Based on the reasoning in the previous section the displacement should be interpreted as a displacement opposite to the one that the rod actually experienced during setting of the wedge. Due to the nature of a rod with a non-existing inner radius Eq. (3.46) can be reduced to
21 1
1 1 1 12
1 1, 0, r ro
ro i or o r
n r pu r n r p p n pE r E
(3.52)
Wedge
After setting
p2
uwo
p2
rwo
Before setting
n1
n2
rwi
uwi
p1
p1
Figure 3.21 Deformation of wedge during its setting

Mechanical Anchorage of Prestressed CFRP Tendons
82
For the inner face of the wedge the following two equations can be derived based on Figure 3.21 and Eq. (3.46):
1wi wiu n r (3.53)
1 1 2 1 2
22 21 1 2 1 21 1 2 2
2 2 2 212 1 2 1
2 2 2 2 212 2 1 1 1 2 22 2
2 1
, , , , ...
1 1... ...
... 2
wi i o i o
w w
w w
w ww
u r n p p p p r n r n
n p p n nn p n pE E nn n n n
n p n p n n n nE n n
(3.54)
For the outer face the same equations are as follows:
2wo wou r n (3.55)
2 1 2 1 2
22 22 1 2 1 21 1 2 2
2 2 2 222 1 2 1
2 2 2 2 222 2 2 1 1 1 12 2
2 1
, , , , ...
1 1... ...
... 2
wi i o i o
w w
w w
w ww
u r n p p p p r n r n
n p p n nn p n pE E nn n n n
n p n n n n p nE n n
(3.56)
Barrel
After setting
p3 = 0ubo
p3 = 0
rbo
Before setting
n2
n3
rbi
ubi
p2
p2
Figure 3.22 Deformation of barrel during setting of the wedge
Based on Figure 3.22 and on the knowledge that the exterior pressure on the barrel is zero the following two equations can be derived for the barrels inner surface:
2bi biu n r (3.57)

Force Distribution Analysis of a Wedge Anchorage
83
2 2 2 3
222 2 2 32 2
2 2 2 223 2 3 2
2 22 22 32 2
3 2
, , 0, , ...
1 1... ...
... 1 1
bi i o i o
b b
b b
b bb
u r n p p p r n r n
n p n nn pE E nn n n n
p n n nE n n
(3.58)
For the outer face the same equations are as follows:
3bo bou r n (3.59)
3 2 2 3
2 223 2 2 3 2 3 22 2
2 2 2 2 2 233 2 3 2 3 2
, , 0, , ...
1 1 2...
bo i o i o
b b
b b b
u r n p p p r n r n
n p n n p n nn pE E nn n n n E n n
(3.60)
Solution of the System of Equations After assembly of the 10 resulting equations a system of ten unknowns can be put together as follows:
Equations Unknowns
1. 1 1
1 rro
r
u p nE
1 1, ,rou P n
2. 1ro rou r n 1,rou n
3. 2 2 2 2 2 12 2 1 1 1 2 2 2 2
2 1
2wi w ww
nu p n p n n n nE n n 1 2 1 2, , , ,wiu P P n n
4. 1wi wiu n r 1,wiu n
5. 2 2 2 2 2 21 1 2 2 2 1 1 2 2
2 1
2wo w ww
nu p n p n n n nE n n 1 2 1 2, , , ,wou P P n n
6. 2wo wou r n 2,wou n
7. 2 2 2 22 3 2 2
3 2
1 1bi b bb
p nu n nE n n 2 2 3, , ,biu P n n
8. 2bi biu n r 2,biu n
9.2
2 3 22 23 2
2bo
b
p n nuE n n
2 2 3, , ,bou P n n
10. 3bo bou r n 3,bou n
At this point the solution of the nestled equations turns into a complex problem. To solve this is a subject for future research. It is complicated due to the many variables

Mechanical Anchorage of Prestressed CFRP Tendons
84
involved and their positions in the equations. If the equations would have been linear the solution could have been done with simple gauss elimination. As it is now with squares and products of variables the solution must be sought in other ways.
In Chapter 6, in the evaluation of the measurements performed on the anchorages in the laboratory tests, the derived equations are used to find the longitudinal distribution of pressure on the rod. They are possible to use in that purpose since the strain on the outer surface of the barrel is known, and consequently the deformed radius n3.

Numerical Model
85
4 Numerical Model
Numerical modelling is today an established method of design. The theory behind it is based upon well known equations derived from equilibrium, compatibility and constitutive relationships. To create a model the structural element is divided into several finite elements which if they are few enough allow calculations by hand. This is however mostly an exception. Most simulations are computerized but even then the number of finite elements must be minimized to decrease the time of analysis, which otherwise may stretch over days up to, in worse cases, weeks. The drawback with a lower amount of finite elements, from now on named “elements”, is the decrease in accuracy of the result. An element has constant properties and is only affected by boundary conditions at its nodes and as fewer elements mean larger elements the model will be less detailed. This together with the difficulties in finding all the exact geometrical and mechanical properties introduces uncertainties to various degrees into the numerical model.
Finite element modelling is in spite of the possible uncertainties a powerful tool in structural investigation and design. Results must however be seen upon with a clear view. Instead of being a tool to find the exact stress or strain it is a strong tool for estimating a design load, or as in the case of this thesis; to roughly investigate the importance of interesting geometrical and material properties on the wedge anchorage’s capability to grip the rod.
4.1 Anchorage Models in Literature Modelling of these types of anchorages has to some extent been done before by a Canadian team of researchers. They have tried a number of different approaches with

Mechanical Anchorage of Prestressed CFRP Tendons
86
an initial 2D design that has been further developed into axisymmetric and 3D models. Their aim, in contrast with the aim of the model in this thesis, has been to investigate the state of stress in an already developed anchorage.
4.1.1 Axisymmetric
Figure 4.1 Upper: Axisymmetric model; Lower: Stresses acting on the CFRP rod in an ultimate state, Sayed-Ahmed (2002)
This type of model is the most widely used. Simplicity is the main reason as it requires the same input as a 2D model but then out of this is able to create a body in three dimensions. By rotation of the 2D depiction around a central axis a body with the same properties all 360° is created. This is a favourable way of modelling for example tubes and other circular structures. It can also be used to model a wedge anchorage. In such a case it must however be remembered that the wedges are also modelled as a tube without the spacing.

Numerical Model
87
Sayed-Ahmed & Shrive (1998) were perhaps the first team of researchers to utilize this type of model for the evaluation of wedge anchoring of CFRP rods. They analyzed an anchorage with steel in both the barrel and the wedges. In the first of two models the steel was modelled as linearly elastic with Young’s modulus and Poisson’s ratio 200 GPa and 0.33 respectively. In the second model an initial yield at 862 MPa and a yield plateau at 1000 MPa were included. The CFRP rod was set to be orthotropic with Young’s modulus 147 GPa in the longitudinal direction and 10.3 GPa in the transverse while Poisson’s ratios were 0.27 and 0.02. Shear modulus were in both directions set to 7.2 GPa. For friction a constant value of 0.5 was used between the rod and the wedge and between the wedge and barrel the friction was set to 0.05. The model, as it is presented in Sayed-Ahmed (2002), can be seen in Figure 4.1 together with the forces acting on the rod after it reached its maximum stress of 2250 MPa.
In the model a difference in angle between the barrel’s inner surface and the wedge’s outer surface is included, further discussion of the theory behind that can be found in Chapter 2 and 3. By varying this difference a conclusion was made that an optimum lies between 0.05 and 0.15°. With a larger difference no radial pressure at all would be apparent in the tensed part of the rod and with a smaller difference the pressure would be too high.
Figure 4.2 Axisymmetric FE-model with the sleeve included, Al-Mayah et al. (2001b)
Campbell et al. (2000) made a short survey of what the results from Sayed-Ahmed & Shrive (1998) and their own earlier models of the anchorage with difference in angle have given so far. All the models use axisymmetric analysis with linearly elastic steel barrels and steel wedges. The rod has been orthotropic and the frictions constant. Soudki et al. (1999) in addition to this also included a soft metal sleeve between the rod

Mechanical Anchorage of Prestressed CFRP Tendons
88
and the wedges and a friction that varies with contact pressure. After being divided into elements the axisymmetric model appeared as in Figure 4.2.
Figure 4.3 Results from analysis of an axisymmetric model. Upper: Effect on longitudinal and radial stresses along the rod due to variation in barrel-wedge friction; Lower: Effect on rod displacement due to variation in presetting force, Campbell et al. (2000)
Based on the survey mentioned above it was concluded that the optimum difference in angle should be around 0.1°. It was also concluded that the search for minimal friction between the barrel and the wedges may lead to an unexpected result. At some level of friction it becomes obvious that only a part of the anchorage is used for the transfer of longitudinal force, see the left part of Figure 4.3. Radial stresses must then be larger along the force transferring length which may lead to transverse crushing of the rod.
From the right part of Figure 4.3 the displacement of the rod in relation to the barrel during the tensile phase can be noticed when different presetting forces have been used. A high presetting force results in a higher stiffness of the system and consequently loses less of the tensile forces to seating of the anchorage.

Numerical Model
89
Al-Mayah et al. (2001a & b) follow up with further development of the model created in Soudki et al. (1999). The division of elements and boundary conditions is shown in Figure 4.2. For barrel-wedge friction 0.07 was used, for wedge-sleeve 1.0 and for sleeve-rod the coefficient varied linearly between the load steps from 0.16 to 0.3. Material properties were the same as for Sayed-Ahmed & Shrive (1998) with the additional properties for the aluminium sleeve which had a Young’s modulus of 68.9 GPa, a shear modulus of 26 GPa and a Poisson’s ratio of 0.35. For tensile loading, in the steps following the presetting phase a rate of 0.25 mm per loading step was used until the ultimate design load (104 kN) of the rod was reached.
Concerning stress distributions along the rod Al-Mayah et al. (2001a) reach the same conclusions as previously mentioned analyses. In addition to those results the new outcome is compared to laboratory tests and also used as a part in a minor parametric study. Figure 4.4 shows the numerical versus the experimental displacement curve when a presetting of 65 kN is used. The agreement is impressive.
Figure 4.4 Comparison between numerical and experimental displacement curves, Al-Mayah et al. (2001b)
Parameters that are investigated are the presetting force and the frictions in the barrel-wedge and sleeve-rod interfaces. They are investigated in relation to the rods longitudinal displacement in the unloaded end at a tensile force similar to the rods ultimate strength. Results from the variation of presetting are exactly the same as in the right part of Figure 4.3. It is probable that Campbell et al. (2000) and Al-Mayah et al. (2001a) use the same results and thereby also can come to the same conclusion, that a higher presetting force results in less displacement. Friction between barrel and wedges had close to zero effect on the slip/displacement behaviour of the rod. The friction between the sleeve and rod did on the other hand produce major differences. Four spans of friction were used with starting values of 0.1, 0.16, 0.20 and 0.25, and a common final value after load stage 15 of 0.3. The rod only experienced a

Mechanical Anchorage of Prestressed CFRP Tendons
90
displacement of 0.1 mm if the highest starting value of 0.25 was used. This should be compared to the 2.5 mm slip experienced by the rod if the lowest starting value was used.
Altogether it can be concluded that it is possible to reach a good description of the laboratory tests with an axisymmetric model, (this statement is however questioned in the next section). It is also stated that larger friction between the rod and sleeve and a high presetting give less slip and displacement of the rod.
4.1.2 3D
Figure 4.5 Model to analyse the theory of variable barrel thickness, Al-Mayah et al. (2005a)
3D models generally demand heavier calculations and are also more demanding to build up. Researchers that utilize 3D models have therefore often already considered or tested a 2D analysis before they start to construct and evaluate the 3D version. If the structure is symmetrical in some way a large 3D model can be decreased in size through cuts in the symmetry planes. Such cuts require well defined boundary conditions, such as free space or constraints as consequences of the removed parts. The wedge anchorage is in that sense a good structure for division into symmetric parts; the number of wedges determines how many degrees of the structure that should be included in the model. Al-Mayah has used 90° in two papers to analyse two different barrel designs with four wedges in the anchorage.
Table 4.1 Material properties used in FE-model, (Al-Mayah et al.2005a & 2007)
Rod Sleeve Wedge Barrel
Material CFRP Copper Steel Steel Longitudinal Elastic Modulus [GPa] 124 117 200 200
Transverse Elastic Modulus [GPa] 7.4 117 200 200 Longitudinal Shear Modulus [GPa] 7.0 44.7 77 77
Transverse Shear Modulus [GPa] 7.0 44.7 77 77 Major Poisson’s Ratio [-] 0.26 0.31 0.3 0.3 Minor Poisson’s Ratio [-] 0.02 0.31 0.3 0.3

Numerical Model
91
In Al-Mayah et al. (2005a) a barrel with variation in thickness is evaluated. The theory behind that anchorage is that the thinner barrel in the tensed part of the anchorage should result in less confining pressure on the wedges and thus also less radial pressure on the rod in those parts, see Figure 4.5. Barrel and wedges are made of steel while the sleeve is made of copper and the rod in orthotropic CFRP. No comment on whether the metals are modelled as elastic or plastic is provided. Table 4.1 provides the material properties used.
Boundary conditions were divided into constant and variable conditions. Rod faces {ardrcrbr and brcrfrer}, sleeve faces {ascs and bsds} as well as barrel faces {abdbcbbb and ebhbgbfb} in Figure 4.6 are all constrained in the circumferential direction. The barrel is also constantly constrained on face {abdbebhb} in the longitudinal direction. Variable conditions exist on the larger face of the wedge as a pushing force in the longitudinal direction during presetting. This force is during the tensile phase removed and replaced by a tensile force acting on face {arbrcr}.
Figure 4.6 Basis for definition of boundary conditions, (Al-Mayah et al.2005a & 2007)
Coefficients of frictions are somewhat different compared to the earlier axisymmetric models performed by Al-Mayah. The barrel-wedge interface friction coefficient is set to 0.0-0.02 while the wedge-sleeve interface is set to 0.4 and the sleeve-rod to 0.24, based upon laboratory tests.
In a first step the anchorage with variable barrel thickness is modelled only during presetting. Presetting distances of 2, 5, 8 and 11 mm on barrels with barrel thickness reductions of 0, 7 and 15 mm were analyzed. The results show that the radial pressure decreases in the loaded end of the rod, as expected. This decrease is not as apparent for a presetting of 2 mm as for one with 11 mm. In the later case the radial pressure decreased from a maximum of 700 MPa to 500 MPa close to the end. The second step analyzed the anchorages concerning displacements and shear stresses when the rod had

Mechanical Anchorage of Prestressed CFRP Tendons
92
been pulled to an ultimate stage. A lower shear stress due to the lower radial stress in the anchorages reduced with 15 mm resulted in a lower tensile capacity and larger slip of the rod.
Al-Mayah et al. (2007) uses the same material and frictional properties as in Al-Mayah et al. (2005a). Geometrical properties of the barrel are however changed. Instead of the variable thickness concept the design now consists of an anchorage where the barrel-wedge interface has a radius. This can be seen in Figure 2.31, and the idea is again to reduce radial stresses in the loaded end of the rod. Four different radii are used. 1650, 1763, 1900 and 2100 mm. Results shown in Figure 4.7 are mainly from the anchorage with a radius of 1900 mm since that laboratory test gave the highest failure load. It can be noticed in Figure 4.7 that the maximum radial pressure is significantly shifted towards the unloaded end of the rod compared to how the radial stresses varied along the rod in Figure 4.1 and Figure 4.3. The same behaviour is observed also for the other radii but with the most advantageous distribution for a radius of 1900 mm.
Tensile loading was then performed in 0.5 mm steps, after a presetting of 0.5 mm, on the 1900 mm radius anchorage. Results from this analysis can be seen in the left part of Figure 4.8 where the load-displacement curve also is compared to experimental results. An interesting feature of this is how the curvature has changed from a convex shape in Figure 4.4 to a concave shape. This can only be due to the difference in shape. That they differ largely also in the size of displacement is probably due to a lower presetting force in this case.
Figure 4.7 Left: Radial stress along the anchorages length and along its 90° interface with the rod for a presetting distance of 11 mm and wedge radius of 1900 mm; Right: Variation of radial stresses along the rod for wedges with radius 1900 mm and presetting distances of 2, 5, 8 and 11 mm

Numerical Model
93
Figure 4.8 Left: Comparison of load-displacement curve from FE-model with experimental tests performed on wedges with radius 1900 mm and presetting distance 0.5 mm; Right: Comparison of radial stresses from 3D and axisymmetric models of the anchorages with 1900 mm radius and presetting of 8 and 11 mm
In Al-Mayah et al. (2007) results from an axisymmetric model are also incorporated, see Figure 4.8. Based on the comparison to the 3D model and that the axisymmetric model experienced slip, which was not found in the experiments, a conclusion is made that it is necessary with 3D models to analyze wedge anchorage problems. This is explained by the constraint in radial force distribution that the axisymmetric one-piece-wedge applies to the model through its arching capability. Further investigations of this phenomenon are done in Section 4.2.1. The statement does however question the reliability of earlier results presented in Al-Mayah et al. (2001a & b), Figure 4.4.
4.2 New Model
Figure 4.9 Preliminary laboratory tests with a straightforward anchorage design
In search of a more optimized anchorage than the ones presented in Chapter 2 some preliminary laboratory tests on an anchorage with the simplest design were performed. The anchorage consisted of a steel barrel and three aluminium wedges. It was 100 mm long and 60 mm in diameter, see Figure 4.9. This anchorage did not fulfil the

Mechanical Anchorage of Prestressed CFRP Tendons
94
requirements and slip was almost immediately experienced after loading began. Improved performance was definitely desirable. To facilitate this improved design it was necessary to perform a parametric study, which, if done in laboratory would have been very costly. The choice then became a more thorough parametric study through FE-modelling than performed in previous literature.
An initial model based on the produced anchorage is built in the FE-software “Abaqus” to facilitate the evaluation. This model is tested so that density, friction and other properties are satisfactory concerning the output quality. Once this has been done the model is tested with lower friction coefficients between the rod and wedge until it finally can’t handle the pulling force anymore. By using the smallest possible friction and varying some factors, that are also possible to vary in reality, it is possible to see if these changes allow for larger forces or if they increase the risk of slip.
4.2.1 General Approach Table 4.2 Material and frictional parameters in the design used to evaluate different types of models
Rod Wedge Barrel
Material CFRP Aluminium SteelElastic Modulus [GPa] 165 70 210
Poisson’s Ratio [-] 0.26 0.34 0.3 Friction [-] Sticking Frictionless
As a first step it was necessary to decide upon which type of model to use. Three different implicit models, kept as simple as possible were put together. One 2D with thickness set to 1 mm, one axisymmetric and one 3D with the complete anchorage included. Material properties and type of friction between the different parts can be seen in Table 4.2.
Barrel Wedge Rod
2D 3D Axisymmetric
Figure 4.10 Division of radial forces from the barrel-wedge interface into interior circumferential and radial forces in the different type of models
Before the analysis began a theory based on the force distribution shown in Figure 4.10 was developed. In a 2D model all radial forces acting on the exterior of the wedge will continue as radial forces also into the rod. In a 3D model some of the exterior radial

Numerical Model
95
forces will be handled by circumferential friction on the wedge’s contact surfaces while the remaining force is transferred into the rod as radial stress. An axisymmetric model should transfer even more of the forces in the circumferential direction due to the arching behaviour and thereby exert the smallest radial pressure onto the rod.
In addition to the different types of model three different mesh densities were evaluated for the 3D model, since it was suspected that this would be the one to use. Medium density was also chosen for the 2D and axisymmetric models; this meant an element length of 2.5 mm in the longitudinal direction. Coarse and fine meshes had element sizes of 3.5 and 1.5 mm respectively. Results from this analysis can be seen in Figure 4.11, which corresponds well to theory and the mesh chosen to continue further with is that of middle density.
0 50 100 150 200
Distance along CFRP rod [mm]
-600
-400
-200
0
Rad
ial s
tress
on
CFR
P ro
d [M
Pa]
Axisymmetric3D Coarse3D Fine3D Middle2D
F
Figure 4.11 Radial stress on the rod due to a pulling force, F, for the different types of models and mesh densities
These first analyses had the simplest interface properties between components, sticking and frictionless. To facilitate more complex frictional behaviour and to model the orthotropic behaviour an explicit solution was chosen. An explicit solution technique differs in some major aspects to the implicit technique. In the implicit dynamic solution each time increment relies on the inversion of the operator matrix and solution of a set of non-linear equations, which makes each increment rather expensive in the sense of computational costs. The implicit solution does also due to the iterative process have problems to solve complicated contact problems. Explicit solutions do unlike the implicit solutions use known values on involved quantities, derived with the central-difference method. Computational costs for each increment is with the explicit method therefore, compared to the implicit method, substantially lower. The lower incremental cost is however balanced with a limited allowable length of each time increment. For the central-difference method to be stable the time increment must be shorter than the minimum time required for a stress wave to pass through an element in the model. Each element in the model facilitates different time lengths for the passage and the governing element is the element that facilitates the shortest time. Generally the two

Mechanical Anchorage of Prestressed CFRP Tendons
96
most crucial variables in that sense are the size of the elements and the density. With a small size and high wave speed created through a low density one single element can create computational times that are several times longer than after removal of that particular element. A common solution to the problem with a large number of increments, and to decrease the total computational time, is to increase all densities with an integral number of powers of ten. The limit for how large the mass scaling can be can in a semi-static solution practically be investigated throughout the analysis by a comparison between the kinetic and strain energies developed within the model. If the densities are too large the kinetic energies will increase and the strain energies decrease at the same time as they start to show an unstable tendency.
Table 4.3 Evaluation of the effect of mass scaling in an explicit solution
Vertical
displacement Kinetic energy Strain energy
Time
[hh:mm]
102 14:40
103 4:40
104 1:42
105 0:45
106 0:15

Numerical Model
97
Table 4.3 shows an evaluation of this mass scaling. The anchorage with a medium dense mesh and the same properties as before, but with an explicit solution was used. For each power of ten that the densities are increased a picture of the displacement in wedges, kinetic energy diagram, strain energy diagram and time of computation are tabled.
Based on the results from the mass scaling evaluation it was decided to use a scaling factor 103, this corresponds to densities a thousand times greater than the actual. For that case the kinetic energy remains minimal and the strain energy reaches the same level as in the case for 102. No analysis of the anchorage with original densities was performed since that would have occupied the computer for 144 hours. Once more complex interface properties and orthotropy are applied the time increases even further.
A comparison between implicit and explicit results for this simple anchorage setup showed no difference in the average stresses. Stresses from the explicit solution did however fluctuate more around the average stress curve along the rods length.
4.2.2 Initial Design Results from Section 4.2.1 can be summarized as follows:
3D model Explicit solution 103 times mass scaling Medium dense element mesh
Next a more detailed model was adopted concerning, geometrical, material and interface properties. Also the loading and boundary conditions are revised to better model the initially produced anchorage. This anchorage serves as the basis for the parametric studies and the properties are thoroughly described in the following sections.
Geometry Three parts are used, rod, wedge and barrel. They are then assembled to create a model. All dimensions are in SI-units on a meter basis, with this in mind consistency with dimensions on material properties and loads are easy to maintain.
Barrel
Four dimensions are necessary to define the geometry of the barrel. They are the length, lb, the thickness in the thick and thin ends, tb,1 and tb,2, respectively and the outer diameter, db.
lb
dbtb,2
tb,1
lb 0.1tb,1 0.0155 tb,2 0.0095 db 0.0612

Mechanical Anchorage of Prestressed CFRP Tendons
98
Wedge
Wedges are also defined by four dimensions, length, lw, thickness in thin and thick ends, tw,1 and tw,2,respectively and how many degrees of a 360° circle the piece covers, w. In this case three wedges were used.
Rod
For the rod all that is necessary to know is the length, lr, and the diameter, dr.
Assembly
Figure 4.12 Assembled model
After assembly the model appears as in Figure 4.12 with a 10° gap between the three wedges, a 0.03 m protrusion of the rod in the unloaded end and 0.07 m protrusion in the pulled end.
MaterialThree different materials are used in the anchorage model; steel for the barrel, aluminium for the wedges and CFRP in the rod. For both metals an initial assumption of linear elastic behaviour was soon discarded due to the unexpected high stresses reached. They were then instead modelled by stress-strain curves defined point by point and linearly connected, see Figure 4.13. The later case is the one shown here.
lw 0.1tw,1 0.01025 tw,2 0.01625
w 110°
tw,2tw,1lw
w
lr
dr
lr 0.2dr 0.0097

Numerical Model
99
0 0.05 0.1 0.15Strain [μm/m]
0
300
600
Stre
ss [M
Pa]
CFRP longitudinal CFRP transverse
Steel
Aluminium
Figure 4.13 Material models used for the initial design
Steel
Equations from Elfgren & Vikström (1999) are used to model the characteristic curve for the steel. Isotropic steel with yield and ultimate strains of 355 and 490 MPa respectively is used with the initial elastic modulus of 210 GPa. Poisson’s ratio is set to 0.3 and the density 7800·103 kg/m3.
Aluminium
Natural aged isotropic aluminium of type 7020, according to ISO standards, with yield strength 145 MPa and an A5 value of 12 % form the basis for the aluminium model. This then is further described according to equations in Boverket (2003). Young’s modulus and Poisson’s ratio are 70 GPa and 0.34 while the density is set to 2700e3 kg/m3.
CFRP
Rods are modelled as orthotropic with one characteristic curve working in the longitudinal direction and one in the radial. Both directions are assumed to be linearly elastic with the same Poisson’s ratios, 0.3, and shear modules, 3.85 GPa, from Miyagawa et al. (2006), but with different Young’s modulus’. For the fibre direction the tensile longitudinal modulus is used since it is mainly this direction which will experience tension. In the radial direction the compressive transverse modulus is used since it is this direction which will mainly experience compression. They are set to 165 and 10 GPa respectively, based on the manufacturer’s knowledge. The density is 1610·103 kg/m3.
InterfacesTwo types of interaction are necessary, one for the barrel-wedge interface and one for the wedge-rod interface. Both are modelled with an exponential decay of the friction

Mechanical Anchorage of Prestressed CFRP Tendons
100
as the individual finite element starts to slip and the static friction becomes kinetic. In the wedge-rod interaction the static friction coefficient is 0.1 and the kinetic 0.09 with a decay coefficient of 0.25, which are commonly accepted coefficients for friction between lubricated metals.
For the wedge-rod interface an iterative process was used to find the minimum friction necessary to grip the rod until a final tensile stress of 2500 MPa was reached. The resulting frictions are 0.23 for the static and 0.2 for the kinetic friction with a decay coefficient of 0.1. These results correspond well to the initial coefficient found by Schön (2004a) but not to the coefficient that can be found after repeated wear of the CFRP. In neither of the two interfaces is any consideration taken to the increased coefficient due to increased normal stress as is described in for example Al-Mayah et al. (2001a & b) and Javadi & Tajdari (2006).
Boundary Conditions Three boundary conditions are applied. The first prevents longitudinal motion in the outermost 75% of the barrels thick end (the loaded end), see Figure 4.14. 75% is chosen to simulate that the support probably wont support the entire face but will have an opening large enough to also facilitate some misplacement of the anchorage. The second and third conditions are applied at the outer edge of the same face with a 90° gap in between. They restrict motion of that point along the axis they are positioned at. While the first boundary condition prevents the barrel from motion in the longitudinal direction, the last two prevent the entire system from rotation and rigid body motion.
Figure 4.14 Left: Boundary conditions; Right: Loads
LoadingAt this point the model is divided into two steps, one where a 10 kN compressive load is applied at the thick face of the wedges. That is the presetting step. The second step is the loading step and the 2500 MPa load is then applied as tension in the rod. Both loads are distributed uniformly on the faces, see Figure 4.14, and they increase linearly during computation of the step that they are active in.
Horizontal
Longitudinal
Vertical
Step 1
Step 2

Numerical Model
101
4.2.3 Element Distribution Meshing is built around two framing conditions which rule further element division of the parts. The first is a circumferential division of the structure into 36 sections, each covering 10°. The second is a longitudinal division of the parts into 0.01 m long sections. In all cases explicit 3D-stress elements with a linear geometrical order were used with reduced integration when possible.
Figure 4.15 Mesh on barrel, one wedge and the rod (parts are not in the same scale)
Final shapes of the meshes can be seen in Figure 4.15. During the parametric study these shapes are only differed in size, and then by the same amount for each element.
Barrel
Longitudinally the barrel is divided into 0.005 m long sections by cutting the general section length in half. Radially it is divided into three sections with their size increased towards the outer face of the barrel. All elements in this part are hexagonal 8 node linear brick elements.
Wedge
Longitudinal meshing on the wedge is further refined to 0.0025 m long sections. In the radial direction 3 sections are used with a larger size towards the exterior edge. This is similar to the barrels mesh. All elements here are 6-node linear triangular prism elements.
Rod
This mesh design is adopted to decrease the number of elements used but still keep up the good resolution of the results. In the first 5 cm of the loaded end and the last 2 cm in the other end the longitudinal element size is 0.01 m. These parts end up outside the barrel after assembly. For the remaining 13 cm the size is 0.0025 m. In the radial direction an outer layer with thickness 0.00165 m is assigned hexagonal 8-node linear

Mechanical Anchorage of Prestressed CFRP Tendons
102
brick elements. Internally the rod is meshed with a best fit design which randomly assigns hexagonal, wedge and tetrahedral elements. All elements are however bounded by the longitudinal restrains.
Since meshing of the parts outer and inner surfaces are governed by the general element division the computational nodes in the element corners on these surfaces will coincide after assembly. That they coincide minimize the risk of overclosure and excessive initial strains in the model.
4.3 Parametric Study Based on the original finite element model of the wedge anchorage described above nine different parameters were studied. The parameters have been investigated as to how they affect the longitudinal displacement of the wedges and the longitudinal slip in the wedge-rod interface, see Figure 4.16.
Figure 4.16 Values used to evaluate variations in the parametric study
Original displacement and slip are tabulated in Table 4.4. A small total displacement of the rod in relation to the barrel is an advantageous result. In the original model this total displacement is 9.56 mm with the larger part originating from the slip of the rod. This slip only measures the actual slip while the displacement of the wedge both considers the slip and strains present.
Table 4.4 Comparable values from the original model
[mm] Wedge to barrel displacement Rod to wedge slip TotalOriginal model 3.16 6.4 9.56
Anchorage Length Three different lengths of the anchorage were analyzed; 150 and 50 mm together with the original 100 mm anchorage. Each anchorage had the same outer diameter of the barrel, 0.0612 m, and the same thicknesses in the ends of the barrel and wedges, Figure

Numerical Model
103
4.17. This results in differing internal angles between the anchorages. Meshing is done as in the original model, based on size, contrary to a possible case where the mesh is decided by the number of elements along a line. More elements are thereby used in the longer anchorage and fewer in the short one. Using this technique an equal resolution of the results is kept between the models.
As expected the larger frictional area of the long anchorage gave less slip while the short anchorage could not resist the applied force. The later analysis ended with a final slip of the rod out of the anchorage before the rod’s ultimate load could be reached. For the long anchorage no value on the slip was achieved since the solution became too time and work consuming. It could without the final value be concluded that the longer the anchorage, the better the grip.
Figure 4.17 150, 100 and 50 mm long anchorage models
Number of Wedges The three wedge design used for the original model was chosen based upon the design of traditional anchorages for steel tendons. It could in addition also be interesting to see how the force transfer works with either 2 or 4 wedges. 2 wedges would be easier to handle but a stress distribution closer to the axisymmetric case, Figure 4.10, can be suspected, with the result of lower gripping force and higher total slip. In the 2 wedge case each wedge covered 170° with 10° of gap in between. For the 4 wedge case 80° wedges with 10° gaps were used.
Table 4.5 Slip resulting from the variation of number of wedges
[mm]Wedge to barrel displacement Rod to wedge slip Total
2 wedges - infinite - 4 wedges 2.71 3.7 6.41
Table 4.5 shows that 2 wedges resulted in less ability to handle the pulling force while the 4 wedge system resulted in significantly less slip. The decrease was close to 30 % compared to the original model.

Mechanical Anchorage of Prestressed CFRP Tendons
104
Wedge Material In the original model aluminium with yield strength 145 MPa and an A5 of 12% was used. Three more materials were also analyzed. One with the lower yield strength of 115 MPa and an A5 of 15%, one with the values 205 MPa and 12%, and one with 270 MPa and 6%. Results from the variation of the wedges’ material properties shown in Table 4.6 reveal no improvement of the total displacement compared to the original model irrespective of whether the material has higher or lower yield strength. It is however interesting that the softer aluminium grip the rod better while the harder ones result in larger slips of the rod. These differences are counteracted by the wedges ability to compress and displace out of the barrel.
Table 4.6 Slip resulting from the variation of the aluminium’s material properties
[mm]Wedge to barrel displacement Rod to wedge slip Total
115/15 4.93 5.5 10.43 205/12 2.49 7.8 10.29 270/06 2.43 7.5 9.93
Barrel Material Steels are defined by yield strength and an ultimate strength. In the original model steel with the yield strength of 355 MPa and ultimate strength of 490 MPa was used. This material was compared to one softer material with strengths of 235 and 340 MPa and one harder with the strengths 460 and 530 MPa respectively.
Differences between the types of steel have minimal effect on the rod’s slip as Table 4.7 show. A slight improvement may be seen for the softer material. That the yield strength has such small effect may be due to the barrel’s thickness. This is investigated later in this parametric study.
Table 4.7 Slip resulting from variation of the steel’s material properties
[mm]Wedge to barrel displacement Rod to wedge slip Total
235/340 3.18 6.3 9.48 460/530 3.18 6.4 9.58
Wedge/Barrel Angle After initial investigations it was concluded that this variable had a great impact on the performance of the anchorage. Eight different models with varying angles are therefore analyzed. The angle is varied by a change of thicknesses in the unloaded end of the barrel and wedges with the notation relating to the change of the wedges. Their thickness in the thick end is varied between - 4 and + 2 mm, see Figure 4.18, while the outer diameter of the barrel is kept constant.

Numerical Model
105
Wedge
Original ± 0.5 mm ± 1.0 mm ± 2.0 mm ± 4.0 mm
Unloaded/Thick end Loaded/Thin end
+
-
Figure 4.18 Variation of wedge/barrel angle through variation of the wedge’s thickness in the unloaded end
Results from this variation can be found in Table 4.8. It is obvious that a larger angle give less resistance to slip. This is reasonable and a result of the fact that the force normal to the rod decreases and thereby creates less frictional forces in the wedge-rod interface. If the angle instead is decreased the frictional force on the rod will grow and the slip will decrease. With a sufficiently large angle the total displacement will increase anyway due to larger pull out of the wedges from the barrel. An optimum angle appears therefore, from these simulations, to be somewhere in between 3 and 4°.
Table 4.8 Slip resulting from variation of wedge/barrel angle
[mm]Wedge to barrel displacement Rod to wedge slip Total
+2.0 - infinite - +1.0 - infinite - +0.5 - infinite - -0.5 3.67 3.6 7.27 -1.0 4.38 3.1 7.48 -2.0 8.93 2.9 11.83 -4.0 infinite - -
Wedge Thickness To start off with two new wedge thicknesses were modelled; one 4 mm thicker than the original and one 4 mm thinner than the original. They clearly showed that the thinner one was preferable and three more wedge thicknesses, which were 2, 6 and 8 mm thinner than the original, were analyzed. As the wedges were made thinner the barrels became thicker with the outer diameter kept constant.
Table 4.9 Slip resulting from variation of the wedges’ thickness
[mm]Wedge to barrel displacement Rod to wedge slip Total
+4 2.51 8.1 10.61 -2 3.55 4.9 8.45 -4 4.20 4.0 8.20 -6 4.83 3.1 7.93 -8 5.40 1.5 6.90

Mechanical Anchorage of Prestressed CFRP Tendons
106
The results presented in Table 4.9 show that the thinner wedges seem to displace more out of the barrel than the thick ones. This displacement is counterweighted by the rod’s slip that instead decreases even more with decreasing wedge thickness; thus resulting in an overall displacement that similarly decreases with decreasing wedge thickness.
Barrel Thickness Analyses similar to the ones for the wedge’s thickness have also been performed on the barrel’s thickness. In the initial models two barrels with a 4.5 mm thinner and thicker material respectively were analyzed. Material was removed from the outer face so that all dimensions of the anchorage except for the barrel’s outer diameter were unvaried. The one with the thicker material gave an unreasonable high total displacement and after that focus was set on the thinner sizes. Table 4.10 reveals the so far unexplained high slip when the thicker barrel was used. It is obvious that a thinner material in the barrel resulted in less slip. It would therefore have been interesting to see what happens with even thinner barrels but the smaller elements that smaller sizes give rise to force the solution into numerous and highly time-consuming steps of calculations. These models were therefore aborted and it is assumed that the value of the displacement converges at some barrel thickness close to 6.5 mm thinner than the original. With a too thin barrel it is possible that it is incapable of handling the hoop stresses created through the tensile loading of the rod.
Table 4.10 Slip resulting from variation of the barrel’s thickness
[mm]Wedge to barrel displacement Rod to wedge slip Total
+4.5 2.97 13.4 16.37 -2.5 3.20 4.4 7.60 -4.5 3.31 3.8 7.11 -6.5 4.02 3.0 7.02
Wedge’s Initial Positions It was suspected that an indentation of the wedges into the barrel towards the loaded end or an extraction of them in the initial step could alter how they gripped the rod. Models with indentations and extractions of 2.5 and 5 mm were therefore created and solved for the total displacement. The wedges were kept 100 mm long and it was therefore necessary to make the extracted wedges somewhat thicker and the indented thinner, see Figure 4.19

Numerical Model
107
Indentation Extraction
Barrel
Wedge
Rod
Fprestress
Figure 4.19 Scaled picture of how the anchorage looks when the wedges are indented or extracted 5 mm in the unloaded end
Results from this variation of the wedges initial positions are found in Table 4.11. There seems to be a large increase in the values of the rod’s slip as the wedges goes from an initial indented position to a position in line with the barrel or extracted. This leap is large enough to influence the total displacement and the variation that creates the smallest total displacement is not any of the most extreme. An indented wedge is however difficult to work with since it requires a hole in the structure that constrains the anchorage’s longitudinal movement and still is larger than the smaller inner diameter of the barrel. The indention also requires that the anchorage is centrally positioned in relation to that hole. These requirements are not easy to meet and especially not when the barrel is positioned against a bare concrete surface.
Table 4.11 Slip resulting from variation of the wedges initial positions
[mm]Wedge to barrel displacement Rod to wedge slip Total
Ind 5.0 3.76 4.7 8.46 Ind 2.5 3.39 4.9 8.29 Ext 2.5 2.97 6.5 9.47 Ext 5.0 2.95 7.0 9.95
Barrel’s Outer Angle In addition the barrel’s outer angle was changed due to the findings done by Al-Mayah et al. (2005a). They found that a decrease of the barrel’s thickness in the loaded end created less normal stresses on the rod and that this resulted in a larger slip. This is contradictory of the behaviour of the model used in this parametric study. For a decrease of the thickness of the barrel in the loaded end with 6 mm, which gives an even material thickness of 9.5 mm along the barrel’s length, a decreased total displacement was achieved. When the material thickness instead was increased to 21.5 mm in the loaded end a large increase in the total displacement was achieved, see Table 4.12.
Table 4.12 Slip resulting from variation of the barrel’s outer angle
[mm]Wedge to barrel displacement Rod to wedge slip Total
9.5 3.47 4.7 8.17 21.5 2.41 12.0 14.41

Mechanical Anchorage of Prestressed CFRP Tendons
108
4.3.1 Combination of Variables To include (or exclude) possible interactions between the different variables several analyses with a combination of variables and their values were performed. The omitted variables are the length, number of wedges and properties of the aluminium. It was obviously better with a longer anchorage and with four wedges while the aluminium quality seemed to have minimal effect on the total displacement.
It became apparent during these analyses that the thinner wedge highly contributed to an overall improvement of the anchorage. This variable was therefore constantly set to 8 mm thinner than the original. Furthermore; a higher yield stress of the barrel’s steel also contributed favourably and the stronger steel 460/530 from Table 4.7 was chosen.
More interesting were the variations of the barrel’s thickness, the wedges’ initial positions and the angle of the wedge/barrel interface. It was also discovered that with the increase in the steel’s strength and variation of barrel thickness the effect of a variation in the barrel’s outer angle diminished. The variable was then omitted. Results from the final variations of these parameters are seen in Table 4.13.
Contrary to the case where single parameters were varied an extraction of the wedges’ final positions seems to be favourable. All analyses with the wedges positioned 2.5 mm towards the unloaded end of the rod gave lower total displacements than the opposite. The reason is the displacement of the wedges in relation to the barrel; which in the case of a decreased wedge/barrel angle also resulted in a final slip of the rod out of the anchorage. Best results were achieved with an original wedge/barrel angle, original barrel thickness and extraction of the wedge’s initial position. The model with the 6.5 mm thinner barrel did however also result in a decrease of the total displacement with almost 30% and might be a good alternative due to the lower weight and smaller size.
Table 4.13 Slip resulting from combinations of favourable parameter variations, all values are in [mm] and described fully in earlier sections
Wedge
Thickness
Steel
Properties
Wedge/Barrel
Angle
Barrel
Thickness
Wedge
Position
Wedge to barrel
displacement
Rod to
wedge slip
Total
-8 460/530 0 0 Ind 2.5 6.19 1.7 7.89 -8 460/530 -0.5 0 Ind 2.5 - infinite - -8 460/530 0 -6.5 Ind 2.5 6.58 1.6 8.18 -8 460/530 -0.5 -6.5 Ind 2.5 - infinite - -8 460/530 0 0 Ext 2.5 4.42 1.8 6.22 -8 460/530 -0.5 0 Ext 2.5 5.50 1.5 7.00 -8 460/530 0 -6.5 Ext 2.5 4.77 1.7 6.47 -8 460/530 -0.5 -6.5 Ext 2.5 5.71 1.5 7.21

Numerical Model
109
4.4 Discussion and Conclusions To achieve results in the FE-analysis that are comparable to the laboratory tests all parts must be modelled correctly concerning both material and geometrical properties. Even when that is done the solution process simplifies the problem. In the transformation from a continuous system to a system of finite elements the resolution of the results is reduced. When this decrease in resolution becomes too large the result deviates more and more from the exact solution and at some point they become unusable. To avoid this, the results of a FE-model are usually compared to measurements on the real structure. That is to calibrate the model; no such tuning was possible in this study because the modelling was performed to find a starting point in the production of anchorages for laboratory testing. The model can therefore not be seen as a representation of a real structure, but as a platform to investigate the different parameters, and for that purpose the model has done its job well.
Initial variations of the single parameters gave a hint of how they affected the total displacement of the rod during the pull out test. Further on the combination of the parameters into more complicated comparative test analyses revealed the influence of interaction between the parameters. This was perhaps most evident in the case of the wedges’ initial positions. During the single-parameter study when the original anchorage was investigated with change in position as the only variable an indentation of the wedges towards the loaded end was preferable. Contrary to that the multi-variable comparison showed that the wedges should be extracted towards the unloaded end.
A thinner wedge and stronger steel in the barrel generally improved the anchorage’s performance. It is more difficult to give a clear opinion on the wedge/barrel angle but it should, based on the analysis be kept somewhere between 2 and 3°.
Results also show the usefulness of longer anchorages with a larger number of wedges and an inclined outer surface of the barrel. Due to the overall aim of the project, to find a reliable anchorage that is small and easy to handle, the first two of these three aspects are harder to meet. The anchorage should be kept small with a minimum of parts involved.
Future Model Based on the experiences from these analyses and from the laboratory tests performed to achieve a reliable anchorage a new model should be developed to compare with the strains and stresses measured during the tests. By doing so the mechanisms that govern the anchorage can be revealed and that model would also be trustworthy as a representation of the structure.
As a first step in that development the 3D model should be reduced by the use of symmetry as in Figure 4.5. In the parametric study the model was built

Mechanical Anchorage of Prestressed CFRP Tendons
110
upon the 3D model used to compare the 2D, axisymmetric and 3D - models in Figure 4.11. This model with the relatively fine mesh and large number of elements required long computational times. The model should also include ultimate compressive and tensile strengths for the CFRP, both in the radial and longitudinal directions. With that included it is easy to see if the anchorage produces stress concentrations that destroy the rod’s capacity. A more precise description of the frictional behaviour must be found and implemented. This may be a difficult task and perhaps the parameters must be calibrated with some help from achieved test results. All material and geometrical data such as stress - strains curves from the metals and possible curvatures of the edges should also be included if the model is to be representative.

Laboratory Tests
111
5 Laboratory Tests
5.1 Introduction So far a literature study, an analytical and a numerical study, with the intention to develop a new anchorage, have been presented. In this chapter an anchorage is developed, based on the earlier findings presented. This anchorage will then be used in the final testing. The type of anchorage chosen is the cylindrical wedge anchorage, which is designed to anchor circular CFRP rods with a diameter of 8 mm. The reason for focusing on cylindrical wedge anchorages was due to the studied literature. The diameter of the rod, 8 mm, was chosen mainly due to the high surface area to cross sectional area ratio.
Following this introduction a range of sections is presented that describes the development of the anchorage into the final design. The final anchorage is then used to investigate the reliability and capacity. In addition the materials used in the development are described below together with equipment used, loading and instrumentation. Results from the final tests are all presented in the next chapter.
5.2 Dead End Anchorage Design In the end of the rod, opposite to the end where the wedge anchorage is placed, a dead end anchorage is to be applied in the tests. Such an anchorage has the function of a reliable dead end to counteract the force applied to the wedge anchorage and transmitted through the rod. With a dead end anchorage that prevents slip of the rod and undergoes negligible deformations all efforts concerning the instrumentation can be focused on the behaviour of the wedge anchorage. Actual mechanical properties based

Mechanical Anchorage of Prestressed CFRP Tendons
112
on stress - strain curves for the CFRP material are also easy to achieve if a reliable anchorage is applied at both ends.
For these laboratory experiments a clamp anchorage was chosen for the dead end, the design of which was inspired by the work of Al-Mayah et al. (2005b), but adjusted to fit the available rods and equipment. The dead end anchorage in this study consists of two steel plates with one longitudinal circular groove in each plate. These plates are clamped around the rod, and a thin inner sleeve made in aluminium, with six 16 mm bolts. A detailed sketch of the plates and the sleeve can be seen in Figure 5.1 and Figure 5.2 respectively while Figure 5.3 shows a photo of the assembled anchorage.
Figure 5.1 Drawing of one out of two steel plates included in each dead end anchorage
Figure 5.2 Drawing of the aluminium sleeve included in the dead end anchorage
Stress concentrations in the front of the anchorage that might cause premature failure of the CFRP rod are prevented by a controlled tightening of the bolts. The pair of bolts closest to the unloaded end of the rod is tightened with a torque of 160 Nm while the central pair is tightened with 145 Nm and the pair closest to the loaded end with 130 Nm.

Laboratory Tests
113
Figure 5.3 Picture of the assembled dead end anchorage
5.3 Mechanical Properties of CFRP Rod After the development of a suitable clamp anchorage it was possible to test the properties of the CFRP rods. The material data given by the manufacturer for the type of CFRP used is presented together with measured properties in Table 5.1.
Five tests were conducted with 0.66 m long pieces of CFRP rods. One dead end anchorage was attached in each end of the rod and the assembled test piece was then put in the test machine described in Section 5.6. Instrumentation consisted of applied force, two LVDTs measuring the overall elongation of the rod and one electrical strain gauge positioned at the rod halfway between the wedges. The sensors can all be discerned in Figure 5.4, which also depicts the type of failure that occurred in all five tests.
All five tested samples failed by rupture of the rod in between the anchorages and at tensile forces between 140-151 kN, this is shown in Appendix A. Test number four experienced some slip of the rod and the thin aluminium sleeve in relation to the clamped steel plates, see Appendix A. No slip between the rod and the sleeve could however be seen in that test, and no slip at all could be seen in the remaining four tests.

Mechanical Anchorage of Prestressed CFRP Tendons
114
Figure 5.4 Left: Rod in test machine with attached sensors; Right: Rod after failure
Table 5.1 gathers the characteristics of the rod given by the manufacturer and compares it with the mean values of the ultimate strength and modulus of elasticity found during the laboratory tests. It also compares the given minimum values with the values of the fifth percentile found during the tests. Finally it compares the minimum ultimate strains, all tests failed at strains above 1.8%.
Table 5.1 Properties of the CFRP rod given by the manufacturer compared to those found through testing in the laboratory
Emean
[GPa]
Estd.dev.
[GPa]
Emin
[GPa]
u,mean
[MPa]u,std.dev.
[MPa]
u,min
[MPa]
u,min
[%]Manufacturer 165 158 2500 2200 1.3
Laboratory tests 158 2.5 154 2891 81 2758 1.8
From Table 5.1 it can be concluded that the values found during the dead end anchorage tests of the rods differ significantly from those given by the manufacturer. The difference in ultimate failure strength is especially remarkable.
Another interesting characteristic from the tests on the rods is the non linearity experienced in the stress-strain curves. A glimpse of the small curvature can be seen already in Appendix A. With a closer investigation of each of the curves it becomes obvious that the rod experienced some strain hardening during the stressing procedure. This can be seen in Figure 5.5 where the elastic part of the test is divided into three separate areas. A new modulus of elasticity for each of these three steps is calculated and it shows that the difference is as much as 20% between the first third and last third of the curve. Part of this might possibly be explained by a decrease in cross sectional area

Laboratory Tests
115
due to the lateral contraction. With a Poisson’s ratio of 0.3 the transverse strain after 15 % of longitudinal strain would be 0.3%. That decrease the initial radius of 4 mm to 3.988 mm, which in turn reduce the cross sectional area to 49.96 mm2. That is only a decrease of 0.6% compared to the original 50.26 mm2. Some other mechanism within the material must be responsible for the remaining parts of the difference. One thought is that the fibres during the initial tensile stress start to straighten and that only after a while can they start to carry the full load.
0 0.002 0.004 0.006 0.008 0.01 0.012 0.0140
500
1000
1500
2000
Strain hardening
Strain, εz
Str
ess,
σ z [MP
a]
E1,rod
= 140 GPa
E2,rod
= 161 GPa
E3,rod
= 173 GP
Figure 5.5 Strain hardening experienced by rod number 1 in the test series
5.4 Development of the Wedge Anchorage After a series of five refined designs an anchorage was found that could fulfil the stated requirements and consequently be used for further development. This section briefly describes the development and explains how the early designs were insufficient and the measures taken to overcome those insufficiencies.
5.4.1 Discovered Failure Modes During the development several types of failure were discovered. These are described in this section as reference for future use. Each step in the development of the wedge anchorage has its characteristic failure modes and when they are mentioned later in the thesis the reader is advised to refer to this chapter for a more thorough explanation.

Mechanical Anchorage of Prestressed CFRP Tendons
116
Successful Failure If an anchorage is to be considered reliable, the failure must occur outside of the anchorage and above a certain load limit. Different guideline values exist for this limit in short term tests. This is further discussed in Chapter 2. One value that often is often used is 95% of the ultimate failure strength of the tendon. If the tendon breaks at a stress less than that, and in the anchorage, it is assumed that the anchorage system has a negative influence on the prestressing systems capacity. A typical successful failure is seen in Figure 5.4, and the remains of the tendon resemble a bird’s nest more than the originally perfectly aligned CFRP.
Soft Slip Particularly anchorages with poor finish and bad design might fail in gripping the tendon sufficiently. This results in low normal pressure onto the tendon and poor utilization of the static friction coefficient between the tendon and the wedge. In these cases the tendon starts to slide already at a low pulling force, i.e. below 75% of its ultimate capacity. Motion is prevented during this process by the remaining kinetic friction between the materials and the pull out is therefore slow and possible to control by variations in the applied force.
Power Slip In contradiction to the soft slip a power slip occurs when the pull out force has reached a high degree of tendons ultimate capacity. If the anchorage at this high level of stress fails to grip the tendon all the stored energy is released at once without controlled sliding or any contribution by the kinetic friction. Characteristics connected to the power slip are the loud bang at the moment of failure and the appearance of the failed tendon as in Figure 5.6. In most cases the part of the tendon in the failing anchorage is shot out of the anchorage and into the splintered part of the tendon in the second anchorage.

Laboratory Tests
117
Figure 5.6 Characteristic signs that a power slip has occurred
Cutting of Fibres Circumferential threads or sharp edges of the wedges aligned transverse to the fibres’ longitudinal direction may, when they are pushed into the tendon, cut individual fibres. By doing so the design of the anchorage reduces the effective tendon area, and thereby also its capacity to carry load. A typical failure where threads in the wedges have cut the tendon can be seen in Figure 5.7.
Figure 5.7 Typical look of the failed rod when the outer fibres have been cut by the threads in the wedges

Mechanical Anchorage of Prestressed CFRP Tendons
118
Crushing of Rod Sharp edges are also introduced into the system parallel to the fibres’ direction by the wedges. Together with the small gap between the wedges the sharp edges allow for the wedge to crush the tendon and for the tendon to squeeze out in the gaps. This failure may happen at low forces and leaves a characteristic pattern on the tendon, see Figure 5.8, with the parts that have been squeezed between the wedges torn off from the remaining parts of the rod.
Figure 5.8 Crushed rod where two pieces squeezed between the wedges have been torn off
Bending of Fibres Bending of a bunch of fibres may occur for two reasons. The result in both cases is that the bent fibres fail prematurely, reduce the effective cross sectional area of the tendon and consequently also facilitate a premature failure of the entire tendon. A first reason for why this failure might occur is a non-aligned test setup. A second reason is the bending of the tendons outer fibres that occurs at the tendons entrance into the anchorage when the wedge squeezes the part inside the anchorage while the part outside is left unaffected, Figure 5.9. This phenomenon is also described in Kerstens et al. (1998).
Figure 5.9 Bent fibres due to the squeeze of the wedge and due to bending of the entire rod
Frontal Overload Failure As the tensile force in the tendon reaches a reasonably high level and is combined with the radial normal pressure from the wedge the principal stress at some point may

Laboratory Tests
119
exceed the tendons ultimate capacity. This is only possible in the front of the anchorage since the longitudinal tensile force in the tendon is successively reduced until it reaches a zero value in the back of the anchor. The failure may also occur as a shear failure in the tendon at a position in the front of the anchorage which leaves the tendon with a conical shape, Figure 5.10, typical for shear failures. To separate this failure from the earlier discussed “cutting of fibres” it can be seen on the rod where the threads end and that can be compared to where the failure occurs.
Figure 5.10 Pictures from when the rod has failed by too high compressive forces in the front of the anchorage
5.4.2 First Design
Figure 5.11 Drawing of the first wedge anchorage design
At first an anchorage was produced without any considerations taken of the numerical parametric study. The anchorage, which can be seen in the drawing in Figure 5.11, consists of a 70 mm long steel barrel and three 80 mm long aluminium wedges with a common 3° angle of the interface. Both parts where made considerably thicker than the finite element model which would later prove advantageous. Each wedge covered a circular section of 104° which left gaps in between them of 16°. In the drawings it can be seen that the intention was to round off all edges aligned transverse to the tendon. Unfortunately the workshop did not follow the drawing of the barrel concerning that detail while the edges of the wedges were rounded as in the drawing. 1 mm deep threads, sticking out of the inner faces of the wedge, were designed to increase the

Mechanical Anchorage of Prestressed CFRP Tendons
120
force transfer in the back of the anchorage. With that the intention was to level out the principal stresses in the tendon over the length of the anchorage. The produced and assembled anchorage can be seen in Figure 5.12.
Figure 5.12 Produced and assembled anchorage of the first design
From the moment when this anchorage was first assembled it was realized that the anchorage would not work as intended. Already after a presetting of 15 kN several problems occurred. The sharp inner edge of the barrel dug into the outer surface of the wedges and hindered them from continuing their sliding into the barrel. Circumferential scars left from this can be seen on the wedges in the assembled anchorage in Figure 5.12. Consequently not enough normal force could be applied and the tests failed due to soft slip of the tendon out of the anchorage. It was also discovered that the large gaps between the wedges allowed for the wedges to crush the tendon. If the anchorage had been able to resist the sliding it would instead have crushed the rod until failure.
5.4.3 Second Design With experience from the first anchorage design and knowledge from the numerical parametric study the improvement achieved with the new second design was considerable. Before delivering the new drawings to the workshop, their personnel were invited to the laboratory to get an understanding of what the purpose of the anchorage was, and also to get a feeling for the importance of the details in the design.

Laboratory Tests
121
Figure 5.13 Drawing of the second design of anchorages
Figure 5.13 shows a sketch of the new design with a longer barrel (compared to the first design) of 85 mm and shorter wedges of 75 mm. Thicknesses of the materials are significantly reduced to follow the indications from the parametric study. The angle is kept at 3°. Threads are reduced to 0.5 mm and the only prescribed round off is in the front of the wedges. All the other edges are also slightly rounded, this has however not been necessary to show in the sketch after informing the workshop about the problem.
Figure 5.14 Barrel and three different wedges from the second design
A larger improvement than any of the above mentioned is however the connection between the wedges that can be seen in the sketch in Figure 5.13 as well as in the photo of the manufactured anchorage in Figure 5.14. This 1.0 mm thin connection

Mechanical Anchorage of Prestressed CFRP Tendons
122
that holds the wedges together and bridges two of the three gaps along the entire length of the wedges has been patented. Advantages with the connection are several. Firstly it resists the tendons tendency to squeeze into two out of three gaps. Secondly it increases the available force transferring frictional area between the wedges and the tendon and thirdly it makes the wedges very easy to handle and to apply correctly into the barrel.
Initial tests with this design proved its improvement but also showed that something had to be done about the threads. They tended to cut the tendon and were consequently drilled out with an 8 mm drill. New tests without the threads and with a presetting force of 50 kN gave failure due to soft slip when the tensile force was applied. The presetting force was then increased to 100 kN. This changed the failure mode to frontal overload failure in a majority of the tests performed and increased the failure load to 112 kN for some of the tests. Compared to the ultimate strength of the tendon given by the supplier that is close to the limit of 95%, which is necessary to consider the anchorage as reliable, but not compared to the actual ultimate strength, see Section 5.3.
5.4.4 Third Design With the same barrel design as a basis the wedges in the third design were altered to overcome the problems from the second design. A difference in angle between the outer surface of the wedges and the inner surface of the barrel was introduced. The value on the difference was set to 0.1° after the study of earlier publications, for example Al-Mayah et al. (2001a and b) and Sayed-Ahmed & Shrive (1998), see Section 2.5.3. Two types of wedges with this difference in angle were produced. One where the inner surface of the wedges was altered and one where the inner surface was kept parallel to the tendon and the outer surface altered, see Figure 5.15.

Laboratory Tests
123
Figure 5.15 Drawing of the third design of anchorages
In addition to the introduction of the difference in angle all threads were initially removed from the wedges. This removal caused the initial tests with this design to fail by soft slip. As Figure 5.15 shows a solution with negative threads in the inner surface of the wedges was then introduced. The cuts were 0.5 mm deep and gave a better friction without cutting the outer fibres of the rod. After that alteration the tendons reached pulling forces of 82-85 kN before they failed by frontal overload. Apparently the 0.1° difference in angle was not enough to direct the necessary amount of normal forces to the back of the anchorage. It is assumed that this was due to the aluminium used in the wedges. The anchorages found in literature all had wedges made out of steel with an elastic modulus three times that of aluminium. A larger angle would therefore probably be necessary for this type of anchorage.
5.4.5 Fourth Design Here the same design as the third design was used with 0.2° difference in angle between the wedges and the barrel in some of the tests. Wedges with a parallel inner surface were chosen due to easier production in the workshop and results in the laboratory showed no difference between the wedges with the angle change on the outer or inner surface. The design is the same as for the lower wedge in Figure 5.15, with the outer angles of 3.1° and 3.2°.
Tests on these anchorages did not show any differences in the results. With low presetting forces the systems failed through soft slip while with presetting forces between 90-110 kN they failed through frontal overload. Concluding remarks from this design were that the anchorage had problems with the friction, that they were

Mechanical Anchorage of Prestressed CFRP Tendons
124
sensitive to changes in the presetting force and that too much normal force was transferred to the tendon in the front of the anchorage.
Drilling of the barrel with a 23 mm drill in the front of the anchorage proved that a larger difference in angle than the tests 0.2° was necessary. After the drilling the barrel looked similar to Figure 5.16. With this design of the barrel minimal normal stresses were transferred in the front of the anchorage and the tendon did consequently fail by frontal overload at the point in the barrel where the drilling stopped and the conical surface began. When that happened it had reached a tensile force of 110-116 kN, which were the highest load values achieved thus far.
Figure 5.16 Drawing of the barrel after modification of the fourth design
5.4.6 Fifth Design At this stage two problems needs to be solved; the friction had to be increased to prevent sliding and a transfer of the normal stress onto the tendon towards the back of the anchorage during the entire loading process had to be facilitated. To make this possible a constant presetting force of 80 kN was chosen and it was also decided to use some commercially available thermosetting adhesive between the tendon and the wedges.
The designs of the wedges and barrels to be tested can be seen in Figure 5.17. The shorter barrel of 85 mm was combined with the 75 mm long wedges which in turn had two different outer angles, 3.5° and 3.8°. Since the inner surface of the barrel has an angle of 3.0° the differences are 0.5° and 0.8°. A longer 105 mm barrel was also tested together with 95 mm long wedges with an outer angle of 3.37°; thus giving a difference of 0.37° to the barrel.

Laboratory Tests
125
85 mm anchorage design
105 mm anchorage design
Figure 5.17 Drawings of the fifth anchorage design

Mechanical Anchorage of Prestressed CFRP Tendons
126
AdhesiveTo make tests on four commercially available types of adhesive the shorter of the two anchorages from the fifth design was used, with an angle of 3.5°. Some requirements on the glue were established and from that it was concluded that it should be strong, quick drying and easy to apply. Four types of adhesive that could be considered to have these qualities were found in the hardware store. They are shown in Figure together with the assembled anchorages and are, with the top one first, Araldite from Huntsman, Strong Epoxy SuperQuick and Strong Epoxy Rapid from Casco and Super Attak from Henkel.
Figure 5.18 The four types of glue tested and assembled 85 mm anchorages from the fifth design
Results from the test with hardening time, the reached strength and type of failure can be seen in Table 5.2. Apparently Cascos SuperQuick did not have adequate strength and considering the ease of application and hardening time the Super Attak Precision from Henkel should be used for further testing. It was not necessary to mix and managed to withstand as high forces as any of the glues while it had the shortest curing time. According to the manufacturer the glue has tensile and shear strengths of 10-20 MPa after 12-24 hours of curing and 50% of that is gained within the first 5 minutes, Henkel (2008).
Table 5.2 Glues tested, with important parameters listed
Company, product
Curing time
[hh:mm]
Force at failure
[kN]Type of failure
Henkel, Super Attak 00:05 125 Power slip Casco, SuperQuick 00:15 80 Slip
Casco, Rapid 16:00 129 Power slip Huntsman, Araldite 24:00 117 Shear failure

Laboratory Tests
127
With the applied adhesive the shorter anchorage with the 0.5° difference in angle handled tensile forces between 107-127 kN and failed through power slip. The short anchorage with the larger difference in angle experienced the same type of power slip and failed at loads between 104-121 kN. At this level of difference in angle the larger one seems disadvantageous since it gives less normal pressure to grip the tendon with.
The longer anchorage with the 3.37° angle failed between 112-125 kN. It too failed by power slip in all tests but one. In the test that failed at 125 kN successful failure was achieved with a rupture of the CFRP tendon in between the anchorages. It could be seen that the slip occurred due to the fact that the space between the two wedges without the connection closed. The decision was then taken to use the longer anchorage for further testing and evaluation of the development, with only a slight modification of the size of the spacing between the wedges.
5.5 Final Wedge Anchorage Design To reach a design that could withstand at least 95% of the rods ultimate failure stress of 2891 MPa the design of the long anchorage in Figure 5.17 was used. The only change made from the fifth design is the larger space between the wedges that can be seen in the left part of Figure 5.19.
Figure 5.19 Left: Wedge from the fifth design compared to the wedge from the final design; Centre: Drawing of an assembled anchorage with the final design; Right: Picture of an assembled anchorage with the final design

Mechanical Anchorage of Prestressed CFRP Tendons
128
5.5.1 Material Properties To test the steel used for the barrel and the aluminium used for the wedges the procedure and design described in, Schmidt & Hansen (2006), is used. It prescribes a sample design as shown in Figure 5.20.
Figure 5.20 Sketch of steel sample used, thickness is 8 mm
The load rate is 2.5‰/s, and the initial measurement length is set to be 50 mm. All samples are manufactured by the workshop that also manufactured all parts included in the anchorages. Where possible the samples have been taken from the same piece of metal as the parts to the anchorages. In the cases where that have not been possible material from the same delivery has been used. Altogether five samples from each of the materials were tested. These can be seen in their deformed shape in Figure 5.21.
Figure 5.21 Left: Tested aluminium samples; Right: Tested steel samples

Laboratory Tests
129
Measurement data and calculations of material properties for the steel and aluminium can be found in Appendix A. The most important properties are also seen in Table 5.3.
Collection of Material Data Four materials are included in the tests performed on the final wedge anchorage. They are the CFRP in the rod, the aluminium in the wedges and sleeve of the dead end anchorage, the steel in the barrel and plates and the adhesive. Parameters for these parts are presented in Table 5.3.
Table 5.3 Important parameters for the materials included in the tests of the final wedge anchorage design
Emean
[GPa]
Estd.dev.
[GPa]
u,mean
[MPa]
u,std.dev
[MPa]
y,mean
[MPa]
y,std.dev
[MPa]
u,min
[%]
CFRP158(test)
2.5(test)
2891 (test)
81(test)
- - 1.8
(test)
Aluminium70
(assumed)-
372(test)
2.2(test)
358(test)
3.1(test)
11.0(9.4) (test)
Steel205
(assumed)-
512(test)
16(test)
463(test)
15(test)
20.1(17.1) (test)
Adhesive - - 10-20
(supplier)- - - -

Mechanical Anchorage of Prestressed CFRP Tendons
130
5.6 Test Equipment
Figure 5.22 Left: Set up for presetting of wedges; Centre: Magnified view of the presetting; Right: Set up for tensile testing of the anchorage system
Tensile loading of the anchorage specimens as well as the presetting was performed by a universal test machine from Instron with the model name 8502, Instron (1987). The machine has a maximum capacity of 250 kN, which in the case of a 8 mm rod gives 5000 MPa, and is deformation controlled.
For each of the two steps, presetting and tensile loading, an insert must also be used within the machine. These are described in the following sections.
5.6.1 Presetting During this step the wedges are pushed down into the barrel so that they grip firmly around the rod. For optimal performance and to avoid bending of the rod the procedure should be performed with the rod kept free to move along with the wedges. For this to be possible a special insert consisting of three horizontal steel plates connected by threaded steel bars was constructed. This can be seen in the left part of

Laboratory Tests
131
Figure 5.22. The two uppermost plates have a 12 mm wide slit going into the centre of the plate to fit the rod. In this way the setup was easy to exchange when the fixed presetting force was reached.
Force was applied through a stiff steel barrel with inner diameter 12 mm and outer diameter 22 mm which fitted onto the rod but did not hit the edge of the anchorages barrel. This part is magnified in the central part of Figure 5.22.
5.6.2 Tensile Loading For the tensile loading two new inserts are used. These two inserts are similar and consist of two horizontal steel plates connected with threaded steel bars. A 12 mm slit is also made in these steel plates where the rod is positioned. The setup can be seen in the right part of Figure 5.22.
5.7 Instrumentation The basic operation was performed by the Instron 8502 machine described in section 5.6. Data about applied force were taken from the machine. Remaining results from the tests are given by a setup of different sensors. For measurements of elongation and strains in the rod and on the outer surface of the barrel, electrical strain gauges were used. Relative displacements of the parts within the tendon-anchorage setup were measured with Linear Variable Differential Transformers (LVDTs). In addition one pilot test with Fibre Optical Sensors (FOS) included in the rod was also carried out. This test was not included in the proof testing of the rods but served as a test of the new method to measure strains in the rod at different locations and also as a way to receive data from parts of the anchorage unreachable by other means.
All data received during testing were saved to the hard drive with a rate of 0.90 Hz. That is with the exception of tests with FOS, which was sampled with a rate of 0.76 Hz and 7.30 Hz; where the higher value is used for the FOS and the lower for the remaining sensors.
5.7.1 Strain Gauges Strain gauges that are used are of the type Vishay CEA-06-240-UZ. The gauge is a universal general purpose polyimide coated strain gage made in constantan. It is limited to strains up to 5% and can work in conditions between -75 to 175°C. Measurements are made on a length of 0.24 inches, which is 6.1 mm. More data on the sensor can be found in Vishay (2003).
To apply the gauges to the barrel and the rod material special purpose cyanoacrylate adhesive from Tokyo Sokki Kenkyujo Co., Ltd is used.

Mechanical Anchorage of Prestressed CFRP Tendons
132
BarrelEach barrel tested had 12 strain gauges attached to its outer surface. Six of them were positioned in the longitudinal direction and six in the circumferential direction. The setup with directions and positions on the barrel can be seen in Figure 5.23.
8 18 1818 18 18 7
105
LS-1
LS-2
LS-3
LS-4
LS-5
LS-6
Longitudinal measurements, l
5 19 1919 19 19 5
105
CS-1 CS-2 CS-3 CS-4 CS-5 CS-6
Circumferential measurements,
(mm)
Figure 5.23 Design of sensor setup for strain gauges on the outer surface of the barrel
Circumferential positions of the circumferential measurements are also varied between the five test setups. The three different positions used can be seen in Figure 5.24. This variation is made because it was suspected that the circumferential stress varies depending on if it is measured at the position of spacing between the wedges, at the wedges quarter point or at a point at the wedges centre. Altogether 12 such points exist in an anchorage with three wedges- six quarter points, three centre points and three points at the spacing between the wedges. A mean value of these stresses can therefore be calculated with Eq. (5.1), Marceau et al. (2003).

Laboratory Tests
133
,space
,quart
,centre
Figure 5.24 Circumferential positions of strain gauges measuring circumferential stresses
Tests 1 and 4 measure at the central position, tests 2 and 3 on the quarter point and test number 5 on the spacing between the wedges.
, , ,,
3 6
12centre space quart
mean (5.1)
Figure 5.25 Strain gauges mounted on the 105 mm barrel for circumferential and longitudinal measurements respectively. Measurements in the second direction are made on the opposite side of each anchorage.

Mechanical Anchorage of Prestressed CFRP Tendons
134
Short cables soldered to the gauges are connected from the sensors to connectors, which are glued onto the surface of the barrel. In that way the cables are restricted from ripping the gauge of from the barrel. All of the setup can be seen in Figure 5.25.
RodOnly one strain gauge is applied to each rod, positioned halfway between the two ends; that is 330 mm in on the 660 mm long rods. The gauges with attached connectors can be seen in Figure 5.26.
Figure 5.26 The five rods used during the tests with attached strain gauges and connectors
5.7.2 Displacement Sensors All LVDTs are of the type TR 50 from Novotechnik. It has an effective range of 50 mm; more information on this sensor is found in Novotechnik (2007). Three sensors of this type are used in each test; they can be seen in Figure 5.27. The first is positioned on a pillar in the test machine and measuring against a steel angle glued onto the rod 70 mm away from the supporting plate at the dead end. Similarly the second one is measuring against an angle attached 90 mm away from the wedge anchorages support. ´The third one measures the deformation of the supporting plate in the end with the wedge anchorage.

Laboratory Tests
135
90
Wedge anchorage
LVDT 2
Strain gauge on rod
LVDT 1
LVDT 3
70
Dead end anchorage
Figure 5.27 Left: Scaled drawing of the measurement setup; Right: LVDTs positioned to measure displacements of the rod
5.7.3 Fibre Optical Sensors (FOS) In addition to the original five tests performed on the final wedge anchorage design one sixth test was performed. This test had a different loading, see section 5.8, and also included fibre optical sensors (FOS). It was performed partly to evaluate the possibility of using FOS in future tests and for further development of the anchorage and partly to evaluate the longitudinal strain distribution within the anchorage. Electrical foil gauges that are used on the barrel and the rod are reliable and widely used but they are not small enough to hide within the anchorage. They would instead be crushed before any

Mechanical Anchorage of Prestressed CFRP Tendons
136
results could be given. Fibre optical sensors, on the contrary, are small enough to be positioned in a 0.6·1 mm large longitudinal groove in the rod, see Figure 5.28. There it can be protected with epoxy and thereby withstand high radial clamping forces.
Figure 5.28 Longitudinal groove cut in the rod to house the FOS
The fibre itself is only 0.14 mm in diameter. It is then protected by two layers of plastics, one transparent layer with 0.22 mm in diameter and one white layer with a diameter of 0.90 mm. At application into the rod the protective layers are removed and 150 of the fibre are exposed. Without the protection, and to some extent also with the protection included, the fibres are extremely sensitive to mechanical damage. Care must therefore be taken during the process of application. A picture of the layers together with a connector can be seen in Figure 5.29.
Figure 5.29 Optical fibre where the fibre can be seen as the outermost 4 mm in the right part of the picture. Also the two protective layers and a connector are seen
For the grooves a miniature diamond cutting blade attached to a drill machine was used. Gluing was done with the same glue as in the anchorage, i.e. the Super Attak Precision from Henkel, described in section 5.5. During curing of the glue the fibre must be kept in place. This must be done with a device that does not risk ripping the fibre off at removal.
Six sensors were written on the fibre used. This was performed by hand due to the necessity of keeping a short distance between the sensors. Each sensor is 6 mm long and

Laboratory Tests
137
they were positioned 20 mm apart, see Figure 5.30. The sensors are of the Fibre Bragg Grating (FBG) type and written with phase mask technique at City University in London. This technique allows for the sensors to respond to different frequencies of the broadband light sent into the fibre during measurement. Each sensor covers a frequency interval and it can thereby during the acquisition phase be seen to which sensor the returning signal belongs. A limitation with this technique is the number of sensors possible to use in one fibre. To avoid any risk of interference between the sensors a gap in the frequency intervals must be kept, which reduce the number of sensors to eight. There also exist some limitations on maximum strains possible to measure. These sensors could only handle approximately 5000 s. For illumination of the sensors a broadband source of 20 mW covering the wavelengths 1520-1560 nm was used. More about the system used can be read in Kerrouche et al. (2008a and b).
Figure 5.30 Original positions of the six FBG sensors in relation to the wedges and the foil gauge to the left in the picture for confirmation and calibration of the FBGs
Figure 5.30 show how the six FBGs are positioned within the anchorage during testing. The first sensor is positioned 15 mm outside of the 90 mm wedges while the remaining five sensors are positioned 5, 25, 45, 65 and 85 mm into it. With this type of sensors the exact position is difficult to state with more than 2-3 mm accuracy.
For comparison of the results with the ordinary measuring technique an electrical foil gauge of the type used on the barrel is positioned 50 mm in front of the wedges, also this sensor can be seen in Figure 5.30.

Mechanical Anchorage of Prestressed CFRP Tendons
138
5.8 Loading Three loading processes were used during the testing; one for presetting, one for the tensile loading in the five ordinary tests and one for the tensile loading of the anchorage with fibre optical sensors (FOS) included in the rod.
Prestressing
At first the wedges were pressed down into the barrel, which can be seen in Figure 5.22. This was done at a rate of 4 kN/sec until the force applied reached 80 kN. At that point the load was kept steady for another 10 seconds. Altogether the process took 30 seconds. After that the force was released and the process was finished.
Tensile loading during ordinary testing
Rostásy (1998) presents a schematic curve for the loading that should be followed during testing of tendon systems. In that he states that the load should be gradually stepped up to a force that is 70% of the rods ultimate force. In these tests it has been decided to see the force given by the manufacturer as the maximum force since that is the force that will be used in a design process. From Table 5.1 this value is taken to be 2500 MPa. That equals 126 kN with an area of the rod of 50.26 mm2. 70% of 126 kN is approximately 90 kN.
A load rate of 2.0 mm/min was chosen to increase the load on the tendon. The steps chosen to keep the load steady at are 30, 60 and 90 kN. In the first two of these parts with constant load the load is kept for 5 minutes. In the last step at 90 kN the load was kept for 60 minutes before the specimen was loaded until failure, again with 2.0 mm/min. The force-time curve for a typical test is presented in the left part of Figure 5.31.
0 10 20 30 40 50 60 70 800
50
100
150
Time [min]
For
ce [k
N]
0 5 10 150
2
4
6
8
10
12
14
16
18
20
Time [min]
For
ce [k
N]
Figure 5.31 Left: Typical force-time diagram for the five tests performed on the wedge anchorage; Right: Force-time curve for the tensile test with optical fibres included

Laboratory Tests
139
Tensile loading during tests with FOS
Unfortunately, as stated in section 5.7.3, the fibre optical sensors used in these tests only handled strains around 5000 s, this corresponds to a load of 35-40 kN and a decision was therefore taken to limit the tensile force in the rod to 20 kN. In that way the fibres would not come close to their maximum capacities and they should therefore give better results and also survive the treatment better.
Altogether five cycles were performed with a load rate of 2 mm/min and a stop at 20 kN for 30 seconds before the rod was instantaneously unloaded. This load pattern can be seen in the right part of Figure 5.31.
5.9 Discussion Although a vast amount of tests have been performed in the development of the final wedge anchorage the designing process was considerably shortened by the knowledge gained from the literature study and the finite element model. It is probable that a thicker anchorage would have been chosen instead of the thinner one that followed the first catastrophic anchorage design. Also the difference in angle between the wedges and the barrel could have taken some time to figure out if it were not for the tests presented in earlier literature. The development of the connections between the wedges, turning them into one is probably the most important finding from this thesis work and it should be possible to develop further.
An unfortunate circumstance in the preparations for the tests is the unreliable values on the elastic modulus of the metals. New samples from these materials must be manufactured and tested to either confirm the unrealistic results found during the tests already performed or to discard them as incorrect. Remaining values do however look promising with small standard deviations. Perhaps the strength of the aluminium was a bit higher than expected and this property must be evaluated regarding its importance in the wedge anchorage in future laboratory tests or FE-models.
The next chapter is to a large extent based upon this fifth chapter and during the discussion of results found in the measurements references are frequently given to the sections in this chapter that describe loading, instrumentation and material data. Knowledge based on the procedure during the tests together with the knowledge from its outcomes given in the next chapter will also form a solid basis for future development and tests.


Evaluation of Laboratory Tests
141
6 Evaluation of Laboratory Tests
In this chapter results from five complete failure tests on the final wedge anchorage design are presented together with results from one test where the FOS (Fibre Optic Sensors) were used in the CFRP bar. Each of the five tests loaded until failure of the rod contained six longitudinally and six circumferentially mounted strain gauges on the barrel. They also included three LVDTs and one strain gauge on the rod. Force was measured by the test machine. For the anchorage with the FOS included, the results come from six FBG sensors within the rod, twelve strain gauges on the barrels exterior, one strain gauge on the rod, one LVDT positioned against the supporting plate of the wedge anchorage and force from the testing machine. This has also previously been described in Chapter 5.
In this chapter results are evaluated and presented. In addition, a comparison to an updated FE-model is included. Also some of the findings from the analytical models in chapter 3 are used to process the data. With known strains on the barrel it is for example possible to find approximate radial stresses on the rod with the usage of the axisymmetric model.
6.1 Unprocessed Data For data processing the quality of the data is very important. Therefore all data have been plotted and investigated before processed. A relatively high portion of the data was however not useful due to unreasonably high or low values. It is for example not possible to have strains in the steel that are above the materials failure strain of ~20%. Also curves where large irregularities exist can be found. In all such cases the measurement is discarded and not used for further processing. Such behaviour in the

Mechanical Anchorage of Prestressed CFRP Tendons
142
data may be caused by a lost connection in the soldering or bad connection to the acquisition equipment. A tabulation of all measurements for all tests and both during presetting and tensile loading is done in Table 6.1. Here“-” marks a useful set of data while a “x“ marks a set of data that has been discarded. All unprocessed curves for the data sets are presented in Appendix B.
Table 6.1 Tabulation of available sets of measurement data
Presetting Tensile loading
Test # 1 2 3 4 5 1 2 3 4 5
Circumferential CS-1 - x x - - - - - - -
Circumferential CS-2 - - - - - - - - - -
Circumferential CS-3 - - - - - - - - - -
Circumferential CS-4 - - - - - - - - - -
Circumferential CS-5 - - - - - - - - - -
Circumferential CS-6 - - - - - - - - - -
Longitudinal LS-1 - - - - - - - - - -
Longitudinal LS-2 - - - - x - - - - x
Longitudinal LS-3 - - - - - - - - - -
Longitudinal LS-4 - - x - - - - x - -
Longitudinal LS-5 - - x - - - - x - -
Longitudinal LS-6 - - - - - - - - - -
LVDT 1 - - - - -
LVDT 2 x - - - -
LVDT 3 - - - - -
Longitudinal SG rod x - - - -
6.2 Ultimate Failure All tests but one failed by a so-called power slip, see Section 5.4.1. The remaining failures were successful and the rod failed by rupture between the anchorages. This successful failure occurred in anchorage number two. All rods tested with the final wedge anchorage design can be seen after failure in Figure 6.1. For anchorages one, three and five, the failures were identical with the upper part shot out of the wedge anchorage; thus hitting the lower part stuck in the dead end anchorage and splintering it. A close-up is seen in the photo of the failure in test number five. Also test four failed when the wedge anchorage suddenly lost its grip and released the rod, but in this test the rod did not leave the anchorage entirely and it did not splinter the lower part of the rod. In test two the same rupture occurred as in the case when rods were tested with dead end anchorages in both ends, see Section 5.3. The result is a pattern that can be described as two sheaves of hay facing each other.

Evaluation of Laboratory Tests
143
Anchorage 1 Anchorage 2 Anchorage 3 Anchorage 4 Anchorage 5
Figure 6.1 Photos of test samples after completion of each test
For a reliable anchorage, the anchorage must during all circumstances be able to carry an ultimate load of 95% of the rods ultimate strength. That is also stated as a demand in the American Post-Tensioning Institutes manual, PTI (2006). The used rods, with an 8 mm diameter, shall, according to the manufacturer, be able to handle 2500 MPa. This corresponds to 126 kN, see Section 5.3. Tests of the rod with dead end anchorages in both ends however show a higher ultimate strength of 2891 MPa, or 145 kN. 95% of these two values are 120 and 138 kN. Table 6.2 compares these values with the failure loads reached in each of the five tests performed on the wedge anchorage.
Table 6.2 Ultimate failure loads of tested anchorages compared to rods ultimate strength
F95%, manuf. F95%,tests FAnchorage 1 FAnchorage 2 FAnchorage 3 FAnchorage 4 FAnchorage 5
120 < 138 < 148 142 144 146 149 [kN]
With the evaluation technique used in Appendix A and Eq. (A.1) and Eq. (A.2) a probability density plot over the reached values can be made, see Figure 6.2. It shows that the mean value of the strength of the rods tested with one wedge anchorage and one dead end anchorage is higher than for the rods tested with two dead end anchorages. The standard deviation is also significantly smaller, pointing towards a more reliable testing technique. With the mean value, u,mean = 2900 MPa, and standard deviation, u,std.dev = 55 MPa, inserted in Eq. (A.3) the fifth percentile strength,

Mechanical Anchorage of Prestressed CFRP Tendons
144
u,5th = 2809 MPa. That is well above the ultimate tensile strength of 2500 MPa given by the manufacturer as design value.
2750 2800 2850 2900 2950 3000 30500
1
2
3
4
5
6
7
x 10−3 Normal distribution
Stress, σult
[MPa]
Nor
mal
σult
, μ = 2900 MPa
Stand.div = 55 MPa
Figure 6.2 Probability density plot of the assumed normally distributed ultimate stresses of the five tested wedge anchorages and rods
6.3 Displacements LVDTs are measuring displacements in three points during the tensile loading of the anchorage. Where and in what direction is described in Section 5.7.2.
6.3.1 Slip in Dead End Anchorage LVDT 1 measures the displacement of a point on the rod positioned 70 mm away from the loaded end of the anchorage. Taking into account that the strain is decreasing within the 160 mm long dead end anchorage the anticipated deformation in the position of LVDT 1 can be calculated. This can be done according to Eq. (6.1) for the tensile force of 100 kN in the rod if some further assumptions are done. First the supporting plate of the anchorage is assumed to be stiff. It is also assumed that the average strain in the rod within the anchorage is half of the strain experienced along the free distance.
3100
1 3
100 10 70 80 1.89 mm2 2 50.26 158 10
an anLVDT fr fr
r r
L F Lu L LA E
(6.1)
This value does however not correspond that well to the results from the measurements that are presented in Figure 6.3. The difference can to a large extent be explained with deformation of the test setup that is not measured. The single 100 mm long steel bar and the four parallel 250 mm long bars that can be seen in Figure 5.22 can altogether be strained with up to 1 mm, depending on material parameters. To solve this problem

Evaluation of Laboratory Tests
145
an additional LVDT must be mounted to measure the displacement of the dead end anchorage. This leads to a better approximation of the slip within the anchorage. In this case considerable slip seems to occur in tests 3 and 4 at an applied force between 110 and 120 kN but for the remaining parts of the tests it is not possible to differ between elongation of the test setup and slip in the dead end anchorage.
−10 −9 −8 −7 −6 −5 −4 −3 −2 −1 00
50
100
150
Displacement [mm]
Ten
sile
forc
e [k
N]
Displacement of steel angle close to dead end anchorage
Anchorage 1Anchorage 2Anchorage 3Anchorage 4Anchorage 5
Figure 6.3 Data from LVDT 1 with the anticipated value for a tensile loading of 100 kN included
6.3.2 Strain in Free Part of the Rod Taking the difference in displacement between the measurement points of LVDT 1 and LVDT 2 it is possible to calculate an elongation in the free part of the rod. This elongation can be compared to the elongation computed with its basis in the data from the strain gauge positioned at the centre of the rod. The elongation is calculated by multiplying the measured strain at each applied tensile force with the rods original distance between the measurement points of LVDT 1 and LVDT 2. With a total length of the rod of 660 mm, lengths of the anchorages of 105 and 160 mm and the measurement points positioned 70 and 90 mm away from the anchorages the original length is 235 mm. From this value 25 mm should also be subtracted for the protrusion of the rods in the unloaded ends of the anchorages; altogether this makes a measured original distance of 210 mm, see Figure 6.4.

Mechanical Anchorage of Prestressed CFRP Tendons
146
90LVDT 2
LVDT 1 70
LVDT 3 210 mm
Figure 6.4 Distance used to calculated elongation of rod
In Figure 6.5 the elongation from the LVDTs, LVDT 2 minus LVDT 1, and the elongation calculated based on the strain readings on the rod are compared. Dotted lines are from the strain readings, unfortunately only two of them functioned all the way up to rod failure. However, it is considered that the agreement between the curves is acceptable and that all of the measurements of LVDT 1, LVDT 2 and the strain gauge on the rod are reliable.
−1 0 1 2 3 4 5 60
50
100
150
Elongation [mm]
Ten
sile
forc
e [k
N]
Elongation of rod between LVDT 1 and LVDT 2
Anchorage 1Anchorage 2Anchorage 3Anchorage 4Anchorage 5
Figure 6.5 Difference in displacements of LVDT2 and LVDT1 plotted against strain gauge based calculation of anticipated elongation of the rod at the 210 mm long central section
6.3.3 Slip and Wedge Sliding in the Wedge Anchorage For an approximation of how far the wedges have slid into the barrel during the tensile loading a calculation based on the measurements by LVDT 2 and LVDT 3 can be performed. From the measurements in LVDT 3 the displacement of the wedge anchorage’s supporting plate is monitored. By subtraction of that measurement with the measured displacement of the point 90 mm below on the rod a difference in displacement for each value on the loading can be found. This difference is a combination of four parts, compression of the anchorages steel barrel, elongation of the

Evaluation of Laboratory Tests
147
rod between the unloaded end of the anchorage and the measuring point for LVDT 2, slip of the rod against the aluminium wedges and sliding of the wedges into the barrel.
Compression of the steel barrel is calculated with Eq. (6.2). Where F is the applied force, Ab,mean is the cross sectional area of the barrel at a distance 52.5 mm away from the supporting plate, Eb is the barrels modulus of elasticity and Lb is the length of the barrel.
73
,
105 8.75 10 mm572 210 10comp b
b mean b
F FL L FA E
(6.2)
Elongation of the rod is calculated with Eq. (6.1).
53 70 47.5 1.48 10 mm
2 50.26 158 10an
rod frL FL L F
If finally the slip of the rod against the wedges is assumed to be zero the sliding of the wedge into the barrel can be calculated with Eq. (6.3).
3 2 0wedge LVDT LVDT comp rodu u u L L (6.3)
After the use of Eq. (6.3) the wedge’s sliding during four of the five tests can be seen in Figure 6.6. In test number one the measurements from LVDT 2 failed. It is interesting to notice that the large slide that occurs during the periods of constant loading at 30, 60 and 90 kN. Anchorage five had considerably shorter periods of constant loading and consequently shows a smaller total slide.
−1 0 1 2 3 4 50
50
100
150
Slide [mm]
Ten
sile
forc
e [k
N]
Sliding of wedge into barrel during tensile loading
Anchorage 2Anchorage 3Anchorage 4Anchorage 5
Figure 6.6 Calculated sliding of the wedges into the barrel during tensile loading
The slide of the wedges during presetting should be added to the calculated slide during tensile loading. No displacement measurements were made during this process,

Mechanical Anchorage of Prestressed CFRP Tendons
148
but afterwards a sliding of approximately 6.5 mm could be measured with a ruler. For better accuracy some way to measure this sliding during the entire process should be developed. The slip is an important factor for FE-comparisons.
6.4 Strain Strains are measured at 12 different positions at each anchorage sample and both during presetting and during the tensile loading. The waste amount of raw data produced by the measurements is presented extensively in Appendix B. Here one section presents the results sensor by sensor and one section presents them anchorage by anchorage. Data is brought into this chapter from Appendix B for further discussion.
−1000 0 1000 2000 3000 4000 50000
50
100
150
μs [−]
Pre
setti
ng fo
rce
[kN
]
Circ. strains in sensor 5 during presetting
minmaxmean
−1000 0 1000 2000 3000 4000 50000
50
100
150
μs [−]
Ten
sile
forc
e [k
N]
Circ. strains in sensor 5 during tension
minmaxmean
Figure 6.7 Min, max, and mean values of measured circumferential strain in CS-5 during presetting with 80 kN and tensile loading up to between 140 and 150 kN. Positive values represent tension.

Evaluation of Laboratory Tests
149
An important limitation in processing the strain measurements from the phase of tensile loading is that no account has been taken to the strains introduced during the presetting of the wedges. In other words, all strains have been reset at a zero value not only in the beginning of the presetting phase, but also in the beginning of the phase of tensile loading. This decision was taken once all raw data had been plotted. It could then be noticed that the deviation in strains between one anchorage test and another during the presetting phase were disproportionate in comparison to the deviations during the phase of tensile loading. A few assumptions on why this is the case have been made and they are all related to the testing procedure rather than to the actual behaviour of the anchorage. A higher sampling frequency together with a lower load rate than the 4 kN/s applied in this case must be used during presetting in future tests to provide higher accuracy in the measurements. From the tests made it can be seen that the strain gauges have problems adjusting to the high rate of increase in strain experienced by the sensors mounted closer to the back of the anchorage, i.e. sensors 4-6.
The large spread in values experienced during presetting is exemplified in Figure 6.7; where min, max and mean strain values from sensor 5 in the circumferential direction are shown for the presetting and tensile loading phases.
6.4.1 Weighted Circumferential Stress Different circumferential positions in relation to the wedges for the circumferential strain gauges were used in the different tests. This is due to observations in the FE-model analyzed and due to findings presented by Marceau et al. (2003), see Section 5.7.1. For the circumferential sensor CS-5 the unweighted mean values of all five tests are presented in Figure 6.7. In Figure 6.8 the unweighted mean values for all circumferential strain gauges, CS-1 - CS-6, are compared to the weighted value calculated by Eq. (5.1). Unweighted values are presented as solid lines while the weighted values are presented as dashed lines. The calculation has not been possible to perform for CS-1 during the presetting phase due to missing values in tests 2 and 3, see Table 6.1.
It is obvious from Figure 6.8 that an unweighted mean value with the combination of circumferential sensor positions used in the five tests performed gives a lower strain than the weighted mean value. The difference varies with the sensors and also the loading phases with the largest and smallest differences in the presetting phase. Sensor CS-5 shows a difference of almost 25% while it for CS-2 is close to zero for the presetting phase. For further evaluation of the anchorage the weighted value is always used.
Figure 6.8 does also describe the loading process well. During presetting the sensors towards the back of the anchorage, CS-4 - CS-6, experience the largest circumferential strains. Sensor CS-6 does after an initial steep increase in strain level out at a weighted mean strain of 0.2%, corresponding in loading to the force at which the back of the wedge enters the barrel, see Figure 6.9.

Mechanical Anchorage of Prestressed CFRP Tendons
150
−1000 −500 0 500 1000 1500 2000 2500 30000
10
20
30
40
50
60
70
80
μs [−]
Pre
setti
ng fo
rce
[kN
]
Mean and weighted mean circumferential strains during presetting
CS−1CS−2CS−3CS−4CS−5CS−6
−1000 −500 0 500 1000 1500 2000 2500 30000
50
100
150
μs [−]
Ten
sile
forc
e [k
N]
Mean and weighted mean circumferential strains during tensile loading
CS−1CS−2CS−3CS−4CS−5CS−6
Figure 6.8 Unweighted mean values of circumferential strains in solid lines compared to the weighted mean value in dashed lines for the presetting and tensile phases
Wedge
BarrelCS-6
Figure 6.9 Sketch of the three phases experienced by sensor CS-6 during presetting and tensile loading
In the tensile phase only small changes from the strain applied in the presetting phase can be seen during the first 75 kN. This is due to that the anchorage already has been exposed to this amount of loading once. As found out in the analytical model in Chapter 3 and the numerical model in Chapter 4 only minor retractions of the wedges are experienced due to the removal of the presetting load. During the unloaded phase they are kept in place by the friction between the aluminium in the wedges and the

Evaluation of Laboratory Tests
151
steel in the barrel. Once the wedges start to slide again, at a tensile load in the rod of 70-80 kN, the strain in CS-6 decreases from its relatively high level due to the fact that the back of the wedge passes the measurement point, Figure 6.9. The remaining sensors that still lie in front of the back of the wedges however still experience an increase in strain all the way up to failure.
6.4.2 Variation of Mean Strains due to Load and Location Similar to Figure 6.8 the mean values from longitudinal measurements from sensors LS-1 - LS-6 can also be plotted against the applied force, but then without any comparison to weighted mean values, this has been carried out and is shown in Figure 6.10.
−1500 −1000 −500 0 500 1000 15000
10
20
30
40
50
60
70
80
μs [−]
Pre
setti
ng fo
rce
[kN
]
Mean longitudinal strains during presetting
LS−1LS−2LS−3LS−4LS−5LS−6
−1500 −1000 −500 0 500 1000 15000
50
100
150
μs [−]
Ten
sile
forc
e [k
N]
Mean longitudinal strains during tensile loading
LS−1LS−2LS−3LS−4LS−5LS−6
Figure 6.10 Mean longitudinal strains from sensors LS-1 - LS-6 during presetting and tensile loading
While the circumferential strains were dependent only on the radial expansion or contraction of the barrel the longitudinal strains are dependent on that radial

Mechanical Anchorage of Prestressed CFRP Tendons
152
deformation as well as the longitudinal compression. With that in mind the large deviation in mean longitudinal strain in LS-6 in relation to the strains in the remaining five sensors in Figure 6.10 can be explained.
During the first 20 kN of presetting the wedge is pushed forward until its back reaches the back end of the barrel. This penetration causes the rapid increase in compressive forces on sensor LS-6 due to the longitudinal compression, which should be in magnitude with the remaining five sensors, but also through the longitudinal concavity of the barrels outer surface caused by the barrels radial expansion. As the wedge then continues into the barrel sensor LS-6 experiences tension as the concavity in front of the wedges back edge turns into a convex curvature at the longitudinal position of the wedges back, see Figure 6.11.
Because of this radial deformation experienced predominantly by sensor LS-6 the longitudinal strain does not return to zero between the presetting and tensile loading phases. A consequence is that the resettled curves for the tensile loading in Figure 6.10 to some extent show incomparable results. LS-1 - LS-5 all starts from a value close to zero also without resettlement to zero and actually experience compression while LS-6 still is in tension, although the tension decreases from the final value of the presetting phase.
LS-6 LS-6
Figure 6.11 Compression of LS-6 in front of the wedges back end and tension of LS-6 when the back end of the wedge is at the longitudinal position of the sensor
In the following four graphs, Figure 6.12 and Figure 6.13, the strains are shown as functions of the sensors longitudinal position on the barrel and on the applied force.
Distribution of Longitudinal Strains Figure 6.12 accounts for the remaining longitudinal strains in sensor LS-6 and use the final strain from the presetting phase as starting value for the tensile loading. All remaining sensors are reset at a zero value. It can from the distribution be seen that the highest compressive longitudinal strains occur at the positions of LS-3 and LS-4. At those points the longitudinal force from the wedges is present during the entire presetting as well as tensile loading phases while the material at those positions is thinner than in the front of the anchorage.
It can in LS-1 be seen that the barrels outer surface seems to widen and create a concave part at its intercourse with the supporting plate. Otherwise the compressive strain in LS-1, in line with the reasoning above, should have been slightly less than in LS-2. For LS-6 it is interesting to note that the gauge at first is compressed and then suddenly turns tensed, where it stays for the remaining parts of the loading. At the very

Evaluation of Laboratory Tests
153
end of the tensile loading phase it seems as if also LS-5 experiences some compression due to the radial pressure. That indicates that the wedge has reached a position that also affects sensor LS-5.
0 10 20 30 40 50 60 70 80 90 100−1200
−800
−400
0
400
800
1200
LS−1 LS−2 LS−3 LS−4 LS−5
Long. strain distribution along barrel during presetting
F = 0 kN to 80 kN with 10 kN intervals
LS−6
Distance along barrel [mm]
μs [−
]
0 10 20 30 40 50 60 70 80 90 100−1200
−800
−400
0
400
800
1200
LS−1 LS−2 LS−3 LS−4 LS−5
Long. strain distribution along barrel during tensile loading
F = 0 kN to 150 kN with 10 kN intervals
LS−6
Distance along barrel [mm]
μs [−
]
Figure 6.12 Distribution of longitudinal strains along the barrel during presetting and tensile loading
Distribution of Circumferential Strains For the curves showing strains during the tensile loading phase in Figure 6.13 an initial value of the weighted mean value from the last step in the presetting phase is added. That is done to simplify the understanding of the total strain distribution throughout the entire loading.
Also in the distribution of the circumferential strains along the barrel, seen in Figure 6.13, the sliding of the wedge into the barrels makes a distinct mark. Tensile strain in sensor CS-6 does not increase at all during the tensile loading phase and only limited amounts after 30 kN in the presetting phase. Figure 6.14 shows the back of wedge anchorage number four together with CS-6 and CS-5 after failure of the rod. With the

Mechanical Anchorage of Prestressed CFRP Tendons
154
known diameter of 8 mm of the inner hole, it can be noticed that the wedges have slid approximately 100 mm and thus passed the longitudinal position of CS-6.
Furthermore, it should be noticed that the strain remains reasonably constant during the first 70 kN during the tensile loading phase. In the three sensors in the front of the barrel a small increase can be noticed. That increase corresponds to the change of loading. During presetting the load is applied in the back of the anchorage and a higher degree of force is then also transferred into the barrel in the back of the anchorage. During loading the load is applied in the front of the anchorage, through the rod, more force is then transferred in the front and consequently the barrel experiences more strain in that section.
0 10 20 30 40 50 60 70 80 90 1000
1000
2000
3000
4000
CS−1 CS−2 CS−3
CS−4 CS−5 CS−6
Circ. strain distribution along barrel during presetting
F = 0 kN to 80 kN with 10 kN intervals
Yield line
Distance along barrel [mm]
μs [−
]
0 10 20 30 40 50 60 70 80 90 1000
1000
2000
3000
4000
CS−1 CS−2 CS−3
CS−4 CS−5 CS−6
Circ. strain distribution along barrel during tensile loading
F = 0 kN to 150 kN with 10 kN intervals
Yield line
Distance along barrel [mm]
μs [−
]
Figure 6.13 Distribution of circumferential strains along the barrel during presetting and tensile loading
In Figure 6.13 a yield line is included, the dashed line. The position is based on the measured yield strength of the steel corresponding to a mean value of 463 MPa and an elastic modulus of 205 GPa. As the curves show in Figure 6.13 this strain is reached in both CS-4 and CS-5. No visual signs of this plastic deformation could however be seen during the tests and the same barrel has therefore been used several times. With these
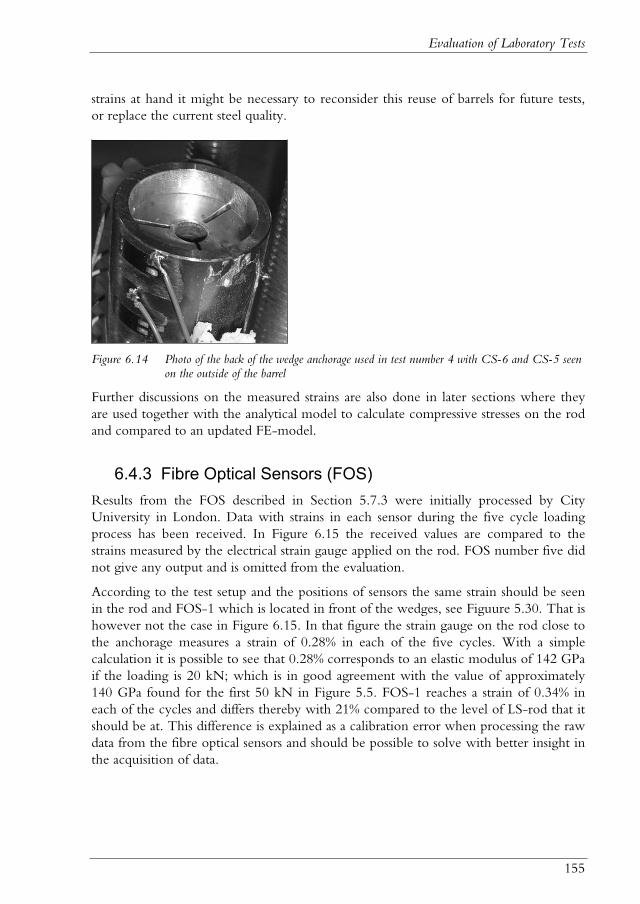
Evaluation of Laboratory Tests
155
strains at hand it might be necessary to reconsider this reuse of barrels for future tests, or replace the current steel quality.
Figure 6.14 Photo of the back of the wedge anchorage used in test number 4 with CS-6 and CS-5 seen on the outside of the barrel
Further discussions on the measured strains are also done in later sections where they are used together with the analytical model to calculate compressive stresses on the rod and compared to an updated FE-model.
6.4.3 Fibre Optical Sensors (FOS) Results from the FOS described in Section 5.7.3 were initially processed by City University in London. Data with strains in each sensor during the five cycle loading process has been received. In Figure 6.15 the received values are compared to the strains measured by the electrical strain gauge applied on the rod. FOS number five did not give any output and is omitted from the evaluation.
According to the test setup and the positions of sensors the same strain should be seen in the rod and FOS-1 which is located in front of the wedges, see Figuure 5.30. That is however not the case in Figure 6.15. In that figure the strain gauge on the rod close to the anchorage measures a strain of 0.28% in each of the five cycles. With a simple calculation it is possible to see that 0.28% corresponds to an elastic modulus of 142 GPa if the loading is 20 kN; which is in good agreement with the value of approximately 140 GPa found for the first 50 kN in Figure 5.5. FOS-1 reaches a strain of 0.34% in each of the cycles and differs thereby with 21% compared to the level of LS-rod that it should be at. This difference is explained as a calibration error when processing the raw data from the fibre optical sensors and should be possible to solve with better insight in the acquisition of data.

Mechanical Anchorage of Prestressed CFRP Tendons
156
0 2 4 6 8 10 12 14−0.5
0
0.5
1
1.5
2
2.5
3
3.5
4x 10
−3
Time [min]
Str
ain
[−]
Strains in FOS and strain gauge on rod
FOS−1FOS−2FOS−3FOS−4FOS−6LS−rod
Figure 6.15 Strains measured in the fibre optical sensors and the strain gauge on the rod during cyclic loading between 0 and 20 kN
More severe is an uncertainty about the order of the fibre optical sensors. It is from preliminary FE-models expected to be a gradual decrease in strains the further into the anchorage that the sensor is positioned. An exception from that is the value from the first sensor within the length of the wedges, FOS-2, which should be slightly higher than the value from FOS-1. This exception is due to the small curvature of the rods surface that the wedge induces as it grips the rod. In Figure 6.15 it is however not FOS-2 that has slightly higher values than FOS-1, but FOS-6; which is positioned in the back of the anchorage where the strain must be close to zero. All stresses causing strains in FOS-6 must be transferred into the wedges at the short longitudinal distance between FOS-6 and the back of the wedge. If then the strain in FOS-6 is as high as in front of the anchorage it means that no stress at all has been transferred along the first 85 mm of the wedges.
The reasoning above gives rise to a suspicion that FOS-6 has taken the position of FOS-2 in the evaluation. When discussing this with the City University they also say that this might be the case since the strains are very complicated to evaluate due to close placements of the sensors on the fiber. This may also lead to a scatter in the refraction index. For the remaining sensors it is not possible to clearly detect if any more mix-up has occurred. Those sensors do nevertheless show some behaviour that would be interesting to study further. For example the non-zero values of sensors designated FOS-3 and FOS-4 after unloading might give information on how the friction works within the anchorage. Is it so that strains in the rod in the front of the anchorage are less affected by the friction due to less radial pressure and return to a value closer to zero after unloading? In that case the sensor designated FOS-3 also might be positioned at the position of where FOS-3 should be positioned since it returns closer to zero than FOS-4. Unfortunately no successful measurement from FOS-5 could confirm this theory and values from the sensor designated FOS-2 are suspected to be mixed up as well as difficult to explain due to its non-linearity.

Evaluation of Laboratory Tests
157
Altogether the fibre optic system used gave a good insight to the possibilities of using FOS in this particular application. The outcome from the FOS monitoring will later be compared in shape with the outcome from a new FE-model in Section 6.6. From these measurements it can also be concluded that the control of the FOS measurements must be more rigorous and that an improved understanding of the equipment is crucial. New tests are also planned in the near future by the use of FOS sensors integrated in the CFRP rod.
6.5 Radial Pressure from Thick-Walled Cylinder Theory
In Chapter 4 an attempt to use an axi-symmetric analytical model to describe the stress distribution within the anchorage after a prescribed sliding of the wedges was performed. The attempt did not succeed due to problems in the solution of the intricate system of equations put up. On its way the solution produced some equations that in spite of the missing solution of the entire problem might be used to transform measured strain on the barrel into radial pressure on the rod. When these equations are used it must however be remembered that they are derived with an assumption of axial symmetry and plane stress or plane strain. In this section plane stress conditions are used. With that assumption and the axial symmetry it is assumed that the different parts of the anchorage act as cylindrical objects free to deform in the longitudinal direction, i.e. no friction and no conical shapes exist at the interfaces between the materials. A brief description of how the equations from Chapter 4 are used here is given in the following derivation.
By the knowledge of the circumferential strain, , at the outer surface of the barrel it can be calculated to what level the radius of the barrel has increased, see Figure 6.16. With the notation from Section 3.4.2 used that means that ubo and consequently n3 is known.
L
Lrbo
n3
3
3
2bo bo
L LL Ln
u n r
Figure 6.16 Conversion of measured circumferential strains into radial expansion of the barrels outer surface

Mechanical Anchorage of Prestressed CFRP Tendons
158
With this knowledge of the variable n3 the system of equations reached in Section 3.4.2 becomes overdetermined. Ten equations are listed but only nine variables are available. Due to this no solution to the stated problem will be found. One of the available material or geometrical parameters must therefore be set to unknown as a replacement for the radius of the barrel after insertion of the wedges. Since all material parameters for steel and aluminium are quite well established as well as all geometrical parameters of the anchorage either the elastic modulus or Poisson’s ratio of the rod should be variable. In this case the elastic modulus, which earlier has been assumed to be 10 GPa is varied. With a prescribed penetration, l, of the wedges, see Figure 3.19, the measured circumferential strain now relies on a certain inner pressure on the barrel, which in turn relies on a certain inner pressure on the wedges. With that inner pressure known the elastic modulus that the rod must have to facilitate the strain on the barrels surface can be calculated.
That the equations end up with an elastic modulus of the rod of 10 GPa is however not that important. The model that the equations are based upon is after all a model with several simplifications that will present an outcome that differs to some extent from the real expected values. On the other hand, the model can predict the longitudinal distribution of pressure along the rod. With a measurement every nineteenth mm this might give some clue on how the design of the anchorage works.
Two states in the loading process are used for the calculations; the first calculation is carried out at the end of the presetting where the sliding of the wedge in average is measured to be 6.5 mm. The second calculation is done at the end of the tensile loading phase when the sliding of the wedges is 6.5 + 3.5 mm = 10 mm, see Figure 6.6. For each calculation the weighted mean circumferential strain at each position and in the two states are used. These strains can be seen in Figure 6.13 and they are tabulated in Table 6.3. For strains after the tensile loading also the strains resulting from the presetting are included, i.e. they have not been reset to a zero value at the beginning of the loading phase.
Table 6.3 Values used for calculations with the thick-walled cylinder theory
CS-1 CS-2 CS-3 CS-4 CS-5 CS-6 Longitudinal position [mm] 5 24 43 62 81 100 Inner barrel radii, rbi [mm] 9.43 10.42 11.42 12.42 13.41 14.41
Presetting ( l = 6.5 mm)Strain, [-] 5.78e-5 1.84e-4 5.12e-4 1.60e-3 2.08e-3 1.96e-3
Outer wedge radii, rwo [mm] 9.37 10.49 11.61 12.73 13.85 14.88 Tensile loading ( l = 10 mm)
Strain, [-] 4.21e-4 8.63e-4 1.82e-3 2.87e-3 4.27e-3 1.64e-3
Outer wedge radii, rwo [mm] 9.58 10.70 11.82 12.94 14.06 -

Evaluation of Laboratory Tests
159
Table 6.3 also shows the initial thicknesses of the barrel and wedges at the longitudinal positions for each sensor and in each of the two states of wedge sliding. No consideration is taken in these calculations to the longitudinal compression that occurs in the barrel as well as in the wedge. Already during the presetting the back of the wedges has passed the central position of CS-6 with 1.5 mm but as an approximation the radius on the back of the wedges is used. When the wedges in the end of the tensile loading phase have passed the position of CS-6 even further nocalculations are made with the strain from that sensor. As inner radii on the wedges, rwi, and outer radii on the rod, rro, 4 mm is used. Material values are according to Table 5.3 70 and 205 GPa for the aluminium and steel respectively. Poisson’s ratios are 0.3 for the CFRP and steel and 0.34 for the aluminium, see Table 3.4.
All steps in the calculations to reach the radial pressure on the rod, p1, and the radial deformation of the rod, uro, are based on Eq. 3.46. In the first step Eq. 3.46 is solved for the radial pressure in the wedge barrel interface, p2, with the outer radial expansion of the barrel, ubo = n3 - rbo, where rbo = 18 mm. This calculation tells the size of the inner pressure that is necessary to deform the outer surface according to the measurements for a given radii and thickness of the barrel:
2 2
2 3 22bo bi
b bobi bo
r rp E n rr r
(6.4)
In a second step the inner deformation of the barrel is sought, ubi = n2 - rbi. That is, with the given inner pressure on the barrel, what is the new inner radius, n2?
2 2
2 2 2 2
1 1b bi b bobi bi
b bo bi
r rn r r p
E r r (6.5)
In the third step this new inner radius of the barrel is used as a measure of the deformation of the wedge’s outer surface, uwo = rwo - n2, to calculate the radial pressure on the wedge’s inner surface:
2 22 22
1 2 2 2 22w wo wiwo wo wi
wo ww wo wi wi wo
E r rp r r rp r nE r r r r
(6.6)
With the inner as well as the outer pressure on the wedge given the new inner radius of the wedge at the given longitudinal section, n1, can be found with uwi = rwi - n1:
2 2 21 2
1 2 2 2 2
2wi wo wi wo wiwi w
w wo wi w wo wi
p r r r r rpn rE r r E r r
(6.7)

Mechanical Anchorage of Prestressed CFRP Tendons
160
The outcome from Eq. (6.6) can be seen in Figure 6.17.
0 20 40 60 80 1000
0.2
0.4
0.6
0.8
1
1.2 CS−1 CS−2 CS−3 CS−4 CS−5 CS−6
Wedge and sensor positions
Distance along barrel [mm]
Nor
mal
ized
rad
ial p
ress
ure
[−]
After presettingAfter tensile loading
Figure 6.17 Radial pressure on the rod normalized with respect to radial pressure at the longitudinal position of CS-5 after tensile loading
Both curves in Figure 6.17 are normalized with respect to the highest pressure after tensile loading. That is the pressure calculated at the longitudinal position for sensor CS-5; which for this case is the unrealistically high value of 13.7 GPa. In the top of the figure a sketch of the wedges assumed position in relation to the barrel and the strain sensors is drawn for the two states of loading. In Figure 6.18 similar curves as in Figure 6.17 are presented for the radial pressure on the barrels inner surface. These curves are normalized to the maximum value as well; which in this case is 351 MPa. The big difference in maximum values between the pressure on the inner surface of the barrel and the inner surface of the wedges can be referred to the model assumption. Since the radial expansion of the barrel is known and the barrel is realistically modelled with the axi-symmetric model the pressure necessary to cause the known expansion should be realistic as well. The wedges are however not that well described by the axi-symmetric assumption and for them to cause the radial pressure onto the barrel with the prescribed
Since the elastic modulus was lifted out as a variable in the beginning of the solution an equation based upon the radial deformation of the rods outer surface, uro = rro - n1,can be set up to find the elastic modulus necessary to fulfil the strain measurement and the assumptions done in the earlier parts of the solution.
1
1
1ro rr
ro
p rE
r n (6.8)

Evaluation of Laboratory Tests
161
deformations an exceptionally high inner pressure is necessary. Modules of elasticity between 29 and 33 GPa and deformations of the rod with up to 1.2 mm are a consequence of that.
0 20 40 60 80 1000
0.2
0.4
0.6
0.8
1
1.2 CS−1 CS−2 CS−3 CS−4 CS−5 CS−6
Wedge and sensor positions
Distance along barrel [mm]
Nor
mal
ized
rad
ial p
ress
ure
[−]
After presettingAfter tensile loading
Figure 6.18 Radial pressure on the barrels inner surface normalized with respect to radial pressure at the longitudinal position of CS-5 after tensile loading
As long as the high absolute values for the radial pressure onto the rod can be disregarded the thick-walled cylinder model gives a good approximation of the longitudinal distribution of radial stresses. In the rod-wedge interface seen in Figure 6.17 both the curves for the presetting phase and the tensile phase show a favorable distribution with high stresses in the back of the anchorage while the stresses in the front are kept low. With this distribution the high principal stresses discussed in Section 3.2.1 should be minimized and the frontal overload failure load described in Section 5.4.1 can be avoided. For the presetting state in Figure 6.17 some inconsistency can be seen in the values for CS-1 and CS-6. That depends on the sliding of the wedge which has not reached far enough into the barrel to make contact to the barrel at CS-1 while it has passed the position of CS-6 with 1.5 mm. In Figure 6.18 the value for CS-4 is higher than expected compared to the surrounding measurements. Since both the thicknesses of the wedge and the barrel vary linearly along the anchorage the pressure should vary linearly as well with an anticipated higher pressure in the position of CS-5 than in CS-4. When it comes to the state of tensile loading the levels correspond better to the expectations and it might be suspected that something is wrong with the weighted mean value from CS-4 during the presetting phase.

Mechanical Anchorage of Prestressed CFRP Tendons
162
6.6 Comparison of Measurements with FE-Model At the end of chapter four the discussion of the FE-model used for the parametric study concludes that the simple model used does not describe the later developed anchorage. It merely serves as a tool in the process and an improved model is necessary to predict the actual behaviour and stress distributions in the final anchorage design. In the requirements for the new model four points are stated, see chapter 4, which must be considered to improve the model in such a way that the model at least should be possible to accurately describe the anchorage. Two of these points are also fulfilled in the new model created for the evaluation of the laboratory tests but two of them are left for future work. One point that is here taken into consideration is the reduction of number of elements due to symmetry; which in turn facilitates the second improvement of a better description of the geometry. Through the decreased number of elements the elements can be made more complicated and still not use more computational time. Due to that also small curvatures at the edges of the parts can be modelled which reduce stress concentration and give a better overall picture of the final stress distribution. Material properties for the steel and aluminium are included based upon the material tests described in appendix A. The two parts that have not been possible to determine yet are the frictional parameters between the materials and the transverse properties of the rod.
How the new model is designed can be found below, in the next section. After that follows a number of sections where the model is compared to results presented earlier in this chapter and in appendix B.
6.6.1 Refined FE-Model
MaterialsGenerally the material parameters used are the same as for the materials in the FE-model created in Section 4.2.2. All densities and Poisson’s ratios are the same. For elastic modules, yield stresses, ultimate stresses and ultimate strains of the materials the values in Table 6.4 are used. The shapes of the stress-strain curves are modelled as in Figure 4.13.
Table 6.4 New material values used for the FE-model created in this chapter
Esteel
[GPa]
Ealum.
[GPa]
ECFRP
[GPa]u,steel
[MPa]u,alum.
[MPa]y,steel
[MPa]y,alum.
[MPa]u,steel
[%]u,alum.
[%]205 70 158 512 372 463 358 17.1 9.4
Lack of knowledge of the transverse properties of the CFRP rod makes the modelling uncertain. In the present model a value of the transverse modulus of elasticity of 7 GPa is used, that is a decrease with 3 GPa compared to the model used in chapter 4. That 7

Evaluation of Laboratory Tests
163
GPa is chosen is a result of preliminary analyses where the wedge penetration with that transverse modulus of elasticity corresponds well to the measurements done on the anchorages.
Geometry With an anchorage with three wedges three types of symmetry can be found as long as the spacing between the wedges is assumed to be equal. Either half the anchorage can be modelled with a section through one of the spacings in between the wedges and one straight through one wedge. Additional symmetry is found if a section is taken from the central axis of the anchorage and through all three spacings. The third symmetry plane can be found if a cut in addition to the cuts through the spacings is also made at the centre of the wedges. In the first type half of the anchorage is modelled, in the second one third and in the third only one sixth of the anchorage is modelled. Schematic drawings of the discussed symmetries are shown in Figure 6.19.
Figure 6.19 Cross section of complete anchorage and the three types of symmetry available
For the present model the second type of symmetry, with one third of the anchorage involved, is modeled. Analyses with the third type were also performed but the decrease in computational time was small and by using the second type it could easily be confirmed that symmetry was achieved during the assembly of the model; thus giving a small hint as to whether the model behaves correctly.
Due to the use of symmetry no consideration is taken to the thin connection between the wedges. That decision is also taken with consideration to the computational time since a pilot model with that part involved required a dense mesh at the inner surface of the wedge. That this piece is omitted should not affect the stresses and strains in any considerable way since it is applied to the anchorage merely to prevent crushing of the CFRP and to increase the frictional area. In this model no crushing is possible since the material is elastic and the increased friction can be achieved by a slightly higher friction coefficient for the remaining surfaces.
All parts in the anchorage are with exception for the connection modeled with the geometrical properties given in the sketch for the long anchorage in Figure 5.17. That means a 105 mm long barrel with an outer diameter of 36 mm and inner diameters of 18.33 and 29.34 mm respectively, resulting in a 3° angle of the inner surface in relation to the anchorages central axis. The wedge is 95 mm long with a 5 mm radius in the

Mechanical Anchorage of Prestressed CFRP Tendons
164
front that shortens the effective inner length of the wedge to 90 mm. Its inner diameter is 8 mm and the two outer diameters are 18.59 and 29.76 mm, creating an angle of 3.37° towards the central axis. To fit into the wedges the rods diameter is also 8 mm. The difference in maximum outer diameter of the wedge and the maximum inner diameter of the barrel prevents the wedge from fitting perfectly into the barrel. Before presetting the back end of the wedge is positioned 4 mm behind the back end of the barrel, with that distance some space is also fitted in between the parts to avoid overclosure at sensitive nodes. This and the complete design are shown in Figure 6.20.
a
(a)
(b)
(c)
Figure 6.20 Design of the new FE-model used for evaluation of test results
In Figure 6.20c it can in addition to the small spacing between the parts also be noticed that a small curvature is added to the inner edge of the barrel as well as the outer edge of the wedge. The radius is 0.2 mm and 0.4 mm for the barrel and the wedge, respectively. Similar curvature is also applied to the inner edge of the wedge to avoid stress concentrations on the rod. These curvatures are also manufactured in the test anchorages and can for example be seen in Figure 5.14.
The cross section in Figure 6.20a shows how the symmetry is created with two sections taken in the spacings at each side of a wedge. A division of the circular section into 10° segments and two 5° segments at each end makes it possible in a reasonable computational time to create a good representation of the anchorage. Each wedge cover with this division 110° and each spacing between the wedges cover 10°. In reality the spacings are made straight with a uniform thickness, not with a uniform angle.
MeshingTo a major extent the meshing of the main body parts of the anchorage are the same as in Section 4.2.3. The differences are made in the areas where a curvature is applied and in the circumferential direction due to the symmetry applied. Magnified views of the mesh in those parts are seen in Figure 6.21.

Evaluation of Laboratory Tests
165
Figure 6.21 Details of the meshing of the circular segment modelled, the front of the wedge and the back of the barrel and the wedge.
Most elements are of the type C3D8R which is a linear eight node element with reduced integration. The exceptions are the wedge shaped elements in the interior of the rod and in the outer part of the back of the wedge, these elements are six node elements and of the type C3D6R.
Interfaces, Boundary Conditions and Loading Properties for the interfacial contacts between the wedge and the barrel are the same as in the earlier presented model and can be found in Section 4.2.2. For the rod-wedge interface, properties simulating a state close to sticking are applied. For static friction the value 0.9 and for kinetic friction the value 0.8 are used. This type of interface should better describe the case with glue applied to the rod. Loads are applied as in Figure 4.14 in Section 4.2.2. but with changed values. During the presetting phase a 26.6 kN force is applied to simulate the 80 kN presetting applied to the entire system during the laboratory tests. In the tensile phase the maximum load of 2500 MPa has been increased to correspond to the mean value of 2891 MPa found during the tests with the dead end anchorages.
In order to facilitate the symmetry, a number of new boundary conditions were necessary. The longitudinal condition found in Figure 4.14 is kept but to describe the test conditions now spread over the entire face of the barrel front. In the horizontal and vertical directions a system with two rigid bodies is used. These bodies are applied to the model but are not meshed and can not deform. They can however move, but in this case the possible movement in all degrees of freedom is set to zero. One body is applied at each surface of symmetry and they meet at the central longitudinal axis. The system can be described as a chute in which the parts of the anchorage may slide. As the interaction between the parts and this chute is created the friction is set to zero. It is also prescribed that once the barrel or rod has made contact with the chute it can not open the gap again. With this solution no restriction in the longitudinal motion and deformations of the parts is applied by the rigid bodies. In the radial direction the system is however restricted to deform infinitely by the “once contact, always contact” solution. To expand in the radial direction the barrel is forced into a stretch in the

Mechanical Anchorage of Prestressed CFRP Tendons
166
circumferential direction. This chute and the longitudinal boundary conditions are seen in Figure 6.22.
Figure 6.22 Boundary conditions used in the new FE-model
6.6.2 Confirmation of Units Finite element models can be complicated, with a large amount of parameters that are to be defined. As a first measure taken in the evaluation of the results from the analysis a confirmation that the units are consistently given to the software must be performed. At the same time the loading and boundary conditions are checked as well. Here the strain within the free part of the rod is checked. It should correspond to the linear elastic behaviour given in the material model and also correspond to the values measured by the electrical strain gauge mounted on the centre of the rod in the laboratory tests. Values from the laboratory tests are found in Appendix B. In Figure 6.23 it can be noticed that the value at an arbitrary point in the loaded and free part of the rod in this model fits well together with the measured and also the calculated values.
0 4000 8000 12000 16000 200000
50
100
150
μs [−]
Ten
sile
forc
e [k
N]
Strain in free part of rod during tensile loading
Anchorage 1Anchorage 2Anchorage 3Anchorage 4Anchorage 5FE−modelCalculated
Figure 6.23 Strain in the free part of the rod during tensile loading

Evaluation of Laboratory Tests
167
With this knowledge at hand the remaining results can be looked upon as a result of the finite element model described and not a result of mistakes done during the assembly of the model.
6.6.3 Wedge Sliding Calibration of the transverse modulus of elasticity of the CFRP was performed with achieved sliding after presetting as a design parameter. The sliding after presetting in the model is consequently chosen close to the measured sliding in the laboratory tests; which at an average was 6.5 mm. This sliding can be noticed in the left part of Figure 6.24. In the right part of the figure the sliding after tensile loading using the same model is shown. Increased sliding due to the increase in longitudinal load is in the final state 2.5 mm.
6.4 mm
After presetting
8.9 mm
After tensile loading
Figure 6.24 Sliding of wedge into the barrel
In Figure 6.25 the variation of sliding during the tensile phase compared to the calculated movement from the laboratory tests is presented. The calculated curves are individually shown in Figure 6.6. Both curves describe a similar path where the sliding in the beginning of the loading is prevented by stresses applied during presetting. Laboratory tests do however show a lower level at which the sliding restarts in the tensile phase. Similar values are found for the ultimate sliding of the wedges in both cases. It must be noted that the value of 3.5 mm from the curves in Figure 6.25 does not correspond to the difference in ultimate positions found in Figure 6.24. This difference is explained by a reverse sliding, experienced by the wedge in the FE-model when the presetting force is removed and no tensile force is applied in the tendon.

Mechanical Anchorage of Prestressed CFRP Tendons
168
−0.5 0 0.5 1.0 1.5 2.0 2.5 3.0 3.5 4.00
50
100
150Sliding of wedge into barrel during tensile loading
Slide [mm]
Ten
sile
forc
e [k
N]
FE−modelMean from laboratory test
Figure 6.25 Comparison of wedge sliding during the tensile loading phase for the FE-model and the mean value from the laboratory tests
In the following two sections strains on the outer surface of the barrel are presented. These strains are measured at six positions in the laboratory tests. Each of those sensors is simulated in the FE-model and the results are presented in a way that is comparable to the results from the laboratory tests.
6.6.4 Longitudinal Strains on Barrel
Figure 6.26 Longitudinal strains on the outer barrel surface at maximum tensile load
Figure 6.26 presents an overall picture of the longitudinal strains on the barrels outside surface when 2891 MPa of tensile stress is applied in the CFRP tendon. Generally, it can be seen that the highest longitudinal strains are found around 25 mm in front of the back end of the barrel. That is almost 15 mm in front of the back of the wedge at this state of loading. Each element in the mesh is 5 mm long in the longitudinal direction.

Evaluation of Laboratory Tests
169
No tensile longitudinal strains are found in this state of loading as the case is for sensor LS-6 from the laboratory tests, see Figure 6.12.
Measurements of longitudinal strains are in the laboratory tests performed in six positions spread in the longitudinal direction of the barrel according to Figure 5.23. Mean values from those tests are presented in Figure 6.10 and the individual values in Appendix B. Since the sensors measuring those strains are 6.1 mm long and positioned randomly in the circumferential direction an average from a defined number of nodes in the FE-model must be used for comparison. For that reason each of the sensors LS-1 - LS-6 is represented by altogether 42 nodes. Nodes used for LS-1 are seen in the left part of Figure 6.27. In the right part the central node for each of the remaining sensors are seen. Average values to use for comparison with measurements from each sensor are then taken over nodes with the same spread as in the left part of the figure involved. Also for the comparison with circumferential measurements in the following sections these representations of each sensor are used.
Figure 6.27 Left: The 42 nodes that are used for calculations of average strains in LS-1 and CS-1; Right: Longitudinal positions for sensors L/CS-1 - L/CS-6
Figure 6.28 show the relative spread between the values that at a later stage are averaged for comparison with sensors LS-1 and LS-6 during presetting. The same scale is used in both graphs and it is obvious that the values in the back of the anchorage where the wedge has caused maximum radial impact on the barrel are more scattered. A similar pattern can be found also for the circumferential measurements.

Mechanical Anchorage of Prestressed CFRP Tendons
170
−1000 −500 0 5000
10
20
30
40
50
60
70
80
μs [−]
Pre
setti
ng fo
rce
[kN
]
−1000 −500 0 5000
10
20
30
40
50
60
70
80
μs [−]
Pre
setti
ng fo
rce
[kN
]
Figure 6.28 Spread in the values used to represent sensor LS-1(upper) and LS-6 (lower) during the presetting phase
Generally it can also be noticed that the longitudinal strains increase the further back in the anchorage they are measured. This can be seen in Figure 6.29 and should be compared to the variation of mean values from the laboratory tests seen in Figure 6.10. It should be noted that the scaling is different between curves from the laboratory tests and the FE-model. If a common scaling is to be withheld the variation in strains during the tests will be hard to detect.
For the sensors LS-1 - LS-3 the longitudinal strains in Figure 6.29 during presetting correspond well to the strains measured in the laboratory and seen in Figure 6.10. Regions where values for those mean values are taken have not yet been affected by large radial stresses and are purely affected by the longitudinal force applied in the back of the anchorage. For sensors LS-4 and LS-5 the longitudinal strains during presetting are considerably higher in the FE-model than in the laboratory tests. The maximum absolute value reached in the tests is 600 s while in the FE-model it is 1600 s. Sensor

Evaluation of Laboratory Tests
171
LS-6 does to some extent show the same behaviour as in tests but while the sensor in the tests become tensed it remains compressed throughout the presetting phase in the FE-model. For the tensile phase again the curves for three first sensors describe a similar shape in the FE-model as in the tests. Initially the curves show tension in all of the sensors but LS-6. That is due to the sliding of the wedges in the backward direction described in the previous section and can to some extent be overseen in the comparison. LS-4 - LS-6 seem more affected by the wedge penetration also in this phase and they increase as the load is at a level comparable to the presetting load.
−3000 −2500 −2000 −1500 −1000 −500 0 5000
10
20
30
40
50
60
70
80
μs [−]
Pre
setti
ng fo
rce
[kN
]
LS−1LS−2LS−3LS−4LS−5LS−6
−3000 −2500 −2000 −1500 −1000 −500 0 5000
50
100
150
μs [−]
Ten
sile
forc
e [k
N]
LS−1LS−2LS−3LS−4LS−5LS−6
Figure 6.29 Upper: Mean longitudinal strains on barrel during presetting, from the FE-model; Lower: Mean longitudinal strains on barrel during tensile loading, from the FE-model
Next a representation of how the longitudinal strains vary along the longitudinal length of the barrel is given in Figure 6.30. These curves are comparable with the curves in Figure 6.12 although different scaling on the y-axis is used. For the tensile loading

Mechanical Anchorage of Prestressed CFRP Tendons
172
phase the curves also differ in that the values for each sensor in Figure 6.30 not are reset at zero. This was done in Figure 6.12 for all sensors but LS-6.
0 10 20 30 40 50 60 70 80 90 100
−4000
−3000
−2000
−1000
0
LS−1 LS−2 LS−3LS−4
LS−5
LS−6
Yield line
Long. strain distribution along barrel during presetting (FEM)
F = 0 kN to 80 kN with 10 kN intervals
Distance along barrel [mm]
μs [−
]
0 10 20 30 40 50 60 70 80 90 100
−4000
−3000
−2000
−1000
0
LS−1LS−2
LS−3
LS−4
LS−5
LS−6Yield line
Long. strain distribution along barrel during tensile loading (FEM)
F = 0 kN to 150 kN with 10 kN intervals
Distance along barrel [mm]
μs [−
]
Figure 6.30 Distribution of longitudinal strains along the barrel during presetting and tensile loading. Values are from the FE-model and should be compared with the curves in Figure 6.12
From the FE-model a large section of the barrels outer surface is yielding, not only in the circumferential direction but also in the longitudinal. In the position of LS-5 the strain reached 2‰; which is close to yielding but far below the strain required for steel hardening, see Figure 4.13 and Appendix A.
Both during presetting and tensile loading the FE-model differs predominantly in the rear region compared to the laboratory tests. In the three sensors in the front of the anchorage the behaviour and values on the strains are similar.

Evaluation of Laboratory Tests
173
6.6.5 Longitudinal Strains on Rod Similar to the gathering of data from the barrel also an average value is used for the rod. This value is based upon readings from 42 nodes. The longitudinal positions of the central nodes as well as the look of the set of nodes used for the calculations of the average value are seen in Figure 6.31. The wedge is included in this picture to underline the readings position in relation to the wedge.
Figure 6.31 Shape of the set of nodes used to calculate a mean value for each sensor, in this particular case for FOS-1, and central positions for each simulated sensor
Even though strains in the rod were only measured during the tensile loading with the fibre optical sensors it might be interesting to also follow these strains during the presetting. During that initial phase the rod is free to move in the longitudinal direction and it might therefore be reasonable to believe that no longitudinal strains are implied. This is not true. Small strains can through the FE-model be detected in the rod also during that phase. Those are shown in the left part of Figure 6.32 while the right part show values for one tensile loading up to 20 kN. These values should be compared to those given from the FOS in Figure 6.15. For that reason the readings are reset at zero although it is known that some strains are implied into the rod already during the presetting phase.

Mechanical Anchorage of Prestressed CFRP Tendons
174
0 4000 8000 12000 16000 200000
10
20
30
40
50
60
70
80
μs [−]
Pre
setti
ng fo
rce
[kN
]
FOS−1FOS−2FOS−3FOS−4FOS−5FOS−6
0 4000 8000 12000 16000 200000
50
100
150
μs [−]
Ten
sile
forc
e [k
N]
FOS−1FOS−2FOS−3FOS−4FOS−5FOS−6
Figure 6.32 Upper: Longitudinal strains in the rod during presetting taken from the FE-model; Lower: Longitudinal strains in the rod during tensile loading taken from the FE-model
Linear increase in strain in all of the positions of the fibre optical sensors reveals a soft behaviour without any slip or sudden redistributions of stresses. This is favorable since the kinetic energy developed during slip is of great magnitude and difficult to resist once it has developed.
After comparison between the results from the FE-model shown in Figure 6.33 and the fibre optical measurements in Figure 6.15 more differences than similarities are found. The lower strain after 20 kN of loading in the FE-model is explained by the difference in modulus of elasticity used. For the FE-model the average value of the CFRP of 158 GPa is used throughout the loading. Figure 5.5 does however show how the modulus in reality varies with the load applied and is only 140 GPa in the first third of the loading phase.

Evaluation of Laboratory Tests
175
In the FE-model all of the three sensors in the front are close to the maximum strain level, in the laboratory tests only two sensors showed this high strains after 20 kN of loading. This suggests that the wedges in the laboratory tests squeeze the rod better at low tensile forces. In the FE-model a small uplift of the front of the wedge towards the surface of the barrel can be seen. It is possible that the connections between the wedges prevent this uplift and keep them tight around the rod.
0 0.5 1 1.5 20
500
1000
1500
2000
2500
3000
Time [min]
μs [−
]
FOS−1FOS−2FOS−3FOS−4FOS−5FOS−6
Figure 6.33 Strains in the simulated fibre optical sensors in the FE-model for the first 20 kN of tensile loading. These values should be compared with Figure 6.15
For sensors FOS-4 and FOS-5 the strain increases in a higher rate than the remaining sensors in Figure 6.33. This can be explained by the higher compressive stresses stored in the rod at the positions of those sensors during the presetting phase. This compressive strain is released once the rod is tensed and give the steep increase due to that the values are reset to zero in Figure 6.33. Stored strains in FOS-6 are however not released, that would have meant a sudden slip of the rod.
It is no doubt about that the strain in FOS-6 should be the lowest strain among the sensors, which is the opposite of what the laboratory measurements shows.

Mechanical Anchorage of Prestressed CFRP Tendons
176
6.6.6 Circumferential Strains Figure 6.34 show that as in the case with longitudinal strains the circumferential strains on the outer surface of the barrel are also at their maximum slightly in front of the wedges back. In this case approximately 10 mm in front compared to 15 mm for the longitudinal strains.
Figure 6.34 Circumferential strains on the outer barrel surface at maximum tensile load
In Figure 6.35 the mean values from simulations of the six sensors CS-1 - CS-6 are presented. These values are the mean of one third of the entire circumferential section of the anchorage and do as such correspond to the weighted mean values in Figure 6.8. The scaling of the x-axis is not identical between the curves for the laboratory tests and these curves from the FE-model.
In shape the circumferential strains from the FE-model correspond well to the curves for the laboratory tests in Figure 6.8 with some exceptions. During the presetting phase the increase in strain in CS-6 in the laboratory tests is more rapid than in the FE-model. On the other hand the strain in the laboratory tests is levelled out after an applied force of 20 kN, this is not the case in the FE-model where the strain increases throughout the presetting phase. This increase continues in the tensile phase while CS-6 in the laboratory tests experience a small decrease in strain during the same loading process. It is as for the longitudinal strains possible to see that the increase in strains in the tensile phase begins later in the FE-model than in the laboratory tests although the point where it happens is distinct in both cases.
Even if the shapes are similar the magnitude of the strains varies widely between the FE-model and the laboratory tests; both in the presetting and tensile phases the strains in the FE-model are approximately three times higher.

Evaluation of Laboratory Tests
177
0 1000 2000 3000 4000 5000 60000
10
20
30
40
50
60
70
80
μs [−]
Pre
setti
ng fo
rce
[kN
]
CS−1CS−2CS−3CS−4CS−5CS−6
0 1000 2000 3000 4000 5000 60000
50
100
150
μs [−]
Ten
sile
forc
e [k
N]
CS−1CS−2CS−3CS−4CS−5CS−6
Figure 6.35 Upper: Mean circumferential strains during presetting taken from the FE-model; Lower: Mean circumferential strains during tensile loading taken from the FE-model
From the curves in Figure 6.36, which should be compared with Figure 6.13, the similarity between the model and the laboratory tested anchorages is obvious. The large difference is the amount of plastic strain that the barrels outer surface on an average is exposed to in the end of the different loading phases. In the measurements in the laboratory 50% of the barrel was in a yielded state with a maximum plastic strain of 2.5‰. In the FE-model the same numbers are 60% and 9‰.

Mechanical Anchorage of Prestressed CFRP Tendons
178
0 10 20 30 40 50 60 70 80 90 1000
2000
4000
6000
8000
10000
12000
CS−1 CS−2 CS−3
CS−4
CS−5
CS−6
Yield line
Circ. strain distribution along barrel during presetting (FEM)
F = 0 kN to 80 kN with 10 kN intervals
Distance along barrel [mm]
μs [−
]
0 10 20 30 40 50 60 70 80 90 1000
2000
4000
6000
8000
10000
12000
CS−1 CS−2 CS−3
CS−4
CS−5
CS−6
Yield line
Circ. strain distribution along barrel during tensile loading (FEM)
F = 0 kN to 150 kN with 10 kN intervals
Distance along barrel [mm]
μs [−
]
Figure 6.36 Distribution of circumferential strains along the barrel during presetting and tensile loading. Values are from the FE-model and should be compared with the curves in Figure 6.13
6.6.7 Radial Pressure Radial pressure is earlier in this chapter approximated for the rod-wedge and wedge-barrel interfaces with the thick-walled cylinder theory derived in Chapter 3. The approximation relies on measured circumferential strains on the barrels outer surface and is as such related to the laboratory tests performed. Magnitudes of the strains on the rods surface become with this approach exceptionally large due to the nature of the theory, results were therefore presented as curves normalized with respect to the highest calculated value after tensile loading. These curves are presented in Figure 6.17 and Figure 6.18 and to confirm the shape of them the radial stresses in the interfaces between the parts of the anchorage in the FE-model are also presented below.

Evaluation of Laboratory Tests
179
Barrels Inner Surface Figure 6.37 show a 3D plot of the normal pressure on the inner surface of the barrel after tensile loading to give an understanding of how the stresses are distributed both in the longitudinal and circumferential directions. These values are not possible to measure and must either be calculated with an analytical method or simulated with a FE-analysis. Interesting is the distribution of high pressure with the peaks at the edges and only minor increases at the back and centre of the wedge where the highest peaks were suspected. Those high stresses along the edges of the wedge explain the somewhat strange distribution of circumferential stresses seen along the edges of the modelled section in Figure 6.34. It also agrees with the raw data seen in Appendix B where the circumferential strains in anchorage 5 together with anchorages 2 and 3 are the highest. Those are positioned at the spacing between the wedges and at the quarter points, see Section 5.7.1.
0
50
100
0
50
100
0
100
200
300
Distance along barrel [mm]Circumferential distance on barrel [°]
Nor
mal
pre
ssur
e [M
Pa]
0
50
100
150
200
250
Figure 6.37 Distribution of normal pressure on the barrels inner surface at the final stage of tensile loadin
For comparison with the analytical model and to see if the model may give a reasonable approximation of the strain distribution along the anchorage a plot of the average pressure along the barrels inner surface is presented in Figure 6.38. The average is taken so that x and z-axes from Figure 6.37 remain. By doing so, and by normalizing the results with respect to the highest value during the tensile loading the curves become comparable with Figure 6.18. The analytical and FE-model show signs of similarity in the shape of the normalized curves both in the presetting and tensile phases. A major difference is the decrease in strains at the position of CS-5 in the FE-model. That is where the analytical model has its maximum. It must in that case be remembered that the analytical model does not take any consideration to the longitudinal direction in the anchorage. It solely uses the strain measurement and assumes that that strain is caused by a force at the same longitudinal position as the sensor is positioned. In this case where the pressure seems to be high in the surrounding longitudinal sections that way of modeling may give misleading results. It is here probable that the pressures in the

Mechanical Anchorage of Prestressed CFRP Tendons
180
sections in front and back of CS-5 cause the radial expansion measured in the strain gauge.
It is also obvious that the consideration of plastic deformation in the FE-model gives a reduced increase of the radial stress further back in the anchorage. In Figure 6.18 the stress increases almost linearly since the analytical model is only valid under elastic conditions and assumes that the increase in strain depends on an increase in stress.
0 20 40 60 80 1000
0.2
0.4
0.6
0.8
1
1.2
Distance along barrel [mm]
Nor
mal
ized
rad
ial p
ress
ure
[MP
a]
CS−1 CS−2 CS−3 CS−4 CS−5 CS−6Wedge and sensor positions
FEM after presettingFEM after tensile loading
Figure 6.38 Distribution of normalized mean normal pressure on the barrels inner surface. To be compared with Figure 6.18
Magnitudes of the normal stresses in the barrel-wedge interface in the FE-model are slightly lower than those given in the analytical model with a maximum of 236 MPa compared to the 351 MPa from the analytical model.
Rod
050
100150
0
50
100
0
200
400
600
Distance along rod [mm]Circumferential distance on barrel [°]
Nor
mal
pre
ssur
e [M
Pa]
100
200
300
400
500
600
Figure 6.39 Distribution of normal pressure on the rods outer surface at the final stage of tensile loading

Evaluation of Laboratory Tests
181
Contradictory to distribution of normal pressure on the wedge-barrel interface the normal pressure on the rod-wedge interface is not concentrated towards the edges of the wedge. The distribution on the rods surface is presented in Figure 6.39 and it instead shows a smooth distribution along the circumferential distance of the surface with a small decrease in the sections closest to the edges of the wedge. No connections between the wedges are included in the FE-model that has produced these values and it is probable that the circumferential distribution would be even more with them included. An even circumferential spread is also sought for since it reduces the risk of stress concentrations that might induce premature failure of the rod.
Likewise the longitudinal distribution seen in Figure 6.39 with maximum pressure in the back of the anchorage is favourable since that distribution smoothly increases the normal pressure as the longitudinal tensile strain applied in the rod decrease.
Figure 6.40 present the normalized 2D representation of Figure 6.39 which is comparable with the results from the analytical stress distribution found in Figure 6.17. As in the case with the pressure on the wedge-barrel interface also the shape of these curves corresponds well. A difference is the high radial pressure found at the end of the presetting phase for the FE-model, which actually is higher than the maximum value reached during tensile loading.
0 20 40 60 80 1000
0.2
0.4
0.6
0.8
1
1.2
Distance along rod [mm]
Nor
mal
ized
rad
ial p
ress
ure
[MP
a]
CS−1 CS−2 CS−3 CS−4 CS−5 CS−6Wedge and sensor positions
FEM after presettingFEM after tensile loading
Figure 6.40 Distribution of normalized mean normal pressure on the rod outer surface. To be compared with Figure 6.17
In the FE-model the highest normal pressure found onto the rod is 644 MPa which should be compared with the unrealistically high 13.7 GPa from the analytical solution.

Mechanical Anchorage of Prestressed CFRP Tendons
182
6.6.8 Longitudinal Stresses on Rod With the favourable distribution of the normal pressure along the rod it is expected to find a similarly favourable longitudinal decrease of the tensile force in the rod. This good stress distribution is also found and can be seen in Figure 6.41. During presetting the longitudinal stresses are small which is a consequence of the fact that the rod is free to move in the longitudinal direction during loading. Still some tension can be found in the position of the back of the wedge.
During tensile loading these longitudinal stresses grow and at the final state when 2891 MPa of tension is applied in the free end of the rod the distribution looks as it theoretically should to maximize the anchorage’s capacity. The stress starts with a small increase in at the rods entrance into the anchorage. That increase is inevitable and it can only be minimized as much as possible. At some point the wedge must start to transfer force into the anchorage and at that point the tensile stress from the rod and the radial pressure applied from the wedge must create principal stresses higher than the applied tensile. After that initial increase the decrease is smooth due to the smooth increase of radial pressure over the longitudinal distance of the rod. In the back end the radial pressure is high enough to also resist the forces not yet transferred into the anchorage and the rod is gripped with a minimum of disturbance on its load carrying capacity.
0 20 40 60 80 100−500
0
500
1000
1500
2000
2500
3000
3500
4000
Distance along rod [mm]
Long
itudi
nal s
tres
s [M
Pa]
Long. stress in rod (FEM)
FEM after presetting
FEM after tensile loading
Figure 6.41 Longitudinal stress ditribution along the rods outer surface during presetting and tensile loading
As a further proof of the anchorage excellent force transferring design Figure 6.42 present how the longitudinal shear on the rods outer surface is close to constant along the force transferring length of the anchorage. In the back of the wedges where the

Evaluation of Laboratory Tests
183
remaining force is transferred and the rod is free to expand in the radial direction again the shear forces increase.
0 20 40 60 80 100−300
−250
−200
−150
−100
−50
0
50
100
Distance along rod [mm]
She
ar s
tres
s [M
Pa]
Long. shear stresses along the rods surface
FEM after presettingFEM after tensile loading
Figure 6.42 Longitudinal shear stresses on the outer surface of the rod taken from the FE analysis
It is obvious that neither of the two methods presented in this chapter for evaluation of the measurements is a perfect description of the reality but both of them seem to in some senses correspond well to the laboratory tests. This and how the methods can be further improved and also further implemented to further develop the anchorage in future research is discussed in chapter 8.


Case Study - The Frövi Bridge Project
185
7 Case Study - The Frövi Bridge Project
It was decided already from the beginning to aim to have a case study as a part of the research. It is always very valuable to take part in a real project, with its planning, execution and follow–up and it is also important to apply the research results in real projects. Often a real project is very different from the work carried out at a university, due to the amount of people involved, strict deadlines and budget. In this particular project a railway bridge was going to be strengthened using CFRP bars and a newly-developed tube system. The project is not exactly applicable to my research, however, there are several overlapping points that my research benefited from. In addition, the project has opened my eyes on real life questions that you never can get an understanding of from desktop studies. It has also given thoughts on how to increase strengthening efficiency by using CFRP systems even further.
7.1 Introduction The village of Frövi is located around 30 kilometres northeast of Örebro in the heart of Sweden. It started to flourish in the late 19th century when the Swedish railway system was expanded. Soon it became a prosperous community with its position as a railway hub for both people and transports. The most important commodities were timber, iron and paper. Later, during the 20th century as other transportation systems started to replace the railway transports the village’s importance decreased. However, still passenger trains commute people from Frövi in to Örebro and the railway is still important, not as a hub, but for transporting freight from other areas of Sweden through Frövi.

Mechanical Anchorage of Prestressed CFRP Tendons
186
As it spans one of the major access roads to the paper mill the bridge in this project has an important role in the community, see Figure 7.1. Both under and over it timber as well as paper can be seen on its way into and out from the mill. The bridge also has an important function on a global scale as it is a link in the Swedish north-south running freight transportation system. To keep this corridor open in 2005 it was found necessary to strengthen the bridge and during the strengthening it was important to keep the trains running. Here several different strengthening methods were investigated but since stopping of the traffic was not an alternative CFRP composites became the only alternative. A new strengthening system with tubes was developed and also the well known NSMR (Near Surface Mounted Reinforcement) strengthening system was used. The tube system was used in the upper part and the NSMR in the lower part of the concrete slab, both systems in the transverse direction. Verification of the results is being obtained through monitoring and is still ongoing.
Figure 7.1 Location of bridge with paper mill in the upper left corner and the village of Frövi in the lower right
After completion of the strengthening work, and as a part of the licentiate study, new bearing capacity calculations were performed. The motive for that was due to a suspicion that the bridge’s capacity would be sufficient without strengthening. This idea proved to be wrong and some CFRP was still, after this calculation, found necessary. One aspect however that the strengthening could not handle was the longitudinal cracks on the slabs lower side; they would have required some prestressing to decrease in size.
7.1.1 Background The Frövi railway bridge spanning Frövifors road was erected in 1958 as a reinforced concrete, RC, bridge with double troughs and double tracks. It has a skew design both in plan and transversely horizontal, which can be seen in Figure 7.2 and also in the photo of its southern face in Figure 7.3. Horizontally the bridge is inclined 1.27

Case Study - The Frövi Bridge Project
187
degrees with the lower part at the southern face. In plan the road’s centreline forms an angle of 71° to the bridge’s centreline. In the longitudinal direction, parallel to the bridge beams, the bridge has a 10.3 m span while the shortest span, perpendicular to the abutments, is 9.8 m.
Track direction
Track direction
Figure 7.2 Rough drawing of the Frövi Bridge
Figure 7.3 Photo of the Frövi Bridge southern face
Due to the bridge’s strategic position on the important freight traffic line it was decided to upgrade the bridge from 22.5 to 25 tons per axle. In line with this the Swedish Rail Administration, Banverket, ordered a bearing capacity calculation from an independent consultant which upon delivery pointed out a lack of transverse tensile flexural capacity in the bottom slab. This lack was present both in the upper and lower parts of the slab as Figure 7.4 shows.

Mechanical Anchorage of Prestressed CFRP Tendons
188
0 1500 3000 4500 6000 7500 9000Transverse distance [mm]
200
100
0
-100
-200
Tran
sver
sefle
xura
l mom
ent [
kNm
]
Bearing capacity upper partDesign load upper partBearing capacity lower partDesign load lower part
Figure 7.4 Result from the bearing capacity calculations presenting the amount of tensile strengthening necessary in grey
Strengthening was consequently necessary, which with traditional strengthening methods would require extensive train traffic interruptions. An alternative was to remove both tracks and the ballast to apply material in the troughs from above as well as from below the slab. CFRP tubes could however solve the problem in an alternative manner and avoid all interruptions; thus saving both important available track time and money. Based on the results in Figure 7.4 it was then decided to use this recently developed method to increase the tensile bending capacity with 155 kNm in the upper part of the slab. The need for strengthening in the lower part of the slab was 80 kNm, and here the NSMR strengthening technique was used. The former bending moment was later adjusted to 110 kNm after studies of the report presented by the consultant.
7.1.2 Aim of the Project Work performed in this project is primarily aimed at strengthening the bridge without train traffic interruptions and with sufficient additional capacity to meet the design criterions in Banverket (2005).
In addition to primary aims, also research motives can be found. Banverket were interested in monitoring the effect before and after strengthening. In addition to this the Frövi bridge project came up during a European funded research project, Sustainable Bridges (www.sustainablebridges.net). This research project aimed for increased load and speed on existing railway lines throughout Europe. Here new assessment, repair and strengthening methods together with monitoring methods were developed. The Frövi project represented therefore an excellent project for applying some of the developments in field. And here we did not only have the possibility to investigate new strengthening methods, but also assessment by non-destructive testing and new monitoring techniques. For non-destructive testing the German Federal Institute for Materials Research and Testing, BAM, carried out tests before and after

Case Study - The Frövi Bridge Project
189
strengthening; before to investigate the placement of steel reinforcement and the actual thickness of the slab, and after to investigate the quality of the bond between the NSMR rods and the concrete. City University of London implemented fibre optic sensor technology for monitoring after strengthening of the bridge.
One of most important aims for involvement with this project in terms of the thesis was to learn more about assessment of concrete structures, full scale strengthening, monitoring and strengthening design.
7.1.3 Project Outline The primary investigations were carried out by CBI (The Swedish Cement and Concrete Institute) who together with the consultant Sweco made a visual inspection and took out material samples for testing. The next part in the assessment was carried out by BAM, who used ground penetrating radar and ultrasonic echo techniques to determine the placement of the steel reinforcement. This is presented in Section 7.2 together with some comparative measurements done by commercial instruments.
In Section 7.3 the chosen strengthening methods are presented and working procedures are described and discussed. After that follows a section where the monitoring and a CSHM (Civil Structural Health Monitoring) plan is presented and evaluated. This part is a necessary part to secure efficiency of the applied strengthening,
Lastly a section is presented with design calculations to investigate the bridge’s capacity before and after strengthening with a different model assumption compared to the one used by the design consultant Tyren’s. This is in Section 7.5 and is only followed by a brief discussion and some conclusions made from the project in Section 7.6.
7.2 Concrete Cover and Reinforcement Detection Non-destructive testing has become a natural element in many maintenance, repair, and upgrading projects, in particular when strengthening of concrete structures is in question. Obviously it is an enormous advantage to be able to investigate properties, such as concrete cover, slab thickness and reinforcement placement, without drilling or excessive concrete removal. It is in fact a necessity in many projects where design drawings are lost and an optimized design is demanded. Also in other cases, such as the Frövi Bridge, where it is questionable how well the actual structure agrees with the drawings it is an effective tool. Original design drawings are available in Appendix C. Not only does it give a foundation for the strengthening design, it also give the possibility to, on one hand, find the reinforcement for instrumentation purposes and on the other hand avoid damage to the reinforcement during FRP application.

Mechanical Anchorage of Prestressed CFRP Tendons
190
7.2.1 Ultrasonic Echo The ultrasonic echo method makes use of acoustics to locate interfaces between materials with differing acoustic impedance. Results from tests done with ultrasonic measurements over the last several years show that it has capabilities to map otherwise unreachable areas of a civil engineering structure. Some examples are detection of surface cracks and investigation of tendons and grouting within metal ducts, but it can also be used to locate ducts and internal reinforcement. Further descriptions of the advantages with this and other non-destructive testing methods can be found in Maierhofer et al. (2008) and Helmerich & Wiggenhauser (2008). They also present some of the tests done with the different methods.
In the Frövi project the intention was to investigate the exact thickness of the slab without removal of any ballast. For this purpose a limited grid distance of 10 mm was required. To create such a dense measurement grid by hand is very time consuming and based on previous experience an automated scanning system compatible with the ultrasonic equipment has been developed. This system is able to map an area of 1.2·1.6 m before it has to be moved and the same system is also used for the radar measurements.
Two areas underneath the bridge were initially investigated with disappointing results. No glimpse of any upper concrete surface could be seen, see Figure 7.5 left. The x-axis is the horizontal distance along the bottom of the slab while the y-axis is the vertical distance into the slab. As it looks it is not possible to tell anything about the structure’s interior due to the noise. For that to be possible some distinct features such as bands of darker colours are expected. The lack of proper results was attributed to the unexpectedly large crystalline aggregates with sizes well above the ultrasonic wavelength. From cores drilled in the beginning of the project sizes between 25 and 30 mm could be expected but once on sight aggregates larger than 70 mm could be seen in damaged parts of the bridge.
Figure 7.5 Vertical sections as they are presented after ultra sonic measurements; Left: Using one US sensor; Right: Using two US sensors

Case Study - The Frövi Bridge Project
191
Additional tests with two sensors, giving an extended distance between transmitter and receiver, were then conducted. Results from these tests can be seen in Figure 7.5 right. It can be seen that a distinct line has appeared a couple of centimetres higher than the expected concrete surface, taken from drawings, found in Appendix C, to be 33 cm at the investigated section.
7.2.2 Ground Penetrating Radar To verify positions of the upper slab reinforcement given by the original drawings ground penetrating radar has been used, it can effectively detect metal but not propagate trough it. Frequency and internal damping by the investigated material have the largest impact on the penetration depth as long as the signal isn’t hindered by metal. For civil engineering applications electromagnetic waves with frequencies between 20 and 2500 MHz are used and in this particular project 1500 MHz was chosen. The radar was a commercial SIRveyor SIR-20 system from Geophysical Survey Systems Inc (GSSI) with the antenna polarization perpendicular to the antenna movement. This movement and the 330 scans per meter performed in lines separated by 25 mm are governed by the automated scanning system seen in Figure 7.6. Totally six areas of the slab, two longitudinal lines of the slab and 19 lines of the southern face of the bridge were scanned.
Figure 7.6 Left: Automated scanning system mounted beneath the slab; Right: Radargram of a profile at the bottom of the slab along the northern track.
Figure 7.6 present raw data from one 8 meter long scan on the slab’s bottom surface along the northern railway track. At a depth of approximately 50 mm densely spaced transverse flexural reinforcement can be seen. The regularly spaced bars are only interrupted at a section between 4 and 5 meters. This irregularity is caused by a patch in the concrete only sparsely reinforced.
After processing of raw data two types of diagrams can be presented. C-scans present the data in horizontal slices at a specified depth while D-scans present the data as vertical slices along one single scanning line. Both types can be seen in Figure 7.7.
From the upper part of Figure 7.7 it can be seen that the lower transverse flexural reinforcement has 100 mm spacing in the slabs. This slab reinforcement ends as it reaches the centre beam and no lower reinforcement seems to connect the two parts.

Mechanical Anchorage of Prestressed CFRP Tendons
192
In the beam the transverse flexural reinforcement has a larger spacing while the lower longitudinal flexural reinforcement has a smaller spacing compared to the slab. All this is in accordance with original drawings that can be found in Appendix C.
Figure 7.7 Upper: C-scan at depth 55 mm of a 110 mm wide and 575 mm long section aligned transversely to the bridge’s centre line; Lower: D-scan of a 575 mm long line at the centre of the above seen C-scan, bottom of slab is at the top of the C-scan result.
The lower part of Figure 7.7 shows how the lower longitudinal flexural reinforcement at depth 50 - 100 mm has a 200 mm spacing in the slabs and a 100 mm spacing close to, and in the centre beam. Also this is in accordance with the original drawings which say that 5 bars with 100 mm spacing shall be positioned closest to the centre and edge beams.
It was expected from the D-scan to notice signs of the upper slab reinforcement at a depth of 280 mm and something can also be detected at that position. Unfortunately that is probably not signs of the upper reinforcement but instead reflections of the lower reinforcement. These reflections make identification of the real upper bars impossible and one of the largest benefits with the radar measurements is thereby lost. The reason for this is probably the dense placement of the bottom reinforcement. Identification of the upper reinforcement position in the vertical direction would have made the horizontal drilling through the plate less hazardous. The horizontal drilling had to then rely on the design drawings instead of in-situ measurements.
Also the scanning of the southern face showed reinforcement in accordance with the drawings, 100 mm spacing between the stirrups close to the abutments and 200 mm spacing in the span was both expected and found.
7.2.3 Electromagnetic Induction and Boreholes To verify results given from the ultrasonic and radar measurements a commercially available reinforcement locator has been used. The locator is a Hilti Ferroscan FV10 and it uses electromagnetic induction to locate reinforcement on concrete depths of up
Centre beam
C-Scan at Z
= 5.5 cm
764
614
589
459
339
189 509 529
549 569
589 609 619
Centre beam

Case Study - The Frövi Bridge Project
193
to 100 mm. This means that it in reality can cover a depth of approximately 60 mm and also estimate the concrete cover.
The electromagnetic measurements are made by hand in 600·600 mm sections and exact positioning of the sensor makes it possible to combine several sections into larger scanned areas. Results presented by BAM can be seen in Figure 7.8.
Figure 7.8 Results from electromagnetic scans of the bottom of the slab. The 600 mm wide transverse section’s position is where the arrow points.
It is obvious that the transverse section in Figure 7.8 corresponds well to the upper part of Figure 7.7. Transverse flexural near surface reinforcement is spaced with 100 mm in the slab and 200 mm in the centre beam but no reinforcement spans the connection between slab and centre beam. In Figure 7.8 it is also possible to see the lack of reinforcement in the patches left after temporary supports during construction; these can also be seen in Figure 7.6. These patches can not be seen in the design drawings in Appendix C but all the other results correspond well to the drawings. Also electromagnetic scans of the southern face of the bridge correspond well to both the radar scanning and drawings.
Both the electromagnetic and radar scans reveal a general concrete cover of between 30 and 40 mm which is enough to host the NSMR grooves.
Boreholes were drilled at three positions on the slabs to verify the slab thickness. At midspan, where the plate is supposed to be 350 mm it was found to be 370 and at the support it was found to be 320 mm instead of the 300 mm shown in drawings. At that latter hole close to the support, upper slab reinforcement was found at a depth of 285 mm leaving a 35 mm concrete cover. A videoscope was used to visually ensure that the actual upper surface was found and that the material above was gravel.

Mechanical Anchorage of Prestressed CFRP Tendons
194
7.3 Installation of CFRP The required amount of strengthening has been calculated based on the bearing capacity calculations performed and the outcome presented in Figure 7.4. For the lower part of the slab the transverse tensile flexural capacity has to be increased with 80 kNm/m throughout the span and for the upper part an extra capacity of 155 kNm/m is necessary. These numbers are the outcome from a model without consideration to the upper transverse tensile capacity of the centre beam. After careful estimations it was therefore decided to decrease the strengthening of the upper part of the slab to 110 kNm/m throughout the slab.
7.3.1 Strengthening Design
CFRP-tubeØ32 t4
NSMR10 x 10 mm
Figure 7.9 Final choice of strengthening system
For strengthening of the upper part of the slab in tension a new method was chosen. Holes were drilled transversely trough the slab beneath the existing longitudinal slab reinforcement found at 285 mm, see Section 7.2.3. In those holes CFRP is inserted and bonded to the concrete with epoxy. Pilot tests have been performed at LTU during 2005 and they have shown that both the drilling and bonding of CFRP to the concrete is possible to perform with straight holes and continuous adhesion as final result. The long holes did however require a core drill with pressurized water and a guide shaft; which for now limits the minimum hole diameter to 38 mm. This consequently requires an outer diameter of the CFRP rod of at least 32 mm to get adequate force transfer trough the layer of epoxy. A homogenous rod of that size would be too strong to optimize the design considering the total amount of CFRP and an even longitudinal spread of the rods along the bridge. Instead of rods the choice then became tubes with a thickness of 4 mm and a 32 mm outer diameter, see Figure 7.9.
To strengthen the lower part of the slab the natural choice was NSMR. It is a well known method previously used in several successful projects, (Enochsson et al. 2007 & Bergström et al. 2004). The method is excellent in applications exposed to tear since it is protected by concrete on three sides. This protection is a necessity on the Frövi Bridge due to the heavy timber trucks hitting it with logs sticking up from the platform. In addition the embedment gives a good bond between the CFRP and the concrete compared to laminates or sheets.

Case Study - The Frövi Bridge Project
195
Figure 7.10 Area of the cross section involved in the bearing capacity calculations and strengthening design calculations
Calculations of the amount of tubes and bars necessary were based on the design guidelines found in Täljsten (2006) and the cross section of the bridge was modelled as a plain beam, see Figure 7.10. Slab thickness was set to 350 mm based on the ultrasonic echo measurements from Section 7.2.1. Effective depth for the tubes was assumed to be 240 mm; thus including 20 mm of safety margin between the upper slab reinforcement and the drilled holes. Calculations were carried out in the highest strained section and only 60 % of the CFRP’s ultimate strain capacity was utilized. Altogether this adds enough extra safety into the design. Material properties used are presented in Table 7.1.
Table 7.1 Material properties used in the strengthening design
Concrete Steel NSMR CFRP tubes K40 Ks40 StoFRP Bar
M10C StoFRP Tube
E 32C StoBPE Lim 567 (A+B)
NM INP 32 (24L)
Comp. strength [MPa] 32 400 93 235 Tens. Strength [MPa] 1.95 400 2000 1800 20
E-modulus [GPa] 32 205 250 160 7 1.1 Ultimate strain [%] 0.35 0.8 1.5 Cross sectional area 100 mm2 350 mm2
Viscosity Tixotropic 0.15 Pa·s
A final longitudinal distribution of the CFRP could not be decided by the design calculations alone since consideration had to be taken of the existing steel reinforcement. The calculations did however require a spacing of 400 mm between the NSMR and 800 mm between the tubes. These numbers were used as targets and deviation to avoid stirrups in the edge beams only caused minor adjustments. The exact final distribution can be seen in Appendix D; 23 NSMR bars and 13 CFRP tubes altogether.
7.3.2 Installing of NSMR Installation of the CFRP began with preparations for the NSMR bars. Many parts and aspects are however the same in the preparations for installation of CFRP tubes and the scaffolding was for example used continuously during the two months of work performed.

Mechanical Anchorage of Prestressed CFRP Tendons
196
Preparatory Work Scaffolding is perhaps one of the most important preparations to achieve a good quality of the strengthening and a sound working environment. At the Frövi Bridge the scaffolding was built in such a way that it allowed work underneath the entire bridge and along both edge beams. The scaffolding was erected before any other work commenced. The worksite was also covered by tarpaulins and heated by electrical fans for the epoxy to harden correctly in case of low temperature during installation. At least 10°C and a relative humidity below 80 % without any visible water on the concrete surface are the necessary conditions stated by the CFRP supplier.
From the scaffolding an automated milling cutter could be mounted underneath the slab. 20 mm wide grooves could then be cut straight and with an optimum depth of 15 mm. Controls of the groove’s sizes were randomly executed without remarks. At each end 100 mm of uncut concrete were left to protect the NSMR from tear, the bars were consequently also shortened by 200 mm.
Figure 7.11 Picture from underneath the Frövi Bridge with the NSMR grooves primed, taped and ready for application of epoxy and bars
Figure 7.11 shows how the grooves look when all preparations are finished. They have then been cleaned, primed with Sto Primer BPE 50 Super (A-B) and taped along the edges. Tapes are used to facilitate removal of excessive epoxy after strengthening.
InstallationNSMR bars arrive with a protective plastic cover called “peel-ply”, this cover is first removed and the bar is positioned on supports close to its final position. During the process between removal of the peel-ply and insertion of the bar into the groove it is important that it does not come in contact with any grease, dirt or contaminants that could harm the bonding.
Epoxy is a two-component adhesive and is first blended carefully according to the supplier’s instructions; in this case StoBPE Lim 567 (A+B) was used. The mixture is then applied into the groove through a pump and nozzle seen in Figure 7.12 left.

Case Study - The Frövi Bridge Project
197
Protective clothing must be worn at all times during work with epoxy; in this case disposable boiler suits and plastic gloves. Sometimes it is also advisable to use masks with forced ventilation – but this is more related to work comfort than health regulations. After the epoxy work follows insertion of the bar; it is gently but firmly pushed into the slot by hand so that the excess epoxy is pressed out leaving a minimum of voids in the bottom and on the sides of the groove. At least two persons, but preferably more, are necessary for this job when the bars are longer than approximately 4-5 meters. Finally the bar is evenly covered by epoxy and the tapes, now covered with epoxy, can be removed to present the result seen in the right part of Figure 7.12.
Figure 7.12 Left: Application of epoxy in an NSMR groove; Right: Final appearance of the bridge’s underside after insertion of bars and removal of tape
Air Void Detection A major concern in the application of all types of FRPs is the risk of air voids trapped within the epoxy. This decreases the effective force transferring area and may cause premature anchorage failure. Hammers are commonly used to tap on the bar and detect voids after hardening of the epoxy. With a new method under development at BAM it should be able to scan all near surface mounted FRP and its adhesive for these voids. This method was briefly tested at the Frövi Bridge and on the 4 bars investigated only minor voids of sizes up to 1 cm2 could be found. Unfortunately no pictures or visual results from these measurements are available since the researchers at BAM wanted to keep the technique confidential until it could be patented.
7.3.3 Installation of CFRP Tubes None of the stages of the tube installation had been used in-situ before and this required careful preparation as well as an ability to adapt to new unforeseen conditions. For this cause the prepared scaffolding and experienced contractors were invaluable.

Mechanical Anchorage of Prestressed CFRP Tendons
198
Preparatory Work
Figure 7.13 Left: Hole positions marked in yellow and near surface steel reinforcement in white chalk; Right: Drilling equipment
Each of the 9 meter long holes required careful preparation. As a first step exact positions of the drill holes were appointed. To avoid cutting as little steel reinforcement as possible, the results from scans presented in Section 7.2 together with precise small scale real time scans were used. Calibration also had to be done so that the hole did not only avoid cutting any steel in the entrance beam, but also in the one where the drill head exited. Once all entrance and exit points were marked, see Figure 7.13, mounting and calibration of the drilling equipment became the next challenge. Each hole had to be perpendicular to the edge beam’s face and also inclined approximately 1.3°. For this the drilling rack seen in the right part of Figure 7.13 is necessary. It can be adjusted both vertically and horizontally with the two turnbuckles before the rack is bolted to the beam above the desired entrance position.
Figure 7.14 Left: Drill head exiting the bridge; Right: Entrance holes when the drilling process is finished
With some additional calibration tools impressive precision was achieved and as Figure 7.14 show the exit holes only differed from the desired position by up to 20 mm after 9.0 m of drilling. Partly this could be credited to the skilled contractors and partly to their automated drill that kept the same speed through concrete as well as ballast and
Turnbuckles

Case Study - The Frövi Bridge Project
199
possibly steel. By doing so changes in direction of the drill head were avoided at the interfaces.
Supplementary work to be performed prior to insertion of the tubes is then to clean and dry the holes’ interior and to seal possible cracks in the concrete with grout. Nipples left from the sealing process can be seen in Figure 7.11, these were later removed for aesthetic reasons.
Installation of the Tubes Tubes do not arrive with peel-ply and they are therefore first sandpapered and then cleaned with a solvent, in this case we used acetone, before insertion to ensure a good adhesive bond. Two small rubber feet are also applied every second meter as spacers to lift the tube from the hole’s bottom surface and allow for the epoxy to enclose it, this can be seen in Figure 7.15.
Figure 7.15 Left: Sandpapered CFRP tube with rubber spacers attached; Right: Inserted CFRP tube with cables from strain sensors exiting
For the adhesive to reach all corners an overpressure is required during installation. For that purpose cracks in concrete were sealed and it was also necessary to seal one end of the hole and only let the air out through a nozzle at this end. The adhesive used was a low viscous, NM INP 32 (A+B). It hardened under conditions controlled by electric fans and the hole was then sealed with epoxy. During a later phase the bridge’s scars from earlier collisions by trucks were fixed, some grout was then also applied as plugs into the remaining depressions in the bridge’s surface. The tubes were deliberately cut a couple of centimetres short to allow for this.
7.4 Monitoring
7.4.1 CSHM Plan As in all monitoring projects a plan for measurements and acquisition is necessary. Without proper planning there is always a possibility that important measurements may be lost or that one could end up with an excessive amount of unnecessary data. This

Mechanical Anchorage of Prestressed CFRP Tendons
200
issue has been brought up by Hejll (2007), who also provides guidelines on how to handle health monitoring of civil structures (CSHM). Some of the ideas presented there have in a later stage been incorporated into the Frövi project. It can however be concluded that much work would have been avoided if the presented algorithm for structural assessment, Figure 7.16, had been consulted at an earlier stage. This is further discussed in Section 7.5.
Figure 7.16 Structural assessment algorithm from Hejll (2007)
In this section focus is on the monitoring state box which in the Frövi project, due to decisions by the railway authorities, has a position after strengthening. There is in other words a direct connection between a negative answer after increased inspection and the strengthening box. From strengthening the path to follow continues to the monitoring state box but after that the continuation so far is more diffuse. It might close the assessment process and start a new sequence of normal inspections or show that further measures have to be taken to secure the bridge’s safety.
For planning reasons an overall goal for the monitoring was defined. It should confirm a successful strengthening process, it should investigate values of deformation and compare to good engineering sense and it should provide these data over a longer time span to account for annual variations. Based on the goals a system design was carried out including sensors, loading, acquisition system and sampling periods. Some adaptation to circumstances not foreseen during the design has nevertheless been done. Due to the discovery of a distinct cracking pattern and problems with loading consistency new sensors were added and it was necessary to review the loading design.
Sensor Design During the planning it was decided to use Linear Variable Differential Transformers (LVDTs) for deflection measurements, welded strain sensors on existing steel

Case Study - The Frövi Bridge Project
201
reinforcement and glued strain sensors on the applied CFRP. This should provide a complete picture of the bridge’s behaviour in the parts necessary to strengthen. Complementary sensors are thermometers for comparison of changes in bridge behaviour to changing temperatures and Crack Tip Opening Displacement sensors (CTODs) for measurements on the lately discovered cracks. In addition to this a novel technique using integrated fibre optic sensors in the CFRP composites was used. Here Bragg gratings were written on corresponding locations on the CFRP tubes and rods as for the locations of the electrical foil gauges. The FOS system was handled by City University in London. This part of the Frövi bridge project is also related to the Sustainable Bridges project.
Linear Variable Differential Transformers (LVDTs)
Figure 7.17 presents locations of deflection measurements in a cross section perpendicular to the bridge’s centre beam. Altogether 11 LVDTs were in use for this measurement. The particular type of sensor is a so-called quarter bridge and can linearly transform a change in voltage to a displacement. No temperature compensation is available for ¼-bridges and they are therefore mostly suitable for short term or indoor measurements. In the Frövi project they are also positioned in a way that demands removal before traffic underneath the bridge can be resumed. LVDTs are therefore only used during on-site measurements performed before and directly after strengthening.
Figure 7.17 Left: Positions of the 11 LVDTs; Right: Photo of ladder used to relate attached LVDT’s local deflection to the global behaviour of the bridge
Out of the 11 sensors three measured the beams deformation in relation to the ground. These are the outermost on each end of the section and the middle one, i.e. placed underneath the bridge beams. The remaining eight sensors measured deflections of the slabs and were related by a stiff steel ladder, seen in Figure 7.17, to the edge beams;

Mechanical Anchorage of Prestressed CFRP Tendons
202
thus making it possible to map the complete cross sectional deflection in relation to the ground. Exactly the same positions for sensors and ladder - edge beam connections were used at both occasions of on-site measurements.
Results from deflection measurements are intended to give valuable information on the size of vertical deformations in the critical cross section. This can be compared to other bridges, to different loading conditions and between before and after strengthening. It should also give a rough picture of how the bridge works structurally.
Strain Sensors on Steel Reinforcement
In addition to deflection measurements eight strain sensors were installed to measure strain in the lower near surface steel reinforcement perpendicular to the bridge’s centre line. Sensor positions were based on reinforcement detection performed by BAM and described in Section 7.2. They are placed in a cross section in close proximity to the cross section used for LVDTs and also later for strain sensors on NSMR and tubes, which also should be the hardest strained section, see Figure 7.18. By doing so all these measurements can be related to each other. It should however be stressed that no continuous steel reinforcement could be found in the bridge’s transverse direction. Sensors underneath the southern trough do thereby not measure on the same bar as the other four, which is the case for CFRP mounted sensors.
Figure 7.18 Left: Positions of the eight strain sensors welded to the original steel reinforcement. The same positions are also used for sensors on NSMR and tubes, except for positions 3 and 7; Right: Welded strains sensor
Half bridges were installed in the centre of each trough and at the sensor position closest to the centre beam underneath the southern trough. Large strains were expected

Case Study - The Frövi Bridge Project
203
at trough centers and those positions were thereby the most important and consequently equipped with reserve sensors. Remaining sensors were mounted as quarter bridges and could because of that not be used for continuous monitoring.
After exposure of the steel, polishing and cleaning, each sensor could be mounted by spot welding. A mounted sensor can be seen in the right part of Figure 7.18. Once mounted the sensor is protected by glue and silicon and the hole is finally filled with grout to restore proper corrosion protection. Reinforcement was in all cases found at the anticipated position and depth.
Strains measured at these positions can be seen as a complement to the deflection measurements and should after evaluation describe bridge behaviour similar to that for the LVDTs. These measurements are also done to compare measurements from the closely mounted NSMR after strengthening.
Strain Sensors on NSMR Bars
Six strain sensors are mounted on the central NSMR bar, close to the section seen in Figure 7.18. Their transverse positions are also similar to the positions seen in Figure 7.18 but without the backup sensors at the trough’s centres. Sensors at the trough’s centres are half bridges as well as the one closest to the centre beam in the southern trough; the remaining three sensors are quarter bridges. Mounting of the sensors was performed at a workshop before transportation to the worksite. This ensured a good working environment and good quality of the work. In the left part of Figure 7.19 a strain gauge has been glued onto a roughened and cleaned surface. By application of a known voltage over the sensor it is possible to detect changes in resistance. These changes occur when the gauge is strained and the conductor’s cross sectional area is changed. In the middle part of the figure wires are soldered to the gauge and it is protected against moisture by a coating, later an additional protective layer of shrinking tubing was applied against tear.
Figure 7.19 Left: Strain sensor glued to an NSMR bar; Centre: Strain sensor on NSMR with protective coating and soldered cables; Right: Strain sensor on tube, protected and with cables connected

Mechanical Anchorage of Prestressed CFRP Tendons
204
These sensors give valuable information about activation of the force carrying capacity in the bar. If the bars are strained it is due to a force acting on them, which in turn means that other parts of the structure must be relieved by the same amount. Strains from the NSMR are also used to compare the behaviour with that of the nearby located steel and from the FOS sensors.
Strain Sensors on CFRP Tubes
Tubes are positioned in the upper part of the slab, opposite to the NSMR that is positioned in the lower part. The sensors on the tube are however positioned at the same section, seen in Figure 7.18, and at the same transverse positions as the gauges mounted on the NSMR. The mounting procedure is also the same with the exception that cables are guided through a hole in the tube and from there in the tubes interior, see the right part of Figure 7.19. It is these cables that can be seen exiting the bridge in Figure 7.15. Three half bridges and three quarter bridges are used, and the distribution for gauges on the NSMR is described in the previous section. Temperature compensation in the half bridges is obtained by a dummy gauge mounted on a piece of NSMR and positioned in the tubes interior.
Strains in the upper part of the slab are important in the sense that they together with strains in NSMR and steel can give a picture of the slabs vertical strain distribution; and consequently the neutral layer’s depth. It also gives a hint as to whether the strengthening is successful, as described for the NSMR sensors.
Crack Tip Opening Displacement Sensors (CTODs)
The decisions to incorporate CTODs in the CSHM plan were taken at a later stage as large and pronounced crack patterns were discovered at four positions underneath the slab. The cracks start at the abutments and stretch longitudinally along the centre beam towards the centre of the span. On the way they branch into several cracks that eventually stop before connection is made with cracks reaching out from the opposite abutment. A general picture of the crack pattern and where the CTODs are positioned can be seen in Figure 7.20. It is assumed that these cracks aroused due to insufficient lower transverse reinforcement in the connection between slabs and the centre beam. After detailed studies of the slabs reinforcement drawing in Appendix C it can be concluded that no bars are intended to bridge that connection. This is also confirmed by scans performed by BAM which are presented in Section 7.2 and Figure 7.7.
It is not possible to close the up to 1,5 mm wide cracks with the proposed strengthening method. For that it would be necessary with prestressing. The measurements are instead intended to investigate whether the strengthening performed can decrease dynamic crack openings during train passages. They have therefore been used at the same positions in the on-site measurements both before and after strengthening.

Case Study - The Frövi Bridge Project
205
Figure 7.20 Left: Positions of the four CTODs, unloaded crack opening widths and a general picture of the crack pattern; Right: Attached CTOD
It is suspected that these cracks found once the scaffolding was in place actually may be the largest threat against the bridge’s service life and it should have been better treated on an earlier stage. The cracks were now however injected with grout, this was a necessity to facilitate the injection of epoxy between the tube and concrete but protection also of the steel reinforcement came as a bi-product.
Fibre Optical Sensors (FOS)
In a transverse section 800 mm to the west of the section with the traditional strain gauges Fibre Bragg Grating (FBG) systems were embedded in the tube and the NSMR bar. 6 sensors on each of the CFRPs positioned at the same transverse positions as the traditional strain sensors should provide good possibilities for comparison of the results. Sections of the fibre with the grating written onto it were attached to the CFRP with Cyano-Acrylate glue and protected in a narrow groove sawn into the tube and bar respectively. The grooves were after hardening of the glue filled with epoxy. One grating in the southern edge of the bridge was left without any attachment to the CFRP, this sensor acted as compensator for the temperature variations experienced by the structure. A schematic view on how the optical fibres where attached to the bar can be seen in Figure 7.21. Further aspects on the acquisition and interpretation systems can be found in Kerrouche et al. (2008).
NW0.4 mm
NE1.0 mm
0.9 mm SW
0.3 mm SE

Mechanical Anchorage of Prestressed CFRP Tendons
206
Figure 7.21 Schematic view on how the optical fibres with their gratings are attached to, and protected in, the CFRP bar, Kerrouche et al. (2008)
Thermocouples
Altogether three thermocouples have been involved in the CSHM design. Only one was used during the two sessions of on-site measurements performed and it is positioned in the concrete cover at the centre of the bridge’s span. Two more are mounted for temperature control during the continuous monitoring. One of them in the flange - edge beam connection right above the box seen in Figure 7.24 and inside the insulated box.
Temperatures on the bridge are necessary to relate changes in overall behaviour of the bridge to changes in the surrounding environment. The sensor mounted in the box is only used to see how well the insulation works and which temperatures the acquisition system can handle.
LoadingNo controlled or reference loading was possible since the major motive to choose the tubes as a method of strengthening was to avoid interruptions in the train traffic. Measurements are therefore limited to loads from scheduled trains. In the initial plan this seemed to be a good solution and it was assumed that at least some heavy trains would return on regular basis. Information received from the railway administration also mentioned that the weight of those trains could be given. Unfortunately this proved impossible and major concerns were instead directed into finding measurements from the Regina passenger train, see Figure 7.22. These trains passed the bridge regularly around 20 times each day and presented a deterministic loading pattern that could be compared between measurements before and after strengthening. The length of each Regina set is 53.9 m and the distance between bogies in one out of two carriers is 19.1 m. Distances between axes within one bogie is 2.1 m. Altogether one set weights 120 tonnes which give an axis weight of 15 tonnes.

Case Study - The Frövi Bridge Project
207
Figure 7.22 Left: Regina train with controlled and constant axis weight; Right: Freight train with randomly distributed and varying axis weight
From readings it has afterwards been seen that the trains with highest axis load are freight trains. They sometimes produce strains three times higher than the Regina trains but their axis weights are unknown and randomly spread. To use those higher loads it is therefore necessary to use a probabilistic approach and include a large amount of data to achieve some relevance in the results. This has not been done here but would for the long term measurements be a good solution to receive reliable results.
Data Acquisition and Communication System In accordance with Hejll (2007) a plan has been made also for how to receive, transfer and store data from up to 35 sensors momentarily on site and 10 sensors during a time span of at least one year. The system can be divided into three parts which are shown in Figure 7.23.
Figure 7.23 Graphical representation of the CSHM system
Part A includes the equipment necessary for acquisition of data. This is the earlier described sensors, a measuring amplifier system and triggers to initiate acquisition. The amplifier system is a MGC plus manufactured by HBM, HBM (2008), which can be seen in Figure 7.24.
Sensors Computer Luleå
InternetMGC plusComputer Frövi
NMT modemExternal antenna
Power supply Battery backupProject portal
Triggers
ABC

Mechanical Anchorage of Prestressed CFRP Tendons
208
a Triggers b Thermometerc ¼ - bridges d ¼ - bridges e ½ - bridges f ½ - bridges g USB cable h Memory cardi Power supply
Figure 7.24 Left: Rear face of the MGC plus, (during short term measurements); Right: Acquisition system box during installation
Part B consists of the pieces necessary for communication of data. Via a USB connection the data can be downloaded from the amplifier onto a computer on site. The last 2 MB of data retrieved from measurements are also continuously stored on a memory card in the MGC as backup. Data can now either be stored at that computer or transferred further through a wireless broadband connection. The latter option has been chosen for long term measurements where the computer in Frövi has been remotely controlled. All data from the bridge is sent into a project portal accessible from anywhere as long as an internet connection is available. Part C is the storage part and includes the mentioned project portal as well as the computer in Luleå where most of the data has been downloaded and evaluated.
Sampling Periods Two different types of sampling are used. One type is used for on site measurements directly before and after strengthening and one for the long term measurements.
Short term monitoring is obtained through 3 days of continuous standby on the amplifier with external motion sensitive triggers that catch all traffic over the bridge. During standby the amplifier stores information from the last 15 seconds in an internal memory which when triggered is transferred to an external hard disk. Altogether 40 seconds of measurements with a sampling rate of 75 Hz is stored on the hard disk for each triggering. Long term monitoring is achieved through monthly one day measurements controlled remotely from Luleå. During these occasions the amplifier is in standby mode and triggered to collect data when strains in a chosen sensor reach a certain level. The same sampling settings are used as in the case of short term measurements.
7.4.2 Results Evaluations of results are, as with the sampling, divided into two parts; short and long term results. Results from the short term measurements are aimed at getting a good
a b c d e f g h i

Case Study - The Frövi Bridge Project
209
picture of the bridge’s transverse behaviour when trains pass on the northern and southern track respectively. Indications of the influence of the strengthening are also desirable. Long term results are in contrast to that focused on changes in behaviour of the bridge and in the strains due to temperature and time.
Short Term Altogether readings from 40 trains before and 108 trains after strengthening was left after removal of distorted data. Distortion might for example be caused by two trains passing each other on the bridge or slow trains triggering several measurements. Results from such occasions are not possible to handle in the automated post processing, it is also impossible to interpret the actual load case and they are difficult to compare to other readings. The remaining trains are distributed by type of loading and track as in Table 7.2. The low number of trains recorded before strengthening is due to a tightened time schedule that only allowed one and a half days of measurements.
Table 7.2 Number of trains recorded for each classification
Before strengthening After strengthening Regina northern track 5 13 Regina southern track 9 13
Freight train northern track 9 45 Freight train southern track 17 37
Deflections, strains and crack openings are accounted for in this section with selected graphs and brief explanations. For further information and a complete setup of graphs the reader is directed to Appendix E. There results from all sensors and all trains are available.
Deflections
All deflections in Figure 7.25 are measured along the transverse section seen in Figure 7.17 and distances along the section are measured from the southern edge beam. Each line represents one train and each circle one LVDT. Between the sensors deformation is assumed to be linear as a simplification. The two outermost sensors are related directly to the ground while the remaining ones are related to the ground through those two. Figure 7.25 only show deflections from readings done during passages of Regina trains. They give repeatable results which show a consistency in the bridge’s deformation. It is obvious that the slab in the loaded trough deflects also in relation to the centre and edge beams while the unloaded part seems to be straight between the unloaded edge beam and the centre beam. Deflection graphs for freight trains and average values of the deflections can be found in Appendix E. They all show the same pattern. No distinct change in deflection can be seen due to strengthening.

Mechanical Anchorage of Prestressed CFRP Tendons
210
0 1000 2000 3000 4000 5000 6000 7000 8000 9000-0.8
-0.7
-0.6
-0.5
-0.4
-0.3
-0.2
-0.1
0Deflections of plate for "Regina" on northern track
[mm]
[mm
]
Before strengthening = blueAfter strengthening = red
0 1000 2000 3000 4000 5000 6000 7000 8000 9000-0.8
-0.7
-0.6
-0.5
-0.4
-0.3
-0.2
-0.1
0Deflections of plate for "Regina" on southern track
[mm]
[mm
]
Before strengthening = blueAfter strengthening = red
Figure 7.25 Readings from LVDTs before and after strengthening when Regina trains pass the bridge on the northern and southern tracks respectively
Strains
Strains are measured at three different levels; at the slabs bottom in the NSMR, in the lower steel reinforcement and in the slabs upper part in the CFRP tubes. Results from steel and NSMR are presented in graphs displaying one transverse section of the bridge, see Figure 7.18. The x-distance is measured from the southern edge beam, each line represents either one train or an average of trains in a certain category and each circle represents one strain gauge. Between the sensors the lines are drawn straight even though this is known to not be entirely correct. Negative strains are tension and positive compression.
Unfortunately a mistake in the mounting of tube gauges resulted in leakage currents and only one functioning sensor. Readings from this sensor are presented without any post processing on a time line.
Steel
Figure 7.26 presents in the left part how strains are developed during Regina train passages on the northern track. Scattered readings on one of the sensors are a result of the post processing. If the values are so low that they tend to be hidden in the background noise it sometimes give a positive value and sometimes a negative value. In those cases the average curves are more interesting. The right part shows an average of all Regina trains passing on the southern track. From the curves it is possible to see that the bridge behaves differently if the train passes on the northern track compared to if it passes on the southern. Although the maximum strain is almost the same in both cases it is obvious that the southern trough is more prone to stretch also close to the centre beam. In the unloaded part of the section small compressive strains are present. As in the deflection measurements no distinct change can be detected in the strains due to strengthening. Further graphs can be found in Appendix E

Case Study - The Frövi Bridge Project
211
0 1000 2000 3000 4000 5000 6000 7000 8000 9000-60
-50
-40
-30
-20
-10
0
10Strains in steel reinforcement for "Regina" on northern track
[mm]
[m
/m]
Before strengthening = blue
After strengthening = red
0 1000 2000 3000 4000 5000 6000 7000 8000 9000-60
-50
-40
-30
-20
-10
0
10Average strains in Steel reinforcement for "Regina" on southern track
[mm]
[m
/m]
Before strengthening = blue
After strengthening = red
Figure 7.26 Left: Strains in the lower steel reinforcement before and after strengthening when Regina trains pass on the northern track; Right: Average strains from all Regina trains passing on the southern track before and after strengthening
NSMR
Values from gauges mounted on the NSMR can obviously only be achieved after strengthening. The left part of Figure 7.27 present readings from the six gauges as Regina trains pass on the northern track. Large similarities are found with the graph in Figure 7.26 which is in agreement with expectations. This is also highlighted in graphs comparing the average values for strains in steel and NSMR, such as the one in the right part of Figure 7.27. Further graphs are found in Appendix E. Also for NSMR a distinct difference between the two troughs is present in the gauge positioned closest to the centre beam.
0 1000 2000 3000 4000 5000 6000 7000 8000 9000-60
-50
-40
-30
-20
-10
0
10Strains in NSMR for "Regina" on northern track
[mm]
[m
/m]
Before strengthening = blue
After strengthening = red
0 1000 2000 3000 4000 5000 6000 7000 8000 9000-60
-50
-40
-30
-20
-10
0
10Average strains in steel and NSMR for "Regina" on southern track
[mm]
[m
/m]
NSMR = blue
Steel = red
Figure 7.27 Left: Strains in NSMR after strengthening when Regina trains pass on the northern track; Right: Average strains in steel and NSMR after strengthening when Regina trains pass on the southern track

Mechanical Anchorage of Prestressed CFRP Tendons
212
Tubes
Mistakes in application of sensors on the tubes resulted in a loss of five out of six gauges. The only one left is the southernmost, see Figure 7.18. This sensor is positioned at the upper part of the tube, as far away from the neutral layer as possible to achieve as large strains as possible. Expected results are small and negative (tension) when trains pass on the northern track while they should be positive (compression) when trains pass on the southern track. Figure 7.28 show two such results on time lines with 3000 readings each. Both graphs show good agreement with expectations. The same pattern returns for all trains on the northern and southern tracks respectively.
0 500 1000 1500 2000 2500 3000-1.5
-1
-0.5
0
0.5
1
1.5Strain in tube for "Regina" on northern track
Time
[m
/m]
0 500 1000 1500 2000 2500 3000-1.5
-1
-0.5
0
0.5
1
1.5Strain in tube for "Regina" on southern track
Time
[m
/m]
Figure 7.28 Strains in the southern most tube sensor as one Regina train with four bogies pass. Left: On the northern track; Right: On the southern track
Crack Openings
Only two CTODs were available and they were moved between 4 positions during the measurements. Unfortunately this has resulted in a situation where values from before strengthening lack values from after to be compared with, and vice versa. This becomes apparent in the measurements seen in Figure 7.29 on the south-western CTOD position. There no readings exist after strengthening. On the south-eastern and north-western CTOD positions no difference in the readings from before and after can be seen while the opening in the north-eastern position clearly shows a decrease from 3.5 m to 0 m. More graphs in Appendix E support this decrease for the NE position. Results from other positions are impossible to make any conclusions out of due to missing data or low values hidden in background noise.

Case Study - The Frövi Bridge Project
213
-0.006
-0.004
-0.002
0
0.002
0.004
0.006
Crack openings southern track for "Regina" on northern track
[mm
]
SW Before strengthening = blue
SE Before strengthening = blue
SE After strengthening = red-0.006
-0.004
-0.002
0
0.002
0.004
0.006
Crack openings northern track for "Regina" on northern track
[mm
]
NW Before strengthening = blue
NW After strengthening = red
NE Before strengthening = blue
NE After strengthening = red
Figure 7.29 Crack openings for Regina trains passing on the northern track. Left: Underneath the southern track; Right: Underneath the northern track
Fibre Optical Sensors
Outcomes from these measurements are highly dependent on the work done by our colleagues at City University in London. Initially they had some problems with the interpretation of the signals and no comparisons have been possible to perform between the traditional strain gauges and the FOS. So far one curve on how the output varies in the three northernmost sensors of the bar during the passage of a freight train on the northern track is available. This can be seen in Figure 7.30. The maximum values correspond reasonably well with the values found for the same type of trains in Appendix E. Unfortunately no traditional measurements of the train passage visualized in Figure 7.30 are available so further work is necessary before a good comparison can be made.
Figure 7.30 Strains in the fibre optical sensors on the bar underneath the northern trough when a freight trains passes on the northern track, Kerrouche et al. (2008)

Mechanical Anchorage of Prestressed CFRP Tendons
214
The tubes experienced only small strains and most parts of the data were lost in the inherent noise of the fibre optical system with amplitudes of up to 5 .
Successful measurements with the same type of fibres but with different interpretation methods have been performed during 2006 on the Örnsköldsviks Bridge. More facts on that application can be found in a report written as a deliverable to the European funded project Sustainable Bridges (www.sustainablebridges.net), Enochsson et al. (2007).
Long Term At the moment only a brief evaluation of the long term results has been performed. These early results do not show any differences in strains due to changes in temperature and the strains do not seem to change over time, see Figure 7.31.
0 1000 2000 3000 4000 5000 6000 7000 8000 9000-60
-50
-40
-30
-20
-10
0
10Average strains in Steel reinforcement for "Regina" on southern track
[mm]
[m
/m]
Before strengthening = blue
After strengthening = red
0 1000 2000 3000 4000 5000 6000 7000 8000 9000-60
-50
-40
-30
-20
-10
0
10Average strains in Steel reinforcement for "Regina" on southern track
[mm]
[m
/m]
Measurements from May = red
Figure 7.31 Comparison of average strains induced by Regina trains. Left: Strains measured in direct connection with the strengthening in July and September 2007; Right: Strains measured in May 2008
7.4.3 Discussion and Conclusions Monitoring has been performed along one transverse section of the bridge and across four cracks at the side of that section. These measurements present a good insight into the bridge’s transverse structural behaviour at the spans midpoint. From the measured deflections it is obvious that the loaded trough also experienced the largest displacement. Also the centre beam and the edge beam on the loaded side seem to be involved in this deflection while the unloaded edge beam is unaffected. From the LVDTs positioned underneath the troughs and closest to the centre beam a small difference between the northern and southern side might be noticed. A higher deflection on the southern side may be evidence of a slightly softer transition from centre beam to slab on that side. This remark is further emphasized by the transverse strain measurements, and then especially on the steel reinforcement. In the southern trough the bridge experience a smoother strain distribution than in the northern

Case Study - The Frövi Bridge Project
215
trough; where the trough’s central gauge shows larger maximum tensile values while the one closest to the centre beam remains close to zero.
Based on this difference in stiffness between the trough’s slabs at the centre of the span it should perhaps be possible to make some suggestion on how the cracks are to behave. Either a soft behaviour with larger strains close to the centre beam at the middle of the span results in larger cracks closer to the abutments or a compensational stiffer behaviour at those points. Neither can however be found. The largest additional openings due to traffic before strengthening can instead be found at the positions where the original openings were largest. That is at the north-eastern and south-western positions. These positions are constrained by the 71° angle between the abutment and the centre beam while the remaining two positions are constrained by the wider 109° angle. It is likely that the cracks in the areas with a narrow angle become larger than the others because the structure lacks sufficient ductility to handle necessary deformations in those regions. After strengthening, all additional crack openings are reduced to values close to zero except for openings on the north-western crack. This reduction is a natural result of the NSMR installation across all cracks which spread necessary strains over a larger area. For further reduction of openings and closure of the cracks in unloaded state it might be necessary with prestressing of the NSMR or prestressing by some other means.
From strain measurements on the unloaded part of the bridge compressive readings can be found both in the lower steel reinforcement and after strengthening in the NSMR. Freight trains give considerably higher values than Regina trains and indicate that this strain is proportional to an increase in loading and not only a product of background noise. Visual inspections of raw data files also confirm that. That these compressive strains exist indicate that the bridge can not be seen as two slabs hung in the centre beam and respective edge beam. A study of the original reinforcement design does however suggest that this may have been the intention of the original design. The transverse cross section must instead be seen as a two span slab with support lines along the longitudinal beams, or a compromise between the two cases. Tensile strains seen in the upper CFRP tubes for traffic on the opposite track further support this statement.
Questions regarding to which extent the strengthening has been successful are always brought up in full scale strengthening projects where no tests to failure are available. These issues can often be solved by measurements both before and after CFRP application and a comparison between deflections and strains. Such comparisons have been presented also for this project but they show no distinct decrease in either deflections or strains. Strains underneath the stiffer northern trough have increased and deflections have decreased while the opposite is true for the softer southern trough. For this to be possible something must have happened to the boundary conditions for the slab in each trough. In the northern case an assumption is that the edge and centre beams experience stiffer longitudinal behaviour due to a higher overall stiffness of the structure. This results in a lower beam deflection at midspan and consequently a lower deflection also for the slab in relation to ground. With that in mind it is not impossible

Mechanical Anchorage of Prestressed CFRP Tendons
216
with higher strains even though the deflection is lower. A desirable result would however of course have been a decrease in both deflections and strains underneath both troughs. As it is now signs of FRP utilization have to be sought in readings from sensors on the NSMR, tubes and over cracks. All of them also show that the CFRP handles a large amount of forces and that the crack openings have decreased.
It has not been determined what the disappointing results from comparison of readings from before and after strengthening depends on. A probable cause is however the limited weight of loading and a design well on the safe side. Strains are overall very small and it is suspected that the bridge is far from even reaching the lower serviceability limit state during this period of monitoring.
Fibre optical sensors are a method for the future. With sufficient protection the thin fibres can be positioned in cut grooves in the CFRP or be included in the CFRP during production. Once in position they can give accurate results for long periods, ideal for monitoring of a structure’s performance over several years. Disadvantages are the high cost, one grating written on the fibre may cost up to 100 €, and the difficulties for a non-physicist to interpret the raw data. In the co-operation in this project several misunderstandings were revealed, the civil engineers do not understand the limitations and possibilities of the fibre optical system while the physicists do not understand the structures behaviour. A continuous dialogue has therefore been necessary to produce visualizations that to a civil engineer are obvious output from a CSHM project.
Some conclusions can from the above reasoning be drawn concerning the bridge’s behaviour before and after strengthening
The unloaded trough is also affected by transverse bending when a train passes on the opposite trough. The transverse section must therefore be handled as a continuous two span beam/slab. Cracks due to designed lack of lower steel reinforcement at the slab/centre beam interface are larger and open up more under load when the slab’s ductility is decreased due to higher constraints on the boundaries. If closure of these cracks is desired prestressing is necessary. No distinct change in readings from LVDTs or strain gauges could be seen between readings from before and after strengthening. Utilization of FRP could instead be proven through the strain measurements on NSMR and tubes. Higher loads are necessary to achieve more distinct evaluations of the bridge’s behaviour and its change in structural behaviour due to the strengthening. Fibre optical sensors will become a good tool to use in monitoring of CFRP in civil engineering structures in the future.

Case Study - The Frövi Bridge Project
217
7.5 Refined Calculations Results and the following discussion from the monitoring suggest that insufficient loading is applied to fully utilize the capacity of the CFRP. As it is now it is possible to see that the NSMR and CFRP tubes are strained in a similar way as the steel and that they thereby also carry parts of the load. Nevertheless the improvement on the bridge’s structural behaviour in the service limit state is very limited. This can of course be explained by the fact that the bridge is strengthened for the ultimate limit state but also due to the fact that the span of the bridge is short and the bridge is very stiff in the transverse direction. In addition to this, before strengthening the bridge had large visible cracks which were injected in combination with the strengthening measure. This made the bridge stiffer than it otherwise would have been. It is no doubt that the CFRP systems contribute to the load carrying capacity. But an interesting question is whether the bridge needed to be strengthened at all. In the classification calculations carried out by the consultants some assumptions regarding the boundary conditions have been made. It would be interesting then to carry out more refined calculations to investigate if any change in the assumptions may reach to a sufficient capacity in the bridge.
These calculations are only focused onto flexural moment capacity in a cross section at midspan and transverse to the bridge’s centre line. This section can be seen in Figure 7.10 and no slab theory is incorporated into the calculation even though the trough bottoms are supported along all four edges.
7.5.1 New vs. Old approach In the bearing capacity design performed in 2005 the design load is based upon Banverket (2000) and train load model number VI. Forces are then distributed in the structure through the use of Brigade Standard, a FEM software developed for modelling of bridges. Results from the modelling can be found together with the entire bearing capacity calculation in Tyréns (2005).
Load Calculations Transverse flexural forces acting on the interesting cross section are displayed in Figure 7.32. These forces are used as designing forces in the original bearing capacity calculation as well as in the new calculations. Differences in safety margin are therefore solely dependent on differences in load carrying capacity between the calculations. To achieve this force distribution several load combinations are used; ultimate limit state, accident and fatigue loading. In addition two sections per combination are considered, one at the spans centre and one close to the western abutment. From those the worst negative and positive values are chosen in 15 points, along the cross section, which then are combined linearly to form the load diagram. Consequently this is a worst case scenario combining the highest bending moment in 15 points along the cross section

Mechanical Anchorage of Prestressed CFRP Tendons
218
due to load combinations; at the for each point worst section along the span. This makes it simple to design strengthening but it will also create large amounts of extra safety in the structure. An alternative would have been to divide the span into several sections; this could have decreased the final amount of CFRP necessary.
0 1500 3000 4500 6000 7500 9000Transverse distance [mm]
200
100
0
-100
-200
Tran
sver
se fl
exur
al m
omen
t [kN
m] Design load upper part
Design load lower part
Negative and positive bending moments used in design
Figure 7.32 Bending moments used in design calculations based upon FEM analysis in Brigade Standard, after Tyréns (2005)
Model for Capacity Calculations Bearing capacity calculations forming the basis for strengthening design were based on the cross sectional model shown in the left part of Figure 7.33. Further it was assumed that the cross section behaves as a beam in 2 dimensions. With these assumptions insufficient transverse capacity in the beams are discovered both with respect to negative and positive bending. In the troughs the insufficiency is limited to negative bending moments, which indicates a lack of transverse tensile reinforcement in the troughs upper part. A graphical interpretation of this can be seen in Figure 7.4 on page 188.
Figure 7.33 Area of the bridge’s cross section involved in bearing capacity calculations. Left: Original area; Right: New area
In the new calculations a larger area has been assumed to cooperate as carrier of the transverse bending moment. This is a means of increasing the capacity in the beam sections where lack of capacity was at its greatest. Continuous stirrups designed to handle shear forces in the longitudinal beams are in this model also incorporated in the handling of transverse bending moments. No detrimental effects on the shear capacity should however appear since the transverse bending only affects the horizontal parts of the stirrups while longitudinal shear is handled by the vertical parts. Reinforcement

Case Study - The Frövi Bridge Project
219
drawings are found in Appendix C. Another positive side effect with inclusion of the beams are the larger effective depths achieved at those sections.
Material Properties Original drawings from 1956 tell that the concrete used in construction of the bridge has quality K400 and that the reinforcement is made of Ks40 steel. According to Banverket (2005) the old quality notation for concrete corresponds to K40 in BBK 94, Boverket (1994), or C28/35 in BBK 04, Boverket (2004). K40 and C28/35 differ slightly from each other in compressive and tensile strengths and in Young’s modulus. Calculations performed in 2005 are based on BBK 94 and the new ones on BBK 04; which give rise to a slight difference in concrete properties. Steel of quality Ks40 does in both standards have the same characteristic yield strength. Interesting mechanical properties of concrete and steel together with partial safety factors are presented in Table 7.3.
Table 7.3 Mechanical properties for concrete and steel used in bearing capacity calculations
Concrete n = 1.2 (Safety class 3) Steel
m, strength = 1.5 Banverket (2000) Banverket (2005) m, strength = 1.15 Banverket (2000/2005)
m, E = 1.2 BBK 94 BBK 04 m, E = 1.05 BBK 94/04
fcc [MPa] 28.5 27.0 fy [MPa] 410
fcc,justa [MPa] 1.15 fcc - 2 = 30.775 1.15 fcc = 31.05 fyd [MPa] 297
fccd,just [MPa] 17.1 17.25 Es [GPa] 200
fct [MPa] 1.95 1.8 Esd [GPa] 159
fctd [MPa] 1.08 1.0 Ecb [GPa] 32 33
Ecd [GPa] 22.2 22.9
characteristic valuedesign value
n m
a fcc,just is an adjusted compressive concrete strength prescribed by Banverket for bridges older than 10 years
b Ec is dependent on the adjusted compressive strength in Banverket (2005)
FRP tubes and NSMR bars have the same properties both in the strengthening design used for the actual strengthening and the new one performed afterwards to investigate possible extra capacity. They can be seen in Table 7.4.
Table 7.4 Mechanical and geometrical properties of the CFRPs used in strengthening design
n = 1.2; m = 1.2 Ef
[GPa]
Efd
[GPa]
ff
[MPa]
f
[‰]
fd
[‰]
Across
[mm2]NSMR StoFRP Bar M10 C 260 181 2500 10 7 100 Tubes StoFRP Tube EØ32 C t4 150 104 2000 13 9 350
Bearing capacity calculations from 2005 use a concrete cover of 1.5 while the new calculations use 30 mm, which is on the safe side and more accurate according to visual

Mechanical Anchorage of Prestressed CFRP Tendons
220
investigations made during strengthening. Also concrete quality was investigated on small cores with a diameter of 60 mm; these were however in many cases contaminated by large aggregates. Results from them giving compressive strengths of up to 100 MPa have therefore not been considered, the exact test values are given in Table 7.5.
Table 7.5 Compressive strength of small concrete cylinders taken from the bridge. The results can not be seen as representative since the ballast size is relatively large and the ballast does probably to a great extent influence the strength of the cylinders.
fc,
[MPa]
F
[kN]
Comment
1 112.0 104.3 2 135.5 125.0 Ballast size>d/3 3 124.0 118.8 d<50 4 128.5 122.2
Diameters, lengths and positions of existing steel reinforcement are taken from reinforcement drawings in Appendix C. NSMR bars are positioned with their centre 10 mm into the concrete and 400 mm apart, as they were applied. Tubes are assumed to work at a distance of 240 mm above the lower concrete surface and 800 mm apart, which is averages of measured distances. 2.5 bars and 1.25 tubes are thereby included in a 1 m wide beam.
New capacity calculations are performed in seven critical sections along the transverse cross section, which with consideration of symmetry altogether forms 13 sections. These sections can be seen in Figure 7.34 and they are named after the distance to the southern/northern edge beam. Between these sections the capacity is assumed to vary linearly, although it is known that that is a simplification. In the 2005 calculations 15 sections, as for the loading, were calculated.
Figure 7.34 Sections used for the new bearing capacity calculations
7.5.2 Before Strengthening For each section a cross sectional height and the horizontal distance between transverse bars in upper and lower part of the section are taken from drawings. Values are collected in Table 7.6.
300 800 1200 2250 3700 45003300

Case Study - The Frövi Bridge Project
221
Table 7.6 Geometrical properties of the calculated sections
Section300
(8700)
800
(8200)
1200/3300
(5700/7800)
2250
(6750)
3700
(5300)4500
Height, h [mm] 1030 325 325 325 325 1100 Lower distance, ccs [mm] 200 200 100 100 - 200
Lower reinforcement diameter, Ø 10 16 16 16 - 10
Upper distance, cc’s [mm] 200 150 150 300 150 150 Upper reinforcement diameter, Ø’ 10 10/16a 10/16a 10 10/16a 10
a Every second bar is a 100 mm bar and every other second a 16 mm bar
Calculations of unstrengthened capacity are performed according to Swedish guidelines found in Svensk Byggtjänst (1990).
Single and Normal Reinforced Cross Section Each studied section is treated as two single reinforced beams with all compression handled by the concrete. For positive bending moment capacity, Mpos, the section is calculated with tensile reinforcement in the lower part, As, while it for negative bending moment capacity, Mneg, is turned up side down and calculated with the upper reinforcement, A’s, as tensile. Reinforcement is as all other calculations based on a 1 meter wide section.
,
ss bal
ccd s tens
Af bd
(7.1)
where s is assumed to be equal to fyd, b is the cross section’s width which in this case is 1000 mm, A is the tensile reinforcement area, ds,tens is the effective depth and bal is the balancing mechanical amount of reinforcement. We then define:
,
,
andand
pos s tens s s
neg s tens s s
M d d A AM d h d A A
where ds and d’s are the distances from the concrete’s upper surface to the lower and upper reinforcement respectively.
735
0.8 0.8 0.5141 1sy y
cu
bal bal f (If ultimate strains from BBK are used)
If the requirement in Eq. (7.1) is violated the section is over reinforced and calculations for double reinforced cross section should be used. See the next section.
12
ssm (7.2)
2ccdM mbd f (7.3)

Mechanical Anchorage of Prestressed CFRP Tendons
222
Double reinforced cross section The model for double-reinforced sections is based upon a division of the bearing capacity into two parts. One considers the capacity of the single reinforced section with tension handled by one part of the tensed reinforcement, As(I), and compression handled by the concrete. This capacity is named M(I). The second part considers a section with the remaining tensile reinforcement, As(II), and the compressive reinforcement. This capacity is named M(II), and no concrete strength contributes. By addition of M(I) with M(II) a total capacity is reached, M.
In a capacity calculation the second part is the first calculated, opposite to the design procedure. If the upper and lower steel areas are the same or the compressive steel area is larger than the tensile no M(I) exists, otherwise M(I) is based upon the tensile reinforcement exceeding the compressive.
An assumption that the compressive stress, ’s, in the steel equals the yield strength give the following equation for the second part of the sections capacity.
( ) min ;II s s yd s sM A A f d d (7.4)
( ) max ; min ;s I s s s sA A A A A (7.5)
( )( )
s I yds I bal
ccd
A fbdf
(7.6)
where b and bal is the same as for the single reinforced cross section and d is the effective depth:
s s s
s ss
d if A Ad
if A Ah d (7.7)
2( )I ccdM mbd f (7.8)
Since the amount of reinforcement is larger in either the upper or lower part of the slab, or equal, M(I) must be zero for either positive or negative bending moment, or both. Eq. (7.9) is used to calculate whether M(I) can be added to the positive or negative bending moment capacity.
( )
( ) ( )
if
ifif0
positive
negative
I s s
I I s s
s s
M A A
M M A AA A
(7.9)
( ) ( )I IIM M M (7.10)
For control of the initial assumption that ’s = fyd Eq. (7.11) and Eq. (7.12) are used.

Case Study - The Frövi Bridge Project
223
0.81 if
0.81 if
scu s s
s ss
scu s s
s s
dA A
d
h dA A
h d
(7.11)
where cu = 3.5 ‰ according to BBK.
if where
if
ydyd s sy sy
sds
sd s s sy
ff
EE
(7.12)
If the latter case in Eq. (7.12) is true iteration is necessary with the calculated ’s as starting value instead of fyd in Eq. (7.4).
ResultsTable 7.7 shows the results from the new calculations of the bridge’s transverse bending capacities before strengthening. Moment capacities for handling of negative bending refer to a case where the upper reinforcement is tensed and vice versa.
Table 7.7 Capacities concerning positive and negative transverse bending moment before strengthening
Section 300 (8700) 800 (8200)1200/3300
(5700/7800)
2250
(6750)
3700
(5300)4500
Mpos [kNm/m] 115.7 83.1 161.1 161.1 0.0 123.9 Mneg [kNm/m] -115.7 -78.1 -78.1 -22.4 -78.1 -165.0
A comparison of the bearing capacity distribution between calculations performed in 2005 and the new calculations is shown in Figure 7.35. Increases in capacities are more pronounced in the beams, as expected. Small increases can also be noticed in the troughs except positive bending moment in a section close to the centre beam. That is where the amount of tensile reinforcement is zero and consequently also the capacity to handle tensile forces. Figure 7.36 show a comparison of the new capacities with the design loads.

Mechanical Anchorage of Prestressed CFRP Tendons
224
0 1500 3000 4500 6000 7500 9000Transverse distance [mm]
200
100
0
-100
-200
Ben
ding
mom
ent c
apac
ity [k
Nm
]
Mneg in new calculationMpos in new calculationMneg in 2005 calculationMpos in 2005 calculation
Bending moment capacities before strengthening
Figure 7.35 Capacities reached in the calculations performed in 2005 compared with capacities from the new calculations
0 1500 3000 4500 6000 7500 9000Transverse distance [mm]
200
100
0
-100
-200
Bend
ing
mom
ent [
kNm
]
Mneg in new calculationMpos in new calculationNegative design loadPositive design load
Necessary strengthening
Figure 7.36 Amount of strengthening necessary to reach enough positive and negative bending capacity in the cross section. This should be compared to the same diagram for the 2005 calculation presented in Figure 7.4.
Capacities from 2005 and design loads are also shown in Figure 7.4. There the diagram shows a total necessity to strengthen for -155 kNm and + 80 kNm while with the new calculations it can be decreased to -30 and + 60 kNm respectively.
7.5.3 After Strengthening All calculations for the strengthening are based upon Täljsten (2004). It gives a guide on how to design FRP strengthening for the common cases, bending, shear, torsion, fatigue and confinement. For the Frövi Bridge calculations for bending are necessary and this consists of three parts. In the first an initial state of strain in the bridge due to dead weight is determined. With those values in mind it is possible to decide upon a failure mode to calculate the necessary strengthened bending moment capacity.

Case Study - The Frövi Bridge Project
225
Initial Stresses and Strains
To be able, at a later stage, to determine the failure mode of the strengthened section the existing steel and concrete strains must be calculated both in the upper and lower part of the studied section, and this for all sections given in Figure 7.34. Dead weight serves as the loading and with an assumed constant loading along the entire cross section the distribution for the dead weight bending moment, Mdead, is obtained from a two span beam. These moments and the assumed load case are shown in Figure 7.37.
Bending moment due to dead weight-60
-40
-20
0
20
40
0 1 2 3 4 5 6 7 8 9
Transverse distance [m]
Ben
ding
mom
ent
[kN
m]
Figure 7.37 Load model for dead weight calculations and resulting bending moments
First a distance to the neutral layer is calculated based on Eq. (7.13) which is a second degree equation with two possible outputs, but only one reasonable.
2
, , , ,1 '2 s s comp s comp s s tens s tens
bx A x d A d x (7.13)
where
1s es
c
EE
and the assumed creep factor, e = 2, due to the bridge’s position and
following from recommendations in Svensk Byggtjänst (1990).
, , , ,
, , , ,
00
s comp s s comp s s tens s s tens sdead
s comp s s comp s s tens s s tens sdead
A A d h d A A d h dMA A d d A A d dM
Eq. (7.13) and the following equation for moment of inertia are both based upon the fact that the concrete is cracked and that all tensile forces are handled by the steel reinforcement. That the concrete actually is cracked is confirmed by visual inspections.
23 2 2, , , ,1 '
12 2 s s comp s comp s s tens s tensbx xI bx A x d A d x
Moments of inertia, bending moment and distance from the neutral layer to the upper and lower surface are now used to calculate maximum compressive and tensile strains in each section.
deadMh x
I; and dead
efE; where
1cd
efe
EE
q0 = 21.1 kN/m
4.5 m 4.5 m

Mechanical Anchorage of Prestressed CFRP Tendons
226
Hooke’s law finally presents initial strains due to dead weight in the sections. These can be seen in table Table 7.8, where tensile strains have positive values and vice versa.
Table 7.8 Initial strains in the lower and upper part of the slab due to dead weight
Section 300 (8700) 800
(8200)
1200/3300
(5700/7800)
2250
(6750)3700 (5300) 4500
dead,l [ m/m] 0.00021 0.00078 0.00052 0.00051 -0.00018 -0.00012 dead,u [ m/m] -0.00003 -0.00027 -0.00027 -0.00029 0.00048 0.00082
Failure Mode
Again Täljsten (2004) is used for calculations. To determine what the failure will be five comparative parameters based on the fibre ratio must be calculated. Those are f1and f2 to determine whether the compressive steel reinforcement will yield or not and
fu, fn and fo to calculate if you have an under reinforced, balanced or over reinforced cross section.
Through the following relations one out of four failure modes can be found. The ratios and relations are also derived so that only one relation can be valid in each case.
1
2
1
Failure in laminate with yielding in the compression steel reinforcement
, Failure in laminate without yielding in the compression steel reinforcement
, Crushing of concr
fu f fn
f fu fn
f fn fo
2
ete with yielding in the compression steel reinforcement
, Crushing of concrete without yielding in the compression steel reinforcementfn f fo
After strengthening of the Frövi Bridge it was by iteration found that all sections will fail in mode III. That is crushing of the concrete without yielding in the compression steel reinforcement. Only the calculations for this case are therefore accounted for here. No consideration was taken in those calculations to the contribution of compressive strength given by either the NSMR or tubes.
is 0.8 according to the Swedish standards described in Svensk Byggtjänst (1990) and cu = 3.5 ‰.
1 , ,1
1 ,
1
ccd s tens yd s comp ydf
ccu dead f
s tens
v f f f
hE
v d
(7.14)
,2, ,
2
1 s compcccd s tens yd s comp cu sd
cfn
fd fd
dh vf f E
d v hE
(7.15)

Case Study - The Frövi Bridge Project
227
, 3, ,
, 3
, 3
11
1
s compccd s tens yd s comp cu sd
s tensfo
ccu dead fd
s comp
d vf f E
d v
h Ed v
(7.16)
- values are defined by the following equations and are derived from geometrical strain relations based upon the assumption that plane cross sections remain plane also during bending.
1,
cu
s tens cu s
xvd
; 2cu
fd dead cu
xvh
; 3,
cu
s comp cu s
xvd
(7.17)
Parameters that are dependent upon whether the section is bent in a positive or negative manner, that is if the lower or upper reinforcement is tensed, can be calculated from the relations below. A value of the dead weight strain is first chosen to base the other parameters on. For negative bending moments it is assumed that the tubes and tensile reinforcement are both positioned at a height of 240 mm from the concrete’s lower surface. This is also assumed to be the overall height of the section irrespective of the actual height. An assumption like this provides the correct internal lever arm for the tubes while the tensed steel’s lever arm is shortened by 4 to 5 mm in the slabs and around 800 mm in the beams. When calculating Ac it is however necessary to use the original height to be on the safe side.
,, ,,
,
,, , ,
,240 mm
s tens ss sc s tens s compdead dead l
s comp sc c
s tens cs sdead dead u c s tens s comp
s comp c sc c
c
d dA Ah h
d dA Ad hA A
hd h h dA A
A bh
(7.18)
Table 7.9 Comparative parameters according to Täljsten (2004) for positive and negative bending moments in each section respectively
Section 300 (8700) 800 (8200) 1200/3300
(5700/7800)2250 (6750) 3700 (5300) 4500
f1,pos 0.02683 0.02746 0.02202 0.02061 0.01939 0.02302 f1,neg 0.01597 0.01606 0.01736 0.01823 0.01476 0.01590 fn,pos 0.00221 0.002264 0.00189 0.001585 0.002877 0.002297 fn,neg 0.002721 0.002768 0.003243 0.003602 0.002136 0.002515 fo,pos 0.000139 0.001821 0.001411 0.001166 0.002018 0.000125 fo,neg 0.005397 0.005298 0.006188 0.006764 0.004869 0.00601
It is also necessary to keep track of the nature of the moment giving rise to the strain due to the dead weight. The following relation is used as assistance to get the values of the comparative parameters in Table 7.9 at their correct positions.
, ,dead l pos dead u negand (7.19)

Mechanical Anchorage of Prestressed CFRP Tendons
228
Strengthened Bending Moment Capacity
Once it is found out that failure mode III is the governing mode in all sections and in both positive and negative bending in each section the calculations for bending moment capacities are straight forward.
Distances to the neutral axis are calculated from Eq. (7.20) with help of the second degree solution presented in Eq. (7.21).
, , ,c
ccd s comp yd s tens yd cu dead fd f tens
h xf bx A f A f E A
x (7.20)
21 4 5
1
4 , , ,
5 ,
0
ccd
s comp yd s tens yd cu dead fd f tens
cu fd f tens c
C x C x CC f bC A f A f E AC E A h
(7.21)
Distances to the neutral axis during positive and negative bending together with the resulting capacities from Eq. (7.22) are presented in Table 7.10.
, , , ,
,
s comp yd s comp s tens yd s tens
ccu dead fd f tens c
M A f x d A f d x
h x E A h xx
(7.22)
Table 7.10 Distance to neutral layer and capacities concerning positive and negative transverse bending moment after strengthening
Section 300 (8700) 800 (8200) 1200/3300
(5700/7800)2250 (6750) 3700 (5300) 4500
xpos [mm] 77.5 41.9 53.7 62.6 34.3 79.4 xneg [mm] 36.3 37.4 49.2 58.6 27.7 33.8
Mpos [kNm/m] 1130.6 233.3 268.9 246.1 212.4 1277.5 Mneg [kNm/m] -126.0 -155.6 -118.4 -60.6 -203.4 -137.0
A comparison between Table 7.7 and Table 7.10 reveal that the resulting capacity after strengthening with the used equations is lower than the capacity in the unstrengthened case for negative bending in the centre beam. This value is shaded in Table 7.10. This is obviously a result of the assumption made during calculations of the strengthened section and not due to an actual decrease in the bridge’s capacity. Values from the unstrengthened bridge have therefore been used as values also for the strengthened bridge’s capacity. To avoid this outcome from the calculations and to provide a solution without these largely simplified assumptions new derivations are to be made of the equations presented in Täljsten (2004). In the new equations a distance from the concrete surface to the actual position of the FRP should be included. As it is now strains are based on the laminate case where the FRP is applied at the concrete’s surface.

Case Study - The Frövi Bridge Project
229
ResultsThe results from design calculations presented in Table 7.10 are compared in Figure 7.38 to the designing bending moments in Figure 7.32. It can be seen here how the available tensile bending capacities in both the upper and lower part of the slab is clearly higher than the calculated loading. In some parts of the lower parts of the slab the available capacity is above 1100 kNm while the load only reaches 155 kNm at its maximum.
0 1500 3000 4500 6000 7500 9000Transverse distance [mm]
1300
1200
1100
1000
900
800
700
600
500
400
300
200
100
0
-100
-200
Ben
ding
mom
ent [
kNm
/m]
Negative design loadPositive design loadMneg after strengtheningMpos after strengthening
Stremgthened capacities and designing loads
Figure 7.38 Comparison between the designing bending moments and the bending moment capacities after strengthening in the same scale as the previous bending moment diagrams

Mechanical Anchorage of Prestressed CFRP Tendons
230
7.5.4 Discussion and Conclusions During the new calculations for unstrengthened and strengthened bending moment capacities in a transverse cross section of the Frövi Bridge several assumptions and simplifications have been done. The first one considers the entire cross section as active in the load carrying of applied bending moments. This is contrary to the capacity calculations performed in 2005 where a section with the lowest slab thickness is considered throughout the section. Standards allow for an increase of thickness with 1 on a length 3, Banverket (2005), which would not allow for the assumption made. It is however assumed that if a bending crack is about to appear in the beam it will go through the entire section and thereby utilize horizontal reinforcement also in the upper part of the beam. Internal lever arm used for the following calculations should then naturally be one considering the full height.
Linear variation of capacity is assumed between the calculated sections. This is a common way of handling complex design problems and the sections chosen are chosen so that the most critical sections are covered by individual calculations. It should thereby be a trustworthy methodology to present a design performed in 13 points.
No tests on actual material properties on the existing bridge are performed. Some concrete cylinders were drilled out and tested to compression failure. These cylinders were unfortunately not intended for compression tests, but for ballast size investigations, and therefore not large enough to give reliable results. High compressive strengths of 110 MPa do nonetheless give a hint that the assumed strength of 17.25 MPa definitely is on the safe side. That value as well as the value on the reinforcements yield strength are both taken from original design drawings and classified according to today’s design codes. Applied safety factors and codes should assure that the values are on the safe side. Geometrical parameters are contradictory to the mechanical well investigated and taken directly from the actual condition.
With the above reasoning in mind it should be possible to interpret Figure 7.35. Higher capacities are reached in all sections but one both for positive and negative bending moment. The one section that differs from the other is the one where cracks have been described in earlier sections of this chapter. Original calculations performed in 2005 did not consider that section in particular and interpolated linearly between the two adjacent sections where calculations were performed. They did therefore not reach a zero value as was done in the calculations performed here.
Strengthening calculations started with an assumed initial strain distribution. In the loading a constant dead weight along the cross section is applied. The size of the weight is taken as the density of reinforced concrete although some parts in the troughs are lighter. Longitudinal beams are seen as perfect simple supports with zero width. Together the two assumptions present a state that to some extent is valid but also largely simplified on the safe side. Strains resulting from the dead weight calculations are however small and they give consequently very small contributions to the capacity calculations. A larger impact is then seen from the decreased section height applied to

Case Study - The Frövi Bridge Project
231
the calculations for negative bending moment capacities. With new derivations of the equations used it would be possible to increase the strengthened capacity and thus increase the bridges extra capacity even further.
As now can be seen in Figure 7.38 the bridge’s strengthened capacity is limited by the section calculated in the centre beam. The excess capacity there is only 10 kNm/m concerning negative bending while it in other parts such as positive bending in the beams have an overcapacity of up to 1250 kNm/m.
Conclusions that the new calculations contribute to are summed up here. Higher calculated bearing capacities can be reached in the Frövi Bridge by a change in the assumed model and motivations to why the new model is acceptable. The new capacities did despite their higher values not fully reach a safe level and strengthening of the section was necessary. This was pronounced in the section where lower transverse bending reinforcement was missing. Strengthening of the bridge gave sufficient capacity in all sections and large overcapacities in most parts. For positive bending the safety margin is 100 kNm/m at its lowest. Increase in allowed load is limited by the negative bending capacity in the centre beam. This is due to necessary simplifications done in the strengthened moment capacity calculation. Equations used for strengthened capacity calculations must be derived to account for internal strengthening when it now is proven that the method works practically.
7.6 Discussion and Conclusions This section deals with the overall impression of the Frövi bridge project. More detailed discussions on what the measurements and new design calculations have given can be found in Sections 7.4.3 and 7.5.4.
Strengthening with CFRP has not yet become an obvious choice for rehabilitation of structural assets. The reasons are probably several; there exists a lack of knowledge both among clients and consultants. In addition there do not exist many specialist contractors to carry out the strengthening work. Previously, absence of guidelines has been a hindrance, however, today guidelines exist. It might also be related to the fact that much of the old fashioned strengthening is made with well functioning traditional methods such as prestressed bars or wires. For the Frövi Bridge using prestressing would probably have been preferable. Smaller amounts of CFRP would have been needed, but still provided enough strengthening. In addition the compressive force induced in the concrete would most likely partly close the pronounced bending cracks. The chosen solution provided the strengthening and gave the structure a capacity well

Mechanical Anchorage of Prestressed CFRP Tendons
232
above the design load but it did not close the cracks. However, this was in the specific case taken care of with epoxy injection.
The conclusion concerning this issue is that a method for simple external or internal prestressing of CFRP is necessary if a higher utilisation of the CFRP material is to be achieved
From a production point of view and on a personal level the strengthening of the Frövi Bridge has been a great success. All parts of the project cooperated well and contributed to the final result. Reinforcement detection provided valuable information for the drilling and sawing crew who managed to create holes that proved to be straighter than expected. Finally the new routines for application of epoxy and CFRP, used by the contractor, impressed both the novice and the experienced personnel. As that novice I can only stress the advantages of this type of full scale experience during the research process. Just in this project more knowledge has been gained than during any of the university courses attended, and that is not only in one area of expertise. Measuring technique, production, material behavior, strengthening design, structural behavior and project economy have all been parts of the course.
All parts of the project played important roles. Even though the measurement, for example, gave somewhat disappointing results it at the same time gave important knowledge to the involved personnel.

Concluding Remarks
233
8 Concluding Remarks
As the work in this thesis covers several of the tools available for research in the area of structural engineering and they all have their own characteristics, each section of the thesis has for that reason ended with a section specific discussion. However, the discussions and conclusions in Chapter 7, where CFRP strengthening of a railway bridge is presented, are considered sufficiently thorough, not to be mentioned again in this chapter. For the remaining chapters the discussion carried out below serves as a summation of the work and it also tries to link the different tools used together.
CFRP as a Prestressing Material Possible advantages with the use of CFRP as prestressing material instead of traditional high strength steel are numerous. The CFRP is light-weight, non-corrosive and has mechanical properties that in vital aspects match also the best high strength steels. Extensive prestressing use of CFRP is however still limited. Reasons for that are to some extent found in the mechanical properties of the material and to some extent in the limited research performed in the area. Probably the largest hindrance is the relatively high material costs and the lack of experience.
Material costs are slowly decreasing, but a fact that is working more favorably towards the use of FRPs is the growing steel prices and the higher demand for space efficient strengthening and rehabilitation methods. Crucial for that to happen is a technical reliable, cost effective and industrialized prestressing system for the CFRP. As mentioned throughout this thesis a major obstacle in the search for such a system is the anchorage. Due to the orthotropic properties of the FRP, with low transverse strength and also due to the non existing yielding and the fibres brittle behaviour traditional anchorages for steel tendons will cause premature failure of the CFRP. Once the anchorage problem is solved more structural research on concrete components in

Mechanical Anchorage of Prestressed CFRP Tendons
234
interaction with CFRP prestressing can be performed. It is most likely that such research will discover further challenges in the use of CFRP as prestressing material but so far the anchorage has been found to be most crucial. More specifically the following problems were identified in relation to the use of CFRP in prestressing tendons:
No reliable and induztrialized anchorage has yet been developed to handle the transfer of forces from the tendon to the concrete. Transverse properties of the CFRP are not favorable and must be dealt with both in the anchorage zone and at the positions of deviators. Due to the above mentioned problems a limited research on long term effects in CFRP tendons can be noticed.
Development of Anchorage for CFRP Tendons Based on the findings in this thesis excellent knowledge on how a mechanical wedge anchorage should be designed to prevent premature failure of the CFRP rod is gained. Firstly, through the analytical model derived; secondly, trough the FE-model and laboratory tests. There an overall design similar to a wedge anchorage for steel has been developed. However, this anchor differs in the mode of gripping; while an anchorage for steel relies on internal threads the wedge anchorage for a CFRP tendon relies on friction. Stress concentrations in the interface between the wedges and the rod must be avoided to prevent local overload of the tendon due to the high principal stresses developed. It is also necessary for all edges of the wedges to be smooth and not “dig” into the brittle CFRP. If that happens, either due to threading, longitudinal edges or badly designed fronts the fibres will be bent and fail instantaneously. During the development of the anchorage all of these failures were experienced and the anchorage behaviour and force transferring qualities are now well known. More specifically the following major effects on the tendon due to the force transfer between the anchorage and the tendon are identified within this thesis:
Sharp edges on the inner surface of the wedges dig into the tendon and cut or break indiviudual fibers which ultimately lead to a premature failure of the entire tendon. At positions in the tendons where the tensile stress is at maximum even a minimal radial pressure will create higher principal stress that the tendon eventually can not carry. If insufficient radial pressure is applied on the tendon it will slip out of the anchorage.
Capacity of the Developed Anchorage So far the tests performed on the anchorage produced very promising results. In the ultimate failure test, the wedge anchorage showed as high failure loads as the tests with large clamped anchorages in both ends. Also the strain distribution in the anchorage

Concluding Remarks
235
measured with strain gauges at the outer surface of the barrel and with fibre optical sensors along the rod show a good agreement with an assumed favorable distribution. That is with an increasing force transfer from the point where the rod enters the anchorage to the back of the anchorage all stress concentrations are avoided. An FE-model of the final wedge anchorage show the same tendencies concerning the shape of the strain distribution although the magnitude of the modeled strains is higher than those measured. These differences are assumed to be related to the coarse mesh used in the barrel. For a better similarity between the strains in the model and the laboratory a higher computational capacity must be used. Since the shapes agree well the model will be used for development of future anchorages, but with focus on the stress distribution rather than the magnitude of stresses. More specifically the work presented in this thesis suggests that a suitable wedge anchorage can be produced for the anchorage of CFRP tendons based upon the following observations:
During the first short term tests performed the anchorage developed at this point facilitate failure stresses of the CFRP tendon that are 100 % of the CFRPs ultimate failure stress. In the analysis of the results the longitudinal distribution of radial forces is promising with low pressure in the front and high pressures in the back. Due to the positive similarities between the results from the FE-model and the laboratory tests the rate of development will increase in the future when some of the work can be done in the computer.
8.1 Future Improvements and Research A licentiate thesis may be seen as a sum-up of the research level at its date of publication and as a source to find suggestions on future research in the continuation of the PhD studies. The future research can be improvements of methods that have been applied in pilot applications, it can be finalizing of initiated processes or the initiation of new, necessary to confirm developed theories or to take the research one step further. This thesis is an excellent source in many of the mentioned aspects. The suggestions on future research are briefly mentioned below separated into distinct areas.
Improvement of anchorage design is an urgent matter, and then not only its design, but also its record of proof tests. More tests concerning dynamic and long term performance, performance during cyclic loading and fatigue must be performed to prove the overall reliability of the anchorage.
Improvement of measurements must be done regarding the fibre optical sensors, the strain measurements on the barrel and the measurement of wedge sliding. Fibre optical sensors are incredible in the investigation of the anchorage’s interior but the reliability of the measurements must be improved. A FOS system that can handle larger strains should also be aimed for. Concerning the strain gauges on the barrel they must be

Mechanical Anchorage of Prestressed CFRP Tendons
236
smaller to measure at a more specific position, they should also be tri-axial for calculations of the principal strains. Finally the sliding of the wedge is important to control with direct measurements instead of as this time with calculated values based upon movement of the rod in relation to the test machine. Common for all of these sensors are that the measurements during presetting must attain higher focus. In the tests performed in this thesis that process has been fast and the measurements were made with too low frequency. The stresses induced during the presetting forms the basis for the anchorage’s behaviour in the tensile phase.
The analytical model should be finalized, compared with FE-analysis and used to predict the anchorage’s behaviour.
The FE-model can be improved to give enhanced precision in the strains of the outer surface of the barrel. As the model is developed at this stage the elements in the barrel are too large to find all shifts in strain at the surface. Further improved material models must be defined for the CFRP in the transverse direction. At this point they are merely a qualified guess than a reliable fact. Also the interaction properties between the materials are urgent to find if the model is to be complete.
Application at component level has already been initiated at Luleå University of Technology but was interupted as the problems with the anchorage appeared. These tests of prestressed CFRP tendons applied to concrete beams must be resumed and carried through to take development one step further.
Application at structural level in form of demonstration projects is a natural final step for the future research and development where the CFRP for example can be used to anchor concrete dams to the ground or externally prestress bridges.

References
237
References
ACI (2001): Guide for the design and construction of concrete reinforced FRP bars, ACI 440.1R-01, American Concrete Institute, Farmington Hills, US
ACI (2004): Prestressing Concrete Structures with FRP Tendons, ACI 440.4R-04, American Concrete Institute, Farmington Hills, US
ACI (2005): Metric Building Code Requirements for Structural Concrete and Commentary, ACI 318M-05, American Concrete Institute, Farmington Hills, US
ACI (2007): Report on Fiber-Reinforced Polymer (FRP) Reinforcement for Concrete Structures., ACI440R-07, American Concrete Institute, Farmington Hills, US
Al-Mayah, A., Soudki, K. & Plumtree, A. (2001a): Experimental and analytical investigation of a stainless steel anchorage for CFRP prestressing tendons, PCI Journal 46(2), 88–100
Al-Mayah, A., Soudki, K. & Plumtree, A. (2001b): Mechanical behavior of CFRP rod anchors under tensile loading, Journal of Composites for Construction 5(2), 128–135
Al-Mayah, A., Soudki, K. & Plumtree, A. (2005a): Variable thickness barrel anchor for CFRP prestressing rods. Ned Burns Symposium on Historic Innovations in Prestressed Concrete, ACI SP-231, 237-252
Al-Mayah, A., Soudki, K. & Plumtree, A. (2005b): Effect of Sandblasting on Interfacial Contact Behavior of Carbon-Fiber-Reinforced Polymer-Metal Couples, Journal of Composites for Construction, Jul/Aug, 289-295
Al-Mayah, A., Soudki, K. & Plumtree, A. (2006a): Development and assessment of a new CFRP rod-anchor system for prestressed concrete, Applied Composite Materials 13(5), 321–34
Al-Mayah, A., Soudki, K. & Plumtree, A. (2006b): FEM and mathematical models of the interfacial contact behaviour of CFRP-metal couples, Composite Structures 73, 33-40
Al-Mayah, A., Soudki, K. & Plumtree, A. (2006c): Effect of Sleeve Material on Interfacial Contact Behavior of CFRP-Metal Couples, Journal of Materials in Civil Engineering, Nov/Dec 2006, 825-830
Al-Mayah, A., Soudki, K. & Plumtree, A. (2007): Novel anchor system for CFRP rod: Finite-element and mathematical models, Journal of Composites for Construction 11(5), 469-476
Al-Mayah, A., Soudki, K. & Plumtree, A. (2008): Effect of rod profile and strength on the contact behavior of CFRP-metal couples, Composite Structures 82, 19-27

Mechanical Anchorage of Prestressed CFRP Tendons
238
Aram, M. R., Czaderski, C. & Motavelli, M. (2008): Effects of Gradually Anchored Prestressed CFRP Strips Bonded on Prestressed Concrete Beams, Journal of Composites for Construction, Jan/Feb, 25-34
Bakis, C. E., Bank, L. C., Brown, V. L., Cosenza, E., Davalos, J. F., Lesko, J. J. Machida, A. Rizkalla, S. H. & Triantafillou, T. C. (2002): Fiber-Reinforced Polymer Composites for Construction - State-of-the-Art Review, Journal for Composites for Construction 6(2), May 2002, 73-87
Banverket (2000): Standard BVH 583.11, Bärighetsberäkning av järnvägsbroar, utgåva 3. The Swedish Rail Administration, 2000
Banverket (2005): Standard BVS 583.11, Bärighetsberäkning av järnvägsbroar. The Swedish Rail Administration, 2005
BBR (2006): BBR VT CONA CMI - Bonded Post-tensioning System. Product brochure, Bahnstrasse 23, Schwerzenbach, Switzerland. Also available 200801 on: http://www.bbr-network.com/uploads/media/CONA_CMI_ETA_06_0147_ENG_01.pdf
BBR (2007): BBR VT CONA CMM - Unbonded Post-tensioning System. Product brochure, Bahnstrasse 23, Schwerzenbach, Switzerland. Also available 200801 on: http://www.bbr-network.com/uploads/media/CONA_CMM_ETA_06_0165_ENG_01.pdf
Bech, J. I., Eriksen, K. P. & Goutianos, S. (2006): Stress Analysis of FRP Compression Test by FE-modeling. Polymer Composite Materials for Wind Power Turbines, Proceedings of the 27th Risö International Symposium on Materials Science, Roskilde, Denmark, 2006, 131-138
Benmokrane, B., Xu, H. & Nishizaki, I. (1997): Aramid and carbon fibre-reinforced plastic prestressed ground anchors and their field applications, Canadian Journal of Civil Engineering 24, 968-985
Bergström, M., Danielsson, G., Johansson, H. & Täljsten, B. (2004): Mätning på järnvägsbro över Fröviån, Technical Report, Technical University of Luleå, Luleå, Sweden, 73 p
Boverket (1994), (2004): Boverkets handbok om betongkonstruktioner, BBK (94), (04). Boverket, Karlskrona, Sweden
Boverket (2003): Regelsamling för konstruktion - Boverkets konstruktionsregler, BKR, byggnadsverkslagen och byggnadsverksförordningen. Boverket, Karlskrona, Sweden, 2003
Braimah, A., Green, M. F. & Campbell, T. I. (2006): Fatigue behaviour of concrete beams post-tensioned with unbonded carbon fiber reinforced polymer tendons, Canadian Journal of Civil Engineering 33, 1140-1155
Branson, D. E. (1977): Deformation of Concrete Structures, Mc-Graw-Hill International Book Company, New York, USA
Burgoyne, C. J. (1990): Properties of polyaramid ropes and implications for their use as external prestressing tendons, External prestressing in bridges, ACI, Detriot, Michigan, 107-124

References
239
Burr, A. H. & Cheatham, J. B. (1995): Mechanical analysis and design. Prentice.Hall, Inc. Englewood Cliffs, New Jersey 07632, USA
Campbell, T., Shrive, N., Soudki, K., Al-Mayah, A., Keatley, J. & Reda, M. (2000): Design and evaluation of a wedge-type anchor for fibre reinforced polymer tendons, Canadian Journal of Civil Engineering 27(5), 985–992
CCL (2008a): Post Tensioning Systems. Product brochure, CCL Park 2000 Millenium Way, Westland Road, Leeds, UK. Also available 200801 on: http://www.cclstressing.com/uploadpdf/1179131441.pdf
CCL (2008b): Pre Tensioning Systems. Product brochure, CCL Park 2000 Millenium Way, Westland Road, Leeds, UK. Also available 200801 on: http://www.cclstressing.com/uploadpdf/1179130767.pdf
CEN (2004): Eurocode 2: Design of concrete structures- Part 1-1: General rules and rules for buildings. European Committee for Standardization, Brussels, Belgium, December 2004
Collins, Michael P. & Mitchell, Denis (1991): Prestressed Concrete Structures. Prentice Hall, Englewood Cliffs, New Jersey 07632, USA
CSA (2000): Canadian Highway Bridge Design Code, Canadian Standards Association International, CSA-S6-00, Toronto
Czaderski, C. & Motavalli, M. (2007): 40-year-old full-scale concrete bridge girder strengthened with prestressed CFRP plates anchored using gradient method, Composites Part B 38(7-8), 878–886
Dolan, C. W. (1993): FRP dvelopment in the United States. Fiber reinforced plastic reinforcement for concrete structures: properties and applications, ed A. Nanni, Elsevier 1993, 129-163
DSI (2006a): DYWIDAG Post-Tensioning Systems. Product brochure, Dywidag-Systems Intl. USA inc., 320 Marmon Drive, Bolingbrook, USA. Also available 200801 on: http://www.dywidag-systems.com/uploads/media/DSI-USA_Bonded_Post_Tensioning_Systems_us.pdf
DSI (2006b): DYWIDAG Bonded Post-Tensioning Systems using Strands. Product brochure, Dywidag-Systems Intl. USA inc., 320 Marmon Drive, Bolingbrook, USA. Also available 200801 on: http://www.dywidag-systems.com/uploads/media/DSI-DYWIDAG_Bonded_PT_Systems_using_Strands_en.pdf
DSI (2007): DYWIDAG Prestressing Steel Threadbar System. Product brochure, Dywidag-Systems Intl. Ltd., Northfield Road, Southam, Warwickshire, UK. Also available 200801 on: http://www.dywidag-systems.com/uploads/media/DSI-UK_Prestressing_Steel_Threadbar_System_uk.pdf
Elfgren, L. & Vikström, L. (1999): Formelsamling för Väg och Vattenbyggare. Book of equations for civil engineering students at LTU, LTU, Luleå, Sweden
El-Hacha, R., Wight, G. & Green, M. F. (1999): Anchors for prestressing FRP sheets, Proceedings, Annual Conference - Canadian Society for Civil Engineering 1, 235–244

Mechanical Anchorage of Prestressed CFRP Tendons
240
El-Hacha, R., Wight, R. G. & Green, M. F. (2003): Innovative system for prestressing fiber-reinforced polymer sheets, ACI Structural Journal - American Concrete Institute 100(3), 305
Elrefai, A., West, J. S. & Soudki, K. (2007): Performance of CFRP tendon-anchor assembly under fatigue loading, Composite Structures 80(3), 352–360
EMHUUD (2005): Egyptian Code for the Use of Fiber Reinforced Polymers (FRP) in the Construction Field, Egyptian Housing and Building National Research Center, Giza, Egypt
Enochsson, O., Nordin, H., Täljsten, B., Carolin, A., Kerrouche, A., Norling, O., Falldén, C., 2007, “Field test – Strengthening of the Örnsköldsviks Bridge with near surface mounted CFRP rods”, deliverable D6.3 within Sustainable Bridges, 55 p
FIP (1993): Recommendations for the acceptance of post-tensioning systems. SETO Ltd, London, UK
Freyssinet, Eugene (1936): A Revolution in the Technique of the Utilisation of Concrete. The Structural Engineer, 14, 242-262, May 1936
Freyssinet Group (2008a): The FREYSSIBAR prestressing system. Product brochure, freyssinet, 1 bis, rue du Petit-Clamart, 78148 Vélizy Cedex, France. Also available 200801 on: http://www.freyssinet.co.uk/getpdf.php?id=65
Freyssinet Group (2008b): The C Range Post-tensioning System. Product brochure, freyssinet, 1 bis, rue du Petit-Clamart, 781 40 Vélizy Villacoublay, France. Also available 200801 on: http://www.freyssinet.co.uk/getpdf.php?id=20
Hamoush, S. A. & Ahmad, S. H. (1990): Debonding of Steel-Plate Strengthened Concrete Beams, Journal of Structural Engineering 116(2), Feb. 1990 356-371
Harries, K. A., Porter, M. L. & Busel, J. P. (2003): FRP Materials and Concrete-Research Needs, Concrete International, Oct 2003, 69-74
HBM (2008): Measuring Amplifier System MGCplus, Hottinger Baldwin Messtechnik GmbH, Darmstadt, Germany. Also available 200804 on: http://www.hbm.com/index.php?id=596&file=1A17281B0&no_cache=1&uid=3118
Hejll, A. (2007): Civil structural health monitoring: strategies, methods and applications, Doctoral thesis, Luleå University of Technology; 2007:10, Luleå
Helmerich, R. & Wiggenhauser, H. (2008): Non-Destructive Testing of Concrete Structures, To be published in proceedings of The 4th International Conference on Advances in Mechanical Engineering and Mechanics, 16-18 December, 2008, Sousse, Tunisia
Henkel (2008): Loctite precision, Tekniskt datablad, Rev 1, Henkel Norden AB, Stockholm. Published 20080325
Hurst, M. K. (1998): Prestressed Concrete Design, Second edition. E & FN Spon, an imprint of Routledge 11 New Fetter Lane, London EC4P 4EE, UK
Instron (1987): Instron 8500 Series Digital Servohydraulic Testing Instruments, Technical Description, Instron, High Wycombe Bucks, UK, 1987

References
241
ISE (1999): Interim Guidance on the Design of Reinforced Concrete Structures Using Fiber Composite Reinforcement, Institution of Structural Engineers, Reference No. 319, London
Javadi, M. & Tajdari, M. (2006): Experimental investigation of the friction coefficient between aluminium and steel. Materials Science - Poland, 24(2/1), 305-310
Jing, Z., Tangning, L., Shijian, X. & Mi, Z. (2007): An innovative external prestressing method with carbon fiber sheet anchored to structures, Tumu Gongcheng Xuebao/ China Civil Engineering Journal 40(1), 15–19+41
Kerrouche, A., Leighton, J., Boyle, W. J. O., Gebremichael, Y., Sun, T., Grattan, K. T. V. & Täljsten, B. (2008a): Strain measurements on a rail bridge loaded to failure using a Fibre Bragg Grating-based distributed sensor System, accepted for publication in IEEE Sensors Journal on 24th of May 2008
Kerrouche, A., Boyle, W. J. O., Gebremichael, Y., Sun, T., Grattan, K. T. V., Täljsten, B. & Bennitz, A. (2008b): Field tests of Fibre Bragg Grating sensors incorporated into CFRP for Railway Bridge strengthening condition monitoring. Accepted for publication in Sensors & Actuators: A. Physical on the 19th of July 2008
Kerstens, J. G. M., Bennenk, W. & Camp, J. W. (1998): Prestressing with Carbon Composite Rods: A Numerical Method for Developing Reusable Prestressing Systems, ACI Structural Journal, Jan-Feb 1998, 43-50
Koller, R., Chang, S. & Xi, Y. (2007): Fiber-reinforced Polymer Bars Under Freeze-Thaw Cycles and Different Loading Rates, Journal of Composite Materials 41(1), 5-25
Ladner, M. & Flueler, P. (1974): Versuche an Stahlbetonbauteilen mit geklebter Armierung, Schweizerische Bauzeitung, Heft 19, May 1974, 9-16
Lees, J. M., Gruffydd-Jones, B. & Burgoyne, C. J. (1995): Expansive cement couplers - A means of pre-tensioning fibre-reinforced plastic tendons, Construction and Building Materials 9(6), 413-423
Leonhardt, E. h. F. (1973): Spannbeton für die Praxis, Dritte, berichtigte Auflage. Verlag von Wilhelm Ernst & Sohn, Berlin, Germany, 1973
Lin, T’ung-yen & Burns, Ned H. (1982): Design of Prestressed Concrete Structures, SI version. John Wiley & Sons, New York, USA
Lundh, Hans (2000): Grundläggande hållfasthetslära. Kungliga Tekniska Högskolan, Stockholm, Sverige
Maierhofer, C., Zacher, G., Kohl, C. & Wöstmann, J. (2008): Evaluation of Radar and Complementary Echo Methods for NDT of Concrete Elements. Journal of Nondestructive Evaluation 27, 47-57
Man, K. W. (1994): Contact Mechanics using Boundary Elements. Topics in Engineering Vol. 22, Computational Mechanics Publications, Southampton, UK
Maravegias, S. & Triantafillou, T. (1996): Numerical study of anchors for composite prestressing straps, Composite Structures 35(3), 323–330

Mechanical Anchorage of Prestressed CFRP Tendons
242
Marceau, D., Fafard, M. & Bastien, J. (2003): Constitutive law for wedge-tendon gripping interface in anchorage device - numerical modeling and parameters identification, Structural Engineering and Mechanics, 15(6), 609-628
Matta, F., Nanni, A., Abdelrazaq, A., Gremel, D. & Koch, R. (2007): Externally post-tensioned carbon FRP bar system for deflection control, Construction and Building Materials, doi:10.1016/j.conbuildmat.2007.08.002
Meier, U. & Farshad, M. (1996): Connecting high-performance carbon-fiber-reinforced polymer cables of suspension and cable-stayed bridges through the use of gradient materials, Journal of Computer-Aided Materials Design, 3, 379-384
Miyagawa, H., Mase, T., Sato, C., Drown, E., Drzal, L.T. & Ikegami, K. (2006): Comparison of experimental and theoretical transverse elastic modulus of carbon fibers. Carbon 44, 2002-2008
Miyano, Y., Nakada, M. & Sekine, N. (2005): Accelerated Testing for Long-term Durability of FRP Laminates for Marine Use, Journal of Composite Materials 39(1), 5-20
Myers, T. J., Kytömaa, H.K. & Smith, T.R. (2007): Environmental stress-corrosion cracking of fiberglass: Lessons learned from failures in the chemical industry. Journal of Hazardous Materials 142(2007), 695-704
Nanni, A., Bakis, C. E., O’Neil, E. F. & Dixon, T. O. (1996a): Performance of FRP tendon-anchor systems for prestressed concrete structure s, PCI Journal 41(1), 34-44
Nanni, A., Bakis, C. E., O’Neil, E. F. & Dixon, T. O. (1996b): Short-term sustained loading of FRP tendon-anchor systems, Construction and Building Materials 10(4), 255-266
Nawy, E. G. (2000): Prestressed Concrete; a Fundamental Approach, Third edition. Prentice Hall, Upper Saddle River, New Jersey 07458, USA
Nordin, H. (2003): Fibre reinforced polymers in civil engineering: flexural strengthening of concrete structures with prestressed near surface mounted CFRP rods. Licentiate thesis 2003:25, Dept. of Structural Engineering, Luleå University of Technology, Luleå 2003
Novotechnik (2007): TR, TRS Series, Data Sheet, NovotechnikU.S., Inc, February 2007. Also available 200809 on: http://www.novotechnik.com/products/linear/linear_potentiometric .html
Ovako (2006): Wire rod for a broad scope of applications. Product brochure, Upplands Väsby, Sweden 2006. Also available 200712 on: http://www.ovako.com/Data/r3187/v1/Wire_Rod_from_Ovako_0605_eng.pdf
Picard, A.; Massicotte, B. & Bastien, J. (1995): Relative Efficiency of External Prestressing. Journal of Structural Engineering, Vol 121, No. 12, December, 1995
Pilkey, W. D. (1994): Formulas for stress, strain, and structural matrices. John Wiley & Sons, Inc, 605 Third Avenue, New York 10158-0012, USA
Pincheira, J. A. & Woyak, J. P. (2001): Anchorage of Carbon Fiber Reinforced Polymer (CFRP) Tendons Using Cold-Swaged Sleeves, PCI Journal 46(6), 100-111

References
243
PTI (2006), (1997), (1985): Post-tensioning manual, 6:th, 5:th and 4:th editions, Phoenix, Arizona, Post-Tensioning Institute
Råde, L. & Westergren, B. (2004): BETA - Mathematics Handbook for Science and Engineering. Studentlitteratur, Lund, Sweden, 2004
Reda Taha, M. M. & Shrive, N. G. (2003a): New concrete anchors for carbon fiber reinforced polymer post-tensioning tendons – part 1: State-of-the-art review/design, ACI Structural Journal - American Concrete Institute 100(1), 86-95
Reda Taha, M. M. & Shrive, N. G. (2003b): New concrete anchors for carbon fiber reinforced polymer post-tensioning tendons – part 2: Development/experimental investigation, ACI Structural Journal - American Concrete Institute 100(1), 96-104
Reda Taha, M. M. & Shrive, N. G. (2003c): UHPC Anchors for Post-Tensioning, Concrete International, Aug 2003
Roark, R. J. & Young, W. C. (1975): Formulas for Stress and Strain, Fifth Ed. McGraw-Hill Book Company, New York, US, 1975
Roberts, T. (2006): The Carbon Fibre Industry: Global Strategic Market Evaluation 2006-2010. Market report, Materials Technology Publications, Nov 2006. ISBN 1871677513
Rosen, B.W. & Hashin, Z. (1987): Engineered Materials Handbook - Vol. 1. Composites, ASM International, Metals Park, OH, 185-205
Rostasy, F. S. & Budelmann, H. (1993): Principles of design of FRP tendons and anchorages for post-tensioned concrete, Fibre-Reinforced-Plastic Reinforcement for Concrete Structures - International Symposium, SP-138 ACI, 633-649
Rostasy, F. S. (1998): Draft guidelines for the acceptance testing of FRP posttensioning tendons, Journal of Composites for Construction 2(1), 2-6
Sayed-Ahmed, E.Y. & Shrive, N.G. (1998): A new steel anchorage system for post-tensioning applications using carbon fibre reinforced plastic tendons. Canadian Journal of Civil Engineering, 25, 113-127
Sayed-Ahmed, E. Y. (2002): Single and multi-strand steel anchorage systems for CFRP tendons/stays, 4:th Structural Speciality Conference, CSCE, 5-8 june 2002
Schmidt, J. W. & Hansen, C. S. (2006): Strengthening of Old Metallic Structures With FRP Materials. Master Thesis, Technical University of Denmark, Kgs. Lyngby, Denmark
Schön, J. (2004a): Coefficient of friction for aluminium in contact with a carbon fiber epoxy composite, Tribology International 37, 395-404
Schön, J. (2004b): Coefficient of friction and wear of a carbon fiber epoxy matrix composite, Wear 257, 395-407
Schupack, M. (2001): Prestressing Reinforcement in the New Millenium, Concrete International, Dec 2001, 38-45
Shaheen, E. & Shrive, N. G. (2006): Reactive Powder Concrete Anchorage for Post-Tensioning with Carbon Fiber-Reinforced Polymer Tendons. ACI Materials Journal, Nov-Dec, 2006, 436-443

Mechanical Anchorage of Prestressed CFRP Tendons
244
Sonobe, Y., Fukuyama, H., Okamoto, T., Kani, N., Kimura, K., Kobayashi, K., Masuda, Y., Matsuzaki, Y., Mochizuki, S., Nagasaka, T., Shimizu, A., Tanano, H., Tanigaki, M. & Teshigawara, M. (1997): Design Guidelines of FRP Reinforced Concrete Building Structures. Journal of Composites for Construction, August, 1997
Soudki, K., Plumtree, A. & El-Mayeh, A. (1999): Behaviour of CFRP anchorages under load. Research , Department of Civil Engineering, University of Waterloo, Waterloo, USA
STO (2005): StoFRP Plate - Förstärkningssystem med kolfiberlaminat, Tekniskt faktablad, Utgåva 2005/05.1, Sto Scandinavia AB, Sweden 2005
Swamy, R. N. & Jones, R. (1980): Technical Notes - Behaviour of plated reinforced concrete beams subjected to cyclic loading during glue hardening, The International Journal of Cement Composites, Vol.2(4), Nov 1980, 233-234
Svensk Byggtjänst (1990): Betonghandboken Konstruktion, utgåva 2. Ljungbergföretagen, Örebro 1990
Svensk Byggtjänst (1997): Betonghandboken Material, utgåva 2. Svenskt Tryck AB, Stockholm 1997
Täljsten, B. (2002): FRP Strengthening of Existing Concrete Structures. Design Guideline, 1:st edition, Luleå University printing office, Luleå, 2002
Täljsten, B. (2003): Strengthening concrete beams for shear with CFRP sheets, Construction and Building Materials 17, 2003, 15-26
Täljsten, B. (2006): FRP Strengthening of Existing Concrete Structures. Design Guideline, 4:th edition, Luleå University printing office, Luleå, 2006. ISBN 91-89580-03-6
Teng, J. G., Chen, J. F., Smith, S. T. & Lam, L. (2003): Behaviour and strength of FRP-strengthened RC structures: a state-of-the-art review, Structures & Buildings 156(1), February 2003, 51-62
Triantafillou, T. C. & Fardis, M. N. (1997): Strengthening of historic masonry structures with composite materials, Materials and Structures 30, 486-496
Tsai, S.W. & Hahn, H.T. (1980): Introduction to Composite Materials, Technomic Publishers, Lancaster, PA, Chap. 9
Tyréns (2005): Bärighetsutredning av Vägport vid Frövibro Hpl på bandelen Frövi - Hallsberg, km 248+353, resultatsammanställning. Tyréns AB, John Leander
Van Gemert, D. & Van den Bosch, M. (1983): Renovation of of reinforced concrete structures by epoxy bonded steel plates, Proceedings of International Kolloqium, Werkstoffwissenchaften und Bausanierung, Esslingen 6-8 Sept, 1983, 237-243
Vännman, K. (2002): Matematisk statistik, Förlaget “studentliteratur”, 2002
Vishay (2003): Precision Strain Gauges - Vishay Micro-Measurements, Product Catalog 2003 Available 200809 on http://www.intertechnology.com/Vishay/Vishay_Catalog_500_CD .html

References
245
Voestalpine (2007): Prestressing steel. Product brochure, voestalpine Austria Draht GmbH, Bahnhofstraße 2, A-8600 Bruck a. d. Mur, Austria. Also available 200712 on: www.voestalpine.com/austriadraht
VSL (2006): VSL Construction Systems. Product brochure, Scheibenstrasse 70, Bern, Switzerland. Also available 200801 on: http://www.vsl-intl.com/document.php?getfile=16
VSL (2008): Appendix Technical Data & Dimensions. Product brochure, Scheibenstrasse 70, Bern, Switzerland. Also available 200801 on: http://www.vsl.net/Portals/0/vsl_data-sheets/VSL_Datasheets_US.pdf
Wang, C. T. (1953): Applied elasticity. McGraw-Hill Book Company, New York, USA
Wight, R. G., Green, M. F. & Erki, M-A. (2001): Prestressed FRP Sheets for Post-strengthening Reinforced Concrete Beams, Journal of Composites for Construction, Nov. 2001, 215-220
Zenkert, D. (1995): An Introduction to Sandwich Construction, EMAS Publishing, Cradley Heath, Warley, West Midlands, UK
Zhang, B., Benmokrane, B., Chennouf, A., Mukhopadhyaya, P. & El-Safty, A. (2001): Tensile Behavior of FRP Tendons for Prestressed Ground Anchors, Journal of Composites for Construction, May 2001, 85-93
Zhang, B., & Benmokrane, B. (2004): Design and evaluation of a new bond-type anchorage system for fiber reinforced polymer tendons, Canadian Journal of Civil Engineering 31: 14-26


Appendix A - Material Data
247
Appendix A - Material Data
This appendix contains data from tests done on the materials included in the wedge anchorage tested in Chapters 5 and 6. They are presented together with the calculations of mean value, standard deviation and lower fifth percentile.
CFRP Rod - Failure Strength
Force-Displacement curves for all five tested samples of the used type of CFRP rod are presented in Figure A.
0 5 10 15 20 250
20
40
60
80
100
120
140
160Force−displacement relationship
Displacement [mm]
For
ce [k
N]
Test 1: Fmax
= 147 kN
Test 2: Fmax
= 142 kN
Test 3: Fmax
= 140 kN
Test 4: Fmax
= 146 kN
Test 5: Fmax
= 151 kN
Figure A Force-Displacement diagram for the five dead end anchorage tests based upon data from the test machine
After division of the ultimate tensile forces with the rods area, 50.26 mm2, the resulting stresses, see Table A, are evaluated based upon an assumption of a normal distribution among the values.

Mechanical Anchorage of Prestressed CFRP Tendons
248
Table A Ultimate failure stresses for the five rods that were tested
1 2 3 4 5 Ultimate failure stress [MPa] 2925 2825 2786 2905 3004
To begin with the mean value of the ultimate stresses is calculated:
, ,1
1 2891 MPan
u mean u iin
(A.1)
where n is the number of samples.
This is then used to calculate the sample standard deviation:
2, . . , ,
1
1 81 MPa1
n
u std dev u i u meanin
(A.2)
With the mean value u,mean = 2891 MPa and standard deviation 81 MPa the probability density function looks as in Figure B.
2650 2700 2750 2800 2850 2900 2950 3000 3050 31000
1
2
3
4
5x 10
−3 Normal distribution
Stress, σult
[MPa]
Nor
mal
σult
, μ = 2891 MPa
Stand.div = 81 MPa
Figure B Probability density plot of the assumed normally distributed ultimate stresses of the five tested rods
Further the assumption of a normal distribution can be used to calculate the fifth percentile. That is the ultimate strength that 5% of all rods within the same population as the tested will fail below. The value is important because it is used in many design codes as the value a designer can use for the material in the designing process. From basic textbooks in statistics, for example Vännman (2002), it can be calculated as:
,5 , , . . 1.6449 2758 MPau th u mean u std dev (A.3)
where 1.9449 comes from a table of values based on a numerical solution of the cumulative distribution function.

Appendix A - Material Data
249
CFRP Rod - Elastic Modulus
Elastic modules are calculated with data from the electrical strain gauge applied at the centre of the tested rod and the force applied by the test machine. A stress-strain diagram, collecting all five tests, where the stresses are calculated by division of the applied forces with the rods cross sectional area, 50.26 mm2, can be seen in Figure C. After a look on these curves the stress applied in the rod at a 1.6% strain was chosen for the calculation of the overall elastic modules. This resulted in modules ranging from 155 to 162 GPa. With help from Eq. (A.1) to Eq. (A.3) also the mean values, standard deviation and fifth percentile of the E - modules can be calculated. Emean = 158.4 GPa, Estd.dev. = 2.5 GPa and E5th = 154.3 GPa.
0 4000 8000 12000 16000 200000
500
1000
1500
2000
2500
3000
Stress−strain relationship
μs [ ]
Str
ess
[MP
a]
Test 1: E1 = 159 GPa
Test 2: E2 = 155 GPa
Test 3: E3 = 158 GPa
Test 4: E4 = 162 GPa
Test 5: E5 = 158 GPa
Figure C Stress-Strain diagram for the five dead end anchorage tests based upon data from the test machine and the strain gauge attached to the rod halfway between the anchorages

Mechanical Anchorage of Prestressed CFRP Tendons
250
Metallic Materials
Below are only measurements of stresses and ultimate strains shown. Measurements on the elastic modulus were however also performed. These gave average values of 170 GPa for the steel and 60 GPa for the aluminium. Both these values are way apart from the expected values of 205 and 70 GPa and are therefore assumed to not be trustworthy. One suspicion is that the 50 mm gauge used for the strain measurement of the sample has been calibrated wrong. That could unfortunately not be controlled once the remarkable results had been found, but the fact that it in both cases differs around 15% from the expected values strengthen that theory. If the suspicion is true also the found values on ultimate strain must be lowered with 15%.
SteelStress strain curves for all five of the steel samples are presented in Figure D together with the ultimate stresses achieved for each sample. The mean value of the ultimate stress, u,mean, is 512 MPa. For the yield stress the mean value, y,mean, is 463 MPa and for ultimate strain the mean value, u,mean, is 20.1 %. Standard deviations in accordance with Eq. (A.2) are, u,std.dev. = 16.3 MPa and y,std.dev. = 15.9 MPa.
0 50e3 100e3 150e3 200e3 250e30
100
200
300
400
500
600
μs, εs [ ]
Str
ess,
σ s [MP
a]
Test 1 σu = 514 MPa
Test 2 σu = 528 MPa
Test 3 σu = 528 MPa
Test 4 σu = 497 MPa
Test 5 σu = 494 MPa
Figure D Stress-Strain curves for the five steel samples tested together with ultimate stresses achieved

Appendix A - Material Data
251
AluminiumAmong these five tests the first had to be interrupted half way and it has therefore been discarded. Figure E does due to that only include four stress-strain curves for the aluminium samples tested. The scaling of these curves are the same as in Figure D to facilitate comparison. The mean value of the ultimate stress, u,mean, is 372 MPa. For the yield stress the mean value, y,mean, is 358 MPa and for ultimate strain the mean value,
u,mean, is 11.0%. Standard deviations in accordance with Eq. (A.2) are, u,std.dev. = 2.2 MPa and y,std.dev. = 3.1 MPa.
0 50e3 100e3 150e3 200e3 250e30
100
200
300
400
500
600
μs, εa [ ]
Str
ess,
σ a [MP
a]
Test 2 σu = 374 MPa
Test 3 σu = 373 MPa
Test 4 σu = 372 MPa
Test 5 σu = 369 MPa
Figure E Stress-Strain curves for four of the four tested samples of aluminium together with ultimate stresses achieved


Appendix B - Wedge Anchorage Test Results
253
Appendix B - Wedge Anchorage Test Results
Appendix B presents all measurements from the laboratory tests performed on the five wedge anchorages with the final design. The data is resettled at a zero value in the beginning of each load step and it is presented both anchorage by anchorage to see how the strain varies within the anchorage and sensor by sensor to see how the values varies between the different anchorage samples. In the sensor by sensor plots a mean value is included for the longitudinal measurements and a weighted mean for the circumferential measurements.
Each of the sections in this appendix covers one type of data. The sections are presented in this order:
Anchorage by anchorage
o Circumferential strains
Presetting
Tensile loading
o Longitudinal strains
Presetting
Tensile loading
Sensor by sensor
o Circumferential strains
Presetting
Tensile loading
o Longitudinal strains
Presetting
Tensile loading
o Displacements and strain on rod during tensile loading

Mechanical Anchorage of Prestressed CFRP Tendons
254
Circumferential Strains During Presetting Presented Anchorage by Anchorage
−1000 −500 0 500 1000 1500 2000 2500 3000 35000
10
20
30
40
50
60
70
80
μs [−]
Pre
setti
ng fo
rce
[kN
]
Circumferential strains during presetting of Anchorage 1
Sensor 1Sensor 2Sensor 3Sensor 4Sensor 5Sensor 6
−1000 −500 0 500 1000 1500 2000 2500 3000 35000
10
20
30
40
50
60
70
80
μs [−]
Pre
setti
ng fo
rce
[kN
]
Circumferential strains during presetting of Anchorage 2
Sensor 2Sensor 3Sensor 4Sensor 5Sensor 6

Appendix B - Wedge Anchorage Test Results
255
−1000 −500 0 500 1000 1500 2000 2500 3000 35000
10
20
30
40
50
60
70
80
μs [−]
Pre
setti
ng fo
rce
[kN
]
Circumferential strains during presetting of Anchorage 3
Sensor 2Sensor 3Sensor 4Sensor 5Sensor 6
−1000 −500 0 500 1000 1500 2000 2500 3000 35000
10
20
30
40
50
60
70
80
μs [−]
Pre
setti
ng fo
rce
[kN
]
Circumferential strains during presetting of Anchorage 4
Sensor 1Sensor 2Sensor 3Sensor 4Sensor 5Sensor 6
−1000 −500 0 500 1000 1500 2000 2500 3000 35000
10
20
30
40
50
60
70
80
μs [−]
Pre
setti
ng fo
rce
[kN
]
Circumferential strains during presetting of Anchorage 5
Sensor 1Sensor 2Sensor 3Sensor 4Sensor 5Sensor 6

Mechanical Anchorage of Prestressed CFRP Tendons
256
Circumferential Strains During Tensile Loading Presented Anchorage by Anchorage
−1000 −500 0 500 1000 1500 2000 2500 3000 35000
50
100
150
μs [−]
Ten
sile
forc
e [k
N]
Circumferential strains during tensile loading of Anchorage 1
Sensor 1Sensor 2Sensor 3Sensor 4Sensor 5Sensor 6
−1000 −500 0 500 1000 1500 2000 2500 3000 35000
50
100
150
μs [−]
Ten
sile
forc
e [k
N]
Circumferential strains during tensile loading of Anchorage 2
Sensor 1Sensor 2Sensor 3Sensor 4Sensor 5Sensor 6

Appendix B - Wedge Anchorage Test Results
257
−1000 −500 0 500 1000 1500 2000 2500 3000 35000
50
100
150
μs [−]
Ten
sile
forc
e [k
N]
Circumferential strains during tensile loading of Anchorage 3
Sensor 1Sensor 2Sensor 3Sensor 4Sensor 5Sensor 6
−1000 −500 0 500 1000 1500 2000 2500 3000 35000
50
100
150
μs [−]
Ten
sile
forc
e [k
N]
Circumferential strains during tensile loading of Anchorage 4
Sensor 1Sensor 2Sensor 3Sensor 4Sensor 5Sensor 6
−1000 −500 0 500 1000 1500 2000 2500 3000 35000
50
100
150
μs [−]
Ten
sile
forc
e [k
N]
Circumferential strains during tensile loading of Anchorage 5
Sensor 1Sensor 2Sensor 3Sensor 4Sensor 5Sensor 6

Mechanical Anchorage of Prestressed CFRP Tendons
258
Longitudinal Strains During Presetting Presented Anchorage by Anchorage
−2000 −1500 −1000 −500 0 500 1000 1500 20000
10
20
30
40
50
60
70
80
μs [−]
Pre
setti
ng fo
rce
[kN
]
Longitudinal strains during presetting of Anchorage 1
Sensor 1Sensor 2Sensor 3Sensor 4Sensor 5Sensor 6
−2000 −1500 −1000 −500 0 500 1000 1500 20000
10
20
30
40
50
60
70
80
μs [−]
Pre
setti
ng fo
rce
[kN
]
Longitudinal strains during presetting of Anchorage 2
Sensor 1Sensor 2Sensor 3Sensor 4Sensor 5Sensor 6

Appendix B - Wedge Anchorage Test Results
259
−2000 −1500 −1000 −500 0 500 1000 1500 20000
10
20
30
40
50
60
70
80
μs [−]
Pre
setti
ng fo
rce
[kN
]
Longitudinal strains during presetting of Anchorage 3
Sensor 1Sensor 2Sensor 3
Sensor 6
−2000 −1500 −1000 −500 0 500 1000 1500 20000
10
20
30
40
50
60
70
80
μs [−]
Pre
setti
ng fo
rce
[kN
]
Longitudinal strains during presetting of Anchorage 4
Sensor 1Sensor 2Sensor 3Sensor 4Sensor 5Sensor 6
−2000 −1500 −1000 −500 0 500 1000 1500 20000
10
20
30
40
50
60
70
80
μs [−]
Pre
setti
ng fo
rce
[kN
]
Longitudinal strains during presetting of Anchorage 5
Sensor 1
Sensor 3Sensor 4Sensor 5Sensor 6

Mechanical Anchorage of Prestressed CFRP Tendons
260
Longitudinal Strains During Tensile Loading Presented Anchorage by Anchorage
−2000 −1500 −1000 −500 0 500 1000 1500 20000
50
100
150
μs [−]
Ten
sile
forc
e [k
N]
Longitudinal strains during tensile loading of Anchorage 1
Sensor 1Sensor 2Sensor 3Sensor 4Sensor 5Sensor 6
−2000 −1500 −1000 −500 0 500 1000 1500 20000
50
100
150
μs [−]
Ten
sile
forc
e [k
N]
Longitudinal strains during tensile loading of Anchorage 2
Sensor 1Sensor 2Sensor 3Sensor 4Sensor 5Sensor 6

Appendix B - Wedge Anchorage Test Results
261
−2000 −1500 −1000 −500 0 500 1000 1500 20000
50
100
150
μs [−]
Ten
sile
forc
e [k
N]
Longitudinal strains during tensile loading of Anchorage 3
Sensor 1Sensor 2Sensor 3
Sensor 6
−2000 −1500 −1000 −500 0 500 1000 1500 20000
50
100
150
μs [−]
Ten
sile
forc
e [k
N]
Longitudinal strains during tensile loading of Anchorage 4
Sensor 1Sensor 2Sensor 3Sensor 4Sensor 5Sensor 6
−2000 −1500 −1000 −500 0 500 1000 1500 20000
50
100
150
μs [−]
Ten
sile
forc
e [k
N]
Longitudinal strains during tensile loading of Anchorage 5
Sensor 1
Sensor 3Sensor 4Sensor 5Sensor 6

Mechanical Anchorage of Prestressed CFRP Tendons
262
Circumferential Strains During Presetting Presented Sensor by Sensor
−1000 −500 0 500 1000 1500 2000 2500 3000 35000
10
20
30
40
50
60
70
80
μs [−]
Pre
setti
ng fo
rce
[kN
]
Circumferential strains in sensor 1 during presetting
Anchorage 1
Anchorage 4Anchorage 5
−1000 −500 0 500 1000 1500 2000 2500 3000 35000
10
20
30
40
50
60
70
80
μs [−]
Pre
setti
ng fo
rce
[kN
]
Circumferential strains in sensor 2 during presetting
Anchorage 1Anchorage 2Anchorage 3Anchorage 4Anchorage 5Weighted mean
−1000 −500 0 500 1000 1500 2000 2500 3000 35000
10
20
30
40
50
60
70
80
μs [−]
Pre
setti
ng fo
rce
[kN
]
Circumferential strains in sensor 3 during presetting
Anchorage 1Anchorage 2Anchorage 3Anchorage 4Anchorage 5Weighted mean

Appendix B - Wedge Anchorage Test Results
263
−1000 −500 0 500 1000 1500 2000 2500 3000 35000
10
20
30
40
50
60
70
80
μs [−]
Pre
setti
ng fo
rce
[kN
]
Circumferential strains in sensor 4 during presetting
Anchorage 1Anchorage 2Anchorage 3Anchorage 4Anchorage 5Weighted mean
−1000 −500 0 500 1000 1500 2000 2500 3000 35000
10
20
30
40
50
60
70
80
μs [−]
Pre
setti
ng fo
rce
[kN
]
Circumferential strains in sensor 5 during presetting
Anchorage 1Anchorage 2Anchorage 3Anchorage 4Anchorage 5Weighted mean
−1000 −500 0 500 1000 1500 2000 2500 3000 35000
10
20
30
40
50
60
70
80
μs [−]
Pre
setti
ng fo
rce
[kN
]
Circumferential strains in sensor 6 during presetting
Anchorage 1Anchorage 2Anchorage 3Anchorage 4Anchorage 5Weighted mean

Mechanical Anchorage of Prestressed CFRP Tendons
264
Circumferential Strains During Tensile Loading Presented Sensor by Sensor
−1000 −500 0 500 1000 1500 2000 2500 3000 35000
50
100
150
μs [−]
Ten
sile
forc
e [k
N]
Circumferential strains in sensor 1 during tensile loading
Anchorage 1Anchorage 2Anchorage 3Anchorage 4Anchorage 5Weighted mean
−1000 −500 0 500 1000 1500 2000 2500 3000 35000
50
100
150
μs [−]
Ten
sile
forc
e [k
N]
Circumferential strains in sensor 2 during tensile loading
Anchorage 1Anchorage 2Anchorage 3Anchorage 4Anchorage 5Weighted mean
−1000 −500 0 500 1000 1500 2000 2500 3000 35000
50
100
150
μs [−]
Ten
sile
forc
e [k
N]
Circumferential strains in sensor 3 during tensile loading
Anchorage 1Anchorage 2Anchorage 3Anchorage 4Anchorage 5Weighted mean

Appendix B - Wedge Anchorage Test Results
265
−1000 −500 0 500 1000 1500 2000 2500 3000 35000
50
100
150
μs [−]
Ten
sile
forc
e [k
N]
Circumferential strains in sensor 4 during tensile loading
Anchorage 1Anchorage 2Anchorage 3Anchorage 4Anchorage 5Weighted mean
−1000 −500 0 500 1000 1500 2000 2500 3000 35000
50
100
150
μs [−]
Ten
sile
forc
e [k
N]
Circumferential strains in sensor 5 during tensile loading
Anchorage 1Anchorage 2Anchorage 3Anchorage 4Anchorage 5Weighted mean
−1000 −500 0 500 1000 1500 2000 2500 3000 35000
50
100
150
μs [−]
Ten
sile
forc
e [k
N]
Circumferential strains in sensor 6 during tensile loading
Anchorage 1Anchorage 2Anchorage 3Anchorage 4Anchorage 5Weighted mean

Mechanical Anchorage of Prestressed CFRP Tendons
266
Longitudinal Strains During Presetting Presented Sensor by Sensor
−2000 −1500 −1000 −500 0 500 1000 1500 20000
10
20
30
40
50
60
70
80
μs [−]
Pre
setti
ng fo
rce
[kN
]
Longitudinal strains in sensor 1 during presetting
Anchorage 1Anchorage 2Anchorage 3Anchorage 4Anchorage 5Mean
−2000 −1500 −1000 −500 0 500 1000 1500 20000
10
20
30
40
50
60
70
80
μs [−]
Pre
setti
ng fo
rce
[kN
]
Longitudinal strains in sensor 2 during presetting
Anchorage 1Anchorage 2Anchorage 3Anchorage 4
Mean
−2000 −1500 −1000 −500 0 500 1000 1500 20000
10
20
30
40
50
60
70
80
μs [−]
Pre
setti
ng fo
rce
[kN
]
Longitudinal strains in sensor 3 during presetting
Anchorage 1Anchorage 2Anchorage 3Anchorage 4Anchorage 5Mean

Appendix B - Wedge Anchorage Test Results
267
−2000 −1500 −1000 −500 0 500 1000 1500 20000
10
20
30
40
50
60
70
80
μs [−]
Pre
setti
ng fo
rce
[kN
]
Longitudinal strains in sensor 4 during presetting
Anchorage 1Anchorage 2
Anchorage 4Anchorage 5Mean
−2000 −1500 −1000 −500 0 500 1000 1500 20000
10
20
30
40
50
60
70
80
μs [−]
Pre
setti
ng fo
rce
[kN
]
Longitudinal strains in sensor 5 during presetting
Anchorage 1Anchorage 2
Anchorage 4Anchorage 5Mean
−2000 −1500 −1000 −500 0 500 1000 1500 20000
10
20
30
40
50
60
70
80
μs [−]
Pre
setti
ng fo
rce
[kN
]
Longitudinal strains in sensor 6 during presetting
Anchorage 1Anchorage 2Anchorage 3Anchorage 4Anchorage 5Mean

Mechanical Anchorage of Prestressed CFRP Tendons
268
Longitudinal Strains During Tensile Loading Presented Sensor by Sensor
−2000 −1500 −1000 −500 0 500 1000 1500 20000
50
100
150
μs [−]
Ten
sile
forc
e [k
N]
Longitudinal strains in sensor 1 during tensile loading
Anchorage 1Anchorage 2Anchorage 3Anchorage 4Anchorage 5Mean
−2000 −1500 −1000 −500 0 500 1000 1500 20000
50
100
150
μs [−]
Ten
sile
forc
e [k
N]
Longitudinal strains in sensor 2 during tensile loading
Anchorage 1Anchorage 2Anchorage 3Anchorage 4
Mean
−2000 −1500 −1000 −500 0 500 1000 1500 20000
50
100
150
μs [−]
Ten
sile
forc
e [k
N]
Longitudinal strains in sensor 3 during tensile loading
Anchorage 1Anchorage 2Anchorage 3Anchorage 4Anchorage 5Mean

Appendix B - Wedge Anchorage Test Results
269
−2000 −1500 −1000 −500 0 500 1000 1500 20000
50
100
150
μs [−]
Ten
sile
forc
e [k
N]
Longitudinal strains in sensor 4 during tensile loading
Anchorage 1Anchorage 2
Anchorage 4Anchorage 5Mean
−2000 −1500 −1000 −500 0 500 1000 1500 20000
50
100
150
μs [−]
Ten
sile
forc
e [k
N]
Longitudinal strains in sensor 5 during tensile loading
Anchorage 1Anchorage 2
Anchorage 4Anchorage 5
−2000 −1500 −1000 −500 0 500 1000 1500 20000
50
100
150
μs [−]
Ten
sile
forc
e [k
N]
Longitudinal strains in sensor 6 during tensile loading
Anchorage 1Anchorage 2Anchorage 3Anchorage 4Anchorage 5Mean

Mechanical Anchorage of Prestressed CFRP Tendons
270
Displacements and Strain on Rod During Tensile Loading
−20 −18 −16 −14 −12 −10 −8 −6 −4 −2 00
50
100
150
Displacement [mm]
Ten
sile
forc
e [k
N]
Displacement of steel angle close to dead end anchorage
Anchorage 1Anchorage 2Anchorage 3Anchorage 4Anchorage 5
0 2 4 6 8 10 12 14 16 18 200
50
100
150
Displacement [mm]
Ten
sile
forc
e [k
N]
Displacement of steel angle close to wedge anchorage
Anchorage 2Anchorage 3Anchorage 4Anchorage 5

Appendix B - Wedge Anchorage Test Results
271
−20 −18 −16 −14 −12 −10 −8 −6 −4 −2 00
50
100
150
Displacement [mm]
Ten
sile
forc
e [k
N]
Displacement of supporting plate at wedge anchorage
Anchorage 1Anchorage 2Anchorage 3Anchorage 4Anchorage 5
0 4000 8000 12000 16000 200000
50
100
150
μs [−]
Ten
sile
forc
e [k
N]
Strain at centre of rod
Anchorage 2Anchorage 3Anchorage 4Anchorage 5


Appendix C - Design Drawings of The Frövi Bridge
273
Appendix C - Design Drawings of The Frövi Bridge
Figure F Plan drawing of the Frövi Bridge

Mechanical Anchorage of Prestressed CFRP Tendons
274
Figure G Dimensioned drawing of the Frövi Bridge
Figure H Dimensioned drawing of the Frövi Bridge

Appendix C - Design Drawings of The Frövi Bridge
275
Figure I Reinforcement drawing of the edge beam and centre beam respectively
Figure J Reinforcement drawing of the edge beam and centre beam respectively
Figure K Reinforcement drawing of the slabs


Appendix D - CFRP Distribution on the Frövi Bridge
277
Appendix D - CFRP Distribution on the Frövi Bridge
Figure L Final longitudinal distribution of NSMR (upper) and CFRP tubes (lower) on the Frövi Bridge


Appendix E - Frövi Results
279
Appendix E - Frövi Results
010
0020
0030
0040
0050
0060
0070
0080
0090
00-0
.8
-0.7
-0.6
-0.5
-0.4
-0.3
-0.2
-0.10
Def
lect
ions
of p
late
for "
Reg
ina"
on
sout
hern
trac
k
[mm
]
[mm]
Bef
ore
stre
ngth
enin
g =
blue
Afte
r stre
ngth
enin
g =
red
010
0020
0030
0040
0050
0060
0070
0080
0090
00-0
.8
-0.7
-0.6
-0.5
-0.4
-0.3
-0.2
-0.10
Def
lect
ions
of p
late
for F
reig
ht tr
ain
on s
outh
ern
track
[mm
]
[mm]
Bef
ore
stre
ngth
enin
g =
blue
Afte
r stre
ngth
enin
g =
red
010
0020
0030
0040
0050
0060
0070
0080
0090
00-0
.8
-0.7
-0.6
-0.5
-0.4
-0.3
-0.2
-0.10
Def
lect
ions
of p
late
for "
Reg
ina"
on
north
ern
track
[mm
]
[mm]
Bef
ore
stre
ngth
enin
g =
blue
Afte
r stre
ngth
enin
g =
red
010
0020
0030
0040
0050
0060
0070
0080
0090
00-0
.8
-0.7
-0.6
-0.5
-0.4
-0.3
-0.2
-0.10
Def
lect
ions
of p
late
for F
reig
ht tr
ain
on n
orth
ern
track
[mm
]
[mm]
Bef
ore
stre
ngth
enin
g =
blue
Afte
r stre
ngth
enin
g =
red
Def
lect
ion
of th
e sl
ab’s
low
er p
art i
n a
line
perp
endi
cula
r to
trac
k di
rect
ion.
Ea
ch li
ne re
pres
ents
one
trai
n an
d ea
ch c
ircle
one
LV
DT.
Dis
tanc
e is
mea
sure
d fr
om th
e br
idge
’s
sout
hern
edg
e be
am.

Mechanical Anchorage of Prestressed CFRP Tendons
280
010
0020
0030
0040
0050
0060
0070
0080
0090
00-0
.8
-0.7
-0.6
-0.5
-0.4
-0.3
-0.2
-0.10
Ave
rage
def
lect
ions
of p
late
for "
Reg
ina"
on
sout
hern
trac
k
[mm
]
[mm]
Bef
ore
stre
ngth
enin
g =
blue
Afte
r stre
ngth
enin
g =
red
010
0020
0030
0040
0050
0060
0070
0080
0090
00-0
.8
-0.7
-0.6
-0.5
-0.4
-0.3
-0.2
-0.10
Ave
rage
def
lect
ions
of p
late
for F
reig
ht tr
ain
on s
outh
ern
track
[mm
]
[mm]
Bef
ore
stre
ngth
enin
g =
blue
Afte
r stre
ngth
enin
g =
red
010
0020
0030
0040
0050
0060
0070
0080
0090
00-0
.8
-0.7
-0.6
-0.5
-0.4
-0.3
-0.2
-0.10
Ave
rage
def
lect
ions
of p
late
for "
Reg
ina"
on
north
ern
track
[mm
]
[mm]
Bef
ore
stre
ngth
enin
g =
blue
Afte
r stre
ngth
enin
g =
red
010
0020
0030
0040
0050
0060
0070
0080
0090
00-0
.8
-0.7
-0.6
-0.5
-0.4
-0.3
-0.2
-0.10
Ave
rage
def
lect
ions
of p
late
for F
reig
ht tr
ain
on n
orth
ern
track
[mm
]
[mm]
Bef
ore
stre
ngth
enin
g =
blue
Afte
r stre
ngth
enin
g =
red
Ave
rage
def
lect
ion o
f th
e slab
’s low
er p
art
in a
lin
e per
pen
dic
ula
r to
tra
ck d
irec
tion b
ased
on a
ll tr
ains
in e
ach
cate
gory
. Ea
ch c
ircle
repr
esen
ts o
ne L
VD
T. D
ista
nce
is m
easu
red
from
the
brid
ge’s
sout
hern
edg
e be
am.

Appendix E - Frövi Results
281
010
0020
0030
0040
0050
0060
0070
0080
0090
00-6
0
-50
-40
-30
-20
-10010
Stra
ins
in s
teel
rein
forc
emen
t for
"R
egin
a" o
n so
uthe
rn tr
ack
[mm
]
[m/m]
Bef
ore
stre
ngth
enin
g =
blue
Afte
r stre
ngth
enin
g =
red
010
0020
0030
0040
0050
0060
0070
0080
0090
00-6
0
-50
-40
-30
-20
-10010
Stra
ins
in s
teel
rein
forc
emen
t for
Fre
ight
trai
ns o
n so
uthe
rn tr
ack
[mm
]
[m/m]
Bef
ore
stre
ngth
enin
g =
blue
Afte
r stre
ngth
enin
g =
red
010
0020
0030
0040
0050
0060
0070
0080
0090
00-6
0
-50
-40
-30
-20
-10010
Stra
ins
in s
teel
rein
forc
emen
t for
"R
egin
a" o
n no
rther
n tra
ck
[mm
]
[m/m]
Bef
ore
stre
ngth
enin
g =
blue
Afte
r stre
ngth
enin
g =
red
010
0020
0030
0040
0050
0060
0070
0080
0090
00-6
0
-50
-40
-30
-20
-10010
Stra
ins
in s
teel
rein
forc
emen
t for
Fre
ight
trai
ns o
n no
rther
n tra
ck
[mm
]
[m/m]
Bef
ore
stre
ngth
enin
g =
blue
Afte
r stre
ngth
enin
g =
red
Str
ains
in s
teel
rei
nfo
rcem
ent
per
pen
dic
ula
r to
tra
ck d
irec
tion in t
he
slab
’s low
er p
art.
Each
line
repr
esen
ts o
ne tr
ain
and
each
circ
le o
ne st
rain
gau
ge. D
ista
nce
is m
easu
red
from
the
brid
ge’s
sout
hern
edg
e be
am.
(-) =
tens
ion,
(+) =
com
pres
sion

Mechanical Anchorage of Prestressed CFRP Tendons
282
010
0020
0030
0040
0050
0060
0070
0080
0090
00-6
0
-50
-40
-30
-20
-10010
Ave
rage
stra
ins
in S
teel
rein
forc
emen
t for
"R
egin
a" o
n so
uthe
rn tr
ack
[mm
]
[m/m]
Bef
ore
stre
ngth
enin
g =
blue
Afte
r stre
ngth
enin
g =
red
010
0020
0030
0040
0050
0060
0070
0080
0090
00-6
0
-50
-40
-30
-20
-10010
Ave
rage
stra
ins
in S
teel
rein
forc
emen
t for
Fre
ight
trai
ns o
n so
uthe
rn tr
ack
[mm
][m/m]
Bef
ore
stre
ngth
enin
g =
blue
Afte
r stre
ngth
enin
g =
red
010
0020
0030
0040
0050
0060
0070
0080
0090
00-6
0
-50
-40
-30
-20
-10010
Ave
rage
stra
ins
in S
teel
rein
forc
emen
t for
"R
egin
a" o
n no
rther
n tra
ck
[mm
]
[m/m]
Bef
ore
stre
ngth
enin
g =
blue
Afte
r stre
ngth
enin
g =
red
010
0020
0030
0040
0050
0060
0070
0080
0090
00-6
0
-50
-40
-30
-20
-10010
Ave
rage
stra
ins
in S
teel
rein
forc
emen
t for
Fre
ight
trai
ns o
n no
rther
n tra
ck
[mm
]
[m/m]
Bef
ore
stre
ngth
enin
g =
blue
Afte
r stre
ngth
enin
g =
red
Ave
rage
str
ains
in s
teel
rei
nfo
rcem
ent
per
pen
dic
ula
r to
tra
ck d
irec
tion in t
he
slab
’s low
er p
art
bas
ed o
n a
ll tr
ains
in
each
cat
egory
. Ea
ch c
ircle
repr
esen
ts o
ne st
rain
gau
ge. D
ista
nce
is m
easu
red
from
the
brid
ge’s
sout
hern
edg
e be
am. (
-) =
tens
ion,
(+) =
com
pres
sion

Appendix E - Frövi Results
283
010
0020
0030
0040
0050
0060
0070
0080
0090
00-6
0
-50
-40
-30
-20
-10010
Stra
ins
in N
SM
R fo
r "R
egin
a" o
n so
uthe
rn tr
ack
[mm
]
[m/m]
Bef
ore
stre
ngth
enin
g =
blue
Afte
r stre
ngth
enin
g =
red
010
0020
0030
0040
0050
0060
0070
0080
0090
00-6
0
-50
-40
-30
-20
-10010
Stra
ins
in N
SM
R fo
r Fre
ight
trai
ns o
n so
uthe
rn tr
ack
[mm
]
[m/m]A
fter s
treng
then
ing
= re
d
010
0020
0030
0040
0050
0060
0070
0080
0090
00-6
0
-50
-40
-30
-20
-10010
Stra
ins
in N
SM
R fo
r "R
egin
a" o
n no
rther
n tra
ck
[mm
]
[m/m]
Bef
ore
stre
ngth
enin
g =
blue
Afte
r stre
ngth
enin
g =
red
010
0020
0030
0040
0050
0060
0070
0080
0090
00-6
0
-50
-40
-30
-20
-10010
Stra
ins
in N
SM
R fo
r Fre
ight
trai
ns o
n no
rther
n tra
ck
[mm
]
[m/m]
Afte
r stre
ngth
enin
g =
red
Str
ains
in N
SM
R p
erpen
dic
ula
r to
tra
ck d
irec
tion in t
he
slab
’s low
er p
art.
Each
line
repr
esen
ts o
ne tr
ain
and
each
circ
le o
ne st
rain
gau
ge. D
ista
nce
is m
easu
red
from
the
brid
ge’s
sout
hern
edg
e be
am.
(-) =
tens
ion,
(+) =
com
pres
sion

Mechanical Anchorage of Prestressed CFRP Tendons
284
010
0020
0030
0040
0050
0060
0070
0080
0090
00-6
0
-50
-40
-30
-20
-10010
Ave
rage
stra
ins
in N
SM
R fo
r "R
egin
a" o
n so
uthe
rn tr
ack
[mm
]
[m/m]
Afte
r stre
ngth
enin
g =
red
010
0020
0030
0040
0050
0060
0070
0080
0090
00-6
0
-50
-40
-30
-20
-10010
Ave
rage
stra
ins
in N
SM
R fo
r Fre
ight
trai
ns o
n so
uthe
rn tr
ack
[mm
][m/m]
Afte
r stre
ngth
enin
g =
red
010
0020
0030
0040
0050
0060
0070
0080
0090
00-6
0
-50
-40
-30
-20
-10010
Ave
rage
stra
ins
in N
SM
R fo
r "R
egin
a" o
n no
rther
n tra
ck
[mm
]
[m/m]
Afte
r stre
ngth
enin
g =
red
010
0020
0030
0040
0050
0060
0070
0080
0090
00-6
0
-50
-40
-30
-20
-10010
Ave
rage
stra
ins
in N
SM
R fo
r Fre
ight
trai
ns o
n no
rther
n tra
ck
[mm
]
[m/m]
Afte
r stre
ngth
enin
g =
red
Ave
rage
stra
ins
in N
SM
R p
erpen
dic
ula
r to
tra
ck d
irec
tion in t
he
slab
’s low
er p
art
bas
ed o
n a
ll tr
ains
in e
ach c
ateg
ory
. Ea
ch c
ircle
repr
esen
ts o
ne st
rain
gau
ge. D
ista
nce
is m
easu
red
from
the
brid
ge’s
sout
hern
edg
e be
am. (
-) =
tens
ion,
(+) =
com
pres
sion

Appendix E - Frövi Results
285
010
0020
0030
0040
0050
0060
0070
0080
0090
00-6
0
-50
-40
-30
-20
-10010
Ave
rage
stra
ins
in s
teel
and
NS
MR
for "
Reg
ina"
on
sout
hern
trac
k
[mm
]
[m/m]
NS
MR
= b
lue
Ste
el =
red
010
0020
0030
0040
0050
0060
0070
0080
0090
00-6
0
-50
-40
-30
-20
-10010
Ave
rage
stra
ins
in s
teel
and
NS
MR
for F
reig
ht tr
ains
on
sout
hern
trac
k
[mm
]
[m/m]
NS
MR
= b
lue
Ste
el =
red
010
0020
0030
0040
0050
0060
0070
0080
0090
00-6
0
-50
-40
-30
-20
-10010
Ave
rage
stra
ins
in s
teel
and
NS
MR
for "
Reg
ina"
on
north
ern
track
[mm
]
[m/m]
NS
MR
= b
lue
Ste
el =
red
010
0020
0030
0040
0050
0060
0070
0080
0090
00-6
0
-50
-40
-30
-20
-10010
Ave
rage
stra
ins
in s
teel
and
NS
MR
for F
reig
ht tr
ains
on
north
ern
track
[mm
]
[m/m]
NS
MR
= b
lue
Ste
el =
red
Ave
rage
val
ues
of st
rain
s in
NSM
R a
nd s
teel
aft
er s
tren
gthen
ing
Each
circ
le re
pres
ents
one
stra
in g
auge
. Dis
tanc
e is
mea
sure
d fr
om th
e br
idge
’s so
uthe
rn e
dge
beam
. (-
) = te
nsio
n, (+
) = c
ompr
essi
on

Mechanical Anchorage of Prestressed CFRP Tendons
286
-0.0
06
-0.0
04
-0.0
020
0.00
2
0.00
4
0.00
6
Cra
ck o
peni
ngs
north
ern
track
for "
Reg
ina"
on
sout
hern
trac
k
[mm]
NW
Bef
ore
stre
ngth
enin
g =
blue
NW
Afte
r stre
ngth
enin
g =
red
NE
Bef
ore
stre
ngth
enin
g =
blue
NE
Afte
r stre
ngth
enin
g =
red
-0.0
06
-0.0
04
-0.0
020
0.00
2
0.00
4
0.00
6
Cra
ck o
peni
ngs
north
ern
track
for F
reig
ht tr
ains
on
sout
hern
trac
k
[mm]
NW
Bef
ore
stre
ngth
enin
g =
blue
NW
Afte
r stre
ngth
enin
g =
red
NE
Bef
ore
stre
ngth
enin
g =
blue
NE
Afte
r stre
ngth
enin
g =
red
-0.0
06
-0.0
04
-0.0
020
0.00
2
0.00
4
0.00
6
Cra
ck o
peni
ngs
north
ern
track
for "
Reg
ina"
on
north
ern
track
[mm]
NW
Bef
ore
stre
ngth
enin
g =
blue
NW
Afte
r stre
ngth
enin
g =
red
NE
Bef
ore
stre
ngth
enin
g =
blue
NE
Afte
r stre
ngth
enin
g =
red
-0.0
06
-0.0
04
-0.0
020
0.00
2
0.00
4
0.00
6
Cra
ck o
peni
ngs
north
ern
track
for F
reig
ht tr
ains
on
north
ern
track
[mm]
NW
Bef
ore
stre
ngth
enin
g =
blue
NW
Afte
r stre
ngth
enin
g =
red
NE
Bef
ore
stre
ngth
enin
g =
blue
NE
Afte
r stre
ngth
enin
g =
red
Cra
ck o
pen
ing
per
pen
dic
ula
r to
tra
ck d
irec
tion u
nder
nea
th t
he
nort
her
n t
rack
clo
se t
o t
he
wes
tern
and e
aste
rn s
upport
re
spec
tive
ly
Each
circ
le re
pres
ents
one
trai
n. (-
) = c
losu
re, (
+) =
ope
ning

Appendix E - Frövi Results
287
-0.0
06
-0.0
04
-0.0
020
0.00
2
0.00
4
0.00
6
Cra
ck o
peni
ngs
sout
hern
trac
k fo
r "R
egin
a" o
n so
uthe
rn tr
ack
[mm]
SW
Bef
ore
stre
ngth
enin
g =
blue
SE
Bef
ore
stre
ngth
enin
g =
blue
SE
Afte
r stre
ngth
enin
g =
red
-0.0
06
-0.0
04
-0.0
020
0.00
2
0.00
4
0.00
6
Cra
ck o
peni
ngs
sout
hern
trac
k fo
r Fre
ight
trai
ns o
n so
uthe
rn tr
ack
[mm]
SW
Bef
ore
stre
ngth
enin
g =
blue
SE
Bef
ore
stre
ngth
enin
g =
blue
SE
Afte
r stre
ngth
enin
g =
red
-0.0
06
-0.0
04
-0.0
020
0.00
2
0.00
4
0.00
6
Cra
ck o
peni
ngs
sout
hern
trac
k fo
r "R
egin
a" o
n no
rther
n tra
ck
[mm]S
W B
efor
e st
reng
then
ing
= bl
ue
SE
Bef
ore
stre
ngth
enin
g =
blue
SE
Afte
r stre
ngth
enin
g =
red
-0.0
06
-0.0
04
-0.0
020
0.00
2
0.00
4
0.00
6
Cra
ck o
peni
ngs
sout
hern
trac
k fo
r Fre
ight
trai
ns o
n no
rther
n tra
ck
[mm]
SW
Bef
ore
stre
ngth
enin
g =
blue
SE
Bef
ore
stre
ngth
enin
g =
blue
SE
Afte
r stre
ngth
enin
g =
red
Cra
ck o
pen
ing
per
pen
dic
ula
r to
tra
ck d
irec
tion u
nder
nea
th t
he
south
ern t
rack
clo
se t
o t
he
wes
tern
and e
aste
rn s
upport
re
spec
tive
ly.
Each
circ
le re
pres
ents
one
trai
n. (-
) = c
losu
re, (
+) =
ope
ning


Doctoral and Licentiate Theses
289
Doctoral and Licentiate Theses
Division of Structural Engineering
Luleå University of Technology
Doctoral Theses (Some are downloadable from: http://epubl.ltu.se/1402-1544/index.shtml)
1980 Ulf Arne Girhammar: Dynamic Fail-Safe Behaviour of Steel Structures. Doctoral Thesis 1980:060D. pp. 309.
1983 Kent Gylltoft: Fracture Mechanics Models for Fatigue in concrete Structures.Doctoral Thesis 1983:25D. pp. 210.
1985 Thomas Olofsson: Mathematical Modelling of Jointed Rock Masses. In collaboration with the Division of Rock Mechanics. Doctoral Thesis 1985:42D. pp. 143.
1988 Lennart Fransson: Thermal ice pressure on structures in ice covers. Doctoral Thesis 1988:67D. pp. 161.
1989 Mats Emborg: Thermal stresses in concrete structures at early ages. Doctoral Thesis 1989:73D. pp. 285.
1993 Lars Stehn: Tensile fracture of ice. Test methods and fracture mechanics analysis. Doctoral Thesis 1993:129D, September 1993. pp. 136.
1994 Björn Täljsten: Plate Bonding. Strengthening of existing concrete structures with epoxy bonded plates of steel or fibre reinforced plastics. Doctoral Thesis 1994:152D, August 1994. pp. 283.
1994 Jan-Erik Jonasson: Modelling of temperature, moisture and stresses in young concrete. Doctoral Thesis 1994:153D, August 1994. pp. 227.
1995 Ulf Ohlsson: Fracture Mechanics Analysis of Concrete Structures. Doctoral Thesis 1995:179D, December 1995. pp. 98.

Mechanical Anchorage of Prestressed CFRP Tendons
290
1998 Keivan Noghabai: Effect of Tension Softening on the Performance of Concrete Structures. Doctoral Thesis 1998:21, August 1998. pp. 150.
1999 Gustaf Westman: Concrete Creep and Thermal Stresses. New creep models and their effects on stress development. Doctoral Thesis 1999:10, May 1999. pp. 301.
1999 Henrik Gabrielsson: Ductility in High Performance Concrete Structures. An experimental investigation and a theoretical study of prestressed hollow core slabs and prestressed cylindrical pole elements. Doctoral Thesis 1999:15, May 1999. pp. 283.
2000 Patrik Groth: Fibre Reinforced Concrete - Fracture Mechanics Methods Applied on Self-Compacting Concrete and Energetically Modified Binders. Doctoral Thesis 2000:04, January 2000. pp. 214. ISBN 978-91-85685-00-4.
2000 Hans Hedlund: Hardening concrete. Measurements and evaluation of non-elastic deformation and associated restraint stresses. Doctoral Thesis 2000:25, December 2000. pp. 394. ISBN 91-89580-00-1.
2003 Anders Carolin: Carbon Fibre Reinforced Polymers for Strengthening of Structural Members. Doctoral Thesis 2003:18, June 2003. pp. 190. ISBN 91-89580-04-4.
2003 Martin Nilsson: Restraint Factors and Partial Coefficients for Crack Risk Analyses of Early Age Concrete Structures. Doctoral Thesis 2003:19, June 2003. pp. 170. ISBN: 91-89580-05-2.
2003 Mårten Larson: Thermal Crack Estimation in Early Age Concrete – Models and Methods for Practical Application. Doctoral Thesis 2003:20, June 2003. pp. 190. ISBN 91-86580-06-0.
2005 Erik Nordström: Durability of Sprayed Concrete. Steel fibre corrosion in cracks. Doctoral Thesis 2005:02, January 2005. pp. 151. ISBN 978-91-85685-01-1.
2006 Rogier Jongeling: A Process Model for Work-Flow Management in Construction. Combined use of Location-Based Scheduling and 4D CAD. Doctoral Thesis 2006:47, October 2006. pp. 191. ISBN 978-91-85685-02-8.
2006 Jonas Carlswärd: Shrinkage cracking of steel fibre reinforced self compacting concrete overlays - Test methods and theoretical modelling. Doctoral Thesis 2006:55, December 2006. pp. 250. ISBN 978-91-85685-04-2.
2006 Håkan Thun: Assessment of Fatigue Resistance and Strength in Existing Concrete Structures. Doctoral thesis 2006:65, December 2006. pp. 169. ISBN 978-91- 85685-03-5.
2007 Lundqvist Joakim: Numerical Analysis of Concrete Elements Strengthened with Carbon Fiber Reinforced Polymers. Doctoral thesis 2007:07, March 2007. pp. 50+58. ISBN 978-91-85685-06-6.

Doctoral and Licentiate Theses
291
2007 Arvid Hejll: Civil Structural Health Monitoring - Strategies, Methods and Applications. Doctoral Thesis 2007:10, March 2007. pp. 189. ISBN 978-91- 85685-08-0.
2007 Stefan Woksepp: Virtual reality in construction: tools, methods and processes. Doctoral thesis 2007:49, November 2007. pp. 191. ISBN 978-91-85685-09- 7.
2007 Romuald Rwamamara: Planning the Healty Construction Workplace through Risk assessment and Design Methods. Doctoral thesis 2007:74, November 2007. pp. 179. ISBN 978-91-85685-11-0.
2008 Björnar Sand: Nonlinear finite element simulations of ice forces on offshore structures.Doctoral Thesis 2008:39, September 2008. pp. 241. ISSN 1402-1544
2008 Bengt Toolanen: Lean contracting : relational contracting influenced by lean thinking.Doctoral Thesis 2008:41. October 2008. pp. 190. ISSN 1402-1544
Licentiate Theses (Some are downloadable from: http://epubl.ltu.se/1402-1757/index.shtml)
1984 Lennart Fransson: Bärförmåga hos ett flytande istäcke. Beräkningsmodeller och experimentella studier av naturlig is och av is förstärkt med armering. Licentiate Thesis 1984:012L. pp. 137.
1985 Mats Emborg: Temperature stresses in massive concrete structures. Viscoelastic models and laboratory tests. Licentiate Thesis 1985:011L, May 1985. rev. November 1985. pp. 163.
1987 Christer Hjalmarsson: Effektbehov i bostadshus. Experimentell bestämning av effektbehov i små- och flerbostadshus. Licentiate Thesis 1987:009L, October 1987. pp. 72.
1990 Björn Täljsten: Förstärkning av betongkonstruktioner genom pålimning av stålplåtar. Licentiate Thesis 1990:06L, May 1990. pp. 205.
1990 Ulf Ohlsson: Fracture Mechanics Studies of Concrete Structures. Licentiate Thesis 1990:07L, May 1990. pp. 66.
1990 Lars Stehn: Fracture Toughness of sea ice. Development of a test system based on chevron notched specimens. Licentiate Thesis 1990:11L, September 1990. pp. 88.
1992 Per Anders Daerga: Some experimental fracture mechanics studies in mode I of concrete and wood. Licentiate Thesis 1992:12L, 1ed April 1992, 2ed June 1992. pp. 81.

Mechanical Anchorage of Prestressed CFRP Tendons
292
1993 Henrik Gabrielsson: Shear capacity of beams of reinforced high performance concrete. Licentiate Thesis 1993:21L, May 1993. pp. 109.
1995 Keivan Noghabai: Splitting of concrete in the anchoring zone of deformed bars. A fracture mechanics approach to bond. Licentiate Thesis 1995:26L, May 1995. pp. 123.
1995 Gustaf Westman: Thermal cracking in high performance concrete. Viscoelastic models and laboratory tests. Licentiate Thesis 1995:27L, May 1995. pp. 125.
1995 Katarina Ekerfors: Mognadsutveckling i ung betong. Temperaturkänslighet, hållfasthet och värmeutveckling. Licentiate Thesis 1995:34L, October 1995. pp. 137.
1996 Patrik Groth: Cracking in concrete. Crack prevention with air-cooling and crack distribution with steel fibre reinforcement. Licentiate Thesis 1996:37L, October 1996. pp. 128.
1996 Hans Hedlund: Stresses in High Performance Concrete due to Temperature and Moisture Variations at Early Ages. Licentiate Thesis 1996:38L, October 1996. pp. 240.
2000 Mårten Larson: Estimation of Crack Risk in Early Age Concrete. Simplified methods for practical use. Licentiate Thesis 2000:10, April 2000. pp. 170.
2000 Stig Bernander: Progressive Landslides in Long Natural Slopes. Formation, potential extension and configuration of finished slides in strain- softening soils. Licentiate Thesis 2000:16, May 2000. pp. 137.
2000 Martin Nilsson: Thermal Cracking of young concrete. Partial coefficients, restraint effects and influences of casting joints. Licentiate Thesis 2000:27, October 2000. pp. 267.
2000 Erik Nordström: Steel Fibre Corrosion in Cracks. Durability of sprayed concrete. Licentiate Thesis 2000:49, December 2000. pp. 103.
2001 Anders Carolin: Strengthening of concrete structures with CFRP – Shear strengthening and full-scale applications. Licentiate thesis 2001:01, June 2001. pp. 120. ISBN 91-89580-01-X.
2001 Håkan Thun: Evaluation of concrete structures. Strength development and fatigue capacity. Licentiate thesis 2001:25, June 2001. pp. 164. ISBN 91-89580-08-2.
2002 Patrice Godonue: Preliminary Design and Analysis of Pedestrian FRP Bridge Deck. Licentiate thesis 2002:18. pp. 203.
2002 Jonas Carlswärd: Steel fibre reinforced concrete toppings exposed to shrinkage and temperature deformations. Licentiate thesis 2002:33, August 2002. pp. 112.

Doctoral and Licentiate Theses
293
2003 Sofia Utsi: Self-Compacting Concrete - Properties of fresh and hardening concrete for civil engineering applications. Licentiate thesis 2003:19, June 2003. pp. 185.
2003 Anders Rönneblad: Product Models for Concrete Structures - Standards, Applications and Implementations. Licentiate thesis 2003:22, June 2003. pp. 104.
2003 Håkan Nordin: Strengthening of Concrete Structures with Pre-Stressed CFRP. Licentiate Thesis 2003:25, June 2003. pp. 125.
2004 Arto Puurula: Assessment of Prestressed Concrete Bridges Loaded in Combined Shear, Torsion and Bending. Licentiate Thesis 2004:43, November 2004. pp. 212.
2004 Arvid Hejll: Structural Health Monitoring of Bridges. Monitor, Assessand Retrofit. Licentiate Thesis 2004:46, November 2004. pp. 128.
2005 Ola Enochsson: CFRP Strengthening of Concrete Slabs, with and without Openings. Experiment, Analysis, Design and Field Application. Licentiate Thesis 2005:87, November 2005. pp. 154.
2006 Markus Bergström: Life Cycle Behaviour of Concrete Structures – Laboratory test and probabilistic evaluation. Licentiate Thesis 2006:59, December 2006. pp. 173. ISBN 978-91-85685-05-9.
2007 Thomas Blanksvärd: Strengthening of Concrete Structures by Mineral Based Composites. Licentiate Thesis 2007:15, March 2007. pp. 300. ISBN 978-91- 85685-07-3.
2007 Alann André: Strengthening of Timber Structures with Flax Fibres. Licentiate Thesis 2007:61, November 2007. pp. 154. ISBN 978-91-85685-10-3.
2008 Peter Simonsson: Industrial bridge construction with cast in place concrete: New production methods and lean construction philosophies. Licentiate thesis 2008:17, May 2008. pp. 164. ISBN 978-91-85685-12-7.
2008 Anders Stenlund: Load carrying capacity of bridges: three case studies of bridges in northern Sweden where probabilistic methods have been used to study effects of monitoring and strengthening. Licentiate thesis 2008:18, May 2008. pp. 306. ISBN 978-91-85685-13-4.


Copyright © 2022 FDOKUMEN