2 3 Response of Masonry Walls Strengthened with CFRP and Steel Strips
17
1 23 Arabian Journal for Science and Engineering ISSN 1319-8025 Arab J Sci Eng DOI 10.1007/s13369-012-0190-9 Response of Masonry Walls Strengthened with CFRP and Steel Strips S. H. Farooq, M. Ilyas & S. Amir
Transcript of 2 3 Response of Masonry Walls Strengthened with CFRP and Steel Strips

1 23
Arabian Journal for Science andEngineering ISSN 1319-8025 Arab J Sci EngDOI 10.1007/s13369-012-0190-9
Response of Masonry Walls Strengthenedwith CFRP and Steel Strips
S. H. Farooq, M. Ilyas & S. Amir

1 23
Your article is protected by copyright and
all rights are held exclusively by King Fahd
University of Petroleum and Minerals. This
e-offprint is for personal use only and shall
not be self-archived in electronic repositories.
If you wish to self-archive your work, please
use the accepted author’s version for posting
to your own website or your institution’s
repository. You may further deposit the
accepted author’s version on a funder’s
repository at a funder’s request, provided it is
not made publicly available until 12 months
after publication.

Arab J Sci EngDOI 10.1007/s13369-012-0190-9
RESEARCH ARTICLE - CIVIL ENGINEERING
S. H. Farooq · M. Ilyas · S. Amir
Response of Masonry Walls Strengthened with CFRPand Steel Strips
Received: 27 January 2010 / Accepted: 7 October 2010© King Fahd University of Petroleum and Minerals 2012
Abstract Strengthening of un-reinforced masonry (URM) to improve its seismic performance is an interna-tional research focus. This paper presents the effect of masonry strengthening using steel strips and carbonfiber reinforced polymer (CFRP) strips on seismic performance of URM wall panels. Three single leaf panelswith aspect ratio of 0.7 were constructed in the laboratory using the same type of materials and workmanship.Both CFRP and steel strips significantly improved the seismic performance compared to the un-reinforcedwall panel. After analysis of test results, we found that lateral strength increase for the steel strengthened wallwas less, but other seismic parameters were better than for the CFRP strengthened wall. However, both CFRPand steel strengthening of masonry were quite effective in improving overall lateral strength and ductility.
Keywords Masonry walls · Shear strengthening · Seismic performance · CFRP strips · Steel strips
1 Introduction
Un-reinforced masonry (URM) structures are very vulnerable to seismic events and can experience in-planeor out-of-plane forces. Researchers all around the globe are working on strengthening masonry to improve
S. H. Farooq (B)School of Civil Engineering, National University of Sciences and Technology (NUST), Risalpur, PakistanE-mail: [email protected]
M. Ilyas · S. AmirUniversity of Engineering and Technology, Lahore, PakistanE-mail: [email protected]
S. AmirE-mail: [email protected]
123
Author's personal copy

Arab J Sci Eng
its resistance against such forces. Recently, Tinazzi [1] and Tumialan [2] developed a strengthening approachusing structural re-pointing in which carbon fibre reinforced polymers (CFRP) rods were embedded into bedjoints of a masonry wall [1,2]. Among the advantages of this method are the lack of visible alteration to thestructure; however, the technique is expensive and labor intensive. Another approach is to apply CFRP as anexternal reinforcement over the surface of a masonry wall. ElGawady et al. [3–5] have shown that strength-ening masonry walls on a single-face using CFRP could significantly increase the lateral strength. Severalresearchers have examined other conventional techniques including ferrocement, shotcrete, and centre core.In the ferrocement technique, a closely spaced hardware mesh of fine steel rods is completely embedded in ahigh strength cement mortar layer [6,7]. In the shotcrete technique, concrete overlays 60 mm thick or moreare sprayed onto the surface of a masonry wall over a mesh of reinforcing bars. For center core reinforcement,continuous vertical holes, 50–125 mm in diameter are drilled in the center of an existing masonry wall fromthe top of the wall into its foundation. Reinforcement is placed in the center of the holes and grouted intoplace.
Recently, more attention has been given to post-tensioning strengthening techniques, which involve a com-pressive force applied to a masonry wall; this force counteracts the tensile stresses resulting from lateral loads[8–10]. Most of these techniques are expensive and not easy to apply, as they require special skills. To addressthe strengthening issue of URM structures, a technique involving application of galvanized thin steel strips asan external reinforcement was proposed by Farooq et al. [11–13]. The advantages of the proposed techniqueinclude: simplicity, reduced architectural impact and cost effectiveness. In the present work, URM panels werestrengthened with CFRP/steel strips to study their efficacy in improving seismic performance. In Pakistan,the cost of masonry strengthening using CFRP is very high. To overcome this problem, the present study wascarried out to compare the effectiveness of strengthening using steel strips with that of CFRP strengthening.The strengthening of masonry using steel strips was found to be quite effective in improving seismic behavior,at a significantly lower cost than CFRP strengthening.
2 Experimental Program
The static cyclic experimental program investigated the effectiveness of steel strips and CFRP strips as exter-nally bonded strengthening materials for in-plane upgrading of URM walls. Three single wythe URM wallswere constructed and tested at the structural laboratory of the University of Engineering and Technology,Lahore, Pakistan. One of the walls was tested without reinforcement and served as the reference specimen.The remaining two walls were reinforced with steel and CFRP strips.
3 Test Specimen
The test specimens were intended to represent typical masonry construction in Pakistan. Single wythe wallswere constructed using solid clay brick masonry units. The test specimens had effective moment/shear ratio of0.70. The specimens were built using type N mortar (one part cement and four parts sand). After allowing thespecimens to cure for 14 days, a precast reinforced concrete head beam was fixed at the top of the specimenusing type S mortar (one part cement and three parts sand). Specimen REFE1 was used as the reference wall.Specimen UPD-DG was strengthened with diagonal steel mesh and specimen UPD-F-DG was reinforced withdiagonal CFRP strip mesh in a similar manner to the steel strengthened wall, as shown in Fig. 1. The verticaland horizontal reinforcement ratios in both cases were 0.19%.
4 Bricks and Mortar
The burnt clay bricks used in the experimental program were procured from the local market. The brickunits used measured 228 × 115 × 76 mm. Four mortar cubes were taken from each wall construction andtested according to ASTM C-270. The average compressive strength of mortar was 7.2 MPa with a stan-dard deviation of 1.4 MPa. The average compressive strength of the brick units was determined accordingto ASTM C-67 as 17.8 MPa with a standard deviation of 0.9 MPa. The masonry compression strength wasdetermined by testing masonry prisms according to ASTM C-1314. Four masonry prisms were built foreach wall and cured under the same conditions. The compression strength of wall panels varied between 7.8and 9.0 MPa.
123
Author's personal copy

Arab J Sci Eng
Specimen UPD-DG, Single sided diagonal steel mesh UPD-F-DG, Single sided diagonal CFRP mesh
Fig. 1 Pictorial view of different meshing patterns
5 Steel/CFRP Strengthening
A diagonal pattern of steel or CFRP mesh was used to strengthen the URM specimens. The application ofthe steel mesh was a simple and rapid operation. First, holes were drilled at specified spacing in the wall andin the steel strips. Second, the steel strips were anchored in form of mesh on the surface of the wall usingHILTI HPS-1 6/15 × 40 type bolts. The steel strips were made of A-36 Mild Steel with yield strength of281 MPa. The steel strips were cut from hot galvanized dipped steel sheet. The dimension of each steel stripwas 50 × 1.40 mm.
CFRP were used to strengthen a URM specimen. Table 1 shows the CFRP/adhesive properties accordingto the manufacturer’s data. The application of the wrap material was a simple and rapid operation. First, thesurface was roughened by grinding and was cleaned with high air pressure. Second, it was coated with a thinlayer of two component epoxy (Sikadur-330). Third, CFRP strips were laid into the epoxy dry and worked intothe underlying layer of epoxy by hand pressure and pressed with a roller. Specimens were left to cure underroom conditions for approximately 7 days.
6 Test Setup and Loading System
Figure 2 illustrates the test setup. The test specimens rested on a rolled concrete foundation beam, which waspost tensioned to the laboratory strong floor. An axial pre-compression of 0.50 MPa included the axial load,weight of cap beam and self weight of wall. The horizontal load was applied to the reinforced concrete headbeam, which in turn distributed the force to the masonry wall panel. The load was applied manually usingtwo hydraulic jacks and hand pumps. The typical cyclic loading sequence adopted for the tests is shown inFig. 3 and consisted of a series of displacement-controlled cycles with two cycles for each displacement level.Because the displacement was not elastic, the initial increments were kept as 0.25 mm and later increased to1 mm. Each stage of loading consisted of two cycles to the selected displacement. Similar loading historieswere used by different researchers such as Haider [14], Voon [15], and Rosenboom [16] for testing of URMwalls.
Table 1 Summary of materials properties
Property CFRP (Sika CarboDur S812) Sikadur-330
Average size (mm) 40 × 1.2 8–10 mmTensile strength (MPa) 2,800 30%Age elongation >1.7 –E-Modulus (GPa) 165 12.8
123
Author's personal copy

Arab J Sci Eng
R.C.C cap beam
Anchoring bolts
Lateral jack/load cell
Strong frame
Frame stiffener
R.C.C foundation beam Strong floor
Bridge bearing assembly
Vertical jack/load cell
Top bracing anchors
Frame for compression load
Horizontal anchor bolt
U-steel channel for lifting
Load cell anchor assembly
Base lateral anchors
Fig. 2 Test arrangement and legend
Loading History
-20
-15
-10
-5
0
5
10
15
20
1 3 5 7 9 11 13 15 17 19 21 23 25
No. of Cycles
Dis
pla
cem
ent
(mm
)
Fig. 3 Loading history
7 Instrumentation
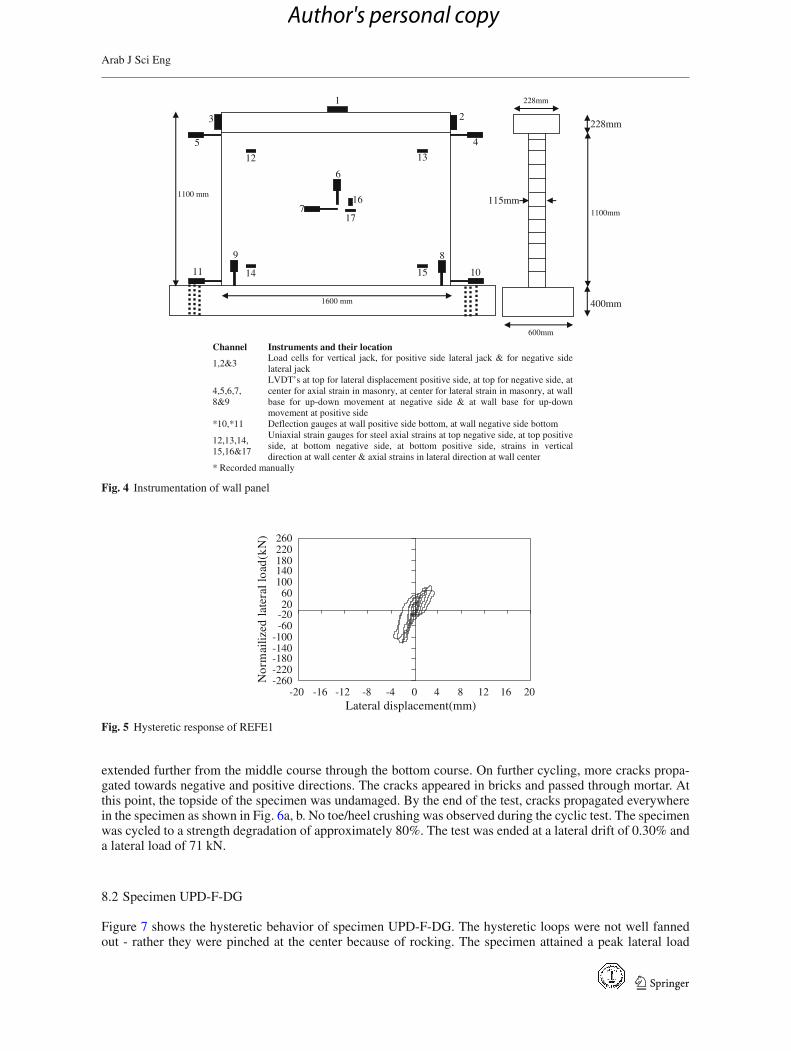
The specimens were instrumented with several devices as shown in Fig. 4. Six linear variable displacementtransducers measured vertical and horizontal displacements and strains in the masonry. The vertical and hori-zontal strains in the steel were measured using electrical strain gauges. Three load cells were used to measurelateral and vertical loads.
8 Test Results of Specimens
The experimental data were recorded and analyzed to study the seismic behavior of strengthened wall panelsas shown below.
8.1 Specimen REFE1
This specimen was a reference wall with an effective moment/shear ratio of 0.67. Its force–displacementrelationship is shown in Fig. 5. The hysteretic loops were not well fanned out indicating typical URM brittlebehavior. The inelastic branch was almost absent and after peak lateral load, sudden stiffness degradation wasobserved. The specimen attained peak lateral strength of 88.90 kN at a lateral drift of 0.26%. The specimenexperienced brittle shear failure. At a lateral drift of 0.26% and a lateral load of 78 kN, a first diagonal crackformed at the mid-height of the specimen at the southern direction. At a load of 85.40 kN, the same crack
123
Author's personal copy
Arab J Sci Eng
115mm
228mm
1100mm
400mm
228mm
600mm
1
23
45
6
7
891011 14
12 13
15
16
17
6
7
89
1600 mm
1100 mm
Channel Instruments and their location
1,2&3Load cells for vertical jack, for positive side lateral jack & for negative side lateral jack
4,5,6,7,8&9
LVDT’s at top for lateral displacement positive side, at top for negative side, at center for axial strain in masonry, at center for lateral strain in masonry, at wall base for up-down movement at negative side & at wall base for up-down movement at positive side
*10,*11 Deflection gauges at wall positive side bottom, at wall negative side bottom
12,13,14,15,16&17
Uniaxial strain gauges for steel axial strains at top negative side, at top positive side, at bottom negative side, at bottom positive side, strains in vertical direction at wall center & axial strains in lateral direction at wall center
* Recorded manually
Fig. 4 Instrumentation of wall panel
-260-220-180-140-100
-60-202060
100140180220260
-20 -16 -12 -8 -4 0 4 8 12 16 20Lateral displacement(mm)
Nor
mai
lized
late
ral l
oad(
kN)
Fig. 5 Hysteretic response of REFE1
extended further from the middle course through the bottom course. On further cycling, more cracks propa-gated towards negative and positive directions. The cracks appeared in bricks and passed through mortar. Atthis point, the topside of the specimen was undamaged. By the end of the test, cracks propagated everywherein the specimen as shown in Fig. 6a, b. No toe/heel crushing was observed during the cyclic test. The specimenwas cycled to a strength degradation of approximately 80%. The test was ended at a lateral drift of 0.30% anda lateral load of 71 kN.
8.2 Specimen UPD-F-DG
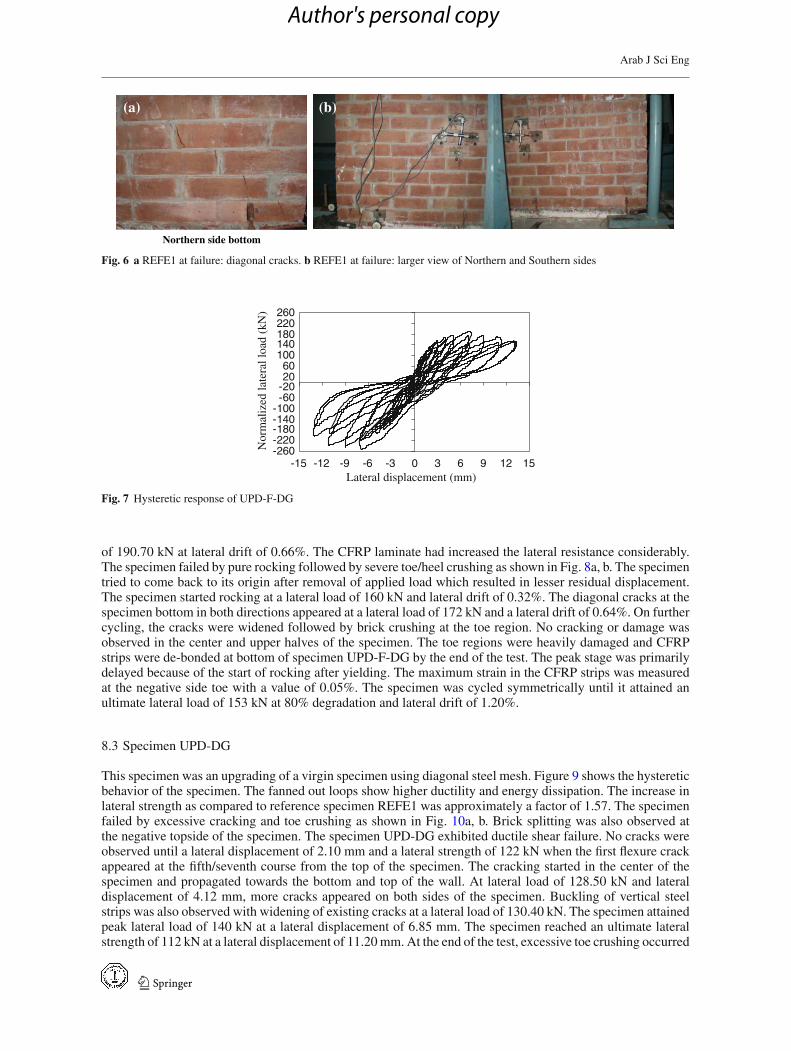
Figure 7 shows the hysteretic behavior of specimen UPD-F-DG. The hysteretic loops were not well fannedout - rather they were pinched at the center because of rocking. The specimen attained a peak lateral load
123
Author's personal copy
Arab J Sci Eng
Northern side bottom
(a) (b)
Fig. 6 a REFE1 at failure: diagonal cracks. b REFE1 at failure: larger view of Northern and Southern sides
-260-220-180-140-100-60-202060
100140180220260
-15 -12 -9 -6 -3 0 3 6 9 12 15Lateral displacement (mm)
Nor
mal
ized
late
ral l
oad
(kN
)
Fig. 7 Hysteretic response of UPD-F-DG
of 190.70 kN at lateral drift of 0.66%. The CFRP laminate had increased the lateral resistance considerably.The specimen failed by pure rocking followed by severe toe/heel crushing as shown in Fig. 8a, b. The specimentried to come back to its origin after removal of applied load which resulted in lesser residual displacement.The specimen started rocking at a lateral load of 160 kN and lateral drift of 0.32%. The diagonal cracks at thespecimen bottom in both directions appeared at a lateral load of 172 kN and a lateral drift of 0.64%. On furthercycling, the cracks were widened followed by brick crushing at the toe region. No cracking or damage wasobserved in the center and upper halves of the specimen. The toe regions were heavily damaged and CFRPstrips were de-bonded at bottom of specimen UPD-F-DG by the end of the test. The peak stage was primarilydelayed because of the start of rocking after yielding. The maximum strain in the CFRP strips was measuredat the negative side toe with a value of 0.05%. The specimen was cycled symmetrically until it attained anultimate lateral load of 153 kN at 80% degradation and lateral drift of 1.20%.
8.3 Specimen UPD-DG
This specimen was an upgrading of a virgin specimen using diagonal steel mesh. Figure 9 shows the hystereticbehavior of the specimen. The fanned out loops show higher ductility and energy dissipation. The increase inlateral strength as compared to reference specimen REFE1 was approximately a factor of 1.57. The specimenfailed by excessive cracking and toe crushing as shown in Fig. 10a, b. Brick splitting was also observed atthe negative topside of the specimen. The specimen UPD-DG exhibited ductile shear failure. No cracks wereobserved until a lateral displacement of 2.10 mm and a lateral strength of 122 kN when the first flexure crackappeared at the fifth/seventh course from the top of the specimen. The cracking started in the center of thespecimen and propagated towards the bottom and top of the wall. At lateral load of 128.50 kN and lateraldisplacement of 4.12 mm, more cracks appeared on both sides of the specimen. Buckling of vertical steelstrips was also observed with widening of existing cracks at a lateral load of 130.40 kN. The specimen attainedpeak lateral load of 140 kN at a lateral displacement of 6.85 mm. The specimen reached an ultimate lateralstrength of 112 kN at a lateral displacement of 11.20 mm. At the end of the test, excessive toe crushing occurred
123
Author's personal copy

Arab J Sci Eng
Southern side bottom
(a)
(b)
Fig. 8 a UPD-F-DG at failure: rocking. b Full view of UPD-F-DG at failure
-260-220-180-140-100
-60-202060
100140180220260
-20 -16 -12 -8 -4 0 4 8 12 16 20
Lateral displacement (mm)
Nor
mal
ized
late
ral l
oad
(kN
)
Fig. 9 Hysteretic response of UPD-DG
at both sides of the specimen. Brick spalling was also observed at the negative topside of the specimen. Itis worth noting that the maximum strain value of 0.08% was measured in the steel strips at the positive sidetoe.
9 Discussion of Test Results
The lateral cyclic behavior of the masonry walls before and after strengthening is discussed in detail in suc-ceeding paragraphs.
123
Author's personal copy

Arab J Sci Eng
Fig. 10 a Specimen UPD-DG failure: toe crushing. b Full view of UPD-DG failure
9.1 Lateral Force–Displacement Behavior
The compressive strength of masonry has a significant effect on its lateral capacity; the masonry shear strengthincreases nonlinearly with masonry compressive strength. That means the increase in masonry lateral resis-tance is approximately proportional to its compressive strength. Therefore, lateral load is normalized in orderto remove variation in the masonry strength from one wall to another. Equation (1) is used to normalize thelateral load.
Normalized lateral load = In-plane lateral load × 103
0.22 f 0.5m Ag
(1)
where Ag = Gross cross-sectional area, f 0.5m = Compressive strength.
In the equation all parameters are constant for each wall except the masonry compressive stress. To removethe effect of the varying compressive strength of different masonry wall panels, their lateral strength was nor-malized by a factor f 0.5
m for each wall panel. The ratio of compressive strength for all specimens was obtainedin comparison to the compressive strength of the reference wall. The lateral strength of the other walls wasnormalized by multiplying this ratio with their lateral strength to cater for the variation in compressive strengthof masonry walls. Figure 11 shows the comparison of critical backbone curves. Higher lateral resistance wasachieved for specimen UPD-F-DG. The lateral displacement at peak lateral load was also higher compared tospecimen UPD-DG as shown in Fig. 12. The rocking of specimen UPD-F-DG followed by toe/heel crushingcaused quick strength reduction. The yielding of specimen UPD-DG started at a lower lateral drift with grad-ual stiffness degradation. Both the strengthened specimens showed more ductile behavior as compared to thereference specimen REFE1. Reference specimen REFE1 showed a strength increase within the elastic limitfollowed by sudden reduction due to heavy cracking. Specimen UPD-F-DG strengthened with CFRP diagonalstrips showed a maximum lateral strength increase of 115%, while a 58% increase was achieved for specimenUPD-DG, as compared to the reference specimen. The higher lateral resistance for specimen UPD-F-DG wasprimarily because of its rocking mode of failure (the axial load increased due to rocking of the specimen) andalso the over-strengthening of the masonry wall panel.
123
Author's personal copy

Arab J Sci Eng
0
40
80
120
160
200
240
0 4 8 12 16 20
Lateral displacement (mm)N
orm
aliz
ed la
tera
l loa
d (k
N)
REFE1UPD-F-DGUPD-DG
Fig. 11 Critical backbone curve
01.63
3.32.1
0
2.89
7.3 6.853
0
3.31
13.211.2
0
4
8
12
16
20
REFE1 UPD-F-DG UPD-DG
Nor
mal
ized
late
ral l
oad
(kN
)
Displat yieldDisplat peak
Displat ultimate
Fig. 12 Comparison of lateral displacement
-240
-180
-120
-60
0
60
120
180
240
-20 -16 -12 -8 -4 0 4 8 12 16 20
Lateral displacement (mm)
Nor
mal
ized
late
ral l
oad
(kN
)
REFE1UPD-DGUPD-F-DG
YIELD
Fig. 13 Comparison of hysteretic loops
9.2 Effect of Confinement
The steel or CFRP always provide passive confinement to the masonry walls as their contribution remainsminimum until yielding, and they actively contribute towards masonry lateral strength and performanceimprovement after initiation of the first crack. Within the yield limit the steel/CFRP strips remain lightlystressed. The bolts ensured effective shear transfer after initiation of cracking. For the steel reinforced wall,the redistribution of shear stress after cracking was carried through the steel strips and bolts were the point ofstress transfer from un-reinforced masonry to steel strips. This transfer of shear stress ensured higher lateralstrength and better seismic performance of strengthened specimen. The hysteretic loops of all three specimensat yielding are overlapped in Fig. 13. Up until yielding, the residual displacements were negligible. The lateraldisplacement at yielding for all specimens was within 1.60–3 mm. The strengthening had played a minor rolein improving the seismic behavior prior to yielding. The ultimate lateral displacement, ductility and energydissipation of strengthened specimens increased significantly after yielding, because of the steel or CFRP strips.
123
Author's personal copy

Arab J Sci Eng
-240
-180
-120
-60
0
60
120
180
240
-20 -16 -12 -8 -4 0 4 8 12 16 20
Lateral displacement (mm)N
orm
aliz
ed la
tera
l loa
d (k
N)
REFE1UPD-DGUPD-F-DG
PEAK
Fig. 14 Comparison of hysteretic loops at peak
-240
-180
-120
-60
0
60
120
180
240
-20 -16 -12 -8 -4 0 4 8 12 16 20
Lateral displacement (mm)
Nor
mal
ized
late
ral l
oad
(kN
)
REFE1UPD-DGUPD-F-DG
ULTIMATE
Fig. 15 Comparison of hysteretic loops at ultimate
The improvement in behavior for strengthened specimens occurred because the masonry bears out againstthe steel/CFRP strips after yielding, which created a passive confinement pressure. The contribution of theconfinement from the steel/CFRP strips towards the seismic performance could be seen from Figs. 14 and 15.These two figures show overlaid hysteretic loops of all the specimens at peak and ultimate stages. It is clearfrom the figures that the steel/CFRP strips started to participate actively after yielding and improved the perfor-mance of strengthened specimens. The hysteretic loops at peak and ultimate stages for both the strengthenedspecimens were well fanned out, showing better energy dissipation, ductility and gradual stiffness degradationafter yielding. This was largely because of redistribution of stresses to less stressed parts via the steel/CFRPstrips.
9.3 Energy Dissipation
The area enclosed by the hysteretic loop represents the energy dissipated by the specimen. The cumulativeenergy dissipation of the specimens can be calculated by summing the energy dissipated during each loadingcycle. The energy dissipated by the specimens mainly depends upon the friction along joints and existingcracks, widening of cracks and formation of new cracks, crushing of bricks, rocking and toe crushing. Instrengthened specimens, the energy was primarily dissipated through cracking of masonry and not throughdeformation of CFRP/steel strips. Figure 16 shows the cumulative energy dissipation for all cycles. The energydissipation of reference specimen REFE1 was the least due to its sudden strength degradation. The energydissipation of specimen UPD-DG was the highest due to crack widening and better ductile behavior. Thecomparatively lower value of energy dissipation for the CFRP strengthened specimen UPD-F-DG was dueto rapid strength degradation. Figure 17 shows the energy dissipated in each cycle for all the specimens. Theenergy dissipation per cycle was the highest for specimen UPD-DG and the lowest for the reference specimen.Moreover, a total of seven further specimens were strengthened/retrofitted with steel strips and their energydissipations ranged from 17 to 34 kJ which was quite high as compared to the CFRP strengthened masonryspecimens.
123
Author's personal copy

Arab J Sci Eng
0
3
6
9
12
15
18
0 4 8 12 16 20 24
CyclesC
omul
ativ
e en
ergy
(kJ
)
REFE1
UPD-F-DG
UPD-DG
Fig. 16 Cumulative energy dissipation in all cycles
0
0.5
1
1.5
2
2.5
0 4 8 12 16 20 24
Cycles
Ene
rgy
per
cycl
e (k
J)
REFE1
UPD-F-DG
UPD-DG
Fig. 17 Comparison of energy dissipation per cycle
2.03
4
5.33
0
1
2
3
4
5
6
Wall specimen
Duc
tility
fac
tor
REFE1
UPD-F-DGUPD-DG
1.97 2.631.0
Fig. 18 Ductility factor for all specimens
9.4 Ductility Factor
Ductility is an important factor for any structural system to achieve the required performance in a seismic pronearea. The yield and ultimate lateral displacements were determined using a method proposed by Muguruma[17]. With the help of these displacements, ductility values were calculated for all the specimens and comparedin Fig. 18. The failure mode had a significant effect on the ductility. In rocking failure, a lower ductility wascalculated because of higher yielding displacement and less cracking. The ductility for specimen UPD-DGwas higher than the CFRP strengthened specimen due to its cracking mode of failure and early yielding. Theductility factors of specimens UPD-F-DG and UPD-DG were 1.97 and 2.63 times higher, respectively, than thereference specimen REFE1. A ductility factor of 2.03 was achieved for the reference specimen. The ductilityfactor for other steel strengthened walls ranged from 5.50 to 5.70 and for steel retrofitted walls it ranged from4.50 to 6.0.
123
Author's personal copy

Arab J Sci Eng
Fig. 19 Method for determination of damping factor (ElGawady et al. [18])
9.5 Damping Factor
An approximate value of the equivalent viscous damping of specimens was also obtained by using Eq. (2)which was previously used by El Gawady [18]:
ζ = 1/2π(A1/A2) (2)
where A1 = energy dissipated in a cycle (i.e., area inside the loop) and A2 = strain energy measured at the peakforce of the same cycle (sum of hatched area), i.e., the sum of the hatched triangular areas. Figure 19 showsthe method for calculating the equivalent viscous damping of all three specimens as a function of area of thelateral load-displacement curve. An approximate value of the equivalent viscous damping of the specimenswas obtained by using a model as discussed earlier. A damping value of 7–10% is quite reasonable for designof un-reinforced masonry. The damping factor value for reference specimen REFE1 was quite high (32%) dueto severe diagonal cracking as shown in Fig. 20. ElGawady had also quoted a 30% damping factor for a URMwall. The maximum damping values of 22 and 31% were recorded for specimens UPD-F-DG and UPD-DG,respectively. The lower value for specimen UPD-F-DG was primarily because of its rocking mode of failureand lesser ductility factor. The specimen UPD-DG showed a very high damping factor associated with higherductility, cracking mode of failure, higher residual displacement and early cracking.
9.6 Stiffness Degradation
The equivalent elastic-perfectly plastic model proposed by Muguruma was used to determine yield, peak andultimate load stages from the load-displacement curve. Stiffness degradation ratio (Ck) is the rate of stiffnessreduction beyond yield, and is defined as the ratio of secant modulus at specified displacement (K ) to thesecant modulus at yield (Ko), as shown in Eq. (3).
Ck = K/K o (3)
Ko is the slope of the line passing through the origin and yield point. Kp and Ku were calculated by determiningthe slopes of lines passing through the origin and the peak and ultimate points, respectively. Ck values at peakand ultimate were calculated. Stiffness degradation ratio (Ck) was determined for each specimen separatelyand plotted as shown in Fig. 21. For the reference specimen REFE1, the stiffness degradation ratio was thehighest, as expected (64.28%). A value of 53.50% was determined for specimen UPD-F-DG. The stiffnessdegradation ratio for specimen UPD-DG was the lowest; a value of 35% was achieved. At the ultimate stage,a similar trend of stiffness degradation was recorded for all the specimens. The lower value for specimenUPD-DG reflects its better performance.
9.7 Behavior of Walls at Failure
The uplift of wall at base of all the specimens is shown in Fig. 22. As the specimen UPD-F-DG experiencedrocking failure, its base uplift was the largest (up to 9.9 mm), with much smaller lateral drift at the wall top. For
123
Author's personal copy

Arab J Sci Eng
0
0.1
0.2
0.3
0.4
0.5
0 4 8 12 16 20 24
CyclesD
ampi
ng f
acto
r
REFE1 UPD-F-DG UPD-DG
Fig. 20 Damping factor for all specimens
64.28
53.81
35.11
44.93
23.92
17.21
0
20
40
60
80
Stif
fnes
s de
grad
atio
n ra
tio (
Ck)
REFE1
UPD-F-DG
UPD-DG
Peak Ultimate
Fig. 21 Comparison of stiffness degradation ratios
0.35
9.89876
0.29440
3
6
9
12
15
Wall specimenn
Wal
l upl
ift a
t bas
e (m
m) REFE1
UPD-F-DG
UPD-DG
Rocking failure
Shear failure Shear failure
Fig. 22 Maximum base uplift
specimen UPD-DG, the base uplift was quite negligible due to its pure cracking mode of failure with higherlateral drift. Reference specimen REFE1 experienced brittle shear failure and a base uplift value of 0.35 mmwas recorded for this specimen.
10 Prediction of Lateral Strength
The shear strength of URM is calculated as per Eq. (4) proposed by Comite Euro-International du BetonEurocode [19]. The E-value calculated for the specimen was 5,100 MPa and the G-value was half the E-valuei.e. 2,550 MPa.
43Vm = Ltτu (4)
123
Author's personal copy

Arab J Sci Eng
Table 2 Comparison of shear strength of wall panels
Specimens Shear strength (kN)
Experimental NZS 4230:1990 Eurocode Triantafillou
REFE1 88.9 – 82.6 –UPD-F-DG 160 – – 179UPD-DG 140 136 –
where L = length of masonry wall; t = thickness of masonry wall; and τu masonry shear stress is calculated asper Eq. (5).
τu = minimum of {c + 0.4σ or 0.0306 fb + 0.126σ } (5)
where c = 0.20 MPa for mortar types M2.5–M9; σ = N/Lt; and fb = normalized compressive strength ofbrick units. The experimental value of lateral resistance of reference specimen REFE1 was 88.90 kN and thepredicted value was 82.60 kN which was in good agreement with experimental value.
The shear capacity of the steel strengthened specimen UPD-DG was validated using Equation 6, as pro-posed by NZS 4230:1990 [20]. The equation includes only two terms, which are contributions from masonryand horizontal reinforcement towards the shear strength of the masonry wall. The experimental value of lateralresistance of specimen UPD-DG was 140 kN and the calculated value using this equation was 136 kN with avariation of 2.80% as shown in Table 2.
V n = νmbwd + Ah fyh(d/
sh) (6)
where vm = is greater of 0.30 MPa or 0.3(0.1 fm + σn) and 0.3(0.1 f ′m + σn) should not exceed 2.4 MPa with
f ′m not to be taken greater than 16 MPa.
The lateral strength of UPD-F-DG was calculated using Eq. (7), proposed by Triantafillou [21]. In theequation, Fm is the shear strength of the URM wall according to existing codes and FF R P is the contributionof CFRP to the shear strength of the wall. Fm was calculated using the equation proposed by Comite Euro-International du Béton Eurocode 1999 as described above. According to the AC125 model (ICBO EvaluationService, Inc. 2001) [22], FF R P can be calculated as per Eq. (8):
F = Fm + FF R P (7)
FF R P = 0.75 ρh f j t L (8)
f j = 0.004 EF R P ≤ 0.75 fF R P.u
where ρh is the reinforcement ratio of FRP in the horizontal direction; f j the axial force in FRP; EF R P modulusof elasticity of FRP; and fF R P.u the ultimate tensile strength of FRP. The calculated strength was 179.30 kNand the experimental value was 160 kN. The difference in values was 11%, so the agreement was reasonable.
11 Conclusions
1. Use of CFRP and steel in masonry wall strengthening has improved the lateral load capacity by factors of2.14 and 1.57, respectively, whereas the lateral displacements at failure were 4.28 and 3.40 times higherthan that of the reference wall, respectively. The performance of specimen UPD-DG is significantly betterthan specimen UPD-F-DG, despite the latter specimen showing higher lateral resistance. In addition, boththe cracking load and pattern are effectively controlled. The cost of CFRP strengthening is much higherthan steel.
2. The energy dissipation of the strengthened specimens ranged from 14 to 16 kJ. However, most of this energywas dissipated due to crushing and deformations in the masonry rather than deformations in the steel/CFRPstrips. The strains in CFRP/strips were within the elastic limit and no yielding was recorded.
3. The displacement ductility of the CFRP and steel strengthened walls increased significantly by factors of1.97 and 2.67, respectively, because of the improvement in seismic behavior.
123
Author's personal copy

Arab J Sci Eng
4. The failure mode also played an important role in seismic behavior of masonry. By controlling the fail-ure mode, the desired seismic behavior can be achieved. Ductile shear failure is more desirable mode ascompared to rocking failure.
Acknowledgments The authors would like to thank Dr. Wajahat Mirza, SIKA (PVT) Limited, HEC Pakistan, and UET Lahore,for providing assistance to complete this research work.
References
1. Tinazzi, D.; Modena, C.; Nanni, A.: Strengthening of masonry assemblages with CFRP rods and laminates. In: ProceedingsInternational Meeting on Composite Materials, PLAST 2000, Advancing with Composites, Crivelli-Visconti, ed., Milan,Italy, 411–418 (2000)
2. Tumialan, G.; Huang, P.-C.; Nanni, A.; Silva, P.: Strengthening of masonry walls by CFRP structural repointing. In: Proc., 5thInt. Conf. on Fibre Reinforced Plastics for Reinforced Concrete Structures. Thomas Telford, Cambridge, UK, pp. 1033–1042(2001)
3. ElGawady, M.A.; Lestuzzi, P.; Badoux, M.: In-plane seismic response of unreinforced masonry walls upgraded with fiberreinforced polymer. J. Comp. Constr., ASCE. 9(6), (2005)
4. ElGawady, M.A.; Lestuzzi, P.; Badoux, M.: Static cyclic response of masonry walls retrofitted with fiber reinforced polymer.J. Comp. Constr., ASCE. 10(1), (2006)
5. ElGawady, M.A.; Lestuzzi, P.; Badoux, M.: Analytical model for the in-plane shear behavior of URM walls retrofitted withCFRP. J. Comp. Sci. Technol. 66, 459–474 (2006)
6. Montes, P.; Fernandez, A.: Behaviour of a hemispherical dome subjected to wind loading. J. Wind Eng. Ind. Aerodyn. 89,911–924 (2001)
7. Abrams, D.P.; Lynch, J.M.: Flexural behavior of retrofitted masonry piers. Korea Earthquake Engineering Research Center(KEERC)—Mid America Earthquake center (MAE) Joint Sem on Risk Mitigation for Regions of Moderate Seismicity,Illinois (2001)
8. Rosenboom, O.; Kowalsky, M.: Investigation of alternative details for seismic design of post tensioned clay masonry walls.In: 9th NAMC, USA, 475–485 (2003)
9. Plecnik, J.; Cousins, T.; O’conner, E.: Strengthening of unreinforced masonry buildings. J. Struc. Eng., ASCE 112, 1070–1087 (1986)
10. Schultz, A.; Bean, J.; Stolarski, H.: Resistance of slender post-tensioned masonry walls with unbonded tendons to transversalloading. In: 9th NAMC, South Carolina, USA, pp. 463–473 (2003)
11. Farooq, S.H.; Ilyas, M.; Ghaffar, A.: “Technique for strengthening of Masonry wall panels using Steel Strips”. Asian Journalof Civil Engineering (Building and Housing) 7(6), 621–638 (2006)
12. Farooq, S.H.; Ilyas, M.; Ghaffar, A.: Effect of horizontal reinforcement in strengthening of masonry members. Mehran Univ.Res. J. Eng. Tecnnol. 27 (1), 49–62 (2008)
13. Ilyas, M.; Farooq, S.H.; Qazi, A. U.; Umair: Confinement of masonry using steel strips. Pakistan J. Eng. Appl. Sci., UETLahore, 5, 1–9 (2009)(July Edition)
14. Haider, W.; Dhanasekar, M.: Experimental study of monotonically loaded wide spaced reinforced masonry shear walls.Aust. J. Struct. Eng. 5(2), 101–118 (2004)
15. Voon, K.C.; Ingham, J.M.: Experimental in-plane shear strength investigation of reinforced concrete masonry walls. J. Struct.Eng., ASCE, 400–408 (2006)
16. Rosenboom, O.; Mervyn, J.K.: Reversed in-plane cyclic behaviour of posttensioned clay brick masonry walls. J. Struct.Eng., ASCE, May, 2004 (2004)
17. Muguruma, H.; Nishiyrama, H.; M.; Watanabe, F.; Tnaka, H.: Ductile behavior of high strength concrete columns confinedby high strength transverse steel. In; ACI Special Publication: Evaluation and Rehabilitation of Concrete Structures andInnovation in Design vol. 128-54(88-AB) (1991)
18. ElGawady, M.A.; Lestuzzi, P.; Badoux, M.: Static cyclic response of masonry walls retrofitted with fiber reinforced polymer.J. Comp. Constr., ASCE. 10(1), (2007)
19. Eurocode 6: Design of masonry structures. Comite Euro-International du Béton, Lausanne, Switzerland (1999)20. NZS 4230: Code of practice for the design of masonry structures. Standards Association of New Zealand, Wellington (1990)21. Triantafillou, T.C.: Strengthening of masonry structures using epoxy-bonded FRP laminates. J. Compos. Constr. 2, 96–104
(1998)22. Applied Technology Council (ATC): Prestandard and commentary for the seismic rehabilitation of buildings. Publication,
No. 356, Federal Emergency Management Agency, Washington, DC (2000)
123
Author's personal copy