Strength Reduction Factor for Flexural RC Members Strengthened with Near-Surface-Mounted Bars

Materials Science and Engineering A 380 (2004) 9–19
Plastic deformation of Fe–Al polycrystals strengthened withZr-containing Laves phases
I. Microstructure of undeformed materials
A. Wasilkowskaa,1, M. Bartscha, F. Steinb, M. Palmb, K. Sztwiertniac,G. Sauthoffb, U. Messerschmidta,∗
a Max-Planck-Institut für Mikrostrukturphysik, Weinberg 2, D-06120 Halle (Saale), Germanyb Max-Planck-Institut für Eisenforschung, Max-Planck-Str. 1, D-40074 Düsseldorf, Germany
c Institute of Metallurgy and Materials Science, Polish Academy of Sciences, ul. Reymonta 25, PL-30059 Krakow, Poland
Received 22 August 2003; received in revised form 21 January 2004
Abstract
The microstructures of several Fe-rich Fe–Al–Zr alloys have been studied as a basis of investigating the mechanical behaviour, which issubject of Part II. The alloys with only low Zr contents show microstructures with a relatively soft matrix and a hard skeleton along the grainboundaries, the latter being residual eutectics containing the matrix phase and the Zr(Fe,Al)2 Laves phase. Scanning electron microscopy,orientation imaging microscopy as well as transmission electron microscopy and diffraction are used to study the grain sizes, the orientationrelationships between the grains and the phases and the crystallography of the Laves phase. With higher Zr contents above about 10 at.%, thematrix is formed by the Zr(Fe,Al)2 Laves phase.© 2004 Elsevier B.V. All rights reserved.
Keywords: Fe–Al–Zr alloys; Intermetallics; Microstructure; Laves phase; Crystallography
1. Introduction
Fe–Al based alloys are of interest as materials for struc-tural applications due to their outstanding oxidation resis-tance, good mechanical strength and relatively low weight(density of 5.76–6.32 g cm−3) [1]. �-Fe dissolves up to52 at.% Al, which gives rise to various states of atomic orderin the bcc lattice with concentration-dependent transforma-tion temperatures[2]. Alloys with an Al content between 40and 50 at.% show the B2 lattice symmetry of FeAl at tem-peratures up to the melting point, whereas the D03 structureof the alloys with about 25 at.% is stable only at lowertemperatures and transforms to the B2 structure at about550◦C. At temperatures below 550◦C, alloys with about20–23 at.% Al are two-phase materials with the disordered
∗ Corresponding author. Tel.:+49-345-5582-927;fax: +49-345-5511223.
E-mail address: [email protected] (U. Messerschmidt).1 Present address: TU München, Lehrstuhl für Materialwissenschaft
und Mechanik, Boltzmannstr. 15, D-85748 Garching, Germany
�-Fe(Al) phase (A2 structure) and the D03 Fe3Al phase[1].The wide off-stoichiometric solubility range of B2 Fe–Alleads to only partial atomic order with constitutional defects.
The Al content and especially the lattice order have apronounced influence on the room temperature mechanicalproperties of the iron aluminides Fe3Al and FeAl [3,4].Strong effects of the microstructure were observed in cast orpowder metallurgically processed alloys[5]. For the devel-opment of Fe-rich aluminide base alloys, strengthening bysecond phases, i.e. carbides, nitrides, oxides and intermetal-lic phases, is attractive[5–8]. Studies on similar ternarysystems show that alloying with Laves phase-forming el-ements has a very strong hardening effect[9,10]. In par-ticular, NiAl with the ordered cubic B2 structure can bealloyed with Nb or Ta to produce two-phase alloys withstrengthening precipitate particles and grain boundary lay-ers containing the ternary phases Nb(Ni,Al)2 or Ta(Ni,Al)2.In close analogy, addition of Zr to Fe–Al alloys leads toZr(Fe,Al)2 Laves phase-strengthened iron aluminides viaconventional ingot metallurgy methods[11]. The phase re-lations and equilibria in the Fe–Zr and Fe–Al–Zr systems
0921-5093/$ – see front matter © 2004 Elsevier B.V. All rights reserved.doi:10.1016/j.msea.2004.04.005

10 A. Wasilkowska et al. / Materials Science and Engineering A 380 (2004) 9–19
have been studied recently, and isothermal sections ofthe Fe–Al–Zr phase diagram have been newly established[11–13]. It is known that small additions of Zr to disorderedFe–Al alloys with low Al contents improve the oxide scaleadherence and thereby the oxidation resistance at elevatedtemperatures[14], whereas controversial effects have beenreported for the iron aluminides with higher Al contents[15,16].
A first survey of the mechanical properties of Laves phasestrengthened alloys of the Fe–Al–Zr system has been givenin [13]. The present work aims at a more detailed study of themechanical behaviour of Fe–Al–Zr alloys with a strength-ening Laves phase, including the strain rate sensitivity ofthe flow stress and the microstructure of deformed samplesof selected materials of this system. First results were pre-sented in[17]. In Part I of this paper, scanning electron mi-croscopy (SEM), orientation imaging microscopy (OIM) andhigh-voltage transmission electron microscopy (HVTEM)have been employed to examine the microstructure of sev-eral materials of the Fe–Al–Zr alloy system. The mechani-cal properties of selected materials are described in Part II[18].
2. Experimental
2.1. Preparation of alloys
The alloys investigated in this study were prepared byvacuum induction melting using high-purity starting mate-rials [11–13]. Their compositions are marked inFig. 1, anisothermal section of the phase diagram[13]. Pure Fe, Al andZr were molten under argon at 700 mbar in a ZrO2 crucibleand cast into a cold Cu mould. The shape of the ingots wascylindrical, with diameters of 10–25 mm and a maximumlength of 200 mm. Specimens were sealed in quartz tubesfilled with argon, annealed and subsequently quenched inNaCl brine. The annealing conditions were 500 h at 800◦Cor 100 h at 1150◦C.
Fig. 1. Provisional isothermal Fe–ZrFe2–ZrAl2–Al phase diagram section at 800◦C after [11–13]. Alloys of the present study are marked by full circles(compositions are always given in at.%).
2.2. Characterization of the microstructureand the crystal structure
Conventional methods of surface preparation includingpolishing were applied for metallographic studies of the mi-crostructure. Samples were investigated in an SEM equippedwith a commercial energy-dispersive X-ray analysis system(EDX). Images were taken with a two-sector detector forback-scattered electrons with signal addition (compositionmode). The volume fraction f of the phases and the surfacearea of phase boundaries per unit volume S were determinedby superimposing a square grid onto the SEM micrographswith high magnification and counting the numberPP of in-tersection points of the lines of the grid that lie in the phaseof interest per total number of intersection points of the gridand the numberPL of intersections of grid lines with phaseboundaries per unit line length. According to standard stere-ological relations[19], f = PP and S = 2PL. The grainsize of the matrix phase was determined on SEM or orien-tation topography images by converting the measured grainarea to the equivalent circle diameter. Orientation imagingmicroscopy (OIM) using the electron back-scattered diffrac-tion technique was employed to characterize the orientationrelationships between the matrix grains[20]. Two rectanglesof 91×127�m2 were scanned for this study including about70 000 single orientations. A three-dimensional misorien-tation distribution function (MODF)[21] was calculatedin order to recognize the tendencies in the misorientationdensity more precisely. Morphological parameters, e.g. thegrain size, were calculated from the data with the help ofthe program CHANNEL (HKL Technology).
The electropolishing method of Schlesier et al.[7] wasapplied to prepare thin foils of sufficient quality for trans-mission electron microscopy. The specimens were investi-gated in an HVTEM with an accelerating voltage of 1 MV.For determining the crystal structure, selected area diffrac-tion patterns were examined according to conventional rulesof spot-pattern indexing using standard crystallographysoftware.

A. Wasilkowska et al. / Materials Science and Engineering A 380 (2004) 9–19 11
3. Experimental results
3.1. Scanning electron microscopy
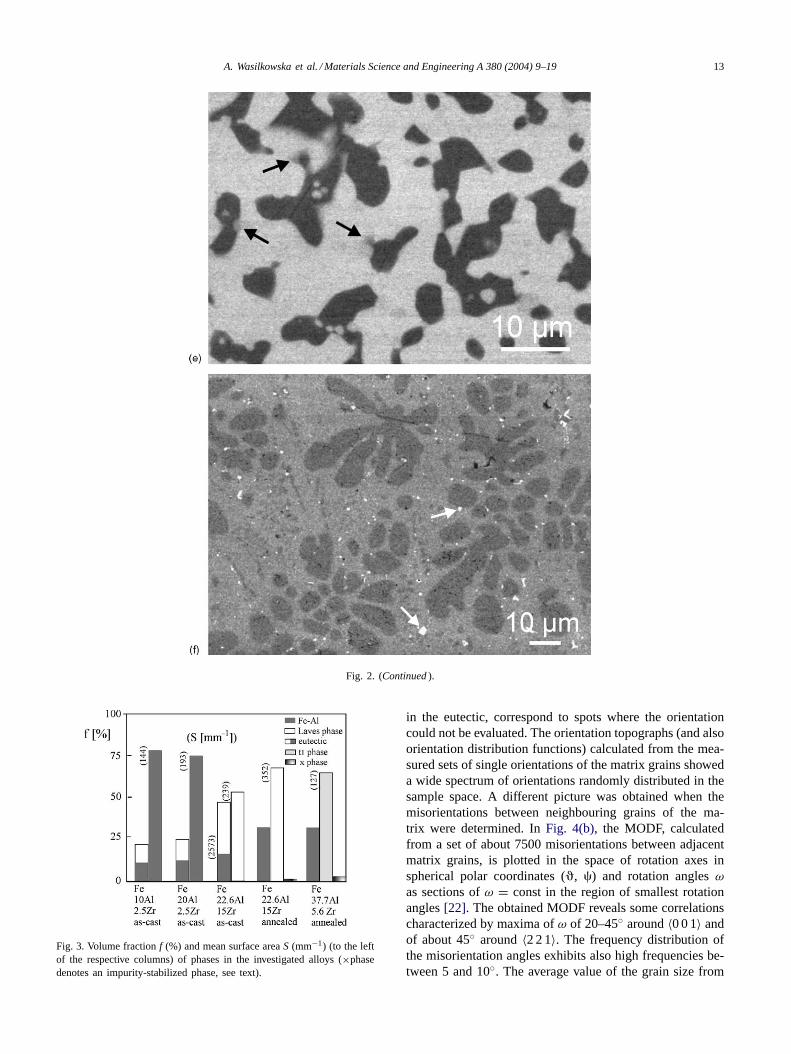
Fig. 2 shows the SEM images of the microstructure ofsome of the alloys marked inFig. 1, imaged in the compo-sition mode. Zr is practically not soluble in Fe–Al accord-ing to electron microprobe analysis of selected specimens[11–13]so that second phases precipitate. The matrix grainsare equiaxed. Addition of less than 10 at.% Zr causes theformation of a primary Fe–Al phase with a residual eutec-tic, as shown inFig. 2(a) and (b). The bright areas corre-spond to the Zr-rich phase in the eutectic, the latter beingdistributed along the grain boundaries of the Fe–Al matrix
Fig. 2. Microstructure of selected alloys imaged in the SEM composition mode. (a) Fe-10Al-2.5Zr as-cast. (b) Fe-20Al-2.5Zr as-cast. (c) Fe-22.6Al-15Zras-cast. (d) Fe-22.6Al-15Zr as-cast, structure at high magnification. (e) Fe-22.6Al-15Zr after heat treatment at 1150◦C for 100 h. (f) Fe-37.7Al-5.6Zrafter heat treatment at 800◦C for 500 h (the phases corresponding to the different contrasts are described in the text; arrows inFig. 2(e) and (f)mark athird phase).
as a hard skeleton. According to the ternary phase diagramin Fig. 1, the eutectic is composed of the Zr(Fe,Al)2 Lavesphase and�-Fe(Al). Addition of more than 10 at.% Zr re-sults in the formation of a primary Laves phase again witha residual eutectic. The microstructure of Fe-22.6Al-15Zr(numbers indicate at.%) inFig. 2(c) contains almost equalamounts of the Laves phase and the eutectic. Bright re-gions correspond to the Laves phase Zr(Fe,Al)2. Micro-graphs with a high magnification were used in order toevaluate the volume fractions in the eutectic, as shown inFig. 2(d).
Annealing leads to substantial changes of the phase mor-phology. The heat-treated alloy Fe-22.6Al-15Zr inFig. 2(e)contains a bright Laves phase matrix and homogeneous dark

12 A. Wasilkowska et al. / Materials Science and Engineering A 380 (2004) 9–19
Fig. 2. (Continued ).
regions of Fe–Al as well as a minor fraction of inclusions ofa third phase (gray particles with arrows). This third phasewas also detected in Fe-37.7Al-5.6Zr annealed at 800◦C(Fig. 2(f)) where it appeared as bright particles (arrows) ofabout 0.5�m in size (its volume fraction does not exceed3%).
Fig. 3 shows the volume fractionsf of the alloy con-stituents represented as individual columns. In the eutectic,both phases are indicated separately. The numbers abovethe columns give the mean surface area of the constituents.For instance, in Fe-22.6Al-15Zr, the volume fractionf ofsingle Laves phase grains amounts to 53% and their spe-cific surface area isS = 239 mm−1. The remaining eutectic(47%) consists of 31 vol.% (related to the whole alloy) ofthe Laves phase and 16% Fe–Al with an internal surfacearea of 2573 mm−1.
Both alloys with 2.5 at.% Zr, i.e. Fe-10Al-2.5Zr andFe-20Al-2.5Zr, contain about 20 vol.% of the grain bound-ary eutectic. The thickness of the eutectic grain boundarylayers, which are frequently interrupted, scatters in a widerange. The grain size of the alloy with 10 at.% Al is 28�mwith a broad distribution (standard deviation, 14�m). Thealloy with 20 at.% Al has a narrower distribution (standarddeviation, 8�m) with a smaller grain size of about 20�m.
3.2. Orientation imaging microscopy
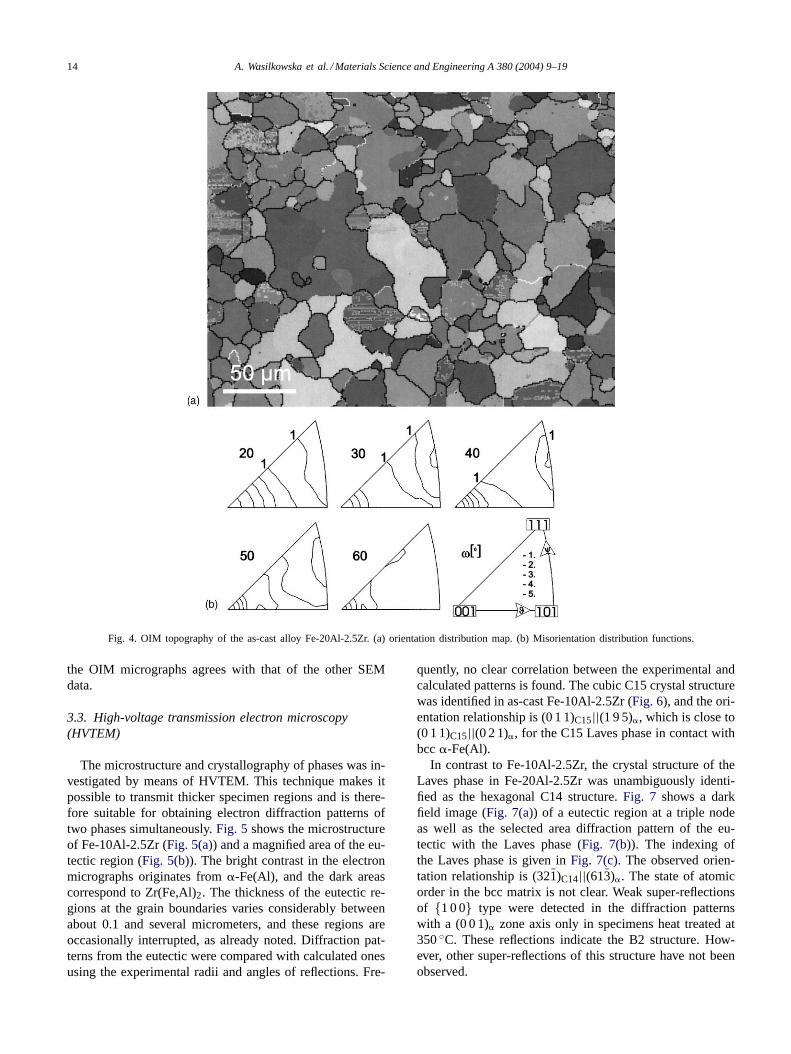
Fig. 4(a)presents an example of the orientation topogra-phy of the as-cast alloy Fe-20Al-2.5Zr. The gray scale re-presents the local grain orientations, showing rather a widespectrum of orientations in the matrix. The black dots, whichare more frequent at the phase boundaries and especially
A. Wasilkowska et al. / Materials Science and Engineering A 380 (2004) 9–19 13
Fig. 2. (Continued ).
Fig. 3. Volume fractionf (%) and mean surface areaS (mm−1) (to the leftof the respective columns) of phases in the investigated alloys (×phasedenotes an impurity-stabilized phase, see text).
in the eutectic, correspond to spots where the orientationcould not be evaluated. The orientation topographs (and alsoorientation distribution functions) calculated from the mea-sured sets of single orientations of the matrix grains showeda wide spectrum of orientations randomly distributed in thesample space. A different picture was obtained when themisorientations between neighbouring grains of the ma-trix were determined. InFig. 4(b), the MODF, calculatedfrom a set of about 7500 misorientations between adjacentmatrix grains, is plotted in the space of rotation axes inspherical polar coordinates (�, �) and rotation anglesωas sections ofω = const in the region of smallest rotationangles[22]. The obtained MODF reveals some correlationscharacterized by maxima ofω of 20–45◦ around〈0 0 1〉 andof about 45◦ around〈2 2 1〉. The frequency distribution ofthe misorientation angles exhibits also high frequencies be-tween 5 and 10◦. The average value of the grain size from
14 A. Wasilkowska et al. / Materials Science and Engineering A 380 (2004) 9–19
Fig. 4. OIM topography of the as-cast alloy Fe-20Al-2.5Zr. (a) orientation distribution map. (b) Misorientation distribution functions.
the OIM micrographs agrees with that of the other SEMdata.
3.3. High-voltage transmission electron microscopy(HVTEM)
The microstructure and crystallography of phases was in-vestigated by means of HVTEM. This technique makes itpossible to transmit thicker specimen regions and is there-fore suitable for obtaining electron diffraction patterns oftwo phases simultaneously.Fig. 5 shows the microstructureof Fe-10Al-2.5Zr (Fig. 5(a)) and a magnified area of the eu-tectic region (Fig. 5(b)). The bright contrast in the electronmicrographs originates from�-Fe(Al), and the dark areascorrespond to Zr(Fe,Al)2. The thickness of the eutectic re-gions at the grain boundaries varies considerably betweenabout 0.1 and several micrometers, and these regions areoccasionally interrupted, as already noted. Diffraction pat-terns from the eutectic were compared with calculated onesusing the experimental radii and angles of reflections. Fre-
quently, no clear correlation between the experimental andcalculated patterns is found. The cubic C15 crystal structurewas identified in as-cast Fe-10Al-2.5Zr (Fig. 6), and the ori-entation relationship is (0 1 1)C15||(1 9 5)�, which is close to(0 1 1)C15||(0 2 1)�, for the C15 Laves phase in contact withbcc�-Fe(Al).
In contrast to Fe-10Al-2.5Zr, the crystal structure of theLaves phase in Fe-20Al-2.5Zr was unambiguously identi-fied as the hexagonal C14 structure.Fig. 7 shows a darkfield image (Fig. 7(a)) of a eutectic region at a triple nodeas well as the selected area diffraction pattern of the eu-tectic with the Laves phase (Fig. 7(b)). The indexing ofthe Laves phase is given inFig. 7(c). The observed orien-tation relationship is (32̄1)C14||(613̄)�. The state of atomicorder in the bcc matrix is not clear. Weak super-reflectionsof {1 0 0} type were detected in the diffraction patternswith a (0 0 1)� zone axis only in specimens heat treated at350◦C. These reflections indicate the B2 structure. How-ever, other super-reflections of this structure have not beenobserved.

A. Wasilkowska et al. / Materials Science and Engineering A 380 (2004) 9–19 15
Fig. 5. HVTEM images of the microstructure of the as-cast alloy Fe-10Al-2.5Zr. (a) Overview. (b) Eutectic area at higher magnification.
The eutectic regions at the grain boundaries usually havea lamellar structure. The width of the Fe–Al lamellae wasmeasured on micrographs where the lamellae were imagedapproximately edge-on as inFig. 5(b). The averages of about50 Fe–Al lamellae are 0.22 and 0.16�m for Fe-10Al-2.5Zrand Fe-20Al-2.5Zr, respectively.
Fig. 8shows the microstructure of as-cast Fe-22.6Al-15Zrwith the corresponding diffraction pattern of a singleLaves phase grain. Zr(Fe,Al)2 exhibits the hexagonal C14structure.
4. Discussion
The present study shows that iron–aluminium alloys withthe addition of zirconium forming the ternary Laves phaseZr(Fe,Al)2 show a wide variety of microstructures. Both al-
loys with 2.5 at.% Zr, i.e. Fe-10Al-2.5Zr and Fe-20Al-2.5Zr,exhibit similar morphologies with small equiaxed grains.The Zr(Fe,Al)2 Laves phase precipitates in eutectic form,distributed along the grain boundaries of the Fe–Al matrix.The volume fraction of the eutectic was about 20% in bothalloys. The size of the matrix grains decreases with increas-ing Al content from about 28�m for the alloy with 10 at.%Al down to about 20�m for that with 20 at.% Al. A similargrain size dependence was reported for B2-ordered alloyscontaining 37–46 at.% Al[4]. At least some of the preferredmisorientations between adjacent Fe–Al matrix grains in thepositions of 20–45◦ around〈0 0 1〉 and of about 45◦ around〈2 2 1〉 correspond to coincidence site lattice (CSL) relationsof Σ5 = 36.90 〈1 0 0〉 andΣ29b = 46.40 〈2 2 1〉, respec-tively. The orientation relationships between the matrixgrains, which are separated by the residual eutectic, mayresult from the existence of such grain boundaries before

16 A. Wasilkowska et al. / Materials Science and Engineering A 380 (2004) 9–19
Fig. 6. Selected area diffraction pattern of eutectic region (� denotes bcc Fe(Al)).
the grain boundary skeleton was formed. Unfortunately, theorientation at the phase boundaries and especially withinthe eutectic cannot be evaluated by the OIM method be-cause of its limited spatial resolution of 1�m [20]. Studieson B2 intermetallic alloys show that lowΣ boundaries (e.g.Σ1 andΣ3) have a higher resistance to fracture[23].
The high-index orientation relations between the Fe–Alphase and the Laves phase in the grain boundary eutecticobserved by HVTEM are not a proof of the existence of co-herent phase boundaries. However, the selected area diffrac-tion aperture covers several lamellae of both phases each.The appearance of sharp diffraction spots of both phases in-dicates that nevertheless such relations exist.
For the mechanical properties, the ordering state ofthe matrix is important. In Fe-10Al-2.5Zr, the Fe–Almatrix is clearly not ordered. In Fe-20Al-2.5Zr,{1 0 0}super-reflections in the annealed specimens hint at the B2structure, which is not consistent with the phase structurein single phase Fe–Al alloys. Possibly, the ordering state isinfluenced by constraints due to the presence of the hardgrain boundary phase.
With increasing Zr content, the matrix changes fromFe–Al to the Laves phase. In Fe-22.6Al-15Zr, the hexago-nal C14 Zr(Fe,Al)2 Laves phase is present in nearly equal
amounts as matrix and eutectic precipitates. Annealing leadsto substantial changes of the phase morphology resulting ina Laves phase matrix with about 23 at.% Zr and 21.5 at.%Al and isolated Fe–Al regions with 24.5 at.% Al as wellas a minor fraction of a third phase. This third phase is awell-known, impurity-stabilized Fe–Zr phase with a cubicstructure of the Th6Mn23 type[11–13]. The major phases inthe Fe-37.7Al-5.6Zr alloy after annealing at 800◦C are thetetragonalτ1 matrix phase Zr(Fe,Al)12 with about 8 at.% Zrand 40.8 at.% Al and the FeAl dendrites with 30.8 at.% Al,according toFig. 1.
An important question is the crystallographic structureof the ternary Laves phase Zr(Fe,Al)2. The possible C14and C15 structures are closely related and differ only in theparticular stacking variants of long-period layer structures[24]. A number of diffraction patterns of Fe-10Al-2.5Zrcould not clearly be interpreted while others could be in-dexed according to the C15 structure. However, the crys-tal structure of the Laves phase in Fe-20Al-2.5Zr with itshigher Al content was clearly identified as the hexagonalC14 structure. These observations confirm the findings in[11,13].
In view of the observed microstructures, the two alloyswith 2.5 at.% Zr may be attractive as structural materials

A. Wasilkowska et al. / Materials Science and Engineering A 380 (2004) 9–19 17
Fig. 7. Microstructure of the as-cast alloy Fe-20Al-2.5Zr. (a) Dark field image of the Laves phase usingg = (1 0 3). (b) Selected area diffraction patternfrom the eutectic. (c) Computed diffraction pattern.

18 A. Wasilkowska et al. / Materials Science and Engineering A 380 (2004) 9–19
Fig. 8. Microstructure of the as-cast alloy Fe-22.6Al-15Zr. (a) Bright field image. (b) Selected area diffraction pattern from a single Zr(Fe,Al)2 grain.
for intermediate to high temperatures because of their hardgrain boundary skeleton with the strengthening Laves phase.Some mechanical properties of these alloys have alreadybeen reported in[13,17]according to which the high strengthat room temperature is retained at higher temperatures up toalmost 500◦C. This is the subject of Part II[18].
Acknowledgements
The authors thank Ursula Doß, Heike Menge, RosamundeMöhner and Christian Dietzsch (MPI-Halle) for technicalhelp as well as Dr. K. Rodak (Silesian University, Katow-ice, Poland) for his contribution to the OIM image analysis.
Financial support by the Deutsche Forschungsgemeinschaft(DFG) is gratefully acknowledged.
References
[1] N.S. Stoloff, Mater. Sci. Eng. A258 (1998) 1.[2] T.B. Massalski, J.L. Murray, L.H. Bennett, H. Baker (Eds.), Binary
Alloy Phase Diagrams, Materials Park OH, ASM, 1990, p. 147.[3] G. Sauthoff, Intermetallics, VCH Verlagsgesellschaft, Weinheim,
Germany, 1995, p. 84.[4] J. Barcik, K. Stepien, T. Prandzioch, T. Mikushewski, Inzynieria
Materialowa 4 (2001) 212.[5] K. Vedula, in: J.H. Westbrook, R.L. Fleischer (Eds.), Intermetallic
Compounds, Vol. 2. Chapter 9, John Willey & Sons, 1995, p. 199.

A. Wasilkowska et al. / Materials Science and Engineering A 380 (2004) 9–19 19
[6] D.G. Morris, Intermetallics 6 (1998) 753.[7] C. Schlesier, J.H. Schneibel, R.P. Wahi, Z. Metalkd. 88 (1997) 810.[8] D.G. Morris, S. Gunther, Mater. Sci. Eng. A208 (1996) 7.[9] G. Sauthoff, Z. Metalkd. 80 (1989) 337–344.
[10] G. Sauthoff, Intermetallics 8 (2000) 1101.[11] F. Stein, M. Palm, G. Sauthoff, In: Symposium Proceedings of
Werkstoffwoche’98, Vol. VI, Wiley-VCH, Weinheim, Germany,1998, 515.
[12] F. Stein, G. Sauthoff, M. Palm, J. Phase Equilib. 23 (6) (2002) 480–494.
[13] F. Stein, M. Palm, G. Sauthoff. Struktur und Verformungsverhal-ten von Fe-Al-Zr-Legierungen mit verstärkenden intermetallischenPhasen für Hochtemperaturanwendungen (Final Report DFG PA705/3-1), 2001, p. 15.
[14] K. Wambach, J. Peters, H.J. Grabke, Mater. Sci. Eng. 88 (1987)205–212.
[15] P.F. Tortorelli, B.A. Pint, I.G. Wright, In: Proceedings of the 11thAnnual Conference on Fossil Energy Materials, ORNL/FMP-97/7,1997, p. 235.
[16] C.H. Xu, W. Gao, H. Gong, Intermetallics 8 (7) (2000) 769–779.
[17] A. Wasilkowska, M. Bartsch, M. Palm, F. Stein, G. Sauthoff,U. Messerschmidt, In: Proceedings Conference of “20 YearsDepartment of Physical Metallurgy and Materials Technology”,March 2001, Technical University Gabrovo, Bulgaria, 2001,p. 33.
[18] A. Wasilkowska, M. Bartsch, M. Palm, F. Stein, G. Sauthoff, U.Messerschmidt, This issue.
[19] J.C. Russ, Computer-Assisted Microscopy: the Measurement andAnalysis of Images, Plenum Press, New York, 1991, p. 221.
[20] D. Katrakova, C. Maas, D. Hohnerlein, F. Mücklich, Prakt. Metallogr.35 (1998) 4.
[21] J. Pospiech, K. Sztwiertnia, F. Haessner, Textures Microstructures 6(1986) 201.
[22] K. Sztwiertnia, J. Pospiech, F. Haessner, Textures Microstructures12 (1990) 233.
[23] T. Watanabe, Materials Forum 11 (1988) 284.[24] Y. Komura, Acta Crystallogr. 15 (1962) 770.
Copyright © 2022 FDOKUMEN