Determination of the sticking probability of a Zr–V–Fe nonevaporable getter strip
7
Determination of the sticking probability of a Zr–V–Fe nonevaporable getter strip Ch. Day a Institute for Technical Physics, Forschungszentrum Karlsruhe GmbH, P.O. Box 3640, 76021 Karlsruhe, Germany X. Luo Institute for Technical Physics, Forschungszentrum Karlsruhe GmbH, P.O. Box 3640, 76021 Karlsruhe, Germany and Institute for Experimental Nuclear Physics, Karlsruhe University, P.O. Box 6980, 76128 Karlsruhe, Germany A. Conte, A. Bonucci, and P. Manini b SAES Getters SpA, Viale Italia 77, Lainate, 20020 Milan, Italy Received 6 February 2007; accepted 21 May 2007; published 25 June 2007 The Karlsruhe Tritium Neutrino experiment is an ambitious experiment to determine the electron neutrino mass with a sensitivity of 0.2 eV. To achieve this extremely high precision, stringent UHV pressures below 10 -11 mbar in two large spectrometer vessels are requested. This will be achieved by several kilometers of nonevaporable Zr–V–Fe alloy getter NEG strips type St707, manufactured by SAES Getters which are to be integrated into robust cylindrical cartridges. The knowledge of the sticking probability is essential because the interference between the strips has to be taken into account in order to optimize the interior NEG pump geometry. In this article, the authors will use the Monte Carlo simulation approach to derive the sticking probability of the St707 NEG strip from the experimental data. The derived sticking probability is 0.02904, which is about 25% higher than the value estimated by the one-dimensional approximation, used by the standard procedure of the analytical method. Based on this value, different geometrical configurations of the pump setup are discussed. It is shown that the pumping speed of the resulting NEG pump with 1 km St707 NEG strips is about 337 m 3 /s for H 2 at 15 °C. © 2007 American Vacuum Society. DOI: 10.1116/1.2748799 I. INTRODUCTION The St707 nonevaporable getter NEG strip, manufac- tured by SAES Getters in Italy, is a 3 cm wide Constantan strip coated compression bonding on both sides with a Zr–V–Fe alloy Zr 70%, V 24.6%, Fe 5.4%, containing about 20 g getter alloy per meter. It has been widely used in many vacuum applications because of its high gettering abil- ity for different gas species, high sorption capacity, and low activation temperature. 1 An example is the application to Karlsruhe Tritium Neutrino experiment KATRIN, where St707 NEG strips are integrated into robust cartridges, i.e., NEG pumps, to provide a high pumping speed for the UHV conditions of the KATRIN enormous tandem spectrometers. 2 The most important parameter to qualify the NEG strip is its gettering rate the pumping speed per unit area. To characterize this parameter, SAES Getters has built up a test facility according to the International Standard ASTM F 798-97 2002 based on the known conductance method. 3 The fundamental parameter related to the gettering rate is the sticking probability, which is the overall adsorption fraction of the incident gas flux, usually accounting for the reflection coefficient, the coefficient of the stimulated gas desorption, the sticking coefficient, and the condensation coefficient. 4 To design a new NEG pump, which is the case for the KATRIN project, 2 knowledge of the sticking probability is essential to characterize the gas-surface interaction for NEG pump ge- ometry optimization. In this article, we will use the Monte Carlo simulation to derive the sticking probability of the SAES St707 NEG strip from the experimental data. II. EXPERIMENTAL PRINCIPLE AND SETUP The experimental system is shown in Fig. 1. The orifice has a known conductance C. There are two Bayard-Alpert gauges BAGs, the first one is located upstream of the ori- fice lower right one in the photo and the second one down- stream. The flow rate Q of the test gas species can be calcu- lated from Q = C p 1 - p 2 , 1 where p 1 and p 2 are the upstream and downstream pressures, respectively. The SAES St707 NEG active on both sides is shaped into a cylinder, located inside the Pyrex bulb, and activated by external rf heating. In the short measurement time window, the system is in a quasiequilibrium state be- cause the injected molecules are totally adsorbed by the NEG strip, so that the pressure of the vacuum system is deter- mined by the following balance relation: a Electronic mail: [email protected] b Electronic mail: paolo[email protected] 824 824 J. Vac. Sci. Technol. A 25„4…, Jul/Aug 2007 0734-2101/2007/25„4…/824/7/$23.00 ©2007 American Vacuum Society
-
Upload
independent -
Category
Documents
-
view
1 -
download
0
Transcript of Determination of the sticking probability of a Zr–V–Fe nonevaporable getter strip

Determination of the sticking probability of a Zr–V–Fe nonevaporable getterstrip
Ch. Daya�
Institute for Technical Physics, Forschungszentrum Karlsruhe GmbH, P.O. Box 3640, 76021 Karlsruhe,Germany
X. LuoInstitute for Technical Physics, Forschungszentrum Karlsruhe GmbH, P.O. Box 3640, 76021 Karlsruhe,Germany and Institute for Experimental Nuclear Physics, Karlsruhe University, P.O. Box 6980,76128 Karlsruhe, Germany
A. Conte, A. Bonucci, and P. Maninib�
SAES Getters SpA, Viale Italia 77, Lainate, 20020 Milan, Italy
�Received 6 February 2007; accepted 21 May 2007; published 25 June 2007�
The Karlsruhe Tritium Neutrino experiment is an ambitious experiment to determine the electronneutrino mass with a sensitivity of 0.2 eV. To achieve this extremely high precision, stringent UHVpressures below 10−11 mbar in two large spectrometer vessels are requested. This will be achievedby several kilometers of nonevaporable Zr–V–Fe alloy getter �NEG� strips �type St707,manufactured by SAES Getters� which are to be integrated into robust cylindrical cartridges.The knowledge of the sticking probability is essential because the interference between the stripshas to be taken into account in order to optimize the interior NEG pump geometry. In this article,the authors will use the Monte Carlo simulation approach to derive the sticking probability of theSt707 NEG strip from the experimental data. The derived sticking probability is 0.0290�4�, whichis about 25% higher than the value estimated by the one-dimensional approximation, used by thestandard procedure of the analytical method. Based on this value, different geometricalconfigurations of the pump setup are discussed. It is shown that the pumping speed of the resultingNEG pump with 1 km St707 NEG strips is about 337 m3/s for H2 at 15 °C. © 2007 American
Vacuum Society. �DOI: 10.1116/1.2748799�I. INTRODUCTION
The St707 nonevaporable getter �NEG� strip, manufac-tured by SAES Getters in Italy, is a 3 cm wide Constantanstrip coated �compression bonding� on both sides with aZr–V–Fe alloy �Zr 70%, V 24.6%, Fe 5.4%�, containingabout 20 g getter alloy per meter. It has been widely used inmany vacuum applications because of its high gettering abil-ity for different gas species, high sorption capacity, and lowactivation temperature.1 An example is the application toKarlsruhe Tritium Neutrino experiment �KATRIN�, whereSt707 NEG strips are integrated into robust cartridges, i.e.,NEG pumps, to provide a high pumping speed for the UHVconditions of the KATRIN enormous tandem spectrometers.2
The most important parameter to qualify the NEG strip isits gettering rate �the pumping speed per unit area�.To characterize this parameter, SAES Getters has built up atest facility according to the International Standard ASTM F798-97 �2002� based on the known conductance method.3
The fundamental parameter related to the gettering rate is thesticking probability, which is the overall adsorption fractionof the incident gas flux, usually accounting for the reflectioncoefficient, the coefficient of the stimulated gas desorption,the sticking coefficient, and the condensation coefficient.4 To
a�Electronic mail: [email protected]�
Electronic mail: paolo�[email protected]824 J. Vac. Sci. Technol. A 25„4…, Jul/Aug 2007 0734-2101/2007
design a new NEG pump, which is the case for the KATRINproject,2 knowledge of the sticking probability is essential tocharacterize the gas-surface interaction for NEG pump ge-ometry optimization. In this article, we will use the MonteCarlo simulation to derive the sticking probability of theSAES St707 NEG strip from the experimental data.
II. EXPERIMENTAL PRINCIPLE AND SETUP
The experimental system is shown in Fig. 1. The orificehas a known conductance C. There are two Bayard-Alpertgauges �BAGs�, the first one is located upstream of the ori-fice �lower right one in the photo� and the second one down-stream. The flow rate Q of the test gas species can be calcu-lated from
Q = C�p1 − p2� , �1�
where p1 and p2 are the upstream and downstream pressures,respectively. The SAES St707 NEG �active on both sides� isshaped into a cylinder, located inside the Pyrex bulb, andactivated by external rf heating. In the short measurementtime window, the system is in a quasiequilibrium state be-cause the injected molecules are totally adsorbed by the NEGstrip, so that the pressure of the vacuum system is deter-
mined by the following balance relation:824/25„4…/824/7/$23.00 ©2007 American Vacuum Society

825 Day et al.: Determination of the sticking probability 825
Q = pS , �2�
where S is the total pumping speed provided by the NEGstrip. This equation is yielding the pumping speed S of theNEG strip. This is a punctual approximation that reduces thesample and manifold volume to an element without spatialpressure variation into the space, connected by a conduc-tance.
However, the principle question to be solved is as follows:How can the sticking probability � be obtained? Under idealisotropic conditions, it can be derived from S by
S = 14 �v��A , �3�
with �v� being the thermal velocity of the test gas moleculesand A the area of the NEG strip. Obviously, ideal isotropicconditions are not fulfilled by our system because there is adirectional flow. Consequently, the punctual approximationgenerally underestimates the actual getter speed, being thepressure over the getter always lower than the measuredvalue. This means that the pressure p in Eq. �2� is differentfrom p2 and is in principle unknown because the location ofthe NEG strip differs from that of the second Bayard-Alpertgauge. The aim of the Monte Carlo simulation is to solve thatproblem and establish a relation for our specified test setupand getter strip’s geometry. Then, useful information on thesticking probability of the getter strip can be extracted fromthe experimental data.
III. EXPERIMENTAL RESULTS
The tests were made with a special sample ST707/CTAM/30D for KATRIN after 24 h of activation at 350 °C. Thisactivation cycle is different from the standard activation re-quirements �45 min at 450 °C�. It is chosen because the
FIG. 1. Experimental setup and flow scheme. The second pressure
maximum temperature of the KATRIN heating system is
JVST A - Vacuum, Surfaces, and Films
limited and full pumping speed can be achieved after thisKATRIN relevant activation cycle.5 The sample is shapedinto a cylinder of 19.4 mm in diameter and 16 mm in heightand has an area of 19.5 cm2. The test gas was H2 at 25 °C;the calibrated conductance of the orifice is 40 cm3/s for H2
referring to conditions 1 atm and 15 °C. The temperaturedifference was taken into the account in evaluation. Beforeinitiating the pumping test, the system has been carefullypreconditioned. After p2 had been stably adjusted to the de-sired value, the test gas was injected into the setup and NEGpumping started. The two BAG pressure gauges �Granville-Phillips Stabil-Ion Vacuum Gauge� were well calibrated forhydrogen, showing a correction factor of 2.24 for p2 and 2.13for p1, respectively. Table I lists the experimental results.
The pressure values were used to calculate the sorbedquantity �product of flow rate Eq. �1� and experimental time�and to extract the pumping speed �Eq. �2�, note that p wastaken as p2�, which is shown in Fig. 2. One can see that thepumping speed obtained here is very close to the one givenin the St707 technical specification.6 This also means that thefull pumping speed had been achieved.
If we continue to use Eq. �3� to estimate the stickingprobability, we obtain the values listed in Table I. In the nextsection, it will be quantitatively discussed �by Monte Carlosimulation� in which regions of the test setup there result toan isotropic situation and in which this assumption does nothold. Furthermore, the pressure at the NEG strip differs fromp2 and the error introduced by the simplification of Eq. �3� isquantified.
IV. SIMULATION MODEL AND RESULTS
The Monte Carlo simulation is made using a recently de-7
e �BAG2� is attached to the flange opposite to the view window.
gaugveloped FORTRAN program. This program has been cross-
826 Day et al.: Determination of the sticking probability 826
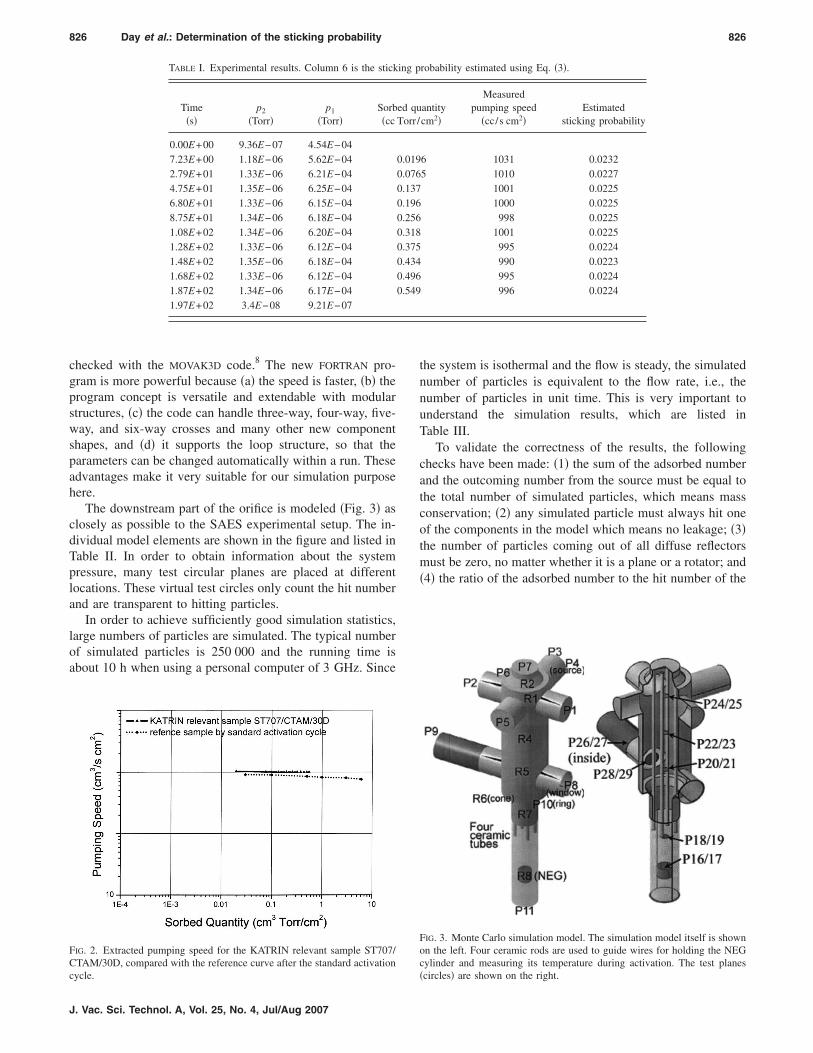
checked with the MOVAK3D code.8 The new FORTRAN pro-gram is more powerful because �a� the speed is faster, �b� theprogram concept is versatile and extendable with modularstructures, �c� the code can handle three-way, four-way, five-way, and six-way crosses and many other new componentshapes, and �d� it supports the loop structure, so that theparameters can be changed automatically within a run. Theseadvantages make it very suitable for our simulation purposehere.
The downstream part of the orifice is modeled �Fig. 3� asclosely as possible to the SAES experimental setup. The in-dividual model elements are shown in the figure and listed inTable II. In order to obtain information about the systempressure, many test circular planes are placed at differentlocations. These virtual test circles only count the hit numberand are transparent to hitting particles.
In order to achieve sufficiently good simulation statistics,large numbers of particles are simulated. The typical numberof simulated particles is 250 000 and the running time isabout 10 h when using a personal computer of 3 GHz. Since
TABLE I. Experimental results. Column 6 is the stick
Time�s�
p2
�Torr�p1
�Torr�Sorb�cc
0.00E+00 9.36E−07 4.54E−047.23E+00 1.18E−06 5.62E−042.79E+01 1.33E−06 6.21E−044.75E+01 1.35E−06 6.25E−046.80E+01 1.33E−06 6.15E−048.75E+01 1.34E−06 6.18E−041.08E+02 1.34E−06 6.20E−041.28E+02 1.33E−06 6.12E−041.48E+02 1.35E−06 6.18E−041.68E+02 1.33E−06 6.12E−041.87E+02 1.34E−06 6.17E−041.97E+02 3.4E−08 9.21E−07
FIG. 2. Extracted pumping speed for the KATRIN relevant sample ST707/CTAM/30D, compared with the reference curve after the standard activation
cycle.J. Vac. Sci. Technol. A, Vol. 25, No. 4, Jul/Aug 2007
the system is isothermal and the flow is steady, the simulatednumber of particles is equivalent to the flow rate, i.e., thenumber of particles in unit time. This is very important tounderstand the simulation results, which are listed inTable III.
To validate the correctness of the results, the followingchecks have been made: �1� the sum of the adsorbed numberand the outcoming number from the source must be equal tothe total number of simulated particles, which means massconservation; �2� any simulated particle must always hit oneof the components in the model which means no leakage; �3�the number of particles coming out of all diffuse reflectorsmust be zero, no matter whether it is a plane or a rotator; and�4� the ratio of the adsorbed number to the hit number of the
robability estimated using Eq. �3�.
antitycm2�
Measuredpumping speed
�cc/s cm2�Estimated
sticking probability
6 1031 0.02325 1010 0.0227
1001 0.02251000 0.0225998 0.0225
1001 0.0225995 0.0224990 0.0223995 0.0224996 0.0224
FIG. 3. Monte Carlo simulation model. The simulation model itself is shownon the left. Four ceramic rods are used to guide wires for holding the NEGcylinder and measuring its temperature during activation. The test planes
ing p
ed quTorr/
0.0190.0760.1370.1960.2560.3180.3750.4340.4960.549
�circles� are shown on the right.

827 Day et al.: Determination of the sticking probability 827
getter strip �R8� must be comparable to �. The relative erroris smaller than 0.005, which means that the simulation sta-tistics are sufficient.
V. ANALYSES OF THE SIMULATION RESULTS
We define the incidence I as the number of moleculesstriking the unit surface in unit time from one direction. Asalready explained, I is simulated by the hit number on thetest circles. If the incidence from all directions �in our case,from two opposite sides� at one position is the same, then theflow is isotropic at this position. If the incidence at all posi-tions of one region is the same, then this region is in equi-librium and only under this condition holds
I = 14 �v�n , �4�
with n being the particle number density. Since the pressureresults from the particle number density via temperature Tand the Boltzmann number kB,
p = nkBT , �5�
TABLE II. Model elements used for the Monte Carlotally placed; even ones are pointing down and oddvertically placed; even ones are pointing left and odd
Name Element
R1 Six-way crossP1 Right end plane of R1P2 Left end plane of R1P3 Back ring of R1, close to the oP4 Orifice, D=0.34 mmP5 Front end plane of R1P6 Top ring of R1R2 Short cone connected to P6R3 Short cylinder connected to R2P7 Top end plane of R3R4 Connection cylinder between RR5 Four-way crossP8 Right end plane of R5P9 Left end plane of R5, where BAP10 Bottom ring of R5R6 Short cone connected to P10, re
to 35 mmR7 Long cylinder of 35 mm diameP11 Bottom plane of R7R8 NEG cylinder, both sides activeR9/R10/P12 Ceramic tube 1, outer cylinder,R11/R12/P13 Ceramic tube 2, outer cylinder,R13/R14/P14 Ceramic tube 3, outer cylinder,R15/R16/P15 Ceramic tube 4, outer cylinder,P16/17 Test planes in the middle of theP18/19 Test planes at height of 100 mmP20/21 Test planes at the center of R5,P22/23 Test planes at the center of R4,P24/25 Test planes at the center of R1,P26/27 Test planes at the place of BAGP28/29 Test planes before BAG2 and c
we have
JVST A - Vacuum, Surfaces, and Films
p =4IkBT
�v�. �6�
If the system is not isotropic, the pressure ratio of two posi-tions i and j can still be estimated by
pi
pj�
Ii
Ij. �7�
It is shown by the simulation results that the incidences inthe center of the six-way cross R1, in the center of themiddle cylinder R4, and in the center of the four-way crossR5 are almost the same. This means that this region is inequilibrium and we have an isotropic situation. The inci-dences at the position of the second gauge are reducedslightly. This reduction, however, is less than 2% for �=0.01 to �=0.035. Hence, the gauge can represent p2 in Eq.�1� and then the gas flow rate Q can be derived correctly.
From the four-way cross to the NEG strip, the incidence isreduced considerably. The reasons are the directional flow inthis region and the long distance between the second gauge
lations. Virtual planes from P16 to P25 are horizon-s pointing up. Virtual planes from P26 to P29 ares pointing right.
Type
Diffuse reflectorDiffuse reflectorDiffuse reflectorDiffuse reflectorSourceDiffuse reflectorDiffuse reflectorDiffuse reflectorDiffuse reflectorDiffuse reflector
R5 Diffuse reflectorDiffuse reflectorDiffuse reflector
s placed Diffuse reflectorDiffuse reflector
g diameter from 63 Diffuse reflector
yrex bulb Diffuse reflectorDiffuse reflectorGrey absorber
cylinder and top ring Diffuse reflectorcylinder and top ring Diffuse reflectorcylinder and top ring Diffuse reflectorcylinder and top ring Diffuse reflectorcylinder, D=10 mm Virtual planes
10 mm Virtual planes0 mm Virtual planes0 mm Virtual planes0 mm Virtual planes=20 mm Virtual planeso R5, D=20 mm Virtual planes
simuoneone
rifice
1 and
G2 i
ducin
ter, P
innerinnerinnerinnerNEG, D=D=1D=1D=12, D
lose t
and the NEG cylinder, which is about 250 mm compared to
828 Day et al.: Determination of the sticking probability 828
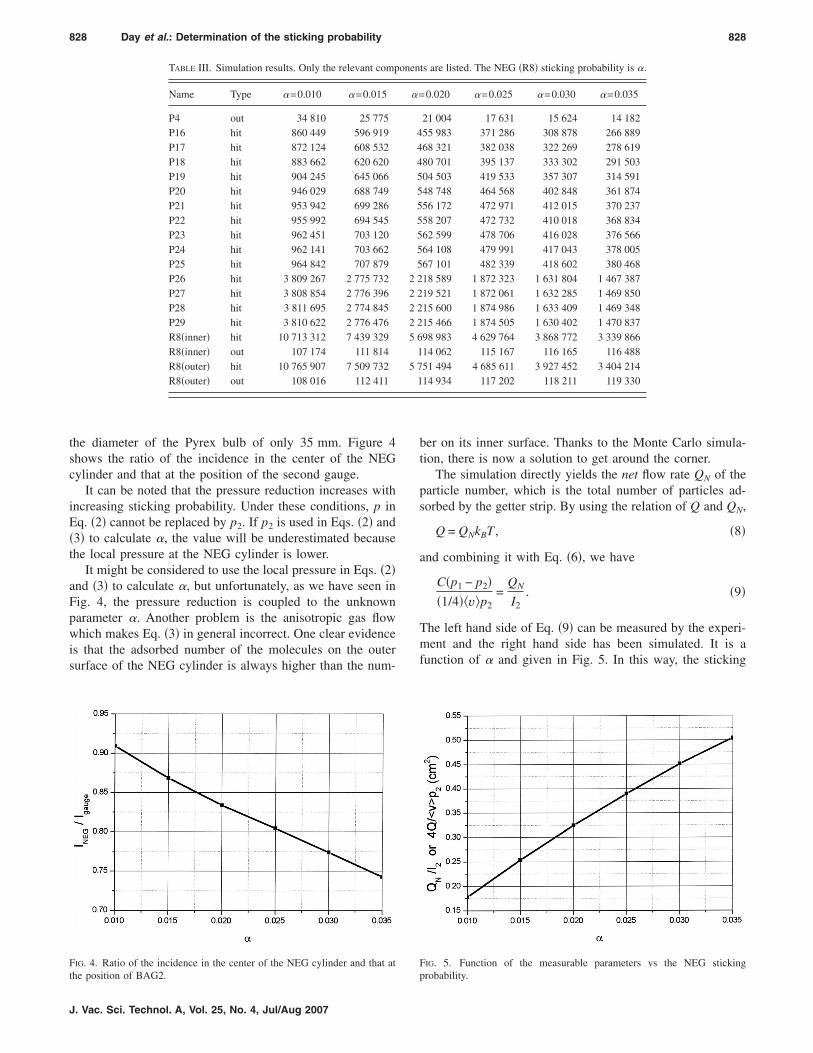
the diameter of the Pyrex bulb of only 35 mm. Figure 4shows the ratio of the incidence in the center of the NEGcylinder and that at the position of the second gauge.
It can be noted that the pressure reduction increases withincreasing sticking probability. Under these conditions, p inEq. �2� cannot be replaced by p2. If p2 is used in Eqs. �2� and�3� to calculate �, the value will be underestimated becausethe local pressure at the NEG cylinder is lower.
It might be considered to use the local pressure in Eqs. �2�and �3� to calculate �, but unfortunately, as we have seen inFig. 4, the pressure reduction is coupled to the unknownparameter �. Another problem is the anisotropic gas flowwhich makes Eq. �3� in general incorrect. One clear evidenceis that the adsorbed number of the molecules on the outersurface of the NEG cylinder is always higher than the num-
TABLE III. Simulation results. Only the relevant comp
Name Type �=0.010 �=0.015
P4 out 34 810 25 775P16 hit 860 449 596 919P17 hit 872 124 608 532P18 hit 883 662 620 620P19 hit 904 245 645 066P20 hit 946 029 688 749P21 hit 953 942 699 286P22 hit 955 992 694 545P23 hit 962 451 703 120P24 hit 962 141 703 662P25 hit 964 842 707 879P26 hit 3 809 267 2 775 732P27 hit 3 808 854 2 776 396P28 hit 3 811 695 2 774 845P29 hit 3 810 622 2 776 476R8�inner� hit 10 713 312 7 439 329R8�inner� out 107 174 111 814R8�outer� hit 10 765 907 7 509 732R8�outer� out 108 016 112 411
FIG. 4. Ratio of the incidence in the center of the NEG cylinder and that at
the position of BAG2.J. Vac. Sci. Technol. A, Vol. 25, No. 4, Jul/Aug 2007
ber on its inner surface. Thanks to the Monte Carlo simula-tion, there is now a solution to get around the corner.
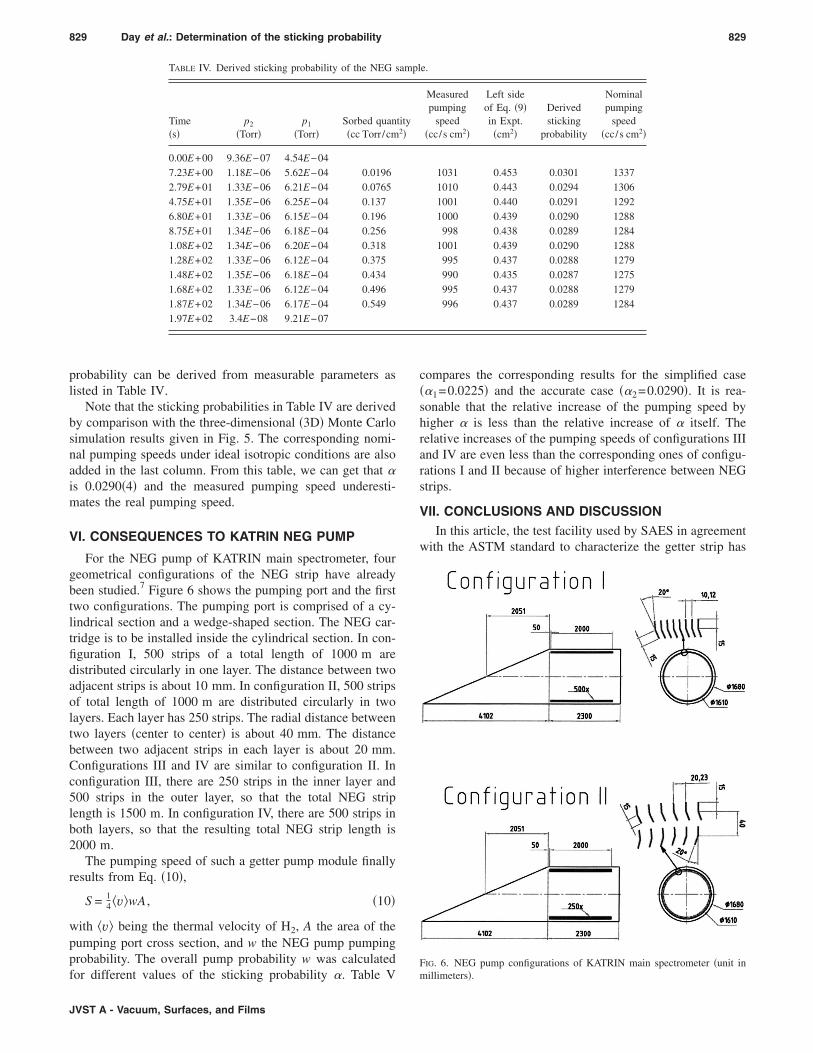
The simulation directly yields the net flow rate QN of theparticle number, which is the total number of particles ad-sorbed by the getter strip. By using the relation of Q and QN,
Q = QNkBT , �8�
and combining it with Eq. �6�, we have
C�p1 − p2��1/4��v�p2
=QN
I2. �9�
The left hand side of Eq. �9� can be measured by the experi-ment and the right hand side has been simulated. It is afunction of � and given in Fig. 5. In this way, the sticking
ts are listed. The NEG �R8� sticking probability is �.
0.020 �=0.025 �=0.030 �=0.035
21 004 17 631 15 624 14 18255 983 371 286 308 878 266 88968 321 382 038 322 269 278 61980 701 395 137 333 302 291 50304 503 419 533 357 307 314 59148 748 464 568 402 848 361 87456 172 472 971 412 015 370 23758 207 472 732 410 018 368 83462 599 478 706 416 028 376 56664 108 479 991 417 043 378 00567 101 482 339 418 602 380 46818 589 1 872 323 1 631 804 1 467 38719 521 1 872 061 1 632 285 1 469 85015 600 1 874 986 1 633 409 1 469 34815 466 1 874 505 1 630 402 1 470 83798 983 4 629 764 3 868 772 3 339 86614 062 115 167 116 165 116 48851 494 4 685 611 3 927 452 3 404 21414 934 117 202 118 211 119 330
FIG. 5. Function of the measurable parameters vs the NEG sticking
onen
�=
4445555555
2 22 22 22 25 6
15 7
1
probability.
829 Day et al.: Determination of the sticking probability 829
probability can be derived from measurable parameters aslisted in Table IV.
Note that the sticking probabilities in Table IV are derivedby comparison with the three-dimensional �3D� Monte Carlosimulation results given in Fig. 5. The corresponding nomi-nal pumping speeds under ideal isotropic conditions are alsoadded in the last column. From this table, we can get that �is 0.0290�4� and the measured pumping speed underesti-mates the real pumping speed.
VI. CONSEQUENCES TO KATRIN NEG PUMP
For the NEG pump of KATRIN main spectrometer, fourgeometrical configurations of the NEG strip have alreadybeen studied.7 Figure 6 shows the pumping port and the firsttwo configurations. The pumping port is comprised of a cy-lindrical section and a wedge-shaped section. The NEG car-tridge is to be installed inside the cylindrical section. In con-figuration I, 500 strips of a total length of 1000 m aredistributed circularly in one layer. The distance between twoadjacent strips is about 10 mm. In configuration II, 500 stripsof total length of 1000 m are distributed circularly in twolayers. Each layer has 250 strips. The radial distance betweentwo layers �center to center� is about 40 mm. The distancebetween two adjacent strips in each layer is about 20 mm.Configurations III and IV are similar to configuration II. Inconfiguration III, there are 250 strips in the inner layer and500 strips in the outer layer, so that the total NEG striplength is 1500 m. In configuration IV, there are 500 strips inboth layers, so that the resulting total NEG strip length is2000 m.
The pumping speed of such a getter pump module finallyresults from Eq. �10�,
S = 14 �v�wA , �10�
with �v� being the thermal velocity of H2, A the area of thepumping port cross section, and w the NEG pump pumpingprobability. The overall pump probability w was calculated
TABLE IV. Derived sticking probability of the NEG s
Time�s�
p2
�Torr�p1
�Torr�Sorbed quan�cc Torr/cm
0.00E+00 9.36E−07 4.54E−047.23E+00 1.18E−06 5.62E−04 0.01962.79E+01 1.33E−06 6.21E−04 0.07654.75E+01 1.35E−06 6.25E−04 0.1376.80E+01 1.33E−06 6.15E−04 0.1968.75E+01 1.34E−06 6.18E−04 0.2561.08E+02 1.34E−06 6.20E−04 0.3181.28E+02 1.33E−06 6.12E−04 0.3751.48E+02 1.35E−06 6.18E−04 0.4341.68E+02 1.33E−06 6.12E−04 0.4961.87E+02 1.34E−06 6.17E−04 0.5491.97E+02 3.4E−08 9.21E−07
for different values of the sticking probability �. Table V
JVST A - Vacuum, Surfaces, and Films
compares the corresponding results for the simplified case��1=0.0225� and the accurate case ��2=0.0290�. It is rea-sonable that the relative increase of the pumping speed byhigher � is less than the relative increase of � itself. Therelative increases of the pumping speeds of configurations IIIand IV are even less than the corresponding ones of configu-rations I and II because of higher interference between NEGstrips.
VII. CONCLUSIONS AND DISCUSSIONIn this article, the test facility used by SAES in agreement
with the ASTM standard to characterize the getter strip has
e.
Measuredpumping
speed�cc/s cm2�
Left sideof Eq. �9�in Expt.�cm2�
Derivedsticking
probability
Nominalpumping
speed�cc/s cm2�
1031 0.453 0.0301 13371010 0.443 0.0294 13061001 0.440 0.0291 12921000 0.439 0.0290 1288998 0.438 0.0289 1284
1001 0.439 0.0290 1288995 0.437 0.0288 1279990 0.435 0.0287 1275995 0.437 0.0288 1279996 0.437 0.0289 1284
FIG. 6. NEG pump configurations of KATRIN main spectrometer �unit in
ampl
tity2�
millimeters�.

830 Day et al.: Determination of the sticking probability 830
been studied systematically by the Monte Carlo simulation.A relation between the pressure measurements and the stick-ing probability of the NEG strip has been established for thisexperimental setup and the chosen getter strip geometry.
The measured pressure in the sample vessel is alwayshigher than the pressure on the getter. Then, the standardprocedure uses a calculation method which underestimatesthe pumping speed.3 Furthermore, the incident flux of mol-ecules is not uniform onto the getter and only a 3D calcula-tion method can take it into account. Combining these resultswith the experimental data, it is found that the sticking prob-ability of the St707/CTAM/30D NEG strip tested forKATRIN is 0.0290�4�, which is about 25% higher than thevalue estimated without a Monte Carlo simulation. The cor-responding pumping speed of the NEG pump comprising of1 km St707 NEG strips in configuration I could be about337 m3/s for H2 at 15 °C. This value will be taken as thereference parameter for designing the NEG pumps of theKATRIN main spectrometer.
Note that the experiment has been carried out for H2 atT=25 °C and p=4�10−6 mbar. As discussed in the Intro-duction, the measured sticking probability is the overall ad-sorption fraction of the incident gas flux, usually accountingfor the reflection coefficient, the coefficient of the stimulatedgas desorption, the sticking coefficient, and the condensation
TABLE V. Pumping speeds S of H2 at 15 °C calculat
Configuration �1=0.0225
I w1=0.116 S1=297 m3/sII w1=0.114 S1=292 m3/sIII w1=0.135 S1=344 m3/sIV w1=0.148 S1=377 m3/s
coefficient. The stimulated gas desorption �negative effect�
J. Vac. Sci. Technol. A, Vol. 25, No. 4, Jul/Aug 2007
may be expected to decrease, as the pressure decreases. Thecondensation coefficient �positive effect� is expected to in-crease, as the temperature decreases. Under KATRIN rel-evant conditions, the pressure in the tandem spectrometers isabout 1�10−11 mbar and the temperature is at ambient. Con-sequently, it is hoped that the above pumping speed is not toooptimistic.
ACKNOWLEDGMENT
The support by BMBF Grant No. 05 CK5VKA/5 is grate-fully acknowledged.
1C. Benvenuti and P. Chiggiato, J. Vac. Sci. Technol. A 14, 3278 �1996�.2KATRIN Collaboration, Forschungszentrum Karlsruhe Scientific ReportNo. FZKA 7090, 2005 �unpublished�.
3International Standard ASTM F 798-97: Standard Practice for Determin-ing Gettering Rate, Sorption Capacity, and Gas Content of NonevaporableGetters in the Molecular Flow Region. Copyright by ASTM Int’l, Re-approved 2002.
4A. Bonucci, R. Giannantonio, C. Caretti, G. Longoni, A. L. Caterino, andM. Urbano, J. Vac. Sci. Technol. A 22, 1820 �2004�.
5C. Benvenuti and P. Chiggiatto, Vacuum 44, 511 �1993�.6St707 Technical Specification, SAES Getters SpA, Italy.7X. Luo, L. Bornschein, Ch. Day, and J. Wolf, Vacuum 81, 777 �2007�.8G. Class, 3D Monte Carlo-Simulation der Molekelbewegung und derWaermestrahlung in Vakuum-Behaeltern-Rechenprogramm MOVAK3D, Re-lease 7.0, Karlsruhe, Germany, 2006; Forschungszentrum Karlsruhe Sci-
r configurations I to IV.
�2=0.0290 �S2−S1� /S1
w2=0.132 S2=337 m3/s 0.135w2=0.130 S2=332 m3/s 0.137w2=0.149 S2=380 m3/s 0.105w2=0.161 S2=411 m3/s 0.090
ed fo
entific Report No. KfK 4292, 1987 �unpublished�.