CFRP strengthening for steel beams with web openings
212
CFRP STRENGTHENING OF STEEL BEAMS WITH WEB OPENINGS A thesis submitted to the University of Manchester for the degree of Doctor of Philosophy In the Faculty of Science and Engineering 2018 MOHAMMED JASSAM MOHAMMED ALTAEE School of Mechanical, Aerospace and Civil Engineering The University of Manchester
-
Upload
khangminh22 -
Category
Documents
-
view
1 -
download
0
Transcript of CFRP strengthening for steel beams with web openings

CFRP STRENGTHENING OF STEEL BEAMS
WITH WEB OPENINGS
A thesis submitted to the University of Manchester for the degree of
Doctor of Philosophy
In the Faculty of Science and Engineering
2018
MOHAMMED JASSAM MOHAMMED
ALTAEE
School of Mechanical, Aerospace and Civil Engineering
The University of Manchester

2
TABLE OF CONTENTS
ABSTRACT ........................................................................................................ 21
DECLARATION ....................................................................................................... 23
COPYRIGHT ........................................................................................................ 24
ACKNOWLEDGEMENTS ....................................................................................... 26
PUBLICATIONS ....................................................................................................... 27
CHAPTER 1 INTRODUCTION ............................................................................ 28
1.1 Background ........................................................................................................ 28
1.2 Fibre reinforced polymers .................................................................................. 29
1.3 General application of FRP-strengthening of steelwork .................................... 31
1.4 Enhancing stability of steel sections using FRP ................................................ 31
1.5 Force transfer mechanism in adhesive joints ..................................................... 32
1.6 Failure modes of FRP-steel joint ....................................................................... 33
1.7 Objectives of research ........................................................................................ 34
1.8 Layout of the thesis ............................................................................................ 35
CHAPTER 2 LITERATURE REVIEW .................................................................. 37
2.1 Introduction ........................................................................................................ 37
2.2 Steel structures ................................................................................................... 37
2.3 Unstrengthened steel beam with web opening ................................................... 38
2.3.1 Failure modes ............................................................................................. 38
2.3.2 Failure mode studies .................................................................................. 40
2.3.3 Approaches to reinforcing the web opening .............................................. 44
2.4 FRP-strengthening of metallic structures ........................................................... 46
2.4.1 FRP strengthening of existing steel bridges ............................................... 46

3
2.4.2 Previous studies on FRP strengthening of steel structures ........................ 47
2.5 Guidelines for strengthening steel structures ..................................................... 65
2.6 Summary ............................................................................................................ 67
CHAPTER 3 ........................................................................................................ 68
DESCRIPTION OF NUMERICAL MODEL AND VALIDATION ........................ 68
3.1 Introduction ........................................................................................................ 68
3.2 Solver type ......................................................................................................... 68
3.3 Material modelling ............................................................................................. 69
3.3.1 Steel ............................................................................................................ 69
3.3.2 Cohesive ..................................................................................................... 70
3.3.3 CFRP modelling ......................................................................................... 74
3.4 Tests conducted by Tsavdaridis and D’Mello (2011) ........................................ 75
3.4.1 Test description .......................................................................................... 75
3.4.2 FE modelling .............................................................................................. 76
3.4.3 FE results and discussion ........................................................................... 78
3.5 Tests conducted by Linghoff et al. (2009) ......................................................... 80
3.5.1 Test description .......................................................................................... 80
3.5.2 FE modelling .............................................................................................. 81
3.5.3 FE results and discussion ........................................................................... 83
3.6 Tests conducted by Deng and Lee (2007) .......................................................... 88
3.6.1 Test description .......................................................................................... 88
3.6.2 FE modelling .............................................................................................. 89
3.6.3 Results and discussion ............................................................................... 92
3.7 Investigation of CFRP strengthening for steel beams with web openings......... 96
3.7.1 Model description....................................................................................... 96

4
3.7.2 FE modelling .............................................................................................. 97
3.7.3 Failure modes ........................................................................................... 100
3.8 Assumptions and limitations ............................................................................ 107
3.9 Summary .......................................................................................................... 108
CHAPTER 4 ...................................................................................................... 110
EXPERIMENTAL STUDY ..................................................................................... 110
4.1 Introduction ...................................................................................................... 110
4.2 Experimental setup ........................................................................................... 110
4.2.1 Specimen description ............................................................................... 110
4.2.2 Loading scheme ....................................................................................... 112
4.2.3 Boundary conditions ................................................................................ 112
4.2.4 Specimen preparation ............................................................................... 115
4.2.5 Specimen material properties ................................................................... 116
4.2.6 Installation of CFRP plates ...................................................................... 118
4.2.7 Strain and deflection measurement .......................................................... 120
4.3 Summary .......................................................................................................... 121
CHAPTER 5 ...................................................................................................... 122
EXPERIMENTAL RESULTS ................................................................................. 122
5.1 Introduction ...................................................................................................... 122
5.2 Results and discussion ..................................................................................... 122
5.2.1 Unstrengthened beams B0, B1-UO, B2-UO & B3-UO ........................... 123
5.2.2 Strengthened beams B1-RO, B2-RO & B3-RO ....................................... 124
5.3 Assumptions and limitations ............................................................................ 133
5.4 Summary .......................................................................................................... 134

5
CHAPTER 6 ...................................................................................................... 135
NUMERICAL MODELLING OF EXPERIMENTAL WORK .............................. 135
6.1 Introduction ...................................................................................................... 135
6.2 Loading and boundary conditions .................................................................... 136
6.3 Material modelling ........................................................................................... 138
6.3.1 Steel properties ......................................................................................... 138
6.3.2 CFRP Material Properties ........................................................................ 138
6.3.3 Adhesive properties .................................................................................. 139
6.3.4 Geometric imperfection ........................................................................... 140
6.3.5 Mesh ......................................................................................................... 140
6.4 Simulation results ............................................................................................. 141
6.4.1 Unstrengthened beams ............................................................................. 141
6.4.2 Strengthened beams ................................................................................. 145
6.5 Effect of CFRP thickness ................................................................................. 160
6.6 Assumptions and limitations ............................................................................ 163
6.7 Summary .......................................................................................................... 164
CHAPTER 7 CASE STUDY .......................................................................... 166
7.1 Introduction ...................................................................................................... 166
7.2 Model description and material properties ....................................................... 166
7.3 Material modelling, boundary conditions and meshing ................................... 172
7.4 Simulation results ............................................................................................. 173
7.4.1 Load mid-span deflection response .......................................................... 173
7.4.2 Modes of Failure ...................................................................................... 174
7.4.3 CFRP strain distribution ........................................................................... 175
7.4.4 Steel stiffeners’ stress distribution ........................................................... 176

6
7.4.5 Adhesive damage ..................................................................................... 177
7.5 Assumptions and limitations ............................................................................ 197
7.6 Summary .......................................................................................................... 198
CHAPTER 8 CONCLUSIONS ....................................................................... 200
8.1 Overview of Research ...................................................................................... 200
8.2 How the FRP system works: General Conclusions ......................................... 201
8.3 Experimental Work: Conclusions .................................................................... 203
8.4 Numerical Modelling of Experimental Series: Conclusions ............................ 204
8.5 Full scale numerical modelling study: Conclusions ........................................ 205
8.6 Recommendations for Future Research ........................................................... 206
REFERENCES ...................................................................................................... 207

7
Notations and Abbreviations 𝐴𝑟
𝑏𝑟
𝑏𝑓
𝐶𝐹𝑅𝑃
D
𝑑
𝑑𝑟
EDC
𝐸𝑁𝐴
𝐸𝐶𝐹𝑅𝑃
𝐸𝑠𝑡𝑒𝑒𝑙
𝐸𝑇𝐹
𝐸𝑥
𝐸𝑦, Ez
e
𝐹𝑅𝑃
𝑓
𝑓𝑦
𝐺𝐹𝑅𝑃
𝐺𝑥𝑦
𝐺𝑥𝑧, 𝐺𝑦𝑧
𝐻𝑀 − 𝐶𝐹𝑅𝑃
ℎ
ℎ𝑎𝑑ℎ.
ℎ𝐶𝐹𝑅𝑃
ℎ𝑜
𝐼𝑇𝐹
𝐼𝐹
K
LTB
𝐿𝑆𝐵
𝐿𝑉𝐷𝑇
Area of stiffening
Width of the stiffener
Flange width
Carbon fibre reinforced polymer
local damage within an element in the finite element method
Web height
Stiffener’s depth from the flange
End debonding of CFRP
Equivalent neutral axis
Elastic modulus of carbon fibre reinforced polymer
Elastic modulus of steel
End-two-flange
Elastic modulus in the longitudinal direction
Elastic modulus in the transverse directions
Opening eccentricity
Fibre reinforced polymer
Member natural frequency
Yield stress
Glass fibre reinforced polymer
In-plane shear modulus
Shear modulus in the transverse directions
High modulus carbon fibre reinforced polymer
Beam depth
Adhesive height
Height of carbon fibre reinforced polymer
Opening depth
Interior-two-flange
Stress-based failure criterion of FRP
Beam’s stiffness
Lateral torsional buckling
Lite steel beam
Linear variable displacement transducer

8
𝑙𝑣
𝑀
𝑀𝑛
𝑀𝑝
𝑀𝑃𝐶
𝑃𝐵
𝑄𝑈𝐴𝐷𝑆𝐶𝑇
𝑅𝐻𝑆
𝑅𝑂𝐶
𝑅𝑂𝑆
𝑆
𝑆𝐵
𝑆𝐷𝐸𝐺
𝑆𝐻𝑆
𝑆𝑍
TFY
𝑡𝑎𝑑ℎ.
𝑡𝐶𝐹𝑅𝑃.
𝑡𝑓
tn,ts,tt
𝑡𝑟
𝑡𝑤
𝑈𝐻𝑀 − 𝐶𝐹𝑅𝑃
VF
𝑋𝑐
YOC
𝑊𝐿𝐵
WPB
𝑋
𝑌
𝑋𝑡
𝑌𝑐
𝑌𝑡
Anchorage length of the stiffener
Bending moment
Nominal bending capacity of a steel member with a web opening
Bending capacity of a steel member without an opening
Multi-points constraint
Primary beam
Quad damage stress criteria (damage initiation)
Rectangular hollow section
Reinforced opening with carbon fibre reinforced polymer plates
Reinforced opening with steel stiffeners
Longitudinal shear strength
Secondary beam
Stress degradation (damage evolution scalar)
Square hollow section
Shear zone
Top flange yielding
Adhesive thickness
Thickness of carbon fibre reinforced polymer
Flange thickness
Nominal stress in three directions
Stiffener thickness
Web thickness
Utra-high modulus carbon fibre reinforced polymer
Vierendeel failure
Longitudinal compressive strength
Yielding of opening corner
Web local buckling
Web post buckling
Stress limit in x-direction
Stress limit in y-direction
Longitudinal tensile strength
Transverse compressive strength
Transverse tensile strength

9
Z
Greek symbols:
𝛿𝑚0
𝛿𝑚𝑓
𝛿𝑚𝑚𝑎𝑥
∆𝐴𝑠
∆𝐹
∆𝑈
휀1
휀2
휀𝑛𝑜𝑚𝑖𝑛𝑎𝑙
휀𝑇𝑟𝑢𝑒
𝜇휀
σ1
σ2
σmax
𝜎𝑛𝑜𝑚𝑖𝑛𝑎𝑙
𝜎𝑇𝑟𝑢𝑒
𝜎𝑥𝑥
𝜎𝑦𝑦
𝜎𝑥𝑦
τmax
Plastic modulus of steel section
Effective relative displacement at the initiation of failure
Effective relative displacement at the end of failure
Maximum effective displacement
Change in shear area
Change in force
Change in displacement
Strain in the longitudinal direction
Strain in the transverse direction
Nominal strain
True strain
Microstrain
Stress in the longitudinal direction
Stress in the transverse direction
Tensile strength of the adhesive
Nominal stress
True stress
Longitudinal stress in x-direction
Longitudinal stress in y-direction
Shear stress in x-y direction
Maximum shear strength of the adhesive

10
List of Figures
Figure 1-1 Schematic and microscopy image of FRP composite (Abed, 2012). ....... 29
Figure 1-2 CFRP products used in strengthening. .................................................... 30
Figure 1-3 Formation of (a) shear and (c) peeling stresses in adhesive joint and
corresponding (b) shear and (d) peeling stress distributions (Karbhari, 2014). ......... 33
Figure 1-4 Failure modes for steel-CFRP bond system (Zhao and Zhang, 2007). ... 34
Figure 2-1 Shear failure mode and corresponding Von Mises stress (MPa). ............ 38
Figure 2-2 Bending failure mode and corresponding Von Mises stress (MPa). ........ 39
Figure 2-3 Web post buckling failure mode and corresponding Von Mises stress
(MPa). ........................................................................................................................ 40
Figure 2-4 Web-post buckling failure (Zaarour & Redwood 1996). ......................... 41
Figure 2-5 Opening locations of perforated sections (Liu & Chung 2003). .............. 43
Figure 2-6 Detailing the limits of the reinforced web opening. ................................. 44
Figure 2-7 Reinforced opening configurations for steel beams. ................................ 45
Figure 2-8 (a) Cutting of bridge into three beam sections and (b) simply supported
composite bridge section (Sen et al. 2001). ............................................................... 49
Figure 2-9 CFRP strengthening schemes. .................................................................. 50
Figure 2-10 Specimen details for beams TR1 and TR2 (Colombi, P. & Poggi, 2006).
.................................................................................................................................... 52
Figure 2-11 Specimen details for beam TR3 (Colombi, P. & Poggi 2006). .............. 52
Figure 2-12 Testing set-up with lateral supports set up for specimens TR0, TR2 and
TR3 (Colombi, P. & Poggi 2006). ............................................................................. 53
Figure 2-13 Schematic diagrams of RHS steel beams repaired using (a) U-shaped
CFRP/GFRP and (b) flat plate pre-peg laminates (Photiou et al. 2006). ................... 55

11
Figure 2-14 CFRP-strengthening of LSBs (a) outer side, (b) inner side and (c) both
sides (Zhao & Al-Mahaidi 2008). .............................................................................. 56
Figure 2-15 Modes of failure of LSBs (a) un-strengthened beam, (b) CFRP on outer
side, (c) CFRP on inner side and (d) CFRP on both sides (Zhao & Al-Mahaidi 2008).
.................................................................................................................................... 57
Figure 2-16 Control and GFRP-strengthened specimens, OB1 and OB2 (Okeil et al.
2009). ......................................................................................................................... 58
Figure 2-17 Test mode of failure of specimen OB2 .................................................. 59
Figure 2-18 Specimen details (a) Control specimen, (b) CFRP-one layer and GFRP-
one layer and (c) CFRP-two layers and GFRP-two layers (Harries et al. 2009). ...... 60
Figure 2-19 Debonding of CFRP strips in specimen CFRP-2 (Harries et al., 2009). 61
Figure 2-20 CFRP-strengthening and loading of specimen NB2 (Narmashiri et al,
2010). ......................................................................................................................... 62
Figure 2-21 Mode failure: (a) control specimen (b) strengthened specimen
(Narmashiri et al, 2010). ............................................................................................ 63
Figure 2-22 Test set-up of ETF and ITF loading conditions (Islam & Young 2013).64
Figure 3-1 Illustration of a simple bilinear traction-separation law (ABAQUS,
2013). ......................................................................................................................... 71
Figure 3-2 Illustration of exponential damage evolution in a traction-separation law
(ABAQUS, 2013). ...................................................................................................... 72
Figure 3-3 Damage initiation criteria. ........................................................................ 72
Figure 3-4 Details of the tested beam. ....................................................................... 76
Figure 3-5 Load, support and mesh conditions of FE model. ................................... 77
Figure 3-6 FE results compared with Experiment results. ........................................ 79
Figure 3-7 Details of the specimen tested by Linghoff et al. (2009). ....................... 80

12
Figure 3-8 Load, support and mesh conditions of FE model. .................................... 82
Figure 3-9 Stress-strain curves of steel used in FE model. ........................................ 83
Figure 3-10 Mesh size convergence. .......................................................................... 84
Figure 3-11 Load–strain curve of control steel beam. ............................................... 84
Figure 3-12 Load–strain curve of strengthened steel beam. ...................................... 85
Figure 3-13 Strain in the CFRP laminate near the mid-span of the strengthened beam
at different loads. ........................................................................................................ 86
Figure 3-14 the adhesive damage. .............................................................................. 87
Figure 3-15 Von Mises stress (MPa) and corresponding deflected shape at failure. . 88
Figure 3-16 Details of the tested specimen and mesh distribution. .......................... 89
Figure 3-17 FE Model of steel material properties. .................................................. 90
Figure 3-18 Load, support and mesh conditions of FE model. ................................. 91
Figure 3-19 Load displacement curve of control steel beam. ................................... 92
Figure 3-20 Load displacement curve of strengthened steel beam. ........................... 93
Figure 3-21 Strain readings on CFRP plate at strain gauge G3 in experiment and FE
models. ....................................................................................................................... 94
Figure 3-22 Strain readings on CFRP plate at stain gauge G5 in experiment and FE
model. ......................................................................................................................... 94
Figure 3-23 Strain readings on CFRP plate at strain gauge G6 in experiment and FE
models. ....................................................................................................................... 95
Figure 3-24 Strain readings on CFRP plate at strain gauge G7 in experiment and FE
models. ....................................................................................................................... 95
Figure 3-25 Strengthened beam failure mode and corresponding Von Mises stress
(MPa). ........................................................................................................................ 96
Figure 3-26 Model description and boundary condition. .......................................... 97

13
Figure 3-27 FE Model of steel material properties. .................................................. 98
Figure 3-28 Load, support and mesh conditions of FE models. ............................... 99
Figure 3-29 Shear failure mode and corresponding Von Mises stress (MPa) for beam
without strengthening. .............................................................................................. 100
Figure 3-30 CFRP locations at opening of the beam. ............................................. 100
Figure 3-31 Load deflection curve for the steel beam with different configurations of
strengthening. ........................................................................................................... 102
Figure 3-32 Bending failure mode and corresponding Von Mises stress (MPa) for
beam without strengthening. .................................................................................... 103
Figure 3-33 Load deflection curve of central opening steel beam with different
configurations of strengthening................................................................................ 104
Figure 3-34 Web post buckling failure mode and corresponding Von Mises stress
(MPa) for beam without strengthening. ................................................................... 105
Figure 3-35 Load deflection curve of beam with two central openings and different
configurations of strengthening................................................................................ 106
Figure 4-1 Layout of strengthened specimens and boundary conditions. ................ 111
Figure 4-2 Load frame assembly.............................................................................. 112
Figure 4-3 Lateral support description and end support condition. ......................... 113
Figure 4-4 Test rig arrangement. .............................................................................. 114
Figure 4-5 Specimens preparation. .......................................................................... 115
Figure 4-6 Mean tensile stress-strain relationship from coupon tests. ..................... 117
Figure 4-7 CFRP plate application process. ............................................................. 119
Figure 4-8 Strain gauge layouts, specimens B1-RO to B3-RO. .............................. 120
Figure 5-1 Load versus vertical displacement at mid-span: specimens B0 & B1-RO
to B3-RO. ................................................................................................................. 127

14
Figure 5-2 Failure patterns for Specimens B0 & B1-RO to B3-RO. ....................... 128
Figure 5-3 Failure modes and corresponding Von Mises stress (MPa) at ultimate
load. .......................................................................................................................... 129
Figure 5-4 Load versus vertical displacement at mid-span for specimens B0 & B1-
RO to B3-RO. .......................................................................................................... 130
Figure 5-5 CFRP strain gauge output....................................................................... 131
Figure 5-6 Steel strain gauge output. ....................................................................... 132
Figure 6-1 Load, support and mesh conditions of FE models. ................................ 137
Figure 6-2 Load mid-span deflection behaviour of different meshes. ..................... 141
Figure 6-3 Load versus vertical displacement at mid-span: specimens ................... 143
Figure 6-4 Von Mises stress (MPa) of specimen B0-FE at 350kN of load. ............ 143
Figure 6-5 Failure patterns for specimens B0-FE at 407kN of load and B0 at 406kN
of load....................................................................................................................... 144
Figure 6-6 Von Mises stress (MPa) at ultimate load for Beam B1-U0-FE at 357kN of
load. .......................................................................................................................... 144
Figure 6-7 Von Mises stress (MPa) at ultimate load for Beam B2-UO-FE at 335kN
of load....................................................................................................................... 145
Figure 6-8 Von Mises stress (MPa) at ultimate load for Beam B3-UO-FE at 351kN
of load....................................................................................................................... 145
Figure 6-9 Load vs. mid-span deflection of beam B1-RO-FE. ................................ 148
Figure 6-10 Von Mises stress (MPa) and failure pattern at ultimate load for Beam
B1-RO-FE at 503kN of load. ................................................................................... 148
Figure 6-11 Adhesive damage parameter, SDEG, of beam B1-RO-FE at 503kN of
load. .......................................................................................................................... 149
Figure 6-12 CFRP strain values of B1-RO-FE and B1-RO. .................................... 149

15
Figure 6-13 Strain value on CFRP at top flange in beam B1-RO-FE at ultimate load.
.................................................................................................................................. 150
Figure 6-14 Steel strain values at opening corner of B1-RO-FE and B1-RO. ......... 150
Figure 6-15 Load vs. mid-span deflection of beam B2-RO-FE. .............................. 152
Figure 6-16 Von Mises stress (MPa) and failure pattern at ultimate load for Beam
B2-RO-FE at 440kN of load. ................................................................................... 153
Figure 6-17 Adhesive damage parameter, SDEG, of beam B2-RO-FE at 440kN of
load. .......................................................................................................................... 153
Figure 6-18 CFRP strain values of B2-RO-FE and B2-RO. .................................... 154
Figure 6-19 Strain value on CFRP attached at the web below the opening in beam
B2-RO-FE at ultimate load. ..................................................................................... 154
Figure 6-20 Steel strain values at opening corner of B2-RO-FE and B2-RO. ......... 155
Figure 6-21 Load vs. mid-span deflection of beam B3-RO-FE. .............................. 157
Figure 6-22 Von Mises stress (MPa) and failure pattern at ultimate load for Beam
B3-RO-FE at 471kN of load. ................................................................................... 157
Figure 6-23 Adhesive damage parameter, SDEG, of beam B3-RO-FE at 471kN of
load. .......................................................................................................................... 158
Figure 6-24 CFRP strain values of B3-RO-FE and B3-RO. .................................... 158
Figure 6-25 Strain value on CFRP at top flange in beam B3-RO-FE at ultimate load.
.................................................................................................................................. 159
Figure 6-26 Steel strain values at opening corner of B3-RO-FE and B3-RO. ......... 159
Figure 6-27 Load mid-span deflection response of specimen B1-RO-FE with
different CFRP thicknesses. ..................................................................................... 161
Figure 6-28 Load mid-span deflection response of specimen B2-RO-FE with
different CFRP thicknesses. ..................................................................................... 161

16
Figure 6-29 Load mid-span deflection response of specimen B3-RO-FE with
different CFRP thicknesses. ..................................................................................... 162
Figure 7-1 Floor scheme. ......................................................................................... 167
Figure 7-2 Opening size scheme. ............................................................................. 168
Figure 7-3 Steel stress-strain used in the current simulations. ................................. 168
Figure 7-4 Use of rigid plate and coupling constraint for the support boundary
conditions. ................................................................................................................ 173
Figure 7-5 Load deflection curve of PB1-ROS-7.5, PB1-ROC-7.5, PB1-UO-7.5 and
PB0-7.5. ................................................................................................................... 178
Figure 7-6 Load deflection curve of SB1-ROS-7.5, SB1-ROC-7.5, SB1-UO-7.5 and
SB0-7.5. ................................................................................................................... 179
Figure 7-7 Load deflection curve of PB2-ROS-7.5, PB2-ROC-7.5, PB2-UO-7.5 and
PB0-7.5. ................................................................................................................... 179
Figure 7-8 Load deflection curve of SB2-ROS-7.5, SB2-ROC-7.5, SB2-UO-7.5 and
SB0-7.5. ................................................................................................................... 180
Figure 7-9 Load deflection curve of PB1-ROS-10, PB1-ROC-10, PB1-UO-10 and
PB0-10. .................................................................................................................... 180
Figure 7-10 Load deflection curve of SB1-ROS-10, SB1-ROC-10, SB1-UO-10 and
SB0-10. .................................................................................................................... 181
Figure 7-11 Load deflection curve of PB2-ROS-10, PB2-ROC-10, PB2-UO-10 and
PB0-10. .................................................................................................................... 181
Figure 7-12 Load deflection curve of SB2-ROS-10, SB2-ROC-10, SB2-UO-10 and
SB0-10. .................................................................................................................... 182
Figure 7-13 Load deflection curve of PB1-ROS-15, PB1-ROC-15, PB1-UO-15 and
PB0-15. .................................................................................................................... 182

17
Figure 7-14 Load deflection curve of SB1-ROS-15, SB1-ROC-15, SB1-UO-15 and
SB0-15. .................................................................................................................... 183
Figure 7-15 Load deflection curve of PB2-ROS-15, PB2-ROC-15, PB2-UO-15 and
PB0-15. .................................................................................................................... 183
Figure 7-16 Load deflection curve of SB2-ROS-15, SB2-ROC-15, SB2-UO-15 and
SB0-15. .................................................................................................................... 184
18
List of Tables
Table 1-1 Classification of CFRP according to modulus of elasticity (Zhao & Zhang
2007). ......................................................................................................................... 30
Table 2-1 Details of beams with comparison of ultimate loads (Sen et al. 2001). .... 49
Table 2-2 Specimens used in Narmashiri et al.’s (2011) test. .................................... 62
Table 3-1 Steel test results. ........................................................................................ 76
Table 3-2 Material properties CFRP plates of FE model. .......................................... 81
Table 3-3 Material properties the adhesive material of FE model. ............................ 82
Table 3-4 Material properties CFRP plates of FE model. .......................................... 91
Table 3-5 Material properties the adhesive material of FE model. ............................ 91
Table 3-6 CFRP configuration of strengthening. ..................................................... 101
Table 4-1 Summary of the mechanical properties of steel (mean values shown). ... 116
Table 4-2 Summary of the mechanical properties of Araldite 420 epoxy adhesive
when cured at room temperature for 24 hours(Huntsman 2009). ............................ 117
Table 5-1 Comparison of specimen ultimate load and failure mode. ..................... 130
Table 6-1 Material properties for FRP composites (Abdullah, 2010). .................... 139
Table 6-2 Number of divisions for the mesh schemes of beam B0-FE. .................. 140
Table 6-3 Percentage of strength achievement compared to specimen with web
opening. .................................................................................................................... 160
Table 7-1 Beam sections. ......................................................................................... 168
Table 7-2 Description of beams used in the 7.5×7.5m floor. ................................... 169
Table 7-3 Description of beams used in the 10×10m floor. ..................................... 170
Table 7-4 Description of beams used in the 15×15m floor. ..................................... 171
Table 7-5 Percentages of strength reduction due to web opening. .......................... 178

19
Table 7-6 Failure mode and von-Mises stresses (MPa) at maximum load of SB & PB
with web opening at mid-span with a beam 7.5m in length..................................... 185
Table 7-7 Failure mode and von-Mises stresses (MPa) at maximum load of SB & PB
with web opening at shear region with a beam 7.5m in length. ............................... 186
Table 7-8 Failure mode and von-Mises stresses (MPa) at maximum load of SB & PB
with web opening at mid-span with a beam 10m in length...................................... 187
Table 7-9 Failure mode and von-Mises stresses (MPa) at maximum load of SB & PB
with web opening at shear region with a beam 10m in length. ................................ 188
Table 7-10 Failure mode and von-Mises stresses (MPa) at maximum load of SB &
PB with web opening at mid-span with a beam 15m in length. ............................... 189
Table 7-11 Failure mode and von-Mises stresses (MPa) at maximum load of SB &
PB with web opening at shear region with a beam 15m in length. .......................... 190
Table 7-12 Strain distribution on CFRP plates at maximum load of SB & PB with a
beam 7.5m in length. ................................................................................................ 191
Table 7-13 Strain distribution on CFRP plates at maximum load of SB & PB with a
beam 10m in length. ................................................................................................. 191
Table 7-14 Strain distribution on CFRP plates at maximum load of SB & PB with a
beam 15m in length. ................................................................................................. 192
Table 7-15 Utilisation percentages of CFRP in different beams. ............................ 192
Table 7-16 Von Mises stress distribution (MPa) on steel stiffeners at maximum load
of SB & PB with a beam 7.5m in length. ................................................................. 192
Table 7-17 Von Mises stress distribution (MPa) on steel stiffeners at maximum load
of SB & PB with a beam 10m in length. .................................................................. 193
Table 7-18 Von Mises stress distribution (MPa) on steel stiffeners at maximum load
of SB & PB with a beam 15m in length. .................................................................. 193

20
Table 7-19 Utilisation percentages of steel plates in different beams. .................... 194
Table 7-20 Adhesive damage parameter, SDEG, of beams 7.5m in length at
maximum load. ......................................................................................................... 194
Table 7-21 Adhesive damage parameter, SDEG, of beams 10m in length at
maximum load. ......................................................................................................... 195
Table 7-22 Adhesive damage parameter, SDEG, of beams 15m in length at
maximum load. ......................................................................................................... 195

21
ABSTRACT
During the service life of a building structure, the introduction of web openings into
existing steel floor beams is often required to allow for new services such as air
conditioning, sprinkler systems, telecommunications etc. However, the presence of
large openings in the webs can significantly reduce the shear and bending strength
capacity of the beams. Traditionally, the welding of additional steel plates around
the opening areas is adopted as a means of strengthening and stiffening. This not
only presents practical difficulties but can induce residual stresses which weaken
fatigue performance of the section.
The aim of this study is to explore the applicability of externally bonded carbon
fibre reinforced polymer composites (CFRP) as an alternative means of
strengthening for web openings in steel flexural elements.
A numerical and experimental investigation was employed in the research reported
in this thesis to achieve this aim. Using a non-linear finite element approach, the
effects of strengthening arrangements and CFRP lengths were investigated with a
view to determine the most structurally efficient layout of CFRP strengthening. The
experimental tests were conducted later on four specimens, one control specimen
(without opening and un-strengthened) and the rest with different web opening
positions and CFRP strengthening.
In order to further understand the limits of applicability of this approach, further
numerical modeling was also performed to assess the proposed strengthening
method when applied to full-scale steel beams with web openings at mid-span or in
the high shear zone. The series of beams examined comprised the types of spans
which are common in commercial frame buildings.
22
The outcomes of this research show that the CFRP strengthening method is capable
of recovering and in some cases exceeding the strength of the beam to that before
the introduction of web openings. Similarly, the strengthening method increases the
stiffness of the altered beam, thus bringing deflections back to a level similar to the
beam before introduction of openings. In many of the strengthened cases, a
reduction in ductility was observed; this can in part be due to over-specification of
strengthening thickness and thus demonstrates the importance of choosing the
optimum strengthening arrangement. In parallel with the reduction in ductility, it
was observed that changes in failure mode and position can occur with certain
strengthening arrangements in comparison to the unaltered beam. In the application
of the method to full scale beams, the results of the simulations suggest that the
technique of CFRP strengthening can be used effectively as a realistic and practical
alternative solution to retrofitting of existing steelwork. When the CFRP
strengthened beams were compared to those with traditional welded steel plate
strengthening designed according to SCI P355 (2011), the results were found to be
similar in terms of load capacity and overall failure mode.

23
DECLARATION
No portion of the work referred to in the thesis has been submitted in support of an
application for another degree or qualification of this or any other university or
other institute of learning.

24
COPYRIGHT
The Author of this thesis (including any appendices and/or schedules to this thesis)
owns any copyright in it (the “Copyright”) and he has given The University of
Manchester the right to use such Copyright for any administrative, promotional,
educational and/or teaching purposes.
Copies of this thesis, either in full or in extracts, may be made only in accordance
with the regulations of the JohnRyland’s UniversityLibraryofManchester.Details
ofthese regulations may be obtained from the Librarian. This page must form part
of any such copies made.
The ownership of certain Copyright, patents, designs, trademarks and other
intellectual property (the “Intellectual Property”) and any reproductions of
copyright works in the thesis, for example graphs and tables (“Reproductions”),
which may be described in this thesis, may not be owned by the author and may be
owned by third parties. Such Intellectual Property and Reproductions cannot and
must not be made available for use without the prior written permission of the
owner(s) of the relevant Intellectual Property and/or Reproductions.
Further information on the conditions under which disclosure, publication and
exploitation of this thesis, the Copyright and any Intellectual Property Rights and/or
Reproductions described in it may take place is available from the Head of School
of Mechanical, Aerospace and Civil Engineering.

25
DEDICATED
TO
MY PARENTS, WIFE AND kids
FOR THEIR
LOVE, sacrifices AND PRAYERS

26
ACKNOWLEDGEMENTS
First and foremost, I wish to give all the praise to ALLAH Almighty for giving me
the patience, strength and time to complete this research.
I would like to express my personal gratitude to my supervisors, Dr Lee S.
Cunningham and Dr Martin Gillie for their expert supervision, continued guidance,
consistent motivation and valuable advices during all phases of the research work.
They provided me with all kinds of support during my PhD study.
I wish to express my sincere thanks for the financial support given by the Iraqi
Ministry of Higher Education and Scientific Research.
Finally, I would like to express my deepest gratitude to my parents, my wife and my
kids for their unlimited support, encouragement and love. Without them, this would
not have been possible.
Mohammed Altaee

27
PUBLICATIONS
Altaee, M.J., Cunningham, L.S. & Gillie, M., 2017. Experimental investigation of
CFRP-strengthened steel beams with web openings. Journal of Constructional Steel
Research, 138, pp.750–760.
Altaee, M., Cunningham, L. & Gillie, M., 2016. CFRP Strengthening of Steel
Beams with Web Openings. In Proceedings of Structural Faults & Repair 2016:
16th International Conference, Edinburgh, UK. p. 1754.
Altaee, M., Cunningham, L. & Gillie, M., 2016b. Novel Technique for
Strengthening Steel Beams with Web Penetrations. In Proceedings of the MACE
PGR Conference, Manchester, UK. pp. 9–11.

28
CHAPTER 1 1
INTRODUCTION
1.1 Background
Towards extending service life and future adaptation, existing steel structures may
often require the creation of voids in the web of floor beams to accommodate
services such as ventilation ducts, electrical and data communication systems, fire
protection systems, heating and cooling systems and instrumentation cables.
However, the existence of web openings may have a significant detrimental effect
whereby the beam may be weakened in the vicinity of the opening due to the
reduction in section. Traditionally the welding of steel plates around openings is used
to compensate for the loss of section as outlined in SCI P355(Lawson & Hicks
2011). This conventional approach induces residual stresses which can weaken the
fatigue performance (Fattouh & Shahat, 2015). Further disadvantages of this
strengthening method are the practical and safety issues associated with welding at
height.
The bonding of fibre reinforced polymer (FRP) composite plates or sheets represent
a potentially advantageous alternative to the traditional method of strengthening
steelwork. FRP composites have many advantages over welding steel plates. FRP,
depending on the constituents, usually has a much higher strength-to-weight ratio,
making it a much easier material to handle. This technique also avoids welding at
height issues making it overall much quicker and easier to install. The enhanced

29
durability aspects of FRP materials are also attractive particularly in regard to
extended service life of structures.
1.2 Fibre reinforced polymers
Fibre reinforced polymer (FRP) is a composite material that is composed of two
components: fibre reinforcement and polymeric resin (matrix), as shown in Figure
1-1. The fibres enhance the strength and stiffness of the FRP composites whilst the
matrix allows the load transfer between the individual fibres, and protects them from
mechanical and environmental damage. The properties of the FRP composite depend
on the properties of the matrix and the fibre as well as the fibre volume ratio and the
fibre orientation.
Figure 1-1 Schematic and microscopy image of FRP composite (Abed, 2012).
The most commonly used fibre constituents for FRP in civil engineering applications
are glass fibre (resulting in GFRP) or carbon fibre (resulting in CFRP). Other less
commonly used fibres include aramid fibre, while newer naturally derived fibres
such basalt fibres are starting to receive attention in the research community. These
types of composite have a wide range of material properties and prices. Carbon fibre
polymer has been used heavily for strengthening of steel structures, primarily

30
because CFRP materials have relatively higher stiffness. CFRP laminates for
application on steel structures are available as pultruded plates and sheets as shown
in Figure 1-2. Pultruded plates are typically bonded to the steel using a two part
epoxy adhesive, while the sheets can be bonded the same way or with a compatible
adhesive film (Hollaway & Cadei 2002).
(a) CFRP sheet (b) CRRP plate
Figure 1-2 CFRP products used in strengthening.
Depending on the modulus of the CFRP material, researchers have used terms such
as normal, high and ultra-high modulus to categorise laminates as given in Table 1-1.
Table 1-1 Classification of CFRP according to modulus of elasticity (Zhao & Zhang
2007).
Category ECFRP to Esteel ECFRP (GPa)
Low modulus ECFRP ≤0.5Esteel <100
Normal modulus 0.5Esteel ≤ ECFRP ≤ Esteel 100-200
High modulus Esteel < ECFRP ≤ 2Esteel 200-400
Ultra-high modulus ECFRP > 2Esteel 400

31
1.3 General application of FRP-strengthening of steelwork
In general, strengthening of an existing steel structure may be required for a number
of reasons e.g. change of use and load requirements, geometric modifications or
damage e.g. introduction of web penetrations, loss of section from corrosion etc
(Cadei et al. 2004).
As previously mentioned FRP composite is the most favoured material in many
strengthening applications because it is light-weight, has suitable strength and
stiffness properties and is easy to install on site. Externally-bonded FRP-
strengthening is a powerful technique of extending the life of structures including
those made of steel. The overall cost of the whole strengthening job using FRP
materials can be as competitive as using conventional materials, in addition to being
quick and easy to handle on site with minimum interruption to the use of the facility.
In some situations, FRP composites are the only plausible material that could be used
for strengthening especially in the places where neither access of heavy machinery is
possible nor closure of the facility is practical.
1.4 Enhancing stability of steel sections using FRP
FRP composite materials externally bonded to the surface of steel members have
been shown to enhance strength and stiffness by generating composite action and
creating an enlarged section. In situations where the stability of un-strengthened steel
members have been compromised, FRP strengthening in local (flange or web) or
global (sectional) buckling situations has proved to be effective. Stability
enhancement through the application of FRP to steel members is primarily a research
topic and there are few known applications in practice at this time. Ekiz et al. (2004)
report that the presence of the CFRP wrap increased the size of the yielded plastic

32
hinge region, inhibited the occurrence of local buckling, and delayed the onset of
lateral torsional buckling. Accord and Earls (2006) demonstrated that the presence of
GFRP strips enhanced the structural ductility of the cross-section as a result of
providing effective bracing of the flange outstands, and thus inhibiting the formation
of the local buckles in the compression flange of the cross-section. Ekiz [(2007)
demonstrated large improvements in the buckling and post-buckling response of full-
scale double angle brace members subjected to reversed cyclic loading.
1.5 Force transfer mechanism in adhesive joints
There are several possible failure mechanisms in FRP strengthened steelwork;
however the weakest link in the strengthening system is the adhesive bond between
the steel and the FRP. De-bonding failure can happen in situations where both the
FRP and steel are relatively lowly stressed in comparison to their respective
capacities. Irrespective of the load type applied on a joint, the stresses in an adhesive
joint can be decomposed into two main stress components: shear stress (τ) and
normal stresses (σ). Normal and shear stresses are caused by forces acting
perpendicular and parallel to the element under consideration in the adhesive layer,
respectively. Normal stresses result in tension or compression in the material,
generating normal strain while shear stresses cause diagonal deformation in the
material known as shear strain. Stresses and strains are simply related to each other
by the modulus of elasticity of the adhesive material.
Figure 1-3 presents a schematic of how the stresses in the joint are developed and
interaction between them. The load transfers in adhesive from one adherent to
another is achieved via shear action in the adhesive layer Figure 1-3a). These shear
stresses vary along the laminate and decrease with increasing distance from the end

33
of the FRP plate as shown in Figure 1-3b. Moreover, the shear action in the joint
causes a secondary bending effect in the FRP as illustrated in Figure 1-3c. This
bending moment in the laminate is counteracted by through-thickness force in the
adhesive layer, referred to as peeling force or peeling stress which is distributed as
shown in Figure 1-3d.
Figure 1-3 Formation of (a) shear and (c) peeling stresses in adhesive joint and
corresponding (b) shear and (d) peeling stress distributions (Karbhari, 2014).
1.6 Failure modes of FRP-steel joint
In order to fully achieve the benefits of adhesive bonding, an understanding of the
failure behaviour of adhesively bonded joints is needed. Due to the disparity between
the strains of the steel substrate and the FRP reinforcement, high stress (both peeling
and shear, see Figure 1-3) is concentrated in the adhesive joints. FRP-strengthened
structures usually fail due to the failure of these joints. Although de-bonding is

34
usually the most prevalent, there are several typical failure modes which shown
schematically in Figure 1-4 can be summarised as:
1. Interlaminar failure of CFRP- CFRP failure.
2. CFRP rupture.
3. CFRP-adhesive interface debonding (adhesion failure).
4. Adhesive failure (cohesion failure).
5. Steel-adhesive interface debonding (adhesion failure).
Figure 1-4 Failure modes for steel-CFRP bond system (Zhao and Zhang, 2007).
1.7 Objectives of research
Currently no published research work exists on the application of FRP strengthening
in beams with web openings. In order to investigate the feasibility of the carbon fibre
reinforced polymer (CFRP) strengthening technique with a particular view to
recovering the strength and stiffness of steel beams after the introduction of web
openings, the following objectives are considered:

35
1. Studies of both un-strengthened and FRP-strengthened steel beams using
FE modelling validated using experimental investigations in the literature
to develop understanding of the behaviour of the structural system.
2. Further corroboration of the findings of the FE study by physically testing
3m strengthened steel beams with different web opening locations and
CFRP configuration.
3. Identification of optimum CFRP configuration for a given arrangement of
web openings.
4. Investigation of potential size effects and limits of applicability of the
method.
1.8 Layout of the thesis
This thesis consists of eight chapters set out as follows:
Chapter one presents an introduction to the research and describes briefly the
principle of FRP strengthening and general failure mechanisms of FRP strengthened
steelwork. It also describes the aims and objectives of the research. Finally, it
outlines the content of the thesis.
Chapter two presents a review of the literature relevant to steel beams with web
openings and the strengthening of steel beams and composite beams in general using
FRP techniques. Finally, an overview of the existing design guidelines that are
applicable to the use of FRP with steel structures is given.
Chapter three describes the details of a validation study in which the FE analyses
of relevant previous test specimens were carried out using ABAQUS software

36
release 6.13-1. It includes a comprehensive description of the finite element tools
that have been used in the validation process such as element selection, material
modelling and contact modelling, etc. Finally the results of the FE analyses are
compared to relevant experimental tests.
Chapter four presents the details of an experimental investigation comprising the
tests of four specimens, one un-strengthened control specimen and the three CFRP
strengthened specimens with different locations of web opening. The test rig, testing
procedure, the strengthening techniques employed and CFRP composites used for the
strengthening of the specimens are described.
Chapter five presents the experimental results of the CFRP strengthened steel
beams subjected to static load. In addition, the comparisons between the test and
theoretical ultimate loads are presented in this chapter.
Chapter six presents the details and results of FE analyses carried out on models
of the test specimens. The ultimate loads, modes of the failure, load-deflection
responses and locations of the plastic hinges developed in specimens obtained from
the FE analyses are compared to those in the tests.
Chapter seven presents a numerical parametric study on full-scale steel floor
beams for three different spans, 7.5m, 10m and 15m, distributed between primary
and secondary beams. Optimum CFRP configurations following introduction of web
openings and potential limits of applicability are investigated.
Chapter eight summarises the main findings and conclusions of the research with
suggestions for possible future work.

37
CHAPTER 2 2
LITERATURE REVIEW
2.1 Introduction
The retrofitting of metallic structures has increased significantly since the late 20th
century due to the pressing need to extend the life of existing steel building and
bridge structures. This is attributed to a number of reasons such as modifications in
their geometry. In most cases, maintaining this infrastructure through retrofit to
extend their service life is more economical than replacing them. This chapter first
presents an overview of metallic structural materials, followed by a brief summary
of conventional methods currently used in retrofitting steel structures. A more
detailed discussion on Fibre Reinforced Polymer (FRP) materials and their use in
retrofitting metallic structures, along with recent research advances in this field, will
follow.
2.2 Steel structures
Although structural steel has been mass produced in Britain since 1860, it took
about 50 years to entirely replace wrought iron (Cadei et al., 2004). The mechanical
properties of steel depend on the chemical composition, the heat treatment and the
manufacturing process. Increasing the carbon percentage increases the strength of
the steel but decreases its ductility. Modern steel is produced with a maximum
carbon content of 0.25%, which provides the best combination of strength and

38
ductility. Developments in the manufacture and the control of the quality and
strength of steel materials have motivated engineers to create extremely challenging
and spectacular structures which are either difficult or costly to produce with other
materials.
2.3 Unstrengthened steel beam with web opening
2.3.1 Failure modes
In the absence of overall instability, which is caused by lateral torsional buckling,
steel beams with web openings have three basic modes of collapse, depending upon
the geometry and the position of the web opening as follows:
2.3.1.1 Vierendeel or shear failure
This mode of failure is associated with high shear forces acting on the beam which
form four plastic hinges at the opening edges, causing the perforated section to
deform as a parallelogram (Kerdal & Nethercot, 1984). After that, the T-section
above the web openings is deformed to a stretched shape, as shown in Figure 2-1.
Figure 2-1 Shear failure mode and corresponding Von Mises stress (MPa).

39
2.3.1.2 Flexural failure
Due to introducing an opening in the pure bending region (mid-span of a simply
supported beam), the top T-section above the opening is vulnerable to buckling
failure due to high compression stresses, as shown in Figure 2-2.
Figure 2-2 Bending failure mode and corresponding Von Mises stress (MPa).
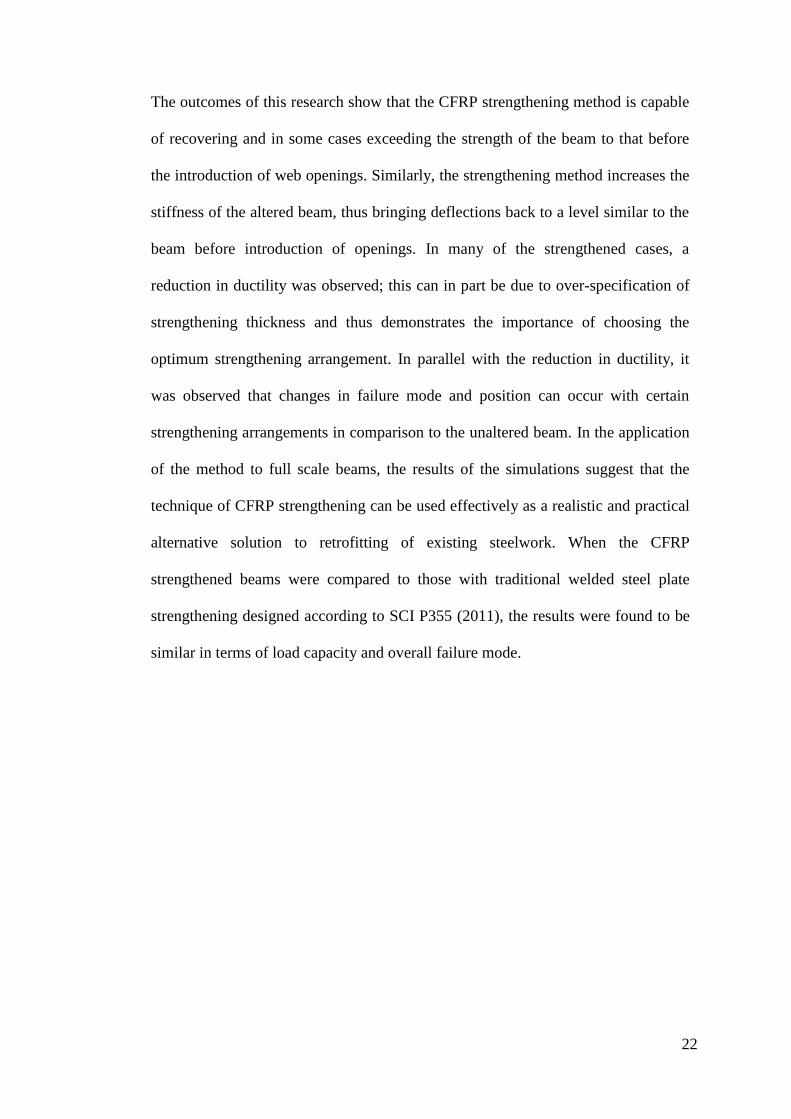
2.3.1.3 Web-post buckling
The horizontal shear force in the web-post is associated with a double curvature
bending over the height of the web-post; one inclined edge of the web opening will
be stressed in tension, and the opposite edge in compression, and so buckling will
cause the web-post to twist along its height, as shown in Figure 2-3.
40
Figure 2-3 Web post buckling failure mode and corresponding Von Mises stress
(MPa).
2.3.2 Failure mode studies
Many studies have been conducted on the failure modes of steel beams with web
penetrations without FRP; this research started in the middle of the last century.
Redwood & McCutcheon (1968) presented three types of failure mechanisms for
beams with rectangular openings in the web: single opening failure, interaction
failure including two or more holes and failure through shear in the web post. The
results reported the ultimate load necessary for each failure mechanism to occur,
and assumed that the beam being analysed would fail through the mechanism which
required the smallest ultimate load to form.
In the same context, the failure mechanisms were also studied by Hosain & Spiers
(1971), but for simply supported castellated steel beams under various load systems,
to investigate the yielding and rupture of the welded joints of these beams. Local
buckling was prevented by providing full depth stiffeners and sufficient lateral
bracings were also provided to prevent premature lateral buckling. Sudden weld
rupture was the common mode of failure for all beams.

41
Hosain & Speirs (1975) later investigated the failure modes of 10 castellated beams
with different beam length, web opening geometry and spacing between openings.
All beams were simply supported while adequate lateral bracing and full depth
stiffeners were provided. Five beams failed due to web buckling directly under the
point of load application, three beams failed due to the formation of plastic hinges
at the corners of the web openings where both shear and moment forces were
acting, and the last two beams had flexural failure.
The buckling of the web-post between web openings of castellated beams was
studied by Zaarour & Redwood (1996) for 12 beams with different depths,
experimentally and numerically. Lateral support was provided in the form of a
vertically aligned greased bearing plate to prevent lateral torsional buckling. FE
analysis of the web post, taking into account inelastic action, was used to predict the
web-post buckling loads. The results showed that the possibility of web-post
buckling as a governing design criterion increased significantly in the deeper beam,
as shown in Figure 2-4.
Figure 2-4 Web-post buckling failure (Zaarour & Redwood 1996).
In an experimental study, four perforated beams with identical cross sections and
opening configurations were tested by Demirdjian (1999). All the beams were

42
simply supported and a central single concentrated load. The main focus of this
experimental study was to investigate the buckling failure of the web-post between
web openings. The results showed that all the beams failed due to web-post
buckling. Test conditions were then simulated by elastic finite element analysis; the
maximum test loads of all the beams exceeded the buckling loads obtained from
finite element analysis with margins ranging from four to 14%.
Furthermore, a numerical study on steel beams with various shapes and sizes of
web openings was conducted by Liu & Chung (2003) to investigate shear-moment
interaction and failure mode. All simply supported beams were under uniformly
distributed load with a span of 12m.The web openings were concentric to the mid-
height of the sections, located at different positions along the beams’ length. The
perforated beam at location 1 was under pure shear without any global moment,
unlike position 4, while interaction between global shear force and global moment
at positions 2 and 3 was significant, as shown in Figure 2-5. It was found that the
yield patterns were common of failure modes for all steel and the most important
parameter in assessing the structural behaviour of perforated beams was the length
of the T-sections above and below the web opening, as it controls the magnitude of
the local Vierendeel moments acting on the T-sections. Furthermore, the global
shear-moment interaction curves were a similar shape, and thus it is possible to
derive empirical shear-moment interaction curves to assess the load capacities of all
steel beams with web openings of various shapes and sizes.

43
Figure 2-5 Opening locations of perforated sections (Liu & Chung 2003).
Finally, an experimental and analytical study on the failure mode of steel beams
with web openings was presented by Tsavdaridis & D’Mello (2011). Twelve
specimens with different web opening shapes were tested to investigate the failure
mode and load strength of the web-post between two adjacent web openings. Test
results were developed and analysed by the finite element method and the results
were compared with the full-scale experiments. The effect of web opening
spacing/web opening depth was studied to investigate the effective ‘strut’ action of
the web-post buckling. The effect of the web opening depth/web thickness was also
studied to investigate the stability (slenderness) of the web-post subjected to vertical
shear load.
From these previous studies, although they used different parametric studies in
terms of opening shape, opening size, single opening or multi-openings, and most
of them involved the failure mode shapes, none of them studied the possibility of
maintaining the beam strength and stiffness using FRP plates or section after
inserting the web opening.

44
2.3.3 Approaches to reinforcing the web opening
2.3.3.1.1 Hicks & Lawson approach (SCI, 2011)
Using a steel stiffener is the only technique that has been applied to strengthening
the web opening in steel beams. SCI publication P355 (Hicks & Lawson 2011)
suggested a design guide using horizontal stiffeners formed from steel plates and
welded to the top and bottom edges of the openings on one or both sides, as shown
in Figure 2-6. This technique can help to transfer the forces around the openings
and prevent local web buckling. In addition to the limitations in Figure 2-6, the
following rules may be used in selecting the stiffener size:
𝑡𝑟𝑡𝑤
≤ 1.2 (𝑙𝑣
2𝑏𝑟)
2-1
Where:
𝑙𝑣 is the anchorage length of the stiffener
𝑡𝑟 is the thickness of the stiffener, 8𝑚𝑚 ≤ 𝑡𝑟 ≤ 20𝑚𝑚
𝑡𝑤 is the thickness of the web
𝑏𝑟 is the width of the stiffener, 𝑏𝑟 ≤ 10 𝑡𝑟휀 , 휀 = √235
𝑓𝑦
Figure 2-6 Detailing the limits of the reinforced web opening.

45
2.3.3.1.2 Darwin approach (AISC, 1990)
Instead of giving the stiffening geometry, the American Institute of Steel
Construction adopts the calculation of the nominal capacity of a steel member with
a web opening in pure bending, 𝑀𝑛 is expressed in terms of the capacity of the
member without an opening, 𝑀𝑝.
for 𝑡𝑤 𝑒 ≥ 𝐴𝑟 𝑀𝑛 = 𝑀𝑝 [1 −∆𝐴𝑠 (
ℎ𝑜
4 + 𝑒 −𝐴𝑟
2𝑡𝑤)
𝑍]
2-2
for 𝑡𝑤 𝑒 < 𝐴𝑟 𝑀𝑛 = 𝑀𝑝
[
1 −
𝑡𝑤 (ℎ𝑜
2
4 + ℎ𝑜𝑒 − 𝑒2) − 𝐴𝑟ℎ𝑜
𝑍
]
2-3
In which:
𝑀𝑝 = 𝑓𝑦 𝑍
∆𝐴𝑠 = ℎ𝑜𝑡𝑤 − 2𝐴𝑟
ℎ𝑜: opening depth
𝑡𝑤: web thickness
e : opening eccentricity, see Figure 2-7.
Z : plastic modulus of section without opening.
Figure 2-7 Reinforced opening configurations for steel beams.

46
The drawback of this approach is that there is not enough information about the
stiffener geometry, such as the anchorage length of the stiffener and the stiffener
position, which can make it more difficult to use it as a technical guide compared to
the Hicks & Lawson Approach. Therefore, the Hicks & Lawson Approach will be
used in this study in Chapter 7 to design steel stiffeners and compare it with the
CFRP strengthening study approach, for the steel beams with web openings.
2.4 FRP-strengthening of metallic structures
The success of FRP composites in strengthening concrete structures encourages
engineers to use them for the strengthening and repair of steel structures in place of
conventional methods using steel strengthening. This allows welding requirements
such as large scaffolding and heavy lifting to be avoided.
Although the use of FRP composite materials for the strengthening of steel
structures started in the late 20th
century, it has increased rapidly since the start of
the 21st century. A review of the use of FRP composites for strengthening steel
structures is given below.
2.4.1 FRP strengthening of existing steel bridges
Several metallic beams in bridges and other structures have been strengthened with
CFRP composites worldwide to increase the live load and necessary expansions.
In the UK, the Hythe Bridge over the River Thames was strengthened with normal
modulus CFRP plates, 112GPa, to increase the load-carrying capacity in bending
from 7.5 tonnes to 40 tonnes (Hollaway & Cadei, 2002). A London underground

47
steel bridge at Acton in west London was also strengthened with HM-CFRP plates,
310GPa, to reduce the live load stresses by 25% and improve its fatigue resistance
(Moy & Bloodworth, 2007). The King Street Railway Bridge in Mold was
strengthened with HM-CFRP strips, 360GPa, which helped strengthen six cast iron
girders to allow 40-tonne vehicles to use the bridge (CNR-DT 202, 2007).
In Delaware, in the USA, two bridges, 1-704 and I-95, were strengthened using
normal modulus CFRP plates, 112GPa (Miller et al., 2001). After the retrofitting,
the measured strain in the tension flange of the steel girder was reduced by 15% and
the girder stiffness was increased by 12%. The Sauvie Island Bridge in Washington
was strengthened using a normal modulus CFRP strip, 138GPa, bonded to an
aluminium honeycomb core (Mosallam, 2007).The aluminium core was added to
increase the distance of the CFRP strip from the neutral axis of the steel beam, thus
increasing the stiffness of the member.
In Japan, the Takiguchi Bridge in Tokyo was strengthened using UHM-CFRP
plates, 450GPa. The bridge girders were strengthened by bonding 4mm thick
laminates along the bottom of the tension flange to create a maximum laminate
thickness of 14 mm at mid-span (Peiris, 2011).
2.4.2 Previous studies on FRP strengthening of steel structures
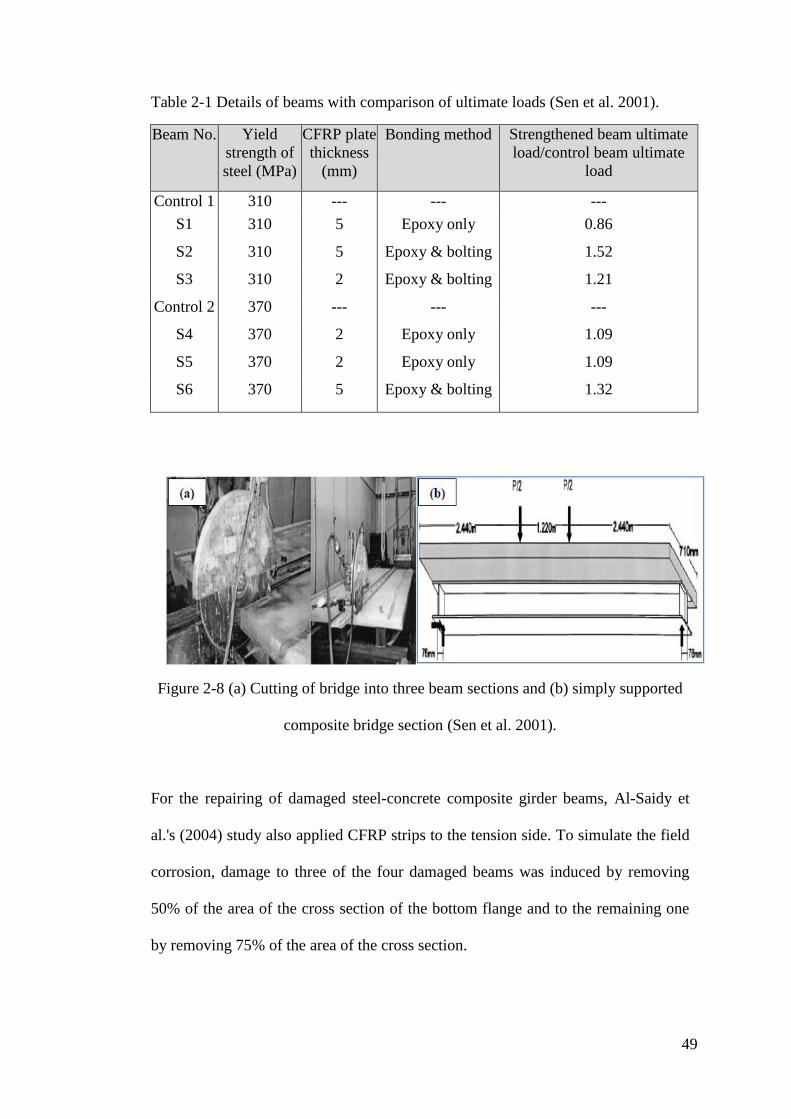
Experimental and analytical work was conducted for six beams by Sen et al. (2001)
to investigate the feasibility of using CFRP strips to repair steel-concrete composite
bridge members. To simulate this effect, all the specimens were pre-loaded under a
four-point load to give permanent deformations in each member before CFRP
repairing. The average pre-loading was 142 kN and 187 kN for the specimens with
the steel yield strengths of 310 MPa and 370 MPa respectively. The beams were

48
named S1 to S6, and were strengthened with two thicknesses of CFRP and with
different bonding methods, as given in Table 2-1. The test specimens were obtained
by cutting each of two steel-concrete composite bridge models into three parts, as
shown in Figure 2-8(a). The resulting cross section is shown in Figure 2-8(b). The
normal weight concrete used had an average compressive strength of approximately
50 MPa.
It can be noticed from the results that the bonding method has more effect than the
CFRP thickness in repairing the damaged steel beam and the repairing process is
more vital with a lower steel grade.
49
Table 2-1 Details of beams with comparison of ultimate loads (Sen et al. 2001).
Beam No. Yield
strength of
steel (MPa)
CFRP plate
thickness
(mm)
Bonding method Strengthened beam ultimate
load/control beam ultimate
load
Control 1 310 --- --- ---
S1 310 5 Epoxy only 0.86
S2 310 5 Epoxy & bolting 1.52
S3 310 2 Epoxy & bolting 1.21
Control 2 370 --- --- ---
S4 370 2 Epoxy only 1.09
S5 370 2 Epoxy only 1.09
S6 370 5 Epoxy & bolting 1.32
Figure 2-8 (a) Cutting of bridge into three beam sections and (b) simply supported
composite bridge section (Sen et al. 2001).
For the repairing of damaged steel-concrete composite girder beams, Al-Saidy et
al.'s (2004) study also applied CFRP strips to the tension side. To simulate the field
corrosion, damage to three of the four damaged beams was induced by removing
50% of the area of the cross section of the bottom flange and to the remaining one
by removing 75% of the area of the cross section.

50
The experiment comprised six steel-concrete composite specimens in total: two
undamaged control beams, two un-repaired damaged beams with two percentages
of damage, 50% and 75%, and two CFRP-repaired damaged beams. The beams
consisted of a 76 mm thick by 812 mm wide concrete slab connected to a 3.4 m
long W8x15 structural steel beam by shear connectors, as shown in Figure 2-9. The
normal weight concrete used had an average compressive strength of approximately
33 MPa, the A572 steel had a yield strength of 364 MPa and the pultruded CFRP
strips had a modulus of elasticity of 200 GPa.
Figure 2-9 CFRP strengthening schemes.
The repair of the three damaged beams was achieved by attaching 1.4 mm thick
CFRP strips to the tension side of the steel sections. Two of the three repaired
beams had 50% and 75% of the bottom flange area removed respectively. All the
six beams were tested in a four-point static-loading system. The test results showed
that the strength of the CFRP-damaged repaired beams was not only fully restored
compared to that of the original undamaged beams, but it was also further increased
by 4 to 20%. The CFRP-repaired beams failed due to slip at the steel-concrete
Concrete slab
Shear
connecter
1.4mm
CFRP strips 51m
m
102mm

51
surface followed by the crushing of the concrete slab. Neither adhesive breakdown
nor CFRP rupture was observed at failure of the repaired beams.
Vatonec et al. (2002) investigated the behaviour of steel tubes strengthened with
different configurations of pultruded CFRP strips. The configurations comprised
bonding the CFRP strips on the top, the bottom and both the top and bottom walls
of the steel tubes. Ten steel tubes, two un-strengthened and eight CFRP-
strengthened, were tested. All specimens were 3.35 m long, TS 6x6x3/16 grade
A500 steel tubes. The CFRP strips had modulus of elasticity and ultimate strengths
of 165 GPa and 2800 MPa respectively. In tests of the first two specimens, the local
buckling of the flanges limited the full potential for the CFRP mobilisation.
Therefore, the middle-half length of the remaining eight specimens was filled with
normal-weight concrete to eliminate the flange local buckling. All the beams were
tested in a four-point loading system. Test results showed that the specimen with
the single top CFRP strip exhibited the minimum increase of 6% in flexural
strength, while that with the single top and double bottom strips exhibited the
maximum increase of 26%, compared to that of the un-strengthened specimens.
Furthermore, the CFRP strips debonded in tests of all the strengthened tubes and the
top strips debonded prior to the bottom strips in all the cases.
Colombi & Poggi (2006) conducted an experimental and numerical programme to
characterise the static behaviour of steel I-beams strengthened by pultruded CFRP
strips. The test group comprised four beams, one un-strengthened and three CFRP-
strengthened. The control specimen, TR0, was a 2500 mm long HEA 140 steel
beam. Both the TR1 and TR2 beams had one layer of CFRP strips bonded with the
bottom flange, 60 mm wide and 1.4 mm thick, using the epoxies Sikadur30 and
SikadurR330 respectively, as shown in Figure 2-10.The third strengthened beam,

52
TR3, had the bottom flange bonded with two layers of the CFRP strips using epoxy
resin Sikadur R30, as shown in Figure 2-11. The two epoxies differed in mechanical
properties. The elastic modulus and tensile strength for SikadurR30 were 4500 and
24.8 MPa and those for SikadurR330 were 3800 and 30 MPa respectively.
Figure 2-10 Specimen details for beams TR1 and TR2 (Colombi, P. & Poggi, 2006).
Figure 2-11 Specimen details for beam TR3 (Colombi, P. & Poggi 2006).
Three-point bending tests were performed using the test frame shown in Figure
2-12. The specimens TR0, TR2 and TR3 were provided with lateral supports to
prevent lateral torsional buckling, which occurred when testing specimen TR1,
which had no lateral support.

53
Figure 2-12 Testing set-up with lateral supports set up for specimens TR0, TR2 and
TR3 (Colombi, P. & Poggi 2006).
The test results showed that the ultimate loads of the CFRP-strengthened beams,
TR1, TR2 and TR3, were increased by 14%, 31% and 40% respectively, compared
to that of the control specimen, TR0. Due to the provision of lateral support and use
of a different epoxy adhesive, specimen TR2 had achieved double increase ratio in
the ultimate load than TR1.
Another application using FRP to recover the strength and stiffness of damaged
steel beams was conducted by Photiou et al. (2006). A combination of CFRP and
GFRP laminates was used in two geometric shapes to repair the artificially
damaged, rectangular hollow section (RHS) steel beams. Half of the thickness of
the tension (bottom) flange was removed to simulate the real damage. The FRP
repaired beams had been divided into two repaired sets, two beams for each, and the
control set had an undamaged-unrepaired beam and damaged-unrepaired beam. All
of them were tested in a four-point loading system and no control beam was tested.
The first set was repaired by bonding U-shaped FRP laminate unit layers to the
tension flange, while the second set was repaired by bonding a flat plate FRP

54
laminate unit. In each set, two layers – each of an ultra-high modulus CFRP, UHM-
CFRP, and a high modulus CFRP, HM-CFRP – were used respectively with a
combination of the layers of a low modulus GFRP laminate, as shown in Figure
2-13. The laminates were bonded together using Sikadur 31 epoxy adhesive. The
ultimate loads of the undamaged and damaged steel beams were determined using
the elasto-plastic analyses of the beams.
Test results showed that, due to removing half the thickness of the bottom flange,
the ultimate load of the damaged beam was reduced by approximately 18%
compared to that of the undamaged beam. The ultimate load of the damaged beam
was not only fully restored to that of the undamaged beam using the CFRP-repair,
either U-shaped or flat plate laminates, but it was also further increased by up to
30%. It also showed that the ultimate loads of the repaired beams using the HM-
CFRP laminates were approximately 11% higher than those using the UHM-CFRP
laminates because the latter had a lower ultimate strain of 0.4%; therefore, the
failure of the HM-CFRP-repaired beams was ductile, while that of the UHM-CFRP-
repaired beams was brittle.

55
Figure 2-13 Schematic diagrams of RHS steel beams repaired using (a) U-shaped
CFRP/GFRP and (b) flat plate pre-peg laminates (Photiou et al. 2006).
The effect of CFRP-strengthening on the web-buckling capacity of light steel beams
was investigated by Zao & Al-Mahaidi (2008).The test comprised 28 specimens
comprising seven control beams and 21 CFRP-strengthened beams that were tested
under compression load. The seven control specimens, LSB1 to LSB7, had web
slenderness ratios ranging from 62.5 to 125. Three strengthening techniques were
used for each type of specimen. The unidirectional fibre orientation CFRP plates
were used with appropriate adhesive bonded to their webs on the outer sides, the
inner sides or both sides, as shown in Figure 2-14. The direction of the CFRP fibre
was kept perpendicular to the longitudinal axis of the beam.

56
Figure 2-14 CFRP-strengthening of LSBs (a) outer side, (b) inner side and (c) both
sides (Zhao & Al-Mahaidi 2008).
The test results showed a significant ultimate load increase in each technique
compared to the un-strengthened beams where the ultimate loads of the beams were
increased by 40% to 200%, using the CFRP strengthening on the outer sides of the
web; using the CFRP strips on the inner sides of the web increased the ultimate
loads by 140% to 300%, and using the CFRP strips on both sides of the web
showed the highest increases of 250% to 500% in the ultimate loads of the
strengthened beams. With regard to failure mode, the debonding of CFRP strips
was a dominant failure mode for all the three types of strengthening, as shown in
Figure 2-15.
These results help to understand that the use CFRP in both sides to strengthen the
web is more important than using it in only on one side and the bond breakdown is
a failure mode in web strengthening.

57
Figure 2-15 Modes of failure of LSBs (a) un-strengthened beam, (b) CFRP on outer
side, (c) CFRP on inner side and (d) CFRP on both sides (Zhao & Al-Mahaidi
2008).
FRP-strengthening also means additional out-of-plane stiffness is provided to the
steel-plate girders that are prone to web buckling. Two specimens were tested by
Okeil et al. (2009), an un-strengthened control beam, OB1, and a GFRP-
strengthened beam, OB2. The steel-plate girder beam was 2083 mm long, 532 mm
deep with a 3.2 mm thick web, and 279 mm wide and 13 mm thick flanges, as
shown in Figure 2-16. It was divided into four panels by five vertical steel
stiffeners, 9.5 mm thick and 114 mm wide, on both sides at an equal spacing of 521
mm. The investigated mode of failure of the plate girder was web buckling;
therefore, all other possible modes in the plate girder causing failure were designed
to be avoided, such as flange buckling and stiffener buckling.
The two vertical GFRP-pultruded T-sections, GFRP stiffener in Figure 2-16, were
applied to the specimen OB2 at one end of the plate girder as the additional
stiffeners on both sides of the web. A single-point load was applied at the first
internal stiffener on one end of the plate girder.

58
Figure 2-16 Control and GFRP-strengthened specimens, OB1 and OB2 (Okeil et al.
2009).
Test results showed that the ultimate load, 389 kN, of the GFRP-strengthened
specimen, OB2, was 40% greater than that, 278 kN, of the control specimen, OB1.
If loads at the initiation of web buckling are considered, there was an improvement
of 56% because the buckling initiated at 389kN (87.5 kip) with failure in the GFRP-
strengthened specimen and at 249kN in the un-strengthened specimen. Failure in
the GFRP-strengthened specimen was initiated by a breakdown of the steel-GFRP
bond followed by immediate buckling of the web, as shown in Figure 2-17.
GFRP
Stiffener
GFRP Stiffener
Load

59
Figure 2-17 Test mode of failure of specimen OB2
(Okeil et al, 2009)
The suitability of using FRP composites to resist global buckling in steel T-sections
was investigated by Harries et al. (2009). Twenty columns were tested, four un-
strengthened columns and 16 FRP-strengthened columns. The test specimens were
T steel sections, 155 x 10.5, grade 345MPa steel, as shown in Figure 2-18(a). CFRP
strips 1.4mm thick and GFRP strips 1.4mm thick were placed on top of each other
and bonded adhesively to both sides of the web in one layer and two layers
respectively, with details as shown in Figure 2-18. The tensile strength and modulus
of elasticity of the CFRP strips were 2790 MPa and 155 GPa respectively, while
those for the GFRP strips were 895 MPa and 41.4 GPa respectively.

60
Figure 2-18 Specimen details (a) Control specimen, (b) CFRP-one layer and GFRP-
one layer and (c) CFRP-two layers and GFRP-two layers (Harries et al. 2009).
In the first set of tests for the elastic buckling, the columns were 1664 mm long.
Five steel sections, one un-strengthened and four FRP-strengthened, one of each
case, were tested. The strong and weak-axis bifurcation loads were assessed as the
loads at which an abrupt change in lateral displacement occurred about these axes.
Results showed that the strong and weak-axis bifurcation loads of the un-
strengthened specimen were increased by up to 60% and 13% respectively by the
FRP-strengthening. However, a very small increase, up to 9%, in the axial capacity
in the FRP-strengthened sections was observed as compared to that of the un-
strengthened section. In the second set of tests for the inelastic buckling, the length
of the specimen was reduced to 356 mm to avoid the flange local and torsional
buckling. Fifteen specimens, three un-strengthened and 12 FRP-strengthened, three
of each case, were tested. FRP application led to improvements of nine to 17% in
web local buckling (WLB) bifurcation loads, compared to those of the control
specimens. An increase of four to 14% was observed in the axial capacity due to
FRP-strengthening. The specimens with two 25.4 mm wide FRP strips performed
(a) (b) (c)

61
better than those with one 50.8 mm strip. Debonding of FRP strips occurred in all
tests, usually at about 75% of the peak loads, see Figure 2-19.
Figure 2-19 Debonding of CFRP strips in specimen CFRP-2 (Harries et al., 2009).
In the same context, the bonded pultruded CFRP strip was used at the beam web for
shear strengthening of steel I-beams, see Figure 2-20. Narmashiri et al. (2010) had
previously implemented FE analyses and experimental testing to investigate this.
Five specimens, as shown in Table 2-2, one control (NB1) and four CFRP-
strengthened (NB2 to NB5), were tested in a four-point loading system. The shear
zone was the web region of surrounded by two partial height stiffeners and two
flanges near the supports and was 200 mm wide and 130 mm deep, as shown in
Figure 2-20. All specimens were a 1.3 m long beam, 150 mm deep with a 6.6 mm
thick web and 100 mm wide and 10 mm thick flanges.

62
Table 2-2 Specimens used in Narmashiri et al.’s (2011) test.
Specimen Number of CFRP
Strips
Strengthening Location
NB1 - -
NB2 3 At each shear zone at each end of the beam
on both sides of the web
NB3 2 At each shear zone at each end of the beam
on both sides of the web
NB4 3 At one shear zone at each end of the beam
on the one side of the web
NB5 2 At one shear zone at each end of the beam
on the one side of the web
Figure 2-20 CFRP-strengthening and loading of specimen NB2 (Narmashiri et al,
2010).

63
The test results showed that the increase in the ultimate load of the strengthened
specimens NB2 and NB3, using three and two CFRP strips respectively on both
sides of the web, was the same, approximately 52%, compared to that of the control
specimen (NB1) while, for the strengthened specimens NB4 and NB5 using three
and two strips respectively on one side of the web only, the increases in the ultimate
loads were 43% and 35% respectively, compared to that of the control specimen
(NB1). They also showed that the control specimen failed due to flange twisting
and web crippling, as shown in Figure 2-21(a). With regard to failure mode, the
results showed that either longitudinal delamination of the CFRP strips in the area
near the applied loads or debonding of the CFRP strips in the strengthened
specimens was initiated in the strengthened specimens, as shown in Figure 2-21(b).
Finally, the CFRP strengthening decreased the shear buckling of the web.
Figure 2-21 Mode failure: (a) control specimen (b) strengthened specimen
(Narmashiri et al, 2010).
This study provides a good indication about using the CFRP strips in strengthening
the web of an I-section beam against shear buckling, and the significant
achievement is that attaching CFRP strips at both sides of the web gave a
significant increase in beam strength compared with only strengthening one side.
(a) (b)

64
Different FRP composites, adhesives and surface treatment methods were used by
Islam & Young (2013) to investigate their effect on the behaviour of stainless steel
tubular sections. A total of 57 specimens were tested under end-two-flange (ETF)
and interior-two-flange (ITF) loading conditions, as shown in Figure 2-22. Nine of
them were un-strengthened controls and 48 were FRP-strengthened. Specimens
were either rectangular hollow sections (RHS) or square hollow sections (SHS).
The tests results showed that the web buckling capacity was increased by up to 50%
due to FRP strengthening. Furthermore, the FRP debonding was the dominant
failure mode and the carbon laminate ‘Sika Carbodur H514 carbon’ and the
adhesive ‘Araldite 2015’ showed a better performance than the others by giving the
higher ultimate loads. Finally, slight differences were observed in the ultimate loads
between using a sander treatment and a grinder treatment.
Figure 2-22 Test set-up of ETF and ITF loading conditions (Islam & Young 2013).

65
In conclusion, it has been observed that the majority of the published work has
focused on the use of GFRP and CFRP composites in the tension regions of the
steel beams in order to increase the beams’ flexural strength. Although there has
been some use of the GFRP pultruded sections as intermediate and diagonal
stiffeners to strengthen the steel beams at their webs, where the failure is initiated
by out-of-plane buckling, their use as stiffeners at web openings instead of steel
stiffeners has not been investigated.
2.5 Guidelines for strengthening steel structures
It is well known that design guidelines and standards for the use of FRP
strengthening with steel structures are not as advanced as those for concrete
constructions, although a few guidelines for the use of FRP in strengthening
metallic structures have already been published throughout Europe as well as in the
USA.
The first design guidance was published in the UK by the Institution of Civil
Engineers (Moy, 2001). Elastic range and an elastic-plastic analysis were adopted to
evaluate the strength of a metallic structure strengthened with FRP materials.
Furthermore, it suggested partial factors for material to consider the effects of short-
term and long-term behaviour.
Another design guideline was also published in the UK, by CIRIA C595 (Cadei et
al., 2004) for strengthening metallic structures using FRP materials. In this
guidance, elasto-plastic analysis was also used beyond the elastic range for steel
beams and steel-concrete composite girders. It also reports that the debonding
failure of the strengthening system can be prevented if the maximum principle

66
stress in the adhesive joint does not exceed the strength of the adhesive obtained
from lap-shear tests. In addition, the material partial factor was considered to
include the environment and time effect.
In 2006, Schnerch et al. (2006) proposed design guidelines in the USA for
strengthening steel concrete composite beams with high modulus CFRP
composites. The guidelines stated that the allowable increase in live load for a
strengthened girder should be selected to satisfy serviceability, safety and
redundancy conditions.
Recently, the Italian National Research Council published state-of-the-art
guidelines on the design, installation and monitoring of an externally bonded FRP
system for strengthening existing metallic structures (CNR-DT202, 2007). The
guidelines recommend the use of material partial factors to ensure a structure’s
safety. The stresses analyses are similar to those proposed by the CIRIA C595
(Cadei et al. , 2004) guidance.
No guidance was given for the FRP-strengthening of the web opening in the
existing steel members where the failure is related to the location of the opening.

67
2.6 Summary
The review has revealed for FRP strengthened steel beams the following:
1. Vierendeel, bending and web-post buckling were the main modes of failure
of steel beams with web openings.
2. The rectangular web openings have more detrimental effect on beam
strength than circular openings.
3. Little attention has been given to apply the FRP composites on steel beam
webs as a stiffener against the out-of-plane buckling. However, the use of
FRP composites as stiffeners at web openings instead of steel stiffeners has
not been investigated.
4. Since the failure mode for FRP-strengthened steel structures is generally
initiated by a breakdown of the adhesive bond, the adhesive properties have
a great influence on the joint durability.
5. The surface preparation is one of the most important factors to be considered
in order to achieve a strong adhesive bond.
6. The adhesive thickness has only a small influence on the strength of the
adhesive joint.
7. In order to further strengthen the bond between the FRP composites and the
steel surface, after bonding the adherents should be held together until the
curing of the adhesive is complete.
Most of the previous studies focused at the effect of FRP composites configurations
and material properties on the flexural and shear strength of the steel beams.
Therefore, there were no numerical and experimental studies conducted to reinforce
the web opening of the steel beam. This Thesis will adopt this experimentally and
numerically in the next chapters.
68
CHAPTER 3 3
DESCRIPTION OF NUMERICAL MODEL
AND VALIDATION
3.1 Introduction
The chapter starts by giving an overview of the adopted numerical modelling
procedure in ABAQUS, covering the main parameters such as solver type and
element description. This is followed by comparative studies between the ABAQUS
simulation and three different test results for steel beams with and without
strengthening. The experimental tests used for the validation study are namely those
of: (Tsavdaridis & D’Mello 2011), (Linghoff et al. 2009) and (Deng & Lee ,2007).
3.2 Solver type
Standard analysis in ABAQUS consists of two main analysis approaches: Implicit
and Explicit. Implicit uses the Newton-Raphson iteration method to solve the
equation ∆𝑢 = 𝐾−1∆𝐹 with relatively large time steps, while this equation is solved
directly with very small time steps by the Explicit solver.
One advantage of the explicit procedure over the implicit procedure is the greater
ease with which it resolves complicated FRP debonding problems (Chen et al.,
2015). In addition, as models become very large, the explicit procedure requires
fewer system resources than the implicit procedure.
69
Applying the explicit dynamic procedure to quasi-static problems requires some
special considerations to achieve a solution in a short amount of time and without
dynamic effect.
Use the frequency analysis to find the member natural frequency corresponding to
the expected failure mode.
Use the smooth load amplitude called SMOOTH STEP using *AMPLITUDE,
DEFINITION=SMOOTH STEP, ABAQUS/Explicit, which can automatically
connect each of the data pairs with curves whose first and second derivatives are
smooth and whose slopes are zero at each of the data points.
Use the suitable time in this amplitude, which can be obtained from:
𝑡 = 1𝑓⁄
3-1
Where 𝑓 is the member natural frequency of the desired failure mode
extracted from the frequency analysis.
Therefore, in this research, the explicit solver was employed to conduct 3-D
nonlinear FE simulations. Both material and geometric nonlinearities were
considered. In order to capture the large deformation and local instability effects in
the 3-D FE models, the geometric nonlinearity was taken into consideration by
activating the optimal parameter “NLGEOM” in ABAQUS.
3.3 Material modelling
3.3.1 Steel
Either shell or solid elements may be used for modelling steel beams. Use of shell
elements is preferred here owing to their superior computational efficiency. S4 and
S4R are the two quadrilateral shell elements in ABAQUS with full and reduced
integration respectively: S4 having four integration points and S4R having one.

70
Since the S4 element has more integration points that take longer to run the
simulation, it was decided to use the S4R element, which has four nodes and six
degrees of freedom (three translations and three rotations) in each node.
3.3.2 Cohesive
To model the steel/adhesive/CFRP interface, there are two approaches in ABAQUS
to model the adhesive behaviour in composite layers, cohesive elements and
cohesive surfaces.
3.3.2.1 Cohesive surfaces approach
This approach is called the surface-based cohesive approach; it is represented by the
surface interaction properties that are assigned to a contact pair using the finite-
sliding, node-to-surface formulation. A cohesive surface is more desirable to begin
the analysis with the surfaces just touching each other. Consequently, cohesive
surfaces are never affected by interface thickness (ABAQUS, 2013). Although the
surface-based cohesive approach is widely used, its utilisation is limited to cases in
which the adhesive thickness is negligibly small. Moreover, it is not supported in
the ABAQUS/Explicit solver.
3.3.2.2 Cohesive elements approach
ABAQUS offers an alternative approach to define adhesive joints with
ABAQUS/Implicit and ABAQUS/Explicit solver. The main aspect of this approach
is that constitutive thickness has a noticeable effect on the interface behaviour
because the nodal coordinates of the cohesive elements are calculated based on the
initial thickness. Thus, the adhesive material properties such as stiffness and
strength are available in modelling the cohesive. This is implemented by using the
tie constraint of the cohesive element, COH3D8, having eight nodes, three degrees

71
of freedom in each node, surfaces to steel substrate and CFRP plate. The debonding
growth occurs along the layer of cohesive elements and without deformation into
the adjacent parts. Thus, the cohesive element approach can predict the bond
behaviour from the initial loading to the initiation of damage and then the damage
propagation.
3.3.2.3 Damage modelling of adhesive
The failure response of the bond can be modelled in both of the aforementioned
approaches using traction-separation models.
A basic bilinear traction-separation law frequently used in calculations can be seen
in Figure 3-1, where the softening after damage initiation is linear. Another
frequently used model is the one seen in Figure 3-2, where the softening after
damage initiation is described by an exponential function. In both, the damage
model consists of two stages: a damage initiation and a damage evolution. The
initial response of the cohesive surfaces is linear: after a damage criterion is met,
the traction-separation response can be defined to a user-defined damage evolution
law.
Figure 3-1 Illustration of a simple bilinear traction-separation law (ABAQUS,
2013).

72
Figure 3-2 Illustration of exponential damage evolution in a traction-separation law
(ABAQUS, 2013).
3.3.2.4 Damage initiation
ABAQUS provides four damage initiation criteria, two of them based on the stress
and the other two based on the separation; examples are the maximum nominal
stress criterion, the maximum nominal strain criterion, and the quadratic nominal
stress or strain criterion (see Figure 3-3).
Figure 3-3 Damage initiation criteria.
In this study, the quadratic nominal stress criterion is used as the damage initiation
criterion, which can be represented as:

73
1
2
max
2
max
2
max
tsn ttt
3-2
where,
tn, ts and tt are peak values of the nominal stress.
σmax is the tensile strength of the adhesive, and
τmax is the shear strength of the adhesive; the symbol < > represents the Macaulay
bracket which is used to signify that compressive stresses do not initiate damage
(i.e. tn is negative and thus <tn> is equal to zero).
3.3.2.5 Damage evolution
After damage initiation, a scalar damage variable D is introduced as the overall
damage in the material. The range of D is from 0 to 1, with 0 representing the
undamaged case and 1, the total separation. Subsequently, the corresponding stress
components are then degraded as follows:
0,
0,1
nn
nn
n tt
ttD
t
3-3
ss
tt
tDt
tDt
1
1
3-4
where, 𝑡�̅�, 𝑡�̅� and 𝑡�̅� are the stress components predicted by multiplying the initial
stiffness and the current relative displacements.
For the linear softening law, the damage index D can be expressed as:
)(
)(0max
0max
m
f
mm
mm
f
mD
3-5

74
where max
m is the maximum effective relative displacement attained during the
loading history, and 𝛿𝑚0 and 𝛿𝑚
𝑓 are the effective relative displacement at the
initiation and end of failure respectively. The effective relative displacement 𝛿𝑚𝑓
can
be written as
222
tsn
f
m 3-6
3.3.3 CFRP modelling
FRP composites are materials that consist of two constituents. The constituents
are combined at a macroscopic level and are not soluble in each other. One
constituent is the reinforcement fibre, which is embedded in the second
constituent, a continuous polymer called the matrix (Cadei et al., 2004). The
reinforcing fibres, which are typically stiffer and stronger than the matrix, take up to
70% of the compound volume. The unidirectional lamina has three mutually
orthogonal planes of material properties, where the x direction is in the same
direction as the fibres, and the y and z directions are perpendicular to the x
direction. Therefore, it is considered as an orthotropic material. This orthotropic
material is also transversely isotropic, where the properties of the FRP composites
are nearly the same in any direction perpendicular to the fibres. Thus, the properties
in the y direction are the same as those in the z direction. Thus, this material is so-
called a specially orthotropic material (Teng et al., 2015). An S4R shell element
was also used to simulate the CFRP in the numerical analysis.
The rupture of the FRP reinforcement was defined by specifying a stress-based
failure criterion: Tsai-Hill failure theory (Kollár & Springer, 2003). The input data
required for this failure envelop are tensile and compressive stress limits, 𝑋𝑡 and 𝑋𝑐,

75
in the x direction; tensile and compressive stress limits, 𝑌𝑡 and 𝑌𝑐 , in the y direction;
and shear strength (maximum shear stress), 𝑆, in the XY plane. The Tsai-Hill
failure criterion requires that:
𝐼𝐹 =
𝜎𝑥𝑥2
𝑋2 −
𝜎𝑥𝑥𝜎𝑦𝑦
𝑋2 +
𝜎𝑦𝑦2
𝑌2 +
𝜎𝑥𝑦2
𝑆2 < 1
3-7
If 𝑥𝑥 0, then 𝑋 = 𝑋𝑡; otherwise, 𝑋 = 𝑋𝑐. If 𝑦𝑦 0, then 𝑌 = 𝑌𝑡 ; otherwise,
𝑌 = 𝑌𝑐.
3.4 Tests conducted by Tsavdaridis and D’Mello (2011)
3.4.1 Test description
A cellular steel beam was tested by Tsavdaridis and D’Mello(2011) to investigate
the failure mode and load strength of the web-post between two adjacent web
openings. The simply supported steel beam has a length of 1.9m (with 1.7m clear
span between the supports) and a cross section of type UKB 457x152x52; the
dimensions and the support conditions of the steel beam are shown in Figure 3-4.
The steel material properties are shown in Table 3-1. Thick steel plate stiffeners
were welded to each beam at the mid-span and supports to avoid premature flange
local buckling.

76
Figure 3-4 Details of the tested beam.
Table 3-1 Steel test results.
Modulus of
Elasticity
(GPa)
Yield
Strength
(MPa)
Tensile
Strength
(MPa)
Strain
Poisson
Ratio Yielding
%
Ultimate
%
Web 200 375.3 492.7 0.187 25 0.3
Flange /
Stiffener 200 359.7 480.9 0.18 24 0.3
3.4.2 FE modelling
In this simulation, the general-purpose shell element S4R with reduced integration
was adopted for both the steel section and the CFRP plate. Both material
nonlinearity and geometric nonlinearity were considered in the FE models. The
three full-depth stiffeners were provided on the two sides of the web at the applied
Point Load
Dial gauge 2 Dial gauge 1
315mm
100mm
409.5mm
449.8
mm
1700mm
Stiffeners (20mmthick)

77
load and supports. Each stiffener was tied (tie option in FE) to the top flange, the
bottom flange and the web of the cross section. The load and the support conditions
were applied at the same positions in the test as shown in Figure 3-5. The material
properties of steel were the same in the test, Table 3-1, with bi-linear isotropic
model. The linear buckling analysis was implemented before the nonlinear analysis
to select the web-post failure mode as happened in the test. The initial out-of-plane
geometric of web was assumed the imperfection of 1mm. In the experimental study
of Tsavdaridis and D’Mello ( 2011), no measured initial imperfection was reported.
Redwood and Demirdjian (1998) recorded a measured maximum imperfection of
the web of about 1 mm. The validated mesh size was 15mm with uniform
distribution as shown in Figure 3-5.
Figure 3-5 Load, support and mesh conditions of FE model.
Applied load places
Support conditions
places

78
3.4.3 FE results and discussion
As the extracted results from experiment were the deflections of the beam at two
locations and the failure mode, they were compared with FE results. It can be
noticed from Figure 3-6a that the ultimate load obtained from FE simulations was
slightly higher than in the test by around 7% for both dial gauges, 1 and 2, and the
stiffness obtained from the FE simulation was much greater than that from the test.
This level of accuracy between test and FE results was achieved by Narmashiri et
al. (2012).
This can be attributed to the residual stresses in the beam left by the manufacturing
process and this effect of these stresses is not considered in the FE model.
Regarding to the failure shape, the simulated perforated steel beam was failed by
the web-post buckling due to high shear stresses. This S-shape buckling
deformation predicated in the FE simulation agreed with the test results as shown in
Figure 3-6b.

79
(a) Load verses deflection
(b) Failure modes
Figure 3-6 FE results compared with Experiment results.
0
50
100
150
200
250
300
350
0 10 20 30 40
Load
,kN
Vertical deflection, mm
Dial gauge 1-Exp.
Dial gauge 1-FE
Dial gauge 2-Exp.
Dial gauge 2-FE
Experiment
failure mode
Out-of-plane deformation, mm,
referring to the FE model failure
mode.

80
3.5 Tests conducted by Linghoff et al. (2009)
3.5.1 Test description
The selected steel beam tested by Linghoff et al. (2009) was constructed of a
standard HEA 180 profile steel beam with 200GPa as the modulus of elasticity and
was subjected to four-point bending. The net span of the beam was 1800 mm and
simply supported boundary conditions were provided. To prevent local buckling of
the web, full-depth 4 mm thick stiffeners were provided on each side of the web at
all support and loading points. To prevent lateral buckling of the beam, lateral
supports were provided at the mid-span. Two strips of 1.4 mm thick CFRP
laminate, 200GPa of elasticity modulus and 3300MPa of tensile strength, were
bonded to the lower flange using epoxy, 7GPa of elasticity modulus and 25MPa of
tensile strength, in the arrangement shown in Figure 3-7.
Figure 3-7 Details of the specimen tested by Linghoff et al. (2009).

81
3.5.2 FE modelling
Both material nonlinearity and geometric nonlinearity were considered in the FE
models. The load was applied on the top flange of the steel section at the two
loading points. The four full-depth stiffeners were provided on the two sides of the
web at the applied load and supports. Each stiffener was tied (tie option in FE) to
the top flange, the bottom flange and the web of the cross section. The load and the
support conditions were applied at the same positions in the test as shown in Figure
3-8. Since the beam was also laterally restrained along the span to prevent out of
plain torsional buckling, there was no need to implement the buckling analysis to
get the proper failure. In the absence of an experimental stress-strain curve, a bi-
linear (i.e. elastic-hardening) stress-strain model as given in Figure 3-9 was
adopted. The general-purpose shell element S4R with reduced integration was
adopted for both the steel section and the CFRP plate, while the adhesive layer was
modelled using the cohesive element COH3D8. The top and bottom surfaces of the
adhesive layer were tied to the bottom surface of the steel beam and the top surface
of the CFRP plate respectively. Due to the limited information of the CFRP and
adhesive, both of them are assumed to be linear elastic until failure. The CFRP plate
was modelled as an orthotropic (Teng et al., 2015) elastic material, see Table 3-2,
while the adhesive was modelled as an isotropic elastic material, see Table 3-3.
Table 3-2 Material properties CFRP plates of FE model.
Longitudinal modulus of elasticity, GPa 200
Transverse in-plane modulus of elasticity, GPa 20
In- plane shear modulus, GPa 3.7
out-of-plane shear modulus, GPa 2.6
Major in -plane Passion’s ratio 0.3
Out-of-plane Passion’s ratio 0.2

82
Table 3-3 Material properties the adhesive material of FE model.
Elasticity modulus , GPa 8
Shear modulus, GPa 2.6
Tensile strength, MPa 29
Sear strength, MPa 26
Figure 3-8 Load, support and mesh conditions of FE model.
Support conditions places
Applied load places
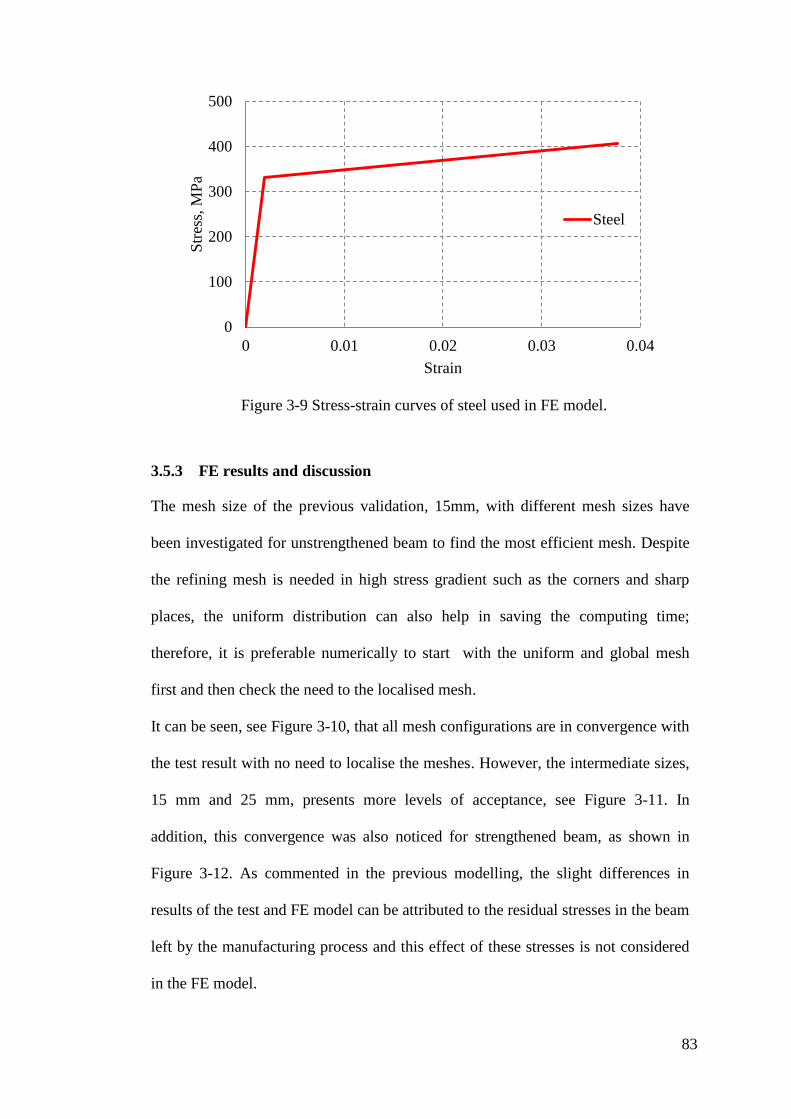
83
Figure 3-9 Stress-strain curves of steel used in FE model.
3.5.3 FE results and discussion
The mesh size of the previous validation, 15mm, with different mesh sizes have
been investigated for unstrengthened beam to find the most efficient mesh. Despite
the refining mesh is needed in high stress gradient such as the corners and sharp
places, the uniform distribution can also help in saving the computing time;
therefore, it is preferable numerically to start with the uniform and global mesh
first and then check the need to the localised mesh.
It can be seen, see Figure 3-10, that all mesh configurations are in convergence with
the test result with no need to localise the meshes. However, the intermediate sizes,
15 mm and 25 mm, presents more levels of acceptance, see Figure 3-11. In
addition, this convergence was also noticed for strengthened beam, as shown in
Figure 3-12. As commented in the previous modelling, the slight differences in
results of the test and FE model can be attributed to the residual stresses in the beam
left by the manufacturing process and this effect of these stresses is not considered
in the FE model.
0
100
200
300
400
500
0 0.01 0.02 0.03 0.04
Str
ess,
MP
a
Strain
Steel

84
Figure 3-10 Mesh size convergence.
Figure 3-11 Load–strain curve of control steel beam.
0
50
100
150
200
250
300
0 3000 6000 9000
Load
,kN
Microstrain on the beam tension flange at mid-span
Exp.
FE-10mm
FE-15mm
FE-25mm
FE-40mm
0
50
100
150
200
250
300
0 3000 6000 9000
Load
,kN
Microstrain on the beam tension flange at mid-span
Exp.
FE-Unstrengthened steel beam

85
Figure 3-12 Load–strain curve of strengthened steel beam.
Nevertheless, strain readings were also obtained for several points along the
laminate, 180mm from the mid-span, and compared with those of the tested beams
for different magnitudes of applied load (Figure 3-13). These were less than 5% as a
difference in the strain along the distance.
0
50
100
150
200
250
300
350
0 3000 6000 9000
Load
,kN
Microstrain on the beam tension flange at mid-span
Exp.
FE-Strengthened steel beam

86
Figure 3-13 Strain in the CFRP laminate near the mid-span of the strengthened beam
at different loads.
Moreover, the adhesive damage has been checked in terms of damage initiation
(QUADSCRT) and damage evolution scalar (SDEG) to verify the ability of the
finite element to capture the damage mechanism, see Figure 3-14. It can be noticed
that the maximum value of the aforementioned parameters at the beam mid-span at
0
1000
2000
3000
4000
5000
0 50 100 150 200
Mic
rost
rain
Distance from the mid-span on CFRP (mm)
177kN
Exp.
FE
0
1000
2000
3000
4000
5000
0 50 100 150 200
Mic
rost
rain
Distance from the mid-span on CFRP (mm)
251kN Exp.
FE
0
1000
2000
3000
4000
5000
0 50 100 150 200
Mic
rost
rain
Distance from the mid-span on CFRP (mm)
300kN
Exp.
FE

87
the adhesive edges due to a plastic hinge forming in the steel beam. Therefore, these
parameters have been investigated along the adhesive edge.
(a) Damage initiation (QUADSCT) of adhesive at failure load.
(b) Damage evolution scalar (SDEG) of adhesive at failure load.
Figure 3-14 the adhesive damage.
0
0.1
0.2
0.3
0.4
0.5
0.6
0.7
0.8
0.9
1
0 200 400 600 800 1000 1200 1400 1600
Dam
age
init
iati
on (
QU
AD
SC
T)
Distance along adhesive,mm
0
0.1
0.2
0.3
0.4
0.5
0.6
0.7
0.8
0.9
1
0 200 400 600 800 1000 1200 1400 1600
Dam
age
evolu
tion (
SD
EG
)
Distance along adhesive,mm

88
Finally, the top flange yielding failure, see Figure 3-15, has been reported as a
failure mode in the test work, which is confirmed in FE prediction with no CFRP
debonding. This provides that the use of enough CFRP length can prevent
debonding and gives a significant strength increase.
Figure 3-15 Von Mises stress (MPa) and corresponding deflected shape at failure.
3.6 Tests conducted by Deng and Lee (2007)
3.6.1 Test description
The simply supported steel beam that was tested by Deng and Lee (2007) has a
length of 1200mm (with 1100mm clear span between the supports) and a cross
section of type 127x76x13UKB; the dimensions and the boundary conditions of the
steel beam are shown in Figure 3-16. Grade 275 steel was used with a
corresponding tensile elastic modulus of 205 GPa. The CFRP plates had a thickness
of 3 mm, a width of 76 mm, 500mm length and an elastic modulus in the fibre
direction of 212 GPa. The epoxy resin used to bond the CFRP to the steel has a

89
tensile strength of 29.7MPa, tensile elastic modulus of 8GPa and shear modulus of
2.6GPa. Two 4mm thick steel plate stiffeners were welded to each beam at the mid-
span, one on each side of the web, to avoid premature flange local buckling.
Figure 3-16 Details of the tested specimen and mesh distribution.
3.6.2 FE modelling
As the experimental stress-strain curve of the steel was not given, a bi-linear (i.e.
elastic-hardening) stress-strain model as given in Figure 3-17 was adopted. The
general-purpose shell element S4R with reduced integration was adopted for both
the steel section and the CFRP plate, while the adhesive layer was modelled using
the cohesive element COH3D8. The load and the support conditions were applied at

90
the same positions in the test as shown in Figure 3-18. Since the beam was also
laterally restrained along the span to prevent out of plain torsional buckling, there
was no need to implement the buckling analysis to get the proper failure.
The two full-depth stiffeners were provided on the two sides of the web in the mid-
span region, and three sides of each stiffener were tied (using tie option in
ABAQUS) to the top flange, the bottom flange and the web of the cross section
respectively. Similarly, the top and bottom surfaces of the adhesive layer were tied
to the bottom surface of the steel beam and the top surface of the CFRP plate
respectively. . Due to the limited information of the CFRP and adhesive, both of
them are assumed to be linear elastic until failure. The CFRP plate was modelled as
an orthotropic elastic material, see Table 3-4, while the adhesive was modelled as
an isotropic elastic material, see Table 3-5. The validated mesh size was 15mm with
a quadric distribution as shown in Figure 3-18.
Figure 3-17 FE Model of steel material properties.
0
100
200
300
400
500
0 0.05 0.1 0.15 0.2
Str
ess,
MP
a
Strain
Steel

91
Figure 3-18 Load, support and mesh conditions of FE model.
Table 3-4 Material properties CFRP plates of FE model.
Longitudinal modulus of elasticity, GPa 212
Transverse in-plane modulus of elasticity, GPa 21
In- plane shear modulus, GPa 4
out-of-plane shear modulus, GPa 2.8
Major in -plane Passion’s ratio 0.3
Out-of-plane Passion’s ratio 0.2
Table 3-5 Material properties the adhesive material of FE model.
Elasticity modulus , GPa 8
Shear modulus, GPa 2.6
Tensile strength, MPa 29
Sear strength, MPa 26
Support conditions
places
Applied load
places

92
3.6.3 Results and discussion
The predictions are compared with the experimental load-displacement curve of the
control beam (un-strengthened beam) in Figure 3-19. The FE result is seen to agree
with the test result, with small differences between the two curves. In both the
experimental and numerical models, the beam failed by compression flange
buckling.
Figure 3-19 Load displacement curve of control steel beam.
In the case of the strengthened beam, failure in the experiment was initiated by end
debonding of the CFRP plate at 149kN. The same failure mode was predicted by
the FE model, which failed at 138kN. The load-deflection curve obtained from the
FE model is compared with the experimental curve in Figure 3-20. The FE model is
close to the experimental curve except it has a lower value at ultimate load by 7%,
which represents the debonding load. This value of accuracy between the
experiment and FE results was achieved by Narmashiri et al. (2012).
0
20
40
60
80
100
120
140
0 5 10 15 20
Load
,kN
Midspan deflection,mm
FE
Exp.

93
As explained before, these differences between test and FE results may attribute to
the residual stress in test’s beam which is not included in FE model.
Figure 3-20 Load displacement curve of strengthened steel beam.
Moreover, the strain distribution was measured experimentally along the CFRP and
is compared with FE results, as shown in Figure 3-21to Figure 3-24. It is believed
that these results reflect an acceptable agreement. It can be seen clearly that the
CFRP strain decreases from the centre to the ends where the load is applied.
0
20
40
60
80
100
120
140
160
0 5 10 15 20
Load
,kN
Midspan deflection,mm
FE
Exp.

94
Figure 3-21 Strain readings on CFRP plate at strain gauge G3 in experiment and FE
models.
Figure 3-22 Strain readings on CFRP plate at stain gauge G5 in experiment and FE
model.
0
1000
2000
3000
4000
5000
6000
0 50 100 150
Str
ain (
με)
Load (kN)
G3
G3 FE
G3 Exp
0
1000
2000
3000
4000
5000
6000
0 50 100 150
Str
ain (
με)
Load (kN)
G5
G5 FE
G5 Exp

95
Figure 3-23 Strain readings on CFRP plate at strain gauge G6 in experiment and FE
models.
Figure 3-24 Strain readings on CFRP plate at strain gauge G7 in experiment and FE
models.
Finally, the failure mode was CFRP debonding followed by top flange yielding,
which was also reported in the test work as shown in Figure 3-25.
0
1000
2000
3000
4000
5000
6000
0 50 100 150
Str
ain (
με)
Load (kN)
G6 G6 FE
G6 Exp
0
1000
2000
3000
4000
5000
6000
0 50 100 150
Str
ain (
με)
Load (kN)
G7
G7 FE
G7 Exp

96
Figure 3-25 Strengthened beam failure mode and corresponding Von Mises stress
(MPa).
Using the model approach described in the preceding sections, an investigation of
CFRP strengthening configurations will now be conducted for the case of a beam
with web openings.
3.7 Investigation of CFRP strengthening for steel beams with web openings
In this section, the ability of strengthening steel beams is considered after
introducing web openings using CFRP plates in different arrangement
configurations. This study helps to give a clear idea about the experiment which
was subsequently conducted.
3.7.1 Model description
A simply supported 457*152.4*13 UKB with 3m clear length was used with
rectangular web openings in different locations to examine the possible failure
modes (see 3.7.3) and suggest the most effective methods of strengthening. The
beam section size was chosen as being typical of floor beam sections used in
practice for multi-storey frame buildings. The beam is prevented from lateral
Top flange
yielding
CFRP debonding

97
translation in the z-direction and is uniformly loaded in y-direction, as shown in
Figure 3-26.
Figure 3-26 Model description and boundary condition.
3.7.2 FE modelling
A bi-linear stress-strain model as was adopted with nominal yield strength of
275MPa with an elastic modulus of 200GPa as shown in Figure 3-27. The CFRP
plates were 25mm wide and CFRP equal angles were 25*25mm with material
properties as shown in Table 3-4. The elastic modulus in the fibre direction was
212GPa with 3mm thickness in all cases. Coupled cohesive behaviour of the
adhesive layer with tensile strength of 29.7MPa, tensile elastic modulus of 8GPa
and shear modulus of 2.6GPa was adopted, see Table 3-5.
The general-purpose shell element S4R with reduced integration was adopted for
both the steel section and the CFRP plate, while the adhesive layer was modelled
using the cohesive element COH3D8. The load was applied uniformly on top flange

98
while the support conditions, vertical restraint, were applied at the beam ends using
MPC constraint option in ABAQUS that shares the entire cross section to prevent
the stress localisation, see Figure 3-28. Since the beam was also laterally restrained
along the span to prevent out of plain torsional buckling, there was no need to
implement the buckling analysis to get the proper failure except it was needed in
web-post buckling failure.
The top and bottom surfaces of the adhesive layer were tied to the steel beam’s
surface and the CFRP surface respectively. The CFRP plate was modelled as an
orthotropic elastic material, see Table 3-4, while the adhesive was modelled as an
isotropic elastic material, see Table 3-5. As previously, the mesh was based on a
15mm element grid as shown in Figure 3-28.
Figure 3-27 FE Model of steel material properties.
0
100
200
300
400
500
0 0.05 0.1 0.15
Str
ess,
MP
a
Strain
Steel

99
Figure 3-28 Load, support and mesh conditions of FE models.
Appling uniform load at top
flange’s surface
Appling lateral restraining at
top flange’s edges
Appling support
conditions, vertical
restraint, at centre
of MPC

100
3.7.3 Failure modes
3.7.3.1 Vierendeel failure
To simulate this type of failure as shown in Figure 3-29, an opening in the high
shear region is introduced. Transfer of the shear force across the opening causes
secondary moments in the T-section above the opening. Six different
configurations, A to F, using plates, pultrusion or a combination of both have been
modelled to find the most efficient strengthening system.
Table 3-6 and Figure 3-30 show the CFRP plate and angle configurations that have
been used for strengthening, each with the same thickness.
Figure 3-29 Shear failure mode and corresponding Von Mises stress (MPa) for beam
without strengthening.
Figure 3-30 CFRP locations at opening of the beam.

101
Table 3-6 CFRP configuration of strengthening.
Specimen Description CFRP
Length
Symbol Section
CFRP plate strengthening above and below the
opening
4×opening
length
A
CFRP plate strengthening above and below the
opening, and beneath the top and bottom flange.
4×opening
length
B
CFRP plate strengthening above and below the
opening, and beneath the top and bottom flange.
3×opening
length
C
CFRP plate strengthening above and below the
opening, and beneath the top and bottom flange.
2×opening
length
D
CFRP angle strengthening above and below the
opening.
4×opening
length
E
CFRP angle strengthening above and below the
opening, and CFRP plate strengthening beneath
the top and bottom flange.
4×opening
length
F

102
The use of these configurations gives different percentages of the strength and
stiffness recovery of the beam after introduction of the opening, depending on the
strengthening location and strengthening stiffness, as shown in Figure 3-31.
Although the specimens B, C and F have different strengthening lengths, they all
obtained a significant strength and stiffness recovery. This was achieved before the
first onset of de-bonding, which occurred at a load of 865kN for the horizontal
strengthening at top and bottom flanges and this also coincided with top flange
yielding. Specimen F, which incorporates angle strengthening, gives the same
strength recovery that has been achieved in specimens B and C with plate
strengthening; in all three cases, failure was due to debonding at the same load
level. However, this strength and stiffness recovery was not observed in the other
beams, which failed in a brittle manner due to the absence of CFRP in the top and
bottom flanges.
Figure 3-31 Load deflection curve for the steel beam with different configurations of
strengthening.
0
100
200
300
400
500
600
700
800
900
1000
0 5 10 15 20 25 30 35
Load
,kN
Mid-span deflection, mm
without CFRP solid
A B
C D
E F

103
3.7.3.2 Flexural failure
The buckling T-section above the web opening is the common failure of this
opening location type, as shown in Figure 3-32.
Figure 3-32 Bending failure mode and corresponding Von Mises stress (MPa) for
beam without strengthening.
Figure 3-33 illustrates the load displacement curves of the same configurations
shown in Table 3-6 that have been utilised to strengthen the steel beam with web
opening at mid-span. It can be seen that the configurations B and F have
demonstrated significant strength increases of 20% and 17% respectively, more
than the solid beam strength but with different behaviour for both: ductile for B and
brittle for F; this is due to the different CFRP elements in the latter debonding
simultaneously. Configuration C, which has the same layout as B with a lesser
bonded length, showed a good strength recovery with a slight increase until
debonding occurred at the top flange strengthening; this layout showed a reasonable
level of ductility. The configurations A and C exhibited full strength recovery but
with earlier debonding of the strengthening system.

104
Figure 3-33 Load deflection curve of central opening steel beam with different
configurations of strengthening.
3.7.3.3 Web-post buckling failure
In web-post buckling, three plastic hinges are generated at the middle and ends of
the top T-section in addition to the plastic hinge in the middle of the web-post, as
shown in Figure 3-34; therefore, these zones may benefit from an increase in
effective section by addition of CFRP sections and profiles with different
configurations, as mentioned in Table 3-6. With a view to significantly increasing
the effective section properties profiled, pultruded angles (25*25mm) were added to
the configuration; this is subsequently referred to as B+web angle.
0
200
400
600
800
1000
1200
0 5 10 15 20 25 30 35
Load
,kN
Mid-span deflection,mm
without CFRP solid
A B
C D
E F

105
Figure 3-34 Web post buckling failure mode and corresponding Von Mises stress
(MPa) for beam without strengthening.
Figure 3-35 illustrates the load-deflection behaviour of the beam in each case; note
that for all configurations the same effective CFRP thickness of 3mm was adopted.
It can be noticed that there are different percentages of strength and stiffness
recovery of the beam depending on the strengthening location and strengthening
stiffness. Configurations B, C, E and F have provided a significant stiffness
recovery for the beam with the opening compared with the solid beam. The
significant strength recovery has been recorded with configurations B, B+web angle
and F with nearly the same value of 15%, while the A configuration has given just
5%. Despite the fact that the addition of the pultrusion angle in beam B+web angle
provided a considerable strength recovery, it could not significantly reduce the
stiffness loss, especially when the web post angle started to debond. Neither the C
configuration, which has a CFRP bonded length of three times the opening length,
nor the configuration D, which has a CFRP bonded length of two times the opening
length, showed strength recovery, but there was a slight stiffness increase with the
C configuration. It is worth mentioning that non-ductile failure is dominant in this
type of opening configuration due to the sudden buckling of the web post.

106
Figure 3-35 Load deflection curve of beam with two central openings and different
configurations of strengthening.
0
200
400
600
800
1000
1200
0 5 10 15 20 25 30 35
Load
,kN
Mid-span deflection, mm
without CFRP solid
A B
C D
E F
B+web angle

107
3.8 Assumptions and limitations
The numerical results obtained in this chapter are based on the following
assumptions:
1. A uniform mesh throughout has been used for all FE models. This has been
adopted for expediency of the analysis and has been shown to be adequate in
terms of accuracy for the beams examined. However, a uniform mesh may
not be able to capture accurate stress distributions in areas of high stress
gradient and concentration such as the ends of FRP plate and the corner of
openings, in these cases a localized, refined mesh may be more appropriate.
2. An idealised bi-linear (i.e. elastic-hardening) stress-strain relationship was
adopted to model the steel.
3. The general-purpose shell element S4R with reduced integration was
adopted for both the steel section and the CFRP plate.
4. Initial imperfections of steel beams are considered in the modelling of
perforated beam which was conducted Tsavdaridis and D’Mello(2011),
1mm imperfection was used in the modelling of web-post buckling.
5. The explicit solver was employed to conduct 3-D nonlinear FE simulations
with smooth step to achieve quasi-static analysis. Failure criteria for each
material were also adopted in the analysis.
6. Both material and geometric nonlinearities were considered.
7. The material properties of steel, CFRP plate and adhesive are assumed to be
as per the respective manufacturers’ declared properties.

108
3.9 Summary
This chapter has presented the results of a numerical model validation and
sensitivity study. Three different experimental tests reported in the literature were
simulated, one beam with web openings and two beams with CFRP strengthening.
Following this, the ability of CFRP strengthening of steel beams after introducing
web openings has been investigated numerically using the validated model. The
major achievements from this chapter can be summarised as:
1. Overall, the simulation results were in acceptable agreement with the
published experimental results in terms of the load-displacement relationships,
strain distribution and failure modes including the crucial phenomenon of de-
bonding.
2. Based on these validation study results, the same modelling techniques will
be applied for all future numerical models in this thesis.
3. A series of CFRP strengthening configurations have been investigated in
order to identify the most effective in terms of overall performance
enhancement, structural efficiency and practicality. Three opening scenarios
were considered i.e. central web opening, opening near the beam end and then
double opening at the centre. Generally the configuration noted as type B was
found to be the optimum in most cases.
4. For the case of the beam with the double central opening where web post
buckling failure dominated, a variant of type B strengthening which included a
CFRP angle section along the height of the web post was found to be the most
effective strengthening solution. This however may not be the most practical
configuration due to the relative scarcity of CFRP angle sections compared to
CFRP plate.

109
Since the numerical study has suggested the type B configuration is most
suitable in general, a series of beams will be tested experimentally using this
configuration in the next chapter. The three different web positions previously
outlined will be examined in order to gain greater insight into the strengthened
beams’ performance.

110
CHAPTER 4 4
EXPERIMENTAL STUDY
4.1 Introduction
The Finite Element investigation in Chapter 3 showed different strengthening
configurations for a steel beams with opening in different locations. One of these
configurations helped to recover the beam’s strength and stiffness in significant manner.
In the current study, this configuration of strengthening was used in the experimental
investigation. This experimental work comprises the tests of four specimens, one
control (without openings and un-strengthened) and the other three with different web
opening positions and the configuration of CFRP strengthening which approved in
Chapter 3. This chapter presents the structural tests, including details of test specimens,
experimental parameters, preparation methods, instrumentation, experimental setup, and
testing procedure.
4.2 Experimental setup
4.2.1 Specimen description
The experimental series consisted of 4 no. 305×102×25 UKBs with 3m clear span; one
without an opening acting as the control (B0), and three with rectangular web openings
in different locations (B1-RO, B2-RO and B3-RO). These specimens were strengthened
by CFRP plates as shown in Figure 4-1.

111
Figure 4-1 Layout of strengthened specimens and boundary conditions.
(a) B1-RO
(b) B2-RO
(c) B3-RO

112
4.2.2 Loading scheme
The typical uniform load delivered by a floor slab in practice was represented using a
rigid steel frame comprising three UC beams , one UC 203×203×60 as primary beam
and two UC 152×152×30 as secondary beams, joined together by hinges, see Figure
4-2. All the specimens were tested under 6-point bending to approximate a uniformly
distributed load.
Figure 4-2 Load frame assembly.
4.2.3 Boundary conditions
The ends of the specimens were placed on two supports. Both supports restrained the
specimen vertically and were free to rotate and move horizontally. The steel roller,
50mm, were used at each specimen end to provide this horizontal translations. In
addition, 130mm wide bearing plates at the supports were added to prevent premature
web bearing and buckling failure, in accordance with Eurocode 3(BSI, 2005), with
details and dimensions shown in Figure 4-3.
Triangulated steel frames were fabricated from I-sections (178×102×28 UKB) to form
lateral restraints, these were distributed along the beam length at 900mm c/c as shown

113
in Figure 4-4. In order to allow the specimen to deflect vertically and minimise friction
effects between the lateral support and the specimen, rigid steel spacers in combination
with 10mm thick PTFE plates were adopted.
Figure 4-3 Lateral support description and end support condition.
Lateral Support
PTFE
Spacer
Specimen
Beam
End support plates
300*130*30mm

114
Figure 4-4 Test rig arrangement.
(b) Plan view
(a) Elevation

115
4.2.4 Specimen preparation
Each specimen had a 3000mm clear span. Either one, or two, 210 x 185mm web
openings were formed in different places over the specimen length using an electric
cutter. Prior to cutting, 5mm holes were formed at the opening corners to avoid notch
formation.
In order to achieve the best bond between steel and CFRP, mechanical grinding was
employed to remove the weak oxide layer, see Figure 4-5. Then, the ground surface was
cleaned with acetone to remove any grease or oil before applying the epoxy and CFRP
layer.
(a)Flange preparation
(a)Flange preparation
Figure 4-5 Specimens preparation.

116
4.2.5 Specimen material properties
To determine the mechanical strength of the steel I-sections used for these tests, tensile
coupon tests were carried out to the specifications and guidelines in BS EN 10002-
1(EN, 2001). Three coupons were taken from two un-yielded locations (one flange and
one web) of the four steel beams tested. The average yield and the average ultimate
stresses for flange and web were determined by averaging the results obtained from all
the tensile coupon tests as shown Table 4-1. The average stress-strain curve for each
series is shown in Figure 4-6. Unidirectional pultruded carbon-fiber-reinforced polymer
(CFRP) plates, 3mm thick, were provided by Weber (Weber Building Solution, 2017).
The CFRP modulus of elasticity was 200 GPa, and the tensile strength was 2970MPa,
based on the manufacturer's details. The CFRP plates were manufactured using a
pultrusion process and had a fibre volumetric content of 70% in an epoxy resin matrix.
Two components of epoxy were used to bond the CFRP plates to the specimens. This
epoxy (Araldite 420) is manufactured by Araldite Co (Huntsman 2009) with properties
as shown in Table 4-2.
Table 4-1 Summary of the mechanical properties of steel (mean values shown).
Young’s Modulus
(GPa)
Yield stress
(MPa)
Ultimate tensile stress
(MPa)
Flange 206 412 566
Web 210 435 569

117
Figure 4-6 Mean tensile stress-strain relationship from coupon tests.
Table 4-2 Summary of the mechanical properties of Araldite 420 epoxy adhesive when
cured at room temperature for 24 hours(Huntsman 2009).
Young’s Modulus
(GPa)
Ultimate Tensile strength
(MPa)
Ultimate Shear strength
(MPa)
Strain at rupture
%
1.5 29 26 4.6
0
100
200
300
400
500
600
0 0.05 0.1 0.15 0.2 0.25 0.3
Str
ess,
MP
a
Strain
Flange
Web

118
4.2.6 Installation of CFRP plates
The CFRP plates were first cut to the desired length and their edges were ground to
obtain a flat, smooth surface. Then the resin/hardener components (A/B) of the epoxy
were mixed together with ratio of 1:2.5 by weight (Huntsman 2009). 1mm glass beads
were used in the mix at a 1% dosage to achieve a constant thickness for the epoxy layer.
After cleaning the CFRP plates from dust, the adhesive was applied in a triangular form
to allow even dispersal and then the plate was placed immediately on the desire place.
Next, when the CFRP was placed on the steel beam, the adhesive was squeezed out
from the centre to the sides, thereby reducing the possibility of air suction into the
adhesive layer. The composite was left to cure before bonding the other face of the
specimen.
In order to prevent any sliding or shifting in the CFRP plate positions, a 10mm steel
plate was placed over the CFRP with a PTFE separation layer to avoid unintentional
bonding as shown in Figure 4-7.

119
Figure 4-7 CFRP plate application process.
(a) Fixing of CFRP plates showing temporary weight during curing
(b) Upturned specimens during curing of adhesive

120
4.2.7 Strain and deflection measurement
Strain gauges were mounted on every CFRP strip parallel to the fibre direction, and on
each specimen at 20mm from the plate end in view of the findings of Deng et al. (2004)
and Linghoff et al. (2009) in which they recorded maximum shear stresses in this
location, details are shown in Figure 4-8. Linear Variable Displacement Transducer
(LVDT) was positioned underneath the specimens at mid-span to measure the vertical
displacement during the test. Moreover, rosette strain gauges were mounted on the steel
web near the opening corner to measure the steel strain in three directions X, Y and XY.
All beams were tested under displacement control with a rate of 2mm/min using a
500kN capacity INSTRON Universal Testing Machine. Loads and dial gauge readings
were recorded at each of these increments.
Figure 4-8 Strain gauge layouts, specimens B1-RO to B3-RO.
B1-RO
B2-RO
B3-RO
Linear SG Rosette SG

121
4.3 Summary
This chapter has presented the details of the experimental work comprising the
testing of four specimens, one control (without opening and un-strengthened) and
the rest three with different web opening positions and a CFRP strengthening
configuration corresponding to type B (as presented in Chapter 3, Table 3-6).
A purpose built test-rig which provided lateral restraint to the top flange of the test
beams at discrete points has been described. For the test series, steel coupon tests
from the parent steel were conducted to derive the stress-strain behaviour including
yield and ultimate strength. Mechanical properties of the CFRP and adhesive used
based on the respective manufacturers’ published values have been described. The
preparation and fixing process for the CFRP strengthening was also explained.
Finally, a detailed description of the experimental setup and instrumentation
including strain gauge locations, LVDT locations, etc., was given.
The next chapter presents the results obtained from the test series along with
detailed discussion on each specimen.

122
CHAPTER 5 5
EXPERIMENTAL RESULTS
5.1 Introduction
This chapter deals with the experimental data acquired from the steel specimens tests
discussed in Chapter 4. The various categories of data are presented and
typical types of behaviour are identified instead of considering each individual
test on its own. Any deviations from the general behaviour are explained.
Initially, the modes of failure and load capacity are discussed. Then, the
CFRP strengthening and steel strain, deflection, torsional buckling and steel yielding
are examined.
5.2 Results and discussion
The following section describes the results from the test series. For economy, only the
strengthened beams with openings were tested experimentally. In order to compare the
performance, the un-strengthened versions of B1-RO, B2-RO & B3-RO (denoted B1-
UO, B2-UO & B3-UO respectively) were modelled using non-linear finite element
analysis via ABAQUS. The model was validated in previous studies by the authors,
Altaee et al. (2016). The experimental behaviour of the control beam B0 provided
further opportunity to validate the model for the unstrengthened beams.

123
5.2.1 Unstrengthened beams B0, B1-UO, B2-UO & B3-UO
The numerical load displacement relationship for B1-UO to B3-UO together with the
experimental model and numerical result for the control beam B0 is presented in
Figure 5-1.
For benchmarking purposes, the Eurocode 3 (BSI, 2005) derived design strength of B0
has been included in Figure 5-1. According to Eurocode 3(BSI, 2005), for a yield
strength of 412 N/mm2, and effective length of 900mm, the moment capacity of B0
should be around 130kNm (fully restrained i.e. zero effective length moment capacity
= 140 kNm), which corresponds to an ultimate total load of around 322kN for the 6-
point bending configuration examined. At the early stages of the experiment on B0, a
linear elastic response was observed upto around 300 kN. Beyond this point, the onset
of localised yield in the top flange at mid-span was observed. Concurrent with this,
visible rotation of the top flange at mid-span was noted. On further loading, lateral
torsional buckling in the constant moment zone between the central lateral restraints
was observed as the beam eventually reached a peak load of 406kN. At this point a full
plastic hinge was developed at the mid-span top flange (see Figure 5-2a). The
experimental unloading branch of the beam was captured following dipslacement
control procedure until the rotation of the top flange reached a point at which the test
was stopped. The numerical model shows acceptable agreement with the experimental
results (Figure 5-1), with occurrence of yield in the top flange and onset of lateral
torsional buckling between the mid-span restraints at around 350kN.
As would be presumed, the FE results show that beams B1-UO, B2-UO and B3-UO all
failed at lower load levels than B0, around 15% on average and in the case of B2-UO,
a noticeably less stiff repsonse was observed. With its central opening, B1-UO
represents a 15% reduction in the plastic modulus (and associated reduction in local
moment capacity) compared to B0. In the case of beam B1-UO, after linear load

124
behaviour up to around 350kN, significant torsional rotation started in the top T-
section above the central opening, this also corresponded with the development of a
plastic hinge in the top T-section at mid-span. After peaking at around 357kN,
unloading of the beam was accompanied by further lateral buckling of the section
between the central restraints, see Figure 5-3. For beam B2-UO, yielding occurred in
both corners around the opening at a load of around 330kN, consistent with the
Vierendeel action. In beam B3-UO, yielding was observed in the top flange around
both openings after yielding in the central portion, web-post buckling was initiated at a
load of around 350kN.
5.2.2 Strengthened beams B1-RO, B2-RO & B3-RO
Figure 5-4 compares the experimental load-displacement response of strengthened
beams B1-RO, B2-RO and B3-RO with the unstrengthened control beam B0. In all
strengthened cases a stiffer response is obtained accompanied by an increase in peak
load. In each case, the degree of lateral movement of the top flange at ultimate load
was more pronounced than for B0, which meant that the experiments were stopped at
an earlier stage in the unloading branch. A summary of the results is given in Table
5-1.
Specimen B1-RO
Due to presence of CFRP plates, the stiffness of B1-RO was significantly increased in
comparison with un-strengthened specimen B0. B1-RO exhibited a fairly linear trend up
to a load of approximately 435 kN. Beyond this load level, there was evidence of the
onset of plastic hinge formation in the top flange near the end of the CFRP plate. This is
corroborated by the strain gauge output from FS1 (Figure 5-5a), which suggests onset of

125
steel yielding (2000 microstrain), assuming strain compatibility between the CFRP and
the steel. Lateral torsional buckling of the section between the central lateral restraints
was observed to start at around 470 kN. At this point, debonding of the CFRP
commenced in the top flange at the extreme edge away from the opening. Strain gauges
FS2, 3 and 4 all recorded comparatively low strains indicating the CFRP strengthening
in these locations was not working hard. The test was continued until a load level of
488kN, beyond this point the test was stopped due to excessive lateral deflection. The
final deflected shape of the beam, including the plastic hinge location is shown in
Figure 5-2b. The strain rosette readings from SS1 indicate that yielding did not take
place in the web, Figure 5-6a.
Specimen B2-RO
In comparison to B1-RO, a less-stiff response was obtained. Lateral torsional buckling
commenced at around 405kN in the zone between the central lateral restraints. Onset of
yielding was recorded at the opening corners before reaching the ultimate load, see FS4
and SS1-XY in Figure 5-5b and Figure 5-6b respectively. As in the case of B1-RO, the
test was stopped due excessive lateral displacement of the top flange and an
accompanying drop in load at around 424 kN. The final deformed shape of the beam is
shown in Figure 5-2c. The failure mode of B2-RO was different than to those for the
numerical model of the corresponding unstrengthened beam B2-UO. In B2-RO plastic
hinge formation at the mid-span top flange and lateral torsional buckling controlled,
while Vierendeel action and associated yielding around the corner opening dominated
the behaviour of B2-UO. This change in failure pattern demonstrates the influence of
the CFRP strengthening on the stress state of the member. Observation of Figure 5-1
shows that B2-UO achieved an ultimate load 334 kN (compared to 405.8 kN for B0).

126
Use of the CFRP strengthening arrangement allowed B2-RO to recover and surpass the
full strength of B0 resulting in a 5% strength enhancement. Although FS4 indicated the
strain in the CFRP at this location was relatively high, no debonding occurred in the
test.
Specimen B3-RO
B3- RO exhibited the same failure mode as B1- RO where lateral torsional buckling of
the section between the lateral restraints occurred at around 420kN. At this load level,
plastic hinge formation was also observed in the top flange near the corner of the
opening close to the mid-span, Figure 5-2d. Yielding was recorded at the opening
corners before reaching the ultimate load, see FS1 in Figure 5-5c. In similarity to B1-
RO, end debonding of the top flange CFRP commenced at ultimate load, 442kN. The
final deflected shape of the beam, including the plastic hinge location is shown in
Figure 5-2d. The strain rosette readings from SS1 indicate that yielding did not take
place in the web, Figure 5-6c. In contrast to the corresponding un-strengthened beam
B3- UO, web post buckling was not observed in the experiment. These suggests the
CFRP strengthening on the flanges and at the central web post were sufficient to delay
onset of this mode, allowing a more global failure mode to develop. Strain gauge FS5
which was mounted at the centre of the web-post strengthening returned modest strains
during the test indicating a low utilisation ratio for the CFRP at this location, Figure
5-5c. Observation of Figure 5-1 shows that B3- UO achieved an ultimate load of 334
kN (compared to 405.8 kN for B0). Use of the CFRP strengthening arrangement
allowed B3- RO to recover and surpass the full strength of B0 resulting in a 10%
strength enhancement.

127
Figure 5-1 Load versus vertical displacement at mid-span: specimens B0 & B1-RO to
B3-RO.
0
50
100
150
200
250
300
350
400
450
500
0 10 20 30 40
Load
,kN
Midspan deflection,mm
B0-Exp.
B0-FE
B1-UO
B2-UO
B3-UO
B0:EC3 Load Capacity
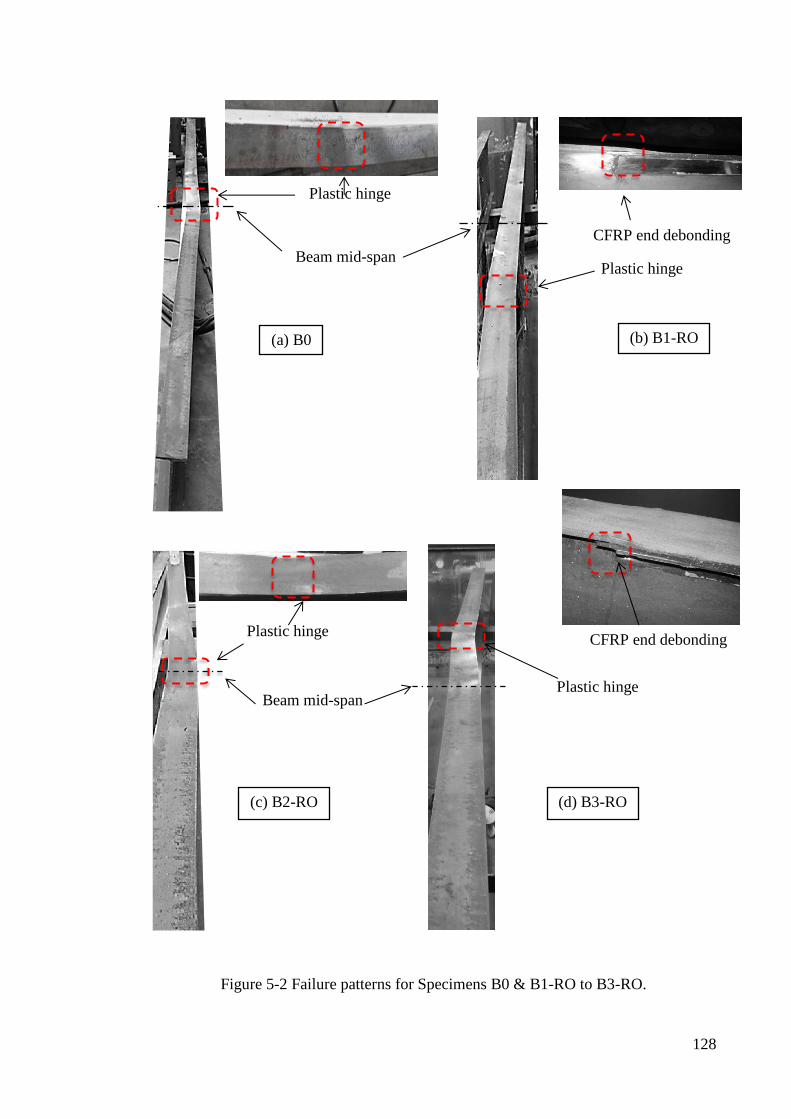
128
Figure 5-2 Failure patterns for Specimens B0 & B1-RO to B3-RO.
(a) B0 (b) B1-RO
Plastic hinge
Plastic hinge
Plastic hinge
CFRP end debonding
Plastic hinge
CFRP end debonding
Beam mid-span
Beam mid-span
(c) B2-RO (d) B3-RO

129
Figure 5-3 Failure modes and corresponding Von Mises stress (MPa) at ultimate load.
(a) B1-UO
(b) B2-UO
(c) B3-UO

130
Figure 5-4 Load versus vertical displacement at mid-span for specimens B0 & B1-RO
to B3-RO.
Table 5-1 Comparison of specimen ultimate load and failure mode.
Specimen Ultimate load
(kN)
Strength difference
with B0 (%)
Failure mode*
In sequence
B0 406 - LTB+TFY
B1-UO 357 -11.8 LTB+TFY
B2-UO 334 -17.5 YOC+VF
B3-UO 351 -13.3 WPB+TFY
B1-RO 488 20 LTB+ TFY +EDC
B2-RO 424 5 LTB+TFY
B3-RO 442 10 LTB+ TFY +EDC
*LTB: Lateral torsional buckling, WPB: Web post buckling, TFY: Top flange yielding,
EDC: End debonding of CFRP, YOC+VF: yielding of opening corner + Vierendeel
failure.
0
50
100
150
200
250
300
350
400
450
500
550
0 5 10 15 20 25 30 35 40
Load
,kN
Deflection,mm
B0
B1-RO
B2-RO
B3-RO

131
Figure 5-5 CFRP strain gauge output.
0
100
200
300
400
500
-2000 -1500 -1000 -500 0 500 1000 1500 2000
Load
,kN
Microstrain
FS1
FS2
FS3
FS4
0
100
200
300
400
500
-2000 -1500 -1000 -500 0 500 1000 1500 2000
Load
,kN
Microstrain
FS1
FS2
FS3
FS4
0
100
200
300
400
500
-2000 -1500 -1000 -500 0 500 1000 1500 2000
Load
,kN
Microstrain
FS1
FS2
FS3
FS4
FS5
(a) B1-RO
(b) B2-RO
(c) B3-RO
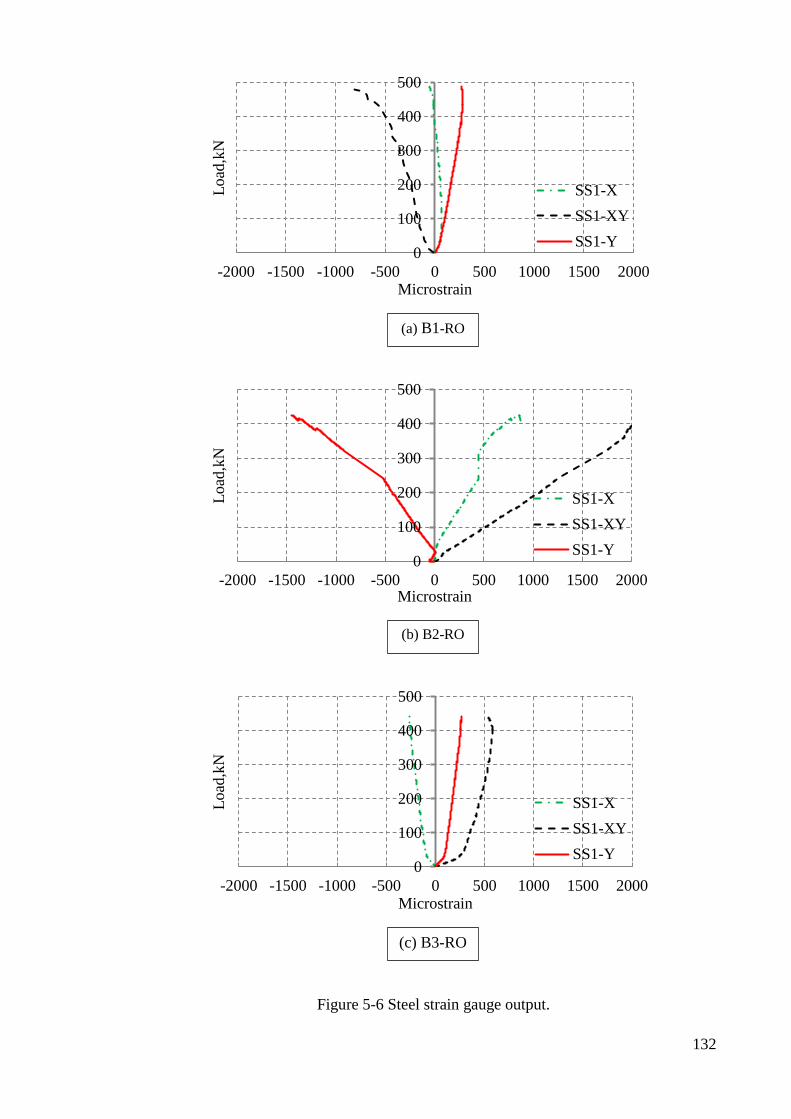
132
Figure 5-6 Steel strain gauge output.
0
100
200
300
400
500
-2000 -1500 -1000 -500 0 500 1000 1500 2000
Load
,kN
Microstrain
SS1-X
SS1-XY
SS1-Y
0
100
200
300
400
500
-2000 -1500 -1000 -500 0 500 1000 1500 2000
Load
,kN
Microstrain
SS1-X
SS1-XY
SS1-Y
0
100
200
300
400
500
-2000 -1500 -1000 -500 0 500 1000 1500 2000
Load
,kN
Microstrain
SS1-X
SS1-XY
SS1-Y
(a) B1-RO
(b) B2-RO
(c) B3-RO

133
5.3 Assumptions and limitations
1. The experimental tests were subjected to static load via six equally spaced point
loads.
2. The experiments were conducted on 305×102×25 UKB with 3m clear span.
Different failure mechanisms might govern the behaviour of longer and deeper
beams.
3. All beams were prevented to move laterally using lateral supports distributed
along the beam length at 900mm c/c. The lateral restraints were in contact with
the top flange of the beams only.
4. It is assumed that a simply supported boundary condition was created in the test
set-up. In terms of vertical movement, the bearing points of the beams were
assumed to be perfectly rigid, in reality, some minor vertical displacement may
occur.
5. The CFRP was oriented in one dimension, 3mm thick. The CFRP length was
four times the opening length. In reality the CFRP is made to a certain degree of
tolerance as specified by the manufacturer.
6. A uniform thickness of adhesive was adhesive was maintained by use of glass
sphere in the matrix. This provided a practical level of uniformity, in reality the
100% uniform thickness is impossible to achieve in practice.

134
5.4 Summary
This chapter has shown the results of the experimental part of this thesis. The main
findings of this experimental work can be drawn as:
1. This method is likely to be a useful approach in practice to recover the stiffness
and strength of beams where in-service web openings are introduced.
2. The beam’s strength was reduced after introducing of the web openings by
11.8%, 17.5 and 13.3 for B1-UO, B2-UO and B3-UO respectively.
3. This method not only helped to recover the beam's strength but also it gave an
increase with 20%, 5% and 10% for beams B1-RO, B2-RO and B3-RO
respectively compared with control beam, B0.
4. In all cases, the strengthened beams showed stiffer response and greater load
capacity than the un-strengthened beams with web openings.
5. The experiments reveal that this approach of strengthening changed the failure
location and mechanism of the strengthened beams which were not always the
same as in the un-strengthened cases, or the control case. Therefore, care must
be taken to identify and check potential failure other than those that might be
expected with strengthening.
6. No debonding was observed in the tests except end debonding which occurred
after steel yielding. Therefore, full composite action is achieved by using this
approach with Araldite 420 as the adhesive layer and implementing adequate
prior surface preparation.
Knowing the material properties of steel, CFRP and adhesive can encourage finding
more information that could not acquire from tests using FE modelling. Nevertheless,
more parametric can be investigated for CFRP strengthening of steel beams with web
openings such as the optimum CFRP thickness. This is what will be conducted in the
next chapter.

135
CHAPTER 6 6
NUMERICAL MODELLING OF
EXPERIMENTAL WORK
6.1 Introduction
In order to provide further insight into the behaviour of the specimens described in
chapters 4 and 5, a detailed finite element (FE) study is presented here. The models are
tested using ABAQUS 6.13-1, adopting the approaches described in Chapter 3.
The objectives of carrying out the FE analyses of the test specimens are:
Due to the limitation in the experimental programme, some parameters that were
not included in the experimental testing will be examined in this chapter to
provide greater insight.
Once the composite behaviour is fully understood, it can start to be used in
further parametric studies.

136
6.2 Loading and boundary conditions
All four models were analysed under the same loading and boundary conditions which
were used in the experiments, as shown in Figure 6-1.
The vertical load was applied directly to the beam at the same test places after using
the rigid plates, and the models were supported at both ends after placing the bearing
plates with the same details as the test bearing plates. Hard interaction was
implemented as contact behaviour between these plates and the specimen with
different friction coefficients. Due to the smooth surface and lubricating effect which
was used in the experiment for the support plates to allow smooth longitudinal
movement, 0.16 was used as friction coefficient between the end support’s plates and
the specimen while 0.8 (Bowden & Tabor, 2001) was used between the load plates and
the specimens that had normal steel roughness.

137
Figure 6-1 Load, support and mesh conditions of FE models.
End support
vertical restraining (Y- direction)
Lateral support
horizontal restraining
(Z-direction)
Applied load
Z
Y
X

138
6.3 Material modelling
6.3.1 Steel properties
As described in Chapter 3, the steel was modelled as an isotropic material, and true
stress-strain relationships were used where the following equations were used to
convert nominal stress and nominal strain to true stress and true strain:
휀𝑇𝑟𝑢𝑒 = 𝐿𝑛(휀𝑛𝑜𝑚𝑖𝑛𝑎𝑙 + 1) 6-1
𝜎𝑇𝑟𝑢𝑒 = 𝜎𝑛𝑜𝑚𝑖𝑛𝑎𝑙(휀𝑛𝑜𝑚𝑖𝑛𝑎𝑙 + 1) 6-2
A four-node shell element S4R, as approved in FE verification in Chapter 3, was
selected in modelling the steel member.
6.3.2 CFRP Material Properties
The linear behaviour was used in modelling the CFRP plates in the numerical
simulation, as explained previously in detail in Chapter 3. Similar to the steel beam, the
CFRP was modelled with a four-node shell element, S4R. The material properties of
CFRP were provided by the supplier (Weber Building Solution, 2014), modulus of
elasticity, tensile strength and Poisson ratio, for one direction. Due to the need for
properties in all directions to feed the CFRP damage’s criteria, explained in Chapter 3,
the material properties of other directions have been taken from a previous study
(Abdullah, 2010) which used the same material with same thickness and from same
supplier source. A summary of the material properties used for the modelling is given in
Table 6-1.

139
Table 6-1 Material properties for FRP composites (Abdullah, 2010).
Elastic Modulus
(MPa)
Poisson
Ratio
Shear modulus
(MPa)
Tensile/shear strength
(MPa)
𝐸𝑥=200000
𝐸𝑦=14050
𝐸𝑧=14050
𝜈𝑥𝑦=0.29
𝜈𝑥𝑧=0.29
𝜈𝑦𝑧=0.6
𝐺𝑥𝑦 =5127.5
𝐺𝑥𝑧 =5127.5
𝐺𝑦𝑧 =4390.6
𝑋𝑡 =2400
𝑋𝑐=2250
𝑌𝑡=69
𝑌𝑐=350
𝑆 =87
𝐸𝑥 Elastic modulus in the longitudinal direction.
𝐸𝑦 and 𝐸𝑧 Elastic modulus in the transverse directions.
𝐺𝑥𝑦 : In-plane shear modulus.
𝐺𝑥𝑧 and 𝐺𝑦𝑧 :shear modulus in the transverse directions.
𝑋𝑡 : Longitudinal tensile strength.
𝑋𝑐 : Longitudinal compressive strength.
𝑌𝑡 : Transverse tensile strength.
𝑌𝑐 : Transverse compressive strength.
𝑆 : Longitudinal shear strength.
6.3.3 Adhesive properties
Cohesive element COH3D8, an eight-node, three-dimensional cohesive element, was
used to model the adhesive material. Surface-based tie constraints were applied at
interfaces, adhesive/CFRP and adhesive/steel. The materials used are reported in Table
6-1. Traction-separation behaviour and proper failure criteria were as described in
Chapter 3, section 3.3.

140
6.3.4 Geometric imperfection
The out-of-straightness imperfection values were introduced into the FE analysis to
initiate the overall buckling mode of failure, indicated by the buckling analysis (first
stage analysis). For each beam, an initial geometric imperfection of span/1000 based
on BS EN 1090-2 (2008) was adopted in the analysis.
6.3.5 Mesh
To arrive at an efficient mesh which can be used in the numerical modelling of the test
series, four mesh schemes, with quad-dominated shape and distribution as shown in
Figure 6-1, were examined by varying the number of elements along the width of the
flange, web and along the beam length for the control beam (B0-FE), as shown in
Figure 6-2 and Table 6-2. The results obtained for the mid-span deflection versus the
load for the selected meshes showed a good convergence in terms of stiffness and
ultimate load, except for mesh 4, which was unable to match the experimental ultimate
load and produced a less stiff post-peak response compared to the other mesh
arrangements. Given the lack of difference between meshes 1, 2 and 3, it would
suggest that mesh 3 is the most efficient mesh density.
Table 6-2 Number of divisions for the mesh schemes of beam B0-FE.
Number of elements
along the web height
Number of elements
across the flange
width
Number of elements
along the beam length
1 30 10 300
2 20 6 200
3 12 4 120
4 9 2 85

141
Figure 6-2 Load mid-span deflection behaviour of different meshes.
6.4 Simulation results
In addition to the numerical verifications that have been presented in Chapter 3,
the numerical results are now also compared with the actual experimental results
reported in Chapter 5, to obtain further information not provided by the experiments.
6.4.1 Unstrengthened beams
6.4.1.1 Beam B0-FE
The numerical load displacement relationship for B0-FE exhibit a linear elastic
response up to around 350 kN, see Figure 6-3, and a slight stiffness which led to the
yielding being delayed, which was at around 300 kN of load. Beyond this point, a
localised yield in the top flange at mid-span began. Subsequently, the yielding of the
top flange allowed a plastic hinge to occur, which caused lateral torsional buckling at
mid-span at 407kN of load, see Figure 6-5, as was observed in the experiment with a
0
50
100
150
200
250
300
350
400
450
500
0 10 20 30 40
Load
,kN
Midspan deflection,mm
B0-Exp.
1
2
3
4

142
slight difference in maximum load (it was 406kN in the experiment). The model was
aborted after excessive distortion.
6.4.1.2 Beam B1-UO-FE
Due to introducing the web opening at mid-span, see Figure 6-3, the FE results show
that beam B1-UO-FE failed at lower load levels than beam B0-FE around 12%, while
the stiffness was maintained. After linear load behaviour up to around 340kN, which
was when the yielding started, significant torsional buckling started in the top T-
section above the central opening. After peaking at around 357kN, unloading of the
beam was accompanied by further lateral buckling of the section between the central
restraints, see Figure 6-6.
6.4.1.3 Beam B2-UO-FE
Although this beam showed less stiffness than beam B1-UO-FE, linear load behaviour
up to around 325kN, which was when yielding occurred in both corners around the
opening, was consistent with the Vierendeel action, see Figure 6-7. The existence of
opening at high shear area led to this reduction in stiffness and 18% in strength of the
beam see Figure 6-3.
6.4.1.4 Beam B3-UO-FE
In this beam, two web opening were introduced at mid-span. The FE results show that
beam B3-UO-FE failed at around 14% lower load levels than B0-FE, see Figure 6-3,
while the stiffness was maintained. Yielding was initiated at a load of around 336kN in
the top flange around both openings. After this, the lateral buckling started in the top
flange above the openings and was accompanied by web-post buckling in the central
part between the two openings. This lateral movement increased greatly, see Figure
6-8, until the ultimate load, 351kN, after which the load dropped and the model was
stopped.
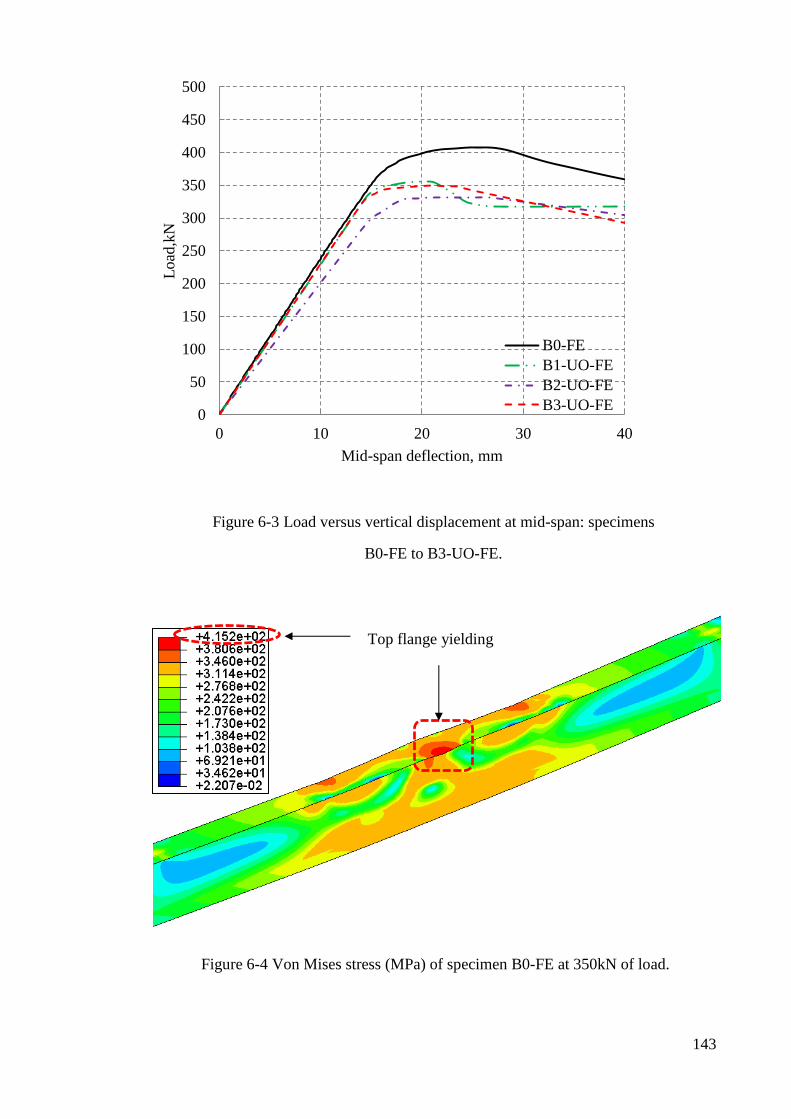
143
Figure 6-3 Load versus vertical displacement at mid-span: specimens
B0-FE to B3-UO-FE.
Figure 6-4 Von Mises stress (MPa) of specimen B0-FE at 350kN of load.
0
50
100
150
200
250
300
350
400
450
500
0 10 20 30 40
Load
,kN
Mid-span deflection, mm
B0-FE
B1-UO-FE
B2-UO-FE
B3-UO-FE
Top flange yielding

144
Figure 6-5 Failure patterns for specimens B0-FE at 407kN of load and B0 at 406kN of
load.
Figure 6-6 Von Mises stress (MPa) at ultimate load for Beam B1-U0-FE at 357kN of
load.
Von Mises stress distribution,
MPa, in FE model
Experimental failure mode

145
Figure 6-7 Von Mises stress (MPa) at ultimate load for Beam B2-UO-FE at 335kN of
load.
Figure 6-8 Von Mises stress (MPa) at ultimate load for Beam B3-UO-FE at 351kN of
load.
6.4.2 Strengthened beams
6.4.2.1 Beam B1-RO-FE
Figure 6-9 presents the load deflection results at the beam’s mid-span obtained from
the numerical simulations of the strengthened specimen, B1-RO-FE. Due to the
presence of CFRP plates, the beam showed a 40% strength increase and stiffer

146
response than beam B1-UO-FE, without CFRP strengthening. Beam B1-RO-FE
exhibited a fairly linear trend up to 444 kN of load. Beyond this load level, the onset of
plastic hinge formation was in the top flange near the end of the CFRP plate.
Consequently, the lateral buckling began at 478kN of load. At this point, end
debonding of the CFRP commenced in the top flange, see Figure 6-10. The ultimate
load capacity was recorded as 503kN; beyond that the load dropped dramatically,
which allowed a new stage of lateral deformation to start. This stage was not available
in the experiment because it was stopped after load dropping to maintain the test rig.
Nevertheless, the adhesive damage can be calculated from the numerical model using
the damage variable of the adhesive,𝐷, which reflects the damage evolution of the
adhesive, as explained clearly in Chapter 3. This parameter can be found using eq. 3-5
and it can be seen from eqs. 3-3 and 3-4 that, if this parameter is equal to 1 for any
element, this means that there are no stresses and the element has failed, after which it
will be deleted. It is expressed by SDEG in the numerical output, which means stress
degradation. It can be noticed from Figure 6-11 that SDEG or the D parameter reached
a value of 1 in specimen B1-RO-FE at the adhesive end.
With regard to strain distribution on the CFRP, a lot of data can be gained from the FE
model but, due to the maximum strain values that were recorded for that attached to
the upper flange, it was selected to acquire the strain along which were not gained
from the experiment, except for one strain gauge, FS1, in Figure 6-12.
The strain values along the CFRP are shown in Figure 6-13. As discussed in Chapter 1,
the ends of the strengthening plate are usually subject to high shear stresses and co-
existing normal stresses, these stress concentrations can initiate de-bonding. Due to
the presence of these very localized stress concentrations, non-zero longitudinal strain
values can be recorded close to the edge of the plates as found experimentally by Deng
& Lee, (2007) and Linghoff et al., (2009). Since the presented strain in this case is

147
numerical, the value represents the solution at the given integration point of the finite
element (spatially inset from the element edge) and is hence not the true edge of the
plate. Improved levels of accuracy in this case may be obtained by using a much finer
localized mesh at the plate ends. The maximum occurring value was 2100 microstrain
at the CFRP end, which is about 18% of its maximum strain capacity, 12000
microstrain. This can be considered to be the utilization ratio i.e. the maximum
occurring CFRP strain/maximum CFRP strain capacity. The utilization ratio can be a
useful indicator as to how hard the strengthening plate is working, however the
parameter has limitations since it is unable to give any indication of the spatial
distribution i.e. where and over how much of the plate are high strains occurring and
should therefore be viewed in that context.
Regarding the steel strain at the opening corner, no yielding state was indicated in any
direction, X, Y or XY, as shown in Figure 6-14.
In terms of the numerical compatibility with the experiment results, B1-RO-FE and
B1-RO showed a reasonable agreement in the stiffness aspect while a slight difference
was noted in the ultimate load where, in the numerical simulation, the ultimate load
was more than that obtained from the test by 3%. In addition, the strain from the FE
strain gauges mounted on the CFRP and steel was in convergence with the experiment
results, as shown in Figure 6-12 and Figure 6-14 respectively.

148
Figure 6-9 Load vs. mid-span deflection of beam B1-RO-FE.
Figure 6-10 Von Mises stress (MPa) and failure pattern at ultimate load for Beam B1-
RO-FE at 503kN of load.
0
100
200
300
400
500
600
0 10 20 30 40
Load
,kN
Mid-span deflection, mm
B1-RO
B1-RO-FE
B1-UO-FE
CFRP end debonding
Lateral buckling Mid-span

149
Figure 6-11 Adhesive damage parameter, SDEG, of beam B1-RO-FE at 503kN of load.
Figure 6-12 CFRP strain values of B1-RO-FE and B1-RO.
0
100
200
300
400
500
600
-2000 -1500 -1000 -500 0 500 1000 1500 2000
Load
,kN
Microstrain
FS1-FE FS2-FE FS3-FE FS4-FEFS1 FS2 FS3 FS4
B1-RO-FE
Adhesive failure

150
Figure 6-13 Strain value on CFRP at top flange in beam B1-RO-FE at ultimate load.
Figure 6-14 Steel strain values at opening corner of B1-RO-FE and B1-RO.
0
500
1000
1500
2000
2500
3000
0 200 400 600 800 1000
Mic
rost
rain
True distance, mm
CFRP strain at
ultimate load
Opening centre line
0
100
200
300
400
500
600
-2000 -1500 -1000 -500 0 500 1000 1500 2000
Load
,kN
Microstrain
SS1-X-FE SS1-XY-FE SS1-Y-FE
SS1-X SS1-XY SS1-Y

151
6.4.2.2 Beam B2-RO-FE
Beam B2-RO-FE showed a 31% strength increase and a stiffer response than beam
B2-UO-FE, without CFRP strengthening, as shown in Figure 6-15. Beam B2-RO-FE
also exhibited a linear trend up to 380kN of load. Beyond this load level, the onset of
plastic hinge formation was in the top flange at the beam mid-span. Consequently,
lateral buckling commenced at 396kN of load between the central lateral supports. The
beam carried the load until 440kN, after which the load dropped. Finally, a plastic
behaviour was noticed after that during loading due to excessive lateral deformation,
as shown in Figure 6-16, which was not in the experiment because it was stopped once
load dropping occurred.
Because this failure was away from the strengthening area, CFRP debonding did not
happen. The adhesive was not damaged, which can be proved by the damage variable,
𝐷 or 𝑆𝐷𝐸𝐺, where all its values were less than 1, as shown in Figure 6-17 .
Regarding the strain values on the CFRP, the maximum strain values were recorded
for that attached at the web below the opening. Therefore, it was selected to acquire
the strain along which was not achieved from the experiment, except for one strain
gauge, FS4, as shown in Figure 6-18. The strain distribution along the CFRP that
attached at the web below the opening, see Figure 6-19, showed that the high strain
values were at the opening edge which is close to the end support, while low values
were at both ends of the CFRP. It can also be mentioned here that the maximum CFRP
strain, 1610 microstrain, is about 13% of its maximum strain capacity, 12000
microstrain, which also indicates the lower utilisation ratio. Finally, steel strain at the
opening corner confirmed that the yielding happened at the upper corner at the end
support side where the high shear occurred, as shown in Figure 6-20.
In terms of the numerical compatibility with the experiment results for B2-RO-FE and
B2-RO, a reasonable agreement was again recorded in the stiffness aspect, while a

152
slight difference in maximum load was observed in the numerical simulation, Figure 6-
15, the ultimate load was more than that obtained from the test by 4%. This accuracy
of the maximum load was also achieved by Seleem et al. (2010) and Fernando (2010).
Also, the acquired FE strain and the test’s stain gauges mounted on the CFRP and steel
was in agreement, as shown in Figure 6-18 and Figure 6-20 respectively.
Figure 6-15 Load vs. mid-span deflection of beam B2-RO-FE.
0
100
200
300
400
500
0 5 10 15 20 25 30 35 40
Load
,kN
Deflection,mm
B2-Exp
B2-RO-FE
B2-UO-FE

153
Figure 6-16 Von Mises stress (MPa) and failure pattern at ultimate load for Beam B2-
RO-FE at 440kN of load.
Figure 6-17 Adhesive damage parameter, SDEG, of beam B2-RO-FE at 440kN of load.
Lateral buckling
Mid-span
B2-RO-FE
< 1

154
Figure 6-18 CFRP strain values of B2-RO-FE and B2-RO.
Figure 6-19 Strain value on CFRP attached at the web below the opening in beam B2-
RO-FE at ultimate load.
0
100
200
300
400
500
-2000 -1500 -1000 -500 0 500 1000 1500 2000
Load
,kN
Microstrain
FS1-FE FS2-FE FS3-FE FS4-FE
FS1 FS2 FS3 FS4
0
500
1000
1500
2000
2500
3000
0 200 400 600 800 1000
Mic
rost
rain
True distance, mm
CFRP strain at
ultimate loadOpening centre line

155
Figure 6-20 Steel strain values at opening corner of B2-RO-FE and B2-RO.
6.4.2.3 Beam B3-RO-FE
Figure 6-21 presents the load deflection at the beam’s mid-span in the numerical
simulation of strengthened beam B3-RO-FE. Due to the presence of CFRP plates, the
beam showed a 34% strength increase and a stiffer response than beam B3-UO-FE,
without CFRP strengthening. Beam B3-RO-FE exhibited a fairly linear trend up to
415kN of load. Beyond this load level, the onset of yielding was in the top flange near
the end of the CFRP plate at 448kN of load. Consequently, the lateral buckling started
at 471kN of load, after which the load dropped with plastic lateral deformation. At this
point, end debonding of the CFRP commenced in the top flange, see Figure 6-22.
Similar to B1-RO-FE, this debonding can be achieved clearly from the numerical
model using the damage variable of the adhesive, SDEG, or D parameter. It can be
noticed from Figure 6-23 that the SDEG parameter reached a value of 1 in specimen
0
100
200
300
400
500
-2000 -1500 -1000 -500 0 500 1000 1500 2000
Load
,kN
Microstrain
SS1-X-FE SS1-XY-FE SS1-Y-FE
SS1-X SS1-XY SS1-Y

156
B3-FE at the adhesive end, which refers to adhesive failure. Hence, the debonding of
the CFRP happened there.
According to the strain distribution on the CFRP, the maximum strain values were
recorded for that attached to the upper flange. Therefore, the numerical model was
used to acquire the strain along it. This was not gained from the experiment, except for
one strain gauge, FS1, in Figure 6-24. As in B1-RO-FE, the strain values along the
CFRP showed that the high strain values were also at the ends of the CFRP, as shown
in Figure 6-25, and the maximum strain value was 1746 microstrain at the failure side
before debonding occurred. This maximum strain value forms about 15% of its
maximum strain capacity, 12000 microstrain, which also reflects the low utilisation
ratio. Regarding the steel strain at the opening corner, SS1-FE, shown in Figure 6-26,
no yielding state was reported in any direction, X, Y or XY. In comparison with the
experiment results, the numerical results showed about a 6% difference in ultimate
load, Figure 6-21.
Strain values of the CFRP and steel were in agreement with the test results except the
strain value of SS1 was in difference with the test’s value. This may be attributed to
the bad contact of this strain with the beam in test, as shown in Figure 6-24 and Figure
6-26 respectively.

157
Figure 6-21 Load vs. mid-span deflection of beam B3-RO-FE.
Figure 6-22 Von Mises stress (MPa) and failure pattern at ultimate load for Beam B3-
RO-FE at 471kN of load.
0
100
200
300
400
500
0 10 20 30 40
Load
,kN
Deflection,mm
B3-RO
B3-RO-FE
B3-UO-FE
CFRP end debonding
Lateral buckling
Mid-span

158
Figure 6-23 Adhesive damage parameter, SDEG, of beam B3-RO-FE at 471kN of load.
Figure 6-24 CFRP strain values of B3-RO-FE and B3-RO.
0
100
200
300
400
500
-2000 -1500 -1000 -500 0 500 1000 1500 2000
Load
,kN
Microstrain
FS1-FE FS2-FE FS3-FE FS4-FE FS5-FE
FS1 FS2 FS3 FS4 FS5
B3-RO-FE
Adhesive failure

159
Figure 6-25 Strain value on CFRP at top flange in beam B3-RO-FE at ultimate load.
Figure 6-26 Steel strain values at opening corner of B3-RO-FE and B3-RO.
0
500
1000
1500
2000
2500
3000
0 200 400 600 800 1000
Mic
rost
rain
True distance, mm
CFRP strain at
ultimate loadOpening centre line
0
100
200
300
400
500
-2000 -1500 -1000 -500 0 500 1000 1500 2000
Load
,kN
Microstrain
SS1-X-FE SS1-XY-FE SS1-Y-FE
SS1-X SS1-XY SS1-Y

160
6.5 Effect of CFRP thickness
Due to the low CFRP utilisation ratio in all specimens, which was confirmed by the
numerical results, a parametric study was conducted to obtain the effective thickness
of CFRP. In addition to the 3mm CFRP thickness that was investigated previously, 1
and 2mm thicknesses were also examined to identify the most effective thickness. It
can be observed from Table 6-3 that there were significant increases in the strength of
specimens B1-RO and B3-RO with CFRP thickness while smaller increases happened
with B2-RO because a plastic hinge formed in the top flange at mid-span earlier than
its formation near the end of the CFRP plate. As can be seen also from Figure 6-27 to
Figure 6-29, in all specimens the increase of CFRP thickness not only helped to
recover the stiffness and strength after introduction of web penetration but also gave a
notable increase in stiffness and strength compared to that in the original beam and the
beam with an opening.
Table 6-3 Percentage of strength achievement compared to specimen with web opening.
CFRP thickness, mm
1mm 2mm 3mm
B1-RO-FE 23% 34% 41%
B2-RO-FE 28% 31% 32%
B3-RO-FE 24% 33% 35%

161
Figure 6-27 Load mid-span deflection response of specimen B1-RO-FE with different
CFRP thicknesses.
Figure 6-28 Load mid-span deflection response of specimen B2-RO-FE with different
CFRP thicknesses.
0
100
200
300
400
500
600
0 10 20 30 40
Load
,kN
Mid-span deflection, mm
B0-FE
B1-UO-FE
1mmCFRP
2mmCFRP
3mmCFRP
0
100
200
300
400
500
600
0 10 20 30 40
Load
,kN
Mid-span deflection, mm
B0-FE
B2-UO-FE
1mmCFRP
2mmCFRP
3mmCFRP

162
Figure 6-29 Load mid-span deflection response of specimen B3-RO-FE with different
CFRP thicknesses.
It is obvious that, by increasing the CFRP thickness, a small increase in strength is
gained and also decreases in beam ductility, because the debonding takes place before
the CFRP’s ultimate strengthening ability is achieved. Therefore, the use of each can
provide an acceptable stiffness and strength recovery. However, the economic issue
stands beside using of 1mm thick.
Because the optimum thickness of CFRP was investigated for strengthening of the
section 305×102×25 UKB with web opening, it could not be used for the further
sections unless it was linked to the web or flange thickness. This selection depends on
whether the web opening is located at mid-span or shear side because the maximum
strain on the CFRP was found at those attached to the flange for the web opening at
mid-span while the maximum was recorded for those attached to the web for the web
opening at shear side.
0
100
200
300
400
500
600
0 10 20 30 40
Load
,kN
Mid-span deflection, mm
B0-FE
B3-UO-FE
1mmCFRP
2mmCFRP
3mmCFRP

163
Therefore, the proportion of CFRP thickness to the flange thickness (1/7) will be used
for strengthening the web opening located at the mid-span while the proportion of
CFRP thickness to the web thickness (1/5.8) will be used for strengthening the web
opening located at the shear side for the case study in the next chapter.
6.6 Assumptions and limitations
The numerical results obtained in this study are based on the following assumptions:
1. In all the numerical models, the static load was subjected at 6 points load as in
the test, it is assumed that the loads are equal.
2. The shell element, S4R, with reduced integration points was used in modelling
the steel and CFRP while continuum element was used in modelling the
adhesive with traction-separation behaviour.
5. The imperfections of steel beams are considered according to Eurocode 3 while
the residual stress is neglected.
6. The material properties of CFRP plate and adhesive are extracted from the
respective manufacturers’ published data.
7. The CFRP was unidirectional, 3mm thick and four times the opening length as a
length. In reality, some degree of manufacturing and placement tolerance will
be in existence as discussed in section 5.3.

164
6.7 Summary
The main aim of this chapter was to further validate the numerical model against the
current experimental results. Additionally, due to the limitation in the experimental
programme in terms of data capture, some of the details not obtained in the
experimental tests were examined to provide greater insight, in particular the spatial
distribution of stresses in the system. Furthermore, the validated model has been used
to assess the effect of CFRP thickness on strengthening effectiveness with a view to
design optimisation. From the results of this chapter, the following conclusion may be
drawn:
1. Based on the simulation results of this and chapter 3, the numerical model is
capable of simulating the behaviour of CFRP strengthened steel members with
and without web opening to an acceptable level of accuracy. This conclusion
was drawn after comparing the simulation results with all of the current
experimental data in terms of load displacement response, failure modes and
strain distribution.
2. The quasi-static analysis technique available in ABAQUS/Explicit can be
employed to simulate the static force.
3. In comparison with the experiment results, the numerical results showed about,
3%, 4% and 6% difference for the beams B1, B2 and B3 respectively in
maximum load.
4. It has been found that the highest strain values were recorded at failure at the
ends of the CFRP plate due to stress concentration. This finding is consistent
with that of existing experimental research e.g. (Deng & Lee, 2007), (Linghoff
et al., 2009) etc.
5. Examining the strains across the CFRP strengthening plate and the associate
damage parameter in the adhesive would suggest the often large parts of the

165
plate are lowly stressed compared to the very ends of the plate where the
aforementioned stress concentrations occur. This may suggest plate thickness
in many cases could be reduced, particularly if the plate and or adhesive profile
at the ends can be altered to reduce stresses as discussed in the early chapters of
this thesis.
6. It has been proven that CFRP can recover the strength of the steel section to
that prior to introduction of the web openings. In parallel with this, the
strengthening system can change the mode of failure in many cases.
7. Three different CFRP plate thicknesses were examined with a view to finding
the most efficient layout. The CFRP thickness was characterised in terms of the
steel flange or web thickness. For the case of openings at mid-span, a CFRP
thickness of 1/7 of the flange was found to be most efficient. For the case of
openings near the end of the beam, a CFRP thickness of around 1/6 of the web
thickness was suggested.
The work presented here and in the previous chapters has concentrated on relatively
small scale beams. In the next chapter, using the same validated model the CFRP
strengthening technique will be explored within the context of larger scale beams of
the size and loading common in commercial frame buildings. The suggested optimum
ratios of CFRP plate to steel thickness will also be explored. For further demonstration
of the practicality of CFRP plate strengthening, its performance will also be compared
to that of the conventional strengthening technique for web openings i.e. welded steel
plate.

166
CHAPTER 7 7
CASE STUDY
7.1 Introduction
The purpose of this chapter is to explore possible size effects, beam span and section
size, and investigate whether there are practical limits of applicability for CFRP
strengthening. Additionally, the performance of CFRP strengthening will be compared
with conventional steel-plate strengthening.
7.2 Model description and material properties
To represent typical commercial floor arrangements, three different bay sizes of
7.5m×7.5m, 10m×10m and 15m×15m were framed using primary and secondary
beams, see Figure 7-1, and designed in accordance with Eurocode 3 (BSI, 2005), see
Table 7-1. All beams were designed as simply supported, carrying floor loads of
5kN/m2 and 3.6kN/m
2 as live and dead load respectively. The concrete slab was
assumed to provide full lateral restraint to the top flanges of the beams. Following
initial design, each beam had a web opening introduced; the opening size was 0.75 of
the beam depth as a length and 0.6 of the beam depth as a height, whether located at
mid-span or near the supports, as shown in Figure 7-2.
The configuration of CFRP strengthening that was applied to the specimens in chapters
4 and 6 was also used here, with CFRP strips having a length of four times the opening
length. The effective proportional ratios that have been concluded from Chapter 6 were
used to select the CFRP width and thickness. Therefore, the same effective ratio,

167
CFRP width/flange, was used to select the CFRP width. In addition, the same effective
ratios, CFRP thickness/web thickness and CFRP thickness/flange thickness, were used
to select the CFRP thickness when the web opening location was at the shear side and
mid-span of the beam respectively, see Table 7-2 to Table 7-4. The material properties
of the CFRP and adhesive material used in this chapter were the same as those
extracted from the experimental test and presented in chapters 4 and 6. The steel was
assumed to be of grade S355 and the stress-strain curve is shown in Figure 7-3.
The steel density and the modulus of elasticity were 7850 kg/m3 and 200000 MPa
respectively. The steel-plate strengthening has been designed accordance to SCI P355
(2011) guidance, as detailed in Chapter 2, with the same steel properties for the steel
beam. The stiffeners were welded on both sides of the steel, above and below the
openings.
Figure 7-1 Floor scheme.

168
Table 7-1 Beam sections.
7.5m 10m 15m
PB 533×312×273 914×419×343 1500×310×1020
SB 305×127×48 457×152×74 686×254×125
Figure 7-2 Opening size scheme.
Figure 7-3 Steel stress-strain used in the current simulations.
0
100
200
300
400
0 0.05 0.1 0.15
Str
ess,
MP
a
Strain
H
0.75H
0.6H
L
0.75H
0.6H H
Concrete slab
L/2
2H

169
Table 7-2 Description of beams used in the 7.5×7.5m floor.
Beam
nomination
Bea
m s
ecti
on
Op
enin
g s
ize,
mm
Steel plate/CFRP
strengthening
Description
thic
k, m
m
len
gth
, m
m
wid
th,
mm
PB0-7.5 5
33
×3
12
×2
73
- - - - 7.5m length primary beam without
opening or strengthening
PB1-UO-7.5
40
4.6
3×
32
3.7
- - - 7.5m length primary beam with
unreinforced opening at mid-span
PB2-UO-7.5 - - - 7.5m length primary beam with
unreinforced opening at high shear region
PB1-ROS-7.5 12 800 80
7.5m length primary beam with
reinforced opening at mid-span by steel
plates
PB1-ROC-7.5 5.4 1618 125
7.5m length primary beam with
reinforced opening at mid-span by CFRP
plates
PB2-ROS-7.5 12 800 80
7.5m length primary beam with
reinforced opening at high shear region
by steel plates
PB2-ROC-7.5 3 1618 125
7.5m length primary beam with
reinforced opening at high shear region
by CFRP plates
SB0-7.5
305×
127×
48
- - - - 7.5m length secondary beam without
opening or strengthening
SB1-UO-7.5
233.2
5×
186.6
- - - 7.5m length secondary beam with
unreinforced opening at mid-span
SB2-UO-7.5 - - - 7.5m length secondary beam with
unreinforced opening at high shear region
SB1-ROS-7.5 5 470 80
7.5m length secondary beam with
reinforced opening at mid-span by steel
plates
SB1-ROC-7.5 2 933 50
7.5m length secondary beam with
reinforced opening at mid-span by CFRP
plates
SB2-ROS-7.5 5 470 80
7.5m length secondary beam with
reinforced opening at high shear region
by steel plates
SB2-ROC-7.5 1.3 933 50
7.5m length secondary beam with
reinforced opening at high shear region
by CFRP plates

170
Table 7-3 Description of beams used in the 10×10m floor.
Beam
nomination
Bea
m s
ecti
on
Op
enin
g s
ize,
mm
Steel plate/ CFRP
strengthening
Description
thic
k, m
m
len
gth
, m
m
wid
th,
mm
PB0-10
91
4×
41
9×
34
3
- - - - 10m length primary beam without
opening or strengthening
PB1-UO-10 6
83
.85
×5
47
.08
- - - 10m length primary beam with
unreinforced opening at mid-span
PB2-UO-10 - - - 10m length primary beam with
unreinforced opening at high shear region
PB1-ROS-10 10 1350 150 10m length primary beam with reinforced
opening at mid-span by steel plates
PB1-ROC-10 4.6 1618 165 10m length primary beam with reinforced
opening at mid-span by CFRP plates
PB2-ROS-10 10 1350 80
10m length primary beam with reinforced
opening at high shear region by steel
plates
PB2-ROC-10 2.8 1618 165
10m length primary beam with reinforced
opening at high shear region by CFRP
plates
SB0-10
45
7×
15
2×
74
- - - - 10m length secondary beam without
opening or strengthening
SB1-UO-10
34
6.5
×2
77
.2
- - - 10m length secondary beam with
unreinforced opening at mid-span
SB2-UO-10 - - - 10m length secondary beam with
unreinforced opening at high shear region
SB1-ROS-10 5 700 100
10m length secondary beam with
reinforced opening at mid-span by steel
plates
SB1-ROC-10 2.4 1386 60
10m length secondary beam with
reinforced opening at mid-span by CFRP
plates
SB2-ROS-10 5 700 100
10m length secondary beam with
reinforced opening at high shear region
by steel plates
SB2-ROC-10 1.4 1386 60
10m length secondary beam with
reinforced opening at high shear region
by CFRP plates

171
Table 7-4 Description of beams used in the 15×15m floor.
Beam
nomination
Bea
m s
ecti
on
Op
enin
g s
ize,
mm
Steel plate/ CFRP
strengthening
Description
thic
k, m
m
len
gth
, m
m
wid
th,
mm
PB0-15
15
00
×3
10
×1
02
0
- - - - 15m length primary beam without
opening or strengthening
PB1-UO-15 1
12
5×
90
0
- - - 15m length primary beam with
unreinforced opening at mid-span
PB2-UO-15 - - - 15m length primary beam with
unreinforced opening at high shear region
PB1-ROS-15 20 2200 80 15m length primary beam with reinforced
opening at mid-span by steel plates
PB1-ROC-15 11.4 1618 135 15m length primary beam with reinforced
opening at mid-span by CFRP plates
PB2-ROS-15 20 2200 80
15m length primary beam with reinforced
opening at high shear region by steel
plates
PB2-ROC-15 7.1 1618 135
15m length primary beam with reinforced
opening at high shear region by CFRP
plates
SB0-15
68
6×
25
4×
12
5
- - - - 15m length secondary beam without
opening or strengthening
SB1-UO-15
508.4
25
×4
00
.74
- - - 15m length secondary beam with
unreinforced opening at mid-span
SB2-UO-15 - - - 15m length secondary beam with
unreinforced opening at high shear region
SB1-ROS-15 6 1010 80
15m length secondary beam with
reinforced opening at mid-span by steel
plates
SB1-ROC-15 2.3 933 70
15m length secondary beam with
reinforced opening at mid-span by CFRP
plates
SB2-ROS-15 6 1010 80
15m length secondary beam with
reinforced opening at high shear region
by steel plates
SB2-ROC-15 1.7 933 70
15m length secondary beam with
reinforced opening at high shear region
by CFRP plates
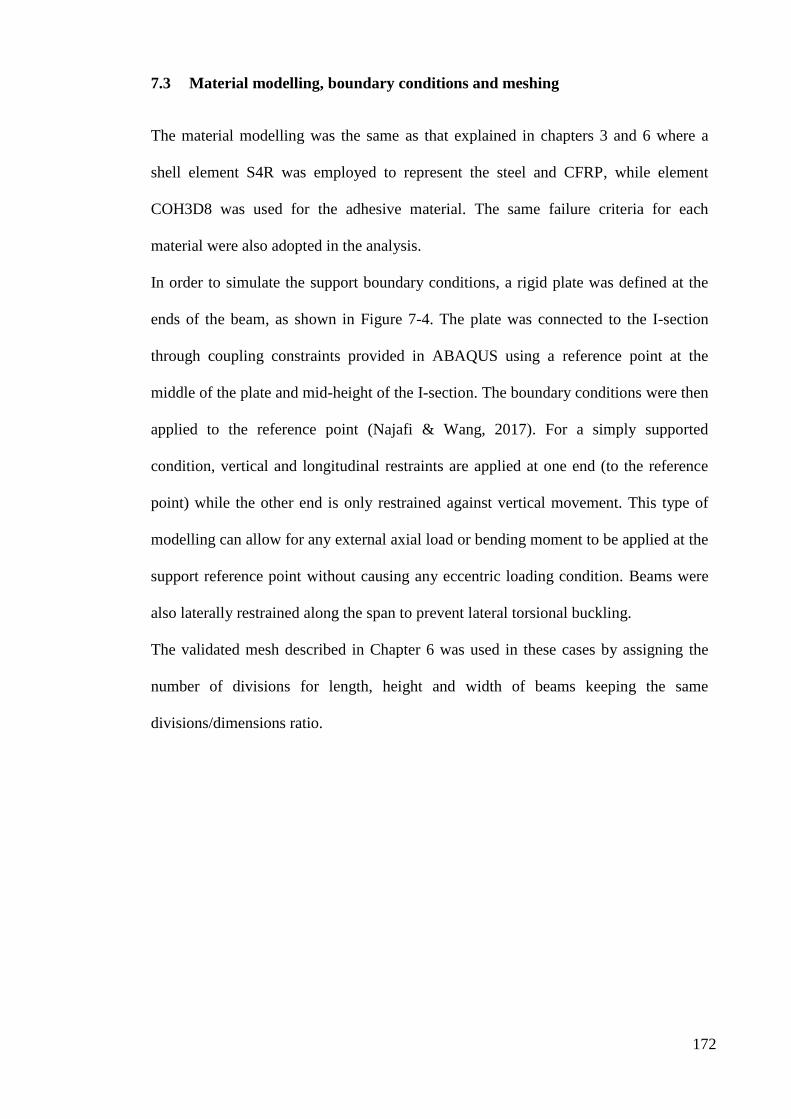
172
7.3 Material modelling, boundary conditions and meshing
The material modelling was the same as that explained in chapters 3 and 6 where a
shell element S4R was employed to represent the steel and CFRP, while element
COH3D8 was used for the adhesive material. The same failure criteria for each
material were also adopted in the analysis.
In order to simulate the support boundary conditions, a rigid plate was defined at the
ends of the beam, as shown in Figure 7-4. The plate was connected to the I-section
through coupling constraints provided in ABAQUS using a reference point at the
middle of the plate and mid-height of the I-section. The boundary conditions were then
applied to the reference point (Najafi & Wang, 2017). For a simply supported
condition, vertical and longitudinal restraints are applied at one end (to the reference
point) while the other end is only restrained against vertical movement. This type of
modelling can allow for any external axial load or bending moment to be applied at the
support reference point without causing any eccentric loading condition. Beams were
also laterally restrained along the span to prevent lateral torsional buckling.
The validated mesh described in Chapter 6 was used in these cases by assigning the
number of divisions for length, height and width of beams keeping the same
divisions/dimensions ratio.

173
Figure 7-4 Use of rigid plate and coupling constraint for the support boundary
conditions.
7.4 Simulation results
This study comprised beam analysis of floors 7.5×7.5m, 10×10m and 15×15m, which
were distributed as primary beams (PB) and secondary beams (SB). Both of them were
strengthened with steel plates and CFRP plates after introducing a web opening at the
bending zone (mid-span) in the first case and at the shear zone in the second case. All
results have been compared with the control beams without openings and without
strengthening in terms of applied load and failure mode.
7.4.1 Load mid-span deflection response
Figure 7-6 to Figure 7-15 show the total applied load versus mid-span deflection
relationship for the beams (SB and PB) in the aforementioned cases. It is obvious also
that the plastic behaviour, in the horizontal part of the curves, occurred for all cases

174
due to the perfectly plastic behaviour assumed for steel in these cases. Firstly, the
strength of both PB and SB of different floors dropped significantly after the
introduction of a web opening at mid-span and shear region, as summarised in Table
7-5, while their strength was recovered completely after applying both types of
strengthening, with a marginal increase in some of them. However, it can be noticed
that the web opening at the shear region did affect the strength of the secondary beams
and no further strength was provided by using either type of strengthening, as shown in
Figure 7-8, Figure 7-12 and Figure 7-16. This can reflect that the selected opening size
in this area of the beam has no effect on the shear resistance of SB2-UO-7.5, SB2-UO-
10 and SB2-UO-15. Regarding the stiffness, all beams showed very similar stiffness
compared to their reference beams, PB0-7.5, SB0-7.5, PB0-10, SB0-10, PB0-15 and
PB0-15, after strengthening was applied.
7.4.2 Modes of Failure
Due to providing a full lateral restraint for all the beams, no lateral torsional buckling
(LTB) was reported as a failure type. In addition to that, all beam sections are either
plastic or compact. All reference beams failed by a conventional flexural failure mode
in which a plastic hinge is formed at mid-span after top flange yielding.
Regarding the beams with a web opening at mid-span, PB1-UO-7.5, SB1-UO-7.5,
PB1-UO-10, SB1-UO-10, PB1-UO-15 and SB1-UO-15, the top T-section was in
compression; therefore, it was vulnerable to failing in buckling, see Figure 2-2 in
Chapter 2, whereas, in the strengthened beams, PB1-ROC-7.5, PB1-ROS-7.5, SB1-
ROC-7.5, SB1-ROS-7.5, PB1-ROC-10, PB1-ROS-10, SB1-ROC-10, SB1-ROS-10,
PB1-ROC-15, PB1-ROS-15, SB1-ROC-15 and SB1-ROS-15, the plastic hinge formed
at the end of strengthening, as shown in Table 7-6, Table 7-8 and Table 7-10.

175
On the other hand, the introduction of a web opening in the shear region had no effect
on the beam strength and stiffness of SBs in which the failure mode was the same as
that in the reference beams, SB0-7.5, SB0-10 and SB0-15, where the failure happened
due to the formation of a plastic hinge in the beam mid-span. In contrast, the PBs
failed in Vierendeel shear failure mode, see Figure 2-1 in Chapter 2, by developing
four plastic hinges, see PB1-UO-7.5, PB1-UO-10 and PB1-UO-15 in Table 7-7, Table
7-9 and Table 7-11. However, strengthened PBs, PB1-ROC-7.5, PB1-ROS-7.5, PB1-
ROC-10, PB1-ROS-10, PB1-ROC-15 and PB1-ROS-15, exhibited flexural failure and
the plastic hinge formed at mid-span.
7.4.3 CFRP strain distribution
Table 7-12 to Table 7-14 demonstrate the strain distribution of SB and PB in different
lengths and with CFRP plate strengthening for web opening at mid-span, beams PB1-
ROC-7.5, SB1-ROC-7.5, PB1-ROC-10, SB1-ROC-10, PB1-ROC-15 and SB1-ROC-
15, and at shear side, beams PB2-ROC-7.5, SB2-ROC-7.5, PB2-ROC-10, SB2-ROC-
10, PB2-ROC-15 and SB2-ROC-15.
Due to the presence of web openings in the beams mid-spans, beams PB1-ROC-7.5,
SB1-ROC-7.5, PB1-ROC-10, SB1-ROC-10, PB1-ROC-15 and SB1-ROC-15, a pure
tensile strain developed in CFRP plates below the opening and a pure compressive
strain was along the CFRP plates above the opening. Meanwhile, the strain
distributions were different to those applied to the web openings at the shear sides,
beams PB2-ROC-7.5, SB2-ROC-7.5, PB2-ROC-10, SB2-ROC-10, PB2-ROC-15 and
SB2-ROC-15, where the strain localised at the openings corners in compressive and
tensile values due to Vierendeel action. It can be reported here that the strain values on
the CFRP were more for the latter than the former and increased with span length.

176
Furthermore, the utilisation ratio of CFRP, the maximum strain/allowable strain, for
different beams ranged from 20-70%, 22-75% and 24-85% for beams of length 7.5m,
10m and 15m respectively, as shown in Table 7-15. These low values can be attributed
to the plastic behaviour of steel materials that allows the plastic hinges to form sooner
than in the strain-hardening behaviour.
It is also obvious that this ratio increased with beam length and size. It can be noticed
also that it was significantly higher when the CFRP was applied at the shear region
than in the mid-span. This can be attributed also to the strain localisation at the
opening corners due to Vierendeel action.
7.4.4 Steel stiffeners’ stress distribution
As the steel plate is a ductile material, the von-Mises stress has been selected to make
a comparison between the different cases. Table 7-16 to Table 7-18 illustrate the stress
distribution of SB and PB in different lengths and with steel-plate strengthening for
web opening at mid-span, beams PB1-ROS-7.5, SB1-ROS-7.5, PB1-ROS-10, SB1-
ROS-10, PB1-ROS-15 and SB1-ROS-15, and at shear side, beams PB2-ROS-7.5,
SB2-ROS-7.5, PB2-ROS-10, SB2-ROS-10, PB2-ROS-15 and SB2-ROS-15.
A uniform stress distribution can be noticed on the stiffeners applied to the web
opening in the beams mid-span, beams PB1-ROS-7.5, SB1-ROS-7.5, PB1-ROS-10,
SB1-ROS-10, PB1-ROS-15 and SB1-ROS-15, while stress localisation was on the
stiffeners applied to the web opening in the shear side, beams PB2-ROS-7.5, SB2-
ROS-7.5, PB2-ROS-10, SB2-ROS-10, PB2-ROS-15 and SB2-ROS-15. This was close
to the opening’s corners due to Vierendeel action.
Regarding the utilisation ratio of the steel stiffener, the maximum stress/allowable
stress, it ranged from 70-86%, 62-88% and 83-92% for beams of 7.5, 10 and 15m

177
length respectively, as shown in Table 7-19. It is obvious that this ratio increased with
beam length and size.
In contrast, in the CFRP strengthening, even though the stress localisation was also
observed in the stiffeners at the shear side, there were slight differences in values
between the stiffeners applied at the shear region and those applied at the mid-span.
This can be attributed to the way in which the steel stiffeners were applied, as they
were welded vertically to the web at the opening edges. This can provide more
stiffening for the opening edges.
7.4.5 Adhesive damage
As explained before, in chapters 3 and 6, the stress degradation, SDEG, was used to
examine the damage status of the adhesive. Table 7-20 to Table 7-22 show this
parameter for different beam lengths and sections. It can be seen clearly that there has
been no debonding in any of the adhesive joints of all beams. This can be noticed from
the values of damage parameter, SDEG, which are less than 1.0. It can also be
observed that the maximum values of this parameter were at joint ends for those used
to strengthen the opening in the beam mid-span, beams PB1-ROC-7.5, SB1-ROC-7.5,
PB1-ROC-10, SB1-ROC-10, PB1-ROC-15 and SB1-ROC-15, while they were at the
opening’s corners in those applied to the opening in the shear side, beams PB2-ROC-
7.5, SB2-ROC-7.5, PB2-ROC-10, SB2-ROC-10, PB2-ROC-15 and SB2-ROC-15.

178
Table 7-5 Percentages of strength reduction due to web opening.
PB1-UO-7.5 12% PB1-UO-10 20% PB1-UO-15 24%
SB1-UO-7.5 14% SB1-UO-10 22% SB1-UO-15 13%
PB2-UO-7.5 25% PB2-UO-10 37% PB2-UO-15 19%
SB2-UO-7.5 0% SB2-UO-10 0% SB2-UO-15 0%
Figure 7-5 Load deflection curve of PB1-ROS-7.5, PB1-ROC-7.5, PB1-UO-7.5 and
PB0-7.5.
0
500
1000
1500
2000
2500
3000
3500
4000
0 50 100 150 200 250 300
Load
,kN
Mid-span deflection, mm
PB1-ROS-7.5
PB1-ROC-7.5
PB1-UO-7.5
PB0-7.5

179
Figure 7-6 Load deflection curve of SB1-ROS-7.5, SB1-ROC-7.5, SB1-UO-7.5 and
SB0-7.5.
Figure 7-7 Load deflection curve of PB2-ROS-7.5, PB2-ROC-7.5, PB2-UO-7.5 and
PB0-7.5.
0
50
100
150
200
250
300
350
400
0 50 100 150 200 250 300
Lo
ad,k
N
Mid-span deflection, mm
SB1-ROS-7.5
SB1-ROC-7.5
SB1-UO-7.5
SB0-7.5
0
500
1000
1500
2000
2500
3000
3500
4000
0 50 100 150 200 250 300
Load
,kN
Mid-span deflection, mm
PB2-ROS-7.5
PB2-ROC-7.5
PB2-UO-7.5
PB0-7.5

180
Figure 7-8 Load deflection curve of SB2-ROS-7.5, SB2-ROC-7.5, SB2-UO-7.5 and
SB0-7.5.
Figure 7-9 Load deflection curve of PB1-ROS-10, PB1-ROC-10, PB1-UO-10 and PB0-
10.
0
50
100
150
200
250
300
350
400
0 50 100 150 200 250 300
Load
,kN
Mid-span deflection, mm
SB2-ROS-7.5
SB2-ROC-7.5
SB2-UO-7.5
SB0-7.5
0
1000
2000
3000
4000
5000
6000
0 50 100 150 200 250 300
Load
,kN
Mid-span deflection, mm
PB1-ROS-10
PB1-ROC-10
PB1-UO-10
PB0-10

181
Figure 7-10 Load deflection curve of SB1-ROS-10, SB1-ROC-10, SB1-UO-10 and
SB0-10.
Figure 7-11 Load deflection curve of PB2-ROS-10, PB2-ROC-10, PB2-UO-10 and
PB0-10.
0
100
200
300
400
500
600
0 50 100 150 200 250 300
Lo
ad,k
N
Mid-span deflection, mm
SB1-ROS-10
SB1-ROC-10
SB1-UO-10
SB0-10
0
1000
2000
3000
4000
5000
6000
0 50 100 150 200 250 300
Load
,kN
Mid-span deflection, mm
PB2-ROS-10
PB2-ROC-10
PB2-UO-10
PB0-10
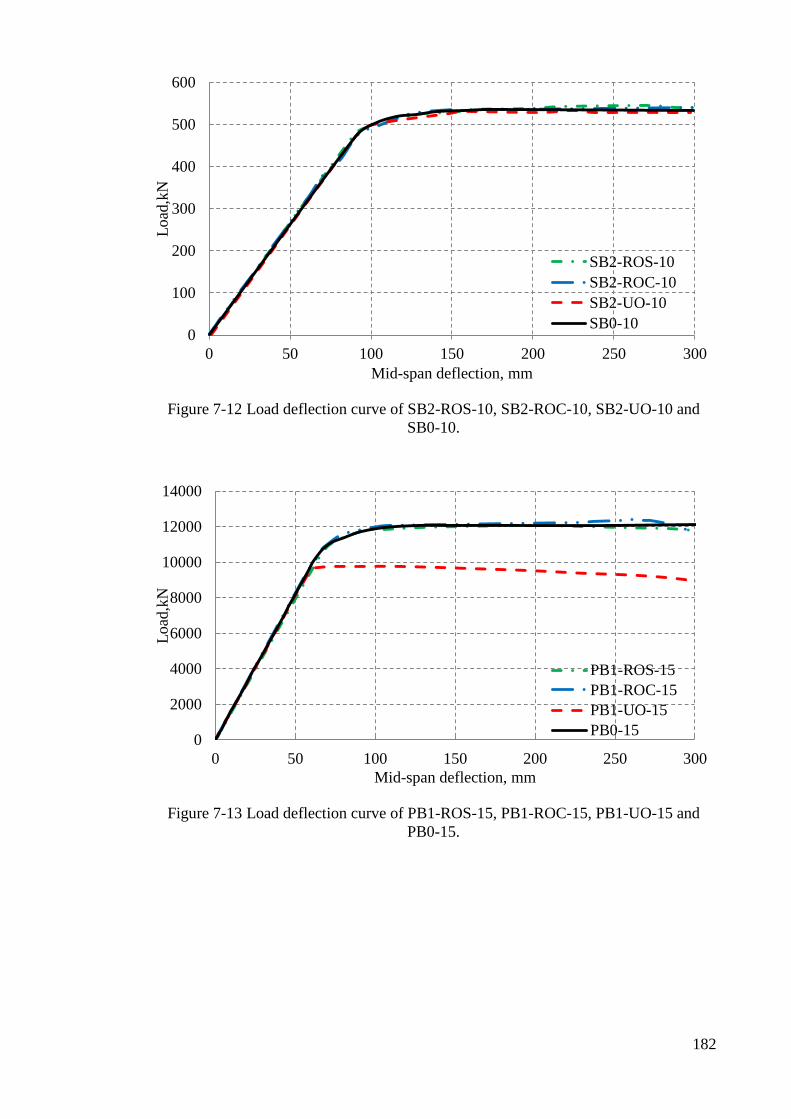
182
Figure 7-12 Load deflection curve of SB2-ROS-10, SB2-ROC-10, SB2-UO-10 and
SB0-10.
Figure 7-13 Load deflection curve of PB1-ROS-15, PB1-ROC-15, PB1-UO-15 and
PB0-15.
0
100
200
300
400
500
600
0 50 100 150 200 250 300
Load
,kN
Mid-span deflection, mm
SB2-ROS-10
SB2-ROC-10
SB2-UO-10
SB0-10
0
2000
4000
6000
8000
10000
12000
14000
0 50 100 150 200 250 300
Load
,kN
Mid-span deflection, mm
PB1-ROS-15
PB1-ROC-15
PB1-UO-15
PB0-15
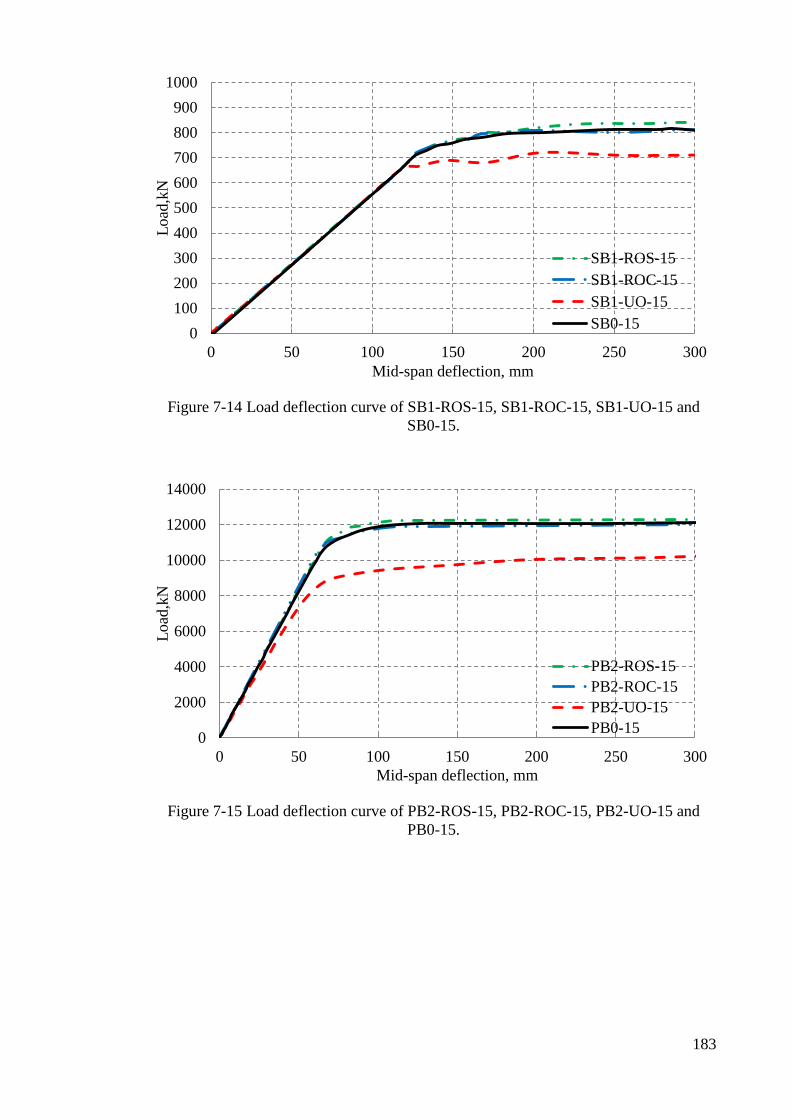
183
Figure 7-14 Load deflection curve of SB1-ROS-15, SB1-ROC-15, SB1-UO-15 and
SB0-15.
Figure 7-15 Load deflection curve of PB2-ROS-15, PB2-ROC-15, PB2-UO-15 and
PB0-15.
0
100
200
300
400
500
600
700
800
900
1000
0 50 100 150 200 250 300
Load
,kN
Mid-span deflection, mm
SB1-ROS-15
SB1-ROC-15
SB1-UO-15
SB0-15
0
2000
4000
6000
8000
10000
12000
14000
0 50 100 150 200 250 300
Load
,kN
Mid-span deflection, mm
PB2-ROS-15
PB2-ROC-15
PB2-UO-15
PB0-15

184
Figure 7-16 Load deflection curve of SB2-ROS-15, SB2-ROC-15, SB2-UO-15 and
SB0-15.
0
100
200
300
400
500
600
700
800
900
1000
0 50 100 150 200 250 300
Load
,kN
Mid-span deflection, mm
SB2-ROS-15
SB2-ROC-15
SB2-UO-15
SB0-15

185
Table 7-6 Failure mode and von-Mises stresses (MPa) at maximum load of SB & PB
with web opening at mid-span with a beam 7.5m in length.
`
PB1-UO-7.5
PB0-7.5 SB0-7.5
SB1-UO-7.5
SB1-ROC-7.5 PB1-ROC-7.5
SB1-ROS-7.5 PB1-ROS-7.5

186
Table 7-7 Failure mode and von-Mises stresses (MPa) at maximum load of SB & PB
with web opening at shear region with a beam 7.5m in length.
PB2-UO-7.5
PB0-7.5 SB0-7.5
SB2-UO-7.5
SB2-ROC-7.5 PB2-ROC-7.5
SB2-ROS-7.5 PB2-ROS-7.5

187
Table 7-8 Failure mode and von-Mises stresses (MPa) at maximum load of SB & PB
with web opening at mid-span with a beam 10m in length.
PB1-UO-10
PB0-10 SB0-10
SB1-UO-10
SB1-ROC-10 PB1-ROC-10
SB1-ROS-10 PB1-ROS-10

188
Table 7-9 Failure mode and von-Mises stresses (MPa) at maximum load of SB & PB
with web opening at shear region with a beam 10m in length.
PB2-UO-10
PB0-10 SB0-10
SB2-UO-10
SB2-ROC-10 PB2-ROC-10
SB2-ROS-10 PB2-ROS-10

189
Table 7-10 Failure mode and von-Mises stresses (MPa) at maximum load of SB & PB
with web opening at mid-span with a beam 15m in length.
PB1-UO-15
PB0-15 SB0-15
SB1-UO-15
SB1-ROC-15 PB1-ROC-15
SB1-ROS-15
PB1-ROS-15

190
Table 7-11 Failure mode and von-Mises stresses (MPa) at maximum load of SB & PB
with web opening at shear region with a beam 15m in length.
PB2-UO-15
PB0-15 SB0-15
SB2-UO-15
SB2-ROC-15 PB2-ROC-15
SB2-ROS-15 PB2-ROS-15

191
Table 7-12 Strain distribution on CFRP plates at maximum load of SB & PB with a
beam 7.5m in length.
Table 7-13 Strain distribution on CFRP plates at maximum load of SB & PB with a
beam 10m in length.
SB1-ROC-10 (CFRP plates)
PB1-ROC-10 (CFRP plates)
SB2-ROC-10 (CFRP plates)
PB2-ROC-10 (CFRP plates)
SB1-ROC-7.5 (CFRP plates)
PB1-ROC-7.5 (CFRP plates)
SB2-ROC-7.5 (CFRP plates)
PB2-ROC-7.5 (CFRP plates)

192
Table 7-14 Strain distribution on CFRP plates at maximum load of SB & PB with a
beam 15m in length.
Table 7-15 Utilisation percentages of CFRP in different beams.
7.5m 10m 15m
Mid-span
opening
Shear side
opening
Mid-span
opening
Shear side
opening
Mid-span
opening
Shear side
opening
SB PB SB PB SB PB SB PB SB PB SB PB
20 24 31 70 22 26 34 75 24 29 41 85
Table 7-16 Von Mises stress distribution (MPa) on steel stiffeners at maximum load of
SB1-ROC-15 (CFRP plates)
PB1-ROC-15 (CFRP plates)
SB2-ROC-15 (CFRP plates)
PB2-ROC-15 (CFRP plates)

193
SB & PB with a beam 7.5m in length.
Table 7-17 Von Mises stress distribution (MPa) on steel stiffeners at maximum load of
SB & PB with a beam 10m in length.
Table 7-18 Von Mises stress distribution (MPa) on steel stiffeners at maximum load of
SB1-ROS-7.5 (CFRP plates)
PB1-ROS-7.5 (CFRP plates)
SB2-ROS-7.5 (CFRP plates)
PB2-ROS-7.5 (CFRP plates)
SB1-ROS-10 (CFRP plates)
PB1-ROS-10 (CFRP plates)
SB2-ROS-10 (CFRP plates)
PB2-ROS-10 (CFRP plates)

194
SB & PB with a beam 15m in length.
Table 7-19 Utilisation percentages of steel plates in different beams.
7.5m 10m 15m
Mid-span
opening
Shear side
opening
Mid-span
opening
Shear side
opening
Mid-span
opening
Shear side
opening
SB PB SB PB SB PB SB PB SB PB SB PB
70 79 77 86 62 94 60 88 83 90 78 92
Table 7-20 Adhesive damage parameter, SDEG, of beams 7.5m in length at maximum
load.
SB1-ROS-15 (CFRP plates)
PB1-ROS-15 (CFRP plates)
SB2-ROS-15 (CFRP plates)
PB2-ROS-15 (CFRP plates)

195
Table 7-21 Adhesive damage parameter, SDEG, of beams 10m in length at maximum
load.
Table 7-22 Adhesive damage parameter, SDEG, of beams 15m in length at maximum
load.
SB1-ROC-10 (CFRP plates)
PB1-ROC-10 (CFRP plates)
SB2-ROC-10 (CFRP plates)
PB2-ROC-10 (CFRP plates)
SB1-ROC-7.5 (CFRP plates)
PB1-ROC-7.5 (CFRP plates)
SB2-ROC-7.5 (CFRP plates)
PB2-ROC-7.5 (CFRP plates)

196
SB1-ROC-15 (CFRP plates)
PB1-ROC-15 (CFRP plates)
SB2-ROC-15 (CFRP plates)
PB2-ROC-15 (CFRP plates)

197
7.5 Assumptions and limitations
The numerical results obtained in this study are based on the following assumptions:
1. Three different bay sizes of 7.5×7.5m, 10×10m and 15×15m were framed using
primary and secondary beams. All beams were designed as simply supported in
accordance with Eurocode 3 and carrying 5kN/m2 and 3.6kN/m2 as live and
dead load respectively.
2. The opening size was set at 0.75 and 0.6 of the beam depth as a length and height
respectively, whether located at mid-span or near the supports.
3. The configuration of CFRP strengthening (denoted as type B) in Chapter 3 was
applied to the specimens having a length of four times the opening length.
4. The shell element, S4R, with reduced integrations points was used in modelling
the steel and CFRP while cohesive element COH3D8 was used in modelling the
adhesive with traction-separation behaviour.
5. The imperfections of steel beams are considered according to Eurocode 3 while
the residual stress is neglected.
6. The material properties of CFRP plate and adhesive are extracted from the
manufacturer’s declared values.
7. The CFRP thickness was proportional to flange thickness when the opening was
located at mid-span, and proportional to web thickness when the web opening
was located at the shear side.
8. The bi-linear stress-strain relationship of steel is used according to Eurocode 3
with elastic-perfect plastic behaviour.
9. The steel-plate strengthening has been designed accordance to SCI P355 (2011)
guidance with the same material properties for the steel beam.

198
10. In order to create the support boundary conditions, a rigid plate was defined at
the ends of the beam. The plate was connected to the I-section through coupling
constraints provided in ABAQUS using a reference point at the middle of the
plate and mid-height of the I-section, vertical restraint.
11. All beams were also laterally restrained along the top flange to prevent lateral
torsional buckling, however no composite action with a floor slab was assumed.
7.6 Summary
Several numerical simulations have been conducted in this chapter to explore the ability
of CFRP strengthening to recover the stiffness and strength of full-scale steel beams
after the introduction of a web opening. In addition, the performance of CFRP
strengthening has been compared with conventional steel-plate strengthening. Three
types of full-scale steel beams, 7.5m, 10m and 15m in length, with two web opening
locations were used. The findings of this study can be summed up as follows:
1. The CFRP-strengthening method is applicable to recover the stiffness and
strength of full-scale beams with different lengths and sections after insertion of
a web opening, whether at mid-span or at the beam ends in regions of high
shear.
2. Although the stiffness and strength have been recovered, the full plastic
behaviour of the steel material did not allow the optimum utilisation of CFRP to
be achieved.
3. The utilisation ratio of CFRP strengthening is more than 40% while it is more
than 60% for the steel-plate strengthening. This means that it may be possible to
reduce the CFRP grade or its thickness from the values considered here.

199
4. The CFRP can give similar strengthening effect to that from traditional steel
plate designed by the SCI P355 method.
5. No de-bonding type failure has been reported for any of the beams in the
different cases.

200
CHAPTER 8 8
CONCLUSIONS
8.1 Overview of Research
This thesis has presented the details and results of an investigation into the use of
carbon fibre reinforced polymer (CFRP) composites to strengthen steel beams after the
introduction of web openings. The objective of this work was to devise an efficient
CFRP strengthening arrangement which could recover the strength and stiffness of the
steel beams after web openings were introduced. First of all, the proposed FE model
was validated using previous experimental works, hence proving the model’s ability to
capture the actual behaviour of steel beams with CFRP composites to an acceptable
level of accuracy. Then, the validated model was used to investigate the most effective
configuration, length and thickness of CFRP plates which were then used later in a
series of experimental tests. The effectiveness of CFRP strengthening was investigated
experimentally by testing of four specimens, one without an opening acting as the
control, and three with rectangular web openings in different locations.
To gain understanding of potential size effects and the limits of applicability of the
proposed strengthening system, further numerical modelling was used to explore the
effect of beam span with a particular focus on spans and depths common in a typical
modern frame building. Furthermore, the proposed CFRP strengthening system was
compared with the industry standard approach of strengthening via welded steel plate
stiffeners.

201
8.2 How the FRP system works: General Conclusions
For each of the different beam geometries, opening scenarios and strengthening
configurations considered in this thesis, the FRP strengthening system has proven
effective. The way by which this is achieved is a follows:
1. Where a single web opening is located at mid-span, the CFRP system is able to
re-distribute the peak stresses away from the T-section above the opening (i.e.
the flange and remaining component of web). In the un-strengthened case,
yielding and/or buckling of the T-section initiates failure at load levels generally
below that of the beam without openings. In the strengthened case, peak stresses
are distributed to approximately the ends of the middle third span of the beam
where the full depth of the steel section is mobilised, eventually forming a
plastic hinge. A typical example of this trend can be seen in Table 7-6 where a
60% reduction in peak stress around the opening is observed in the strengthened
7.5m secondary beam SB1-ROC-7.5 compared to the un-strengthened case SB1-
UO-7.5. This level of local stress reduction is commensurate with the level of
section modulus enhancement at the T-section brought about by the addition of
the CFRP. In the same strengthened beam, redistribution of stresses is observed
as a plastic hinge forms some distance away from the opening at approximately
the ends of the middle third span.
As discussed in Chapter 1, the most common failure mode of the strengthened
system is de-bonding of the CFRP from the steel surface, this typically occurs
long before rupture of the CFRP plate can occur. Crucially, the CFRP is able to
act fully compositely with the steel section in the vast majority of the
strengthened cases throughout the loading process since no de-bonding occurs,

202
thus allowing the enhanced section properties to be mobilised. The absence of
de-bonding indicates the length of CFRP plate and chosen thickness dimension
is sufficient to fully mobilise the section and develop full force transfer as
discussed in section 1.5. It should be noted however that a few of the beam
scenarios examined were close to the threshold of de-bonding at ultimate load as
indicated by the numerical damage parameters. Use of thinner CFRP sections
along with adoption of tapered ends may reduce the associated peeling and shear
stresses in these cases.
2. In the case of single openings located near the end of the beam in the high shear
zone, the dominant mode of failure in the un-strengthened case is yielding in the
T-section above and below the opening due to the Vierendeel action generated.
As in the case for the mid-span openings, the strengthening system is able to
reduce the peak stresses around the opening and allow redistribution of stresses
compared to the un-strengthened case. A typical example of this can be seen in
Table 7-7 where a 50% reduction in peak stresses at the opening is observed in
beam PB2-ROC-7.5 compared to the un-strengthened beam PB2-UO-7.5. Since
no de-bonding occurred, the fully developed composite action and associated
enhanced section modulus around the opening avoids local failure in this area
and has allowed the beam to develop full plastic section capacity at the mid-span
section leading to development of the plastic hinge and ultimate loads
comparable to the same beam without an opening i.e. PB0-7.5.

203
8.3 Experimental Work: Conclusions
1. It is clear that for all the strengthened beams examined, a stiffer response was
observed up to ultimate load compared to the un-strengthened cases. This is due
to the fact that the CFRP is creating an enhanced composite I’ value which is
favorably altering the stress state in the locations corresponding to the peak
stresses in the un-strengthened beam, as discussed in section 8.2. Furthermore,
in all cases the strengthened beams showed greater load capacity, 503kN, 440kN
and 471kN for B1-RO, B2-RO and B3-RO respectively, after strengthening with
web openings present compared to the control case which had no openings or
strengthening. Therefore, this method is likely to be a useful approach in
practice to recover the stiffness and strength of beams where in-service web
openings are introduced.
2. As expected, for the un-strengthened beams where web openings were
introduced, the ultimate strength reduced, i.e. by 11.8%, 17.5% and 13.3% for
B1-UO, B2-UO and B3-UO respectively.
3. The proposed strengthening method not only helped to recover the beam's
strength but also resulted in an increase of ultimate strength by 20%, 5% and
10% for beams B1-RO, B2-RO and B3-RO respectively compared with control
beam, B0.
4. The experiments reveal that the proposed CFRP strengthening system changed
the failure location and mechanism of the strengthened beams which were not
always the same as the un-strengthened cases, or the control case. Therefore,
care must be taken to identify and check potential failure other than those that
might be expected with strengthening.

204
5. As discussed in Chapter 1, the phenomenon of de-bonding is the most common
cause of premature failure of the strengthening system. For the beams tested
experimentally, no de-bonding of the CFRP plate occurred at the target ultimate
loads (i.e. the ultimate of the same beam without an opening). As referred to in
section 8.2, full composite action was achieved in test series. This suggested the
bond length of CFRP plate configuration was adequate. Similarly, the use of the
high-modulus adhesive, in this case Araldite 420, ensured full shear transfer
between steel and CFRP occurred.
8.4 Numerical Modelling of Experimental Series: Conclusions
1. When compared with previous and current experimental tests in terms of
ultimate load, mode of the failure, strain distribution and load-deflection
response both for un-strengthened specimens and strengthened specimens, the
proposed FE model showed an acceptable level of accuracy. Based on this, the
numerical models used to explore the proposed CFRP strengthening system can
be viewed with a good level of confidence.
2. Crucially, the proposed FE model is shown to be capable of capturing the key
phenomena of plate de-bonding and buckling of the steel section (local and
global).
3. In comparison with the experiment results, the numerical results showed about,
3%, 4% and 6% for the beams B1, B2 and B3 respectively in maximum load.

205
8.5 Full scale numerical modelling study: Conclusions
1. In the case of full-scale steel beams, the proposed CFRP strengthening system
was shown to be a suitable alternative to traditional steel stiffeners in recovering
beam stiffness and strength. This applied to both scenarios of when web
openings were presented at mid-span and near the end of beams.
2. Different failure modes have been observed for strengthened beams to those for
un-strengthened beams. For the un-strengthened case, where the opening was a
mid-span, local failure of the T-section (yielding followed by buckling)
occurred. For the un-strengthened beams with openings near the ends,
Vierendeel action led to localised yielding around the corners of the opening. In
the CFRP strengthened cases for both opening locations, the localised failure
was avoided, with plastic hinges eventually forming at ultimate loads, well away
from the opening position. As in the experiments, bond breakdown was not a
problem in all strengthened beams which achieved full composite action
between the steel beam and the CFRP strengthening system.
3. No CFRP rupture occurred in all strengthened beams thus suggesting a lesser
amount of CFRP could be used.
4. The proposed CFRP system is able to produce a strengthening performance
comparable to that of the standard steel plate stiffener approach,
5. Using the proposed CFRP geometry, the utilisation ratio was more than 40%.
On the other hand, the utilisation ratio was more than 60% with steel stiffener
strengthening using SCI P355 to select the steel plate geometry.
6. The steel grade has a significant role to play in the optimum utilisation of CFRP.
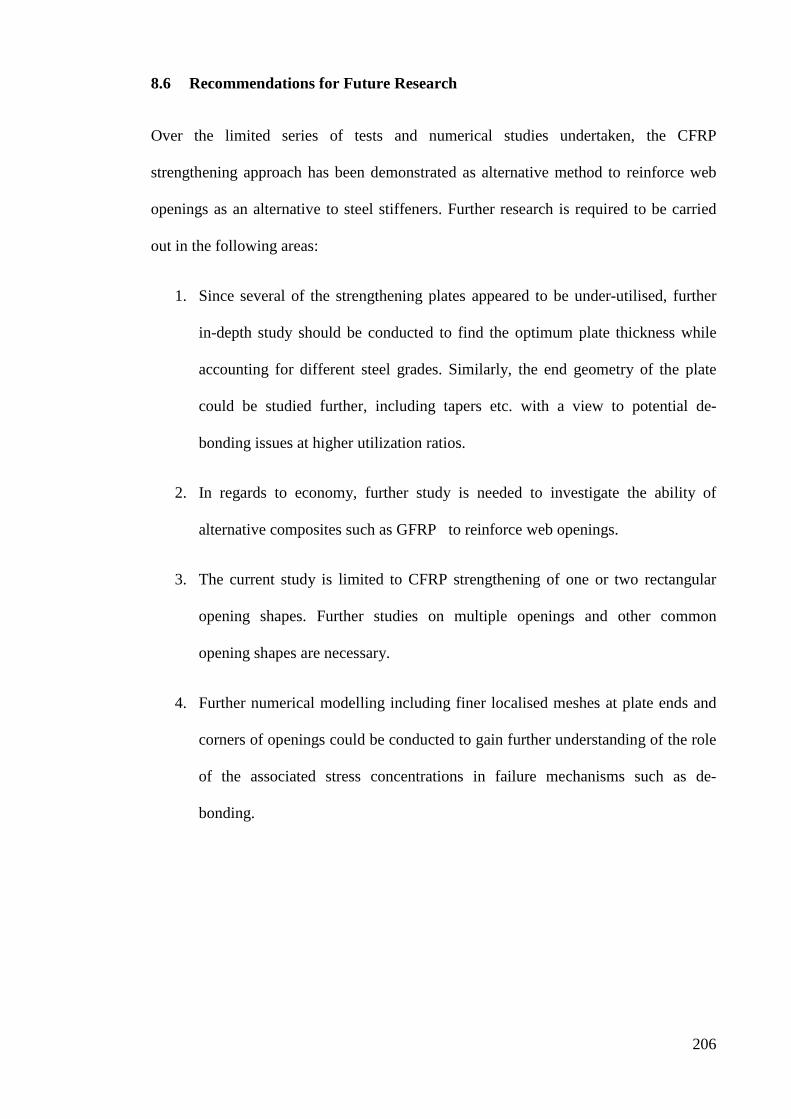
206
8.6 Recommendations for Future Research
Over the limited series of tests and numerical studies undertaken, the CFRP
strengthening approach has been demonstrated as alternative method to reinforce web
openings as an alternative to steel stiffeners. Further research is required to be carried
out in the following areas:
1. Since several of the strengthening plates appeared to be under-utilised, further
in-depth study should be conducted to find the optimum plate thickness while
accounting for different steel grades. Similarly, the end geometry of the plate
could be studied further, including tapers etc. with a view to potential de-
bonding issues at higher utilization ratios.
2. In regards to economy, further study is needed to investigate the ability of
alternative composites such as GFRP to reinforce web openings.
3. The current study is limited to CFRP strengthening of one or two rectangular
opening shapes. Further studies on multiple openings and other common
opening shapes are necessary.
4. Further numerical modelling including finer localised meshes at plate ends and
corners of openings could be conducted to gain further understanding of the role
of the associated stress concentrations in failure mechanisms such as de-
bonding.

207
REFERENCES 9
ABAQUS, 2013. Theory Manual, User Manual and Example Manual Version 6.,
Dassault Systemes Simulia Corp.
Abdullah, A.M., 2010. Analysis of Repaired/Strengthened R.C. Structures Using
Composite Materials : Punching Shear. University of Manchester.
Accord N.B., Earls C.J., 2006. Use of fiber reinforced polymer composite elements to
enhance structural steel member ductility. ASCE J Comp Constr, 10 (4), pp. 337-
344.
Al-saidy, A.H., Klaiber, F.W. & Wipf, T.J., 2004. Repair of steel composite beams with
carbon fiber-reinforced polymer plates. Composite for Construction.
Altaee, M., Cunningham, L. & Gillie, M., 2016. CFRP Strengthening of Steel Beams
with Web Openings. In Proceedings of Structural Faults & Repair 2016: 16th
International Conference. Edinburgh, p. 1754.
Altaee, M., Cunningham, L. & Gillie, M., 2016b. Novel Technique for Strengthening
Steel Beams with Web Penetrations. In Proceedings of the MACE PGR
Conference. Manchester: University of Manchester, pp. 9–11.
Altaee, M.J., Cunningham, L.S. & Gillie, M., 2017. Experimental investigation of
CFRP-strengthened steel beams with web openings. Journal of Constructional
Steel Research, 138, pp.750–760.
Linghoff, D., Haghani, R., and Al-Emrani, M. 2009. Carbon-fibre composites for
strengthening steel structures, Thin-walled Structures, 47: 1048–1058.
Bowden, F.P. & Tabor, D., 2001. The friction and lubrication of solids, Oxford
university press.
BS EN1993-1-1, 2005. Eurocode 3:Design of steel structures. In British Standards
Institution, London, UK.

208
BS EN 10002-1, 2001. Tensile testing of Metallic materials. British Standards
Instituion, London, UK.
BS EN 1090-2, 2008. Execution of steel structures and aluminium structures: Technical
requirements for steel structures, British Standards Institution, London, UK.
BSI, 2005. Eurocode 3-Design of steel structures.
Cadei, J.M.C., 2004. Strengthening Metallic Structures Using Externally Bonded Fibre-
reinforced Polymers, CIRIA.
Chen, G.M. et al., 2015. Finite element modeling of debonding failures in FRP-
strengthened RC beams: A dynamic approach. Computers & Structures, 158,
pp.167–183.
CNR-DT 202, 2007. Guidelines for the Design and Construction of Externally Bonded
FRP Systems for Strengthening Existing Structures, Rome, Italy.: Advisory
Committee on Technical Recommendations for Construction of National Research
Council.
Colombi, P. & Poggi, C., 2006. An experimental, analytical and numerical study of the
static behaviour of steel beams reinforced by pultruded CFRP strips. In Composites
Part B: Engineering. pp. 64–73.
Darwin, D., 1990. Steel Design Guide Series Steel and Composite Beams with Web
Openings Design of Steel and Composite Beams with Web Openings, American
Institute of Steel Construction.
Deng, J., Lee, M.M.. & Moy, S.S.., 2004. Stress analysis of steel beams reinforced with
a bonded CFRP plate. Composite Structures, 65(2), pp.205–215.
Deng, J. & Lee, M.M.K., 2007. Behaviour under static loading of metallic beams
reinforced with a bonded CFRP plate. Composite Structures, 78(2), pp.232–242.
Ekiz E, El-Tawil S, Parra-Montesinos G, Goel S., 2004.Enhancing plastic hinge
behavior in steel flexural members using CFRP wraps. In: Proceedings of the 13th

209
World Conference on EQ Engineering, Vancouver, 2004.
Ekiz E., 2007.Improving Steel Behavior Using Carbon Fiber Reinforced Polymer
(CFRP) Wrapping. Ph.D. Thesis, Department of Civil and Environmental
Engineering, University of Michigan.
Fattouh, S. & Shahat, M., 2015. Strengthening of web opening in non-compact steel
girders. IOSR Journal of Mechanical and Civil Engineering Ver. II, 12(5),
pp.2278–1684.
Fernando, N.D., 2010. Bond behaviour and debonding failures in CFRP-strengthened
steel members (Doctoral dissertation, The Hong Kong Polytechnic University).
Harries, K.A., Peck, A.J. & Abraham, E.J., 2009. Enhancing stability of structural steel
sections using FRP. Thin-Walled Structures, 47(10), pp.1092–1101.
Hassein Abed, G., 2012. Effects of temperature on the adhesive bonding in steel beams
reinforced with CFRP composites.
Hicks, S.. & Lawson, R.M., 2011. Design of composite beams with large web openings
(P355),
Hollaway, L.C. & Cadei, J., 2002. Progress in the technique of upgrading metallic
structures with advanced polymer composites. Progress in Structural Engineering
and Materials, 4(2), pp.131–148.
Hosain, A.M. and & Speirs, W., 1975. Optimum expansion ratio of castellated steel
beams. Engineering Optimization, 1(4), pp.213–225.
Hosain, M.U. & Spiers, W.G., 1971. Experiments on castellated steel beams.
Huntsman, 2009. Structural adhesives aerospace adhesives. Araldite 420A/B. Huntsman
International LLC.
Islam, S.M.Z. & Young, B., 2013. Strengthening of ferritic stainless steel tubular
structural members using FRP subjected to Two-Flange-Loading. Thin-Walled
Structures, 62, pp.179–190.

210
Karbhari V.M., 2014. Rehabilitation of Metallic Civil Infrastructure Using Fiber
Reinforced Polymer (FRP) Composites. Elsevier/Woodhead Publishing,pp 62,
ISBN: 978-0-857-09653 1.
Kerdal, D. & Nethercot, D.A., 1984. Failure modes for castellated beams. Journal of
Constructional Steel Research, 4(4), pp.295–315.
Kollár, L.P. & Springer, G.S., 2003. Mechanics of composite structures, Cambridge
university press.
Lawson, R.M. & Hicks, S.J., 2011. Design of beams with large web openings. The Steel
Construction Institute,SCI, UK.
Linghoff, D., Haghani, R. & Al-Emrani, M., 2009. Carbon-fibre composites for
strengthening steel structures. Thin Walled Structures, 47, pp.1048–1058.
Liu, T.C.H. & Chung, K.F., 2003. Steel beams with large web openings of various
shapes and sizes: Finite element investigation. Journal of Constructional Steel
Research, 59(9), pp.1159–1176.
Miller, T.C. et al., 2001. Strengthening of a steel bridge girder using CFRP plates.
Journal of Bridge Engineering, 6(6), pp.514–522.
Mosallam, A., 2007. Structural evaluation and construction of fiber-reinforced polymer
composites strengthening systems for the Sauvie Island Bridge. Journal of
Composites for Construction, 11(2), pp.236–249.
Moy, S.S.J., 2001. ICE Design and Practice Guides. FRP composites: Life extension
and strengthening of metallic structures, Thomas Telford.
Moy, S.S.J. and Bloodworth, A.G., 2007. Strengthening a steel bridge with CFRP
composites. Proceedings of the Institution of Civil Engineers-Structures and
Buildings, 160(2), pp.81–93.
Najafi, M. & Wang, Y.C., 2017. Axially restrained steel beams with web openings at
elevated temperatures, part 2: Development of an analytical method. Journal of

211
Constructional Steel Research, 128, pp.687–705.
Narmashiri, K., Ramli Sulong, N.H. & Jumaat, M.Z., 2012. Failure analysis and
structural behaviour of CFRP strengthened steel I-beams. Construction and
Building Materials, 30, pp.1–9.
Narmashiri, K., Ramli Sulong, N.H. & Jumaat, M.Z., 2011. Flexural strengthening of
steel I-beams by using CFRP strips. International Journal of Physical Sciences,
6(7), pp.1620–1627.
Okeil, A.M., Bingol, Y & Ferdous, M.R., 2009. Novel Technique for Inhibiting
Buckling of Thin-Walled Steel Structures Using Pultruded Glass FRP Sections.
Journal of composites for construction, 13(6), pp.547–557.
Peiris, N.A., 2011. Steel beams strengthened with ultra high modulus CFRP laminates,
University of Kentucky.
Photiou, N., Hollaway, L.C. & Chryssanthopoulos, M.K., 2004. Strengthening Of An
Artificially Degraded Steel Beam Utilising A Carbon/Glass Composite System. In
Advanced Polymer Composites for Structural Applications in Construction: ACIC
2004. pp. 274–283.
Redwood, R.G. and Demirdjian, S., 1998. Castellated beam web buckling in Shear.
Journal of Stmc?ural Engineering, American Society of Civil Engineers, 124(8),
pp.1202–1207.
Redwood, R.G. & McCutcheon, J.O., 1968. Beam tests with unreinforced web
openings. Journal of the Structural Division.
Schnerch, D. et al., 2006. Design guidelines for the use of HM strips: strengthening of
steel-concrete composite bridges with high modulus carbon fiber reinforced
polymer (CFRP) strips.
Seleem, M.H., Sharaky, I.A. & Sallam, H.E.M., 2010. Flexural behaviour of steel
beams strengthened by carbon fiber reinforced polymer plates–Three dimensional
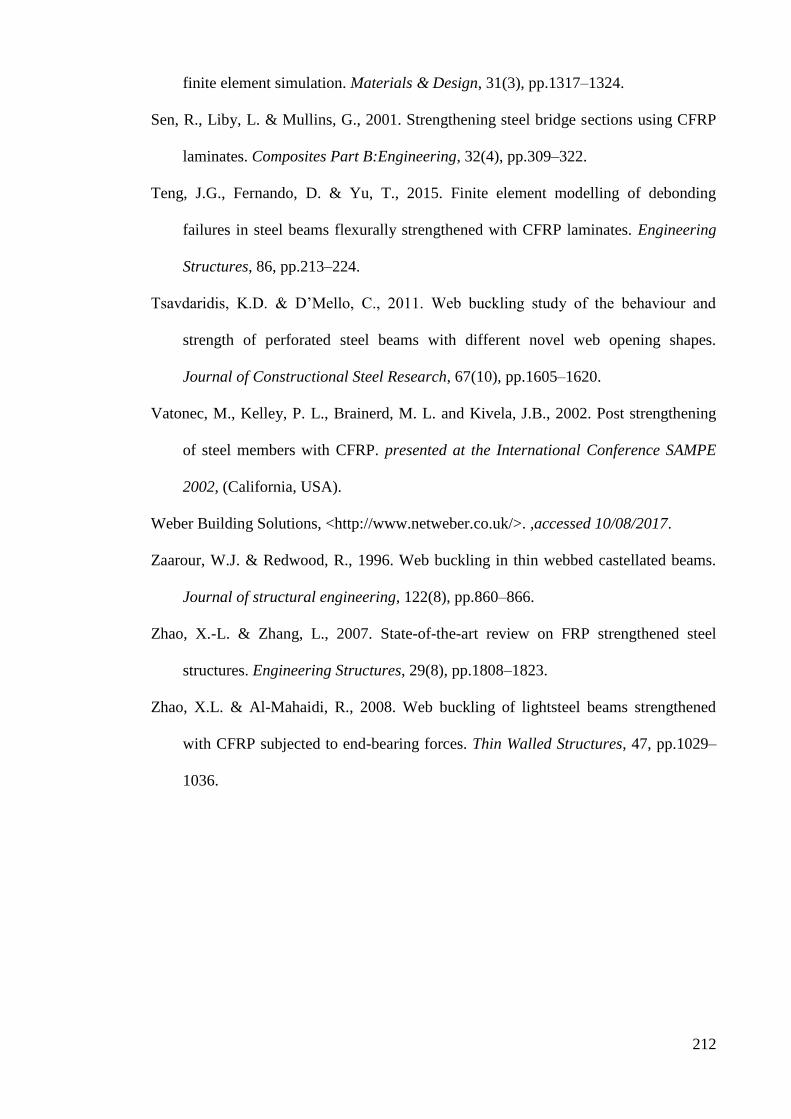
212
finite element simulation. Materials & Design, 31(3), pp.1317–1324.
Sen, R., Liby, L. & Mullins, G., 2001. Strengthening steel bridge sections using CFRP
laminates. Composites Part B:Engineering, 32(4), pp.309–322.
Teng, J.G., Fernando, D. & Yu, T., 2015. Finite element modelling of debonding
failures in steel beams flexurally strengthened with CFRP laminates. Engineering
Structures, 86, pp.213–224.
Tsavdaridis, K.D. & D’Mello, C., 2011. Web buckling study of the behaviour and
strength of perforated steel beams with different novel web opening shapes.
Journal of Constructional Steel Research, 67(10), pp.1605–1620.
Vatonec, M., Kelley, P. L., Brainerd, M. L. and Kivela, J.B., 2002. Post strengthening
of steel members with CFRP. presented at the International Conference SAMPE
2002, (California, USA).
Weber Building Solutions, <http://www.netweber.co.uk/>. ,accessed 10/08/2017.
Zaarour, W.J. & Redwood, R., 1996. Web buckling in thin webbed castellated beams.
Journal of structural engineering, 122(8), pp.860–866.
Zhao, X.-L. & Zhang, L., 2007. State-of-the-art review on FRP strengthened steel
structures. Engineering Structures, 29(8), pp.1808–1823.
Zhao, X.L. & Al-Mahaidi, R., 2008. Web buckling of lightsteel beams strengthened
with CFRP subjected to end-bearing forces. Thin Walled Structures, 47, pp.1029–
1036.