156 - Wind Load Cases North anchorage South anchorage Openings Closings Closings Openings Live(L
35
- 156 - B.3.5.1.2 Expansion Without any longitudinal restraint, the maximum deck movement will be in the range of ±1.9m for the load combination of L+T and L+W as shown in Table B.3.5.1-1. Since this movement is extremely large, very frequent maintenances and repair works on the bearing and expansion joint are foreseen. The movements are limited to ±1.0m by introducing hydraulic buffer system between the deck and the anchorages and thereby expansion joints with the capacity up to ±1.1m are installed at both ends of the deck. Deck movement ranges with hydraulic buffers are shown in Table B.3.5.1-2. The hydraulic buffer is designed in order to reduce fast movements from traffics passing, braking, dynamic wind and earthquake and to physically block movements exceeding the limit. Table B.3.5.1-1 Deck movement ranges without any longitudinal restraints (unit: m) Load Cases North anchorage South anchorage Openings Closings Closings Openings Live(L) -1.46 1.37 -1.37 1.46 Temperature(T) -0.42 0.46 -0.46 0.42 Settlement (SD) -0.07 0.07 -0.07 0.07 Error (E0) -0.01 0.01 -0.01 0.01 Wind(W) -0.33 0.33 -0.33 0.33 Earthquake(EQ) -0.66 0.66 -0.66 0.66 L+T -1.88 1.83 -1.83 1.88 L+W -1.79 1.70 -1.70 1.79 Table B.3.5.1-2 Deck movement ranges with hydraulic buffers (unit: m) Load Cases North anchorage South anchorage Openings Closings Closings Openings Live(L) -0.64 0.57 -0.57 0.64 Temperature(T) -0.42 0.46 -0.46 0.42 Wind(W) -0.33 0.33 -0.33 0.33 L+T -1.06 1.03 -1.03 1.06 L+W -0.97 0.90 -0.90 0.97 B.3.5.1.3 Navigation clearance check The main navigational clearance of 1000m x 64m is provided as per RFP under reference loading condition. The loading conditions for the check of navigational clearance are found as in Design Basis of Great Belt East Bridge. For the Izmit Bay Bridge, it is assured the navigational clearance can be maintained with a minimum clearance height of 1.2m between deck soffit and navigation clearance for the load combination of 1.0G + 1.0T + 0.5L.
-
Upload
independent -
Category
Documents
-
view
2 -
download
0
Transcript of 156 - Wind Load Cases North anchorage South anchorage Openings Closings Closings Openings Live(L

- 156 -
B.3.5.1.2 Expansion
Without any longitudinal restraint, the maximum deck movement will be in the range of ±1.9m for the
load combination of L+T and L+W as shown in Table B.3.5.1-1. Since this movement is extremely
large, very frequent maintenances and repair works on the bearing and expansion joint are foreseen.
The movements are limited to ±1.0m by introducing hydraulic buffer system between the deck and
the anchorages and thereby expansion joints with the capacity up to ±1.1m are installed at both ends
of the deck. Deck movement ranges with hydraulic buffers are shown in Table B.3.5.1-2. The
hydraulic buffer is designed in order to reduce fast movements from traffics passing, braking,
dynamic wind and earthquake and to physically block movements exceeding the limit.
Table B.3.5.1-1 Deck movement ranges without any longitudinal restraints (unit: m)
Load Cases North anchorage South anchorage
Openings Closings Closings Openings
Live(L) -1.46 1.37 -1.37 1.46
Temperature(T) -0.42 0.46 -0.46 0.42
Settlement (SD) -0.07 0.07 -0.07 0.07
Error (E0) -0.01 0.01 -0.01 0.01
Wind(W) -0.33 0.33 -0.33 0.33
Earthquake(EQ) -0.66 0.66 -0.66 0.66
L+T -1.88 1.83 -1.83 1.88
L+W -1.79 1.70 -1.70 1.79
Table B.3.5.1-2 Deck movement ranges with hydraulic buffers (unit: m)
Load Cases North anchorage South anchorage
Openings Closings Closings Openings
Live(L) -0.64 0.57 -0.57 0.64
Temperature(T) -0.42 0.46 -0.46 0.42
Wind(W) -0.33 0.33 -0.33 0.33
L+T -1.06 1.03 -1.03 1.06
L+W -0.97 0.90 -0.90 0.97
B.3.5.1.3 Navigation clearance check
The main navigational clearance of 1000m x 64m is provided as per RFP under reference loading
condition. The loading conditions for the check of navigational clearance are found as in Design Basis
of Great Belt East Bridge. For the Izmit Bay Bridge, it is assured the navigational clearance can be
maintained with a minimum clearance height of 1.2m between deck soffit and navigation clearance
for the load combination of 1.0G + 1.0T + 0.5L.

- 157 -
Vertical deflections
The vertical deflections under service loading conditions are tabulated as follows.
Locations Live Wind Temperature Earthquake Error
At side span(1/2) -6.92m -0.64m -0.21m -1.48m -0.08m
At tower -1.50m -0.25m -0.11m -0.52m -0.04m
At main span (1/4) -9.76m -1.50m -0.99m -1.08m -0.42m
At main span (1/2) -10.50m -1.63m -1.34m -0.43m -0.58m
Navigational clearance
Locations
Proposed
elevation
(A)
Girder
depth
(B)
Girder
deflection
(C)
Obtain
clearance
(D) =(A)-(B)-(C)
Navigation
clearance
(E)
Allowance
(D)-(E)
Point A 74.703m 4.5m 5.050m 65.153m 64m 1.2m
Point B 79.090m 4.5m 7.380m 67.210m 64m 3.2m
B.3.5.2 Orthotropic Steel Bridge Deck
B.3.5.2.1 General
Design of the bridge deck is in accordance with EN 1993 and based upon verification of ultimate limit
state strength by using partial factor method.
Partial factors for steel materials are to be taken into account in accordance with BS EN 1993-2:2006
Resistance of Partial factors Value Remark
Cross sections γM0 1.00
Members γM1 1.10
B.3.5.2.2 Cross sections
A streamlined box cross section having rounded fairing has a total width of 36.7m. The deck plate is
14mm thick, which is a minimum requirement for the surfacing layer of 70mm, according to EC3.
The 14mm of deck plate thickness and 12mm of sidewalk plate thickness are applied along the entire

- 158 -
length of the bridge deck. For the bottom and web plates, a minimum thickness of 8mm is adopted at
normal cross section and increased up to 20mm in the vicinity of the towers. The closed stiffeners
with trapezoidal profiles are used. 300mm × 275mm × 6(8) troughs for deck plate and 450mm
× 225mm × 6(8) troughs are adopted at both 600mm centre at deck and 900mm centre at bottom
flange, respectively. The bridge deck cross sections are classified into 2 types and its material
characteristics are tabulated below.
An open truss type diaphragm is adopted at 4.0m spacing in longitudinal direction, which is more
economical than full plate type bulkhead. The spacing of 4.0m is a well known support condition for
the orthotropic deck.
It is assumed that all cross sections are classified to Class 4 in which local buckling will occur prior to
the attainment of yield stress. The effects of local buckling and shear lag have been considered by
effective width method which reduces resistance instead of the yield strength.
Cross section (Typical)
Material properties Unit TYPE 1 TYPE 2 Remarks
Steel grade - HSB 500 SM520 HSB 600 SM570
Yield strength(fy) MPa 380 360 450 450
Ultimate tensile strength(fu) MPa 500 520 600 570
Modulus of elasticity(E) MPa 210,000 210,000 210,000 210,000

- 159 -
B.3.5.2.3 Resultant forces for ULS combination
The resultant design force envelopes for the bridge deck from global analysis are plotted as shown
below.
Axial forces envelopes
The axial force envelopes for the cases of maximum and minimum bending moments are shown
below.
Vertical bending moment envelope
Horizontal bending moment envelope
- 160 -
Shear forces envelope
B.3.5.2.4 Bridge Deck
Fiber stress points
Resistance of cross section
(1) Resistance to flexural bending stresses
The design value of a loading effect in each cross section does not exceed the corresponding design
resistance and if several loading effects act simultaneously the combined effect does not exceed the
resistance for that combination.
Members which are subjected to combined bending and axial force satisfy:
1/// 0min..
.
0min..
.
0
≤+
++
+⋅ Myzeff
NzEdEdz
Myyeff
NyEdEdy
Myeff
ED
fW
eNM
fW
eNM
fA
N
γγγ
where, Aeff is the effective area of the cross section when subjected to uniform compression
Weff.min is the effective section modulus (corresponding to the fibre with the maximum
elastic stress) of the cross section when subjected only to moment about the relevant axis
eN is the shift of the relevant centroidal axis when the cross section is subjected to
compression only

- 161 -
(2) Resistance to flexural shear stresses
For unstiffened or stiffened webs the design resistance for shear is taken as:
Ml
hfVVV
wtyw
RdbfRdbwRDb⋅
⋅⋅≤+=
γ
η
3...
where, the contribution from the web is given by :
Ml
wyww
Rdbw
thfV
γ
χ
3.
⋅⋅⋅=
and the contribution from the flanges Vbf,Rd is not considered in this calculation.
The resistance for shear satisfies the following criteria.
0.1.
3 ≤=Rdb
Ed
V
Vη
(3) Interaction between shear force, bending moment and axial force
Provided that η3 does not exceed 0.5, the design resistance to bending moment and axial force need
not to be reduced to allow for the shear force. If η3 is more than 0.5, the combined effects of bending
and shear in the web of an I or box girder satisfy:
( )Rdpl
Rdf
Rdpl
Rdf
M
Mfor
M
M
.
.
1
2
3
.
.
1 0.1121 ≥≤−
−+ ηηη
(4) Summary for bending and shear check
For all elements, the capacity of cross sections along the length of the steel girders has been verified
to be satisfactory. The verification and limit criteria are plotted along the length of the girder as shown
below.
① Bending check (Check Point 01, 02)
- 162 -
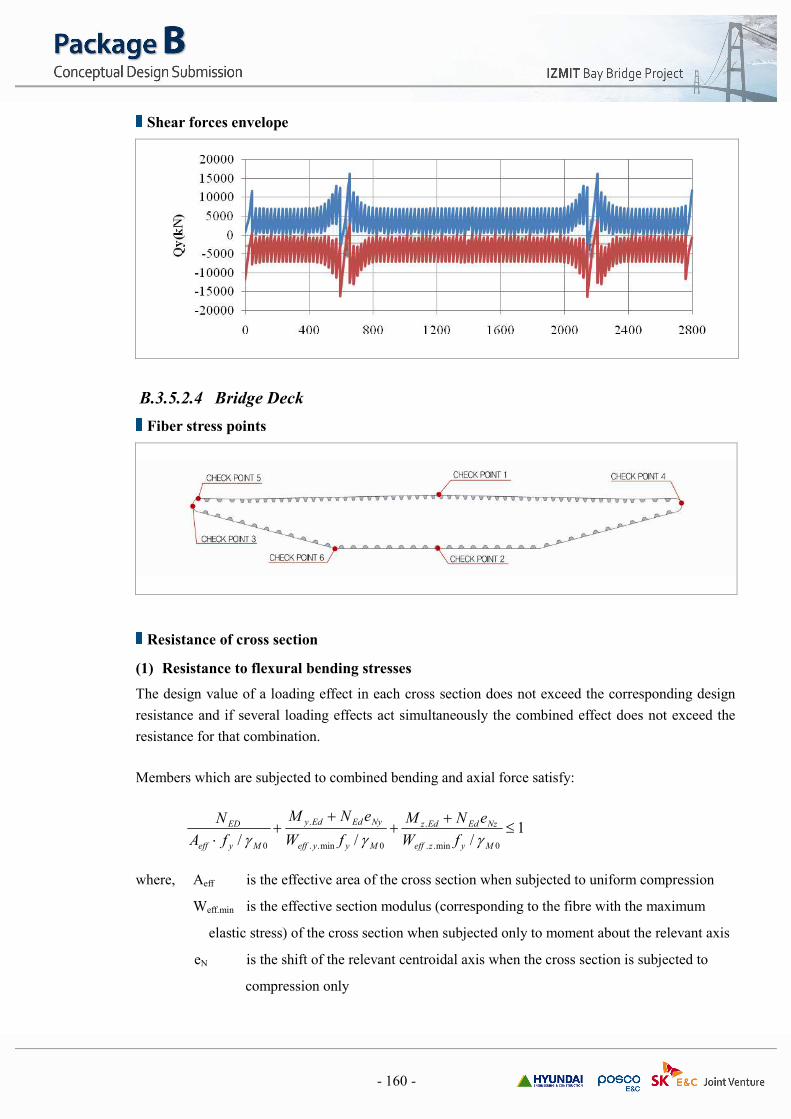
② Bending check (Check Point 03,04)
③ Bending check (Check Point 05)
④ Bending check (Check Point 06)
- 163 -
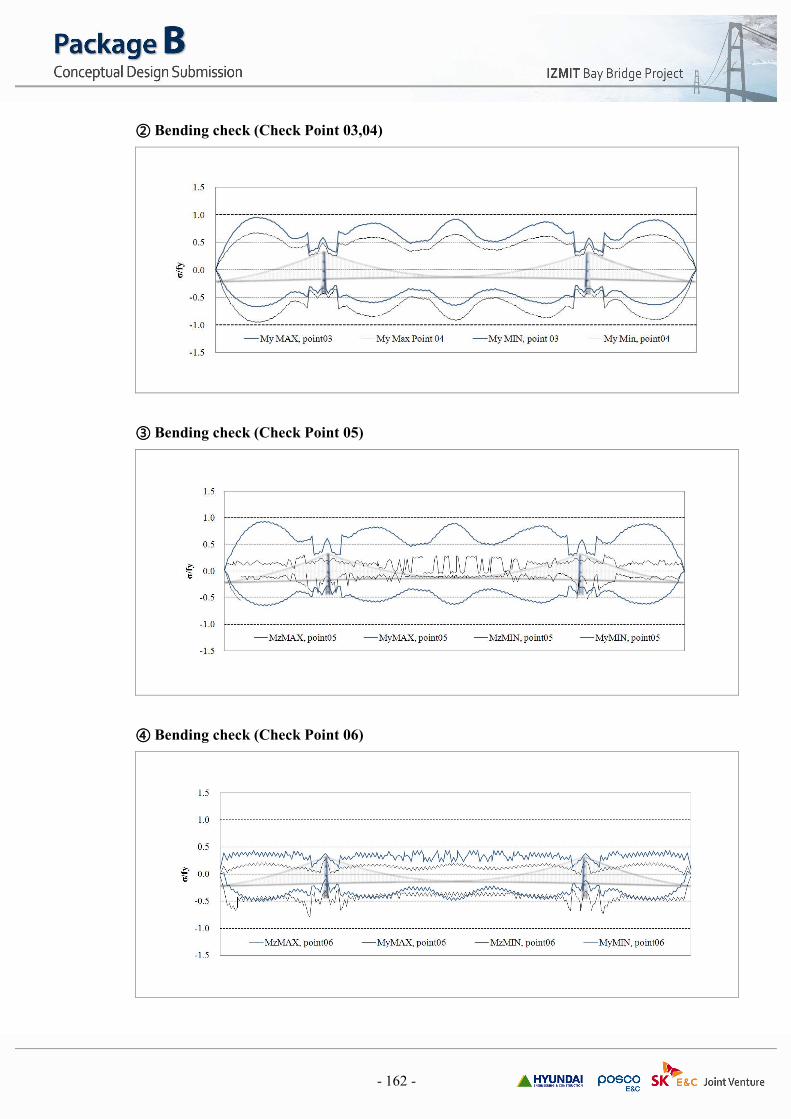
⑤ Shear check
Provided that the design value of the shear force VEd does not exceed 50% of the design plastic shear
resistance Vb,Rd, no reduction of the resistance for bending and axial force need be made.
B.3.5.3 Cable Structures
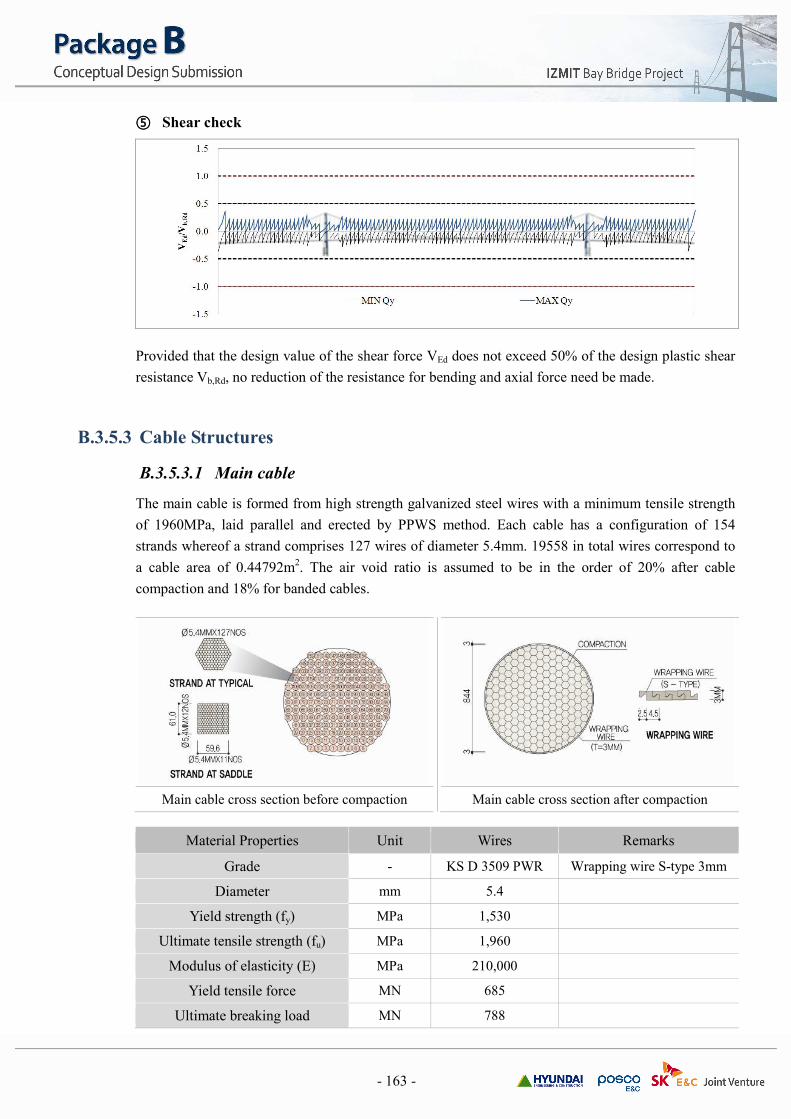
B.3.5.3.1 Main cable
The main cable is formed from high strength galvanized steel wires with a minimum tensile strength
of 1960MPa, laid parallel and erected by PPWS method. Each cable has a configuration of 154
strands whereof a strand comprises 127 wires of diameter 5.4mm. 19558 in total wires correspond to
a cable area of 0.44792m2. The air void ratio is assumed to be in the order of 20% after cable
compaction and 18% for banded cables.
Main cable cross section before compaction Main cable cross section after compaction
Material Properties Unit Wires Remarks
Grade - KS D 3509 PWR Wrapping wire S-type 3mm
Diameter mm 5.4
Yield strength (fy) MPa 1,530
Ultimate tensile strength (fu) MPa 1,960
Modulus of elasticity (E) MPa 210,000
Yield tensile force MN 685
Ultimate breaking load MN 788

- 164 -
Verification of resistance
The main cables have been designed for both ultimate limit state (ULS) and service limit state (SLS)
in accordance with EN 1993-1-11:2006. For ultimate limit state, applied axial forces will not exceed
the design tensile resistance. For serviceability limit state, stress and strain levels in the component
will not exceed the limiting values.
(1) ULS verification
The resistances of cables have been verified as follows
1≤Rd
Ed
F
F,
=R
k
R
ukRd
FFF
γγ,
5.1min
(2) SLS verification
The stress level is limited to 45% of tensile strength: FRD = 0.45 Fuk
Limit state Splay saddle Side span Main span Center node
ULS
ULS 482 528 519 478
FRD_ULS 585 585 585 585
Utilization ratio 0.82 0.90 0.89 0.82
Check O.K O.K O.K O.K
SLS
SLS 356 390 384 353
FRD_SLS 395 395 395 395
Utilization ratio 0.90 0.99 0.97 0.89
Check O.K O.K O.K O.K
As shown in the above table, serviceability check takes precedence over ULS verification. For
serviceability limit state, the maximum cable tensile force of 395MN occurs at side span in the
vicinity of the main tower. The maximum utilization ratio reaches 0.99, which corresponds to safety
factor of 2.2.
B.3.5.3.2 Hangers
A hanger is very slender and high strength element that carries the loads from the suspended bridge
deck. Because of their small cross section, the bridge might be exposed to vulnerability with regard to
accidental damage. In particular, the risk of progressive collapse will be thoroughly assessed and
necessary means to mitigate the risk will be taken. Since this bridge sustains relatively high traffic
loads, double hanger system will be more advantageous than single hanger system in case of hanger
loss, and therefore the double hanger system has been adopted.

- 165 -
Hanger cross section
Four different sizes of hanger in the following table are used.
Items TYPE-H1 TYPE-H2 TYPE-H3 TYPE-H4
Cross sections
No. of wires Φ5.0mm-151 Φ5.0mm-211 Φ5.0mm-223 Φ5.0mm-367
Areas 2,965mm2 4,143mm
2 4,379mm
2 7,206mm
2
Grades KS D 3509 KS D 3509 KS D 3509 KS D 3509
Tensile strength 1670MPa 1670MPa 1670MPa 1670MPa
Breaking load 4,951kN 6,919kN 7,312kN 12,034kN
Elastic modulus 2.0E5MPa 2.0E5MPa 2.0E5MPa 2.0E5MPa
� Strength verification
As described in B3.5.3.1, the hanger has been checked for both ULS and SLS.
Limit state Hanger No.1
side span
Hanger No.24
at tower
Hanger No.56
main span
ULS
ULS 4.04 6.92 2.63
FRD_ULS 4.88 8.02 3.30
Utilization ratio 0.83 0.86 0.80
Check O.K O.K O.K
SLS
SLS 2.98 5.12 1.94
FRD_SLS 3.29 5.42 2.23
Utilization ratio 0.91 0.94 0.87
Check O.K O.K O.K
- 166 -
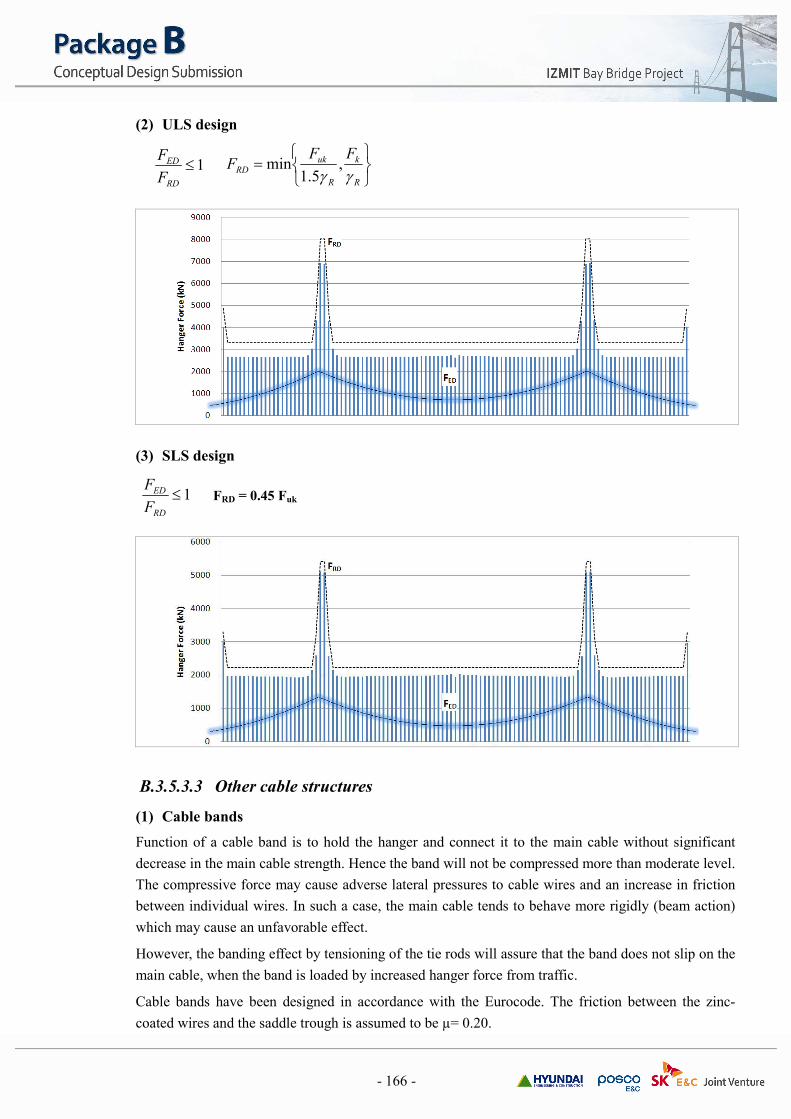
(2) ULS design
(3) SLS design
FRD = 0.45 Fuk
B.3.5.3.3 Other cable structures
(1) Cable bands
Function of a cable band is to hold the hanger and connect it to the main cable without significant
decrease in the main cable strength. Hence the band will not be compressed more than moderate level.
The compressive force may cause adverse lateral pressures to cable wires and an increase in friction
between individual wires. In such a case, the main cable tends to behave more rigidly (beam action)
which may cause an unfavorable effect.
However, the banding effect by tensioning of the tie rods will assure that the band does not slip on the
main cable, when the band is loaded by increased hanger force from traffic.
Cable bands have been designed in accordance with the Eurocode. The friction between the zinc-
coated wires and the saddle trough is assumed to be µ= 0.20.
=R
k
R
ukRD
FFF
γγ,
5.1min1≤
RD
ED
F
F
1≤RD
ED
F
F

- 167 -
� Material
The cast steel has the following characteristics (SCW550 grade or equivalent):
fa = 209MPa fy = 355MPa fu = 550MPa
The band bolts are (SCM440 grade or equivalent):
fa = 491MPa fy = 834MPa fu = 981MPa
� Design of cable bands
Items TYPE-1 TYPE-2 TYPE-3 TYPE-4 TYPE-5
Material Band SCW550 SCW550 SCW550 SCW550 SCW550
Bolt SCM440 SCM440 SCM440 SCM440 SCM440
Band length 2000mm 1200mm 1400mm 1600mm 3000mm
Num. of bolts 20 EA 12 EA 14 EA 16 EA 30 EA
Thickness 38mm 38mm 38mm 38mm 38mm
Sliding check 8.92 > 1.65 4.26 > 1.65 4.20 > 1.65 3.64 > 1.65 2.89 > 1.65
Separate check 2.08 > 1.65 1.96 > 1.65 2.31 > 1.65 2.37 > 1.65 1.98 > 1.65
Hoop stress 137MPa 137MPa 137MPa 137MPa 137MPa
Contact pressure 11.6MPa 11.6MPa 11.6MPa 11.6MPa 11.6MPa
(2) Tower saddles
The tower saddles, installed on the bent in order to make the main cable pass through the top of the
tower, act as a structure transmitting reaction force of main cable to the tower. The trough of the
saddle is made of cast steel, whereas its body structures are made of structural steel plates.
� Design of Tower Saddle
Classification Values Remarks
Trough Material SCW550 fa= 209MPa / fy=355MPa / fu=550MPa
Curvature R1=7250mm / R2=6250mm
Web
Material HSB500 fa= 220MPa / fy=380MPa / fu=500MPa
Number Main 2NOS
Rib 16NOS
Base Material HSB500 fa= 220MPa / fy=380MPa / fu=500MPa

- 168 -
� Stress Check
Classification Stress check Remarks
Trough
Deck plate f = 78MPa < fa=209MPa O.K
Side wall f = 77MPa < fa=209MPa O.K
Web f = 125MPa < fa=220MPa O.K
Base f = 122MPa < fa=220MPa O.K
(3) Splay Saddles
Splay saddles fix main cables to the anchorage and ensure that the main cables are spread out with a
strand as a unit.
The splay saddles are composite structures that transmit load directly. The trough of the saddle is
made of cast steel, whereas other members are made of steel plate.
� Design of Splay Saddles
Classification Values Remarks
Trough
Material SCW550 fa= 209MPa / fy=355MPa / fu=550MPa
Curvature
RV R1=7,500mm / R2=5,500mm
RH RH = 21,752mm
Web
Material HSB500 fa= 220MPa / fy=380MPa / fu=500MPa
Number of web 2NOS
Base Material HSB500 fa= 220MPa / fy=380MPa / fu=500MPa
� Stress Check
Classification Stress check Remarks
Trough
Deck plate f = 112MPa < fa=209MPa O.K
Side wall f = 152MPa < fa=209MPa O.K
Web f = 174MPa < fa=220MPa O.K
Base f = 112MPa < fa=220MPa O.K

- 169 -
B.3.5.4 Towers
The main towers are portal shaped frame structures consist of two slightly inclined legs
interconnected by 4 cross beams at the top and at intermediate levels between the foundation and the
tower top. The tower legs are supported on two separate circular jacket type foundations.
B.3.5.4.1 Cross Section
The towers, slightly tapered from 6.5m × 10m at the bottom to 6.5m × 6.5m at the top, have
rectangular cross section with square corner cuts. The general elevation and cross sections of the
tower legs are as shown below.
Cross Sections
Classifications Units Values Symbols
Steel grade - HSB 600
Yield strength N/mm2 450 fy
Ultimate tensile strength N/mm2 600 fu
Modulus of elasticity N/mm2 210,000 E
Shear modulus N/mm2 81,000 G

- 170 -
Partial Safety Factors
The partial factors applied to the characteristic values of resistance are tabulated as follows.
Resistance values Partial factors Value Remark
Cross sections γM0 1.0
Members γM1 1.1
B.3.5.4.2 Linear Buckling Analysis
To estimate the effective buckling length of the tower leg, elastic buckling analysis is carried out for
the completed bridge using RM2006. The effective buckling length of each element is derived from
the critical buckling forces for Euler column. Buckling safety factors for three buckling modes are
shown below.
Mode No. Buckling factor Description
1 4.608 tower's 1st mode in longitudinal direction
3 12.087 tower's 1st mode in transverse direction
4 11.921 tower's 2nd mode in longitudinal direction
1st mode : longitudinal direction
3rd mode : transverse direction

- 171 -
B.3.5.4.3 Design force for ULS combination
Axial force Nx (kN) Bending moment Mz (kN∙m) Bending moment My (kN∙m)
Shear force Qz (kN) Shear force Qy (kN)
- 172 -
B.3.5.4.4 Verifications
Cross section properties
It is assumed that all cross sections are classified to Class 4 in which local buckling will occur prior to
the attainment of yield stress. The effects of local buckling and shear lag are considered by effective
width method which reduces resistance instead of the yield strength.
Check buckling effects of plate
The resistance of plated members is determined using the effective areas of plate elements in
compression for Class 4 sections using cross sectional properties (Aeff, Ieff, Weff) for cross sectional
verifications and member verifications for column buckling and lateral buckling according to EN
1993-1-1. Effective areas are determined on the basis of the linear strain distribution with the
attainment of yield strain in the mid plane of the compression plate.
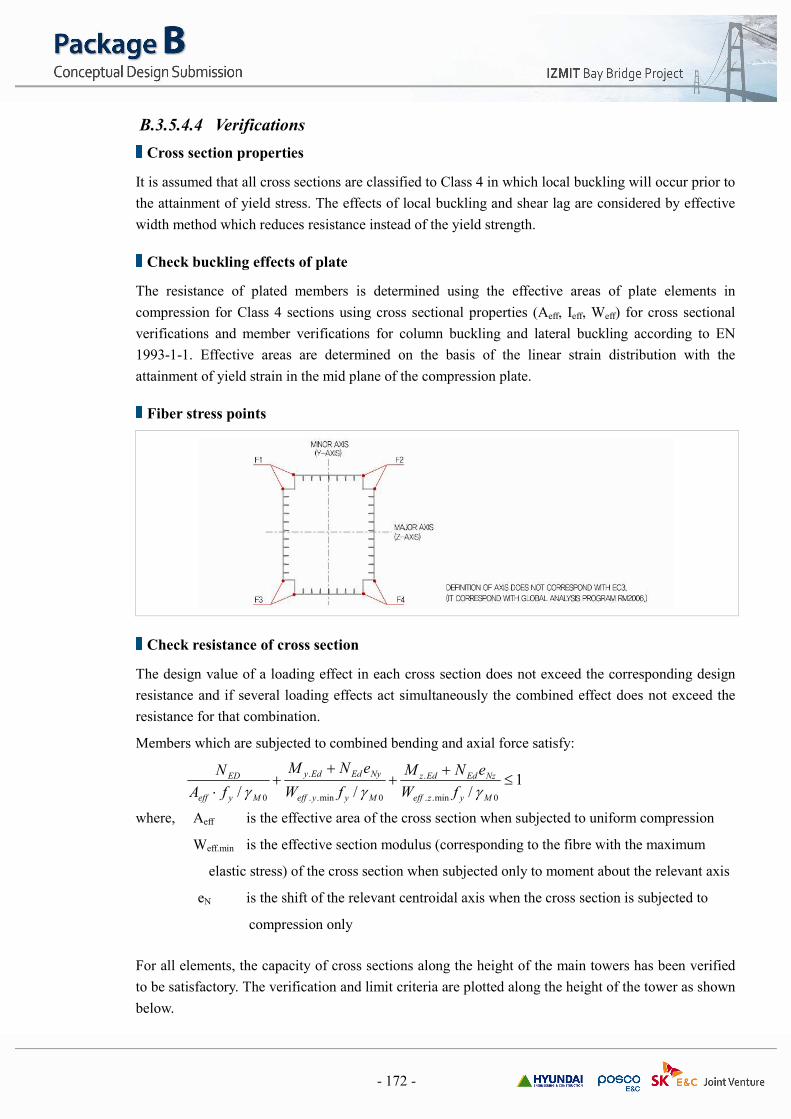
Fiber stress points
Check resistance of cross section
The design value of a loading effect in each cross section does not exceed the corresponding design
resistance and if several loading effects act simultaneously the combined effect does not exceed the
resistance for that combination.
Members which are subjected to combined bending and axial force satisfy:
1/// 0min..
.
0min..
.
0
≤+
++
+⋅ Myzeff
NzEdEdz
Myyeff
NyEdEdy
Myeff
ED
fW
eNM
fW
eNM
fA
N
γγγ
where, Aeff is the effective area of the cross section when subjected to uniform compression
Weff.min is the effective section modulus (corresponding to the fibre with the maximum
elastic stress) of the cross section when subjected only to moment about the relevant axis
eN is the shift of the relevant centroidal axis when the cross section is subjected to
compression only
For all elements, the capacity of cross sections along the height of the main towers has been verified
to be satisfactory. The verification and limit criteria are plotted along the height of the tower as shown
below.

- 173 -
Cross section check in bending and axial force – ULS load combinations
Cross section check in bending and axial force – Accidental load combinations
Check buckling resistance of members
(1) Uniform members in compression
A compression member is verified against buckling as follows:
0.1.
≤Rdb
Ed
N
N
where, NEd is the design value of the compression force
Nb.Rd is the design buckling resistance of the compression member

- 174 -
For axial compression in members the value of χ for the appropriate non-dimensional slenderness λ is
determined from the relevant buckling curve according to :
0.11
22≤
−Φ+Φ= χ
λχ but
where, [ ]2)2.0(15.0 λλα +−+=Φ
(2) Uniform members in bending
A laterally unrestrained member subjected to major axis bending is verified against lateral torsional
buckling as follows:
0.1.
≤Rdb
Ed
M
M
where MEd is the design value of the moment
Mb.Rd is the design buckling resistance moment
Beams with sufficient restraint to the compression flange are not susceptible to lateral-torsional
buckling. In addition, beams with certain types of cross sections, such as square or circular hollow
sections, fabricated circular tubes or square box sections are not susceptible to lateral-torsional
buckling. Therefore, the reduction factor for lateral-torsional buckling is χLT = 1.0 .
(3) Uniform members in bending and axial compression
Members which are subjected to combined bending and axial compression satisfy:
1.
..
.
.. ≤∆+
+∆+
+
Ml
Rkz
EdzEdzyz
Ml
Rky
LT
EdyEdy
yy
Ml
Rky
Ed
M
MMk
M
MMk
N
N
γγχ
γχ
1.
..
.
.. ≤∆+
+∆+
+
Ml
Rkz
EdzEdzzz
Ml
Rky
LT
EdyEdy
zy
Ml
Rkz
Ed
M
MMk
M
MMk
N
N
γγχ
γχ
where, NEd, My.Ed and Mz.Ed are the design values of the compression force and the maximum
moments about the y-y and axis along the member, respectively
∆My.Ed, ∆Mz.Ed are the moments due to the shift of the centroidal axis
Χy and Χz are the reduction factors due to flexural buckling
ΧLT is the reduction factor due to lateral torsional buckling
kyy, kzz,kzy,kzz are the interaction factors
- 175 -
(4) Interaction factor
The interaction factors according to EN 1993-1-1 : Annex B are not applied for member check
because a large displacement analysis including second order effect (P-δ effects) is carried out in global structural analysis.
Therefore, the value of 1.0 is applied for all elements as the interaction factor in the resistance check.
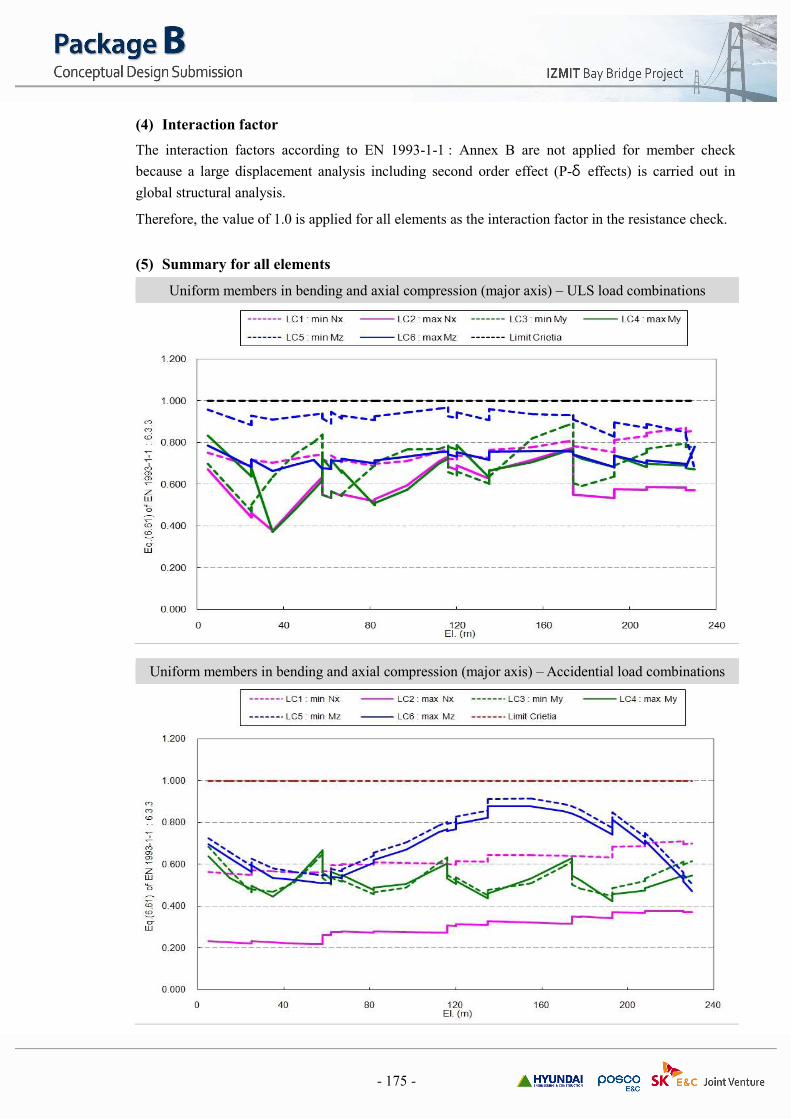
(5) Summary for all elements
Uniform members in bending and axial compression (major axis) – ULS load combinations
Uniform members in bending and axial compression (major axis) – Accidential load combinations
- 176 -
Check shear resistance of members
(1) Check the resistance for shear
For unstiffened or stiffened webs the design resistance for shear are taken as :
Ml
hfVVV
wtyw
RdbfRdbwRDb⋅
⋅⋅≤+=
γ
η
3...
in which the contribution from the web is given by :
Ml
wyww
Rdbw
thfV
γ
χ
3.
⋅⋅⋅=
and the contribution from the flanges Vbf, Rd is not considered in this calculation.
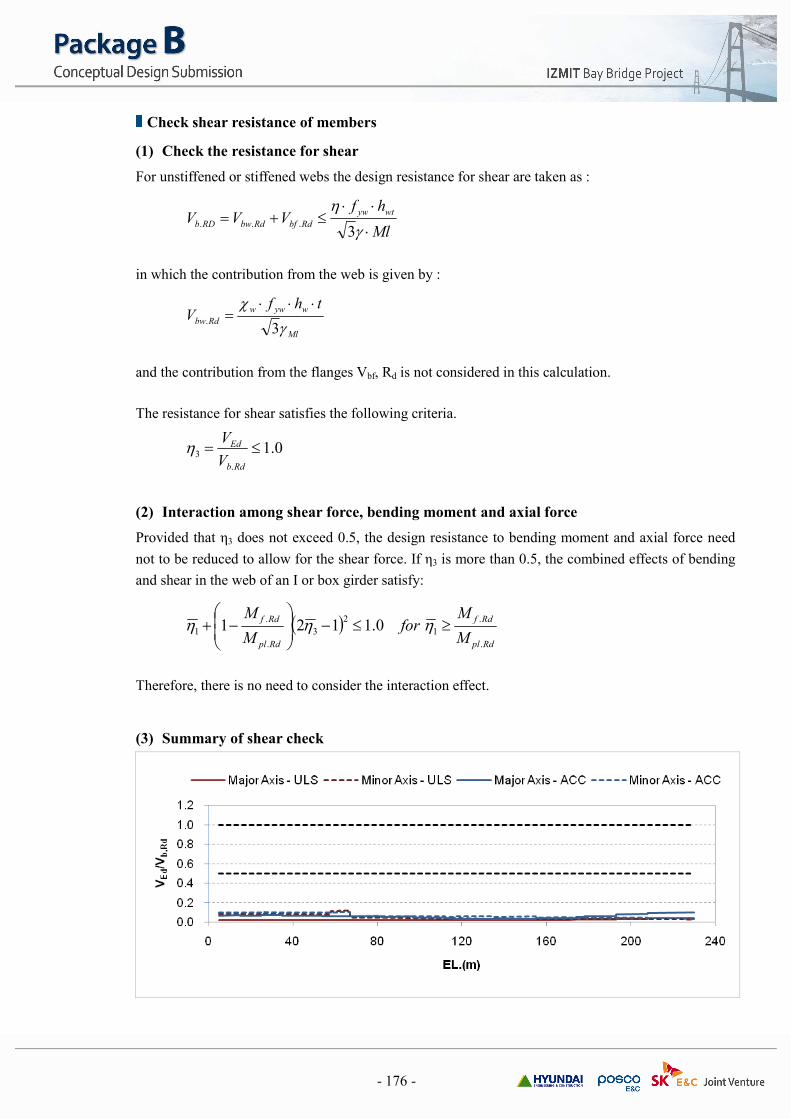
The resistance for shear satisfies the following criteria.
0.1.
3 ≤=Rdb
Ed
V
Vη
(2) Interaction among shear force, bending moment and axial force
Provided that η3 does not exceed 0.5, the design resistance to bending moment and axial force need
not to be reduced to allow for the shear force. If η3 is more than 0.5, the combined effects of bending
and shear in the web of an I or box girder satisfy:
( )Rdpl
Rdf
Rdpl
Rdf
M
Mfor
M
M
.
.
1
2
3
.
.
1 0.1121 ≥≤−
−+ ηηη
Therefore, there is no need to consider the interaction effect.
(3) Summary of shear check
- 177 -
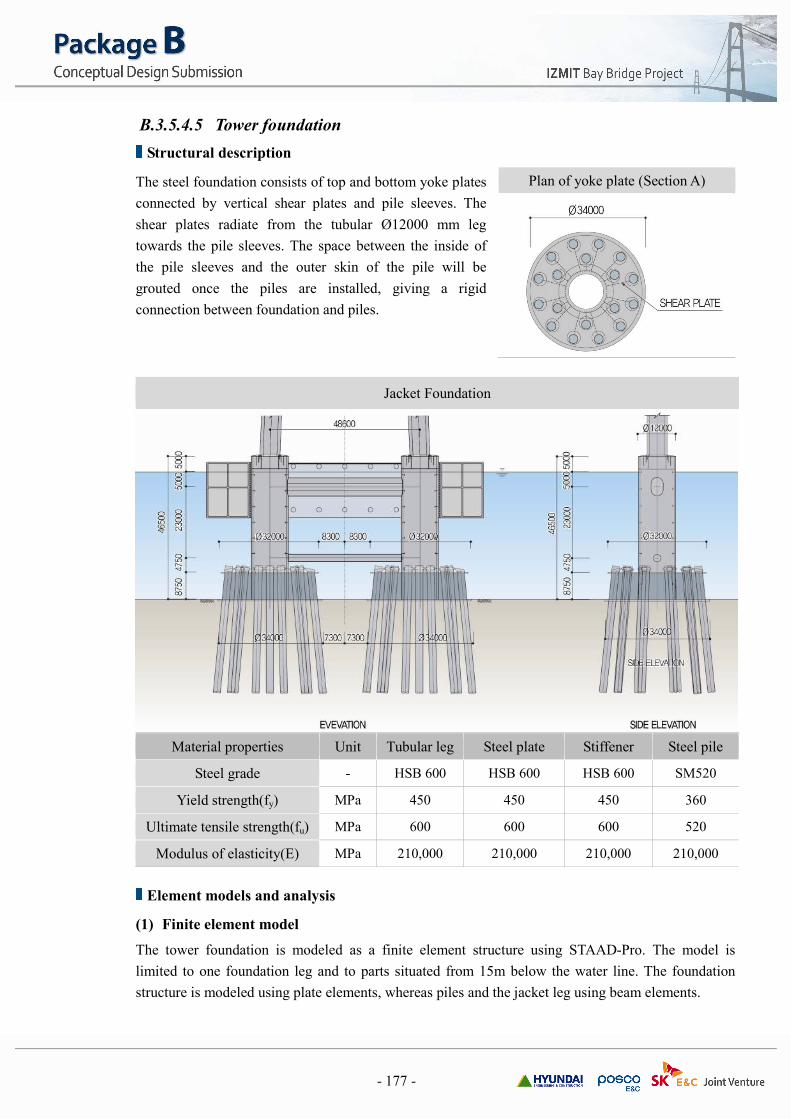
B.3.5.4.5 Tower foundation
Structural description
The steel foundation consists of top and bottom yoke plates
connected by vertical shear plates and pile sleeves. The
shear plates radiate from the tubular Ø12000 mm leg
towards the pile sleeves. The space between the inside of
the pile sleeves and the outer skin of the pile will be
grouted once the piles are installed, giving a rigid
connection between foundation and piles.
Jacket Foundation
Material properties Unit Tubular leg Steel plate Stiffener Steel pile
Steel grade - HSB 600 HSB 600 HSB 600 SM520
Yield strength(fy) MPa 450 450 450 360
Ultimate tensile strength(fu) MPa 600 600 600 520
Modulus of elasticity(E) MPa 210,000 210,000 210,000 210,000
Element models and analysis
(1) Finite element model
The tower foundation is modeled as a finite element structure using STAAD-Pro. The model is
limited to one foundation leg and to parts situated from 15m below the water line. The foundation
structure is modeled using plate elements, whereas piles and the jacket leg using beam elements.
Plan of yoke plate (Section A)

- 178 -
(2) Beam model
STAAD-Pro is used for creating a beam grid model. The foundation structure is represented by I-
profiles between the tubular jacket leg and the piles. Each shear plate is given a flange based on
effective width of the top and bottom yoke plates.
Finite element model - STAAD Beam model
Results
(1) Shear plates
Earthquake and vessel collision loads give the largest stresses in the shear plates.
The table below summarizes the design stresses for the relevant load cases for the given shear plate
with thickness of 45 mm:
Load case Shear plate connected to
pile no
Max Von Mises stress
fy=450MPa
Max shear stress
τy=260MPa
Vessel collision 1 9 420~450MPa 210~240MPa
Vessel collision 2 10 390~420MPa 180~210MPa
Earthquake 1 7 390MPa 210MPa
Earthquake 2 10 420~450MPa 250MPa
The Von Mises stress levels in the shear plates are very close to the yield strength. Shear stress gives
the largest contribution to the Von Mises stress for all load combinations. Therefore increased plate
thickness is the best approach for reducing plate stress. An increase of thickness from 45mm to 50
mm gives 11% extra capacity or stress reduction, i.e. Von Mises stress of 450MPa in a 45mm plate is
reduced to 405MPa.
- 179 -
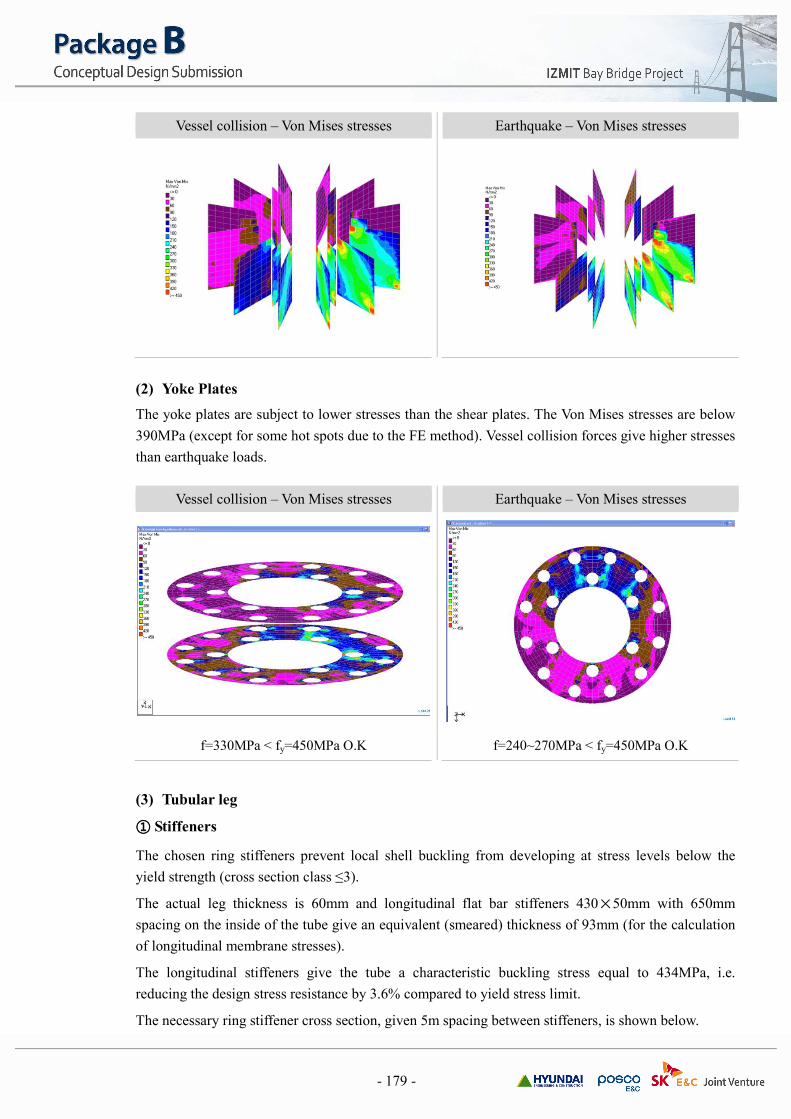
Vessel collision – Von Mises stresses Earthquake – Von Mises stresses
(2) Yoke Plates
The yoke plates are subject to lower stresses than the shear plates. The Von Mises stresses are below
390MPa (except for some hot spots due to the FE method). Vessel collision forces give higher stresses
than earthquake loads.
Vessel collision – Von Mises stresses Earthquake – Von Mises stresses
f=330MPa < fy=450MPa O.K f=240~270MPa < fy=450MPa O.K
(3) Tubular leg
① Stiffeners
The chosen ring stiffeners prevent local shell buckling from developing at stress levels below the
yield strength (cross section class ≤3).
The actual leg thickness is 60mm and longitudinal flat bar stiffeners 430×50mm with 650mm
spacing on the inside of the tube give an equivalent (smeared) thickness of 93mm (for the calculation
of longitudinal membrane stresses).
The longitudinal stiffeners give the tube a characteristic buckling stress equal to 434MPa, i.e.
reducing the design stress resistance by 3.6% compared to yield stress limit.
The necessary ring stiffener cross section, given 5m spacing between stiffeners, is shown below.
- 180 -
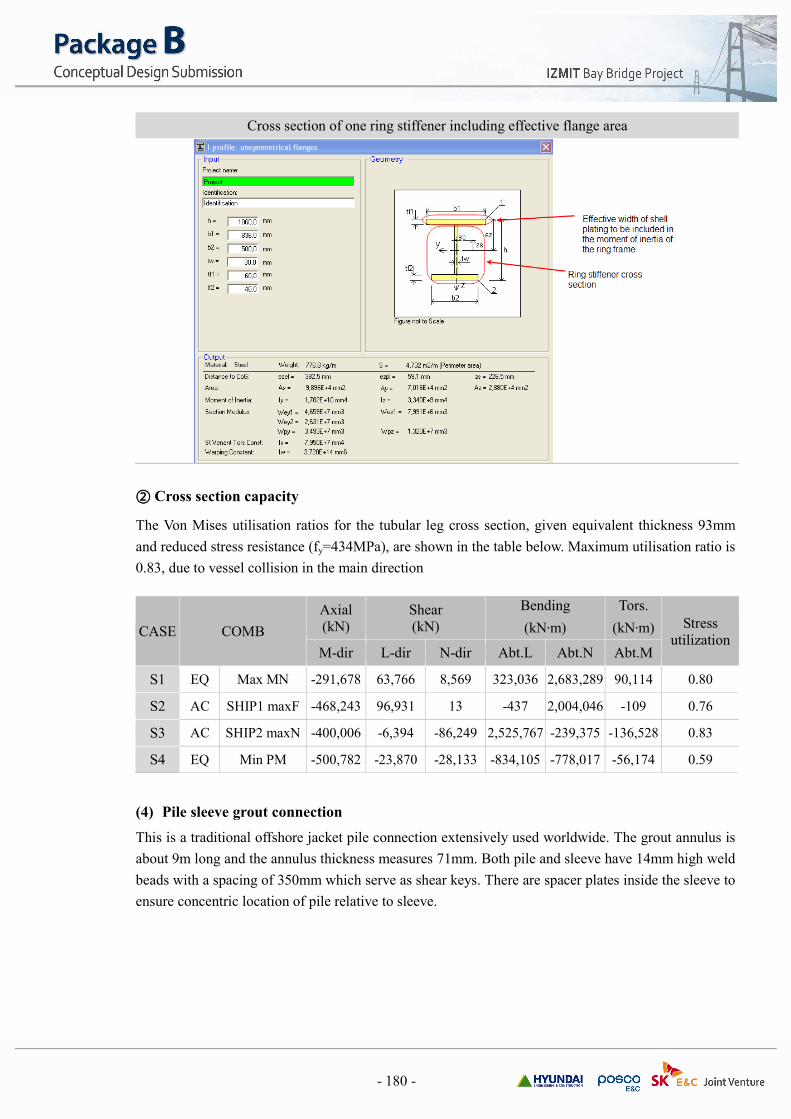
Cross section of one ring stiffener including effective flange area
② Cross section capacity
The Von Mises utilisation ratios for the tubular leg cross section, given equivalent thickness 93mm
and reduced stress resistance (fy=434MPa), are shown in the table below. Maximum utilisation ratio is
0.83, due to vessel collision in the main direction
CASE COMB
Axial
(kN)
Shear
(kN)
Bending
(kN·m)
Tors.
(kN·m) Stress
utilization M-dir L-dir N-dir Abt.L Abt.N Abt.M
S1 EQ Max MN -291,678 63,766 8,569 323,036 2,683,289 90,114 0.80
S2 AC SHIP1 maxF -468,243 96,931 13 -437 2,004,046 -109 0.76
S3 AC SHIP2 maxN -400,006 -6,394 -86,249 2,525,767 -239,375 -136,528 0.83
S4 EQ Min PM -500,782 -23,870 -28,133 -834,105 -778,017 -56,174 0.59
(4) Pile sleeve grout connection
This is a traditional offshore jacket pile connection extensively used worldwide. The grout annulus is
about 9m long and the annulus thickness measures 71mm. Both pile and sleeve have 14mm high weld
beads with a spacing of 350mm which serve as shear keys. There are spacer plates inside the sleeve to
ensure concentric location of pile relative to sleeve.

- 181 -
① Grout properties
The grout consists of standard Portland
cement mixed with water. The critical
parameter is the mixing, i.e. to obtain correct
water/cement ratio. In this manner, cube
strength of 60MPa is readily achieved.
Standard grout will not expand, but may
shrink. However, this has no negative effects
in small annuli (typical thickness <100 mm).
The durability of the grout is comparable with
concrete, which has shown to be excellent for
high density/strength applications. In addition
since the grout is protected/contained by pile
and sleeve, there are few environmental
impacts.
Special grout is sometimes used, particularly if extra high strength is required (typically 80-120MPa)
and/or special qualities are required such as fast setting, non-shrinkage, expanding qualities.
② Design check of grout connection
� Design rules
The grouted connection between pile sleeve and pile head is calculated using NORSOK standard N-
004 Design of steel structures, rev 2, October 2004. The NORSOK standards are developed and
owned by the Norwegian petroleum industry and used for the design of Norwegian offshore structures.
� Calculations
Chapter K.5.3 in N-004 gives the strength of a grouted connection.
The following input values are assumed:
- Characteristic cube strength of grout, fck 60Mpa
- Effective grouted connection length, Le 7.5m
- Steel-grout elastic modular ratio, m 18
- Design axial force, NSd 60MN
- Material factor for interface transfer strength, γM 2.0
- Characteristic interface transfer strength, fbk 2.455MPa
- Design interface transfer stress, τbSd 1.04MPa
- Utilization ratio, τbSd / ( fbk/ γM) 0.85
Pile sleeve with grout-filled void
- 182 -
③ Results and conclusion
The connection capacity is larger than the design force. The utilisation ratio for the connection is 85%.
The grout is sensitive to relative pile to sleeve movement during the first 24h after grouting, reducing
the grout strength if movements are too large. Given the rather calm waters of Izmit Bay, full grout
capacity is not difficult to achieve.
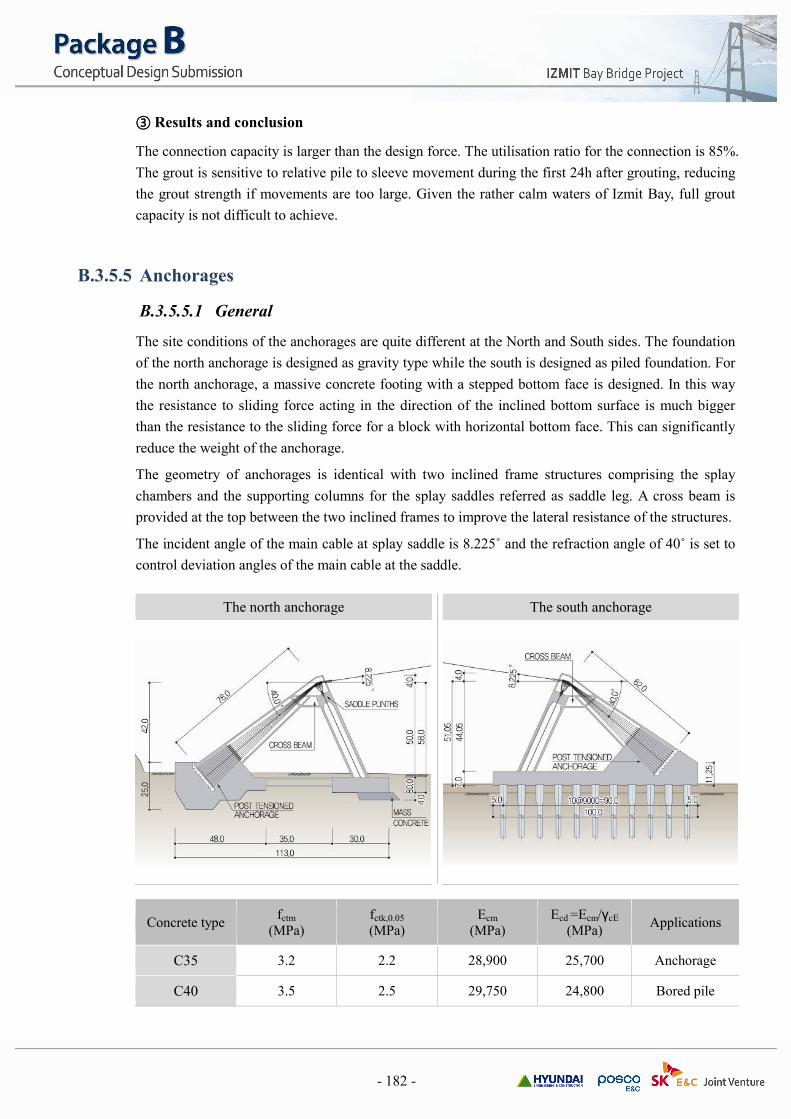
B.3.5.5 Anchorages
B.3.5.5.1 General
The site conditions of the anchorages are quite different at the North and South sides. The foundation
of the north anchorage is designed as gravity type while the south is designed as piled foundation. For
the north anchorage, a massive concrete footing with a stepped bottom face is designed. In this way
the resistance to sliding force acting in the direction of the inclined bottom surface is much bigger
than the resistance to the sliding force for a block with horizontal bottom face. This can significantly
reduce the weight of the anchorage.
The geometry of anchorages is identical with two inclined frame structures comprising the splay
chambers and the supporting columns for the splay saddles referred as saddle leg. A cross beam is
provided at the top between the two inclined frames to improve the lateral resistance of the structures.
The incident angle of the main cable at splay saddle is 8.225˚ and the refraction angle of 40˚ is set to
control deviation angles of the main cable at the saddle.
The north anchorage The south anchorage
Concrete type fctm
(MPa) fctk,0.05 (MPa)
Ecm
(MPa) Ecd =Ecm/γcE
(MPa) Applications
C35 3.2 2.2 28,900 25,700 Anchorage
C40 3.5 2.5 29,750 24,800 Bored pile
- 183 -
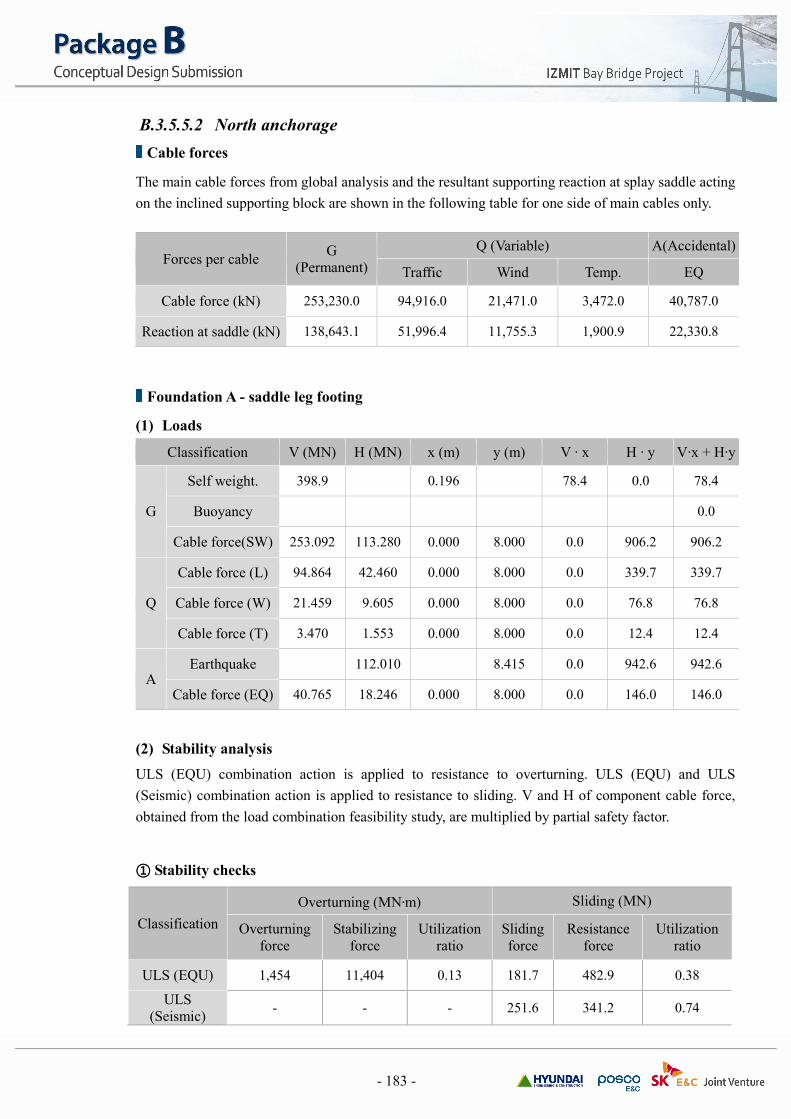
B.3.5.5.2 North anchorage
Cable forces
The main cable forces from global analysis and the resultant supporting reaction at splay saddle acting
on the inclined supporting block are shown in the following table for one side of main cables only.
Forces per cable G
(Permanent)
Q (Variable) A(Accidental)
Traffic Wind Temp. EQ
Cable force (kN) 253,230.0 94,916.0 21,471.0 3,472.0 40,787.0
Reaction at saddle (kN) 138,643.1 51,996.4 11,755.3 1,900.9 22,330.8
Foundation A - saddle leg footing
(1) Loads
Classification V (MN) H (MN) x (m) y (m) V · x H · y V·x + H·y
G
Self weight. 398.9 0.196 78.4 0.0 78.4
Buoyancy 0.0
Cable force(SW) 253.092 113.280 0.000 8.000 0.0 906.2 906.2
Q
Cable force (L) 94.864 42.460 0.000 8.000 0.0 339.7 339.7
Cable force (W) 21.459 9.605 0.000 8.000 0.0 76.8 76.8
Cable force (T) 3.470 1.553 0.000 8.000 0.0 12.4 12.4
A Earthquake 112.010 8.415 0.0 942.6 942.6
Cable force (EQ) 40.765 18.246 0.000 8.000 0.0 146.0 146.0
(2) Stability analysis
ULS (EQU) combination action is applied to resistance to overturning. ULS (EQU) and ULS
(Seismic) combination action is applied to resistance to sliding. V and H of component cable force,
obtained from the load combination feasibility study, are multiplied by partial safety factor.
① Stability checks
Classification
Overturning (MN·m) Sliding (MN)
Overturning
force
Stabilizing
force
Utilization
ratio
Sliding
force
Resistance
force
Utilization
ratio
ULS (EQU) 1,454 11,404 0.13 181.7 482.9 0.38
ULS
(Seismic) - - - 251.6 341.2 0.74
- 184 -
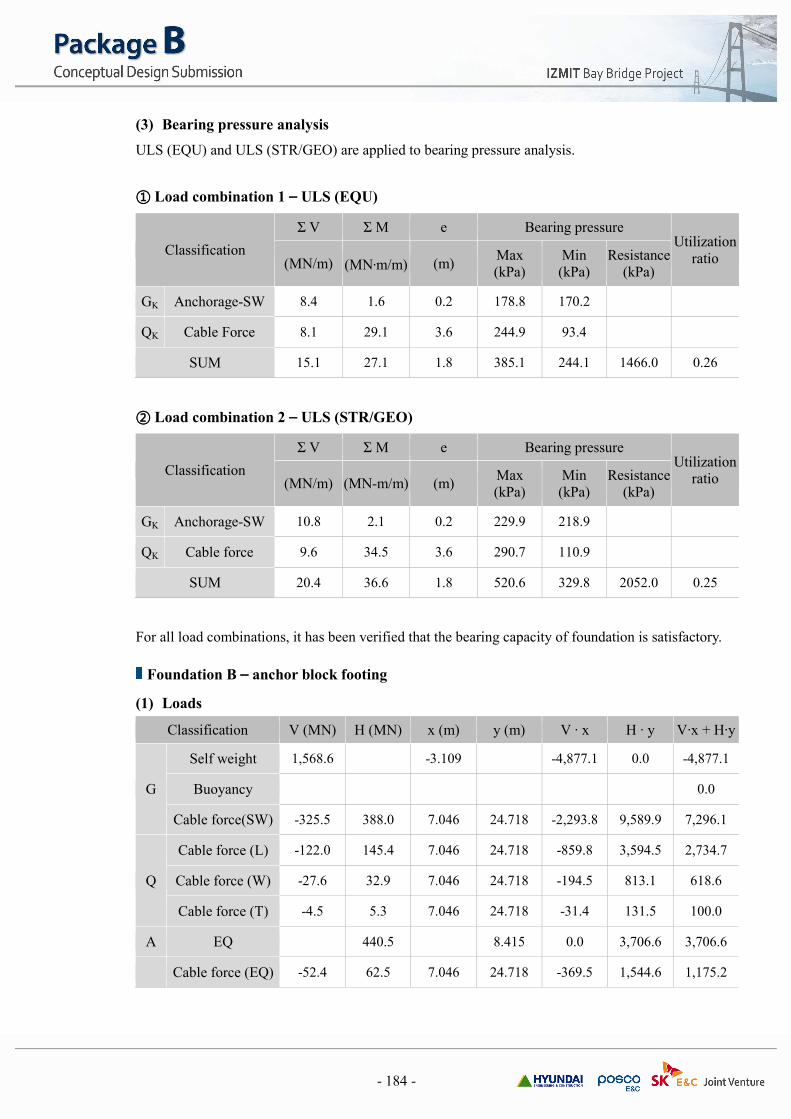
(3) Bearing pressure analysis
ULS (EQU) and ULS (STR/GEO) are applied to bearing pressure analysis.
① Load combination 1 – ULS (EQU)
Classification
Σ V Σ M e Bearing pressure Utilization
ratio (MN/m) (MN·m/m) (m) Max
(kPa)
Min
(kPa)
Resistance
(kPa)
GK Anchorage-SW 8.4 1.6 0.2 178.8 170.2
QK Cable Force 8.1 29.1 3.6 244.9 93.4
SUM 15.1 27.1 1.8 385.1 244.1 1466.0 0.26
② Load combination 2 – ULS (STR/GEO)
Classification
Σ V Σ M e Bearing pressure Utilization
ratio (MN/m) (MN-m/m) (m) Max
(kPa)
Min
(kPa)
Resistance
(kPa)
GK Anchorage-SW 10.8 2.1 0.2 229.9 218.9
QK Cable force 9.6 34.5 3.6 290.7 110.9
SUM 20.4 36.6 1.8 520.6 329.8 2052.0 0.25
For all load combinations, it has been verified that the bearing capacity of foundation is satisfactory.
Foundation B – anchor block footing
(1) Loads
Classification V (MN) H (MN) x (m) y (m) V · x H · y V·x + H·y
G
Self weight 1,568.6 -3.109 -4,877.1 0.0 -4,877.1
Buoyancy 0.0
Cable force(SW) -325.5 388.0 7.046 24.718 -2,293.8 9,589.9 7,296.1
Q
Cable force (L) -122.0 145.4 7.046 24.718 -859.8 3,594.5 2,734.7
Cable force (W) -27.6 32.9 7.046 24.718 -194.5 813.1 618.6
Cable force (T) -4.5 5.3 7.046 24.718 -31.4 131.5 100.0
A EQ 440.5 8.415 0.0 3,706.6 3,706.6
Cable force (EQ) -52.4 62.5 7.046 24.718 -369.5 1,544.6 1,175.2

- 185 -
(2) Stability analysis
ULS (EQU) of combination action is applied to resistance to overturning. ULS (EQU) and ULS
(Seismic) of combination action are applied to resistance to sliding. V and H of component cable
force, obtained from the load combination feasibility study, are multiplied by partial safety factor.
① Resultant summary
Classification
Overturning (MN·m) Sliding (MN)
Overturning
force
Stabilizing
force
Utilization
ratio Sliding force
Resistance
force
Utilization
ratio
ULS (EQU) 21,125 38,272 0.55 350.7 699.5 0.50
ULS (Seismic) - - - 609.0 650.4 0.94
(3) Bearing pressure analysis
ULS (EQU) and ULS (STR/GEO) are applied to bearing pressure analysis.
① Load combination 1 – ULS (EQU)
Classification
Σ V Σ M e Bearing pressure Utilization
ratio (MN/m) (MN-m/m) (m) Max
(kPa)
Min
(kPa)
Resistance
(kPa)
GK Anchorage-SW 27.5 -85.3 -3.1 349.6 794.2
QK Cable force -8.7 195.1 -22.4 326.6 -689.3
SUM 18.5 109.7 5.9 676.3 104.9 1466.0 0.46
② Load combination 2 – ULS (STR/GEO)
Classification
Σ V Σ M e Bearing pressure Utilization
ratio (MN/m) (MN-m/m) (m) Max
(kPa)
Min
(kPa)
Resistance
(kPa)
GK Anchorage-SW 35.3 -109.7 -3.1 449.5 1021.1
QK Cable force -10.3 231.5 -22.4 387.7 -818.2
SUM 25.0 121.8 4.9 837.3 202.9 2052.0 0.41
For all load combinations, it has been verified that the bearing capacity of foundation is satisfactory.

- 186 -
Check the cross section
(1) Saddle Leg
① Design member force
Classification Axial (kN) Shear (kN) Moment (kN·m)
Longitudinal Transverse Longitudinal Transverse
ULS (STR/GEO) -334,851 12,110 -1,226 -112,159 16,852
ULS-seismic X -255,042 553 -11,927 -196,352 306,121
ULS-seismic Y -245,390 8,923 -36,004 -105,139 965,503
② P-M interaction check
fck=35Mpa, fyk=400Mpa
fcd=
fck
=
35
= 23.3 Mpa
fyd=
fyk
=
400
= 348 Mpa
γm 1.5
γm 1.15
Longitudinal direction Transverse direction
The longitudinal reinforcement ratio for the saddle leg is approximately 1.4%, which is determined to
satisfy the minimum ratio criteria of longitudinal reinforcement for compression components
specified.
(2) Splay chamber
① Design member force
Classification Axial (kN) Shear (kN) Moment (kN-m)
Longitudinal Transverse Longitudinal Transverse
ULS (STR/GEO) -46,892 27,797 885 -531,201 -12,439
ULS-seismic X 40,421 30,419 15,494 -600,136 -525,091
ULS-seismic Y -74,489 22,310 52,911 -427,561 -1,670,359

- 187 -
② P-M interaction check
fck=35Mpa, fyk=400Mpa
fcd= fck
= 35
= 23.3 Mpa
fyd= fyk
= 400
= 348 Mpa γm 1.5
γm 1.15
Longitudinal direction Transverse direction
The longitudinal reinforcement ratio for the splay chamber is approximately 1.8%, which is
determined by the minimum ratio criteria of longitudinal reinforcement for compression components
specified in EC2.
B.3.5.5.3 South anchorage
Cable forces
The main cable force from global analysis and the resultant supporting reaction at splay saddle acting
on the inclined supporting block are shown in the following table for one side of main cables only.
Forces per cable G
(Permanent)
Q (Variable) A (Accidental)
Traffic Wind Temp. EQ
Cable force (kN) 253,230.0 94,916.0 21,471.0 3,472.0 40,787.0
Reaction at saddle
(kN) 138,643.1 51,966.4 11,755.3 1,900.9 22,330.8

- 188 -
Check foundation
(1) Applied load summary
Classification V (MN) H (MN) x (m) y (m) V · x H · y V·x + H·y
G
Self weight 2,034.2 -11.456 -23,302.7 0.0 -23,302.7
Buoyancy 0.0
Cable force(SW) -72.5 501.3 14.000 51.050 -1,014.4 25,588.8 24,574.5
Q
Cable force (L) -27.2 187.9 14.000 51.050 -380.2 9,591.2 9,211.0
Cable force (W) -6.1 42.5 14.000 51.050 -86.0 2,169.6 2,083.6
Cable force (T) -1.0 6.9 14.000 51.050 -13.9 350.8 336.9
A EQ 571.2 7.326 0.0 4,184.5 4,184.5
Cable force (EQ) -11.7 80.7 14.000 51.050 -163.4 4,121.5 3,958.1
(2) Cable force by combination of actions
Classification Cable force (MN) V (MN) H (MN) Remarks
ULS (STR/GEO) 964.340 -137.959 954.421 Member design,
Bearing pressure
ULS (EQU) 812.402 -116.223 804.046 Stability, Bearing pressure
ULS (Seismic) 624.270 -89.309 617.849 Seismic
SLS 712.522 -101.934 705.193 -
(3) Stability analysis
① Resultant load at the center of footing
Classification N (MN) H (MN) M (MN·m) Remarks
SLS 1,927.0 736.4 12,791.8
ULS (EQU) 1,910.7 848.5 18284.3 Pile design
ULS (STR/GEO) 2,000.0 1,000.5 17,578.4 Pile design
/ Member design
ULS (Seismic) 1,939.6 1,221.0 12,729.5 Pile design
② Verification of stabilities
See chapter B.3.6.2
- 189 -
Check the cross section
(1) Saddle leg and splay chamber
The cross sections of the saddle leg and splay chamber are the same as those of the north anchorage
and the section check is not required.
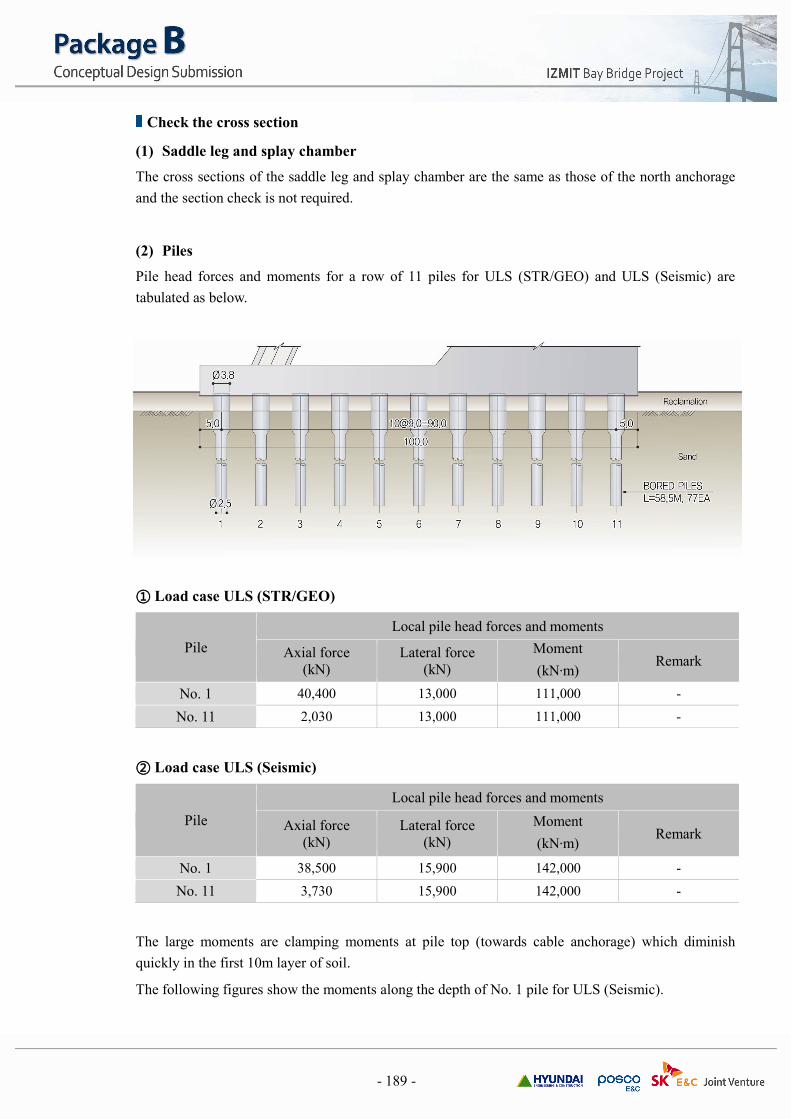
(2) Piles
Pile head forces and moments for a row of 11 piles for ULS (STR/GEO) and ULS (Seismic) are
tabulated as below.
① Load case ULS (STR/GEO)
Pile
Local pile head forces and moments
Axial force
(kN)
Lateral force
(kN)
Moment
(kN·m) Remark
No. 1 40,400 13,000 111,000 -
No. 11 2,030 13,000 111,000 -
② Load case ULS (Seismic)
Pile
Local pile head forces and moments
Axial force
(kN)
Lateral force
(kN)
Moment
(kN·m) Remark
No. 1 38,500 15,900 142,000 -
No. 11 3,730 15,900 142,000 -
The large moments are clamping moments at pile top (towards cable anchorage) which diminish
quickly in the first 10m layer of soil.
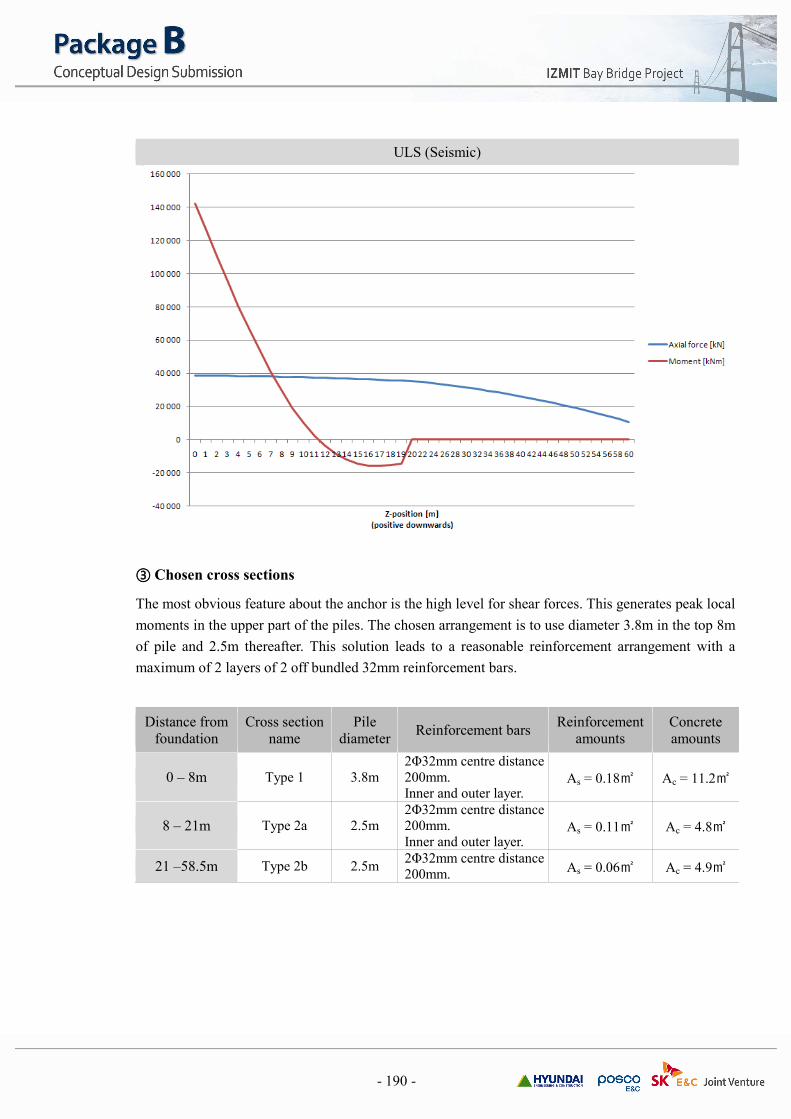
The following figures show the moments along the depth of No. 1 pile for ULS (Seismic).
- 190 -
ULS (Seismic)
③ Chosen cross sections
The most obvious feature about the anchor is the high level for shear forces. This generates peak local
moments in the upper part of the piles. The chosen arrangement is to use diameter 3.8m in the top 8m
of pile and 2.5m thereafter. This solution leads to a reasonable reinforcement arrangement with a
maximum of 2 layers of 2 off bundled 32mm reinforcement bars.
Distance from
foundation
Cross section
name
Pile
diameter Reinforcement bars
Reinforcement
amounts
Concrete
amounts
0 – 8m Type 1 3.8m
2Φ32mm centre distance
200mm. Inner and outer layer.
As = 0.18㎡ Ac = 11.2㎡
8 – 21m Type 2a 2.5m 2Φ32mm centre distance 200mm.
Inner and outer layer. As = 0.11㎡ Ac = 4.8㎡
21 –58.5m Type 2b 2.5m 2Φ32mm centre distance 200mm.
As = 0.06㎡ Ac = 4.9㎡