Fibrillar organization in tendons: A pattern revealed by percolation characteristics of the...
16
Network Biology, 2014, 4(2): 31-46 IAEES www.iaees.org Article Fibrillar organization in tendons: A pattern revealed by percolation characteristics of the respective geometric network Daniel Andrés Dos Santos 1 , María Laura Ponssa 2 , María José Tulli 2 , Virginia Abdala 1,2,3 1 Instituto de Biodiversidad Neotropical, Facultad de Ciencias Naturales e Instituto Miguel Lillo, Universidad Nacional de Tucumán – CONICET. Horco Molle S/N, Yerba Buena, Tucumán, Argentina 2 Instituto de Herpetología, Fundación Miguel Lillo-CONICET. Miguel Lillo 251, San Miguel de Tucumán, Tucumán, Argentina 3 Cátedra de Biología General, Facultad de Ciencias Naturales e IML, Universidad Nacional de Tucumán. Miguel Lillo 251, San Miguel de Tucumán, Tucumán, Argentina E-mail: [email protected] Received 7 January 2014; Accepted 10 February 2014; Published online 1 June 2014 Abstract Since the tendon is composed by collagen fibrils of various sizes connected between them through molecular cross-links, it sounds logical to model it via a heterogeneous network of fibrils. Using cross sectional images, that network is operatively inferred from the respective Gabriel graph of the fibril mass centers. We focus on network percolation characteristics under an ordered activation of fibrils (progressive recruitment going from the smallest to the largest fibril). Analyses of percolation were carried out on a repository of images of digital flexor tendons obtained from samples of lizards and frogs. Observed percolation thresholds were compared against values derived from hypothetical scenarios of random activation of nodes. Strikingly, we found a significant delay for the occurrence of percolation in actual data. We interpret this finding as the consequence of some non-random packing of fibrillar units into a size-constrained geometric pattern. We erect an ideal geometric model of balanced interspersion of polymorphic units that accounts for the delayed percolating instance. We also address the circumstance of being percolation curves mirrored by the empirical curves of stress-strain obtained from the same studied tendons. By virtue of this isomorphism, we hypothesize that the inflection points of both curves are different quantitative manifestations of a common transitional process during mechanical load transference. Keywords percolation; collagen; fibril network; interspersion; pattern recognition. 1 Introduction It has been often stressed that collagen fibrils in a connective tissue exhibit a network organization (Purslow et al., 1998; Berthod et al., 2001; Chandran and Barocas, 2006; Rigozzi et al., 2011; Shirazi et al., 2011). It is Network Biology ISSN 22208879 URL: http://www.iaees.org/publications/journals/nb/onlineversion.asp RSS: http://www.iaees.org/publications/journals/nb/rss.xml Email: [email protected] EditorinChief: WenJun Zhang Publisher: International Academy of Ecology and Environmental Sciences
Transcript of Fibrillar organization in tendons: A pattern revealed by percolation characteristics of the...

Network Biology, 2014, 4(2): 31-46
IAEES www.iaees.org
Article
Fibrillar organization in tendons: A pattern revealed by percolation
characteristics of the respective geometric network
Daniel Andrés Dos Santos1, María Laura Ponssa2, María José Tulli2, Virginia Abdala1,2,3
1Instituto de Biodiversidad Neotropical, Facultad de Ciencias Naturales e Instituto Miguel Lillo, Universidad Nacional de
Tucumán – CONICET. Horco Molle S/N, Yerba Buena, Tucumán, Argentina 2Instituto de Herpetología, Fundación Miguel Lillo-CONICET. Miguel Lillo 251, San Miguel de Tucumán, Tucumán, Argentina 3Cátedra de Biología General, Facultad de Ciencias Naturales e IML, Universidad Nacional de Tucumán. Miguel Lillo 251, San
Miguel de Tucumán, Tucumán, Argentina
E-mail: [email protected]
Received 7 January 2014; Accepted 10 February 2014; Published online 1 June 2014
Abstract
Since the tendon is composed by collagen fibrils of various sizes connected between them through molecular
cross-links, it sounds logical to model it via a heterogeneous network of fibrils. Using cross sectional images,
that network is operatively inferred from the respective Gabriel graph of the fibril mass centers. We focus on
network percolation characteristics under an ordered activation of fibrils (progressive recruitment going from
the smallest to the largest fibril). Analyses of percolation were carried out on a repository of images of digital
flexor tendons obtained from samples of lizards and frogs. Observed percolation thresholds were compared
against values derived from hypothetical scenarios of random activation of nodes. Strikingly, we found a
significant delay for the occurrence of percolation in actual data. We interpret this finding as the consequence
of some non-random packing of fibrillar units into a size-constrained geometric pattern. We erect an ideal
geometric model of balanced interspersion of polymorphic units that accounts for the delayed percolating
instance. We also address the circumstance of being percolation curves mirrored by the empirical curves of
stress-strain obtained from the same studied tendons. By virtue of this isomorphism, we hypothesize that the
inflection points of both curves are different quantitative manifestations of a common transitional process
during mechanical load transference.
Keywords percolation; collagen; fibril network; interspersion; pattern recognition.
1 Introduction
It has been often stressed that collagen fibrils in a connective tissue exhibit a network organization (Purslow et
al., 1998; Berthod et al., 2001; Chandran and Barocas, 2006; Rigozzi et al., 2011; Shirazi et al., 2011). It is
Network Biology ISSN 22208879 URL: http://www.iaees.org/publications/journals/nb/onlineversion.asp RSS: http://www.iaees.org/publications/journals/nb/rss.xml Email: [email protected] EditorinChief: WenJun Zhang Publisher: International Academy of Ecology and Environmental Sciences

Network Biology, 2014, 4(2): 31-46
IAEES www.iaees.org
basically proposed that the microstructural properties of the collagen network contribute to continuum
mechanical tissue properties that are strongly anisotropic with tensile-compressive asymmetry (Shirazi et al.,
2011). Besides, extensible connective tissues (e.g. skin, blood vessels, fascia) contain networks of fibrillar
collagen embedded into an amorphous matrix. It is the reorientation of the collagen fibres within these
networks that allows large extensions of the tissues and is responsible for their non-linear stress–strain curves
(Wainwright et al., 1976; Purslow et al., 1998). This characterization of the collagen organization as a network
is used to explain mechanical properties of soft biological tissues. Despite distinct mechanical functions,
biological soft tissues have a common microstructure in which a ground matrix is reinforced by a collagen
fibril network (Purslow et al., 1998). Likewise, the existence of a collagen network in hard biological tissues
such as cartilage (Långsjö et al., 2009; Långsjö et al., 2010; Julkunen et al., 2010) is also widely accepted.
Collagen fibrils are not isolated functional entities, but they integrate a network system in which the proximate
fibrils could exhibit a functional connection. In spite of the currently assumption that the collagen fibril
network is responsible of the main mechanical properties of tendon, to our best knowledge the underlying
geometrical network has been never formalized in graph terms where the nodes and edges represent the fibrils
and their cross-links respectively.
The properties of connective tissues are known to depend on a wide variety of factors such as the type and
maturity of the tissue, the chemical nature of the covalent cross-links, the type and quantity of the
glycosaminoglycans throughout the extracellular matrix (ECM) and the content of elastic fibres, water and
minerals (Parry et al., 1978).Two main classes of extracellular macromolecules make up the tendon matrix:
proteoglycans (PGs), which play a complex role in force transmission and maintenance of tendon tissue
structure (Reed and Iozzo, 2002; Rigozzi et al., 2010) and collagen fibrils. Studies that have investigated the
relationship between structural and mechanical properties have generally focused on one major component,
either collagen or proteoglycans (PG), with studies focusing on collagen fibril morphology being more
common (Rigozzi et al., 2010).The amount of interactions between the collagen fibrils and the surrounding
matrix influents the stiffness of the tissue, and this may prevent changes in shape after the removal of stress
(Parry et al., 1978). The degree of interaction between the collagen fibrils and the amorphous matrix is
function of the collagen fibril diameter distribution. The relevant role of the ECM is also visible during tendon
development, because collagen fibrillogenesis generates a tendon-specific extracellular matrix that determines
the functional properties of the tissue (Zhang, 2005; Zhang et al., 2005). Other studies indicate that
biochemical deficiencies the amorphous ECM may be a primary causative factor in certain tendon pathologies
(Battaglia et al., 2003; Mikic et al., 2001).
Networks are a collection of elements (nodes or vertices) connected by some relationships of interest
(links or edges) (Zhang, 2012a, 2012b, 2012c). The internet, airline routes, and electric power grids are all
examples of networks whose function relies crucially on the pattern of interconnection between the
components of the system. Thinking of systems as networks and studying their patterns of connection can
often lead to new and useful insights (Newman, 2010; Ferrarini, 2013, 2014; Zhang, 2012a, 2012b, 2012c,
2013). An important property of such connection patterns is their robustness—or lack thereof— to removal of
network nodes, which can be modeled as a percolation process on a graph representing the network (Callaway
et al., 2000). Percolation theory is a branch of probability theory dealing with properties of random media
(Berkowitz and Ewing, 1998; Zhang, 2012a, 2013). It is one of the simplest models in probability theory
which exhibits what is known as critical phenomenon. This usually means that there is a natural parameter in
the model at which the behavior of the system drastically changes (Grimmett, 1999). Percolation statement is
simple: every site on a specified lattice is independently either occupied (recruited), with probability q, or not
with probability 1 − q. In particular, the system percolates when it exhibits a continuous phase transition at a
32
Network Biology, 2014, 4(2): 31-46
IAEES www.iaees.org
finite value of q which, on a regular lattice, is characterized by the formation of a cluster large enough to span
the entire system across its dimensions in the limit of infinite system size (Newman and Ziff, 2001). From a
mathematical perspective, the percolation theory describes the behavior of connected clusters in a random
graph (Cuestas et al., 2011). The percolation method allows us to evaluate the network resilience to deletion of
network nodes (Callaway et al., 2000).
In this work we delineate a network approach for studying the tendon organization (system composed of
interconnected fibrils) that could contribute to a better understanding of its biomechanical responses. Relative
neighborhood networks between collagen fibrils are here erected as proxies for the underlying collagen
network. This type of objects constitutes an appropriate candidate to make mathematically tractable the
collagen network. The links (edges) between the discrete units (nodes) of this network are derived from the
relationships of spatial proximity between fibrils. However, the spatial gap between fibrils connected by
proximity is occupied by the amorphous matrix and should be also considered a relevant component for the
functionality of the entire system. Amorphous matrix is assumed to be the physical substrate over which the
information can flow across the nodes of the network. In dealing with the term transference of information, we
adopt the meaning implicit to the information theory (Shannon, 1948) that involves the transmission of data or
any state change in a system. This notion liberates us from considering the ECM network as a theoretical
model uniquely associated to the context of force transmission. The model of ECM network is useful to
address the topic of functional integrity. One way to do that is to evaluate if information can propagate
throughout the structure of the network, or equivalently to study its characteristics of percolation. Percolation
theory may contribute to the understanding of the information flow such as force transmission from the
beginning of the tensile activity (tendon activated by a contractile force) until the resulting response
(movement of skeletal pieces).
This paper is interested on the morphology and spatial organization of the tendon collagen fibrils in
addition to their functional consequences. It is structured around the following assumptions: i) collagen fibrils
are units that mediate the transmission of information; ii) the tendon is an assembly of interconnected fibrils
that can be modeled with the approach of geometric networks; iii) molecular cross-links provides the material
evidence about the connection between fibrils; iv) percolation of information throughout the network is
directly associated to the notion of functional integrity; v) phase transition involved by the percolation
threshold can be traced to a point on the non-linear stress-strain curve. In tight correspondence with the above
premises, and considering a hypothetical scenario of fibril recruitment by increasing size, we ask the following
questions: 1) which is the critical threshold that allows the information to traverse the physical dimensions of
the network in which fibrils reside? Based on the observed percolation, 2) is it possible to infer some peculiar
geometrical feature of the network structure? To answer this, we need to compare the observed percolation
pattern against the random expectations under a stochastic shuffling of the fibril sizes but maintaining the
topology of the network. Taking into account that percolation of a system implies a phase transition, 3) which
is the influence of this putative phenomenon in the mechanical properties exhibited by tendons? Can the stress-
strain curves be used to deal with the last issue? We think that a right comprehension of all these inquiries will
bring us new insights to grasp the outstanding mechanical properties of the tendon.
2 Material and Methods
Electron microscopy analysis was conducted with samples of the flexor tendon of the Digit IV obtained from
adults of anurans (Scinax nasicus, Phyllomedusa sauvagii, Rhinella arenarum, Leptodactylus latinasus and
Leptodactylus chaquensis) and squamatan reptiles (Liolaemus elongates, L. coeruleus, L. bibroni and
Tupinambis rufescens). Details about examined specimens are provided in the Appendix. We selected the
33

Network Biology, 2014, 4(2): 31-46
IAEES www.iaees.org
flexor tendon of Digit IV because of the importance of this digit in locomotion as stressed by Teixeira-Filho et
al. (2001) and Tulli et al. (2011).
Samples were placed overnight in 0.1-M phosphate buffer with 2.5% glutaraldehyde and 4%
paraformaldehyde. The tissue was then fixed in 1% osmium tetroxide, dehydrated in graded acetones, and flat
embedded in Epon plastic 812 (Ernest F Fullam, Inc, Latham, NY) in a cross-sectional orientation. Sections
(85 nm) were obtained and stained with 0.25% lead citrate and 5% uranyl acetate in 50% acetone and then
observed and photographed in a JEOL100CX transmission electron microscope (LAMENOA, Universidad
Nacional de Tucumán, Argentina). Collagen fibril diameters of each species were measured on each micro-
graph using the Image J 1.44p (Wayne Rasband, National Institutes of Health, USA,http://rsbweb.nih.gov/ij/).
Diameter of each fibril present in the selected area was measured. Each fibril included in the selected area was
identified in a coordinate system using the particle analysis option of the Image J software.
2.1 The collagen fibril network
Each cross section of a tendon can be represented as a set of points distributed in a 2-dimensional space. Since
these points are assumed to interchange information they give rise to a spatial network. In fact,
glycosaminglycancross-links connect each fibril with the adjacent ones. To address the problem of the
geometrical organization of the network, we need to operationalize the concept of the fibrillar network.
Because spatial networks subsume into the category of geometric graphs, we choose this mathematical model
to work with. A geometric graph G = (V, E) is an embedding of the set V of nodes as points in the plane, and
the set E of edges as straight line segments joining pairs of points in V. Locations for the center mass of each
fibril are adopted as point occurrences of fibrils throughout the study system (here, the cross section of the
tendon). We also say that the graph G is planar if no two of its edges intersect except perhaps at their end
points. In the computational geometry literature, there are several classes of planar geometric graphs arising
from what are known as proximity graphs (see the survey of Jaromczyk and Toussaint 1992 for more details).
In this paper, we will model the topology of the collagen fibril network via a Gabriel graph. The rationale
for this choice relies on the capacity of the Gabriel graph to capture a fair representation of the proximity
structure portrayed by the data. A geometric graph G= (V, E) is called a Gabriel graph if the following
condition holds: for any u, vϵV, an edge (u, v) ϵE if and only if the circle with uvas diameter does not contain
any other point of V (Gabriel and Sokal, 1969) (Fig. 1). The ultimate meaning of observing two adjacent fibrils
A and B in the underlying Gabriel graph (connected by an edge) is that their area of reciprocal influence is
unique and not interfered by nearby fibrils. If the stress force does flow throughout the interfibrillar matrix, it
would freely flow across the space bridging fibrils directly linked in the respective Gabriel graph.
Fig. 1 Example of Gabriel graph (right) obtained from the Delaunay triangulation (left) applied on a set of 4 points, i.e. {a, b, c and d}. The edge joining a toc is discarded because it corresponds to the diameter of a circle that includes another point of the set (i.e. point d).
34

Network Biology, 2014, 4(2): 31-46
IAEES www.iaees.org
2.2 Percolation
The network of collagen fibrils is used to represent the propagation of information across the tendon. Here,
information can be understood as the propagation of the mechanical stress across the tendon, or the flow of the
cross-linking molecules through the amorphous matrix, or any other factor that can change the integral
response of the tendon. Vertices on the graph are considered occupied or not, depending on whether the
network nodes they represent (fibrils) are activated or recruited. We have examined the site percolation of the
network in which the occupation is a function of the fibril size. So, we have considered percolation under a
targeted activation of nodes. In this way, we have simulated a sequential recruitment of fibrils increasingly
ordered by their sizes and checked then the spanning area of the putative percolating cluster.
In site percolation of spatial networks one views the clusters formed by the occupied vertices. A cluster is
defined as set of neighboring or adjacent vertices that are occupied. Of particular interest is to establish if there
exists a cluster that connects the borders of the area spanned by the network (here, the cross section of the
tendon). Such a cluster is called a percolating cluster and its presence represents a qualitative change in the
structure of the system from a disconnected state to a connected one (functionality transition). We estimate the
percolation threshold (q) from the inflection point of the S-shaped curved relating the relative size of the
spanning cluster and the fraction of activated sites. The following fitting model was used (Pawłowska and
Sikorski, 2013):
1 1 exp
where a is a parameter that dictates the slope of the curve. Here, percolation probability P is function of the
fraction of activated sites. In operative terms, nonlinear least square regression was applied on the values
of relative size of the percolating cluster against the respective fraction of activated sites. The relative size of
the percolating cluster was taken as the ratio between the area of the bounding box enclosing the points of the
largest component and the overall rectangular area of the system under study. Percolation threshold was
calculated for the case of targeted sequential activation of nodes ordered by increasing size. In a next instance
of analysis, this observed score for q was compared against values obtained from random scenarios of node
activation. Certainly, if the observed value would deviates from random expectations then we could suspect
some pattern of spatial organization where the size of fibrils has a prominent role.
We conducted separate recruitment scenarios for each empirical case of study. Each scenario consisted of
21 instances in a gradual sequence of node activation, using for that purpose a vector of cutoff values that
dictate the activation (or not) of the nodes. Whenever a node has a size (= fibril diameter) lower or equal than a
specified cutoff value it is activated. The 21 elements of the referred vector are increasingly ordered and
correspond to the percentiles by steps of five (0, 5, 10, …, 100) found on the statistical distribution of fibril
sizes. Thus, the first element of this vector corresponds to the minimum size of fibril, its second element
corresponds to the fifth percentile, its third element is the tenth percentile, and so on. The last element
concerns to the largest fibril. Although exploring the entire set of unique values of size would have yielded
more accurate results, we have binned the data by percentile intervals of five because of computational
facilities. The full activation of nodes translates into the original Gabriel graph that accounts for the collagen
fibril network. As the activation of nodes proceeds from the minimum cutoff value to the maximum one, nodes
are connected by an edge if they are actually neighbors in the underlying Gabriel graph. The critical instance,
or scene, of the recruitment scenario is that where the percolating cluster firstly appears. The inflection point
on the percolation curve, obtained by adjustment of the above equation to the 21 instances of node activation,
was used to estimate the percolation threshold q. The q quantile for the set of fibril diameters was subsequently
35
Network Biology, 2014, 4(2): 31-46
IAEES www.iaees.org
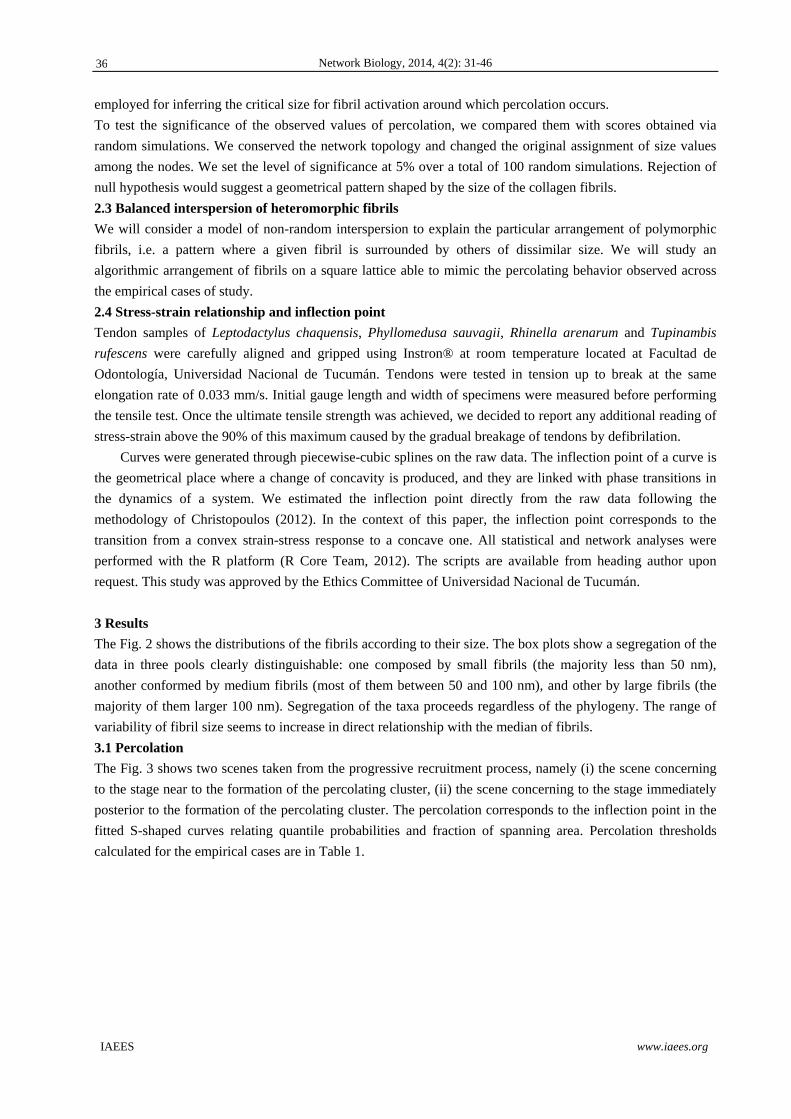
employed for inferring the critical size for fibril activation around which percolation occurs.
To test the significance of the observed values of percolation, we compared them with scores obtained via
random simulations. We conserved the network topology and changed the original assignment of size values
among the nodes. We set the level of significance at 5% over a total of 100 random simulations. Rejection of
null hypothesis would suggest a geometrical pattern shaped by the size of the collagen fibrils.
2.3 Balanced interspersion of heteromorphic fibrils
We will consider a model of non-random interspersion to explain the particular arrangement of polymorphic
fibrils, i.e. a pattern where a given fibril is surrounded by others of dissimilar size. We will study an
algorithmic arrangement of fibrils on a square lattice able to mimic the percolating behavior observed across
the empirical cases of study.
2.4 Stress-strain relationship and inflection point
Tendon samples of Leptodactylus chaquensis, Phyllomedusa sauvagii, Rhinella arenarum and Tupinambis
rufescens were carefully aligned and gripped using Instron® at room temperature located at Facultad de
Odontología, Universidad Nacional de Tucumán. Tendons were tested in tension up to break at the same
elongation rate of 0.033 mm/s. Initial gauge length and width of specimens were measured before performing
the tensile test. Once the ultimate tensile strength was achieved, we decided to report any additional reading of
stress-strain above the 90% of this maximum caused by the gradual breakage of tendons by defibrilation.
Curves were generated through piecewise-cubic splines on the raw data. The inflection point of a curve is
the geometrical place where a change of concavity is produced, and they are linked with phase transitions in
the dynamics of a system. We estimated the inflection point directly from the raw data following the
methodology of Christopoulos (2012). In the context of this paper, the inflection point corresponds to the
transition from a convex strain-stress response to a concave one. All statistical and network analyses were
performed with the R platform (R Core Team, 2012). The scripts are available from heading author upon
request. This study was approved by the Ethics Committee of Universidad Nacional de Tucumán.
3 Results
The Fig. 2 shows the distributions of the fibrils according to their size. The box plots show a segregation of the
data in three pools clearly distinguishable: one composed by small fibrils (the majority less than 50 nm),
another conformed by medium fibrils (most of them between 50 and 100 nm), and other by large fibrils (the
majority of them larger 100 nm). Segregation of the taxa proceeds regardless of the phylogeny. The range of
variability of fibril size seems to increase in direct relationship with the median of fibrils.
3.1 Percolation
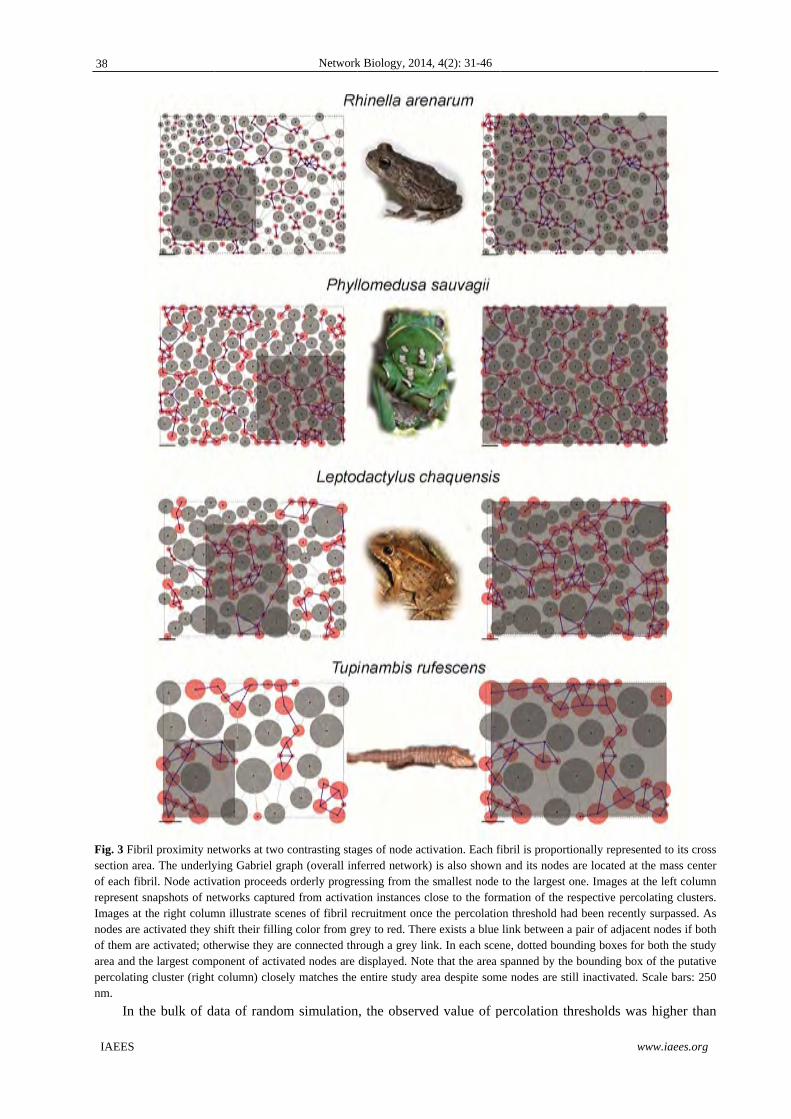
The Fig. 3 shows two scenes taken from the progressive recruitment process, namely (i) the scene concerning
to the stage near to the formation of the percolating cluster, (ii) the scene concerning to the stage immediately
posterior to the formation of the percolating cluster. The percolation corresponds to the inflection point in the
fitted S-shaped curves relating quantile probabilities and fraction of spanning area. Percolation thresholds
calculated for the empirical cases are in Table 1.
36

IAEES
Fig. 2 Sizspecies, dadominatedfibrils prev1.5 times t
Species
Tupinam
Leptoda
Phyllom
Rhinella
Leptoda
Scinax n
Liolaem
Liolaem
Liolaem
ze distribution oata coming fromd by small fibrivail (> 100 nm)the interquartile
s
mbis rufescen
actylus chaqu
medusa sauva
a arenarum
actylus latina
nasicus
mus bibroni
mus coeruleus
mus elongatus
of digital flexom all samples wils (< 50 nm), ). Outliers havee range from th
Table
Numb
of
sampl
image
analyz
ns 1
uensis 11
agii 7
3
asus 5
1
1
s 1
s 1
Network
or tendon fibrilswere pooled into
another charace been removed e box.
e 1 Percolation
ber
ling
es
zed
Avera
Traget
activa
0.72
0.62
0.65
0.63
0.59
0.65
0.59
0.64
0.70
k Biology, 2014
s across some o a single data scterized by inte
and whiskers e
characteristics
age percolatio
ted
ation
Ran
acti
0.53
0.51
0.48
0.49
0.49
0.48
0.47
0.52
0.49
4, 4(2): 31-46
representativesset. Species canermediate fibrilextend to the m
of tendon cros
on threshold
ndom
ivation
3
1
8
9
9
8
7
2
9
s of South Amen be segregated s (50-100 nm) ost extreme dat
s sections.
Percentage
images
resulted in
percolation
threshold
0.05)
100%
82%
100%
100%
80%
100%
100%
100%
100%
w
erican herpetofinto three size and the last on
ta point which i
e of
that
a high
n
(P<
Med
fibri
obse
perc
thres
(nm)
241
187
153
92
89
88
83
36
23
www.iaees.org
fauna. For eachcategories: onene where largeis no more than
dian of the
l size at the
erved
olation
shold
)
h e e n
37
IAEES
Fig. 3 Fibrsection areof each fibrepresent sImages at nodes are of them ararea and thpercolatingnm.
In th
ril proximity neea. The underlybril. Node activsnapshots of nethe right columactivated they sre activated; othhe largest compg cluster (right
he bulk of d
etworks at two ying Gabriel grvation proceedsetworks capturemn illustrate sceshift their fillinherwise they arponent of activacolumn) close
ata of random
Network
contrasting stagaph (overall inf
s orderly progreed from activatenes of fibril re
ng color from grre connected thrated nodes are ly matches the
m simulation
k Biology, 2014
ges of node actferred network)essing from thetion instances cecruitment oncerey to red. Therrough a grey lindisplayed. Noteentire study ar
n, the observe
4, 4(2): 31-46
tivation. Each fi) is also shown smallest node
close to the forme the percolatiore exists a blue nk. In each scene that the area rea despite som
ed value of p
fibril is proportin and its nodes
to the largest omation of the reon threshold hadlink between ane, dotted bounspanned by the
me nodes are sti
percolation th
w
ionally represenare located at t
one. Images at tespective percod been recently
a pair of adjacennding boxes fore bounding box ll inactivated. S
hresholds was
www.iaees.org
nted to its crossthe mass centerthe left columnolating clusters.y surpassed. Asnt nodes if bothr both the study
of the putativeScale bars: 250
s higher than
s r n . s h y e 0
n
38

IAEES
random e
to the si
progressi
them (Fi
geometri
Fig. 4 Percthe fractiohorizontal fibrils (bluintervals w
3.2 Bala
We hav
heteromo
by us a
occurren
fibrils ha
chess bo
percolati
ultrastruc
expectancy (P
ize of the fib
ive recruitme
ig. 4). With
ical pattern co
colation curveson of activated line passes thro
ue curve), the rwere created aft
nced intersp
e been able
orphic units (
as Balanced
nce of larger
as been partit
oard pattern
on threshold
cture, i.e. q ~
P< 0.05) (Tab
brils in mos
ent when the
a slight abu
onstrained by
s. The percolatiofibrils against
ough the inflectespective percoter considering
persion of po
e to reprodu
(elements of
Interspersion
and smaller
tioned into tw
(Fig. 5). Se
d similar to
0.64 (Table
Network
ble 1).Random
st of the sam
attribute size
use of words
y size.
on threshold is t the relative retion points of fiolation thresholthe curve param
lymorphic fi
uce condition
different size
n of Polymo
fibrils throug
wo sets of co
equential act
the observe
2).
k Biology, 2014
m simulation
mples, becaus
e for the fibri
s, the high v
estimated as thectangular area
fitting curves. Fld falls always meters associate
ibrils
ns of delaye
es) on a squar
orphic Units
ghout the phy
ontrasting size
ivation of si
ed ones in
4, 4(2): 31-46
ns revealed th
se the percol
ils is randoml
values of per
he inflection poia occupied by or the scenario beyond the oneed to 100 scena
ed percolatio
re lattice. Th
(BIPU). BI
ysical dimens
es (large and
ites in this p
the analysis
hat there is a g
lation occurs
ly decoupled
rcolation thre
int of the adjustthe largest comof progressive
e-sided 95% coarios of random
on through a
e pattern und
IPU consists
sions of the s
d small), we a
pre-ordered
of cross-se
w
geometrical p
s at earlier s
d from the tru
esholds detec
ted S-shaped cumponent of thesize-dependent
onfidence intervrecruitment of
a non-random
der considera
of a regula
system. Once
allocate them
template ma
ection image
www.iaees.org
pattern linked
stages of the
ue location of
cted imply a
urve that relatesem. The dottedt recruitment ofval. Confidencef fibrils.
m layout of
tion is called
ar alternated
e the pool of
m following a
ay achieve a
es of tendon
d
e
f
a
s d f e
f
d
d
f
a
a
n
39
IAEES
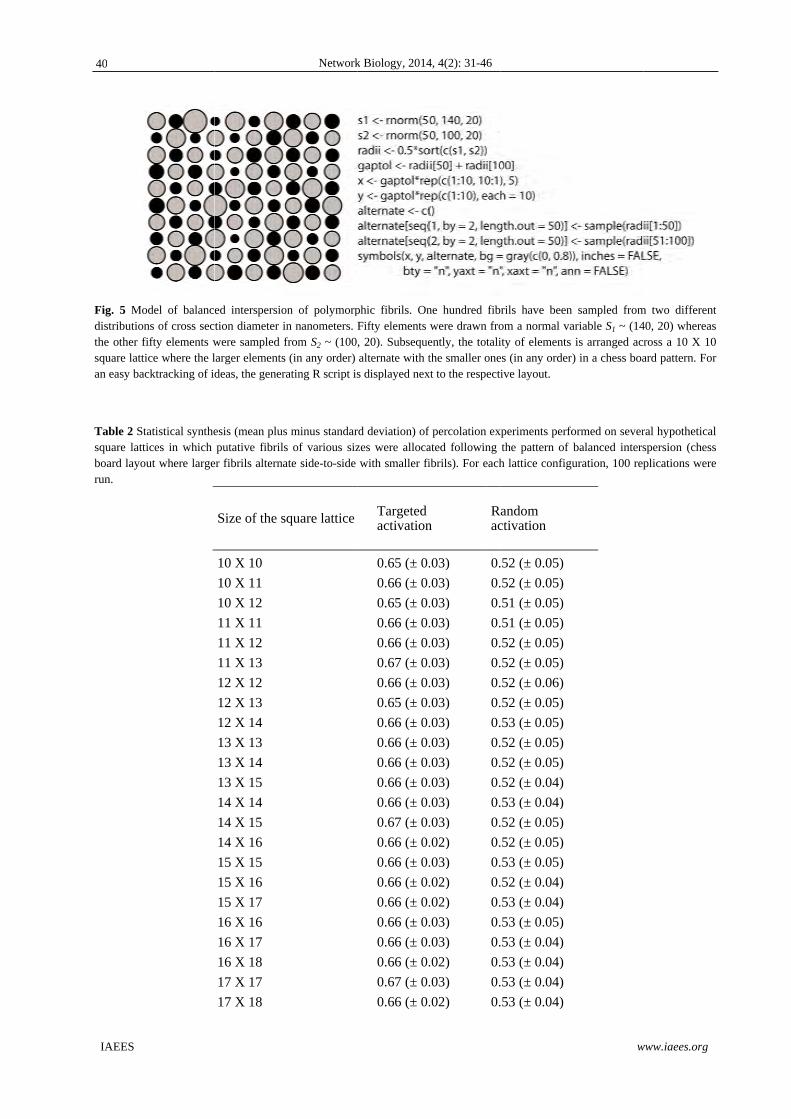
Fig. 5 Modistributiothe other fsquare lattan easy ba
Table 2 Ssquare lattboard layorun.
odel of balancons of cross secfifty elements wtice where the lacktracking of id
tatistical synthetices in which out where large
ed interspersiotion diameter inwere sampled flarger elements deas, the genera
esis (mean plusputative fibrils
er fibrils alterna
Size of the s
10 X 10
10 X 11
10 X 12
11 X 11
11 X 12
11 X 13
12 X 12
12 X 13
12 X 14
13 X 13
13 X 14
13 X 15
14 X 14
14 X 15
14 X 16
15 X 15
15 X 16
15 X 17
16 X 16
16 X 17
16 X 18
17 X 17
17 X 18
Network
on of polymorpn nanometers. Ffrom S2 ~ (100(in any order)
ating R script is
s minus standars of various sizate side-to-side
quare lattice
k Biology, 2014
phic fibrils. OnFifty elements , 20). Subsequealternate with ts displayed nex
rd deviation) ofzes were allocawith smaller fi
Targetedactivation
0.65 (± 0.
0.66 (± 0.
0.65 (± 0.
0.66 (± 0.
0.66 (± 0.
0.67 (± 0.
0.66 (± 0.
0.65 (± 0.
0.66 (± 0.
0.66 (± 0.
0.66 (± 0.
0.66 (± 0.
0.66 (± 0.
0.67 (± 0.
0.66 (± 0.
0.66 (± 0.
0.66 (± 0.
0.66 (± 0.
0.66 (± 0.
0.66 (± 0.
0.66 (± 0.
0.67 (± 0.
0.66 (± 0.
4, 4(2): 31-46
ne hundred fibwere drawn froently, the totalithe smaller one
xt to the respecti
f percolation exated following ibrils). For each
n Rac
.03) 0.
.03) 0.
.03) 0.
.03) 0.
.03) 0.
.03) 0.
.03) 0.
.03) 0.
.03) 0.
.03) 0.
.03) 0.
.03) 0.
.03) 0.
.03) 0.
.02) 0.
.03) 0.
.02) 0.
.02) 0.
.03) 0.
.03) 0.
.02) 0.
.03) 0.
.02) 0.
rils have beenom a normal vaity of elements es (in any orderive layout.
xperiments perfothe pattern of h lattice configu
andom ctivation
52 (± 0.05)
52 (± 0.05)
51 (± 0.05)
51 (± 0.05)
52 (± 0.05)
52 (± 0.05)
52 (± 0.06)
52 (± 0.05)
53 (± 0.05)
52 (± 0.05)
52 (± 0.05)
52 (± 0.04)
53 (± 0.04)
52 (± 0.05)
52 (± 0.05)
53 (± 0.05)
52 (± 0.04)
53 (± 0.04)
53 (± 0.05)
53 (± 0.04)
53 (± 0.04)
53 (± 0.04)
53 (± 0.04)
w
n sampled fromariable S1 ~ (14is arranged ac
) in a chess boa
ormed on severbalanced intersuration, 100 rep
www.iaees.org
m two different40, 20) whereasross a 10 X 10ard pattern. For
ral hypotheticalspersion (chessplications were
t s 0 r
l s e
40

IAEES
3.3 Stres
Typical s
tensile st
point are
Fig. 6 Strepoints mar
Table 3 Bcritical strstiffness c
Species
Rhinella
Phyllom
Leptoda
Tupinam
ss-strain rela
stress-strain
tress (UTS) f
e showed in T
ess-strain curverked as red dots
Basic measuremrain and stress orresponds to th
s
a arenarum(n
medusa sauva
actylus chaqu
mbis rufescen
17 X 19
18 X 18
18 X 19
18 X 20
ationship and
curves for an
for each spec
Table 3.
es. Direct readis.
ments of stress-sare those recorhe slope of the
n = 6)
agii (n = 5)
uensis (n = 6)
ns(n = 5)
Network
d inflection p
nurans and sq
ies and summ
ings from the I
strain relationshrded at the infltangent at such
Strain UTS (mm/mm)
0.36
0.23
) 0.62
0.27
k Biology, 2014
0.66 (± 0.
0.66 (± 0.
0.67 (± 0.
0.67 (± 0.
point
quamatans d
mary statistic
Instron® device
hip. Reported vlection point ofh inflection poin
at
)
UTS (MPa)
11.22
65.50
51.49
47.52
4, 4(2): 31-46
.02) 0.
.02) 0.
.02) 0.
.02) 0.
igital flexor
s about the s
e were adjusted
values are the mf the polynomiant. UTS= ultima
Criticalst(mm/mm
0.25
0.16
0.45
0.15
53 (± 0.03)
53 (± 0.04)
53 (± 0.04)
54 (± 0.04)
tendons are
tress and stra
d through piece
medians of the al cubic fit of tate tensile stren
train m)
Criticalstress (MPa)
6.64
50.14
29.82
21.89
w
shown in Fig
ain found at t
ewise-cubic spl
respective samthe empirical d
ngth.
l Maxim(MPa)
81.27
569.65
176.56
488.13
www.iaees.org
g.6. Ultimate
the inflection
ines. Inflection
mples. Scores ofdata. Maximum
mumstiffness
e
n
n
f m
41

Network Biology, 2014, 4(2): 31-46
IAEES www.iaees.org
4 Discussion
The survival of living organisms is dependent on the functional integrity of all their organs and organ systems.
The tendon is a biomechanical system of force transference from muscles to bones in which its functional
integrity translates into a controlled movement of joints. Without loss of generality, the functional integrity of
any system relies on the ability of their components to propagate information and offer an adaptive response to
external influences. It is hard to conceive such a property in a system of poorly connected components or,
equivalently stated, in a system with a relaxed network structure underpinning it. In this paper, we have
assumed a network organization for the fibrils of the tendon and consequently explored the patterns of
connections between them under the approach of network percolation. At least to our knowledge, percolation
theory is the most adequate conceptual framework to answer inquiries about the functional integrity of the
tendon, because it deals explicitly with the subject of information propagation throughout the physical
dimensions where the system resides.
While Svensson et al. (2013) have recently pointed out that fibrils are not evenly loaded within the tendon
butare sequentially recruited throughout the initial stress-strain region, the analysis of our data revealed
moreover a size-dependent effect for that sequential recruitment of fibrils. The percolation thresholds are
consistently biased towards the upper tail of the statistical distribution of the size of fibrils. It is then
comprehensible that the following taxa: Leptodactylus chaquensis, Phyllomedusa sauvagii, and Tupinambis
rufescens, exhibit great values for the percolation threshold size. All they surpass easily the 100 nm of
diameter in the cross section of fibrils. Ultimately, this means that taxa with great fibrils do not achieve
percolation by activation of their small fibrils alone, larger fibrils are also necessary to be activated. A
marginal essay performed by us using images about tendon ultrastructure available from literature (horse:
Parry, 1988; mouse: Ameye et al., 2002; rabbit: Gill et al., 2004) showed the same pattern. In mammals it also
seems to be necessary the activation of fibrils around the 65th percentile to achieve percolation. When
compared with the random activation of fibrils, the observed values for percolation thresholds also resulted
significantly higher than random expectations.
The delay detected for the occurrence of percolation during the recruitment process indicates that collagen
fibrils are spatially arranged according to a geometrical non-random model, in which the location and size
attribute are both important. We propose the model BIPU of fibril arrangement characterized by the even
interspersion of fibrils of different size category throughout the ECM. This pattern would account for a
uniform fibrillar density, that makes restricted regions to be very similar with regards of the overall tendon,
and also would explain the delayed percolation threshold observed along our experiments of targeted sites
activation. In fact, the balanced interspersion of polymorphic unit simply that larger fibrils makes a shadow
effect on nearby smaller fibrils decreasing thus the chance of direct connections between the latter ones.
Additionally, the balanced interspersion would also imply that heterogeneous fibrilsare close each other
facilitating the access to information managed by the different fibrils. An open question is if the delay for
percolation represents a way to optimize the physiological range of tendons.
Traditionally, a typical stress-strain curve for a tendon has been characterized by three regions: the toe,
linear and non-linear regions (Wang, 2006). On the contrary, we interpret the resulting stress-strain curve as
composed by two phases: the convex and concave regions, being the point of inflection the transition between
them. Functionally, they would reflect two quite different behaviors: in the first region, stiffness increases by a
targeted activations of fibrils depending upon their sizes, whereas in the second region the tendon begins to
yield and fracture. This change in the approach to analyze the stress-strain curve abruptly breaks with the
conventional perspective of considering an intermediate linear region in which the respective slope reflect
some biomechanical property intrinsically linked to the structure of tendons. In other words, we think that the
42

Network Biology, 2014, 4(2): 31-46
IAEES www.iaees.org
task of calculating the Young's modulus as a unique and distinctive measure seems to be a sum-zero exercise
in analyzing functional tendon properties. Consequently, we propose to rely on the point of inflection to
calculate several metrics that account for the mechanical properties of tendons such as critical stress, critical
strain (physiological range), and critical stiffness. We propose an isomorphic linkage between stress-strain and
percolation curves, and we hypothesize that the inflection points of both curves reflect a phase transition
associated to the same underlying process. This process is probably the propagation of fibril disfunction
throughout the extracellular ground of connective tissue. When failure percolates the overall system begins to
elongate elastically, so the percolation threshold could indicate the upper bound for the physiological range of
the tendon.
In our approach, the physical properties of a tendon depend on the pattern of connections behind the
geometrical network of fibrils where location and difference in size play a key role. It is interesting to note that
a polimodal distribution of fibril sizes characterize those connective tissues able to resist tensional forces such
as tendons. On the contrary, those connective tissues that are commonly under no tensile force show a
typically unimodal distribution of fibril size (e.g. buccal gingival mucosa collagen: Ottani et al., 1998; skin
collagen: Danielson et al., 1997; Silver et al., 2001; corneal stroma lamella: Parry et al., 1978). Likewise, those
tendons that are not yet functional, such as embryonic tendons exhibit also anunimodal distribution of collagen
fibril size (Fleischmajer et al., 1988; Parry et al., 1978; Zhang et al., 2005). Unimodal distribution of collagen
fibril size is also present in regenerated tendons (Gill et al., 2004). We suggest that for acting efficiently, the
polymorphism must be accompanied of another geometrical feature of spatial organization. This spatial
organization seems to be subsumed into a pattern of balanced interspersion of different fibrils throughout the
ECM. An immediate application of our proposal concerns with the design of strategies for tissue engineering
provided of biomimetic-synthetic nanofibrous composites.
5 Concluding Remarks
The polymorphic nature of collagen fibrils in addition to the presence of molecular cross-links between them
lead us to think in an heterogeneous network of fibrils that influences the mechanical behavior of tendon as a
whole. The main contribution of our work is to combine geometrical and network considerations into a single
framework by using the percolation approach. This analysis allows a holistic study of the structural properties
of a tendon based on their architectural design. The geometrical pattern we have suggested (non-random
packing constrained by size) is amenable with the idea of a progressive and sequential recruitment of fibrils
dependent on their size. This pattern offers a delay to percolation, which could act a mechanism for expanding
the physiological range. As a surplus of our work, we also address the circumstance of being percolation
curves mirrored by the empirical curves of stress-strain obtained from the same studied tendons. By virtue of
this isomorphism, we hypothesize that the inflection points of both curves are different quantitative
manifestations of a common transitional process during mechanical load transference.
Appendix Specimens examined
L: personal collection of María Laura Ponssa; FBC: personal collection of Felix B. Cruz; FML: Fundación
Miguel Lillo; GS: personal collection of Gustavo Scrocchi; ST: personal collection of Sebastián Torres. An
asterisk is appended to the access number if the respective specimen was used for studying cross sectional
tendon images, otherwise specimens were used for stress-strain analysis.
Leptodactylus chaquensis: L103, L766, L850*, L344, L950, L950-951*, L964*, L971*, ST103; Leptodactylus
latinasus: L937a*, L939-942*, L944-945*;
Phyllomedusa sauvagii: L849*, L936*, L938*, L946-947, L947(1), L946-948*, L971;
43

Network Biology, 2014, 4(2): 31-46
IAEES www.iaees.org
Rhinella arenarum: L51, L851*, L909, L935, L935*, L937b*, L961, L965;
Scinax nasicus: L949*;
Liolaemus bibroni: FBC 1265*;
Liolaemus coeruleus: FBC 1265*;
Liolaemus elongatus: GS3227;
Tupinambis rufescens: FML 07256*, FML7554.
Acknowledgements
This work was supported by the ANPCyT and CONICET through the following research grants: PICT 2012-
1067, PICT 2012-1910, PIP 112-200801-00225, and BID-PICT 606. All authors are grateful to CONICET for
supporting our work via its program of post-graduate fellowships and research grants. We thank Gabriela
Pacios (Facultad de Odontología, Universidad Nacional de Tucumán)for assistance with Instron, and
NicolásNieva (Facultad de Ciencias Exactas, Universidad Nacional de Tucumán) for comments that greatly
improved the structure of the manuscript.
References
Ameye L, Aria D, Jepsen K, et al. 2002. Abnormal collagen fibrils in tendons of biglycan/fibromodulin-
deficient mice lead to gait impairment, ectopic ossification, and osteoarthritis. FASEB J, 16: 673-680
Battaglia TC, Clark RT, Chhabra A, et al. 2003. Ultrastructural determinants of murine achilles tendon
strength during healing. Connective Tissue Research, 44: 218-224
Berthod F, Germain L, Li H, et al. 2001. Collagen fibril network and elastic system remodeling in a
reconstructed skin transplanted on nude mice. Matrix Biology, 20: 463-473
Berkowitz B, Ewing RP. 1998. Percolation theory and network modeling applications in soil physics.
SurvGeophys, 19: 23-72
Callaway DS, Newman MEJ, Strogatz SH, Watts DJ. 2000. Network robustness and fragility: percolation on
random graphs. Physical Review Letters, 85: 5468-5471
Chandran PL, Barocas VH. 2006. Affine versus non-affine fibril kinematics in collagen networks: theoretical
studies of network behavior. Journal of Biomechanical Engineering, 128: 259-270
Christopoulos DT. 2012. Developing methods for identifying the inflection point of aconvex/ concave curve.
arXiv:1206.5478v1 [math.NA]
Cuestas E, Vilaró M, Serra P. 2011.Predictibilidad de la propagación espacial y temporal de la epidemia de
influeza A-H1N1 en Argentina por el método de percolación. Revista Argentina de Microbiología, 43:
186-190
Danielson KG, Baribault H, Holmes DF, et al. 1997. Targeted disruption of decorin leads to abnormal
collagen fibril morphology and skin fragility. Journal of Cell Biology, 136: 729-743
Ferrarini A. 2013. Exogenous control of biological and ecological systems through evolutionary modeling.
Proceedings of the International Academy of Ecology and Environmental Sciences, 3(3): 257-265
Ferrarini A. 2014. True-to-life friction values in connectivity ecology: Introducing reverse flow connectivity.
Environmental Skeptics and Critics, 3(1): 17-23
Fleischmajer R, Perlish JS, Timpl R, et al. 1988. Procollagen intermediates during tendon fibrillogenesis.
Journal Hist Cyt, 36: 1425-1432
Gabriel KR, Sokal RR. 1969. A new statistical approach to geographic variation analysis. Systematic Zoology,
44

Network Biology, 2014, 4(2): 31-46
IAEES www.iaees.org
18:259-278
Gill SS, Turner MA, Battaglia TC, et al. 2004. Semitendinosus regrowth. Biochemical, ultrastructural, and
physiological characterization of the regenerate tendon. American Journal of Sports Medicine, 32: 1173-
1181
Grimmett G. 1999. Percolation (2nd edition). Springer-Verlag, New York, USA
Jaromczyk JW, Toussaint GT. 1992. Relative neighborhood graphs and their relatives. Proceedings of the
IEEE, 80: 1502-1517
Julkunen P, Livarinen J, Brama PA, et al. 2010. Maturation of collagen fibril network structure in tibial and
femoral cartilage of rabbits. Osteoarthritis and Cartilage, 18: 406-415
Långsjö TK, Arita M, Helminen HJ. 2009. Cartilage collagen fibril network in newborn transgenic mice
analyzed by electron microscopic stereology. Cells, Tissues and Organs, 190: 209-218
Långsjö TK, Vasara AI, Hyttinen MM, et al. 2010. Quantitative analysis of collagen network structure and
fibril dimensions in cartilage repair with autologous chondrocyte transplantation. Cells, Tissues and
Organs, 192: 351-360
Mikic B, Schalet BJ, Clark RT, et al. 2001. GDF-5 deficiency in mice alters the ultrastructure, mechanical
properties and composition of the Achilles tendon. Journal of Orthopaedic Research, 19: 365-371
Newman MEJ. 2010. Networks: An Introduction. Oxford University Press, Oxford, UK
Newman MEJ, Ziff RM. 2001. A fast Monte Carlo algorithm for site or bond percolation. Physical Review E,
64: 016706
Ottani V, Franchi M, Depasquale V, et al. 1998. Collagen fibril arrangement and size distribution in monkey
oral mucosa. Journal of Anatomy, 192: 321-328
Parry DAD. 1988. The molecular and fibrillar structure of collagen and its relationship to the mechanical
properties of connective tissue. Biophysical Chemistry, 29: 195-209
Parry DAD, Barnes GRG, Craig AS. 1978. A comparison of the size distribution of collagen fibrils in
connective tissues as a function of age and a possible relation between fibril size distribution and
mechanical properties. Proceedings of the Royal Society of London B, 203: 305-321
Pawłowska M, Sikorski A. 2013.Monte Carlo study of the percolation in two-dimensional polymer systems.
Journal of Molecular Modeling (DOI 10.1007/s00894-013-1892-y).
Purslow PP, Wess TJ, Hukins DWL. 1998. Collagen orientation and molecular spacing during creep and
stress-relaxation in soft connective tissues. Journal of Experimental Biology, 201: 235-242
R Core Team. 2012. R: A language and enviroment for statistical computing. R Foundation for statistical
computing Vienna, Austria. Available at: http://www.R-project.org/.
Reed CC, Iozzo RV. 2002. The role of decorin in collagen fibrillogenesis and skin homeostasis.
Glycoconjugate Journal, 19: 249-255
Rigozzi S, Müller R, Snedeker JG. 2010. Collagen fibril morphology and mechanical properties of the Achilles
tendon in two inbred mouse strains. Journal of Anatomy, 216: 724-731
Rigozzi S, Stemmer A, Müller R, Snedeker JG. 2011. Mechanical response of individual collagen fibrils in
loaded tendon as measured by atomic force microscopy. Journal of Structural Biology, 176: 9-15
Shannon CE. 1948. A mathematical theory of communication. Bell System Technical Journal, 27: 379-423,
623–656.
Shirazi R, Vena P, Sah RL, Klisch SM. 2011. Modeling the collagen fibril network of biological tissues as a
nonlinearly elastic material using a continuous volume fraction distribution function. Mathematics and
Mechanics of Solids, 16: 707-716
Silver FH, Freeman JW, Devore D. 2001. Viscoelastic properties of human skin and processed dermis. Skin
45

Network Biology, 2014, 4(2): 31-46
IAEES www.iaees.org
Research and Technology, 7: 18-23
Svensson RB, Mulder H, Kovanen V, et al. 2013. Fracture mechanics of collagen fibrils: influence of natural
cross-links. Biophysical Journal, 104: 2476-2484
Teixeira-Filho PF, Rocha-Barbosa O, Paes V, et al. 2001. Ecomorphological relationships in six lizard species
of Restinga da Barra de Marica, Rio deJaneiro, Brazil. Rev Chil Anat, 19: 45-50
Tulli MJ, Abdala V, Cruz FB. 2011. Relationships among morphology, clinging performance and habitat use
in Liolaemini lizards. Journal of Evolutionary Biology, 24: 843-855
Wainwright SA, Biggs WD, Currey JD, Gosline JM. 1976. Mechanical Design in Organisms. Edward Arnolds,
London, UK
Wang JHC. 2006. Mechanobiology of tendon. Journal of Biomechanics, 39: 1563-1582
Zhang G. 2005. Evaluating the viscoelastic properties of biological tissues in a new way. Journal of
Musculoskeletal and Neuronal Interactions, 5: 85-90
Zhang G, Young BB, Ezura Y, et al. 2005. Development of tendon structure and function: regulation of
collagen fibrillogenesis. Journal of Musculoskeletal and Neuronal Interactions, 5: 5-21
Zhang WJ. 2012a. Computational Ecology: Graphs, Networks and Agent-based Modeling. World Scientific,
Singapore
Zhang WJ. 2012b. Modeling community succession and assembly: A novel method for network evolution.
Network Biology, 2(2): 69-78
Zhang WJ. 2012c. Several mathematical methods for identifying crucial nodes in networks. Network Biology,
2(4): 121-126
Zhang WJ. 2013. Network Biology: Theories, Methods and Applications. Nova Science Publishers, New York,
USA
46