Blockade ofthe negative co-stimulatory molecules PD-1 and ...
Upload
independentCategory
view
0download
0
Oxidative Stress Modulates DNA Methylation during MelanocyteAnchorage Blockade Associated with Malignant Transformation1
Ana C. E. Campos*,2, Fernanda Molognoni*,2, Fabiana H. M. Melo*, Luciano C. Galdieri y, Celia R. W. Carneiro*,Vania D’Almeida y, Mariangela Correa* and Miriam G. Jasiulionis*,z
*Departamento de Microbiologia, Imunologia e Parasitologia, Universidade Federal de Sao Paulo – UNIFESP,Sao Paulo, SP, Brazil; yDepartamento de Ciencias da Saude, Universidade Federal de Sao Paulo – UNIFESP,Sao Paulo, SP, Brazil; zDepartamento de Farmacologia, Universidade Federal de Sao Paulo – UNIFESP,Sao Paulo, SP, Brazil
Abstract
Both oxidative/nitrosative stress and alterations in DNA
methylation are observed during carcinogenesis of dif-
ferent tumor types, but no clear correlation between
these events has been demonstrated until now. Mela-
noma cell lines were previously established after sub-
mitting the nontumorigenicmelanocyte lineage, melan-a,
to cycles of anchorage blockade. In this work, increased
intracellular oxidative species and nitric oxide levels, as
well as alterations in the DNA methylation, were ob-
served after melan-a detachment, which were also as-
sociated with a decrease in intracellular homocysteine
(Hcy), an element in the methionine (universal methyl
donor) cycle. This alteration was accompanied by
increase in glutathione (GSH) levels and methylated
DNA content. Furthermore, a significant increase in
dnmt1 and 3b expression was identified along melan-a
anchorage blockade. LG-Nitro-L-arginine methyl esther
(L-NAME), known as a nitric oxide synthase (NOS) in-
hibitor, and N-acetyl-L-cysteine (NAC) prevented the
increase in global DNA methylation, as well as the in-
crease in dnmt1 and 3b expression, observed during
melan-a detachment. Interestingly, both L-NAME and
NAC did not inhibit nitric oxide (NO) production in these
cells, but abrogated superoxide anion production during
anchorage blockade. In conclusion, oxidative stress ob-
served during melanocyte anchorage blockade seems
to modulate DNA methylation levels and may directly
contribute to the acquisition of an anoikis-resistant phe-
notype through an epigenetic mechanism.
Neoplasia (2007) 9, 1111–1121
Keywords: Anoikis, carcinogenesis, epigenetics, DNA methylation, oxida-tive stress.
Introduction
The interaction between cells and their surrounding extra-
cellular matrix is a major determinant of cell behavior by
modulating gene expression, cell growth, differentiation,
migration, and overall tissue architecture. Cell survival also
depends on anchorage to extracellular matrix and on cell–
cell contacts. Apoptosis induced by loss of appropriate
cell–matrix contact has been termed anoikis and plays an
essential role in regulating homeostasis, as it maintains the
correct cell number of high turnover tissues [1,2]. An important
feature of transformed cells is loss of anchorage-dependent
growth control, leading to increased survival time and facili-
tating an eventual reattachment. Thus, the ability of escaping
anoikis regulation is a critical step in oncogenesis [3].
Reduced substrate adhesion or lack of growth factors
represent adverse conditions that confer a dramatic rise in
cellular stress, characterized by damage to various cellular
constituents such as DNA, protein, and lipids that ultimately
triggers death signals [4,5]. Low or subtoxic levels of reactive
oxygen species (ROS) can act as potent second messengers
in signal transduction pathways that regulate cell growth and
transformation [6,7]. High levels of ROS have been considered
direct DNA-damaging agents that increase the mutation rate
and promote and maintain the oncogenic phenotype [8–10].
Neither superoxide (O2.�) nor hydrogen peroxide (H2O2) are
particularly toxic, but cells can greatly increase the toxicity of
superoxide by producing nitric oxide (NO) that may function as
an antiapoptotic or proapoptotic agent depending on concen-
tration and cell type [11]. Superoxide anion and NO react to
produce peroxynitrite (ONOO�) that can readily modify pro-
teins and other molecules [12]. In addition to causing genetic
changes, ROS may lead to epigenetic alterations that strongly
affect gene expression without changing the DNA base se-
quence [13–15].
Epigenetic changes, including alterations in DNA methyla-
tion status, have been implicated with malignant transformation
Abbreviations: ADMA, asymmetric dimethylarginine; DAF-2DA, diaminofluorescein-2 diace-
tate; DHE, dihydroethidium; Dnmt, DNA methyltransferase; GSH, glutathione; Hcy, homo-
cysteine; L-NAME, LG-nitro-L-arginine methyl esther; MTT, methyl thiazol tetrazolium; NAC,
N-acetyl-L-cysteine; NO, nitric oxide; NOS, nitric oxide synthase; PCR, polymerase chain reac-
tion; ROS, reactive oxygen species; SAM, S-adenosylmethionine; SAH, S-adenosylhomocysteine
Address all correspondence to: Miriam G. Jasiulionis, Departamento de Farmacologia, Univer-
sidade Federal de Sao Paulo – UNIFESP, Rua Botucatu, 862 4j andar, 04023-900, Sao Paulo,
SP, Brazil. E-mail: [email protected] work was supported by Fundacao de Amparo a Pesquisa do Estado de Sao Paulo
(FAPESP; grants 02/06935-7 and 06/61293-1 to M.G.J. and 97/0184-7 to V.A.) and
by Coordenacao de Aperfeicoamento de Pessoal de Nıvel Superior (CAPES; grant
33009015003P3 to M.G.J.).2These authors share first authorship.
Received 8 August 2007; Revised 2 October 2007; Accepted 3 October 2007.
Copyright D 2007 Neoplasia Press, Inc. All rights reserved 1522-8002/07/$25.00
DOI 10.1593/neo.07712
Neoplasia . Vol. 9, No. 12, December 2007, pp. 1111 –1121 1111
www.neoplasia.com
RESEARCH ARTICLE

and progression of numerous tumor types. The addition of
methyl (CH3) radicals to the cytosine nucleotide is catalyzed
in mammals mainly by three different DNA methyltrans-
ferases (Dnmt), namely DNMT 1, 3a, and 3b. DNMT3 group
comprises two enzymes with catalytic activity (DNMT 3a and
3b) and DNMT 3L, which has a regulatory role [16,17].
Neoplastic cells present simultaneously regional DNA
hypermethylation and global hypomethylation. Hypermethyl-
ation of promoter regions is associated with tumor sup-
pressor gene silencing by interfering with the binding of
transcription factors or by recruiting corepressor complexes
containing, for example, histone deacetylases. Global DNA
hypomethylation can result in oncogene expression, ge-
nomic instability, and loss of imprinting. Alterations in meth-
ylation patterns can thus determine the gene expression
profile, which is crucial for comprehension of carcinogen-
esis [18–20].
Recently, an in vitro transformation model of murine
melanocytes has been developed in our laboratory, after
submitting a nontumorigenic melanocyte lineage, melan-a,
to sequential cycles of anchorage blockade [21,22]. The aim
of the present study was to determine whether anchorage
blockade results in altered ROS and/or NO levels, and the
resulting effect on DNA methylation, which may contribute to
melanocyte malignant transformation.
Materials and Methods
Cell Culture
Murine nontumorigenic melanocyte lineage melan-a [23],
a kind gift from Dr. Michel Rabinovitch (Discipline of Parasi-
tology, Universidade Federal de Sao Paulo – UNIFESP),
was maintained in RPMI 1640 (Gibco, Carlsbad, CA), pH 6.9,
containing 5% fetal bovine serum (Gibco), 40 mg/l gentami-
cin, and 200 nM phorbol 12-myristate 13-acetate (Sigma, St.
Louis, MO) at 37jC in 5% CO2. For anchorage blockade
assays, adherent melan-a cells were removed from plates
by trypsin treatment (D0) and plated (105 cells/ml) on 1%
agarose-coated dishes for 1 to 24 hours (D1h to D24h) in the
conditions described above. In these conditions, melan-a
cells do not adhere to the plastic and remain viable in sus-
pension for at least 24 hours, as demonstrated by the Trypan
blue exclusion assay (data not shown).
Measurement of Superoxide Anion (O2.�) by Flow Cytometry
Relative concentrations of intracellular O2.� were deter-
mined as described previously [24]. Control adherent cells
(D0) and cells submitted to anchorage blockade for different
periods of time (D1h, D3h, D5h, and D24h) were assayed
for O2.� detection using dihydroethidium (DHE; Molecular
Probes, Carlsbad, CA). Briefly, cells were washed in phos-
phate-buffered saline (PBS) and resuspended in PBS con-
taining 10 mM DHE at 37jC for 30 minutes. After washing,
cells were resuspended in PBS and analyzed (10,000 events
per sample) by flow cytometry (FACScalibur; Becton Dickinson,
San Juan, CA) (excitation wavelength = 480 nm; emission
wavelength = 567 nm).
Glutathione Assay
Total glutathione (GSH) content was measured from cell
lysates obtained during adhesion (D0) and deadhesion con-
ditions (D1h, D5h, and D24h). Cells were mixed with the
same volume of 2 M perchloric acid with 4 mM EDTA. After
pH neutralization with K3PO4 and centrifugation, superna-
tants were collected for reaction with nicotinamide adenine
dinucleotide phosphate (4 mg/ml in 0.5% NaHCO3 buffer),
5,5V-dithiobis(2-nitro-benzoic acid) (1.5 mg/ml in 0.5%
NaHCO3 buffer), and GSH reductase (6 U/ml in 0.1 M
KPO4, pH 7, with 1 mM EDTA). Total GSH levels were
obtained spectrophotometrically at 412 nm [25] and all
determinations were normalized to the protein content [26].
Total GSH contents were expressed as nanomole per milli-
gram of protein.
Nitric Oxide Detection
The fluorescent NO indicator, diaminofluorescein-2 diace-
tate (DAF-2DA), was used to measure intracellular [NO]
[27] in adherent (D0) and suspended cells (D1h, D3h, D5h,
and D24h). DAF-2DA readily enters the cells and it is
hydrolyzed by cytosolic esterases to DAF-2, which is trapped
inside cells. In the presence of NO and oxygen, the relatively
nonfluorescent DAF-2 is converted into the highly green
fluorescent triazole form DAF-2T. Thus, increases in DAF-
2T fluorescence represent elevation of [NO]. Cells were
incubated with DAF-2DA (10 mM) in 0.5 ml of PBS at room
temperature for 30 minutes, rinsed with PBS, and analyzed
by flow cytometry in a FACScan (Becton Dickinson) (excita-
tion wavelength = 495 nm; emission wavelength = 515 nm).
Alternatively, extracellular NO levels were also determined
by a gas-phase chemiluminescence reaction of NO with
ozone using a NO Analyzer (NOA 280; Sievers Instruments,
Inc., Boulder, CO). NO-related species (nitrite, nitrate, S-
nitrosothiols, and so on) are converted to NO in the purge
vessel of the analyzer. The released NO is carried by an inert
gas to the detector where it reacts with ozone to produce a
chemiluminescence signal proportional to the concentration.
A standard curve was established with a set of serial dilutions
(0.1–100 mM) of sodium nitrate. The concentrations of NO
metabolites in the samples were determined by comparing
with the standard curve and expressed as micromole per
liter. Data collection and analysis were performed using the
NOAnalysis software (version 3.21; Sievers) [28].
Lipid Peroxidation Assay
Lipid peroxidation was measured by quantifying thiobarbi-
turic acid-reactive substances, mainly malondialdehyde
(MDA), formed during incubation using the thiobarbiturate–
MDA adduct formation [29]. The product of the reaction
between cell lysates and thiobarbituric acid was measured
spectrophotometrically at 535 nm and values were expressed
as nanomole per milligram of protein.
Homocysteine and Cysteine Quantification
Intracellular homocysteine (Hcy) was measured during
adhesion (D0) and deadhesion conditions (D24h) by high-
1112 Oxidative Stress and DNA Methylation Campos et al.
Neoplasia . Vol. 9, No. 12, 2007

performance liquid chromatography (HPLC) with fluorimet-
ric detection and isocratic elution. This methodology was
adapted from Pfeiffer et al. [30] and it involves three steps,
namely reduction of thiol groups using tris(carboxyethyl)-
phosphine, protein precipitation with trichloroacetic acid,
and derivatization with 7-fluorobenzene-2-oxy-1,3-diazolic-
4-ammonium sulfate. The HPLC system used was a Shimadzu
apparatus with a SIL-10ADvp automatic sample injector and
a RF-10AXL fluorescence detector (Shimadzu, Tokyo, Japan).
Chromatographic separation was performed using a C18
model Shim-pack CLC–ODS column (4.6 � 150 mm2, with
5.0-mm microparticles; Shimadzu). The fluorescence was ana-
lyzed with a detector adjusted for excitation at 385 nm and
emission at 515 nm. Total Hcy and cysteine (Cys) content,
expressed as nanomole per milligram of protein, were calcu-
lated with a calibration curve using known Hcy, Cys, and
cystamine concentrations as the internal standards.
5-Methylcytosine Content
Global DNA methylation was evaluated by staining cells
with a specific monoclonal antibody against 5-methylcytosine
(5-MeC; Oncogene, La Jolla, CA), as previously described
[31]. Cells in adherent (D0) or nonadherent (D1h, D3h, and
D24h) conditions were washed with PBS supplemented with
0.1% Tween 20 and 1% bovine serum albumin (PBS–TB),
fixed with 0.25% paraformaldehyde at 37jC for 10 minutes,
followed by 88% methanol at �20jC for at least 30 minutes.
After washing, cells were treated with 2 N HCl at 37jC for
30 minutes, neutralized with 0.1 M sodium borate (pH 9.0),
and blocked with 10% mouse serum for 20 minutes at 37jC.
Then, cells were incubated with anti–5-MeC antibody at a
final concentration of 1 mg/ml for 45 minutes at 37jC,
followed by incubation with goat anti–mouse IgG conjugated
with fluorescein (Kirkegaard & Perry Laboratories Inc. (KPL),
Gaithersburg, MD) for 30 minutes at 37jC. Finally, cells were
analyzed by flow cytometry in a FACScan. For nitric oxide
synthase (NOS) inhibition and antioxidant assays, adhered
melan-a cells were treated for 18 hours with 1 mM LG-nitro-L-
arginine methyl esther (L-NAME), 5 mM N-acetyl-L-cysteine
(NAC), or 1% dimethylsulphoxide (DMSO), submitted to the
anchorage blockade protocol as described above in the
presence of inhibitors, and analyzed for 5-MeC content.
The NOS inhibitor and antioxidants were used at noncyto-
toxic concentrations, estimated by methyl thiazol tetrazolium
(MTT) assays.
Cytotoxicity Assays
MTT assay was performed to determine noncytotoxic
concentrations of the NO inhibitor L-NAME and the antiox-
idants. Briefly, cells were seeded at a density of 2.5 �105 cells/ml in 96-well plates (in a final volume of 200 ml) in
complete medium and replicates of three. After adhesion,
cells were incubated with various concentrations of L-NAME
(0.5, 1, 2, 4, and 8 mM), NAC (0.5, 1, 5, and 10 mM), cata-
lase (5, 10, 50, and 100 U/ml), peroxidase (10, 50, 100, and
200 U/ml), and DMSO (0.5, 1, and 2%) in serum-free me-
dium. After 24 hours of incubation, 20 ml of MTT (5 mg/ml;
Sigma) was added and incubated for 1 hour at 37jC.
Supernatant was then removed, and 100 ml of isopropanol
was added. Culture plates were incubated for 15 minutes at
room temperature to dissolve MTT crystals. Absorbance
values were determined by an Multiskan MS (Labsystems,
Vantaa, Finland) at a wavelength of 570 nm. Each experi-
ment was repeated twice.
Western Blot Analysis
Protein extracts (50 mg) from adherent (D0) and sus-
pended (D1h, D3h, D5h, and D24h) melan-a cells, treated
or not with the nonspecific NOS inhibitor L-NAME (1 mM),
were submitted to Western blot analysis using rabbit poly-
clonal antibodies against dnmt3b (Abcam, Cambridge, MA)
and dnmt1 (Abcam), followed by incubation with peroxidase-
conjugated anti–rabbit antibody (KPL) and developed using
an enhanced chemiluminescence (ECL) detection reagent
(GE Healthcare, Buckinghamshire, UK).
Reverse Transcription–Polymerase Chain Reaction
Total RNA was extracted from adherent and deadherent
melan-a cells with TRIzol reagent (Invitrogen, Carlsbad, CA),
according to the manufacturer’s instructions. One microgram
of RNA was reverse-transcribed to cDNA with Superscript III
(Invitrogen). The resulting single-strand cDNAs were am-
plified by polymerase chain reaction (PCR) as follows: initial
5 minutes at 94jC, followed by 42 cycles of denaturing at
94jC for 30 seconds, with combined annealing at 56.5jC
for 30 seconds, and extension at 72jC for 60 seconds. The
b-actin mRNA was used to normalize the amounts of RNA
in the cell samples, and the intensities of the resulting PCR
bands were used to calculate the ratio of endothelial NOS
(eNOS)/b-actin intensities. PCR fragment amplification was
confirmed by agarose gel staining with ethidium bromide.
PCR detection of eNOS and actin mRNA was carried out by
using the primers: eNOS F 5V CATGGAAATGTCAGGCCCG
3V; eNOS R 5V TTCCACAGAGAGGATTGTAGC 3V; actin F 5V
CGAGGCCCAGAGCAAGAGAG 3V; actin R 5V AGGAAGA-
GGATGCGGCAGTGG 3V.
Statistical Analysis
GraphPad Prism 3.03 software (San Diego, CA) was used
for statistical analysis. One-way analysis of variance test was
initially performed to analyze sample groups and unpaired t
tests were used to compare suspended cells samples to ad-
herent cells controls. All experiments were performed at least
three times, each one in triplicates, and one representative ex-
periment is shown.
Results
Anchorage Blockade Induces Oxidative and
Nitrosative Stress
Several types of environmental stress induce ROS and
reactive nitrogen species production, but few studies ad-
dress the relationship of forced anchorage impediment and
free radicals levels in melanocytes. To investigate the effect
of anchorage blockade on ROS production, adherent (D0)
Oxidative Stress and DNA Methylation Campos et al. 1113
Neoplasia . Vol. 9, No. 12, 2007

and deadherent melan-a cells (D1h, D3h, D5h, and D24h)
were assayed for intracellular superoxide anion (O2.�). Intra-
cellular O2.� levels, which have been shown to be increased
in human metastatic melanomas compared to normal mela-
nocytes [32], become elevated progressively along melan-a
anchorage blockade. In adherent conditions (D0), 1% of cells
are positive for the O2.� marker, whereas 30% of cells
maintained in suspension for 5 (D5h) to 24 hours (D24h)
showed positivity (Figure 1).
Oxidized and reduced GSH levels are commonly used as
a measurement of intracellular redox state [33], and total
GSH levels were investigated during exposure of melan-a
cells to anchorage blockade. The ratio of intracellular GSH
relative to total protein content was not significantly in-
creased during the first hours in suspension (D1h, P = .064
and D5h, P = .159), when H2O2 levels were maximum (data
not shown), but became elevated in a statistically significant
manner only after 24 hours in detached cells (D24h, P = .020;
Figure 2A), when H2O2 levels returned to concentrations
found in adherent cells (data not shown), suggesting that
increased glutathione levels could be acting in the removal of
excessive H2O2 through reduction.
ROS production has been associated also with that of
NO, whose derivatives (N2O3, NO2�, peroxynitrite, and
others) possess a strong oxidative capacity [34]. We esti-
mated intracellular NO concentration in adherent (D0) and
deadherent (D1h, D8h, and D24h) melan-a (Figures 2B and
4C); NO levels are higher in samples collected from sus-
pended cell cultures than from adherent melan-a cells (D0),
peaking around 5 hours in suspension and decreasing after
24 hours in deadherent conditions (Figure 2B). In addition,
exposure of melan-a melanocytes to anchorage blockade re-
sulted in a significant expression of eNOS (type III), different
from adherent cells (D0) that did not express this enzyme
(Figure 2F ). Neither adherent nor suspended melan-a cells
expressed neuronal NOS (nNOS) (type I) (data not shown).
Lipid hydroperoxides are the initial products of unsaturated
fatty acid oxidation caused by peroxynitrite, the reaction prod-
uct of NO with O2.� [35]. One of the major aldehyde products
of lipid peroxidation is MDA and, as shown in Figure 2C, its lev-
els increase progressively, soon after melanocyte anchorage
blockade. These results clearly show that anchorage impedi-
ment in melanocytes results initially in increased levels of ROS
and NO, later followed by accumulation of total glutathione.
Anchorage Blockade Induces Hcy Depletion
Approximately half of the intracellular GSH pool in cells is
derived from Hcy through the transsulfuration pathway [36].
Hcy is a metabolite in the methionine cycle and has two
major fates: 1) transsulfuration catalyzed by cystathionine
b-synthase leading to cystathionine and 2) remethylation
catalyzed by methionine synthase or by betaine Hcy meth-
yltransferase. In the former pathway, cystathionine is subse-
quently converted to Cys, a precursor of GSH [37]. Cells can
Figure 1. Anchorage blockade of nontumorigenic melanocytes (melan-a)
induces superoxide anion (O2.�) production. Intracellular O2
.� concentration
were analyzed by flow cytometry in suspended (D1h, D3h, D5h, and D24h)
and adherent (DO) melan-a cells using the nonfluorescent cell-permeant
probe DHE, which, in contact with O2.�, becomes highly fluorescent. Light
gray lines represent nonstained and black lines represent stained melan-a
cells. Numbers inside graphs represent percentage of positive cells relatively
to nonstained controls.
1114 Oxidative Stress and DNA Methylation Campos et al.
Neoplasia . Vol. 9, No. 12, 2007
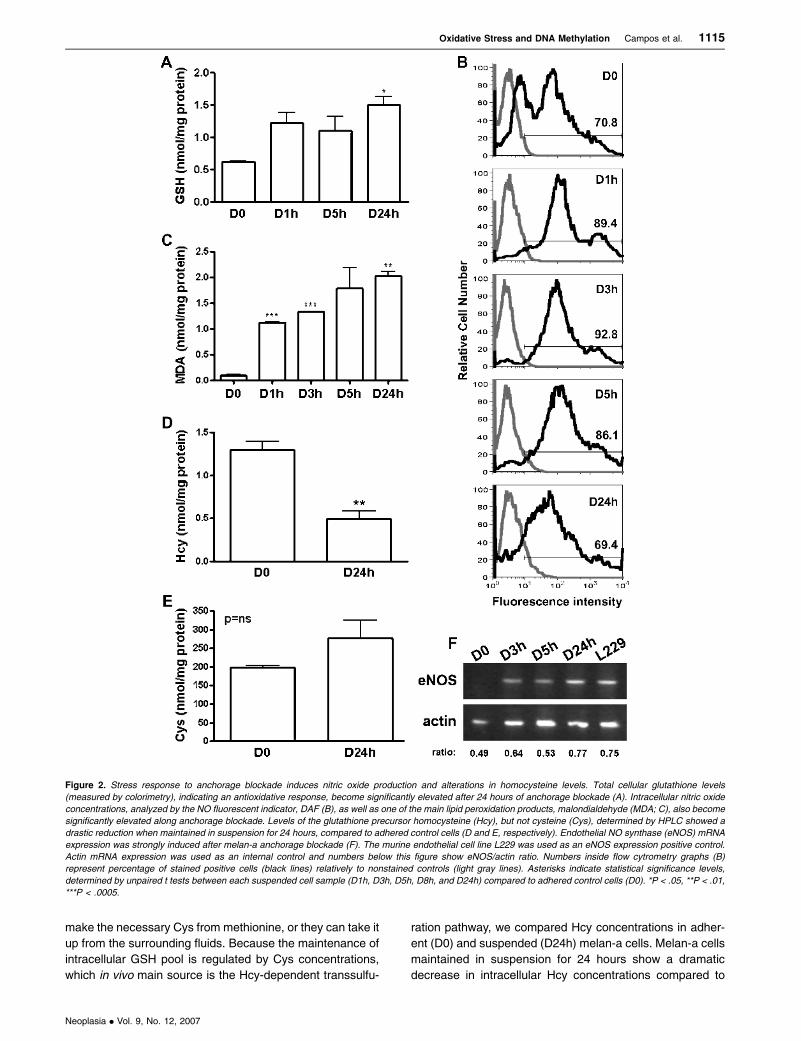
make the necessary Cys from methionine, or they can take it
up from the surrounding fluids. Because the maintenance of
intracellular GSH pool is regulated by Cys concentrations,
which in vivo main source is the Hcy-dependent transsulfu-
ration pathway, we compared Hcy concentrations in adher-
ent (D0) and suspended (D24h) melan-a cells. Melan-a cells
maintained in suspension for 24 hours show a dramatic
decrease in intracellular Hcy concentrations compared to
Figure 2. Stress response to anchorage blockade induces nitric oxide production and alterations in homocysteine levels. Total cellular glutathione levels
(measured by colorimetry), indicating an antioxidative response, become significantly elevated after 24 hours of anchorage blockade (A). Intracellular nitric oxide
concentrations, analyzed by the NO fluorescent indicator, DAF (B), as well as one of the main lipid peroxidation products, malondialdehyde (MDA; C), also become
significantly elevated along anchorage blockade. Levels of the glutathione precursor homocysteine (Hcy), but not cysteine (Cys), determined by HPLC showed a
drastic reduction when maintained in suspension for 24 hours, compared to adhered control cells (D and E, respectively). Endothelial NO synthase (eNOS) mRNA
expression was strongly induced after melan-a anchorage blockade (F). The murine endothelial cell line L229 was used as an eNOS expression positive control.
Actin mRNA expression was used as an internal control and numbers below this figure show eNOS/actin ratio. Numbers inside flow cytrometry graphs (B)
represent percentage of stained positive cells (black lines) relatively to nonstained controls (light gray lines). Asterisks indicate statistical significance levels,
determined by unpaired t tests between each suspended cell sample (D1h, D3h, D5h, D8h, and D24h) compared to adhered control cells (D0). *P < .05, **P < .01,
***P < .0005.
Oxidative Stress and DNA Methylation Campos et al. 1115
Neoplasia . Vol. 9, No. 12, 2007

adherent melan-a cells (Figure 2D), whereas Cys levels
remain stable in this condition (Figure 2E ).
Anchorage Blockade Alters 5-MeC Content
In the second metabolic pathway, Hcy is remethylated to
methionine, which is further converted to S-adenosylmethio-
nine (SAM) by methionine adenosyltransferase. SAM, the
universal methyl donor, is demethylated by several enzymes,
such as DNA methyltransferases [38]. Alterations in Hcy
levels in deadherent melan-a cells led us to investigate
whether global DNA methylation was altered during melan-
a anchorage blockade. Figure 3A (CTRL) shows that global
DNA methylation is augmented in suspended melan-a cells
(D1h, D3h, and D24h) when compared to adherent ones (D0,
47.3% of 5-MeC–positive cells). 5-Methylcytosine levels are
elevated as soon as 1 hour (70.2% positive cells) and
become progressively higher up to 24 hours after adhesion
blockade (95.9% positive cells).
L-NAME and NAC Abrogate DNA Hypermethylation and the
Concomitant Increase in dnmt1 and 3b Expression during
Anchorage Blockade
Considering that the increase in reactive species produc-
tion and DNA methylation have a temporal association in this
model, we tested whether these phenomena share a causal
relationship. Figure 3A shows that L-NAME, a known NOS in-
hibitor, and the cell-permeant antioxidant NAC impair global
DNA hypermethylation observed during melan-a anchorage
blockade. L-NAME completely reversed 5-MeC levels in-
crease after 3 (D3h, 10.4% positive cells) and 24 hours (D24h,
7.3% positive cells) in suspension, compared to nontreated
control cells (CTRL) at the same time points (D3h, 84.6%
positive cells; D24h, 95.9% positive cells). NAC was also
able to exert a significant inhibitory effect over 5-MeC con-
tent elevation, at an earlier time point (D1h, 24.9% positive
cells) than L-NAME and in 24 hours after anchorage block-
ade (D24h, 41.8% positive cells).
Other antioxidants, such as catalase (Sigma), DMSO
(Sigma), and peroxidase (type II horseradish peroxidase,
Sigma), were unable to exert the inhibitory effect over 5-MeC
levels observed with L-NAME and NAC (Figure 3A, for
DMSO; and data not shown, for catalase and peroxidase).
Intriguingly, L-NAME–treated adherent cells (D0) showed a
marked elevation in 5-MeC content, not detected after treat-
ment with other compounds (NAC: Figure 3; DMSO, cata-
lase, and peroxidase: data not shown). This observation is
being further investigated in our laboratory, and may be
related to Ras activation status [39].
The DNA methyltransferases implicated in establishing
de novo methylation patterns are dnmt3a and 3b, whereas
maintenance of DNA methylation pattern is performed by
dnmt1 during DNA replication process. We analyzed protein
expression by Western blot at different time points (D0, D1h,
D3h, D5h, and D24h), and Figure 3B shows a marked in-
crease in dnmt3b expression along anchorage blockade. A
significant increase in dnmt1 expression was also observed
Figure 3. Total DNA methylation levels and dnmt1 and 3b expression become elevated during forced anchorage blockade, and this response is abrogated by the
L-NAME and NAC. 5-MeC content, analyzed by flow cytometry using a specific antibody (Oncogene), augments along melan-a adhesion blockade (D1–24h)
compared to the adherent counterpart (D0) and this increase is abolished when these cells are treated with 1 mM L-NAME or with the antioxidant NAC, but not with
DMSO (A). Numbers inside graphs represent percentage of positively stained cells (black lines) relative to control cells incubated in the absence of primary
antibody (light gray lines). Suspended melan-a cells (D1–24h) present elevated expression of dnmt1 (D) and 3b (B and C) along time compared to adherent control
cells (D0), as analyzed by Western blot using specific antibodies against dnmt1 and 3b (Abcam), and L-NAME treatment inhibits both dnmt1 and 3b expression in
suspension condition [D3h and D24h for dnmt3b (C); D5h for dnmt1 (D)]. D0: adhered melan-a; D1h, D3h, D24h: suspended melan-a cells. �: nontreated cells, +:
treated cells. Numbers below blots indicate dnmt/actin ratio.
1116 Oxidative Stress and DNA Methylation Campos et al.
Neoplasia . Vol. 9, No. 12, 2007

after anchorage impediment (D5h), as shown in Figure 3D.
Corroborating the hypothesis that oxidative stress regulates
DNA methylation, L-NAME was capable of abolishing the in-
crease both in dnmt1 and 3b expression, observed during an-
chorage blockade of melan-a cells (D3h and D24h, Figure 3C;
D5h, Figure 3D). In addition, L-NAME–treated adherent cells
(D0), which present higher levels of 5-MeC as shown above,
also present a much higher expression of dnmt3b protein, but
not dnmt1. Taken together, these data reinforce the proposi-
tion that oxidative stress regulates DNA methylation through
DNA methyltransferase expression modifications.
L-NAME and NAC Do Not Inhibit NO Levels in Melan-a
Melanocytes, But Totally Impair O2.� Production
Despite its known capacity of inhibiting NOS, L-NAME
failed to reduce intracellular NO levels in nonadherent
melan-a cells (Figure 4A), which, although unexpected, is
in accordance with previous data showing that L-NAME was
unable to inhibit NO production in different human melanoma
cell lines [40], and with results indicating that L-NAME can be
a source of nonenzymatically produced NO [41]. In addition,
the NAC and catalase antioxidants did not modify NO levels
in melan-a cells maintained in suspension (Figure 4A).
Furthermore, L-NAME and NAC, but not catalase, were able
to completely abrogate O2.� production in this condition
(Figure 4B ).
Discussion
Normal melanocytes depend on signals provided by both
keratinocytes (in the epidermal melanin unit) and extracellular
matrix to maintain their normal homeostasis, and their ectopic
localization, as in dysplastic nevi and melanomas, is associ-
ated with morphologic and functional alterations [42,43].
Our group has recently established a melanocyte trans-
formation model where several melanoma lineages were
derived from immortalized, but nontumorigenic, melanocytes
(melan-a cells) submitted to rounds of anchorage blockade
followed by reattachment during normal culture conditions
[21,22]. This model allows the identification of biochemical,
genetic, and epigenetic alterations involved in homeostatic
control loss and the carcinogenic process.
A significant increase in oxidative stress, as shown di-
rectly by elevated intracellular levels of O2.� (Figure 1) and
indirectly by GSH (Figure 2A) and MDA concentrations
Figure 4. L-NAME and NAC do not inhibit NO production, but abrogate O2.�
generation during melan-a anchorage blockade. Melan-a cells submitted to
anchorage blockade (D3h) produced significant amounts of NO, estimated by
NO analyzer, compared to adherent melan-a cells (D0). NO generation was
not affected by either L-NAME (LN), NAC, or catalase (Cat) treatment (A).
Intracellular O2.� levels were determined by flow cytometry (FACScan;
Becton Dickinson) using DHE staining. L-NAME and NAC, but not catalase
(Cat), treatment strongly inhibited O2.� generation by deadhered melan-a
cells (D3h) (B). C: nontreated melan-a cells. Numbers inside graphs repre-
sent percentage of positive stained cells (black lines) relatively to control cells
incubated in the absence of DHE (light gray lines). ***P < .0005.
Oxidative Stress and DNA Methylation Campos et al. 1117
Neoplasia . Vol. 9, No. 12, 2007

(Figure 2C), is observed in melan-a cells submitted to
anchorage blockade, beginning as soon as 1 hour. The
increase in GSH levels could also indicate a response to
oxidative stress [33,36] (Figure 5) because we observed a
significant increase in GSH levels only 24 hours after adhe-
sion blockade (Figure 2A), when H2O2 production returns to
basal levels (data not shown). Increased ROS intracellular
levels induced by anchorage blockade have been implicated
as mediators of anoikis of human endothelial cells [44] and
colorectal carcinoma cells [45]. However, elevated levels of
O2.� have also been associated with protection from apop-
totic death induced by cytotoxic agents or CD95 activation
[46,47]. Nair et al. [48] showed that the decision to commit to
programmed cell death during oxidative stress is, at least for
neuronal murine cells, determined stochastically by each
cell. This mutually exclusive decision involves either extra-
cellular-regulated kinase or p53 activation pathways. It is
probable that such life or death choice is also taken by
melan-a cells maintained in forced deadherent culture con-
ditions, and preliminary results from our laboratory demon-
strate that p53 expression is increased in premalignant cell
lines, but is lost in cell lines with full malignant phenotype
(manuscript in preparation).
Oxidative stress is also commonly associated with rela-
tively high levels of reactive nitrosative species and reac-
tive oxygen nitrogen species [49]. NO is synthesized by a
family of enzymes termed NOS. Two of them, the so-called
endothelial (eNOS) and neuronal (nNOS) isoforms, are ex-
pressed constitutively and generate NO for cell signaling
purposes. The inducible isoform releases NO in large
amounts during inflammatory or immunologic reactions and
is involved in host tissue damage responses. NO production
(Figures 2B and 4A) and MDA levels (Figure 2C) are clearly
amplified in deadherent melan-a cells (D1–D24h), com-
pared to their adherent counterparts (D0). In addition, an-
chorage blockade induced eNOS expression by melan-a
cells (Figure 2F ), but not nNOS expression (data not shown).
Intracellular Hcy concentration was shown to fall dras-
tically in melan-a submitted to anchorage blockade for
24 hours (Figure 2D). Interestingly, the concentration of
Cys, a product of Hcy metabolism and a GSH precursor,
did not change after anchorage blockade (Figure 2E). The
observed low levels of intracellular Hcy suggest that both
metabolic pathways in which it is involved (transsulfuration
and remethylation) could be overly active. DNA molecules
are one of the possible targets of methylation reactions [50]
and elevated plasma levels of Hcy are associated with DNA
hypomethylation [51]. Our results show that global DNA
methylation, estimated by 5-MeC content, is clearly aug-
mented in the first hours after melan-a detachment (Figure 3A;
CTRL) when the Hcy level is significantly decreased (Fig-
ure 2D). The expression of both dnmt1 and 3b were also in-
creased along melan-a anchorage blockade (Figure 3, B–D),
providing a functional explanation for the observed rise in
5-MeC content.
Some groups have shown that both ROS and NO can
affect DNA methylation status [15,52–54]. In our work,
treatment of melan-a cells with L-NAME or NAC, but not with
other antioxidants (DMSO, catalase, and peroxidase),
resulted in inhibition of 5-MeC content (Figure 3A), as well
as in dnmt1 and 3b expression increase (Figure 3C) along
melan-a anchorage blockade. This effect does not seem to
evolve NO production because both L-NAME and NAC were
unable to inhibit NO synthesis (Figure 4A), but rather seems
related to O2.� levels, whose production was abrogated by
these inhibitors (Figure 4B). Absence of nitric oxide produc-
tion inhibition by a fairly known NOS inhibitor L-NAME has
already been described previously in melanoma cells [40], as
well as in other cell types [41]. As an L-arginine analog, L-
NAME itself seems to be a source of nonenzymatically
produced NO [41], which could explain the observed main-
tenance of NO levels after L-NAME addition to culture media.
Hydrogen peroxide scavenger antioxidants, such as DMSO
(Figure 3A), catalase, and peroxidase (data not shown), did
not alter either 5-MeC, dnmt1 and 3b expression or O2.�
production. Conversely, NAC can specifically induce the
expression [55] and the activity [56] of manganese superox-
ide dismutase (MnSOD), apart from its role as a precursor of
GSH, which could explain its effects on reducing O2.� levels
in melan-a cells submitted to anchorage blockade.
A very interesting feature of the NOS enzymes is that
they not only generate NO but also produce O2.� themselves
[57–59]. This phenomenon is referred to as the uncoupled
state of NOS and has been associated with risk factors
for some pathologies and considered as an abnormality of
NOS function [60,61]. As mentioned above, eNOS expres-
sion was significantly induced during melan-a anchorage
blockade (Figure 2F ), as well as superoxide anion produc-
tion (Figure 1). The exposure of eNOS to oxidants, including
peroxynitrite, may cause increased enzymatic uncoupling
and generation of superoxide anion [62] (Figure 5). Exoge-
nous NOS inhibitor L-NAME can impair the transfer of
electrons to molecular oxygen, inhibiting O2.� production
Figure 5. O2.� production and its possible relation to methionine cycle. Lower
levels of Hcy may result in lower levels of ADMA and higher NOS activity and/
or expression. The concomitant local generation of NO and O2.� can result in
peroxynitrite production, which, in turn, may lead to eNOS uncoupling and pro-
duction of higher O2.� levels. Activated Ras, in the presence of high O2
.� con-
centrations, may induce the dnmt’s expression and, consequently, increase
global DNA methylation. Met, methionine; SAM, S-adenosylmethionine; Cys,
cysteine; GSH, glutathione; DDAH, dimethylarginine dimethylaminohydrolase;
ADMA, asymmetric dimethylarginine; eNOS, endothelial NO synthase; CH3,
methyl radical; NO, nitric oxide; O2.�, superoxide anion; dnmt, DNA methyl-
transferases. Adapted from Laurent et al. [47] and Nair et al. [48].
1118 Oxidative Stress and DNA Methylation Campos et al.
Neoplasia . Vol. 9, No. 12, 2007

[58], which could explain the abrogation of O2.� production
in our model (Figure 5). In a similar way, asymmetric
dimethylarginine (ADMA), an endogenous NOS inhibitor,
can regulate the balance of NO and O2.� production from
NOS. ADMA is indirectly stimulated by Hcy [63] (Figure 5)
and elevated plasma levels of the latter are associated with
DNA hypomethylation [51]. In this context, lower Hcy con-
centrations could be indirectly related to NOS uncoupling
and increased O2.� production, which, in turn, might directly
contribute to DNA methylation regulation through modulation
of dnmt’s expression (Figure 5).
In our model, Ras activation is strongly induced few hours
after melan-a anchorage blockade (Machado, J. Jr., personal
communication). Aberrant activation of this oncogene has
been implicated in many aspects of the malignant pheno-
type, including uncontrolled proliferation and functional and
morphologic alterations [64,65]. MacLeod et al. [66] showed
that DNA methylation may be regulated by the Ras signaling
pathway by activating the Jun transcription factor, which in
turn transactivates the dnmt promoter by interacting with AP-
1 sites. The expression of either dnmt1, 3a, or 3b has already
been shown to be upregulated by activated Ras in different
experimental conditions [67–69] (Figure 5). Interestingly,
Sephashvili et al. [70] demonstrated that L-NAME increases
the production of S-adenosylhomocysteine (SAH), leading to
the reduction in SAM/SAH ratio and in methylation reactions,
only in cells presenting mutated oncogenic RasH, possibly
through enhancement of superoxides. Otherwise, these au-
thors showed that L-NAME–treated wild-type Ras-expressing
cells present increased SAM/SAH ratio, indicative of aug-
mented methylation reactions. In our work, increased 5-MeC
content and dnmt1 and 3b expression were abrogated by L-
NAME during melan-a anchorage blockade, when Ras is ac-
tivated, suggesting that this dnmt’s upregulated expression
may be related to Ras activation status. Curiously, L-NAME
treatment of adherent melan-a cells, which present nonacti-
vated Ras, leads to increases both in global DNA methylation
and in dnmt3b, but not dnmt1 expression. This fact may be
related to the experimental conditions, because dnmt1, and
not dnmt3b expression, is cell cycle–dependent. In most
studies, the expression of dnmts induced by Ras has been
found to depend on the cell type and context [67]. The impact
of Ras activation status and oxidative stress in DNA methyl-
ation is under intensive investigation in our laboratory.
Anchorage-independent growth (anoikis resistance) has
traditionally been described as an acquired in vitro charac-
teristic, which is well correlated with in vivo tumorigenic
capacity [71,72] but the acquisition of this phenotype is not
considered a causative event in carcinogenesis. Neverthe-
less, using basically the same deadhesion protocol used in
our work, Rak et al. [73] obtained tumorigenic variants after
enforced anchorage-independent growth of a nontumori-
genic immortalized epithelial cell line. Using a similar ap-
proach, Zhu et al. [74] obtained a melanoma cell line with
greater metastatic potential compared to the parental cell line.
More interestingly, Seftor et al. [75] showed that adhesion of
normal human melanocytes to a modified extracellular matrix
could induce the expression of several genes associated
with a malignant phenotype. This cancer-associated expres-
sion profile was reverted after several days in physiological
adherent conditions, and the authors suggest that melano-
cyte phenotype is controlled by epigenetic mechanisms that
include DNA methylation.
In our model of melanocyte transformation, cell–substrate
adhesion blockade is the only induced modification in cul-
ture conditions, which resulted in full malignant transformed
cell lines after several anchorage blockade cycles [22]. The
first hours of this process, as described in this work, present
a significant increase in oxidative/nitrosative stress, and this
metabolic imbalance may have a causal role in modifications
of DNA methylation status and dnmt1 and 3b expression, as
shown by L-NAME and NAC inhibition assays. These results
begin to unveil important clues about the initial events in the
carcinogenic process related to microenvironmental changes.
Acknowledgements
We thank Elisa Mieko Suemitsu Higa and Margaret Gori
Mouro for help with NO analyzer assays. We also thank
Heraldo Possolo for his helpful advice.
References[1] Frisch SM and Screaton RA (2001). Anoikis mechanisms. Curr Opin
Cell Biol 13, 555 – 562.
[2] Grossmann J (2002). Molecular mechanisms of ‘‘detachment-induced
apoptosis—anoikis’’. Apoptosis 7, 247 – 260.
[3] Cheng TL, Symons M, and Jou TS (2004). Regulation of anoikis by
Cdc42 and Rac1. Exp Cell Res 295, 497 – 511.
[4] Kawanishi S, Hiraku Y, and Oikawa S (2001). Mechanism of guanine-
specific DNA damage by oxidative stress and its role in carcinogenesis
and aging. Mutat Res 488, 65 – 76.
[5] Eu JP, Liu L, Zeng M, and Stamler JS (2000). An apoptotic model for
nitrosative stress. Biochemistry 39, 1040 – 1047.
[6] Cavelier G (2000). Theory of malignant cell transformation by super-
oxide fate coupled with cytoskeletal electron-transport and electron-
transfer. Med Hypotheses 54, 95– 98.
[7] Deng X, Gao F, and May WS (2003). Bcl2 retards G1/S cell cycle
transition by regulating intracellular ROS. Blood 102, 3179 –3185.
[8] Zimmerman R and Cerutti P (1984). Active oxygen acts as a promoter
of transformation in mouse embryo C3H/10T1/2/C18 fibroblasts. Proc
Natl Acad Sci USA 81, 2085 – 2087.
[9] Irani K, Xia Y, Zweier JL, Sollott SJ, Der CJ, Fearon ER, Sundaresan M,
Finkel T, and GoldschmidtClermont PJ (1997). Mitogenic signaling
mediated by oxidants in ras-transformed fibroblasts. Science 275,
1649 –1652.
[10] Behrend L, Henderson G, and Zwacka RM (2003). Reactive oxygen spe-
cies in oncogenic transformation. Biochem Soc Trans 31, 1441–1444.
[11] Brune B, von Knethen A, and Sandau KB (1999). Nitric oxide (NO): an
effector of apoptosis. Cell Death Differ 6, 969 –975.
[12] Ischiropoulos H and Beckman JS (2003). Oxidative stress and nitration
in neurodegeneration: cause, effect, or association? J Clin Invest 111,
163 – 169.
[13] Creppy EE, Traore A, Baudrimont I, Cascante M, and Carratu MR
(2002). Recent advances in the study of epigenetic effects induced by
the phycotoxin okadaic acid. Toxicology 181–182, 433 – 439.
[14] Marnett LJ, Riggins JN, and West JD (2003). Endogenous generation of
reactive oxidants and electrophiles and their reactions with DNA and
protein. J Clin Invest 111, 583 –593.
[15] Valinluck V, Tsai H, Rogstad DK, Burdzy A, Bird A, and Sowers LC
(2004). Oxidative damage to methyl-CpG sequences inhibits the bind-
ing of the methyl-CpG binding domain (MBD) of methyl-CpG binding
protein 2 (MeCP2). Nucleic Acids Res 32, 4100 – 4108.
[16] Gowher H, Liebert K, Hermann A, Xu G, and Jeltsch A (2005). Mech-
anism of stimulation of catalytic activity of Dnmt3A and Dnmt3B DNA-
(cytosine-C5) – methyltransferases by Dnmt3L. J Biol Chem 280,
13341 – 13348.
Oxidative Stress and DNA Methylation Campos et al. 1119
Neoplasia . Vol. 9, No. 12, 2007

[17] Suetake I, Shinozaki F, Miyagawa J, Takeshima H, and Tajima S (2004).
DNMT3L stimulates the DNA methylation activity of Dnmt3a and
Dnmt3b through a direct interaction. J Biol Chem 279, 27816 – 27823.
[18] Jones PA and Baylin SB (2002). The fundamental role of epigenetic
events in cancer. Nat Rev Genet 3, 415 –428.
[19] Feinberg AP, Ohlsson R, and Henikoff S (2006). The epigenetic pro-
genitor origin of human cancer. Nat Rev Genet 7, 21 –33.
[20] Wang Y, Yu Q, Cho AH, Rondeau G, Welsh J, Adamson E, Mercola D,
and McClelland M (2005). Survey of differentially methylated promoters
in prostate cancer cell lines. Neoplasia 7, 748 –760.
[21] Correa M, Machado J Jr, Carneiro CR, Pesquero JB, Bader M,
Travassos LR, Chammas R, and Jasiulionis MG (2005). Transient
inflammatory response induced by apoptotic cells is an important me-
diator of melanoma cell engraftment and growth. Int J Cancer 114,
356– 363.
[22] Oba-Shinjo SM, Correa M, Ricca TI, Molognoni F, Pinhal MA, Neves IA,
Marie SK, Sampaio LO, Nader HB, Chammas R, et al. (2006). Melano-
cyte transformation associated with substrate adhesion impediment.
Neoplasia 8, 231 – 241.
[23] Bennett DC, Cooper PJ, and Hart IR (1987). A line of non-tumorigenic
mouse melanocytes, syngeneic with the B16 melanoma and requiring a
tumour promoter for growth. Int J Cancer 39, 414 – 418.
[24] Zhao H, Kalivendi S, Zhang H, Joseph J, Nithipatikom K, Vasquez-Vivar
B, and Kalyanaraman B (2003). Superoxide reacts with hydroethidine
but forms a fluorescent product that is distinctly different from ethidium:
potential implications in intracellular fluorescence detection of super-
oxide. Free Radic Biol Med 34, 1359 –1368.
[25] Tietze F (1969). Enzymic method for quantitative determination of nano-
gram amounts of total and oxidized glutathione: applications to mam-
malian blood and other tissues. Anal Biochem 27, 502 –522.
[26] Lowry OH, Rosebrough NJ, Farr AL, and Randall RJ (1951). Pro-
tein measurement with the Folin phenol reagent. J Biol Chem 193,
265 – 275.
[27] Kojima H, Nakatsubo N, Kikuchi K, Urano Y, Higuchi T, Tanaka J, Kudo
Y, and Nagano T (1998). Direct evidence of NO production in rat hippo-
campus and cortex using a new fluorescent indicator: DAF-2 DA. Neu-
roreport 9, 3345 – 3348.
[28] Hampl V, Waters CL, and Archer SL (1996). Determination of nitric
oxide by the chemiluminescence reaction with ozone. In Feelisch, M,
Stamler, JS (Eds.), Methods in Nitric Oxide Research, pp. 309 –318
John Wiley & Sons, Chichester.
[29] Ohkawa H, Ohishi N, and Yagi K (1979). Assay for lipid peroxides
in animal tissues by thiobarbituric acid reaction. Anal Biochem 95,
351 –358.
[30] Pfeiffer CM, Huff DL, and Gunter EW (1999). Rapid and accurate HPLC
assay for plasma total homocysteine and cysteine in a clinical labora-
tory setting. Clin Chem 45, 290 – 292.
[31] Milutinovic S, Zhuang Q, Niveleau A, and Szyf M (2003). Epigenomic
stress response. Knockdown of DNA methyltransferase 1 triggers an
intra – S-phase arrest of DNA replication and induction of stress re-
sponse genes. J Biol Chem 278, 14985 – 14995.
[32] Meyskens FL Jr, McNulty SE, Buckmeier JA, Tohidian NB, Spillane TJ,
Kahlon RS, and Gonzalez RI (2001). Aberrant redox regulation in hu-
man metastatic melanoma cells compared to normal melanocytes. Free
Radic Biol Med 31, 799 –808.
[33] Tchantchou F, Graves M, Ashline D, Morin A, Pimenta A, Ortiz D,
Rogers E, and Shea TB (2004). Increased transcription and activity
of glutathione synthase in response to deficiencies in folate, vitamin E,
and apolipoprotein E. J Neurosci Res 75, 508 –515.
[34] Zorov DB, Bannikova SY, Belousov VV, Vyssokikh MY, Zorova LD,
Isaev NK, Krasnikov BF, and Plotnikov EY (2005). Reactive oxygen and
nitrogen species: friends or foes? Biochemistry (Mosc) 70, 215 – 221.
[35] Warner DS, Sheng H, and Batinic-Haberle I (2004). Oxidants, anti-
oxidants and the ischemic brain. J Exp Biol 207, 3221 – 3231.
[36] Mosharov E, Cranford MR, and Banerjee R (2000). The quantitatively
important relationship between homocysteine metabolism and gluta-
thione synthesis by the transsulfuration pathway and its regulation by
redox changes. Biochemistry 39, 13005 –13011.
[37] Dimitrova KR, DeGroot K, Myers AK, and Kim YD (2002). Estrogen and
homocysteine. Cardiovasc Res 53, 577– 588.
[38] Caudill MA, Wang JC, Melnyk S, Pogribny IP, Jernigan S, Collins MD,
Santos-Guzman J, Swendseid ME, Cogger EA, and James SJ (2001).
Intracellular S-adenosylhomocysteine concentrations predict global
DNA hypomethylation in tissues of methyl-deficient cystathionine b-
synthase heterozygous mice. J Nutr 131, 2811 –2818.
[39] Irani K, Xia Y, Zweier JL, Sollott SJ, Der CJ, Fearon ER, Sundaresan M,
Finkel T, and GoldschmidtClermont PJ (1997). Mitogenic signaling
mediated by oxidants in ras-transformed fibroblasts. Science 275,
1649 – 1652.
[40] Salvucci O, Carsana M, Bersani H, Tragni G, and Anichini A (2001).
Antiapoptotic role of endogenous nitric oxide in human melanoma cells.
Cancer Res 61, 318 – 326.
[41] Moroz LL, Norby SW, Cruz L, Sweedler JV, Gillete R, and Clarkson RB
(1998). Non-enzymatic production of nitric oxide (NO) from NO syn-
thase inhibitors. Biochem Biophys Res Commun 253, 571 –576.
[42] Kincannon J and Boutzale C (1999). The physiology of pigmented nevi.
Pediatrics 104, 1042 –1045.
[43] Postovit LM, Seftor EA, Seftor RE, and Hendrix MJ (2006). Influence of
the microenvironment on melanoma cell fate determination and pheno-
type. Cancer Res 66, 7833 – 7836.
[44] Li N, Oberley TD, Oberley LW, and Zhong W (1998). Inhibition of cell
growth in NIH/3T3 fibroblasts by overexpression of manganese super-
oxide dismutase: mechanistic studies. J Cell Physiol 175, 359 – 369.
[45] Laguinge LM, Lin S, Samara RN, Salesiotis AN, and Jessup JM (2004).
Nitrosative stress in rotated three-dimensional colorectal carcinoma cell
cultures induces microtubule depolymerization and apoptosis. Cancer
Res 64, 2643 – 2648.
[46] Pervaiz S, Cao J, Chao OS, Chin YY, and Clement MV (2001). Activa-
tion of the RacGTPase inhibits apoptosis in human tumor cells. Onco-
gene 20, 6263 – 6268.
[47] Laurent A, Nicco C, Chereau C, Goulvestre C, Alexandre J, Alves A,
Levy E, Goldwasser F, Panis Y, Soubrane O, et al. (2005). Controlling
tumor growth by modulating endogenous production of reactive oxygen
species. Cancer Res 65, 948 – 956.
[48] Nair VD, Yuen T, Olanow CW, and Sealfon SC (2004). Early single cell
bifurcation of pro- and antiapoptotic states during oxidative stress. J Biol
Chem 279, 27494 – 27501.
[49] Haddad JJ (2004). Redox and oxidant-mediated regulation of apoptosis
signaling pathways: immuno –pharmaco-redox conception of oxidative
siege versus cell death commitment. Int Immunopharmacol 4, 475 – 493.
[50] Ulrey CL, Liu L, Andrews LG, and Tollefsbol TO (2005). The impact of
metabolism on DNA methylation. Hum Mol Genet 14 Spec No 1,
R139 –R147.
[51] Yi P, Melnyk S, Pogribna M, Pogribny IP, Hine RJ, and James SJ
(2000). Increase in plasma homocysteine associated with parallel in-
creases in plasma S-adenosylhomocysteine and lymphocyte DNA hy-
pomethylation. J Biol Chem 275, 29318 – 29323.
[52] Weitzman SA, Turk PW, Milkowski DH, and Kozlowski K (1994). Free
radical adducts induce alterations in DNA cytosine methylation. Proc
Natl Acad Sci USA 91, 1261 – 1264.
[53] Cerda S and Weitzman SA (1997). Influence of oxygen radical injury on
DNA methylation. Mutat Res 386, 141 – 152.
[54] Hmadcha A, Bedoya FJ, Sobrino F, and Pintado E (1999). Methylation-
dependent gene silencing induced by interleukin 1b via nitric oxide pro-
duction. J Exp Med 190, 1595 –1604.
[55] Nagata K, Iwasaki Y, Yamada T, Yuba T, Kono K, Hosogi S, Ohsugi S,
Kuwahara H, and Marunaka Y (2007). Overexpression of manganese
superoxide dismutase by N-acetylcysteine in hyperoxic lung injury.
Respir Med 101, 800 – 807.
[56] Xia Z, Guo Z, Nagareddy PR, Yuen V, Yeung E, and McNeill JH (2006).
Antioxidant N-acetylcysteine restores myocardial Mn-SOD activity and
attenuates myocardial dysfunction in diabetic rats. Eur J Pharmacol
544, 125.
[57] Rabelink TJ and Luscher TF (2006). Endothelial nitric oxide synthase.
Host defense enzyme of the endothelium? Arterioscler Thromb Vasc
Biol 26, 267 – 271.
[58] Cardounel AJ, Xia Y, and Zweier JL (2005). Endogenous methylargi-
nines modulate superoxide as well as nitric oxide generation from neu-
ronal nitric-oxide synthase. J Biol Chem 280, 7540 –7549.
[59] Pou S, Keaton L, Surichamorn W, and Rosen GM (1999). Mechanism of
superoxide generation by neuronal nitric-oxide synthase. J Biol Chem
274, 9573 – 9580.
[60] Meininger CJ, Cai S, Parker JL, Channon KM, Kelly KA, Becker EJ,
Wood MK, Wade LA, and Wu G (2004). GTP cyclohydrolase I gene
transfer reverses tetrahydrobiopterin deficiency and increases nitric ox-
ide synthesis in endothelial cells and isolated vessels from diabetic rats.
FASEB J 18, 1900 –1902.
[61] Stroes E, Kastelein J, Cosentino F, Erkelens W, Wever R, Koomans H,
Luscher TF, and Rabelink TJ (1997). Tetrahydrobiopterin restores en-
dothelial function in hypercholesterolemia. J Clin Invest 99, 41– 46.
[62] Zou MH, Shi C, and Cohen RA (2002). Oxidation of the zinc – thiolate
complex and uncoupling of endothelial nitric synthase by peroxynitrite.
J Clin Invest 109, 817 – 826.
[63] Stuhlinger MC, Tsao PS, Her JH, Kimoto M, Balint RF, and Cooke JP
1120 Oxidative Stress and DNA Methylation Campos et al.
Neoplasia . Vol. 9, No. 12, 2007

(2001). Homocysteine impairs the nitric oxide synthase pathway: role of
asymmetric dimethylarginine. Circulation 104, 2569 –2575.
[64] Barbacid M (1987). Ras genes. Annu Rev Biochem 56, 779 – 827.
[65] Derouet M, Xou X, May L, Hoon Yoo B, Sasazuki T, Shirasawa S, Rak J,
and Rosen KV (2007). Acquisition of anoikis resistance promotes the
emergence of oncogenic K-ras mutations in colorectal cancer cells and
stimulates their tumorigenicity in vivo. Neoplasia 9, 536 –545.
[66] MacLeod R, Rouleau J, and Szyf M (1995). Regulation of DNA meth-
ylation by the Ras signaling pathway. J Biol Chem 270, 11327 –11337.
[67] Chang H, Cho C, and Hung W (2006). Silencing of the metastasis
suppressor RECK by RAS oncogene is mediated by DNA methyltrans-
ferase 3b-induced promoter methylation. Cancer Res 66, 8413– 8420.
[68] Soejima K, Fang W, and Rollins BJ (2003). DNA methyltransferase 3b
contributes to oncogenic transformation induced by SV40T antigen and
activated Ras. Oncogene 22, 4723 – 4733.
[69] Pruitt K, Ulku AS, Frantz K, Rojas RJ, Muniz-Medina VM, Rangnekar
VM, Der CJ, and Shields JM (2005). Ras-mediated loss of the pro-
apoptotic response protein Par-4 is mediated by DNA hypermethylation
through Raf-independent and Raf-dependent signaling cascades in epi-
thelial cells. J Biol Chem 280, 23363 – 23370.
[70] Sephashvili M, Zhuravliova E, Barbakadze T, Khundadze M, Narmania
N, and Mikeladze DG (2006). L-NAME has opposite effects on the
productions of S-adenosylhomocysteine and S-adenosylmethionine in
V12-H-Ras and M-CR3B-Ras pheochromocytoma cells. Neurochem
Res 31, 1205 – 1210.
[71] Baserga R (1997). The price of independence. Exp Cell Res 236, 1– 3.
[72] Song J, Xie H, Lian J, Yang G, Du R, Du Y, Zou X, Jin H, Gao J, Liu J,
et al. (2006). Enhanced cell survival of gastric cancer cells by a novel
gene URG4. Neoplasia 8, 995 –1002.
[73] Rak J, Mitsuhashi Y, Sheehan C, Krestow J, Florenes V, Filmus J, and
Kerbel R (1999). Collateral expression of proangiogenic and tumorigenic
properties in intestinal epithelial cell variants selected for resistance to
anoikis. Neoplasia 1, 23–30.
[74] Zhu Z, Sanchez-Sweatman O, Huang X, Wiltrout R, Khokha R, Zhao Q,
and Gorelik E (2001). Anoikis and metastatic potential of cloudman S91
melanoma cells. Cancer Res 61, 1707 – 1716.
[75] Seftor EA, Brown KM, Chin L, Kirschmann DA, Wheaton WW, Protopopov
A, Feng B, Balagurunathan Y, Trent JM, Nickoloff BJ, et al. (2005). Epi-
genetic transdifferentiation of normal melanocytes by a metastatic mela-
noma microenvironment. Cancer Res 65, 10164–10169.
Oxidative Stress and DNA Methylation Campos et al. 1121
Neoplasia . Vol. 9, No. 12, 2007
Copyright © 2022 FDOKUMEN