Measuring Process Capacity - BSI Engineering
8
December 1, 2020 White Paper - Volume 10 Headquarters Address: [email protected] E-mail: www.bsiengr.com Website: 300 E-Business Way, Suite 300 Cincinnati OH 45241 Phone: 513-201-3100 Fax: 513-201-3190 Measuring Process Capacity
-
Upload
khangminh22 -
Category
Documents
-
view
2 -
download
0
Transcript of Measuring Process Capacity - BSI Engineering
December 1, 2020
White Paper - Volume 10
Headquarters Address:[email protected]:
www.bsiengr.comWebsite:
300 E-Business Way, Suite 300Cincinnati OH 45241Phone: 513-201-3100 Fax: 513-201-3190
Measuring ProcessCapacity
2 Abstract
2 What is Process Capability
4 Determination and Calculation of CP & CPK - Process Capability Indexes
5 Determination and Calculation of PP & PPK - Process Performance Indexes
6 Conclusion
CONTENT
5 Summary
6 References
1Measuring Process Capability
What is Process Capacity
A process has been defined as a sequence of interdependent procedures, operations or steps that consume resources and convert the inputs into outputs. Each operation or step adds to the next to achieve a goal or desired result. There always exists a certain amount of variation in each process. Variation in process cannot be eliminated, but can be measured, reduced and controlled. By utilizing process controls, taking measurements, and using reliable, well-maintained equipment, variation in the process can leave less effect on the quality of the output. The process can be capable of producing an acceptable product on a consistent basis. We can maintain Process Capability. When the new product is developed, before it enters production one must consider the capability of the machine or process selected to make the desired product.
Process Capability is a statistical measurement of a process’s ability to produce whatever product it was intended to within specified limits and on a consistent basis. Process capability compares the output of an in-control process to the specification limits by using capability indices.
To estimate how the new process could be performing we calculate Pp (Preliminary Process Capability) and Ppk (Preliminary Process Capability Index). The Pp and Ppk indices are used to evaluate a new process or one that is not in statistical control. The Pp and Ppk calculations use standard deviation based on studied data (whole population).
Conversely to determine how the process is operating, we can calculate Cp (Process Capability), Cpk (Process Capability Index), depending on the state of the process and the method of determining the standard deviation. The Cp and Cpk indices are used to evaluate existing, established processes in statistical control. The Cp and Cpk calculations use sample deviation or deviation mean within rational subgroups.
Process capability indices Cp and Cpk evaluate the output of a process in comparison to the specification limits determined by the target value and the tolerance range. Cp tells if the process is capable of making product within specifications and Cpk tells if the process is centered between the specification limits.
ABSTRACT
2Measuring Process Capability
A process capability study uses data from a sample to PREDICT the ability of a manufacturing process to produce parts conforming to specifications.
This prediction enables us to “qualify” a new manufacturing process as being fit for use in production. Therefore, Process Capability Analysis is best used during New Product Introduction (NPI), or at the start of each day or each shift of production as a method of checking whether a process is in control and capable of producing parts that meet specifications.
Both Cp and Cpk are used for the short-term process.
A process capability index uses both the process variability and the process specifications to determine whether the process is “capable”
The comparison is made by forming the ratio of the spread between the process specifications (the specification “width”) to the spread of the process values, as measured by 6 process standard deviation units.
There are several statistics that can be used to measure the capability of a process: Cp, Cpk, and Cpm.The Cp index is a fundamental indication of process capability. The Cp value is calculated using the specification limits and the standard deviation of the process. Most companies require that the process Cp = 1.33 or greater.
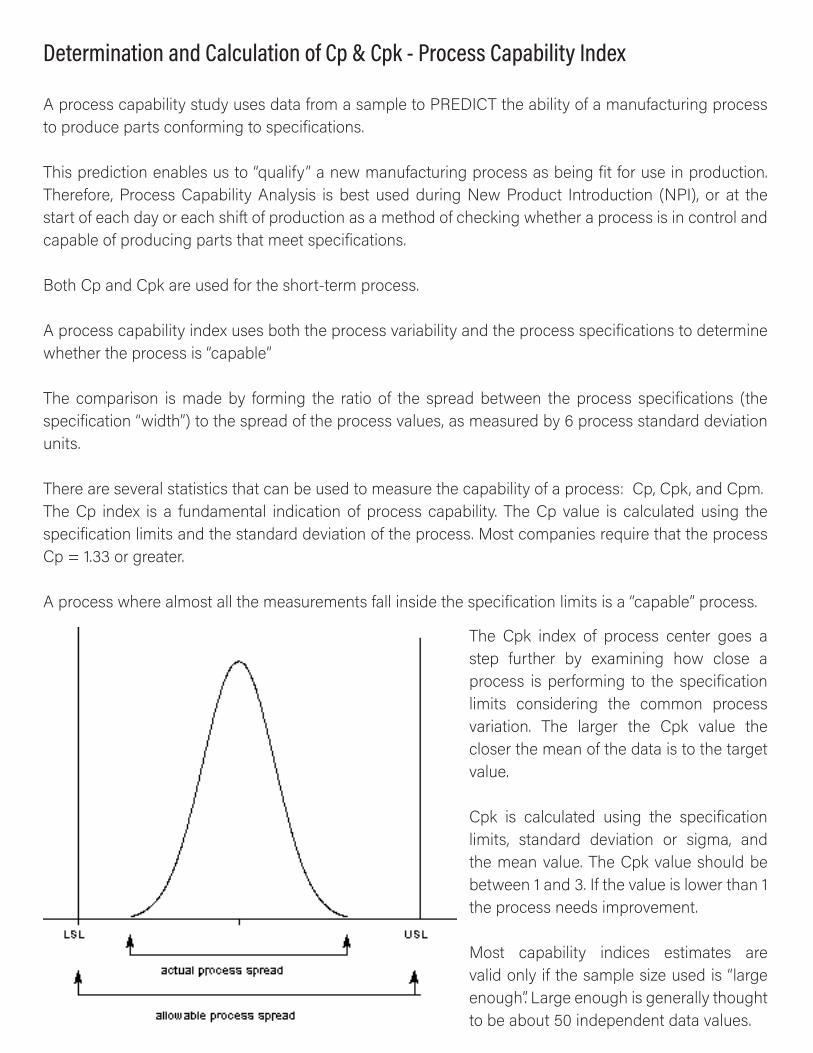
A process where almost all the measurements fall inside the specification limits is a “capable” process.
Determination and Calculation of Cp & Cpk - Process Capability Index
The Cpk index of process center goes a step further by examining how close a process is performing to the specification limits considering the common process variation. The larger the Cpk value the closer the mean of the data is to the target value.
Cpk is calculated using the specification limits, standard deviation or sigma, and the mean value. The Cpk value should be between 1 and 3. If the value is lower than 1 the process needs improvement.
Most capability indices estimates are valid only if the sample size used is “large enough”. Large enough is generally thought to be about 50 independent data values.
The Cp, Cpk, and Cpm statistics assume that the population of data values is normally distributed. Assuming a two-sided specification, if ơ and ơ are the mean and standard deviation, respectively, of the normal data and USL, LSL, and T are the upper and lower specification limits and the target value, respectively, then the population capability indices are defined as follows.
Process Capability Formula (Cp, Cpk):
Cp and Cpk are used for the short-term process, or within 6ơ.
Cp= (USL-LSL)/6ơ (within) and Cpk = min (Cpu, Cpl),
Cpu = (USL-Mean)/3ơ (within)
Cpl= (Mean-Cpl)/3ơ (within)
In the Cpk, k stands for off-target variation.
K= (Process Centre-Process Mean)/50% of USL-LSL and if we talk about process center;
Process center = (USL+LSL)/2, and the process mean is the average or mean of the process data points.
DETERMINATION AND CALCULATION OF CP AND CPK - PROCESS CAPABILITY INDEXES
A Process Performance study is used to EVALUATE a manufacturing process and answers the question: “how did the process actually perform over a period of time?” In daily use we tend to omit an important word, “actual”, from the name of this analysis.
The missing word “Actual” from Process Performance and the missing word “Potential” from Process Capability result in significant confusion among practitioners.
The Process Performance Analysis is best used when you have inspection data, and you want to use the inspection data to understand how your manufacturing process actually performed. This is a historical analysis rather than a predictive analysis but can still be used to drive process improvements.The Pp and Ppk provide the overall process capability overview or long-term process capability. It shows the exact process capability at current. Process Performance Indices Formula (Pp, Ppk):
Pp =(USL-LSL)/6ơ (overall) and Ppk = min (Cpu, Cpl)/6 ơ
Ppu = (USL-Mean)/3ơ (overall)
Ppl= (Mean-Cpl)/3ơ (overall)
ơ(overall) = Sqrt (∑(x-xbar)^2/(n-1)), here xbar refers to the process mean, individual data points refer by x, where n indicates sample size and their degree of freedom reflects as n-1.
DETERMINATION AND CALCULATION OF Pp AND Ppk – Process Performance Indexes
Any process would have the variance, due to the multiple outputs or there may be some noise in the process. If we have different inputs, then the outputs will not be the same or exactly hitting the target every time. For such scenarios, customers must give the space for acceptance of variations. Hence, we can say that every process has variations.
In case there is a variation, we then need to see, how much are we deviating from our target and how much are we within the customers’ defined limits.
The process capability is thus, defined as the ratio of the voice of the customer and voice of the process:
Cp = (USL-LSL)/6ơ
Long-term process capability cannot be the same as the short term. We must always try to change the Non-Normal data to normal first and convert Discrete data to continuous data in order to get the more accurate details.
CONCLUSION
SUMMARYProcess Capability Analysis requires that data be captured in the production sequence i.e. in the order the items were produced.
This is because Process Capability Analysis is predicated on the process being stable over time and we must be able to measure and compare process variation over time in order to determine stability. On the other hand, Process Performance Analysis does not require data in production sequence as it uses the total standard deviation and it does not matter what order the parts were produced in (more on this in a subsequent post).
Cp and Cpk require that the manufacturing process be stable, while Pp and Ppk do not require process stability. So Cp and Cpk are effectively the best the process can perform when it is stable, and Pp and Ppk is the actual performance against that theoretical best.
6Measuring Process Capability
REFERENCES
MEASURING PROCESS CAPABILITY
Urvashi, Chitranshi. How to measure Process Capability and Process Performance? https://greycampus.com/blog/quality-management/how-to-measure-process-capability-and-process-performance
NIST/SEMATECH e-Handbook of Statistical Methods, http://itl.nist.gov/div898/handbook/, 11/15/20
Quality-One International Discover the Value, Process Capability https://quality-one.com/process-capability/, 11/16/20
Girotra, Nipun. Process Capability - Part 1: Difference Between Process Capability (Cp, Cpk) and Process Performance (Pp, Ppk), https://.1factory.com/blog-post-process-capability-basics-cpk-ppk-part-1.html, 11/16/20
WHAT IS PROCESS CAPABILITY? Quality Glossary Definition: Process Capability: Estimates and Studies, ASQ.https://asq.org/quality-resources/process-capability, 11/16/20
BSI Engineering is a full-service provider of engineering and design services for a very broad range of industry sectors.
The majority of our 200+ employees have over twenty years of technical experience and are ready to add their expertise to your project from any of our midwestern office locations. We deliver exceptional value for our clients wanting a fully integrated, engineering-led EPCM model.
THANK YOUFOR CHOOSING US!
300 E-Business Way, Suite 300Cincinnati OH 45241
Phone: 513-201-3100Fax: 513-201-3190
E-mail: [email protected]: www.bsiengr.com