Measurement of the trunk musculature from T5 to L5 using MRI scans of 15 young males corrected for...
8
Clin. Biomech. 1993; 8: 171-178 Papers Measurement of the trunk musculature from T5 to L5 using MRI scans of 15 young males corrected for muscle fibre orientation S M McGill PhDl, Lina Santaguida MSC’ , J Stevens PhD2 ‘Occupational Biomechanics Laboratories, Department of Kinesiology, University of Waterloo; and 2Eye Research institute of Canada, Toronto Western Hospital, Toronto, Ontario, Canada Summary Lumbar and thoracic transverse magnetic resonance image scans from T4 to the sacrum were collected from 15 young men at a slice thickness of 5 mm. Anatomical muscle areas and distances from muscle centroids to their respective intervertebral disc centroid were measured directly from the scans, from which physiological muscle areas and muscle moment arms, corrected for the cosine between the scan plane and dominant fibre line of action, were calculated. Only a portion of the abdominal wall, and quadratus lumborum, and lower lumbar levels of longissimus thoracis pars lumborum demonstrate changes in corrected areas and moment arm distances greater than 10% relative to their uncorrected values measured directly from scan slices. The data illustrate the changing cross-sectional areas and mechanical moment arms of the muscles spanning the lower thoracic and lumbar regions. Considerations and problems in interpretation of these cross-sectional areas and moment arms for biomechanical analyses are discussed, together with the limitations for direct application of these geometric measurements for modelling. Relevance The accuracy of anatomically sophisticated mathematical models of the low back designed to assess low-back mechanics is dependent upon the geometry of the load-bearing components. The data presented in this study documents gross muscle geometry over the full length of the lumbar spine. Introduction Ongoing development of anatomically sophisticated mathematical models of the low back designed to investigate lumbar mechanics is continuing in several laboratories. Researchers and clinicians alike must come to grips with the complex mechanics of the low back to address competently the issues of industrial injury risk assessment and the evaluation of strategies hypothesized to avoid injury. The accuracy of biomechanicalimathematical models used to predict tissue loads (including muscle, ligament, and skeletal) has been demonstrated to be highly dependent upon Received: 20 March 1992 Accepted: 12 September 1992 Correspondence and reprini requests tot Dr S McGill, Occupational Biomechanics Laboratories, Department of Kinesiology, University of Waterloo, Waterloo, Ontario, Canada N2L 3GI 0 1993 Butterworth-Heinemann Ltd 0268-0033/93/040171-08 the geometry of the load-bearing anatomical com- ponents’. The very nature of the trunk musculature, with curving lines of pull, layered architecture, and the spanning of many joints, increases the sensitivity of accurate representation of geometric parameters in models. A small database of trunk muscle geometry can be compiled from three types of studies documented in the literature; cadaveric (e.g. two males - Rab et al.*; seven males - Dumas et a1.3); computed tomography (CT) scans (e.g. 96 older women - Chaffin et a1.4; 13 men, average age 40 years - McGill et al.“; 35 males and 21 females, average age 58.6 years - Kumar6), and magnetic resonance images (MRI) (e.g. 26 males, average age 29 years - Tracey et a1.7) None of these studies reported muscle geometry from the mid- thoracic region down to the sacrum. While dissection of cadaveric material is required to understand anatomical morphology, cadavers provide poor estimates of geometrical measures of muscle bulk due typically to their older age and inactivity prior to death, and shape/
-
Upload
independent -
Category
Documents
-
view
4 -
download
0
Transcript of Measurement of the trunk musculature from T5 to L5 using MRI scans of 15 young males corrected for...
Clin. Biomech. 1993; 8: 171-178
Papers
Measurement of the trunk musculature from T5 to L5 using MRI scans of 15 young males corrected for muscle fibre orientation
S M McGill PhDl, Lina Santaguida MSC’, J Stevens PhD2
‘Occupational Biomechanics Laboratories, Department of Kinesiology, University of Waterloo; and 2Eye Research institute of Canada, Toronto Western Hospital, Toronto, Ontario, Canada
Summary
Lumbar and thoracic transverse magnetic resonance image scans from T4 to the sacrum were collected from 15 young men at a slice thickness of 5 mm. Anatomical muscle areas and distances from muscle centroids to their respective intervertebral disc centroid were measured directly from the scans, from which physiological muscle areas and muscle moment arms, corrected for the cosine between the scan plane and dominant fibre line of action, were calculated. Only a portion of the abdominal wall, and quadratus lumborum, and lower lumbar levels of longissimus thoracis pars lumborum demonstrate changes in corrected areas and moment arm distances greater than 10% relative to their uncorrected values measured directly from scan slices. The data illustrate the changing cross-sectional areas and mechanical moment arms of the muscles spanning the lower thoracic and lumbar regions. Considerations and problems in interpretation of these cross-sectional areas and moment arms for biomechanical analyses are discussed, together with the limitations for direct application of these geometric measurements for modelling.
Relevance
The accuracy of anatomically sophisticated mathematical models of the low back designed to assess low-back mechanics is dependent upon the geometry of the load-bearing components. The data presented in this study documents gross muscle geometry over the full length of the lumbar spine.
Introduction
Ongoing development of anatomically sophisticated mathematical models of the low back designed to investigate lumbar mechanics is continuing in several laboratories. Researchers and clinicians alike must come to grips with the complex mechanics of the low back to address competently the issues of industrial injury risk assessment and the evaluation of strategies hypothesized to avoid injury. The accuracy of biomechanicalimathematical models used to predict tissue loads (including muscle, ligament, and skeletal) has been demonstrated to be highly dependent upon
Received: 20 March 1992 Accepted: 12 September 1992 Correspondence and reprini requests tot Dr S McGill, Occupational Biomechanics Laboratories, Department of Kinesiology, University of Waterloo, Waterloo, Ontario, Canada N2L 3GI
0 1993 Butterworth-Heinemann Ltd 0268-0033/93/040171-08
the geometry of the load-bearing anatomical com- ponents’. The very nature of the trunk musculature, with curving lines of pull, layered architecture, and the spanning of many joints, increases the sensitivity of accurate representation of geometric parameters in models.
A small database of trunk muscle geometry can be compiled from three types of studies documented in the literature; cadaveric (e.g. two males - Rab et al.*; seven males - Dumas et a1.3); computed tomography (CT) scans (e.g. 96 older women - Chaffin et a1.4; 13 men, average age 40 years - McGill et al.“; 35 males and 21 females, average age 58.6 years - Kumar6), and magnetic resonance images (MRI) (e.g. 26 males, average age 29 years - Tracey et a1.7) None of these studies reported muscle geometry from the mid- thoracic region down to the sacrum. While dissection of cadaveric material is required to understand anatomical morphology, cadavers provide poor estimates of geometrical measures of muscle bulk due typically to their older age and inactivity prior to death, and shape/
172 Clin. Biomech. 1993; 8: No 4
volume distortions caused by the embalming process. CT scans provide high-resolution slices of most tissues, particularly mineralized tissue, but expose the human subject to X-radiation. Conversely, the MRI process does not produce any ionizing radiation and is superior in imaging soft tissues as it is sensitive to the concentration of hydrogen atoms rather than mineral content. Also the superior ability of MRI to differentiate between muscle and connective tissue over CT was cited by Engstrom et al.* in their report that compared the two techniques to predict cross- sectional areas of thigh muscles.
The purpose of this study was to add to the growing database of trunk muscle cross-sectional areas and moment arm lengths, particularly over the full length of those muscles involved in lumbar kinetics, specifically from the level of T5 to the sacrum. The unique feature of the data reported here is that areas and moment arm lengths are corrected for fibre line of action cosines that were compiled from the literature.
Methods
Subjects
Fifteen young men were recruited who were healthy and had no history of disabling back disease or injury (mean age 25.3 (SD 3.6) years; mean weight 81.5 (SD 10.7) kg; mean height 176.1 (SD 6.8) cm).
Data collection
Lumbar and thoracic MRI scans were collected from the 15 subjects in a neutral position which was defined as supine lying with the knees extended. The scanner (Phillips Gyroscan) was set to a spin echo pulse sequence of TR = 500 and TE = 20, generating slices 5 mm thick.
Distortion of the images in the MRI scans was evaluated by scanning calibration objects (perfect cubes and spheres) of known size and volume. Differences no greater than 3% were found between the digitized and true area values. Further, distortions of the aspect ratio were investigated but no distortion of this type was detected within a resolution of 1 mm.
The field view of the scan was limited to 330 mm, requiring two overlapping scans from each subject (Trz to the sacrum and T4 to k). To assist in the alignment of the overlap of the two scans an oil bead was taped to each skin surface over the Lr or L2 spinous process prior to scanning. The bead was visible in both the lumbar and thoracic spine sagittal scout views. Due to the variability of subject size and spine geometry, the multiple slices did not cut through the same location on the vertebrae/disc of all subjects. The slices closest to the disc centre (determined from sagittal scout views) were selected as representative of the muscle at that particular spinal level. The transverse slices were always within 5 mm (superiorly or inferiorly) of the disc centroid.
Data analysis
Thirty-five-millimetre slides were made of the developed MRI films. The slides were projected onto a digitizing tablet (Summagraphics, Fairfield, Connecticut, USA), where the optical axis of the projector was aligned ‘normal’ to the plane of the tablet by first projecting a square grid. Perimeters of muscle slices were scribed three times with a pen cursor and the average area calculated. Area centroids were calculated from a sequential trapezoidal fitting algorithm described by Chaffin et a14. The anterior- posterior and lateral distances of the muscle area centroids with respect to the centroid of the disc together with anatomic cross-sectional area were measured.
Most studies to date have assumed that these measurements of muscle area and distance from the disc centroid represent force- and moment-producing potential. However, muscle lines of action, in most cases, are not perpendicular to the scan slices. Recognizing this shortfall, we attempted to correct for these cosines in an effort to obtain better estimates of physiological cross-sectional areas and muscle moment arms about three orthopaedic axes (flexion-extension, lateral bend, and axial twist). First, cosines of specific muscles with respect to the supine anatomic position (listed in Table 1) were taken from Dumas et al3 for rectus abdominis, latissimus dorsi, iliocostalis pars thoracis, longissimus pars thoracis, quadratus lumborum, external and internal oblique; from Macintosh and Bogduk’ for iliocostalis pars lumborum, longissimus pars lumborum; from Santaguida” for psoas; and from Macintosh and Bogduk” for multi- fidus. This was justified on the basis that the serial MRI scans were taken with the trunk axes orientated in anatomic (supine) position. The next step was to correct the raw anatomical measures of cross-sectional area into physiological cross-sections that were perpen- dicular to the muscle fibres. This was accomplished by taking the DOT product between the perpendicular axis of the scan plane and the unit vector cosine of the muscle fibres, realizing that this approximation is not appropriate for muscles whose cosines approach zero (e.g. transverse abdominis):
A,, = A, * [(X, Y, Z) * (i,j, k),] (1)
where A,:
A,:
(X y, Z):
(i&Q,,:
corrected cross-sectional area (mm2), area measured from scan slice (mm”), unit vector of perpendicular axis to the scan plane, unit vector of muscle fibres line of action.
True muscle moment arms are the perpendicular distance from the disc centroid to the dominant line of action rather than the X-Y distances measured directly from the MRI slice images. Again, using the muscle

McGill et al.: Measurement of trunk musculature 173
Table 1. Cosines of muscle line of action with respect to the anatomical axes of the torso obtained from the literature
Muscle (source) Y (ant-post)
cosine Z (sup-inf)
cosine X (lateral)
cosine
Rectus abdominis (Dumas3)
Lat dorsi (Dumas3)
lliocostalis pars thoracis (Dumas3)
lliocostalis pars lumborum (Macintosh’al Ll-2 0.198 0.973 0.119 L2-3 0.288 0.962 0.096 L3-4 0.339 0.932 0.127 L4-5 0.325 0.909 0.260
Longissimus pars thoracis (Dumas3)
Longissimus pars lumborum (Macintosh’s)
Quad lumborum (Dumas3)
Psoas (Santaguida”)
External oblique (Dumas3)
Internal oblique (Dumas3)
Multifidus (Macintosh” b)
Ll-2 0.163 0.979 0.122 L2-3 0.240 0.960 0.144 f-3-4 0.481 0.843 0.241 L-5 0.649 0.699 0.300 L5-Sl 0.727 0.582 0.364
T12-L1 -0.197 0.940 -0.201 b-2 -0.245 0.899 -0.348 L2-3 -0.259 0.870 -0.393 L3-4 -0.212 0.805 -0.535 b-5 -0.074 0.486 -0.821
Ll-2 0.135 0.978 0.135 L2-3 0.229 0.964 0.125 L3-4 0.086 0.988 0.119 L4-5 0.084 0.990 0.117 L5-Sl 0.079 0.992 0.098
L3-4 -0.374 0.859 0.155 L4-5 -0.495 0.905 0.209
L3-4 0.299 0.785 0.328 L4-5 0.188 0.949 0.231
Ll-2 -0.094 0.944 0.315 L2-3 -0.071 0.919 0.389 L3-4 0 0.933 0.361 L4-5 0.236 0.943 0.236 L5-Sl 0.383 0.920 0.077
0.078
0.204
-0.035
-0.003
0.993
0.911
0.977
0.997
0.070
0.357
0.204
0.061
Sources: Dumas: Dumas et aL3 using seven male cadavers, mean age 55.6 yrs, height 163.6 cm. Note that these cosines were subject averages, so that the unit vector sum may not equal unity exactly. Macintosh a: Macintosh and Bogdukg using five cadavers and radiographs from 21 living subjects. Macintosh b: Macintosh and Bogduk” using five cadavers and radiographs from 21 living subjects. Santaguida: Santaguida” using model results from serial MRI (15 subjects) combined with dissection data from seven cadavers.
fibre unit vector cosines, true muscle moment arms were estimated from the triple scalar product:
Results
MA = ;.
rk 2. Fk
L;, Gj r/k (2)
A series of MRI scans from a sample subject illustrating the geometrical changes of the muscle groups from Ts to the mid-pelvis level is shown in Figure 1, while a 3- dimensional composite of the same subject is shown in Figure 2.
where MA:
ri, rj, rk :
Fi, Fi, Fk :
ui, uj, uk 1
corrected moment arm (perpen- The uncorrected cross-sectional areas and ant.-post. dicular distance to the fibre line and lateral moment arms (directly from the transverse of action) (mm*); scans) are listed in Tables 2-4 to facilitate quantitative distance (mm) from the disc comparison between vertebral levels and between the centroid to the muscle centroid data of other studies that only listed uncorrected data measured from the scan slice; measured directly from serial slices. In certain subjects, unit vector of muscle fibres line individual muscles could not be distinguished from the of action; functional-anatomical group of muscles such that unit vector of the orthopaedic values for the abdominal wall (external and internal axis (flexion-extension (1 ,O,O) oblique, transverse abdominis, and labelled ‘a’ in or lateral bend (O,l,O). Figure 2), and erector mass (multifidus, iliocostalis

174 Clin. Biomech. 1993; 8: No 4
Figure 1. Transverse scans of one subject (supine) at the levels of a, T9; b, L,; c, L,; d, S,, showing the musculature in cross-section.
lumborum, longissimus thoracis, and labelled ‘b’ in Figure 2) are also shown.
The uncorrected muscle centroids with respect to the corresponding disc centroid as a function of vertebral level are displayed in Figure 3 to convey the geometrical changes at the various spinal levels. The rectus abdominus increases its anterior mechanical advantage in the upper lumbar region, which appears to be due to the increasing posterior position of the vertebral column when moving superiorly through the lumbar-thoracic region. The abdominal wall appears to decrease its anterior moment arm over the mid- lumbar region, although this will be modulated by differing vector cosines and architectural factors. The spine extensors of longissimus thoracis and iliocostalis lumborum increase their lateral moment arm in the upper lumbar and thoracic regions. The lateral moment arm of latissimus dorsi increases while the posterior moment arm decreases simultaneously when moving superiorly from the L3 level toT6. The lateral moment arm of quadratus lumborum decreases from L4 to T12, although vector cosine data of Dumas et a1.3 would suggest that this may be functionally incorrect.
Figure 2.3-D composite of the same subject as in Figure 1, illustrating the changing geometry of the musculature as a function of vertebral level. The abdominal wall (external and internal oblique, transverse abdominis) is labelled ‘a’ and the erector mass (multifidus, iliocostalis lumborum, longissimus thoracis) is labelled ‘b’.

McGill et al.: Measurement of trunk musculature 175
Table 2. Raw cross-sectional areas (mm*) (standard deviation in parentheses) measured directly from the MRI scans
M"sc,es L5 L4 L3 L2 Ll Tl? 711 710 79 78 77 TS TS
787 ,250) 802 l247l
119 122, 175 157,
1104 ,393) 1146 ,377)
750 1207, 746 ,181, 915 11991 992 12761 903 I631 900 1115, 237 WI 224 1461
2412 14191 2420 14761
905 (331, 966 (336, 1606 (1961 ,590 (2441
1360 (2761
52912191231
2151 (533) 2234 (476) 1661 (347, 1820 (272, 725 ,209) 625 12491 1459 (270)
51613,9&25,
670 ,133) 693 11771 1276 1,711 1335 ,213, 1515 ,317) 1424 (3101 356 11101 376 ,115,
3269 (422, 3329wa, 747 ,162) 762 ,129, 1368 ,341, 1395 ,223) 447 ,271, 472 ,269, 232 ,192, 256 ,217,
2631 (456, 2933 ,362, 1594 (369) 1593 (291, 701 (212, 746 (167, 1415 ,249,
54266,6702,
712 ,239, 576 (1511 746 ,240, 514 ,991 ,158 (222, 1351 ,282) 1055 ,173) 1027 ,342) 696 (601 646 ,163)
3051 ,463, 3111 (556, 1175 ,370) 1246 1228, 1069 ,251) 1160 1194, ,104 ,I*,, IIS, 1316, 1150 ,196, 1156 ,247, 343 ,176) 230 ,961 366 ,157) 324 ,951 429 ,202, 717 ,260, 372 ,161, 662 1260,
2654 ,547, 2615 MO51 2633 ,456, 2723 (426, 1177 ,265) 513 13291 1211 1296, 466 1250, 552 ,192, 392 1249, 614 ,169, 4w ezo, 1332 (294, 1334 ,265,
55634t6112, 5909116899,
1095 1222) 936 149, ,258 13471 938 ,211 921 ,339, 556 ,234, 6351400, 551 ,170) 269 (66, 331 ,691 361 ,901 312 197, 312 (76, 327 160, 353 ,531 355 173, 1014 c264I 1254 12611 1366 ,330, 1456 1269, 1561 11591 1764 1269, 1676 ,432, 2477 ,246, 960 1310, ,102 1316, 1239 ,257, 1417 (293, 1562 12611 1697 1169, 2013 ,422, 2696 ,721,
2614 ,584, 1632 1262, ,690 ,210, 1413 (304, 1049 12011 642 ,165, 777 ,169) 743 ,701 2601 ,559, 2041 1265, 1722 ,273, 1471 (351, 1129 /lOO, 979 ,114, 779 1951 675 (761 330 1210, 462 ~1901 320 (197, 325 15, 1241 ,166, 1133 (124, 1015 ,125) 933 (112, 798 191, 797 (104) 741 (801 671 (621
6328719153, 59249,7272, 61051l7570, 6173216960, 657W52541 6776213962, 66410(2372, 6333X2233,
*Abdominal wall includes external and internal oblique and transverse abdominis. **Erector mass includes longissimus thoracis, iliocostalis lumborum, and multifidus.
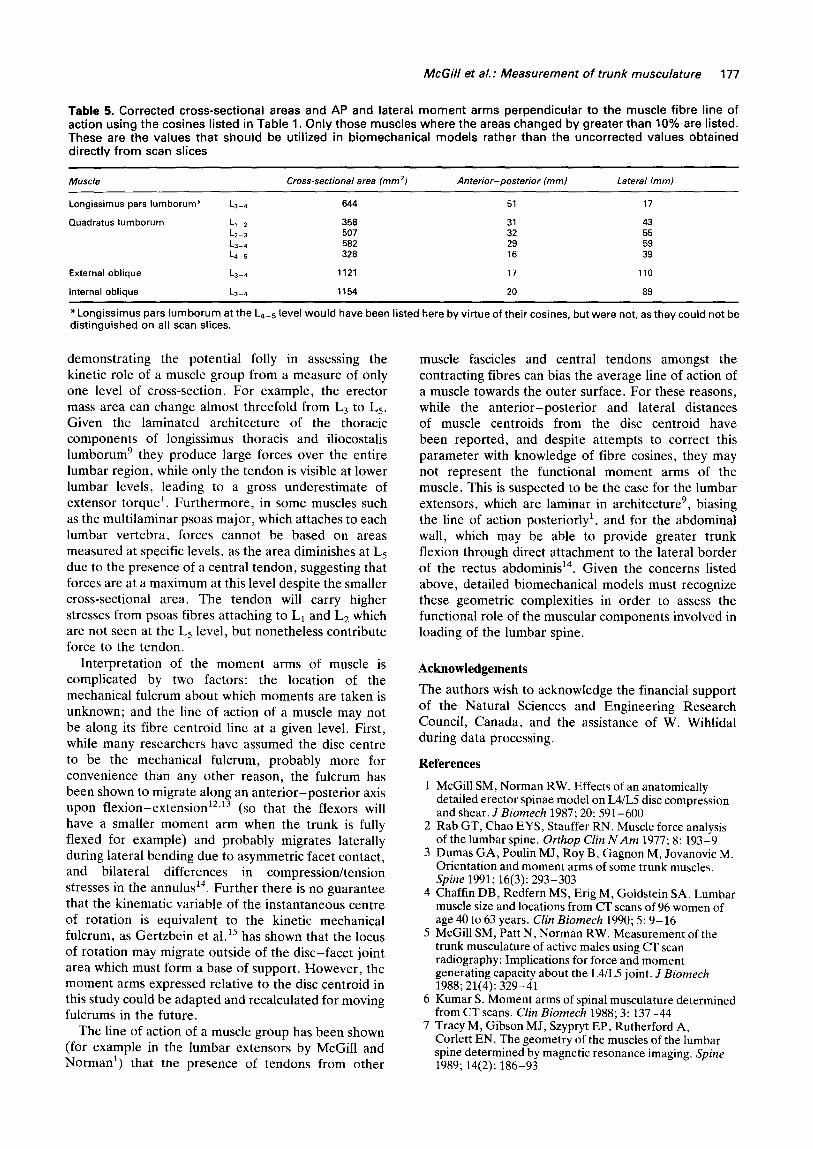
Cross-sectional areas and perpendicular moment arm distances of those muscles where the cosines between their line of action and the perpendicular to the scan slices cause the correction to exceed 10% are listed in Table 5. The decreases in physiological area and moment and arm distances, once corrected by the line of action cosine, were largest in the abdominal wall (at least at the L3-L4 level) and lower lumbar levels of longissimus thoracis pars lumborum.
Discussion
Limitations The purpose of this paper was to contribute to the growing database on trunk muscle geometry. The interpretation of the data presented here is limited by the supine posture of the subjects in the MRI unit, which may cause shifting of soft tissues. Further, the location and shapes of muscle mass will probably
change with changes in posture6. In addition, while good quality MRI units provide state-of-the-art images, it is still not always possible to resolve the boundaries between various soft tissues and muscle sheaths. For example, the cross-sectional area of the psoas, at the level of T12 was measured to be larger on the right side of the body. One would suspect that this difference is due to the crural ligament of the diaphragm that is much larger on the right side and often extends down to L1l? Further, it was difficult to separate the multifidus, longissimus, and iliocostalis at lower lumbar levels so that the area of the total erector mass was also reported. Note that the areas reported for the erector mass and the abdominal wall (external and internal oblique, transverse abdominis) are slightly larger than the sum of the areas of their components, due to the inclusion of intermuscular spaces within the bulk of the functional group.
Table 3. Raw lateral (Xl distances (mm) between muscle centroids and intervertebral disc centroid (standard deviation in parentheses)
MU*C,eS L5 L4 L3 LZ Ll TL? 711 710 T9 78 TI Tl? T5
R. Rectus abdaminis 32i5, 38 17, 43 (7) 46 18, 37 C6, L. Rectus abdominis -3316, -35 (7, -38 (6) 43 0, -35117, R. Enernal oblique 125113, 130,lO) 140 (51 L. External oblique -120 19, -125 (9, -133 (7, R Internal oblique 109,11, 116 (6, 123 19, L. Internal Oblique -103 (91 -112 (6) -121,ll) R. Transverse abdomfnis 9911, 108,111 112 (9, 117 (9, L Transverseabdom~n~s -10111, -101 191 -107 (7, -109 19, R. Abdominal wall* 102181 113112) 119 18, 123 (91 L.Abdom~“alwall* -102,9, -116,14) -114 (7, -120 19)
R. Lo”glss”n”sfhor 22 14, 32 121 32 I61 30 12, 29 (1, L. Longissimusthor. -19 15) -30 161 -37112) -34 I41 -36 (7) R Iliocostalis Numb. 52 141 5% 141 66,10, 65 (7, 61 (4, L. lliocastalislumb. 46 161 60110, -65 (91 -67 171 -67,11, R. Multifidus 11 Ill 13 14, 13 (31 10 131 8 (21 11 12, 12 (2, L. Multifidus -14 (7) -12 (3, -11 (3, -11 121 -12 (2, -12 12, -15110, R. Latissuwsdorsi 102 18, 108 (8, 122c121 129f10, 129 (9, 140 (9, 141 (9) 145 171 146 17, 155 (7, 153 L. Latitsimus dew
14, -1Wl15, -107 19, -117Ul) -126 17, -129flOl -137 19, -139 18, -143 16, -147,101 -153 -151
R. Erector “MES” 22,61 34 (7, (5, (5,
40 (4, 42 (41 44 15, 42 13, 34 I41 34 14, 32 (41 31 17, 30 141 25 (5, 27 L Erector “lass** -21,5) -33 (6, -38 (5,
12, 41 (6, -41 (7, 40 14, 40 (31 -36 (31 -35 (4, -33 161 -31 12, -29 (3) -27
54,41 161
6. PSOBE 50 (3, 44 (3, 39 (21 32 (3, 32 131 L. Pscas -54(5, A6 14, -42 (3, -38 (3, -31 (3, -32 ,a 6. Ouadratus lhmb. 61 151 75 (6, 63 (5, 46 (6, 46/111 L. hadratus lumb. -76(12) -73 (4) -64 (5, -50 161 47 I51
Total area O(2) 1 (3, -2 (41 -1 (31 -1 14, 0 13, 1 (3, 0 121 0 (2, 2 Ill 2 (1, 1 (3, 2 (31
*Abdominal wall includes external and internal oblique and transverse abdominis. **Erector mass includes longissimus thoracis, iliocostalis lumborum, and multifidus.
176 Clin. Biomech. 1993; 8: No 4
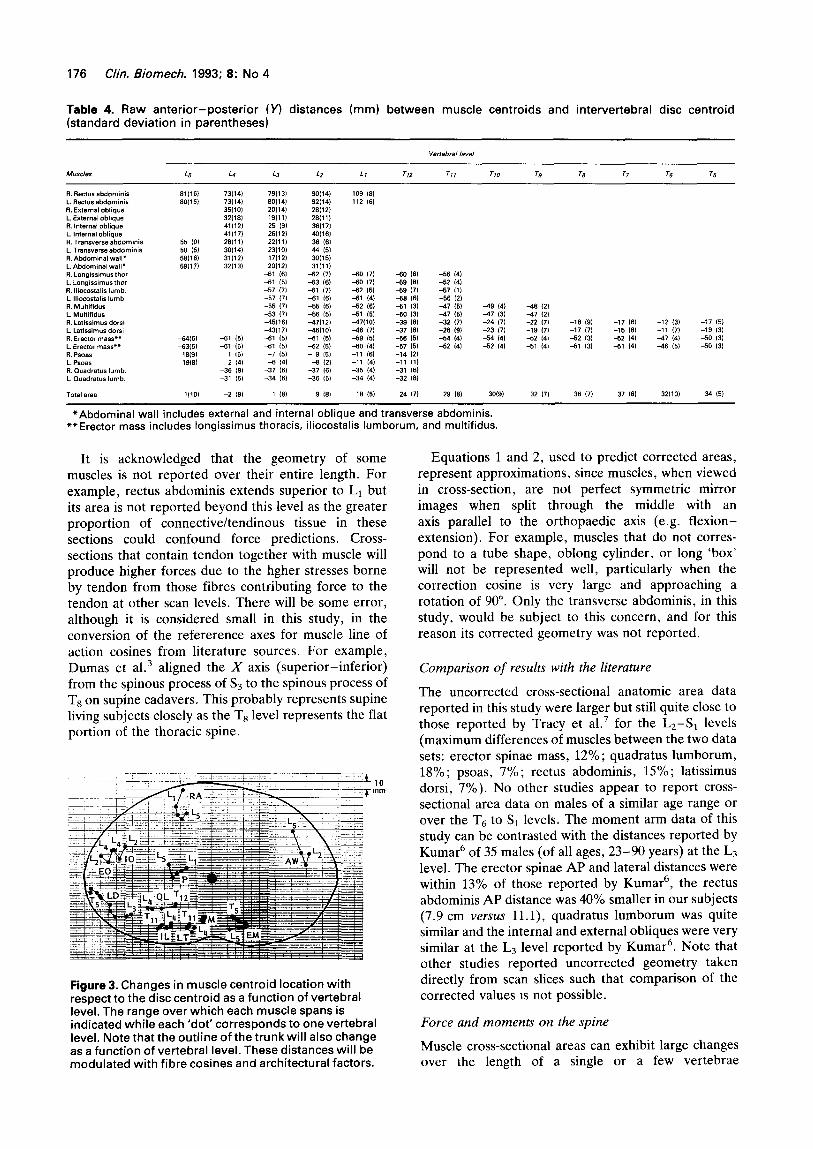
Table 4. Raw anterior-posterior (VI distances (mm) between muscle centroids and intervertebral disc centroid (standard deviation in parentheses)
R. Rectusabdomlnis L. Rwclus abdominls R. External oblique L. Exlernal oblique FL Internal oblique I_. Internal oblique R. Transverse abdomlnis L. Transverse abdominis R. Abdominal waII* L. Abdominal wall* R. Lo”glosim”s tllor L. Longissimusthor. R. lliocostalis lumb. L. Iliocostalis lumb. R. M”ltifid”s L. Multifidus R. Latissimusdorsl L. Latissim”s dorrl R. ErectotmaJs” L. Erector Inas*** Ft. Psoas L. Psoas R. 0”adrat”s lumb. L. Quadratus lumb.
55 101 50 151 5Sl16) 591171
446) -63(5l
18cSl 19w
l(10)
73,141 ?3/14l 35(101 321191 41112~ 4,117) 261111 3Oll.l) 31112) 32113)
79,131 *0,14, 20114, 191111 25 01 26112l 22111, 23,101 1?,12) 2Ol12l
a1 I61 -61 I51 -57 (7, -57 (7, -55 (7) -53 0) 45(161 -43l17) a1 (5) a1 (5)
-7 151 4 (41
-37 ,6, -34 161
1 IS)
90,14, 92114, 29,12, 29,ll b 36117, 40(16, 36 (61 44 I51 3OU6, 3lUl1
62 (7) -63 16) -61 (7) -61 (6) -66 16) -66 15, 4,112, 46110, 41 151 62 I51 - 9 15)
-6 I21 -37 16) -36 (6,
9 (61
109 (61 112 (6)
40 /?I bo (7) 62 151 bl 141 -52 161 -5l 151 -l7(1Ol A6 (71 -59 (51 40 141 -11 (61 -11 ,4, -35 (4, -34 (4)
16 15)
-60 16) -69 18) 49 (7) 46 (6) 51 (3) -50 13) -39 (91 -37 (81 -56 (51 -57 (51 -14 (21 -11 (1) -31 16) -32 (8)
-56 14) -52 14) -57 ,I) -56 12) 47 15) 49 (41 46 (21 47 (5) -I? (31 47 (21 -32 I?) -24 (7) -22 17) -16 I91 -17 16) -28 19) -23 (7) -IS 17) -17 (7) -15 (6) -54 141 -54 (4) 52 (4) -52 (31 52 14) 52 14) -52 (41 -51 (4) -51 (31 51 141
-12 13) -17 (5) -11 (7) -19 13) 47 (4) -50 (3) -46 151 -50 I31
24 (7) 29 03) 30(S) 32 (7) 36 (7) 37 161 32(101 34 (5)
*Abdominal wall includes external and internal oblique and transverse abdominis. **Erector mass includes longissimus thoracis, iliocostalis lumborum, and multifidus.
It is acknowledged that the geometry of some muscles is not reported over their entire length. For example, rectus abdominis extends superior to L1 but its area is not reported beyond this level as the greater proportion of connective/tendinous tissue in these sections could confound force predictions. Cross- sections that contain tendon together with muscle will produce higher forces due to the hgher stresses borne by tendon from those fibres contributing force to the tendon at other scan levels. There will be some error, although it is considered small in this study, in the conversion of the refererence axes for muscle line of action cosines from literature sources. For example, Dumas et a1.3 aligned the X axis (superior-inferior) from the spinous process of S3 to the spinous process of Ts on supine cadavers. This probably represents supine living subjects closely as the Ts level represents the flat portion of the thoracic spine.
i 10 Tmm
Figure 3. Changes in muscle centroid location with respect to the disc centroid as a function of vertebral level. The range over which each muscle spans is indicated while each ‘dot’ corresponds to one vertebral level. Note that the outline of the trunk will also change as a function of vertebral level. These distances will be modulated with fibre cosines and architectural factors.
Equations 1 and 2, used to predict corrected areas, represent approximations, since muscles, when viewed in cross-section, are not perfect symmetric mirror images when split through the middle with an axis parallel to the orthopaedic axis (e.g. flexion- extension). For example, muscles that do not corres- pond to a tube shape, oblong cylinder, or long ‘box’ will not be represented well, particularly when the correction cosine is very large and approaching a rotation of 90”. Only the transverse abdominis, in this study, would be subject to this concern, and for this reason its corrected geometry was not reported.
Comparison of results with the literature
The uncorrected cross-sectional anatomic area data reported in this study were larger but still quite close to those reported by Tracy et al.’ for the L2-S1 levels (maximum differences of muscles between the two data sets: erector spinae mass, 12%; quadratus lumborum, 18%; psoas, 7%; rectus abdominis, 15%; latissimus dorsi, 7%). No other studies appear to report cross- sectional area data on males of a similar age range or over the T6 to S1 levels. The moment arm data of this study can be contrasted with the distances reported by Kumar6 of 35 males (of all ages, 23-90 years) at the L3 level. The erector spinae AP and lateral distances were within 13% of those reported by Kumar6, the rectus abdominis AP distance was 40% smaller in our subjects (7.9 cm uersuS ll.l), quadratus lumborum was quite similar and the internal and external obliques were very similar at the L3 level reported by Kumar6. Note that other studies reported uncorrected geometry taken directly from scan slices such that comparison of the corrected values 1s not possible.
Force and moments on the spine
Muscle cross-sectional areas can exhibit large changes over the length of a single or a few vertebrae
McGill et al.: Measurement of trunk musculature 177
Table 5. Corrected cross-sectional areas and AP and lateral moment arms perpendicular to the muscle fibre line of action using the cosines listed in Table 1. Only those muscles where the areas changed by greater than 10% are listed. These are the values that should be utilized in biomechanical models rather than the uncorrected values obtained directly from scan slices
Muscle Cross-sectional area (mm21 Anterior-posterior (mm) Lateral (mm)
Longissimus pars lumborum*
Quadratus lumborum
External oblique
Internal oblique
k-4
L1-2 L2S3 L3-4 L-5
L3-4
L-4
644
358 507 582 328
1121
1154
51
31 32 29 16
17
20
17
43 55 59 39
110
a9
* Longissimus pars lumborum at the L4-5 level would have been listed here by virtue of their cosines, but were not, as they could not be distinguished on all scan slices.
demonstrating the potential folly in assessing the kinetic role of a muscle group from a measure of only one level of cross-section. For example, the erector mass area can change almost threefold from L3 to Lg. Given the laminated architecture of the thoracic components of longissimus thoracis and iliocostalis lumborum’ they produce large forces over the entire lumbar region, while only the tendon is visible at lower lumbar levels, leading to a gross underestimate of extensor torque’. Furthermore, in some muscles such as the multilaminar psoas major, which attaches to each lumbar vertebra, forces cannot be based on areas measured at specific levels, as the area diminishes at L5 due to the presence of a central tendon, suggesting that forces are at a maximum at this level despite the smaller cross-sectional area. The tendon will carry higher stresses from psoas fibres attaching to L1 and L, which are not seen at the L5 level, but nonetheless contribute force to the tendon.
Interpretation of the moment arms of muscle is complicated by two factors: the location of the mechanical fulcrum about which moments are taken is unknown; and the line of action of a muscle may not be along its fibre centroid line at a given level. First, while many researchers have assumed the disc centre to be the mechanical fulcrum, probably more for convenience than any other reason, the fulcrum has been shown to migrate along an anterior-posterior axis upon flexion-extension12313 (so that the flexors will have a smaller moment arm when the trunk is fully flexed for example) and probably migrates laterally during lateral bending due to asymmetric facet contact, and bilateral differences in compression/tension stresses in the annulus14. Further there is no guarantee that the kinematic variable of the instantaneous centre of rotation is equivalent to the kinetic mechanical fulcrum, as Gertzbein et a1.15 has shown that the locus of rotation may migrate outside of the disc-facet joint area which must form a base of support. However, the moment arms expressed relative to the disc centroid in this study could be adapted and recalculated for moving fulcrums in the future.
The line of action of a muscle group has been shown (for example in the lumbar extensors by McGill and Norman’) that tne presence of tendons from other
muscle fascicles and central tendons amongst the contracting fibres can bias the average line of action of a muscle towards the outer surface. For these reasons, while the anterior-posterior and lateral distances of muscle centroids from the disc centroid have been reported, and despite attempts to correct this parameter with knowledge of fibre cosines, they may not represent the functional moment arms of the muscle. This is suspected to be the case for the lumbar extensors, which are laminar in architecture’, biasing the line of action posteriorly’, and for the abdominal wall, which may be able to provide greater trunk flexion through direct attachment to the lateral border of the rectus abdominis14. Given the concerns listed above, detailed biomechanical models must recognize these geometric complexities in order to assess the functional role of the muscular components involved in loading of the lumbar spine.
Acknowledgements
The authors wish to acknowledge the financial support of the Natural Sciences and Engineering Research Council, Canada, and the assistance of W. Wihlidal during data processing.
References
McGill SM, Norman RW. Effects of an anatomically detailed erector spinae model on L4/L5 disc compression and shear. J Biomech 1987; 20: 591-600 Rab GT, Chao EYS, Stauffer RN. Muscle force analysis of the lumbar spine. Orthop Clin N Am 1977; 8: 193-9 Dumas GA, Poulin MJ, Roy B, Gagnon M, Jovanovic M. Orientation and moment arms of some trunk muscles. Spine 1991; 16(3): 293-303 Chaffin DB, Redfern MS, Erig M, Goldstein SA. Lumbar muscle size and locations from CT scans of 96 women of age 40 to 63 years. Clin Biomech 1990; 5: 9-16 McGill SM, Patt N, Norman RW. Measurement of the trunk musculature of active males using CT scan radiography: Implications for force and moment generating capacity about the L4/L5 joint. J Biomech 1988; 21(4): 329-41 Kumar S. Moment arms of spinal musculature determined from CT scans. Clin Biomech 1988; 3: 137-44 Tracy M, Gibson MJ, Szypryt EP, Rutherford A, Corlett EN. The geometry of the muscles of the lumbar spine determined by magnetic resonance imaging. Spine 1989; 14(2): 186-93
178 Clin. Biomech. 1993; 8: No 4
8 Engstrom CM, Loeb GE, Reid JG, Forrest WJ, Avruch L. Morphometry of the human thigh muscles. A comparison between anatomical sections and computer tomographic and magnetic resonance images. JAnat 1991; 176: 139-56
9 Macintosh JE, Bogduk N. The attachments of the lumbar erector spinae. Spine 1991; 16(7): 783-92
10 Santaguida P. The Psoas Major Muscle: A three- dimensional anatomical and mechanical study with respect to the spine. M.Sc. Thesis, University of Waterloo, Waterloo, October 1991
11 Macintosh JE, Bogduk N. The biomechanics of the lumbar multifidus. Clin Biomech 1986; 1: 205-13
12 Rolander SD. Motion of the lumbar spine with special reference to the stabilizing effect of posterior fusion. An experimental study on autopsy specimens. Actu Orthop Scund 90, 1966; [Suppl.]
13 Klein JA, Hukins DWL. Relocation of the bending axis during flexion-extension of lumbar intervertebral discs and its implications for prolapse. Spine 1983; 8(6): 659-64
14 McGill SM. A myoelectrically based dynamic 3-D model to predict loads on lumbar spine tissues during lateral bending. J Biomech 1992; 25(4): 395-414
15 Gertzbein SD, Holtby R, Tile M, Kapasouri A, Chan KW, Cruickshank B. Determination of a locus of instantaneous centres of rotation of the lumbar disc by Moire fringes: a new technique. Spine 1984; 9(4): 409-13
EUROPEAN SPINE SOCIETY 4TH ANNUAL MEETING
Ruhr University, Bochum, Germany 16-18 September 1993
This meeting will be based on free papers with some special preferred topics and the official language will be English. Topics to be covered will include:
??Cervical and lumbar disc surgery ??Post-traumatic disorders and deformities ??Conservative treatment including back school and manual therapy
of the neck and back ??New developments in spinal surgery
The Acromed Prize will be presented for the best original paper on any aspect of spinal disease and research. For further information regarding the final programme and registration details please contact the Organizing Committee at the following address: Orthopgdische Universitatsklinik, St-Josef-Hospital, Gundrunstrahe 56,463O Bochum, Germany. Tel: + 49 (0) 234 509 2526 or 3132; Fax: + 49 (0) 234 509 2525 or 3132.