
A t5\L 0 0 - International Nuclear Information System (INIS)
169
INlS-mf—12585 A t5 \L 0 0 LABELLING OF OLIVE OIL WITH RADIOACTIVE IODINE AND RADIOACTIVE TECHNETIUM By OMAR A. F. AL-DAYEL This Dissertation has been examined and accepted for M.Sc. degree on 1st. March 1988- Supervisors: Name Signature Supervisor : prof. H. A. El-Garhy C -supervisor: soc. Prof. A. A. Al-Suhybani Committe members: Name Signature Prof. M. A. El-Garhy M- Asoc. Prof. S. H. Al-Khowaiter : Prof. M. E. Abdullah
-
Upload
khangminh22 -
Category
Documents
-
view
2 -
download
0
Transcript of A t5\L 0 0 - International Nuclear Information System (INIS)

INlS-mf—12585 A t5\L 0 0
LABELLING OF OLIVE OIL WITH RADIOACTIVE IODINE
AND RADIOACTIVE TECHNETIUM
By
OMAR A. F. AL-DAYEL
This Dissertation has been examined and accepted for M.Sc. degreeon 1st. March 1988-
Supervisors:
Name Signature
Supervisor :
prof. H. A. El-Garhy
C-supervisor:
soc. Prof. A. A. Al-Suhybani
Committe members:
Name Signature
Prof. M. A. El-Garhy M-
Asoc. Prof. S. H. Al-Khowaiter :
Prof. M. E. Abdullah

LABELLING OF OLIVE OIL WITH RADIOACTIVE IODINE
AND RADIOACTIVE TECHNETIUH
THIS DISSERTATION IS SUBMITTED IN PARTIAL FULFILMENT OF
THE REQUIREMENTS FOR THE MASTER'S DEGREE IN THE DEPARTMENT OF
CHEMISTRY AT THE COLLEGE OF SCIENCE, KING SAUD UNIVERSITY.(1988)

D E D I C A T I O N :
To my parents, my wife, and my son.

ACKNOWLEDGEMENTS
I wish to acknowedge the generous guidance, advice and help that Ireceived from Professor M. El-Garhy, and Associate Professor Abdulaziz A.Alsuhaibani, who also supervised my research.
I would also like to thank the head of the department and members ofthe staff of Chemistry Department, College of Science, King SaudUniversity.
I am also indebted to. my brother Dr. Mohammed, who helped me andconsistently during the writing of this thesis.
I appreciate the consistent support from all the members of theDirectorate of Atomic Energy, King Abdulaziz City for Science andTechnology (KACST), especially the head of the departmentDr. Abdulrahman Melibary for his valuable advices.
I give special thanks to the Nuclear Medicine department in King
Khalid University Hospital for their help in providing the Tc used inthis work.
I wish to acknowledge the vital role of the Directorate of InformationSystems and Technical Services, King Abdulaziz City for Science andTechnology (KACST) in providing me quickly and precisely the neededreferences.

C O N T E N T S
Page
List of Tables ... ••• ••• i
List of Figures ... .... ... ;;J
Aimz of this work ... ... ... v
Summary ... ... ... ... Vl
CHAPTER 1 : GENERAL INTRODUCTION
1.1 Genera 1 ... ... . . 2
1.2 A r t i f i c i a l Radioisotopes . . . . . . . 5
1.2.A.a. Reactor Produced Isotopes . . . . . . 6
1.2.A.b. Some Theori t ical Aspects of Radioisotope Production 9
1.2.A.C Practical Aspects of Reactor Irradiat ions . . . 12
I.2.B. Accelerator Produced Radioisotopes . . . 13
I.2.C. Radioisotope Generator Systems . . . 15
1.3 Methods of Labelling of Organic Compoundswith Radioactive Iodine Isotopes . . . 18
1.*» 0 1 i v e 0 i 1 . . . . . . 2k
1.5 Historical Cascade of Radioactive Iodine FattyAcids Labelling . . . . . . 27
1.6 Iodine Isotopes and Labelled Compounds . . . 33
CHAPTER 2 : EXPERIMENTAL AND RESULTS
2.1 The iodine Monochloride Method . . . . . . kl

Page
2.2 Label l ing of Oil wi th Inact ive IodineMonochloride Method kk
2.3 Label l ing of Oil with Radioactive Iodine
Monochloride Method . . . 51
2.4 Labell ing of Oil with Chloramine-T Method . . . 59
2.5 Quali ty Control Systems . . . . . . 59
CHAPTER 3 : DISCUSSION AND CONCLUSIONS
3.1 Label 1 ing of 01ive Oil and 01iec Acid w i thIodine Monochloride Method . . . 78
3-2 Label l ing of Olive Oil and 01iec Acid withChloramine-T Method . . . 82
CHAPTER 4 : LABELLING OF OIL WITH 99 lTc
4.1 Introduction ... ... ... 86
4.1.1 Generator Fundamentals ... ... 86
'••I.2 Technetium-99m Milking System . 93
A.1.3 Methods for Separation of ""Vc ... 96
4.1.4 Comparison of Tc Generator Forms ... 97
4.1.5 Use of 99mTc in Labelling ... ... 101
4.2 Experimental and Results ... 103
4.2.1 Preparation and Control of 9mTc ... 104
4.2.2 Determination of Radiocontaminants in Old
99mTc Generators ... 110
4.2.3 Quality Control by Thin Layer Chromatographyand Paper Chromatography ... ... 120

Page
k.2.k Labelling of Olive Oil by " m T c 138
*».2.5 Labelling of Olive Oil by Reduced9 9 m T c 138
R E F E R E N C E S ... ... T»3

L I S T OF TABLES
T A B L E Paae
1. Nuclear Data for Iodine Radionuciides Used
in Nuclear Medicine ... . k
2. Some Common Radioactive Milking Pairs ... 17
3. Methods of Labelling ... ... 22-23
h. Olive Oil Components ... ... 2k
5. Relative Weight of Olive Oil Expressed asPercentage Body Weights of Rats Fed with01ive Oil ... ... 25
6. Principal Fatty Acids of Myocardium of RatsFed with Olive Oil . . . . . . 26
7. Examples of Compounds Labelled with lodine-125and Their Application(s) . . . 35"36
8. Reactions Realized by the Use of an i??Accelerator (Production of |) 37
9. Reactions Realized by the Use of an
Accelerator (Production of 1 2 5 l ) . . . 38-39
10. Reactions Realized in a Nuclear Reactor
(Productionof 1 3 1 | ) kO
1 1 . The U l t r a V i o l e t Spectrum Stud ies f o rL a b e l l i n g O l i ve O i l . . . . . kB-hS
12. Distribution Coefficient of IC1Between Aquous Layer and Organic Layer 52
13- Wave Lengths of Maximum Absorption inDifferent Solvents ... ... 57

I I
Page
1^-16 Th in- layer Chromatography Results 66-68
17. Change of A c t i v i t i e s w i th Time in Aloo mci
^9Mo Generator . . . . . . . 88
18. Nuclear Data f o r Technetium . . . 90
19. Radioactive Isotopes Produced on I r r a d i a t i n gStable Molybdenum in Nuclear Reactor 9*t
20. Compounds Label led by " m T c . . . 102
2 1 . Standard L ib ra ry (Option) . . . 106
22-2A The Radiocontaminants of Old Molybdenum-
Technetium Generators ... 111-113
25-26 Thin-layer Chromatography Results .. 121
27- Paper Chromatography Results ... 121
28. The Rf Values for "m T c in DEE Medium 133
29- The Rf Values for the ""Vc in Acetone Medium 13^30. Label l ing Y ie l d o f Ol ive Oi l by " " V c O ^ 139

LIST OF FIGURES
Figure Page
1. Anular Number of Patients Investigated by
by Nuclear Medicine in (KKUH) .. ... 3
2. Production of lodine-131 ... ••• 8
3. Decay Scheme of 1 2 3I ... ... 37
4. Decay Scheme of 1 2 5I ... ... 39
5. Decay Scheme of 131| ... ... ^0
6 - 1 6 The Ultra Violet Spectrum Studies for Labelling
Olive Oil ... ... ... 47-50
17- Labelling of Olive Oil with IC1 ... ... 54
18. Labelling of Oleic Acid with IcL . ... 55
19. Labelling of Oleic Acid with Commerical 1C1 — 56
20. Wavelength of Maximum Absorption of IC1 ... 58
21. Labelling of Olive Oil with CAT ... ... 60
22. Labelling of Oleic Acid With CAT ... ... 6l
23*33 IR-Spectrum Results ... ... ... 71-7634. Theoritical Growth and Decay of "Vc in Pure
Parent 9 9Mo ... ... ••• 89
35. The Decay Scheme of " m T c ... ... 91
36. The Decay Scheme of " m M o ... ... 91
37. Linearity Curve ... — ... 107
38. The Spectrum of 33mTc ... ... ... 108

IV
Page
39. The Half-life Curve of " m T c ... ... 104
40-45 Composite Decay Curves of Old Molybdenum-
Technetium Generators ... ... 114-119
46-55. Paper Chromatography Analysis ... ... 123-132
56. Labelling Yield of Olive Oil in DEE ... 141
57. Labelling Yield of Olive Oil in Acetone ... 142

THE AIM OF THIS WORK
LOive oil is composed of many fatty acids, some are saturated and
others are unsaturated. Oleic acid and linolic acid are the most
important two unsaturated fatty acids. Stearic Acid and Palmitic acid
are the most important two saturated fatty acids.
The composing fatty acids, and hence the olive oil, is an
important source of energy for many cells in the body Labelling of
ioc 99mthis oil with radioactive isotopes as IZ-M and Tc helps to study the
metabolism of fats in the body. The labelled oil can be used, as well,
for diagnostic purposes in nuclear medicine and many other medical and
biological purposes.
The ease of giving olive oil in the normal diet, and that it is
free of toxic effect shows the importance of its labelling to be used in
diagnostic and study purposes.

S U M M A R Y
This thesis is composed of two par t s :
Pa «*t 1 : In this part studies related to labelling of olive oil with
125-iodine were carried out.
1251. I was chosen because of its long half-life to represent the
123most widely used I the short-lived one.
2. As the olive oil used in this work contains more than 50% as oliec
acid the latter was investigated as a monitor to the labelling
techniques used.
Among the different methods reported in the literature for labelling
with iodine i the two methods used and applied in this investigated work
were the iodine monochloride method (IC1) and the chloramine-T method.
On labelling using the IC1 method to investigate the labelling,
inactive work was carried first, followed by radioactive work. Using
the IC1 method a yield of >1Q% was found in case of diethyl ether (DEE)
as solvent and at 5 minutes reaction period, for olive oil while it is >8(&
in case of oleic acid under the same conditions. In case of benzene as
solvent the labelling yield reaches a maximum labelling of 37% and >43%
in case of olive oil and oleic acid after 60 minutes reaction period,

vi
after which labelling decrease with time, which may reflect the more
stable the complex of ICl-CgHg than the oil-iodine.
When using CAT a maximum labelling yield of 28% in case of olive
oil in the n-heptane solvent against 50$ labelling yield of oleic acid
under the same conditions of solvent, temperature and reaction time.
When using acetone as solvent it was found that the labelling yield
decreases with reaction time.
Thin layer chromatography technique was applied to determine the
labelling yield.
As a result of IR studies the labelling took place at the double
bond.
Part 2 : In this part , labelling of olive oil with the radioactive
9 9 mTc was studied as well as the radio analytical study for 99Mo- 9 9 m Tc
generator.
It was tried, then, to labell olive oil with the milked 9 9 m Tc. The
results gave a very low labelling percentage yield (only 1.8% ) in
acetone medium. Labelling was tried again using a reducing agent,
SnCl0.2H0O. Labelling yield percentage was compared to the quantityLi it
of the reducing agent in two different media (the acetone and the

VI I I
DEE). A fairly higher labelling yield percentage was achieved in case
of adding 20 mg of the reducing agent in acetone medium. Labelling
yield for olive oil was more than 60% . When the DEE medium was used
under the same conditions, at room temperature, the yield was more
than 50% . It was noticed that the lesser the reducing agent was, the
lower was the yield percentage.
Thin Layer Chromatography Technique (TLC) and Paper
Chromatography Technique were used as quality control systems.

CHAPTER 1 : GENERAL INTRODUCTION
1.1. General
1.2. Artificial Radioisotopes.
1.3. Methods of Labelling of Organic Compounds Vfith RadioactiveIodine Isotopes.
1.4. Olive Oil.
1.5. Historical Cascade of Radioactive Iodine Fatty Adds Labelling.
1.6. Iodine Isotopes and Labelled Compounds.

CHAPTER 1 : INTRODUCTION
1.1 General :
During the past few decades, the progress in nuclear sciences
resulted in the extensive production of radioisotopes, and the wide
range of their applications in industry, agriculture, biology, medicine,
research and many different fields of science and technology. It was
probably in the field of medicine and biochemistry that some of the
earliest applications of radioisotopes have been made, as these were
pronounced to be a new powerful tool in an area of vital importance as
the understanding of metabolic reacions, the mechanisms of the action of
drugs, the location of cancerous growths and obstruction of blood flow.
In fact the scope of the subject would appear to be almost unlimited
particularly in. the presence of specially trained experts and
sophisticated instrucments. Thus in addition to the use of radioactive
tracers in microcurie quantities for monitoring certain processes in the
body, larger doses have been successfully used for therapeutic
purposes for destroying cancerous tissues. For more information
publications can be consulted(l).
The use of radioactive drugs in the Kingdom of Saudi Arabia is
rapidly increasing and especially radiopharmaceuticals labelled with
short-half-life isotopes. These ara frequently produced at hospitals
e.g., King Faisal Specialist Hospital (KFSH) in Riyadh. In King Khalid

University Hospital (KKUH) the amount of radioisotopes applied in the
department of Nuclear Medicine is doubling every year* as shown by
figure (1).
Figure (1) : Anular number of patients investigatedby nuclear medicine in { KKUH).
50Q0
A 000
<Q_
3000
2000
1000
..?•-'"
11t07

Among the most useful labelled compounds are those labelled with
radioiodine isotopes. There are more than 50 compounds labelled by
radioactive iodine-123 (t1/2=i3^3h);odine-125(t1/2=60d), iodine-131(t1/2 =
8d) or iodine-132(t1/2=2.3h) table (1).
TABLE (1) : NUCLEAR DATA FOR IODINE RADIONUCLIDES
USED IN NUCLEAR MEDICINE
Isotope
132,
131I
125.
2.3 hr
8.05 d
60 d
13-3 hr
Half-thickness ofmain y rays in lead
6.5 mm
2.k mm
0.016 mm
0.37 mm
Mode of decay, Energy
B"
B( S") MeV0.2500.3350.6080.815
BE.C(1OO%)
6E.C(1OO^)
668 kev773 kev
Y-rays MeV0.080O.36A0.6370.723
X-rays MeV0.00*»0.0280.035
y-rays MeV0.0280.159
Preparatior
^eactor-ri ssion
Reactor
Fissionproductscyclotron
Cyclotron

1.2 Artificial Radioisotopes
Radioisotopes may be either naturally occuring or artificially
produced.
There are many radionuclides which are clinically useful in
diagnosis or therapy. The energy, the half-life and the type of
emitted radiations as well as the high specific activity are the most
important factors that have to be taken into consideration when
choosing an isotope for a special application. The shorter the half-life
of the radioisotope the more useful it is, since one can repeat the
experiment more than one time during a reasonable period (2). Also the
lower Ihe energy of the gamma emitted from the radioisotope the more
safer is its application. At the same time isotopes emitting only gamma
(Y ) and not beta ( Q ) particles (or low energy beta) are preferred in
medical application in order to decrease the dose affecting the
applicant.
Suitable radionuclides for different medical applications have
gamma energies between 20 to 600 KeV and have physical properties
such that a useable photon flux is available for the examination without
excessive patient irradiation (2).
PRODUCTION OF RADIOISOTOPES
Radioactive nuclides may be prepard by nuclear reactors and by

a wide variety of particle accelerators. However, only reactors or
cyclotrons of at least moderate particle flux are able to produce sources
of sufficiently high specific radioactivities to be of practical interest.
These two methods of production supplement each other in that in
general they do not produce the same isotopes of an element.
1.2 .A-a) Reactor Produced Isotopes ( 3 , 4 , 5 ) :
Experimental nuclear reactors are the main source for more than
90 % of the applied radioisotopes. When a target element is bombarded
with thermal neutrons in a reactor, one or more of the following
processes may occur.
a) The (n, gamma) process, in which a neutron is captured by the
nucleus of a target atom, and almost simultaneously one or more gamma
photons are emitted. The target atom is changed to an atom with one
more neutron in the nucleus, that is , to a heavier isotope of the same
element. The process may be represented symbolically as follows:-
2 X, (n,Y) +2X
b) The (n, P) reaction : A target nucleus absorbs a neutron and
expels a proton immediately. The product atom is therefore an atom of

an element with an atomic number lesser by one than the target
element, and the same mass number, giving a carrier free isotope, a
symbolic example is:
c) The (n, gamma) process followed by radioactive decay to the
desired product. The produced isotope is of high specific activity and
is carrier free. An example is the production of Iodine-131 by
irradiation of tellurium dioxide (TeO») or any tellurium target.
Figure (2) shows the production of Iodine-131 in a neutron flux of13 2
5x10 n/cm /sec, target tellurium metal.
130Te (n , Y )
d) The (n, a ) process : A neutron is absorbed and one or more
alpha particles emitted.
ZX (n,a) Z .2Y
It might be mentioned here that a number of stable nuclides can
be produced by neutron irradiation that could not otherwise be obtained
in pure form. For example:
1 9 7 A u ( n , Y ) 198Au B-d e C a^ 1 9 8Hg
e) Fission : As a result of uranium fission a tremendous amount of

Specific Activity (Curies per gram of Tellurium)
IO
\n 3 -tin> - i
x cort a.— -\ co o o
— 3 rt
- 3O
VIno
rtQl-1
••anrt
n— oic
oQ.
3ni
9 ow 9
01
?t i
on
2" 8
s\
\
00

activity can be produced. All fission products are Beta emitters. Some
of these radioactive fission products can be obtained in substantial
quantities by chemical separation from the residual uranium and other
elements present in the burnt-out reactor fuel rods. For instance:
U(n, Fission)
f) The secondary nuclear reactions : In these reactions the target
material is admixed with another material suffering any one of the last
given nuclear reactions, then using the emitted, p,ct to initiate a
nuclear reaction in the target material thus using a reactor as source
of charged particle instead of a source of neutrons. For example
mixing the target material with Li, and according to the nuclear
equation Li( n' a) T, one can make use of the charged a particle or
the tritium to intiate another nuclear reaction, of course this procedure
gives low activity, but is of value in absence of accelerator facilities.
1.2.A-b> Some Theoritical Aspects of Radioisotope Fvoductioii(3,4,5):
The theory of reactor irradiations is, in general, extremely complex.
Some of the elementary aspects will be dealt with here. The probability
that a certain incident neutron will be captured by a certain atom of
the target material depends on the energy of the neutron and on the
characteristics of the target nucleus. If we know the energy of the

10
neutron (usually thermal energy) we can express the probability of
capture in terms of an imaginary small circular area surrounding the
target nucleus and perpendicular to the path of the neutron such that
if, and only if. the neutron passes through the area, capture occurs.
This area is called the capture cross section of the target nucleus.
The capture cross section is different for different target nuclei and
for different neutron energies. In almost all cases, the slower the
neutron is travelling (i.e. the lower its energy), the greater is the
probability of capture. The thermal neutrons, which are slowed down
to the lowest possible energy for a neutron are therefore ideal for the
purpose. The cross section area is usually expressed in barns
-24 2(1 barn = 10 cm ). The thermal neutron cross sections of a number
of target materials are tabulated and published in many reports edited
by the International Atomic Energy Agency, Vienna (IAEA).
From these considerations, we can readily show that after a
target material is exposed to thermal neutron irradiation for a time t,
seconds,its specific activity at any time during irradiation is equal to:
1 l /
Activity = 0.602 ijoa A"1 (l-(l/2) l * ) Bq . g
t1.62 x 10"1 ] 0 a a A ' 1 ( 1 - ( i ) / t : i ) Ci .g " 1

11
The activity at any time after end of irradiation is
Activity = 1.62 x 10"11 0$ a A~1(1-(1/2J ^i ) (1/2)
where $ = neutron flux in n/cm2/sec.
a = thermal neutron cross section of the target material in cm2
A = mass number of the target element
a = the percent natural abundance,
t = time of irradiat ion.
T = cool ing time,
t , = hal f-1i fe time of the isotope of interest.
Knowing the characteristics of the target material and the
thermal neutron flux, we can use the last equation to calculate the
specific activity of the target after any irradiation time. The time
needed to produce a given specific acitvity depends on the thermal
neutron flux, the cross section and the rate of decay of the product.
In practice irradiation times vary from a few hours to 2 or 3 years.
The specific activity calculated by the last equation must be corrected
to allow for several sources of error. The actual activity produced is
usually less than the calculated value. The ratio of actual to calculated
activity is called the irradiation efficiency. Practical irradiation

12
effeciencies may be as low as 20% or as high as 80% depending on the
self-sheilding in the target material and /or on the burn up factors.
Irradiation efficiency can not in general be predicted by theoritical
means. In practice predictions are based on empirical factors derived
from the results of past irradiations. These include certain factors
which are :
i) Day-to-day variation in the neutron flux due to shielding by other
target materials in adjacent reactor position and to unscheduled
variations in the reactor power level.
ii) Impurities in the target. '
1.2.A-c) Practical Aspects of Reactor Irradiations (3,4,5):
In theory, almost any nuclide can be converted to another
nuclide by neutron irradiation. Whether or not this is feasible or
worthwhile depends on a number of factors.
Some target materials can not be irradiated safely at normal
reactor temperatures of several hundred degrees. Substances that are
explosive, pyrophoric or extremely volatile at such temperatures are not
in general acceptable as targets. If the target isotope has a very low
activation cross section an unpractically long irradiation may be required

13
to produce appreciable activity. If the radioactive product has a very
short half-life it may decay as fast as it can be produced, or before it can
be shipped to the user. The amount of a given target material that can
be put into any one reactor position is limited by a number of factors.
For example the design of most reactors leaves only a very limited amount
of space for radioisotope production and hence volume is an important
restriction.
1.2-B Accelerator Produced Radioisotopes (3,4,5):
Whereas a reactor can only give a flux of neutrons and gamma rays,
accelerating machines can use many other types of bombarding particles.
These are charged, generally, positively, although electrons are also
accelerated, and include protons, deuterons and heavy ions. There are
several types of accelerating machines, sometimes given the generic term
"cyclotron" and differently named according to the particle accelerated and
the mode of doing this. In general, a beam of charged particles is
injected at one point, and by being subjected to electric and magnetic
forces is accelerated either in a straight line, or, more commonly in a
spiral path increasing in energy as it does so. The high energy particle
strikes a target and may impart sufficient energy to cause a nuclear
reaction. Bombarding with protons or deuterons can produce new nuclides
with an excess of positive oharge, for instance the bombardment of
boron-10( B) with deuterons produces carbon-11 ( C), which is

radioactive and emits B particles. At high energies, enough energy may
be imparted to cause a break-up of the nucleus termed "Spallation" as in
case of 37Cl(P,6P4n)28Mg.
The main points about accelerator produced isotopes are :
a) The resulting nuclides decay by g or by electrone capture (E.C.)
modes.
b) There is a change of element, so the products are carrier free and
need chemical extraction from the target.
c) The target becomes considerably heated, and this either limits the
choice of material or necessitates special cooling, or both.
d) The beam is small and so the number of targets that can be irradiated
at one time is limited.
e) The yield is a function of time and beam current (flux and time in
reactor irradiation) and of course it depends upon the cross-section for
the reaction, which raay in turn depend upon the particle energy.
f) Becuase the output of radionuclides is small, the cost of production
tends to be high. However some nuclides produced by this route have

15
properties which are more suitable for some purposes than reactor
produced radioisotopes of the same element.
A radionuclide which has achieved importance in recent years for190
body function studies, is iodine-123 ( I ) with a half life of 13.2 hours
and emission of gamma rays of energy 159 KeV with no particle emission
(table 1). The half-life is of reasonable length, and the dose to the body
is less than is given by comparable activities of any other iodine
radioisotopes. It is produced at AERE Harwell using 58 MeV protons in
the variable energy cyclotron,
%
72% EC j, 1 2 3I n+
Auger effect
28% 6 + 123T-
1 2 5X e Auger effect
the target material is di-iodomethane.
123A very good review of I production methods is given by
Stocklin(6).
1.2-C Radioisotope Generator Systems (3,4):
Several short lived radioisotopes which are useful in clinical
radioisotopes work are the daughters of longer-lived parents. In fact it is
preferable to conduct trace experiments with short-lived nuclides as Lhis

16
eleminates the problem of disposal of residual radioactive waste after
completion of the experiment. It is convenient to have a long-lived
mother in storage from which a short-lived daughter can be removed as
required for use in tracer work. A few examples of uses of such
mother-daughter can be removed as required for use in tracer work. A
few examples of uses of such mother-daughter pairs are included in
Table 2. Such systems are called radioisotope generators.
132Most commonly used radioisotope generator is Te from which•too 132
I may be milked. In this case Te is adsorbed as radium tellurite132on an alumina column, and the I removed by passage of 0.01M132ammonia through the column. The I is used both diagnostically and
therapeutically for thyroid cancer, (k)
Another commonly used radioisotope generator-milking system99 99Mo- Tc is used for diagnostic purposes for liver, spleen, and other
99scanning. The Mo parent is absorbed on a column of alumina and the
daughter ' mTc removed by passage of saline solution at intervals
governed by the equilibrium. The parent, when it is fixed in a
semi-permanent sample as on an adsorbent column, is often known as a
"cow" and the removal of the daughter activity from the radioisotope
generator (the "cow") is termed milking (see part 4 of this thesis).

TABLE (2) : SOME COMMON RADIOACTIVE MILKING PAIRS. THE DECAY PROPERTIES INCLUDE DECAYENERGY (MeV),MODE OF DECAY AND HALF-LIFE,
Mothernuclide
DecayProperties
Daughternuclidc
DecayPronerties
Application
44Ti
68Ge
90Sr
" ]
113
132
137
140
144
210
226
238.
Sn
Te
Cs
Ba
Ce
Pb
Ra
EC,Y:47.3 y 44Sc
68EC:275 d
O.5S0;28.1 y
3.YJ284 d
P.YJ21 y
a; 1600 y
a; 4.5x10⁹ y
Ga
1 3 7 m Ba
140La
144Pr
210Bi
222 Rn
l.SB ;1.17:4.0 h
1.886+,1.O8Y5
1.14 h
2.27B;64 h
0.14Y;6.0 h
0.40YJ1.66 h
3,Y=2.3 h
0.28Y.2.55 min
3.00g;17.3 min
1.163;5.01 d
a;3.82 d
B.YJ 24.1 d
Teaching
Medical
fa")Heat source (large amounts). '
calibration source
Medical
Medical
Medical
Gamma radiography, radiation . ..sterilization (large amounts) '
Lanthanum tracer
Calibration source
Calibration source
Medical
Thorium tracer
(a) Mainly use of mother substance.
Reference CO

18
1_3 ifethods of Labelling of Organic Compounds With Radio-active Iodine
isotopes (7):
A radioactivity labelled (or "tagged") compound is one in which one
of the atoms is radioactive. Preparation of labelled compounds may
involve lengthy chemical synthesis starting with the radioactive nuclides
in elementary form or in a simple compound. Labelling is said to. be
specific when only one position, in the compound, contains radioactive
nuclides. However labelling is said to be general when several
positions are labelled. Labelling is said to be taking place through
biosynthesis when the complicated organic compound is left to grow in a
substrate containing the radioactive nuclide.
The use of radioisotopes for labelling of organic compounds have
been adapted to a large extent becuase the isotopes are available and
these labelled compounds play an important role in nuclear medicine (8).
High specific activity is desirable for the radiopharmaceuticals so that
nonphysiologic amounts can be administered. For radio-immuno-assay
high specific activity is important for sensitive assays.
Radioiodination of protein has generally been carried out by one of
three methods: the iodine-mono-chloride (IC1) method (9, 10, 11); the
Chloramine-T method (12, 13, 9); and the electrolytic method (14, 15).
Procedures for iodination of fibrinogen by IC1, Chloramine-T and

electrolytic methods have been published (16). Reaction yields for
radioiodinated fibrinogen were measured by separating labelled
fibrinogen from free iodide ion using a sephadex G-10-12 gel
chromatography column (16). Krohn and Welch(17) have reported the
carrier-free iodination of fibrinogen with percentage yield ranging from
60-85% within 30 min.
Other procedures were recorded in the literature for labelling of
proteins depend on freeing the I in direct contact with the protein by
oxidation of KI solution. The oxidizing agent such as KIO_ (18, 19),
nitrous acid (20), hydrogen peroxide (21), ammonium-persulphate (22),
chloramine-T (23) have been reported in the literature. All these
oxidizing agents are able to induce denaturation phenomena becuase
they are in direct contact with the protein solution. To avoid the
denaturation of the product, labelling methods in heterogeneous phase
have been adapted (20, 24). Therefore a new method was described125for labelling proteins to high specific activities with I (25). This
new method involves reacting the protein under mild conditions with the
N-hydroxy-succinamide ester of 3-(4-hydroxy-phenyl) propionic acid125that has previously been labelled with I and separated from the
products of the iodination reaction by solvent extraction (26).
Enzymatic oxidation has been developed for the iodination of
proteins (27) and immunoglobulins (28). The enzymitic oxidation
was also utilized in labelling of gonadotropin (29),

20
aromatic steroids and other hormones and proteins (30). This method
requires the reaction of Ijactoperioxidase, carrier-free radioiodine and
the compound to be labelled together with nonmolar quantities of HnC>2
It yields high specific activity products and the biological activity for
radioimmunoassay is preserved (28).
Another important class of methods for introducing radioactive
iodine and bromine into a molecule is the halogen exchange (31). In1O1
1966, Tubis et. al (32) first described the preparation of I labelled131Sod-o-iodohippurate by isotopic exchange between Na- I and inactive
o-iodohippurate. Radioiodine labelling of o-iodohippurate by isotopic
exchange was further studied by Scheer et. al. (33) and in more
details by Hallaba et. al. (34). Various procedures for the separation
and purification of labelled o-iodohippuric acid after exchange labelling
were described (34-36). A new technique for iodine labelling of
aromatic iodine compounds has been described and applied to the131preparation of I-labelled m-iodohippuric acid (37). m-iodohippuric
acid is of great stability and has advantages for nuclear medical
application when compared with o--iodohippuric acid. The method is
very efficient, and in this particular case the exchange is completed
within about 30 minutes at a temperature of 161° C.
A new approach has been reported under the name "melt method"
(37). Isotopic exchange by the melt method in general is very efficient

21
and fast (37-39), if the reaction proceed without decomposition of the
compound to be labelled. This method was used to prepare radioiodine123
labelled o- I HA with radiochemical yield of almost 100% (40).
On the other hand, there are some cases in which the compound to
be labelled decomposes during melting (31). To avoid this phenomena
low melting derivatives of the compound have been used (31).
123Lambrecht et. al (41) used the decay of Xe in the exchange labelling
123 123
in the melt to prepare 1-4-iodophenylalanine, I-5-and-6-
iodotryptophan. Further utilisation for this approach have been
developed by Elias and Lotterhos (7), who used "unreactive" solvents
(acetamide) which has low melting point and a good solubility for many
organic compounds as well as for metal halides. It was found that, the
radiochemical yield observed after two hours at 180° C is 80% for
exchange bromobenzoic acid to m-iodcbenzoic acid (41, 7).
For many medical application products, iodine-131 or iodine-125
radiopharmaceuticals which are presently being used for "in vivo"
procedures can be replaced by iodine-123 due to its convenient
characteristics. Table (3) summarizes the most important used
practical labelling procedures.

22
TABLE 3 : METHODS OF LABELLING
T h e r e a r e e s s e n t i a l l y f i v e m a j o r t e c h n i q u e s e m p l o y e d i n t h e
p r e p a r a t i o n o f l a b e l l e d c o m p o u n d s f o r c l i n i c a l u s e : {k2)
METHODS EXPLANATION EXAMPLES
Isotope ExchangeReactions
In these reactions, one or more atoms ina molecule are replaced by isotopes ofthe same element having d i f f e ren t massnumbers. Since the radiolabel led andparent molecules are ident ica l exceptfor the isotope e f f e c t , they are expectedto have the same b io log ica l and chemicalpropert ies.
3 2 S-
and 3H-labelledcompounds
Introduction ofa foreign label
In th is type of l a b e l l i n g , a radionuclideis incorporated into a molecule that has aknown biological r o l e , p r imar i ly by theformation of covalent or coordinate-covalent bonds. The tagging radionuclideis foreign to the molecule and does notlabel i t by the exchange of one of i t sisotopes.
" m Tc- labe l l edalbumin.5 l Cr- labe l ledred bloodc e l l s .1 3 1 | - l abe l l edproteins.1 2 5 l - l abe l l edfa t t y acids
Biosynthesis orchemical synthesis
In biosynthesis, a l i v i n g organism isgrown in a cul ture medium containingthe radioactive t racer ; the tracer isincorporated into metabolites producedby the metabolic processes of theorganism, and the metabolites are thenchemically separated.
5760C0 orlabelledvitamin B
CO-
12.1 C-labelledCarbohydrates,proteins, andfats.
Continued....

Table (3) continued
23
METHODS EXPLANATION EXAMPLES
Recoil labelling This method is of limited interestbecause it is not used on a largescale for labelling. In a nuclearreaction, when particles are emittedfrom a nucleus recoil, atoms areproduced that can form a bond withother molecules present in the targetmaterial. The 1ight energy of therecoil atoms results in poor yieldand hence allow specific activity ofthe labelled product.
H-labelledcompounds.lodinatedcompounds.
Exitat ionlabel 1 ing
(from 1 2 3Xedecay)
This method of labelling entails the 1231 —labe1 ledutilization of radioactive and highly compoundsreactive daughter ions produced in anuclear decay process. During gdecayor electron capture, energetic chargedions are produced that are capable oflabelling various compounds of interest.77 77
Kr decays to Br and, if the compoundto be labelled is exposed to 7 7Kr, thenenergetic 7 7Br ions labelled the compoundto form the brominated compound.

24
1-4 Olive Oa
Olive oil is one of the natural oils, it is obtained from ripe olives,
the fruit of the cultivated olive trees. The olive oil is a pale yellow oil
with a pleasing delicate flavor. It has a density of 0.909-0.915 at 25 C
Iodine value for olive oil is 79-90 (43).
Olive oil is a mixture of glycerides. It is composed of many fatty
acids, (Table 4). Some are saturated while others are unsaturated.
TABLE : OLIVE O I L COMPONENTS
Sa
tura
ted
Un
sa
tura
ted
Fatty Acid
Palmi tic
Stearic
Otheis
Oleic
Linoleic
Others
Structure
C15H31COOH
C,7H35COOH
CH (CH2) CH=CH(CH2) COOH
CH (CH2) CH=CHCH2CH=CH(CH2) COOH
Percentage
a 10.0%
b 12.95%
a 3.3%
b 2.83%
a 0.6%
b 2.27%
,a 77.5%
b 58.12%
a 8.6%
b 13-69%
a
b 6.M»%

25
The main constituents of olive oil is oleic acid (9-octadecenoic acid)
Co H,. 09 ; the chemical structure is as below :18 oi L
C H 3 ( C H 2 ) 6 C H 2 - ^ —-V'Y-
Pure oleic acid is colorless, of density about C.895 at 25° C, and
the iodine value is 89.9 (43).
The distribution of olive oil in rats tissues was done by Cappelli
(44), to study the functional and biochemical effects of olive oil. The
study shows the relative weight of olive oil expressed as percentage
body weights of rats fed with olive oil (see table 5).
TABLE (5) : RELATIVE WEIGHT OF OLIVE OIL EXPRESSED
AS PERCENTAGE BODY WEIGHTS OF RATS FED WITH OLIVE
Heart
0.23
Liver
2.35
Kidney
0.5't
Spleen
0.22
Testes
0.80
Another study was done to determine the fatty acids of myocardium
of rats fed with olive oil. Table (6) shows the results given by
Beare-Rogers (45)

TABLE (6) : PRINCIPAL FATTY ACIDS OF
MYOCARDIUM OF RATS FED
WITH OLIVE OIL.
26
Fatty Acid
Carbon atom No. / double bonds
16:0
18:0
18:1
18:2
20:1
20:4
22:5
22:6
Percentage
12.2
22.1
18.3
14.4
0.2
17.4
2.1
9-5
Total Fatty Ac ids/Myocardium (mg/g) used= 15-4

27
Many other studies about the distribution of halogenized olive oil in
experimental animals are mentioned in the literature. (46,47, 48,).
These studies showed the presence of olive oil components in the liver,
kidney, heart, spleen, and testes. This wide range of distribution
shows the importance of labelling of olive oil with radio-active isotopes
for diagnostic purposes.
1.5 Historical Cascade of Radioactive Iodine Fatty Acids Labelling :
Fatty acids are one of the main sources of energy production in
mammals, and their physiological and biochemical fate has therefore been
extensively studied. Recently new attention has been focused on these
compounds because, if labelled with suitable emitting radionuelides, they
may be used to monitor part of the energy producing metabolism in vivo
(49).
Radioiodinated triolein and fatty acids have been widely used in the
assessment of intestinal malabsorption and maldigestion.
The method of study is essentially a tracer test in which a known
dose of radioiodinated triolein and oleic acid are orally administered and
the percentage of the ingested fat and fatty acid appearing in the blood
or excerted in the fecal samples is measured. This provides a

28
diagnostic aid in assessing fat digestion and absorption by the
alimentary tract (50).
In 1949 Stanley (51) studied the absorption and desorption of orally131 131
administered I-labelled olive oil. He had mixed I with carrier
and acid, then the liberated iodine was extracted with chloroform. Into
the chloroform solution a stream of chlorine was then passed until the
purple color of iodine just disappeared. The iodine chloride obtained
was added to a chloroform solution of 20 gins, of olive oil. The labelled
olive oil was soaked into bread and eaten.
131Later on, Tuna (52) et al. have used I to radioiodinate triolein,
olive oil, sesame oil, and peanut oil. The various samples were
analyzed chromatographically for radiochemical purity. It was found
that only 30 to 60 percent of the radioactivity was in triglycerides.
Remaining radioactivity was distributed among free fatty acids, their
methyl esters, partially digested fats, acetoglycerides, and other
substances, then the absorption in human body was studied.
In 1970 Davila and co-workers (53) described a new method of131preparing I-labelled oleic acid and triolein which may be used for
studies on the absorption and the metabolism of fats. In this method
the labelling of the compounds and the subsequent separation and
purification of the labelled products were done in one vessel in a
continuous manner.

29
131The absorption of I-labelled oleic acid was studied by Turk (54).
The labelling have been done in a second gelatin capsule containing 20131uCiof I-labelled oleic acid whi<
the radio-zinc containing capsule.
131uCiof I-labelled oleic acid which was administered concurrently with
131Tennant et al (55) demonstrated the absorption of I-oleic acid131and I-triolein by germ-free and conventionalized rats and it has been
demonstrated that there are several differences in lipid metabolism
between germ-free and conventional rats. To evaluate the role which
intestinal absorption might play in determining these differences, they
compared the absorption of I-oleic acid and I-triolein in germ-free
and conventionalized rats. Gastric emptying of both compounds
appeared to be delayed in germ-free rats and correspondingly less
radioactivity reached the cecum during the 6 hours period following
intragastric administration. When corrections were made for differences
in gastric emptying, germ-free and conventionalized rats absorbed oleic
acid and triolein at similar rates. Under the conditions of their
studies, intestinal micro-organisms did not appear to influence the rate
of either lipolysis or fatty acid absorption directly, but significantly
influenced the rate at which fat was transported along the gastro-
intestinal tract.
Eugenio (56) et al. used a technique for labelling oleic acid using
reactor-irradiated coconut oil resin (RICOR). The most effective

30
technique for labelling oleic acid now in vogue employs iodine131monochloride tagged with I to introduce radioactive iodine into the
oleic acid molecule. In this work they presented a technique using
RICOR and oleic acid molecule was labelled with radioactive iodine. It
appears that RICOR can be used as an effective medium for labelling131oleic acid with I. This new labelling technique is fast, easy and
convenient to use provided that the iodine concentration in the final
product is not too critical.
Robinson and Lee (57) used radioiodinated fatty acids as agents for
use in heart imaging. Previous studies in experimental animals and131humans using I-oleic acid of low specific activity were marginally
successful. Higher specific activity compounds offer potential
improvement for use as imaging agents for normal myocardium.
The labelling of oleic acid with 1 4 C , 1 3 1 I and 131I-labelled linoleic
acid have been described by Beierwaltes et al (58). The distribution of
131I-labelled oleic acid or linoleic acid was also studied in dogs.
Radioactivity concentration in the myocardium was the highest at all131times, the myocardium uptake of I-oleic acid was significantly higher
than the radioactivity in the blood or other tissues at 30 minutes after
injection.

31
131Robinson (59) has synthesized I-16-iodo-9-hexadecenoic acid by
123reacting the brominated precursor with I-iodide under reflux in
anhydrous acetone or methyl ethyl ketone (MEK). I-iodide was
extracted into the reaction medium from aqueous (4N) NaOH single
extraction transfer into acetone which was more efficient than into MEK,
but labelling yields were higher using MEK.
131 125Norman et al (60) used I, I and some radionuelides to label
hexanoic acid, oleic acid and stearic acid. They used the labelled
compounds for myocardial imaging.
123 11Machulla and Stoklin (61) prepared I and C labelled long-chain
fatty acids for kinetic studies of heart muscle meatabolism.
14Machulla et al (62) labelled various long-chain fatty acids with C,
34 77 123Cl, Br, and I and evaluated their protential application in
measuring myocardial metabolism in vivo.
Otto et. al. (63, 64) studied terminally iodinated long-chain fatty
acids and it has been used experimentally and clinically as myocardial
imaging agents. Six u-iodo fatty acids (I(CH2)n COgH where n=10, 12,
15, 18, 21, 26) have been synthesized and tested in rats. Myocardial
extraction values and heart-to-blood ratios are affected by chain length
and they found that the radioiodinated fatty acids have short myocardial

32
tn ,„ and high blood activity levels when these used as myocardial
imaging agents. Both of these problems may be related to rapid
8-oxidation of the fatty acids by the myocardium and liver. They
suggested several approaches to decrease the rate of g-oxidation. One
approach is to modify the carbon skeleton to promote storage as
triglycerides.
A description of a rapid method for labelling long-chain fatty acids131 123
which gave high rpecific activity with radioiodine ( I or I) wasgiven by El-Shaboury (65).
In 1982 Riche (66) labelled fatty acids with iodine 123 or 131 in
w-position. This worker has developed a simple and rapid labelling
method which requires no product purification and should therefore be
routinely useful in nuclear medicine laboratories. The synthesis of long
chain fatty acids iodinated in u-position is performed by tosylation of
the u-hydroxy acids followed by an exchange reaction.
The problem of deiodination of long chain fatty acids results in
relatively rapid loss of radioactivity from the myocardium with
accumulation of radioiodide in the thyroid and blood. In order to
overcome the problem of radioiodide loss, iodine has been chemically
stabilized by attachment to the para position of the phenyl ring or by
the introduction of the tellurium as a heteroatom in the fatty acid to

33
inhibit 8-oxidation and "trap" the fatty acid in the myocardium.
Knapp et al (135, 136) prepared two new tellurium fatty acids in which
iodine-125 has been chemically stabilized by attachment as a trans-vinyl
iodide (I-CH = CH-R-Te-It -COOH) and evaluated them in rats. The
absolute heart uptake of this agent was moderate, but the hearfblood
ratios were low. The effect of tellurium position was unexpected and
the heart/blood ratios were dependent upon the position, of the
tellurium.
The preparation of terminal p-iodophenyl-substituted- a and
g-methyl-branched long chain fatty acids have been described by
Goodman et al. (137). The radioiodinated agents are of interest as a
result of the expected pronounced uptake and prolonged myocardial
retention that may result from the inhibition of fatty acid metabolism.
A comparison of the heart uptake of the radio-iodinated
methyl-branched fatty acids and their unbranched analogues has
demonstrated a greater myocardial retention of the methyl-branched
fatty acids than the unbranched analogues. The tissue distribution
studies in rats have been done.
1.6 Iodine Isotopes and Labelled Compounds :
There are 25 radioisotopes of iodine, ranging from atomic mass 117
to 137. The potential of each of these is discussed by Mayers (94).123For various reasons only four have become important. These are I,

131j a n ( j 1 j_ Nuclear properties as well as method of production
of these radioisotopes are shown in tables (1,8,9,10) and figures
(3,4,5).
ioi no
I and/or I are produced by neutron irradiation of tellirium235targets or separated from fission products of U. Iodine-125 is
124produced by neutron irradiation of Xe or by accelerator.
Although Iodine-131 has been used more often in clinical studies123 125 132
than I, I or I, becuase of its availability, low costs andrelatively long half-life yet iodine-123 is competing because of its short
131half life, low y energy and non-beta particles. With I a 364 KeV
photon is emitted 80% of the time, but higher energy photons of 637 and
722 KeV are emitted about 12% of the time with resultant septal
penetration in collimators designed for lower energy emissions.
Iodine-125 became commercially available relatively late in 1960s.
1-125 has been shown to produce thyroid scans, at least, as good as
those of 1-131 in resolution and sensitivity. This isotope however
became popular after invention of (RIA) radio-immuno assay (69, 93).
There are many compounds labelled by Iodine-125; some of these
compounds are shown in Table 7.

35
TABLE 7 : EXAMPLES OF COMPOUNDS LABELLED WITH
IODINE-125 AND THEIR APPLICATION(S)
Compounds labelled
withApp)ication Reference
Meta-D imethoxy-N,N-Oimethyl lodophenylIso-propy1 ami nes
Imaging agent fo r brainblood flow
Mathis, C(72)
co-lodo Fatty Acids
l(CH2)nCOOH
(n=10, 12, 15, 18,21, and 26)
13-lodo-3-methyltridecanoic acidi6-Bromo-9, 10-methylene-hexadecanoic acid
iA-iodo-9~tetradecanoicacid
Myocardial Imaging Agents Otto, C.(6M
15-(P~lodophenyl)-6-Tellur apentadecanoicacid
17-iodo 9-tellurahepta-decanoic acid
For the diagnosis ofheart disease and todelineate regions ofabnormal fatty acidmetabolism within themyoca rd i urn
Knapp, F. (135)
i8-lodo-13-tellura-17-octadecanoic acid
17-1odo-heptadecanoi cacid
17-lodo-9"tellurahepta-decanoic acid
i6-lodo-9~Hexadecanoicacid
15-(P-lodophenyl)Pentadecanoic acid
O-T«»I 1 •"-=>ri-h»ntadecanoic
Determine themyocardial uptake
Knapp, F. (136)

Table 7 (Continued)
36
Compounds labelled
with 1 2 5 IApplication Reference
5-Ben zoxy-1 -Pen ten e
3-(P-tolythiol)-2Methylpropene
i8-nonadecenoic acid
21-docosenoic acid
Diagnostic nuclearmedicine
Kabalka, G. (68)
A-iodobenzyl bromide
l»-trimethylsi ly l benzylbromide
For label l ing otherbiological ly importantmolecules which possessuitable nucleophil icfunctional groups
Wilson, A. (67)
T»-(P-iodophenyl)2(RS)-methyltetradecanoic acid
Myocardial imagingagents
methyl-pentadecanoicacid
19c
[ I ] Iodospiroperidol
Goodman, M. (137)
Fibrinogen
Human Albumin
Plasma AlbuminProteins
To study fibrinogenbehavior in vivo
For metabolic studiesand behavior of theprotein
For metabolic studies
Krohn, K.
Rosa, U.
Katz, J.
(7*0
(15)
(70)
For use in v i t r o assaysto consider theY emitting dopamineantagonist
Laudvatter, S.(73)
Amidarone (Cordarone ) For medical uses Sion, R. (71)

37
Table (8) : Reactions realized by the use of an accelerator
(Production of 123l)
Reaction
™Te(p.n)ml
•«Te(p.8n)'"l
••'Te(>He.2n,'»XeE-?'»I
'»Sb(>He.3n,»M
'!'Sbfo.2n)'"l
«'Te(a.3n,'»XtE-C=»I
Abundanceof argetnuclide
0.87
31.79
34.49
2.46
41.75
57.25
2.'6
Energy ofincidentpaniclei(MeV)
15.5
15
80 [8]
30
30
25
30
d30-35[11]
46 [12]
Productionrate
ixiCi/mAh
-450 b [3]
-1000 C [7]
-90CC [7]
-300 C [7]
200 [9]
40-120 [10]
Side reacDor.1 ir.chalf-kit s!
nuclide fanned
mTe(p.n)»'ltTj = 1.3 h)iiot. abund.: 0.06K
"'Tecp.n)1"!
iioi. abund.: 4.61".-
m Te(p .n) '" l(Tj • 60.2 d)isot. abund.: 6.99^
(Tj = l l . e d )iiot. abund.: IE.TIT.-
'"Tetp.n)'"!
iioi. abuni.: 34.49C>
•"Sbfe.n;"'!
iiot. aounc.: 42.75-T-
"•Sbfo.aro"*!
"'1 . " M a n i ' * l
reactions
FOT all nuclear aata except those with their own reference, tee Ref.fj3 & Ja Only iide reactions producing nuclides with half-livei excee^mc 1 hare taken into con:ideri£cr.^ Refen 10 approx. "50 mg of tellurium enriched in 1IJTe to SPC-.c Tfic weight of targe: >nd its enrichment not given.0 The optimum ranee c! energy for production.
t.«3
B.33
11.11
0.14
. i

38
TABLE (9) : Reactions realised by the use of an accelerator
125(Production of I)
Reaction
»Te<p.n)«l
"•T«(d.n)m l
«»Te(d.2n)'»l
'"Sb(o.ai)">l
iKHOpIcabundance
olihemiclide
<*>
6.9!)
4.6)
6.99
42.15
Energyof incident
panic lei(MeV)
16- IB
to
14
30
Production rate(mCi/mAh)
1.8 [7]
1.0 18]
15.0 (9)
0.42 [10]
Secondary reaciioniand hall-lire of the
nuclide formed
mTe(d.n)"MCTj • 13.8 d)lut. abund.: 6.99
"'SKn^n)111!(TJ = S.>2h)ilol. abund.: 57.25
'"SKa.anl1"!(Tj • 13.3 h)
'"SWn.an)1"!
'»Sb(e..n)lwI(Tj • 12.8 d)

39
Table (9) : Reactions realized in a nuclear reactor
(Production of 1 2 5|)
Reaction
l"Xe(n.))mXe
liotopiabundance
oruenuclide
(*)
0.096
C«MJ-
tection(bam)
110
Activity of elementat 10" n/cm'-i
(Cl/g)
1 week S week u i .
0.22 0.45 Z.B
Secondary reaction!and half-life of theradionuclide loaned
'"Xetno^'xe{Tj » 3 6 . « d)iiot. abund.: 0.09o * 2 bam
(Tj «B.0d)itot. abund.: 1.9:o < 5 bam
l"xe(n.T) I > 1Xen i
( T ) - l l . B d )iiot. abund.: 4.08a < 5 bam
(T, • S.27 d)iiot. abund.: 26.B9o < 5 bam
"*Xe(n.})"*Xem
(Tj = IS. 6 min)iioi. abund.: 10.4o < 5 bam
(TJ « 9.14 h)o - 0.2 barn
(Tj - 3.9 min)isot. abund.: B.S7o - 0.1S bam
For nuclear data m Rd.[95 J
125 TS3*
0.03S4S
Figure (A) : Decay scheme (MeV)

Table (10) : Reactions realized in a nuclear reactor
(Production of 1 3 1|)
Reaction
l"Te(n.))n'Tem
\30 h
IT 18% '"I
24.8 min
.1 Z8'
A un ance
of targetnuelidt
(To)
34.49
34.49
Croii-section(barn)
0.04
0.2
Activity of elementat 10" n/cm1'!
(mCi/g)
24 h 7 d ut.
1.4 7.9 n . S
7.2 40.0 S9.0
Side reactions andhalf-life of
nuelide formed
'»Te(n. 7 )" ! TeCTj • 11 d)lKJl. abund.: 0.D8?fro " 0.3 bam
m T e ( n . T ) 1 " T e m
CTj • 1M U)a * 2.0 bam
mTe(n.r)v l lT em
(Tj • i n d)iut. abund.: 2.46^o " 1. 0 bam
iioi. abund.: 4.61%0 * S.Obarn
( T j - 9.4 h)Uoi. abuni.: 18.111a * 0.9 barn
IMTe<n.i)1"T!m
(Tj a 109 d)o=0.1 barn
mTe(n.,)1MTe(TJ - 6S.:rmn)isot. abund.: 31.1?>c0 • 0.14 barn
(Tj •= 34.1 dlo = 0.011 barr.
For nuclear daia xee I
•s
11
C.JI5
1
i .
O.IH
1•. t
- a. TO
— 0.3M
i x .
Figure (5 ) : Decay scheme (MeV)

CHAPTER 2 : EXPERIMENTAL and RESULTS
2.1 The Iodine Monochloride Method.
2.2 Labelling of Oil with Inactive Iodine Monochloride Method.
2.3 Labelling of Oil with Radioactive Iodine Monochloride Method.
2.4 Labelling of Oil With Chloramine-T Method.
2.5 Quality Control Systems.

CHAPTER 2 : LABELLING OF OIL - EXPERIMENTAL AND RESULTS
In this work two methods were investigated aiming at preparing
labelled olive oil and/or oleic acid with radioactive iodine. The methods
used are the iodine monochloride (IC1) method and the chloramine-T
(CAT) method. The theoretical base of these methods are:
2.1. The iodine monochloride (IC1) method :
If potassiumiodate solution is added to potassium iodide solution in
the presence of hydrochloric acid (HC1), the reaction occurs:
2KIO, + 10KI + 12 HC1 = 12 KC1 + 6I_ + 6HOO (1)
However, if an excess of concentrated HC1 is present, a further
quantity of KICL oxidizes the I_ to IC1 according to equation (2).
3KIO3 + 6I2 + 18HC1 ?==? 3KC1 + 15IC1 + 9H2O (2)
by addition of equations 1 and 2 and dividing by 5 we get:
KIO, + 2KI + 6HC1 ?=± 3KC1 + 3IC1 + 3H00 (3)

Therefore a solution of concentration 33 mM with respect to IC1
(i .e . 5.35 mg of ICl/ml which is equivalent to 4.18 mg of f per
millileter) can be prepared by dissolving 166 mg of KI in 8 ml of 6M
HC1, to this added by forcible injection to avoid precipitation of I_ -
107 mg of KIO3 dissolved in 2 ml of H2O then completed to a total
volume of 40 ml H-O. The resulting solution was shaken twice by 5 ml
CC1. aliquot to extract any I™ free in the solution. The aquous layer
was then aerated for one hour by bubbling moist air through it and the
volume is finally made up to 45 ml. The purity of the solution was
controlled by measuring the absorbtion peak at 460 nm wave length on
spectrophotometer LKB 4050 UV/visible apparatus (85) (86).
Since high Cl concentration stabilizes IC1(3) the solution was
diluted with 9 vol of more than 2 M NaCl before use .
Since only radioactivity that is in the IC1 form takes part in
substitution or addition reaction, iodine monochloride must be of high
specific activity. Iodine monochloride can be made radioactive through
125either i) isotopic exchange reaction between radioactive I and the
125 125inactive IC1, and in this case the fraction of I present as IC1depends on the relative masses of the exchanging forms : (87)
125or (ii) through the direct preparation of IC1 according to reaction

125number (3) using radioactive Na I prepared by oxidizing the total125iodine in the carrier free Na I solution with addition of iodate to the
stiochiometric amount of Nal.
2.2 Labelling of Oil with Iodine Monochloride (ICl) Method :
a) Cold (inactive) labelling : -
In order to know the feasibility of labelling the oil using ICl, some
experiments were carried out by using prepared inactive ICl and
following the labelling process spectrophotometrically.
The characteristic peaks for iodide, oleic acid, olive oil and
iodine monochloride as well as ICl-oil dissolved in the solvent-
(petroleum ether, diethyl ether and acetic acid, 70,30,1.5 V V V ) were
recognized by scanning on the UV-visible UNICAM sp 820 series 2 in
order to identify any change in the absorption peaks and the intensity
at every peak. The results are given in figures 6 - 1 6 and table 11.
Olive oil was labelled using inactive laboratory prepared ICl. The
ICl was prepared in the following manner :
b) Preparation of (ICl) for labelling :-
In a separating funnel 0.045 mM potassium iodide (11.25 ml), 0.21
mM potassium iodate 3.75 ml and 8 ml saturated solution of sodium

TABLE 11 : THE ULTRA VIOLET SPECTRUM STUDIES FORLABELLING OF OLIVE OIL BY INACTIVE ICL
System Peak in my ( O p t i c a lDens i t y ) Comment
0.1 M Nal ,inSolvent 1A"
251 (1.56), 257(1.66) and
l - " > Figure (7)
3 peaks characterist icof Nal
2% Oleic acidin 1A';
246 (1.52), 250(1.5), 256(1.26), 266(1.52)
Figure (12)
The four peaks arecharacter ist ic of oleicacid 246, 250, 256, and266
1% Oleic acidin 1A* + traceNal
21*5(1.26), 250(1.46),256(1.20) and 267(1.30)
Figure (14)
Small decrease at allpeaks
2% Oleic acidin 1A'r+ traceNal + 2g si 1icagel
246(1.22), 250(1.34),256(1.01), and 266 (1.18)
Figure (13)
Small decrease at allpeaks.
2% Olive oil in 245(1.28), 251(1.54),1A* 257(1-50), and 267(1.8)
Figure (9)
Four peaks characteristicof olive orl 245, 251,257, and 267
2% 01ive oilin 1A: +trace Nal
246(1.24), 250(1.44),257(1.38), and 267(1.66)
Figure (11)
Small decrease at allpeaks
2% Olive oilin 1AV + traceNal + 2 gsi 1ica gel
245(1-24), 250(1.48),257(1.44), and 267(1.74)
Figure (10)
I, ( 0.39)mM 245(1.18), 250(1.44), 2572 (1.38), 262(1.24)in 1A- Figure (6)
1A = Petroleum ether, Diethyl ether, Acetic acid. 70: 30 : 1.5, V:V:V
Continued

Table 11 (Continued)
46
System Peak in my ( O p t i c a lDens i t y )
Comments
IC1(Prepared)0.39mM in 1A
245(1.2), 250(1.54), 257(1.54),and 263(1.42)
Figure (8)
in
12h, 24h
277(1.4), 271(1.36)
(15)
Two
characteristicof ^belled
0.39mM IC10.3 ml OliveOil in 1A +3 g Si 1icagel after1h, 12, 24h
277(0.8), 270 (0.76)
Figure (16)
There is adecrease ata l l peaks

ISO J'S
Uaveiength (myO
Figure (6) : 0.39 mhl in [lA] [petroleum ether, Diethyl ether,
Acetic acid. 70 : 30 : 1.5. V:V:V]
JJ5 TSO
Wavelength (mju)
Figure (7) : 0.1 M Nal in [1A]
o
Wavelength (m/j)
Figure (8) : 0.39 mM ICl in [1A]

Figure (9) : 01ive o i l in 1A
oin
€
J« 730 J'S 300
wavelength (m^i)
Figure (10) : Ol ive o i l +t race Nal + s i l i c a gel in 1A
:>9 'so
Wavelength (m;u)
Figure (11) : O l ive o i l +- t race Nal in 1A

250 374
Wavelength (m_/i)
Figure (12) : Oleic acid in 1A
Figure (13) •: Oleic acid +trace Nal + silica gel in 1A
Figure {\k) : Oleic acid +trace Nal in 1A

50
ISO 37 : 3CO
Wavelength (mji)3 16
Time in hours
Figure (15) : Labelled oilive oil after a) 1h b) 12h c )
lit
Wavelength (mju)8 16
Time in hours
Figure (16) : Label led o l i v e o i l in the presence of s i l i c a gel
a f t e r a) 1h b) 12h c)
2 4

51
chloride, and 30 ml of (petroleum ether, diethyl ether and acetic
acid 70,30, 1.5 V/V/V) were then added. The whole content of the
funnel was shaken well and 5.0 mM hydrochloric acid (5 ml) was added.
The funnel snaked until the pink color of the iodine monochloride (ICl)
developed. The ICl was immediately separated in the organic layer and
used for labelling.
c) Labelling Procedure :-
In a 50 ml conical flask 0.39 mM of ICl 0.3 ml of olive oil are mixed
together. The flask contents were stirred by magnetic stirrer.
Labelling process was followed up through the spectroscopy method.
The results are demonstrated in figures 15, and 16.
2.3 . Iodine-125 monochloride method
a) Preparation of (125IC1):
In a separating funnel containing 0.0045 mM (1.125 ml) potassium
iodide, 0.021 mM (0.375 ml) potassium iodate and about 20 v Ci of
Na125I(74xl04Bq). 0.5 ml of saturated solution of sodium chloride and 3
ml of organic solvent were then added. The whole content of the
funnel was shaken well and 0.5 mM (0.5 ml) hydrochloric acid was
added. The funnel shaked untill the color of the radioactive iodine•I n c 125
monochloride ( I C l ) deveolped (table 12). The ICl was immediately
separated and used for labelling.

52
TABLE 12 : DISTRIBUTION COEFFICIENT OF 20 uCI
OF 125ICl AT ROOM TEMPERATURE
ORGANIC
SOLVENT
Benzene
Pe t ro l e r Ether
D. E. E.
n-Heptane
BETWEEN AQUOUS
LAYER
COLOR
Pink
Pink
Faint Yellow
Purple
LAYER AND ORGANIC
D I S T R I B U T I O N
C O E F F I C I E N T
41.38*
75*
Sk.k%

53
IOC
b) labelling Procedure with ("3IC1) :
In a 10 ml round bottom flask fitted with a condenser we put 0.039
125mM of IC1, 30 ul of olive oil (or oleic acid) and 3 ml of the organic
solvent and stirred by magnetic stirrer. Tap water was used as cooling
system in the condenser. A water bath was also used to adjust the
temperature at the required degree. The round bottom flask has an
opening with a septum for specimen handling by a syringe at different
periods of time to find out the labelling percentage. Each specimen
taken was 10 ul.
The percentage of labelling is shown in Figure (17) for olive oil and
in figure (18) for oleic acid in different solvents.
As it has been noticed that the labelling yield was changing from
one preparation to the other showing the great dependence of labelling
125on the method of IC1 preparation. This called for the use of
commercial iodine monochloride (IC1) instead of that prepared in the
laboratory. Figure (19) compares the labelling yield with IC1 prepared
in the laboratory and the commercial IC1 (purified and unpurified).
The purity of the commercial iodine monochloride (IC1) (Merck) was
tested to determine the percentage of free iodine (I , ) through the use
of sodium thiosulfate (75) (Na2S2O35H20). It was found that the
commercial iodine monochloride (IC1) used in this work contains 12% as
free iodine.

TO
• 0
• 0
40.
•
M
10
. . .
.jf—*"' * A- A—
/
A• a
B
A
C
a
A
®
10 90 SO 70 90 110 ISO ISO 170 190 210 230 250
Time in minutes
Figure (17 ) : Labelling of Olive oil with iodine monochloride (IC1)
A . in diethyl ether at 33°C
B. in petroleum ether at 5b°C
C. in n-heptane at 95°C
D. in benzene at 76°C

55
80 '
70
60
90
.-.40«*
•D
"5 30
20
10
-B- -a-
A-B- -a-
10 30 50 70 90 110 130 150 170 190 210 230 250
Time in minutes
Figure (i8) : Labelling of oleic acid with iodine monochioride (IC1)
A in diethyl ether at 33°C
B in petroleum ether at 56°C
C in n-heptane at 95°C
D in benzene at 76°C

56
6 0 -o-
so
40
30
20
10
1 0 3° 50 70 90 110 130 150 170 190 210 230 250
Time in minutes
Figure (19) : Labelling of oleic acid with iodine monochloride
( 1 2 5 . e i )
A = Commercial IC1 in benzene at 76°C
B = Purified commercial Id in benzene at 76°C
C = Prepared I C.I in benzene at 76°C

57
The commercial iodine monochloride was purified from the free iodine
using the solvent extraction by tb<j organic solvents CC1- and COEO.4 6 6
Table ( i j ) show the wavelength of maximum
absorption of I2 and IC1 in different solvents. Figure (20) shows the
wavelength of maximum absorption of IC1.
TABLE (13) : WAVE LENGTHS OF MAXIMUM ABSORPTION
IN DIFFERENT SOLVENTS
Species
Solvent
C 6 H 6
'2
X nm
519
501
297
Extinction
coefficient
900
1036
9767
IC1
Anm
1*60
<»35
287
Extinction
coefficient
160
220
9600 - 9000

10000
5000
1000300'
200 300
1}IC1 in CCl^2)I"I in *c en sens
400 500
Figure (20) : Wavelength of maximum absorpXion of IC1

59
2.4. Labelling of Olive Oil and Oleic acid with Chloramine-T (CAT):
a) Preparation of CAT Solution:
2 mg of CAT (Riedel-de Haen) was dissolved in 10 ml of acetone at
room temperature. The dissolved CAT was freshly prepared within 10
minutes of starting the experiment.
b) Labelling Procedure with CAT :
In a 10 ml round bottom flask fitted with a condenser we put 20P ci19> 4 191
of Na i ' !3I (74 x 10* Bq). The Na ^ I was dehydrated under vaccum.
3 ml of the organic solvent, 30 yl of olive oil (or oleic acid) and 5 pi of
CAT were then added and stirred by magnetic stirrer. Tap water was
used as a cooling system in the condenser. A water bath was also used
to adjust the temperature at the required degree. The round bottom
flask has an opening with a septum for specimen-handling by a syringe
at different periods of time to find out the labelling percentage. Each
specimen taken was 10 yl.
The labelling yield is shown in Figure (21) for olive oil and Figure
(22) for oleic acid.
2.5 Quality Control Systems:
Thin layer chromatography technique was used to determine the

60
3 O i
80 120 160 200
TIME IN MINUTES
240
F i a u r e (21) : Labe l l ing of O l i ve Oi l w i t i . (CAT)
A in n-heptane a t 95°C
B in methy l -n-propy l -ketone a t 7OCC
C in benzene a t 76CC
D in acetone a t *i5°C

61
80 120 16 200Time in minutes
240
Figure (22) : Labelling of oleic acid with (CAT)
A in n-heptane at 95°C
B in methyl-n-propyl-ketone at 70°C
C in benzene at 76CC
D in acetone at i»5°C

62
quality of labelling. Infrared spectrophotometry was used to determine
the location of labelling.
In the following a review on chromatographic methods is given.
2.5.a Thin-layer Chromatography Technique (TLC) :
A good deal of work has been carried out on fatty acids analysis by
TLC. In the following paragraphs a review of some aspects of this
work is given.
Sgoutas and Kumnerow (76) have studied the methyl
polybromostearates corresponding to oleic, linoleic and linolenic acids.
They used a thin layer (250-275y ) of silica gel on glass (20x20 cm), a
mixture of 96 vol. of Skely solvent B (bp67-68°C) and 4 vol. of
anhydrous ether served as the developing system for the separation of
the bromo-derivatives.
The results of R- values of brominated methyl esters of fatty acids
were (0.78, 0.75 and 0.73) for methyl oleate, methyl linoleate and
methyl linolenate respectively.
Tuna, et al.(52) reported the radioiodenation of olive oil and oleic
acid. They used a glass plate (20 x 20 cm) which has been coated with
a thin layer of silica gel. The developing system, they

63
used was a mixture of petroleum hydrocarbon (b.p. 60-70°C), diethyl
ether and glacial acetic acid (70 : 30 : 2, V:V:V respectively).
The results of R,. values of olive oil and oleic acid were 0.6 and
0.44 respectively.
Robinson and Lee (57) studied the radioiodenation of fatty acid131( I-oleic acid). The radioiodenated fatty acid was determined by TLC
on cellulose acetate using 320:80:1 heptane, diethyl ether and acetic
acid as a solvent. They found that free iodide remained near the
origin whereas the fatty acid migrates with R,. value of 0.8 - 0.9.
Bevenue (77) outlined a note of thin-layer chromatographic exami-
nation of various seed oils. He used plastic sheets pre-coated with 0.1
mm of cellulose. The sheets were developed in glacial acetic acid.
This was less efficient in the separation of the various components of
the oil sample and less sensitive in detection by the iodine-starch
reaction. On the other hand, Bevenue (77) found that the sheets
which were coated with liquid paraffin and developed in glacial acetic
acid gave good distribution.
Beierwaltes, Shaw and Roy (78) studied the myocardial uptake of
labelled oleic and linoleic acids, the total triglycerides of olive oil. The
sample of olive oil was dissolved in petroleum ether (bp30-50°C) and
then silica gel plate (20 x 20 cm) of 0.5 mm layer thickness was

used. The plate was developed in petroleum ether (bp 30-50°C) diethyl
ether (99%) and formic acid (70:30:1.5, V:V:V). Bands were visualized
by spraying the plate with 2.7 dichloroflorescein in ethanol (0.1* YKV).
The band containing the total triglycerides ( R* s 0.85) was separated
off and exhaustively extracted with CHC1,. Radiochemical purity of
their products was ascertained with thin-layer chromatography using
silica gel with flourescein indicator and solvent system of petroleum
ether, diethyl ether and acetic acid (90:10:0.5, V:V:V). The labelled
products gave R*. of 0.44 for oleic acid and R,. of 0.36 for linoleic acid.
Damiani and Burini (79) reported the determination of the
triglyceride composition of olive oil by a multistep procedure to isolate
the total triglycerides of olive oil. The sample of olive oil was
dissolved in petroleum ether (bp 30-50°C) and then silica gel plate (20
x 20 cm) of 0.5 mm layer thickness was used. The plate was developed
in petroleum ether (bp 3O-5O°C) diethyl ether (99*) and formic acid
(70:30:1.5, V:V:V). Bands were visualized by spraying the plate with
2.7 dichloro-florescein in ethanol (0.1% W/V). The band containing the
total triglycerides (Rj. 0.85) was separated off and exhaustively
extracted with CHC1_.
At the beginning we used five systems to determine the Rf for the
olive oil, oleic ac\d and radioactive sodium iodide with carrier. Tables
(14, 15, 16) show our results for different three systems.

65
System 1 :
The eluent was petroleum ether, diethyl ether and 99 formic acid
(70:30:1.5, V:V:V). Table (14)
System 2 :
The eluent was n-hepatane, diethyl ether and acetic acid (320:80:2,
V:V:V). Table (15)
System 3 :
The eluent was methanol and HgO (85:15, V:V). Table (16).
System 4 :
The eleuent was 99 acetic acid. DC-plastic sheet coated with
cellulose 0.1 mm without florescent and glass plates coated with silica
gel 0.2 mm with floresint F2 5 4 were used. This system does not show a
clear distribution neither for olive oil nor for oleic acid.
System 5 :
The eluent was petroleum ether, diethyl ether and 99 acetic acid
(70:30:1.5, V:V:V). Glass plates coated with silica gel with flourescent

66
TABLE ( I t )
SYSTEM (1)
The eluent was petroleum e ther , diethyl ether and 99% formic acid (70:30:1.5, V:V:V)
De-Plastic sheetCellulose 0.1mm
Conroonent without flourescent
glass p la t i c ( s i l i cage l ) 0.2nun Aluminum Sheetcoated withs i l i cage l 0.2mm
F_,_. with flourescent
I2-Vapor D.C.F* I -Vapor U.V. D.C.F* I2-Vapor
Olive Rf = 1 Rf = 1 R- =0.37 R =0.45 Rf=l R,. =0.31Oil
Rf,=0.45 R f2=l Rf2=0.48
R f.=0.9+ R£3=0.69
Rf4= 1 + ' ' Rf4=1+
OleicAcid
Rf x = 1 Rf = 1 Rfl=0.16 R£1=0.41 Rf=0.62 Rf=l
Rf2=0.22 Rf2=0.69
Rf3=O.27+ Rf3=0.76
Rf4=0.81
v 125 TNa I Rf = 0. (activity}** Not (activity)Regular
Rf=0 (activity)
125 IC1 Rf = 0 (activity) Rf=0 (activity)
+ = wide band* = 1:0.05% ethanolic spray solution of 2,7-dichlorof lurescein. See Ref.** = Counted using a Beckmann gan.ma counter (5500).

67
TABLE (15) :SYSTEM (2)
The eluent was n-heptane, diethyl ether and acetic acid (320:80:2, V:V:V)
De-Plastic sheet glass paltic (silicagel) 0.2mm Aluminum sheetcoated withsilicagel 0.2mm
Cellulose ).lmm ¥ with flourescentComponent without flourescent
I2=Vapor D.C.F. I2=Vapor U.V. D.C.P
OliveOil
Rf - 1 R£1=0.
R£2=0.
Rf3=0.
R f 4=o.
9
1
16
19
Rfl=0.
R£2=0.
Rf3=0.
1 D — r
14
54
1.51 R£1=0
Rf2=0
Rf3 = 0
Rf4=°
.55
.9
.14
.16
R£5=0.49
Oleicacid
R- = 0.81 Rfl=0.14 R£=0.39 R£=0.31 Rfl=0.38
R£2=0.47 R£2=0.86
Na 1 2 5Iwithcarrier
R£ = 0 (activity) Rf=0 (activity) Rf=0 (activity)
125ICl Rf=0 (activity) R£=0 (activity) R£=0 (activity)
( + = wide band )

68
TABLE (16) :SYSTEM (3) :
The eluent was Methanol : H20 (8S:IS, V:V)
DC-Plastic sheet glass platic (silicagel) 0.2mm Aluminum sheetCellulose 0.1mm F_5. with flourescent coated with
Component without flourescent silicagel 0.2mm
I2-Vapor D.C.F 12-Vapor U.V. D.C.F. I2~Vapor
Olive Rf = 0+ Rf = 0 Rf=0
+ Rf=0+ Rf=0
+ R-=0+
Oil t
Oleic Rf = Rf=0.49 Rf= Rf=0.52+ Rf=0.48
+ Rf=0.65+
acid 0.17-0.96+ 0.4-0.9+
Na 125I Rf = 1 Rf = 1 R, = 1withcarrier
1 IC1 Rf = 1 (activity) Rf = 1 (activity) Rf=l (activity)
( + = wide band)

^254 w a s usec*" "^^s s v s t e m gave Rf f° r olive oil as follows:
R f l = 1> Rf2 = ° ' 2 9 a n d B 3 = ° ' 2 5
Of these five tested systems, the second system was chosen for use
during our work becuase it gave good distribution and the radioactive
material remains at the origin. The plastic plates coated with cellulose
(0.1 mm) (Merk) was used during our study because it is easy to cut
when we want to count the radioactivity.
2.5-b IR-Spectrum :
In the IR-spectrum study for both olive oil (figure 23) and oleic
acid (figure 25), the unsaturated bond was demonstrated at a wave
number of 1400-1500 cm" . This un
bi-peak (a? shown in the two figures).
number of 1400-1500 cm . This unsaturated bond is shown as a
In order to know the effect of temperature change on the
IR-spectrum for both olive oil and oleic acid, temperature was raised
up to 90°C for 2h. The IR-spectrum was, then taken but no change
has been noticed as it is cleared out from figure (24) and figure (26).
To study the effect of iodine (I~) on the double bond, two organic
solvents were used which are benzene (C-H«) and carbon tetrachlorideb b
(CC1.). IR-spectra for iodine 0.1 M in benzene and carbon tetra-

70
chloride are shown in figure (27) and figure (28) respectively. The
spectra for oleic acid dissolved in benzene and carbon tetrachloride are
shown in figure (29) and figure (31) respectively. 0.2 mM of iodine
were then added to the oleic acid dissolved in benzene and to the oleic
acid dissolved in carbon tetrachloride. The temperature was raised
up to 35°C with continuous stirring for 2 h. The spectra for these are
shown in figure (30) and figure (32) respectively. It is found that
presence of iodine causes some change in the spectrum, especially, on
the bi-peak at a wave number of 1400-1500 cm" which represents the
double bond. This gives an evidence that iodine has caused some
change in the double bond. In fact we have to study this point in
depth in order to identify the exact change in the double bond.
Lastly, the spectrum of oleic acid labelled with Kl was taken. It
was noticed that some change has already happened in the bi-peak at
the wave number of 1400-1500 Cm"1 . This change is demonstrated in
figure (33).

71
Uavenumber cm"
Figure (23) : 01ive oi 1
Wavenumber cm-1
Figure [2k) : Olive oil heated at 90°C for 2 hours

72
Uavenumber cm
Figure (25) : Ole ic ac id
Uaveniimber cm-1
Figure (26) Oleic acid heated at 9O°C for 2 hours

73
- Wavenuniber cm-1
Figure (27) : 0 .1 M I in benzene
Uavenumber cm
Figure (28) : 0.1M
-1

Wavenuniber cm"
Figure (29) Oleic acid dissolved in benzene
Wavenuniber cm"1
Figure (30) : Labelling of Oleic acid with I in benzene

75
Wavenumher cm" '
Figure (31) : Oliec acid dissolved in CC1,
Wavenumber cm
Figure (32) : Labelling of Oleic acid with

76
MOO 1400
Wavenumber cm-1BOO
F i g u r e (33) : L a b e l l i n g of O l e i c a c i d w i t h IC1

CHAPTER 3 : DISCUSSION and CONCLUSIONS
3.1 Labelling of Olive Oil and Oliec Acid withIodine Monochloride Method.
3.2 Labelling of Olive Oil and Oliec Acid with Chlor-amine-T Method.

78
CHAPTER 3 : DISCUSSION AND CONCLUSIONS
3.1. Labelling of Olive Oil and Oleic Add with Iodine Monochloride
(IC1):
Iodine monochloride (IC1) was discovered by Davy and Gay-lassac
(83).Greenbaum used iodine monochloride (IC1) for the iodination of oils
since 1937 (84). In 1967 Helmkamp (85, 86) used (IC1) for
131
I-labelling of proteins.
The chemical forms of iodine species that react with fatty acids
using (IC1) has so far not been identified unequivocally (87). In this
work for labelling of olive oil and oleic acid using (IC1), an inactive
prepared (IC1) was firstly used and the labelling process was followed
up through the U.V. spectrum. Ultra-violet absorption peaks of !„,
IC1, Nal, oleic acid and olive oil dissolved in [Petroleum ether, diethyl
ether, acetic acid, (70:30:1.5, V:V:V)] [1A] and measured against the
same solvent as blank were identified. As a result of the Ultra-violet
spectrophotometric studies for the different chemicals used, table (11)
and figures (6-14) illustrate that there are three absorption peaks at
wave lengths of 251, 257, 246 m y for Nal, four absorption peaks at
wave lengths of 245, 250, 257, 262 m y for I , , four absorption peaks
at wave lengths of 245, 250, 257, 263 m y for IC1, four absorption
peaks at wave lengths of 246, 250, 256, 266 my for oleic acid and four
absorption peaks at wave lengths of 245, 251, 257, 267 my for olive oil.
From these results it appears that we can rely on absorption peak
at 266-267 millimicrons to recognise the oil in presence of Nal since this

79
peak does not appear in Nal spectrum. The addition of silica gel,
figures (10, 13, 16) show that it absorbs not only oleic acid and olive
oil but also the labelled olive oil indicating that one can not use silica
gel for purification of the oil from other species.
When IC1 was added to olive oil two new absorption peaks at 271
and 277 my appear which differ from those peaks of both IC1 and/or
olive oil. This is an evidence of a new product formation which is
iodinated labelled olive oil. The change in absorbancy of this peak with
time (lh, 12h, 24h) shows that the maximum labelling took place after
one hour and that labelling decreases with time indicating the
unstability of labelled olive oil. This unstability may be attributed to
chemical damage caused by the high concentrations of iodinating
reagents used and/or by impurities that may be present in iodide
solutions or as a result of alteration of the structure of the oil (88).
Radio-active laboratory prepared IC1 was then used with benzene
(at 76°C), petroleum ether (at 56°C), diethyl ether (at 33°C) and
n-heptane (at 95°C) as solvents. The highest yield was obtained
through using diethyl ether. The yield was more than 80! for oleic
acid and more than 10% for olive oil after 15 minutes. The labelling
yield of oleic acid in petroleum ether increased with the increase of time
reaching a maximum percentage of 62% after 120 minutes. In case of
n-heptane, labelling yield was found to reach maximum value of 63%
after 5 minutes then decreased sharply to 40$ at 100 minutes period.

80
This decrease may be attributed to the fact that the C-I bond
(238 KJ mol ) (91) is relatively weak compared with the C-H bond
(412 KJ mol" )(91) and it is therefore not surprising, with increase of
temperature (95°C) and long reaction time, that one of the main
impurities formed in self-decomposition of iodine labelled compounds is
inorganic iodine (92). Benzene shows the lowest labelling yield of 25%
although at the beginning the percentage of labelling increases from 5%
at 5 minutes to reach a maximum value of 43% after 60 minutes.
In case of olive oil, the case is approximately the same where the
highest labelling was achieved when using diethyl ether. In petroleum
ether the same trend in labelling was noticed, where labelling increase
with the increase of time reaching stable value of 35% at 55 minutes
period. The same trend was noticed in case of benzene and n-heptane.
However in case of olive oil the labelling yield was lower in benzene
than in heptane a case which is the same as what had happened in
oleic acid.
The lower labelling yield in case of olive oil may be attributed to
the fact that olive oil used in this work contains only 58.12% as oleic
acid, and 13.69% as linoleic acid i.e. approximately 71% of the olive oil
is found as unsaturated fatty acids, a case which indicates again that
labelling took place in the double bond which is in good agreemnt with
other authors working on caster oil (89).

81
As benzene shows the lowest labelling percentage in case of oleic125acid curve it was chosen as the solvent for labelling using the I d
prepared from commercial I d . Figure (13) gives the percentage of125labelling of oleic acid using purified and unpurified I d . From this
125curve it appears that commercial IC1 gave a higher labelling yield125than that of I d prepared in the laboratory. 65% labelling yield was
reached in the first 15 minutes period in contrast to a yield of only 22%125for the prepared I d . The commercial IC1 purified from the other
iodine species, however gave only a yield of about 40% after 15 minutes.
This reduction in the yield in case of purified IC1 indicates that other
iodine species share in the labelling process. It appears that the
labelling takes place to some extent as a result of the persence of the
species I d , !„ , I, and IOH depending on the medium used (90).
51" + IO- + 6H+ ^ 3I2 + 3H2O
3I~ + 3H O + ?=* 3H0I +31,
3HOI + 3H+ + 3d" = £ 3IC1 + 3H2O
The IR-spectrum for Io added to the oleic acid in CC1. solvent^ 4
(figure 32) shows a change in the double bond indicating that I« also
labels the oil.

82
j Labelling of Olive Oil and Oleic Acid With Chloranrine-T(CAT)
The use of (CAT) is considered to be as one of the oxidation
uethods which was widely used in labelling experiments. Chloramines
> iBve been used in the past for the generation of IC1 to iodinate anilides
as well as phenol, naphthol, and aromatic ethers (87).
if
: IC1 is obtained in acidic medium by the reactionVN-C1+2HI = ^N-H+HC1+I2
The HC1 reacts with another molecule of chloramine, liberating
f- chlorine, which combines with iodine to yield I d .
H Hunter (80, 81) used this method for studying the labelling of
J, proteins with iodine.
f-
; Krohn (82) used the same system for studying the possibility of
labelling fibrinogen with radioiodine.
The commercially available chloramine-T is the sodium salt of
Pl-chloro-p-toluene-sulfon-amide] the formula of which is shown below:
CH.
A s is generally known electronegativity is a property which
indicates that an atom tends to attract an electron. Since chlorine is
I
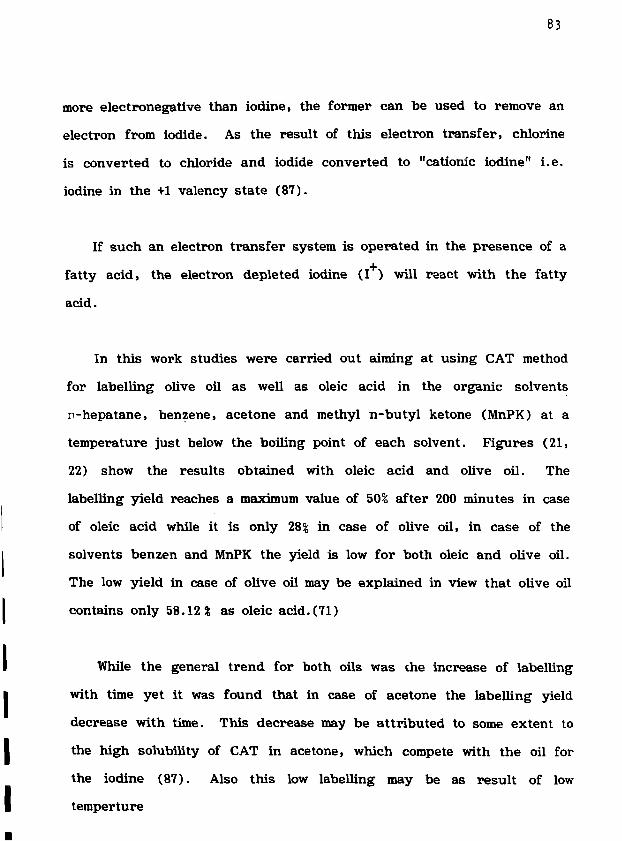
83
more electronegative than iodine, the former can be used to remove an
electron from iodide. As the result of this electron transfer, chlorine
is converted to chloride and iodide converted to "cationic iodine" i.e.
iodine in the +1 valency state (87).
If such an electron transfer system is operated in the presence of a
fatty acid, the electron depleted iodine (I ) will react with the fatty
acid.
In this work studies were carried out aiming at using CAT method
for labelling olive oil as well as oleic acid in the organic solvents
n-hepatane, benzene, acetone and methyl n-butyl ketone (MnPK) at a
temperature just below the boiling point of each solvent. Figures (21,
22) show the results obtained with oleic acid and olive oil. The
labelling yield reaches a maximum value of 50% after 200 minutes in case
of oleic acid while it is only 28% in case of olive oil, in case of the
solvents benzen and MnPK the yield is low for both oleic and olive oil.
The low yield in case of olive oil may be explained in view that olive oil
contains only 58.12% as oleic acid. (71)
While the general trend for both oils was che increase of labelling
with time yet it was found that in case of acetone the labelling yield
decrease with time. This decrease may be attributed to some extent to
the high solubility of CAT in acetone, which compete with the oil for
the iodine (87). Also this low labelling may be as result of low
temperture

(4F°C) in case of acetone which means low release of CAT from the
acstone. In accordance with Greenwood (138) there appears to be a
critical amount of the reagent (CAT) below which labelling is
i isignificant. Bocci (139) reported that an inverse relationship exists
Vetween reaction time and the amount of oxidant used, which may
explain the low yield in case of acetone as a result of low oxidant
concentration available.

CHAPTER 4 : LABELLING OF OIL WITH 9 9 mTc
4.1 Introduction.
4.1.1 Generator Fundamentals.
4.1.2 Technetium-99m Milking System.
4.1.3 Methods for Separation of " T C .
4.1.4 Comparison of ^Tc Generator Forms.
4.1.5 Use of 9 9 mTc in Labelling.
4.2 Experimental and Results.
4.2.1 Preparation and Control of 9 inTe.
4.2.2 Determination of Radiocontaminants in Old ^ T c Generators.
4.2.3 Quality Control by Thin Layer Chromatography and PaperChromatography.
4.2.4 Labelling of OKve Oil by 9 9 mTc.
4.2.5 Labelling of Olive Oil by Reduced 9 9 m Tc.

86
CHAPTER 4 : TECHNETIUM
4.1 Introduction :
Severs! short-lived radioisotopes which are useful in clinical
radioisotope work are the daughters of longer-lived parents. It is thus
possible to perpare a generator or "cow" containing the parent
radioisotope from which the daughter can be "milked" whenever it is
needed. Table (2) gives details of a number of these parent daughter
systems.
4.1.1 Generator Fundamentals (96) :
Milking systems are well known for a long time (97). The most
important factor in these systems is the establishment of transient
equilibrium between the parent and its daughter isotope. The parent
99isotope Mo ( t 1 / 9=66.7h) which is freshly purified from its daughter
99m 99products ( Tc + Tc) will continue to generate technetium isotopes
99as a result of beta decay of Mo (98).
From the laws governing the transient equilibrium (3, 4), the99 99m
maximum total activity of the mixture ( M o + Tc) will be reached at
time (t ) given by :

87
XTc 'XMo 2 XMo XTc " XMo
99 99m
which is 17 hours in case of Mo + Tc mixture. The generatedmTc reaches its maximum activity at a time "t"" independant of the
counter detection efficiency given by :
t - = * ta T c
m XTc ~ AMo XMo
This time is 22.91 hours for technetium-99m. On the above
mentioned bases the changes of activities in a generator with time is99given in table (17) and in figure (34) (for s 886 mCi Mo produced
as a result of irradiation of 25 gin MoO_ at thermal neutron flux ofo
13 210 n'cm . s for saturation).

88
TABLE (17) : CHANGE OF ACTIVITIES WITH TIME IN
A 100mCi99Mo GENERATOR (Ref. 96)
Generatoractivity
mCi
100
78
60.8
A7.5
37
29>22.5
17.6
13.7
10.7
8.3
Generator age(from time of dispatch day)
Zero
1
2
3
k
5
6
7
8
9
10
9 9 l\c Activitymi Iked* perstage mCi
di spatched
62. k
kB.6
38
29.6
23.2
18
14.1
11
8.6
8.6

89
1024 48 72 96
TIKE (HOURS)
120 144
Figure (3*0 : Theoretical Growth and Decay of99mTc in Pure Parent 99Mo. (96)

90
When the transient radioactive equilibrium is established, the
activity of the generated technetium is 1.098 greater than that of the
99parent Mo considering equal detection efficiency.
The nuclear properties of 99m-technetium isotope are shown in
99 99table (18). The decay sequences of the parent isotope Mo to Ruare as follows (100):
8
x 10py)
99
The decay shceme of Tc (101) as well as 'is parent isotope
JVIo are given in figure (35 and 36).
TABLE ( 1 8 ) : NUCLEAR DATA FOR TECHNETIUM
Isotope
" m T c 6.0h9 9Tc
( 99Tc h a l f - l i f e
2.12 X 10⁵yr,
B to 99Ru
Mode of decay,Energy (Number/100disintegrations)
Isometric t rans i t ion
y-rays from Tc
0.0022 (98.6)
0.U05 (98.6)
0.U27 (I.**)
Method ofProducing Isotope
Parent/daughter system
99M Q 67hr 99mTc
99 6 "Mo produced by reactor
i r rad ia t ion of 5 V > (23-75S
or by separation from
f iss ion products.

0.142 McV-
0.140 .McV-
0.0
"•Tr
98.6% 7. (Internalconversion ratio = 0.005)
i "Tr ( T | = 2. I X 10'vr)
__"Ru (Stable)
-»,= O.OOi McV7 : = 0. HO McV1 i = 0 . H 2 McV
Figure (35) : The decay scheme of Tc .
Molybdenum-99Btla-minui decay
91
1
\
n0
1 00*?1
;
0 9208
0 67U
C 5090
rt o igio
9 l\ 0 I4Z6
F i g u r e (36) : The decay scheme o f99
Mo

92
Advantages and Disadvantages in Selecting "'Tc for medical use:
Technetium-99m was selected for use in nuclear medicine because
of many advantages it has. These advantages are that the -y-ray
energy of 140 KeV is ideally suited for the Anger Camei'a. It gives
excellent resolution and efficiency with a low energy collimator; raTc
does not have a primary particle emission and its low internal
conversion of its 140 KeV y-ray and its 6h half-life allow the use of
large quantities of the radionuclide with low i*adiation dose to the
99patient. The parent Mo has a 66.7h half life period which allows time
for shipment from manufacturer to hospitals, and finally the 6h half-life
of mTc allows rapid buildup of activity permitting frequent milking of
the generator.
On the other hand, Tc has some disadvantages which are that
99the 66.7h half-life of the Mo requires that the generator be replaced
weekly and requires shipment by air to distant places from the
manufacturer. The low y r a y energy of 140 KeV does not make it
ideally suited to detect deep-seated lesions in the body, the short
half-life of 6h is a disadvantage when delayed scanning procedures are
required and the chemistry of technetium is not well known and the
multiple oxidation states make it difficult to label certain compounds or
reagents (102).

93
-:." % ~ ,1-tinetfaim - 99m MiHring System:
In the preparation of any milking system, one of the important
factors is the purity and specific activity of the parent isotope. In99technetium generator, the parent isotope is Molybdenum-99, ( Mo).
99The specific activity as well as the purity of the Mo depends on the
way by which it is prepared.
Molybdenum-99 can be prepared in a nuclear reactor by:
a) Irradiation of natural molybdenum target mainly the oxide (MoO»)QQ QQ
according to the nuclear reaction: Mo (n, y ) Mo.
The radioactive (96) contaminants that may appear as side nuclear
reactions are given in table (19). Zirconium and Niobium isotopes are
the main contaminants, depending on irradiation time, cooling time and
the neutron flux. Molybdenum-99 produced by this way is of low
specific activity.

TABLE (19) : RADIOACTIVE ISOTOPES PRODUCED ON
IRRADIATING STABLE MOLYBDENUM IN
NUCLEAR REACTOR
Sk
Nuclear
Nuclide
92MO
Mo
95MO
96Mo
97Mo
98Mo
1 0 0MO
IReaction
Abundance
15.9
9-1
15-7
16.5
3.k
23.8
9.6
Isotope t.
93Mo 2 y
93mMo 7 h
99Mo 67 h
101Mo 15m
n,PIsotope
92mNb10
92Nb 10:
9\lb2.7
95Nb 35
96Nb 23
97Nb 72
1
ti
d
'»
,o\
d
h
m
n ,a
1sotope
89Zr 97
93Zx9-5
95Zr 65
97Zr 17
t.
h
D5y
d
h
n . 2n, or
1sotope tJ
91Mo 15.5m
91mMo65 s
93 S 93mMo
Mo 67 h
See Ref. (96)

95
98b) Irradiation of molybdenum enriched in Mo by thermal
neutrons. In order to increase the specific activity and decrease to
some extent the radioimpurities, targets enriched upto 90 % in
molybdenum of mass 98 are irradiated in the neutron flux of a reactor.
The Molybdenum -99 produced by this way is of high specific activity.
However the price of enriched material is of high cost. To overcome
the expensive enriched targets some authors reported the use of recoil
techniques (96) on natural molybdenum materials or by transferring the
molybdate to the complexed chemical form phosphomolybdate.
oQg 238c) Irradiation of U or U targets in a stream of neutrons
235where molybdenum-99 is produced as result of fission U (n, fission)
Mo. The molybdenum-99 produced by this way is of very high99specific activity, may be carrier free. Fission-product Mo demands
elaborate and expensive processing facilities, and extreme care to avoid
contaminating the product with over fission products and the
highly-toxic a-emitting transuranic radionuclides. Despite the high
235 99
fission cross section of U and the high fission yield of Mo the
overall yield has to be restricted because of such practical
considerations as the ability to dissipate nuclear heat or to dispose of99highly radioactive waste. The specific activity of fission-produced Mo
is high ( >104 Cig"1). (3 , 95, 96)
The criteria for choosing the method of Mo production must
include economic, resources, and mode of utilisation. The practical

99difficulties associated with the production of fission Mo ore reflected
in the costs even in large-scale manufacture, the cost of producing 1 Ci
99of fission Mo may be upwards of four times of the cost of 1 Ci ofQQ
9 Mo(n, Y ) Mo. Besides the need to process highly radioactive
irradiated uranium in a manner which does not compromise the safety of
the environment, an infrastructure is required to deal with the special
problems of quality control and waste disposal.(4,95)
4.1.3 Methods for Separation of 99mTc :
99 99m
After preparing Mo (the parent isotope of Tc) by any one of
the last mentioned methods and geting it in its very high radiochemical
purity, begins the step of choosing the way by which Tc can be
milked out to receive the required amount of Tc. In the literature
three main methods are reported; 1) chromatography, 2) solvent
extraction, and 3) sublimation methods. A brief account of each method
is given below:
1) Chromatographic Method :
In this method molybdenum-99 in the molybdate or phosphomolybdate
form (96, 97) is retained on some sort of solid sorbing material as
alumina (100, 103, 104), hydrous zirconum oxide (105), manganese
dioxide (102) silica gel (106) or active charcoal (107). 9 9 mTc is milked
*nenever required by appropriate eluant for example isotonic saline

97
lution (0.9fcNacl solution) (96), acid solution of methyl ethyl ketone
5vol*0.01 M HC1) (105), 0.1 M HNO3 (102) or acetone (106).
2. Solvent Extraction Method :
In this method A"C is extracted by some organic solvent for
example methyl ethyl ketone (MEK) (108, 109, 110, 111), isobutyl
•ethyl ketone (112), bis-(2-ethyl-hexyl) phosphoric acid (113) and
pyridine derivatives (114, 115), then transferred to the required
•edium (105, 106, 107, 108) for application.
3. Sublimation Method :
In this method mTc is separated from its parent by sublimation of
the irradiated molybdenum target depending on the different volatilities
of their oxides (115).
*•*•* Comparison of 9mTc Generator Forms (104):
The choice of a particular generator system is usually made for
•chnical, economic and logistic reasons, with emphasis on one or other
these factors depending upon the circumstances.
This brief idea about the more common mTc-generator systemsws that the ideal generator has yet to be invented; all the current

98
i¥ersions have at least one disadvantage will- •' ' i : n d s t o l i m i t t h e i r
practical appl icat ion. The following i . i l - l - " ' < " l t a I n t h e advantages,
disadvantages and prospects of each
|. Chromatographic generator containing
natural molybdenum :
in ing <«. I > " M o P roduced from
Advantages
* Simple processina
* Only inexpensivelow specificac t iv i ty99
Mo requi red.
* Yield not 1imitedby extensivewaste disposalproblems.
* Simple to operateand portable.
* 99m_Tc separated
with high efficie-cy
Disadvant.vi"^
* Large size a Icolumn requ ii"for specific
99activity Mo.
" Low elutionProfile.elute volume.
Prospects
Development ofsubstrates otherthan aluminarequired toreduce thedimensions ofthe generator.

2. Chromatographic generator containing (n,y )98from enriched Mo.:
99
99Mo produced
Advantages Disadvantages Prospects
* Simple processing.
* Easy to operate andportable
* 99mTc separated withhigh efficiency.
* Elution profileimproved.
* Expensive targetmaterial and a veryhigh flux reactorrequired formaximum effort;probably the most
expensive method of
producing regq
unless the Mo isrecyc1ed.
Obsolesence
993. Chromatographic generator containing fission produced Mo
Advantages Oi sadvantages Prospects
-Use of physically smallgenerators permittedbecause of carrier-freecharacteristics of99Mo, giving not only
maximum radioactive
Tc but also reducedshielding mass.
* Simple, to operate andportable.
* Tc separated withhigh efficiency.
* Excellent elutionprofile.
* High capital cost ofprocessing plant;special problemsarising from gaseousfission products andsubsequent environ-mental hazards.
* Elaborate processingprecautions requiredto avoid fissionproduct or trans-uranic contamination
of 99Mo.
* Porblem of disposal ofother fission products.
QOm* High cost per mg Tc.
* Although atpresent this typeof generator iswidely used, itsinherent disadvan-tages are promptinga search foralternatives. Itis predictedtherefore, thatthe fissionqproduced "9Mogenerator wi11eventually besuperceded byadvanced designsincorporating
(n,Y ) 99Mo.

100
The sublimation generator containing (n,Y)Natural molybdenum :
99Mo produced from
D i sadvan tages Prospects
• Only inexpensive low-: Specific act iv i ty 99Mo
requi red•
• Ho chemical processing.
• Capable of being scaledupto Kci quantities.
• Product free fromchemical impurities.
• Very high radioactiveconcentrations easilyattained.
• High radionuclidicpurity.
• Low cost per Mg Tc.
* Version suitable foruse in small nuclearmedicine laboratoriesyet to be developed.
* Separation efficiencyreduced (25 - 50%)and speciallyprogrammed processcycles required toprevent even furtherefficiency deterioration.
DespiteabiIityproduce
itsto
ofexceptional lyhigh quality ,i t can not befully exploiteduntil itsquanti tativeperformancecharacteristicshave beenimproved.
Furtherdevelopmenti s requ i red.
5. The solvent extraction generator containing (n, y )from natural molybdenum :
99,Mo produced
Advan tages D i sadvan tages Prospects
* Only inexpensive lowspecific activity99Mo required.
* Capable of beingscaled up or down toindividual requirements.
High radioactiveconcentration99rn . L,
Tc attainable.
* High radionuclidicPurity.
High separation efficiency
* Low cost per mg 9 9 mTc.
" Apparatus complicated;highly trainedpersonnel required.
* Possible fire hazardwith MEK vapour.
* Possible interferenceby polymeric organic
residues in the 9 9 mTcproduct solution withsubsequent taggingreactions to produceundesirable changes inbiological properties.
Limited onlyif the problemof organicresidues, whichhas brought thismethod intodisrepute, isnot resolved.

101
t s i » of " " T c in Labelling :
The chemical form of mTc milked from the Mo-generator is in the
nertechnetate form TcO~. Chemically, mTcO^ is a rather nonreactive
species and does not label any compound by direct addition. In
labelling by technetium mTc, prior reduction of mTc from the
7+state to a lower valence state (3 +, 4+, or 5+) is required. Various
reducing systems that have been used are Stannous chloride (SnCL
2Ho0) (111). Stannous tartrate (112) ascorbic acid plus ferric chloride
(111), concentrated HC1, (113) sodium borohydride (NaBH4)(lll) and
ferrus sulfate (111). Among these Stennous chloride is the most
commonly used reducing agent in an acidic medium. It is used in most
preparations of mTc labelled compounds. Another method of reduction
of mTc 7+ involves the electrolysis of a mixture of sodium
pertechnetate and the compound to be labelled using an anode of
zirconium (113).
There are many compounds labelled by mTc; some of these
compounds are shown in table (20).

102
TABLE (20) : COMPOUNDS LABELLED BY " mTc
COMPOUND
# Human serum albumen
• Red cell hemoglobin
• Plasmin
* Dimercaposuccinicacid (DMS)
* Fatty Acids
* Oleic Acid
Gentamin
APPLICATION
Nuclear medicine
Nuclear medicine
Medical scintigraphy
investigations of99mTc-DMS biochemicalbehaviour in kidneytissue.
Nuclear medicine
Nuclear medicine
Scintigraphicstudies
Auther
Steigman J. (117)
Dewanjee, M. K. (118}
Sundrehagen, E. (ilV
Razumenic, N. (13^)
Oiengott, D. (115)
Moore, G. et al(119)
Ozker, K. (l16)

a n d R e s u l t s :
i this part of study investigations were carried out aiming at
olive oil with mTc. Since there are no stable technetium
s, and since mTc isotope used is a carrier free, a case in
we are obliged to use only radioactivity counting techniques. The
fhbelling technique used consists of mixing the oil in diethyl ether or
with the mTc in the same solvent with or without the reducing
- SnCl2 - then mixing thoroughly using a magnetic stirrer at
temperature for a known time, after which samples were taken and
chroniatographed to know the labelling yield. The chromatographic
technique used was ascending paper chromatography with 85% methanol
as developing solution.
Materials Used:
- Olive oil (Winlab Limited)
- Methanol (Analar Merk)
- Diethyl Ether (Analar Merk)
- Acetone (Analar BDH)
- SnCl2 . 2H2O (BDH)
- HC1 (Analar (BDH)
Tc kindly supplied by the Nuclear Medicine Department of
King Khalid University Hospital (KKUH).
- Four out of use Mo - mTc generator (Amersham type) kindly

supplied by Nuclear Medicine Department of King Khalid
University Hospital (KKUH).
(These have been used to determine the radiocontaminants within
the generator and also as a supply (from new ones) of the parent99isotope Mo)
- Silica gel plastic sheets 60 F 2 5- 0.2 mm (Merk)
- Cellulose plastic roll 0.1 mm (Merk)
- Whatman paper lm (Whatman)
4.2.1 Preparation and Control of 99mTc :
Molybdenum-99 fission product obtained as a result of eluting a
Tc generator by (1.5 ml, 1.5M) NaOH solution. The acidity of the
molybdenum solution was adjusted to be 0.1 M in HCl and 0.001 M with
respect to Molybdenum then absorbed on a column (8 cm long and 1 cm
wide) containing 5 g alumina (A1OO, for chrom&tography). The column
was washed thoroughly with 0.9% Nacl solution until no more activity
was detected in the washings and, also, until no more blue colour
appears when drops of the washings were contacted with stannous
chloride solution. The column was left for 24 hours after which the
daughter 9 9 m Tc was milked.

105
99m,Tc was e lu ted b y us ing 5-10 ml isotonic saline solution. The
Y-spectrum of the eluted m T c was measured a n d plotted on a
plot ter-pr inter ( t y p e Dataproducts) connected to a multichannel analyzer
(type 35 plus Canber ra ) us ing a well type 7.5 x 7.5 cm Nal (Tl)
crystal detector shielded with 5 cm lead and lined with 0.6 cm copper to
minimize in te r ference from lead X - r a y s . The MCA u s e d was equipped
with an iso-analyzer type 3543 s t a n d a r d l ibrary (Table 21) . However
since this l i b ra ry does not contain any technetium or molybdenum
60isotopes the MCA was calibrated using Co lines (1173 KeV), (1330
KeV), 137Cs line (662 KeV) and 85Sr (514 KeV). The linearity curve
is given on figure (37) showing that the first four channels have to be
neglected. Measuring the spectrum of Tc eluted shows its presence
at channel No.46 (No.42 after correction) indicating 140 KeV. The
Spectrum is shwon in figure (38) from which it appears that the
Tc milked is of very high radiochemical purity. The half-life curve
is shown in figure (39) indicating half-life period of 6 hours.

ti/2ENEMY WU> ENEhjT YKU)
NAME 11/1 |UW| |%| 11/2EttERGV
ItoVI
_
•
•
to
I I
I I
11
14
11
• •
I T
< •
* t
to
- „»
I *
.
C O M
cot'
C O M
1 M
ca«o •
n u
•JtttU
M i l
•K IT
« " M
- T M
M N
M M
5»%1
* IlM
I » H
*U-tO3
CO-IO*
AG.HO
»27Y
M M O
4 M H
I tTOO
i 27 H
1* *H
101 SOD
3 IlM
IS30M
• MM
MTQM
3S10 0
MOOD
3*40 0
4*3 00 D
232 300
I1M|
I3MI
I M I
•101
ll«il
ITIJI
13321
i n n
>»i:
S M I
*i«0
*031
1 M )
« * •
i«ll
H H I
13421
• M O
i|U«
1301
W l
•17 7
•»7T
1031 1
u a i
I tMO
21701
M I J
?«••
1014]
w\
T i l l
m i
7917
•17 1
M O
•117
7 M 7
M * 7
« 7 4
13»«3
14O10
•oa
m
100
i t
1 4
M
SO
3 *
1 3
11
i j
M
M
M
10
M
10
t
91
43
14
•0
I I
13
34
M
•00
• 1
ss
m
4
M
! •
n34
nt3
n
3 t
33
33
3*
IS
3«
37
U
M
4 0
4 1
4 3
M it]
ii II
•A 133
t'33
*( <»
•E <32U
C5M34
1.114
M M
«•<»
XI 1J1M
ca->37
•sooo
130"
tQIO*
HtWOn
• »oD * 0
t H <
I I I N
101 •*
13 100
, JO JOT
»• '
W 2 T
, „ , ' •U I I
• M O
>301
M # 7
• 0 2
2B0 3
• 3 7 0
m i
SO11
523 7
•30 2
U 7 7
1711
M 4 I
B l
2714
3031
M O
3 U S
liltITS 4
no 1
J33 2
M i l
M i l
•04 I
T M I
•Ol •
S M 4
•211
€77 3
•47 0
•S7 3
M * '
10731
IIJII
IKMI
&•••
' IOUI1131 »
I2K)A
14171
iftTVO
tTOIl
i T t t l
l « t l
M
M
too
u
." 1• • . •
•ri
1
„ 1
l
t «
14
M
7ft
l |
3*
7
t l
12
•
•7
4
27
10
t
i »
SI
ss
1
7
1
I t
t t
t
M
7
•»
t l
10
•
7
1
n31
•
IO
4
I
to
- ^ • • : " • n
I7IB
373 7
34OI
•It«
1331J
I t
• •47
100
M
4ft
4C
4 7
41
4 |
SO
11
u
11
u
11
M
17
M
u
cs iji
Si ill
•A lit
Cf 13*
•A 1*0
l> 140
a t4i
a •«•
W 1«7
K i m
IlM?
•1-114
•V-214
u i n
W137
• • ^ . u ,
32K)li
<4I0M
•3 70U
• 37SOO
ling
4QIQM
» M 0
2*4 30 9
moao
13 tO"
«ttoo
HOD*
ittOH
31 ««•
ototmoci
OnOQiCOl*
• ?" W T
• M l
bkt l
10011
I4JftUtIO1UI4
• U l
m i
2 M 4
4341
1TM3
m i l
i « t
i
• t i l i
137 3
3311
m o
111*
•\M*
US 4
l U l
M O
• 7 1
1000
113 4
1121
• •111
K R 0
1221 *
•13i 0
»» t
13*2
47t!
s u t
Oft 4
M i l
m t
' i t
irto
' 1 1
710
• « •
M l 7
lOUl
17JO1
tots
•1201
1141
• • I tm i
t«3l
"»S »
• • •
»ot»
2212 1
1771 P
3111 1
134 2 1
3710 1
M l J 3
Table 2 1Model 3543 Standard Library

80 ' 120 ' i£o ' 200 240 280 32"o 3&0
CHANNELS
Figure (37) : Lineari ty Curve

30 90 CHANNELS l5° 2I°Figure (38) : The gamma spectrum of Tc measured
MCA type 35 plus Canberra
on

109
10
TO 1V WTIME IN HOURS
26 30
Figure (39) : The half-life curve of 9 9 m T c

4.2.2 Determination of Radiocontamiiiants in Old ^ T e Generators :
Three Molybdenum-Technetium generators of the same total activity
(Amersham), one was 12 months old, the other 9 months old and the
third 6 months old were used for determination of the radiocontaminants99appearing with Mo. The gamma spectrum of these generators was
counted by using the multichannel analyser, type Pareke of KACST*
using a well type germanium detector. The results are shown in tables
(22, 23, 24). Although some of the data given in these tables are not
reasonable because of the very short half-life isotopes given in it, in
spite of the long cooling period, yet it indicates the persence of the
other long-lived fission products, 95Zr- 95Nb, 103Ru, 125Sb and 207Bi
showing the necessity to have good precautions in getting rid of these
types of genertor systems. Measuring these three generators again
using our MCA type 35 plus shows that they still contain some sort of
activity. The peaks of these activities appear on channels 19, 27, 41,
58, 157, and 190 indicating an energy of 63 KeV, 90 KeV, 136 KeV, 193
KeV, 523 KeV and 633 KeV respectively. In a trial to determine the
half-life of the 6 peaks analysis of composite decay curves was plotted
(Figures 40 - 45). Each decay curve is composed of two or more
components which requires very careful analysis, from this analysis, it
can be said that the main radioactivity is due to an isotope of half life
38.7 d. This isotope may be either Ru ( t 1 / 2 = 39.35 day, ,
497, 610 KeV) or 9 5 N b ( t l /2 = 3 5 d ) ^ d a u g h t e r P ™ ^ of 95Zr
= 65d). The second component shows a half life of approximately*fhese generators were kindly counted by Mr. Al-Medainy an engineer
in KACST.

SAMPLE•fission products absorption in aluminum column
M t : about 5 grams
DETECTOR SYSTEMORTEC Detec tor GMX20190, CFG-SV 301 ,MA:572, HV-PS-.459, Ana lysa to r : ADCAM 100 w i t h 91BAMCB and IBM A"
CALIBRATIONc a l i b r a t i o n measurements o-f eu-152 sourcecounted -for 1200 second
FIRST LIBRARY FILE FISSI0N1.LIB FBC
START 100 STOP 8000 SENS <7.) BO.O MULTIPLIER 7400.000
* * * * * * * * * * * * * * * * SUMMARY OF NUCLIDE3 IN SAMPLE * * * * * * * * * * * * * * * *
TIME OF COUNT PERCENTNUCLIDE ACTIVITY UNCERTAINTY
Bq/g COUNTING 2 S
AS-106 9.731E+02 1.1AR-41 1.525E-01 79.4 .BA-131 B.397E+01 2.731-214 3.142E+00 27.3ER-SO 1.11OE+02 7.5CE-144 7.040E+00 16.9IN-116M 2.156E-01 79.4NB-95 7.710E+00 4.4MD-141 2.363E+02 12.6NAT-RA 3.216E+00 26.6R'J-103 3. S04E+01 3.0RL!-105 2.700E+00 19.4SB-124 1.OOSE-01 74.1SB-125 1.S96E+00 39.4
* * * * * * * * * * * * * * * * * * * * * * * * * * SUMMARY * * * * * * * * * * * * * * * * * * * * * * * * * *TOTAL ACTIVITY: 1468.54
* * * * * * * * * * * * * * * * * * * * * DISPOSITION OF PEAKS * * * # * * * * * * * * * * * * * * * -
380.43 <§ SB-125 557.04 + RU-103 610.33 + RU-103665.45 e BI-214 1120.29 ? BI-214 1292.64 ? ND-141
1764.49 BI-214
Table (22) The radiocontaminants of 12 months old of Molybdenum-
Technetium generators counted by KACST.

nSr absorption in aluminum columnNo. 609/mon, wtsabout 5 grams 112
DETECTOR SYSTEM
5S
of eu-152
counted for 1200 second
FIRST LIBRARY FILE FISSICN2.LIBSTART 100 STOP B000 SENS (7.) 30.0 MULTIPLIER 7400.000
SUMMARY OF NUCLIDES IN SAMPLE ********************************
TIME CF COUNTNUCLIDE ACTIVITY
Bq/g -
1.B63E+02< 4.6E-011.305E+024.471E+00< 1.4E+012.502E+01< 7.2E-013.243E-K>1< B.9E*014.471E+004.973E+O1< 1.4E-i-0i< B.4E-013.470E+00< 1.3E+001.3B5E+00< B.5E-019.B3rE-011.458E+01< 5.SE-C1< 3.3E-01< i.4E+00< 1.OE+00< 2.4E+01
PERCENTUNCERTAINTYCOUNTINB 2 S
B.2
5.O54.7
14.B
4.4
54.76.B
53.5
70. B
79.79. 1
* * * * * * * * * * * * * * * * * * * * * * * * * * SUMMARY * * * * * * * * * * * * * * * * * * * * * * * * * *TOTAL ACTIVITY: 459.316
* * * * * * * * * * * * * * * * * * * * * DISPOSITION OF FEfiKS * * * * * * * * * * * * * * * * * * * * *
5">.2O S PA-230427 .39 * S3-125469 .37 @ RU-105696 .49 <§ CE-144
1293.54 ! IN-116M
60.11 « CE-144<43.75 @ PA-230557.04 @ RU-103717.34 @ AG-106N
21B5.70 ? CE-144
133.54 @ CE-144454.95 © PA-230610.33 + RU-103724.21 ! RU-105
99 99mTable (23) : The radiocontaminants of 9 months old of Mo - Tc generator
IfATCT

1 ,rr~°Wrr4!an uas}ueuiwejuoooipej
W9XT-NI © OZ.-BXB£ox-na + to -zssWd-IWN 36'XS£
SOT-na i IZ'trZLWTZ.-NZ 9 fr£'Z.B1rTZ.T-H3 * 0£ '80£frfrT-33 * fr3*££t
na + ££"0x9W9XX-NI S 9B"9Xfr
t i v - a a © 06*26s
* * * * * * * * * * * * * * * * * * * * *
************************** Ayyuwns **************************
JO NDIlISOdaia *********************
X0-3399"6
• S Z £ : T I z.a-wyc-90 zc •£0'3I
X'i7/
S"£
S-6Z.
0"3
£'17
X "65
00+3Z.ST'T
X0-3X66'XX0-3X£6'3X0+3£i7S*XX 0-317 mL >00+39" X >00+3Z.SX"£
0 0 + 3 9 "
T0+3X"X
X0+3XS6'TX0+3Z.*9 >
T0-3X'£ >00+39L\ ' 6X0+3£"X >X0+3X36'X
XO-32'3 >30+3BZ.6' X
UIX -̂WZ
03I-SS96-ar-j93T-I09-03
06-DW
W90X-SyS3X-6S
sox-na•2ox-na
XfrX-uNS6-3N
W9XX-NIfrfrX-33
os-aa
S Z BNIlNnODAlNiyia3DNH All*"
XN33a3d iNnD3 dO 3WI1«
**************** sidwys NI 33ai~i3nw do Aaywwns ****************
aandinnw o'oa c/.)SN3s O O O B dais oox iayis3iid Ayyaan
puoass 003T
iy wai pue oox 4tO£ AS- '06I0SXM9W3ISAS

10'
8
6 1
2 . Composite decay curve
Shorter-lived component
20 300
TIME IN DAYS
Figure (kO) :• Composite decay curve of the peak at Channel 19

115
10'
8 •
6 .
k
Composite decay curve
Longer-VTved component
• Shorter-lived component
20 60 100 140 180
TIME IN DAYS
220 260 300
Figure (k^) : Composite decay curve of the peak at Channel 27

116
cr
si6
Composite decay curve
10
86
8
6
Longer-1iv»d component
Shorter-lived component
20 100 140 180
TIME IN DAYS
Figure Ct2) : Composite decay curve of the peak at Channel

117
Composite decay Curve
Shorter-lived component
20 60 100 1A0 180 220 260 300TIME IN DAYS
Figure C»3) : Composite decay curve of the peak at Channel 58

103
8 .
6 .
Composite decay curve
c'icr
Longer-Pi^ed component
I
Shorter-lived component
100 140 180 Z20 260 300TIME IN DAYS
20 60
Figure (kk) Composite decay curve of the , " :k at channel 157

119
10
Composite decay curve
Shorter-lived component
60 100 VkO 180 220 260 300TIME IN DAYS
Figure (̂ 5) : Composite decay curve of the peak at Channel 190

175 d which may be due to other long lived isotopes, again a case which
one must be very careful during working with these jcenerators.
4.2.3 Quality Control by Thin Layer Chromatography (TLC) and Paper
Chromatography :
To find out a method for determining the labelling yield by mTc,
thin layer chromatography as well as paper chromatography were
treated. Silica gel plastic sheet 2.5 cm x 20 cm of 0.2 mm thickness
with flou re scent indicator F™-. (Merk), celeluse plastic sheets 2.5 cm x
20 cm of 0.1 mm thickness without flourescent indicator (Merk), and
Whatman paper No. 1 (3.5 x 20 ), methanol and water (85:15, V/V) was
used as an eluent. 10 ul of each sample was chromatographed for 45
minutes after which the R- value was determined either by activity
counting in case of Tc or mTc labelled oil and !„ vapour in case
of unlabelled oil.
For counting, the chromatogram was devided into 1 cm sections then
cutting these parts and counting in the well type Nal (T£. ) gamma
detector.
The results are shown in tables (25, 26, 27). From these tables it
appears that paper chromatography gives a very good and clean
separation for 99mTc as 9 9 mTc04 and olive oil. Silica gel sheets give
two Rf values in case of olive oil, one having 0.78 value and is very

TABLE (25) : THE R f VALUES USING THE PLASTIC
SHEETS COATED WITH SILICA GEL
Sample Detect ion
01ive o i l
Oleic acid
1
0 (main peak)
0.78
04. - 0.8
Activi ty
I_ - vapor
I- - vapor
TABLE (26) : THE R f VALUES USING THE PLASTIC SHEETS
COATED WITH CELELUSE (0.1mm )
Sample
TcO"
01 ive ~>\ !
Oleic acid
R f
0.9
0
0.17-0.96
Detection
Activi ty
l 2 - vapor
l 2 - vapor
TABLE (27) THE Rf VALUES USING THE WHATMANN
PAPER 1
Sample
TcOJj
Olive o i l
Oleic acid
R f
0.78
0
Not regular
Detect ion
Activi ty
l_ - vapor
1- - vapor

122
small and may be attributed to degradation products in the oil while the
main peak has an R~ value of zero.
The R- value for mTc VII in paper chromatography was 0.78
which differs from that given in the literature i.e. 0.64 (96) and 0.6
(134) using Whatman paper 3 mm. The difference may be attributed to
the difference in the type of paper as well as the method of 99mTc
preparation. As labelling yield of olive oil with technetium as TcOT was
very low (section 4.2.4) it was found to be of value to try the labelling
using reduced mTc. Among the various reducing agents cited in the
literature (111, 112, 113) the most popular agent has continued to be
stannous ion. To study the effect of stannous ion Sn concentration
on the reduction of Tc, paper chromatographic technique was used.mTc (as eluted from the generator is mainly in the form mTcO~ ) in
diethyl ether as well as in acetone in the presence of different
concentrations of stannous ion was chromatographed. The results are
shown in Figures (46 - 55) and tables (28, 29). From the figures and
tables it appears that the R- "alue of mTc decreases as the
concentration of stannous ion increases meaning that the reduced
techniteum gives an R- of low value. Some of the activity is
homogenously distributed through the whole paper giving a percentage
of approximately 38 - 45% which may be in the colloidal Sn form. The
parts that have Rf >0.8 may be attributed to some sort of complex
having Tc in the oxidation state of VII since no higher state than
VII can be obtained and this shows a value of 2-15% in case of 20 mg

2600
Figure C»6) : "mTc in diethyl ether
PAPER CHROMATOGRAPHYAnalysis of 7*0—99m
s eDistance (Cm)

99m,
1600
Figure (i»7) : Tc in diethyl ether
PAPER CHROMATOGRAPHYAnalysis of Te—99m+2mg SnCl
a eDistance (Cm)

1600
Ftgure (kB)
PAPER CHROMATOGRAPHYAnalysis of Tc-99m+5mg SnCl in DEE
Distance (Cm)IN

Figure
1500
PAPER CHROMATOGRAPHYAnalysis of Tc—99m+10mg SnCl in DEE
3 eDistance (Cm)

Figure (50) :99m.Tc in diethyl ether
600
'400-
PAPER CHROMATOGRAPHYAnalysis of Tc-99m+20mg SnCl
a eDistance (Cm)

99m
2600
Figure (51) : Tc in Acetone
PAPER CHROMATOGRAPHYAnalysis of Tc—99m
2000
i1500
1000
600-
s eDistance (Crn)

vu
(uiw/bg) X11AI1DV

Figure (53)
1600
PAPER CHROMATOGRAPHYAnalysis of Tc—99m+ 5 mg SnCl in Aceton
3 eDistance (Crri\

Figure
400
PAPER CHROMATOGRAPHYAnalysis of Tc~99m+10mg SnCl in Aceton
3 aDistance (Cm)

1000
Figure (55)
PAPER CHROMATOGRAPHYAnalysis of Tc-99m+20mg SnCl in Aceton
3 6
Distance (Cm)

133
99mTABLE (28) : THE RVALUES FOR Tc UN DEE MEDUM)
MILKED AND REDUCED USING THE REDUCINGAGENT SnCl2 IN DIFFERENT QUANTITIES(2, 5, 10, AND 20 mg)
R fvalues
0
0.11
0.22
0.33
O . U
0.56
0.67
0.78
0.89
1
Milked
0
0
0
0
0.5
0.9
5-7
92.if
0.5
0
D i f f e r e n t
2 mg
0
0
0
0
0
2
95
3
0
0
Percentage of A c t M
Quantities of SnCl 9
5 mg
0
0
0
0
0
2
95
3
0
0
10 mg
15
0.5
0.5
0.5
0.5
0.5
80
0.5
0.5
0.5
i/ i ty
20 mg
U.8
3.8
3.8
3.8
3.8
3-8
3-8
3.8
3.8
15

13*
TABLE (29)99m
T ( I N ACETONE MEDIUM)
MILKED AND REDUCED USING THE REDUCING AGENT
: THE R f VALUES OF
Sn C l 2 IN DIFFERENT QUANTITIES ( 2 , 5 , ± 0 , AND
20 mg )
R fValues
0
0.11
0.22
0.33
O . U
0.56
0.67
0.78
0.89
1
I
P E R C E N T A G E OF A C T I V I T Y
M I L K E D
0
0
0
0
0 .5
7
11 .5
7 7 . 9
2 . 8
0
D I F F E R E N T Q U A N T I T I E S OF SnCl
2 mg
0
0
0
1
1 . 7
i * .1
8 1 . 8
9 . 6
1
0
5 mg
0
0
0
0
21
* . 9
8 3 . 6
8 .2
0 . 7
0
10 mg
7
10
7 -6
8
6 - 7
7
2 7 . 3
1 2 . 1 3
7 . 1
6 . 9
20 mg .
(,k
13
3 . 5
3
k.G
3-9
2
2
2 . 5
0

135
Jin in view of what is stated in the literature the complex Sn
"CcHg may be that what have the Rf >0.8.
Despite the fact that the chemistry of the element (Tc) is poorly
developed in comparison to its immediate neighbours Mo, Mn> Ru, and
Re, there is no shortage of review articles dealing with various -aspects
oJ" its chemistry (120). From what is known, it is to be expected that
its chemistry will be proved to be among the most diverse of the
transition elements certainly revealing that of its second row neighbours
Mo and Ru. Compounds have already been characterized in all
oxidation states from (-l)d8, e.g. [ Tc(COj5fto VII d°,e.g. TcO" (121)
and TcHg (122) in which the elements displays coordination numbers
which vary from 4 to 9. The most exciting recent development and
perhaps the most relevant to nuclear medicine is that a number of the
lower valent complexes can be synthesized in high yields in aqueous
media at both the carrier and no-carrier-added concentrations.
The octahedral d , hexachlorometallates inflamed by heating TcO"
salt in the corresponding halo acid HX. (X is a halogen in this case Cl)
TcO" + 3H3O+ + 9X"
in presence of concentrated acid prevents hydrolysis to TcO™ at low
temperature.

136
+ 6H O+ + 6 x ' (TcOX^)" + 9H 0 + X
However, both elec trophoresis and adsorption spectrum studied by
Ianovici et al (123) shows that about 15% of the Tc Cl^2 hydrolysed to
other species.
The hydrolysed Tc Cl"2 appears as cationic, uncharged and anionic
species TcCl-(Ho0)]~ (124)
The anionic species was reported by Kawashima (124) as
[TcClj.(H2O)] . The unchanged species is more likely to be a mixture of
hydrated TcO 'and [ TcCl4(H2O)2](125). Concerning the nature of the
cation it was expected that its spectrum would resemble that reported
for [TcCl3(H2O)3] + (126, 127).
The neutral species (formed by hydrolysis and'or isometric
transition) can be easily oxidized to TcO^ by air (128, 129) but the
proportion oxidized decreases rapidly as the chemical concentration of
technetium increases. Possibly the aerial oxidation only proceeds
rapidly in true solution and becomes negligible when a colloidal
TcOo x HOO phase forms (123.). It appears that what we have in thisii it
work is a mixture of different cationic, anionic uncharged and colloidal
species and that colloidal and unchanged species increase with the
increase of Sn Cl™ concentrations. Of course intensive concentration of
this part need more work which is out of the scope of this thesis.

137
In addition to the last indicated complexes we may give the
following oxidation reduction icn equations.
Tc O ' + Sn+2 + 2H+ TcO~ + Sn+4 + H2O (130)
from Tc VII to Tc V
2Tc OT + 3Sn+2 + 8H+ 2Tc O9 + 3Sn+4 + 4HOO (128)4 L I
to reduce Tc VII to Tc IV
T c 0 4 + 2Sn+2 + 4H+ TcO2 + 2 S n + 4 + 2 H 2°
to reduce Tc VII to Tc III
2TcO~ + 5Sn+2 +16 H+ 2Tc?2 + 5Sn+4 + 8 H2O (132)
to reduce Tc VII to Tc II+2indicating that increase of concentration of Sn leads ,the reaction to
proceed more to reduction and complicates the problem. This indicates+2that the concentration of Sn is critical (133).

138
4.2.4 Labelling of Olive Oil by 9 9 mTc :
In a 5 ml round bottom flask 2 ml diethyl ether or acetone were
added, followed by 1 mCi of"mTcO4 (100 u 1) then a 30 yl of olive oil
was added. The whole solution was stirred by magnetic stirrer at room
temperature, and samples (10 yl) were withdrawn at different periods of
time and analyzed by paper chromatography. The results are given in
table (30) showing a percent yield of 1.8% to assure that mTc in the
VII state is responsible for the low labelling yield, the labelling
experiment was repeated by using Tc to which bromine water was
added. The results (precent yield 0.5%) show no change in labelling
yield indicating the urgent need for reducing mTc in order to get
labelling.
4.2.5 Labelling of Olive Oil by reduced 9 9 m Tc:
A. In Diethyl ether (DEE) medium :
In a 5 ml round bottom flask 2 ml of acidified diethyl ether of
pH( l -2 ) , prepared by shaking ljO ml 6N HC1 with 10 ml DEE and taking
the DEE layer, was added. Then 1 mCi of TcO4 (100 y 1) was
added, followed by the reducing agent SnCl2 .2H2O, (2, 5, 10, or 20
mg). The flask was shaken vigorously for 2 - 3 minutes after which 30
1 of olive oil were added. The whole solution was stirred by magnetic
st i rrer at room temperature, and samples (10Pi) were withdrawn at
different periods of time and analyzed by paper chromatography. The

TABLE (30) : LABELLING YIELD OF OLIVE OIL BY99m
(IN DEE AND ACETONE
MEDIUM
139
Time in
minutes
10
30
60
90
Acetone
1
1
1
1
8
.2
.2
Label 1i ng
medium
Y i e l d
DEE
1 .
1
1
0 .
Percentage
medi urn
5
8

results are given in Figure (56) showing that more than 50% labelling
yield was attained within the first 10 minutes in case of 20 mg Sn .
B. In Acetone Medium :
In a 5 ml round bottom flask we add 2 ml of acidified acetone of pH
1-2 prepared by addition of 1 ml 6NHC1 to 9 ml acetone followed by 1
mCi of 9 9 mTc04 (100 Ul) then we add the reducing agent SnCl2.2H2O (2
mg or 5 mg, 10 mg or 20 mg). The flask was shaken vigoursly for 2 -
3 minutes after which 30PI of olive oil were added. The whole solution
was stirred by magnetic stirrer at room temperature, and samples were
withdrawn at different periods of time and analyzed by paper
chromatography. The results are shown in figure (57). The curve
shows that labelling took place within the first 10 minutes and that
labelling increased with the increase of reduced species resulting from+2increase concentration of Sn ion, which is in good agreement with
work done on labelling of the phosphonates and other radio-
pharmaceuticals with 99mTc (133).

Figure (56)
^ ^
Yiel
d
60
4 0 -
30
20-
10-
0 -
Labelling Yield of olive oil(4—20mg).(B—10mg),(C—5mg).{D
D
D
R ,T v x
Q
in DEE—Zmg)
30 60Time (nvin)
oo

Figure (57)
80
Labelling Yield of olive oil in acetone—20mg),(B—10mg),(C—5mg)t(D—Zmg)
60
s?
DA
B
30 60 00
Time (min)

REFERENCES
1. Silver, S. : Radioisotopes in Medicine and Biology, 1st edition,London, Heny Kimpton, (1962).
2. Gottschalk, A. and Potchen, E. : Diagnostic Nuclear Medicine, 1st,edition, U.S.A., Williams and Wilkins Company, Section 20, 26 (1984).
3. Friedlander, G., Kennedy, J . , Macias, E . , and Miller, J . : Nuclearand Radiochemistry, 3rd edition, New York, John Wiley and Sons,54-287 (1981).
4. Choppin, G. and Rydberg, J. : Nuclear Chemistry Theory andApplications, 1st edition, U.K., 242 (1980).
5. Chaste, G. and Rabinowitz, J . : Principles of RadioisotopeMethodology, 3rd edition, U.S.A., Burges Publishing Company, 409(1967).
6. Stocklin, G.: J . Applied Raediation and Isotopes, 28, 131 (1977).
7. El-Wetery, A.: Labelling of Some Organic Compounds by RadioativeIodine, Ph.D. thesis, Cairo, Ain-Shams University, 6 (1980).
8. Machulla, H., Shanshal, A. and Stocklin, G.: J. Radiochimica Acta,24, 42 (1977).
9. Hallaba, E. , El-Wetery, A. and Azzam, R. : J . Radiopharmaceuticalsand Labelled Compounds, II, 171 (1973).
10. Macfarlane, A. : Nature, 182, 53 (1958).
11. Macfarlane, A. : J . Clin. Invest., 42, 346 (1963).
12. Hunter, W. and Greenwood, F. : Nature, 194, 495 (1962).
13.. Hunter, W. : Radioactive Pharmaceuticals, 6, 245 (1966).
14. Rosa, U. , Scassellati, G., Pcnnisi, F . , Riccioni, N. , Giagnoni, P.and Giordani, R. : Biochim. Biophys. Acta, 86, 519 (1964).
15. Rosa, U. : Biochim. Biophys. Acta, 133, 486 (1967).
16. Krohn, K., Sherman, A. and Welch, M. : Biochim. Biophys. Acta,285, 404 (1972).

\kk
17. Krohn, K. and Welch, M. : J. Applied Radiation and Isotopes, 25,315 (1974).
18. Francis, G., Mulligan, W. and Wormall, A. : Nature, 167, 748 (1951).
19. Vcall, N . , Person, J. and Hanie, J. : Brit. J. Radiol., 28, 633(1955).
20. Berson, S . , Yalow, R . , Schreiber, S. and Post, J. : J. Clin.I n v e s t . , 32, 746 (1953) .
21. MacFarlane, A. : Biochem. J . , 62, 135 (1956).
22. Gilmore, R. , Robbinsan, M. and Reid, A. : Nucleonics, 12, 65(1954).
23. Reth, W. and Tampion, W. : Nature, 12, 181 (1963).
24. Dubert, A . , Coursget, J . , Fallot, P. and Royer, P. : Radioisotopesin Scientific Research, Proc. Unesco Intern. Conf., 1st , 3 , 274(1958).
25. Bolton, A. and Hunter, W, : Biochem. J . , 133, 529 (1973).
26. Jiang, V. and Welch, M. : J. of Labelled Compounds andRadiopharmaceuticals, 13, 2, 277 (1977).
27. Nunez, J . , Pommier, J . , El-Hilali, and Roche, J. : J. LabelledCompounds, 1, 128 (1965).
28. Marchalonis, J. : Biochem. J . , 113, 299 (1969).
29. Matkovics, B . , Rakonczay, Z. and Rajki, S. : J. Steroido-logia, 2,77 (1971).
30. Morrison, M. and Bayse , G. : Biochemistry, 9, 2995 (1970).
31. Stocklin, G.: J. Applied Radiation and Isotopes, 28, 131 (1977).
32. Tubis , M. : Proc. Soc. Exp. Biol. Med., 103, 497 (1960).
33. Scheer, K. and Meier-Borst, W. : J. Nucl. Med., 2, 1993 (1962).
34. Hallaba, E . , Raich, M. and Missak, N. : J. Applied Radiation andIsotopes, 20, 865 (1969) .
35. Anghileri, L . : J. Applied Radiation and Isotopes, 15, 95 (1964).
36. Hosick, A . , Watts, C. and Meschan, J. : J. Nucl. Med., 7, 643(1964) .

1*»5
37. Elias, H . , Arnold, C. and Kloss, G. : J . Applied Radiation andIsotopes, 24, 463 (1973).
38. Elias, H. : Proc. Japan Conf., 9th, Radioisotopes, 538, May 13-15(1969).
39. Elias, H. and Lotterhos, H. : Chem. Ber . , 109, 1580 (1976).
40. Thakur, M., Chauser, B. and Hudson, F. : J . Applied Radiation andIsotopes, 26, 319 (1975).
41. Lambrecht, R., Atkins, H. , Elias, H., Fawler, J . , Lin, S. andWolf, A. : J. Nucl. Med., 15, 863 (1974).
42. Sana, G.: Fundamentals of Nuclear Pharmacy, 1st edition, N.Y. ,40-80 (1984).
43. Merck Co. Inc . , An Encyclopedia of Chemicals, Drugs and BiologicalsMerk Index, 10th edition, U.S.A. (1983).
44. Cappeli, V. , Guzzoni, M., Gazzani, G. and Griziotti, A. : IRCS,Med. Sci. , 11, 625 (1983).
45. Beare-Rogers, J . : J . Lipids Data, 11, 4, 283 (1976).
46. Lawrance, J . , Chadha, R . , Iverson, F . , Mcguire, P. andConacher, H.: J . Lipids Data, 19, 9, 704 (1984).
47. Conacher, H., Chadha, R. , Lawrence, J . , Charbonneau, S. andBryce, F. : J. Lipids Data, 19, 9, 637 (1984).
48. Ueda, C , Lemaire, M., Gsell, G. and Nussbaumer, K. : J .Biopharm. Drug Dispos., 4, 2, 113 (1983).
49. Westera, G. and North, E. Holand : Biomedical Pres Progress inRadiopharmacology, 2, 120 (1981).
50. Itoh, H. : Jikei Med. J . , 18, 133 (1971).
51. Stanley, M. and Siegfried, T. : J. Lab. and Clin. Med., 34, 1634(1949).
52. Tuna, N. : J. Lab. and Clin. Med., 61, 620 (1963).
53. Davila, A. and Linda, L. : Philippines Nuclear Journal, 2, 193(1970).
54. Turk, D. : Nature, 1768 (1968).
55. Tennant, B . , Nario, R. , Doris, H. and Marvin, G. : J . Nutrition,97, 65 (1969).

56. Eugenio, M., Roceles, P . , and Valdezco, J. : Philippines NuclearJournal, 11, 1, 161 (1969).
57. Robinson, G. and Lee, A. : J. Nucl. Med., 16, 1, 17 (1975).
58. Beierwaltes, W., Lee, R. , Shaw, M. and Ryo, U. : J. Nucl. Med.,16, 9, 842 (1975).
59. Robinson, G. : J. Applied Radiation and Isotopes, 28, 149 (1977).
60. Norman, P . , Robinson, G., Graham, S. and Macdonald, N. : J. Nucl.Med., 17, 1077 (1976).
61. Machulla, H. and Stocklin, G. : J. of Labelled Compounds andRadicpharmaceuticals, 13, 2, 221 (1977).
62. Machulla, H. , Stocklin, G., Kupfernagel, C , Freundlieb, C ,Hock, A . , Vyska, K. and Feinendegen, L. : J. Nucl. Med., 19, 298(1978).
63. Otto, C , Brown, L . , Wieland, D . , and Beierwaltes, W. : J. Nucl.Med., 22, 7, 613 (1981).
64. Otto, C , Brown, L . , Wieland, D. and Beierwaltes, W. : J. ofLabelled compounds and Radiopharmaceuticals, 17, 1 (1982).
65. El-Shaboury, G. and El-Garhy, M. : J.of Labelled Compounds andRadiopharmaceuticals, 19, 1529 (1983).
66. Riche, F . , Mathieu, J . , Coornaert, S . , Bardy, A . , Busquect, G.,Godart, J . , Comet, M. and Vida, M. : J. of Labelled Compounds andRadiopharmaceuticals, 19, 11 (1983).
67. Wilson, A . , Dannals, R . , Ravert, H . , Burns, H. and Wagner, H. :J. of Labelled Compounds and Radiopharmaceuticals, 23 , 1, 83 (1986).
68. Kabalka, G., Gooch, E. and Sastry, K. : J. Nucl. Med., 22, 10,908 (1981).
69. Freedman, S. Clinical Immunology, 1st edition, New York, Harper andRow, (1971).
70. Katz, J. and Bonorrise, G. : J. Lab. and Clin. Med., 72, 6 (1968).
71. Sion, R. : J. of Labelled Compounds and Radiopharmaceuticals, 22,8 , 799 (1985).
72. Mathis, C , Shulgin, A. and Sargent. T. : J. of Labelled Compoundsand Radiopharmaceuticals, 23, 2, 115 (1986).

73. Landvatter, S.: J. of Labelled Compounds and Radiopharmaceuticals,22, 3, 273 (1985).
74. Krohn, K.: J. Biochimica and Biophysica Acta, 285, 404 (1972).
75. Pierce, W., Haenisch, E. and Sawyer, D. : Quantitative Analysis, 1stedition, New York, John Wiley and Sons, (1958).
76. Sgoutas, D. and Kummerow, F.: J. of the American Oil ChemistsSociety, 40, 138 (1963).
77. Bevenue, A. : J. Chromatography, 95, 235 (1974).
78. Beierwaltes, W., Ice, R., Shaw, M. and Ryo, V. : J. Nucl. Med.,16, 9, 442 (1975),
79. Damiani, P. and Bu??ini, G. : J. Agric. Food. Chem., 28, 1232(1980).
80. Hunter, W. and Green wood, F. : Nature, 194, 495 (1962).
81. Hunter, W. : Radioactive Pharmaceuticals, Conf., Springfield,Virginia, 245 (1966).
82. Krohn, K., Sherman, L. and Welch, M. : J. Biochim. Biophys. Acta,285, 404 (1972).
83. Berliner, E. : J. Amer. Chem. S o c , 78, 3632 (1956).
84. Greenbaum, F. : Amer. J. Pharmacol., 109, 407 (1937).
85. Helmkamp, R. : J. Applied Radiation and Isotopes, 18, 737 (1967).
86. Helmkamp, R. : J. Applied Radiation and Isotopes, 18, 747 (1967).
87. Regoeczi, E. : Iodine-labelled Plasma Proteins, 1st Edition, U.S.A. ,CRC Press (1984).
88. Bolton, A. : Radioiodenation Techniques, 2nd Edition, England,Amersham International, 24 (1985).
89. Zakey, F. : Labelling of Castor Oil and Some Organic Compounds byRadioactive Iodine, M.Sc. Thesis, Riyadh, King Saud University,(1984).
90. Al-Dayel, O., Al-Suhybani, A. and El-Garhy, M. : The SecondNational Meeting of Chemists, K.S.A., Riyadh, 99 (1987).
91. Stark, J. and Wallace, H. : Chemistry Data Book, 2nd Edition,London, John Murray Press, 32 (1982).

1t»8
92. Sorantin, H. : J . Radio and Radiations Analytical Letters, 17, 21(1974).
93. Berson, S. and Yalow, R. : J. Clin. Chem. Acta, 22, 51 (1968).
94. Mayers, W. : Radioisotopes of Idoine in Radiopharmaceuticals, 1stEdition, U.S.A. , Andrews, G. and Wagner, H., Atomic Energy(1966).
95. International Atomic Energy Agency (IAEA). Radioisotope Productionand Quality Control, Technical Reports Series No. 128, Vienna(1971).
96. El-Garhy, M., El-Bayoumy, S. and El-Alfy, S. : Production of 9 9 mTcfor Medical Application, Rep. 20, Cairo, U.A.R., (1968).
97. Stange, L. and Richards, P. : Nucleonics, 22, 46 (1964).
98. Strominger, D. , Hollander, J. and Seaborg, G. :Rev. Mod. Phys. ,30, 558 (1958).
99. Friedlander, G., Kennedy, J . , Macias E. and Miller, J . : Nuclear andRadiochemistry, 3rd Edition, New York, John Wiley and Sons, 194-196(1981).
100. Lederer, C. : Table of Isotopes, 6th Edition, New York, John Wileyand Sons, (1967).
101. Smith, E. J. Nucl. Med., 6, 231 (1965).
102. Victor, J . , and Molinski, J. : J. Applied Radiation on Isotopes, 33,811 (1982).
103. Richards, P. : 5th Nuclear Conf., Rome, Italy 225 (1960).
104. Boyd, R. : J . Applied Radiation and Isotopes, 33, 801 (1982).
105. Lanthrop, R. and Harper, P. : Neuro Nuclear Med., 1, 145 (1972).
106. Steigman, J. : J . Applied Radiation and Isotopes, 33, 829 (1982).
107. Tucker, W., Griini, M., Wells, A. and Muttenhof, A. : ReportBNL-3746, Brookhaven Natl. Lab. , New York, (1958).
108. Arino, H. and Kramer, H. : J. Applied Radiation and Isotopes, 26,301 (1975).
109. Meloni, S and Barndone, A. : J. Applied Radiation and Isotopes, 19,164 (1968).

110. Maki, Y. and Mukaram, Y. : J. Nippon Kagaku Zasshi, 92, 1211(1971).
111. Sana, G. : Fundamentals of Nuclear Pharmacy, 1st Edition, NewYork, 88 (1984).
112. Volkrrt, W. Troutner, D. and Holmes, R. : J. Applied Radiation andIsotopes, 33, 891 (1982).
113. Sunderhagen, E. : J. Applied Radiation and Isotopes, 33, 89(1982).
114. Sundrehgen, E. ; J. Applied Radiation and Isotopes, 33, 93 (1982).
115. Diengot, D. : Tagging Fatty Acids With 9 9 m Tc, Report No. IAEA-R-2228-F, Haifa, International Atomic Energy Agency, Vienna, (1980).
116. Ozker, K. and Urgancloglu, K. : J. of Labelled Compounds andRadiopharmaceuticals, 22, 939 (1985).
117. Stigman, J. and Richards, P. : J. Nucl. Med., 4, 269 (1974).
118. Dewanjee, M. : J. Nucl. Med., 15, 703 (1974).
119. Moore, J . , Parkey, R. and Curry, G. : J. Nucl. Med., 14, 381(1974).
120. Jones, A. and Davison, A. : J. Applied Radiation and Isotopes, 33,867 (1982).
121. Hilemann, J . , Huggins, D. and Kaesz, H. : J. Inorg. Chem., 1, 933(1962).
122. Abrahams, S., Ginsberg, A. and Knox, K : J. Inorg. Chem., 3, 558(1964).
123. Lanovici, E., Lerch, P . , Zahner, G. and Maddock, A. : J.Radiochimica Acta, 28, 23 (1981).
124. Kawashima, M., Koyama, M. and Fujinaga, T. : J. Inorg. Nucl.Chem., 38, 819 (1976).
125. Kanchiku, Y. : J. Bull. Chem. Soc. Japan, 42, 2831 (1969).
126. Koyama, M., Kanchiku, Y. and Fujinaga, T. : Coord. Chem. Rev. 3,285 (1968).
127. Huheey, J. Inorganic Chemistry Principles of Structure andReactivity, 2nd edition, New York, Harper and Row, 219 (1978).

150
128. Ianovici, E . , Lerch, P . , Proso, Z. , Decombaz, M. and Maddock, A. :J. Radiochimica Acta, 26, 141 (1979).
129. Feradini, C , Carlier, R . , Genet, M. and Pucheaut, J. : J.Radiochimica, Acta, 12, 1 (1969).
130. Boyd, E. and Larson, M. : Report No. ORNL-2782 (1959).
131. Zaitsev, V . , Guselnikov, V. and Makhomalkina, S. : J. Radiokhimia,14, 783 (1972).
132. Kotigov, K., Ravkov, O. and Shevdov, V. : Advances in InorganicChemistry and Radiochemistry, 1st edition, London, Emeleus, H. andSharp, A. Vol. 11 (1968).
133. El-Kolaly, Labelling of Some Organic Compounds by Tc, Ph .D .thesis , Cairo University, (1983).
134. Razumenic, N. and Petrovic, J. : J. Applied Radiation and Isotopes,33, 277 (1982).
135. Knapp, F . , Goodman, M. and Callahan, A. : J. of LabelledCompounds
and Radiopharmaceuticals, 19, 11-12, 1323 (1983).
136. Knapp, F . , Goodman, M., Callahan, A . , Ferren, L . , Kabalka, G. andSastry, K. : J. Med. Chem. 26, 1293 (1983).
137. Goodman, M., Kirsch, G. and Knapp, F. : J. Med. Chem., 27, 390(1984).
138. Greenwood, F . , Hunter, W. and Glover, J. : J. Biochemistry, 89,114 (1963).
139. Bocci, V. : J. Biochemistry, 18, 346 (1969).
140. Dyeing Reagents for Thin Layer and Paper Chromatography, 1stedition, Germany, Germany, E. Merck, Darmstadt, Federal Republicof Germany, 27 (1980).

Acetone oj———5)1 L \ ' . «• | ' .
•O—" 5—•
111 »
. • • < " . ) l
s1'j " v l - J
J—Aill « o
..,.••"•< II
• l - - . il ,
I l>".*«[ •_; '«•- J j •—«• »
3 A J P C - g—SI -Al l
Diethyl ether
— 9 . . " A
tS Acetone J J "• gi
h m i l I A I
Jkjil I J | , I .1 I
J ll » , J

( j "Jl <£.\
I-A—* 3j b f - J
lj I
_=JI - • «
Jl A »|-,>tll J_6I
Chloramine-T «=- - o v J JSJI
jj . ISJI tSJl >1 Jj. ji 11
' fA
, • • * ' "l l
- ' * * • * * ' • / • V - — " • '
Diethyl ether
Jlo_.j 1 '/'i
Lij 1*
^ hll I A •
5 -i
./.TV
( CAT ) o _ o—-«1 JJ 1SJI
n-heptane >l..l >"...L
• \ * II '~« j j ) II t f

J . - ^ II «• I I I
L i n o l e . i c a c i d o 1 —^SJ 1 <z~*j<ji •«> j O l e i c a c i d
S t e a r i c a c i d S T - " 1 * " * — I ' ^ a J ' j P a l m i t i c a c i d
• • " " • • ' ~ ,Q "
ft - * J I I - ^ > f tijU I b.
Label 1 ing
a ^ : t>—--"
^ — (99mTc
>_Jl I.
tTo -
« - I
o*—**
i j a II
l j e5l Nuclear Medicine <£JJ uil v_. faJI u
/xjVm" j l Mai absorption |« «i»
«f 1 aM 1
0—- ' . . ' " • • • '
»j—*J'
I t a - ; •"•»»

-* OJ- Jl C-.
JUJl
j , 1 i - i i » . i< , » i _. - .< n --• - I oJI
u li Ull
J—i I Oil