Genome-wide linkage scan for contraction velocity characteristics of knee musculature in the Leuven...
36
1 Genome-wide linkage scan for contraction velocity characteristics of knee musculature in the Leuven Genes for Muscular Strength Study Gunther De Mars 1 , An Windelinckx 1 , Wim Huygens 1 , Maarten W Peeters 1 , Gaston P Beunen 1 , Jeroen Aerssens², Robert Vlietinck³, Martine AI Thomis 1§ 1 Department of Biomedical Kinesiology, Research Center for Exercise and Health, Faculty of Kinesiology and Rehabilitation Sciences, Katholieke Universiteit Leuven, 3001 Leuven, Belgium ²Department of Translational Medical Research, TIBOTEC BVBA, 2800 Mechelen, Belgium ³Department of Human Genetics, Faculty of Medicine, Katholieke Universiteit Leuven, 3000 Leuven, Belgium § Corresponding author: Martine Thomis, Department of Biomedical Kinesiology, Research Center for Exercise and Health, FABER, Tervuursevest 101, 3001 Leuven Mail: [email protected] Tel./Fax : +32 (0) 16 32 90 80 / +32 (0) 16 32 91 97 Running head: Genome-wide linkage scan for torque-velocity relation Articles in PresS. Physiol Genomics (August 5, 2008). doi:10.1152/physiolgenomics.90252.2008 Copyright © 2008 by the American Physiological Society.
-
Upload
independent -
Category
Documents
-
view
0 -
download
0
Transcript of Genome-wide linkage scan for contraction velocity characteristics of knee musculature in the Leuven...
1
Genome-wide linkage scan for contraction velocity
characteristics of knee musculature in the Leuven Genes for
Muscular Strength Study
Gunther De Mars1, An Windelinckx1, Wim Huygens1, Maarten W Peeters1, Gaston P
Beunen1, Jeroen Aerssens², Robert Vlietinck³, Martine AI Thomis1§
1Department of Biomedical Kinesiology, Research Center for Exercise and Health, Faculty of
Kinesiology and Rehabilitation Sciences, Katholieke Universiteit Leuven, 3001 Leuven,
Belgium
²Department of Translational Medical Research, TIBOTEC BVBA, 2800 Mechelen, Belgium
³Department of Human Genetics, Faculty of Medicine, Katholieke Universiteit Leuven, 3000
Leuven, Belgium
§Corresponding author: Martine Thomis, Department of Biomedical Kinesiology, Research
Center for Exercise and Health, FABER, Tervuursevest 101, 3001 Leuven
Mail: [email protected]
Tel./Fax : +32 (0) 16 32 90 80 / +32 (0) 16 32 91 97
Running head: Genome-wide linkage scan for torque-velocity relation
Articles in PresS. Physiol Genomics (August 5, 2008). doi:10.1152/physiolgenomics.90252.2008
Copyright © 2008 by the American Physiological Society.
2
Abstract
The torque-velocity relationship is known to be affected by ageing, decreasing its protective
role in the prevention of falls. Interindividual variability in this torque-velocity relationship is
partly determined by genetic factors (h²: 44-67%) As a first attempt, this genome-wide
linkage study aimed to identify chromosomal regions linked to the torque-velocity
relationship of the knee flexors and extensors. A selection of 283 informative male siblings
(17-36 years), belonging to 105 families, was used to conduct a genome-wide SNP-based
(Illumina Linkage IVb panel) multipoint linkage analysis for the torque-velocity relationship
of the knee flexors and extensors. The strongest evidence for linkage was found at 15q23 for
the torque-velocity slope of the knee extensors (TVSE). Other interesting linkage regions
with LOD scores > 2 were found at 7p12.3 (LOD = 2.03; P = 0.0011) for the torque-velocity
ratio of the knee flexors (TVRF), at 2q14.3 (LOD = 2.25; P = 0.0006) for TVSE, and at 4p14
and 18q23 for the torque-velocity ratio of the knee extensors TVRE, (LOD = 2.23 and 2.08; P
= 0.0007 and 0.001, respectively). We conclude that many small contributing genes are
involved in causing variation in the torque-velocity relationship of the knee flexor and
extensor muscles. Several earlier reported candidate genes for muscle strength and muscle
mass and new candidates are harboured within or in close vicinity of the linkage regions
reported in the present study.
Keywords
Human muscle strength, torque-velocity relationship, linkage, whole genome
3
Introduction
The force generated by a muscle not only depends on the length of the muscle, and thus the
sarcomere length or contractile filaments overlap, but it also varies with the velocity at which
it shortens. With increasing shortening velocity, the force sustained by the muscle rapidly
decreases, finally leading to a velocity at which force can no longer be sustained; this is the
maximum velocity of shortening (Vmax). Force at zero velocity of shortening is the isometric
force (F0). It is possible to compare muscles of different sizes by expressing the force at a
particular velocity as a fraction of F0. The speed of shortening of a contracting muscle is
dependent on the number of sarcomeres in series.
The torque-velocity relationship is known to be affected by ageing (6, 34, 44) and
concentric torques have been found to be depressed in older individuals (15, 24). The deficit
in concentric peak torque between young and elderly individuals has also been found to
increase with contraction velocity (6). Explosive muscle power (the product of force and the
speed at which force is produced during the first seconds of a movement) is important in
correcting a displacement or movement error. To prevent a fall, an individual must have
sufficient lower limb muscle power in the stabilizing leg to counteract the kinetic energy of
the imbalance (31). The discovery of genomic factors (e.g., DNA sequence variants) causing
individual variation in the torque-velocity relationship can elucidate the physiological
pathways involved in this trait. Furthermore, final discovery of velocity-dependent gene
variants might ultimately be used for screening individuals at risk for low muscle power and
be used in individualized exercise prescription.
Several studies suggest that isometric (Fisom) and concentric (Fconc) muscle strength
are under moderate to high genetic control with heritabilities ranging between 44% - 78% for
Fisom and 31% - 61% for Fconc (23, 35-37, 39, 41, 42). However, muscle strength is a complex

4
multifactorial trait, and high heritabilities do not guarantee the presence of quantitative trait
loci (QTL) with large effect size. Heritability estimates for variation in eccentric and
concentric arm flexion torques at different velocities, indicative for torque-velocity
specificity, have been reported by Thomis et al. (39). The contribution of genetic factors was
larger in eccentric torques at different velocities (66-78% at 110° and 62-82% at 140°) than
in concentric torques at different velocities (29-51% at 110° and 52-65% at 140°). The
importance of genetic factors gradually decreased with increasing velocity contraction in
concentric torques (from 65% at 30°/sec to 53% at 120°/sec in an elbow angle of 140°).
The ‘Human gene map for performance and health-related fitness phenotypes’ (26)
indicates that only a few studies have reported significant association of allelic variants in
putative QTLs with muscle strength characteristics, and even fewer associations have
consistently been replicated. To our knowledge, only a limited number of studies has been
performed to investigate association of candidate genes with the torque-velocity relationship.
Vincent et al. (45) demonstrated a genotype by velocity interaction with a greater decrease of
torque at higher velocities for the ACTN3 XX compared to the RR genotype group.
The linkage studies of Huygens et al. (16, 17) were the first to explore the role of
candidate genes in the myostatin pathway as QTLs for knee or trunk muscle strength and
estimated muscle cross-sectional area in 329 young male Caucasian siblings from the Leuven
Genes for Muscular Strength study (LGfMS). Results from these single-point linkage
explorations with a single microsatellite marker per candidate gene revealed that the
chromosomal regions harbouring myostatin (GDF8; 2q32.2), p21 (CDKN1A; 6p21.2), MyoD
(MYOD1; 11p15.1) and retinoblastoma (RB1; 13q14.2) are potentially interesting regions for
further genetic studies (LOD scores between 1.50 and 2.78, P values between 0.05 and
0.0002). Strengthened by these preliminary single-point linkage results and the physiological
evidence for the entire myostatin pathway, a multipoint linkage analysis was performed on a
5
larger and partially independent sample (18) for these genetic regions, in addition to the
regions harbouring the muscle regulatory factors Myf5 (MYF5; 12q21.31) and Myf6 (MYF6;
12q21.31); insulin-like growth factor-1 (IGF1; 12q22q23); cyclin-dependent kinase-2
(CDK2; 12q13); and titin (TTN; 2q31.2) (18). Significant or suggestive linkage with knee
muscle strength was found for the regions comprising CDK2 (LOD 3.4, P = 0.0004), RB1
(LOD 2.74, P = 0.0002) and IGF1 (LOD 2.6, P = 0.0002).
The first genome-wide multipoint linkage analysis on different muscle strength
characteristics revealed one region on chromosome 14 with significant evidence for linkage
with torque-length relationship of the knee flexors (14q24.3) and several other regions with
suggestive evidence for linkage (muscle and bone cross-sectional area: 14q32.2; isometric
knee peak torque at 30° flexion: 2p24.2; torque-length relationship of the knee extensors:
1q21.3, 2p23.3 and 18q11.2; muscle-cross sectional area adjusted knee extension torque:
18p11.31) (12).
In this paper we report the results of a genome-wide linkage scan using 6008 SNP
markers, aimed at identifying genomic regions harbouring candidate genes that cause
variation in the torque-velocity relationship of the knee flexor and extensor muscles.
Methods
Subjects
A selection of 283 male siblings aged 17-36 years in 105 families from the total sample of the
Leuven Genes for Muscular Strength study (LGfMS) was made and was composed of 13
quads, 47 trios and 45 pairs of brothers, resulting in 309 pairwise comparisons. As the
absence of parental genotypes reduces the accuracy of IBD estimation within families and

6
thus the power to detect linkage, emphasis was placed on the inclusion of trios and quads, as
well as the selection of the most informative sibpairs based on their level of discordance for
different strength phenotypes as Risch and Zhang (29) showed that extreme discordant
sibpairs provide substantial power to detect linkage for a QTL. The recruitment procedures
and subject characteristics have been described in detail previously (16, 18). Prior to
participation, the purpose and procedures of the study were explained in detail and the
subjects gave their written informed consent. The procedures used in this study were
approved by the medical and ethical committee of the Katholieke Universiteit Leuven.
Measurements
A detailed overview of the anthropometrical and muscle strength measurements in the
LGfMS project can be found in Huygens et al. (16, 18).
Muscle strength. The Cybex NORM isokinetic dynamometer (Lumex, Ronkonkoma, NY)
was used to assess the maximal isometric and concentric knee strength characteristics. After a
5 – 10 minutes warm-up period on an ergometer cycle and light stretching exercises, subjects
were positioned on the dynamometer, following the instructions of the manufacturer.
Anatomical zero was set at full extension of the knee and the rotation axis of the joint was
aligned with the mechanical axis of the dynamometer. Two isometric and four concentric
submaximal trials preceded the actual tests for familiarization with the testing procedure
(angle, range of motion or velocity). Maximal isometric knee strength was measured at two
angles (30° and 60°). At each angle, highest torque values (Nm) during a 6s isometric
contraction of three maximal flexion and extension contractions were retained for further
analysis. Thirty seconds of rest between each contraction were given. Peak torque over the
complete range of motion (0°-90°) of concentric knee extension and flexion was measured at
7
60°/sec (3 repetitions), at 120°/sec (25 repetitions) and at 240°/sec (5 repetitions). During
these contractions, torque at specific angles was also recorded: following the force-length
relationship of a muscle, optimal strength is generated at longer muscle length, i.e., at an
angle of 60° for knee extension (quadriceps) and 30° for knee flexion (hamstrings). Subjects
were verbally encouraged to perform at their maximum effort, and visual feedback of their
performance was presented after each test.
Torque-velocity calculations. Dynamic torques at different velocities (0°/sec, 60°/sec,
120°/sec and 240°/sec) for the optimal angles were first expressed as a percentage of
maximal isometric torque (relative torque per velocity). A natural logarithmic transformation
(Ln) of velocity was performed to linearize the torque-velocity curve with the equation y = a
+ bx (whereby a = intercept, b = slope, x = Ln(velocity); R² between .96 and .99). The
torque-velocity slope of each subjects linear torque-velocity curve for knee flexors (TVSF)
and extensors (TVSE) was calculated and retained for further analyses. A second measure of
torque-velocity was the ratio of torque at 240°/sec and torque at 60°/sec, multiplied by 100.
This torque-velocity ratio was calculated for knee flexors (TVRF) and extensors (TVRE).
Baecke Sport Index. The Baecke physical activity questionnaire (5) was used to assess the
level of daily physical activity and more specifically the subjects’ sports participation in the
Sport Index.
DNA collection
DNA was extracted using the Chemagic DNA Blood Kit on an automated Chemagic
Magnetic Separation Module I (Chemagen®, Baesweiler, Germany) and a Multiprobe I
(PerkinElmer®, Waltham, Massachusetts, USA) robotic station. An OrageneTM saliva kit
(Genotek, Ottawa, Ontario, Canada) was provided to siblings who were not able to deliver a
8
blood sample. DNA from these saliva kits was extracted following the guidelines of the
manufacturer.
Genotyping
The Illumina SNP-based Linkage Panel IVb was selected for genotyping. The panel includes
6008 bi-allelic SNP markers distributed evenly across the genome. The average and median
intervals between markers are 482kb (0.64 cM) and 298kb (0.35 cM), respectively. The
largest interval between successfully genotyped markers is 5.02 cM on chromosome 8 and
linkage disequilibrium between markers is minimal. The panel is designed to reach an
average minor allele frequency and heterozygosity of SNP markers of 37% and 44%,
respectively (Illumina technical report). The Illumina markers were typed with the Illumina
Beadstation 500GX, in accordance with the manufacturer’s standard recommendations. The
genotype success rate was 99.6% (33 SNPs were excluded from analysis due to low signal or
cluster overlap). Only autosomal SNPs were included for further analyses.
Statistical analysis
Descriptive statistics. Descriptive statistics and phenotypic correlations between the different
strength characteristics and covariates were calculated using SAS version 9.1.(SAS Institute
Inc., Cary, NC, USA). To explore the contribution of velocity-dependent torque declines on
the measure of the torque-velocity slope, linear stepwise regression analyses were performed.
The declines in torque from 0°/sec to 60°/sec and 60°/sec to 240°/sec were expressed as
ratios, and the proportion of variance explained by each of these torque-velocity curve ratios
was then estimated through regression analyses.
Heritability estimations. Upper-limit heritability of the traits (h²) were estimated using the
variance-components analysis procedure (VC) in QTDT (2). This estimate includes common

9
environmental variation in addition to the additive genetic component, because these factors
can not be separated using sib pairs only. Hence, it is called the upper-limit heritability.
Linkage analysis. Nonparametric multipoint linkage analyses were performed on 22
autosomes using the revised Haseman-Elston regression algorithm (MERLIN Regress)
outlined by Sham et al. (30) - implemented in MERLIN software v.1.1.1 (3). The revised H-E
algorithm combines the simplicity and robustness of regression-based methods and the
generality and power of variance components methods (30). This method requires
specification of trait heritability, population means and variances, which were calculated
using the Pedstats (46) and QTDT program (2). Average minor allele frequencies and
heterozygosities of markers in the present linkage panel within our sample were calculated
using MERLIN (3). Before statistical analyses, all genotypes were checked for Mendelian
inheritance, using the error detection protocol in MERLIN (3). Deviations from Hardy-
Weinberg equilibrium were assessed using the PEDSTATS program (46). Polymorphisms
with Hardy-Weinberg P values < 0.001 were removed from further analyses.
Under the assumption of no susceptibility loci, simulated data for 100 genome scans
were generated using MERLIN (3), in order to estimate the significant and suggestive
threshold for linkage (10, 21, 43). In each simulation, we retained the original pedigree
structure and generated a new data set with the same allele frequencies, marker spacing,
phenotypes and any missing genotypes or data pattern. Any evidence for linkage in these
simulated data is due to chance. The cut-off for suggestive linkage (LOD = 2.37) was
calculated as the mean of the genome-wide maximum LOD score from each genome scan,
which determines the maximum peak size expected once per genome scan by chance alone.
The significant linkage threshold (LOD = 3.64) was defined as the maximum LOD score
occurring with probability 0.05 in a genome scan (i.e., 5 peaks of equal or greater size
observed in the 100 simulations).
10
It is nowadays a widely accepted practice to obtain empirical P values for reported
LOD scores (1, 4, 32). We calculated empirical P values through the use of 1,000, 10,000 or
100,000 gene-dropping simulations (related to the original P values of SNPs with LOD > 1.5,
see Table 3 under P value) using MERLIN (3), under the assumption of no susceptibility loci.
The empirical significance level of a LOD peak was then determined by counting the
proportion of simulated (unlinked) LOD scores higher or equal to the original LOD score.
Combined linkage and association analysis. Tests for joint linkage and association in regions
with suggestive and significant evidence for linkage were carried out using QTDT
(Quantitative Transmission Disequilibrium Test) software (2). SNPs in a minus 1 LOD
support region around SNPs showing suggestive or significant evidence for linkage in the
MERLIN-regress linkage analysis were investigated. Fulker et al. (14) developed a method
for simultaneous modelling of association and linkage for quantitative traits using sib pair
data that also controls for population stratification. Combined linkage and association
analysis is a powerful tool for pinpointing functional associated loci responsible for a linkage
signal. Assuming there is suggestive/significant linkage before modelling association, the
extent to which evidence for linkage diminishes in the joint test of linkage and association
reflects the proximity of the marker to the functional quantitative trait locus (QTL) (9, 14). If
the linkage signal of a certain locus is entirely explained by modelling association (i.e., the
linkage signal is no longer significant), that particular locus is either the functional locus or in
tight LD with the functional locus.
Association analysis. SNPs in a minus 1 LOD support region around the SNP showing
significant evidence for linkage were tested for association with the MERLIN likelihood-ratio
test for the different strength phenotypes (3).
11
Results
Descriptive statistics
Average minor allele frequencies and heterozygosities for the autosomes within this
sample were 50% and 45%, respectively. The percentage of SNPs with MAF < 5% was
0.65%.
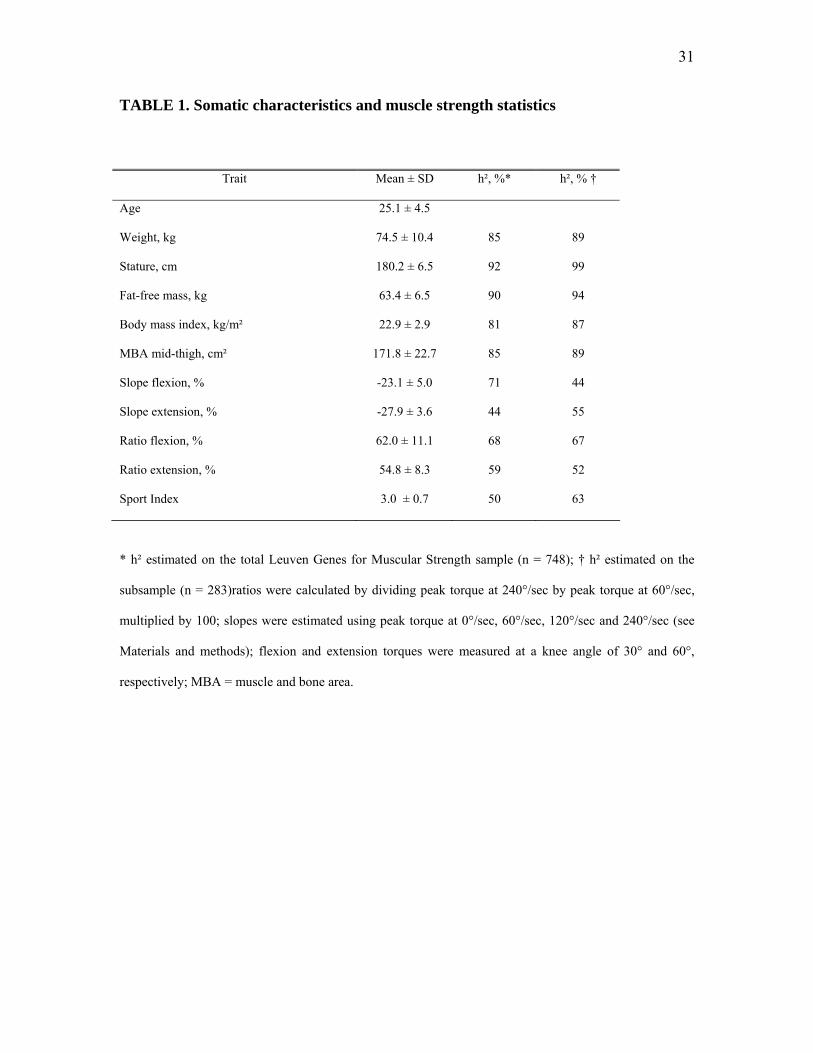
Table 1 shows the main somatic and muscle strength statistics of 283 siblings, with
corresponding upper-limit heritabilities (h²) estimated for both the total LGfMS sample (n =
748) and the subsample (n = 283). Subjects had normal weight and height; the body mass
index (BMI: 22.9 ± 2.9 kg/m²) indicates that they were, on average, rather lean.
As expected, the upper-limit heritability estimate of stature was high (99%), and
genetic determination of body mass and BMI were somewhat lower (89% and 87%,
respectively). Fat-free mass and muscle and bone cross-sectional area (MBA) of the mid-
thigh showed h² estimates of 94% and 89%, respectively. In this sample, moderate to high
upper-limit heritabilities were found for the torque-velocity slopes and ratios of the knee
flexors and extensors (44-67%). Variability in the Sport Index could be accounted for by
genetic factors for at most 63%.
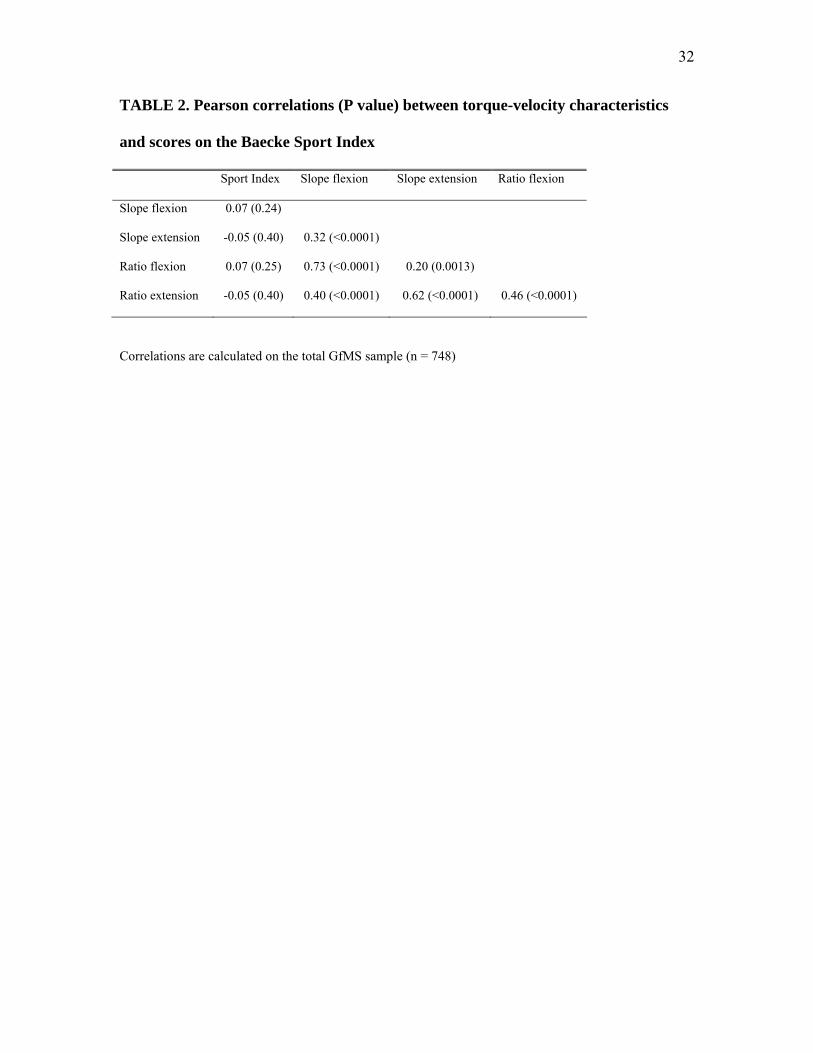
Correlations between the different torque-velocity phenotypes ranged from .20 to .73
(Table 2). Moderate to high correlations were found between TVSF and TVRF (.73), and
between TVSE and TVRE (.62). Low to moderate cross-trait/-estimate correlations were
found (r between .20 and .46), indicating the specificity of both torque-velocity estimates and
the torque-velocity characteristics of knee extensor muscles and flexor muscles. Correlations
between Sport Index and torque-velocity phenotypes were not significant.
12
Regression analyses demonstrated that the ratios for 0°/sec to 60°/sec and 60°/sec to
240°/sec for the knee flexors and extensors account for 41% and 55%, and 48% and 44%,
respectively, of the total variance in the torque velocity slope from 0°/sec to 240°/sec.
Linkage analyses
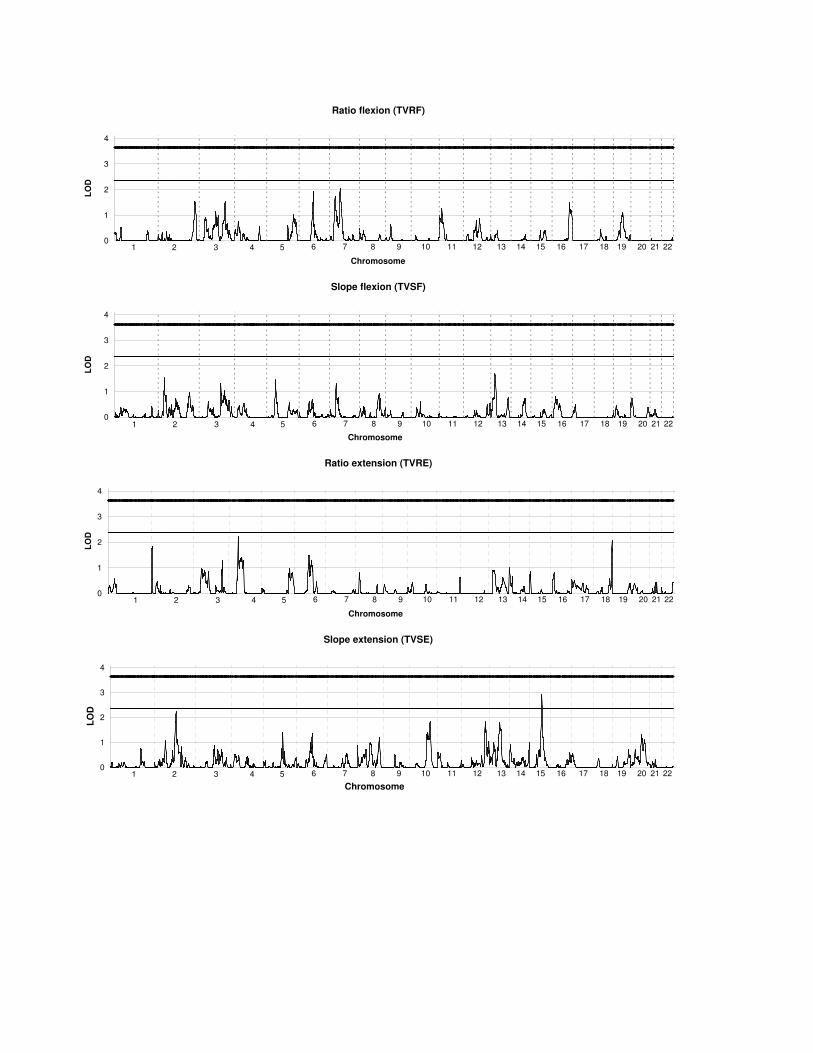
Figure 1 shows LOD score curves over the autosomal genome for each of the phenotypes.
Empirical P values and LOD scores for regions with LOD of 1.5 and higher are shown in
Table 3. The highest multipoint LOD score (2.91) was found on chromosome 15q23 for
TVSE, with an empirical P value < 10-5. Other interesting linkage regions with LOD scores >
2 were found for TVRF (LOD = 2.03 on 7p12.3), TVSE (LOD = 2.25 on 2q14.3) and TVRE
(LOD = 2.23 and 2.08 on 4p14 and 18q23, respectively).
Combined linkage and association analyses
Figure 2 shows two examples of LOD score curves for the effects of combined linkage and
association analysis for SNPs in a LOD -1 support region around SNP rs1403970 (2q36.3)
for TVRF, and around SNP rs477449 (2q14.3) for TVSE. No significant drop in LOD scores
was observed after modelling a joint test for linkage and association, indicative for rather
limited effects of allelic association between the investigated SNPs and the studied traits.
Similar results were found for all other SNPs in regions with evidence for linkage. However,
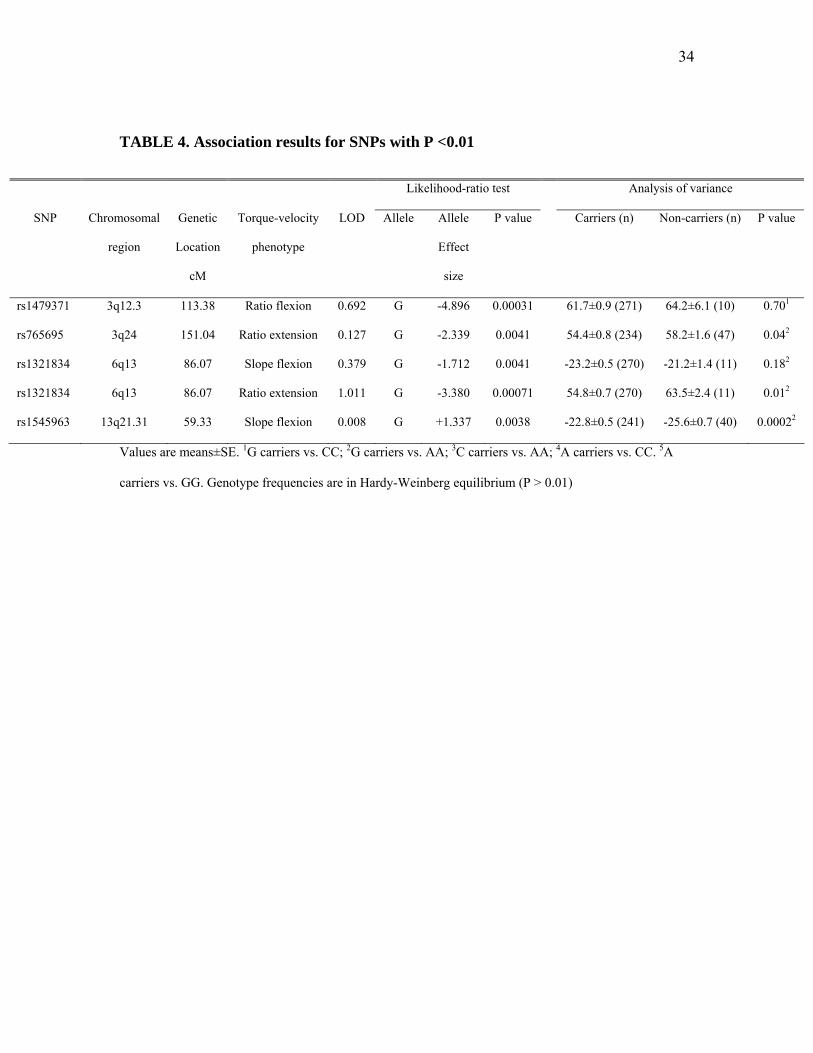
when applying the MERLIN likelihood-ratio association test, significant associations (P <
0.01) were found (Table 4) between SNPs within these LOD-1 support regions and several
phenotypes. Association tests for the SNPs with peak LOD scores are included in table 3,
however, these were not significant. Classical AN(C)OVA-type association analysis
confirmed the above MERLIN likelihood-ratio association findings, except for SNPs
13
rs1479371 at chr3 (TVRF) and SNP rs1321834 at chr6 (TVSF) (Table 4). Peak LOD scores
for the associated SNPs in table 4 are also included.
Discussion
We performed a genome-wide multipoint linkage analysis to identify quantitative trait loci
for the torque-velocity relationship of the knee flexors and extensors, including two
measures: 1) the slope of the linearized torque-velocity relationship and 2) the ratio of torque
at 240°/sec and torque at 60°/sec. The most promising evidence for linkage was observed for
the torque-velocity slope of the knee extensors with SNP rs1348318 on chromosome 15q23.
It is possible that the identified susceptibility locus is muscle specific (flexors vs. extensors)
and does not account for variability in knee flexion. As muscle strength and its derived
phenotypes are regarded as a complex genetic trait, identification of a large number of
markers with LOD scores that meet the criteria of suggestive linkage should not be expected.
Another interesting chromosomal region is region 7p12.3 that harbours a candidate gene
(IGFBP-1) for TVRF, although this region was not reported in earlier linkage studies
investigating strength-related phenotypes.
Our group previously performed a multipoint linkage analysis for muscle strength
and muscle mass in a similar cohort of young, male siblings, using microsatellite markers in
chromosomal regions harbouring myostatin pathway genes (18). Region 12q24.32 was
identified in the present study and is in the vicinity of the earlier reported region 12q22-23
(18). Compared with our previous analyses (18) with microsatellites markers (average marker
distance 4.81 cM for chromosome 12), the current study used the Illumina pre-designed SNP
based Linkage IVb panel with an average marker distance of 0.56 cM for chromosome 12.
Although this SNP panel induces higher genetic informativeness than microsatellite markers
14
(13, 47), differences between present (n = 283; Illumina SNP panel) and previous findings (n
= 367; microsatellite markers; Applied Biosystems) (18) are probably related to sample size
differences, or region-specific informativeness of closely chosen microsatellite markers
versus SNP markers (mean heterozygosity of SNP markers was 44.2% on chr12). Of note,
also several other overlapping/neighbouring linkage regions could be detected between the
present study and our genome-wide scan for maximum and length-dependent knee muscle
strength (12): region 2p25.3 (TVRE) with 2p24.2 for isometric torque at 30° flexion; region
10q25.3 (TVSE) with 10q26.13 for torque-length flexion; region 2q14.3 (TVSE) with 2q14.2
for muscle-bone area of the mid-thigh; region 12q24.32 (TVSE) with 12q24.32 and 12q24.31
for torque-length flexion and extension, respectively; and 15q23 (TVSE) with 15q23 for
isometric torque at 30° flexion. These regions might harbour candidate genes for underlying
shared characteristics like muscle fiber type distribution that cause variability in both torque-
length and torque-velocity characteristics.
Several multivariate genetic studies examined genetic and environmental
contributions to individual differences in various muscle strength characteristics (11, 36, 37,
39, 41, 42). These studies suggest a shared pleiotropic gene action for the different
phenotypic characteristics (the same genes causing variability in different types of
contractions, speeds, angles), referring to a common underlying genetic cause of strength
generality. This would imply that different examined phenotypes share the same
chromosomal region with suggestive or significant evidence for linkage. However, no clear
overlap for chromosomal regions between the different phenotypes was found within this
study. This is somewhat surprising, given the correlations up to 0.73, which strongly suggest
a shared genetic source of variance in muscle strength, although additional shared
environmental sources of covariance might induce this correlation. Common linkage signals
were also absent between highly intercorrelated VO2max and maximal power output (r = 0.94)

15
in the HERITAGE Family study (27). An explanation might be the different information
provided by each measure: the slope measure encompasses the torque-velocity curve in a
range of 0°sec to 240°/sec, whereas the ratio measure focuses on the faster part of the curve
(60°/sec to 240°/sec). Therefore, the torque-velocity ratio does not pick up linkage signals for
slower contraction velocities (0°/sec to 60/°sec), whereas the torque-velocity slope does.
The examined phenotypes related to the torque-velocity relationship are regulated
by numerous genes. In addition, gene-gene and gene-environment interactions and
contributions of environmental factors for muscle strength can be assumed to affect the
power of linkage studies. The identification of susceptibility loci using a small sample
size is therefore difficult. We calculated the successful estimation of IBD status for each
pairwise comparison over all 133 SNP markers at chromosome 22 by counting a >0.95
probability level as a successful classification of IBD status (IBD0, IBD1 or IBD2). The
information content for duo, trio and quad families was 60%, 78% and 88%, respectively,
which is even higher than reported in (33). The power to detect regions harbouring
susceptibility loci was estimated using the Genetic Power Calculator (25) based on the
heritabilities estimated in QTDT (assumptions: θ = 0; additive QTL variance = 30%;
common residual shared variance = 40% (= genetic variance not attributable to the QTL
and/or common environmental variance); no dominance; residual nonshared variance =
30%; α level = 0.05). A weighted non-centrality parameter was derived based on the
proportion of quads, trios and sib pairs. With the current sample, it is estimated that a
power of 70% can be reached for the detection of a QTL accounting for 30% of the
phenotypic variance, 30% residual shared variance, no dominance, and residual non-
shared variance of 40%. Much higher sample sizes are needed when small QTL effect
sizes are aimed to be detected.

16
Heritability of slope flexion in the subsample (n = 283) is low, which might in
part explain the single LOD peak > 1.5 for this trait. Muscle strength is a complex
multifactorial trait, and high heritabilities do not guarantee the presence of a quantitative
trait locus (QTL) with large effect size, although it increases the probability of finding
one.
Different mechanisms underly the variability in the torque-velocity relationship. First,
Rijkelijkhuizen et al. (28) showed in rats that the mean curvature of the torque-velocity
relationship for fast oxidative fibers was higher than for fast glycolytic fibers. They
concluded that the degree of curvature is fiber-type dependent. This is in line with the single-
fiber study of Bottinelli et al. (8) who demonstrated in humans that curvature was higher for
slow fibers than for fast fibers; among fast fibers, curvature was higher for fast oxidative (IIa)
than for fast glycolytic (IIb) fibers although the difference was not statistically significant.
Furthermore, a shortened velocity of knee extensor muscles was found to be significantly
correlated with the percentage of fast-twitch fibers in the vastus lateralis muscles (40).
Second, previous studies have also suggested the presence of unique genetic causes of
variance (genes causing non-shared variability in one specific muscle characteristic) (11, 36,
37, 39, 41, 42). For example, the ACTN3 (11q13.1) gene, which is expressed in Z-lines of
fast but not of slow muscle fibers, is believed to be one of the contributing genes in the
heritability of fiber type distribution (45) and might be (in)directly involved in the presence
of different curvatures of the torque-velocity relationships. ACTN3 R577X genotype
associations were reported for relative torques at 300°/sec (45), which is at much higher
speeds than measured in the present study. We did not find an important linkage signal in the
vicinity of ACTN3, which might be attributed to the absence of a causal SNP or lack of LD
with the causal SNP in the current Illumina SNP panel. An exploratory association analysis
17
of ACTN3 R577X genotypes at 60°/sec, 120°/sec and 240°/sec in a subsample of the LGfMS
study (n = 362) demonstrated stronger associations for relative dynamic knee extension
torques with increasing velocities (38). The lower relative dynamic torques at higher
contraction speeds for XX carriers might indicate a downward shift of the force-velocity
curve in subjects lacking the ACTN3 protein. Second, the torque-velocity relationship can
also be determined by fascicle length (muscle fibers packed in bundles which extend from the
proximal to distal tendons) and pennation angle of muscle fibers (angle between the muscle
fiber and the axis of the muscle). In a group of 37 male 100-m sprinters (fast and slow
group), Kumagai et al. (20) found significant, negative correlations between 100-m personal
best performance and fascicle length (absolute and relative to limb length) of the vastus
lateralis, and gastrocnemius medius and lateralis muscles. They argued that longer fascicle
length might lead to greater maximal velocity of shortening and allows for a greater force
output at an identical shortening velocity, which results in greater power production.
Furthermore, sprinters in the fast group had a significantly lower pennation angle than did the
slow group for the selected muscles. Both muscle architectural characteristics might be the
result of genes and/or gene-environment (i.e. training) interactions.
A candidate gene for the torque-velocity relationship is the insulin-like growth factor-
binding protein 1 gene (IGFBP-1) which is located on chromosome 7p12p13, within the
LOD peak of 2.03 at 7p12.3 (for TVRF). It binds to the insulin-like growth factor 1 protein
(IGF-1) which has previously been associated with quadriceps-muscle strength gains in
response to strength training (19). Lang et al. (22) demonstrated that an acute in vivo
elevation in circulating levels of IGFBP-1 is capable of selectively decreasing protein
synthesis in fast-twitch skeletal muscle and concluded that elevations in circulating and tissue
levels of IGFBP-1 may be an important mediator for the muscle catabolism observed in
various stress conditions. Several candidate genes have been associated with muscle strength
18
phenotypes (7, 26). However, these genes are not located within linkage regions reported in
the present study. Growth and differentiation factor 8 (GDF8; 190.6 Mb) is located in relative
vicinity to region 2q36.3 (221.8 Mb), myosin light chain kinase (MYLK; 124.9 Mb) to region
3q21 (141.8 Mb), both linked to TVRF, and insulin like growth factor 1 (IGF1; 101.3 Mb) to
region 12q24.32 (122.2 Mb). Further fine mapping analysis will be required to assess the
potential contribution of each of these candidate genes to explain velocity-dependent muscle
strength variation.
The results of the joint test for linkage and association showed no evidence for
association with any of the SNPs in regions with suggestive or significant evidence for
linkage. However, the association analysis using Merlin software (3) revealed significant
association in six different chromosomal regions (Table 4). These SNPs are located in the
vicinity of the SNPs with highest LOD scores within their respective chromosomal region.
Finding “true” association between a trait and a SNP requires complete LD between the
marker and the functional SNP, or the SNP being the actually functional SNP itself. Marker
spacing in the Linkage IVb Panel of Illumina, designed to perform linkage analyses rather
than association analyses, is relatively large (average marker spacing = 482Kb or 0.64 cM),
with low between-marker LD. Furthermore, the panel is not specifically enriched for
functional SNPs (eg non-synonymous variants), as minor allele frequency and heterozygosity
are the main criteria for markers to be included. This might explain the observation that the
SNPs which identified the highest linkage LOD score did not show up as most significant in
the association analysis. A much denser marker panel (eg microarray chips) or a functional
fine mapping panel of SNPs located in relevant ranked candidate genes (48) will be needed to
assess association in regions with suggestive or significant evidence for linkage.
19
Conclusions
This genome-wide multipoint linkage analysis of different torque-velocity characteristics
revealed several promising regions with evidence for linkage with the torque-velocity
relationship of the knee flexors and extensors. Several candidate genes that might be relevant
from a physiological point of view are located within the identified regions, and warrant
further fine mapping analyses by additional linkage and/or association studies. Despite only
the largest families from the LGfMS project were selected for this study, the relatively small
sample size limits the possibility to detect chromosomal regions where genes with small
effect sizes are harboured. Therefore, fine mapping and replication studies should focus on
highly informative samples (e.g. large families) of sufficiently large size, and preferably
extend to females and other age groups.
Acknowledgements
We thank the siblings for the participation in the study and their enthusiasm in performing at
their maximum during the strength testing protocol. The authors wish to thank I Salden for
his support during the preparation of DNA samples, and Ruben van ‘t Slot for careful
assistance with the genome scan.
Grants
GDM is funded by grant G.0496.05 of the Research Foundation Flanders (FWO). AW is
supported by the Research Fund of the Katholieke Universiteit Leuven (OT/04/44). WH was
funded by grant OT/98/39. Maarten Peeters is a Postdoctoral Fellow (FWO). The project is
20
funded by OT/98/39 for the phenotyping phase, and OT/04/44, G.0496.05 and mainly FWO
G.0567.07 for the genome scan.
Disclosures
The authors confirm that there is no conflict of interest for this research article.
Table legends
TABLE 1. Somatic characteristics and muscle strength statistics
* h² estimated on the total Leuven Genes for Muscular Strength sample (n = 748); ratios were calculated by
dividing peak torque at 240°/sec by peak torque at 60°/sec, multiplied by 100; slopes were estimated using
peak torque at 0°/sec, 60°/sec, 120°/sec and 240°/sec (see Materials and methods); flexion and extension
torques were measured at a knee angle of 30° and 60°, respectively; MBA = muscle and bone area.
TABLE 2. Pearson correlations (P value) between torque-velocity characteristics
and scores on the Baecke Sport Index
Correlations are calculated on the total GfMS sample (n = 748)
TABLE 3. LOD scores > 1.5 and P values of multipoint linkage analysis for torque-
velocity relationship of the knee flexors and extensors
TABLE 4. Association results for SNPs with P <0.01
Values are means±SE. 1G carriers vs. CC; 2G carriers vs. AA; 3C carriers vs. AA; 4A carriers vs. CC. 5A
carriers vs. GG. Genotype frequencies are in Hardy-Weinberg equilibrium (P > 0.01)
21
Figure legends
FIGURE 1. LOD scores for autosomal linkage analysis for ratio and slope
characteristics of torque-velocity for the knee flexors and extensors
Cut-off LOD scores for suggestive and significant linkage are 2.37 and 3.64, respectively.
FIGURE 2. Representation of combined linkage and association analysis for ratio
flexion and slope extension at LOD -1 support region around SNPs rs1403970 and
rs477449, respectively
LOD scores for variance components analyses in QTDT: Linkage (VC_L) and combined linkage and
association (VC_LA); LOD scores for Merlin-regress analyses (REG)
22
References
1. Abecasis GR, Burt RA, Hall D, Bochum S, Doheny KF, Lundy SL,
Torrington M, Roos JL, Gogos JA and Karayiorgou M. Genomewide scan in
families with schizophrenia from the founder population of Afrikaners reveals
evidence for linkage and uniparental disomy on chromosome 1. Am J Hum Genet
74: 403-417, 2004.
2. Abecasis GR, Cardon LR and Cookson WO. A general test of association for
quantitative traits in nuclear families. Am J Hum Genet 66: 279-292, 2000.
3. Abecasis GR, Cherny SS, Cookson WO and Cardon LR. Merlin--rapid
analysis of dense genetic maps using sparse gene flow trees. Nat Genet 30: 97-
101, 2002.
4. Abecasis GR, Yashar BM, Zhao Y, Ghiasvand NM, Zareparsi S, Branham
KE, Reddick AC, Trager EH, Yoshida S, Bahling J, Filippova E, Elner S,
Johnson MW, Vine AK, Sieving PA, Jacobson SG, Richards JE and Swaroop
A. Age-related macular degeneration: a high-resolution genome scan for
susceptibility loci in a population enriched for late-stage disease. Am J Hum Genet
74: 482-494, 2004.
23
5. Baecke JA, Burema J and Frijters JE. A short questionnaire for the
measurement of habitual physical activity in epidemiological studies. Am J Clin
Nutr 36: 936-942, 1982.
6. Bazzucchi I, Marchetti M, Rosponi A, Fattorini L, Castellano V, Sbriccoli P
and Felici F. Differences in the force/endurance relationship between young and
older men. Eur J Appl Physiol 93: 390-397, 2005.
7. Beunen G and Thomis M. Gene Powered? Where to Go from Heritability (h2) in
Muscle Strength and Power? Exerc Sport Sci Rev 32: 148-154, 2004.
8. Bottinelli R, Canepari M, Pellegrino MA and Reggiani C. Force-velocity
properties of human skeletal muscle fibres: myosin heavy chain isoform and
temperature dependence. J Physiol 495 ( Pt 2): 573-586, 1996.
9. Cardon LR and Abecasis GR. Some properties of a variance components model
for fine-mapping quantitative trait loci. Behav Genet 30: 235-243, 2000.
10. Churchill GA and Doerge RW. Empirical threshold values for quantitative trait
mapping. Genetics 138: 963-971, 1994.
11. De Mars G, Thomis MA, Windelinckx A, Van Leemputte M, Maes HH,
Blimkie CJ, Claessens AL, Vlietinck R and Beunen G. Covariance of isometric

24
and dynamic arm contractions: multivariate genetic analysis. Twin Res Hum
Genet 10: 180-190, 2007.
12. De Mars G, Windelinckx A, Huygens W, Peeters MW, Beunen GP, Aerssens
J, Vlietinck R and Thomis MA. Genome-wide linkage scan for maximal and
length-dependent knee muscle strength in young men: significant evidence for
linkage at chromosome 14q24.3. J Med Genet 45: 275-283, 2008.
13. Evans DM and Cardon LR. Guidelines for genotyping in genomewide linkage
studies: single-nucleotide-polymorphism maps versus microsatellite maps. Am J
Hum Genet 75: 687-692, 2004.
14. Fulker DW, Cherny SS, Sham PC and Hewitt JK. Combined linkage and
association sib-pair analysis for quantitative traits. Am J Hum Genet 64: 259-267,
1999.
15. Hughes VA, Frontera WR, Wood M, Evans WJ, Dallal GE, Roubenoff R and
Fiatarone Singh MA. Longitudinal muscle strength changes in older adults:
influence of muscle mass, physical activity, and health. J Gerontol A Biol Sci Med
Sci 56: B209-B217, 2001.
16. Huygens W, Thomis MA, Peeters MW, Aerssens J, Janssen R, Vlietinck RF
and Beunen G. Linkage of myostatin pathway genes with knee strength in
humans. Physiol Genomics 17: 264-270, 2004.
25
17. Huygens W, Thomis MA, Peeters MW, Aerssens J, Janssen RG, Vlietinck RF
and Beunen G. A quantitative trait locus on 13q14.2 for trunk strength. Twin Res
7: 603-606, 2004.
18. Huygens W, Thomis MA, Peeters MW, Aerssens J, Vlietinck R and Beunen
GP. Quantitative trait loci for human muscle strength: linkage analysis of
myostatin pathway genes. Physiol Genomics 22: 390-397, 2005.
19. Kostek MC, Delmonico MJ, Reichel JB, Roth SM, Douglass L, Ferrell RE
and Hurley BF. Muscle strength response to strength training is influenced by
insulin-like growth factor 1 genotype in older adults. J Appl Physiol 98: 2147-
2154, 2005.
20. Kumagai K, Abe T, Brechue WF, Ryushi T, Takano S and Mizuno M. Sprint
performance is related to muscle fascicle length in male 100-m sprinters. J Appl
Physiol 88: 811-816, 2000.
21. Lander E and Kruglyak L. Genetic dissection of complex traits: guidelines for
interpreting and reporting linkage results. Nat Genet 11: 241-247, 1995.
22. Lang CH, Vary TC and Frost RA. Acute in vivo elevation of insulin-like
growth factor (IGF) binding protein-1 decreases plasma free IGF-I and muscle
protein synthesis. Endocrinology 144: 3922-3933, 2003.
26
23. Loos R, Thomis M, Maes HH, Beunen G, Claessens AL, Derom C, Legius E,
Derom R and Vlietinck R. Gender-specific regional changes in genetic structure
of muscularity in early adolescence. J Appl Physiol 82: 1802-1810, 1997.
24. Pousson M, Lepers R and Van HJ. Changes in isokinetic torque and muscular
activity of elbow flexors muscles with age. Exp Gerontol 36: 1687-1698, 2001.
25. Purcell S, Cherny SS and Sham PC. Genetic Power Calculator: design of
linkage and association genetic mapping studies of complex traits. Bioinformatics
19: 149-150, 2003.
26. Rankinen T, Bray MS, Hagberg JM, Perusse L, Roth SM, Wolfarth B and
Bouchard C. The Human Gene Map for Performance and Health-Related Fitness
Phenotypes: The 2005 Update. Med Sci Sports Exerc 38: 1863-1888, 2006.
27. Rico-Sanz J, Rankinen T, Rice T, Leon AS, Skinner JS, Wilmore JH, Rao
DC and Bouchard C. Quantitative trait loci for maximal exercise capacity
phenotypes and their responses to training in the HERITAGE Family Study.
Physiol Genomics 16: 256-260, 2004.
28. Rijkelijkhuizen JM, de Ruiter CJ, Huijing PA and De Haan A. Force/velocity
curves of fast oxidative and fast glycolytic parts of rat medial gastrocnemius
muscle vary for concentric but not eccentric activity. Pflugers Arch 446: 497-503,
2003.

27
29. Risch NJ and Zhang H. Mapping quantitative trait loci with extreme discordant
sib pairs: sampling considerations. Am J Hum Genet 58: 836-843, 1996.
30. Sham PC, Purcell S, Cherny SS and Abecasis GR. Powerful regression-based
quantitative-trait linkage analysis of general pedigrees. Am J Hum Genet 71: 238-
253, 2002.
31. Skelton DA, Kennedy J and Rutherford OM. Explosive power and asymmetry
in leg muscle function in frequent fallers and non-fallers aged over 65. Age
Ageing 31: 119-125, 2002.
32. Song KK, Weeks DE, Sobel E and Feingold E. Efficient simulation of P values
for linkage analysis. Genet Epidemiol 26: 88-96, 2004.
33. The International Multiple Sclerosis Genetics Consortium. Enhancing linkage
analysis of complex disorders: an evaluation of high-density genotyping. Hum
Mol Genet 13: 1943-1949, 2004.
34. Thom JM, Morse CI, Birch KM and Narici MV. Influence of muscle
architecture on the torque and power-velocity characteristics of young and elderly
men. Eur J Appl Physiol 100: 613-619, 2007.
28
35. Thomis M, Claessens AL, Vlietinck R, Marchal G and Beunen G. Accuracy of
anthropometric estimation of muscle cross-sectional area of the arm in males. Am
J Hum Biol 9: 73-86, 1997.
36. Thomis M, Van Leemputte M, Maes H, Blimkie CJR, Claessens AL, Marchal
G, Willems E, Vlietinck R and Beunen G. Multivariate genetic analysis of
maximal isometric muscle force at different elbow angles. J Appl Physiol 82: 959-
967, 1997.
37. Thomis MA, Beunen GP, Maes HH, Blimkie CJ, Van Leemputte M,
Claessens AL, Marchal G, Willems E and Vlietinck RF. Strength training:
importance of genetic factors. Med Sci Sports Exerc 30: 724-731, 1998.
38. Thomis MA, De Mars G, Windelinckx A, Vincent B, Huygens W, Peeters M,
Vlietinck R and Beunen G. Alpha-actinin-3 R577X Genotype and Muscle Power
in Young Male Adults of the Leuven Genes for Muscular Strength Study. Med Sci
Sports Exerc 38: S365-S366, 2006.
39. Thomis MAI, Beunen GP, Van Leemputte M, Maes HH, Blimkie CJ,
Claessens AL, Marchal G, Willems E and Vlietinck RF. Inheritance of static
and dynamic arm strength and some of its determinants. Acta Physiol Scand 163:
59-71, 1998.
29
40. Thorstensson A, Grimby G and Karlsson J. Force-velocity relations and fiber
composition in human knee extensor muscles. J Appl Physiol 40: 12-16, 1976.
41. Tiainen K, Sipila S, Alen M, Heikkinen E, Kaprio J, Koskenvuo M, Tolvanen
A, Pajala S and Rantanen T. Shared genetic and environmental effects on
strength and power in older female twins. Med Sci Sports Exerc 37: 72-78, 2005.
42. Tiainen K, Sipila S, Alen M, Heikkinen E, Kaprio J, Koskenvuo M, Tolvanen
A, Pajala S and Rantanen T. Heritability of maximal isometric muscle strength
in older female twins. J Appl Physiol 96: 173-180, 2004.
43. Treloar SA, Wicks J, Nyholt DR, Montgomery GW, Bahlo M, Smith V,
Dawson G, Mackay IJ, Weeks DE, Bennett ST, Carey A, Ewen-White KR,
Duffy DL, O'connor DT, Barlow DH, Martin NG and Kennedy SH.
Genomewide linkage study in 1,176 affected sister pair families identifies a
significant susceptibility locus for endometriosis on chromosome 10q26. Am J
Hum Genet 77: 365-376, 2005.
44. Valour D, Ochala J, Ballay Y and Pousson M. The influence of ageing on the
force-velocity-power characteristics of human elbow flexor muscles. Exp
Gerontol 38: 387-395, 2003.
30
45. Vincent B, De BK, Ramaekers M, Van den EE, Van LM, Hespel P and
Thomis MA. ACTN3 (R577X) genotype is associated with fiber type
distribution. Physiol Genomics 19;32: 58-63, 2007.
46. Wigginton JE and Abecasis GR. PEDSTATS: descriptive statistics, graphics
and quality assessment for gene mapping data. Bioinformatics 21: 3445-3447,
2005.
47. Wilcox MA, Pugh EW, Zhang H, Zhong X, Levinson DF, Kennedy GC and
Wijsman EM. Comparison of single-nucleotide polymorphisms and
microsatellite markers for linkage analysis in the COGA and simulated data sets
for Genetic Analysis Workshop 14: Presentation Groups 1, 2, and 3. Genet
Epidemiol 29 Suppl 1: S7-28, 2005.
48. Windelinckx A, Vlietinck R, Aerssens J, Beunen G and Thomis MA.
Selection of genes and single nucleotide polymorphisms for fine mapping starting
from a broad linkage region. Twin Res Hum Genet 10: 871-885, 2007.
31
TABLE 1. Somatic characteristics and muscle strength statistics
Trait Mean ± SD h², %* h², % †
Age 25.1 ± 4.5
Weight, kg 74.5 ± 10.4 85 89
Stature, cm 180.2 ± 6.5 92 99
Fat-free mass, kg 63.4 ± 6.5 90 94
Body mass index, kg/m² 22.9 ± 2.9 81 87
MBA mid-thigh, cm² 171.8 ± 22.7 85 89
Slope flexion, % -23.1 ± 5.0 71 44
Slope extension, % -27.9 ± 3.6 44 55
Ratio flexion, % 62.0 ± 11.1 68 67
Ratio extension, % 54.8 ± 8.3 59 52
Sport Index 3.0 ± 0.7 50 63
* h² estimated on the total Leuven Genes for Muscular Strength sample (n = 748); † h² estimated on the
subsample (n = 283)ratios were calculated by dividing peak torque at 240°/sec by peak torque at 60°/sec,
multiplied by 100; slopes were estimated using peak torque at 0°/sec, 60°/sec, 120°/sec and 240°/sec (see
Materials and methods); flexion and extension torques were measured at a knee angle of 30° and 60°,
respectively; MBA = muscle and bone area.
32
TABLE 2. Pearson correlations (P value) between torque-velocity characteristics
and scores on the Baecke Sport Index
Sport Index Slope flexion Slope extension Ratio flexion
Slope flexion 0.07 (0.24)
Slope extension -0.05 (0.40) 0.32 (<0.0001)
Ratio flexion 0.07 (0.25) 0.73 (<0.0001) 0.20 (0.0013)
Ratio extension -0.05 (0.40) 0.40 (<0.0001) 0.62 (<0.0001) 0.46 (<0.0001)
Correlations are calculated on the total GfMS sample (n = 748)

33
TABLE 3. LOD scores > 1.5 and P values of multipoint linkage analysis for torque-
velocity relationship of the knee flexors and extensors
Trait SNP Chromosomal region
cM LOD
P value Empirical P value
P value Likelihood-ratio test
Slope flexion rs717651 13q12.3 26.87 1.70 0.003 0.002 0.95 Ratio flexion rs1403970 2q36.3 231.87 1.55 0.004 0.004 0.36 rs1384542 3q25.32 164.47 1.53 0.004 0.002 0.92 rs2998367 6q14.1 88.25 1.93 0.0014 0.0007 0.18 rs921630 7p12.3 70.13 2.03 0.0011 0.0006 0.32 Slope extension rs477449 2q14.3 139.88 2.25 0.0006 <0.0001 0.96 rs4751909 10q25.3 133.38 1.85 0.002 <0.001 0.095 rs918044 12q24.32 149.17 1.85 0.002 0.001 0.149 rs768826 13q21.33 64.23 1.82 0.002 <0.001 0.73 rs1348318 15q23 76.79 2.91 0.00013 <0.00001 0.62 Ratio extension rs938326 2p25.3 3.58 1.85 0.002 0.001 0.033 rs1039559 4p14 58.04 2.23 0.0007 0.0001 0.70 rs1866338 18q23 118.79 2.08 0.001 <0.001 0.73
34
TABLE 4. Association results for SNPs with P <0.01
Values are means±SE. 1G carriers vs. CC; 2G carriers vs. AA; 3C carriers vs. AA; 4A carriers vs. CC. 5A
carriers vs. GG. Genotype frequencies are in Hardy-Weinberg equilibrium (P > 0.01)
Likelihood-ratio test Analysis of variance
SNP Chromosomal
region
Genetic
Location
cM
Torque-velocity
phenotype
LOD Allele Allele
Effect
size
P value Carriers (n) Non-carriers (n) P value
rs1479371 3q12.3 113.38 Ratio flexion 0.692 G -4.896 0.00031 61.7±0.9 (271) 64.2±6.1 (10) 0.701
rs765695 3q24 151.04 Ratio extension 0.127 G -2.339 0.0041 54.4±0.8 (234) 58.2±1.6 (47) 0.042
rs1321834 6q13 86.07 Slope flexion 0.379 G -1.712 0.0041 -23.2±0.5 (270) -21.2±1.4 (11) 0.182
rs1321834 6q13 86.07 Ratio extension 1.011 G -3.380 0.00071 54.8±0.7 (270) 63.5±2.4 (11) 0.012
rs1545963 13q21.31 59.33 Slope flexion 0.008 G +1.337 0.0038 -22.8±0.5 (241) -25.6±0.7 (40) 0.00022
Ratio flexion (TVRF)
0
1
2
3
4
Chromosome
LOD
1 2 3 4 5 6 7 8 9 10 11 12 13 14 15 16 17 18 19 20 21 22
Slope flexion (TVSF)
0
1
2
3
4
Chromosome
LOD
1 2 3 4 5 6 7 8 9 10 11 12 13 14 15 16 17 18 19 20 21 22
Ratio extension (TVRE)
0
1
2
3
4
Chromosome
LOD
1 2 3 4 5 6 7 8 9 10 11 12 13 14 15 16 17 18 19 20 21 22
Slope extension (TVSE)
0
1
2
3
4
Chromosome
LOD
1 2 3 4 5 6 7 8 9 10 11 12 13 14 15 16 17 18 19 20 21 22

Ratio flexion (TVRF)
0
0.5
1
1.5
2
223.8 226.2 228.0 229.1 234.0 238.2 239.6 243.9
Position (cM)
LOD
VC_L
VC_LA
REG
rs1403970
Slope extension (TVSE)
0
0.5
1
1.5
2
2.5
130.7 134.6 135.2 138.6 141.4 142.4
Position (cM)
LO
D
rs477449