MASARYK UNIVERSITY - IS MUNI
205
MASARYK UNIVERSITY Faculty of Science Martin KLVAŇA STRUCTURE-DYNAMICS-FUNCTION RELATIONSHIPS OF HALOALKANE DEHALOGENASES Dissertation thesis Supervisor: Assoc. Prof. RNDr. Miroslav Němec, CSc. Brno, 2009
-
Upload
khangminh22 -
Category
Documents
-
view
3 -
download
0
Transcript of MASARYK UNIVERSITY - IS MUNI

MASARYK UNIVERSITYFaculty of Science
Martin KLVAŇA
STRUCTUREDYNAMICSFUNCTION RELATIONSHIPSOF HALOALKANE DEHALOGENASES
Dissertation thesis
Supervisor: Assoc. Prof. RNDr. Miroslav Němec, CSc. Brno, 2009


Bibliografická identifikace / Bibliographic identification
Jméno a příjmení autora / Author name: Martin Klvaňa
Název dizertační práce / Dissertation thesis title: Vztahy mezi strukturou, dynamikou a funkcí halogenalkandehalogenáz / Structuredynamicsfunction relationships of haloalkane dehalgoenases
Studijní program / Study programme: Biologie / Biology
Studijní obor / Field of study: Mikrobiologie / Microbiology
Školitel / Supervisor: Assoc. Prof. RNDr. Miroslav Němec, Csc.
Rok obhajoby / Defence year: 2010
Klíčová slova / Keywords: Protein, enzym, halogenalkandehalogenáza, vnořené aktivní místo, tunel, odchod produktů, výměna molekul vod, molekulovědynamická simulace, návrh mutantů, CAVER / Protein, enzyme, haloalkane dehalogenase, buried active site, tunnel, product release, water exchange, molecular dynamics simulation, design of mutants, CAVER


© Martin Klvaňa, Masaryk University, 2009


Acknowledgements
My PhD research has been made possible by the following institutions:Masaryk University, Supercomputing Center Brno, EML Research, Kobe University
. . . and with financial support from the Ministry of Education of the Czech Republic:Grant MSM0021622412
Below follows my list of people to whom I would like to say thank you:
Study supervisor: Assoc. Prof. RNDr. Miroslav Němec, Csc.Department of MicrobiologyFaculty of Science, Masaryk UniversityBrno, Czech Republic
Research supervisor: Assoc. Prof. Jiří Damborský, Ph.D.Loschmidt LaboratoriesDepartment of Experimental BiologyFaculty of Science, Masaryk UniversityBrno, Czech Republic
Methodological advisor: Dr. Rebecca C. WadeMolecular and Cellular Modeling GroupEML ResearchHeidelberg, Germany
Technical advisor: Mgr. Jan BrezovskýLoschmidt LaboratoriesDepartment of Experimental BiologyFaculty of Science, Masaryk UniversityBrno, Czech Republic
Publications coauthors: Pavel Banáš, Radka Chaloupková, Jiří Damborský, Jan Dohnálek, Pavel Dvořák, Táňa Koudeláková, Petr Kulhánek, Ivana KutáSmatanová, Michal Kutý, Yuji Nagata, Michal Otyepka, Martina Pavlová, Zbyněk Prokop, Alena Stsiapanava, Masataka Tsuda, Rebecca C. Wade.
Software coauthors: Filip Andres, Petr Beneš, Jan Brezovský, Eva Chovancová, Jiří Damborský, Petr Jaša, Barbora Kozlíková, Petr Medek, Antonín Pavelka, Jiří Sochor, Tibor Szabó, Matúš Zamborský.
Laboratory colleagues: Šárka Bidmanová, Jan Brezovský, Radka Chaloupková, Eva Chovancová, Pavel Dvořák, Andrea Fořtová, Khomaini Hasan, Petr Jeřábek, Táňa Koudeláková, Marta Monincová, Tomáš Mozga, Antonín Pavelka, Martina Pavlová, Zbyněk Prokop, Veronika Šťěpánková.
Other scientists: Takashi Nakamura, Alexander Shug, Shigenori Tanaka, Hirofumi Watanabe.


How can I put it? Life is like video footage: Hard to edit, directors, that never understood it.
― Robert F. Diggs


Abstrakt
Vždycky dělám to, co neumím, abych se případně naučil, jak to dělat.
― Pablo Picasso
Bílkoviny, geny a genetický kód jsou nejzákladnějšími funkcemi pro život. V živých organismech plní bílkoviny řadu funkcí z nichž katalytická funkce některých bílkovin, tzv. enzymů, je tou nejzásadnější, protože enzymy urychlují specifické chemické reakce, nezbytné k životním procesům. Pochopení základních principů života vyžaduje detailní pochopení funkce enzymů. Jelikož funkce enzymu je určena jeho strukturou a dynamikou, objasnění funkce vyžaduje pochopení vztahu mezi strukturou, dynamikou a funkcí pro každý jednotlivý enzym. Tyto tři vlastnosti musi být navíc vnímány z evolučního hlediska, protože nic v biologii nemá smysl, pokud to neni bráno z pohledu evoluce. Každý jednotlivý enzym si zaslouží být studován, protože každý enzym může poskytnout důležité informace o strukturnědynamickofunkčních vztazích, které mohou být případně zobecněny pro další enzymy, potažmo bílkoviny jako celek, a to z důvodu omezeného množství možného trojrozměrného uspořádání struktury bílkoviny.
/ hydrolázové trojrozměrné uspořádání je jedním z nejuniverzálnějších, protože podporuje řadu hydrolytickýchα β funkcí, včetně hydrolytické dehalogenace katalyzované enzymy halogenalkandehalogenázami. Tyto enzymy přitahují pozornost vědců přes dvacet let z mnoha důvodů, včetně toho, že náleží k univerzálnímu trojrozměrnému uspořádání, a že díky schopnosti podílet se na odstraňování jedovatých halogenovaných sloučenin vnesených do životního prostředí člověkem mají potenciálně nezanedbatelný ekologický význam. Halogenalkandehalogenázy katalyzují hydrolytickou dehalogenaci halogenovaných alifatických uhlovodíků na příslušný alkohol, halogenidový anion a proton. Hydrofóbní charakter substrátů halogenalkandehalogenáz vyžaduje, aby bylo aktivní místo těchto enzymů vnořené, a tím chráněno od vnějšího vodného prostředí. Na druhou stranu, výměna molekul vod, substrátu a produktů mezi vnořeným aktivním místem a vnějším prostředím musí být zajištěna tak, aby umožnila učinnou dehalogenační funkci. S cílem lépe pochopit procesy výměny reakčních molekul na atomární úrovni, molekulovědynamické simulace byly provedeny s halogenalkandehalogenázou DhaA z bakterie Rhodococcus rhodochrous NCIMB 13064. Na základě těchto simulací byly navrženy mutace a místa vhodná k mutacím v cestách, které mohou potenciálně sloužit k výměně molekul. Tyto cesty a výměnné procesy byly dále podrobně prozkoumány a interpretovány ve světle experimentálních dat: mutageneze, dehalogenační aktivity, stability sekundární struktury a trojrozměrné rentgenové krystalové struktury.
Účinný mechanismus umožnující kontrolovanou výměnu molekul byl vytvořen v enzymu DhaA nahrazením některých alifatických aminokyselinových zbytků velkými aromatickými v hlavní výměnné cestě, tzv. hlavním tunelu. Tímto bylo dosaženo až 26ti násobného zvýšení účinnosti mutantů DhaA v dehalogenaci jedovaté sloučeniny 1,2,3trichlorpropanu. Vnesené mutace způsobily, že se hlavní tunel změnill z trvale otevřeného na přechodně otevřený, který se otevírá a zavírá podle fáze reakčního cyklu. Přechodné otevření může být vyvoláno molekulami vody, které vstupují z vnějšího prostředí do aktivního místa, kde solvatují produkty reakce. Na druhou stranu, v nepřítomnosti halogenidového aniontu v aktivním místě, je toto dostatečně odstíněno od vnějšího prostředí a brání molekulám vod ve vstupu do aktivního místa, kde by mohly soupeřit s molekulou substrátu a bránit tak jeho vazbě do reaktivní pozice pro první chemický krok dehalogenační reakce. Cesty nalezené v halogenalkandehalogenáze DhaA a jejích mutantech, a mechanismy výměny substrátu, produktů a vod naznačují důležitost dynamiky pro funkci halogenalkandehalogenáz. Nalezené cesty také posloužily jako počáteční zkušební sada při vývoji algoritmu CAVER 2.0, sloužícího pro rychlý výpočet a charakterizaci cest, které vedou z vnořené dutiny v bílkovině na povrch. Tento přístup má, v kombinaci s molekulovou dynamikou, potenciál dále podněcovat výzkum s cílem pochopit vztahy mezi strukturou, dynamikou a funkcí bílkovin s vnořeným vazebným či aktivním místem.
Klíčová slova: Protein, enzym, halogenalkandehalogenáza, vnořené aktivní místo, tunel, odchod produktů, výměna molekul vod, molekulovědynamická simulace, návrh mutantů, CAVER

Abstract
I am always doing that which I cannot do, in order that I may learn how to do it.
― Pablo Picasso
Proteins, genes and genetic code are the most fundamental functions required for life. Among the proteins, those with catalytic functions, the socalled enzymes, are fundamentally the most important because they speed up specific and otherwise too slow chemical reactions to sustain living processes. Understanding the underlying principles of life thus requires understanding enzyme function to the very deepest level. Since the function is determined by protein structure and dynamics, elucidation of the underlying principles of enzyme function requires detailed understanding of relationships between structure, dynamics and function for every particular enzyme. Moreover, these properties must be considered from evolutionary perspective because nothing in biology has sense unless in the view of evolution. Every single enzyme is worth of study because every enzyme can reveal important information on the structuredynamicsfunction relationships, that might be possibly generalised to some other enzymes, and proteins in general, when considering limited space of threedimensional protein folds.
/ hydrolase fold is one of the most versatile protein folds as it supports various hydrolytic functions includingα β hydrolytic dehalogenation catalysed by haloalkane dehalogenases. These enzymes have attracted scientists since 80s for many reasons, including their belonging to the versatile fold and potentially high ecological importance in removal of toxic halogenated xenobiotics from polluted environment. Haloalkane dehalogenases perform hydrolytic dehalogenation of halogenated aliphatic hydrocarbons to corresponding alcohol, halide anion and proton. Hydrophobic nature of the substrate implies necessity for the active site to be buried in the protein core, shielded from the bulk solvent. Contrary, exchange of water, substrate and products between the buried active site and bulk solvent must be efficient for effective dehalogenating function. Aimed at gaining better understanding of the exchange processes at atomic level, molecular dynamics simulations of haloalkane dehalogenase DhaA from Rhodococcus rhodochrous NCIMB 13064 were employed/conducted: (i) to design mutations and hot spots for mutagenesis in exchange pathways; (ii) to identify product release and water exchange pathways, proteinproduct, proteinwater and productwater interactions; and (iii) to interpret them in the light of experimental data: mutagenesis, dehalogenating activities, secondary structure stabilities and threedimensional protein Xray crystal structures.
An efficient gating mechanism allowing controlled exchange of molecules was established in the DhaA enzyme by introducing aromatic substitutions in the main exchange route, the socalled main tunnel, causing up to 26fold improvement in catalytic performance of DhaA mutants towards nonnatural xenobiotic, 1,2,3trichloropropane. The mutations caused change of the main tunnel from permanent to transient that opens temporarily according to the phase of reaction cycle. Transient opening can be induced by water from bulk solvent that enters the active site to solvate products. On the other hand, in the absence of the halide anion in the active site, the shielding is efficient to hinder water from entering the active site where it would unfavourably compete with a substrate and disturb its binding into reactive position for initial chemical step of the dehalogenating reaction. Pathways identified in the DhaA haloalkane dehalogenase and its mutants and mechanisms of substrate, product and solvent exchange signify importance of dynamics for the function of haloalkane dehalogenases. The identified pathways also serve as an initial validation set for development of CAVER 2.0 tunnel calculation algorithm, an approach for rapid evaluation of possible pathways leading from a buried cavity to surface in proteins that has, together with molecular dynamics simulations, a potential to stimulate further research on proteins aimed at understanding structuredynamicsfunction relationships of proteins with buried binding or active sites.
Keywords: Protein, enzyme, haloalkane dehalogenase, buried active site, tunnel, product release, water exchange, molecular dynamics simulation, design of mutants, CAVER

Contents
It's Yourz! The world in the palm of your hand.― Robert F. Diggs
1 Introduction [1589]1.1 Life [1520]
1.1.1 Definition of life [15]1.1.2 Origin of life [16]
1.2 Protein structure [2032]1.2.1 Primary structure [20]1.2.2 Secondary structure [22]1.2.3 Tertiary structure [25]1.2.4 Quarternary structure [32]
1.3 Protein function [3242]1.3.1 Proteinligand binding [32]1.3.2 Protein fold, function and evolution [34]1.3.3 Enzymes [34]
1.3.3.1 Enzyme kinetics [34]1.3.3.2 Catalytic effect [39]
1.4 Protein dynamics [4352]1.4.1 Protein conformations [43]1.4.2 Hierarchy of motions in time and space [43]1.4.3 Conformational changes upon ligand binding [46]1.4.4 Role of dynamics in enzyme catalysis [48]1.4.5 Ligand exchange in proteins [50]
1.5 Protein research [5264]1.5.1 Basic principles of scientific research [52]1.5.2 Protein research strategy [53]1.5.3 Basic tasks in protein research [53]
1.5.3.1 Determination and prediction of protein structure [53]1.5.3.2 Determination and prediction of protein dynamics [57]1.5.3.3 Determination and prediction of protein function [59]
1.6 Model system [6489]1.6.1 Selecting a protein [64]1.6.2 Haloalkane dehalogenases [64]
1.6.2.1 Source of haloalkane dehalogenases [64]1.6.2.2 Biological role of haloalkane dehalogenases [66]1.6.2.3 Structure of haloalkane dehalogenases [69]1.6.2.4 Function of haloalkane dehalogenases [74]1.6.2.5 Dynamics of haloalkane dehalogenases [82]1.6.2.6 Application of haloalkane dehalogenases [86]
2 Objectives [90]3 Methods [91114]
3.1 Experiments [91102]3.2 Molecular modelling [102113]3.3 Software engineering [114]
4 Results [115143]4.1 In silico design of DhaA mutants for improved conversion of 1,2,3trichloropropane [115]4.2 Analysis and interpretation of the effects of mutations on the enhanced conversion of TCP by DhaA mutants [116118]4.3 Product release and water exchange pathways and mechanisms in DhaA and its mutants [118122]
4.3.1 Identification of pathways by MD simulations [118]4.3.2 Pathway p1 [118]4.3.3 Pathway p2a [119]4.3.4 Pathway p2b [120]

4.3.5 Pathway p2c [120]4.3.6 Pathway p3 [120]
4.4 Structural characterisation of three mutants with modified tunnels [121122]4.1 – 4.4 Tables and figures [122141]4.5 Development of CAVER 2.0 program for calculation of tunnels in protein structures [141143]
5 Discussion [144148]5.1 Active site access tunnels in the haloalkane dehalogenase DhaA from Rhodococcus rhodochrous NCIMB 13064 modified using semirational approach yielded mutants with significantly enhanced activity towards toxic and recalcitrant xenobiotic, 1,2,3trichloropropane [144145]5.2 Molecular dynamics simulations identified five pathways for product release and water exchange among DhaA variants [145146]5.3 Solvation of products is essential for their release from buried active site of DhaA variants [146147]5.4 Mutations change the accessibility of the pathways in DhaA variants [147]5.5 Mutations change the mechanism of ligand exchange in DhaA variants [148]
6 Conclusions [149]References [150190]List of tables and figures [191193]Abbreviations [194197]Original research articles [198199]Supplementary material [200]Curriculum vitae [203204]

1 Introduction
A textbook is like a guide who tells you “there are thirtysix chambers in the castle” and shows you only compartment ceiling in the castle souvenir shop.
1.1 Life
1.1.1 Definition of life
Fundamental functions of life. Genes, genetic code and proteins are the most fundamental functions required for life (RuizMirazo et al., 2004; Ikehara, 2005). Genes are segments on doublestranded deoxyribonucleic acid (dsDNA) coding for singlestranded ribonucleic acids (ssRNA) via nucleotide basepairing complementarity, or functioning directly as regulatory elements.
RNA functions. RNA molecules function in translation (mRNA, tRNA and rRNA), ribosome maturation (snoRNA), RNA processing (snRNA and sno RNA), replication (telomerase RNA in eukaryotes), editing (eukaryotes), protein translocation (SRP RNA), cellular transport (vRNA in eukaryotes), translation quality control (tmRNA in eubacteria) and functions of many others has not yet been determined (Jeffares et al., 1998; Meli et al., 2001). Of all the types of RNA, tRNA is principally the most important because it plays the central role in translation of nucleotide sequence of mRNA into amino acid sequence of a protein by using the language of a genetic code, i.e. specific assignment of amino acids to nucleotide triplets (Nirenberg et al., 1965; Söll et al., 1965), while ribosome increases rate and fidelity of the process (Woese, 2001; Rodnina et al., 2007).
Protein functions. Proteins have catalytic (enzymes) or noncatalytic function; the latter includes structural proteins, transport proteins, motor proteins, signaling proteins, storage proteins, receptors, some hormones, and antibodies (Schmidt & Lamzin, 2007). Of all the protein functions, enzymes are principally the most important because they speed up specific and otherwise too slow chemical reactions (Koshland Jr., 2002b). If a constant source of energy is available, the increased rate of enzymecatalysed reactions allows highly organised, highentropy living organism to maintain itself against unevitable thermodynamic losses via processes of metabolism (Koshland Jr., 2002b; RuizMirazo et al., 2004; Mulkidjanian & Galperin, 2007).
Enzymes. Enzyme kinetics depends on concentration of both enzymes and their substrates. Therefore, to sustain life, living organisms are organised into compartments, cells, i.e. containers of a limited volume, surrounded by a semipermeable active boundary, a membrane, and eventually by additional structures (Koshland Jr., 2002b; RuizMirazo et al., 2004). Even in the limited volume of a cell, however, thousands of reactions are occurring at the same time. In order to prevent enzymes to be confused by other reactions, they are characterised by seclussion, i.e. by some degree of substrate specificity on hand (Morowitz, 1999; O'brien & Herschlag, 1999; RuizMirazo et al., 2004), and by some degree of plasticity on the other hand (O'brien & Herschlag, 1999; RuizMirazo et al., 2004).
Evolution. Regeneration and repair of structures of a living organism, as the fight against thermodynamic losses, is not perfect, thus leading to gradual decay, which can be especially harmful if the decay is associated with changes in DNA (Koshland Jr., 2002b). Living organisms use a clever trick to prevent from the decay – starting over via DNA replication and cell division, eventually by the birth of an infant (Koshland Jr., 2002b). Even the replication, however, is not perfect and therefore leads to changes in DNA and consequently in gene products. Depending on the change, and interaction with external environment, the change can be harmful, harmless or even beneficial for the living organism. The tradeoff between perfection of regeneration and repair, and errors in the processes defines the ability of a living system to change, i.e. to evolve, to improvise (Koshland Jr., 2002b; Mulkidjanian & Galperin, 2007). Evolution alone is, however, too slow process for an organism occurring in rapidly changing environment. Therefore, living organisms also possess feedback and feedforward adaptability mechanisms, implemented in the program defined by DNA (Koshland Jr., 2002b).
PICERAS. In summary, life is based on seven fundamental principles – program, improvisation, compartmentalisation, energy, regeneration, adaptability and seclussion (PICERAS), as noted by Koshland Jr. (2002b; Fig 1).
15

1 Introduction
Fig 1 | PICERAS. There are seven pillars of life (from left to right): program (P), improvisation (I), compartmentalisation (C), energy (E), regeneration (R), adaptability (A) and seclussion (S). Redrawn according to Koshland Jr. (2002b).
1.1.2 Origin of life
Key macromolecules in PICERAS. Two types of biological macromolecules, nucleic acids and proteins, play the two key roles in the PICERAS to sustain life of a living organism – informational (DNA and RNA) and catalytic (RNA and proteins). Evolutionary, it is not clear whichever of the three macromolecules came first.
Theories on the origin of life. It is generally accepted that: (i) biotic era, characteristic by existence and evolution of living organisms, was preceded by a prebiotic era; and (ii) the first biotic, i.e. living, organism, being at the same time the Last Universal Common Ancestor (LUCA) and appearing presumably 3.8 billion years ago (Maher & Stevenson, 1988), i.e. only 200 million years after the end of Earth's bombardment (Davies, 2001), already possessed the PICERAS (Koshland Jr., 2002b). It is also assumed that RNA molecules preceded DNA and that RNA molecules in contemporary organisms are relics of an ancient, prebiotic era. Consequently, two alternative scenarios on the origin of life were proposed and described as RNA world hypothesis by Gilbert (1986; Fig 2a), and [GADV]protein world hypothesis by Ikehara (2002; Fig 2b).
Fig 2 | Two hypotheses on the origin of life. (a) RNAworld hypothesis, (b) [GADV]protein world hypothesis. Redrawn according to Ikehara (2002).
RNA world hypothesis. According to RNA world hypothesis, chemical reactions involving inorganic and simple organic compounds yielded ribonucleotides which oligomerised and polymerised into RNA molecules possessing, at first, ultraviolet (UV) lightdriven selfreplication ability (Mulkidjanian & Galperin, 2007), information storage and structural role (Yarus, 1999; Woese, 2001; Brosius, 2003; Chen et al., 2007). Subsequently, RNA molecules acquired additional catalytic functions resulting in a primitive RNAmetabolising system (Yarus, 1999; Woese, 2001; Brosius, 2003; Chen et al., 2007) surrounded by a membrane composed of subunits synthesised by RNA (Ma & Yu, 2006; Chen et al., 2007). Association of RNA molecules with amino acids (Yarus, 1988; Yarus & Christian, 1989; Kuhn & Waser, 1994; Knight & Landweber, 1998; Yarus, 1998; Szathmáry, 1999; Yarus, 1999) led to the origin
16

1 Introduction
and evolution of genetic code governed by the order of appearance, i.e. biosynthesis, of amino acids (Tables 1 and 2; Kuhn & Waser, 1994; Szathmáry, 1999) and two physicochemical constraints (Table 3; Szathmáry, 1999; Lehmann, 2000): (i) hydrophobicity, involved in the process of attachment of amino acid to tRNA, and (ii) volume, involved in peptide bond formaton via stereopopulation control (Milstien & Cohen, 1970; Szathmáry, 1999). Establishing of the genetic code determined the relationship between RNA and proteins and resulted in transition from the RNA world to RNAprotein (RNP) world. Most of RNA catalytic functions, especially those with limiting chemical steps, i.e. not diffusion (Jeffares et al., 1998), were passed to more catalytically versatile and/or efficient proteins (Cech, 1993; Müller, 2006; Chen et al., 2007) ultimately leading to seperation of phenotype from genotype in both space and type of macromolecule (Szathmáry, 1999; Dworkin et al., 2003; RuizMirazo et al., 2004). Although, the first proteins of RNP world are thought to be noncatalytic chaperonelike RNA binding proteins (Poole et al., 1998).
Table 1 | Sequence of the amino acids in the order in which they were coded for.a,b
Group 1 Group 2 Group3Gly Lys PheAla Arg Tyr
Asp/Glu Gln/Asn HisVal Pro Cys
Leu/Ile MetSer TrpThr
aRedrawn according to Kuhn & Waser (1994).bGroups and amino acids within each group are ordered by the order of appearance.
Table 2 | Origin of genetic code.a,b
Stage CodeA GGC and GCCB GNCC GNND PuNNE NNNF Pu/Pyc
G AUN/UPuPud
aAccording to Kuhn & Waser (1994).bN = G/C/A/T; Pu = G/C; Py = A/T.cDistinguishing Pu/Py at 3rd position.dDifferentiating AUN and UPuPu.
Arguments in favour of the RNA world hypothesis. The RNA world hypothesis is based on discovery of selfsplicing of Tetrahymena prerRNA in early 1980s (Kruger et al., 1982; GuerrierTakada et al., 1983). Since then, many catalytic RNA molecules have been identified. The RNA world hypothesis is further supported by the following findings: (i) dual, informational and catalytic, function of RNA (Müller et al., 2006); (ii) experimentally demonstrated RNAcatalysed RNA synthesis (Johnston et al., 2001); (iii) ability of RNA to catalyse amino acid activation, aminoacyltRNA synthesis and peptide bond formation (Meli et al., 2001; Steitz & Moore, 2003; Vlassov et al., 2005; Rodnina et al., 2007); (iv) presence of conserved nucleotide cofactors in contemporary enzymes (White, 1976; Benner et al., 1989); (v) RNAprimed DNA replication (Itoh & Tomizawa, 1980); (vi) feasible synthesis of DNA from RNA precursors (Lazcano et al., 1988); (vii) high catalytic rate compared to uncatalysed reaction, e.g. 350/min rate of RNA cleavage by Tetrahymena ribosyme corresponding to ~ 1011 acceleration (Cech, 1993; Jeffares et al., 1998); (viii) versatility of RNA catalyst, e.g. transesterification and hydrolysis of phosphate diesters and monoesters, aminoacyl eseterase activity, general acidbase catalysis, and metal ionassisted catalysis (Cech, 1993; Doudna & Lorsch, 2005); and (ix) catalytic superiority of proteins over RNA (Jeffares et al., 1998).
Arguments against the RNA world hypothesis. At the same time, however, RNA world hypothesis still suffers from several unresolved issues of which at least some might be unresolvable (Ikehara, 2002): (i) prebiotic synthesis of nucleotides under presumed prebiotic conditions has not been demonstrated so far (Orgel, 1998; Ma & Yu, 2006; Anastasi et al., 2007); (ii) polyphoshpates were not abundant in prebiotic compounds (Keefe & Miller, 1995); (iii) alternative possibility of RNA being result of a biotic invention (Lazcano & Miller, 1996; Orgel, 1998; Anastasi et
17

1 Introduction
al., 2007), i.e. being preceded by a simpler informational macromolecule, denoted generally as XNA [e.g. TNA, threose nucleic acid (Anastasi et al., 2007), GNA, glycol nucleic acid (Anastasi et al., 2007), or PNA, backbone of ethylenediamine monoacetic acid (Nielsen, 1993)], seems also unlikely just for the same reasons of unfeasible synthesis of building blocks and/or their polymerisation, and transition from XNA to RNA (Orgel, 1998; Anastasi et al., 2007); (iv) although our inability to synthesise RNA under presumed prebiotic conditions cannot be taken to mean that the particular thing cannot be done (Woese, 2001; Pross, 2004), if RNA could be formed in the prebiotic era, then much simpler amino acids (Di Giulio, 1997; Ikehara, 2005; Chen et al., 2007) and their polymers, proteins, could be formed as well (Di Giulio, 1997; Ikehara, 2005); therefore, pure RNA world could have never existed; instead, RNA were in actual fact tRNAlike molecules covalently linked to polypeptides (Di Giulio, 1997); (v) it is impossible for RNA to selfreplicate because RNA does not have stable tertiary structure required to exhibit genetic function on nucleotide sequence as a template, whereas RNA must be folded into stable tertiary structure to exhibit catalytic functions; and (vi) last, and most importantly, RNA world hypothesis treats origin of genes, genetic code, proteins and life independently (Table 4; Ikehara, 2002; Ikehara, 2005), providing space for the question of ‘how selfreplicated RNA could acquire any genetic information for protein synthesis?’ (Szathmáry, 1999; Ikehara, 2005).
Table 3 | Symmetrical representation of universal genetic code.a,b,c,d,e,f
1st position 2nd position 3rd positionU C G A
U Phe Ser Cys Tyr UPhe Ser Cys Tyr CLeu Ser Trp Stop GLeu Ser Stop/Secg Stop A
C Leu Pro Arg His ULeu Pro Arg His CLeu Pro Arg Gln GLeu Pro Arg Gln A
G Val Ala Gly Asp UVal Ala Gly Asp CVal Ala Gly Glu GVal Ala Gly Glu A
A Ile Thr Ser Asn UIle Thr Ser Asn C
Met Thr Arg Lys GIle Thr Arg Lys A
aAccording to Lehmann (2000).bNucleotides are ordered by hydrophilicity from U (most hydrophilic) to A (most hydrophobic).cAmino acids are ordered by hydrophobicity from left (most hydrophobic) to right (most hydrophilic).dSmall and large amino acids (except for Asn, Arg and Trp) are coded by codons with G/C and A/U at the second position, respectively.eDegeneracy symmetry is highlighted with a thick line.fFourfold and twofold degenerate codon families are indicated by light yellow and white boxes, respectively.gSelenocysteine (Sec) is encoded by UGA codon only in presence of SECIS element in mRNA of selenoproteins.
[GADV]protein world hypothesis. All the above mentioned deficiencies of the RNA world hypothesis have been addressed by the alternative [GADV]protein world hypothesis (Ikehara, 2002) that states that there has never been RNA world and that proteins composed of four amino acids, Gly, Ala, Asp and Val, preceded RNA. According to the [GADV]protein world hypothesis, the four amino acids, present in prebiotic era, was the first and the simplest set of amino acids to form watersoluble globular [GADV]proteins via pseudoreplication in absence of genes (Ikehara, 2002; Ikehara, 2005). [GADV]proteins satisfied first four out of six crucial indices of globular proteins at an extremely high probability: (i) hydrophobicity (Ala) and hydrophilicity (Asp); (ii) helix formabilities (Ala); (iii) α βsheet formabilities (Val); (iv) turn formabilities (Gly); (v) acidic amino acid content; and (vi) basic amino acid contentβ (Ikehara, 2002). Importance of the six indices is deduced from the fact that they are constant in proteins encoded by genes of different %GC content (Ikehara, 2002; Ikehara, 2005). Additionally, Asp would be indispensable in the
18

1 Introduction
construction of a catalytic centre on primeval proteins (Ikehara, 2005). It is believed that some [GADV]proteins could acquire peptidebond formation catalytic function (Ikehara, 2002). Due to limited variety of proteins that could be formed from the four amino acids, the catalytic [GADV]proteins would become abundant. Expanding [GADV]proteins discovered catalysis of nucleotide and oligonucleotide synthesis. In this step, tight relationship between [GADV]proteins and nucleotides resulted in origin and evolution of a genetic code, because genetic code is too complex to be formed with one stroke (Ikehara, 2005). [GADV]amino acids became associated with various GNC primeval tRNA molecules (N = G, C, A, or T) by specific interaction between [GADV]amino acids and oligonucleotides containing GNC, forming GNC primeval genetic code (Ikehara, 2005). Lengthwise arrangement of [GADV]amino acids and GNC primeval tRNA complexes accelerated [GADV]protein synthesis through GNC primeval genetic code system and formation of (GNC)n primeval genes through phosphodiester bond formation among GNC codons (Ikehara, 2005). Singlestranded (GNC)n primeval genes developed to produce doublestranded RNA (dsRNA) yielding primitive dsRNA genes and enabling inheritance and evolution of genetic information during propagation of RNA sequences from ancestors to descendants. (GNC)n primeval genes and GNC primeval genetic code evolved to genes and universal genetic code system of LUCA (Table 3) through (SNS)n primitive geneSNS primitive genetic code system (S = G or C) by incorporating additional amino acids (Leu, Pro, His, Gln, Arg and Glu) into watersoluble globular proteins with high probability (Ikehara et al., 2002), causing: (i) decreasing %GC content of genes; (ii) increasing variability of protein functions; and (iii) expanding the metabolism (Ikehara, 2002; Ikehara, 2005).
Table 4 | Hypotheses related to the origin of life.a
Origin of Ikehara's hypotheses[Ikehara, 2002]
Examples of hypothesesby other scientists
Life [GADV]protein world RNAworld (Gilbert, 1986)Gene GCNSF(a)
(SNS)nGene duplication (Ohno, 1970)
Exon shuffling (Gilbert et al., 1997)Genetic code GNC primitive code
SNS primeval codeRNY codeb (Shepherd, 1981)
WWW codec (JimenézSánchez, 1995)Mitochondrialtype code (Osawa,1995)
Protein GCNSF(a) 0thorder structureSNS 0thorder structure
Sequence theory (Dill, 1990)Structure theory (Dill, 1990)
aAccording to Ikehara (2002).bR = purine, N = any nucleotide base, Y = pyrimidine.cW = A or U.
Arguments in favour of [GADV]Protein world hypothesis. The [GADV]protein world hypohesis, based on the essential coevolution of genes, genetic code and proteins (Table 4; Ikehara, 2002), is supported by the following arguments: (i) conserved regions among homologeous proteins indicate that the proteins were produced from one common ancestor, but not selected out independently from the sequence space with large diversity (Ikehara, 2002); (ii) amino acids were undoubtedly present on the early Earth (Miller, 1953; Weber & Miller, 1981; Chen et al., 2007); (iii) Gly, Ala, Asp and Val could easily be formed on primitive Earth (Miller, 1974); (iv) order of appearance of amino acids, Gly, Ala, Asp, Val, Pro, Ser, Glu, Leu/Thr, Arg, Ile/Gln/Asn, His, Lys, Cys, Phe, Tyr, Met and Trp (Table 1; Kuhn & Waser, 1994; Trifonov, 2004) is coincident to a high degree with GNCSNS primitive genetic code hypothesis (Ikehara, 2005); (iv) genes can originate in overprinting antisense strands of GCrich (> 60%) bacterial genes due to highly biased repeating (GNC)n sequence on sense strands with long nonstop frames (NSFs) on the corresponding antisense strands (Ikehara & Okazawa, 1993; Ikehara et al., 1996; Ikehara, 2005); (v) feasibility of formation of enzymatically active [GADV]peptides formation was proven experimentally by repeating dryheating cycles and by solid phase peptide synthesis (Rode et al., 1997), yielding [GADV]peptides that possessed peptide bond hydrolysis activity with bovine serum albumin and galactoside bond hydrolysis activity β (Ikehara, 2005); the former activity is just opposite of peptide bond formation thus backward reaction is theoretically possible (Ikehara, 2005).
Origin of life mystery. Thus, although RNA world hypothesis has been widely accepted and more and more evidences suggest the existence of RNA world during the origin of life, the scenario concerning the origin of the RNA world remains blurry (Ma & Yu, 2006). The RNA world hypothesis can, as well as its alternative [GADV]protein world hypothesis prove to be wrong, or we may simply never understand the origin of informational and catalytic macromolecules at the fullest (Trevors & Abel, 2004).
Early evolution of genes. Genome of the LUCA was fragmented eukaryoticlike dsDNA (Poole et al., 1998). Transition from RNA to DNA had to occurr with higher DNA stability (Müller et al., 2006) and high fidelity of DNA
19

1 Introduction
replication and repair systems being the primary reasons (Lupas et al., 2001). Early genes were only ~45 to 60 nucleotides in length (Gilbert et al., 1997)] and were fragmented due to low efficiency of transcription and translation processes (Poole et al., 1998). Consequently, early genes encoded short peptides (McLachlan, 1972; Lupas et al., 2001) that selfassembled into small multipeptide complexes to perform function (Lupas et al., 2001). The advantageous higher protein stability, higher robustness of the protein function against structural changes and facilitating folding by removing processes of peptide diffusion, encounter and complex formation (Demchenko, 2001) led to evolution of longer genes via fusion of shorter ones (Lupas et al., 2001), thus encoding larger proteins that might be of polyphyletic origin (Lupas et al., 2001) and in which the structural changes could more efficiently finetune protein function (Koshland Jr., 1976; Koshland Jr., 1998). Even in the LUCA, however, genes were separated by introns which are believed to appear early in the evolution (Doolittle, 1978; Gilbert et al., 1997).
Early evolution of genome organisation. Rapid reproduction (Poole et al., 1998) and thermophily (Poole et al., 1998) as a response on the surrounding environment were the driving forces for the loss of introns (Gilbert et al., 1997), organisation of genome into single DNA molecule and its circularisation (Poole et al., 1998), and for reduced dependence on ssRNA functionalities (Poole et al., 1998), ultimately leading to origin of prokaryotes. Such a prokaryotelike model could conceivably have arisen more than once in evolution (Poole et al., 1998). Hence, instead of being more ancient or more primitive than eukaryotes, prokaryotes are, in fact, more derived forms, adopted to harsh and rapidly changing environment (Jeffares et al., 1998; Poole et al., 1998). Interestingly, genome organisation of modern eukaryotes and their metabolism, heavily dependent on RNA, resemble those of the LUCA (Jeffares et al., 1998; Poole et al., 1998).
1.2 Protein structure
1.2.1 Primary structure
Amino acids. Proteins are linear, unbranched polymers of Lamino acids α (Sanger et al., 1955), defined by genetic code and nucleotide sequence of a gene. There are altogether 20 amino acids defined by the universal genetic code and thus definable by the gene, plus selenocysteine indirectly encoded by otherwise stop codon into the socalled selenoproteins (Table 3). Hence, when omitting selenoproteins, for a protein composed of N amino acids, there are 20N possible protein sequences, the socalled primary structures. The amino acids have common methenyl (CαH), carboxyl (COOH), and, except for Pro, amino (NH2) group, and differ one to each other by a substituent attached to the Cα atom (Table 5). The substituents can be classified into several overlapping groups according to: (i) size (tiny, small or large); (ii) type of alkyl chain (aliphatic linear or cyclic, or aromatic); (iii) polarity (hydrophobic, hydrophilic or amphiphilic); (iv) net charge (neutral or charged); (v) pKa of ionisable group (acidic or basic); and (vi) capacity for participating in standard hydrogen bonding interaction (donor or acceptors, or both, or none) (Fig 3; Livingstone & Barton, 1993). There are two special amino acids – Gly with no substituent on Cα atom, and Pro with amino group participating with the substituent in a fivemembered heterocycle.
Table 5 | Structure of amino acids. (pp. 2021)Amino acida Structureb Amino acidb Structureb
Glycine (Gly, G) Tyrosine (Tyr, Y)
Alanine (Ala, A) Tryptophan (Trp, W)
20

1 Introduction
Amino acida Structureb Amino acidb Structureb
Valine (Val, V) Methionine (Met, M)
Leucine (Leu, L) Cysteine (Cys, C)
Isoleucine (Ile, I) Selenocysteine (Sec, U)
Proline (Pro, P) Serine (Ser, S)
Phenylalanine (Phe, F) Threonine (Thr, T)
Asparagine (Asn, N) Histidine (His, H)
Glutamine (Gln, Q) Lysine (Lys, K)
Aspartic acid (Asp, D) Arginine (Arg, R)
Glutamic acid (Glu, E)
aThree and oneletter abbreviations are given in parentheses.bSidechains are highlighted in red.
21

1 Introduction
Fig 3 | Physicochemical properties of amino acids. Redrawn according to Livingstone & Barton (1993).
Amino acid residues. Incorporation of amino acids into the protein occurs via formation of the socalled peptide bond between carboxyl group of the last incorporated amino acid in the growing polypeptide chain attached to tRNA and the free amino group of the following amino acid attached to another tRNA molecule (Woese, 2001; Rodnina et al., 2007). The residual part of the amino acid incorporated into the polypeptide chain, i.e. the amino acid residue, is constituted of two parts – mainchain (also known as “backbone”) and sidechain. Mainchain is formed by [NHCαHCO] group in all amino acid residues except for Pro ([NCαHCO]), Gly ([NHCαH2CO]), first amino acid residue with free mainchain amino group ([NH2CαHCO]; Nterminus) and last amino acid residue with free mainchain carboxyl group ([NHCαHCOOH]; Cterminus). Sidechain is formed by substituent on the Cα atom. The substituent is unchanged upon incorporation but may undergo functionspecific chemical modification or chemical modification associated with protein aging. The mainchain distinguishes only Gly and Pro, whereas the rest of amino acids is left undistinguishable. Sidechains, on the other hand, distinguish all the 21 amino acid residues.
1.2.2 Secondary structure
Protein backbone dihedral angle.ω Peptide bond can exist in two resonance structures because of the resonance of electrons between the double bond of the carbonyl group and the amide NC bond. Consequently, NC bond is ~10% shorter than that found in usual CN amine bonds, and has ~ 40% doublebond character (Scheme 1; Pauling et al., 1951; Eisenberg, 2003). Due to electron delocalisation between atoms of the peptide bond, atoms of [Cα(i)CONHCα(i+1)] group, where i is the rank of an amino acid residue in the protein sequence, lie in the same plane, and HNCO dihedral angle should be ideally planar. Although, dihedral angle can deviate from planarity as much as by ~ω ω 40° with tendency for lower (< 180°) values (Pauling et al., 1951; Ramachandran, 1968; HeadGordon et al., 1991; MacArthur & Thornton, 1996; Eisenberg, 2003).
Scheme 1 | Resonance of peptide bond.
Protein backbone and dihedral angles.φ ψ Direction of the protein backbone is determined by two dihedral angles, and , between two adjacent planes defined by [Cφ ψ α(i)CONHCα(i+1)] and [Cα(i+1)CONHCα(i+2)] groups, respectively (Fig 4; Pauling et al., 1951; Ramachandran et al., 1963). Values of and dihedral anglesφ ψ are somewhat restricted due to (i) the constraints of dihedral angle, (ii) steric limitation from amino acid sideωchains, and (iii) regular nature of the protein backbone (Pauling et al., 1951; Ramachandran et al., 1963; Aurora et al., 1997). The three constraints imposed on the protein backbone, together with hydrogen bonding capacity of the backbone amide and carbonyl groups, cause that certain segments of the protein backbone exist as remarkably regular geometries, the socalled secondary structure elements – either helical (Pauling et al., 1951) or extended (Pauling & Corey, 1951b; Pauling & Corey, 1951c; Pauling & Corey, 1951d; Pauling & Corey, 1951f).
22

1 Introduction
Fig 4 | Mainchain dihedral angles. Mainchain direction is defined by two dihedral angles, and ,φ ψ between two planes (shaded by light and dark grey), determined by dihedral angle.ω
Amino acid residue propensities. Different amino acid residues show different propensities for being part of the secondary element, i.e. global propensities (Penel et al., 1999). Additionally, in the case of a helical geometry, different amino acid residues show different propensities for being located at different positions within the helix, i.e. local propensities (Penel et al., 1999), and also, except for Ala and Gly, adopting different sidechain conformations, (defined by χ1 and χ2 dihedral angles), depending on the position within the helix, i.e. rotamer propensities (Doig et al., 1997; Penel et al., 1999). Although, the physical background for secondary structure propensities is not yet fully understood (Avbelj & Fele, 1998).
Helical geometry. Helical geometry was first proposed for globular proteins, haemoglobin and myoglobin, and for fibrous proteins, myosin and keratin, by Pauling, Corey and Branson α (Pauling et al., 1951) and its uniformly righthanded twist was identified by Kendrew and coworkers (Kendrew et al., 1958; Kendrew et al., 1960; Kendrew, 1962). Helical geometry is the preferred state for the mainchain (Pauling et al., 1951) and thus the most abundant secondary structure geometry (Ismer et al., 2008).
Three types of helices. There are three types of a helical geometry in proteins (Ismer et al., 2008) – helix, alsoα known as “3.7helix” (Pauling & Corey, 1950; Pauling et al., 1951; Pauling & Corey, 1951a; Pauling & Corey, 1951d; Pauling & Corey, 1951e), 310helix (Richardson & Richardson, 1988) and helix π (Low & Baybutt, 1952; Fodje & Karadaghi, 2002; Armen et al., 2003). They differ in (i) the number of residues per turn, (ii) the hydrogen bonding pattern they form, (iii) radius, and (iv) occurrence in proteins determined by stability of the particular helical geometry and by functional role (Table 6 and Fig 5; Ismer et al., 2008). Of the three types of a helical geometry,
helix is the most frequent, 3α 10helix is less frequent and helix is the least common π (Baker & Hubbard, 1984; Barlow & Thornton, 1988). 310helix and helix can be present as transient defect structures in helices at lowπ α temperature (~ 0°) as a consequence of difference in relative thermodynamic stability, i.e. the difference in the free energy of formation between the three helical geometries (Mikhonin & Asher, 2006).
Table 6 | Properties of helical conformations.Property Helical conformation
310 α πOccurrence in Xray crystal structures of proteins (%)a
~ 20 ~ 80 < 1
Number of amino acid residues per turna 3.12 3.66 4.5Hydrogen bonding pattern between NH and CO groups in the core of the helixa
i, i+3 i, i+4 i, i+5
Radius (Å)a 1.96 2.17 2.66Unit rise (Å)b 2.0 1.5 1.2Length (average number of amino acid residues)
35c 14d 7b
Special features Cylindrical hole down the centre of the helixe
a According to Ismer et al. (2008).b According to Fodje & Karadaghi (2002).c According to Richardson & Richardson (1988).d According to Gunasekaran et al. (1998).e According to Low & Baybutt (1952).
23

1 Introduction
Fig 5 | Geometry of helical conformations. (a) 310helix, (b) helix,α (c) helix; amino acid residues are represented by spheres π (d). Mainchain hydrogen bonding is indicated by dashed lines. Redrawn according to Ismer (2008).
Stabilising interactions in helix.α helix is the most frequent secondary structure element in proteins α (Barlow & Thornton, 1988). With its mean length of 14 amino acid residues (Gunasekaran et al., 1998), helix is by tenα and seven amino acid residues longer than typical 310helix and helix, respectively π (Richardson & Richardson, 1988; Fodje & Karadaghi, 2002), which is the consequence of easier elongation of helix compared to the other twoα types of helical conformation (Rohl & Doig, 1996). helixforming tendencies of amino acid residues are determinedα by loss of sidechain conformational entropy upon helix formation and possibility of compensation by stabilising interactions between sidechains or between sidechain and backbone (Aurora et al., 1997) because the first four amide hydrogens, amino acid residue positions denoted as Ncap (Presta & Rose, 1988; Aurora & Rose, 1998), N1 (Cochran et al., 2001), N2 (Cochran & Doig, 2001) and N3 (Iqbalsyah & Doig, 2004), and last four carbonyl oxygens, amino acid residue positions denoted as C3, C2, C1 and Ccap (Presta & Rose, 1988; Aurora & Rose, 1998) of protein backbone in helix necessarily lack intrahelical hydrogen bonds α (Richardson & Richardson, 1988; Aurora & Rose, 1998). These unsatistifed atoms are capped by alternative hydrogen bond partners, hydrophobic interactions (Aurora & Rose, 1998), and electrostatic interactions between sidechains of terminal amino acid residues and the partial charges on unsatisfied polar groups (Shoemaker et al., 1987; Avbelj & Fele, 1998; Avbelj, 2000). The hydrogen bonds are donated by conventional OH and NH groups (Aurora & Rose, 1998; Penel et al., 1999) and remarkably also by nonconventional CH, CH2 and CH3 groups (Pauling, 1960; Green, 1974; Jeffrey & Maluszynska, 1982; Derewenda et al., 1995; Vargas et al., 2000; Scheiner et al., 2001; Manikandan & Ramakumar, 2004). The nonconventional CH...O hydrogen bonds are by no means insignificant, because for every three conventional hydrogen bonds in helix there are two CH...O hydrogen bonds α (Manikandan & Ramakumar, 2004). The nonconventional CH...O hydrogen bonds in helices account for ~ 58% of all CH...Oα hydrogen bonds in a protein thus singifying their importance for stabilisation of helices α (Manikandan & Ramakumar, 2004).
Amino acid propensities in helix.α The most prominent amino acid residue propensity features of helix are (i)α strong energetic and structural “preferences” for N1, N2 and N3 differing greatly one to each other and from positions within helix interior α (Doig et al., 1997; Penel et al., 1999). Specifically, there are high propensities for negatively charged amino acid residues (ionic forms of Asp and Glu) at Nterminus (Cochran et al., 2001; Cochran & Doig, 2001) and positively charged amino acid residues (ionic form of His) at Cterminus of helix α (Shoemaker et al., 1985), giving rise to helix dipole moment α (Chou & Fasman, 1974; Wada, 1976; Hol et al., 1978; Sheridan et al., 1982; Shoemaker et al., 1985; Shoemaker et al., 1987), Note, the term “ helix propensity” does not mean “ helixα α preference” (Creamer & Rose, 1992) because helical conformation is the preferred state of the backbone α (Pauling & Corey, 1951f), whereas helixdisfavouring factors must arise in the sidechains α (Creamer & Rose, 1992; Aurora et al., 1997). Among all the amino acid residues, the sidechain of Ala is the least destabilising (Merutka & Stellwagen, 1990b; Creamer & Rose, 1992).
310helix. 310helix can be formed at N and Ctermini of helices α (Baker & Hubbard, 1984; Barlow & Thornton, 1988) as an intermediate in the (un)folding of helices α (Millhauser, 1995). Such a free interconversion between and 3α 10helical geometries is possible due to absence of a disallowed region of backbone conformational space, defined by and dihedral angles, for Lamino acid residues φ ψ (Rohl & Doig, 1996; Armen et al., 2003). Initiation of 310helix is easier than helix because one fewer amino acid residue needs to be fixed in a helicalα conformation before the first hydrogen bond is formed (Rohl & Doig, 1996). On the other hand, 310helix elongation is much less favourable compared to helix. Therefore, 3α 10helix is usually only three to five amino acid residues long (Richardson & Richardson, 1988). Another factor, influencing whether 310helix or helix is favoured or whetherα both are possible, is the amino acid residue at Ncap position (Doig et al., 1997). 310helix is characteristic by high
24

1 Introduction
propensity for His at the Ncap position, whereas Ser and Thr at the Ncap position disfavours 310helix and favours αhelix, and Asp/Asn/Pro may lead to either 310helix and helix α (Doig et al., 1997).
helix.π helix is the least common among the three types of helices because of its lowest stability due to strongπ temperature dependence (Ismer et al., 2008) caused by (i) energetically unfavourable and dihedral angles, (ii)φ ψ presence of 1 Å hole down the centre of the helix which is, however, too narrow for access by a water molecule π (Low & Baybutt, 1952) thus causing loss of van der Waals interactions, and (iii) higher number of residues (five) that must be oriented correctly before the first (i, i+5) hydrogen bond can be formed. Hence, initiation of helix is moreπ entropically unfavourable compared to helix and 3α 10helix (Rohl & Doig, 1996). For all these reaosns, helix hasπ been long considered as extremely rare and unstable in proteins. However, according to recent estimates, ~ 10% of proteins contain a helix as a conserved structural feature among functionally related proteins π (Weaver, 2000; Fodje & Karadaghi, 2002). The least ease of initiation of helix among helical conformations is compensated by itsπ high length, seven to thirteen amino acid residues long with the most common length of seven amino acid residues (Fodje & Karadaghi, 2002). Additionally, helix has characteristic amino acid composition π (Fodje & Karadaghi, 2002). Asn shows extremely high propensity for middle of helix π (Fodje & Karadaghi, 2002). Aromatic amino acid residues (Phe, Trp and Tyr) and large aliphatic (Ile, Leu and Met) show high propensities for being located at termini of helix, thus providing stability to helix via favourable interactions between the termini of helix π π π (Fodje & Karadaghi, 2002). Pro shows extremely high propensity for position right after helix, thus causing termination ofπ
helix π (Fodje & Karadaghi, 2002).Extended geometry. Unlike helical geometry, extended geometry, the socalled strand, cannot exist on its ownβ
because the hydrogen bonding pattern must be established between two sequentially distal segments with extended geometry along the protein backbone. Therefore, strand, exists due to higher hierarchy geometry – a sheet, firstβ β observed in keratin β (Pauling & Corey, 1951b; Pauling & Corey, 1951c; Pauling & Corey, 1951d; Pauling & Corey, 1951f).
1.2.3 Tertiary structure
Secondary versus tertiary structure. Helices and sheets can both be considered as well to the secondary as to theβ tertiary structure elements (Creamer & Rose, 1992; Yang & Honig, 1995a; Yang & Honig, 1995b; Pal & Chakrabarti, 2000) because helix and strand formation are guiding events in protein folding (Cohen et al., 1979; Aurora et al., 1997; Baldwin & Rose, 1999a; Baldwin & Rose, 1999b; Gong et al., 2005; Rose et al., 2006) and their properties are influenced by interaction with rest of the protein (Scholtz et al., 1991; Creamer & Rose, 1992; Otzen & Fersht, 1995; Yang & Honig, 1995b) and surrounding solvent (Tanford et al., 1960; Blundell et al., 1983; Nelson & Kallenbach, 1986; Buck et al., 1993; Jasanoff & Fersht, 1994; Waterhous & Johnson, 1994; Blanco et al., 1994; Schönbrunner et al., 1996; Luo & Baldwin, 1998; Avbelj & Fele, 1998).
Tertiary aspects of helices.α helices in globular proteins have the following interdependent properties α (Kumar & Bansal, 1998): (i) position in the protein sequence; (ii) length; (iii) amino acid residue composition; (iv) geometry; and (v) position in the globular protein. The mean length of helix depends on its curvature and is 12 ± 3, 14 ± 5 andα 20 ± 6 amino acid residues for linear, curved and kinked helices, respectively, with no correlation between theα geometry and helix position in the globule. The amino acid residue composition depends on position in the globularα protein, helix geometry and length. helices with large curvature show increased propensities for Leu, Gln, Lys andα α Cys; kinks are often associated with presence of amino acid residues with low helix propensities. Amino acidα residues with larger sidechains or sidechains with larger number of functional groups more frequently occur in longer helices. Position of an helix in the globular protein can be classified into three categories: largely buried,α α partially buried or largely exposed; 66% of helices belong to the first category. Most importantly, as the result ofα arrangement of helix in the context of the rest of the protein sequence, it shows alternating pattern of hydrophobicα and hydrophilic amino acid residues that gives rise to an amphipathic character of helix α (Schiffer & Edmundson, 1967; Xiong et al., 1995) which is, for example, mainfested by increased propensity for hydrophobic amino acid residue and decreased propensity for polar and negatively charged amino acid residues at N1 position compared to N2 because of larger burial of N1 compared to more solvent exposed N2 position (Penel et al., 1999).
helix stability in globular proteins.α helical state would not be well populated without significant enhancementα (Creamer & Rose, 1992). The enhancement is realised by scaling, requiring, however, more than 100 amino acid residues long helix α (Creamer & Rose, 1992). helices in proteins have, however, only 14 amino acid residues onα average, thus enhancement must be provided by a different mechanism – via interaction of the helix with otherα parts of the protein molecule (Scholtz et al., 1991; Creamer & Rose, 1992), which additionally influences shape and amino acid residue propensities of helices.α
25

1 Introduction
Tertiary aspects of sheet.β Due to absence of longrange dipoledipole interactions in strands, the existence of β βstrands is dependent on their mutual association via crossstrand mainchain–mainchain hydrogen bonding and sidechain–sidechain hydrophobic interactions into sheets, which requires bringing distal segments of the proteinβ sequence close in space (Yang & Honig, 1995b). Thus, sheets have elements of both secondary ( strand) andβ β tertiary ( sheet) structure β (Pal & Chakrabarti, 2000). Therefore, although large hydrophobic amino acid residues show high propensities for sheet, the propensities of amino acid residues for sheet are context dependent, becauseβ β
sheet formation is not associated with individual amino acid residues but involves pairwise interactions betweenβ sidechains (Otzen & Fersht, 1995; Yang & Honig, 1995b). Yet another characteristic feature of sheets is thatβ they are invariably twisted in the righthanded direction (Richardson, 1976; Yang & Honig, 1995b); the dominant determinant of the sheet twist are tertiary interactions with rest of the protein β (Yang & Honig, 1995b).
Architecture of sheet.β There are three types of sheets – parallel, antiparallel and mixed. Parallel sheet isβ β composed of two or more strands running in the same direction; antiparallel sheet is composed of two or more β β βstrands running in opposite directions; and mixed sheet is composed of both parallel and antiparallel strandsβ β (Fig 6). strands are topologically connected in sheet by a hairpin or a crossover. The former type of topologicalβ β connection is also known as “plain” or “same end” connection; the latter is also known as “cross” or “oppositeend” connection and exists in two types, right and lefthanded (Richardson, 1976).
Additional stabilising interactions in sheet.β Besides the mainchain hydrogen bonding between adjacent βstrands and van der Waals interactions between hydrophobic sidechains of the strands, sheets are furtherβ β considerably stabilised by electrostatic interactions (Avbelj & Fele, 1998; Avbelj, 2000) and nonconventional CαH...OC hydrogen bonds (Derewenda et al., 1995; Fabiola et al., 1997). The strength of these hydrogen bonds can be as much as a half of the strength of conventional hydrogen bonds (Vargas et al., 2000; Scheiner et al., 2001), which is 5 kcal mol1 on average (McDonald & Thornton, 1994). Additionally, the nonconventional hydrogen bonds involving sidechain CH groups are also extensively present in sheets β (Fabiola et al., 1997). Propensities for being involved in CH...OC hydrogen bonding interactions varies among amino acid residues with clear preference for Val and Thr (Fabiola et al., 1997).
Fig 6 | Geometry of sheet. β (a) Parallel sheet, β (b) antiparallel sheet; mainchain hydrogenbonding is indicated byβ dashed lines; amino acid residues are represented by spheres; direction of protein backbone is indicated by arrows. Antiparallel sheet is more stable due to parallel hydrogen bonds.β
bulges.β Regular arrangement of strands in sheet can be disturbed by one amino acid residue insertion orβ β deletion, causing presence of a bulge, i.e. region between two consecutive type mainchain hydrogen bondsβ β (Richardson et al., 1978). bulge consists of two amino acid residues on one strand and one amino acid residue onβ β the other strand, causing slight bend in the sheet β β (Richardson et al., 1978). bulges mostly occur betweenβ antiparallel strands whereas they are extremely rare in parallel strands β β (Richardson et al., 1978). bulges areβ thought to be an evolutionary conserved feature because they function to (i) compensate for effects of single amino acid residue insertion or deletion within the sheet, (ii) provide strong local twist which is required to form closed β βbarrel structures, (iii) influence direction in which strand leaves the sheet, and (iv) influence orientation ofβ β functionally critical sidechains (Richardson et al., 1978).
26

1 Introduction
Packing of α helices and sheets in globular proteins.β Taking together, secondary elements are not isolated one to each other but pack (Crick, 1952; Pauling & Corey, 1953) via strandstrand (to form sheet), helixhelix, helixβsheet and sheetsheet interactions (Chothia et al., 1977). The arrangement of secondary structure elements is such as to allow (i) the secondary structure elements to occupy conformations close to the free energy minimum, and (ii) buried amino acid residues to occupy the same volume as if they were free amino acids (Chothia et al., 1977). αhelices associate via packing of ridges of one α helix into grooves of another α helix (Chothia et al., 1977). Deviations from the idealised model depends on the twist and exact radius of α helices and on the size of sidechains (Chothia et al., 1977). If two adjacent αhelices are arranged in opposite direction they can interact more favourably due to interactions of macrodipoles of the α helices (Shoemaker et al., 1985). Thus, α helix dipole may be an important factor in protein folding (Shoemaker et al., 1985). hα elix can pack onto sheet with its axis being (i) equal to zero,β i.e. α helix is arranged in parallel to the strands of the sheet, providing continuous helixsheet contact, (ii) < 0, i.e.β β helixsheet contact occurs in the middle, and (iii) > 0, helixsheet contacts occur at the ends, providing an internal cavity (Chothia et al., 1977). Sheetsheet packing can be established by packing of a single sheet folded over byβ means of a local righthanded supertwist or by two independent sheets with rotation between the sheetsβ β influencing regions of strongest contacts: the larger is the rotation, the stronger are the contacts in the middle compared to the rest of the sheets β (Chothia et al., 1977).
Globular protein structure. Secondary elements cannot, for steric reasons, follow one another directly (Rose et al., 2006), and are therefore interspaced by turns, also known as “tight turns”, or loops, also known as “loose turns” or “random coils” (Chou, 2000) which together account for about half of protein structure on average (Fitzkee et al., 2005a). Although, turns are sometimes considered to belong among secondary structure elements (Barlow & Thornton, 1988). The protein interior is comprised almost exclusively of residues from either helices or strands, because of their capacity to provide buried mainchain carboxamides with intramolecular hydrogen bonding partners (Stickle et al., 1992) whereas turns and loops are more frequently located at solventexposed regions of the globule. Turns and loops allow mainchain direction reversal and thus packing of the secondary elements into globular, tertiary structure (Kendrew et al., 1958; Kendrew et al., 1960; Chou, 2000), with rugged surface with clefts, and with cavities in the interior of the globule (Fig 7). Presence of clefts and cavities in globular proteins is a consequence of heterogenous packing because some highly ordered regions are being mixed with many regions not as highly ordered (Socolich et al., 2005) due to liquidlike rather than solidlike distribution of packing intensities (Liang & Dill, 2001; LindorffLarsen et al., 2005).
Fig 7 | An example of a globular protein (cytochrome P450eryF from Saccharopolyspora erythraea; PDBID 1Z8O). (a) Cartoon representation of a globular protein showing presence and arrangement of αhelices (red) and βsheets (yellow), connected by loops and turns (green); (b) surface representation of protein showing overall globular shape and rugged surface; (c) slice through the surface representation showing surface clefts and an internal cavity open to the surface at two sites. Depending on the context, cavity can be also called “pocket” (in the context of a ligand binding/unbinding) or “tunnel/channel” (in the context of a ligand ingress/egress).
Turns. There are five classes of turns distinguished according to number of amino acid residues: turn composedα of five amino acid residues (Toniolo, 1980), turn composed of four amino acid residues of which i+1 or i+2 is Gly,β (Venkatachalam, 1968), turn composed of three amino acid residues γ (Némethy & Printz, 1972), turn composedδ of two amino acid residues (Toniolo, 1980) and turn composed of six amino acid residues) π (Toniolo, 1980). andβ turn can connect strands of antiparallel sheet γ β β (Venkatachalam, 1968; Némethy & Printz, 1972). Each type
of turn has several different trajectories to reverse the mainchain direction which is reflected by different subtypes
27

1 Introduction
of turns (Chou, 2000). Turns share two common features: (i) distance between Cα of first and last amino acid residues is < 7 Å, and (ii) in most cases, intraturn hydrogen bond is formed between CO group of the first and NH group of the last amino acid residue. Turns also have specific amino acid residue propensities, although amino acid residue sequences in turns are much more variable compared to secondary structure elements (Yang et al., 1996).
Loops. Loops are formed by more than six amino acid residues that connect two adjacent secondary elements or form Nterminal or Cterminal tail of the protein (Chou, 2000). Due to higher length of loops compared to turns, loops show higher structural variability and thus also significantly contribute to the arrangement of secondary elements in the globular proteins. The structural variability does not necessarily mean that loops are unstructured, but rather that there are larger number of possible architectures and interactions in loops that precludes classification (Chou, 2000). Loops show the same types of interactions as made by secondary structure elements. Additionally, two loops can be kept in proximity to each other by a bridge interaction, i.e. a sheetlike mainchainβ β –mainchain hydrogen bonding interaction between one amino acid residue provided by one loop and two amino acid residues from another loop (Kabsch & Sander, 1983).
Protein backbone distorsions. Local constraints, e.g. requirement for sharp change in protein backbone direction and/or overcoming steric clashes, may impose strain to force and protein backbone dihedral angles into unusualφ ψ values. If present in the protein structure, the unusual and dihedral angles are most frequently associated withφ ψ Asn, Asp, His, Ser and Thr, whereas infrequently with bulky hydrophobic amino acid residues. Typically, the unusual
and dihedral angles more frequently occur in long irregular segments and less frequently in short segments up toφ ψ five amino acid residues. Some such strained irregular segments are involved at N and Ctermini of α helices and βstrands (Gunasekaran et al., 1996). Importantly, unusual and angles can be associated with biological roleφ ψ (Petock et al., 2003) and hence can be conserved in structurally and/or functionally related proteins (Gunasekaran et al., 1996).
Protein folding. The process of attaining functional tertiary structure of a protein, the socalled folding, is the last step during conversion of genetic information into biological function (Zeeb & Balbach, 2004). During the process of folding, polypeptide chain of specific sequence switches from unfolded to specific native structure, the socalled fold or domain that can be regarded as a specific structural, functional and evolutionary unit, although definition of a protein domain is fuzzy in literature (Rose et al., 2006). Folding occurs: (i) spontaneously; (ii) with the aid of chaperones and chaperonines (Demchenko, 2001); (iii) according to protein template, e.g. folding of IA3 protein with aspartic proteinase A serving as the template (Li et al., 2000) and formation of inclusion bodies as an extreme case of template (mis)folding (Demchenko, 2001); (iv) on proteinprotein fragments association, e.g. folding of ribonuclease A, staphylococcal nuclease, cytochrome c, thioredoxin and barnase (Demchenko, 2001), or folding is preceded by selfassembly, e.g. folding of Trp receptor (Demchenko, 2001). Chaperones and chaperonines function by minimising aggregation largely by binding to partially folded proteins in a nucleotide dependent reaction that sequesters the proteins from one another, thereby reducing their effective concentration while they are afforded the opportunity to fold (Mu et al., 2008). Chaperones exhibit broad but welldetermined substrate specificity with absence of highly specific protein recognition features (Demchenko, 2001). Hence, a protein folds according to its primary protein structure, or in other words, every protein contains all the information needed to reach the final fold (Anfinsen et al., 1961; Kendrew, 1962) while the folding is eventually guided by interactions with other protein(s) that have coevolved with the protein (Jager et al., 2008).
Folding pathway hypothesis. In late 1960s, Levinthal proposed, that protein sequence includes also information on intermediate states of folding that define the folding pathway, i.e. a sequence of events which follow one another so as to carry the protein from the unfolded to a uniquely folded state (Fig 8b; Levinthal, 1968; Levinthal, 1969). Levinthal argued, that without such a folding pathway, random exploration of the practically infinite number of potential states would otherwise have made the folding in biologically relevant time, ranging from microsecond (Myers & Oas, 2002; Liu et al., 2008) to millisecond timescale (Rose et al., 2006), impossible, known as the socalled Levinthal paradox (Fig 8a; Levinthal, 1968; Levinthal, 1969).
Folding funnel hypothesis. The folding pathway hypothesis was replaced by folding funnel hypothesis, pioneered by Anfinsen (Fig 8cd; Anfinsen, 1973; Bryngelson et al., 1995; Dill & Chan, 1997; Chan & Dill, 1998; Deechongkit et al., 2006). The folding funnel hypothesis states that (i) folding is the process of searching for global energy minimum structure (Anfinsen, 1973), (ii) energy landscape of all possible conformations has the shape of a funnel (Anfinsen, 1973), (iii) folding occurs essentially via directed search by gradient towards a lower energy state, i.e. towards the bottom of a folding funnel (Frauenfelder et al., 1991; Bryngelson et al., 1995), and (iv) every unique sequence has its own funnel (Rose et al., 2006).
Energy landscape of a folding funnel. Depending on the energy landscape, the folding funnel can be approximated as smooth (Fig 8c) or rugged (Fig 8d). Smooth folding funnel, an approximation for folding of some small single
28

1 Introduction
domain proteins (e.g. artificial WW domain), results in a twostate (also known as “downhill” or “class I” or “HP+”) folding process in which: (i) protein occurs “only” as either unfolded or native structure at any time; (ii) unfolding is often a reverse process of folding (Chan & Dill, 1998); (iii) folding speed aproaches the theoretical maximum of ~ 0.1 to ~ 1 s μ (Hagen et al., 1996; Chang et al., 2003; Liu et al., 2008) and (iv) ratelimiting is the conformational searching because of entropic barriers. Rugged folding funnel (also known as “class II” or “HP”), an approximation for folding of large multidomain proteins, on the other hand, provides kinetic traps that can result in misfolding or aggregation into inclusion bodies (Kane & Hartley, 1988; Demchenko, 2001) due to fast collapse into the kinetic traps and slower barrier climbing out of the traps at some regions of the funnel (Chan & Dill, 1998), which is manifested by presence of folding intermediates (Anfinsen, 1973; Jager et al., 2008). In the case of the rugged folding funnel, both folding and unfolding can occurr via multiple and different pathways (Ma et al., 2000). Importantly, difference between class I and II folding reactions lies not in the mechanism of their folding but only in the stability of their intermediates (Baldwin & Rose, 1999b).
Protein folding bases. Fold is necessarilly the result of interaction of close and distal amino acid residues of the protein sequence. So far, however, consensus has not yet been reached as to whether the interactions between amino acid sidechains (sidechain–based protein folding) or between mainchain atoms (backbonebased protein folding) are crucial in the folding process.
Sidechain–based protein folding. Widely accepted sidechain–based protein folding is supported by the following arguments: (i) sidechains of the 21 natural amino acid residues are responsible for discrimination of a funnel energy landscape because the mainchain (except for Gly and Pro) is chemically equivalent and thus lacks the discriminative power (Aurora et al., 1997); (ii) different amino acid residues prefer different location in secondary structure elements that pack to hide hydrophobic sidechains in the protein core and to expose hydrophilic sidechains to the outside water environment (Kendrew, 1962), the socalled hydrophobic collapse phenomenon; (iii) helix is theα preferred state for mainchain (Pauling & Corey, 1951f), but some sidechains lose sufficient conformational entropy in an helix that they push the protein backbone towards the only other allowed region, extended, i.e. strandα β (Aurora et al., 1997; Baldwin & Rose, 1999a). Thus, sidechain conformational entropy must play a crucial role in selecting between helix and sheet α β (Aurora et al., 1997). Indeed, conformational transition from strand to β αhelical conformation requires overcoming unfavourable free energy barrier of ~ 1.5 kcal mol1 due to sidechain modulation of the free energies of local mainchain electrostatic interactions, which is large enough to account for the distinct propensities of amino acid residues in helix and sheet α β (Avbelj, 2000).
Fig 8 | Protein folding hypotheses. (a) Random search; (b) folding pathway; (c) smooth funnel; (d) rugged funnel. N – native fold. Adapted from Dill & Chan (1997).
Sidechain–sidechain interactions. Sidechain–based protein folding signifies importance of interactions between sidechains for protein folding. Sidechains can interact by short range van der Waals and long range electrostatic interactions including conventional and nonconventional CH...O hydrogen bonds. Importantly, hydrophobic interactions are the primary stabilising factor of sheet β (Koehl & Levitt, 1999). Stabilisation of globular tertiary structure can be further enhanced by presence of a covalent disulphide bond between sulphydryl groups of two Cys amino acid residues in various structural patterns (Mas et al., 1998; Mas et al., 2001; Gupta et al., 2004). The Cys amino acid residues for disulphide bridge interaction can be any of loops, strands or helical conformations β (Mas et al., 1998; Mas et al., 2001; Gupta et al., 2004). Salt bridges can significantly, by as much as 17 kcal mol1, contribute to stability of a folded protein (Baldwin, 2007). Protein stability is thus dependent on pH due to differences between pKa values of the amino acid residues in the native and unfolded state of the protein and inversely, protein structure affects the pKa values of amino acid residues, thus influencing protonation state of ionisable sidechains (Baldwin, 2007). While sidechain–sidechain interactions can be favourable in the folded protein and thus provide stability to protein (Burley & Petsko, 1985; Matthews et al., 1987; Matsumura et al.,
29

1 Introduction
1989; Serrano & Fersht, 1989; Serrano et al., 1990; Serrano et al., 1991; Anderson et al., 1993; Clarke & Fersht, 1993; Britton et al., 1995; Waldburger et al., 1995; Thapar et al., 1996; Mansfeld et al., 1997; Strop & Mayo, 2000; Pace et al., 2000; Makhatadze et al., 2003; Schwem et al., 2003; Puchkaev et al., 2003; Eijsink et al., 2005), significance of these effects is not yet fully understood (Gray et al., 2001; Eijsink et al., 2004). Moreover, presence of such interactions does not specify their role in the folding process (Rose et al., 2006). Furthermore, folding is associated with, and thus opposed by, a loss of conformational entropy (Pal & Chakrabarti, 1999; Chakrabarti & Pal, 2001; Penel & Doig, 2001; Jarymowycz & Stone, 2006), especially for closely packed buried amino acid residues that can be even locked into a single rotamer (Penel & Doig, 2001). Hence, although widely accepted, sidechain–based protein folding may not be ultimately the correct view (Rose et al., 2006).
Backbonebased protein folding. Alternative theory of protein folding mechanism, backbonebased protein folding, has been recently proposed by Rose et al. (2006), who argue the following: (i) unfolded state is preorganised thus entropy loss upon folding is not so large; (ii) sidechains play only limited role in selecting between secondary structure elements and loops; (iii) hydrogen bonding predominates during protein folding over hydrophobic collapse (Baldwin, 2007); (iv) folding reaction is allornone process with proteins either folded or unfolded, whereas there is only a negligible population of partially folded intermediates implying that conformation and stability are two separable features, which is manifested by the fact, that protein folding, in contrast to stability, is only marginally influenced by specific amino acid residue interactions of a protein (Oliveberg, 2001); (v) osmolytes fold proteins by influencing the unfolded population; (vi) regardless of protein sequence, most proteins fold and unfold under similar conditions; (vii) there is only limited number of protein domains (Chothia, 1992); (viii) hydrogen bonding is important determinant of secondary structures, thus even the unfolded protein may possess some regions of secondary structure elements; indeed, even in unfolded state, helices do not melt to random coil conformations, butα rather exist in polyproline II conformation consisting of lefthanded helices with three amino acid residues per turn, where the peptide bonds are hydrogen bonded to water (Barron et al., 1997; Fleming et al., 2005; Mikhonin & Asher, 2006); individual amino acid residues in unfolded protein cluster in the helix, sheet and polyproline IIα β regions of and dihedral angle space and they flicker between these regions at rates ~ 10φ ψ 12 s1 at room temperature (Barron et al., 1997); (ix) not only sequencedependent funnel landscape but also structuredependent but sequenceindifferent landscape imposes major constraints on any sequencedependent folding model; (x) local protein backbone steric restrictions cause that e.g. three or more amino acid residues in helical conformation cannot be immediatelyα followed by amino acid residue from sheet without encountering a steric clash; (xi) topdown protein architecture isβ a consequence of bottomup selfassembly process (Rose, 1979).
Folding mystery. Despite the immense number of interactions between amino acid residues, the free energy difference between native and unfolded state is only ~ 5 to ~ 15 kcal mol1 which corresponds to the energy of single to three conventional hydrogen bonds (Jarymowycz & Stone, 2006; Rose et al., 2006). It remains a mystery how such a small difference can be sufficient to guide the folding towards the bottom of the funnelshape free energy landscape and what kind of interactions are crucial during this process (Socolich et al., 2005; Rose et al., 2006; Baldwin, 2007; Schmidt & Lamzin, 2007; Lupas, 2008), especially when considering that number of conceivable native to unfolded pathways for even a small protein of 100 amino acid residues is of the order at least 1030 and possibly much larger (Fitzkee et al., 2005b).
Robustness of protein folds. Protein folds evolved from small, manifested by occurrence of structurally similar fragments in contemporary proteins (Lupas et al., 2001), towards larger size (Koshland Jr., 1976; Koshland Jr., 1998) with typical contemporary protein having ~ 300 amino acid residues (Kent, 2009) which imposes robustness to the fold even in the protein core (Matthews, 1993). The robustness means that: (i) many protein amino acid residues simply serve as scaffolding for the final orientation of a few critical amino acid residues in appropriate alignments (Koshland Jr., 1976); (ii) some changes in the protein sequence, especially in surfaceexposed loops, are tolerated without any significant effect on the specific native protein fold (Pascarella & Argos, 1992) whereas others, especially those involving amino acid residues located in buried parts of protein structure and those involved in αhelices and sheets are more constrained and thus less prone to fixation of such a mutation β (Koehl & Levitt, 1999); (iii) mutations often reduce stability but rarely alter overall fold (Chothia & Lesk, 1986; Dalal et al., 1997; Baldwin & Rose, 1999b; Orengo et al., 2002).
Protein domain space. Considering the robustness of protein folds greatly reduces the protein folding problem because current estimates suggest that there are altogether only ~ 104 folds used in nature (Chothia, 1992; Govindarajan et al., 1999; Vitkup et al., 2001). The folds are conventionally classified according to secondary structure composition and arrangement into mainly/all folds, mainly/all folds, mixed ( + )folds with sheetα β α β β preceded or followed, but not interrupted, by helices, mixed / folds with helices present in some connectionsα α β α between strands of a sheet, and unclassified folds β β (Murzin et al., 1995; Orengo et al., 1997; Hubbard et al.,
30

1 Introduction
1998; Cuff et al., 2009). Other folds have been either not yet sampled by the evolutionary process as demonstrated recently by de novo design of a novel globular protein fold, Top7 (Fig 9; Kuhlman et al., 2003) or have been explored but have not found useful, or are not possible due to physical constraints (Kuhlman et al., 2003). These considerations suggest that free energy landscape is presculpted (Hoang et al., 2004) into a few thousands of intrinsically stable domains unmasked upon switching from unfolding to folding conditions, thus specific sequences, selected during evolution, are needed to discriminate among the possibilities in this repertoire (Rose et al., 2006). Hence, there must be rather a limited but specific number and distribution of amino acid residues and interactions (Socolich et al., 2005), the socalled conformational gatekeepers (Otzen & Oliveberg, 1999) that determine the protein fold (Kendrew, 1962; Koshland Jr., 1976; Otzen & Oliveberg, 1999; Oliveberg, 2001; Friedberg & Margalit, 2002; Socolich et al., 2005; Deechongkit et al., 2006; Jager et al., 2008). These amino acid residues are essentially conserved and coevolved (Socolich et al., 2005).
Fig 9 | Top7 de novo fold. Top7 fold (PDBID 1QYS) is a successfully computationally designed novel 93amino acid residue / fold with novel sequence and topology.α β The Top7 fold is composed of fivestranded antiparallel
sheet, packed on one side by two helices. Theβ α topology of the Top7 fold is: 2 1 1 3 2 5 4. Nβ β α β α β βterminus, blue; Cterminus, red.
Evolution of protein folds. From evolutionary point of view, limited number of protein folds is a consequence of either divergent and convergent evolution. Protein folds related via divergent evolution are homologues, i.e. they evolved from a common ancestor and mostly share similar tertiary structure due to the fact that tertiary protein structures are much more highly conserved during evolution than protein sequences (Chothia & Lesk, 1986; Dalal et al., 1997; Baldwin & Rose, 1999b; Orengo et al., 2002). At low sequence identities, a significant proportion of homologues are likely to be paralogues, i.e. relatives tha have arisen through gene duplication within a genome and often acquired new functions (Reeves et al., 2006). Protein folds related via convergent evolution evolved from disimilar protein sequences into similar, but not homologeous, tertiary protein structures due to limitation of possible number of arrangements of secondary structure elements in threedimensional space by physical constraints (Kendrew, 1962; Gibrat et al., 1996; Orengo et al., 1998).
Fold embellishments. Similarity of homologeous tertiary structures can be obscurred via permutations, rearrangements, and accretions, i.e. larger insertions and deletions (Lupas et al., 2001). The accretions are thought to originate via gene duplication and/or fusion and shuffling, the processes that are considered to be the main mechanisms of origin of new genes within the frame of RNA world hypothesis (Lupas et al., 2001; Orengo et al., 2002), and are often associated with different functions, e.g. changes in binding pocket, mediating domaindomain interactions and promoting oligomerisation states (Teichmann et al., 1999; Reeves et al., 2006). The secondary structure embellishments often tend to be colocated in the globular protein and involve sheet or helices leading toβ α up to more than twofold difference in number of secondary structure elements between otherwise structurally similar proteins (Reeves et al., 2006). helices are inserted as single elements, whereas sheet embellishments occur viaα β peripheral additions, subtractions or extensions to existing sheets β (Reeves et al., 2006) and they are responsible e.g. for variable number of strands (5 to 13) in the sheet of proteins possessing / hydrolase fold β β α β (Reeves et al., 2006). An extreme case of a fold embelishment is an acquisition of an entire domain leading to a multidomain protein.
Fold change. Although typically, tertiary protein structure is more conserved than primary protein sequence
31

1 Introduction
(Chothia & Lesk, 1986; Dalal et al., 1997; Baldwin & Rose, 1999b; Orengo et al., 2002), two homologeous proteins may possess different folds due to fold change via one or more of the following events (Grishin, 2001): (i) insertions, deletions and substitutions; (ii) circular permutations on gene level (Goldenberg, 1989), facilitated by gene duplication (Russell & Ponting, 1998); (iii) circular permutations on protein level due to close proximity of N and Ctermini, e.g. cleavage and ligation of the two fragments in concanavalin A (Cunningham et al., 1979); (iv) βstrand invasion or withdrawal; and (v) hairpin flip/swap rearrangements within sheet.β β
1.2.4 Quarternary Structure
Protein complexes. Some proteins fold on template of another protein (Li et al., 2000; Demchenko, 2001) or a pair of unfolded proteins form native folded structure only on the association (Demchenko, 2001). Some proteins fold individually but exert biological function only in association with one or more other proteins (dimer to multimer), either same (homo) or different (hetero), or may form even higher hierarchical arrangement, macromolecular complex, e.g. ribosome (Ramakrishnan & Moore, 2001) and flagella (Samatey et al., 2001). Because of limited number of protein folds, ~ 104 (Chothia, 1992; Vitkup et al., 2001), there must be also limited number of proteinprotein interaction types. Indeed, recent estimate suggests existence of ~ 104 proteinprotein interaction types of which 2 103 is already known (Aloy et al., 2005).
1.3 Protein function
1.3.1 Proteinligand binding
Binding. Proteins essentially function by interaction with other proteins, nucleic acids or other macromolecules, or small molecules and ions, i.e. ligands, via the socalled binding (Halperin et al., 2002; Manjasetty et al., 2008). In order for a protein to bind a ligand, it must be larger than ligand, provide threedimensional binding site and show complementarity with ligand in both structure and interactions (Koshland Jr., 1976). The interactions include hydrophobic interactions, van der Waals interactions, electrostatic interactions and hydrogen bonding interactions (Copeland, 2000a). Proteins bind ligands into clefts or crevices on protein surface or into a pocket buried in the protein core, depending on ligand chemical nature. Hydrophilic ligands bind on rather exposed hydrophilic protein surface, whereas hydrophobic ligands prefer binding into a rather hydrophobic pocket and thus combat the major obstacle of a living system, which is not so much the need to “activate” water to react when needed as the need to prevent water from reacting in cases where it is not needed to do so (Koshland Jr., 1976). Although almost all hydrophilic amino acid residues are located on protein surface, some of them can be buried and these rare exceptions have some special function within the protein (Kendrew, 1962).
Determinants of proteinligand binding. Proteinligand complex formation depends on (i) concentration of both partners, the higher the concentration, the higher the chance of proteinligand encounter, (ii) diffusion of the two binding partners, and (iii) affinity of a ligand to the binding site (Gohlke & Klebe, 2002). In case of a buried binding site, there is an additional determinant of the proteinligand association and dissociation: diffusion of a ligand into the buried binding pocket, which can occur via a tunnel or, for small ligands with zero net charge, through the protein matrix.
Proteinligand binding affinity. Assuming a protein with a single binding site for a ligand, any molecule of protein is either free or ligand bound, and likewise, any ligand must be either free or bound to a protein (Copeland, 2000b). Under any specific conditions, an equilibrium will be established between the free and bound forms of the protein, due to reversibility of proteinligand complex formation (Scheme 2) (Copeland, 2000b):
Scheme 2 | Proteinligand binding.
The position of the equilibrium can be described quantitatively by the socalled dissociation constant, Kd (Eq 1) (Copeland, 2000b):
32

1 Introduction
Eq 1 | Dissociation constant.
where [P], [L] and [PL] refer to concentration of protein, ligand and proteinligand complex, respectively. Relative affinity, i.e. strength of binding, is inversely proportional to the dissociation constant: the tighter the ligand binds, the lower the value of the dissociation constant (Copeland, 2000b). At equilibrium, the concentration of proteinligand complex is constant. Assuming [P] << [L], the relationship between [P], [L], [PL] and Kd can be described by the socalled Langmuir isotherm equation (Eq 2):
Eq 2 | Langmuir isotherm.
Formation of proteinligand complex as a function of ligand concentration, the socalled binding isotherm, has typically hyperbolic shape (Fig 10). However, if the assumption on [P] << [L] is not valid, which is the case of the ligand showing very strong affinity to the protein, then the relationship between [P], [L], [PL] and Kd cannot be described by the Langmuir isotherm, but instead using quadratic equation that is rigorously correct for any proteinligand binding interaction (Eq 3):
Eq 3 | Quadratic equation for proteinligand binding.
The dissociation constant can be related to the Gibbs free energy of binding (Eq 4):
Eq 4 | Gibbs free energy of binding.
where R is universal gas constant and T is temperature.Biological response to proteinligand binding. Binding of a ligand to the protein is a specific recognition process
(Koshland Jr., 1976; Gohlke & Klebe, 2002) resulting in some kind of an action, i.e. biological response of the protein to the bound ligand. According to the response, two types of proteins can be distinguished – (i) noncatalytic, e.g. receptors and signaling proteins, and (ii) catalytic, the socalled enzymes. The latter respond, alone or with the aid of nonprotein compounds, the socalled cofactors or coenzymes, to a specific bound ligand, a substrate, in an active site, by its chemical modification into another entity or entities, product(s) (Schmidt & Lamzin, 2007), that finally leave the active site to free the space for another substrate to bind.
Fig 10 | Langmuir isotherm for proteinligand complex, [PL], formation as a function of ligand concentration, [L]. Note, deviations from the hyperbolic shape occur for example when protein contains multiple nonequivalent binding sites. Redrawn according to Copeland (Copeland, 2000b).
33

1 Introduction
1.3.2 Protein fold, function and evolution
Protein fold and function. Protein folds differ by tendency to be associated with enzymatic or nonenzymatic functions (Hegyi & Gerstein, 1999): / folds are disproportionally associated with enzymes, especially transferasesα β and hydrolases, whereas all folds and small folds in general are associated with nonenzymes α (Hegyi & Gerstein, 1999). ( + )folds have an equal tendency either way α β (Hegyi & Gerstein, 1999).
Functional variability and evolution. One function can be accomplished by more than one fold and vise versa (Hegyi & Gerstein, 1999). It seems that nature tends to reinvent enzymatic function, i.e. convergent evolution, more often than modify already existing function, i.e. functional divergence (Hegyi & Gerstein, 1999). The most versatile (promiscuous) enzymatic functions, hydrolases and Oglycosyl glucosidases, are associated with seven folds each (Hegyi & Gerstein, 1999). The five most versatile folds are TIMbarrel (Jones, 2003), Rosmann (Hegyi & Gerstein, 1999), ferredoxin (Hegyi & Gerstein, 1999), / hydrolase (α β Hegyi & Gerstein, 1999; Li et al., 2008) and Ploop NTP hydrolase (Hegyi & Gerstein, 1999). All these five folds are mixed / folds which are thought to beα β generic scaffolds because they are capable of accommodating more than six functions (Hegyi & Gerstein, 1999). For example, versatility of TIMbarrel fold, which is known to support over 60 different functions (Watson et al., 2005), has been demonstrated by successful design of catalytic activity into enzymatically inert bacterial protein thioredoxin (Bolon & Mayo, 2001), and versatility of / hydrolase fold allows multiple possibilities of organisation of aα β functional amino acid residues via “migration” (also known as “hopping”) within the protein primary sequence, without loss or change of function (Todd et al., 2002). The functional group migration can occur towards stabilisation of protein structure and/or optimisation of less efficient proteins by loss of an “old” functional amino acid residue by mutation and recruitment of the new elsewhere in the protein (Todd et al., 2002). The functional variability also depends on modular organisation of proteins. Multidomain proteins show higher functional variability at a given sequence identity compared to single domain proteins with function similarity confidence level shifted from 40% for singledomain to 60% for multidomain proteins (Orengo et al., 2002).
Protein function in the context of a living organism. Even proteins with 100% identity, however, can have different functions depending on where they are expressed in a living organism (Whisstock & Lesk, 2003). Thus, full understanding of protein function cannot be achieved by considering the protein function only in the context of the protein itself, but requires also considering the protein function in the context of entire metabolic network of the living organism (Watson et al., 2005). Importantly, evolutionary selection acts on function, not on structure (Russ et al., 2005). Therefore, whether particular change in the structure caused by mutation(s) (Teichmann et al., 1999; Todd et al., 2001; Orengo et al., 2002) becomes fixed depends on function of the mutant protein within the context of a complex ensemble of reactions in the living organism (Gray et al., 2001). Since change in binding affinity does not necessarily lead to affected fitness of the living organism, whereas change or loss of function may have often adverse effect on the living organism, protein functions are more conserved than ligand specificities (Teichmann et al., 2001).
1.3.3 Enzymes
Enzyme function. Enzymes are known to catalyse ~ 4000 different reactions (Schomburg et al., 2004). According to catalytic function (CaetanoAnollés et al., 2009) but not guided by evolutionary considerations (Valencia, 2005), enzymes are conventionally classified into six classes, defined by the first digit of the socalled Enzyme Commission (EC) number: oxidoreductases (EC 1), transferases (EC 2), hydrolases (EC 3), lyases (EC 4), isomerases (EC 5), and ligases (EC 6) (CaetanoAnollés et al., 2009). Enzymes within each class are further distinguished by three subsequent digits, each providing increasingly detailed specification of enzyme function: the second digit (subclass) specifies chemical compound or group involved in the reaction, the third digit (subsubclass) specifies type of the reaction and the fourth digit (serial identifier) specifies metabolites and cofactors (CaetanoAnollés et al., 2009).
Functional features of enzymes. Enzymes have two key interrelated functional features (Copeland, 2000c; Copeland, 2000d; Copeland, 2000e; Copeland, 2000f; Copeland, 2000g, Copeland 2000h): (i) rate acceleration, described by enzyme kinetics (see 1.3.3.1) and by source of catalytic effect (see 1.3.3.2); and (ii) substrate specificity described by source of catalytic effect (see 1.3.3.2). These two features together define the enzyme reaction mechanism which is the key determinant of biological role of every enzyme.
1.3.3.1 Enzyme kinetics
Reaction progress curves. The enzymecatalysed reaction usually comprises three steps: (i) substrate binding; (ii)
34
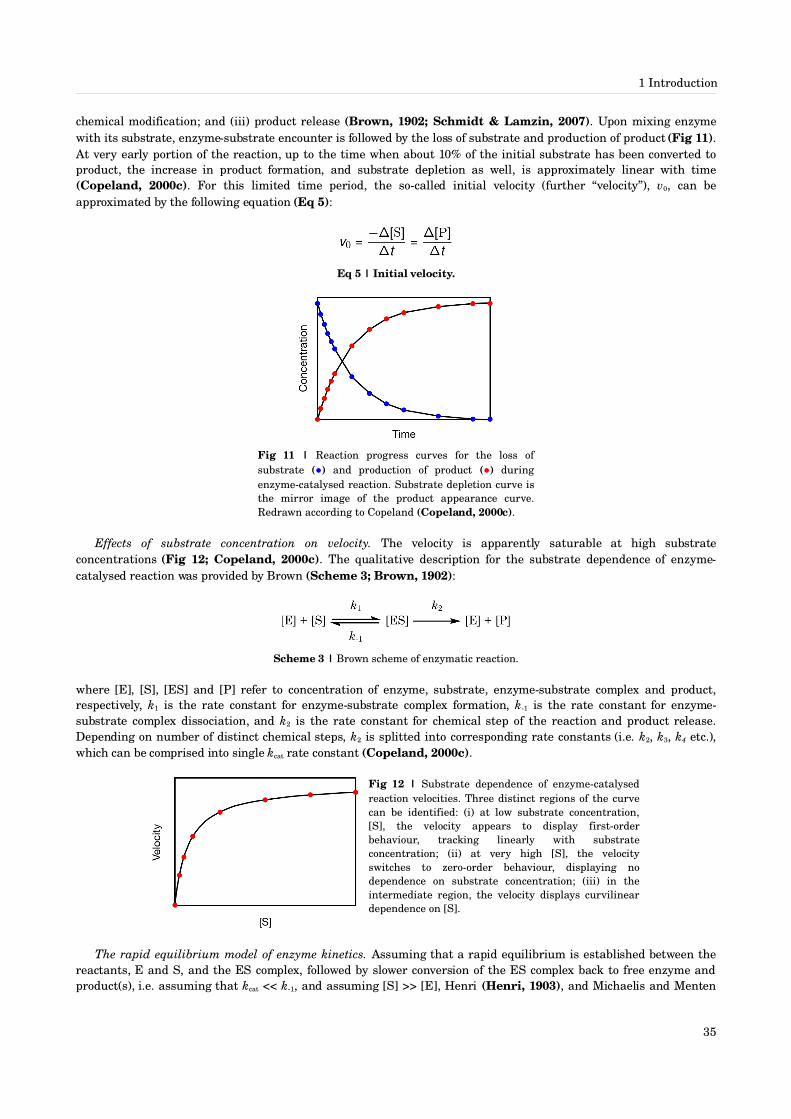
1 Introduction
chemical modification; and (iii) product release (Brown, 1902; Schmidt & Lamzin, 2007). Upon mixing enzyme with its substrate, enzymesubstrate encounter is followed by the loss of substrate and production of product (Fig 11). At very early portion of the reaction, up to the time when about 10% of the initial substrate has been converted to product, the increase in product formation, and substrate depletion as well, is approximately linear with time (Copeland, 2000c). For this limited time period, the socalled initial velocity (further “velocity”), v0, can be approximated by the following equation (Eq 5):
Eq 5 | Initial velocity.
Fig 11 | Reaction progress curves for the loss of substrate (●) and production of product (●) during enzymecatalysed reaction. Substrate depletion curve is the mirror image of the product appearance curve. Redrawn according to Copeland (Copeland, 2000c).
Effects of substrate concentration on velocity. The velocity is apparently saturable at high substrate concentrations (Fig 12; Copeland, 2000c). The qualitative description for the substrate dependence of enzymecatalysed reaction was provided by Brown (Scheme 3; Brown, 1902):
Scheme 3 | Brown scheme of enzymatic reaction.
where [E], [S], [ES] and [P] refer to concentration of enzyme, substrate, enzymesubstrate complex and product, respectively, k1 is the rate constant for enzymesubstrate complex formation, k1 is the rate constant for enzymesubstrate complex dissociation, and k2 is the rate constant for chemical step of the reaction and product release. Depending on number of distinct chemical steps, k2 is splitted into corresponding rate constants (i.e. k2, k3, k4 etc.), which can be comprised into single kcat rate constant (Copeland, 2000c).
Fig 12 | Substrate dependence of enzymecatalysed reaction velocities. Three distinct regions of the curve can be identified: (i) at low substrate concentration, [S], the velocity appears to display firstorder behaviour, tracking linearly with substrate concentration; (ii) at very high [S], the velocity switches to zeroorder behaviour, displaying no dependence on substrate concentration; (iii) in the intermediate region, the velocity displays curvilinear dependence on [S].
The rapid equilibrium model of enzyme kinetics. Assuming that a rapid equilibrium is established between the reactants, E and S, and the ES complex, followed by slower conversion of the ES complex back to free enzyme and product(s), i.e. assuming that kcat << k1, and assuming [S] >> [E], Henri (Henri, 1903), and Michaelis and Menten
35

1 Introduction
(Michaelis & Menten, 1913) independently arrived to the following description of the reaction velocity as a hyperbolic function of [S], known as HenriMichaelisMenten equation (Eq 6):
Eq 6 | HenriMichaelisMenten equation.
where Ks is equilibrium dissociation constant, k1/k1, and Vmax is maximum reaction velocity that is reached at infinite [S] (Eq 7):
Eq 7 | Maximum velocity.
The steadystate model of enzyme kinetics. The rapid equilibrium model of enzyme kinetics is valid only if kcat << k1. More general description of enzyme kinetics can be provided by steadystate model, that does not require kcat << k1. The steady state refers to a time period of the enzymatic reaction after fast (millisecond timescale) burst of ES formation. In the steady state, the rate of ES complex formation is exactly matched by its rate of decay to free enzyme and products, under the condition of [E] << [S] (Copeland, 2000c). Since kcat cannot be neglected, the steadystate expression for the reaction velocity (Eq 8) substitutes Ks by Km (Eq 9):
Eq 8 | BriggsHaldane Equation.
Eq 9 | Km constant.
Although Eq 8 is different from Eq 6, it is commonly referred to as HenriMichaelisMenten equation (Copeland, 2000c).
Significance of Km. Km, also known as “Michaelis constant”, is the [S] that provides a reaction velocity that is half of the maximal velocity obtained under saturating substrate conditions (Copeland, 2000c). In other words, Km is the [S] at which half of enzyme active sites are filled with substrate in the steady state (Copeland, 2000c). The lower the Km, the lower [S] is needed to fill half of enzyme active sites with substrate, and thus the higher is the affinity of the substrate to the enzyme active site (Copeland, 2000c). However, although Km is considered as a good measure of binding affinity in most cases, since Km depends also on kcat (Eq 9), it must be beared in mind that Km can be less than, greater than, or equal to binding constant; hence Km is referred to as “apparent binding constant” and should generally be considered as kinetic, not thermodynamic, constant (Copeland, 2000c; Koshland Jr., 2002a). Only under the specific conditions that kcat << k1 are Km and Ks equivalent (Copeland, 2000c).
Significance of kcat. kcat defines the maximal velocity at which an enzymatic reaction can proceed at a fixed concentration of enzyme and infinite availability of substrate (Copeland, 2000c). In other words, kcat, also known as “turnover number”, defines number of catalytic turnover events that occur per unit time (Copeland, 2000c). Since kcat often reflects multiple chemical steps, it does not provide detailed information on the rates of any of the individual steps subsequent to the substrate binding (Copeland, 2000c). Instead, kcat provides a lower limit on the rate constant of the slowest, i.e. ratelimiting step following substrate binding (Copeland, 2000c). Resolving individual chemical steps is possible at presteady state phase of enzymecatalysed reaction (millisecond timescale), i.e. before the equilibrium for [ES] is established (Copeland, 2000c).
Enzyme performance. The best measure of enzyme performance is provided by kcat/Km ratio, which is sometimes referred to as “specificity constant”. However, the term “specificity constant” can be deceptive, because conformational change, that might occur during enzymatic reaction, can be part of kcat and/or Km but kcat/Km does not evaluate either conformational change or the ability to discriminate between substrate structures (Koshland Jr., 2002a). kcat/Km
term summarises the net advantage or disadvantage of a mutation to the enzyme, and thus the term “performance
36

1 Introduction
constant” seems to be a more accurate and descriptive designation for this concept (Koshland Jr., 2002a). The higher is kcat/Km, the better is the enzymatic performance (Koshland Jr., 2002a).
Enzyme perfection. The fact, that the enzyme has a maximum velocity for a given substrate under given conditions, that cannot be further enhanced by increased concentration of a substrate, is caused by limitation of enzyme activity caused by the slowest step along the reaction cycle, which can be any of rate of substrate binding, or any of the multiple steps contributing to kcat (Copeland, 2000c). Some enzymes, e.g. acetylcholinesterase or carbonic anhydrase, display kcat/Km values of 108 109 M1 s1, which is at the diffusion limit (Copeland, 2000c). Such enzymes are said to have achieved kinetic perfection, because they are limited by the rate of diffusion of molecules in solution (Copeland, 2000c). The diffusion limit does not set an upper limit on the catalytic performance because it can be overcome by compartmentalisating themselves and their substrates within close proximity (Copeland, 2000c). This can be accomplished by assembling enzymes and substrates into organised multienzyme complexes, e.g. at cellular membrane, in such a way that product of one enzymatic reaction, which is substrate for another enzyme, is channeled into the second enzyme without the need for diffusion through solution, hence the socalled substrate channeling mechanism (Copeland, 2000c).
Deviation from HenriMichaelisMenten hyperbolic kinetics. HenriMichaelisMenten kinetics is valid only for catalytic reactions in homogeneous (water) phase. Lipasecatalysed lipolytic reactions which occur at the lipidwater interface cannot be described by HenriMichaelisMenten equations (Jaeger & Reetz, 1998). Deviations from HenriMichaelisMenten kinetics can be also caused by inhibition and cooperativity (Copeland, 2000c).
Enzyme inhibition. Inhibitors are substrates, products or other ions or molecules that decrease enzyme's activity by binding to the enzyme. Some inhibitors, the socalled reversible inhibitors, establish their binding equilibrium with the enzyme on a timescale that is rapid with respect to the turnover rate of the enzymecatalysed reaction (Scheme 4; Copeland, 2000e):
Scheme 4 | Equilibrium inhibition.
Depending on values of and factors, three types of inhibitor interaction with enzyme are distinguished: (i)α β competitive ( = α ∞, = 0), (ii) noncompetitive (0 < < β α ∞, = 0) and (iii) uncompetitive ( << 1β α , = 0) β (Fig 13; Copeland, 2000e). Other inhibitors, the socalled tightbinding inhibitors bind to their target enzyme with such a high affinity that the population of free inhibitor molecules is significantly depleted by formation of enzymeinhibitor complex (Copeland, 2000f). Many tightbinding inhibitors establish equilibrium on the timescale of enzymatic turnover, thus displaying a change in initial velocity with time (Copeland, 2000g). Such inhibitors act as the socalled slowbinding or timedependent inhibitors; three different modes of interaction between an inhibitor and enzyme can be distinguished to result in slow binding kinetics (Fig 14; Copeland, 2000g). All these inhibitiory mechanisms are important for finetuning enzyme action in a complex metabolic network, but may also lead to an undesired defect in enzyme's biological role in the case of a nonnatural inhibitor or nonnatural concentration of an inhibitor supplied by external environment or by impaired (decoupled, imbalanced) elements of the metabolic network.
37

1 Introduction
Fig 13 | Three types of inhibitor interactions with the enzyme. (a) Competitive inhibition, (b) noncompetitive inhibition, (c) uncompetitive inhibition; enzyme, white; substrate, grey; inhibitor, black. Redrawn according to Copeland (2000e).
Fig 14 | Three types of timedependent inhibition. (a) simple reversible slow binding, (b) enzyme isomerisation, (c) irreversible enzyme inactivation by affinity labeling/covalent modification or mechanismbased inhibition. The inhibition schemes describe competing reactions for enzymecatalysed reaction in absence of inhibitor. Redrawn according to Copeland (2000h).
Cooperativity. In some oligomeric enzymes, each subunit contains an active site centre for substrate binding and catalysis. The active sites can act independently on each other (no cooperativity) thus displaying classical HenriMichaelisMenten behaviour, or the binding of ligands at one active site of the enzyme can increase (positive cooperativity) or decrease (negative cooperativity) affinity to other active sites (Copeland, 2000h). According to the socalled allostery concept, cooperativity is achieved via structural changes transmitted through protein; although, structural change does not necessarilly imply cooperativity (Koshland Jr. & Hamadani, 2002). Allosteric effects can occur between separate binding sites for the same ligand, i.e. homotropic cooperativity, or by binding of a structurally unrelated ligand, the socalled allosteric effector, at a distant separate site, i.e. heterotropic cooperativity (Copeland, 2000h). Ligands that cause positive and negative heterotropic cooperativity are referred to as allosteric activators and repressors, respectively (Copeland, 2000h). Two major models were proposed to explain cooperativity in proteins (Fig 15; Copeland, 2000h): (i) concerted transition or symmetry model, also known as “MWC model” (Monod et al., 1965) and (ii) sequential model, also known as “KNF model” (Koshland Jr. et al., 1966). MWC model suggests that subunits change shape in concerted manner to preserve the symmetry of the entire molecule as it transforms from the conformation “T” to the conformation “R” under the influence of a ligand (Monod et al., 1965). This model, however, does not explain negative cooperativity (Koshland Jr. & Hamadani, 2002). KNF model is model of all three possible situations: positive cooperativity, negative cooperativity and no cooperativity (Koshland Jr. et al., 1966; Koshland Jr., 1976; Koshland Jr., 1996). KNF model is based on (i) induced conformational changes transmitted through subunit interactions and (ii) capacity of the protein to be distorted which is the key programmed feature of the protein (Koshland Jr. et al., 1966; Koshland Jr., 1976; Koshland Jr., 1996).
Role of cooperativity for protein function. Cooperativity is one of the well established phenomena that makes living possible (Koshland Jr. & Hamadani, 2002). Positive cooperativity causes amplification of the sensitivity of signal. Negative cooperativity, on the other hand, decreases sensitivity to HenriMichaelisMenten behaviour but in the process of doing that, the negative cooperativity extends the range over which some response is generated (Koshland Jr. & Hamadani, 2002).
Rate of enzymatic reaction. In summary, overall rate of enzyme action is dependent on (i) rate of diffusion, (ii) substrate binding affinity, (iv) chemical modification, i.e. type and complexity of the reaction and free energy
38

1 Introduction
barrier(s), (v) product release, (v) presence/absence of cooperativity, (vi) presence/absence of inhibitors and mode of their action, and (vii) physicochemical parameters of the environment, e.g. temperature, pH, pressure, presence and concentration of inorganic and organic compounds.
Fig 15 | Models of cooperativity. (a) MWC model of positive cooperativity, (b) KNF model of positive, negative and no cooperativity. In the KNF model, positive, negative and no cooperativity occurs when a < 1, a > 1 and a = 1, respectively. L, ligand; white shape, free protein; grey shape, proteinligand complex. Redrawn according to Copeland (2000h).
1.3.3.2 Catalytic effect
Keylock model. Both substrate specificity and rate acceleration results from the precise threedimensional structure of the active site (Copeland, 2000d). In 1884, Fischer proposed the socalled keylock model of substrate specificity based on observation that invertase from beer yeast hydrolyses glucoside but not glucosides whileα β emulsin operates oppositely, i.e. enzyme and glucoside have to fit to each other like a lock and key in order to exert a chemical effect on each other (Fig 16; Fischer, 1894). The keylock theory was further supported by steric repulsions in organic reactions and by the fact that kinetics of enzyme action is compatible with an enzyme substrate complex. Major implication of the keylock model is appreciation of the importance of well ordered, highly specific threedimensional structure as a necessary prerequisite for protein function (Mirsky & Pauling, 1936). The enzyme active site was thought by Fischer to be a rigid and sturdy lock which would have exact fit with only one substrate, the key (Ma et al., 2000). Thus, the specificity of enzyme catalysis was thought to be the result of matching a lock with the correct key (Ma et al., 2000).
Fig 16 | Early view of substrate specificity through keylock model. (a) A substrate (light grey) fits to the active site of an enzyme (white) like a key to the lock; (b) a nonsubstrate (dark grey) does not fit and thus cannot be converted by the enzyme to product(s).
39

1 Introduction
Transition state stabilisation. The early keylock hypothesis was formulated far before development of transition state theory (Pauling, 1946), hence it viewed the ground state of enzymesubstrate complex as the relevant configuration (Copeland, 2000d). However, the enzyme active sites have evolved to best complement the substrate transition state structure, rather than the ground state, because the catalytic power of enzymes is due to stabilisation of transition state of the reaction compared to uncatalysed reaction, hence lowering the activation energy barrier to product formation (Fig 17; Pauling, 1946). The activation energy, Ea, is related to kcat by the following equation (Eq 10):
Eq 10 | The relationship between catalytic constant and activation energy.
where kB is Boltzmann constant, T is temperature, h is Planck's constant and R is universal gas constant. Hence, a linear decrease in activation energy caused by transition state stabilisation of enzymecatalysed reaction compared to uncatalysed reaction leads to an exponential increase in kcat and thus an exponential increase in reaction rate (Copeland, 2000d). Transition state stabilisation can cause rate acceleration up to 1011 or even more (Wolfenden, 1969; GarciaViloca et al., 2004). Lowering the free energy barrier of the transition state of the reaction is necessary because a typical chemical reaction has an activation barrier of 30 to 80 kcal mol1 (Ma et al., 2000), whose overcoming by noncatalysed reaction would be to slow to sustain life (Wolfenden & Snider, 2001). Impressive power of enzymes can be demonstrated by the fact that reduction of barrier height by ~ 8 kcal mol1 in enzyme, which corresponds to a single strong hydrogen bond, can cause an increase of ~ 106 in the rate constant at room temperature (Soriano et al., 2005).
Fig 17 | Energy level diagram of enzymecatalysed (–) and the corresponding uncatalysed (–) chemical reaction. Transition states, S‡ and ES‡, are the highest energy structures along the threedimensional reaction coordinate. The initial states, E + S, and final states, E + P, are energetically identical in the catalysed and uncatalysed reactions (–). E, free enzyme; S, free substrate; ES, enzymesubstrate complex; S‡, free transition state; ES‡, enzymesubstrate transition state; EP, enzymeproduct complex; P, free product; ∆GES, net energy gain that results from the realisation of enzymesubstrate binding energy; ∆Gkcat, amount of energy that must be expended to reach the transition state; ∆GES
‡, free energy of activation. In multiplestep enzymecatalysed reaction, the single ES‡ transition state can be splitted into multiple intermediate and transition states. Redrawn according to Copeland (Copeland, 2000d).
“Loose” versus “tight” transition state. The widely accepted view of enzymatic catalysis as tight binding of the substrate to the transitionstate structure causing lowering the activation energy may be, however, oversimplified because the real meaning of a transition state is a surface, not a single saddle point on the potential energy surface (Ma et al., 2000). Thus, transition state can be loose causing that the entire transition state region, rather than a single saddle point, contributes to reaction kinetics (Ma et al., 2000). Therefore, instead of optimising binding to a welldefined transitionstate structure, enzymes are optimised by evolution to bind efficiently with a transitionstate ensemble (Ma et al., 2000). In an extreme case, e.g. electron transfer reaction, there is no saddle point controlling reaction kinetics (Ma et al., 2000).
Transmission coefficient. In some cases, an additional though minor contribution to the rate acceleration comes from the socalled transmission coefficient, which is composed of three components: (i) nonequilibrium effects, i.e. deviation of equilibrium distribution in phase space (GarciaViloca et al., 2004); (ii) quantummechanical tunneling (GarciaViloca et al., 2004); and (iii) dynamical recrossing of transition state (GarciaViloca et al., 2004; Nam et al., 2004; Tousignant & Pelletier, 2004; Soriano et al., 2005). These minor effects can cause additional rate acceleration up to 103.
Total catalytic effect. Transition state stabilisation and transmission coefficient together define the enhancement of the reaction rate achieved by the enzyme compared to the noncatalysed reaction in water, and eventually gas phase
40

1 Introduction
(Martí et al., 2001; Cui & Karplus, 2002; DeviKesavan & Gao, 2003), the socalled catalytic effect, also known as “enzymatic proficiency” (Warshel, 1991; Radzicka & Wolfenden, 1995; Cannon & Benkovic, 1998). The catalytic effect is reported to be up to 1017fold (Radzicka & Wolfenden, 1995; Benkovic & HammesSchiffer, 2003) or up to 1019 (Wolfenden & Snider, 2001) whereas some uncatalysed reactions have halftimes approaching the age of the Earth (Wolfenden & Snider, 2001).
Chemical mechanisms for transition state stabilisation. There are five major categories of chemical mechanisms used by enzymes to achieve transition state stabilisation (Copeland, 2000d): (i) approximation, i.e. greatly increased effective concentration of substrate in the active site with respect to its concentration in solution; (ii) covalent catalysis, i.e. breaking the reaction into multiple steps composed of formation and breakdown of covalent intermediates via nucleophilic, electrophilic or redox catalysis; (iii) general acidbase catalysis involving proton transfer; (iv) conformational distorsion involving enzyme and/or substrate conformational changes, inducedfit (Koshland Jr., 1958; Koshland Jr., 1976; Koshland Jr., 1995), inducedstrain (Copeland, 2000d) or conformational selection (Karush, 1950; Lightstone & Bruice, 1996; Lightstone et al., 1997; Lightstone et al., 1998; Bruice & Lightstone, 1999; Bruice & Benkovic, 2000; Ma et al., 2000; Bruice, 2002; Sullivan & Holyoak, 2008), to drive the complex towards the transition state (Fig 18); and (v) preorganisation of the active site for transition state complementarity, i.e. substituting solvent by protein and solvating the transition state more than water does (Warshel & Levitt, 1976; Warshel, 1978; Warshel & Florián, 1998; Warshel & Papazyan, 1998; Ma et al., 2000; Shurki et al., 2002; Warshel, 2003; Olsson & Warshel, 2004; Warshel et al., 2006). Any enzyme exploits several or all of these often interdependent and to some extent undistinguishable mechanisms to achieve overall rate enhancement (Copeland, 2000d).
Inducedfit model of substrate specificity. Even if the keylock model will be considered as referring to transitionstate configuration, it does not explain all cases (Koshland Jr., 1958). For example, keylock theory would predict equal rates for hydrolysis of ribose5'phosphate by 5'nucleotidase as for adenylic acid at enzyme saturation, and molecule similar to substrate binds to the enzyme but is not converted, e.g. methyl glucoside smaller by twoα hydrogen atoms to maltose binds to amylomaltase and functions as competitive inhibitor of this enzyme, but is not hydrolysed. Such anomalous behaviours can be explained by Koshland Jr.'s inducedfit theory (1958). Inducedfit theory states the following (Koshland Jr., 1958): (i) precise orientation of catalytic groups is required for enzyme action; (ii) the substrate may cause an appreciable change in the threedimensional relationships of the amino acids at the active site; (iii) the changes in the protein structure caused by a substrate bring the catalytic groups into proper orientation for reaction whereas a nonsubstrate does not. Thus the idea of a fit is retained from the keylock theory; and the fit occurs only after the changes have been induced by the substrate itself (Koshland Jr., 1958). Inducedfit model can be metaphorically described as “hand in glove” model (Koshland Jr., 1958). When a “good” substrate binds to the active site, the binding forces between the enzyme and the substrate are used to drive the enzyme into an energetically less favourable but catalytically active conformation (Fig 18a; Copeland, 2000d). Inducedfit model is supported by (i) flexible nature of portions, if not all, of the protein (Koshland Jr., 1958), (ii) conformational changes caused by small molecules, e.g. reversible denaturation of enzymes by urea (Koshland Jr., 1958), (iii) substratepromoted isotopic exchange, i.e. substrate is necessary to promote the proper orientation of catalytic groups (Koshland Jr., 1958), and (iv) protein Xray crystallography (Anderson et al., 1979).
Keylock model versus inducedfit model. Inducedfit model is sometimes errorneously referred in literature as an alternative to keylock model. In fact, the inducedfit model is an extension of the keylock model to account for systems that cannot be accounted for by the keylock model (Koshland Jr., 1995). The inducedfit model keeps the necessity of enzymesubstrate complementarity and adds inducedfit mechanism, to account for protein flexibility, as the necessary step for achieving the complementarity for some systems (Koshland Jr., 1958; Koshland Jr., 1976; Koshland Jr., 1995): The best explanation of the actual relationship between keylock and inducedfit models could be provided and was provided by Koshland himself (Quote 1; Koshland Jr., 1995):
(...) The induced fit theory is no more a refutation of Fischer’s keylock principle than the Heisenberg atom was of the Bohr atom or the modern DNA sequences are of the one geneone enzyme hypothesis. A new theory must explain all the existing facts that pertain to it at the time of its enunciation. Gradually the new theory becomes accepted and then acquires anomalies due to the new facts uncovered after its enunciation. That in turn generates a newer theory which elicits new techniques to test it and its predictions. These new techniques then uncover facts which eventually require further new theories and so on. The new theories are built on components of the old principles. It is said that each scientist stands on the shoulders of the giants who have gone before him. There can be no more honored place than to stand on the shoulders of Emil Fischer. (...)
Quote 1 | From Koshland (1995).
41

1 Introduction
Conformational selection. Even when enzyme does not seem to undergo ligandinduced conformational changes upon ligand binding, conformations sampled by free enzyme and substrate, and by enzyme and substrate upon enzymesubstrate association usually change (Ma et al., 2000). Such situations cannot be on principle accounted for by rigid keylock model but instead by conformational selection model, also known as “population shift model” (Sullivan & Holyoak, 2008) (Fig 18b). Conformational selection model is generally applicable for all systems, in some, though, preceded by or accompanied by inducedfit step (Sullivan & Holyoak, 2008). Conformational selection and inducedfit are complementary, rather than mutually exclusive models (Sullivan & Holyoak, 2008). Anyway, keylock model is obsolete and should not be used for description of substrate specificity although it might be still considered useful for providing basic, simplified understanding of the term “complementarity” (Ma et al., 2000).
Inducedstrain model. In some cases, the active conformation sampled by the enzyme can be the preferred enzyme configuration, whereas substrate binding requires distorsion from the active conformation (Copeland, 2000d). The binding forces between enzyme and substrate are then directly used to induce strain in the substrate molecule, distorting it towards the transition state structure to facilitate reaction, hence the inducedstrain model (Fig 18c) (Copeland, 2000d).
Fig 18 | Models of conformational distorsions for transition state stabilisation. (a) Inducedfit model, (b) conformational selection model, (c) inducedstrain model. Enzyme, white; substrate, light grey; nonsubstrate, dark grey. Inducedfit and conformational selection models are demonstrated on enzyme conformational distorsions; substrate can be distorted, too.
42

1 Introduction
1.4 Protein dynamics
1.4.1 Protein conformations
Protein as an engine. Proteins are engines and engines essentially work by action in time, which involves movements (Koshland Jr., 1976; Koshland Jr., 1996; Parak, 2003; Karplus & Kuriyan, 2005; Igumenova et al., 2006; Rueda et al., 2007). Therefore, a static protein structure is an inadequate approximation in describing complex nature of protein function (Karush, 1950; Wolfenden, 1974; Parak, 2003; Busenlehner & Armstrong, 2005; Igumenova et al., 2006; Jarymowycz & Stone, 2006).
Four dimensions of a protein. Protein is not a three but rather a fourdimensional system because each atom has a specific position in threedimensional space and the fourth dimension is being provided by time (Lupas, 2008). In other words, a protein molecule is dynamic in time, i.e. atoms change positions with respect to each other with progress of time (Supplementary file md.avi; Lakowicz & Weber, 1973; Austin et al., 1975; Frauenfelder et al., 1979; Janin & Wodak, 1983; Bennett & Huber, 1984; Chothia & Lesk, 1985; Baldwin & Rose, 1999a; Frauenfelder et al., 2001; Jarymowycz & Stone, 2006). At any particular time, a protein molecule has a specific threedimensional structure, the socalled conformation, that corresponds to a region of a configurational space surrounding the local minimum on a free energy landscape (Kurzyński, 1998). Protein dynamics is manifested by sampling of conformational space via overcoming energy barriers between different conformations, and thumbling around those conformations (Fig 19; Cooper, 1976; Ma et al., 2000; Kurakin, 2009; Skjaerven et al., 2009).
Protein ensemble. Different molecules within protein ensemble may have different conformations at a particular moment and each fluctuates dynamically over time (Lakowicz & Weber, 1973; Austin et al., 1975; Frauenfelder et al., 1979; Janin & Wodak, 1983; Bennett & Huber, 1984; Chothia & Lesk, 1985; Baldwin & Rose, 1999a; Frauenfelder et al., 2001; Jarymowycz & Stone, 2006). Hence, every protein ensemble must conceptually have some, often different, concentration of different conformations in equilibrium (Fig 19; Yu & Koshland Jr., 2001; Carlson, 2002; Parak, 2003; Sousa et al., 2006; Kurakin, 2009). Heterogeneity of an ensemble of protein molecules is a consequence of protein molecules not having well defined energy minimum (Parak, 2003; Sousa et al., 2006). Prevalence of any particular conformation depends on relevant energy barrier and population of the starting conformation (Jarymowycz & Stone, 2006).
Fig 19 | Protein conformational landscape. Any protein molecule exists in solution as a population of interconverting conformations, shown here as minima on the free energy curve, which represents a onedimensional crosssection through the highdimensional energy surface of a protein. In the example given, a population of conformations is composed of three families (A, B, and C). Families are composed of groups of related conformations, while groups, in turn, are composed of yet smaller divisions (not shown), providing hierarchy of free energy barrier heights. Different protein molecules (circles) of an ensemble may have different conformations at a given time. Redrawn according to Kurakin (2009).
Functional Conformations. Since only subset of conformational states is competent for any particular protein function (Jarymowycz & Stone, 2006), protein conformations have to interconvert to perform a function (Yonetani et al., 1998; Piana et al., 2002; Parak, 2003; Cascella et al., 2004; Bourgeois & Royant, 2005; Busenlehner & Armstrong, 2005; Karplus & Kuriyan, 2005; Igumenova et al., 2006; Carnevale et al., 2006; Jarymowycz & Stone, 2006; Mittermaier & Kay, 2006; Sousa et al., 2006; Rueda et al., 2007; Helms, 2007; Liu et al., 2007; Jager et al., 2008; Laberge & Yonetani, 2008; Yonetani & Laberge, 2008; Skjaerven et al., 2009). Functional properties of a protein is the manifestation of (i) functional properties of each competent state, (ii) population of these states, i.e. thermodynamics of the ensemble and (iii) rates of interconversion between different conformations, i.e. kinetics of the ensemble (Jarymowycz & Stone, 2006; Kurakin, 2009).
1.4.2 Hierarchy of motions in time and space
Timescales and amplitudes. Motions show hierarchy in both time and space (Austin et al., 1975; Henzler
43

1 Introduction
Wildman et al., 2007a). Protein motions occur on timescales ranging from 1014 to 1012 s and covering amplitudes ranging from 0.01 Å to more than 100 Å and with energy variation of 0.1 to 100 kcal mol1 (Fig 20; Brooks III et al., 1988; Kurzyński, 1998; Karplus, 2000). Several types of motions can be distinguished according to timescale, amplitudes and impact on protein: vibrational motions and conformational motions; the latter includes local, spiderweb, rigidbody and global motions.
Fig 20 | Hierarchy of motions in time and space. (a) Timescales of various protein motions, (b) amplitudes of the protein motions. The boundaries for local, rigidbody and global motions are context dependent to some extent and thus cannot be strictly defined.
Vibrational motions. Vibrational motions range from 1014 s to 1011 s, i.e. from weakly damped localised NH and CH stretching modes to overdamped collective modes involving the whole protein domains (Kurzyński, 1998). This vibrational spectrum can be divided into two parts at 2 1013 s whose energy corresponds to temperature 300 K (Kurzyński, 1998). The highfrequency vibrational modes, from 1014 s to 2 1013 s, involve mainly the stretching and bending bonds (Kurzyński, 1998). The lowfrequency vibrational modes, from 2 1013 s to 1011 s, involve mainly the collective torsional motions in dihedral angles about the bonds (Kurzyński, 1998). Only the lowfrequency vibrational modes contribute to thermal properties, entropy and thermal heat, of proteins (Kurzyński, 1998). Vibrational dynamics is approximated by damped harmonic oscillations subjected to weaker or stronger stochastic perturbations (Kurzyński, 1998). This description is, however, oversimplified, because of anharmonicity of actual vibrations in the period range 1012 to 1011 s (Kurzyński, 1998).
Local motions. Local motions have amplitude of 0.01 to 5 Å, occur on timescale of 1014 to 101 s (McCammon & Karplus, 1980; Rueda et al., 2007; Skjaerven et al., 2009), and involve atomic fluctuations, sidechain motions (Kendrew, 1962), and loop motions (Brooks III et al., 1988). Unexpectedly, there is no correlation between amino acid sidechain rigidity and depth of burial, packing density and no inverse correlation between amino acid sidechain rigidity and solvent accessibility surface area (Igumenova et al., 2006). Hence, solvent exposed amino acid residues are not necessarily the most mobile or flexible (Igumenova et al., 2006). Additionally, there can be large difference between dynamics of mainchain and sidechain part of an amino acid residue in a protein (Lee et al., 2000; Igumenova et al., 2006). A special case of local motions are the socalled spiderweb motions, i.e. small interconnected local motions that occur over extensive distance (up to more than 100 Å) through smaller than 1 Å displacements of atoms (Koshland Jr., 1976; Koshland Jr., 1995; Koshland Jr., 1996; Yu & Koshland Jr., 2001).
Rigidbody motions. Rigidbody motions are rooted in protein backbone of loops and involve displacement of helix, and shear and hinge movements of domain and subunit in relation to another (Brooks III et al., 1988; Gerstein et al., 1994). These motions have larger amplitudes, on the order of 1 to 10 Å, and consequently occur on longer timescales, 109 to 1 s (Yu & Koshland Jr., 2001; Kay, 2005; Skjaerven et al., 2009).
Global motions. The largest changes are associated with global motions, e.g. helixcoil transition and folding/unfolding. These motions have amplitudes over 5 Å and occur on the longest timescale from 107 to 1012 s (Brooks III et al., 1988; Kurzyński, 1998; Karplus, 2000; Skjaerven et al., 2009). The upper limit of global motions, 1012 s, is an upper limit of waiting time for spontaneous unfolding of the protein in physiological conditions (Kurzyński, 1998). Interestingly, rate of many enzymatic reactions occurs at the rate in the middle of the protein dynamics timescale, i.e. 103 s (Kurzyński, 1998).
44

1 Introduction
Protein folding/unfolding dynamics. Although native protein must be stable enough to have a defined threedimensional fold it must be dynamic enough not only to be capable of performing biological role (HenzlerWildman et al., 2007a; HenzlerWildman et al., 2007b) but also to be capable of reaching the native fold. Individual amino acid residues in unfolded protein cluster in the helix, sheet and polyproline II regions of and dihedral angleα β φ ψ space and they flicker between these regions at rates ~ 1012 s1 at room temperature (Barron et al., 1997). Hence, these fast motions occur on the same picosecond timescale as rearrangements of the hydrogen bond network in bulk water (Ohmine & Tanaka, 1993) and are therefore coupled with them. Thus the rapid “flicker” motions are promoted by insertion of bulk water molecules via a repertoire of transient hydrated turn conformations (Barron et al., 1997). Folding process, functionally important as the last step during conversion of genetic information into biological function (Zeeb & Balbach, 2004), has the upper speed limit estimated to ~ 106 s based on the diffusioncontrolled rate of collision of sequentially distant segments of an unfolded protein (Hagen et al., 1996) which is assumed to determine the shortest time for the initial collapse to a compact structure (Barron et al., 1997; Deechongkit et al., 2006), or even 107 s (Chang et al., 2003). Mean waiting time of spontaneous unfolding in physiological conditions is 103 to 1012 s, depending on equilibrium populations of native and unfolded state; the higher the equilibrium population of native state over unfolded state, i.e. the more stable the native state is, the longer is the mean waiting time of spontaneous unfolding (Kurzyński, 1998). Thus, 1012 s is the upper limit of the relaxation spectrum of protein conformational transitions (Kurzyński, 1998). Protein folding is oppossed by a loss of conformational entropy that is further enhanced by correlated (also known as “coupled”) motions (Jarymowycz & Stone, 2006). It might be expected that evolutionary pressure selects for natural folded proteins with relatively few correlated motions (Jarymowycz & Stone, 2006).
Effect of temperature on protein dynamics. Internal protein motion is temperaturedependent and increases with increasing tempertature (Kurzyński, 1998; Jarymowycz & Stone, 2006). Protein specific motions, that allow the molecular engine to fulfill its function, occur only above the socalled dynamical transition temperature Tdt, also known as “Tc“ (Parak, 2003). Below Tdt, ~ 150 to ~ 200 K, certain protein motions essential to biological activity may cease completely (Bourgeois & Royant, 2005), functional action of the protein is not activated, and the molecule is in “standby” state (Parak, 2003). Dynamics below Tdt is characterised by density of phonon states, as in solids (Parak, 2003). The phonons act as a “thermal bath” supplying the energy for all processes of protein dynamics (Parak, 2003). Below Tdt, nearly all molecules are trapped in a rigid conformation; only phonon vibrations occur, and jump into the flexible conformation is very seldom (Parak et al., 2006). Above Tdt, protein molecule in flexible conformation performs diffusive motions of its segments, sidechains, diffusive motions of larger segments, e.g. haem group in myoglobin and diffusion motions of helical elements (Parak et al., 2006). These diffusive structural fluctuations are lubricant for structural changes that are essential for the biological role (Parak et al., 2006). Thus, proteins show rather complex dynamic behaviour (Parak et al., 2006; Rueda et al., 2007): (i) femtosecond to picosecond timescale fast vibrations provided by thermal phonon bath; and (ii) above Tdt, characteristic temperature diffusive modes, the socalled Brownian motions of groups, e.g. sidechains at timescale 1 to some 100 ps, and αhelices, and collective motions of larger segments at timescale from 0.1 ns to 100 ns or longer (Parak et al., 2006). As the temperature increases, an amino acid sidechain itself tends to explore a larger volume (Igumenova et al., 2006). However, the “dynamic volume” occupied by its neighbours also tends to increase as their excursions increase, sterically constraining the sidechain (Igumenova et al., 2006). Thus, neighbouring sidechain motions tend to be positively correlated by their steric interactions (Igumenova et al., 2006).
Link between timescale and function. It is assumed, that “functionally relevant motions” are those that involve conformational transitions and occur at a timescale of a protein function (Foster et al., 2007; HenzlerWildman et al., 2007a; HenzlerWildman et al., 2007b). Conformational transitions are purely stochastic activated processes, characterised by a spectrum of relaxation times of the number equal to the number of conformational states (~ 1010) (Kurzyński, 1998). In the physiological conditions, spectrum of relaxation times of conformational transitions begins at 1011 s and involves local sidechain rotations and hydrogen bond rearrangements on the protein surface, related to overcoming the energy barriers on the order of 10 kJ mol1 (Kurzyński, 1998). Microsecond to millisecond motions are the fastest motions for which direct link to protein function, originally proposed by Austin et al. (1975), has been established (WolfWatz et al., 2004; Bourgeois & Royant, 2005; Kay, 2005; Boehr et al., 2006; Foster et al., 2007; HenzlerWildman et al., 2007a; HenzlerWildman et al., 2007b). Moreover, recent studies on Cdc42Hs signal transduction protein (Loh et al., 2001) and PDZ domain (Fuentes et al., 2004) suggest that allosterically relevant motions may occur on subnanosecond timescale (Igumenova et al., 2006).
Link between different timescales. Very little is understood about the connection of such functionally relevant millisecond to microsecond movements with much faster (picosecond to nanosecond) local atomic fluctuations
45

1 Introduction
(Tousignant & Pelletier, 2004; Foster et al., 2007; HenzlerWildman et al., 2007b). Nonetheless, picosecond to nanosecond dynamics have been proposed to generally have functional importance for (i) kinetics of the conformational ensemble, i.e. rate of interconversion between different conformations, (ii) thermodynamics of the conformational ensemble, i.e. populations of the conformational states, (iii) conformational entropy, i.e. distribution of conformational states, and (iv) coupled (correlated) motions (McCammon & Karplus, 1977; Karplus McCammon, 1981; Schotte et al., 2003; Schotte et al., 2004; Jarymowycz & Stone, 2006; HenzlerWildman et al., 2007a; HenzlerWildman et al., 2007b). Thus, the term “functionally relevant motion” may, in fact, cover entire timescale of protein dynamics because fast motions with small amplitudes can function as a lubricant for motions that occur on longer timescales and amplitudes including those directly linked to protein function (McCammon & Karplus, 1977; Karplus McCammon, 1981; Bruice & Benkovic, 2000; Jarymowycz & Stone, 2006; Parak et al., 2006; HenzlerWildman et al., 2007a; HenzlerWildman et al., 2007b).
Protein dynamics complexity. The large timescale range, overlapping timescales for different types of motions, diversity of motions themselves, and dependence on protein structure hierarchy and temperature indicate immense complexity of protein dynamics which is still only poorly understood, as noted for myoglobin, the most popular model system to study protein dynamics (Genberg et al., 1991; Jackson et al., 1994; Srajer et al., 2001; Parak, 2003; Parak et al., 2006).
1.4.3 Conformational changes upon ligand binding
Protein dynamics upon ligand binding. Proteins are dynamic themselves (Koshland Jr., 1976; Koshland Jr., 1996), i.e. in the absence of a ligand, i.e. in the native folded state. Proteinligand association then often results in change in distribution of conformational states of the protein (Fig 21; Kurakin, 2009). Hence, proteins do not have a structure rigid enough to form a lock (Ma et al., 2000; Jarymowycz & Stone, 2006). Discovery of the importance of protein dynamics upon ligand binding has led to modification of Fischer's keylock model of rigidbody proteinligand association to conformational selection (Karush, 1950; Sullivan & Holyoak, 2008) and inducedfit (Koshland Jr., 1958; Koshland Jr., 1976) models.
Conformational selection. Proteinligand interactions may stabilise the bestfitting member from an ensemble of conformations in equilibrium (Karush, 1950; Sullivan & Holyoak, 2008). Thus, protein samples active conformation on its own even in the unliganded state. Upon ligand binding, however, the population of the active conformation in the ensemble of conformations in equilibrium increases compared to unliganded state (Fig 21; Kurakin, 2009). This mechanism is of general importance for almost every protein because the highest populated conformations of a free protein are not necessarily the most populated conformations in the proteinligand complex; in fact, it is seldom the case (Carlson, 2002; Teague, 2003; Sousa et al., 2006).
Fig 21 | Reshaping of protein conformational landscape upon ligand binding. Ligand binding to a protein often leads to redistribution of protein conformations and altered rates of their interconversions. In the example given, ligand binding causes change in the prevalent protein conformation in the ensemble from A to B. Such redistribution can be caused also by other changes in the internal state of the protein, e.g. by mutation or chemical modification, or by changes in external conditions, e.g. by pH, pressure, temperature and ionic strength. Redrawn according to Kurakin (2009),
46

1 Introduction
Inducedfit binding. Inducedfit theory of Koshland Jr. states that dynamic fit between protein and ligand is achieved only upon ligand binding whereas free protein is not able to reach the active conformation on its own (Koshland Jr., 1976). Additionally, a protein that has occluded binding site and that shows the ability to form encounter complex with the ligands, e.g. lidgated active site of some lipases, or secondary, tertiary etc. binding sites, also known as “docking sites”, e.g. in myoglobin, must operate by an induced fit mechanism instead of conformational selection (Sullivan & Holyoak, 2008). This means, that not only ligandinduced conformational changes of a protein for proper alignment of binding or, in the case of an enzyme, catalytic amino acid residues, but also ligandinduced conformational changes of a protein for making the binding site (in)accessible to the ligand, are consistent with the inducedfit mechanism (Sullivan & Holyoak, 2008). An induced fit event must be essentially followed/accompanied by the conformational selection event thus the two mechanisms of ligand binding complement rather than contradict each other (Sullivan & Holyoak, 2008).
Scenarios of inducedfit binding. The induced fit can be considered also inversely, i.e. that protein changes ligand dynamics or mutually, i.e. both protein and ligand change conformations upon association (May & Zacharias, 2005). Therefore, generalised inducedfit model has three possible scenarios for proteinligand binding (Jarymowycz & Stone, 2006): (i) one component is template for structural rearrangement of the second component (Jarymowycz & Stone, 2006); (ii) each binding partner becomes substantially rigid during association, i.e. mutual inducedfit (Jarymowycz & Stone, 2006); (iii) ligand binding increases flexibility in the binding site, e.g. when an ordered water molecule is replaced by a hydrophobic ligand, or the increase in flexibility is widespread, or the increase in flexibility occurs in regions distant from the active site via longrange effects (Jarymowycz & Stone, 2006).
Ligandinduced motion types. Ligandinduced changes in proteins involve (i) local motions (Jarymowycz & Stone, 2006), (ii) hinge domain motions (Gerstein et al., 1994), (iii) shear domain motions (Gerstein et al., 1994) and (iv) spiderweb motions (Koshland Jr., 1995; Yu & Koshland Jr., 2001). Different ligands can induce different protein motions (Prasad & Mitra, 2002).
Longrange dynamic effects. Dynamic communication across protein upon ligand binding can be achieved by longrange dynamic effects via three mechanisms (Jarymowycz & Stone, 2006): (i) perturbation induces conformational change of a protein including remote region (Jarymowycz & Stone, 2006); (ii) perturbation induces conformational change of amino acid residues located at and/or near the site of perturbation thus leading to modification of the strength of their interactions with amino acid residues located between the perturbation site and remote amino acid residues (Jarymowycz & Stone, 2006); there may be several alternative pathways connceting the binding site to the remote site via alternative intervening amino acid residues (Jarymowycz & Stone, 2006); (iii) perturbation does not induce any change in the average structure of the protein but instead affects the dynamics of amino acid residues both at the perturbation site and at the remote site (Jarymowycz & Stone, 2006). For many proteins, such functionally relevant transmission of information occurs in the absence of large structural rearrangement which suggests important role for fast (subnanosecond) sidechain motions (Loh et al., 2001; Fuentes et al., 2004; Igumenova et al., 2006).
Role of correlated (coupled) motions in ligand binding. The negative pressure associated with entropy reduction upon inducedfit proteinligand binding can be overrided by correlated motions (Jarymowycz & Stone, 2006). Correlated motions provide thermodynamic driving force in favour of ligand binding via disrruption of dynamical coupling network upon ligand binding during which some amino acid residues become “immobilised” but other amino acid residues are released from the coupling network and undergo increased motions and thus contribute favourably to entropy of binding (Jarymowycz & Stone, 2006). These changes in coupling network can cancel or even outweigh entropic penalty of inducedfit binding (Jarymowycz & Stone, 2006).
Role of ligandinduced changes. Inducedfit is considered to be the crucial mechanism that controls seclussion (Koshland Jr., 1976; Jarymowycz & Stone, 2006), involves positive and negative cooperativity (Koshland Jr., 1976) and thus feedback and feedforward mechanism of signal amplification and signal sensitivity (Koshland Jr., 1998).
Positive and negative cooperativity. Cooperativity, i.e. allosteric effects and signal transduction between protein subunits, is achieved by motions that propagate over substantial distance (Demchenko, 2001; Koshland Jr. & Hamadani, 2002). The conformational changes induced by a ligand create subunit interactions that have either favourable (positive cooperativity) or unfavourable (negative cooperativity) effects on the binding of subsequent ligands. Big conformational change does not necessarily imply cooperativity as is the case of no cooperativity in aldolase and lactic dehydrogenase, e.g. (Koshland Jr. & Hamadani, 2002). Some enzymes show positive cooperativity with one ligand and negative cooperativity with another ligand, and some enzymes show both positive and negative cooperativity with a single ligand during the sequential binding of that ligand (Koshland Jr. & Hamadani, 2002).
47

1 Introduction
Cooperativity and evolution. Occurrence of positive and negative cooperativity in nature is probably equal (Koshland Jr. & Hamadani, 2002). Cooperativity can change by single amino acid residue substitution (i) from no cooperativity to positive cooperativity, e.g. in pyruvate kinase (Ikeda et al., 1997), (ii) from positive to negative cooperativity, e.g. in aspartate receptor (Kolodziej et al., 1996), and (iii) from negative to no cooperativity, e.g. in aspartate receptor (Yu & Koshland Jr., 2001). These examples demonstrate delicate balance between cooperativity effects and ease of change of cooperativity during evolution (Koshland Jr. & Hamadani, 2002), and link between protein dynamics and protein function in the course of evolution (Kurakin, 2009).
Amplitudes of ligandinduced motions. It has long been disputed about “how big must the motions be to have functional importance?” and the question is still relevant (Koshland Jr., 1995; Koshland Jr., 1996; Koshland Jr., 1998). In general, any motion that is functionally important is big enough (Koshland Jr., 1995; Koshland Jr., 1996; Koshland Jr., 1998). Both big and small movement can be important (Koshland Jr., 1995; Koshland Jr., 1996; Koshland Jr., 1998). The smaller the structural change required for the function or correlated with the function the better because the lower thermodynamic energy is required and therefore it is more likely to be easy kinetically (Yu & Koshland Jr., 2001). Hence some proteins, e.g. aspartate receptor, exploit dynamics with amplitude as small as ~ 0.5 Å for performing the function (Yu & Koshland Jr., 2001). Consequences of small conformational changes are profound because they are responsible for the enormous amplification of stimulus to response which is essential in living organisms (Koshland Jr., 1998).
Role of water for protein dynamics. Water is the universal solvent medium of cells (Helms, 2007). Water surrounds proteins, water is integral part of proteins and can be involved in key mechanistic steps (Helms, 2007). Water can be considered as a special kind of a ligand. Protein dynamics is thus tightly connected to the dynamics of surrounding and internal water solvent with implication for protein function (Jimenez et al., 1994; Nandi et al., 2000; Daniel et al., 2003; Pal & Zewail, 2004; Halder et al., 2007; Helms, 2007; Murugan & Agren, 2009). Water has the ability to promote conformational changes in helices and sheets (α β Sundaralingam & Sekharudu, 1989). Solvent fluctuations dominate some part of protein dynamics and may even control function of a protein because the fluctuation of the water molecules provide the enthalpy needed by the protein, e.g. myoglobin (Parak, 2003), to go from the “rigid” to the “flexible” state (Parak, 2003). The protein, together with its hydration shell, determines the entropy which controls the motions in the flexible state, and is thus responsible for opening and closing of channels connecting buried binding site to protein surface (Parak, 2003).
1.4.4 Role of dynamics in enzyme catalysis
Tradeoff between conformational stability and conformational changes. Enzyme activity requires a precise balance between conformational stability and conformational changes because enzymes must be stable enough to retain their native threedimensional folds, and dynamic enough to allow sufficient substrate binding, chemical reaction and product release (HenzlerWildman et al., 2007b; Strasser & Wittmann, 2007). Hence, there exists an intimate relation between overall native enzyme fold, its conformational diversity (in timescale, amplitude and type of motion) and its enzymatic function (Wolfenden, 1974; Karplus McCammon, 1983; Miller & Benkovic, 1998; Davis & Agard, 1998; Kitao & Go, 1999; Kohen et al., 1999; Mine et al., 1999; Berendsen & Hayward, 2000; Radkiewicz & Brooks III, 2000; Eisenmesser et al., 2002; Eisenmesser et al., 2005; Daniel et al., 2003; GarciaViloca et al., 2004; Teeter, 2004; Tousignant & Pelletier, 2004; Busenlehner & Armstrong, 2005; Otyepka et al., 2008).
Substrateinduced conformational changes. All enzymes essentially undergo conformational changes induced by substrate binding (Koshland Jr., 1995), because enzymes are present in environment of many biochemical pathways involving substrate analogs and they need to prevent side reactions with the analogs (Koshland Jr., 1995). Enzymes that show the least conformational changes are hydrolases (e.g. proteases and nucleases) because they do not need to exclude water (Koshland Jr., 1995). Any enzymatic reaction requires motion of some sort because (i) substrates need to be admitted and bound, (ii) cofactors need to be brought to contact, (iii) active site needs to be shielded against the adverse effects of the surrounding aqueous solvent, (iv) protein needs to adjust itself to accommodate the changing stereochemistry along the reaction pathway, and (v) products need to be expelled (Schmidt & Lamzin, 2007). For example, by active site loop amino acid residues repositioning, integral membrane protein PagP interconverts between highly dynamic state allowing substrate entry and more rigid state that supports catalysis (Kay, 2005; Foster et al., 2007).
Promoting and dynamical motions in enzyme catalysis. Two types of motions can be distinguished according to their relevance for enzymatic function: promoting motions and dynamical motions (Tousignant & Pelletier, 2004).
48

1 Introduction
Promoting motions are conformational changes that occur on timescale of overall reaction along the reaction coordinate and modify height of activation free energy barrier (GarciaViloca et al., 2004; Tousignant & Pelletier, 2004). Dynamical motions occur on femtosecond timescale and these specifically influence transmission coefficient (Tousignant & Pelletier, 2004). Thus, motions influence both lowering free energy barrier of transition state and generalised transmission coefficient that includes tunneling, nonequilibrium effects and transition state recrossing (GarciaViloca et al., 2004). Promoting motions should have in general higher impact on enzyme catalysis because they influence transition state theory constant which affects reaction rate exponentially whereas dynamical motions should have in general lower impact on enzyme catalysis because they influence generalised transmission coefficient which affects reaction rate only as a prefactor (HammesSchiffer, 2002).
Preorganisation of active site. Promoting motions involve conformational changes. Random sampling of all possible folded configurations would, however, degrade catalytic efficiency, a situation analogous to protein folding (HenzlerWildman et al., 2007a). Thus there are defined conformational changes that preorganise active site amino acid residues in the configuration needed to facilitate the reaction (Bruice, 2006; HammesSchiffer & Benkovic, 2006; Nagel & Klinman, 2006; HenzlerWildman et al., 2007a). It has been proposed by Bruice & Benkovic (2000), that in some cases, intrinsic turnover rate of enzyme, kcat, is related to frequency (probability) with which enzyme populates conformations competent to catalyse reactions, the socalled near attack configurations, NACs (Bruice & Benkovic, 2000). The NAC concept could be superfluous because it comprises enzymeinduced conformational changes in substrate and/or substrateinduced conformational changes in enzyme, the phenomena that can be explained by conformational selection and/or inducedfit mechanisms (Jarymowycz & Stone, 2006). Effeciency of formation of active (competent) enzymesubstrate complex may be further enhanced by correlated motions (Jarymowycz & Stone, 2006). If active site groups move independently then probability of active enzymesubstrate (ES) complex formation is a product of individual group probabilities, whereas if active site groups are appropriately motionally coupled then active ES complex formation probability is not product of individual functional group probabilities but higher and if active ES complex formation is the limiting event of the reaction cycle then it results in more efficient catalysis (Jarymowycz & Stone, 2006).
Correlated motions and generalised transmission coefficient. Correlated motions also have possible functional role in quantum tunneling, exploited in enzymatic reactions involving electron and proton transfer (Jarymowycz & Stone, 2006). Tunneling is extremely sensitive to distance between original and final positions of the tunneling particle and therefore molecular motions that modulate the distance influence tunneling rates and mechanism (Jarymowycz & Stone, 2006). Correlated motions are, for example, required for completion of reaction cycle of dihydrofolate reductase (Brooks III et al., 2003).
Location of important motions in enzymes. Both motions in and around the active site and transition state of enzymatic reaction, and motions distant from the active site might be important for enzyme function (Ma et al., 2000; Gao, 2003; Tousignant & Pelletier, 2004). In some cases, transition state ensemble may be homogeneous around the active site, i.e. with rather a small influence on the substrate binding affinity, and heterogeneous and contributing to the reaction in terms of activation entropy, away from the active site, e.g. in 5monophosphate decarboxylase (Ma et al., 2000; Gao, 2003). Motions of certain noncatalytic amino acid residues may help defining preorganisation of enzyme active site and transition state stabilisation (Tousignant & Pelletier, 2004), e.g. in dihydrofolate reductase (Agarwal et al., 2002; Rajagopalan et al., 2002; Rod et al., 2003; Watney et al., 2003), triosephosphate isomerase (Lolis & Petsko, 1990; Derreumaux & Schlick, 1998; Rozovsky & McDermott, 2001), horse liver alcohol dehydrogenase (HammesSchiffer, 2002), and Escherichia coli TEM1 lactamaseβ (Meroueh et al., 2002). Therefore, functional protein dynamics may not be always restricted to the active site and catalytic amino acid residues (Ma et al., 2000).
Advantage of conformational changes in enzyme function. In summary, enzyme dynamics, not accounted for by the keylock model (Koshland Jr., 1976), is responsible for the following phenomena (Koshland Jr., 1976): (i) similar structures to substrate bind but are unable to induce catalysis in reactions that are controlled not by steric exclusion but by failure to react, the socalled kinetic specificity (Koshland Jr., 1976); (ii) if a highly reactive intermediate is formed during enzymatic reaction it is desirable that the intermediate exists only transiently to avoid wasteful sidereactions; the transient existence can be achieved by the socalled ordered (also known as “sequential”) binding (Koshland Jr., 1976); (iii) binding of a noncompetitive inhibitor does not affect substrate binding but affects enzyme action because the noncompetitive inhibitor binds at second site and induces a conformation which disorganises catalytic groups of enzyme without affecting binding groups (Koshland Jr., 1976); (iv) substrate analogs that are not large enough to induce proper alignment of catalytic groups of enzyme can become substrate if they are supplemented by nonreacting molecule containing the missing part of structure (Koshland Jr., 1976); (v) if protein is composed of two or more subunits then conformational change of one subunit affects neighbouring subunits,
49
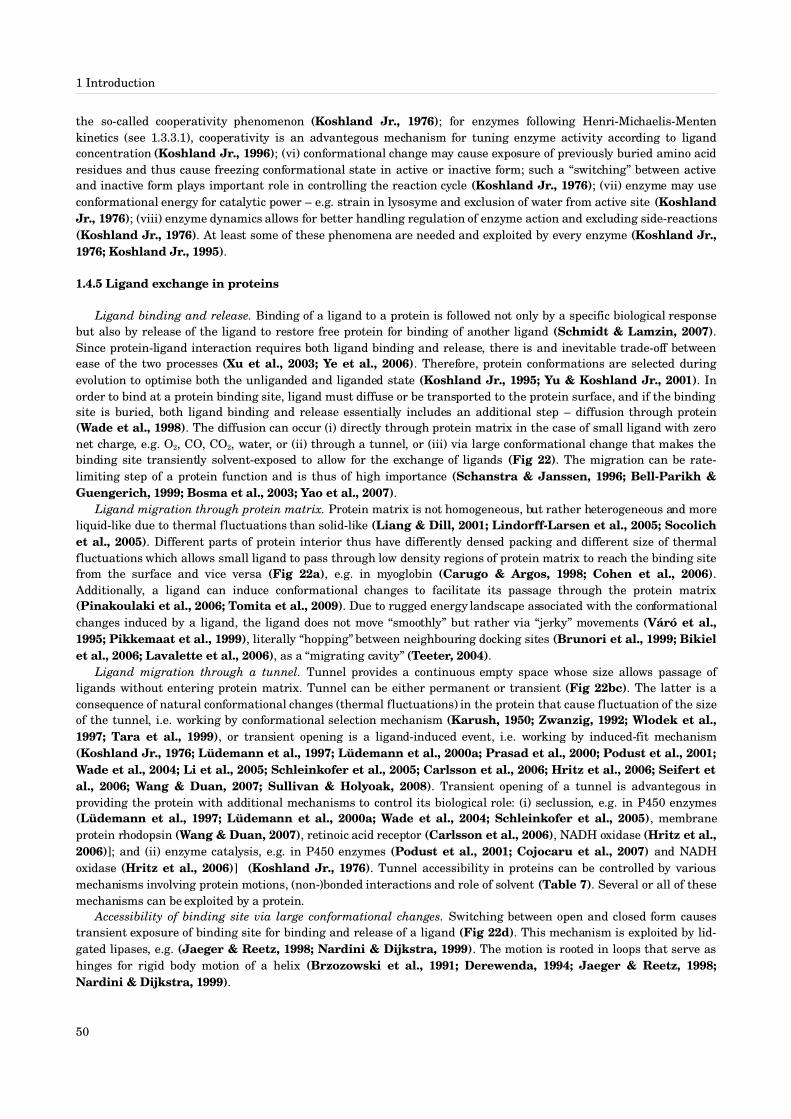
1 Introduction
the socalled cooperativity phenomenon (Koshland Jr., 1976); for enzymes following HenriMichaelisMenten kinetics (see 1.3.3.1), cooperativity is an advantegous mechanism for tuning enzyme activity according to ligand concentration (Koshland Jr., 1996); (vi) conformational change may cause exposure of previously buried amino acid residues and thus cause freezing conformational state in active or inactive form; such a “switching” between active and inactive form plays important role in controlling the reaction cycle (Koshland Jr., 1976); (vii) enzyme may use conformational energy for catalytic power – e.g. strain in lysosyme and exclusion of water from active site (Koshland Jr., 1976); (viii) enzyme dynamics allows for better handling regulation of enzyme action and excluding sidereactions (Koshland Jr., 1976). At least some of these phenomena are needed and exploited by every enzyme (Koshland Jr., 1976; Koshland Jr., 1995).
1.4.5 Ligand exchange in proteins
Ligand binding and release. Binding of a ligand to a protein is followed not only by a specific biological response but also by release of the ligand to restore free protein for binding of another ligand (Schmidt & Lamzin, 2007). Since proteinligand interaction requires both ligand binding and release, there is and inevitable tradeoff between ease of the two processes (Xu et al., 2003; Ye et al., 2006). Therefore, protein conformations are selected during evolution to optimise both the unliganded and liganded state (Koshland Jr., 1995; Yu & Koshland Jr., 2001). In order to bind at a protein binding site, ligand must diffuse or be transported to the protein surface, and if the binding site is buried, both ligand binding and release essentially includes an additional step – diffusion through protein (Wade et al., 1998). The diffusion can occur (i) directly through protein matrix in the case of small ligand with zero net charge, e.g. O2, CO, CO2, water, or (ii) through a tunnel, or (iii) via large conformational change that makes the binding site transiently solventexposed to allow for the exchange of ligands (Fig 22). The migration can be ratelimiting step of a protein function and is thus of high importance (Schanstra & Janssen, 1996; BellParikh & Guengerich, 1999; Bosma et al., 2003; Yao et al., 2007).
Ligand migration through protein matrix. Protein matrix is not homogeneous, but rather heterogeneous and more liquidlike due to thermal fluctuations than solidlike (Liang & Dill, 2001; LindorffLarsen et al., 2005; Socolich et al., 2005). Different parts of protein interior thus have differently densed packing and different size of thermal fluctuations which allows small ligand to pass through low density regions of protein matrix to reach the binding site from the surface and vice versa (Fig 22a), e.g. in myoglobin (Carugo & Argos, 1998; Cohen et al., 2006). Additionally, a ligand can induce conformational changes to facilitate its passage through the protein matrix (Pinakoulaki et al., 2006; Tomita et al., 2009). Due to rugged energy landscape associated with the conformational changes induced by a ligand, the ligand does not move “smoothly” but rather via “jerky” movements (Váró et al., 1995; Pikkemaat et al., 1999), literally “hopping” between neighbouring docking sites (Brunori et al., 1999; Bikiel et al., 2006; Lavalette et al., 2006), as a “migrating cavity” (Teeter, 2004).
Ligand migration through a tunnel. Tunnel provides a continuous empty space whose size allows passage of ligands without entering protein matrix. Tunnel can be either permanent or transient (Fig 22bc). The latter is a consequence of natural conformational changes (thermal fluctuations) in the protein that cause fluctuation of the size of the tunnel, i.e. working by conformational selection mechanism (Karush, 1950; Zwanzig, 1992; Wlodek et al., 1997; Tara et al., 1999), or transient opening is a ligandinduced event, i.e. working by inducedfit mechanism (Koshland Jr., 1976; Lüdemann et al., 1997; Lüdemann et al., 2000a; Prasad et al., 2000; Podust et al., 2001; Wade et al., 2004; Li et al., 2005; Schleinkofer et al., 2005; Carlsson et al., 2006; Hritz et al., 2006; Seifert et al., 2006; Wang & Duan, 2007; Sullivan & Holyoak, 2008). Transient opening of a tunnel is advantegous in providing the protein with additional mechanisms to control its biological role: (i) seclussion, e.g. in P450 enzymes (Lüdemann et al., 1997; Lüdemann et al., 2000a; Wade et al., 2004; Schleinkofer et al., 2005), membrane protein rhodopsin (Wang & Duan, 2007), retinoic acid receptor (Carlsson et al., 2006), NADH oxidase (Hritz et al., 2006)]; and (ii) enzyme catalysis, e.g. in P450 enzymes (Podust et al., 2001; Cojocaru et al., 2007) and NADH oxidase (Hritz et al., 2006)] (Koshland Jr., 1976). Tunnel accessibility in proteins can be controlled by various mechanisms involving protein motions, (non)bonded interactions and role of solvent (Table 7). Several or all of these mechanisms can be exploited by a protein.
Accessibility of binding site via large conformational changes. Switching between open and closed form causes transient exposure of binding site for binding and release of a ligand (Fig 22d). This mechanism is exploited by lidgated lipases, e.g. (Jaeger & Reetz, 1998; Nardini & Dijkstra, 1999). The motion is rooted in loops that serve as hinges for rigid body motion of a helix (Brzozowski et al., 1991; Derewenda, 1994; Jaeger & Reetz, 1998; Nardini & Dijkstra, 1999).
50

1 Introduction
Fig 22 | Ligand migration between buried cavity and surface of a protein. (a) Migration through protein matrix, (b) migration through permanent tunnel, (c) migration through transient tunnel, (d) migration upon transient lid opening. Protein, grey/black; empty space, white; ligand, red. Portions of a protein shaded by light grey indicate lower packing density of a protein matrix and a lid in ac and d, respectively. Redistribution of protein matrix packing densities is indicated by black in c.
Alternative tunnels and protein matrix pathways. The tradeoff between ease of ligand binding and release is solved by some proteins by providing alternative tunnels, e.g. in P450 enzymes (Lüdemann et al., 2000a; Lüdemann et al., 2000b; Wade et al., 2004), acetylcholinesterase (Tara et al., 1999; Van Belle et al., 2000), or by alternative protein matrix pathways, e.g. in myoglobin (Scott et al., 2001; Cohen et al., 2006). Different tunnels and pathways can be specific to different ligands due to differential interaction with tunnel or pathway amino acid residues (Tara et al., 1999; Van Belle et al., 2000; Lüdemann et al., 2000a; Podust et al., 2001; Wade et al., 2004) thus allowing synchronisation of ligand/substrate binding and ligand/product release (Wombacher et al., 2006), e.g. in P450 enzymes (Oprea et al., 1997; Podust et al., 2001; Wade et al., 2004; Cojocaru et al., 2007; Yao et al., 2007), in catalase HPII (Sevinc et al., 1999), and acetylcholinesterase (Kovach et al., 1994). Alternative tunnels may have direct impact on enzymatic reaction because depending on which tunnel is used by a substrate, different enantiomeric products can be generated (Wombacher et al., 2006). Alternative tunnels and pathways may be also coupled with cellular localisation. For example, membrane P450 enzymes may bind a hydrophobic ligand from the membrane space via one tunnel, and expell more hydrophilic product into the cytoplasm via another tunnel (Schleinkofer et al., 2005; Cojocaru et al., 2007). Since enzymatic reactions are coupled in the metabolic network, the products of one enzymatic reactions may be substrates for another enzymatic reaction. In order to shorten delay between release of the product of the first reaction into cytoplasm and diffusion and encounter and binding of the product as a substrate into another enzyme for the second reaction, some enzymes can be associated in such a way, that the product of the first reaction moves via a tunnel into the second enzyme without entering the bulk solvent, a phenomenon referred to as “substrate channeling”, observed, e.g., in P450 enzymes (Cojocaru et al., 2007) and dihydrofolate reductasethymidylate synthase pair (Elcock et al., 1997).
51

1 Introduction
Table 7 | Mechanisms of controlling tunnel accessibility.Mechanism ProteinLoop (gating) motion triosephosphate isomerase (Wade et al., 1993)
P450 enzymes (Wade et al., 2004; Schleinkofer et al., 2005; Li et al., 2005; Seifert et al., 2006; Cojocaru et al., 2007)acetylcholinesterase (Kovach et al., 1994; Xu et al., 2003)
Rigidbody motion P450 enzymes (Wade et al., 2004; Yao et al., 2007)c
gpH1receptor (Strasser & Wittmann, 2007)Secondary structure element fluctuationa P450 enzymes (Lüdemann et al., 2000b; Prasad et al., 2000; Podust et al.,
2001; Li et al., 2005)acetylcholinesterase (Tara et al., 1999)gpH1receptor (Strasser & Wittmann, 2007)
Aromatic gatingb P450 enzymes (Lüdemann et al., 2000a; Lüdemann et al., 2000b; Winn et al., 2002; Li et al., 2005)acetylcholinesterase (Ripoll et al., 1993; Enyedy et al., 1998; Zhou et al., 1998; Tara et al., 1999; Van Belle et al., 2000; Xu et al., 2003)NADH oxidase (Hritz et al., 2006)horseradish peroxidase (Khajehpour et al., 2003; Zelent et al., 2004)
Saltbridge interaction P450 enzymes (Deprez et al., 1994; Di Primo et al., 1997; Lounnas & Wade, 1997; Oprea et al., 1997; Lüdemann et al., 2000a; Winn et al., 2002; Yao et al., 2007)acetylcholinesterase (Kovach et al., 1994; Enyedy et al., 1998)catalase HPII (Sevinc et al., 1999)
Disulphidebridge interaction rhodopsin (Lüdemann et al., 2000a; Wang & Duan, 2007)Hydrogen bonding interaction P450 enzymes (Li et al., 2005; Schleinkofer et al., 2005)
acetylcholinesterase (Kovach et al., 1994)Solvation P450 enzymes (Dunn et al., 2001)
acetylcholinesterase (Henchman et al., 2002)aStability, extension, shortening, bending, or breakage of a secondary structure element, mostly helix.bConformational change of aromatic amino acid residue sidechain.cHelix displacement.
Dynamics of internal water molecules. Water is not only the solvent that surrounds the protein but it also enters the protein via protein matrix or a tunnel. Internal water molecules may help stabilising regions of unsatisfied backbone hydrogen bonding (Chau, 2004; Damjanović et al., 2005). Although buried binding sites are selected by evolution to favour binding of a hydrophobic ligand and disfavour binding of hydrophilic ligand including water, biological role of the protein often necessitates presence of some polar or even charged groups in the binding site (Kendrew, 1962) that can attract bulk water molecules. Thus, ligand binding into buried binding site can be hindered by tightly bound water molecules and these must be displaced to allow ligand binding (Koshland Jr., 1976). On the other hand, release of the ligand might be facilitated by water and some enzymes (hydrolases) use water as a cosubstrate. Hence, there must be a delicate balance between selectivity of the binding site for ligand and accessibility of the binding site for water. This balance can be controlled by the above mentioned transient opening of tunnels, switching between open and closed forms by large conformational changes, and by providing an alternative tunnel for water escape while ligand enters the protein via another tunnel (Oprea et al., 1997; Tara et al., 1999; Xu et al., 2003).
1.5 Protein research
1.5.1 Basic principles of scientific research
Scientific discovery. According to Koshland Jr.'s ChaChaCha theory (2007), there are three categories of scientific discoveries: (i) charge, i.e. seeing what everyone else has seen and thinking what no one else has thought before; (ii) challenge, i.e. responding to accumulation of facts or concepts and anomalies unexplained by or incongruous with scientific theories of the time; and (iii) chance, i.e. seeing what no one else has seen and being able to realise its importance. In general, scientists should be nonconformists because nonconformism is essential for progress in science (Woese, 2001; Koshland Jr., 2004; Trevors & Abel, 2004). At the same time, however, the nonconformism should be restrained to prevent anarchy (Koshland Jr., 2004). The restraint should be performed at two
52

1 Introduction
levels: (i) by selfcriticism of scientists themselves (Popper, 1959); and (ii) by peerreviewed journals and grant agencies (Koshland Jr., 2004).
Knowledge. Scientific discoveries lead to progress in our understanding of the scientific problems. Up to date body of information obtained by scientific discoveries constitutes a knowledge, which can be represented by a model, a hypothesis or a theory (Koshland Jr., 1995). Importantly, facts are not enriched by the model but the model is enriched, and made more complex, by the facts (Woese, 2001). To be useful, scientific model should lead to predictions (Jeffares et al., 1998) and should suggest how to test its validity (Jones, 2003; Trevors & Abel, 2004). However, the fact that an experimental result is not inconsistent with a theory does not necessarily speaks to the theory's predictivity or to its validity (Woese, 2001). Thus, to be meaningful, predictions need to be specific in a way that the theory can stand or fall with the experimental result (Woese, 2001). Whether the experiments prove validity of the model or prove invalidity of the model, is equally worth. When the bulk of information accummulates that refutates validity of a model, then a new model should be established, while purging past prejudices (Koshland Jr., 1995; Woese, 2001).
Scientific goal. There are two possible goals of any scientific research: (i) to get primary knowledge about the studied problem, i.e. basic research, or (ii) to explore how to exploit already acquired knowledge for human benefit, i.e. applied research. Today science is being under tremendous formative pressure from the society, at large from medicalindustrial complex in particular, to become a discipline of applications, to merely be society's handmaiden (Woese, 2001).
1.5.2 Protein research strategy
Key steps in protein research. There are several key issues in protein research (Jones, 2003): (i) choice of a problem to solve, or model to test and gathering all relevant information that pertain to the problem; (ii) choice of an organism; (iii) choice of a protein; (iv) choice of methods; (v) setup of the methods; (vi) running the methods; (vii) analysis of results; (viii) interpretation of the analysed results; (ix) confrontation of the interpretation with current knowledge about the problem; (x) sharing conclusions with scientific community and when aproved then also sharing the findings with public community. Steps iiii may go in any order depending on what is the focus field – a protein, an organism, or a model.
Experiments and computations. According to methods used, two approaches can be distinguished – experiments and computations, the latter comprising the use of molecular modelling and/or bioinformatics methods. Experiments and computationss do not contradict, but rather complement each other (Wlodawer et al., 2008). Moreover, these two approaches are more and more dependent on each other in protein research. Nowadays, every experiment in protein research depends at some extent on computations, and vice versa (Halperin et al., 2002; Altieri & Byrd, 2004; Billeter et al., 2008; Wlodawer et al., 2008; Güntert, 2009). Experiments and computations are so much intertwinned in protein research that their seperation is somewhat artificial (Halperin et al., 2002; Altieri & Byrd, 2004; Billeter et al., 2008; Wlodawer et al., 2008; Güntert, 2009). Although, at the end, it is the experiment that must test model derived by experiments and/or computations, not the other way around (Pross, 2004). In some sense, even computation can be regarded as a kind of an experiment (Kurzyński, 1998). Anyway, both the approaches are equally invaluable in protein research. Disappreciating any of the them means halfclosing the gate on the path towards full understanding of proteins.
Protein research points of view. The full understanding of proteins requires simultaneous study of their structure, dynamics and function. Moreover, these three protein properties must be essentially considered from evolutionary point of view, because nothing in biology makes sense except in the light of evolution (Dobzhansky, 1964; Koshland Jr., 1976; Woese, 2001). Various methods have been developed and established as reliable tools for probing protein structure, dynamics and function (see 1.5.3). Due to tight relationship between hierarchies of protein structure, hierarchies of protein dynamics and complexity of their effects on protein function, one method may bring information on various aspects of structuredynamicsfunction relationships of a protein, and oppositely, several methods complement in providing valuable information on a specific property of a protein. Thus, the most comprehensive understanding of the studied protein can be obtained only by combination of various methods.
1.5.3 Basic tasks in protein research
1.5.3.1 Determination and prediction of protein structure
Determination of primary protein structure. Identification of amino acid residues at every position in the protein
53

1 Introduction
primary structure is an indispensable step in protein research aimed at understanding structuredynamicsfunction relationships from evolutionary point of view. As the relationship between gene sequence and primary protein structure is defined by the genetic code, knowing the gene sequence means knowing primary protein structure. Consequently, there are two possible approaches in determination of primary protein structure: (i) direct determination of protein primary structure, i.e. protein sequencing, that can be performed using mass spectrometry (MS) or Edman degradation (Edman, 1949; Edman, 1950); and (ii) determination of primary protein structure indirectly by determination of the nucleotide sequence of the corresponding gene, i.e. gene sequencing. Protein sequencing is nowadays used for peptide sequencing and for quick assessment of protein similarities by identification of few tens of amino acid residues at Nterminus of proteins. Gene sequencing is nowadays a routine approach to determine sequence of genes. There are three approaches in gene sequencing – (i) chemical sequencing developed by Gilbert & Maxam (1977), (ii) plusminus sequencing developed by Sanger and coworkers (Sanger et al., 1977a; Sanger, 1980); and (iii) dideoxynucleoside termination sequencing developed by Sanger et al. (1977b). Dideoxynucleoside termination sequencing replaced plusminus sequencing and chemical sequncing for higher precision and speed (Sanger et al., 1978), and for lower consumption of chemicals and lower toxicity, respectively. Newly determined nucleotide sequences should be deposited in publicly available databases – GenBank (Benson et al., 2005; http://www.ncbi.nlm.nih.gov/Genbank/), EMBL nucleotide sequence database (Cochrane et al., 2009; http://www.ebi.ac.uk/embl/) or DNA Ddata Bank of Japan (DDBJ; http://www.ddbj.nig.ac.jp/). Data are being shared among these three databases through International Nucleotide Sequence Database Collaboration (INSDC; http://www.insdc.org/).
Determination of secondary protein structure. Some regions of protein sequence fold into secondary structure elements, helices and strands, whereas others form connections between them. Since limited repertoir of secondaryβ structure elements and their arrangement in space (Chothia, 1992; Vitkup et al., 2001), knowing whether the protein contains amino acid residues in helical and/or extended conformation, how many and where, narrows the space of possible tertiary protein structure folds for the given protein sequence. Qualitative and quantitative information about secondary protein structure can be obtained by means of farUV (180260 nm) circular dichroism (CD) spectroscopy (Kelly et al., 2005). Distinguishing different helical conformations ( , 3α 10 and ) can be achievedπ by UV resonance RAMAN (UVRR) spectroscopy (Mikhonin & Asher, 2006). The same quantitative information as provided by CD and UVRR spectroscopic approaches, further enriched by assignment of individual amino acid residues to secondary structure elements, can be obtained from protein backbone chemical shifts (Spera & Bax, 1991; Wishart & Sykes, 1994; Kuszewski et al., 1995; Cornilescu et al., 1999; Wang & Jardetzky, 2002) and vicinal scalar couplings (Karplus, 1959; Karplus, 1963) determined using nuclear magnetic resonance (NMR) spectroscopy (Teng, 2005). While NMR chemical shifts and vicinal scalar coupling can be used directly to determine secondary protein structure, protein crystallography techniques need first to be applied to determine tertiary structure of an entire protein whose geometry can only then be analysed to identify secondary protein structure elements (Wlodawer et al., 2008). Several methods are available for such purpose (Martin et al., 2005), e.g. DSSP (Kabsch & Sander, 1983), KAKSI (Martin et al., 2005), STRIDE (Frishman & Argos, 1995), XTLSSTR (King & Johnson, 1999), PSEA (Labesse et al., 1997), SECSTR (Fodje & Karadaghi, 2002), DEFINE (Richards & Kundrot, 1988).
Prediction of secondary protein structure. It is well established, by means of CD spectroscopy and NMR spectroscopy, that different amino acid residues show different propensities for location in helical and extended conformations, and even at different positions within an element in the case of a helix (Penel et al., 1999). Therefore, it should be possible to predict secondary structure elements from primary protein sequence alone. Indeed, several bioinformatics methods are available for this purpose, e.g. PSIPRED (Jones, 1999; http://bioinf.cs.ucl.ac.uk/psipred/) and JPRED (Cole et al., 2008; http://www.compbio.dundee.ac.uk/wwwjpred/), with average prediction accuracy ~ 75% (Montgomerie et al., 2006). Considering tertiary aspects of secondary structure elements (Kumar & Bansal, 1998; Pal & Chakrabarti, 2000), the accuracy can be further improved (up to 90%) by including tertiary protein structure database comparisons as part of the prediction process, e.g. as implemented in PROTEUS (Montgomerie et al., 2006; http://wks16338.biology.ualberta.ca/proteus/). Higher reliability of secondary structure prediction can be achieved by combination of various approaches, i.e. using consensus strategy which is so typical for bioinformatics field, e.g. using NPS@ (Deléage et al., 1997; http://npsapbil.ibcp.fr/cgibin/npsa_automat.pl?page=/NPSA/npsa_seccons.html).
Determination of tertiary protein structure. Determination of tertiary protein structure is at the very heart of any attempt to understand protein structuredynamicsfunction relationships. Tertiary protein structure fingerprint, useful for comparison between mutant proteins and for validation of sample prior the application of low and high resolution protein structure determination, can be obtained by nearUV CD spectroscopy (Kelly et al., 2005) and
54

1 Introduction
Raman optical activity (Wilson et al., 1996). Molecular weight can be identified by gel filtration, electrophoresis, dynamic light scattering, and by low resolution (~ 10 Å) structural techniques (Schmidt & Lamzin, 2007). The latter include electron microscopy, small angle Xray scattering (SAXS) and small angle neutron scattering (SANS), and additionally provide information about molecular shape (Petoukhov & Svergun, 2007; Schmidt & Lamzin, 2007). The deepest insight into protein structure can be obtained by atomic resolution methods, crystallography (Kendrew et al., 1958; Kendrew et al., 1960; Kendrew, 1962; Acharya & Lloyd, 2005) and NMR spectroscopy (Altieri & Byrd, 2004), that ideally identify positions of all atoms of a protein in the threedimensional space. Crystallographic techniques can be classified according to nature of the diffraction beam into Xray crystallography, XC (Kendrew et al., 1958; Kendrew et al., 1960; Kendrew, 1962), neutron crystallography, NC (Blakeley et al., 2008) and electron crystallography, EC (Unwin & Henderson, 1975; Henderson & Unwin, 1975; Henderson et al., 1990; Kimura et al., 1997). NMR spectroscopy can be applied to determine tertiary protein structure in solution using a variety of twodimensional (HSQC, COSY, TOCSY, NEOSY, HSQC), threedimensional (HNCO, HN(CA)CO, HNCA, NOESY/HSQC, TOCSY/HSQC) experiments (Altieri & Byrd, 2004; Foster et al., 2007; Güntert, 2009) and even fourdimensional experiments (Kay, 2005; Foster et al., 2007), or via chemical shifts only (Cornilescu et al., 1999; Neal et al., 2003; Cavalli et al., 2007; Shen et al., 2008; Wishart et al., 2008). Chemical shifts can also be used in solid state NMR structure determination (Baldus, 2007; Robustelli et al., 2008; Shen et al., 2009). Despite rapid development in NMR (Altieri & Byrd, 2004; Billeter et al., 2008) and ever increasing size limitation, nowadays > 82 kDa (Tugarinov et al., 2005b), XC is the only technique routinely used to determine structures of large proteins > 20 kDa (Foster et al., 2007; Billeter et al., 2008). XC will likely remain the primary technique for determining structures of large proteins for the forseeable future (DeLucas et al., 2003; McPherson, 2004). Other approaches will find applications when XC fails (Bard et al., 2004; McPherson, 2004; Acharya & Lloyd, 2005; DeLucas et al., 2005; Pusey et al., 2005; Manjasetty et al., 2008) and/or when NCspecific information, i.e. position of hydrogen atoms (Blakeley et al., 2008), ECspecific information, i.e. determination of tertiary structure of membrane proteins and determination of charge state of individual amino acid residues (Kimura et al., 1997; Mitsuoka et al., 1999; Hite et al., 2007), is needed; solution and solid state NMR will find application especially for characterisation of “unstructured” functional proteins (Billeter et al., 2008) and membrane proteins (Robustelli et al., 2008; Shen et al., 2009), respectively. Determined protein structures should be deposited in publicly available Protein Data Bank (PDB; Berman et al., 2003). Additionally, there exists also specialised NMR structure database, DRESS (Nabuurs et al., 2004), Hydrogen and Hydration in proteins Data Base (HHDB) storing positions of hydrogen atoms determined by NC (Blakeley et al., 2008), and protein fold classification databases, CATH (Orengo et al., 1997; Orengo et al., 1998; Orengo et al., 2002; Reeves et al., 2006; Cuff et al., 2009) and SCOP (Murzin et al., 1995; Hubbard et al., 1998). It should be emphasised that both NMR protein structures and protein crystal structures are models, i.e. interpretations of NMR and crystallographic experiments, respectively (Lupas, 2008). Atomicdetail determination of tertiary protein structure is thus an examplary example of interdependence of experiment and molecular modelling (Lupas, 2008).
Prediction of tertiary protein structure. Sometimes, the protein resists XC/NC/EC determination or is too large to be tackled by NMR spectroscopy. In such cases, atomicdetail structure can still be obtained – using bioinformatics and molecular modelling techniques. Based on the assumption, that similar protein sequences fold into similar native tertiary structures (Chothia & Lesk, 1986; Dalal et al., 1997; Baldwin & Rose, 1999b; Orengo et al., 2002), the socalled homology model can be build using sufficiently similar (Vitkup et al., 2001), i.e. likely evolutionary homologeous (Aloy et al., 2005), NMR, XC, NC or EC high or atomic resolution tertiary protein structures, e.g. by means of MODELLER (Sali & Blundell, 1993; http://www.salilab.org/modeller/), SWISSMODEL (Schwede et al., 2003; http://swissmodel.expasy.org//SWISSMODEL.html) and Genesilico MetaServer (Kurowski & Bujnicki, 2003; https://www.genesilico.pl/meta2/). Quality of a homology model depends on number of available template structures, sequence identity, distribution of nonsimilar regions, presence of long insertions and deletions, methods applied, and whether the case belongs to majority of similar sequencesimilar fold “rule” or is an exception (Vitkup et al., 2001). At targettemplate sequence identity > 3035%, the homology model quality often allows to correlate structural variations with differences in function (Vitkup et al., 2001). For sequence identity > 40%, homology model quality increases linearly with increasing sequence identity (Vitkup et al., 2001). Since limited number of folds in nature, carefully chosen proteins for NMR or crystallographic tertiary structure determination may identify all 95% of all 104
natural folds (Chothia, 1992; Vitkup et al., 2001) in ten years, according to estimation of growing speed of structure determination in subsequent years (Vitkup et al., 2001). Then, almost all protein sequences would have sufficiently similar sequence with one or more experimental model that would allow highquality homology models to be built (Vitkup et al., 2001). Higher number of template structures is convenient as it allows building higher quality
55

1 Introduction
fragments of the target protein and subsequent recombining the fragments into final model, a strategy used by Frankenstein3D approach (Kosinski et al., 2003; Kosinski et al., 2005; https://genesilico.pl/toolkit/unimod?method=FrankensteinWebOptimizeAlignment). If no template protein structure is available, the tertiary protein structure can be predicted by de novo building using information from secondary structure prediction, turn prediction, atomic interactions, fragment insertion and numerical simulations, e.g. ROSETTA (Bradley et al., 2003). Alternatively, fold can be identified via the socalled threading approaches, e.g. SUPERFAMILY (Gough et al., 2001), PHYRE (Kelley & Sternberg, 2009), pGenTHREADER (Bryson et al., 2005) and pDomTHREADER (Bryson et al., 2005), i.e. by secondary structure prediction and advanced sequence comparison followed by testing compatibility of the sequence with the selected known folds (Bowie et al., 1991; Bryant & Lawrence, 1993; Moult et al., 1997). Despite the heavy effort to predict tertiary protein structures, eight rounds of Critical Assessment of Structure Prediction (CASP) competitions (Moult et al., 1995; http://predictioncenter.org/), initiated by Moult in response to periodic, poorly substantiated claims of decisive progress in solving the protein folding problem reveal that so far, no methods has produced results suggesting that the problem of predicting protein structure has been reached at a fundamental level (Kryshtafovych et al., 2005; Lupas, 2008).
Determination of quarternary protein structure. Oligomeric state of a protein can be identified by gel filtration, electrophoresis, dynamic light scattering, electron microscopy, SAXS and SANS (Petoukhov & Svergun, 2007; Schmidt & Lamzin, 2007). Atomic resolution quarternary protein structure can be obtained by NMR, XC, NC and EC, as in the case of tertiary protein structure. NMR spectral perturbation (Huang et al., 1998; Fiaux et al., 2002), crossrelaxation (Garrett et al., 1999) and crosssaturation experiments (Nishida et al., 2003) can be used to determine quarternary interaction interface quickly without the need to solve threedimensional structure of an entire complex and without “intrinsic” size limitation. Therefore, the NMR techniques are conveniently applicable to large complexes > 300 kDa (Huang et al., 1998; Fiaux et al., 2002; Nishida et al., 2003; Foster et al., 2007), whereas XC/NC/EC must be first applied to solve the threedimensional structure that only then can be used to predict, and analyse quarternary contacts and to distinguish them from packing interactions in the crystal lattice (Bahadur et al., 2004; Janin et al., 2007; Kobe et al., 2008). Biologically relevant quarternary interface is usually more hydrophobic, contains more fully buried atoms, and shows more compact atomic packing compared to crystal packing (Bahadur et al., 2004; Janin et al., 2007). Nevertheless, distinguishing biologically relevant interface from crystal contacts is often not straightforward because physical basis is the same. Moreover, biologically relevant interface may not be always present in the crystal. Thus absence of these interactions cannot be granted as the proof of absence of quarternary structure (Kobe et al., 2008). These limitations necessitate complementing the crystallographic analysis with computational predictions and multiple complementary experimental techniques, including the above mentioned NMR spectroscopy, electron microscopy, CD spectroscopy, SAXS, SANS, atomic force microscopy (ATF), MS, fluorescence resonance energy transfer (FRET), electron paramagnetic resonance (EPR) spectroscopy, and mutagenesis of putative interface amino acid residues (Kobe et al., 2008).
Prediction of quarternary protein structure. Based on physicochemical models of macromolecular interactions and chemical thermodynamics, quarternary protein structure can be detected in XC structures with the use of Protein Interfaces, Surface and Assemblies (PISA) with 8090% success rate (Krissinel & Henrick, 2007; http://www.ebi.ac.uk/msdsrv/prot_int/pistart.html). Using PISA, biological role of the macromolecular interface can be assessed and the predicted interface can be further compared with previously identified interfaces (Krissinel & Henrick, 2007). Similar success rate was reported for another computational approach that is based on interface area, fraction of surface involved, numbers and properties of atomic pair contacts, and amino acid residue propensities (Bahadur et al., 2004). Although biological quarternary contacts are usually conserved, combination of size information and conservation criteria in quarternary contacts predictions showed only little predictive benefit added by the latter (Valdar & Thornton, 2001) because of presence of two extremes: (i) two protein complexes can show similar quarternary interactions despite very weak sequence similarity, e.g. fibroblast growth factors and their receptors vs interleukins1 and its receptor; and (ii) two protein complexes can show different quarternary interactions despite high sequence similarity, e.g. interaction between CheY and CheAP2 differs by a rotation of 180° in different bacterial species (Aloy et al., 2005). Nevertheless, on average, there is low, medium and high correlation between sequence identity of < 30%, 3060% and > 60%, respectively, and interaction similarity (Aloy et al., 2005). Since limited number of interfaces used by nature, estimated ~ 104 (Aloy et al., 2005), as new interfaces are being detected, the coverage of the quarternary interaction space increases which will yield ever more secure predictions in future (Vitkup et al., 2001).
56

1 Introduction
1.5.3.2 Determination and prediction of protein dynamics
Experimental approaches. Protein structure determines protein dynamics and they jointly determine protein function (Karush, 1950; Wolfenden, 1974; Parak, 2003; Busenlehner & Armstrong, 2005; Igumenova et al., 2006; Jarymowycz & Stone, 2006). Information about conformational changes of native individual protein molecules can be obtained by SAXS and SANS (Petoukhov & Svergun, 2007). Atomic resolution of protein motions including ligandinduced motions can be obtained by highresolution techniques, XC (Smith et al., 1994; Wilson & Brunger, 2000; Acharya & Lloyd, 2005; Bourgeois & Royant, 2005), NC, EC and NMR (Palmer, 2004; Mittermaier & Kay, 2006). Exceptional information on protein dynamics is also provided by combination of Hydrogen/Deuterium (H/D) exchange with NC (Blakeley et al., 2008), NMR (Englander & Kallenbach, 1983) or MS (Busenlehner & Armstrong, 2005). Ligandinduced conformational changes can be also detected by differential scanning calorimetry (Gohlke & Klebe, 2002), farUV CD spectroscopy (Kelly et al., 2005), and by wideangle Xray scattering with 23 Å resolution if high resolution XC structure of the protein is available (Fischetti et al., 2004). FarUV CD spectroscopy can be also applied to study protein folding by study of refolding of denaturated proteins and can be used to measure rate of tertiary protein structure acquisition (Kelly et al., 2005). Protein folding can be also studied by realtime NMR spectroscopy (Zeeb & Balbach, 2004) allowing detection of folding equilibrium intermediates that can be silent to farUV CD spectroscopy or fluorescence spectroscopy (Zeeb & Balbach, 2004).
Determination of protein dynamics by XC. Proteins in crystal can perform function (Bourgeois & Royant, 2005) which is a proof of presence of biologically important motions in proteins in crystals (Smith et al., 1994; Wilson & Brunger, 2000; Acharya & Lloyd, 2005), although some largescale motions can be impeded by the crystal lattice (Wilson & Brunger, 2000). XC can provide information about the protein motions through (i) atomic displacement parameter or its mathematical transformation into temperature factor (also known as “Bfactor”), which is part of the final crystal structure model, (ii) translationlibrationscrew (TLS) parameters for XC structures with resolution higher than 2 Å (Winn et al., 2001; Chaudhry et al., 2004), and (iii) when a series of static structures are assigned to various states along a reaction pathway morphed into movies (Echols et al., 2003). Bfactors provide information about mobility of each atom around its mean position: the higher the Bfactor the higher the atomic mobility (Acharya & Lloyd, 2005). While XC structures solved at resolution < 1.2 Å should be always provided with isotropically refined Bfactors, i.e. showing spherical shape of mobility, Bfactors for XC structures solved to high resolution, i.e. > 1.2 Å, can be refined anisotropically, i.e. showing different mobility of atoms in different directions via threedimensional ellipsoid defined by length and threeprincipal axes and thus providing information about directional motion (Acharya & Lloyd, 2005; Schmidt & Lamzin, 2007). Secondary structure elements, especially
sheets, are among the regions with the lowest β Bfactors, whereas loops, especially those located at protein surface, and N and Ctermini often belong to high Bfactor regions. Derivative Bfactors, i.e. differences between average Bfactors for two consecutive amino acid residue mainchain groups, reveal regions of flexibility, i.e. hinge regions responsible for rigid body motion (Carugo, 2001). Different protein molecules often possess different conformations even in the crystal lattice, although some may be consequence of protein molecules being in the crystalline state (Acharya & Lloyd, 2005). If these conformations are highly populated, they give rise to smear in electron density map or alternative electron density for the group that differs in conformation among the ensemble of protein molecules in the crystal lattice. High mobility of some region of a protein and solvent content surrounding the protein molecule may cause missing electron density and therefore the final XC structure may have some regions missing, which is an indication of mobility or solvent effects (Acharya & Lloyd, 2005). If some groups populate two or more different conformations, these can be identified by the alternative electron density for the group and these are included in the final model with occupancy information, from 0 for no occupancy to 1 for 100% occupancy (Acharya & Lloyd, 2005). Although dynamics of protein in crystal lattice is not severely ceased because protein molecules are surrounded by solvent and contacts between protein molecules in crystal lattice are rather loose (Wilson & Brunger, 2000) XC provides only limited information about protein dynamics, because the final protein crystal structure is a time and space average of a large ensemble of protein molecules (Acharya & Lloyd, 2005). Deeper insight into mobility and flexibility in protein molecule, i.e. beyond static, time and space averaged image of XC, that might be important for function can be obtained: (i) by timeresolved XC which can provide a reaction kinetics of conformational changes at the atomic level, but the pathway from one conformation to the other is different for each individual protein molecule in the crystal thus the timeresolved experiments cannot visualise the atomic trajectories by which one molecule passes from one state to the next (Parak, 2003); or (ii) by multiwavelength technique, e.g. picosecond timeresolved Laue diffraction using unfiltered polychromatic Xray pulses, for fast data collection allowing catching transient chemical states in the crystal and identification of direction of motions (Schotte et al., 2004; Schmidt & Lamzin, 2007).
57

1 Introduction
Determination of protein dynamics by NMR spectroscopy. One of the greatest strengths of NMR spectroscopy is the possibility to measure molecular motion at nearatomic resolution (Palmer, 2004; Mittermaier & Kay, 2006), and to identify (i) motions on various timescales (~ 1013 to ~ 105 s), i.e. involving local, rigidbody, and global motions, and (ii) correlations between motions (Tousignant & Pelletier, 2004; Zeeb & Balbach, 2004; Kay, 2005). TROSY NMR experiments and advance in labeling allows molecular motions to be studied in large proteins and their complexes, e.g. macromolecular assembly involving 300 kDa cylindrical protease ClpP, a 14subunit oligomer consisting of two symmetrical heptameric rings (Sprangers et al., 2005). Thus motions can be studied by NMR directly in a biological functional context (Zhu et al., 2000; Tugarinov et al., 2005a). NMR measurements of residual dipolar coupling (1HN15N) resulting from the weak alignment of solute proteins in dilute solution of ordering media provides information about protein backbone dynamics (Tolman & Ruan, 2006). If these measurements are supplemented by 15N spin relaxation experiments then information about protein internal dynamics change upon ligand binding can be obtained (Kay, 2005). 2H spin relaxation NMR experiments provide information about: (i) molecular recognition (Kay et al., 1998); (ii) protein folding (Choy et al., 2003); (iii) protein stability (Lee & Wand, 2001); and (iv) response of protein dynamics to hydrophobic core amino acid residue mutations (Mittermaier & Kay, 2004). These examples of NMR techniques demonstrate why NMR spectroscopy is currently at the centre of efforts to illuminate the nature of protein dynamics and their role in biological function (Igumenova et al., 2006).
Computational approaches. Molecular modelling, normal mode analysis (NMA) and molecular dynamics (MD) simulations, provide finer time and space resolution of protein dynamics compared to experimental techniques (Skjaerven et al., 2009). However, it should be emphasised that both NMA and MD simulations rely on high resolution protein models that can be obtained only by experimental techniques.
Prediction of protein dynamics by NMA. Correlated, shear and hinge, motions can be predicted by analysis of vibrational normal modes (Table 8). Compared to MD simulations, NMA is better suited to study the slow dynamics involving large structural rearrangements because NMA is less computationally demanding. NMA proved to reproduce vibrational spectra (Wilson et al., 1955) which demonstrated predictive power of the computational approach (Skjaerven et al., 2009). NMA includes: (i) characterising and visualising displacements associated with the modes, directly comparable with Bfactors; (ii) identifying correlated motions; (iii) measuring degree of collectivity of displacement for assessment of degree of flexibility of domains; (iv) identifying number of NM needed to describe transconformation; and (v) simulating transition pathways between two conformations (Skaerjven et al., 2009).
Table 8 | Normal mode analysis programs.Program LinkADENM http://enm.lobos.nih.gov/start.htmlDCENM http://enm.lobos.nih.gov/start_dc.htmlDFProt http://sbg.cib.csic.es/Software/DFprot/ElNémo http://igsserver.cnrsmrs.fr/elnemo/index.htmliGNM http://ignm.ccbb.pitt.edu/Index.htmMinActionPath http://lorentz.immstr.pasteur.fr/maxL_traj.phpMolMovDB http://molmovdb.org/NOMADRef http://lorentz.immstr.pasteur.fr/nomadref.phpNORMA http://www.igs.cnrsmrs.fr/elnemo/NORMA/oGNM http://ignm.ccbb.pitt.edu/GNM_Online_Calculation.htmPathENM http://enm.lobos.nih.gov/start_path.htmlProMode Database http://promode.socs.waseda.ac.jp/pages/jsp/index.jspTMM http://services.cbu.uib.no/tools/tmmaWEBnm http://services.cbu.uib.no/tools/normalmodes
Prediction of protein dynamics by MD simulations. MD simulation is the most powerful theoretical method for description of protein dynamics (Karplus & Kuriyan, 2005; Rueda et al., 2007) because it provides atomicdetail resolution of all types of protein motions and their timescales, if only not limited by short simulation time. Nevertheless, suppossing reasonable approximations are applied (Carloni et al., 2002), MD simulation is the only technique, and well established, that can provide dynamical behaviour of a protein in “real time” movie; some such movies are being shared via publicly available MolMovDB database (Gerstein & Krebs, 1998; Echols et al., 2003; Flores et al., 2006). The limitation of simulated time can be handled by enhanced conformational sampling by using implicit solvent model or by enhanced sampling MD simulation methods (Roitberg & Simmerling, 2004), e.g. replica exchange MD (Sugita & Okamoto, 1999) which is one of the most effective sampling method (Liwo et al., 2008), locally enhanced sampling MD, LES (Elber & Karplus, 1990), targeted MD, TMD (Schlitter et al., 1993), steered MD, SMD (Phillips et al., 2005), random acceleration MD, RAMD (Lüdemann et al., 2000a), and umbrella
58

1 Introduction
sampling MD, USMD (Kumar et al., 1992; Kumar et al., 1995). Most MD simulations in the future are expected to be of the steered type (Phillips et al., 2005). In general, each MD method relies on a force field, i.e. parameters that describe atomic properties and interatomic bonded and nonbonded interactions (forces), and a potential energy function that uses the parameters for description of the relationship between structure and energy of the system (Mackerell, 2004). Interatomic forces are derived empirically and electronic degrees of freedom are integrated out (Carloni et al., 2002). Several MD packages have emerged within last three decades; the most widely used are AMBER (Weiner & Kollman, 1981; Case et al., 2005), CHARMM (Brooks et al., 1983), GROMOS (Christen et al., 2005), GROMACS (Van Der Spoel et al., 2005), NAMD (Humphrey et al., 1996; Phillips et al., 2005), OPLS (Jorgensen & TiradoRives, 1988), and OPLSAA (Jorgensen et al., 1996). Modern protein force fields, e.g. CHARMM, AMBER and OPLSAA, behave comparably in MD simulations (Price & Brooks III, 2002). The progress in MD simulations is almost entirely dependent on advances in computing power (Borrell, 2008). either through the growth of supercomputing centres (e.g. MetaCentrum; http://meta.cesnet.cz/cms/opencms/en) or through imaginative distributive computing, e.g. folding@home (Shirts & Pande, 2000). For illustration, the first successful MD simulation of a protein, 9.2 ps of 58amino acid residue bovine pancreatic trypsin inhibitor was reported in 1977 (McCammon & Karplus, 1977). 39 years later, > 50 ns long allatom MD simulation of entire living system, satellite tobbacco mosaic virus composed of ~ 106 atoms, was reported (Freddolino et al., 2006). MD simulation length progressed rapidly: 10 ps for years 19701979, 10100 ps for years 19801995, 100 ps to 1 ns for years 19951999, and 1100 ns for years 20002007 (Sanbonmatsu & Tung, 2007). Despite the progress, however, the desired depth of understanding of protein action in time by using MD is not particularly close (Lupas, 2008).
1.5.3.3 Determination and prediction of protein function
Determination and prediction of protein function by sequence and structure comparison. There are two possible scenarios how to match a protein with a function, both starting by creating a genome library. In the first approach, the genome library is searched for known function. The genome fragment of the clone that acquired the function is sequenced and gene that encodes for the protein responsible for the function can thus be identified. In the second approach, entire genome library is sequenced to determine nucleotide sequence of the whole genome. The genome sequence is then searched for all possible nonstop frames (also known as “open reading frames”), which represent set of putative genes. Comparison of the sequences of open reading frames with protein sequences stored in publicly available nucleotide sequence databases, GenBank, EMBL nucleotide sequence database and DDBJ, and protein sequence database, UniProt (Apweiler et al., 2004a; Apweiler et al., 2004b; Bairoch et al., 2005; UniProt Consortium, 2009), can reveal similarity with a gene whose protein product and its function is known (McLachlan, 1971; Gaboriaud et al., 1987; Altschul et al., 1990; Altschul & Lipman, 1990; Altschul et al., 1997; Callebaut et al., 2000). The higher is the sequence similarity, the higher is the confidence about functional similarity, although exceptions may exist. There are numerous approaches for sequencebased function prediction (Table 9; Watson et al., 2005). These tools play important role in proposing function of newly identified putative genes, that nowadays emerge in large number from genome and metagenome sequencing projects. Once prediction of function suggests some possible functions, these must be tested experimentally by biochemical characterisation and, if possible, structural characterisation, including solving atomicdetail resolution protein structure by XC, NC, EC or NMR. The experimental protein structure can be then used for structurebased function prediction (Table 9). Determination/prediction of protein function is thus a classic example of tight cooperation between experiment, bioinformatics and molecular modelling.
Table 9 | Function prediction. (pp. 5960)Approach MethodsSequencebased function prediction
BLAST/PSIBLAST (http://blast.ncbi.nlm.nih.gov/Blast.cgi)SSEARCH/FASTA (http://fasta.bioch.virginia.edu/fasta_www2/fasta_list2.shtml)PROSITE (http://www.expasy.org/prosite/)PRINTS (http://www.bioinf.manchester.ac.uk/dbbrowser/PRINTS/index.php)Pfam (http://pfam.sanger.ac.uk/)ProDom (http://prodom.prabi.fr/prodom/current/html/home.php)TIGRFAMs (http://www.jcvi.org/cms/research/projects/tigrfams/overview/)SMART (http://smart.emblheidelberg.de/)SUPERFAMILY (http://supfam.cs.bris.ac.uk/SUPERFAMILY/)InterProScan (http://www.ebi.ac.uk/Tools/InterProScan/)Hhpred/HHsearch (http://toolkit.tuebingen.mpg.de/hhpred)COACH (http://drive5.com/lobster/)
59
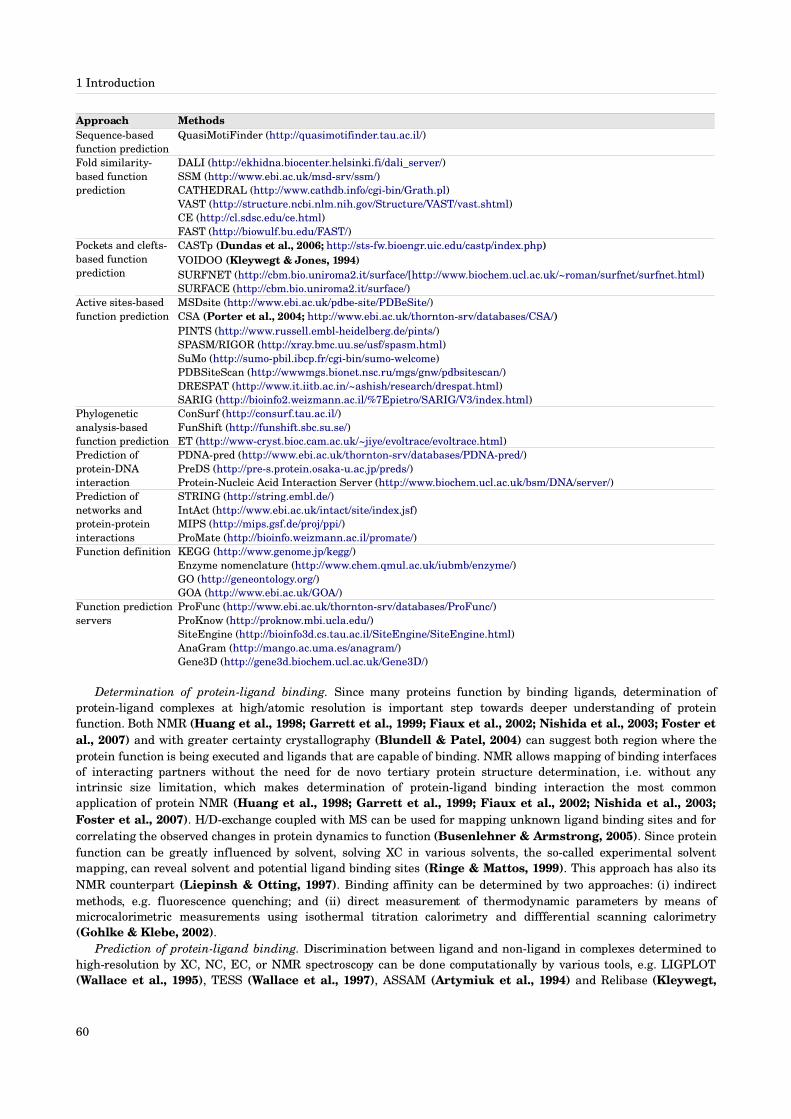
1 Introduction
Approach MethodsSequencebased function prediction
QuasiMotiFinder (http://quasimotifinder.tau.ac.il/)
Fold similaritybased function prediction
DALI (http://ekhidna.biocenter.helsinki.fi/dali_server/)SSM (http://www.ebi.ac.uk/msdsrv/ssm/)CATHEDRAL (http://www.cathdb.info/cgibin/Grath.pl)VAST (http://structure.ncbi.nlm.nih.gov/Structure/VAST/vast.shtml)CE (http://cl.sdsc.edu/ce.html)FAST (http://biowulf.bu.edu/FAST/)
Pockets and cleftsbased function prediction
CASTp (Dundas et al., 2006; http://stsfw.bioengr.uic.edu/castp/index.php)VOIDOO (Kleywegt & Jones, 1994)SURFNET (http://cbm.bio.uniroma2.it/surface/[http://www.biochem.ucl.ac.uk/~roman/surfnet/surfnet.html)SURFACE (http://cbm.bio.uniroma2.it/surface/)
Active sitesbased function prediction
MSDsite (http://www.ebi.ac.uk/pdbesite/PDBeSite/)CSA (Porter et al., 2004; http://www.ebi.ac.uk/thorntonsrv/databases/CSA/)PINTS (http://www.russell.emblheidelberg.de/pints/)SPASM/RIGOR (http://xray.bmc.uu.se/usf/spasm.html)SuMo (http://sumopbil.ibcp.fr/cgibin/sumowelcome)PDBSiteScan (http://wwwmgs.bionet.nsc.ru/mgs/gnw/pdbsitescan/)DRESPAT (http://www.it.iitb.ac.in/~ashish/research/drespat.html)SARIG (http://bioinfo2.weizmann.ac.il/%7Epietro/SARIG/V3/index.html)
Phylogenetic analysisbased function prediction
ConSurf (http://consurf.tau.ac.il/)FunShift (http://funshift.sbc.su.se/)ET (http://wwwcryst.bioc.cam.ac.uk/~jiye/evoltrace/evoltrace.html)
Prediction of proteinDNA interaction
PDNApred (http://www.ebi.ac.uk/thorntonsrv/databases/PDNApred/)PreDS (http://pres.protein.osakau.ac.jp/preds/)ProteinNucleic Acid Interaction Server (http://www.biochem.ucl.ac.uk/bsm/DNA/server/)
Prediction of networks and proteinprotein interactions
STRING (http://string.embl.de/)IntAct (http://www.ebi.ac.uk/intact/site/index.jsf)MIPS (http://mips.gsf.de/proj/ppi/)ProMate (http://bioinfo.weizmann.ac.il/promate/)
Function definition KEGG (http://www.genome.jp/kegg/)Enzyme nomenclature (http://www.chem.qmul.ac.uk/iubmb/enzyme/)GO (http://geneontology.org/)GOA (http://www.ebi.ac.uk/GOA/)
Function prediction servers
ProFunc (http://www.ebi.ac.uk/thorntonsrv/databases/ProFunc/)ProKnow (http://proknow.mbi.ucla.edu/)SiteEngine (http://bioinfo3d.cs.tau.ac.il/SiteEngine/SiteEngine.html)AnaGram (http://mango.ac.uma.es/anagram/)Gene3D (http://gene3d.biochem.ucl.ac.uk/Gene3D/)
Determination of proteinligand binding. Since many proteins function by binding ligands, determination of proteinligand complexes at high/atomic resolution is important step towards deeper understanding of protein function. Both NMR (Huang et al., 1998; Garrett et al., 1999; Fiaux et al., 2002; Nishida et al., 2003; Foster et al., 2007) and with greater certainty crystallography (Blundell & Patel, 2004) can suggest both region where the protein function is being executed and ligands that are capable of binding. NMR allows mapping of binding interfaces of interacting partners without the need for de novo tertiary protein structure determination, i.e. without any intrinsic size limitation, which makes determination of proteinligand binding interaction the most common application of protein NMR (Huang et al., 1998; Garrett et al., 1999; Fiaux et al., 2002; Nishida et al., 2003; Foster et al., 2007). H/Dexchange coupled with MS can be used for mapping unknown ligand binding sites and for correlating the observed changes in protein dynamics to function (Busenlehner & Armstrong, 2005). Since protein function can be greatly influenced by solvent, solving XC in various solvents, the socalled experimental solvent mapping, can reveal solvent and potential ligand binding sites (Ringe & Mattos, 1999). This approach has also its NMR counterpart (Liepinsh & Otting, 1997). Binding affinity can be determined by two approaches: (i) indirect methods, e.g. fluorescence quenching; and (ii) direct measurement of thermodynamic parameters by means of microcalorimetric measurements using isothermal titration calorimetry and diffferential scanning calorimetry (Gohlke & Klebe, 2002).
Prediction of proteinligand binding. Discrimination between ligand and nonligand in complexes determined to highresolution by XC, NC, EC, or NMR spectroscopy can be done computationally by various tools, e.g. LIGPLOT (Wallace et al., 1995), TESS (Wallace et al., 1997), ASSAM (Artymiuk et al., 1994) and Relibase (Kleywegt,
60

1 Introduction
1999). Rapid assessment of possible ligand binding sites can be performed by computational solvent mapping, the counterpart of XC and NMR solvent mappings (Silberstein et al., 2003). An alternative to the computational solvent mapping is represented by molecular docking, pioneered during early 1980s (Kuntz et al., 1982), This approach plays an important complementary and supportive role in determination of proteinligand association from several perspectives – protein binding site, ligand affinity and ligand specificity (Halperin et al., 2002). The most widely used docking programs include ADAM (Mizutani et al., 1994), AutoDock (Goodsell & Olson, 1990; Morris et al., 1996; Morris et al., 1998), DARWIN (Taylor & Burnett, 2000), DIVALI (Clark & Ajay, 1995), DOCK 4.0 (Ewing et al., 2001), DockVision (Hart & Read, 1992), EUDOC (Perola et al., 2000), FlexE (Claussen et al., 2001), FlexX (Rarey et al., 1996), FLOG (Miller et al., 1994), FTDOCK (Gabb et al., 1997), GOLD (Jones et al., 1997), Hammerhead (Welch et al., 1996), ICM (Abagyan et al., 1994), LIGIN (Sobolev et al., 1996), LUDI (Böhm, 1992), MCDOCK (Liu & Wang, 1999), Prodock (Trosset & Scheraga, 1999), PRO_LEADS (Baxter et al., 1998), QXP (McMartin & Bohacek, 1997), SANDOCK (Burkhard et al., 1998), SFDock (Hou et al., 1999), and Soft docking (Jiang & Kim, 1991). As of year 2006, the most cited program was AUTODOCK with 27% share (Sousa et al., 2006). However, performance of most docking tools is highly dependent on the specific characteristics of both the binding site and the ligand. Therefore, establishing which method would be most suitable in a precise context is almost impossible (Sousa et al., 2006). As tertiary protein structure prediction has its CASP, so has molecular docking its CAPRI, Critical Assessment of Predicted Interactions (Janin et al., 2007). CAPRI revealed that docking algorithms work efficiently and accurately when predicting the mode of assembly of proteins that do not “significantly” change conformation upon association and perform less well in the presence of large conformational changes (Janin et al., 2007). Thus, the most challenging problem of molecular docking is treatment of ligand and especially protein dynamics as both may be important for formation of the proteinligand complex in both conformational selection and inducedfit binding scenarios (May & Zacharias, 2005). Although every docking approach contains scoring function for discriminating between ligand binding modes and between various ligands, reliable estimation of free energy of binding must be obtained by other approaches. Currently, one of the best ways to calculate binding energy is to use the linear response approximation (LRA) treatment which provides good estimate for the free energy associated with change between potential surfaces and possibility of decomposition of free energies to their individual additive contributions, in contrast to free energy perturbation, FEP (Lee et al., 1992; Olsson et al., 2004).
Determination of ligand migration through protein. Ligand migration through protein may play crucial role for function of proteins with buried binding sites. Ligand migration through protein can be inferred experimentally by capturing proteinligand complexes by XC (Verschueren et al., 1993a; Pikkemaat et al., 1999; Dunn et al., 2001; Podust et al., 2001; Teeter, 2004) or by NMR (Berlow et al., 2007; Yao et al., 2007), by identification of cavities in highresolution experimental protein structures (Williams et al., 1994; Oprea et al., 1997; Takano et al., 1997; Brunori et al., 1999), by various physicochemical methods, e.g. flash (laser) photolysis (Austin et al., 1975; Brunori et al., 1999; Scott et al., 2001; Lavalette et al., 2006), timeresolved photoacustic calorimetry (Di Primo et al., 1997), fluorescence spectroscopy (Verschueren et al., 1993a; Brunori et al., 1999; Pikkemaat et al., 1999; Prasad et al., 2000; Prasad & Mitra, 2002), phosphorescence spectroscopy (Khajehpour et al., 2003), UVVIS and resonance Raman spectroscopy (Jakopitsch et al., 2005) and chargetransfer absorption spectroscopy (Zelent et al., 2004), and in case of an enzyme by appropriate methods for enantioselectivity measurements (Wombacher et al., 2006), and for steadystate kinetics (Scott et al., 2002; Jakopitsch et al., 2005) and presteady state kinetics measurements (Jakopitsch et al., 2005).
Prediction of ligand migration through protein. Possible ligand pathway through protein can be identified by searching for continuous region of high Bfactor amino acid residues or atoms in the socalled thermal motion pathway approach (Lüdemann et al., 1997; Carugo & Argos, 1998). Highresolution XC, NC, EC and NMR structures can be also explored for presence of internal cavities, e.g. by CASTP (Dundas et al., 2006) and VOIDOO (Kleywegt & Jones, 1994), and tunnels, e.g. by CAVER 1.0 (Banáš et al., 2006; Petřek et al., 2006; Cojocaru et al., 2007; Negri et al., 2007; Silberstein et al., 2007; http://www.loschmidt.chemi.muni.cz/caver1.0/), MOLE (Petřek et al., 2007; http://mole.chemi.muni.cz/index.php), MOLAXIS (Yaffe et al., 2008; http://bioinfo3d.cs.tau.ac.il/MolAxis/molaxis.html), CHUNNEL (Coleman & Sharp, 2009; http://crystal.med.upenn.edu/software.html), and SLITHER (Lee et al., 2009; http://slither.rcas.sinica.edu.tw/index.php). However, ligand migration is a dynamic process characteristic by motions in both protein and ligand, and by proteinligand interactions. MD is currently the only approach that can provide atomicdetail movie of ligand migration in proteins. Both classical MD (Kottalam & Case, 1988; Wlodek et al., 1997; Enyedy et al., 1998; Brunori et al., 1999; Tara et al., 1999; Wriggers & Schulten, 1999; Henchman et
61

1 Introduction
al., 2002; Khajehpour et al., 2003; Xu et al., 2003; Chau, 2004; Damjanović et al., 2005; Wen et al., 2005; Schleinkofer et al., 2005; Banáš et al., 2006; Hritz et al., 2006; Zhou et al., 2006; Negri et al., 2007; Wang & Duan, 2007) and enhanced sampling MD simulations (Kottalam & Case, 1988; Lüdemann et al., 1997; Enyedy et al., 1998; Wriggers & Schulten, 1999; Lüdemann et al., 2000a; Van Belle et al., 2000; Isralewitz et al., 2001; Scott et al., 2001; Bui et al., 2003; Xu et al., 2003; Wade et al., 2004; Li et al., 2005; Schleinkofer et al., 2005; Bikiel et al., 2006; Carlsson et al., 2006; Cohen et al., 2006; Wang & Duan, 2007) were employed in numerous studies and proved useful in identification of pathways and dynamical behaviour associated with ligand diffusion through protein, and proteinligand interactions during the process. The enhanced sampling MD simulations include RAMD (Lüdemann et al., 1997; Lüdemann et al., 2000a; Wade et al., 2004; Schleinkofer et al., 2005; Carlsson et al., 2006; Wang & Duan, 2007), SMD (Wriggers & Schulten, 1999; Isralewitz et al., 2001; Xu et al., 2003; Li et al., 2005; Bikiel et al., 2006), LES (Scott et al., 2001), multiple copy sampling (Van Belle et al., 2000), activated MD (Bikiel et al., 2006), USMD (Kottalam & Case, 1988; Enyedy et al., 1998; Bui et al., 2003), extended MD (Bikiel et al., 2006), and implicit ligand sampling (Cohen et al., 2006). Both classical and especially enhanced sampling MD simulations provide such a level of information that cannot be achieved by contemporary experimental methods. This apparent advantage of computations over experiments is at the same time the major drawback of the simulations as they do not have corresponding experimental validation. Thus, interpretation of the simulations requires a special caution.
Determination of enzyme reaction mechanism. The task of determination of reaction mechanism can be tackled using variety of techniques and its scenario largely depends on particular case. From chemical point of view, there are various possibilities, how a substrate can be chemically modified by an enzyme into particular product; and the reaction can include more than one distinct chemical step, and thus one or more intermediates. It is therefore of high importance to get understanding of the underlying chemistry of the enzymatic reaction. This problem needs to be tackled from three points of view – structural (see 1.5.3.1), dynamical (see 1.5.3.2) and chemical. Identification of catalytic amino acid residues, substrate binding residues, cosubstrate/cofactor/coenzyme requirement and their binding sites, is crucial structural information for determination of reaction mechanism. This structural information can be obtained from both NMR and crystallography determination of protein structure in presence of substrates, products, cosubstrates and cofactors/coenzymes. Even in the protein crystal, an enzyme can perform its function. It is therefore possible to observe intermediates formed during complex enzymatic reaction by means of the socalled kinetic XC, by employing catching inermediate structures by freeze trapping methods or “realtimeresolved” Laue diffraction to “film proteins in action”, complemented by UV/visible singlecrystal spectroscopy (Bourgeois & Royant, 2005) or by singlecrystal microspectrophotometry (Pearson et al., 2004). Trapping intermediate states in a reaction pathway of membrane proteins is possible using timeresolved EC (Hite et al., 2007). Many enzymatic reactions involve hydrogen transfer (Howard et al., 2004; Stranzl et al., 2004), therefore ultrahigh resolution XC structure (Schmidt & Lamzin, 2007) or NC structure can be valuable source of structural information. Simultaneously, biochemical characterisation of the reaction with selected substrate should be performed aimed at determining steadystate kinetic constants, Km and kcat. Both chemical nature of the product and its quantification can be done by MS (Liesener & Karst, 2005). Finer degree of product identification can be achieved by combining gas chromatography, GC (James & Martin, 1952) with MS (Holmes & Morrell, 1957; Gohlke & McLafferty, 1993; Honour, 2006) and NMR spectroscopy. The deepest understanding of the reaction mechanism means identification of all intermediates, reversibility of individual reaction steps and their rate constants, thus determining the ratelimiting step of the reaction. This requires to measure enzyme kinetics before reaching steadystate. Two complementary approaches are available – rapid quenchflow (Ferguson & Roughton, 1934; Barman et al., 2006) and stoppedflow (Roughton, 1963; Copeland, 2000c). These biochemical experiments should be complemented with substrate and product inhibition experiments, and determination of cooperativity in oligomeric proteins, especially if there is indication of deviation from HenriMichaelisMenten kinetics. Valuable information can be also provided by specific isotopic exchange experiments, in which certain atom of substrate, cosubstrate, solvent or enzyme is exchanged for heavier isotope. If the isotope exchange affects enzymatic reaction, i.e. increases or decreases its rate, the particular species plays important role (Paneth, 2003).
Prediction of enzyme reaction mechanism. Proposed reaction mechanism can be further explored by molecular modelling techniques – hybrid QM/MM methods (Warshel & Levitt, 1976; Senn & Thiel, 2009), empirical valence bond (EVB) methods (Senn & Thiel, 2009), or by their combination (Olsson & Warshel, 2004; Rosta et al., 2006). The reaction must be modelled in both protein and water to get further structural and dynamical insight into the reaction and to identify source of catalytic power. This requires direct observation of transition states which is accessible by the molecular modelling techniques while it is beyond reach of contemporary experimental methods because of extremely short lifetime of transition state species (Lightstone et al., 1997).
62

1 Introduction
Generating protein variants by rational design. One of the key logical elements of scientific research is comparison. In the case of a protein, its full understanding requires determination of a structural, dynamical and functional role for all amino acid residues in the protein. Role of each amino acid residue can be best determined by comparison of the original protein with the one with the given position replaced by another amino acid residue. These changes in protein structure can be obtained via two possible ways: isolation of mutant protein from in vivo mutant, or performing specific mutagenesis of the gene in vitro. However, it is not possible to test all positions within protein for all 20 possible amino acid residue substitutions, and all their combinations because of limited number of atoms in Universe, estimated to ~ 9 1078 (Voet, 1999). Therefore, mutagenesis need to be performed at specific selected positions or regions, via the socalled sitedirected mutagenesis. This type of mutagenesis involves specific substitutions, deletions and insertions that are selected prior to mutagenesis based on structural (Chica et al., 2005) and, if available, dynamical and functional information available, and is thereby called “rational design” (Craik et al., 1985). The resulting mutant protein is structurally, dynamically, and functionally characterised and compared with original variant and role of the given amino acid residue for protein structure, dynamics and function can be assessed. Since not only the small number of amino acid residues in protein binding site, but also much larger number amino acid residues distant from the active site can be important for protein folding (e.g. folding gatekeepers) and protein dynamics linked to function (e.g. coupled motions, rigidbody motions, spiderweb motions, tunnel gating amino acid residues and binding site loop gate), the rational design might fail to identify all important amino acid residues and regions (Tousignant & Pelletier, 2004).
Generating protein variants by directed evolution. If the rational design fails to identify all important amino acid residues and coupling between them, or prior knowledge of structure, dynamics and function, and relationships between them is missing or limited due to complexity of the relationships, which is often the case (Cedrone et al., 2000; Tao & Cornish, 2002), then such a situation favours the use of an alternative mutagenesis approach – random mutagenesis (Chica et al., 2005). There is a number of random mutagenesis techniques that can generate the socalled naïve mutant libraries (Dalby, 2003; Sen et al., 2007), e.g.: errorprone PCR (epPCR); DNA shuffling (Stemmer, 1994a; Stemmer, 1994b); staggered extension process (StEP); random chimeragenesis on transient templates, RACHITT (Pelletier, 2001); increamental truncation for the creation of hybrid enzymes, ITCHY (Lutz et al., 2001); combination of ITCHY with DNA shuffling, SCRATCHY (Zhao et al., 2002); recombined extension on truncated templates, RETT; randompriming recombination, RPR; heteroduplex recombination; degenerate oligonucleotide gene shuffling, DOGS (Gibbs et al., 2001); random drift mutagenesis, RNDM (Bergquist et al., 2005); sequence saturation mutagenesis, SeSaM (Wong et al., 2004); and nucleotide exchange and excision technology, NexT (Müller et al., 2005). Due to randomness of the mutations, it is likely, that the mutant proteins are not capable to reach native fold (Chica et al., 2005). While sitedirected mutagenesis makes specific change which is subsequently explored for its effect on function, random mutagenesis must be followed by rapid and sensitive screen or selection method for the properties of interest (Chica et al., 2005), which is the major obstacle in this approach (Tao & Cornish, 2002). The combination of lowfrequency introduction of randomly distributed mutations in a gene, or genome (Patnaik et al., 2002; Zhang et al., 2002), of interest with selection/screening of naïve mutant library and sequencing of selected candidates, is referred to as “directed evolution”, a concept introduced already in 1967 by Spiegelman and coworkers (Mills et al., 1967; Tao & Cornish, 2002; Henry & Romesberg, 2005; Sen et al., 2007). Although, the use of this denomation has been disputed by Trevors & Abel (2004) who argue that experiment that is directed cannot be evolutionary, because evolution has no goal. Directed evolution differs from natural evolution in two key aspects: (i) natural evolution occurs under multiple and variable selection pressures, whereas directed evolution is accomplished under controlled selection pressure for predetermined function (Sen et al., 2007); and (ii) natural evolution favours functions advantageous to the survival of the organism (SchmidtDannert, 2001; Williams et al., 2004), whereas in directed evolution, “nonnatural” functions can be obtained (Sen et al., 2007).
Generating protein variants by semirational approach. Since both rational design and directed evolution have different advantages and disadvantages, they can be combined beneficially into the socalled semirational approach (Chica et al., 2005), e.g. saturation mutagenesis (Chica et al., 2005). The semirational approach exploits structure/dynamicsbased design to target random mutagenesis into specific regions or even individual amino acid residue positions, to generate the socalled smart mutant libraries that are supposed to more likely yield mutant with desired properties compared to naïve mutant libraries generated by random mutagenesis alone (Santoro & Schultz, 2002; Dalby, 2003; Mildvan, 2004; Chica et al., 2005). Improved search in sequence space can be also achieved by incorporating a strategy for analysis of protein sequence activity relationships, ProSAR (Fox et al., 2007), or by the use of nonnatural amino acids with novel functions (Wang et al., 2001). The semirational approach can be further aided by semirational combinatorial design, e.g. using protein design automation method, to eliminate protein sequences incompatible with protein fold (Hayes et al., 2002), by exploiting Indel PDB database of insertions and
63

1 Introduction
deletions derived from sequence alignment of closely related proteins (Hsing & Cherkasov, 2008), and by considering organismspecific codon usage (Angov et al., 2008; Welch et al., 2009). It can be also beneficial to introduce some mutations via random mutagenesis to identify “leads” and then finetune the leads by saturation mutagenesis of the identified amino acid residues (Chica et al., 2005), or to perform several rounds of saturation mutagenesis in the socalled iterative saturation mutagenesis (ISM) approaches. Examples of ISM include combinatiorial active site saturation test (CAST) approach for evolving substrate acceptance and/or enantioselectivity (Reetz et al., 2005; Reetz et al., 2006a; Reetz et al., 2009), and Bfactor saturation test (BFIT) approach for isolation of mutant proteins with improved stability (Reetz et al., 2006b; Reetz & Carballeira, 2007; Reetz et al., 2009). Semirational approach, compared to rational design and directed evolution, can more likely yield proteins with improved (finetuned) an already existing function, e.g. change in ligand binding affinity, ligand specificity, and/or rate of enzymatic reaction (Sen et al., 2007), and is thus exploited when aimed (i) at understanding possible evolutionary pathways towards modification or change in function (Valuev et al., 2002) or (ii) to obtain protein with improved properties for use in industrial applications. It should be noted that the successes in redesigning or “evolving” proteins, while occasionally very impressive, are precisely impressive because they are so hard to reproduce (Lupas, 2008) because of complexity of protein structuredynamicsfunction relationships that are not yet understood to the fundamental level.
1.6 Model system
1.6.1 Selecting a protein
Scientific criteria. Every protein is worth to study because every protein may reveal important information on structuredynamicsfunction relationships in evolutionary perspective that might fill a gap in our understanding of the role of proteins in living organisms (Kendrew, 1962). Particular choice of a protein depends on many criteria that can be divided into two broad aspects, living organism (bacteria, archaea, eucarya) and biological role of a protein. Bacteria are often the choice because of the following properties: (i) bacteria are ubiquitous; (ii) life on Earth depends on bacteria; (iii) some bacteria cause diseases; (iv) some bacteria can be exploited for human benefit; (v) bacteria are unicellular, haploid (although they might contain more than just one copy of genome at a time) and rapidly reproducing; and (vi) laboratory manipulation (e.g. mutagenesis and killing) is apparently considered by the general public as ethically acceptable. Enzymes are then often the choice because of all the protein functions, fundamentally the most important for life is the catalytic function (Koshland Jr., 2002b).
Nonscientific criteria. Besides the scientific criteria, there are also some nonscientific criteria, e.g. funding and established laboratory. Ease of obtaining funding for the research is influenced by the apparent “attractivity” of the selected living organism and/or protein. For me, as a student, the choice was also influenced by focus of the laboratory that offered me the possibility to perform doctoral research.
Choice for a bacterial haloalkane dehalogenase enzyme. All the above mentioned aspects contributed to the choice for a bacterial haloalkane dehalogenase enzyme for study of structuredynamicsfunction relationships within the scope of my doctoral research.
1.6.2 Haloalkane dehalogenases
1.6.2.1 Source of haloalkane dehalogenases
Bacteria and Eucarya. Haloalkane dehalogenase genes have been so far identified only in bacteria primarily isolated from environment contaminated by halogenated compounds (Keuning et al., 1985; Scholtz et al., 1987; Yokota et al., 1987; Janssen et al., 1988; Sallis et al., 1990; Kulakova et al., 1995; Kulakova et al., 1997; Nagata et al., 1997; Poelarends et al., 1998; Poelarends et al., 1999; Kulakov et al., 1999) or identified from genome sequences (Jesenská et al., 2002; Sato et al., 2005). More than 48 bacterial species are known to possess a gene encoding for haloalkane dehalogenase, or putative haloalkane degalogenase gene (Table 10; van den Wijngaard et al., 1992; Chovancová et al., 2007). Phylogenetic diversity of the bacterial species harbouring haloalkane dehalogenase genes suggests widespread occurrence of these genes in bacteria (Chovancová et al., 2007). Additionally, three putative haloalkane dehalogenase genes have been identified in three eucaryotic organisms (Table 10; Chovancová et al., 2007). It can be expected that many more bacterial and eucaryotic species will be identified to bear putative haloalkane dehalogenase genes as more and more genome and metagenome sequences will
64

1 Introduction
be determined (Janssen et al., 2005).
Table 10 | Source of (putative) haloalkane dehalogenases.a,b
Bacteriac EucaryaAgrobacterium tumefaciens (DatA)Ancylobacter aquaticus (DhlA)Bradyrhizobium japonicum (DbjA)Burkholderia sp.Burkholderia cenocepaciaCaulobacter crescentusChloroflexus aurantiacusColwellia psychrerythraeaDesulfotalea psychrophilaDesulfuromonas acetoxidansErythrobacter litoralisJannaschia sp.Lyngbya majusculaMesorhizobium loti (DmlA)Mycobacterium sp. (DhaA)Mycobacterium avium (DhmA)Mycobacterium bovis (DmbA, DmbB, DmbC)Mycobacterium smegmatis (DmsA)Mycobacterium tuberculosis (DmbA, DmbB, DmbC)Nocardia farcinicaPelobacter propionicusPhotobacterium profundumPolaromonas sp.Pseudoalteromonas atlantica
Pseudomonas pavonaceaePsychrobacter cryohalolentis Rhodococcus sp. (DhaA)Rhodococcus rhodochrous (DhaA)Rhodopirellula baltica (DrbA)Shewanella sp.Shewanella amazonensisShewanella balticaShewanella denitrificansShewanella frigidimarinaShewanella oneidensisShewanella putrefaciensSphingobium francense (LinB)Sphingobium japonicum (LinB)Sphingobium indicum (LinB)Streptomyces avermitilisXanthobacter autotrophicus {DhlA)Xanthobacter flavus {DhlA)Xanthomonas axonopodisXanthomonas oryzaeXanthomonas campestrisXylella fastidiosa
Renilla muellerid
Renilla reniformisd
Strongylocentrotus purpuratuse
aObtained by PSIBLAST search.bAccording to Chovancová et al. (2007).cExperimentally characterised haloalkane dehalogenases are given in parentheses.dAlso known as sea pansy.eAlso known as purple sea urchin.
Evolution of haloalkane dehalogenase genes. Some bacteria have already revealed to bear two or more same or different genes encoding haloalkane dehalogenases (Jesenská et al., 2005; Ito et al., 2007) or putative haloalkane dehalogenase genes (Table 11; Chovancová et al., 2007) and different strains of same or even different bacterial species isolated from different sites around the World have been identified to contain identical or nearly identical haloalkane dehalogenase genes encoding identical enzymes (Table 12; Janssen et al., 1995; Poelarends et al., 1998; Poelarends et al., 1999; Poelarends et al., 2000a; Poelarends et al., 2000b; Chovancová et al., 2007). These observations suggest recent distribution and divergence of haloalkane dehalogenase genes from ancestral genes (Poelarends et al., 2000a; Ito et al., 2007) by gene duplication (Jesenská et al., 2000; Jesenská et al., 2005; Chovancová et al., 2007; Pavlová et al., 2007) and horizontal gene transfer (van den Wijngaard et al., 1992; Janssen et al., 1995; Poelarends et al., 1998; Poelarends et al., 1999; Poelarends et al., 2000a; Poelarends et al., 2000b; Ito et al., 2007; Wu et al., 2007; Mazumdar et al., 2008). Although, the recent distribution has been recently disputed by Janssen (2004).
Table 11 | Bacteria with two or more (putative) haloalkane dehalogenase genes.a,b
Bacteria Number of genesJannaschia sp. CCS1 2Mycobacterium avium K10 2Mycobacterium bovis AF2122/97 3Mycobacterium tuberculosis H37Rv 3Shewanella frigidimarina NCIMB 400 3aObtained by PSIBLAST search.bAccording to Chovancová et al. (2007).
65

1 Introduction
Table 12 | Different species of bacteria with identical or nearly identical (putative) haloalkane dehalogenases.a,b,c
Protein BacteriaDhlA Xanthobacter autotrophicus
Xanthobacter flavusAncylobacter aquaticus
DhaA Rhodococcus rhodochrousPseudomonas pavonaceaeMycobacterium sp. GP1
LinB Sphingobium francenseSphingobium indicumSphingobium japonicum
DmbA Mycobacterium bovisMycobacterium tuberculosis
DmbB Mycobacterium bovisMycobacterium tuberculosis
DmbC Mycobacterium bovisMycobacterium tuberculosis
Putative Xanthomonas axonopodisXanthomonas campestrisXanthomonas oryzae
Putative Shewanella balticaShewanella oneidensisShewanella putrefaciens
aObtained by PSIBLAST search.bAccording to Chovancová et al. (2007).cAmino acid sequence identity > 90%.
1.6.2.2 Biological role of haloalkane dehalogenases
Detoxification. Haloalkane dehalogenases have been so far determined to perform only hydrolytic dehalogenation of some halogenated aliphatic hydrocarbons into corresponding alcohols and halides, EC 3.8.1.5 (Janssen et al., 1985; Nagata et al., 1993; Kulakova et al., 1995; Jesenská et al., 2000; Jesenská et al., 2002; Sato et al., 2005; Jesenská et al., 2009). Some of the substrates of haloalkane dehalogenases are known to be produced naturally as secondary metabolites by living organisms, e.g. by marine algae presumably for chemical defense (Gribble, 2003), and by abiogenic processes (Table 13; Gribble, 2003; Gribble, 2004). However, wast majority of the substrates of haloalkane dehalogenases have been introduced into the environment also or exclusively by human during last century, as the socalled xenobiotics (Table 14). Since many of these xenobiotics are highly toxic and genotoxic (Chroust et al., 2007), haloalkane dehalogenases could have evolved to convert the highly toxic halogenated aliphatic hydrocarbons into less toxic alcohols. Haloalkane dehalogenase could have been derived for such purpose from enzymes converting natural halogenated substrates, or evolved from enzymes catalysing the same reaction type on nonhalogenated compounds (Janssen et al., 1995).
Table 13 | Natural source of substrates of haloalkane dehalogenases.a
Marine algae Volcano Rock, mineralsand shales
Biomassburning
Humificationprocesses in peat
Rice paddies
ChloromethaneBromomethaneIodomethaneBromochloromethaneBromoethaneIodoethaneBromoiodoethane1,2Dibromoethane1Bromopropane1Iodopropane1Iodobutane1Bromopentane1Iodopentane
ChloromethaneBromomethaneIodomethane
ChloromethaneBromoethane
ChloromethaneBromomethane
ChloromethaneBromomethaneIodomethane
ChloromethaneBromomethaneIodomethane
aAccording to Gribble (2003; 2004).
66

1 Introduction
Table 14 | Anthropogenic source of substrates of haloalkane dehalogenases.a
Compound UseBromomethane Pesticide
SolventChloroethane Solvent
RefrigerantProduction of celluloseProduction of dyesProduction of medicinal drugs
1,2Dichloroethane Production of vinyl chlorideSolventLead remover from gasoline
1,2Dibromoethane Industrial fumigant1,2Dichloropropaneb Soil fumigant
Industrial solvent 1,2,3Trichloropropanec Industrial solvent
Paint removerVarnish removerCleaning agentDegreasing agent
1,2Dibromo3chloropropane Nematocide1,2,3Tribromopropane Nematocide1,3Dichloropropene PesticideHexachlorocyclohexane InsecticideaAccording to Agency for Toxic Substances & Disease Registry (http://www.atsdr.cdc.gov/).bAlso produced as byproduct of epichlorohydrine and propylene oxid manufacture.cAlso produced as byproduct of epichlorohydrine and 1,2dichloropropene manufacture.
Metabolism. Additionally, the alcohols could be further metabolised and used as carbon and energy source, if approriate metabolic pathways are established within the bacterium. Indeed, some bacteria are capable of growing on halogenated aliphatic hydrocarbons as a sole carbon and energy source with haloalkane dehalogenase being the initial enzyme of the catabolic metabolic pathway (Table 15 and Fig 23; Janssen et al., 1984; Janssen et al., 1985; Janssen et al., 1987; Yokota et al., 1987; van den Wijngaard et al., 1992; Janssen et al., 1995; Kulakova et al., 1997; Nagata et al., 1993; Poelarends et al., 1998; Poelarends et al., 1999; Poelarends et al., 2000b). These bacteria can thus manage both: (i) protection against deleterious effects of the toxic halogenated aliphatic hydrocarbons; and (ii) use of these compounds as carbon and energy source. Presence of the whole metabolic pathway thus provides selective advantage for these bacteria in highly poluted environments. On the other hand, other bacteria possess haloalkane dehalogenase genes but not the other components for the use of these compounds as carbon and energy source. This may suggest that (i) haloalkane dehalogenase genes evolved and/or have been acquired only recently by the bacteria and full metabolic pathway could have not yet been established in the bacterium (Bosma et al., 1999), and (ii) that the primary biological role of haloalkane dehalogenases is protection against adverse effects of the toxic compounds, whereas providing alcohols for their use as carbon and energy source represents a secondary advantage.
Another function. Another possibility is that haloalkane dehalogenases may execute an additional function which, however, remains to be identified. In this context, presence of haloalkane dehalogenases in mycobacteria isolated from animal tissues is especially intruiging (Jesenská et al., 2000; Jesenská et al., 2002). Attempts to understand role of haloalkane dehalogenases in mycobacteria has so far been sparse and rather speculative (Janssen, 2004): Haloalkane dehalogenases in mycobacteria could had been acquired before they evolved from soil bacteria to animal parasites (Jesenská et al., 2000) or could be involved in the detoxification of halogenated compounds produced in animal tissues by peroxidases (Janssen, 2004). Recently, haloalkane dehalogenase DmbA have been identified to be overexpressed after phagocytosis of Mycobacterium tuberculosis Kstrain by human monocytic cell line U937 but it is not clear whether the protein expression profile change is truly due to phagocytosis (Ryoo et al., 2007) and what would be the function of the protein. Hence the biological role of haloalkane dehalogenases in mycobacteria still remains to be solved.
67

1 Introduction
Table 15 | Bacteria growing on haloalkanes as sole carbon and energy source and responsible haloalkane dehalogenase for initial dehalogenation.Bacteria Haloalkane
dehalogenaseSole carbon and energy source
Xanthobacter autothrophicus GJ10 DhlA Bromochloromethane (Torz et al., 2007)Dibromomethane (Torz et al., 2007)1,2Dichloroethane (Janssen et al., 1984; Janssen et al., 1985; Janssen et al., 1987)1Bromo2chloroethane (Torz et al., 2007)
Ancylobacter aquaticus AD20, AD25, AD27 DhlA 1,2Dichloroethane (van den Wijngaard et al., 1992)Pseudomonas pavonaceae 170 DhaA 1,3Dichloropropene (Poelarends et al., 1998)Mycobacterium sp. GP1 DhaA 1,2Dibromoethane (Poelarends et al., 1999)
1Chloropropane (Poelarends et al., 1999)1Bromopropane (Poelarends et al., 1999)
Rhodococcus rhodochrous NCIMB 13064 DhaA 1Chlorooalkanes (C3C8) (Kulakova et al., 1997; Poelarends et al., 2000b)
Rhodococcus sp. m153 DhaA 1Chlorobutane (Yokota et al., 1987)Shingobium japonicum UT26 LinB Hexachlorocyclohexane γ (Nagata et al., 1993)
Fig 23 (pp. 6869) | Examples of halogenated aliphatic hydrocarbon utilisation metabolic pathways in bacteria. (a) Utilisation of 1,2dichloroethane by Xanthobacter autothrophicus GJ10 and Ancylobacter aquaticus by the action of haloalkane dehalogenase, DhlA, alcohol dehydrogenase with PQQ cofactor, aldehyde dehydrogenase with NAD cofactor and haloacetate dehydrogenase, DhlB (Janssen et al., 1995; Poelarends et al., 1999); (b) utilisation of 1,2dibromoethane by Mycobacterium sp. GP1 by the action of haloalkane dehalogenase, DhaA, and halohydrin halogenhalide lyase, Hlyase (Poelarends et al., 1999; Poelarends et al., 2000b); (c) utilisation of 1chlorobutane by Rhodococcus rhodococcus NCIMB 13064 by the action of haloalkane dehalogenase, DhaA, cofactordependent (X) alcohol dehydrogenase and cofactor
68
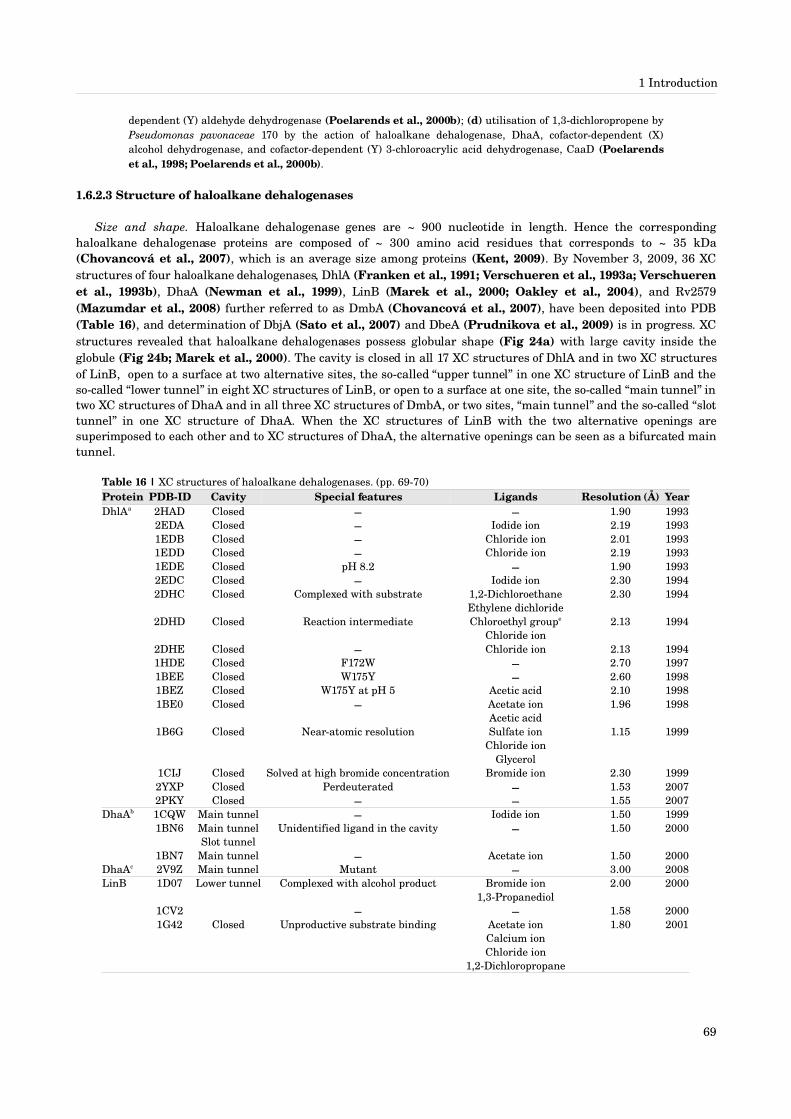
1 Introduction
dependent (Y) aldehyde dehydrogenase (Poelarends et al., 2000b); (d) utilisation of 1,3dichloropropene by Pseudomonas pavonaceae 170 by the action of haloalkane dehalogenase, DhaA, cofactordependent (X) alcohol dehydrogenase, and cofactordependent (Y) 3chloroacrylic acid dehydrogenase, CaaD (Poelarends et al., 1998; Poelarends et al., 2000b).
1.6.2.3 Structure of haloalkane dehalogenases
Size and shape. Haloalkane dehalogenase genes are ~ 900 nucleotide in length. Hence the corresponding haloalkane dehalogenase proteins are composed of ~ 300 amino acid residues that corresponds to ~ 35 kDa (Chovancová et al., 2007), which is an average size among proteins (Kent, 2009). By November 3, 2009, 36 XC structures of four haloalkane dehalogenases, DhlA (Franken et al., 1991; Verschueren et al., 1993a; Verschueren et al., 1993b), DhaA (Newman et al., 1999), LinB (Marek et al., 2000; Oakley et al., 2004), and Rv2579 (Mazumdar et al., 2008) further referred to as DmbA (Chovancová et al., 2007), have been deposited into PDB (Table 16), and determination of DbjA (Sato et al., 2007) and DbeA (Prudnikova et al., 2009) is in progress. XC structures revealed that haloalkane dehalogenases possess globular shape (Fig 24a) with large cavity inside the globule (Fig 24b; Marek et al., 2000). The cavity is closed in all 17 XC structures of DhlA and in two XC structures of LinB, open to a surface at two alternative sites, the socalled “upper tunnel” in one XC structure of LinB and the socalled “lower tunnel” in eight XC structures of LinB, or open to a surface at one site, the socalled “main tunnel” in two XC structures of DhaA and in all three XC structures of DmbA, or two sites, “main tunnel” and the socalled “slot tunnel” in one XC structure of DhaA. When the XC structures of LinB with the two alternative openings are superimposed to each other and to XC structures of DhaA, the alternative openings can be seen as a bifurcated main tunnel.
Table 16 | XC structures of haloalkane dehalogenases. (pp. 6970)Protein PDBID Cavity Special features Ligands Resolution (Å) YearDhlAa 2HAD Closed 1.90 1993
2EDA Closed Iodide ion 2.19 19931EDB Closed Chloride ion 2.01 19931EDD Closed Chloride ion 2.19 19931EDE Closed pH 8.2 1.90 19932EDC Closed Iodide ion 2.30 19942DHC Closed Complexed with substrate 1,2Dichloroethane
Ethylene dichloride2.30 1994
2DHD Closed Reaction intermediate Chloroethyl groupe
Chloride ion2.13 1994
2DHE Closed Chloride ion 2.13 19941HDE Closed F172W 2.70 19971BEE Closed W175Y 2.60 19981BEZ Closed W175Y at pH 5 Acetic acid 2.10 19981BE0 Closed Acetate ion
Acetic acid1.96 1998
1B6G Closed Nearatomic resolution Sulfate ionChloride ion
Glycerol
1.15 1999
1CIJ Closed Solved at high bromide concentration Bromide ion 2.30 19992YXP Closed Perdeuterated 1.53 20072PKY Closed 1.55 2007
DhaAb 1CQW Main tunnel Iodide ion 1.50 19991BN6 Main tunnel
Slot tunnelUnidentified ligand in the cavity 1.50 2000
1BN7 Main tunnel Acetate ion 1.50 2000DhaAc 2V9Z Main tunnel Mutant 3.00 2008LinB 1D07 Lower tunnel Complexed with alcohol product Bromide ion
1,3Propanediol2.00 2000
1CV2 1.58 20001G42 Closed Unproductive substrate binding Acetate ion
Calcium ionChloride ion
1,2Dichloropropane
1.80 2001
69

1 Introduction
Protein PDBID Cavity Special features Ligands Resolution (Å) YearLinB 1G4H Closed Complexed with alcohol product Calcium ion
Chloride ion1Butanol
1.80 2001
1G5F Upper tunnel Unproductive substrate binding 1,2Dichloroethane 1.80 20011IZ7 Lower tunnel Chloride ion
Calcium ion1.58 2002
1IZ8 Lower tunnel Complexed with alcohol product Bromide ionCalcium ion
1,3Propanediol
2.00 2002
1K5P Lower tunnel Chloride ionMagnesium ion
1.80 2003
1K6E Lower tunnel Complexed with alcohol product Bromide ionChloride ion
Magnesium ion1,2Propanediol
1Bromopropane2ol
1.85 2003
1K63 Lower tunnel Complexed with alcohol product Bromide ionChloride ion
Magnesium ion2Bromo2propene1ol
1.80 2003
1MJ5 Lower tunnel Atomic resolution Magnesium ionChloride ion
0.95 2003
2BFN Lower tunnel Complexed with alcohol product Calcium ionChloride ion
2,3Dichloropropane1ol
1.60 2006
DmbAd 2O2H Main tunnel Unproductive substrate binding Chloride ionAcetate ion
1,2DichloroethaneEthylene dichloride
1.60 2007
2O2I Main tunnel Complexed with alcohol product Bromide ion1,3Propandiol
1.50 2007
2QVB Main tunnel Chloride ion1,2Ethanediol
1.19 2008
aSource – Xanthobacter autotrophicus GJ10.bSource – Rhodococcus sp.cSource – Rhodococcus rhodochrous NCIMB 13064.dSource – Mycobacterium tuberculosis H37Rv.eCovalently attached to Asp124.
Fold. The XC structures also revealed that haloalkane dehalogenases contain an eightstranded central sheetβ and eleven helices located in the excursions from the sheet α β (Figs 24c and 25; Franken et al., 1991; Verschueren et al., 1993a; Verschueren et al., 1993b; Newman et al., 1999; Marek et al., 2000; Oakley et al., 2004; Mazumdar et al., 2008). Six of the eleven helices (AF) are located between consecutive strands and theyα β are packed against the sheet faces in arrangement β αβα (Figs 24c and 25) that was also identified in some other hydrolases, e.g. acetylcholinesterase from Torpedo californica, carboxypeptidase II from wheat, dienelactone hydrolase from Pseudomonas sp. B13 and lipase from Geotrichum candidum (Ollis et al., 1992). Sequence and structure comparison revelead that all these hydrolases are related by extreme divergent evolution from a common ancestor and the / fold was called according to the structure and function, / hydrolase fold α β α β (Ollis et al., 1992). The extreme divergence of / hydrolase superfamily is manifested by extensive secondary structure embellishmentsα β with strands 3 to 7 and helix C being the only fully conserved secondary structure elements β α (Ollis et al., 1992; Heikinheimo et al., 1999; Nardini & Dijkstra, 1999; Holmquist, 2000). The largest variability among / α βhydrolases is situated between the strand 6 and the helix D that may be few amino acid residues or large enoughβ α to be considered as a separate domain (Ollis et al., 1992; Heikinheimo et al., 1999; Nardini & Dijkstra, 1999); the latter is the case of haloalkane dehalogenases which contain about 80 amino acid residue long excursion between the strand 6 and the helix D. The excursion is composed of five helices collocated in space and packed one toβ α α each other and to the sheet edge β (Fig 25). In haloalkane dehalogenases, the / hydrolase fold and the helicalα β excursion are called main domain and cap domain, respectively (Fig 24d).
Functional role of the main domain. The main domain provides three catalytic amino acid residues, the socalled catalytic triad, in the sequence order conserved among all / hydrolases as follows: nucleophile, Asp; acid, Asp orα β
70

1 Introduction
Glu; and base, His (Fig 25; Ollis et al., 1992; Heikinheimo et al., 1999; Nardini & Dijkstra, 1999; Holmquist, 2000). The topological arrangement of the catalytic triad is conserved among / hydrolases which explains why theα β
strands 3 to 7 are always present and signifies the importance of the arrangement for performing the hydrolyticβ function (Ollis et al., 1992; Heikinheimo et al., 1999; Nardini & Dijkstra, 1999; Holmquist, 2000). The nucleophile is located in a highly conserved sharp like turn, the socalled nucleophile elbow, located between γ βstrand 5 and the only conserved helix C α (Ollis et al., 1992; Arand et al., 1994; Cousin et al., 1998; Nardini & Dijkstra, 1999; Holmquist, 2000; Orengo et al., 2002). The sequence around the nucleophile has the canonical form of SmXNuXSmSm, where Sm is a small amino acid residue important to allow sharp protein backbone direction reversal, usually Gly, X is a variable amino acid residue and Nu is the nucleophile, Asp in haloalkane dehalogenases and Asp/Ser/Cys in other / hydrolases α β (Ollis et al., 1992; Heikinheimo et al., 1999; Nardini & Dijkstra, 1999; Holmquist, 2000). The and dihedral angles of the nucleophile take unfavourable valuesφ ψ suggesting importance of the strained geometry for function (Ollis et al., 1992). The base is always His located at the first position of a reverse turn in the socalled His loop between the strand 8 and helix F (β α Ollis et al., 1992). In contrast to the nucleophile and the base, the acid shows variability in both nature and position even among haloalkane dehalogenases which is yet another evidence for extreme robustness of the / hydrolase foldα β (Heikinheimo et al., 1999; Nardini & Dijkstra, 1999; Holmquist, 2000; Skjøt et al., 2009). Asp as the acid is situated in the loop between the strand 8 and helix F in DhlA β α (Fig 25a) whereas Glu as the acid is situated in the loop between the strand 6 and the cap domain in DhaA, LinB and DmbA β (Fig 25b). It has been proposed that repositioning of the catalytic acid occurred for optimising the substrate specificity of DhlA (Krooshof et al., 1997) although this proposal has been recently disputed by phylogenetic analysis (Chovancová et al., 2007).
Functional role of the cap domain. The internal, predominantly hydrophobic cavity is formed due to the cap domain that buries the catalytic triad and other amino acid residues at the edge of the sheet. The cavity isβ contributed both by the main and especially by the cap domain amino acid residues. While the main domain contribution to the cavity is largely conserved among haloalkane dehalogenases as it includes catalytic triad and their neighbouring, often conserved, amino acid residues and only few others, the cap domain contributions differ due to differences in arrangement of helices and their amino acid residue composition α (Chovancová et al., 2007). The cap domain also provides the openings to the surface observed in DhaA, LinB and DmbA (Fig 24b). The differences in size and shape of the cavity and its openings imposed by different cap domains are therefore considered to be the major determinants of substrate specificity that varies among haloalkane dehalogenases (Pries et al., 1994b; Callebaut et al., 2000; Marek et al., 2000; Jesenská et al., 2002; Chaloupková et al., 2003). The ancestor cap domain has been proposed to be composed of helices 4, 5', 5, 6 and 7 based on phylogenetic analysis α (Chovancová et al., 2007). Loss of the helix 5' and insertion of the helix 4' at the Nterminus of the cap domain has beenα α proposed as an evolutionary event towards DhlA cap domain composed of helixes 4', 4, 5, 6 and 7 α (Chovancová et al., 2007). Interestingly, the helices 4, 5, 6 and 7 of the cap domain of DhlA as well as the corresponding excursionα in some other / hydrolases, e.g. carboncarbon bond hydrolase and haloperoxidase families α β (Callebaut et al., 2000) resembles uteroglobin fold (Russell & Sternberg, 1997). It is, however, not clear whether the similarity represents a remote homology, implying horizontal gene transfer, or a convergence to a common four helix binding motif devotedα to hydrophobic ligand binding (Callebaut et al., 2000). Considering the proposed origin of the DhlA cap domain, the latter is more parsimonious and thus more likely (Chovancová et al., 2007). Although, evolutionary changes do not always follow the most parsimonious solution (Albert, 2005).
Substrate binding site. Even though haloalkane dehalogenases are functionally active in the crystal making capturing the enzymesubstrate complex an extremely difficult task, by specifc crystalisation conditions (low temperature and pH), a complex of DhlA with 1,2dichloroethane (PDBID 2DHC) was captured by Verschueren et al. (1993d). The 2DHC structure revealed binding of the substrate into the cavity with one halogen positioned inbetween two indol ring nitrogens of two Trp amino acid residues: one Trp immediately follows the catalytic nucleophile and the other Trp is situated in the cap domain helix 4 α (Fig 25a). DhaA, LinB and DhaA are conserved with DhlA in the position and the nature of the main domain Trp. In the position of the other halogen/halide Trp, DhaA, LinB and DmbA contain Asn provided by the loop between the strand 3 and the helix A β α (Fig 25b). The catalytic triad and the two halidestabilising amino acid residues have been denoted collectively as the catalytic pentad (Janssen, 2004).
71

1 Introduction
Fig 24 | XC structures of haloalkane dehalogenases. (a) Surface representation of the XC structures of DhlA (PDBID 2HAD), DhaA (PDBID 1BN6), LinB (PDBID 1CV2) and DmbA (PDBID 2QVB); (b) crosssection of the surface representation of the XC structures of DhlA (PDBID 2HAD), DhaA (PDBID 1BN6), LinB (PDBIDs 1G5F + 1CV2) and DmbA (PDBID 2QVB), showing the cavity and its openings to the surface; (c) cartoon representation of the XC structures of DhlA (PDBID 2HAD), DhaA (PDBID 1CQW), LinB (PDBID 1CV2) and DmbA (PDBID 2QVB), coloured by secondary structure elements: helices, red; strands, yellow; turns and loops, green; α β (d) cartoon representation of the XC structures of DhlA (PDBID 2HAD), DhaA (PDBID 1CQW), LinB (PDBID 1CV2) and DmbA (PDBID 2QVB), coloured by domains: the main domain, grey; the cap domain, blue. The surface representations are modelled by 1.4 Å probe corresponding to the approximate size of a water molecule. The sheet has an obligatory righthanded twist: the strandsβ β 1 and 8 cross each other at an angle ~ 90°. The domain boundaries are approximate. The view in ab is different from cd.
72

1 Introduction
Fig 25 | Topological arrangement of secondary structure elements in haloalkane dehalogenases. (a) DhlA, (b) DhaA, LinB and DmbA. The central sheet has the strand order 12435678, of which all strands run in parallel except for anβ β β antiparallel strand 2. helix A is located between strands 3 and 4, helix B is located between strands 4 and 5, helixβ α β α β α C is located between strands 5 and 6, helix D is located between strands 6 and 7, helix E is located between strandsβ α β α β 7 and 8, and helix F is located after strand 8. Four of the six helices are packed against one face (B, C, D and E) and twoα β α are packed against the other face of the sheet (A and F). The largest excursion, the cap domain (highlight by dotted box) isβ located between the strand 6 and the helix D, and contains five helices. DhlA contains an aditional twostranded sheetβ α α β embellishment close to the Nterminus (highlighted by dashed box). The catalytic amino acid residues are coloured as follows: the nucleophile, orange; the acid, grey; the base, magenta; halidestabilising amino acid residues, blue and cyan. Both conventional / hydrolasespecific (letters) and haloalkanedehalogenasespecific annotation (numbers) of the main domain α β αhelices is given. Redrawn according to Chovancová et al. (2007).
73

1 Introduction
Classification of the haloalkane dehalogenase family. Recently, a phylogenetic tree of haloalkane dehalogenase family has been reported that classified 12 experimentally characterised and 32 putative haloalkane dehalogenases (Table 10) into three subfamilies denoted by Roman numerals, I, II and III (Table 17; Chovancová et al., 2007). The major determinants of the classification are (i) variability in the cap domains, (ii) variability in the position and nature of the catalytic acid and (iii) variability in the second halidestabilising amino acid residue (Chovancová et al., 2007). Although no XC structure is available for haloalkane dehalogenases from subfamily III, the phylogenetic analysis allowed identification of the catalytic triad amino acid residues to be analogous to the subfamily I, identification of halidestabilising amino acid residues to be analogous to the subfamily II, and identification of the arrangement of the cap domain helices to be analogous to the subfamily II α (Chovancová et al., 2007).
Table 17 | Haloalkane dehalogenase subfamilies and their experimentally characterised representatives.a
Subfamily Catalyticnucleophile
Catalyticacid
Catalyticbase
Halidestabilising Protein Source
I Asp123 Asp250 His279 Trp124 and Trp164 DhmA Mycobacterium avium N85Asp123 Asp250 His279 Trp124 and Trp164 DmbB Mycobacterium tuberculosis H37RvAsp124 Asp260 His289 Trp125 and Trp175 DhlA Xanthobacter autotrophicus GJ10
II Asp114 Glu138 His280 Asn49 and Tyr115 DatA Agrobacterium tumefaciens C58Asp103 Glu127 His280 Asn38 and Trp104 DbjA Bradyrhizobium japonicum USDA110Asp110 Glu134 His278 Asn45 and Trp111 DmlA Mesorhizobium loti MAFF303099Asp107 Glu131 His272 Asn37 and Trp108 DmsA Mycobacterium smegmatis ATCC700084Asp109 Glu133 His273 Asn39 and Trp110 DmbA Mycobacterium tuberculosis H37RvAsp106 Glu130 His272 Asn38 and Trp107 DhaA Rhodococcus rhodochrous NCIMB 13064Asp108 Glu132 His272 Asn41 and Trp109 LinB Sphingobium japonicum UT26
III Asp109 Asp238 His267 Asn43 and Trp110 DmbC Mycobacterium tuberculosis H37RvAsp139 Asp272 His300 Asn71 and Trp140 DrbA Rhodopirellula baltica SH1
aAccording to Chovancová et al. (2007).
1.6.2.4 Function of haloalkane dehalogenases
Substrate specificity. So far, haloalkane dehalogenases have been found to be active with a wide range of halogenated aliphatic alkanes, alcohols, ethers, esters, alkylbenzenes and cyanides with the cleaving halogen being bound to sp3hybridised carbon atom (Tables 18 and 19). The broad substrate specificities of DhlA (Keuning et al., 1985; Janssen et al., 1988; Pries et al., 1994b; Schanstra et al., 1996b; Schanstra et al., 1996a; Schindler et al., 1999), DhaA (Yokota et al., 1987; Kulakova et al., 1997; Poelarends et al., 1998; Schindler et al., 1999; Bosma et al., 1999; Bosma et al., 2002; Bosma et al., 2003; Prokop et al., 2006), LinB (Nagata et al., 1993; Nagata et al., 1997; Nagata et al., 1999; Marvanová et al., 2001; Nagata et al., 2003; Chaloupková et al., 2003; Nagata et al., 2005; Kmuníček et al., 2005; Prokop et al., 2006; Raina et al., 2007; Monincová et al., 2007; Raina et al., 2008), DhmA (Jesenská et al., 2002), DbjA (Sato et al., 2005) and DmlA (Sato et al., 2005) that have been reported so far are in agreement with the detoxifying and metabolic biological roles of haloalkane dehalogenases because bacteria bearing haloalkane dehalogenases are being exposed to rapidly changing environment manifested by fluctuating concentrations of various haloalkanes from natural and/or anthropogenic sources. Since the inevitable tradeoff between the substrate specificity and rate of conversion, haloalkane dehalogenases have apparently evolved towards plasticity while sacrificing secclusion, and hence the rate of conversion, and they are in a local evolutionary optimum because enhancement of one step of the reaction cycle (vide infra) often results in reduced rate for another step, as demonstrated for DhlA (Schanstra et al., 1996a; Krooshof et al., 1997; Krooshof et al., 1998) and LinB (Chaloupková et al., 2003; Nagata et al., 2003). Haloalkane dehalogenases differ one to each other by the substrate range and their rate of conversions showing different preferential dehalogenating activities, the socalled substrate specificity profiles (Kmuníček et al., 2001; Kmuníček et al., 2003; Kmuníček et al., 2005; Sato et al., 2005). Even chemically similar substrates can differ greatly in rate of conversion by a haloalkane dehalogenase (Chaloupková et al., 2003). For example, 1,2dibromoethane is one of the best known substrate for DhaA with kcat/Km ≈ 3.7 103 s1 M1, whereas its chlorinated analog is not converted by DhaA at all (Bosma et al., 1999; Schindler et al., 1999).
74

1 Introduction
Table 18 | Substrate range of haloalkane dehalogenases DhlA, DhaA and LinB.a (pp. 7576)Group DhlA DhaA LinBHalomethanes Chloromethane
BromomethaneIodomethaneDichloromethaneDibromomethaneBromochloromethaneBromocyanomethane
NR NR
1Haloalkanes ChloroethaneBromoethaneIodoethane1Chloropropane1Bromopropane1Iodopropane1Chlorobutane1Bromobutane1Chloropentane1Bromopentane1Chlorohexane1Bromohexane1Chlorooctane1Bromooctane
Bromoethane1Chloropropane1Bromopropane1Chlorobutane1Bromobutane1Chloropentane1Chlorohexane1Chloroheptane1Chlorooctane1Chlorononane1Chlorodecane1Chlorododecane
Bromoethane1Chloropropane1Bromopropane1Chlorobutane1Bromobutane1Iodobutane1Chloropentane1Chlorohexane1Chloroheptane1Chlorooctane1Chlorononane1Chlorodecane
2Haloalkanes 2Bromopropane2Bromobutane2Bromopentane
2Chlorobutane2Bromobutane2Chlorooctane
2Chlorobutane2Chlorooctane
3Haloalkanes NR NR 3Chlorohexane1,2Haloalkanes 1,2Dichloroethane
1,2Dibromoethane1Bromo2chloroethane1,2Dichloropropane1,2Dibromopropane
1,2Dibromoethane1,2Dibromopropane1,2Dichlorobutane1,2Dibromobutane2Bromo1chloropropane
1,2Dibromoethane1,2Dibromopropane2Bromo1chloropropane
1,3Haloalkanes NR 1,3Dichlorobutane NR2,3Haloalkanes NR 2,3Dichlorobutane NR2Substituted 1haloalkanes 1Bromo2methylpropane 1Chloro2methylpropane
1Chloro3methylbutane1Bromo2methylpropane
, Haloalkanesα ω 1,2Dichloroethane1,2Dibromoethane1Bromo2chloroethane1,3Dichloropropane1,3Dibromopropane1,4Dichlorobutane1,6Dichlorohexane1,9Dichlorononane
1,2Dibromoethane1,3Dichloropropane1,3Dibromopropane1,4Dichlorobutane1,5Dichloropentane1,6Dichlorohexane1,7Dichloroheptane1,8Dichlorooctane1,9Dichlorononane
1,2Dibromoethane1,3Dichloropropane1,3Dibromopropane1,3Diiodopropane1,4Dichlorobutane1,6Dichlorohexane1,9Dichlorononane
Multihalogenated alkanes NR 1,2,3Trichloropropane1,2,3Tribromopropane1,2Dibromo3chloropropane
1,2,3TrichloropropaneHexachlorocyclohexaneαHexachlorocyclohexaneβHexachlorocyclohexaneδ
2,3,5,6Tetrachlorocyclohexane1,4diol3,4,5,6Tetrachloro2cyclohexene1olPentachlorocyclohexaneδ
Cyclic haloalkanes Bromocyclohexane ChlorocyclobutaneBromocyclobutaneBromomethylcyclobutaneChlorocyclopentaneBromocyclopentane
ChlorocyclohexaneBromocyclohexane
HexachlorocyclohexaneαHexachlorocyclohexaneβHexachlorocyclohexaneδ
2,3,5,6Tetrachlorocyclohexane1,4diol3,4,5,6Tetrachloro2cyclohexene1olPentachlorocyclohexaneδ
Haloalkenes 3Chloropropene1,3Dichloropropene
1,3Dichloropropene 3Chloro2methylpropene
Haloalkylbenzenes 1Phenyl2bromopropane NR NR
75

1 Introduction
Group DhlA DhaA LinBHalogenated alcohols 2Bromoethanol
3Bromopropanol1,3Dibromo2propanol1Chloro6hexanol1Bromo6hexanol
2Bromoethanol3Chloro1propanol3Bromo1propanol1.3Dibromo2propanol4Chloro1butanol
2Chloroethanol4Chlorobutanol6Chlorohexanol2,3,4,5,6Pentachlorocyclohexanol
Halogenated ethers Bis(2chloroethyl) ether2Chloroethylvinylether2Chloroethylmethylether
NR NR
Haloepoxides EpichlorohydrineEpibromohydrine
NR NR
Halonitriles 2Bromoacetonitrile NR NRHaloacetamides 2Bromoacetamide NR NRAlkylthioalkyl halides NR Bis(2chloroethyl) sulphideb Bis(2chloroethyl) sulphideb
aNR – not reported.bAlso known as “mustard gas” and “Yperite”.
Table 19 | Substrate range of haloalkane dehalogenases DhmA, DbjA amd DmlA.a
Group DhmA DbjA DmlAHalomethanes NR NR NR1Haloalkanes Bromoethane
1Iodopropane1Chlorobutane1Bromobutane1Iodobutane1Chloropentane
1Chloropropane1Chlorobutane1Bromobutane1Chloropentane1Chlorohexane1Chlorodecane
1Chloropropane1Chlorobutane1Bromobutane1Chloropentane1Chlorohexane1Chlorodecane
2Haloalkanes 2Chloropropane2Iodobutane
2Chloropropane2Chlorobutane
2Chloropropane2Chlorobutane
3Haloalkanes NR NR NR1,2Haloalkanes 1,2Dichloroethane
1,2Dibromoethane1Bromo2chloroethane1,2Dichloropropane1,2Dibromopropane2Bromo1chloropropane1,2Dichlorobutane
1,2Dichloroethane1,2Dibromoethane1,2Dichloropropane1,2Dibromopropane
1,2Dichloroethane1,2Dibromoethane1,2Dichloropropane1,2Dibromopropane
1,3Haloalkanes NR NR NR2,3Haloalkanes NR NR NR2Substituted 1haloalkanes 1Chloro2methylpropane
1Bromo2methylpropane1Chloro2methylpropane 1Chloro2methylpropane
, haloalkanesα ω 1,2Dichloroethane1,2Dibromoethane1Bromo2chloroethane1,3Dichloropropane1,3Dibromopropane1,3Diiodopropane
1,2Dichloroethane1,2Dibromoethane1,3Dibromopropane
1,2Dichloroethane1,2Dibromoethane1,3Dibromopropane
Multihalogenated alkanes 1,2,3Trichloropropane1,2,3Tribromopropane1,2Dibromo3Chloropropane
1,2,3Trichloropropane 1,2,3Trichloropropane
Cyclic haloalkanes ChlorocyclopentaneChlorocyclohexaneBromocyclohexane1Bromomethylcyclohexane
ChlorocyclohexaneBromocyclohexane
ChlorocyclohexaneBromocyclohexane
Haloalkenes 3Chloro2methylpropene2,3Dichloropropene
3Chloro2methylpropene 3Chloro2methylpropene
Haloalkylbenzenes NR NR NRHalogenated alcohols NR NR NRHalogenated ethers Bis(2chloroethyl) ether NR NRHaloepoxides NR NR NRHalonitriles 4Chlorobutyronitrile
4BromobutyronitrileNR NR
Haloacetamides NR NR NRaNR – not reported.
76

1 Introduction
Rate enhancement. The highest catalytic performance of isolated haloalkane dehalogenases, expressed as kcat/Km
ratio, differs by both value and substrate among haloalkane dehalogenases (Table 20). For example, it has been estimated by QM/MM calculations that DhlA provides rate enhancement by 108 to 109 for conversion of 1,2dichloroethane to 2chloroethanol (Soriano et al., 2005). The low effeciency can be due to the above mentioned sacrificing the rate of conversion towards plasticity, or can be due to recent origin of haloalkane dehalogenases that have not had sufficient time to evolve into highcatalytic rate enzymes (Lau et al., 2000). The former is supported by the fact that even the moderate catalytic performance of haloalkane dehalogenases DhlA, DhaA and LinB can provide sufficient amount of the alcohol product as the sole carbon and energy source and thus to sustain life (Janssen et al., 1984; Janssen et al., 1985; Janssen et al., 1987; Yokota et al., 1987; van den Wijngaard et al., 1992; Janssen et al., 1995; Kulakova et al., 1997; Poelarends et al., 1998; Poelarends et al., 1999; Poelarends et al., 2000b) (Table 15 and Fig 23) suggesting that the judging of the catalytic performance as being low, moderate or high should be considered in the context of the living organism rather than by comparing it with the most efficient enzymes working at the diffusion limit because most enzymes do not need to achieve the kinetic perfection in order to execute its biological role.
Table 20 | The highest catalytic performances of haloalkane dehalogenases.Enzyme Substrate kcat [s1] Km [M] kcat/Km [s1 M1]DhlA 1,2Dibromoethane (Schanstra et al., 1996b) 3.0 1 x 10⁵ 3.0 x 10⁵
DhaA 1,3Dibromopropane (Bosma et al., 2003) 2.7 5 x 10⁶ 5.4 x 10⁵
LinB 1Iodohexane (Kmuníček et al., 2005) 2.3 1 x 10⁵ 2.3 x 10⁵
DbjA 1Chlorohexane (Sato et al., 2005) 1.4 5 x 10⁵ 2.8 x 10⁴
Reaction cycle. Presteady state kinetics has been so far reported for conversion of 1,2dichloroethane and 1,2dibromoethane by DhlA (Schanstra et al., 1996b), 1,3dibromopropane by DhaA (Bosma et al., 2003), and 1chlorohexane, bromocyclohexane and chlorocyclohexane by LinB (Prokop et al., 2003) that together with XC structures (Verschueren et al., 1993d; Newman et al., 1999; Marek et al., 2000; Oakley et al., 2004) revealed multiple step reaction cycle comprising the following steps: (i) substrate binding; (ii) three distinct chemical steps; and (iii) product release (Figs 26 and 27).
Substrate binding. Substrate binds into the buried active site cavity with its halogen bound between the two halidestabilising amino acid residues and the halogenbound electrophilic sp3hybridised carbon atom positioned towards the nucleophilic carboxyl oxygen of the Asp nucleophile, PDBID 2DHC (Verschueren et al., 1993d). XC also identified unproductive binding of poor substrates of LinB, 1,2dichloroethane (PDBID 1G42) and 1,2dichloropropane (PDBID 1G5F), and nonsubstrate of DmbA, 1,2dichloroethane (PDBID 2O2H), adjacent to the face of the imidazole ring of His base (Fig 28; Oakley et al., 2002; Mazumdar et al., 2008). The presence of the secondary binding site has been explained as to be due to favourable interaction of the molecules with the His base and their inability to displace active site water molecules (Oakley et al., 2002).
Bimolecular nucleophilic substitution (SN2). The nucleophilic oxygen attacks the halogenbound carbon atom yielding covalently bound intermediate (sometimes referred to as “alkylenzyme intermediate”) and halide ion that remains to be bound between the two halidestabilising amino acid residues, PDBID 2DHD (Verschueren et al., 1993d). The negative charge that evolves on the other (free) carboxyl oxygen of the Asp nucleophile is stabilised by the socalled oxyanion hole (Henderson, 1970), a structural feature characteristic to / hydrolases α β (Ollis et al., 1992; Cousin et al., 1998; Nardini & Dijkstra, 1999; Holmquist, 2000; Orengo et al., 2002) and other enzymes related to / hydrolases by convergent evolution, e.g. serine proteases α β (Ollis et al., 1992). The oxyanion hole interaction in haloalkane dehalogenases involves hydrogen bonding interaction of the free carboxyl oxygen of the Asp nucleophile with mainchain amide group of the downstream neighbour of the nucleophile, i.e. halidestabilising Trp, and an amino acid residue in a turn between the strand 3 and helix A, i.e. Glu in DhlA β α (Verschueren et al., 1993d) or the halidestabilising Asn in DhaA (Newman et al., 1999), LinB (Marek et al., 2000; Oakley et al., 2004) and DmbA (Mazumdar et al., 2008).
Nucleophilic addition (AdN). The formation of the covalent intermediate is followed by nucleophilic addition (AdN) of a hydroxyl anion to the carboxyl carbon atom of the Asp nucleophile sidechain, yielding the socalled tetrahedral intermediate, also known as “alcoxyhydroxyolate intermediate” (Pries et al., 1994a). Thus, haloalkane dehalogenases are evolved to optimise two different nucleophilic substitutions at two nucleophilic centres (Pries et al., 1995a). The hydroxyl anion is formed by substraction of a proton from a catalytic water molecule by the His base (Pries et al., 1995b). The catalytic water is situated near the nucleophile and the base, and interacts via three hydrogen bonds with: (i) the imidazole ring nitrogen of the His base; (ii) the mainchain carbonyl group of the halide
77

1 Introduction
stabilising Asn in DhaA (Newman et al., 1999), LinB (Marek et al., 2000; Oakley et al., 2004) and DmbA (Mazumdar et al., 2008), or Glu in DhlA (Verschueren et al., 1993d); and (iii) one structural water molecule bound to the sidechain of the amino acid residue just upstream of the Asp nucleophile, i.e. Gln in DhlA (Verschueren et al., 1993d) or His in DhaA (Newman et al., 1999), LinB (Marek et al., 2000; Oakley et al., 2004) and DmbA (Mazumdar et al., 2008). The role of the His base as the water activator was proven by His to Gln sitedirected mutagenesis in DhlA and by observation of no incorporation of 18O into the Asp nucleophile upon mixing enzyme with substrate in 18Olabelled water (Pries et al., 1995b). Interestingly, the role of the His base is different in some / hydrolases: (i) His base functions to maintain nucleophilicity of Cys nucleophile in dienelactone hydrolase ofα β Pseudomonas B13; (ii) His base is involved in both formation and hydrolysis of covalent acylintermediate in lipase from Geotrichum candidum and acetylcholinesterase from Torpedo californica; and (iii) His was suggested to accept proton from Ser nucleophile in wheat carboxypeptidase A (Pries et al., 1995b). In haloalkane dehalogenases, the functional His tautomer and the positive charge that evolves on the His base upon accepting the proton from the catalytic water is stabilised by hydrogen bonding interaction of the His+ base with the catalytic acid, i.e. Asp in DhlA or Glu in DhaA, LinB and DmbA via the other imidazole amide group (Krooshof et al., 1997). The catalytic acid also functions as to increase basicity of the His thus making it stronger base, a prerequisite for efficient proton abstraction from water (Oakley et al., 2004; Negri et al., 2007; Otyepka et al., 2008). However, since the baseacid interaction have been observed in various forms of enzyme along the reaction cycle (Verschueren et al., 1993d), this interaction does not explain triggering the AdN at proper time, i.e. after formation of the ester intermediate. The triggering can be caused by change in His pKa due to change in microenvironment caused by halide anion formation during the preceding SN2 step which could explain different rates of hydrolysis of the identical ester intermediate, cyclohexylenzyme, formed during dehalogenation reaction of chlorocyclohexane and bromocyclohexane by LinB (Prokop et al., 2003).
Decomposition of tetrahedral intermediate. Although the tetrahedral intermediate is being stabilised by the oxyanion hole, it is a metastable state (Otyepka et al., 2008) that has not been captured by XC unlike the ester intermediate. The tetrahedral intermediate decomposes into alcohol and free Asp nucleophile. As a consequence of the nucleophilic addition of the hydroxyl anion from the catalytic water to the carboxyl carbon atom of the Asp nucleophile sidechain, the catalytic water provides oxygen for the alcohol product on a long run (Prince, 1994), i.e. the water virtually functions as to regenerate the Asp carboxyl group. The proton of the alcohol group can be obtained either from the His+ base or from the hydroxyl group attached to the carboxyl carbon of the Asp nucleophile, i.e. from the catalytic water. QM/MM calculations of the AdN step of dehalogenation of 1,2dichloroethane by LinB suggest the former, i.e. the His base functions not only as the water activator but also as the proton carrier (Otyepka et al., 2008). One or more XC structures were determined for each of DhlA, DhaA, LinB and DmbA that contain halide anion bound between the two halidestabilising amino acid residues (Table 16 and Fig 29; Verschueren et al., 1993d; Newman et al., 1999; Marek et al., 2000; Oakley et al., 2002; Streltsov et al., 2003; Mazumdar et al., 2008). Six XC structures of LinB (PDBIDs 1D07, 1G4H, 1IZ8, 1K6E, 1K63 and 2BFN) and one XC structure of DmbA (PDBID 2O2I) also captured bound alcohol product of the dehalogenation reaction in the cavity (Table 16 and Fig 29). In four of the XC structures (PDBIDs 1G4H, 1IZ8, 2BFN and 2O2I), the alcohol molecule is located adjacent to the face of the imidazole ring of the His base, i.e. in the region that corresponds to the unproductive substrate binding site (Streltsov et al., 2003; Monincová et al., 2007; Mazumdar et al., 2008). In other XC structures (PDBIDs 1D07, 1K6E and 1K63), the alcohol product is shifted towards the Asp nucleophile and halide anion, and shows smaller interaction interface with the His base (Streltsov et al., 2003).
Product release. Last step of the reaction cycle is regeneration of the active site, i.e. the release of all the three products, i.e. halide ion, alcohol and proton. The halide is released from the interaction with the halidestabilising amino acid residues and the alcohol from the interaction with the halide anion, the Asp nucleophile and the His base by water molecules (Schanstra & Janssen, 1996) that enter the cavity to compete for the interactions and to solvate the halide ion and the hydroxyl group of the alcohol (Negri et al., 2007). The two products then leave the active site through a tunnel (Negri et al., 2007). All three possible sequences of product release have been already observed in haloalkane dehalogenases: (i) alcohol first (chloride ion vs 2chloroethanol and bromide ion vs 2bromoethanol) in DhlA (Schanstra et al., 1996b); (ii) halide first (bromide ion vs 3bromo1propanol) in DhaA (Bosma et al., 2003); and (iii) random sequential (chloride ion vs 1hexanol, chloride ion vs cyclohexanol and bromide ion vs cyclohexanol) in LinB (Prokop et al., 2003). The fate of the proton from the Asp nucleophile remains unknown; the proton can be accepted by a water molecule and leave the active site through hydrogen bonding network connecting the active site to bulk solvent (Otyepka et al., 2008).
78

1 Introduction
Fig 26 | Reaction cycle of haloalkane dehalogenase DhlA with 1,2dichloroethane. (a) Binding of a substrate to a free enzyme and displacing of active site water molecules; (b) bimolecular nucleophilic substitution of a chlorine atom by carboxyl oxygen atom of the Asp124 nucleophile yielding a covalent ester intermediate and chloride anion; (c) nucleophilic addition of a hydroxyl anion from the catalytic water molecule to the carboxyl carbon of the Asp124 nucleophile in the ester intermediate yielding a tetrahedral intermediate; (d) decomposition of the metastable tetrahedral intermediate into 2chloroethanol and free carboxyl group of the Asp124 nucleophile; (e) complex of DhlA with the three products of the reaction; (f) release of the products and binding of a new catalytic water molecule. Mainchain groups of the amino acid residues are indicated by amino acid residue annotations for clarity. Hydrogen bonding interactions are indicated by dotted lines: black, oxyanion hole; orange, halidestabilisation; light blue, violet and grey, binding and polarisation of the catalytic water molecule. Schemes a, b, c and e are evidenced from XC structures of DhlA (see Fig 27). The reaction mechanism of DhaA/LinB/DmbA is analogous, except for Asn38/41/39 functioning instead of Trp175 and Glu56 as halidestabilising amino acid residue and oxyanion hole amino acid residue, His105/107/108 functioning as the structural water binding amino acid residue instead of Gln123, and Glu130/132/133 functioning as the catalytic acid instead of Asp260. Redrawn according to Verschueren et al. (1993d); the fate of the hydrogens from catalytic water molecule remains unclear; added according to the proposal by Otyepka et al. (2008) for LinB.
79

1 Introduction
Fig 27 | XC structures along the reaction cycle of haloalkane dehalgoenase DhlA with 1,2dichloroethane. (a) Free DhlA enzyme with solvated active site (PDBID 2HAD); (b) DhlA1,2dichloroethane complex (PDBID 2DHC); (c) DhlAchloroethyl ester intermediate and chloride anion (PDBID 2DHD); (d) DhlAchloride anion complex (2chloroethanol has already left; PDBID 2DHE). Yellow sphere, chloride anion; red spheres, oxygen atoms of water molecules. The spheres are visualised in 30% of their actual size for clarity. The structures correspond to the schemes a, b, c and partially e, respectively, in Fig 26.
Fig 28 | Unproductive substrate binding in haloalkane dehalogenases LinB (PDBIDs 1G42 and 1G5F) and DmbA (PDBID 2O2H). The substrate molecules (green sticks with chlorine atoms in yellow) are superimposed to the 1G42 structure. The substrate molecules bind adjacent to the face of the His base. The productive binding site is occupied by halide anion (yellow spheres) and water molecules (oxygen atoms shown in red spheres). The amino acid residue identifiers are in the order LinB/DmbA.
80

1 Introduction
Fig 29 | Product binding sites in haloalkane dehalogenases LinB (PDBIDs 1D07, 1G4H, 1IZ8, 1K6E, 1K63 and 2BFN) and DmbA (PDBID 2O2I). The products are superimposed to the 2BFN structure. Halide anions bind between the two halidestabilising amino acid residues. Alcohol molecules (sticks) bind adjacent to the face of the His base, and close to the halide anion (sphere) and the Asp nucleophile. The spheres are visualised in 30% of their actual size for clarity. Yellow, chlorine/chloride anion; orange, bromine/bromide anion. The amino acid residue identifiers are in the order LinB/DmbA. The orientation of the protein molecule is the same as in Fig 28.
Rate limitation. The overall rate of the dehalogenation reaction is determined by the slowest step along the reaction cycle (Table 21). Interestingly, four different ratelimiting steps have been already observed in dehalogenating reactions catalysed by haloalkane dehalogenases DhlA (Schanstra et al., 1996b), DhaA (Bosma et al., 2003) and LinB (Prokop et al., 2003). The differences in ratelimiting steps have been attributed to combination of three effects (Prokop et al., 2003): (i) DhaA and LinB have larger size and better accessibility of the active site cavity compared to DhlA (Fig 24b; Marek et al., 2000); (ii) two Trp halidestabilising amino acid residues in DhlA are stronger compared to corresponding Trp and Asn in DhaA and LinB (Krooshof et al., 1998; Boháč et al., 2002); and (iii) Asp catalytic acid interacts more repulsively with halide anion during its release than Glu catalytic acid due to different spatial location (Krooshof et al., 1997; Bosma et al., 2003). Additionally, there are substratespecific effects because dehalogenation reactions catalysed by a particular haloalkane dehalogenase can be limited at different steps for different substrates (Schanstra et al., 1996b; Bosma et al., 2003). Interestingly, one or two amino acid residues substitution can already shift the ratelimiting step (Krooshof et al., 1997; Krooshof et al., 1998) which is an indication of delicately balanced rates of individual steps (Schanstra et al., 1996a; Krooshof et al., 1997; Krooshof et al., 1998). Despite all these observations, current level of knowledge about haloalkane dehalogenases does not allow extrapolating rate limitation among different haloalkane dehalogenases (Prokop et al., 2003), their mutants (Krooshof et al., 1997; Krooshof et al., 1998) and different substrates (Schanstra et al., 1996b; Bosma et al., 2003).
Table 21 | Ratelimiting steps in dehalogenating reactions catalysed by haloalkane dehalogenases. (pp. 8182)Enzyme Variant Substrate Products Ratelimiting stepDhlAa Wildtype 1,2Dichloroethane 2Chloroethanol
Cloride anionRelease of the halide anion(Schanstra et al., 1996b)
1,2Dibromoethane 2BromoethanolBromide anion
Release of the halide anion(Schanstra et al., 1996b)
1Chlorohexane 1HexanolChloride anion
Substrate binding or SN2 step(Schanstra et al., 1996b)
DhlAa Asp260Asn+Asn148Glud
1,2Dibromoethane 2BromoethanolBromide anion
Substrate binding or SN2 step(Krooshof et al., 1997)
DhlAa Trp175Tyre 1,2Dibromoethane 2ChloroethanolChloride anion
Substrate binding or SN2 step(Krooshof et al., 1998)
DhaAb Wildtype 1,3Dibromopropane 3Bromo1propanolBromide anion
Release of the alcohol(Bosma et al., 2003)
1,2,3Trichloropropane 2,3Dichloropropane1ol Substrate binding or SN2 step(Bosma et al., 2003)
81

1 Introduction
Enzyme Variant Substrate Products Ratelimiting stepLinBc Wildtype 1Chlorohexane 1Hexanol
Chloride anionHydrolysis of the ester intermediate(Prokop et al., 2003)
Chlorocyclohexane CyclohexanolChloride anion
Hydrolysis of the ester intermediate(Prokop et al., 2003)
Bromocyclohexane CyclohexanolBromide anion
Hydrolysis of the ester intermediate(Prokop et al., 2003)
aSource – Xanthobacter autotrophicus GJ10.bSource – Rhodococcus rhodochrous NCIMB 13064.cSource – Sphingobium japonicum UT26.dIn vitro sitedirected mutagenesis; repositioning of the catalytic acid.eIn vitro sitedirected mutagenesis; substitution in the halidestabilising amino acid residue.
Catalytic effect. Haloalkane dehalgoenases exploit mechanisms from all the five categories (see 1.3.3.2) to achieve overall rate enhancement: (i) approximation by sequestering a substrate molecule from bulk solvent into a cavity buried in the protein core (Franken et al., 1991; Verschueren et al., 1993b; Verschueren et al., 1993a; Verschueren et al., 1993c; Newman et al., 1999; Marek et al., 2000; Oakley et al., 2004; Mazumdar et al., 2008); (ii) breaking the reaction into multiple steps composed of formation and breakdown of two covalent intermediates via nucleophilic catalyses (Verschueren et al., 1993d; Pries et al., 1994a; Pries et al., 1995a; Schanstra et al., 1996b; Bosma et al., 2003; Prokop et al., 2003), (iii) hydrolysis of the ester intermediate involving proton transfer by His acting as the general base catalyst (Verschueren et al., 1993d; Pries et al., 1995b; Otyepka et al., 2008); (iv) preorganisation of the active site for transition state complementarity, i.e. substituting water solvent by protein and solvating the transition state more than water does (Warshel & Levitt, 1976; Warshel, 1978; Warshel & Florián, 1998; Warshel & Papazyan, 1998; Shurki et al., 2002; Warshel, 2003; Olsson & Warshel, 2004; Warshel et al., 2006; Murugan & Agren, 2009), achieved by a network of hydrogen bonding interactions in the active site including stabilisation of halide anion by halidestabilising amino acid residues, stabilisation of tetrahedral intermediate by oxyanion hole interactions, stabilisation of His+ by ionic interaction with catalytic base, and binding and polarisation of catalytic water by interaction with one oxyanion hole amino acid residue and the His base (see Fig 26); and (v) involving enzyme and substrate conformational changes of inducedfit and/or conformational selection type to drive the complex towards the transition state, see 1.6.2.5 (Pries et al., 1994b; Schanstra & Janssen, 1996; Lightstone & Bruice, 1996; Lightstone et al., 1997; Krooshof et al., 1998; Lightstone et al., 1998; Bruice & Lightstone, 1999; Krooshof et al., 1999; Newman et al., 1999; Bruice & Benkovic, 2000; Marek et al., 2000; Gray et al., 2001; Lewandowicz et al., 2001; Bruice, 2002; Oakley et al., 2002; Otyepka & Damborský, 2002; Chaloupková et al., 2003; DeviKesavan & Gao, 2003; Paneth, 2003; Streltsov et al., 2003; Oakley et al., 2004; Negri et al., 2007).
1.6.2.5 Dynamics of haloalkane dehalogenases
Role of dynamics in chemical steps of the reaction. According to QM/MM calculations, the SN2 step for the conversion of 1,2dichloroethane by DhlA (Warshel et al., 2000; Villa & Warshel, 2001; Shurki et al., 2002; Olssson & Warshel, 2004) and the AdN step for the conversion of 1,2dichloroethane by LinB (Otyepka et al., 2008) are supposed to be largely due to electrostatic preorganisation with only minor effect of dynamics in the reaction complex (Warshel et al., 2000; Villa & Warshel, 2001; Shurki et al., 2002; Olsson & Warshel, 2004; Otyepka et al., 2008). According to Warshel and coworkers, ~ 90% of the catalytic effect of the SN2 step of 1,2dichloroethane conversion by DhlA is due to electrostatic preorganisation (Warshel et al., 2000; Villa & Warshel, 2001; Shurki et al., 2002; Olsson & Warshel, 2004). Contrary, Bruice and coworkers proposed more significant role of both DhlA and 1,2dichloroethane dynamics in restricting configurational space of the substrate in reactant state as to yield complexes close to the transition state of the SN2 step, the socalled near attack configurations (NAC), more frequently compared to poor substrates (Lightstone & Bruice, 1996; Lightstone et al., 1997; Lightstone et al., 1998; Bruice & Lightstone, 1999; Bruice & Benkovic, 2000; Lau et al., 2000; Bruice, 2002), thus reducing the activation barrier for the SN2 step by ~ 25% compared to the corresponding reaction in aqueous solution (Hur et al., 2003). The NAC for the SN2 step of 1,2dichloroethane conversion by DhlA was calculated to be defined by two geometrical parameters: (i) contact distance between the Asp nucleophilic oxygen atom and attacked carbon atom of the substrate molecule ≤ 3.41 Å; and (ii) angle between the Asp nucleophilic oxygen atom, attacked carbon atom of the substrate molecule and leaving chlorine atom 157180° (Scheme 5; Hur et al., 2003):
82

1 Introduction
Scheme 5 | Near attack configuration for SN2 step of 1,2dichloroethane conversion by DhlA.
According to this definition, the XC structure of the DhlA1,2dichloroethane complex (PDBID 2DHC), in which the substrate is in a trans conformation, is not in the NAC. In fact, the 2DHC structure (see Fig 27b) presents an “inactive complex” because it is known from QM calculations that for the SN2 step, 1,2dichloroethane should be in a gauche conformation (Lightstone et al., 1997). QM/MM calculations and MD simulations revealed that 1,2dichloroethane in the gauche conformation is much more stable than trans in DhlA, and gauche in water because the gauche conformation of 1,2dichloroethane in DhlA is stabilised by chargedipole interaction with the Asp nucleophile (Murugan & Agren, 2009). The gauche conformation then facilitates approaching of the two reacting atoms by decreased repulsion between the adjacent chlorine atom and carboxyl group of the Asp nucleophile (Lightstone et al., 1997). The preference of the gauche conformation of 1,2dichloroethane in DhlA is thus caused by strongly polarised environment of the enzyme active site compared to water solvent (Murugan & Agren, 2009) and hence the proposed NAC effect could be actually apparent steric effect contributed by smaller steric and larger electrostatic components (Warshel et al., 2000; Villa & Warshel, 2001; Shurki et al., 2002; Olsson & Warshel, 2004).
Dynamics of catalytic amino acid residues. Even in the highly preorganised active site of haloalkane dehalogenases, some potentially functionally important motions have been observed for the Asp nucleophile (Oakley et al., 2004) and predicted for halidestabilising amino acid residues (Lewandowicz et al., 2001; DeviKesavan & Gao, 2003; Paneth, 2003). In the former case, the Asp nucleophile was determined in the ultrahigh resolution XC structure of LinB (PDBID 1MJ5) to occur in two conformations (Fig 30) depending on the protonation state of the His base; during the catalytic cycle, the Asp nucleophile is supposed to switch the conformation to effectively perform its function (Oakley et al., 2004). In the latter case, sidechains of the halidestabilising Trp in DhlA were predicted by QM/MM calculations and MD simulations to be rotated out of their optimal positions like “drawing a bow”; the highenergy cost of the strain is compensated by increased hydrogenbonding of the chlorine atom; finally, hydrolysis of the intermediate releases the strain causing return of the Trp sidechains into optimal position (DeviKesavan & Gao, 2003). Estimation of the quantitative contribution of these motions to the total catalysis effect has not yet been reported.
Fig 30 | Two conformations of Asp108 nucleophile (A and B) in haloalkane dehalogenase LinB. The distance between O 1δ
and N 2ε is 3.05 Å in the A conformation and 2.53 Å in the B conformation. The distance between O 1δ atoms of the two conformations is 1.49 Å. The distance between O 2δ atoms of the two conformations is only 0.29 Å; thus in both the conformations, O 2δ atom exists in favourable position for oxyanion hole interactions (dashed lines) with Trp109 and Asn38. The electron density map (2mFoDFc) is contoured at 2.0 .σ
Role of conformational change for halide release in DhlA. Diffusion steps, substrate binding and product release, can be also ratelimiting and thus main determinants of the reaction rate (see Table 21). The exchange of substrates,
83

1 Introduction
products and water between bulk solvent and buried active site occurs via tunnels; XC structures revealed two tunnels in DhaA (Newman et al., 1999), two tunnels in LinB (Marek et al., 2000), but no tunnel in DhlA (see Fig 24). The absence of a tunnel in DhlA suggests a conformational change that must accompany substrate binding and product release (Pries et al., 1994b). Indeed, stoppedflow fluorescence measurements of halide binding and release (Schanstra & Janssen, 1996), and thermodynamic analysis of halide binding (Krooshof et al., 1998) showed twostep and threestep routes for halide binding via formation of an encounter (also known as “collision”) complex later proven by XC, PDBID 1BE0 (Pikkemaat et al., 1999). The presence of the encounter complex and buried active site means that halide release in DhlA is accomplished by inducedfit mechanism (Sullivan & Holyoak, 2008). Sitedirected mutagenesis confirmed that the enzyme isomerisation involving conformational change is located in the cap domain (Schanstra et al., 1996a; Schanstra et al., 1997; Krooshof et al., 1998). The conformational change of the cap domain is the cause of halide release being the ratelimiting step; in other words, the conformational change of the cap domain for halide release is the ratelimiting event in the reaction cycle of DhlA (Schanstra & Janssen, 1996). The conformational change could involve: (i) concerted movement of aromatic amino acid residue sidechains in the cap domain (Krooshof et al., 1998); (ii) movement in the region comprising first two helices, 4' and 4, of theα cap domain (see Fig 25a) and the loop between them, 4'/ 4loop α α (Schanstra & Janssen, 1996; Krooshof et al., 1998); and/or (iii) cistrans isomerisation of the cap domain Pro168 amino acid residue located in the 4'/ 4loopα α (Krooshof et al., 1999).
Role of dynamics in tunnels for substrate binding and/or product release. Possible sites for encounter complex formation in DhlA were determined by XC, PDBID 1BE0 (Pikkemaat et al., 1999) and further supported by computational solvent mapping (Silberstein et al., 2007). Two pathways that could potentially form open tunnels due to protein motions, and that are in accordance with the proposed surface halidebinding sites (Silberstein et al., 2007), were found by CAVER 1.0 tunnel calculation program (Fig 31a; Petřek et al., 2006). Although, direct experimental observation of (presumably shortliving) open tunnels in DhlA has not yet been reported. Even when tunnels are present in the XC structure, which is the case of LinB, DhaA and DmbA, substrate binding or product release cannot be a priori excluded as possible ratelimiting steps of the overall reaction, as shown by DhaA case: release of 3bromopropane1ol is the ratelimiting step of 1,3dibromopropane conversion by DhaA (Bosma et al., 2003). The reason for the release of the alcohol being the ratelimiting step could be: (i) strong attractive interaction between product and amino acid residues of the tunnel, especially the Asp nucleophile and the His base, as suggested by the XC structures of LinB (see Fig 29; Oakley et al., 2002; Streltsov et al., 2003) and DmbA (see Fig 29; Mazumdar et al., 2008), and MD simulations of LinB with 2chloroethanol (Negri et al., 2007); and/or (ii) dynamical fluctuations of the tunnel size at a timescale that interfers with product release rate. In agreement with alternative conformations present for amino acid residues in XC structures (Fig 32) and with XC Bfactors (Fig 33; Streltsov et al., 2003), comparative analysis of protein motions in DhlA, DhaA and LinB by using classical MD simulations showed that the largest amplitudes of protein motions occur in Nterminal cap domain loop, NC loop (DhlA, DhaA and LinB), helix 4' (DhlA), helix 4 (DhlA, DhaA and LinB) and Cterminal cap domain loop, CC loopα α (Otyepka & Damborský, 2002), i.e. in the region of tunnels observed by XC and MD simulations (Otyepka & Damborský, 2002) and predicted by CAVER 1.0 (Fig 31; Petřek et al., 2006). Together with kinetic data, presence of the largest motions and all known tunnels in the same regions of the cap domain of haloalkane dehalogenases suggests that the cap domain provides not only the active site cavity and tunnels, but also plasticity to these structural features via motions (Otyepka & Damborský, 2002; Streltsov et al., 2003; Oakley et al., 2004; Negri et al., 2007) and that these motions are important for enzyme kinetics (Schanstra & Janssen, 1996; Krooshof et al., 1998; Krooshof et al., 1999; Gray et al., 2001; Oakley et al., 2002). As the cap domain also contributes to the formation of the active site, the mobility of the cap domain needs to be compromised. This is achieved by stabilising βbridge interaction between the NC and CCloops in DhaA and LinB (Otyepka & Damborský, 2002), packing of αhelix 4' against helix E in DhlA α (Otyepka & Damborský, 2002), and by stabilising interaction of the cap domain with highly conserved main domain loop located between strand 4 and helix B, that comprises GlyXGlyXSerβ αmotif common to haloalkane dehalogenases (Chovancová et al., 2007) and their close relatives, epoxide hydrolases (Barth et al., 2004).
84

1 Introduction
Fig 31 | Tunnels in XC structure of haloalkane dehalogenases identified by CAVER 1.0. (a) DhlA; (b) DhaA; (c) LinB. CAVER identifies three types of pathways: (i) tunnels (solid lines) observed in XC structures; (ii) pathways that form open tunnels via protein motions in MD simulations (dashed lines) reported by Otyepka & Damborský (2002); and (iii) “uncertain” pathways highlighted by dotted lines that either open on longer time scale not sampled by the MD simulations, or do not form open tunnel but allow passage of water molecules through the low density region of protein matrix, or they are not relevant. Identifiers for amino acid residues lining the tunnels are given in grey and white circles for cap and main domain, respectively. Schematic representation of the protein is given only for Nterminal part of the cap domain. Redrawn according to Petřek et al. (2006).
Fig 32 | Alternative conformations in haloalkane dehalogenases. (a) DhlA (PDBIDs 1B6G and 2PKY mapped onto 2HAD); (b) DhaA (PDBIDs 1BN6 and 1BN7 mapped onto 1CQW); (c) LinB (PDBIDs 1MJ5, 1G42, 1G4H, 1G5F and 2BFN mapped onto 1CV2); (d) DmbA (PDBIDs 2O2H and 2QVB mapped onto the latter). Cα atoms of amino acid residues determined in alternative conformations are highlighted by red balls. The larger number of the alternative conformations observed for DhlA and LinB can be due to nearatomic (PDBID 1B6G) and atomic resolution (PDBID 1MJ5) XC structures, respectively. Protein cartoon models are coloured by domain: grey, the main domain; blue, the cap domain.
Fig 33 | High mobility regions of haloalkane dehalogenases identified by XC Bfactors. (a) DhlA (PDBID 2HAD); (b) DhaA (PDBID 1CQW); (c) LinB (PDBID 1MJ5); (d) DmbA (PDBID 2QVB). Bfactors for different amino acid residues are visualised by varying thickness of a cartoon tube: the thicker the tube, the higher the Bfactor; main domain, grey; cap domain, blue. When omitting termini, the highest mobility in DhaA and LinB is situated in Nterminal part of the cap domain.
85

1 Introduction
1.6.2.6 Application of haloalkane dehalogenases
Bioremediation. Bacteria bearing and expressing haloalkane dehalogenase genes were long time ago recognised to be possibly applicable for bioremediation (Janssen et al., 1985), i.e. humanassisted removal of xenobiotics from polluted environment by living organisms. Bacteria expressing haloalkane dehalogenases can be used for removal of halogenated aliphatic hydrocarbons from polluted soil (Wada et al., 1989), water (Stucki & Thueer, 1995; Erable et al., 2004; Torz et al., 2007) and gas (van den Wijngaard et al., 1993; Dravis et al., 2000; Erable et al., 2004; Erable et al., 2005). Removal of 1,2dichloroethane by Xanthobacter autotrophicus GJ10 with key initial action by haloalkane dehalogenase DhlA (Fig 23) was demonstrated to occur in a continuous stirred tank bioreactor (Fig 34; van den Wijngaard et al., 1993; Ferreira Jorge & Livingston, 1999), a membrane reactor (Freitas dos Santos & Livingston, 1994) and at full scale in a rotating disk biological contactor (Stucki & Thueer, 1995). Recently, it has been suggested that more efficient cleanup of a polluted water or gas sample could have been achieved by a combination of various bacterial strains expressing different haloalkane dehalogenases with different substrate specificities in a successive batch reactor to allow for optimising temperature and pH to various strains (Erable et al., 2006). Haloalkane dehalogenase gene dhlA of Xanthobacter autotrophicus GJ10 was also successfully engineered into Arabidopsis thaliana (Naested et al., 1999) and, together with haloacid dehalogenase gene dhlB of Xanthobacter autotrophicus GJ10, into Nicotiana tabacum (MenaBenitez et al., 2008) via Agrobacterium sp. PGV3101, and the possibility of phytoremediation was demonstrated (Naested et al., 1999; MenaBenitez et al., 2008). Alternatively, haloalkane dehalogenases could be isolated from the bacteria and applied directly in a cellfree form. For example, it has been proposed, that if mixed with proper additives, haloalkane dehalogenases DhaA, LinB and DmbA could be used for decontamination of Yperitecontaminated objects and perhaps even human skin stained with this horrific blistering agent (Prokop et al., 2006).
Fig 34 | Degradation of 1,2dichloroethane by Xanthobacter autotrophicus GJ10 in a continuous stirred tank bioreactor. Gas samples are taken at point 1 (gas inlet) and 2 (gas outlet). The dilution rate is measured with a sterile pipet connected at point 3 with the system. At point 4, the medium enters the culture vessel. Before the aqueous sample is taken at point 5, the pipes are cleaned with air that contains no volatile substrate. For this, clamps 6 and 8 are opened for several seconds, while clamp 7 is closed. Redrawn according to van den Wijngaard et al. (1993).
Biosensing. Prior to any bioremediation effort, the polluted sites must be identified first. Detection of halogenated aliphatic hydrocarbons (in mg L1) in the environment can be achieved by a biosensor with haloalkane dehalogenases
86

1 Introduction
expressed by bacteria functioning as the biological element and by detecting products of the hydrolytic dehalogenation, i.e. halide ions (Peter et al., 1996) or protons (Campbell et al., 2006). The usefulness of this approach was successfully demonstrated by a biosensor with Rhodococcus sp. DSM 6344 cells immobilised in alginate on a chloride or bromide ionselective electrode and expressing haloalkane dehalogenase DhaA (Peter et al., 1996) and by a fiber optic biosensor for 1,2dichloroethane detection in aqueous solution with haloalkane dehalogenase DhlA in whole cells of Xanthobacter autotrophicus GJ10 immobilised in calcium alginate on the tip of a fiber optic fluoresceinaminebased pH optode (Fig 35; Campbell et al., 2006). The advantage of the optical biosensor is possibility of the use in situ, small size of the sensor and low cost. The in situ measurements can be, however, complicated by affected response of the biosensor by pH and buffer capacity of the environment, thus further research is needed in order to develop biosensors for practical use (Campbell et al., 2006).
Fig 35 | Fiber optic biosensor for 1,2dichloroethane detection in aqueous solution with haloalkane dehalogenase DhlA in whole cells of Xanthobacter autotrophicus GJ10 as the biocomponent. (a) Scheme of the biosensor; (b) detail of the biosensor tip. Redrawn according to Campbell et al. (2006).
Production of fine chemicals. Only recently, it has been discovered that haloalkane dehalogenases are enantioselective to some substrates (Prokop et al., 2005), yielding alcohol products with high enantiomeric purity. For example, DbjA converts (R)2bromopentane into (S)2pentanol with enantiomeric ratio, i.e. catalytic performance ratio between preferred and nonpreferred substrate, > 200 (Prokop et al., 2005). The fact, that S2pentanol is used as a key intermediate required in the synthesis of several antiAlzheimer drugs that inhibit βamyloid peptide release and/or its synthesis (international patent publication No. WO 98/22494), suggests that new doors may open for possible exploitation of haloalkane dehalogenases for yet another human benefit (Prokop et al., 2005).
Cell imaging. Another, already well established, use of haloalkane dehalogenases in the field of biomedicine and human health is in cell imaging technologies. Reaction catalysed by haloalkane dehalogenases involves essential role of His base for hydrolysis of the covalent ester intermediate (Fig 26). Mutating the His base causes termination of the reaction cycle before AdN step, yielding accumulating ester intermediate. This is the principle of the socalled HaloTag technology developed at Promega, originally using DhaA His272Phe mutant as the HaloTag (http://www.promega.com/applications/prtn_exp/halotag.htm). A substrate, the socalled HaloTag ligand, is composed of three parts: (i) a terminally halogenated alkyl chain that binds covalently to the Asp nucleophile in the SN2 step; (ii) a spacer of variable length and chemical nature, running through a tunnel to the protein surface in the ester intermediate; and (iii) a solvent exposed applicationspecific functional group, e.g. fluorescent dye, affinity handles or solid surfaces (Los et al., 2008). Fusion of the HaloTag gene with a gene encoding protein of interest allows investigating the role and behaviour of the protein in live cells. Using the HaloTag technology, subcellular localisation, translocation, translocation dynamics and degradation of NF B proteins (p65 and I B) was monitored by fusingκ κ genes for the proteins with the DhaA HaloTag (Los et al., 2008). Fusion of the DhaA HaloTag with Xlinked inhibitor of apoptosis associated factor 1 (XIAPassociated factor 1, XAF1) allowed deciphering the role of XAF1 in regulation of trophoblast cell apoptosis (StraszewskiChavez et al., 2007). The HaloTag technology was also used to study
87

1 Introduction
expression, trafficking, spatial separation and realtime translocation of an 1integrinHaloTag fusion, thusβ demonstrating that this technology can be a powerful tool to investigate also membrane protein biology in live cells (Svendsen et al., 2008). An extension of the HaloTag technology, the socalled covalin, was developed by Johnson and coworkers (Chidley et al., 2008). Covalin is a protein chimera of two selflabeling proteins, HaloTag and O6alkylguanineDNA alkyltransferease, the socalled SNAPtag (Chidley et al., 2008). The advantage of the HaloTagSNAPtag fusion is nonoverlapping substrate specificity (i.e. haloalkane derivatives vs benzylguanine derivatives) that allows specific conjugation of large variety of different molecules or objects displaying appropriate functional groups (Fig 36; Chidley et al., 2008).
Fig 36 | General scheme of covalindependent bioconjugations. Objects, in green and yellow, represent synthetic probes, biomolecules, beads, or cells. Redrawn according to Chidley et al. (2008).
Engineering of proteins and metabolic networks. Naturally occurring enzymes may not be efficient or stable enough for practical applications (Chang et al., 1999). The above outlined potential for applications of haloalkane dehalogenases, that has attracted scientists over two decades, makes these enzyme family a good model system for better understanding of protein structuredynamicsfunction relationships that in reward allows design and construction of haloalkane dehalogenase mutants with enhanced stabilities (Gray et al., 2001; Pikkemaat et al., 2002), modified substrate specificities (Pries et al., 1994b; Kmuníček et al., 2001; Chaloupková et al., 2003; Kmuníček et al., 2003; Kmuníček et al., 2005), enantioselectivities (Chrobáková et al., 2006a; Chrobáková et al., 2006b; Brezovský et al., 2008) and enhanced activities (Pries et al., 1994b; Schanstra et al., 1996a; Schanstra et al., 1997; Holloway et al., 1998; Gray et al., 2001; Bosma et al., 2002; Chaloupková et al., 2003). However, when steadystate kinetic data reported, increase in kcat is almost always accompanied by increase in Km; the highest improvement of catalytic performance by engineering of haloalkane dehalogenases that has been reported so far is “only” 10.6fold for conversion of 1chlorohexane by DhlA Phe172Trp mutant (Schanstra et al., 1996a), and 7.8fold for conversion of 1,2,3trichloropropane by DhaA C176Tyr+Tyr273Phe double mutant, DhaAM2 (Bosma et al., 2002). However, even such a modest improvement allowed turning the nongrowth 1,2,.3trichloropropane compound into growth substrate for Agrobacterium radiobacter AD1 expressing the mutant dhaAM2 gene (Fig 37; Bosma et al., 2002). Complementary to the protein engineering, there is also an effort towards discovery of more efficient
88

1 Introduction
natural catalysts: three more haloalkane dehalogenases, DbjA (Sato et al., 2005), DmlA (Sato et al., 2005) and LinB (Monincová et al., 2007), have been recently found to be active with TCP; none of these enzymes are, however, vast superior over the mutant DhaA (Table 22).
Fig 37 | Engineered TCP utilisation pathway in Agrobacterium radiobacter AD1. (a) Rhodococcus sp. M153 TCP degradation pathway; (b) Agrobacterium radiobacter AD1 2,3dichloropropane1ol utilisation pathway; (c) Agrobacterium radiobacter AD1(TB3) TCP degradation pathway; (d) Agrobacterium radiobacter AD1(TB3) TCP utilisation pathway. DhaA, haloalkane dehalogenase from Rhodococcus sp. m153; DhaAM2, Cys176Tyr+Tyr273Phe mutant of DhaA; HheC, haloalcohol dehydrogenase from Agrobacterium radiobacter AD1; EchA, epoxide hydrolase from Agrobacterium radiobacter AD1. Blue, substrate; red, metabolic intermediate. Redrawn according to Bosma et al. (2002).
Table 22 | Haloalkane dehalogenases active with TCP.Enzyme Source Variant kcat
[s1]Km
[M]kcat/Km
[s1 M1 ]Year of
discoveryDhaA Rhodococcus sp. m153 WTa 0.08 2.2 103 36 1999DhaA Rhodococcus sp. m153 M2b 0.28 1.0 103 280 2002DbjA Bradyrhizobium japonicum USDA110 WT 0.24 2.8 104 857 2005DmlA Mesorhizobium loti MAFF303099 WT NRc NR NR 2005LinB Shingobium japonicum UT26 WT 0.005 7.3 105 68 2007aWT, WildType; identical to DhaA from Rhodococcus rhodochrous NCIMB 13064.bCys176Tyr+Tyr273Phe mutant; obtained by DNA shuffling and errorprone PCR.cNR – Not reported.
89

2 Objectives
What is a digital camera? You open it and there is no film tape inside.
By means of molecular docking calculations, molecular dynamics simulations and visualisation of protein structure and dynamics, and in the view of available experimental data, my doctoral research was aimed at designing mutations in haloalkane dehalogenase DhaA from Rhodococcus rhodochrous NCIMB 13064 (the wildtype DhaA) for enhanced catalytic performance with toxic and recalcitrant xenobiotic compound, 1,2,3trichloropropane, TCP (Task 1), and while attempting that, bringing better understanding of structuredynamicsfunction relationships of this enzyme (Tasks 2 to 6).
Below follows a list of the six specific tasks that emerged in the course of conducting the research:
Task 1 | In silico design of mutants of the wildtype DhaA for enhanced conversion of TCP. The goal was to provide experimentalists with a list of amino acid residues for substitution, and if possible, to suggest suitable substitutes.
Task 2 | In silico analysis and interpretation of the effects of mutations on the enhanced conversion of TCP by DhaA mutants. The goal was to suggest what part of the reaction cycle is improved by the substitutions in the mutants, and to propose what is the basis of the improvement.
Task 3 | In silico identification of pathways and mechanisms for release of two products of TCP hydrolytic dehalogenation, i.e. 2,3dichloropropane1ol (DCL) and chloride anion (CL), from the buried active site of the wildtype DhaA and the mutants. The goal was to identify all potentially functional product release pathways for the two products and to describe the release process in terms of productenzyme and productwater interactions and dynamics.
Task 4 | In silico identification of pathways and mechanisms for water exchange between the buried active site and the surface of the wildtype DhaA and the mutants. The goal was to identify all potentially functional water exchange pathways and to describe the exchange process in terms of waterenzyme and waterproduct interactions and dynamics.
Task 5 | Comparison of XC structures of DhaA variants. The goal was to explore open and closed tunnels in the structures and describe the effect of mutations on the accessibility of the tunnels.
Task 6 | Testing temporary versions of CAVER 2.0 algorithm and CAVER Viewer application for calculation of pathways leading from buried cavities to surface in protein structures. The goal was to provide developers of the algorithm and the application with feedback response on the reliability of pathways identified by the CAVER 2.0 algorithm and on the userfriendliness of the graphical user interface of the CAVER Viewer.
90
3 Methods
There are always at least two solutions for one problem. One naturally attempts to decide for the best solution. Later on, one often realises that the best solution was actually not the best one, which is, in fact, the best proof that the realised solution was indeed the best one.
The research on the haloalkane dehalogenase DhaA outlined in the previous chapter (see 2 Objectives) was multidisciplinary, requiring tight collaboration of specialists from various fields of protein science: DNA manipulation, protein expression, protein purification, circular dichroism (CD) spectroscopy, enzyme kinetics, Xray crystallography (XC), molecular docking calculation and molecular dynamics (MD) simulation. All experimental methods were employed by collaborators under the supervision of Jiří Damobrský, Yuji Nagata, Michal Kutý and Ivana KutáSmatanová (see 3.1), whereas all molecular modelling methods were employed by myself under the supervision of Jiří Damborský and Rebecca C. Wade (see 3.2). CAVER 2.0 program was developed in the collaboration of molecular modelling and bioinformatics specialists led by Jiří Damborský with specialists in the field of computer graphics and interaction of humans with computer led by Jiří Sochor (see 3.3).
3.1 Experiments
Materials and basic DNA manipulation. All used chemicals were purchased from SigmaAldrich (St. Louis, MO, USA). The enzymes used for DNA manipulations were obtained from Takara Bio (Kyoto, Japan), Toyobo (Osaka, Japan) and New England Biolabs (Beverly, MA USA). Modification and mutagenesis oligonucleotide primers were obtained from Hokkaido System Science (Hokkaido, Japan). Plasmids pUC18 and pAQN were obtained from (Takara Bio, Kyoto, Japan) and from Nagata et al. (1999), respectively. The bacterial strains Escherichia coli DH5 , BL21 andα XJb were obtained from Zymo Research (Orange, CA, USA) and cultivated on Lysogeny Broth (LB) medium obtained from SigmaAldrich (St. Louis, MO, USA). Established methods were employed for the following procedures: preparation of plasmid DNA, digestion of plasmids and PCRamplified DNA fragments with restriction endonucleases, ligation, agarose gel electrophoresis, and transformation of Escherichia coli cells (Maniatis, 1982).
Preparation of recombinant dhaAHis gene. Nucleotide sequence of pRTL1 plasmidlocated dhaA gene (GenBank accession number AF060871; Supplementary file genbank_AF060871) from Rhodoccocus rhodochrous NCIMB 13064 (Kulakova et al., 1997) was modified at its termini by addition of BamHI and HinDIII restriction sites, ShineDalgarno sequence (Shine & Dalgarno, 1975) and six codons for His in PCR using synthetic oligonucleotide primers designed accordingly (Fig 38). The PCRamplified modified dhaA gene (dhaAHis) was inserted into high copy number pUC18 plasmid to yield recombinant plasmid pUC18::dhaAHis that was subsequently transformed into Escherichia coli DH5α (Fig 39). The transformants were selected by ampicilin resistance conferred by pUC18located bla gene encoding lactamase. Among the transformants, recombinant pUC18::β dhaAHis were distinguished from intact plasmid by blue/white screening on LB agar with 5bromochloroindolylgalactopyranoside, Xgal (Fig 40).
Sitedirected mutagenesis I. The amplified pUC18::dhaAHis plasmid was isolated from the recombinant Escherichia coli DH5α and served as the template for sitedirected mutagenesis (Table 23) by inverted (also known as “inside out” or “inverse”) PCR (Ochman et al., 1988; Triglia et al., 1988) using synthetic oligonucleotide primers to yield pUC18::dhaA04His. The mutant recombinant dhaA04 gene was afterwards recloned into pAQN yielding pAQN::dhaA04His. The recombinant plasmids pUC18::dhaAHis and pAQN::dhaA04His served as the templates for sitedirected mutagenesis using the QuikChange SiteDirected Mutagenesis Kit (Stratagene, La Jolla, CA, USA) to yield pUC18::dhaA14His and pAQN::dhaA15His, respectively (Stsiapanava et al., 2008). The mutant recombinant dhaA14 gene was afterwards recloned into pAQN yielding pAQN::dhaA14His. pAQN::dhaA04His also served as the template for two rounds of sitedirected mutagenesis by inverted PCR with KOD Plus polymerase (Toyobo) to yield pAQN::dhaAM2 and pAQN::dhaAM3, respectively. The recombinant plasmids were transformed into Escherichia coli BL21 and the respective DhaA proteins were overexpressed and purified (vide infra).
91

3 Methods
Fig 38 | Preparation of dhaAHis gene. (a) Oligonucleotide primers for PCR amplification of dhaA gene; (b) detail of forward primer; (c) detail of reverse primer. The forward oligonucleotide primer for PCR gene amplification was designed to introduce BamHI restriction site for DNA manipulation purpose and ShineDalgarno sequence of Escherichia coli canonical form (TAAGGAGG) (Makrides, 1996) for overexpression of DhaA protein. The reverse oligonucleotide primer for PCR gene amplification was designed to introduce six codons for His (alternating two His codons, GTG and ATG) between last coding codon for Leu293 (CTC) and the amber stop codon (TAG) to aid purification of DhaA protein, and HindIII restriction site for DNA manipulation.
Fig 39 | Preparation of recombinant pUC18::dhaAHis plasmid. (a) pUC18 plasmid and dhaAHis are digested with BamHI and HindIII restriction endonucleases and joined into recombinant plasmid pUC18::dhaAHis with dhaAHis inserted within multiple copy site (MCS). bla – gene encoding lactamase; β rep – pMB1 replicon; lacZ – gene encoding Nterminal part of galactosidase.β
Saturation mutagenesis and seeding. Both pAQN::dhaAM2His and pAQN::dhaAM3His served as the templates for two saturation mutagenesis experiments (Table 24) by inverted PCR targeting one (diversity 32) and two codons (diversity 1024), respectively, using specific oligonucleotide primers. The coding strand primers contained NNK at the position to be mutagenised, where N was an equal mixture of all four nucleotides and K was an equal mixture of G and T. The mutated amplified plasmids were treated with DpnI to digest the parental DNA template, leaving the mutationcontaining in vitro synthesised nicked plasmids that were transformed into Escherichia coli DH5 , yieldingα two sublibraries for each template. All transformants were used for the stock bulk sublibrary and for fivefold inoculation of 3 mL LB media with 100 g mLμ 1 ampicilin. Plasmids from the two pAQN::dhaAM2Hisbased sublibraries and the two pAQN::dhaAM3Hisbased sublibraries were isolated and purified using Quantum Prep Plasmid Miniprep kit (BioRad Laboratories). The isolated plasmids from respective sublibraries were mixed in equal amounts, digested simultaneously with HindIII and NruI restriction endonucleases at 37°C for 2 h. A small fragment of DNA (330 bp) from the two codon sublibrary was cloned into the respective one codon sublibrary (4,600 bp),
92

3 Methods
resulting in the final libraries A and B, each saturated at the three codons of interest. The libraries A and B were electroporated (Neumann et al., 1982; Lurquin, 1997) into Escherichia coli XJb cells (1 mm cuvette, 1.8 kV, 200 ,Ω 25 F).μ
Fig 40 | Selection of Escherichia coli DH5 with pUC18::α dhaAHis. (a) Escherichia coli DH5 cell with recombinant plasmidα pUC18::dhaAHis does not produce functional galactosidase to convert Xgal into blue 5,5'dibromo4,4'dichloroindigo, andβ produces white colonies on LB agar plate with Xgal and ampicilin (right); cell lysis is protected by pUC18encoded periplasmicspacelocated lactamase (yellow); β (b) Escherichia coli DH5 cell with intact pUC18 plasmid produces functional galactosidaseα β by complementation of pUC18encoded Nterminal part the enzyme (blue sickle) with hostencoded Cterminal part (grey sickle), to convert Xgal into blue 5,5'dibromo4,4'dichloroindigo (BCI) via 5bromo4chloro3hydroxyindole (BCHI), and produces blue colonies on LB agar plate with Xgal (right); cell lysis is protected by lactamase (yellow); β (c) Escherichia coli DH5 withoutα pUC18 plasmid lyses on LB agar plate with ampicilin (right) due to absence of pUC18encoded periplasmicspacelocated βlactamase (Minsky et al., 1986).
Propagation of libraries. The recovered transformed Escherichia coli XJb cells were plated onto LB agar plates supplemented with 100 g mLμ 1 ampicillin and incubated overnight at 37°C. The individual colonies were picked with sterile toothpicks and resuspended in separate wells of a 96well plate containing LB medium and 100 g mLμ −1
ampicillin. Each 96well plate contained eight positive controls of M2, four negative controls with the intact pAQN plasmid and four wildtype controls. The plates were shaken at 120 r.p.m. at 37 °C for at least 16 h, and a replica of the 96 wells was made on LB agar plates. Expression of the mutant dhaaHis gemes from lac promoter was induced by isopropylbDthiogalactopyranoside (IPTG), that inactivates pAQNencoded LacI repressor, at a final concentration 0.5 mM and cultivated for a further 5 h at 30 °C, pelleted at 4 °C by centrifugation at 1,800 r.p.m. for 35 min and
93

3 Methods
stored at −80 °C.
Table 23 | Sitedirected mutagenesis.Template Primers (5' 3')a, b Result Introduced mutationd
pUC18::dhaAHis TACGTCGTCCGT CCGCTTACfw
TTTCGGGAGCGCACCCTCrev
pUC18::dhaA04His Cys176Tyr
pAQN::dhaAHis GGAATTCATCCGGCCTTTCCCGACGTGGfw
CCACGTCGGGAAAGGCCGGATGAATTCCrev
pUC18::dhaA14His Ile135Phe
pAQN::dhaA04His GGAATTCATCCGGCCTTTCCCGACGTGGfw
CCACGTCGGGAAAGGCCGGATGAATTCCrev
pAQN::dhaA15His Ile135Phe
pAQN::dhaA04His TTCCTCCAGGAAGACAACCCfw
GTGCAATCCCGGGGCrev
pAQN::dhaAM2His Tyr273Phe
pAQN::dhaAM2His GGACGAATTTCCGGAATTCGfw
CACGTCGGGATAGGCCrev
pAQN::dhaAM3His Trp141Phe
pAQN::dhaA31His TTCCTCCCGAAATACGTCGTCCfw
ACCCTCGATGAAAGCGTTCTGfw
pAQN::dhaA51His Ala172Phe
pAQN::dhaA51His TTCCGTGAGACCTTCCAGGCfw
GAATTCCGGCCATTCGTCCCrev
pAQN::dhaA52His Ala145Phe
aThe introduced mutations are boldfaced and underlined.bfw, forward primer; rev, reverse primer.
Table 24 | Saturation mutagenesis.Template Primers (5' 3')a, b, c Result Introduced mutationd
pAQN::dhaAM2His GGCCTNNKCCGACGTGfw
GGATGAATTCCATACATGCAATACrev
pAQN::dhaAsublibraryA1His Ile135X
pAQN::dhaAM2His NNKATCCCCCCGGCCGAAGfw
MNNGCCGGGTGTGCCCCAGrev
pAQN::dhaAsublibraryA2His Val245XLeu246X
pAQN::dhaAM3His GGCCTNNKCCGACGTGfw
GGATGAATTCCATACATGCAATACrev
pAQN::dhaAsublibraryB1His Ile135X
pAQN::dhaAM3His NNKATCCCCCCGGCCGAAGfw
MNNGCCGGGTGTGCCCCAGrev
pAQN::dhaAsublibraryB2His Val245XLeu246X
aThe introduced mutations are boldfaced and underlined.bN = A, G, C or T; K = G or T; M = A or C.cfw, forward primer; rev, reverse primer.dX – any of the 20 standard amino acid residues.
Highthroughput screening of the libraries for dehalogenating activity with TCP. The microplates with the propagated mutant A and B libraries were defrosted, and cell pellets were lysed in 1 mM HEPES buffer (pH 8.2). 10
L of cell free extract was transferred into 140 L of phenol red assay buffer (pH 8.2) composed of 1 mM HEPESμ μ buffer, 20 mM Na2SO4, 1 mM EDTA and phenol red at final concentration 25 g mLμ −1. TCP substrate was added to an apparent concentration of 10 mM, the microplates were sealed with parafilm and incubated at 25 °C for 16 h. Hydrolytic dehalogenation of TCP is accompanied by production of protons that decreased pH of the weakly buffered medium causing change in colour of the phenol red dye from red to yellow: the most active variants produced a bright yellow colour, less active in hues of orange, while inactive variants and negative controls formed a deep purple colour (Fig 41). Replica colonies corresponding to the most active variants (wells) were used to inoculate 3 mL LB media and their plasmids were subsequently isolated. The nucleotide sequences of the mutant dhaA genes of 51 most active variants were determined by the dideoxy chain termination method using an automated DNA sequencer, ABI PRISM 310 genetic analyzer with BigDye, Terminator version 3.1 Cycle Sequencing kit (Applied Biosystems, Foster City, CA, USA; Fig 42). Selected plasmids encoding 25 unique DhaA mutant proteins were transformed into Escherichia coli BL21.
Overexpression of selected DhaA variants. Escherichia coli BL21 cells with the selected plasmids were cultured in 10 mL (for determination of specific activity – see below) and in 2 L (for purification – see below) of LB with 100 gμ mL1 ampicilin at 37 °C and cultivated at 37 °C to an optical density of 0.5 at 600 nm. The induction of DhaA variant expression at 30 °C was initiated by the addition of IPTG to a final concentration of 0.5 mM. The cells were harvested by centrifugation at 8000g for 10 min after 4 h of cultivation at 30 °C. During harvesting, cells were washed and then resuspended in 20 mM KH2PO4 buffer (pH 7.5). The harvested cells were kept at −65 °C. Defrosted cell suspensions were disrupted by sonication using a Soniprep 150 (Sanyo Gallenkamp PLC, Loughborough, UK) or ultrasonic processor Hielscher UP200S (Hielscher Ultrasonics, Teltow, Germany). The cellfree extracts (lysates) were centrifuged at 21,000 g for 1 h to provide DhaAcontaining supernatant.
94

3 Methods
Fig 41 | Screening a saturation mutagenesis library for dehalogenation of TCP. (a) Escherichia coli Xjb replica colonies from a saturation mutagenesis library; (b) 96wells microplate containing eight positive M2 mutant controls (light grey), four wildtype controls (dark grey), four negative controls (black), and 80 variants picked from the saturation mutagenesis library. In this example, variant 9E shows enhanced activity compared to the M2 mutant positive controls as the 9E contains the highest concentration of proton product of dehalogenating reaction, indicated by decrease in pH and colourchange response of phenol red pH indicator.
Comparison of substrate specificities of selected DhaA variants. Substrate specificity of wildtype DhaA and the most active mutant 31 towards a set of 31 substrates (Table 25) was assayed in the crude extracts by monitoring released halide anions (X) by addition of mercuric thiocyanate and ferric ammonium sulfate, and determining the orange colour of ferric thiocyanate product spectrophotometrically at 460 nm, the socalled Iwasaki method (Scheme 6; Iwasaki et al., 1952):
Scheme 6 | Iwasaki method.
One unit of enzymatic activity was defined as the release of 1 mol of halide anion per minute.μPurification of selected DhaA variants. The collected cellfree extracts were purified using using FPLC Akta
(Amersham Pharmacia Biotech, USA) and HiTrap affinity column packed with high performance chelating sepharose (GE Healthcare Life Sciences, NJ, USA formerly Amersham Pharmacia Biotech) or with affinity resin (Amersham Biosciences, Freiburg, Germany) charged with Ni2+ and equilibrated with purification buffer (pH 7.5) composed of 16.4 mM K2HPO4, 3.6 mM KH2PO4, and 0.5 M NaCl containing 10 mM imidazole. The Histagged DhaA proteins were bound to the resin in the equilibrating buffer composed of 50 mM phosphate buffer (pH 7.5) containing 500 mM sodium chloride and 10 mM imidazole. Unbound and weakly bound proteins were washed out with buffer containing 50 mM imidazole. Histagged DhaA proteins were eluted with the purification buffer containing 300 mM imidazole. Purified proteins were dialysed overnight against 50 mM phosphate buffer (pH 7.5) composed of 41 mM K2HPO4 and 9 mM KH2PO4. The enzymes were sterilised and stored in the same buffer. The entire purification process and storage was performed at 4 °C. DhaA protein concentrations were determined by the method of Bradford (SigmaAldrich, St. Louis, MO, USA).
Sitedirected mutagenesis II. The plasmid with mutant dhaA gene encoding the most active DhaA variant, pAQN::dhaA31His, served as the template for two rounds of sitedirected mutagenesis (Table 23) by inverted PCR with Phusion polymerase (Finnzymes, Espoo, Finland) and using specific oligonucleotide primers yielding pAQN::dhaA51His and pAQN::dhaA52His, respectively. The recombinant plasmids were transformed into Escherichia coli BL21 and the respective DhaA proteins were overexpressed and purified (see above).
Determination of steadystate kinetic constants for selected DhaA variants with TCP. Steadystate kinetic constants, kcat and Km, for the conversion of TCP by wildtype DhaA and mutants M2, M3, 04, 14, 15, 21, 27, 31, 51, and 52 were assayed with TCP by the initial velocity measurements as described previously (Chaloupková et al., 2003): the substrate concentration was determined by a gas chromatography (Trace GC 2000) equipped with a flame ionization detector (Thermo Finnigan, San Jose, CA, USA) and a DBFFAP capillary column 30 m × 0.25 mm × 0.25 mm (J&W Scientific, Folsom, CA, USA). Dehalogenation reaction was performed at 37 °C in 25mL ReactiFlasks closed by Mininert Valves in a shaking water bath. 10 mL reaction mixture consisted of 0.2 to 1.0 mg mL1 DhaA
95

3 Methods
variant in glycine buffer (pH 8.6) and varied concentrations of substrate (0.5 to 15.0 mM). The reaction was stopped by the addition of methanol at 10 and 20 min or 15 and 30 min time points. All the data points were measured in duplicates or triplicates. Halide product concentration was determined by the Iwasaki method. The Km and kcat
constants were calculated using the program Origin 6.1 (OriginLab, Northampton, MA, USA). The kinetic data were fitted using the Origin 6.1 to linear or exponential (burst) models described by equation c = A (1exp(kB t)) + kL t, where A is the amplitude of burst, kB is the burst phase rate and kL is the steadystate phase rate.
Fig 42 | Determination of nucleotide sequence of mutant dhaA genes. (a) Cycle sequencing by dideoxynucleotide termination method using differently fluorescentlylabelled dideoxynucleotide terminators (BigDye, Terminator v. 3.1, Applied Biosystems, Foster city, CA, USA); (b) fractionating products of the sequencing reaction by capillary electrophoresis according to size, and detection of the fluorescentdyelabelled DNA fragments by fluorescent detector yielding emission spectrum that provides the order of nucleotides in the nucleotide sequence. Redrawn according to Applied Biosystems (Foster city, CA, USA).
Determination of product inhibition for selected DhaA variants. Steadystate inhibition constants, Ki, for 2,3dichloropropane1ol (DCL) were calculated using the program ORIGIN 6.1 (OriginLab, Northampton, MA, USA) for wildtype DhaA and mutants 21, 27, and 31 based on the initial rates of TCP conversion determied by the Iwasaki method at various DCL concentrations. The TCP substrate concentration was constant (1.4 mM), and the DCL inhibitor concentrations varied between 1.4 and 35.0 mM. The velocity of the reaction without the DCL inhibitor was measured as a negative control. Reactions were performed in duplicates. Halide concentrations were determined at
96

3 Methods
several times (10, 20, 30, and 40 min) in order to obtain at least three data points in the initial phase of conversion. Initial substrate and inhibitor concentrations were determined before reaction initiation by Trace GC 2000 equipped with a flame ionization detector (Thermo Finnigan, San Jose, CA, USA) and a DBFFAP capillary column 30 m × 0.25 mm × 0.25 mm (J&W Scientific, Folsom, CA, USA).
Table 25 | Set of substrates for determination of substrate specificity.Group Compounds1Haloalkanes 1Chloropropane
1Iodopropane1Chlorobutane1Bromobutane1Iodobutane1Chloropentane1Chlorohexane1Bromohexane1Chlorodecane1Iodohexane
2Haloalkanes 2Chloropropane2Iodobutane
1,2Haloalkanes 1,2Dibromoethane1Bromo2chloroethane1,2Dibromopropane2Bromo1chloropropane
, Haloalkanesα ω 1,2Dibromoethane1Bromo2chloroethane1,3Dichloropropane1,3Dibromopropane1,3Diiodopropane1Bromo3chloropropane1,5Dichloropentane
Multihalogenated alkanes 1,2Dibromo3chloropropane1,2,3Trichloropropane1,2,3Tribromopropane
2Substituted 1Haloalkanes 1Bromo2methylpropaneCyclic haloalkanes Chlorocyclopentane
(Bromomethyl)cyclohexaneHaloalkenes 2,3Dichloropropene
3Chloro2methylpropeneHalonitriles 4BromobutyronitrileHaloethers Bis(2chloroethyl) ether
Determination of secondary structure fingerprint for selected DhaA variants. Secondary structure fingerprint of the purified wildtype DhaA, mutants 04, M2, M3, and six most active DhaA variants obtained by screening the saturation mutagenesis libraries A and B (mutants 17, 19, 21, 27, 31 and 33), and mutants 51 and 52, was determined by measuring farUV CD spectra (Fig 43) using Jasco J810 spectropolarimeter (Jasco, Tokyo, Japan). CD data were collected at 22°C, from 185 to 260 nm at 100 nm/min rate, 1 s response time and 2 nm bandwidth using a 0.1 cm quartz cuvette. The concentration of tested proteins was in the range of 0.26 to 0.30 mg mL1. For each DhaA variant, ten individual scans were averaged, corrected for absorbance caused by the buffer and expressed in terms of the mean residue ellipticity, θMRE in deg cm2 dmol1, at wavelength λ (Eq 11):
Eq 11 | Mean residue ellipticity.
where θλ is the observed ellipticity (degrees) at wavelength λ, M is the molecular mass of the protein (Da), N is the number of amino acid residue in the protein (299 in DhaAHis variants), d is the pathlength (cm) and c is the concentration (g mL1). Secondary structure content of wildtype DhaA and mutants 04, 14, 15, 21, 27, 31, 51 and 52 was calculated from the CD spectra using K2D and SelfConsistent methods (Andrade et al., 1993; Sreerama & Woody, 1993) implemented in the program DICROPROT (Deléage et al., 1993).
97

3 Methods
Fig 43 | Determination of secondary structure fingerprint of DhaA variants by CD spectroscopy. Circular dichroism is a phenomenon observed when optically active matter, e.g. protein, absorbs left (EL) and right (ER) circularly polarised light (Supplementary files circularly_polarised_light_left.gif and circularly_polarised_light_right.gif) slightly differently, causing the projection of the resulting amplitude to yield an ellipse instead of a line (Kelly et al., 2005). Circularly polarised light is created from linearly polarised light (Supplementary file linearly_polarised_light.gif) by piezoelectric crystal modulator (PEM), and detected by photomultiplier (PM) after going through the protein sample. In proteins, the chromophores are peptide bonds (Kelly et al., 2005). Amino acid residues in different conformational states, e.g. helix and sheet, showα β characteristic differential absorbance at various wavelength of farUV region of light spectrum (Kelly et al., 2005). Plotting differential absorbances or mean residue ellipticities against wavelengths in farUV region provides farUV CD spectrum characteristic for a given protein (Kelly et al., 2005), here DhaA variant. Knowing mean residue ellipticity at 208 and 222 nm, and protein concentration, relative number of amino acid residues of the protein in helical and stranded conformations canα β be determined by fitting the farUV CD spectrum to standard curves for pure helical and sheet conformations.α β
Determination of highresolution structure of selected DhaA variants. Highresolution XC structure was determined for the purified DhaA variants 04 (PDBID 3FBW; Supplementary file 3fbw.pdb), 14 (PDBID 3G9X; Supplementary file 3g9x.pdb) and 15 (PDBID 3FWH; Supplementary file 3fwh.pdb) using XC structure of DhaA from Rhodococcus sp. (PDBID 1BN6) and XC structure of the mutant 15 as starting models for molecular replacement (Fig 44 and Table 26; Stsiapanava et al., 2008).
Determination of ratelimiting step of selected DhaA variants. Ratelimiting step in reaction cycle of TCP dehalogenation by wildtype DhaA and the mutant 31 was determined by combinating two approaches: (i) solvent kinetic isotope effects determined by performing activity assays at 37 °C in glycine buffer (pH 8.6) containing TCP and increasing concentrations of 2H2O from 0 to 100%, and (ii) rapid quenchflow experiments performed at 37 °C in a glycine buffer (pH 8.6) using a QFM 400 rapid quenchflow instrument (BioLogic, Claix, France; Fig 45). In the latter technique, the reaction was started rapidly by mixing 70 L enzyme and 70 L substrate solutions, then quenchedμ μ with 100 L 0.8 M Hμ 2SO4 after time intervals ranging from 2 ms to 8 s. The quenched mixture was directly injected into 0.5 mL of icecold diethyl ether with 1,2dichloroethane as an internal standard. After extraction, the diethyl
98

3 Methods
ether layer containing noncovalently bound TCP substrate and DCL alcohol product was collected, dried on a short column containing anhydrous Na2SO4 and analysed using Trace GC 2000 equipped with an MS detector (Thermo Finnigan, San Jose, CA, USA) and a DBFFAP capillary column (J&W Scientific, Folsom, CA, USA). The amount of chloride anion (CL) product in the water phase was measured using an 861 Advanced Compact ion chromatograph equipped with a METROSEP A Supp 5 column (Metrohm, Herisau, Switzerland).
Fig 44 | Crystallisation and Xray diffraction data collection for determination of XC structure for selected DhaA variants. (a) Crystallisation of DhaA mutants 04, 14, and 15 by sitting drop vapor diffusion method; (b) crystals of the mutant proteins; (c) DORIS storage ring facility (circumference of 289 m, bending radius of 12.2 m, energy of 4.45 GeV) of EMBL/DESY synchrotron used for diffraction data collection for the DhaA mutant proteins; (d) diffraction images of the DhaA mutant proteins. The crystals of the mutants 04, 14 and 15 diffracted to resolution of 1.30, 0.95 and 1.15 Å, respectively.
Table 26 | Summary of XC data and refinement. (pp. 99102)Parameters DhaA variant
04 14 15Crystallisation
Conditions 0.08 M bicine8% PEG 80000.08 M MgCl2pH 9.0Temperature 294 K
25% PEG 40008% 2propanol0.1 M sodium acetatepH 7.5Temperature 277 K
25% PEG 40008% 2propanol0.1 M sodium acetatepH 7.5Temperature 277 K
Technique Sitting drop vapor diffusionb
Sitting drop vapor diffusion
Sitting drop vapor diffusion
Space groupb, c P212121 P1 P1Diffraction data collection
Synchrotrond Yes Yes YesRadiation source EMBL/DESY, Hamburg EMBL/DESY, Hamburg EMBL/DESY, HamburgBeamline X11 X11 X11Wavelength (Å)e 0.82 0.82 1.15Detector CCD CCD Image plateTemperature (K) 100 100 100pH 9.0 7.5 7.5Number of crystals used 1 1 1Number of unique reflectionsf, g 88,814 163,495 77,114Resolutionh range high (Å)i 1.23 0.95 1.20Resolution range low (Å)j 100 20.00
99

3 Methods
Parameters DhaA variant04 14 15
Completeness (%)k 100.0 94.2 90.7Data redundancyl 7.400 5.8 3.4Rmerge
m 0.05600 0.05900 0.05000In the highest resolution shell
Resolution range high (Å) 1.23 0.95 1.20Resolution range low (Å) 1.25 0.97 1.24Completeness (%) 99.9 90.6 45.0Data redundancy 5.70 4.00 2.1Rmerge 0.581 0.418 0.179
Model buildingMethod Molecular replacementn Molecular replacement Molecular replacementSoftware MOLREP MOLREP MOLREPStarting model (PDBID) 1BN6 3FWH 1BN6
RefinementProgram SHELXL97 REFMAC 5.2.0019 REFMAC 5.2.0019Data used in refinement
Resolution range high (Å) 1.23 0.95 1.22Resolution range low (Å) 100.00 19.86 20.00Completeness (%) 99.9 94.17 94.4Number of reflections 88,731 162,574 77,113
Fit to data used in refinementCrossvalidation method Free R Throughout ThroughoutRfactor (working + test set)o 0.137 0.114 0.162Rfactor (working set)o 0.137 0.113 0.161Rfree
p 0.167 0.125 0.186Number of nonhydrogen atoms used in refinement
Protein atoms 2,692 2,679 2,656Heterogen atoms 17 8 5Solvent atoms 454 756 645
RMS deviations from restraint target valuesBond lengths (Å)q 0.011 0.012 0.013Bond angles (degrees) NR 1.498 1.467
Final modelPDBID 3FBW 3G9X 3FWHResolution (Å) 1.23 0.95 1.22Missing amino acid residues Met1
Ser2His296His297His298His299
Met1His298His299
Met1His298His299
Missing atoms His295Cα
His295CHis295OHis295Cβ
His295Cγ
His295Nδ1
His295Cδ2
His295Cε1
His295Nε2
Ser2Oγ
Torsion angles outside the expected Ramachandran regionsr
Pro29Pro42Thr43Glu98Asp106Asp156Val245Leu271His294
Pro42Thr43Glu98Asp106Asp153Asp156Val245Leu271
100

3 Methods
Parameters DhaA variant04 14 15
Cisconformation of peptide bond Asn41Pro42Glu214Pro215Thr242Pro243
Asn41Pro42Glu214Pro215Thr242Pro243
Asn41Pro42Glu214Pro215Thr242Pro243
Number of discretely disordered amino acid residues
61 41 35
Mean Bfactor (Å2)s 11.57 8.76 13.46Ligands Benzoic acid
Chloride anion (6 )Magnesium cation (2 )
2PropanolAcetate anionChloride anion
2PropanolAcetate anionChloride anion
Solventt Water (454 ) Water (651 ) Water (614 )aSitting drop vapor diffusion – a methods for creating supersaturation and promoting a solubility minimum (McPherson, 2004).bProtein crystal – a solid composed of repeated structural motifs (protein molecules) in a threedimensional lattice (Acharya & Lloyd, 2005).cSpace group – symmetrical arrangement of molecules in the crystal lattice where one or more protein molecules are related to others by mathematical transformations (Acharya & Lloyd, 2005); the space group symmetry dictates amount of data required to solve the XC structure (Acharya & Lloyd, 2005).dSynchrotron – an intense Xray source used for highresolution data collection (Acharya & Lloyd, 2005).eWavelength – wavelength of the Xray radiation; about atomic bond length (Acharya & Lloyd, 2005).fReflection (diffraction spot) – a result of the scattering of Xrays by the electrons of atoms in the crystal lattice; a series of reflections creates a diffraction pattern; rotation of the crystal through a defined angle (determined by its symmetry) is needed for obtaining diffraction spots for all the ordered atoms in the molecule (Acharya & Lloyd, 2005); each reflection has three properties – wavelength of the difracted beam, amplitude (obtained from measured intensities) and phase (Wlodawer et al., 2008); the intensity of each individual reflection depends on the positions of all atoms in the unit cell, therefore it is not possible to solve only a selected, small part of the crystal structure without modelling the rest of it (Wlodawer et al., 2008).gNumber of unique reflections – minimum number of unique reflections per atom (including all hydrogen atoms and water molecules) = 4 (Acharya & Lloyd, 2005).hResolution of diffraction data – minimum spacing of crystal lattice planes that still provides measurable diffraction of Xrays which defines minimum distance between structural features that can be distinguished in the electron density maps; among four customary categories distinguised today, low > 2.7 Å, medium ~ 2.7 Å, high ~ 1.5 Å, and atomic < 1.2 Å, (Wlodawer et al., 2008), the resolution of the diffraction data for the DhaA variant is high/atomic.iResolution range high – high resolution is needed for obtaining accurate atomic positions in XC structure (Acharya & Lloyd, 2005).jResolution range low – no data cutoff is applied when refining a protein structure; all observed reflections at low resolution are used otherwise Bfactors would become underestimated (Acharya & Lloyd, 2005).kCompleteness – the number of observed reflections divided by theoretical maximum; completeness approaches 100% in goodquality structures (Acharya & Lloyd, 2005); if some reflections are not measured at all then data are not 100% complete; the lack of completeness negatively influences the quality and interpretability of the electron density maps computed from such data because each value of the electron density map can be correctly calculated only with the contribution of all reflections (Wlodawer et al., 2008).lData redundancy – the average number of times each unique reflection is recorded (Acharya & Lloyd, 2005); the higher the redundancy the more accurate the final estimation of the averaged reflection intensity which is important for goodquality model (Wlodawer et al., 2008).mRmerge – diffraction data reliability factor for judging spread of individual intensities of all symmetryequivalent reflections, contributing to the same unique reflection; important because every reflection is measured with a certain degree of error (Wlodawer et al., 2008); a good set of diffraction data is characterised by Rmerge < 45%; at the highest resolution shell, Rmerge can be allowed to reach values up to 3040% for low symmetry crystals and up to 60% for high symmetry crystals, since in the latter case the redundancy is usually higher (Wlodawer et al., 2008).nMolecular replacement (MR) – a method for solving phase problem for structure determination by using a suitable existing macromolecular model (Pusey et al., 2005; Chruszcz et al., 2008; Manjasetty et al., 2008).oRfactor – global reliability factor for judging the agreement (discrepancy) between the observed reflection amplitudes, Fobs, and those calculated from the model, Fcalc (Wlodawer et al., 2008); Rfactor combines the error inherent in the experimental data and the deviation of the model from reality; with increasingly better diffraction data (characterised by Rmerge ≤ 4% or less) crystallographic Rfactor is an effective measure of model errors; Rfactor for wellrefined protein structures is expected < 20%; when Rfactor approaches 30%, structure should be regarded with a high degree of reservation because at least some parts of the model may be incorrect; the best refined macromolecular structures have Rfactors < 10% (Wlodawer et al., 2008); inclusion of lowresolution data is essential for reliability of Rfactor (Acharya & Lloyd, 2005).pRfree – reliability factor calculated analogously to R factor, but for only ~ 1000 randomly selected reflections which have never entered into model refinement, although they might have influenced model definition; if the mathematical model of the structure becomes unreasonably complex, i.e. when it includes parameters for which there is no justification in the experimental data, then Rfree will not improve even though the R factor may decrease, which is an indication of overinterpretation of the data; Rfree should
101

3 Methods
not exceed R factor by more than ~ 7% (Wlodawer et al., 2008).qRMS for bond lengths – an indicator of how much the model departs from typical or commonsenserepresenting bond lengths based on previous experience; goodquality medium/high resolution structures are expected RMS for bond length ~ 0.02 Å (Wlodawer et al., 2008).rExpected regions of Ramachandran plot – three broad regions (E, L, R) of and dihedral angles sterically allowed for the Lα α φ ψamino acids in Ramachandran plot (Ramachandran et al., 1963; Acharya & Lloyd, 2005); mapping pairs of amd dihedralφ ψ angles has strong validation power because their values are usually not restrained in the refinement, unlike bond lengths and bond angles (Brown & Ramaswamy, 2007; Wlodawer et al., 2008).sBfactor – thermal vibration factor, a measure of thermal mobility of any particular atom in the crystal structure model; there are two types of Bfactors – isotropic (equal in all directions) and anisotropic (not equal in all directions); anisotropic refinement is possible only for atomic resolution structures (Acharya & Lloyd, 2005).tSolvent (ordered water molecules) – number increases with increasing resolution (Acharya & Lloyd, 2005); rough estimate of the expected ratio of the number of water molecules per amino acid residue can be obtained by substracting resolution (in Å) from 3 (Wlodawer et al., 2008).
Fig 45 | Rapid quench flow experiment for determination of presteady state kinetics of dehalogenation of TCP by DhaA variants. Each syringe is driven by an independent stepping motor. Solutions are loaded into the instrument using four position valves. Reaction was initiated upon mixing DhaA wildtype or 31 mutant with TCP in the mixer 1. The reaction mixture moved via delay loop into mixer 2 where the reaction was stopped by quencher, and the aged solution was flushed through an exit line to a collect device. The quenched sample was subsequently analysed for concentration of TCP substrate, and DCL and CL products. Redrawn according to BioLogic (Claix, France).
3.2 Molecular Modelling
Preparation of protein structures. The XC structure of DhaA from Rhodococcus sp. (PDBID 1CQW) was truncated by five amino acid residues at the Cterminus, renumbered according to dhaA gene (Supplementary file genbank_AF060871) and modified with three amino acid residue substitutions, Val172Ala, Ile209Leu, and
102

3 Methods
Ala292Gly, using PYMOL 0.97 or 0.99 (DeLano, 2002) to reconstruct the structure of DhaA from Rhodococcus rhodochrous NCIMB 13064 (wildtype DhaA) used in experiments. The wildtype structure of DhaA served as the template for amino acid residue substitutions using PYMOL, yielding structures of mutant proteins 04, 14, 15, 21', 27', 31', 51', and 52'. The most frequently occurring rotamer that had little or no steric overlap with the neighbouring protein atoms was selected from backbonedependent rotamer library (Dunbrack & Cohen, 1997) for each substitution (Fig 46). The in silico mutants correspond to the mutants obtained by sitedirected and saturation mutagenesis by the identifiers, except for absence of Tyr273Phe in the in silico mutants marked with the prime symbol.
Fig 46 | In silico mutagenesis of DhaA using PYMOL mutagenesis wizard; procedure is demonstrated on Cys176Tyr substitution. (a) wildtype Cys176; (b) Cys176Tyr rotamer 1; (c) Cys176Tyr rotamer 2; (d) Cys176Tyr rotamer 3. The backbonedependent rotamers are ordered according to their frequencies of occurrence in experimental protein structures stored in PDB, the value is given at the topright corner of each rotamer. The visible disks and their colours indicate pairwise overlap of atomic van der Waals radii. Small green disks are shown when atoms are almost in contact or slightly overlapping; large red disks indicate signficant van der Waals overlap; everything else lies between those extremes. The rotamer 1 shows high preference in proteins over the rotamer 2 and 3; rotamer 2 shows the least steric clashes. Thus, both rotamer 2 and 3 could be used. The rotamer 1 was applied in the expectation that the steric overlaps will be removed in subsequent MD simulations. The rotamer 2 was kept as second choice in case the structure with the rotamer 1 will be unstable in MD simulations. The rotamer 3 was discarded because it shows too large van der Waals overlaps with neighbouring atoms.
Preparation of ligand structures. The threedimensional models of (R)2,3dichloropropane1ol (RDCL), (S)2,3dichloropropane1ol (SDCL) and TCP (Fig 47) were built using PYMOL 0.97, and geometry optimised by the Austin Model 1 (AM1) method (Dewar et al., 1985) of MOPAC 2000 (Stewart, 1990) using the following keywords: SCFCRT = 1D12, EF, POINTS = 12, LET, and PRECISE. The optimised structures were refined by energy minimisation using GAUSSIAN 94 (Frisch et al., 1994) employing the HartreeFock method (Leach, 1996; Jensen, 2006) and 631G* basis set (Leach, 1996; Jensen, 2006) for compatibility with AMBER force field (Cornell et al., 1995; Cornell et al., 1996). Partial atomic charges were fitted to reproduce the electrostatic potential calculated with GAUSSIAN using the Restrained Electrostatic Potential fit, RESP (Bayly et al., 1993; Cornell et al., 1993), module of AMBER 8 (Case et al., 2004).
103

3 Methods
Fig 47 | Structures of ligands. (a) TCP; (b) RDCL. All atoms were assigned to unique RESP partial charges (given in e, +1.60219 1019
C). Atoms are coloured by type: carbon, green; oxygen, red; chlorine, yellow; hydrogen, white.
Modelling of enzymesubstrate and enzymeproduct complexes. The initial orientation of the TCP substrate in the active site of wildtype DhaA and the initial orientation of the R and SDCL product in the active site of DhaA wildtype complexed with CL were modelled using AUTODOCK 3.0.5 (Morris et al., 1998). Rotatable bonds were assigned to DCL and TCP using the Autotors module of AUTODOCK. All crystallographic water molecules were removed, the main tunnel iodide was removed, and the activesite iodide anion was replaced by a CL for docking of DCL, or removed, for docking of TCP. Polar hydrogens were added to wildtype DhaA using WHATIF 5 (Vriend, 1990), and partial charges and solvation parameters by the q.kollua and addsol scripts of AUTODOCK, respectively. The atomic interaction maps for all atom types of DCL and TCP, using carbon, oxygen, chlorine, and hydrogen atoms as the probes, as well as electrostatic potential map using a point charge of +1e, +1.60219 1019 C , as the probe, were precalculated for the wildtype DhaA using Autogrid module of AUTODOCK. A grid box of 81 81 81 points in x, y, and z dimensions was used with a grid spacing of 0.25 Å. The grid was centred on the Cγ atom of His272 to ensure that the entire active site, the open main tunnel, and the closed slot tunnel were encompassed by the box (Fig 48). The van der Waals interactions and hydrogen bonds were modelled using the 126 (Eq 12 and Fig 49) and 1210 LennardJones potential (Eq 13), respectively:
Eq 12 | The LennardJones 126 potential.
Eq 13 | The LennardJones 1210 potential.
104

3 Methods
where: r is the distance; εij is the welldepth for two atoms, i and j; and σ = the collision diameter = the seperation of the two atoms for which the energy is zero = reqm,ij/21/6, where reqm,ij is the equilibrium distance between the two atomic nuclei. The region of maximum affinity at ε was widened using the smoothing parameter of 0.5. Electrostatic interactions were modelled based on Coulomb's law (Eq 14) with no distance cutoff:
Eq 14 | Coulomb's law.
where: qi and qj are the partial charges of the atoms i and j; ε0 is the permitivity of free space; εr is the relative dielectric coefficient of the medium between the charges; rij is the distance seperating the centres of the atoms. A sigmoidal distancedependent dielectric function was used to model solvent screening (Mehler & Solmajer, 1991) (Eq 15):
Eq 15 | Dielectric function.
where: r is the distance; A = 8.5525; B = ε0 – A; ε0 = the dielectric constant of bulk water at 25°C = 78.4; λ = 0.003627 and k = 7.7839 parameters (Morris et al., 1998). Using the precalculated maps, fifty independent docking calculations were performed for R and SDCL, and TCP using the Autodock module of AUTODOCK, employing a Lamarckian genetic algorithm (LGA) consisted of global search using genetic algorithm (GA) and local search using pseudoSolis&Wets algorithm, pSW (Fig 50), and using the same setting as in the case docking study by Morris et al. (1998) and docking to haloalkane dehalogenase DhlA (Kmuníček et al., 2003) and LinB (Kmuníček et al., 2005). The GA was used with an initial population of 50 random individuals; an ellitism value of 1, which was the number of top individuals that automatically survived into the next generation; mutation rate of 0.02, which was the probability that a gene would undergo a random change; and a crossover rate of 0.8, which was the probability that two individuals would undergo crossover. The pSW was used with a maximum of 300 iterations per local search; the probability of performing local search on an individual in the population was 0.06. The energetics of a particular ligand configuration was found by trilinear interpolation of affinity values of the eight grid points surrounding each of the atoms in the substrate. The electrostatic interaction was evaluated similarly, by interpolating the values of the electrostatic potential and multiplying by the charge on the atom. Docked energy was expressed as a sum of intermolecular interaction energy between DhaA and DCL or TCP, and internal interaction energy of DCL or TCP. A maximum of 1,500,000 energy evaluations were performed. The resulting 50 conformations were clustered with a tolerance of 0.5 Å. The lowestenergy representatives of the highestpopulated clusters of R and SDCL, and TCP in the wildtype DhaA were selected as starting conformations for subsequent MD simulations. The conformations of R and SDCL obtained for the wildtype DhaA were applied to mutants for subsequent MD simulations.
Fig 48 | Search space in the wildtype DhaA for docking of DCL and TCP using AUTODOCK. Dimensions of the searching grid box are highlighted in blue. Atoms of the protein (lines and mesh representation) that fall inside the box are coloured in red. Catalytic pentad of the active site is coloured in green. Both the main tunnel and the closed slot tunnel are encompassed by the box.
105

3 Methods
Fig 49 | van der Waals potential energy approximated by the 126 LennardJones potential. The van der Waals interaction (–) between two atoms (balls) has two contributions: repulsive () and attractive (). The repulsive contribution is due to exchange (often referred to as “overlap”) forces and varies as 1/r12. The attractive contribution is due to dispersive forces and varies as 1/r6 (see Eq 12). The lowest value of the 126 LennardJones potential for the pair of interacting atoms is reached at the distance reqm., which is the sum of the socalled van der Waals radii of the two atoms. At shorter distances, the two atoms overlap and the 126 LennardJones potential increases. At longer distances, the interaction between the two atoms decreases. In AUTODOCK, the smoothed 126 LennardJones potential (–) is used to widen the range of well depth, , with theε lowest van der Waals potential.
Fig 50 | Lamarckian genetic algorithm (LGA) search stage in docking using AUTODOCK. The LGA is an allusion to Jean Baptiste Lamarck’s (discredited) assertion that phenotypic characteristics acquired during an individual’s lifetime can become heritable traits (Lamarck, 1809). The particular arrangement of a ligand and a protein is defined by a set of values (genes): x, y and z Cartesian coordinates for the ligand translation; four variables defining a quaternion (consisting of a random unit vector and a random rotation angle between 180° and +180° and specifying the ligand orientation; and one realvalue for each ligand torsion, in that order. The ligand's state corresponds to the genotype, whereas its atomic coordinates correspond to the phenotype. A generation consists of five stages: mapping of the genotype into phenotype, fitness evaluation (the sum of proteinligand intermolecular interaction energy and intramolecular interaction energy of the ligand), proportional selection of individuals that will reproduce, twopoint crossover between genes, mutation by adding random real number to the genes, and elitist selection defining how many of the top individuals automatically survive into the next generation, in that order. Each generation is followed by local search for a proportion of the population. The local search is performed by continuously converting from the genotype to the phenotype; sufficient iterations of the
local search arrive at a local minimum and the genotype of the parent is replaced by the resulting genotype, in accordance with Lamarckian principles. Redrawn according to Morris et al. (1998).
Classical MD simulations of enzymesubstrate and enzymeproduct complexes. Classical MD simulations were performed for wildtype DhaA and mutant 31' complexed with TCP, and for all DhaA variants with R and SDCL and with/without CL in AMBER 8 using the 1994 Cornell force field, ff94 (Fig 51 and Supplementary file parm94.dat; Cornell et al., 1995; Cornell et al., 1996). Carbon, oxygen, oxygenbound hydrogen and carbonbound hydrogen atoms were approximated by the CT, OH, HO and H1 atom types, respectively, of the ff94. Missing parameters for bond lengths, bond angles and dihedral angles involving chlorine atoms (the CL atom type of the ff94) were obtained from Kmuníček et al. (2001); CL (chloride anion) was approximated by the IM atom type (Smith & Dang, 1994) of the ff94 and was assigned a charge of −1e (Supplementary file parm94_kmunicek_etal_2001.dat). All crystallographic water molecules not overlapping with the docked TCP and DCL, respectively, were added to the
106

3 Methods
complexes. One additional water molecule was added with oxygen centred at the position of CL for MD simulations without CL. Nonpolar hydrogens were added to the protein using the Leap module of AMBER 8. Seventeen sodium cations were added with Leap to ensure a neutral net charge of the system. Finally, the complexes were immersed in a rectangular box of TIP3P (Jorgensen et al., 1983) water molecules with a minimum wall thickness of 10 Å using Leap and subjected to an equilibration protocol using the Sander module of AMBER 8 (Fig 53). The equilibrations consisted of the following steps: (i) 300 steps of steepest descent energy minimisation of all noncrystallographic atoms, i.e. all hydrogens on protein, water, and the ligand (DCL or TCP) atoms; (ii) 20 ps periodic boundary condition MD (Fig 52) of water, sodium cations, and the ligand at constant temperature of 300 K using the weak coupling algorithm (Berendsen et al., 1984) and constant pressure of 1 atm with isotropic position scaling, with the rest of the system harmonically restrained with a 500 kcal mol−1 Å−2 force constant; (iii) four consecutive steepest descent energy minimisations of 300 steps each with a decreasing restraint on the protein backbone with a force constant of 500, 125, 5, and 0 kcal mol−1 Å−2, respectively; (iv) unrestrained MD using the same parameters as those for the 20 ps of MD but raising the temperature from 0 to 300 K during the initial 200 ps (Table 27). The trajectories were propagated for 2.0 to 2.8 ns to ensure acquisition of wellequilibrated and stable systems. A time step of 2 fs was used with application of SHAKE algorithm (Ryckaert et al., 1977) to bonds involving hydrogens and a particle mesh Ewald treatment of Coulombic interactions. The cutoff distance for the nonbonded interactions was 10 Å. MD snapshots were gathered every 0.5 ps. The equilibration MD simulations of the enzymesubstrate complexes were followed by 2 ns of production classical MD simulations at 300 K using the same parameters as for the equilibration MD simulations; the equilibration MD simulations of the enzymeproduct complexes were followed by production RAMD simulations.
Fig 51 | The 1994 Cornell force field. (a) Atoms are defined by atomic mass (m) placed at atomic centres (black point); bonding atoms are further distinguished into atom types according to bonding partners. (b) Bonds between atoms are defined by equilibrium length, r0, and by harmonic force constant, Kr (in kcal mol1 A2). (c) Angles between bonded atoms are defined by equilibrium angle, θ0, and by harmonic force constant, Kθ (in kcal mol1 rad2). (d) Dihedral angles are defined by torsional barrier height, Vn, periodicity of the torsional barrier, n, and by phase shift, Υ. (e) Electrostatic interactions between partial atomic charges, qi and qj, are treated according to Coulomb's law; the point partial atomic charges are placed at atomic centres; the charges are fitted to the atoms using the RESP method (Bayly et al., 1993; Cornell et al., 1993; Cieplak et al., 1995) to reproduce the electrostatic potential calculated using the HartreeFock method with 631G* basis set for molecular fragments, dipeptides. (f) van der Waals interactions are described by the 126 LennardJones potential defined by atomic van der Waals radii, rvdw, and potential well depth, ε (see Fig 49). (g) The core of the 1994 force field is then an aditive potential energy function that sums all the energy contributions b + c + d + e + f, and thus describes the relationship between molecular structural model and energy; r, θ and Φ is the actual bond length, bond angle and dihedral angle, respectively; D = 4πεrε0; Aij = rε vdw
12; Cij = rε vdw6.
Fig 52 | Periodic boundary condition (PBC). PBC was applied in the MD simulations to model virtually infinite bulk solvent. The consequence of using PBC was that when any part of the system, e.g. a water molecule (red ball) in bulk solvent (dark grey balls) escapes from the box at one side, then it enters the box (its exact image) on the other side with same velocity. Thickness of the box wall (BW) was set to 10 Å in order that it is sufficiently larger than reach of nonbonded interactions (light orange), to avoid artificial interactions of amino acid residues located at opposite sides of the DhaA protein molecule (dark orange) in neighbouring images.
107

3 Methods
Fig 53 | Overview of a classical MD simulation of enzymesubstrate and enzymeproduct complexes of the reaction cycle of DhaA with TCP using Sander module of AMBER. A docked complex with XC water molecules was neutralised to avoid summing to an infinite charge when applying PBC in the subsequent MD simulation, and immersed in a box of TIP3P water molecules; atom types, partial atomic charges, bonds, angles and dihedrals were assigned according to the ff94. MD parameters describing the MD calculation itself (Table 27) were supplied allowing potential energy function (PEF) to determine starting energy of the system. Initial velocity (size and direction) was assigned to each atom and the system was allowed to develop for DT time by solving the differential equations embodied in Newton's second law of motion, i.e. Fi = mi ai. Forces were evaluated and energy of the developed system was calculated. New velocities were assigned according to the forces and the system was allowed to propagate for another DT time. The simulation was halted when NSTLIM time step (from 1,000,000 to 1,900,000) was reached. The result was a trajectory (magenta) that specified how the positions and velocities of the particles in the system varied with time. DhaA is shown in cartoon model and coloured by domain: the main domain, grey; the cap domain, blue. In this example, TCP is shown and coloured by atom type: carbon, green; chlorine, yellow; hydrogen, white. Sodium cations and oxygen atoms of water molecules are shown as cyan and red spheres of 30% of their actual size, respectively. The structure with the box of water molecules is zoomed out by 10 Å with respect to the both left side images; the edges of the box are outlined.
Table 27 | Parameters for MD simulations of enzymesubstrate and enzymeproduct complexes of the reaction cycle of DhaA with TCP using Sander module of AMBER. (pp. 108110)Parametera DescriptionSection I: MD parameters
General flags describingthe calculation
IMIN = 0* MD simulation will be performed.NMROPT = 1 Weight changes will be read (see Section II).
Nature and format of inputNTX = 1*IREST = 0*
Initial coordinates and box size is read formatted with no initial velocity information.
Nature and format of outputNTXO = 1* The final coordinates, velocities and box size is written to restart file in formatted form.NTPR = 250 The most recent energy and temperature information will be printed to mdout and
mdinfo files every 250 MD steps.NTWR = 500* The restart file is written every 500 MD steps.IWRAP = 0* The coordinates are written to the restart and trajectory files without “wrapping” into a
primary box.b
NTWPRT = 0*NTWX = 250
The coordinates of all atoms will be written to coordinate file every 250 ps.
108

3 Methods
Parametera DescriptionNTWV = 0* The velocities will not be written to velocity file.NTWE = 0* The energies and temperatures will not be written to energy file.
Potential functionNTF = 1* Complete interaction (force evaluation) is calculated.NTB = 2 Constant pressure periodic boundary condition is applied.DIELC = 1.0* Dielectric multiplicative constant for the electrostatic interactions.CUT = 10 Cutoff of 10 Å for the nonbonded interactions is used.SCNB = 2.0* 14 van der Waals interactions are divided by 2.0.SCEE = 1.2* 14 electrostatic interactions are divided by 1.2.NSNB = 10 The nonbonded list is updated every 10 MD steps.IPOL = 0* Polarisabilities are not included in the force field.
Generalised BornIGB = 0* No generalised Born term is used.
Frozen or restrained atomsIBELLY = 0* No atoms are frozen.NTR = 0* No position restraints are applied.
Molecular dynamicsNSTLIM = 1000000 1,000,000 MD steps will be performed.c
NSCM = 0* Translational and rotational centreofmass motion removal at regular intervals is not applied.
T = 0.0* The time (ps) at the start of MD simulation.DT = 0.002 The MD time step of 0.002 ps is used.
Temperature regulationNTT = 1 Constant temperature scaling is performed using the weakcoupling algorithm, ensuring
that the total kinetic energy is appropriate for the desired temperature.TEMP0 = 300* The system is to be kept at reference temperature of 300 K.TEMPI = 0* Initial temperature of 0 K is used.IG = 555333 The seed of 555,333 is used for random number generator for determination of the initial
velocities.TAUTP = 1* Heat bath coupling for the system is performed using time constant of 1 ps.VLIMIT = 20* Any component of the velocity that is greater than 20 will be reduced to 20.
Pressure regulationNTP = 1 Constant pressure MD with isotropic positon scaling is performed.PRES0 = 1* The system is maintained at reference pressure of 1 bar.COMP = 44.6 Compressibility of 44.6 106 bar is used.TAUP = 1* Pressure relaxation time of 1 ps is used.
SHAKE bond length constraintsNTC = 2 Bonds involving hydrogen are cosntrained.TOL = 0.00001 Relative geometrical tolerance of 0.00001 Å is used for coordinate resetting in SHAKE.
Particle Mesh Ewald (PME) methode
ORDER = 4* A cubic spline approximation is used.VERBOSE = 0* Minimum output size of information about the PME run.EW_TYPE = 0* PME method is turned on.DSUM_TOL = 105 Cutoff value of the direct sum at CUT is less than 105.EW_COEFF = 0.27511* Ewald coefficient is 0.27511 Å; this is determined by DSUM_TOL and CUT.NBFLAG = 1* NSNB is ingored, and the list is updated whenever any atom has moved more than half
of SKINNB since the last list update.SKINNB = 2* Width of the nonbonded “skin” is 2 Å; the direct sum nonbonded list is extended to CUT
+ SKINNB, and the van der Waals and direct electrostatic interactions are truncated at CUT.
NETFRC = 1* The total force on the system is artificially removed at every stepUSE_PME = 1* Reciprocal part of the sum will be computed.VDWMETH = 1* Continuum model is used for correction for energy and pressure for van der Waals
interactions beyond those included in the direct sum.EEDMETH = 1* A cubic spline is used for evalutation of the switching function for the direct sum
Coulombic interaction.Section II: Weight change information
TYPE = TEMP0 Reference temperature will be varied.ISTEP1 = 0*ISTEP2 = 100,000
The weight will be applied over MD steps 0 through 100,000.
VALUE1 = 0VALUE2 = 300
Temperature will change from 0 to 300 K from ISTEP1 to ISTEP2.
109
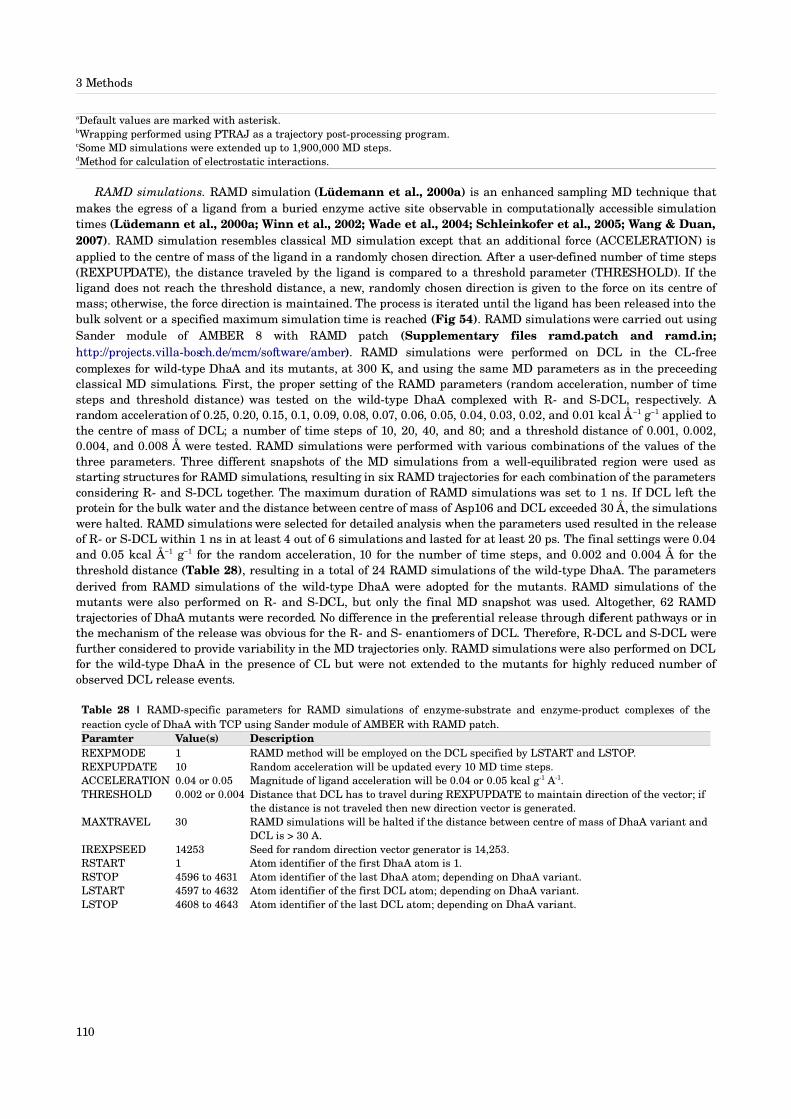
3 Methods
aDefault values are marked with asterisk.bWrapping performed using PTRAJ as a trajectory postprocessing program.cSome MD simulations were extended up to 1,900,000 MD steps.dMethod for calculation of electrostatic interactions.
RAMD simulations. RAMD simulation (Lüdemann et al., 2000a) is an enhanced sampling MD technique that makes the egress of a ligand from a buried enzyme active site observable in computationally accessible simulation times (Lüdemann et al., 2000a; Winn et al., 2002; Wade et al., 2004; Schleinkofer et al., 2005; Wang & Duan, 2007). RAMD simulation resembles classical MD simulation except that an additional force (ACCELERATION) is applied to the centre of mass of the ligand in a randomly chosen direction. After a userdefined number of time steps (REXPUPDATE), the distance traveled by the ligand is compared to a threshold parameter (THRESHOLD). If the ligand does not reach the threshold distance, a new, randomly chosen direction is given to the force on its centre of mass; otherwise, the force direction is maintained. The process is iterated until the ligand has been released into the bulk solvent or a specified maximum simulation time is reached (Fig 54). RAMD simulations were carried out using Sander module of AMBER 8 with RAMD patch (Supplementary files ramd.patch and ramd.in; http://projects.villabosch.de/mcm/software/amber). RAMD simulations were performed on DCL in the CLfree complexes for wildtype DhaA and its mutants, at 300 K, and using the same MD parameters as in the preceeding classical MD simulations. First, the proper setting of the RAMD parameters (random acceleration, number of time steps and threshold distance) was tested on the wildtype DhaA complexed with R and SDCL, respectively. A random acceleration of 0.25, 0.20, 0.15, 0.1, 0.09, 0.08, 0.07, 0.06, 0.05, 0.04, 0.03, 0.02, and 0.01 kcal Å−1 g−1 applied to the centre of mass of DCL; a number of time steps of 10, 20, 40, and 80; and a threshold distance of 0.001, 0.002, 0.004, and 0.008 Å were tested. RAMD simulations were performed with various combinations of the values of the three parameters. Three different snapshots of the MD simulations from a wellequilibrated region were used as starting structures for RAMD simulations, resulting in six RAMD trajectories for each combination of the parameters considering R and SDCL together. The maximum duration of RAMD simulations was set to 1 ns. If DCL left the protein for the bulk water and the distance between centre of mass of Asp106 and DCL exceeded 30 Å, the simulations were halted. RAMD simulations were selected for detailed analysis when the parameters used resulted in the release of R or SDCL within 1 ns in at least 4 out of 6 simulations and lasted for at least 20 ps. The final settings were 0.04 and 0.05 kcal Å−1 g−1 for the random acceleration, 10 for the number of time steps, and 0.002 and 0.004 Å for the threshold distance (Table 28), resulting in a total of 24 RAMD simulations of the wildtype DhaA. The parameters derived from RAMD simulations of the wildtype DhaA were adopted for the mutants. RAMD simulations of the mutants were also performed on R and SDCL, but only the final MD snapshot was used. Altogether, 62 RAMD trajectories of DhaA mutants were recorded. No difference in the preferential release through different pathways or in the mechanism of the release was obvious for the R and S enantiomers of DCL. Therefore, RDCL and SDCL were further considered to provide variability in the MD trajectories only. RAMD simulations were also performed on DCL for the wildtype DhaA in the presence of CL but were not extended to the mutants for highly reduced number of observed DCL release events.
Table 28 | RAMDspecific parameters for RAMD simulations of enzymesubstrate and enzymeproduct complexes of the reaction cycle of DhaA with TCP using Sander module of AMBER with RAMD patch.Paramter Value(s) DescriptionREXPMODE 1 RAMD method will be employed on the DCL specified by LSTART and LSTOP.REXPUPDATE 10 Random acceleration will be updated every 10 MD time steps.ACCELERATION 0.04 or 0.05 Magnitude of ligand acceleration will be 0.04 or 0.05 kcal g1 A1.THRESHOLD 0.002 or 0.004 Distance that DCL has to travel during REXPUPDATE to maintain direction of the vector; if
the distance is not traveled then new direction vector is generated.MAXTRAVEL 30 RAMD simulations will be halted if the distance between centre of mass of DhaA variant and
DCL is > 30 A.IREXPSEED 14253 Seed for random direction vector generator is 14,253.RSTART 1 Atom identifier of the first DhaA atom is 1.RSTOP 4596 to 4631 Atom identifier of the last DhaA atom; depending on DhaA variant.LSTART 4597 to 4632 Atom identifier of the first DCL atom; depending on DhaA variant. LSTOP 4608 to 4643 Atom identifier of the last DCL atom; depending on DhaA variant.
110

3 Methods
Fig 54 | Principle of RAMD simulation. The principle is demonstrated on a hypothetical release of a ligand (green) from a buried cavity in a protein (grey) in a fiveREXPUDATEstep RAMD simulation. Starting proteinligand complex was obtained from classical MD simulation (Step 1); centre of mass of protein and ligand are indicated by black cross and black point, respectively. The RAMD procedure is composed of alternating simulation (even numbers) and decision steps (odd numbers). ACCELERATION (arrow) is applied to the centre of mass of the ligand in a random direction for a userdefined REXPUPDATE number of MD timesteps (Steps 2, 4, 6, 8 and 10). After the REXPUPDATE is reached, the distance traveled by the ligand during the last REXPUPDATE (starting and ending positions are indicated by red and black point, respectively) is compared to THRESHOLD (Steps 3, 5, 7, 9); if the distance traveled by the ligand during the last REXPUPDATE is shorter than THRESHOLD, a new random direction for ACCELERATION is chosen (Steps 4 and 8); if the distance traveled by the ligand during the last REXPUPDATE is ≥ THRESHOLD, the direction for ACCELERATION is maintained for next REXPUPDATE period (Steps 6 and 10). At every MD timestep of each REXPUPDATE, the ligand position is compared to the centre of mass of the protein (Steps 23, 45, 67, 89, 1011); if the distance traveled by the ligand is ≥ MAXTRAVEL, the simulation is halted (Step 11). See Table 28 for details about the RAMD parameters. In practice, depending on a system and classical MD and RAMD parameters, the total number of REXPUPDATE steps is in the order of 103 and higher.
General analysis of MD simulations. The stability of the MD trajectories was assessed by allatom RMSD and radius of gyration using the Ptraj and Carnal modules of AMBER. Stable parts of the MD simulations were decided visually by plotting RMSD versus time. The stability of the secondary elements was calculated in PYMOL for each snapshot of a trajectory using the DSSP method based on detection of hydrogen bonds by electrostatic criterion (Kabsch & Sander, 1983). Bfactors (Supplementary file bfac.zip) and geometrical parameters (distances, bond angles, and dihedral angles) were measured using Ptraj. Hydrogen bonds were identified using < 2.76 Å and > 120°
111

3 Methods
for the distance and angle thresholds, respectively.Analysis of enzymesubstrate interactions in classical MD and RAMD simulations. The presence of near attack
configurations for TCP in the wildtype DhaA and the mutant 31' along the production classical MD trajectories was evaluated every 0.5 ps using the twoparameter geometric conditions proposed previously for DhlA1,2dichloroethane complex by Hur et al. (2003): (i) the distance between the nucleophilic oxygen and the attacked carbon atom ≤ 3.41 Å and (ii) the angle formed by the nucleophilic oxygen, the attacked carbon and the leaving chlorine > 157°.
Analysis of product release pathways in classical MD and RAMD simulations. Release of DCL and CL was monitored in both classical MD and RAMD simulations (Fig 55). Distances between the centre of mass of the two hydrogen atoms, H 1ɛ of Trp107 and H 22δ of Asn41, and CL and between the centre of mass of Asp106 and DCL were measured with Ptraj to identify regions of long residence time for CL or DCL during release from the active site to the bulk water in classical MD and RAMD simulations (Fig 56 and Supplementary files cpr.zip and fpr.zip). Residues within 7 Å of the centre of mass of DCL along the trajectories were assumed to constitute the release pathways. Seven angstroms ensured that all first shell residues were included. Water molecules that resided in the protein interior or entered the protein during classical MD and RAMD simulations were identified as those located at a distance < 8 Å from any atom of Asp106 in at least one snapshot using Carnal. The selected pathway residues and the internal water molecules aided analysis of important events using VMD 1.8.5 (Humphrey et al., 1996) and PYMOL where especially behaviour of the pathway residues and the internal water molecules were monitored. Release pathways for CL and DCL were visualised by PYMOL as a surface representation of CL or all positions of a central carbon of DCL (Supplementary files path.zip and bcp.zip). The surface representations of all release pathways for CL and DCL from all classical and RAMD simulations were superimposed onto the crystal structures of DhaA from Rhodococcus sp. (PDBIDs 1CQW and 1BN6) and clustered by visual inspection according to overlap between the surface representations of the pathways and the contribution of the same secondary structure elements. Clusters were annotated by a number, and branching clusters were further distinguished by a letter. For each DhaA variant and each unique DCL release pathway, all snapshots were extracted from the selected RAMD trajectories and adjusted by 150 steps of steepest descent energy minimisation with the implicit generalised Born solvation model II (Onufriev et al., 2004) using Sander. The van der Waals and electrostatic interaction energies between DCL and every protein residue were calculated for each of the energyminimised structures using the Anal module of AMBER.
Fig 55 | Visualisation of DCL and CL release pathways observed in MD simulations. (a) DCL release pathway (green) in DhaA (grey) visualised as a surface representation of all positions of central carbon atom (green balls) of a single DCL molecule along MD trajectory; (b) CL release pathway in DhaA visualised as a surface representation of all positions of a single chloride anion (yellow balls) along MD trajectory.
112

3 Methods
Fig 56 | Identification of amino acid residues belonging to the DCL release pathway. Amino acid residues (violet balls) in DhaA (grey) that surrounded the leaving DCL (green) were identified by the 7 Å threshold distance criterium (dashed circle) in all MD snapshots, and coloured in a redgreenblue colour scale according to frequency of occurence.
Analysis of water pathways in classical MD simulations. Water pathways were identified in classical MD simulations by superimposing all positions of oxygen atoms of all internal water molecules onto the crystal structures of DhaA in PYMOL (Fig 57). Opening and closing of tunnels connecting the active site to the bulk solvent and their inducibility by CL, DCL, and water were visualised by PYMOL as a slice through the solventaccessible surface representation (with a probe radius of 1.4 Å) of the protein with 5 and 1ps windows for classical MD and RAMD simulations, respectively. Tunnels were classified as closed or open according to whether the solventaccessible surface showed the active site isolated from (closed) or connected to (open) the bulk solvent.
Fig 57 | Visualisation of water exchange pathways observed in classical MD simulations. Water exchange pathways (cyan) in DhaA (grey) were visualised as a surface representation of all positions of water oxygen atoms (coloured balls) along MD trajectory. In contrast to DCL and CL release pathways (see Fig 55), the water exchange pathways are result of multimolecular surface representation.
Analysis of XC structures of the DhaA mutants. XC structures of the mutant proteins 04, 14 and 15 were explored for open tunnels using PYMOL. The structures were visualised as a slice through the solventaccessible surface representation (with a probe radius of 1.4 Å) and superimposed onto the 1CQW and 1BN6 XC structures of DhaA from Rhodococcus sp. with superimposed CL and DCL release pathways. Open tunnels in the XC structures of the DhaA mutants were then identified and annotated.
113

3 Methods
3.3 Software engineering
Development of CAVER 2.0 algorithm and CAVER Viewer application. Development of algorithms and their implementation is far beyond the scope of my contribution and far beyond my understanding, and is described by the software engineers elsewhere (Kozlíková et al., 2007; Medek et al., 2007).
Testing temporary versions of CAVER 2.0 algorithm. Temporary versions of CAVER 2.0 algorithm were tested as a PYMOL plugin with XC structures of DhaA from Rhodococcus sp. (PDBIDs 1CQW and 1BN6) and with selected snapshots of MD simulations of the wildtype DhaA and its mutants (see 3.2). Calculated tunnels were compared with visually identified open tunnels. Reliability of the calculated tunnels and proper functionality of the PYMOL plugin was assessed and reported to the algorithm developers.
Development and testing of the graphical user interface (GUI) of CAVER Viewer. The GUI of CAVER Viewer application was designed and temporary versions of the application were tested for basic functionality. Observed functionality problems and suggestions for improving userfriendliness were reported to the application developers.
114

4 Results
There are two players, A and B, in the “Why?” game: A asks a question “Why?”, and B answers the question. The game is started by an arbitrary sentence spoken by B. A asks “Why?”, and B answers. And this goes on and on until B cannot find answer different from the previous one; and this happens when the last answer is about The Big Bang.
4.1 In silico design of DhaA mutants for improved conversion of 1,2,3trichloropropaneKlvaňa M, Pavlová M, Prokop Z, Chaloupková R, Banáš P, Otyepka M, Wade RC, Nagata Y & Damborský J (2009). Redesigning dehalogenase access tunnels as a strategy for degrading an anthropogenic substrate. Nat. Chem. Biol. 5: 727733.
Focus of the mutagenesis effort. Bosma et al. (2002) isolated DhaA mutants 04 (Cys176Tyr) and M2 (M1+Tyr273Phe) that showed 2.8fold and 7.8fold increase in catalytic performance for conversion of 1,2,3trichloropropane (TCP) to 2,3dichloropropane1ol (DCL) and chloride anion (CL). Bosma et al. (2002) then proposed that the common substitution at the position 176 in the main tunnel contributes to the improvement by reducing the size of the active site cavity and thus enhancing efficiency of TCP substrate binding. In line with the proposed effect of Cys176Tyr, Bosma et al. (2003) proposed the SN2 reaction to be the ratelimiting step in the conversion of TCP by wildtype DhaA based on absence of 2H2O kinetic isotope effect. Banáš et al. (2006) noted decreased size of the main tunnel by Cys176Tyr and presumed that the substitution causes shift in the ratelimiting step from the SN2 step to DCL release due to redirection of DCL release from the main tunnel to the slot tunnel and suggested to perform substitutive mutagenesis in the slot tunnel for further improvement of the catalytic performance of DhaA with TCP.
Identification of hot spots. Classical molecular dynamics (MD) simulations were performed for wildtype DhaA and the 04 mutant complexed with CL and docked DCL, or docked DCL only (Fig 58) to investigate whether DCL can escape the active site cavity through the slot tunnel (Tables 29 and 30). The DCL release was, however too timedemanding to be observable within nanosecond timescale of the classical MD simulations. Therefore, enhanced sampling random acceleration MD (RAMD) simulations were employed to facilitate the release of DCL (Table 31). RAMD simulations showed (i) higher frequency of occurrence of DCL release via the main tunnel in the wildtype DhaA than in the 04 mutant (Table 32) and (ii) possibility of the slot tunnel to serve as an auxiliary DCL release pathway in both the wildtype DhaA and the 04 mutant, with relative higher importance in the latter due to affected main tunnel. Both these observations were thus far in accordance with the previously proposed DCL redirection hypothesis. Considering the redirection hypothesis as the possibility, Cys176 identified by Bosma and coworkers as a hot spot in the previous study (Bosma et al., 2002) and, among the slot tunnel amino acid residues identified here by the RAMD simulations (Fig 59), four amino acid residues that showed close contacts to DCL via sidechains (Trp141, Leu135, Val245 and Leu246) were selected for mutagenesis (Fig 60).
Design of substitutions in the hot spots. To assess the mutability of the hot spots identified by the RAMD simulations, variability of the corresponding amino acid residues among haloalkane dehalogenases belonging to subfamily II was read from the multiple sequence alignment reported by Chovancová et al. (2007; Table 33). Of the two possible substitutes for Trp141, Ser and Phe, the latter was selected to be introduced by sitedirected mutagenesis as it was supposed to yield stable folded mutant more likely than the former. The remaining three hot spots, Leu135, Val245 and Leu246 were proposed for randomisation using saturation mutagenesis for the following reasons: (i) 90 possible combinations were identified among members of haloalkane dehalogenase subfamily II of which no one could be discarded a priori; (ii) the three amino acid residues were located close in space where substitution at one site may require compensatory substitution at another of the two remaining sites; and (iii) our understanding of structuredynamicsfunction relationships for these sites was limited. Trp141Phe was proposed to be introduced into the M2 mutant, yielding mutant M3. Both the M2 and M3 mutants served as the templates for the saturation mutagenesis, leading to libraries A (2,568 clones) and B (2,705 clones), respectively.
115

4 Results
4.2 Analysis and interpretation of the effects of the mutations on the enhanced conversion of TCP by DhaA mutantsKlvaňa M, Pavlová M, Prokop Z, Chaloupková R, Banáš P, Otyepka M, Wade RC, Nagata Y & Damborský J (2009). Redesigning dehalogenase access tunnels as a strategy for degrading an anthropogenic substrate. Nat. Chem. Biol. 5: 727733.
Klvaňa M, Pavlová M, Koudeláková T, Chaloupková R, Dvořák P, Prokop Z, Stsiapanava A, Kutý M, KutáSmatanová I, Dohnálek J, Kulhánek P, Wade RC & Damborský J (2009). Pathways and mechanisms for product release in the engineered haloalkane dehalogenases explored using classical and random acceleration molecular dynamics simulations. J. Mol. Biol. 392: 13391356.
DhaA mutants with enhanced activity with TCP. Most DhaA mutants in the saturation mutagenesis libraries (96%) showed little or no activity with TCP, but a small proportion appeared to have higher activity than wildtype DhaA. Sequencing of dhaA mutant genes of the 51 clones exhibiting up to 39fold improvement in the activity with TCP relative to the wildtype cultures revealed 25 unique DhaA protein variants with 20 different combinations of mutations at the three randomised positions (Table 34). The three most active variants from library A (mutants 27, 31 and 33) and library B (mutants 17, 19 and 21) were purified and subjected to determination of secondary structure fingerprint using farUV CD spectroscopy to assess impact of the mutations on the relative abundance of amino acid residues in helices and sheet. The farUV CD spectra of the selected variants were nearly identical to that of theα β wildtype DhaA (Fig 61a). Although some minor effect of mutations on the packing of amino acid residues in helicalα conformation could be discerned, the farUV CD spectra suggested that the mutations did not significantly alter the native folded state. Specific activities measured for the selected purified DhaA variants revealed three superior mutants, 27 and 31 from library A and 21 from libraby B, all common in Val245Phe substitution (Fig 62). Steadystate kinetic experiments then showed that the enhanced activity of the three mutants with TCP was due to increased kcat (up to 32fold in the mutant 31), whereas Km showed slight increase within experimental error (Table 35). The catalytic efficiency of the mutants 21, 27 and 31, quantified by kcat/Km, was 12, 23 and 26fold higher, respectively, compared to the wildtype DhaA. At milimolar concentrations of DCL product of TCP conversion, the three mutants were inhibited with Ki ranging from 2.08 to 4.42 mM, similarly to the wildtype DhaA, Ki = 2.50 mM (Fig 63). The effect of mutations on substrate specificity was assessed for the mutant 31 by comparing specific activities for the set of 31 substrates to the specificity profile of the wildtype DhaA (Fig 64). The mutant 31 showed an increase in specific activity towards all tested 1,2dihaloethanes, 1,2dihalopropanes and 1,2,3trihalopropanes, and reduced activity towards longerchain (> C3) 1haloalkanes and , dihaloalkanes.α ω
Discriminating between possible sources of improvement of the conversion of TCP by DhaA mutants. RAMD simulations of DCL release were conducted with the Tyr273Phefree variants of the mutants 21, 27 and 31, denoted 21', 27' and 31', respectively (Tables 29, 30 and 31), prepared by in silico mutagenesis from the 04 mutant (approved by farUV CD spectra), to gain better understanding on the effect of the introduced mutations on accessibility of the main tunnel and the slot tunnel and on the possible connection of the DCL release to enhanced activity of the mutants with TCP. Tyr273Phe was not included for the following reasons: (i) to allow direct comparison with the 04 mutant, and (ii) not to include mutations that will have presumably no sizeable effect on physical steps of the reaction cycle modelled by MD simulations. DCL release through the main tunnel was observed in the RAMD simulations of all the variants but with decreasing frequency from the mutant 21' through the mutant 27' to the mutant 31' (Table 32), i.e. in the direction of increasing activity (Table 35). The release of DCL through the slot tunnel could occur in the mutants 21' and 27', although DCL preferentially exited via branches from the slot tunnel in these mutants: pathway 2c (p2c) in mutant 21' as a result of the Trp141Phe substitution, and pathway 2b (p2b) in mutant 27' due to the Ile135Val substitution (Table 32 and Fig 65). In the mutant 31', however, the release of DCL through the slot tunnel or its branches appeared to be completely prevented by the Ile135Phe substitution (Fig 66). Hence, presence of three bulky substitutions, Ile135Phe, Cys176Tyr and Val245Phe together with preserved wildtype Trp141 were responsible for the mutant 31' being the least amenable to DCL release among the mutants (Table 32). RAMD simulations thus indicated that DCL release could hardly be improved in the mutants. Therefore, DCL redirection hypothesis was abandoned, and our attention ultimately focused to the substrate binding/SN2 steps as the only remaining possible source of improvement.
Proposal on the mechanism of improvement of TCP binding or SN2 step in the mutant 31'. The hampered DCL release in the mutants with increase in activity must be essentially supercompensated by improvement in the TCP binding or SN2 step of the wildtype. Classical MD simulations showed, that bulky aromatic substitions in the main tunnel and the slot tunnel not only hindered DCL release but they also restricted exchange of water molecules between the bulk solvent and the buried active site, especially in the absence of chloride anion in the active site (Fig 67). While water molecule is an essential cosubstrate and some water molecules are required for product release,
116

4 Results
they may unfavourably affect substrate binding or SN2 step. The dynamics of water molecules were therefore monitored together with the stability of the substrate TCP in “reactive” nearattack configurations (NAC) in classical MD simulation of the wildtype DhaA and the mutant with most occluded active site, 31'. Two bindings modes of TCP, identified by molecular docking, and corresponding to the binding modes 2 (yielding SDCL) and 3 (yielding RDCL) reported previously (Banáš et al., 2006), were applied. The MD simulations with the substrate revealed that the active site of the wildtype DhaA was easily accessible to water molecules from bulk solvent and that increasing numbers of water molecules in the active site competed with TCP for interaction with the nucleophile, Asp106 (Fig 68). The competition led to reduced formation of the NAC since the water molecules sterically hindered access of TCP to the nucleophile. Contrary, the bulky aromatic substitutions in the access tunnels of the 31' mutant shielded the active site from the bulk solvent effeciently within the twonanosecond MD simulation, and the complex occurred in NAC 6.7times more frequently than in the wildtype DhaA (Fig 68).
Determination of the ratelimiting step in the mutant 31. Whether the improved SN2 step of the mutant 31 overweighed other steps of the reaction cycle was determined by 2H2O kinetic isotope effect and transient kinetic experiments. Increasing the fraction of 2H2O in the reaction mixture resulted in increased activity of the 31 mutant with TCP, indicating a shift of the ratelimiting step in the conversion of TCP in the 31 mutant, since no effect of 2H2O has been detected in the wildtype DhaA (Bosma et al., 2003). The increase of the catalytic rate in the presence of 2H2O further suggested that the step determining the rate of TCP conversion by the 31 mutant is neither hydrolysis nor slow conformational change (Bosma et al., 2003), leaving product, DCL or chloride anion, release as the possible ratelimiting steps (Fig 69). Transient kinetic experiments conducted with the wildtype DhaA and the 31 mutant confirmed the shift in the ratelimiting step in the 31 mutant (Fig 69). No sign of burst was observed for either CL or DCL formation after rapid mixing of the wildtype DhaA with excess TCP (Fig 69a). Instead, linear formation of both products was observed with a rate constant of 0.07 ± 0.01 s−1, which corresponded well with the steady state turnover number of 0.04 ± 0.01 s−1. The absence of burst for both CL and DCL formation suggested that the slowest step of TCP conversion lies at the beginning of the reaction cycle, before or in the step forming the CL product. In contrast, upon rapid mixing of the 31 mutant with excess TCP, a clear presteady state burst was identified for both CL and DCL, with observed rates of 5.8 ± 2.3 and 5.2 ± 1.5 s−1, respectively (Fig 69b). The burst was followed by a linear steadystate phase, with rate constants of 1.42 ± 0.31 and 1.36 ± 0.18 s−1 for CL and DCL, respectively, which corresponded well with the kcat value observed in steadystate kinetics (1.26 ± 0.07 s−1). These findings suggested that none of the chemical steps is limiting for the 31 mutant; instead, the ratelimiting step for the reaction with TCP catalysed by this mutant is the release of a product, CL or DCL (Fig 69c).
Exploring the tradeoff between shielding and accessibility of the active site. Based on the mutant 31, four additional mutants, denoted as mutant 14 (Ile135Phe), mutant 15 (Cys176Tyr+Ile135Phe), mutant 51 (31+Ala172Phe) and mutant 52 (51+Ala145Phe) were designed to test the robustness of the main tunnel and the slot tunnel against aromatic amino acid residue substitutions and, in the case of the mutants 51 and 52, to explore, whether the shielding of the active site could be improved further by introducing additional aromatic amino acid residues into the main tunnel wall. The mutants were constructed by sitedirected mutagenesis and characterised for steadystate kinetic constants for conversion of TCP (Table 35) and secondary structure fingerprint using farUV CD spectroscopy (Fig 61b). The catalytic performance of the mutants 14 and 15 was similar to the wildtype DhaA and the mutant 04, respectively, indicating that Ile135Phe alone had no sizeable effect on the activity with TCP. Classical MD simulations (Tables 29 and 30) and RAMD simulations (Table 31) of the mutants 14 and 15 showed that Ile135Phe alone sealed the slot tunnel, leaving the main tunnel as the only DCL release pathway, irrespective of presence/absence of Cys176Tyr substitution (Table 32 and Fig 66). The catalytic performance of the mutants 51 and 52 with TCP dropped to the wildtype level (Table 35). The secondary structure fingerprint indicated that the decrease in the activity could be contributed by changes on secondary structure level (Fig 61b). Classical MD simulations (Tables 29 and 30) and RAMD simulations (Table 31) of Tyr273Phefree variants of the mutants 51 and 52, denoted as the mutants 51' and 52', respectively, showed increased ease of DCL release through the main tunnel (Table 32 and Fig 66), indicating that the region of the main tunnel crowded by the aromatic amino acid residues was disturbed from the compactness of the mutant 31'.
Proposal on the order of DCL and CL release in the wildtype DhaA and its mutants. 2H2O kinetic isotope effect and transient kinetics experiments on the wildtype DhaA and the mutant 31 revealed product release as the ratelimiting step for conversion of TCP but did not specify which of the products, DCL or CL, is the slower on release. Classical MD simulations of the wildtype DhaA and the mutants 04, 14, 15, 21', 27', 31', 51' and 52' complexed with both DCL and CL products of TCP conversion were monitored for product release. While DCL release was not observed at all, CL release was observed in the wildtype DhaA (trajectory c1) and the mutant 15 (trajectory c7) to occur through the main tunnel with the same ease without any additional artifical force (Table 29 and Fig 70).
117

4 Results
These observations suggested that CL is faster on the release compared to DCL in the wildtype DhaA and the mutant 15. RAMD simulations of CL release were attempted for the mutant 31', but failed to provide reliable results: large acceleration had to be applied to tear off CL from the interactions with halidestabilising amino acid residues Asn41 and Trp107 (Fig 58), causing subsequent subpicosecond release of unsolvated CL from the active site to the bulk water (data not shown).
4.3 Product release and water exchange pathways and mechanisms in DhaA and its mutantsKlvaňa M, Pavlová M, Koudeláková T, Chaloupková R, Dvořák P, Prokop Z, Stsiapanava A, Kutý M, KutáSmatanová I, Dohnálek J, Kulhánek P, Wade RC & Damborský J (2009). Pathways and mechanisms for product release in the engineered haloalkane dehalogenases explored using classical and random acceleration molecular dynamics simulations. J. Mol. Biol. 392: 13391356.
4.3.1 Identification of pathways by MD simulations
Modelling of DhaA complexed with products of TCP conversion. The structures of the enzymeproduct complexes for dehalogenation of TCP were modelled by molecular docking of R and SDCL, respectively, into wildtype DhaA complexed with CL (Fig 58). Both R and SDCL had similar conformations and positions in the active site with respective docked energies of 5.26 and 5.41 kcal mol−1 and both formed a hydrogen bond to the Asp106 sidechain and a close contact to the imidazole ring of His272 in the active site. None of the mutated residues in the eight mutants studied overlapped with the binding site of DCL. Therefore, the same initial DCL coordinates were used in all mutants (04, 14, 15, 21', 27', 31', 51' and 52'). The complexes were subjected to classical MD simulations to adjust the conformation of DCL in the active site and the conformations of the mutated residues (Table 29). During these simulations, DCL preserved its docked orientation, characterised by the strong interactions with the catalytic residues Asp106 and His272. The overall stability of the complexes was supported by a flattened RMSD around 1.5 Å and a radius of gyration around 17.8 Å for all complexes.
Product release and water exchange pathways in the wildtype DhaA and its mutants. The classical MD trajectories were investigated for spontaneous release of the products (DCL and CL) and for exchange of water molecules between the buried active site and bulk solvent. In total, one release pathway for CL, p1 (Figs 70 and 71a), no release pathway for DCL, and five pathways for water molecules, p1, p2a, p2b, p2c, and p3 (Figs 67a and 71c) were observed for the DhaA variants. Another set of MD simulations was performed with CL replaced by a water molecule to model the system after release of the halide anion from the active site (Table 30). The overall stability of the complexes was supported by a flattened RMSD around 1.4 Å and a radius of gyration around 17.8 Å for all complexes. The MD trajectories were investigated for exchange of water molecules and spontaneous release of DCL. Altogether, three pathways were observed for water molecules (p1, p2a, and p2b) with the DhaA variants (Fig 71b). No release of DCL was observed in any of the classical MD simulations, justifying the use of RAMD simulations to enhance DCL release. RAMD simulations of DCL release in wildtype DhaA and its mutants resulted in five pathways, p1, p2a, p2b, p2c, and p3 (Table 31 and Figs 65, 66 and 71b).
4.3.2 Pathway p1
Description of p1. p1 corresponds to the main tunnel identified in the Xray crystal (XC) structures of DhaA (Fig 72). p1 is defined mainly by two helices of the cap domain 4 (Phe144, Ala/Phe145, and Phe149) and 5 (Ala/Phe172α α and Cys/Tyr176) and, to a smaller extent, by the 8/ 10 loop (His272) and the 8/ 9 loop (Val/Phe245). The mainβ α β α tunnel was permanently open in wildtype DhaA and mutant 14 (Table 36). The tunnel was widened during the passage of DCL, CL, and water molecules. The introduction of one or more aromatic substitutions in p1 caused a change in the opening mechanism from permanent tunnel to the transient tunnel (Table 36 and Figs 73ab and 74). Decreased accessibility of the tunnel for the studied ligands was observable already after a single substitution, Cys176Tyr in mutant 04, and was further pronounced by cumulatively introduced substitutions Val245Phe, Ala172Phe, and Ala145Phe in mutants 31', 51', and 52' (Fig 67b). The accessibility of p1 was controlled by the aromatic residues Phe144 and Phe149 in wildtype DhaA; by Cys176Tyr, Val245Phe, Ala172Phe, and Ala145Phe in mutants 04, 15, 21', 27', 31', 51', and 52'; by the varying length of the Nterminal part of 4 helix (143GluPheAla/Pheα145); by a flexible residue located in the middle of the 5 helix (Gly171); and by the varying size of the Cterminal partα of the 5 helix (Cys/Tyr176).α
118
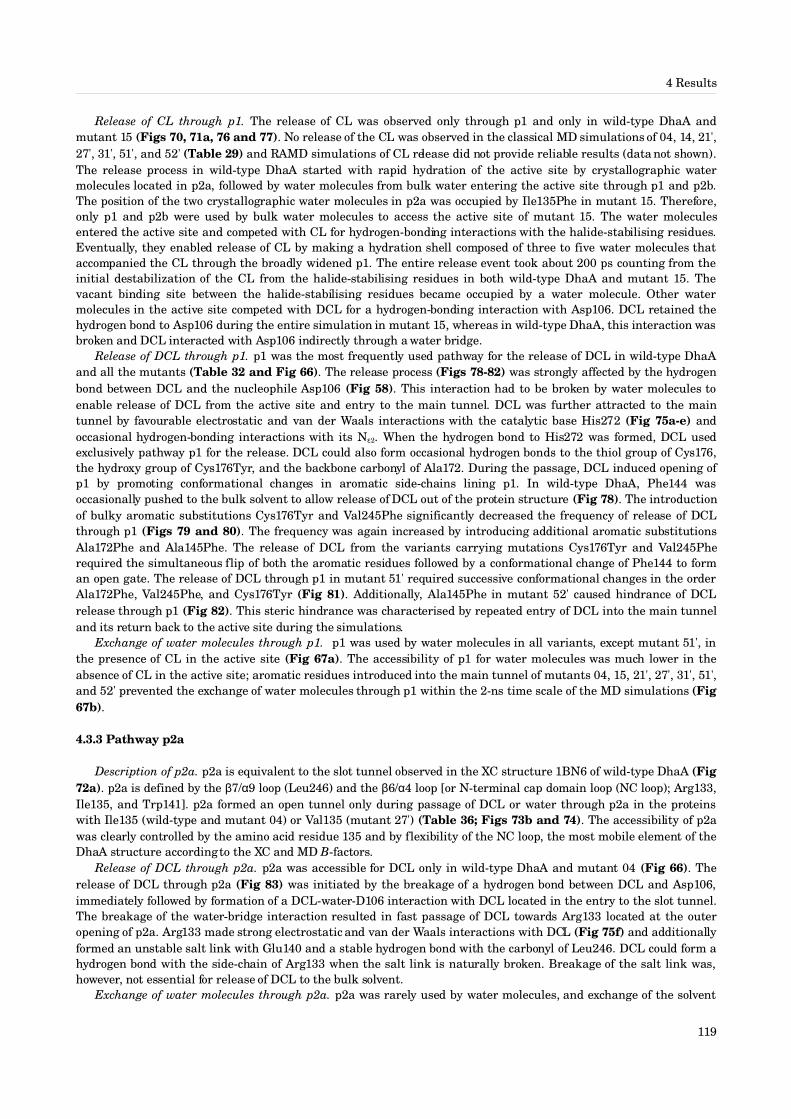
4 Results
Release of CL through p1. The release of CL was observed only through p1 and only in wildtype DhaA and mutant 15 (Figs 70, 71a, 76 and 77). No release of the CL was observed in the classical MD simulations of 04, 14, 21', 27', 31', 51', and 52' (Table 29) and RAMD simulations of CL release did not provide reliable results (data not shown). The release process in wildtype DhaA started with rapid hydration of the active site by crystallographic water molecules located in p2a, followed by water molecules from bulk water entering the active site through p1 and p2b. The position of the two crystallographic water molecules in p2a was occupied by Ile135Phe in mutant 15. Therefore, only p1 and p2b were used by bulk water molecules to access the active site of mutant 15. The water molecules entered the active site and competed with CL for hydrogenbonding interactions with the halidestabilising residues. Eventually, they enabled release of CL by making a hydration shell composed of three to five water molecules that accompanied the CL through the broadly widened p1. The entire release event took about 200 ps counting from the initial destabilization of the CL from the halidestabilising residues in both wildtype DhaA and mutant 15. The vacant binding site between the halidestabilising residues became occupied by a water molecule. Other water molecules in the active site competed with DCL for a hydrogenbonding interaction with Asp106. DCL retained the hydrogen bond to Asp106 during the entire simulation in mutant 15, whereas in wildtype DhaA, this interaction was broken and DCL interacted with Asp106 indirectly through a water bridge.
Release of DCL through p1. p1 was the most frequently used pathway for the release of DCL in wildtype DhaA and all the mutants (Table 32 and Fig 66). The release process (Figs 7882) was strongly affected by the hydrogen bond between DCL and the nucleophile Asp106 (Fig 58). This interaction had to be broken by water molecules to enable release of DCL from the active site and entry to the main tunnel. DCL was further attracted to the main tunnel by favourable electrostatic and van der Waals interactions with the catalytic base His272 (Fig 75ae) and occasional hydrogenbonding interactions with its N 2ɛ . When the hydrogen bond to His272 was formed, DCL used exclusively pathway p1 for the release. DCL could also form occasional hydrogen bonds to the thiol group of Cys176, the hydroxy group of Cys176Tyr, and the backbone carbonyl of Ala172. During the passage, DCL induced opening of p1 by promoting conformational changes in aromatic sidechains lining p1. In wildtype DhaA, Phe144 was occasionally pushed to the bulk solvent to allow release of DCL out of the protein structure (Fig 78). The introduction of bulky aromatic substitutions Cys176Tyr and Val245Phe significantly decreased the frequency of release of DCL through p1 (Figs 79 and 80). The frequency was again increased by introducing additional aromatic substitutions Ala172Phe and Ala145Phe. The release of DCL from the variants carrying mutations Cys176Tyr and Val245Phe required the simultaneous flip of both the aromatic residues followed by a conformational change of Phe144 to form an open gate. The release of DCL through p1 in mutant 51' required successive conformational changes in the order Ala172Phe, Val245Phe, and Cys176Tyr (Fig 81). Additionally, Ala145Phe in mutant 52' caused hindrance of DCL release through p1 (Fig 82). This steric hindrance was characterised by repeated entry of DCL into the main tunnel and its return back to the active site during the simulations.
Exchange of water molecules through p1. p1 was used by water molecules in all variants, except mutant 51', in the presence of CL in the active site (Fig 67a). The accessibility of p1 for water molecules was much lower in the absence of CL in the active site; aromatic residues introduced into the main tunnel of mutants 04, 15, 21', 27', 31', 51', and 52' prevented the exchange of water molecules through p1 within the 2ns time scale of the MD simulations (Fig 67b).
4.3.3 Pathway p2a
Description of p2a. p2a is equivalent to the slot tunnel observed in the XC structure 1BN6 of wildtype DhaA (Fig 72a). p2a is defined by the 7/ 9 loop (Leu246) and the 6/ 4 loop [or Nterminal cap domain loop (NC loop); Arg133,β α β α Ile135, and Trp141]. p2a formed an open tunnel only during passage of DCL or water through p2a in the proteins with Ile135 (wildtype and mutant 04) or Val135 (mutant 27') (Table 36; Figs 73b and 74). The accessibility of p2a was clearly controlled by the amino acid residue 135 and by flexibility of the NC loop, the most mobile element of the DhaA structure according to the XC and MD Bfactors.
Release of DCL through p2a. p2a was accessible for DCL only in wildtype DhaA and mutant 04 (Fig 66). The release of DCL through p2a (Fig 83) was initiated by the breakage of a hydrogen bond between DCL and Asp106, immediately followed by formation of a DCLwaterD106 interaction with DCL located in the entry to the slot tunnel. The breakage of the waterbridge interaction resulted in fast passage of DCL towards Arg133 located at the outer opening of p2a. Arg133 made strong electrostatic and van der Waals interactions with DCL (Fig 75f) and additionally formed an unstable salt link with Glu140 and a stable hydrogen bond with the carbonyl of Leu246. DCL could form a hydrogen bond with the sidechain of Arg133 when the salt link is naturally broken. Breakage of the salt link was, however, not essential for release of DCL to the bulk solvent.
Exchange of water molecules through p2a. p2a was rarely used by water molecules, and exchange of the solvent
119

4 Results
occurred only in wildtype DhaA and mutant 04 in both the presence and absence of CL in the active site and in mutant 27' only in the presence of CL in the active site (Fig 67). A single substitution, Ile135Phe, was sufficient to block exchange of water molecules through p2a.
4.3.4 Pathway p2b
Description of p2b. p2b corresponds to the deep surface depression near the slot tunnel opening in the XC structures of wildtype DhaA (Fig 72abc). p2b is formed by the 7/ 9 loop (Val245Phe and Leu246Ile) and the NCβ α loop (Arg133, Ile/Leu/Val/Phe135, and Trp/Phe141). p2b formed a tunnel during the passage of DCL or water molecules through the pathway (Table 36; Figs 73b and 74). p2b could be opened simultaneously with p1 and p2a. The accessibility of p2b was controlled by the aromatic residues Trp/Phe141 and Val245Phe as well as by the flexibility of the NC loop.
Release of DCL through p2b. Release of DCL through p2b was observed only in mutant 27' carrying the mutation Ile135Val (Fig 66). The release process (Fig 84) started by breakage of the hydrogen bond between DCL and Asp106, followed by a DCLwaterD106 interaction and a transient hydrogen bond between DCL and the backbone carbonyl groups of Glu130 and Ile132. DCL entered p2b by inducing a simultaneous flip of the Val245Phe and Trp141 sidechains. DCL moved between the two aromatic sidechains and established a hydrogen bond to the Arg133 sidechain and the Val245Phe backbone (Fig 75g) without perturbation of the salt link between Arg133 and Glu140 and the hydrogen bond between Arg133 and Leu246Ile. This hydrogenbonding network hindered the smooth release of DCL to the bulk water.
Exchange of water molecules through p2b. p2b was used by water molecules in all DhaA variants, except mutant 21', in the presence of CL in the active site (Fig 67a). p2b was the only pathway for exchange of water molecules in mutant 51' and the preferred pathway in mutant 27'. p2b was always preferred over p2a, p2c, and p3. The accessibility of p2b for water molecules was significantly decreased in the absence of the CL in the active site. p2b was not used by water molecules in any variant except mutant 27' in MD simulations without CL (Fig 67b).
4.3.5 Pathway p2c
Description of p2c. p2c was identified as a branch of p2a, which was not indicated by any of the XC structures of wildtype DhaA. p2c was formed by the NC loop (Arg133, Ile135, and Trp/Phe141) and the 7/ 8 loop [or Cterminalα α cap domain loop (CC loop); Pro210 and P212]. p2c formed an open tunnel only in wildtype DhaA and mutant 21' and only in the presence of CL in the active site (Table 36; Figs 73b and 74). The bulkier DCL promoted opening of p2c for a longer time during its release in RAMD simulations. The accessibility of p2c was controlled by the flexibility of the NC and CC loops and by a bridge interaction between Pro210 and Alaβ 212 of the CC loop and Ile135 of the NC loop. The bridge must be disrupted to allow exchange of a ligand between bulk solvent and p2c.β
Release of DCL through p2c. Release of DCL through p2c (Fig 85) was observed only in mutant 21' carrying the unique substitution Trp141Phe (Fig 66). The release process started by obligatory breakage of the hydrogen bond between DCL and Asp106, followed by formation of the water bridge DCLwaterAsp106 positioning DCL near the entrance to p2a and p2c. After breakage of the water bridge, DCL moved along Trp141Phe, inducing a flip of its sidechain, disrupted the Ala212Ile135Leu bridge interaction, and established a hydrogen bond with the backboneβ carbonyl group of Arg133. The arginine showed strong electrostatic and van der Waals attraction for DCL (Fig 75h). While maintaining the hydrogen bond to Arg133, DCL reoriented its carbon chain towards the bridge. After releaseβ of DCL from Arg133, DCL moved between the NC loop and the CC loop, causing breakage of the Ala212–Ile135Leu βbridge interaction followed by release of DCL to bulk water and the immediate reconstruction of the bridge. The lossβ of the hydrogenbonding interactions between the NC loop and the CC loop during DCL release through p2c was partially compensated for by a hydrogen bond between the residues of the bridge and DCL.β
Exchange of water molecules through p2c. p2c was rarely used for exchange of water molecules and occurred only in wildtype DhaA and mutant 04 and only in the presence of CL in the active site (Fig 67b). The accessibility of the active site for water molecules through p2c was blocked by Ile135Phe, but the bridge could be disrupted by waterβ molecules from bulk solvent as observed for the mutant in the presence of CL in the active site.
4.3.6 Pathway p3
Description of p3. p3 was not observable in any XC structure of wildtype DhaA. p3 was located between helix 4α (Phe149), the NC loop (Trp138 and Trp141), and the CC loop (Leu209 and Ile211). p3 was relatively short and straight compared to p2a, p2b, and p2c but was generally unfavourable for accommodation of water molecule or DCL due to
120

4 Results
steric clashes with the protein structure. p3 formed an open tunnel only upon passage of DCL through the pathway, whereas water migrated through the protein matrix (Table 36; Figs 71bc and 73bc). The open tunnel existed for the shortest period of time (on the order of picoseconds) among the pathways before its disappearance. Water in p3 moved solely through the protein matrix without formation of a tunnel (Fig 73c).
Release of DCL through p3. The release of DCL through p3 occurred in wildtype DhaA and in mutant 27' (Fig 66 and Fig 86). After obligatory release of DCL from the nucleophile Asp106, a DCLwaterAsp106 interaction was established, and DCL was positioned between Trp141 and Phe149 (Fig 75i), whose sidechains acted as a gate and flipped to open up the p3 pathway. The immediate release of DCL to the bulk solvent was blocked by the sidechain of Trp138 (Fig 75i), and DCL was temporarily enclosed in an isolated cavity. DCL eventually pushed Trp138 into the bulk water and was released out of the protein. After DCL release, Trp138 made a fast flip to its original conformation to completely block p3.
Exchange of water molecules through p3. p3 served as the exchange pathway for one water molecule in mutant 21' carrying the mutation Trp141Phe and CL in the active site (Fig 67a).
4.4 Structural characterisation of three mutants with modified tunnelsKlvaňa M, Pavlová M, Koudeláková T, Chaloupková R, Dvořák P, Prokop Z, Stsiapanava A, Kutý M, KutáSmatanová I, Dohnálek J, Kulhánek P, Wade RC & Damborský J (2009). Pathways and mechanisms for product release in the engineered haloalkane dehalogenases explored using classical and random acceleration molecular dynamics simulations. J. Mol. Biol. 392: 13391356.
Selection of the DhaA mutants for structure determination. Classical MD and RAMD simulations on DhaA wildtype and mutants 04, 14, 15, 21', 27', 31', 51' and 52' showed that single Ile135Phe of the mutants 14 and 15 was sufficient to seal the slot tunnel and that single Cys176Tyr of the mutants 04 and 15 changed the main tunnel from permanent to transient (Fig 74 and Table 36). To provide experimental structural evidence to these computational findings, XC structures of the mutants 04 (PDBID 3FBW), 14 (PDBID 3G9X), and 15 (PDBID 3FWH) were determined to atomic resolution (Stsiapanava et al., unpublished results). The mutant structures were compared with the XC structures of DhaA from Rhodococcus sp. available in the PDB (Newman et al., 1999). This analysis deciphered the effect of the substitutions located in the main tunnel (mutant 04), the slot tunnel (mutant 14), and both the main and slot tunnels (mutant 15) on the accessibility of the active site and the mechanisms of ligand exchange (Fig 72).
Main tunnel in the XC structures of DhaA and its mutants. The main tunnel was open in all XC structures of DhaA variants carrying the wildtype Cys176 (Fig 72ad), while the single Cys176Tyr substitution blocked this tunnel (Fig 72ef). This observation was in agreement with MD simulations showing the main tunnel to be mostly closed in mutants 04 and 15, unless it was temporarily opened by a passing ligand (Fig 74). The sidechain of Tyr176 was resolved in two different conformations in the XC structure of mutant 04. The distance between oxygen atoms of 4hydroxyphenyl groups of the two conformations is 4.1 Å, and there are most likely two distinct conformational states of this bulky residue at the mobile Cterminus of the 5 helix. Accommodation of the 4hydroxyphenyl group of Tyr176α in the place formerly occupied by the thiol group of Cys176 results in one conformation pointing towards the active site and another placing the aromatic ring close to the carbonyl of Ala172. This observation is consistent with the gatekeeping function of Tyr176 and the observation of both conformations of Tyr176 in the MD simulations.
Slot tunnel in the XC structures of DhaA. The opening of the slot tunnel in the structure 1BN6 (Fig 72a) was due to the presence of different rotamers of Ile135 and Arg133 sidechains together with 0.8 Å displacement of the backbone of five residues of the NC loop (133ArgProIleProThr137), compared to structures 1CQW and 1BN7. This is in accordance with the important role of the highly mobile NC loop in controlling the accessibility of the slot tunnel in RAMD simulations of DCL release through the p2a pathway. The displacement of the NC loop in the structure 1BN6 could be due to the presence of an unknown ligand represented by an extensive electron density in the active site and five water molecules located at the mouth of the slot tunnel (Newman et al., 1999). On the contrary, the active site of 1CQW contains only water molecules and 1BN7 contains an acetate ion. The slot tunnel in structures 1CQW and 1BN7 was represented only by an isolated cavity containing two water molecules (Fig 72bc), while no crystallographic water molecules were identified in the region corresponding to the mouth of the slot tunnel.
Slot tunnel in the DhaA mutants. The NC loop of mutant 04 was resolved in a conformation similar to that in structures 1CQW and 1BN7, resulting in a closed slot tunnel. The introduction of a bulky Ile135Phe substitution further reduced accessibility of the slot tunnel of the XC structures of mutants 14 and 15 (Fig 72df). The NC loop of mutants 14 and 15 aligned with the corresponding region of 1BN6, suggesting slight displacement of the loop upon
121

4 Results
introduction of the bulky aromatic sidechain. This was in agreement with MD simulations that showed Ile135 to switch between four different conformations, whereas Phe135 adopted a single conformation similar to those observed in the XC structures of mutants 04 and 15.
Main tunnel versus slot tunnel. Based on available crystallographic data, it can be concluded that the slot tunnel belongs to a transient type of tunnel in all the studied proteins, while the main tunnel changes from being a permanent tunnel in the proteins with the wildtype cysteine in position 176 to being a transient tunnel in mutants 04 and 15 carrying tyrosine at position 176.
4.1 – 4.4 Tables and figuresKlvaňa M, Pavlová M, Prokop Z, Chaloupková R, Banáš P, Otyepka M, Wade RC, Nagata Y & Damborský J (2009). Redesigning dehalogenase access tunnels as a strategy for degrading an anthropogenic substrate. Nat. Chem. Biol. 5: 727733.
Klvaňa M, Pavlová M, Koudeláková T, Chaloupková R, Dvořák P, Prokop Z, Stsiapanava A, Kutý M, KutáSmatanová I, Dohnálek J, Kulhánek P, Wade RC & Damborský J (2009). Pathways and mechanisms for product release in the engineered haloalkane dehalogenases explored using classical and random acceleration molecular dynamics simulations. J. Mol. Biol. 392: 13391356.
Fig 58 | Docked orientations of DCL in wildtype DhaA. (a) RDCL; (b) SDCL. Catalytic pentad is shown in sticks, CL is represented by a yellow sphere and DCL by balls and sticks. Dashed lines indicate hydrogen bonding interactions between DhaA and the products. All molecular graphics were created using PYMOL (DeLano, 2002).
Table 29 | Overview of classical MD simulations of DhaA with DCL and CL products of TCP conversion.DhaAvariant
Products ID Length(ns)
Average RMSDof stable part (Å)a
Timespan of stableRMSD (ns)
DCL releasepathway
CL releasepathway
wt RDCL and CL c1 2.2 1.39 (±0.03) 1.602.20 p1SDCL and CL c2 2.8 1.55 (±0.03) 1.852.80
04 RDCL and CL c3 2.0 1.53 (±0.03) 1.202.00 SDCL and CL c4 2.0 1.50 (±0.02) 1.202.00
14 RDCL and CL c5 2.0 1.33 (±0.02) 1.252.00 SDCL and CL c6 2.0 1.43 (±0.02) 1.302.00
15 RDCL and CL c7 2.0 1.33 (±0.02) 1.452.00 p1SDCL and CL c8 2.0 1.37 (±0.03) 1.452.00
21' RDCL and CL c9 2.0 1.29 (±0.04) 0.602.00 SDCL and CL c10 2.0 1.57 (±0.04) 1.002.00
27' RDCL and CL c11 2.0 1.43 (±0.02) 1.702.00 SDCL and CL c12 2.0 1.41 (±0.03) 1.302.00
31' RDCL and CL c13 2.0 1.44 (±0.02) 1.652.00 SDCL and CL c14 2.0 1.47 (±0.03) 1.002.00
51' RDCL and CL c15 2.0 1.43 (±0.03) 0.902.00 SDCL and CL c16 2.0 1.42 (±0.03) 1.402.00
52' RDCL and CL c17 2.0 1.58 (±0.02) 1.502.00 SDCL and CL c18 2.0 1.67 (±0.03) 1.552.00
aStandard deviations are given in parentheses.
122

4 Results
Table 30 | Overview of classical MD simulations of DhaA with DCL product of TCP conversion.DhaAvariant
Product ID Length(ns)
Average RMSDof stable part (Å)a
Timespan of stableRMSD (ns)
DCL releasepathway
wt RDCL c19 2.8 1.38 (±0.02) 1.852.80 SDCL c20 2.8 1.45 (±0.02) 1.852.80
04 RDCL c21 2.0 1.33 (±0.03) 1.202.00 SDCL c22 2.0 1.34 (±0.02) 1.202.00
14 RDCL c23 2.0 1.36 (±0.04) 0.902.00 SDCL c24 2.0 1.31 (±0.03) 1.202.00
15 RDCL c25 2.0 1.34 (±0.02) 1.302.00 SDCL c26 2.0 1.29 (±0.03) 1.302.00
21' RDCL c27 2.0 1.29 (±0.03) 0.802.00 SDCL c28 2.0 1.33 (±0.05) 0.802.00
27' RDCL c29 2.0 1.34 (±0.02) 1.052.00 SDCL c30 2.0 1.31 (±0.02) 1.252.00
31' RDCL c31 2.0 1.35 (±0.03) 1.152.00 SDCL c32 2.0 1.36 (±0.03) 1.152.00
51' RDCL c33 2.0 1.59 (±0.01) 1.702.00 SDCL c34 2.0 1.43 (±0.02) 1.352.00
52' RDCL c35 2.0 1.37 (±0.04) 0.802.00 SDCL c36 2.0 1.47 (±0.03) 0.702.00
aStandard deviations are given in parentheses.
Table 31 | Overview of RAMD simulations of DhaA with DCL product of TCP conversion. (pp. 123124)DhaAvariant
Product Starting MDsnapshot (id)
ACCELERATIONa
(kcal Å1 g1)THRESHOLD
(Å)ID Length
(ps)DCL release
pathwaywt RDCL 5178 0.04 0.002 r1 1000
0.004 r2 480 p10.05 0.002 r3 102 p1
0.004 r4 60 p15400 0.04 0.002 r5 1000
0.004 r6 146 p10.05 0.002 r7 173 p2a
0.004 r8 143 p15600 0.04 0.002 r9 572 p3
0.004 r10 270 p10.05 0.002 r11 248 p2a
0.004 r12 99 p1SDCL 5194 0.04 0.002 r13 157 p1
0.004 r14 43 p10.05 0.002 r15 185 p1
0.004 r16 35 p15398 0.04 0.002 r17 1000
0.004 r18 220 p10.05 0.002 r19 291 p1
0.004 r20 135 p15582 0.04 0.002 r21 141 p1
0.004 r22 305 p10.05 0.002 r23 1000
0.004 r24 160 p104 RDCL 4000 0.04 0.002 r25 1000
0.004 r26 351 p10.05 0.002 r27 69 p1
0.004 r28 188 p1SDCL 4000 0.04 0.002 r29 1000
0.004 r30 1000 0.05 0.002 r31 408 p2a
0.004 r32 106 p114 RDCL 4000 0.04 0.002 r33 270 p1
0.004 r34 196 p10.05 0.002 r35 252 p1
0.004 r36 613 p1SDCL 4000 0.04 0.002 r37 176 p1
123

4 Results
DhaAvariant
Product Starting MDsnapshot (id)
ACCELERATIONa
(kcal Å1 g1)THRESHOLD
(Å)ID Length
(ps)DCL release
pathway14 SDCL 4000 0.004 r38 1000
0.05 0.002 r39 1000 0.004 r40 43 p1
15 RDCL 4000 0.04 0.002 r41 1000 0.004 r42 183 p1
0.05 0.002 r43 1000 0.004 r44 85 p1
SDCL 4000 0.04 0.002 r45 1000 0.004 r46 1000
0.05 0.004 r48 588 p121' RDCL 4000 0.04 0.002 r49 1000
0.004 r50 356 p10.05 0.002 r51 1000
0.004 r52 165 p1SDCL 4000 0.04 0.002 r53 140 p1
0.004 r54 545 p2c0.05 0.002 r55 1000
0.004 r56 232 p127' RDCL 4000 0.04 0.002 r57 230 p1
0.004 r58 200 p2b0.05 0.002 r59 1000
0.004 r60 155 p3SDCL 4000 0.04 0.002 r61 276 p1
0.004 r62 1000 0.05 0.002 r63 1000
31' RDCL 4000 0.04 0.002 r65 1000 0.004 r66 565 p1
0.05 0.002 r67 1000 0.004 r68 1000
SDCL 4000 0.04 0.002 r69 1000 0.004 r70 1000
0.05 0.002 r71 1000 0.004 r72 1000
51' RDCL 4000 0.04 0.002 r73 148 p10.004 r74 372 p1
0.05 0.002 r75 359 p10.004 r76 44 p1
SDCL 4000 0.04 0.002 r77 1000 0.004 r78 1000
0.05 0.002 r79 1000 0.004 r80 485 p1
52' RDCL 4000 0.04 0.002 r81 1000 0.004 r82 465 p1
0.05 0.002 r83 239 p10.004 r84 28 p1
SDCL 4000 0.04 0.002 r85 1000 0.004 r86 1000
0.05 0.002 r87 128 p10.004 r88 273 p1
aREXPUDATE = 10.
Table 32 | Frequency of occurrence of DCL release in the wildtype DhaA and its mutants in RAMD simulations. (pp. 124125)DhaAvariant
Variable amino acid residuesa
176 141 135 245 246 172 146No. ofRAMD
simulations
DCL release pathwayp1b p2ac p2b p2c p3
Norelease
(%)wt Cys Trp Ile Val Leu Ala Ala 24 17 2 1 1704 Tyr Trp Ile Val Leu Ala Ala 8 4 1 3814 Cys Trp Phe Val Leu Ala Ala 8 6 2515 Tyr Trp Phe Val Leu Ala Ala 7 3 5721' Tyr Phe Val Phe Ile Ala Ala 8 4 1 3827' Tyr Trp Leu Phe Ile Ala Ala 7 2 1 1 43
124

4 Results
DhaAvariant
Variable amino acid residuesa
176 141 135 245 246 172 146No. ofRAMD
simulations
DCL release pathwayp1b p2ac p2b p2c p3
Norelease
(%)31' Tyr Trp Phe Phe Ile Ala Ala 8 1 8851' Tyr Trp Phe Phe Ile Phe Ala 8 5 3852' Tyr Trp Phe Phe Ile Phe Phe 8 5 38aMutations are highlighted in dark grey.bp1 corresponds to the main tunnel.vp2a corresponds to the slot tunnel.
Fig 59 | Amino acid residues of the slot tunnel identified by RAMD simulations of DCL release in the wildtype DhaA and the 04 mutant. (a) the wildtype DhaA (trajectories r7 and r11); (b) the mutant 04 (trajectory r31). DCL release pathway through the slot tunnel is shown in grey surface representation. Cα atoms of the identified amino acid residues are shown in spheres, coloured by frequency of contact with DCL during the simulations and mapped onto the starting structure of the RAMD simulations. The thickness of the ribbon corresponds to the mainchain Bfactors for the RAMD simulations.
Fig 60 | Hot spot amino acid residues lining the access tunnels selected for mutagenesis by RAMD simulations of DCL release in the wildtype DhaA and the 04 mutant. The selected amino acid residues are located along DCL release pathway through the main tunnel, p1 (Cys176), the slot tunnel, p2a (Trp141, Ile135 and Leu246), or both the tunnels (Val245). DhaA wildtype is shown in cartoon model coloured by domains: grey, the main domain, white, the cap domain.
125

4 Results
Table 33 | Variability of the hot spots among members of subfamily II haloalkane dehalogenases.DhaA wildtype Substitutes among subfamily IIa
Ile135 Val, Phe, MetTrp141 Val, Phe, Met, SerVal245 Ala, Leu, Phe, SerLeu246 Ile, Phe, Metaboldfaced substitutes were found in experimentally characterised haloalkane dehalogenases.
Table 34 | DhaA variants obtained by screening saturation mutagenesis libraries A and B for enhanced activity towards TCP.DhaAvarianta
Variable amino acid residuesb Frequencyc
176 273 141 135 245 246Relativeactivitye
wt Cys Tyr Trp Ile Val Leu 1f
TemplatesM2 (Lib. A) Tyr Phe Trp Ile Val Leu 4M3 (Lib. B) Tyr Phe Phe Ile Val Leu 5
Library A25 Tyr Phe Trp Phe Met Leu 4 2226 Tyr Phe Trp Tyr Phe Ile 11 2327 d Tyr Phe Trp Val Phe Ile 1 3928 Tyr Phe Trp Tyr Leu Thr 1 2229 Tyr Phe Trp Phe Ile Leu 5 1130 Tyr Phe Trp Tyr Met Ile 3 1331 Tyr Phe Trp Phe Phe Ile 3 2432 Tyr Phe Trp Phe Met Ile 9 1633 Tyr Phe Trp Cys Tyr Leu 1 2834 Tyr Phe Trp Phe Leu Ile 2 1735 Tyr Phe Trp Phe Phe Val 2 2336 Tyr Phe Trp Phe Cys Leu 1 2037 Tyr Phe Trp Tyr Ile Leu 1 1338 Tyr Phe Trp Phe Tyr Ile 1 539 Tyr Phe Trp Tyr Met Met 1 1240 Tyr Phe Trp Phe Ile Met 1 541 Tyr Phe Trp Tyr Met Leu 1 16
Library B17 Tyr Phe Phe Phe Met Ile 9 2418 Tyr Phe Phe Tyr Phe Ile 11 1519 Tyr Phe Phe Tyr Met Ile 3 2620 Tyr Phe Phe Phe Phe Ile 3 2121 Tyr Phe Phe Leu Phe Ile 1 2522 Tyr Phe Phe Ile Phe Ile 1 2223 Tyr Phe Phe Phe Met Leu 4 1824 Tyr Phe Phe Ile Met Leu 1 12
aVariants selected for detailed characterisation are underlined; wt, wild type.bMutations introduced by sitedirected mutagenesis are highlighted in dark grey; mutations introduced by saturation mutagenesis are highlighted in orange.cFrequency of the specific combination of mutations at positions 135, 245, and 246 among the 51 clones comprising the 25 unique variants; frequencies of the combinations found in both libraries are underlined.dVariant 27 contains an additional (spontaneous) substitution Arg254Gly located at solvent exposed face of the main domain helix E.αeSpecific activities of crude extracts with TCP.fSpecific activity of wt = 0.014 mol sμ 1 mg1 of total protein.
126

4 Results
Fig 61 | Secondary structure fingerprint of DhaA variants determined by farUV CD spectroscopy. (a) The farUV CD spectra of wildtype DhaA, two templates for saturation mutagenesis, M2 and M3, and mutants obtained by saturation mutagenesis; the spectra showed two negative peaks at 208 and 222 nm, and one positive peak at 195 nm; the negative peak at 222 nm exhibited 835% increase in the mean residue ellipticity in the DhaA mutants compared to the wildtype DhaA. (b) The farUV CD spectra of the wildtype DhaA and the mutants containing aromatic amino acid residue substitutions obtained by one or two rounds of sitedirected mutagenesis of the wildtype DhaA and the mutant 31; the mutants 51 and 52 showed increased negative peak of the mean residue ellipticity at 208 and 222 nm.
Fig 62 | Specific activities of selected DhaA variants with TCP. The specific activities were expressed as fold changes relative to the specific activity of wildtype DhaA (0.0020 ± 0.0008 mol sμ 1 mg1).
Table 35 | Steadystate kinetic constants for TCP conversion by selected DhaA variants. (pp. 127128)DhaAvariant
Variable amino acid residuesa
176 273 141 135 245 246 172 146kcat
(s1)Km
(mM) kcat/Km
(s1 M1)Rel. kcat
(mt/wt)Rel. Km
(mt/wt)Rel. kcat/Km
(mt/wt)wta Cys Tyr Trp Ile Val Leu Ala Ala 0.08 2.2 36 1.0 1.0 1.0M2a Tyr Phe Trp Ile Val Leu Ala Ala 0.28 1.0 280 3.5 0.5 7.8wt Cys Tyr Trp Ile Val Leu Ala Ala 0.04 ± 0.01 1.0 ± 0.2 40 ± 13 1.0 1.0 1.004 Tyr Tyr Trp Ile Val Leu Ala Ala 0.24 ± 0.01 1.7 ± 0.1 141 ± 10 6.0 1.7 3.514 Cys Tyr Trp Phe Val Leu Ala Ala 0.05 ± 0.02 1.5 ± 0.3 33 ± 15 1.3 1.5 0.815 Tyr Tyr Trp Phe Val Leu Ala Ala 0.23 ± 0.01 1.8 ± 0.2 128 ± 15 5.8 1.8 3.2M2 Tyr Phe Trp Ile Val Leu Ala Ala 0.14 ± 0.04 0.9 ± 0.1 156 ± 48 3.5 0.9 3.9M3 Tyr Phe Phe Ile Val Leu Ala Ala 0.07 ± 0.01 1.0 ± 0.1 70 ± 12 1.8 1.0 1.821 Tyr Phe Phe Val Phe Ile Ala Ala 0.55 ± 0.04 1.2 ± 0.2 458 ± 83 13.8 1.2 11.527 Tyr Phe Trp Leu Phe Ile Ala Ala 1.02 ± 0.06 1.1 ± 0.1 927 ± 100 25.5 1.1 23.2
127

4 Results
DhaAvariant
Variable amino acid residuesa
176 273 141 135 245 246 172 146kcat
(s1)Km
(mM) kcat/Km
(s1 M1)Rel. kcat
(mt/wt)Rel. Km
(mt/wt)Rel. kcat/Km
(mt/wt)31 Tyr Phe Trp Phe Phe Ile Ala Ala 1.26 ± 0.07 1.2 ± 0.1 1,050 ± 105 31.5 1.2 26.351 Tyr Phe Trp Phe Phe Ile Phe Ala 0.21 ± 0.02 7.1 ± 1.1 30 ± 5 5.3 7.1 0.852 Tyr Phe Trp Phe Phe Ile Phe Phe 0.11 ± 0.01 1.7 ± 0.2 65 ± 10 2.8 1.7 1.6Rel, relative; mt, mutant; wt, wildtype.aData reported originally by Bosma et al. (2002); the s.d. for kcat and Km were ≤15% and ≤25%, respectively; kinetic constants were meausred in 50 mM NaHCO3NaOH buffer at pH 9.4 and 30 °C.
Fig 63 | Inhibition of TCP conversion by DCL product. Data were fitted to the model for competitive inhibition expressed as a = (Km + [S])/(Km(1 + [I]/Ki) + [S])), where: a, relative activity; [S], concentration of TCP; and [I], concentration of DCL. Ki
wt = 2.50 ± 0.17 mM, Ki21 = 3.15
± 0.20 mM, Ki27 = 4.42 ± 0.19 mM, Ki
31 = 2.08 ± 0.15 mM.
Fig 64 | Substrate specificity profiles of the wildtype (wt) DhaA and the mutant 31. The substrates are ordered by increasing 31towt ratio of specific activities. Decreased and increased activities of the mutant 31 are highlighted by light and dark grey, respectively.
128

4 Results
Fig 65 | DCL release pathways observed among DhaA variants. Pathways are represented by the surface and mapped on the crystal structure of DhaA from Rhodococcus sp. (PDBID 1CQW). The thickness of the ribbon corresponds to the crystallographic Bfactors. Variable amino acid residues among the DhaA variants are represented by black balls and labeled by the residue identifier; see Table 32 for specification of the mutations. p1 and p2a correspond to the main tunnel and the slot tunnel, respectively. NCloop, Nterminal cap domain loop; CCloop, Cterminal cap domain loop.
Fig 66 | Effect of mutations on the accessibility of DCL release pathways in RAMD simulations of the wildtype DhaA and its mutants. Pathways are represented by the surface and mapped on the crystal structure of DhaA from Rhodococcus sp. (PDBID 1CQW). DhaA variants are shown in ribbon; the pathways are coloured as follows: p1, yellow; p2a, blue; p2b, red; p2c, cyan; p3, green.
129

4 Results
Fig 67 | Effect of mutations and CL on the accessibility of water exchange pathways in classical MD simulations of the wildtype DhaA and its mutants with products of TCP conversion. (a) DhaA variants with DCL and CL in the active site; (b) DhaA variants with DCL in the active site. Pathways are represented by the surface and mapped on the XC structure of DhaA from Rhodococcus sp. (PDBID 1CQW). DhaA variants are shown in ribbon; the water exchange pathways are coloured as follows: p1, yellow; p2a, blue; p2b, red; p2c, cyan; p3, green.
130

4 Results
Fig 68 | Role of active site accessibility for bulk water molecules in the wildtype DhaA and the mutant 31' on formation of reactive complexes with TCP in classical MD simulations. (a) Active site accessibility for bulk water; the active site of the wildtype DhaA is accessible to bulk water (red); the cavity of the 31' mutant is inaccessible, and only discrete internal positions are occupied by structural water molecules (blue), also present in the wild type DhaA; spheres representing waters have a radius of 0.5 Å centred on the oxygen atoms. (b) The population of NAC (boxed) for TCP in the wildtype DhaA (red) and the mutant 31' (blue) in the MD simulations; snapshots shown in d are indicated by (□). (c) Evolution of the NAC distance of two reacting atoms during MD simulations; snapshots shown in d are indicated by (●). (d) Snapshots from MD simulations of the nonreactive configuration of TCP competing with water molecules for the nucleophile in the wildtype DhaA and the NAC for TCP in the 31' mutant; only polar hydrogens are shown for clarity.
131

4 Results
Fig 69 | The ratelimiting steps for conversion of TCP by the wildtype DhaA and mutant 31 identified by 2H2O kinetic isotope effect and presteady state kinetics. (a) The wildtype DhaA; (b) the mutant 31; (c) reaction scheme. Solid and dashed lines in a and b represent the best fits to the chloride ion (■) and DCL (□) kinetic data. The insets in a and b illustrate 2H2O kinetic isotope effect on the dehalogenase activity: the ratio between the activity in 1H2O (VH) and in 2H2O (Vobs) was plotted versus various 1H2O/2H2O ratios; the 2H2O kinetic isotope effect data for the wildtype DhaA are from a previous study (Bosma et al., 2003). The reaction scheme in c shows ratelimiting steps for the reactions catalysed by the wildtype DhaA (red) and the 31 mutant (blue); E, free enzyme; RCl, substrate; E.RCl, enzymesubstrate complex; ER.Cl−, alkylenzyme intermediate; E.Cl−.ROH, enzymeproduct complex; Cl− and ROH, products.
Fig 70 | No effect of single Cys176Tyr in the main tunnel on the accessibility of p1 release pathway for CL in classical MD simulations of the wildtype DhaA and its mutants. The CL release was observed only in the wildtype DhaA and the mutant 15, and only through via p1 pathway through the main tunnel. The pathways are represented by yellow surface and mapped on the XC structure of DhaA from Rhodococcus sp. (PDBID 1CQW).
Fig 71 | Schematic representation of ligand pathways among DhaA variants. (a) Pathway for CL observed in classical MD simulations; (b) pathways for DCL observed in RAMD simulations; (c) pathways for water molecules observed in classical MD simulations. Arrows indicate direction of passage of ligands through a tunnel (p1, p2a, p2b and p2c for DCL and water, and p3 for DCL) or protein matrix (p3 for water); p1, the main tunnel; p2a, the slot tunnel.
132
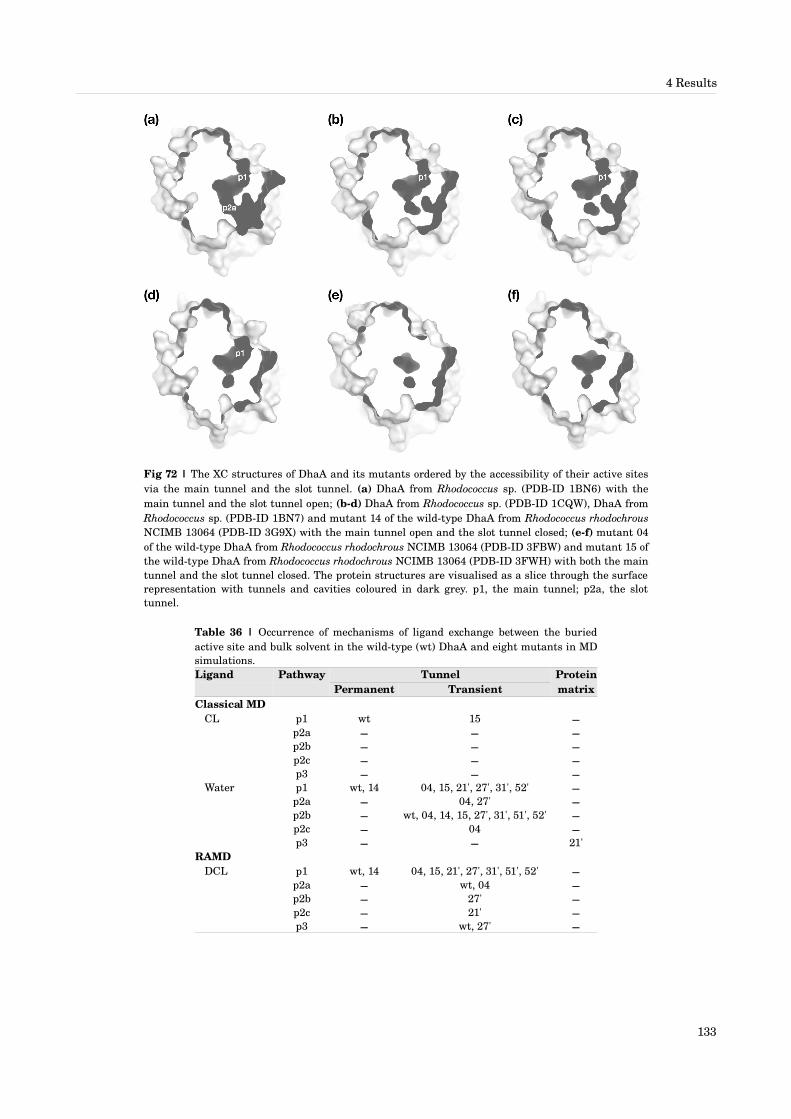
4 Results
Fig 72 | The XC structures of DhaA and its mutants ordered by the accessibility of their active sites via the main tunnel and the slot tunnel. (a) DhaA from Rhodococcus sp. (PDBID 1BN6) with the main tunnel and the slot tunnel open; (bd) DhaA from Rhodococcus sp. (PDBID 1CQW), DhaA from Rhodococcus sp. (PDBID 1BN7) and mutant 14 of the wildtype DhaA from Rhodococcus rhodochrous NCIMB 13064 (PDBID 3G9X) with the main tunnel open and the slot tunnel closed; (ef) mutant 04 of the wildtype DhaA from Rhodococcus rhodochrous NCIMB 13064 (PDBID 3FBW) and mutant 15 of the wildtype DhaA from Rhodococcus rhodochrous NCIMB 13064 (PDBID 3FWH) with both the main tunnel and the slot tunnel closed. The protein structures are visualised as a slice through the surface representation with tunnels and cavities coloured in dark grey. p1, the main tunnel; p2a, the slot tunnel.
Table 36 | Occurrence of mechanisms of ligand exchange between the buried active site and bulk solvent in the wildtype (wt) DhaA and eight mutants in MD simulations.Ligand Pathway Tunnel
Permanent TransientProteinmatrix
Classical MDCL p1 wt 15
p2a p2b p2c p3
Water p1 wt, 14 04, 15, 21', 27', 31', 52' p2a 04, 27' p2b wt, 04, 14, 15, 27', 31', 51', 52' p2c 04 p3 21'
RAMDDCL p1 wt, 14 04, 15, 21', 27', 31', 51', 52'
p2a wt, 04 p2b 27' p2c 21' p3 wt, 27'
133

4 Results
Fig 73 | Schematic representation for three mechanisms of ligand exchange between the buried active site of DhaA and bulk solvent. (a) Ligand passage through a permanent tunnel; (b) ligand passage through a transient tunnel; (c) ligand passage through a protein matrix. Protein and ligand are depicted in grey and red, respectively. Lowdensity region of the protein matrix is in light grey.
Fig 74 | The effect of mutations and CL on the opening and solvent accessibility of permanent and transient tunnels in classical MD simulations of the wildtype DhaA and its mutants. (a) DhaA variants complexed with DCL and CL; (b) DhaA variants complexed with DCL. Each value represents the average from two independent simulations. Colour coding of the pathways: p1, yellow; p2a, blue; p2b, red; p2c, cyan.
134

4 Results
Fig 75 | Selected attractive electrostatic (ele) and van der Waals (vdw) interactions between DCL and protein residues during release of DCL through different pathways. (a) p1 in the wildtype DhaA (trajectory r9); (b) p1 in the 04 mutant (trajectory r26); (c) p1 in the 31' mutant (trajectory r66); (d) p1 in the 51' mutant (trajectory r74); (e) p1 in the 52' mutant (trajectory r82); (f) p2a in the wildtype DhaA (trajectory r11); (g) p2b in the 27' mutant (trajectory r58); (h) p2c in the 21' mutant (trajectory r54); (i) p3 in the wildtype DhaA (trajectory r9). The most important residues of the release pathways are annotated by residue identifier and colour coded: p1, yellow; p2a, blue; p2b, red; p2c, cyan; p3, green.
135

4 Results
Fig 76 | Release of CL through p1 in the wildtype DhaA. (a) Distance of the CL from the halidestabilising residues Asn41 and Trp107 during classical MD simulation (trajectory c1); representative snapshots are indicated by squares and depicted (bf): (b) the initial state (at time = 0 ns); (c) solvation of the active site; (d) release of the CL from the halidestabilising residues; (e) movement of the CL through p1 towards Cys176; (e) release of the CL and water molecules to the bulk solvent; (f) transient interaction between the CL and Lys175 during the final stage of the CL release to the bulk solvent.
Fig 77 | Release of CL through p1 in the 15 mutant. (a) Distance of the CL from the halidestabilising residues Asn41 and Trp107 during classical MD simulation (trajectory c7); representative snapshots are indicated by squares and depicted (bf): (b) the initial state (at time = 0 ns); (c) solvation of the active site; (d) release of the CL from the halidestabilising residues; (e) movement of the CL through p1 towards Cys176; (e) release of the CL and water molecules to the bulk solvent; (f) transient interaction between the CL, Cys176Tyr and Lys175 during the final stage of the CL release to the bulk solvent.
136

4 Results
Fig 78 | Release of DCL through p1 in the wildtype DhaA. (a) Distance of the DCL from the the nucleophile Asp106 during RAMD simulation (trajectory r9); representative snapshots are indicated by squares and depicted (bd): (b) DCLAsp106 hydrogen bonding interaction; (c) DCLwaterAsp106 interaction; (d) release of the DCL through p1 allowed by transient conformational change of Phe144 sidechain.
Fig 79 | Release of DCL through p1 in the 04 mutant. (a) Distance of the DCL from the the nucleophile Asp106 during RAMD simulation (trajectory r26); representative snapshots are indicated by squares and depicted (bd): (b) DCLAsp106 hydrogen bonding interaction; (c) DCLwaterAsp106 interaction; (d) release of the DCL through p1 allowed by transient conformational change of Cys176Tyr and Phe144 sidechains.
137
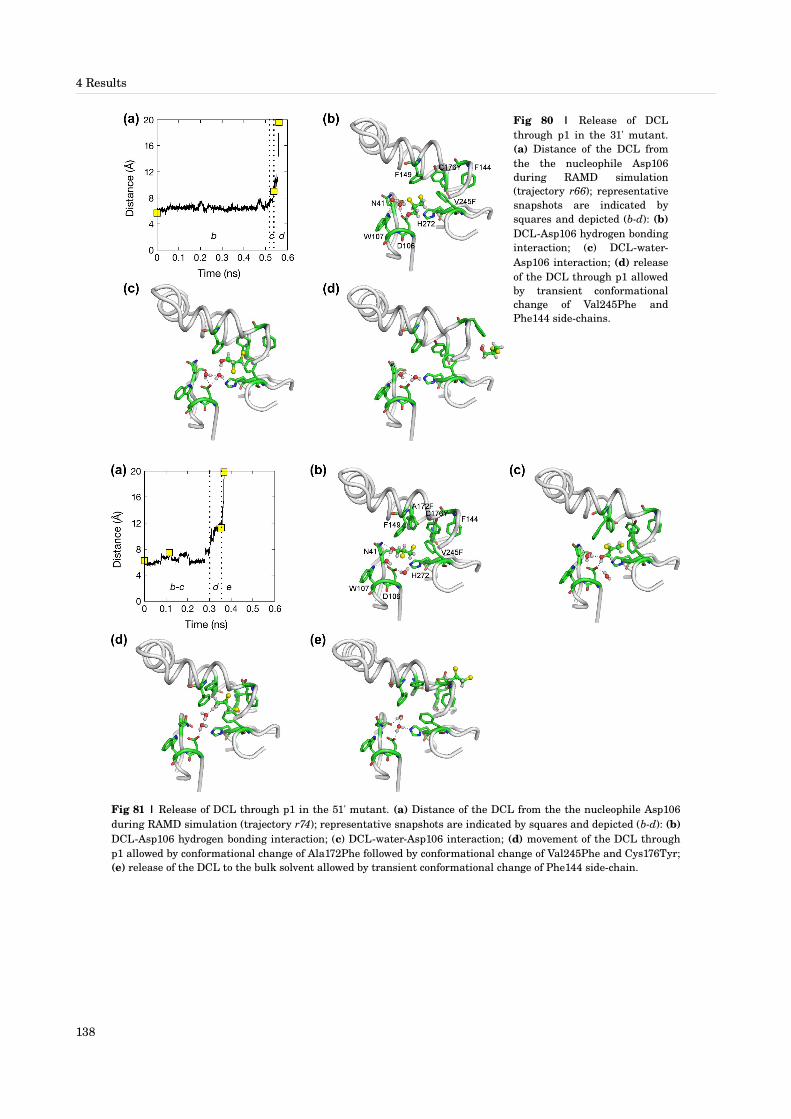
4 Results
Fig 80 | Release of DCL through p1 in the 31' mutant. (a) Distance of the DCL from the the nucleophile Asp106 during RAMD simulation (trajectory r66); representative snapshots are indicated by squares and depicted (bd): (b) DCLAsp106 hydrogen bonding interaction; (c) DCLwaterAsp106 interaction; (d) release of the DCL through p1 allowed by transient conformational change of Val245Phe and Phe144 sidechains.
Fig 81 | Release of DCL through p1 in the 51' mutant. (a) Distance of the DCL from the the nucleophile Asp106 during RAMD simulation (trajectory r74); representative snapshots are indicated by squares and depicted (bd): (b) DCLAsp106 hydrogen bonding interaction; (c) DCLwaterAsp106 interaction; (d) movement of the DCL through p1 allowed by conformational change of Ala172Phe followed by conformational change of Val245Phe and Cys176Tyr; (e) release of the DCL to the bulk solvent allowed by transient conformational change of Phe144 sidechain.
138

4 Results
Fig 82 | Release of DCL through p1 in the 52' mutant. (a) Distance of the DCL from the the nucleophile Asp106 during RAMD simulation (trajectory r82); representative snapshots are indicated by squares and depicted (bd): (b) DCLAsp106 hydrogen bonding interaction; (c) DCLwaterAsp106 interaction and consecutive conformational change of aromatic sidechains of p1; (d) release of the DCL through p1 along Ala172Phe flipped to the bulk solvent due to interaction with Ala145Phe.
Fig 83 | Release of DCL through p2a in the wildtype DhaA. (a) Distance of the DCL from the the nucleophile Asp106 during RAMD simulation (trajectory r11); representative snapshots are indicated by squares and depicted (be): (b) DCLAsp106 hydrogen bonding interaction; (c) DCLwaterAsp106 interaction; (d) fast movement of the DCL towards Arg133; (e) release of the DCL to the bulk solvent without perturbation of Arg133Glu140 salt link.
139

4 Results
Fig 84 | Release of DCL through p2b in the 27' mutant. (a) Distance of the DCL from the the nucleophile Asp106 during RAMD simulation (trajectory r58); representative snapshots are indicated by squares and depicted (be): (b) DCLAsp106 hydrogen bonding interaction; (c) DCLwaterAsp106 interaction and progressive conformational change of Trp141 and Val245Phe sidechains; (d) Arg133DCLVal245Phe hydrogen bonding interactions; (e) release of the DCL to the bulk solvent and flip of Trp141 and Val245Phe sidechains to original conformations.
Fig 85 | Release of DCL through p2c in the 21' mutant. (a) Distance of the DCL from the the nucleophile Asp106 during RAMD simulation (trajectory r54); representative snapshots are indicated by squares and depicted (bf): (b) DCLAsp106 hydrogen bonding interaction; (c) DCLwaterAsp106 interaction and perturbation of Pro210Ile135Leu part of a βbridge; (d) DCLArg133 hydrogen bond and perturbation of Ala212Ile135Leu part of the bridge; β (e) release of the DCL to the bulk solvent through the region of the original bridge; β (f) reconstruction of the bridge immediately afterβ the release of the DCL.
140

4 Results
Fig 86 | Release of DCL through p3 in the wildtype DhaA. (a) Distance of the DCL from the the nucleophile Asp106 during RAMD simulation (trajectory r9); representative snapshots are indicated by squares and depicted (be): (b) DCLAsp106 hydrogen bonding interaction; (c) DCLwaterAsp106 interaction and conformational change of Trp141 and Phe149 sidechains; (d) movement of the DCL between Trp141 and Phe149 sidechains, release of the DCL to the bulk solvent blocked by Trp138; (e) release of the DCL to the bulk solvent allowed by transient flip of Trp138 sidechain to the bulk solvent.
4.5 Development of CAVER 2.0 program for calculation of tunnels in protein structuresAndres F, Beneš P, Brezovský J, Chovancová E, Jaša P, Klvaňa M, Kozlíková B, Medek P, Pavelka A, Szabó T, Zamborský M, Zruban M (in alphabetical order), Sochor J & Damborský J (2009). CAVER 2.0 tunnel calculation program. Human Computer Interaction Laboratory and Loschmidt Laboratories (in alphabetical order), Masaryk University, Brno, Czech Republic. http://www.loschmidt.chemi.muni.cz/caver
CAVER 2.0 tunnel calculation program. CAVER 2.0 provides rapid, accurate, automated calculation of tunnels leading from buried cavities to the surface in the structural models of proteins, nucleic acids and inorganic materials.
Finding a tunnel using CAVER 2.0 algorithm. CAVER 2.0 treats atoms as spheres with diameter equal to the van der Waals radii according to the 1999 AMBER force field (Wang et al., 2000). The Voronoi diagram for a set of atom centres is computed starting from a userdefined buried cavity. Voronoi edges and vertices are converted to a weighted graph using Delaunay triangulation. The weighted graph is processed by the modified Dijkstra's algorithm. The search starts in the graph node which is closest to the cavity specified by user. The modified Dijkstra's algorithm computes the widest tunnel with minimal length. The mouth of the tunnel is blocked and the computation is repeated if more than one tunnel needs to be identified (Fig 87). Details of the computational procedure were described by Medek and coworkers (Medek et al., 2007).
Implementations of CAVER 2.0 algorithm. CAVER 2.0 algorithm can be run online using CAVER Viewer GUI Java Web Start application at http://loschmidt.chemi.muni.cz/caver/index.php?page=OnlineCAVER, and as a plugin for PYMOL, available after cost free registration at http://loschmidt.chemi.muni.cz/caver/index.php?page=Download. CAVER Viewer enables visualisation of tunnel in spheres representation, and additionally provides a novel “fire spire” model that shows the actual shape of the tunnel more accurately and highlights mutual circumfluence of neighbouring tunnels (Fig 88). Details of the development of the CAVER Viewer GUI application were described by Kozlíková and coworkers (Kozlíková et al., 2007). The advantage of using the plugin form of CAVER 2.0 is more graphically advanced and bugfree PYMOL program; CAVER Viewer is still at the early stage of a rather bustling development.
Demonstration of CAVER 2.0 functionality. Reliability of tunnels identified by temporary versions of CAVER 2.0 tunnel calculation algorithm was tested repeatedly against the set of protein structures comprising snapshots of MD simulations of wildtype DhaA and eight mutants (Table 29 and Fig 89). Although open tunnels can be easily identified by visual inspection of surface models of the protein structures e.g. in PYMOL, CAVER 2.0 brings several
141

4 Results
benefits: (i) precision in finding tunnels differing in openings to the surface (Fig 89ac); (ii) automation; (iii) speed, enabling processing of large set of structures in short time; (iii) identification of atoms and amino acid residues lining the tunnel; (iv) determination of tunnel width at discrete points along the tunnel, useful for identification of bottlenecks in tunnels; and (v) identification of tunnels that are invisible by visual inspection yet they may open for a ligand to pass through due to dynamics of a protein in time (Fig 89ade). Known limitation of the current version of CAVER is failure to find one of two tunnels possessing a common mouth (Fig 89de), due to blocking the mouth after finding the first of the two tunnels, which is the current strategy used to force the algorithm to search for more than one tunnel.
User statistics. As of November 14, 2009, 2,174 users registered for CAVER 2.0; the web site of CAVER was accessed from 15,013 unique IP addresses.
Fig 87 | Finding a tunnel using CAVER 2.0 algorithm. Weighted graph (edges, dashed lines with numbers, connected by nodes, squares) is generated from Delaunay triangulation (solid lines) for the set of protein atoms (grey spheres with centres highlighted by small orange balls). The widest tunnel with minimal length (red arrow) is computed from the weighted graph using the modified Dijkstra's algorithm, starting from the graph node (black square) closest to the user defined point in the cavity (asterisk).
Fig 88 | Calculation and visualisation of tunnels using CAVER Viewer application. (a) GUI with menu bar, (1), shortcut icons (2), and structure manipulation (3), molecular graphics (4), sequence (5) and command line panes (6); (b) tunnel calculation dialog (left) for specifying location of the starting point using (i) catalytic amino acid residues retrieved for the protein from Catalytic Site Atlas (1), (ii) userdefined amino acid residues (2), or (iii) x, y an z coordinates (3), and specifying number of tunnels to be computed (4); (c) computed tunnels shown in spheres; (d) computed tunnels shown in “fire spires”.
142

4 Results
Fig 89 | Tunnels in the snapshots from MD simulations of DhaA identified manually and automatically using CAVER 2.0 plugin in PYMOL. (a) open p1 and p2a in the mutant 27' (trajectory c12; snapshot 3860); (b) open p1 and p2b in the mutant 27' (trajectory c11; snapshot 3960); (c) open p1 and p2c in the mutant 04 (trajectory c4; snapshot 3810); (d) open p2a and p2b in the mutant 04 (trajectory c3; snapshot 3550); (e) open p1, p2a and p2b in the mutant 04 (trajectory c3; snapshot 3980). Five tunnels were calculated for each structure. Starting point was defined as a centroid of three atoms: N 2δ atom of Asn41, O 1δ atom of Asp106 and N 2ε atom of Trp107. All open tunnels were identified by CAVER 2.0 in a, b and c. p2b tunnel in d and p2a tunnel in e was not found by CAVER 2.0 due to common mouth with p2a and p2b tunnel, respectively. In a, d and e, CAVER 2.0 identified additional tunnels (p2c, p1 and p2c, and p2c, respectively) that were closed in the snapshots, but that are at the same time known to open in MD simulations. Protein structures are shown in surface representation; tunnels are in dark grey. CAVER 2.0 tunnels are shown in mesh representation and coloured by tunnel as follows: p1, yellow; p2a, blue; p2b, red; p2c, cyan.
143

5 Discussion
Nothing is not nothing because nothing is not something, and what is not something does not exist, and what does not exist is not, and what is not cannot be defined.
5.1 Active site access tunnels in the haloalkane dehalogenase DhaA from Rhodococcus rhodochrous NCIMB 13064 modified using semirational approach yielded mutants with significantly enhanced activity towards toxic and recalcitrant xenobiotic, 1,2,3trichloropropaneKlvaňa M, Pavlová M, Chaloupková R, Prokop Z, Banáš P, Otyepka M, Wade RC, Nagata Y & Damborský J (2009). Redesigning dehalogenase access tunnels as a strategy for degrading an anthropogenic substrate. Nat. Chem. Biol. 5: 727733.
Three approaches to protein engineering. There are many documented cases of organisms acquiring the ability to degrade anthropogenic chemicals within a few years (or less) following contact with them (Aharoni et al., 2005). It is unclear how the enzymes involved can evolve new activities so rapidly, but the ability generally depends on the introduction of new phenotypic traits by a small number of mutations. Three major approaches can be applied to mimic such rapid evolution and enhance the catalytic performance of enzymes towards nonnatural substrates in the laboratory: rational protein design (Craick et al., 1985), directed evolution (Mills et al., 1967) and their combination, the socalled semirational approach (Chica et al., 2005). The rational design is the most promising and versatile approach for generating new activities, while the directed evolution seems to be the best way to optimise catalytic properties of existing enzymes (Woycechowsky et al., 2007); the semirational approach then combines advantages of both these approaches (Chica et al., 2005; Sen et al., 2007).
DhaA variants with enhanced activity towards 1,2,3trichloropropane (TCP) have been obtained by the semirational approach. In this study, we constructed a variant of the haloalkane dehalogenase DhaA from Rhodococcus rhodochrous NCIMB 13064 with 32fold higher catalytic activity and 26fold higher catalytic performance for TCP than wildtype DhaA by the semirational approach employing classical molecular dynamics (MD) and random acceleration MD (RAMD) simulations with directed evolution. Identification of specific sites in the protein for combinatorial saturation mutagenesis substantially reduced the sequence space required to isolate viable mutants: A smart mutant library of ~ 5,000 clones yielded 51 positive clones and 25 unique sequences with improved TCP conversion ─ significantly more than in a previous study in which a random library of DhaA mutants created by DNA shuffling (Bosma et al., 2002) yielded 30 potentially positive variants out of 10,000 clones, and only one (04 mutant, Cys176Tyr) showing improved TCP conversion. A secondgeneration library created by errorprone PCR provided 14 potentially positive variants and one (M2, Cys176Tyr+Tyr273Phe) with further improved catalytic performance (Bosma et al., 2002). However, neither the wildtype enzyme nor M2 have sufficient catalytic activity and catalytic efficiency with TCP (kcat = 0.04 and 0.14 s−1, kcat/Km = 40 s−1 M−1 and 156 s−1 M−1, respectively) for biodegradation in a continuousflow system, which would be essential for costeffective, fullscale bioremediation processes. The catalytic constants of our mutant with highest activity towards TCP (kcat = 1.26 s−1, kcat/Km = 1,050 s−1 M−1) are of the same order of magnitude as those of the haloalkane dehalogenase DhlA for 1,2dichloroethane (kcat = 3.3 s−1, kcat/Km = 6,200 s−1 M−1), which has proven utility in 1,2dichloroethane–mineralising microorganisms used in a fullscale groundwater purification plant (Stucki & Thueer, 1995). The haloalkane dehalogenase DhlAproducing microorganisms have survived, grown and shown potential to degrade 1,2dichloroethane efficiently for at least five years after the startup of the plant. Construction of a TCPdegrading bacterium carrying the mutant dehalogenase identified in this work is currently in progress, thus following the work of Bosma and coworkers on the wildtype DhaA (1999) and the M2 mutant (2002).
The enhanced activity of the mutant 31 is due to improved shielding of the active site from bulk solvent.. In the present study, focusing on the apparent importance of narrowing the main access tunnel (Banáš et al., 2006), the most active mutant 31 contains the large aromatic residues in four out of five positions targeted by mutagenesis, leading to the most occluded active site. Product release was a rare event in random acceleration molecular dynamics (RAMD) simulations of variant 31', and classical molecular dynamics (MD) simulations of its enzymesubstrate
144

5 Discussion
complex showed that the modification of its entrance pathways restricts access of water molecules to the occluded active site cavity. One water molecule must be present in the active site as a cosubstrate for the hydrolytic step, but additional water molecules inhibit carbonhalogen bond cleavage (DeviKesavan & Gao, 2003; Hur et al., 2003; Olsson & Warshel, 2004). Rapid quenchflow analysis confirmed indications from MD simulations that carbonhalogen bond cleavage is the ratelimiting step for TCP conversion by the wildtype DhaA ─ as reported previously (Bosma et al., 2003) ─ and that this step is significantly improved in the 31 mutant. The observed switch of the ratelimiting step from the chemical reaction to the product release in the 31 mutant documents the tradeoff that favours catalysis in the occluded active site and disfavours product release. Substrate mapping for the 31 mutant showed that it also has increased activity towards other 1,2dihaloethanes and 1,2dihalopropanes, in accordance with the proposed limitation of carbonhalogen bond cleavage for these substrates. Precise formation of the activated complex and stabilisation of the transition state are important for the initial bimolecular nucleophilic substitution (SN2) step in the conversion of 1,2halogenated substrates by the haloalkane dehalogenases, since halogen substitutents in the 1,2position strongly sterically hinder the nucleophilic attack.
Engineering the active site access pathways has applicability for optimising enzymes with buried active sites. Comparative analysis of Xray crystal (XC) structures suggested that access tunnels substantially influence haloalkane dehalogenases’ substrate specificity and activity (Marek et al., 2000) and it was verified by exhaustive sitedirected mutagenesis of the tunnel amino acid residue Leu177 in the haloalkane dehalogenase LinB (Chaloupková et al., 2003). Access tunnels have also been shown to affect the substrate specificity of cytochrome P450s (Winn et al., 2002; Schleinkofer et al., 2005; Cojocaru et al., 2007). Numerous reports describing variants of several enzymes carrying singlepoint mutations in access tunnels with modified specificities, enantioselectivities or activities (Carmichael & Wong, 2001; Lauble et al., 2002; Schmitt et al., 2002; Chaloupková et al., 2003; Fedorov et al., 2004; Fishman et al., 2004; Kotik et al., 2007; Feingersch et al., 2008) support the general applicability of redesigning access tunnels to alter enzymes’ activities. Here we have demonstrated the utility of simultaneously randomising several residues that influence ligand and water passage through access tunnels for optimising tunnel anatomy, physicochemical properties and dynamics. In summary, we provide experimental evidence that the activity of enzymes towards anthropogenic substrates can be improved by modifying access routes connecting the buried active site cavity with the surrounding solvent. The results indicate that identifying hot spot amino acid residues lining access tunnels by MD simulations combined with exhaustive mutagenesis by directed evolution may be a valuable, generally applicable methodology for engineering new biocatalysts with buried active sites. The tunnel amino acid residues remote to the active site represent good targets for mutagenesis since their replacement may not lead to loss of functionality by disruption of the active site architecture.
5.2 MD simulations identified five product release and water exchange pathways in DhaA variantsKlvaňa M, Pavlová M, Koudeláková T, Chaloupková R, Dvořák P, Prokop Z, Stsiapanava A, Kutý M, KutáSmatanová I, Dohnálek J, Kulhánek P, Wade RC & Damborský J (2009). Pathways and mechanisms for product release in the engineered haloalkane dehalogenases explored using classical and random acceleration molecular dynamics simulations. J. Mol. Biol. 392: 13391356.
Five product release and water exchange pathways were identified of which three were not evident from Xray crystal (XC) structures. Two distinct tunnels, named the main tunnel and the slot tunnel, could be identified in the XC structures of the haloalkane dehalogenases (Otyepka & Damborský, 2002; Petřek et al., 2006). The simulations conducted with wildtype DhaA confirm the relevance of the main tunnel (pathway p1) and the slot tunnel (pathway 2a) for release of products and exchange of water molecules between the buried active site and the bulk solvent. p1 is observed as the only release pathway for chloride anion (CL). The release of CL was observed only in wildtype DhaA and mutant 15, most probably due to limited time available in the classical MD simulations for the CL to become hydrated. Nevertheless, the proposed role of p1 for CL release is supported by the presence of iodide anions in the XC structure of DhaA from Rhodococcus sp., PDBID 1CQW (Newman et al., 1999). The structure reveals two iodide binding sites: (i) iodide anion positioned between the halidestabilising residues Asn41 and Trp107 and (ii) iodine covalently attached to the S of Cys176 γ (Newman et al., 1999). An imaginary line connecting the two iodide binding sites goes through the p1 pathway. p1 is also the dominant release pathway for 2,3dichloropropane1ol (DCL) and for exchange of water molecules between the active site and bulk solvent. p2a functions as an auxiliary pathway for DCL and water molecules. The release of DCL through the pathway corresponding to p2a was also observed in the recent MD simulations of enzyme–product complexes of the phylogenetically closely related haloalkane dehalogenase LinB (Negri et al., 2007). Besides p1 and p2a, the simulations revealed the additional p2b
145

5 Discussion
and p2c for water molecules and p3 for DCL in wildtype DhaA. While p2b can be related to a deep surface depression in the three available XC structures of DhaA (Newman et al., 1999), no indication for p2c or p3 can be found in these structures. DCL passing through p3 forms a transient tunnel, while water molecules pass directly through the protein matrix of the region p3. MD simulations suggest that p2b and p2c function as auxiliary pathways for water molecules, especially in the presence of charged CL in the active site. Interestingly, p2b is the preferred route for the exchange of water molecules over p2a and is observed in all but one DhaA variant.
Protein dynamics is important determinant of accessibility of ligand exchange pathways. It is noteworthy that all the pathways are located along highly mobile secondary structure elements of the DhaA cap domain comprising the Nterminal cap domain loop (NC loop), the variable Nterminal part of the 4 helix, the breakage point in the 5 helixα α at Gly171, the variable Cterminal part of the 5 helix, and the Cterminal cap domain loop, CC loop α (Otyepka & Damborský, 2002). The larger backbone fluctuations during the passage of CL, DCL, or water molecules through a pathway compared to the free, unliganded pathway also suggest that the mobility can be further enhanced by interactions with small molecules. Apparently, some of the functionally relevant pathways are not observable in the XC structures and MD simulations are necessary for their identification (Lüdemann et al., 2000a; Winn et al., 2002; Wade et al., 2004; Schleinkofer et al., 2005; Carlsson et al., 2006; Wang & Duan, 2007). Previous studies on other systems have also shown that flexibility of loops and helices controls accessibility of the active site, for example, in cytochrome P450 (Lüdemann et al., 2000b; Prasad et al., 2000; Dunn et al., 2001; Podust et al., 2001; Wade et al., 2004; Li et al., 2005; Schleinkofer et al., 2005; Seifert et al., 2006; Cojocaru et al., 2007; Yao et al., 2007), acetylcholinesterase (Tara et al., 1999), gpH1 receptor (Strasser & Wittmann, 2007), and haloalkane dehalogenase LinB (Negri et al., 2007). We further demonstrate that all relevant pathways in wildtype DhaA and its mutants can be identified by monitoring of the exchange of solvent between the buried active site and the protein surface.
5.3 Solvation of products is essential for their release from buried active site of DhaA variantsKlvaňa M, Pavlová M, Koudeláková T, Chaloupková R, Dvořák P, Prokop Z, Stsiapanava A, Kutý M, KutáSmatanová I, Dohnálek J, Kulhánek P, Wade RC & Damborský J (2009). Pathways and mechanisms for product release in the engineered haloalkane dehalogenases explored using classical and random acceleration molecular dynamics simulations. J. Mol. Biol. 392: 13391356.
CL release is triggered and assisted by water molecules. Specific interactions between the two products, CL and DCL, the protein, and water solvent are essential for release of products from the buried active sites of haloalkane dehalogenases. CL formed during the dehalogenation reaction is strongly bound in between two halidestabilising residues, which are present in all currently known haloalkane dehalogenases (Verschueren et al., 1993d; Kennes et al., 1995; Damborský et al., 1997; Krooshof et al., 1997; Damborský & Koča, 1999; Newman et al., 1999; Schindler et al., 1999; Marek et al., 2000; Boháč et al., 2002; Janssen, 2004; Chovancová et al., 2007). The halide ion is positioned in between the two halidestabilising residues in all XC structures of haloalkane dehalogenases, with the exception of enzymesubstrate complexes with the halidebinding site occupied by the substrate molecule (Verschueren et al., 1993d; Newman et al., 1999; Marek et al., 2000). The stabilisation of halide ions is weaker in DhaA than in DhlA due to the different chemistry of the halidestabilising residues. DhaA possesses tryptophan and asparagine, whereas DhlA has two tryptophans (Schindler et al., 1999; Boháč et al., 2002). The stronger stabilisation of the halide product in DhlA, together with its occluded active site and different location of a catalytic acid, may explain the limitation of the reaction cycle by the halide release (Schanstra et al., 1996b; Pikkemaat et al., 1999). In DhaA, halide release is a fast process, showing no effect on overall kinetics (Bosma et al., 2002). The release of CL from DhaA is clearly triggered by water molecules. The CL bound in the active site induces a strong electrostatic field, which attracts water molecules from the bulk solvent to the active site not only through tunnels p1 and p2a but also through three auxiliary water pathways p2b, p2c, and p3. Water molecules compete with the halidestabilising residues for favourable interactions with CL and facilitate the release of CL from the active site. This proposal is in very good agreement with the classical MD simulations of product release from the haloalkane dehalogenase LinB (Negri et al., 2007). In DhaA, CL leaves the active site through p1 surrounded by water molecules. The polar residue Lys175 located at the mouth opening of the main tunnel of DhaA guides solvated CL out of the main tunnel to the surrounding solvent.
DCL release is triggered by water molecules and guided by interactions with aromatic amino acid residues. Both molecular docking and MD simulations suggest that the DCL, formed during the dehalogenation reaction, makes a
146

5 Discussion
hydrogen bond with the nucleophile Asp106. This interaction could explain inhibition of TCP dehalogenation by DCL product. Disruption of this interaction is assisted by water molecules and represents one of the limiting events of DCL release. Several polar residues located along the release pathways make contacts with DCL during its release. Very important is van der Waals and electrostatic attraction of DCL by His272 in p1. Strong interaction of the alcohol product with the conserved catalytic histidine has been described for the enzymeDCL complex of LinB (Monincová et al., 2007) as well as for other enzymeproduct complexes of this enzyme (Marek et al., 2000; Streltsov et al., 2003; Oakley et al., 2004). Another important interaction made by DCL, when moving away from the active site via p2a, p2b, and p2c, is with the polar Arg133. Arg133 controls p2a opening by transient formation of a salt link to Glu140. Favourable electrostatic and van der Waals interactions are provided by several aromatic sidechains in p1, p2b, and p3. Bulky aromatic sidechains function as gatekeepers and must undergo conformational change to increase the accessibility of the pathway for bulky DCL. If two or more aromatic sidechains form the gate, they change conformation in a simultaneous or consecutive way, depending on their location along the pathway. DCL moves through a pathway taking advantage of temporarily increased local space due to natural protein breathing motions, which may be further enhanced by a DCL molecule. This is in agreement with studies describing the accessibility of pathways that are being controlled locally by (i) hydrogenbonding and salt link interactions, described for cytochrome P450 (Deprez et al., 1994; Di Primo et al., 1997; Lounnas & Wade, 1997; Oprea et al., 1997; Lüdemann et al., 2000a; Dunn et al., 2001; Winn et al., 2002; Li et al., 2005; [Yao et al., 2007) and acetylcholinesterase (Kovach et al., 1994; Enyedy et al., 1998), and (ii) aromatic gating, described for cytochrome P450 (Lüdemann et al., 2000a; Lüdemann et al., 2000b; Winn et al., 2002; Li et al., 2005), acetylcholinesterase (Ripoll et al., 1993; Enyedy et al., 1998; Tara et al., 1999; Van Belle et al., 2000; Xu et al., 2003), NADH oxidase (Hritz et al., 2006), horseradish peroxidase (Khajehpour et al., 2003; Zelent et al., 2004), and myoglobin (Teeter, 2004).
5.4 Mutations change the accessibility of the pathways in DhaA variantsKlvaňa M, Pavlová M, Koudeláková T, Chaloupková R, Dvořák P, Prokop Z, Stsiapanava A, Kutý M, KutáSmatanová I, Dohnálek J, Kulhánek P, Wade RC & Damborský J (2009). Pathways and mechanisms for product release in the engineered haloalkane dehalogenases explored using classical and random acceleration molecular dynamics simulations. J. Mol. Biol. 392: 13391356.
Effect of amino acid residue substitutions on accessibility of auxiliary exchange pathways is mutation and liganddependent. The eight mutants of the DhaA haloalkane dehalogenase studied here carry various substitutions in the residues lining the main tunnel and the slot tunnel. The mutations show diverse effects on the accessibility of individual pathways for individual ligands. Four out of five possible pathways (p1, p2a, p2b, and p2c) are accessible for water molecules in wildtype DhaA, whereas one pathway (p3) becomes accessible for water molecules only after introducing the Trp141Phe substitution in mutant 21'. Residue 141, together with Phe149, forms a gate that controls accessibility of p3. The release of DCL through p3 is observed in mutant 27', but not in mutant 21', suggesting that p3 is hardly accessible for bulky alcohol regardless of the residue in position 141. On the other hand, Trp141Phe and Ile135Val are required to allow accessibility of p2b and p2c pathways for DCL. Ile135 is the key residue controlling the access to p2a, p2b, and p2c because its substitution to bulky phenylalanine effectively closes up p2a, p2b, and p2c for DCL and p2a and p2c for water molecules.
Main tunnel is the only pathway that could not be sealed against ligand exchange by amino acid residue substitutions. The only pathway that could not be completely blocked is p1. This is the main release pathway for DCL and is accessible even after the cumulative introduction of four aromatic substitutions. Introduction of aromatic substitutions in p1 (Cys176Tyr, Val245Phe, Ala172Phe, and Ala145Phe) seems to decrease its accessibility for DCL in the presence of two substitutions but surprisingly seems to restore the accessibility for DCL by the third and fourth substitutions in mutants 51' and 52'. It is noteworthy that many aromatic residues are packed close to each other in the active site (His272, Tyr273, Phe152, and Phe168) and p1 (Phe144, Ala145Phe, Phe149, Ala172Phe, Cys176Tyr, and Val245Phe) of mutant 52'. We propose that an effective gating is established because product release is not impaired in mutant 52' and the water molecules can enter the occluded active site once CL is formed during the dehalogenation reaction. Such an aromatic gating is a common way by which enzymes with buried active sites control accessibility during the reaction cycle. An interesting example of aromatic gating has been described for acetylcholinesterase (Ripoll et al., 1993; Kovach et al., 1994; Tara et al., 1999; Bui et al., 2003). The gate of the main gorge of acetylcholinesterase is formed by four aromatic residues, and their pinching movement (Tara et al., 1999; Bui et al., 2003), together with loop motion (Kovach et al., 1994) and strong dipole moment (Ripoll et al., 1993), is responsible for the enzyme operating near the diffusionlimited rate.
147

5 Discussion
5.5 Mutations change the mechanism of ligand exchange in DhaA variantsKlvaňa M, Pavlová M, Koudeláková T, Chaloupková R, Dvořák P, Prokop Z, Stsiapanava A, Kutý M, KutáSmatanová I, Dohnálek J, Kulhánek P, Wade RC & Damborský J (2009). Pathways and mechanisms for product release in the engineered haloalkane dehalogenases explored using classical and random acceleration molecular dynamics simulations. J. Mol. Biol. 392: 13391356.
Three common mechanisms for exchange of products and water are exploited by DhaA. Passage through a permanent tunnel, passage through a transient tunnel, and passage through a protein matrix were observed in classical MD and RAMD simulations of in the wildtype DhaA and its mutants. These mechanisms have analogies in other proteins. The exchange of ligands through permanent tunnels has been described for numerous proteins possessing a crystallographically observable tunnel in their structure (Sevinc et al., 1999; Tara et al., 1999; Podust et al., 2001; Henchman et al., 2002; Otyepka & Damborský, 2002; Chelikani et al., 2003; Wade et al., 2004; Jakopitsch et al., 2005; Wen et al., 2005; Ye et al., 2006; Cojocaru et al., 2007; Negri et al., 2007). The exchange through the transient tunnels corresponds to exchange through a socalled naturally fluctuating bottleneck (Zwanzig, 1992), which is a common mechanism to transiently enable access and egress of ligands in and out of the active site in the regions of lower density of protein atoms. This mechanism was previously reported for cytochrome P450 (Deprez et al., 1994; Lüdemann et al., 2000b; Dunn et al., 2001; Seifert et al., 2006), acetylcholinesterase (Van Belle et al., 2000; Bui et al., 2003), NADH oxidase (Hritz et al., 2006), T4 lysosyme (Carugo & Argos, 1998), and horseradish peroxidase (Zelent et al., 2004). Passage of the ligands through the protein matrix is a welldocumented phenomenon for gas migration in haem proteins (Di Primo et al., 1997; Teeter, 2004; Cohen et al., 2006; Lavalette et al., 2006; Ye et al., 2006).
Single amino acid residue substitution causes change of the main tunnel from permanently to transiently open. To study the effect of mutations on the mechanism of ligand exchange, we attempted to assign one of three mechanisms to every ligand exchange observed in our molecular dynamic simulations. By comparing the mechanisms of the wildtype enzyme with its mutants, we demonstrated that substitutions introduced into the tunnels changed not only the accessibility of the individual pathways (see 5.4) but also the mechanism of ligand exchange in the case of the p1 pathway. This pathway follows the permanent tunnel in the wildtype DhaA. The XC structures of the mutants show that a single aromatic substitution in the tunnel results in its closure. However, MD reveals that ligands can pass through the p1 pathway even in the mutants with four aromatic substitutions. This is possible due to ligandinduced changes in the protein structure that cause the pathway to open up transiently to allow release of products. The opening of p1 can also be induced by water molecules entering the active site through p1 due to strong electrostatic attraction by CL. This solvation of the active site through the transiently opened tunnel is observed even in mutant 52' with the most occluded active site. The substitutions for aromatic residues in p1 changed the mechanism for ligand exchange from the passage through a permanent tunnel to the passage through a transient tunnel.
148

6 Conclusions
Problems often arise from incorrect interpretation of incomplete data.
Conclusion 1 | Using classical MD and RAMD simulations, three amino acid residues, Ile135, Val245 and Leu246, were proposed for saturation mutagenesis of the Cys176Tyr+Tyr273Phe mutant of the haloalkane dehalogenase DhaA. The saturation mutagenesis then yielded mutants with catalytic performance of 1,2,3trichloropropane (TCP) conversion increased up to 26fold (mutant 31).
Conclusion 2 | The enhanced activity of the DhaA mutants with TCP is due to improved shielding of the buried active site from bulk solvent at substrate binding and/or bimolecular nucleophilic substitution step of the reaction cycle. The shielding is best achieved by Cys176Tyr+Val245Phe+Ile135Phe substitutions of the mutant 31.
Conclusion 3 | Two active site access pathways, p1 and p2a, corresponding to crystallographically observable main tunnel and slot tunnel, respectively, and three additional pathways, p2b, p2c and p3, were identified among wildtype DhaA and eight mutants using classical MD and RAMD simulations.
Conclusion 4 | Release of chloride anion product of TCP conversion is triggered and assisted by water; release of 2,3dichloropropane1ol (DCL) product is also triggered by water and guided by aromatic amino acid residues and by hydrogen bonding interactions.
Conclusion 5 | p1 is the major product release and water exchange pathway, robust against sealing attempted by four aromatic amino acid residue substitutions (Cys176Tyr+Val245Phe+Ala172Phe+Ala145Phe). Other pathways are auxiliary (p2a, p2b and p2c) or rare (p3). Accessibility of the auxiliary pathways is DCL and/or waterspecific and shows high sensitivity to substitution at position of the wildtype Ile135.
Conclusion 6 | Three mechanisms of ligand exchange are exploited among DhaA variants: passage through a permanent tunnel, passage through a transient tunnel and migration through a protein matrix. Main tunnel changes from permanently open to transiently open tunnel by single Cys176Tyr substitution.
Conclusion 7 | CAVER 2.0, a program for calculation of tunnels in protein structures, is available at:http://www.loschmidt.chemi.muni.cz/caver. The program can be used as a PYMOL plugin, or as a Java Web Start application, CAVER Viewer.
149

References
Seek simplicity, and distrust it. ― Alfred North Whitehead
Abagyan R, Totrov M and Kuznetsov D (1994). ICM – A new method for protein modeling and design: applications to docking and structure prediction from the distorted native conformation. J. Comput. Chem. 15: 488506.
Acharya KR & Lloyd MD (2005). The advantages and limitations of protein crystal structures. Trends Pharmacol. Sci. 26: 1014.
Agarwal PK, Billeter SR, Rajagopalan PTR, Benkovic SJ & HammesSchiffer S (2002). Network of coupled promoting motions in enzyme catalysis. Proc. Natl. Acad. Sci. U.S.A. 99: 27942799.
Aharoni A, Gaidukov L, Khersonsky O, Gould SM, Roodveldt C & Tawfik DS (2005). The 'evolvability' of promiscuous protein functions. Nat. Genet. 37: 7376.
Albert VA (2005). 3. Parsimony and its presuppositions. In Parsimony, phylogeny, and genomics (pp. 4353). Oxford University Press, New York, NY, USA.
Aloy P, Pichaud M & Russell RB (2005). Protein complexes: structure prediction challenges for the 21st century. Curr. Opin. Struct. Biol. 15: 1522.
Altieri AS & Byrd RA (2004). Automation of NMR structure determination of proteins. Curr. Opin. Struct. Biol. 14: 547553.
Altschul SF, Gish W, Miller W, Myers EW & Lipman DJ (1990). Basic local alignment search tool. J. Mol. Biol. 215: 403410.
Altschul SF & Lipman DJ (1990). Protein database searches for multiple alignments. Proc. Natl. Acad. Sci. U.S.A. 87: 55095513.
Altschul SF, Madden TL, Schäffer AA, Zhang J, Zhang Z, Miller W & Lipman DJ (1997). Gapped BLAST and PSIBLAST: a new generation of protein database search programs. Nucleic Acids Res. 25: 33893402.
Anastasi C, Buchet FF, Crowe MA, Parkes AL, Powner MW, Smith JM & Sutherland JD (2007). RNA: prebiotic product, or biotic invention? Chem. Biodivers 4: 721739.
Anderson CM, Zucker FH & Steitz TA (1979). Spacefilling models of kinase clefts and conformation changes. Science, 204: 375380.
Anderson DE, Hurley JH, Nicholson H, Baase WA & Matthews BW (1993). Hydrophobic core repacking and aromaticaromatic interaction in the thermostable mutant of T4 lysozyme Ser 117>Phe. Protein Sci. 2: 12851290.
Andrade MA, Chacón P, Merelo JJ & Morán F (1993). Evaluation of secondary structure of proteins from UV circular dichroism spectra using an unsupervised learning neural network. Protein Eng. 6: 383390.
Anfinsen CB, Haber E, Sela M & White FH (1961). The kinetics of formation of native ribonuclease during oxidation of the reduced polypeptide chain. Proc. Natl. Acad. Sci. U.S.A. 47: 13091314.
Anfinsen CB (1973). Principles that govern the folding of protein chains. Science, 181: 223230.
Angov E, Hillier CJ, Kincaid RL & Lyon JA (2008). Heterologous protein expression is enhanced by harmonizing the codon usage frequencies of the target gene with those of the expression host. PLoS ONE, 3: e2189 (110).
Apweiler R, Bairoch A & Wu CH (2004a). Protein sequence databases. Curr. Opin. Chem. Biol. 8: 7680.
Apweiler R, Bairoch A, Wu CH, Barker WC, Boeckmann B, Ferro S, Gasteiger E, Huang H, Lopez R, Magrane M, Martin MJ, Natale DA, O'Donovan C, Redaschi N & Yeh LL (2004b). UniProt: the Universal Protein knowledgebase. Nucleic Acids Res. 32: D115119.
150

References
Arand M, Grant DF, Beetham JK, Friedberg T, Oesch F & Hammock BD (1994). Sequence similarity of mammalian epoxide hydrolases to the bacterial haloalkane dehalogenase and other related proteins. Implication for the potential catalytic mechanism of enzymatic epoxide hydrolysis. FEBS Lett. 338: 251256.
Armen R, Alonso DOV & Daggett V (2003). The role of alpha, 3(10), and pihelix in helix>coil transitions. Protein Sci. 12: 11451157.
Artymiuk PJ, Poirrette AR, Grindley HM, Rice DW & Willett P (1994). A graphtheoretic approach to the identification of threedimensional patterns of amino acid sidechains in protein structures. J. Mol. Biol. 243: 327344.
Aurora R, Creamer TP, Srinivasan R & Rose GD (1997). Local interactions in protein folding: lessons from the alphahelix. J. Biol. Chem. 272: 14131416.
Aurora R, & Rose GD (1998). Helix capping. Protein Sci. 7: 2138.
Austin RH, Beeson KW, Eisenstein L, Frauenfelder H & Gunsalus IC (1975). Dynamics of ligand binding to myoglobin. Biochemistry, 14: 53555373.
Avbelj F & Fele L (1998). Role of mainchain electrostatics, hydrophobic effect and sidechain conformational entropy in determining the secondary structure of proteins. J. Mol. Biol. 279: 665684.
Avbelj F (2000). Amino acid conformational preferences and solvation of polar backbone atoms in peptides and proteins. J. Mol. Biol. 300: 13351359.
Bahadur RP, Chakrabarti P, Rodier F & Janin J (2004). A dissection of specific and nonspecific proteinprotein interfaces. J. Mol. Biol. 336: 943955.
Bairoch A, Apweiler R, Wu CH, Barker WC, Boeckmann B, Ferro S, Gasteiger E, Huang H, Lopez R, Magrane M, Martin MJ, Natale DA, O'Donovan C, Redaschi N & Yeh LL (2005). The Universal Protein Resource (UniProt). Nucleic Acids Res. 33: D154159.
Baker EN & Hubbard RE (1984). Hydrogen bonding in globular proteins. Prog. Biophys. Mol. Biol. 44: 97179.
Baldus M (2007). ICMRBS founder's medal 2006: biological solidstate NMR, methods and applications. J. Biomol. NMR, 39: 7386.
Baldwin RL & Rose GD (1999a). Is protein folding hierarchic? I. Local structure and peptide folding. Trends Biochem. Sci. 24, 2633.
Baldwin RL & Rose GD (1999b). Is protein folding hierarchic? II. Folding intermediates and transition states. Trends Biochem. Sci. 24, 7783.
Baldwin RL (2007). Energetics of protein folding. J. Mol. Biol. 371: 283301.
Banáš P, Otyepka M, Jeřábek P, Petřek M & Damborský J (2006). Mechanism of enhanced conversion of 1,2,3trichloropropane by mutant haloalkane dehalogenase revealed by molecular modeling. Journal of Comput. Aided Mol. Des. 20, 375383.
Bard J, Ercolani K, Svenson K, Olland A & Somers W (2004). Automated systems for protein crystallization. Methods, 34: 329347.
Barlow DJ & Thornton JM (1988). Helix geometry in proteins. J. Mol. Biol. 201: 601619.
Barman TE, Bellamy SRW, Gutfreund H, Halford SE & Lionne C (2006). The identification of chemical intermediates in enzyme catalysis by the rapid quenchflow technique. Cell. Mol. Life Sci. 63: 25712583.
Barron LD, Hecht L & Wilson G (1997). The lubricant of life: a proposal that solvent water promotes extremely fast conformational fluctuations in mobile heteropolypeptide structure. Biochemistry, 36: 1314313147.
Barth S, Fischer M, Schmid RD & Pleiss J (2004). The database of epoxide hydrolases and haloalkane dehalogenases: one structure, many functions. Bioinformatics, 20: 28452847.
151

References
Baxter CA, Murray CW, Clark DE, Westhead DR & Eldridge MD (1998). Flexible docking using Tabu search and an empirical estimate of binding affinity. Proteins, 33: 367382.
Bayly CI, Cieplak P, Cornell W & Kollman PA (1993). A wellbehaved electrostatic potential based method using charge restraints for deriving atomic charges: the RESP model. J. Phys. Chem. 97: 1026910280.
BellParikh LC & Guengerich FP (1999). Kinetics of cytochrome P450 2E1catalyzed oxidation of ethanol to acetic acid via acetaldehyde. J. Biol. Chem. 274: 2383323840.
Benkovic SJ & HammesSchiffer S (2003). A perspective on enzyme catalysis. Science, 301: 11961202.
Benner SA, Ellington AD & Tauer A (1989). Modern metabolism as a palimpsest of the RNA world. Proc. Natl. Acad. Sci. U.S.A. 86: 70547058.
Bennett WS & Huber R (1984). Structural and functional aspects of domain motions in proteins. CRC Crit. Rev. Biochem. 15: 291384.
Benson DA, KarschMizrachi I, Lipman DJ, Ostell J & Wheeler DL (2005). GenBank. Nucleic Acids Res. 33: D3438.
Berendsen HJC, Postma JPM, van Gunsteren WF, DiNola A & Haak JR (1984). Molecular dynamics with coupling to an external bath. J. Chem. Phys. 81: 36843690.
Berendsen HJC & Hayward S (2000). Collective protein dynamics in relation to function. Curr. Opin. Struct. Biol. 10: 165169.
Bergquist PL, Reeves RA & Gibbs MD (2005). Degenerate oligonucleotide gene shuffling (DOGS) and random drift mutagenesis (RNDM): two complementary techniques for enzyme evolution. Biomol. Eng. 22, 6372.
Berlow RB, Igumenova TI & Loria JP (2007). Value of a hydrogen bond in triosephosphate isomerase loop motion. Biochemistry, 46: 60016010.
Berman H, Henrick K & Nakamura H (2003). Announcing the worldwide Protein Data Bank. Nat. Struct. Biol. 10: 980.
Bikiel DE, Boechi L, Capece L, Crespo A, De Biase PM, Di Lella S, González Lebrero MC, Martí MA, Nadra AD, Perissinotti LL, Scherlis DA & Estrin DA (2006). Modeling heme proteins using atomistic simulations. PCCP, 8: 56115628.
Billeter M, Wagner G & Wüthrich K (2008). Solution NMR structure determination of proteins revisited. J. Biomol. NMR, 42: 155158.
Blakeley MP, Langan P, Niimura N & Podjarny A (2008). Neutron crystallography: opportunities, challenges, and limitations. Curr. Opin. Struct. Biol. 18: 593600.
Blanco FJ, Jiménez MA, Pineda A, Rico M, Santoro J & Nieto JL (1994). NMR solution structure of the isolated Nterminal fragment of proteinG B1 domain. Evidence of trifluoroethanol induced nativelike betahairpin formation. Biochemistry, 33: 60046014.
Blundell T, Barlow D, Borkakoti N & Thornton J (1983). Solventinduced distortions and the curvature of alphahelices. Nature, 306: 281283.
Blundell TL & Patel S (2004). Highthroughput Xray crystallography for drug discovery. Curr. Opin. Pharmacol. 4: 490496.
Boehr DD, Dyson HJ & Wright PE (2006). An NMR perspective on enzyme dynamics. Chem. Rev. 106: 30553079.
Boháč M, Nagata Y, Prokop Z, Prokop M, Monincová M, Tsuda M, Koča J & Damborský J (2002). Halidestabilizing residues of haloalkane dehalogenases studied by quantum mechanic calculations and sitedirected mutagenesis. Biochemistry, 41: 1427214280.
Böhm HJ (1992). The computer program LUDI: a new method for the de novo design of enzyme inhibitors. J. Comput. Aided Mol. Des. 6: 6178.
Bolon DN & Mayo SL (2001). Enzymelike proteins by computational design. Proc. Natl. Acad. Sci. U.S.A. 98: 1427414279.
Borrell B (2008). Chemistry: power play. Nature, 451: 240243.
152

References
Bosma T, Kruizinga E, de Bruin EJ, Poelarends GJ & Janssen DB (1999). Utilization of trihalogenated propanes by Agrobacterium radiobacter AD1 through heterologous expression of the haloalkane dehalogenase from Rhodococcus sp. strain M153. Appl. Environ. Microbiol. 65: 45754581.
Bosma T, Damborský J, Stucki G & Janssen DB (2002). Biodegradation of 1,2,3trichloropropane through directed evolution and heterologous expression of a haloalkane dehalogenase gene. Appl. Environ. Microbiol. 68: 35823587.
Bosma T, Pikkemaat MG, Kingma J, Dijk J & Janssen DB (2003). Steadystate and presteadystate kinetic analysis of halopropane conversion by a Rhodococcus haloalkane dehalogenase. Biochemistry, 42: 80478053.
Bourgeois D & Royant A (2005). Advances in kinetic protein crystallography. Curr. Opin. Struct. Biol. 15: 538547.
Bowie JU, Lüthy R & Eisenberg D (1991). A method to identify protein sequences that fold into a known threedimensional structure. Science, 253: 164170.
Bradley P, Chivian D, Meiler J, Misura KMS, Rohl CA, Schief WR, Wedemeyer WJ, SchuelerFurman O, Murphy P, Schonbrun J, Strauss CEM & Baker D (2003). Rosetta predictions in CASP5: successes, failures, and prospects for complete automation. Proteins, 53 Suppl 6, 457468.
Brezovský J, Prokop Z, Sato Y, Florián J, Mozga T, Chaloupková R, Koudeláková T, Jeřábek P, Natsume R, Janssen DB, Nagata Y, Senda T & Damborský J. Modulation of enantioselectivity in haloalkane dehalogenase DbjA by engineering of a surface loop. Protein Design and Evolution for Biocatalysis (Saint Feliu de Guixols, Spain), Oct 2530, 2008.
Britton KL, Baker PJ, Borges KM, Engel PC, Pasquo A, Rice DW, Robb FT, Scandurra R, Stillman TJ & Yip KS (1995). Insights into thermal stability from a comparison of the glutamate dehydrogenases from Pyrococcus furiosus and Thermococcus litoralis. Eur. J. Biochem. 229: 688695.
Brooks BR, Bruccoleri RE, Olafson BD, States DJ, Swaminathan S & Karplus M (1983). A program for macromolecular energy, minimization, and dynamics calculations. J. Comput. Chem. 4: 187217.
Brooks III CL, Karplus M & Pettitt BM (1988). I. Protein structure and dynamics an overview. In A theoretical perspective of dynamics, structure, and thermodynamics. Adv. Chem. Phys. 71: 721.
Brooks III CL, Thorpe IF, Rod TH & Radkiewicz JL (2003). Dynamics coupled to protein catalysis? Factors affecting hydride transfer rates in DHFR. Abstr. Pap. Am. Chem. Soc. 225: U747.
Brosius J (2003). Gene duplication and other evolutionary strategies: from the RNA world to the future. J. Struct. Funct. Genomics, 3: 117.
Brown AJ (1902). XXXVI.Enzyme action. J. Chem. Soc. Trans. 81: 373388.
Brown EN & Ramaswamy S (2007). Quality of protein crystal structures. Acta Crystallogr., Sect. D: Biol. Crystallogr. 63: 941950.
Bruice TC & Lightstone FC (1999). Ground state and transition state contributions to the rates of intramolecular and enzymatic reactions. Acc. Chem. Res. 32: 127136.
Bruice TC & Benkovic SJ (2000). Chemical basis for enzyme catalysis. Biochemistry, 39: 62676274.
Bruice TC (2002). A view at the millennium: the efficiency of enzymatic catalysis. Acc. Chem. Res. 35: 139148.
Bruice TC (2006). Computational approaches: reaction trajectories, structures, and atomic motions. Enzyme reactions and proficiency. Chem. Rev. 106: 31193139.
Brunori M, Cutruzzolà F, Savino C, TravagliniAllocatelli C, Vallone B & Gibson QH (1999). Structural dynamics of ligand diffusion in the protein matrix: a study on a new myoglobin mutant Y(B10) Q(E7) R(E10). Biophysi. J. 76: 12591269.
Bryant SH & Lawrence CE (1993). An empirical energy function for threading protein sequence through the folding motif. Proteins, 16: 92112.
Bryngelson JD, Onuchic JN, Socci ND & Wolynes PG (1995). Funnels, pathways, and the energy landscape of protein folding: a synthesis. Proteins, 21: 167195.
153

References
Bryson K, McGuffin LJ, Marsden RL, Ward JJ, Sodhi JS & Jones DT (2005). Protein structure prediction servers at University College London. Nucleic Acids Res. 33: W3638.
Brzozowski AM, Derewenda U, Derewenda ZS, Dodson GG, Lawson DM, Turkenburg JP, Bjorkling F, HugeJensen B, Patkar SA & Thim L (1991). A model for interfacial activation in lipases from the structure of a fungal lipaseinhibitor complex. Nature, 351: 491494.
Buck M, Radford SE & Dobson CM (1993). A partially folded state of hen egg white lysozyme in trifluoroethanol: structural characterization and implications for protein folding. Biochemistry, 32: 669678.
Bui JM, Henchman RH & McCammon JA (2003). The dynamics of ligand barrier crossing inside the acetylcholinesterase gorge. Biophys. J. 85: 22672272.
Burkhard P, Taylor P & Walkinshaw MD (1998). An example of a protein ligand found by database mining: description of the docking method and its verification by a 2.3 Å Xray structure of a thrombinligand complex. J. Mol. Biol. 277: 449466.
Burley SK & Petsko GA (1985). Aromaticaromatic interaction: a mechanism of protein structure stabilization. Science, 229: 2328.
Busenlehner LS & Armstrong RN (2005). Insights into enzyme structure and dynamics elucidated by amide H/D exchange mass spectrometry. Arch. Biochem. Biophys. 433: 3446.
CaetanoAnollés G, Yafremava LS, Gee H, CaetanoAnollés D, Kim HS & Mittenthal JE (2009). The origin and evolution of modern metabolism. Int. J. Biochem. Cell Biol. 41: 285297.
Callebaut I, Poupon A, Bally R, Demaret JP, Housset D, Delettré J, Hossenlopp P & Mornon JP (2000). The uteroglobin fold. Ann. N.Y. Acad. Sci. 923: 90112.
Campbell DW, Müller C & Reardon KF (2006). Development of a fiber optic enzymatic biosensor for 1,2dichloroethane. Biotechnol. Lett. 28: 883887.
Cannon WR & Benkovic SJ (1998). Solvation, reorganization energy, and biological catalysis. J. Biol. Chem. 273: 2625726260.
Carloni P, Rothlisberger U & Parrinello M (2002). The role and perspective of ab initio molecular dynamics in the study of biological systems. Acc. Chem. Res. 35: 455464.
Carlson HA (2002). Protein flexibility and drug design: how to hit a moving target. Curr. Opin. Chem. Biol. 6: 447452.
Carlsson P, Burendahl S & Nilsson L (2006). Unbinding of retinoic acid from the retinoic acid receptor by random expulsion molecular dynamics. Biophys. J. 91: 31513161.
Carmichael AB & Wong LL (2001). Protein engineering of Bacillus megaterium CYP102. The oxidation of polycyclic aromatic hydrocarbons. Eur. J. Biochem. 268: 31173125.
Carnevale V, Raugei S, Micheletti C & Carloni P (2006). Convergent dynamics in the protease enzymatic superfamily. J. Am. Chem. Soc. 128: 97669772.
Carugo O & Argos P (1998). Accessibility to internal cavities and ligand binding sites monitored by protein crystallographic thermal factors. Proteins, 31: 201213.
Carugo O (2001). Detection of breaking points in helices linking separate domains. Proteins, 42: 390398.
Cascella M, Raugei S & Carloni P (2004). Formamide hydrolysis investigated by multiplesteering ab initio molecular dynamics. J. Phys. Chem. B, 108: 369375.
Case DA, Darden TA, Cheatham TE, Simmerling CL, Wang J, Duke RE, Luo R, Merz KM, Wang B, Pearlman DA, Crowley M, Brozell S, Tsui V, Gohlke H, Mongan J, Hornak V, Cui G, Beroza P, Schafmeister C, Caldwell JW, Ross WS & Kollman PA (2004). AMBER 8. University of California, San Francisco, CA, USA.
Case DA, Cheatham TE, Darden T, Gohlke H, Luo R, Merz KM, Onufriev A, Simmerling C, Wang B & Woods RJ (2005). The AMBER biomolecular simulation programs. J. Comput. Chem. 26: 16681688.
154

References
Cavalli A, Salvatella X, Dobson CM & Vendruscolo M (2007). Protein structure determination from NMR chemical shifts. Proc. Natl. Acad. Sci. 104: 96159620.
Cech TR (1993). The efficiency and versatility of catalytic RNA: implications for an RNA world. Gene, 135: 3336.
Cedrone F, Ménez A & Quéméneur E (2000). Tailoring new enzyme functions by rational redesign. Curr. Opin. Struct. Biol. 10: 40510.
Chakrabarti P & Pal D (2001). The interrelationships of sidechain and mainchain conformations in proteins. Prog. Biophys. Mol. Biol. 76: 1102.
Chaloupková R, Sýkorová J, Prokop Z, Jesenská A, Monincová M, Pavlová M, Tsuda M, Nagata Y & Damborský J (2003). Modification of activity and specificity of haloalkane dehalogenase from Sphingomonas paucimobilis UT26 by engineering of its entrance tunnel. J. Biol. Chem. 278: 5262252628.
Chang CH, Schindler JF, Unkefer CJ, Vanderberg LA, Brainard JR & Terwilliger TC (1999). In vivo screening of haloalkane dehalogenase mutants. Bioorg. Med. Chem. 7: 21752181.
Chang I, Lee JC, Winkler JR & Gray HB (2003). The proteinfolding speed limit: intrachain diffusion times set by electrontransfer rates in denatured Ru(NH3)5(His33)Zncytochrome c. Proc. Natl. Acad. Sci. U.S.A. 100: 38383840.
Chan HS & Dill KA (1998). Protein folding in the landscape perspective: chevron plots and nonArrhenius kinetics. Proteins, 30: 233.
Chaudhry C, Horwich AL, Brunger AT & Adams PD (2004). Exploring the structural dynamics of the E. coli chaperonin GroEL using translationlibrationscrew crystallographic refinement of intermediate states. J. Mol. Biol. 342: 229245.
Chau P (2004). Water movement during ligand unbinding from receptor site. Biophys. J. 87: 121128.
Chelikani P, Carpena X, Fita I & Loewen PC (2003). An electrical potential in the access channel of catalases enhances catalysis. J. Biol. Chem. 278: 3129031296.
Chen X, Li N & Ellington AD (2007). Ribozyme catalysis of metabolism in the RNA world. Chem. Biodivers. 4: 633655.
Chica RA, Doucet N & Pelletier JN (2005). Semirational approaches to engineering enzyme activity: combining the benefits of directed evolution and rational design. Curr. Opin. Biotechnol. 16: 378384.
Chidley C, Mosiewicz K & Johnsson K (2008). A designed protein for the specific and covalent heteroconjugation of biomolecules. Bioconjugate Chem. 19: 17531756.
Chothia C, Levitt M & Richardson D (1977). Structure of proteins: packing of alphahelices and pleated sheets. Proc. Natl. Acad. Sci. U.S.A. 74: 41304134.
Chothia C & Lesk AM (1985). Helix movements in proteins. Trends Biochem. Sci. 10: 116118.
Chothia C & Lesk AM (1986). The relation between the divergence of sequence and structure in proteins. EMBO J. 5: 823826.
Chothia C (1992). Proteins. One thousand families for the molecular biologist. Nature, 357: 543544.
Chou KC (2000). Prediction of tight turns and their types in proteins. Anal. Biochem. 286: 116.
Chou PY & Fasman GD (1974). Conformational parameters for amino acids in helical, betasheet, and random coil regions calculated from proteins. Biochemistry, 13: 211222.
Chovancová E, Kosinski J, Bujnicki JM & Damborský J (2007). Phylogenetic analysis of haloalkane dehalogenases. Proteins, 67: 305316.
Choy W, Shortle D & Kay LE (2003). Side chain dynamics in unfolded protein states: an NMR based 2H spin relaxation study of delta131delta. J. Am. Chem. Soc. 125: 17481758.
155

References
Christen M, Hünenberger PH, Bakowies D, Baron R, Bürgi R, Geerke DP, Heinz TN, Kastenholz MA, Kräutler V, Oostenbrink C, Peter C, Trzesniak D & van Gunsteren WF (2005). The GROMOS software for biomolecular simulation: GROMOS05. J. Comput. Chem. 26: 17191751.
Chrobáková T, Sato Y, Prokop Z, Monincová M, Jesenská A, Nagata Y & Damborský J. Engineering of enantioselective haloalkane dehalogenase by cumulative mutagenesis. 5th Discussions in Structural Molecular Biology (Nové Hrady, Czech Republic), Mar 1618, 2006a.
Chrobáková T, Prokop Z, Sato Y, Monincová M, Jesenská A, Grodecká L, Senda T, Nagata Y & Damborský J. Engineering of haloalkane dehalogenase DhaA from Rhodococcus rhodochrous NCIMB 13064 towards higher enantioselectivity. Protein Design and Evolution for Biocatalysis (Greifswald, Germany), Aug 30 – Sep 01, 2006b.
Chroust K, Pavlová M, Prokop Z, Mendel J, Božková K, Kubát Z, Zajíčková V & Damborský J (2007). Quantitative structureactivity relationships for toxicity and genotoxicity of halogenated aliphatic compounds: wing spot test of Drosophila melanogaster. Chemosphere, 67: 152159.
Chruszcz M, Wlodawer A & Minor W (2008). Determination of protein structures – a series of fortunate events. Biophys. J. 95: 19.
Cieplak P, Cornell WD, Bayly C & Kollman PA (1995). Application of the multimolecule and multiconformational RESP methodology to biopolymers: charge derivation for DNA, RNA, and proteins. J. Comput. Chem. 16: 13571377.
Clark KP & Ajay (1995). Flexible ligand docking without parameter adjustment across four ligandreceptor complexes. J. Comput. Chem. 16: 12101226.
Clarke J & Fersht AR (1993). Engineered disulfide bonds as probes of the folding pathway of barnase: increasing the stability of proteins against the rate of denaturation. Biochemistry, 32: 43224329.
Claussen H, Buning C, Rarey M & Lengauer T (2001). FlexE: efficient molecular docking considering protein structure variations. J. Mol. Biol. 308: 377395.
Cochran DA, Penel S & Doig AJ (2001). Effect of the N1 residue on the stability of the alphahelix for all 20 amino acids. Protein Sci. 10: 463470.
Cochran DA & Doig AJ (2001). Effect of the N2 residue on the stability of the alphahelix for all 20 amino acids. Protein Sci. 10: 130513011.
Cochrane G, Akhtar R, Bonfield J, Bower L, Demiralp F, Faruque N, Gibson R, Hoad G, Hubbard T, Hunter C, Jang M, Juhos S, Leinonen R, Leonard S, Lin Q, Lopez R, Lorenc D, McWilliam H, Mukherjee G, Plaister S, Radhakrishnan R, Robinson S, Sobhany S, Hoopen PT, Vaughan R, Zalunin V & Birney E (2009). Petabytescale innovations at the European Nucleotide Archive. Nucleic Acids Res. 37, D1925.
Cohen FE, Richmond TJ & Richards FM (1979). Protein folding: evaluation of some simple rules for the assembly of helices into tertiary structures with myoglobin as an example. J. Mol. Biol. 132: 275288.
Cohen J, Arkhipov A, Braun RI & Schulten K (2006). Imaging the migration pathways for O2, CO, NO, and Xe inside myoglobin. Biophys. J. 91: 18441857.
Cojocaru V, Winn PJ & Wade RC (2007). The ins and outs of cytochrome P450s. Biochim. Biophys. Acta, 1770: 390401.
Cole C, Barber JD & Barton GJ (2008). The Jpred 3 secondary structure prediction server. Nucleic Acids Res. 36: W197201.
Coleman RG & Sharp KA (2009). Finding and characterizing tunnels in macromolecules with application to ion channels and pores. Biophys. J. 96: 632645.
Cooper A (1976). Thermodynamic fluctuations in protein molecules. Proc. Natl. Acad. Sci. U.S.A. 73: 27402741.
Copeland RA (2000a). 2. Chemical bonds and reactions in biochemistry. In Enzymes: a practical introduction to structure, mechanism, and data analysis (pp. 1141). John Wiley and Sons, New York, NY, USA.
Copeland RA (2000b). 4. Proteinligand binding equilibria. In Enzymes: a practical introduction to structure, mechanism, and data analysis (pp. 76108). John Wiley and Sons, New York, NY, USA.
156

References
Copeland RA (2000c). 5. Kinetics of singlesubstrate enzyme reactions. In Enzymes: a practical introduction to structure, mechanism, and data analysis (pp. 109145). John Wiley and Sons, New York, NY, USA.
Copeland RA (2000d). 6. Chemical mechanisms in enzyme catalysis. In Enzymes: a practical introduction to structure, mechanism, and data analysis (pp. 146187). John Wiley and Sons, New York, NY, USA.
Copeland RA (2000e). 8. Reversible inhibitors. In Enzymes: a practical introduction to structure, mechanism, and data analysis (pp. 266304). John Wiley and Sons, New York, NY, USA.
Copeland RA (2000f). 9. Tight binding inhibitors. In Enzymes: a practical introduction to structure, mechanism, and data analysis (pp. 305317). John Wiley and Sons, New York, NY, USA.
Copeland RA (2000g). 10. Timedependent inhibition. In Enzymes: a practical introduction to structure, mechanism, and data analysis (pp. 318349). John Wiley and Sons, New York, NY, USA.
Copeland RA (2000h). 12. Cooperativity in enzyme catalysis. In Enzymes: a practical introduction to structure, mechanism, and data analysis (pp. 367384). John Wiley and Sons, New York, NY, USA.
Cornell WD, Cieplak P, Bayly CI & Kollmann PA (1993). Application of RESP charges to calculate conformational energies, hydrogen bond energies, and free energies of solvation. J. Am. Chem. Soc. 115: 96209631.
Cornell WD, Cieplak P, Bayly CI, Gould IR, Merz KM, Ferguson DM, Spellmeyer DC, Fox T, Caldwell JW, & Kollman PA (1995). A second generation force field for the simulation of proteins, nucleic acids, and organic molecules. J. Am. Chem. Soc. 117: 51795197.
Cornell WD, Cieplak P, Bayly CI, Gould IR, Merz KM, Ferguson DM, Spellmeyer DC, Fox T, Caldwell JW & Kollman PA (1996). A second generation force field for the simulation of proteins, nucleic acids, and organic molecules J. Am. Chem. Soc. 1995, 117, 5179−5197. J. Am. Chem. Soc. 118: 2309.
Cornilescu G, Delaglio F & Bax A (1999). Protein backbone angle restraints from searching a database for chemical shift and sequence homology. J. Biomol. NMR, 13: 289302.
Cousin X, Hotelier T, Giles K, Toutant JP & Chatonnet A (1998). aCHEdb: the database system for ESTHER, the alpha/beta fold family of proteins and the Cholinesterase gene server. Nucleic Acids Res. 26: 226228.
Craik CS, Largman C, Fletcher T, Roczniak S, Barr PJ, Fletterick R & Rutter WJ (1985). Redesigning trypsin: alteration of substrate specificity. Science, 228: 291297.
Creamer TP & Rose GD (1992). Sidechain entropy opposes alphahelix formation but rationalizes experimentally determined helixforming propensities. Proc. Natl. Acad. Sci. U.S.A. 89: 59375941.
Crick FHC (1952). Is alphakeratin a coiled coil? Nature, 170: 882883.
Cuff AL, Sillitoe I, Lewis T, Redfern OC, Garratt R, Thornton J & Orengo CA (2009). The CATH classification revisitedarchitectures reviewed and new ways to characterize structural divergence in superfamilies. Nucleic Acids Res. 37, D310314.
Cui Q & Karplus M (2002). Quantum mechanical/molecular mechanical studies of the triosephosphate isomerasecatalyzed reaction: Verification of methodology and analysis of reaction mechanisms. J. Phys. Chem. B, 106: 17681798.
Cunningham BA, Hemperly JJ, Hopp TP & Edelman GM (1979). Favin versus concanavalin A: circularly permuted amino acid sequences. Proc. Natl. Acad. Sci. U.S.A. 76: 32183222.
Dalal S, Balasubramanian S & Regan L (1997). Protein alchemy: changing betasheet into alphahelix. Nat. Struct. Biol. 4: 548552.
Dalby PA (2003). Optimising enzyme function by directed evolution. Curr. Opin. Struct. Biol. 13: 500505.
Damborský J, Kutý M, Němec M & Koča J (1997). A molecular modelling study of the catalytic mechanism of haloalkane dehalogenase: 1. quantum chemical study of the first reaction step. J. Chem. Inf. Comput. Sci. 37: 562568.
157

References
Damborský J & Koča J (1999). Analysis of the reaction mechanism and substrate specificity of haloalkane dehalogenases by sequential and structural comparisons. Protein Eng. 12: 989998.
Damjanović A, GarcíaMoreno B, Lattman EE & García AE (2005). Molecular dynamics study of water penetration in staphylococcal nuclease. Proteins, 60: 433449.
Daniel RM, Dunn RV, Finney JL & Smith JC (2003). The role of dynamics in enzyme activity. Annu. Rev. Biophys. Biomol. Struct. 32: 6992.
Davies P (2001). The origin of life I: When and where did it begin? Sci. Prog. 84: 116.
Davis JH & Agard DA (1998). Relationship between enzyme specificity and the backbone dynamics of free and inhibited alphalytic protease. Biochemistry, 37: 76967707.
Deechongkit S, Nguyen H, Jager M, Powers ET, Gruebele M & Kelly JW (2006). Betasheet folding mechanisms from perturbation energetics. Curr. Opin. Struct. Biol. 16: 94101.
DeLano WL (2002) The PyMOL molecular graphics system. DeLano Scientific, Palo Alto, CA, USA.
Deléage G & Geourjon C (1993). An interactive graphic program for calculating the secondary structure content of proteins from circular dichroism spectrum. Comput. Appl. Biosci. 9: 197199.
Deléage G, Blanchet C & Geourjon C (1997). Protein structure prediction. Implications for the biologist. Biochimie, 79: 681686.
DeLucas LJ, Bray TL, Nagy L, McCombs D, Chernov N, Hamrick D, Cosenza L, Belgovskiy A, Stoops B & Chait A (2003). Efficient protein crystallization. J. Struct. Biol. 142: 188206.
DeLucas LJ, Hamrick D, Cosenza L, Nagy L, McCombs D, Bray T, Chait A, Stoops B, Belgovskiy A, Wilson WW, Parham M & Chernov N (2005). Protein crystallization: virtual screening and optimization. Prog. Biophys. Mol. Biol. 88: 285309.
Demchenko AP (2001). Recognition between flexible protein molecules: induced and assisted folding. J. Mol. Recognit. 14: 4261.
Deprez E, Gerber NC, Di Primo C, Douzou P, Sligar SG & Hui Bon Hoa G (1994). Electrostatic control of the substrate access channel in cytochrome P450cam. Biochemistry, 33: 1446414468.
Derewenda ZS (1994). Structure and function of lipases. Adv. Protein Chem. 45: 152.
Derewenda ZS, Lee L & Derewenda U (1995). The occurrence of CH...O hydrogen bonds in proteins. J. Mol. Biol. 252: 248262.
Derreumaux P & Schlick T (1998). The loop opening/closing motion of the enzyme triosephosphate isomerase. Biophys. J. 74: 7281.
DeviKesavan LS & Gao J (2003). Combined QM/MM study of the mechanism and kinetic isotope effect of the nucleophilic substitution reaction in haloalkane dehalogenase. J. Am. Chem. Soc. 125: 15321540.
Dewar MJS, Zoebisch EG, Healy EF & Stewart JJP (1985). Development and use of quantum mechanical molecular models. 76. AM1: a new general purpose quantum mechanical molecular model. J. Am. Chem. Soc. 107: 39023909.
Di Giulio M (1997). On the RNA world: evidence in favor of an early ribonucleopeptide world. J. Mol. Evol. 45: 571578.
Dill KA (1990). Dominant forces in protein folding. Biochemistry, 29: 71337155.
Dill KA & Chan HS (1997). From Levinthal to pathways to funnels. Nat. Struct. Biol. 4: 1019.
Di Primo C, Deprez E, Sligar SG & Hui Bon Hoa G (1997). Origin of the photoacoustic signal in cytochrome P450cam: role of the Arg186Asp251Lys178 bifurcated salt bridge. Biochemistry, 36: 112118.
Dobzhansky T (1964). Biology, molecular and organismic. Am. Zool. 4: 443452.
Doig AJ, MacArthur MW, Stapley BJ & Thornton JM (1997). Structures of Ntermini of helices in proteins. Protein Sci. 6: 147155.
158

References
Doolittle WF (1978). Genes in pieces: were they ever together? Nature, 272: 581582.
Doudna JA & Lorsch JR (2005). Ribozyme catalysis: not different, just worse. Nat. Struct. Mol. Biol. 12: 395402.
Dravis BC, LeJeune KE, Hetro AD & Russell AJ (2000). Enzymatic dehalogenation of gas phase substrates with haloalkane dehalogenase. Biotechnol. Bioeng. 69: 235241.
Dunbrack RL & Cohen FE (1997). Bayesian statistical analysis of protein sidechain rotamer preferences. Protein Sci. 6: 16611681.
Dundas J, Ouyang Z, Tseng J, Binkowski A, Turpaz Y & Liang J (2006). CASTp: computed atlas of surface topography of proteins with structural and topographical mapping of functionally annotated residues. Nucleic Acids Res. 34: W116118.
Dunn AR, Dmochowski IJ, Bilwes AM, Gray HB & Crane BR (2001). Probing the open state of cytochrome P450cam with rutheniumlinker substrates. Proc. Natl. Acad. Sci. U.S.A. 98: 1242012425.
Dworkin JP, Lazcano A & Miller SL (2003). The roads to and from the RNA world. J. Theor. Biol. 222: 127134.
Echols N, Milburn D & Gerstein M (2003). MolMovDB: analysis and visualization of conformational change and structural flexibility. Nucleic Acids Res. 31: 478482.
Edman P (1949). A method for the determination of amino acid sequence in peptides. Arch. Biochem. 22: 475.
Edman P (1950). Method for determination of the amino acid sequence in peptides. Acta Chem. Scand. 4: 283293.
Eijsink VGH, Bjørk A, Gåseidnes S, Sirevåg R, Synstad B, van den Burg B & Vriend G (2004). Rational engineering of enzyme stability. J. Biotechnol. 113: 105120.
Eijsink VGH, Gåseidnes S, Borchert TV & van den Burg B (2005). Directed evolution of enzyme stability. Biomol. Eng. 22: 2130.
Eisenberg D (2003). The discovery of the alphahelix and betasheet, the principal structural features of proteins. Proc. Natl. Acad. Sci. U.S.A. 100: 1120711210.
Eisenmesser EZ, Bosco DA, Akke M & Kern D (2002). Enzyme dynamics during catalysis. Science, 295: 15201523.
Eisenmesser EZ, Millet O, Labeikovsky W, Korzhnev DM, WolfWatz M, Bosco DA, Skalicky JJ, Kay LE & Kern D (2005). Intrinsic dynamics of an enzyme underlies catalysis. Nature, 438: 117121.
Elber R & Karplus M (1990). Enhanced sampling in molecular dynamics: use of the timedependent Hartree approximation for a simulation of carbon monoxide diffusion through myoglobin. J. Am. Chem. Soc. 112, 91619175.
Elcock AH, Huber GA & McCammon JA (1997). Electrostatic channeling of substrates between enzyme active sites: comparison of simulation and experiment. Biochemistry, 36: 1604916058.
Englander SW & Kallenbach NR (1983). Hydrogen exchange and structural dynamics of proteins and nucleic acids. Q. Rev. Biophys. 16: 521655.
Enyedy I, Kovach I & Brooks B (1998). Alternate pathways for acetic acid and acetate ion release from acetylcholinesterase: a molecular dynamics study. J. Am. Chem. Soc. 120: 80438050.
Erable B, Goubet I, Lamare S, Legoy MD & Maugard T (2004). Haloalkane hydrolysis by Rhodococcus erythropolis cells: comparison of conventional aqueous phase dehalogenation and nonconventional gas phase dehalogenation. Biotechnol. Bioeng. 86: 4754.
Erable B, Goubet I, Lamare S, Seltana A, Legoy MD & Maugard T (2005). Nonconventional hydrolytic dehalogenation of 1chlorobutane by dehydrated bacteria in a continuous solidgas biofilter. Biotechnol. Bioeng., 91: 304313.
Erable B, Goubet I, Lamare S, Legoy M & Maugard T (2006). Bioremediation of halogenated compounds: comparison of dehalogenating bacteria and improvement of catalyst stability. Chemosphere, 65: 11461152.
Ewing TJ, Makino S, Skillman AG & Kuntz ID (2001). DOCK 4.0: search strategies for automated molecular docking of flexible molecule databases. J. Comput. Aided Mol. Des. 15, 411428.
159

References
Fabiola GF, Krishnaswamy S, Nagarajan V & Pattabhi V (1997). CH...O hydrogen bonds in betasheets. Acta Crystallogr., Sect. D: Biol. Crystallogr. 53, 316320.
Fedorov R, Vasan R, Ghosh DK & Schlichting I (2004). Structures of nitric oxide synthase isoforms complexed with the inhibitor ARR17477 suggest a rational basis for specificity and inhibitor design. Proc. Natl. Acad. Sci. U.S.A. 101: 58925897.
Feingersch R, Shainsky J, Wood TK & Fishman A (2008). Protein engineering of toluene monooxygenases for synthesis of chiral sulfoxides. Appl. Environ. Microbiol. 74, 15551566.
Ferguson JK & Roughton FJ (1934). The direct chemical estimation of carbamino compounds of CO(2) with haemoglobin. J. Physiol. 83, 6886.
Ferreira Jorge RM & Livingston AG (1999). A novel method for characterisation of microbial growth kinetics on volatile organic compounds. Appl. Microbiol. Biotechnol. 52, 174178.
Fiaux J, Bertelsen EB, Horwich AL & Wüthrich K (2002). NMR analysis of a 900K GroEL GroES complex. Nature, 418: 207211.
Fischer E (1894). Einfluss der Configuration auf die Wirkung der Enzyme. Ber. Deut. Chem. Ges. 27, 29852993.
Fischetti RF, Rodi DJ, Gore DB & Makowski L (2004). Wideangle Xray solution scattering as a probe of ligandinduced conformational changes in proteins. Chem. Biol. 11: 14311443.
Fishman A, Tao Y, Bentley WE & Wood TK (2004). Protein engineering of toluene 4monooxygenase of Pseudomonas mendocina KR1 for synthesizing 4nitrocatechol from nitrobenzene. Biotechnol. Bioeng. 87: 779790.
Fitzkee NC, Fleming PJ & Rose GD (2005a). The Protein Coil Library: a structural database of nonhelix, nonstrand fragments derived from the PDB. Proteins, 58: 852854.
Fitzkee NC, Fleming PJ, Gong H, Panasik N, Street TO & Rose GD (2005b). Are proteins made from a limited parts list? Trends Biochem. Sci. 30, 7380.
Fleming PJ, Fitzkee NC, Mezei M, Srinivasan R & Rose GD (2005). A novel method reveals that solvent water favors polyproline II over betastrand conformation in peptides and unfolded proteins: conditional hydrophobic accessible surface area (CHASA). Protein Sci. 14: 111118.
Flores S, Echols N, Milburn D, Hespenheide B, Keating K, Lu J, Wells S, Yu EZ, Thorpe M & Gerstein M (2006). The database of macromolecular motions: new features added at the decade mark. Nucleic Acids Res. 34, D296301.
Fodje MN & AlKaradaghi S (2002). Occurrence, conformational features and amino acid propensities for the pihelix. Protein Eng. 15: 353358.
Foster MP, McElroy CA & Amero CD. (2007). Solution NMR of large molecules and assemblies. Biochemistry, 46: 331340.
Fox RJ, Davis SC, Mundorff EC, Newman LM, Gavrilovic V, Ma SK, Chung LM, Ching C, Tam S, Muley S, Grate J, Gruber J, Whitman JC, Sheldon RA & Huisman GW (2007). Improving catalytic function by ProSARdriven enzyme evolution. Nat. Biotechnol. 25: 338344.
Franken SM, Rozeboom HJ, Kalk KH & Dijkstra BW (1991). Crystal structure of haloalkane dehalogenase: an enzyme to detoxify halogenated alkanes. EMBO J. 10: 12971302.
Frauenfelder H, McMahon BH, Austin RH, Chu K & Groves JT (2001). The role of structure, energy landscape, dynamics, and allostery in the enzymatic function of myoglobin. Proc. Natl. Acad. Sci. U.S.A. 98: 23702374.
Frauenfelder H, Petsko GA & Tsernoglou D (1979). Temperaturedependent Xray diffraction as a probe of protein structural dynamics. Nature, 280: 558563.
Frauenfelder H, Sligar SG & Wolynes PG (1991). The energy landscapes and motions of proteins. Science, 254: 15981603.
Freddolino PL, Arkhipov AS, Larson SB, McPherson A & Schulten K (2006). Molecular dynamics simulations of the complete satellite tobacco mosaic virus. Structure, 14, 437449.
160

References
Freitas dos Santos LM & Livingston AG (1994). Extraction and biodegradation of a toxic volatile organic compound (1,2dichloroethane) from wastewater in a membrane bioreactor. Appl. Microbiol. Biotechnol. 42: 421431.
Friedberg I & Margalit H (2002). Persistently conserved positions in structurally similar, sequence dissimilar proteins: roles in preserving protein fold and function. Protein Sci. 11: 350360.
Frisch MJ, Trucks GW, Schlegel HB, Gill PMW, Johnson BJ, Robb MA, Cheeseman JR, Keith T, Petersson GA, Montgomery JA, Raghavachari K, AlLaham MA, Zakrzewski VG, Ortiz JV, Foresman JB, Cioslowski J, Stefanov BB, Nanayakkara A, Challacombe M, Peng CY, Ayala PY, Chen W, Wong MW, Andres JL, Replogle ES, Gomperts R, Martin RL, Fox DJ, Binkley JS, Defrees DJ, Baker J, Stewart JP, HeadGordon M, Gonzalez C & Pople JA (1994) Gaussian 94 (Revision D4). Gaussian, Inc., Pittsburg, PA, USA.
Frishman D & Argos P (1995). Knowledgebased protein secondary structure assignment. Proteins, 23: 566579.
Fuentes EJ, Der CJ & Lee AL (2004). Liganddependent dynamics and intramolecular signaling in a PDZ domain. J. Mol. Biol. 335: 11051115.
Gabb HA, Jackson RM & Sternberg MJ (1997). Modelling protein docking using shape complementarity, electrostatics and biochemical information. J. Mol. Biol. 272: 106120.
Gaboriaud C, Bissery V, Benchetrit T & Mornon JP (1987). Hydrophobic cluster analysis: an efficient new way to compare and analyse amino acid sequences. FEBS Lett. 224: 149155.
Gao J (2003). Catalysis by enzyme conformational change as illustrated by orotidine 5'monophosphate decarboxylase. Curr. Opin. Struct. Biol. 13: 184192.
GarciaViloca M, Gao J, Karplus M & Truhlar DG (2004). How enzymes work: analysis by modern rate theory and computer simulations. Science, 303, 186195.
Garrett DS, Seok YJ, Peterkofsky A, Gronenborn AM & Clore GM (1999). Solution structure of the 40,000 Mr phosphoryl transfer complex between the Nterminal domain of enzyme I and HPr. Nat. Struct. Biol. 6, 166173.
Genberg L, Richard L, McLendon G & Miller RJ (1991). Direct observation of global protein motion in hemoglobin and myoglobin on picosecond time scales. Science, 251: 10511054.
Gerstein M, Lesk AM & Chothia C (1994). Structural mechanisms for domain movements in proteins. Biochemistry, 33: 67396749.
Gerstein M & Krebs W (1998). A database of macromolecular motions. Nucleic Acids Res. 26, 42804290.
Gibbs MD, Nevalainen KM & Bergquist PL (2001). Degenerate oligonucleotide gene shuffling (DOGS): a method for enhancing the frequency of recombination with family shuffling. Gene, 271, 1320.
Gibrat JF, Madej T & Bryant SH (1996). Surprising similarities in structure comparison. Curr. Opin. Struct. Biol. 6, 377385.
Gilbert W, de Souza SJ & Long M (1997). Origin of genes. Proc. Natl. Acad. Sci. U.S.A. 94: 76987703.
Gilbert W (1986). Origin of life: The RNA world. Nature, 319: 618.
Gohlke H & Klebe G (2002). Approaches to the description and prediction of the binding affinity of smallmolecule ligands to macromolecular receptors. Angew. Chem. Int. Ed. 41: 26442676.
Gohlke RS & McLafferty FW (1993). Early gas chromatography/mass spectrometry. J. Am. Soc. Mass Spectrom. 4: 367371.
Goldenberg DP (1989). Circularly permuted proteins. Protein Eng. 2: 493495.
Gong H, Fleming PJ & Rose GD (2005). Building native protein conformation from highly approximate backbone torsion angles. Proc. Natl. Acadd. Sci. U.S.A. 102: 1622716232.
Goodsell DS & Olson AJ (1990). Automated docking of substrates to proteins by simulated annealing. Proteins, 8: 195202.
161

References
Gough J, Karplus K, Hughey R & Chothia C (2001). Assignment of homology to genome sequences using a library of hidden Markov models that represent all proteins of known structure. J. Mol. Biol. 313: 903919.
Govindarajan S, Recabarren R & Goldstein RA (1999). Estimating the total number of protein folds. Proteins, 35: 408414.
Gray K, Richardson T, Kretz K, Short J, Bartnek F, Knowles R, Kan L, Swanson P & Robertson D (2001). Rapid evolution of reversible denaturation and elevated melting temperature in a microbial haloalkane dehalogenase. Adv. Synth. Catal. 343: 607617.
Green RD (1974). Hydrogen Bonding by CH Groups. Macmillan, London, England.
Gribble GW (2003). The diversity of naturally produced organohalogens. Chemosphere, 52: 289297.
Gribble GW (2004). Natural organohalogens. Euro Chlor (http://www.eurochlor.org/).
Grishin NV (2001). Fold change in evolution of protein structures. J. Struct. Biol. 134, 167185.
GuerrierTakada C, Gardiner K, Marsh T, Pace N & Altman S (1983). The RNA moiety of ribonuclease P is the catalytic subunit of the enzyme. Cell, 35: 849857.
Gunasekaran K, Ramakrishnan C & Balaram P (1996). Disallowed ramachandran conformations of amino acid residues in protein structures. J. Mol. Biol. 264, 191198.
Gunasekaran K, Nagarajaram HA, Ramakrishnan C & Balaram P (1998). Stereochemical punctuation marks in protein structures: glycine and proline containing helix stop signals. J. Mol. Biol. 275: 917932.
Güntert P (2009). Automated structure determination from NMR spectra. Eur. Biophys. J. 38: 129143.
Gupta A, Van Vlijmen HWT & Singh J (2004). A classification of disulfide patterns and its relationship to protein structure and function. Protein Sci. 13: 20452058.
Hagen SJ, Hofrichter J, Szabo A & Eaton WA (1996). Diffusionlimited contact formation in unfolded cytochrome c: estimating the maximum rate of protein folding. Proc. Natl. Acad. Sci. U.S.A. 93: 1161511617.
Halder M, Mukherjee P, Bose S, Hargrove MS, Song X & Petrich JW (2007). Solvation dynamics in protein environments: comparison of fluorescence upconversion measurements of coumarin 153 in monomeric hemeproteins with molecular dynamics simulations. J. Chem. Phys. 127: 055101/1 055101/6.
Halperin I, Ma B, Wolfson H & Nussinov R (2002). Principles of docking: An overview of search algorithms and a guide to scoring functions. Proteins, 47: 409443.
HammesSchiffer S (2002). Impact of enzyme motion on activity. Biochemistry, 41: 1333513343.
HammesSchiffer S & Benkovic SJ (2006). Relating protein motion to catalysis. Annu. Rev. Biochem. 75: 519541.
Hart TN & Read RJ (1992). A multiplestart Monte Carlo docking method. Proteins, 13: 206222.
Hayes RJ, Bentzien J, Ary ML, Hwang MY, Jacinto JM, Vielmetter J, Kundu A & Dahiyat BI (2002). Combining computational and experimental screening for rapid optimization of protein properties. Proc. Natl. Acad. Sci. U.S.A. 99: 1592615931.
HeadGordon T, HeadGordon M, Frisch MJ, Brooks III CL & Pople JA (1991). Theoretical study of blocked glycine and alanine peptide analogs. J. Am. Chem. Soc. 113: 59895997.
Hegyi H & Gerstein M (1999). The relationship between protein structure and function: a comprehensive survey with application to the yeast genome. J. Mol. Biol. 288: 147164.
Heikinheimo P, Goldman A, Jeffries C & Ollis DL (1999). Of barn owls and bankers: a lush variety of alpha/beta hydrolases. Structure 7: R141146.
Helms V (2007). Protein dynamics tightly connected to the dynamics of surrounding and internal water molecules. Chemphyschem, 8: 2333.
162

References
Henchman RH, Tai K, Shen T & McCammon JA (2002). Properties of water molecules in the active site gorge of acetylcholinesterase from computer simulation. Biophys. J. 82: 26712682.
Henderson R (1970). Structure of crystalline alphachymotrypsin. IV. The structure of indoleacryloylalphachyotrypsin and its relevance to the hydrolytic mechanism of the enzyme. J. Mol. Biol. 54: 341354.
Henderson R, Baldwin JM, Ceska TA, Zemlin F, Beckmann E & Downing KH (1990). Model for the structure of bacteriorhodopsin based on highresolution electron cryomicroscopy. J. Mol. Biol. 213: 899929.
Henderson R & Unwin PN (1975). Threedimensional model of purple membrane obtained by electron microscopy. Nature, 257: 2832.
Henri V (1903). L ois Generales de l’action des diastases. Hermann, Paris, France.
Henry AA & Romesberg FE (2005). The evolution of DNA polymerases with novel activities. Curr. Opin. Biotechnol. 16, 370377.
HenzlerWildman KA, Thai V, Lei M, Ott M, WolfWatz M, Fenn T, Pozharski E, Wilson MA, Petsko GA, Karplus M, Hübner C G & Kern D (2007a). Intrinsic motions along an enzymatic reaction trajectory. Nature, 450: 838844.
HenzlerWildman KA, Lei M, Thai V, Kerns SJ, Karplus M & Kern D (2007b). A hierarchy of timescales in protein dynamics is linked to enzyme catalysis. Nature, 450: 913916.
Hite RK, Raunser S & Walz T (2007). Revival of electron crystallography. Curr. Opin. Struct. Biol. 17: 389395.
Hoang TX, Trovato A, Seno F, Banavar JR & Maritan A (2004). Geometry and symmetry presculpt the freeenergy landscape of proteins. Proc. Natl. Acad. Sci. U.S.A. 101: 79607964.
Holloway P, Knoke KL, Trevors JT & Lee H (1998). Alteration of the substrate range of haloalkane dehalogenase by sitedirected mutagenesis. Biotechnol. Bioeng. 59: 520523.
Holmes J & Morrell F (1957). Oscillographic mass spectrometric monitoring of gas chromatography. Appl. Spectrosc. 11: 8687.
Holmquist M (2000). Alpha/Betahydrolase fold enzymes: structures, functions and mechanisms. Curr. Protein Pept. Sci. 1: 20935.
Hol WG, van Duijnen PT & Berendsen HJ (1978). The alphahelix dipole and the properties of proteins. Nature, 273: 443446.
Honour JW (2006). Gas chromatographymass spectrometry. Methods Mol. Biol. 324: 5374.
Hou T, Wang J, Chen L & Xu X (1999). Automated docking of peptides and proteins by using a genetic algorithm combined with a tabu search. Protein Eng. 12: 639648.
Howard EI, Sanishvili R, Cachau RE, Mitschler A, Chevrier B, Barth P, Lamour V, Van Zandt M, Sibley E, Bon C, Moras D, Schneider TR, Joachimiak A & Podjarny A (2004). Ultrahigh resolution drug design I: details of interactions in human aldose reductaseinhibitor complex at 0.66 Å. Proteins, 55: 792804.
Hritz J, Zoldák G & Sedlák E (2006). Cofactor assisted gating mechanism in the active site of NADH oxidase from Thermus thermophilus. Proteins, 64: 465476.
Hsing M & Cherkasov A (2008). Indel PDB: a database of structural insertions and deletions derived from sequence alignments of closely related proteins. BMC Bioinf. 9: 293.
Huang X, Yang X, Luft BJ & Koide S (1998). NMR identification of epitopes of Lyme disease antigen OspA to monoclonal antibodies. J. Mol. Biol. 281: 6167.
Hubbard TJ, Ailey B, Brenner SE, Murzin AG & Chothia C (1998). SCOP, Structural Classification of Proteins database: applications to evaluation of the effectiveness of sequence alignment methods and statistics of protein structural data. Acta Crystallogr., Sect. D: Biol. Crystallogr. 54: 11471154.
Humphrey W, Dalke A & Schulten K (1996). VMD: visual molecular dynamics. J. Mol. Graphics, 14: 3338.
163
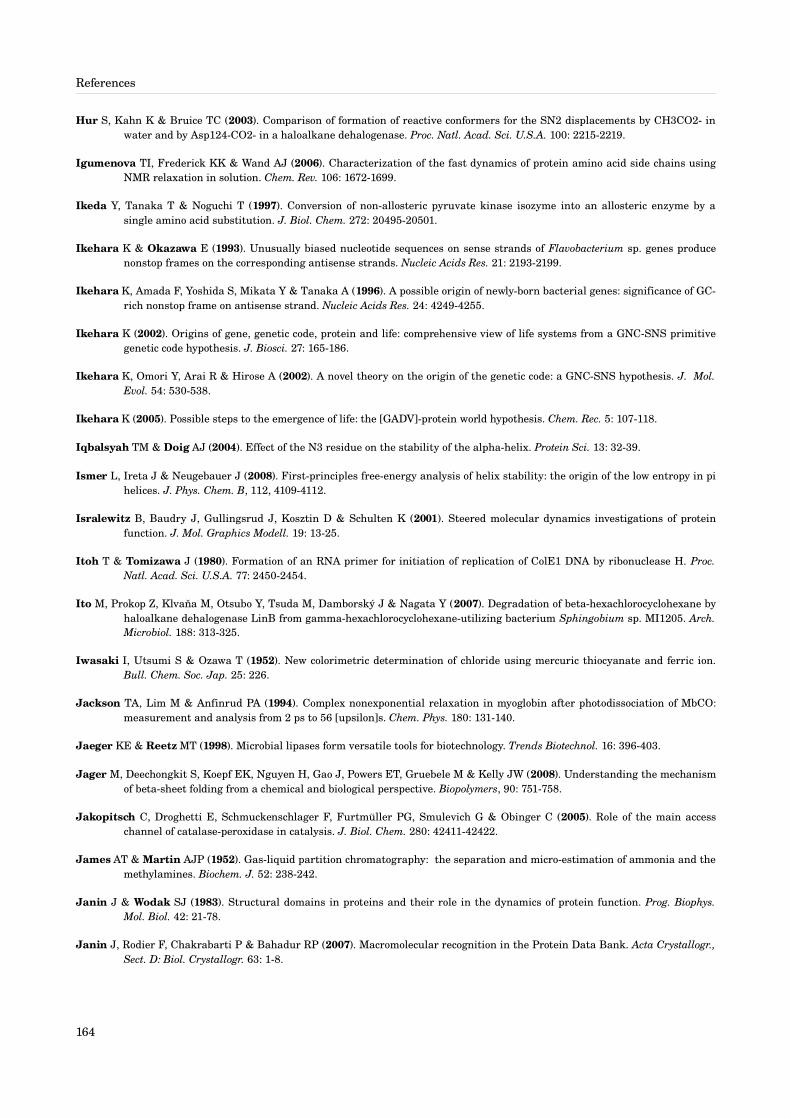
References
Hur S, Kahn K & Bruice TC (2003). Comparison of formation of reactive conformers for the SN2 displacements by CH3CO2 in water and by Asp124CO2 in a haloalkane dehalogenase. Proc. Natl. Acad. Sci. U.S.A. 100: 22152219.
Igumenova TI, Frederick KK & Wand AJ (2006). Characterization of the fast dynamics of protein amino acid side chains using NMR relaxation in solution. Chem. Rev. 106: 16721699.
Ikeda Y, Tanaka T & Noguchi T (1997). Conversion of nonallosteric pyruvate kinase isozyme into an allosteric enzyme by a single amino acid substitution. J. Biol. Chem. 272: 2049520501.
Ikehara K & Okazawa E (1993). Unusually biased nucleotide sequences on sense strands of Flavobacterium sp. genes produce nonstop frames on the corresponding antisense strands. Nucleic Acids Res. 21: 21932199.
Ikehara K, Amada F, Yoshida S, Mikata Y & Tanaka A (1996). A possible origin of newlyborn bacterial genes: significance of GCrich nonstop frame on antisense strand. Nucleic Acids Res. 24: 42494255.
Ikehara K (2002). Origins of gene, genetic code, protein and life: comprehensive view of life systems from a GNCSNS primitive genetic code hypothesis. J. Biosci. 27: 165186.
Ikehara K, Omori Y, Arai R & Hirose A (2002). A novel theory on the origin of the genetic code: a GNCSNS hypothesis. J. Mol. Evol. 54: 530538.
Ikehara K (2005). Possible steps to the emergence of life: the [GADV]protein world hypothesis. Chem. Rec. 5: 107118.
Iqbalsyah TM & Doig AJ (2004). Effect of the N3 residue on the stability of the alphahelix. Protein Sci. 13: 3239.
Ismer L, Ireta J & Neugebauer J (2008). Firstprinciples freeenergy analysis of helix stability: the origin of the low entropy in pi helices. J. Phys. Chem. B, 112, 41094112.
Isralewitz B, Baudry J, Gullingsrud J, Kosztin D & Schulten K (2001). Steered molecular dynamics investigations of protein function. J. Mol. Graphics Modell. 19: 1325.
Itoh T & Tomizawa J (1980). Formation of an RNA primer for initiation of replication of ColE1 DNA by ribonuclease H. Proc. Natl. Acad. Sci. U.S.A. 77: 24502454.
Ito M, Prokop Z, Klvaňa M, Otsubo Y, Tsuda M, Damborský J & Nagata Y (2007). Degradation of betahexachlorocyclohexane by haloalkane dehalogenase LinB from gammahexachlorocyclohexaneutilizing bacterium Sphingobium sp. MI1205. Arch. Microbiol. 188: 313325.
Iwasaki I, Utsumi S & Ozawa T (1952). New colorimetric determination of chloride using mercuric thiocyanate and ferric ion. Bull. Chem. Soc. Jap. 25: 226.
Jackson TA, Lim M & Anfinrud PA (1994). Complex nonexponential relaxation in myoglobin after photodissociation of MbCO: measurement and analysis from 2 ps to 56 [upsilon]s. Chem. Phys. 180: 131140.
Jaeger KE & Reetz MT (1998). Microbial lipases form versatile tools for biotechnology. Trends Biotechnol. 16: 396403.
Jager M, Deechongkit S, Koepf EK, Nguyen H, Gao J, Powers ET, Gruebele M & Kelly JW (2008). Understanding the mechanism of betasheet folding from a chemical and biological perspective. Biopolymers, 90: 751758.
Jakopitsch C, Droghetti E, Schmuckenschlager F, Furtmüller PG, Smulevich G & Obinger C (2005). Role of the main access channel of catalaseperoxidase in catalysis. J. Biol. Chem. 280: 4241142422.
James AT & Martin AJP (1952). Gasliquid partition chromatography: the separation and microestimation of ammonia and the methylamines. Biochem. J. 52: 238242.
Janin J & Wodak SJ (1983). Structural domains in proteins and their role in the dynamics of protein function. Prog. Biophys. Mol. Biol. 42: 2178.
Janin J, Rodier F, Chakrabarti P & Bahadur RP (2007). Macromolecular recognition in the Protein Data Bank. Acta Crystallogr., Sect. D: Biol. Crystallogr. 63: 18.
164
References
Janssen DB, Scheper A & Witholt B (1984). Biodegradation of 2chloroethanol and 1,2dichloroethane by pure bacterial cultures. Prog. Ind. Microbiol. 20: 169178.
Janssen DB, Scheper A, Dijkhuizen L & Witholt B (1985). Degradation of halogenated aliphatic compounds by Xanthobacter autotrophicus GJ10. Appl. Environ. Microbiol. 49: 673677.
Janssen DB, Keuning S & Witholt B (1987). Involvement of a Quinoprotein Alcohol Dehydrogenase and an NADdependent Aldehyde Dehydrogenase in 2Chloroethanol Metabolism in Xanthobacter autotrophicus GJ10. J. Gen. Microbiol. 133: 8592.
Janssen DB, Gerritse J, Brackman J, Kalk C, Jager D & Witholt B (1988). Purification and characterization of a bacterial dehalogenase with activity toward halogenated alkanes, alcohols and ethers. Eur. J. Biochem. 171: 6772.
Janssen DB, van der Ploeg JR & Pries F (1995). Genetic adaptation of bacteria to halogenated aliphatic compounds. Environ. Health Perspect. 103 Suppl 5, 2932.
Janssen DB (2004). Evolving haloalkane dehalogenases. Curr. Opin. Chem. Biol. 8, 150159.
Janssen DB, Dinkla IJT, Poelarends GJ & Terpstra P (2005). Bacterial degradation of xenobiotic compounds: evolution and distribution of novel enzyme activities. Environ. Microbiol. 7: 18681882.
Jarymowycz VA & Stone MJ (2006). Fast time scale dynamics of protein backbones: NMR relaxation methods, applications, and functional consequences. Chem. Rev. 106: 16241671.
Jasanoff A & Fersht AR (1994). Quantitative determination of helical propensities from trifluoroethanol titration curves. Biochemistry, 33: 21292135.
Jeffares DC, Poole AM & Penny D (1998). Relics from the RNA world. J. Mol. Evol. 46: 1836.
Jeffrey GA & Maluszynska H (1982). A survey of hydrogen bond geometries in the crystal structures of amino acids. Int. J. Biol. Macromol. 4: 173185.
Jensen F (2006). 3. Electronic structure methods: independentparticle models. In Introduction to computational chemistry (pp. 80132). John Wiley and Sons, Chichester, England.
Jesenská A, Sedláček I & Damborský J (2000). Dehalogenation of haloalkanes by Mycobacterium tuberculosis H37Rv and other mycobacteria. Appl. Environ. Microbiol. 66: 219222.
Jesenská A, Bartoš M, Czerneková V, Rychlík I, Pavlík I & Damborský J (2002). Cloning and expression of the haloalkane dehalogenase gene dhmA from Mycobacterium avium N85 and preliminary characterization of DhmA. Appl. Environ. Microbiol. 68: 37243730.
Jesenská A, Pavlová M, Strouhal M, Chaloupková R, Tešínská I, Monincová M, Prokop Z, Bartoš M, Pavlík I, Rychlík I, Möbius P, Nagata Y & Damborsky J (2005). Cloning, biochemical properties, and distribution of mycobacterial haloalkane dehalogenases. Appl. Environ. Microbiol. 71: 67366745.
Jesenská A, Monincová M, Koudeláková T, Hasan K, Chaloupková R, Prokop Z, Geerlof A & Damborský J (2009). Biochemical characterization of haloalkane dehalogenases DrbA and DmbC, representatives of a novel subfamily. Appl. Environ. Microbiol. 75: 51575160.
Jiang F & Kim SH (1991). "Soft docking": matching of molecular surface cubes. J. Mol. Biol. 219: 79102.
Jimenez R, Fleming GR, Kumar PV & Maroncelli M (1994). Femtosecond solvation dynamics of water. Nature, 369: 471473.
JiménezSánchez A (1995). On the origin and evolution of the genetic code. J. Mol. Evol. 41: 712716.
Johnston WK, Unrau PJ, Lawrence MS, Glasner ME & Bartel DP (2001). RNAcatalyzed RNA polymerization: accurate and general RNAtemplated primer extension. Science, 292: 13191325.
Jones DT (1999). Protein secondary structure prediction based on positionspecific scoring matrices. J. Mol. Biol. 292: 195202.
165

References
Jones DT (2003). Structural biology. Learning to speak the language of proteins. Science, 302: 13471348.
Jones G, Willett P, Glen RC, Leach AR & Taylor R (1997). Development and validation of a genetic algorithm for flexible docking. J. Mol. Biol. 267: 727748.
Jorgensen WL, Chandrasekhar J, Madura JD, Impey RW & Klein ML (1983). Comparison of simple potential functions for simulating liquid water. J. Chem. Phys. 79: 926935.
Jorgensen WL & TiradoRives J (1988). The OPLS [optimized potentials for liquid simulations] potential functions for proteins, energy minimizations for crystals of cyclic peptides and crambin. J. Am. Chem. Soc. 110: 16571666.
Jorgensen WL, Maxwell DS & TiradoRives J (1996). Development and testing of the OPLS allatom force field on conformational energetics and properties of organic liquids. J. Am. Chem. Soc. 118: 1122511236.
Kabsch W & Sander C (1983). Dictionary of protein secondary structure: pattern recognition of hydrogenbonded and geometrical features. Biopolymers, 22: 25772637.
Kane JF & Hartley DL (1988). Formation of recombinant protein inclusion bodies in Escherichia coli. Trends Biotechnol. 6: 95101.
Karplus M (1959). Contact electronspin coupling of nuclear magnetic moments. J. Chem. Phys. 30: 1115.
Karplus M (1963). Vicinal proton coupling in nuclear magnetic resonance. J. Am. Chem. Soc. 85: 28702871.
Karplus M & McCammon JA (1981). The internal dynamics of globular proteins. CRC Crit. Rev. Biochem. 9: 293349.
Karplus M & McCammon JA (1983). Dynamics of proteins: elements and function. Annu. Rev. Biochem. 52: 263300.
Karplus M (2000). Aspects of protein reaction dynamics: deviations from simple behavior. J. Phys. Chem. B, 104: 1127.
Karplus M & Kuriyan J (2005). Molecular dynamics and protein function. Proc. Natl. Acad. Sci. U.S.A. 102: 66796685.
Karush F (1950). Heterogeneity of the binding sites of bovine serum albumin. J. Am. Chem. Soc. 72: 27052713.
Kay LE, Muhandiram DR, Wolf G, Shoelson SE & FormanKay JD (1998). Correlation between binding and dynamics at SH2 domain interfaces. Nat. Struct. Biol. 5: 156163.
Kay LE (2005). NMR studies of protein structure and dynamics. J. Magn. Reson. 173: 193207.
Keefe AD & Miller SL (1995). Are polyphosphates or phosphate esters prebiotic reagents? J. Mol. Evol. 41: 693702.
Kelley LA & Sternberg MJE (2009). Protein structure prediction on the Web: a case study using the Phyre server. Nat. Protoc. 4: 363371.
Kelly SM, Jess TJ & Price NC (2005). How to study proteins by circular dichroism. Biochim. Biophys. Acta, 1751: 119139.
Kendrew JC, Bodo G, Dintzis HM, Parrish RG, Wyckoff H & Phillips DC (1958). A threedimensional model of the myoglobin molecule obtained by Xray analysis. Nature, 181: 662666.
Kendrew JC, Dickerson RE, Strandberg BE, Hart RG, Davies DR, Phillips DC & Shore VC (1960). Structure of myoglobin: a threedimensional Fourier synthesis at 2 A. resolution. Nature, 185: 422427.
Kendrew JC (1962). Myoglobin and the structure of proteins. In Nobel Lectures Chemistry 19421962 (pp. 676698). Elsevier Publishing Co. (1964), Amsterdam, The Netherlands.
Kennes C, Pries F, Krooshof GH, Bokma E, Kingma J & Janssen DB (1995). Replacement of tryptophan residues in haloalkane dehalogenase reduces halide binding and catalytic activity. Eur. J. Biochem. 228: 403407.
Kent SBH (2009). Total chemical synthesis of proteins. Chem. Soc. Rev. 38: 338351.
Keuning S, Janssen DB & Witholt B (1985). Purification and characterization of hydrolytic haloalkane dehalogenase from Xanthobacter autotrophicus GJ10. J. Bacteriol. 163: 635639.
166

References
Khajehpour M, Rietveld I, Vinogradov S, Prabhu NV, Sharp KA & Vanderkooi JM (2003). Accessibility of oxygen with respect to the heme pocket in horseradish peroxidase. Proteins, 53: 656666.
Kimura Y, Vassylyev DG, Miyazawa A, Kidera A, Matsushima M, Mitsuoka K, Murata K, Hirai T & Fujiyoshi Y (1997). Surface of bacteriorhodopsin revealed by highresolution electron crystallography. Nature, 389: 206211.
King SM & Johnson WC (1999). Assigning secondary structure from protein coordinate data. Proteins, 35: 313320.
Kitao A & Go N (1999). Investigating protein dynamics in collective coordinate space. Curr. Opin. Struct. Biol. 9: 164169.
Kleywegt GJ (1999). Recognition of spatial motifs in protein structures. J. Mol. Biol. 285: 18871897.
Kleywegt GJ & Jones TA (1994). Detection, delineation, measurement and display of cavities in macromolecular structures. Acta Crystallogr., Sect. D: Biol. Crystallogr. 50: 178185.
Kmuníček J, Luengo S, Gago F, Ortiz AR, Wade RC & Damborský J (2001). Comparative binding energy analysis of the substrate specificity of haloalkane dehalogenase from Xanthobacter autotrophicus GJ10. Biochemistry, 40: 89058917.
Kmuníček J, Boháč M, Luengo S, Gago F, Wade RC & Damborský J (2003). Comparative binding energy analysis of haloalkane dehalogenase substrates: modelling of enzymesubstrate complexes by molecular docking and quantum mechanical calculations. J. Comput. Aided Mol. Design, 17: 299311.
Kmuníček J, Hynková K, Jedlička T, Nagata Y, Negri A, Gago F, Wade RC & Damborský J (2005). Quantitative analysis of substrate specificity of haloalkane dehalogenase LinB from Sphingomonas paucimobilis UT26. Biochemistry, 44: 33903401.
Knight RD & Landweber LF (1998). Rhyme or reason: RNAarginine interactions and the genetic code. Chem. Biol. 5: R215220.
Kobe B, Guncar G, Buchholz R, Huber T, Maco B, Cowieson N, Martin JL, Marfori M & Forwood JK (2008). Crystallography and proteinprotein interactions: biological interfaces and crystal contacts. Biochem. Soc. Trans. 36: 14381441.
Koehl P & Levitt M (1999). Structurebased conformational preferences of amino acids. Proc. Natl. Acad. Sci. U.S.A. 96: 1252412529.
Kohen A, Cannio R, Bartolucci S & Klinman JP (1999). Enzyme dynamics and hydrogen tunnelling in a thermophilic alcohol dehydrogenase. Nature, 399: 496499.
Kolodziej AF, Tan T & Koshland Jr. DE (1996). Producing positive, negative, and no cooperativity by mutations at a single residue located at the subunit interface in the aspartate receptor of Salmonella typhimurium. Biochemistry, 35: 1478214792.
Koshland Jr. DE (1958). Application of a theory of enzyme specificity to protein synthesis. Proc. Natl. Acad. Sci. U.S.A. 44: 98104.
Koshland Jr. DE, Némethy G & Filmer D (1966). Comparison of experimental binding data and theoretical models in proteins containing subunits. Biochemistry, 5: 365385.
Koshland Jr. DE (1976). Role of flexibility in the specificity, control and evolutiion of enzymes. FEBS Lett. 62: E4752.
Koshland Jr. DE (1995). The keylock theory and the induced fit theory. Angew. Chem. Int. Ed. 33: 23752378.
Koshland Jr. DE (1996). The structural basis of negative cooperativity: receptors and enzymes. Curr. Opin. Struct. Biol. 6: 757761.
Koshland Jr. DE (1998). Conformational changes: how small is big enough? Nat. Med. 4: 11121114.
Koshland Jr. DE (2002a). The application and usefulness of the ratio k(cat)/K(M). Bioorg. Chem. 30: 211213.
Koshland Jr. DE (2002b). The seven pillars of life. Science, 295: 22152216.
Koshland Jr. DE & Hamadani K (2002). Proteomics and models for enzyme cooperativity. J. Biol. Chem. 277: 4684146844.
167

References
Koshland Jr. DE (2004). Crazy, but correct. Nature, 432: 447.
Koshland Jr. DE (2007). The ChaChaCha Theory of Scientific Discovery. Science, 317: 761762.
Kosinski J, Cymerman IA, Feder M, Kurowski MA, Sasin JM & Bujnicki JM (2003). A "FRankenstein's monster" approach to comparative modeling: merging the finest fragments of FoldRecognition models and iterative model refinement aided by 3D structure evaluation. Proteins, 53 Suppl 6: 369379.
Kosinski J, Gajda MJ, Cymerman IA, Kurowski MA, Pawlowski M, Boniecki M, Obarska A, Papaj G, SroczynskaObuchowicz P, Tkaczuk KL, Sniezynska P, Sasin JM, Augustyn A, Bujnicki JM & Feder M (2005). FRankenstein becomes a cyborg: the automatic recombination and realignment of fold recognition models in CASP6. Proteins, 61 Suppl 7: 106113.
Kotik, M., Štěpánek V, Kyslík P & Marešová H (2007). Cloning of an epoxide hydrolaseencoding gene from Aspergillus niger M200, overexpression in E. coli, and modification of activity and enantioselectivity of the enzyme by protein engineering. J. Biotechnol. 132: 815.
Kottalam J & Case DA (1988). Dynamics of ligand escape from the heme pocket of myoglobin. J. Am. Chem. Soc. 110: 76907697.
Kovach IM, Qian N & Bencsura A (1994). Efficient product clearance through exit channels in substrate hydrolysis by acetylcholinesterase. FEBS Lett. 349: 6064.
Kozlíková B, Andres F & Sochor J (2007). Visualization of tunnels in protein molecules. In 5th international conference on virtual reality, computer graphics, visualization and interaction, Grahamstown, South Africa (pp. 111118). Association for Computing Machinery, New York, NY, USA.
Krissinel E & Henrick K (2007). Inference of macromolecular assemblies from crystalline state. J. Mol. Biol. 372: 774797.
Krooshof GH, Floris R, Tepper AW & Janssen DB (1999). Thermodynamic analysis of halide binding to haloalkane dehalogenase suggests the occurrence of large conformational changes. Protein Sci. 8: 355360.
Krooshof GH, Kwant EM, Damborský J, Koča J & Janssen DB (1997). Repositioning the catalytic triad aspartic acid of haloalkane dehalogenase: effects on stability, kinetics, and structure. Biochemistry, 36: 95719580.
Krooshof GH, Ridder IS, Tepper AW, Vos GJ, Rozeboom HJ, Kalk KH, Dijkstra BW & Janssen DB (1998). Kinetic analysis and Xray structure of haloalkane dehalogenase with a modified halidebinding site. Biochemistry, 37: 1501315023.
Kruger K, Grabowski PJ, Zaug AJ, Sands J, Gottschling DE & Cech TR (1982). Selfsplicing RNA: autoexcision and autocyclization of the ribosomal RNA intervening sequence of Tetrahymena. Cell, 31: 147157.
Kryshtafovych A, Venclovas C, Fidelis K & Moult J (2005). Progress over the first decade of CASP experiments. Proteins, 61 Suppl 7: 225236.
Kuhlman B, Dantas G, Ireton GC, Varani G, Stoddard BL & Baker D (2003). Design of a novel globular protein fold with atomiclevel accuracy. Science, 302: 13641368.
Kuhn H & Waser J (1994). On the origin of the genetic code. FEBS Lett. 352: 259264.
Kulakova AN, Larkin MJ & Kulakov LA (1997). The plasmidlocated haloalkane dehalogenase gene from Rhodococcus rhodochrous NCIMB 13064. Microbiol. 143: 109115.
Kulakova AN, Stafford TM, Larkin MJ & Kulakov LA (1995). Plasmid pRTL1 controlling 1chloroalkane degradation by Rhodococcus rhodochrous NCIMB 13064. Plasmid, 33: 208217.
Kulakov LA, Poelarends GJ, Janssen DB & Larkin MJ (1999). Characterization of IS2112, a new insertion sequence from Rhodococcus, and its relationship with mobile elements belonging to the IS110 family. Microbiol. 145: 561568.
Kumar S & Bansal M (1998). Geometrical and sequence characteristics of alphahelices in globular proteins. Biophys. J. 75: 19351944.
Kumar S, Rosenberg JM, Bouzida D, Swendsen RH & Kollman PA (1995). Multidimensional freeenergy calculations using the weighted histogram analysis method. J. Comput. Chem. 16: 13391350.
168

References
Kumar S, Rosenberg JM, Bouzida D, Swendsen RH & Kollman PA (1992). THE weighted histogram analysis method for freeenergy calculations on biomolecules. I. The method. J. Comput. Chem. 13: 10111021.
Kuntz ID, Blaney JM, Oatley SJ, Langridge R & Ferrin TE (1982). A geometric approach to macromoleculeligand interactions. J. Mol. Biol. 161: 269288.
Kurakin A (2009). Scalefree flow of life: on the biology, economics, and physics of the cell. Theor. Biol. Med. Modell. 6: 633.
Kurowski MA & Bujnicki JM (2003). GeneSilico protein structure prediction metaserver. Nucleic Acids Res. 31: 33053307.
Kurzyński M (1998). A synthetic picture of intramolecular dynamics of proteins. Towards a contemporary statistical theory of biochemical processes. Prog. Biophys. Mol. Biol. 69: 2382.
Kuszewski J, Qin J, Gronenborn AM & Clore GM (1995). The impact of direct refinement against 13C alpha and 13C beta chemical shifts on protein structure determination by NMR. J. Magn. Reson., Ser. B, 106: 9296.
Laberge M & Yonetani T (2008). Molecular dynamics simulations of hemoglobin A in different states and bound to DPG: effectorlinked perturbation of tertiary conformations and HbA concerted dynamics. Biophys. J. 94: 27372751.
Labesse G, Colloc'h N, Pothier J & Mornon JP (1997). PSEA: a new efficient assignment of secondary structure from C alpha trace of proteins. Comput. Appl. Biosci. 13: 291295.
Lakowicz JR & Weber G (1973). Quenching of protein fluorescence by oxygen. Detection of structural fluctuations in proteins on the nanosecond time scale. Biochemistry, 12: 41714179.
Lamarck, JB (1809). Philosophie zoologique, ou exposition des considérations relatives a l'histoire naturelle des animaux; a la diversité de leur organisation et des facultés qu'Ils en obtiennent. Dentu, Paris, France.
Lauble H, Miehlich B, Förster S, Kobler C, Wajant H & Effenberger F (2002). Structure determinants of substrate specificity of hydroxynitrile lyase from Manihot esculenta. Protein Sci. 11: 6571.
Lau EY, Kahn K, Bash PA & Bruice TC (2000). The importance of reactant positioning in enzyme catalysis: a hybrid quantum mechanics/molecular mechanics study of a haloalkane dehalogenase. Proc. Natl. Acad. Sci. U.S.A. 97: 99379942.
Lavalette D, Tétreau C & Mouawad L (2006). Ligand migration and escape pathways in haem proteins. Biochem. Soc. Trans. 34: 975978.
Lazcano A, Guerrero R, Margulis L & Oró J (1988). The evolutionary transition from RNA to DNA in early cells. J. Mol. Evol. 27: 283290.
Lazcano A & Miller SL (1996). The origin and early evolution of life: prebiotic chemistry, the preRNA world, and time. Cell, 85: 793798.
Leach AR (1996). 2. Quantum mechanical models. In Molecular modelling: principles and applications (pp. 25130). Addison Wesley Longman, Harlow, England.
Lee AL, Kinnear SA & Wand AJ (2000). Redistribution and loss of side chain entropy upon formation of a calmodulinpeptide complex. Nat. Struct. Biol. 7: 7277.
Lee AL & Wand AJ (2001). Microscopic origins of entropy, heat capacity and the glass transition in proteins. Nature, 411: 501504.
Lee FS, Chu ZT, Bolger MB & Warshel A (1992). Calculations of antibodyantigen interactions: microscopic and semimicroscopic evaluation of the free energies of binding of phosphorylcholine analogs to McPC603. Protein Eng. 5: 215228.
Lee P, Kuo K, Chu P, Liu EM & Lin J (2009). SLITHER: a web server for generating contiguous conformations of substrate molecules entering into deep active sites of proteins or migrating through channels in membrane transporters. Nucleic Acids Res. 37: W559564.
Lehmann J (2000). Physicochemical constraints connected with the coding properties of the genetic system. J. Theor. Biol. 202: 129144.
169

References
Levinthal C (1968). Are there pathways for protein folding? J. Chim. Phys. 65: 4445.
Levinthal C (1969). How to fold graciously. In Mossbauer spectroscopy in biological systems. Proceedings of the University of Illinois Bulletin (pp. 2224), University of Illinois Press, Champaign, IL, USA.
Lewandowicz A, Rudziński J, Tronstad L, Widersten M, Ryberg P, Matsson O & Paneth P (2001). Chlorine kinetic isotope effects on the haloalkane dehalogenase reaction. J. Am. Chem. Soc. 123: 45504555.
Li C, Hassler M & Bugg TDH (2008). Catalytic promiscuity in the alpha/betahydrolase superfamily: hydroxamic acid formation, CC bond formation, ester and thioester hydrolysis in the CC hydrolase family. Eur. J. Chem. Biol. 9: 7176.
Li M, Phylip LH, Lees WE, Winther JR, Dunn BM, Wlodawer A, Kay J & Gustchina A (2000). The aspartic proteinase from Saccharomyces cerevisiae folds its own inhibitor into a helix. Nat. Struct. Biol. 7: 113117.
Li W, Liu H, Scott EE, Gräter F, Halpert JR, Luo X, Shen J & Jiang H (2005). Possible pathway(s) of testosterone egress from the active site of cytochrome P450 2B1: A steered molecular dynamics simulation. Drug Metab. Dispos. 33: 910919.
Liang J & Dill KA (2001). Are proteins wellpacked? Biophys. J. 81: 751766.
Liepinsh E & Otting G (1997). Organic solvents identify specific ligand binding sites on protein surfaces. Nat. Biotechnol. 15: 264268.
Liesener A & Karst U (2005). Monitoring enzymatic conversions by mass spectrometry: a critical review. Anal. Bioanal. Chem. 382: 14511464.
Lightstone FC, Zheng YJ, Maulitz AH & Bruice TC (1997). Nonenzymatic and enzymatic hydrolysis of alkyl halides: a haloalkane dehalogenation enzyme evolved to stabilize the gasphase transition state of an SN2 displacement reaction. Proc. Natl. Acad. Sci. U.S.A. 94: 84178420.
Lightstone FC & Bruice TC (1996). Ground state conformations and entropic and enthalpic factors in the efficiency of intramolecular and enzymatic reactions. 1. Cyclic anhydride formation by substituted glutarates, succinate, and 3,6endoxo 4tetrahydrophthalate monophenyl esters. Δ J. Am. Chem. Soc. 118: 25952605.
Lightstone FC, Zheng Y & Bruice TC (1998). Molecular dynamics simulations of ground and transition states for the SN2 displacement of Cl from 1,2dichloroethane at the active site of Xanthobacter autotrophicus haloalkane dehalogenase. J. Am. Chem. Soc. 120: 56115621.
LindorffLarsen K, Best RB, Depristo MA, Dobson CM & Vendruscolo M (2005). Simultaneous determination of protein structure and dynamics. Nature, 433: 128132.
Liu F, Du D, Fuller AA, Davoren JE, Wipf P, Kelly JW & Gruebele M (2008). An experimental survey of the transition between twostate and downhill protein folding scenarios. Proc. Natl. Acad. Sci. U.S.A. 105: 23692374.
Liu M & Wang S (1999). MCDOCK: a Monte Carlo simulation approach to the molecular docking problem. J. Comput. Aided Mol. Des. 13: 435451.
Liu T, Whitten ST & Hilser VJ (2007). Functional residues serve a dominant role in mediating the cooperativity of the protein ensemble. Proc. Natl. Acad. Sci. U.S.A. 104: 43474352.
Livingstone CD & Barton GJ (1993). Protein sequence alignments: a strategy for the hierarchical analysis of residue conservation. Comput. Appl. Biosci. 9: 745756.
Liwo A, Czaplewski C, Ołdziej S & Scheraga HA (2008). Computational techniques for efficient conformational sampling of proteins. Curr. Opin. Struct. Biol. 18, 134139.
Loh AP, Pawley N, Nicholson LK & Oswald RE (2001). An increase in side chain entropy facilitates effector binding: NMR characterization of the side chain methyl group dynamics in Cdc42Hs. Biochemistry, 40: 45904600.
Lolis E & Petsko GA (1990). Crystallographic analysis of the complex between triosephosphate isomerase and 2phosphoglycolate at 2.5Å resolution: implications for catalysis. Biochemistry, 29: 66196625.
170
References
Los GV, Encell LP, McDougall MG, Hartzell DD, Karassina N, Zimprich C, Wood MG, Learish R, Ohana RF, Urh M, Simpson D, Mendez J, Zimmerman K, Otto P, Vidugiris G, Zhu J, Darzins A, Klaubert DH, Bulleit RF & Wood KV (2008). HaloTag: a novel protein labeling technology for cell imaging and protein analysis. ACS Chem. Biol. 3: 373382.
Lounnas V & Wade RC (1997). Exceptionally stable salt bridges in cytochrome P450cam have functional roles. Biochemistry, 36: 54025417.
Low BW & Baybutt RB (1952). The helix – a hydrogen bonded configuration of the polypeptide chain. π J. Am. Chem. Soc. 74: 58065807.
Lüdemann SK, Carugo O & Wade RC (1997). Substrate access to cytochrome P450cam: a comparison of a thermal motion pathway analysis with molecular dynamics simulation data. J. Mol. Model. 3: 369374.
Lüdemann SK, Lounnas V & Wade RC (2000a). How do substrates enter and products exit the buried active site of cytochrome P450cam? 1. Random expulsion molecular dynamics investigation of ligand access channels and mechanisms. J. Mol. Biol. 303: 797811.
Lüdemann SK, Lounnas V & Wade RC (2000b). How do substrates enter and products exit the buried active site of cytochrome P450cam? 2. Steered molecular dynamics and adiabatic mapping of substrate pathways. J. Mol. Biol. 303: 813830.
Luo Y & Baldwin RL (1998). Trifluoroethanol stabilizes the pH 4 folding intermediate of sperm whale apomyoglobin. J. Mol. Biol. 279: 4957.
Lupas AN, Ponting CP & Russell RB (2001). On the evolution of protein folds: are similar motifs in different protein folds the result of convergence, insertion, or relics of an ancient peptide world? J. Struct. Biol. 134: 191203.
Lupas AN (2008). The long coming of computational structural biology. J. Struct. Biol. 163: 254257.
Lurquin PF (1997). Gene transfer by electroporation. Mol. Biotechnol. 7: 535.
Lutz S, Ostermeier M, Moore GL, Maranas CD & Benkovic SJ (2001). Creating multiplecrossover DNA libraries independent of sequence identity. Proc. Natl. Acad. Sci. U.S.A. 98: 1124811253.
Ma B, Kumar S, Tsai C, Hu Z & Nussinov R (2000). Transitionstate ensemble in enzyme catalysis: Possibility, reality, or necessity? J. Theor. Biol. 203: 383397.
Ma W & Yu C (2006). Intramolecular RNA replicase: possibly the first selfreplicating molecule in the RNA world. Origins Life Evol. Biosphere, 36, 41320.
MacArthur MW & Thornton JM (1996). Deviations from planarity of the peptide bond in peptides and proteins. J. Mol. Biol. 264: 11801195.
Mackerell AD (2004). Empirical force fields for biological macromolecules: overview and issues. J. Comput. Chem. 25: 15841604.
Maher KA & Stevenson DJ (1988). Impact frustration of the origin of life. Nature, 331: 612614.
Makhatadze GI, Loladze VV, Ermolenko DN, Chen X & Thomas ST (2003). Contribution of surface salt bridges to protein stability: guidelines for protein engineering. J. Mol. Biol. 327: 11351148.
Makrides SC (1996). Strategies for achieving highlevel expression of genes in Escherichia coli. Microbiol. Rev. 60: 512538.
Maniatis T (1982). Molecular cloning: A laboratory manual. Cold Spring Harbor Laboratory Press, Cold Spring Harbor, NY, USA.
Manikandan K & Ramakumar S (2004). The occurrence of CH...O hydrogen bonds in alphahelices and helix termini in globular proteins. Proteins, 56: 768781.
Manjasetty BA, Turnbull AP, Panjikar S, Büssow K & Chance MR (2008). Automated technologies and novel techniques to accelerate protein crystallography for structural genomics. Proteomics, 8: 612625.
Mansfeld J, Vriend G, Dijkstra BW, Veltman OR, Van den Burg B, Venema G, UlbrichHofmann R & Eijsink VG (1997). Extreme stabilization of a thermolysinlike protease by an engineered disulfide bond. J. Biol. Chem. 272: 1115211156.
171

References
Marek J, Vévodová J, KutáSmatanová I, Nagata Y, Svensson LA, Newman J, Takagi M & Damborský J (2000). Crystal structure of the haloalkane dehalogenase from Sphingomonas paucimobilis UT26. Biochemistry, 39: 1408214086.
Martin J, Letellier G, Marin A, Taly J, de Brevern AG & Gibrat J (2005). Protein secondary structure assignment revisited: a detailed analysis of different assignment methods. BMC Struct. Biol. 5: 17.
Martí S, Andrés J, Moliner V, Silla E, Tuñón I & Bertrán J (2001). Transition structure selectivity in enzyme catalysis: a QM/MM study of chorismate mutase. Theor. Chem. Acc. 105: 207212.
Marvanová S, Nagata Y, Wimmerová M, Sýkorová J, Hynková K & Damborský J (2001). Biochemical characterization of broadspecificity enzymes using multivariate experimental design and a colorimetric microplate assay: characterization of the haloalkane dehalogenase mutants. J. Microbiol. Methods 44: 149157.
Mas JM, Aloy P, MartíRenom MA, Oliva B, BlancoAparicio C, Molina MA, de Llorens R, Querol E & Avilés FX (1998). Protein similarities beyond disulphide bridge topology. J. Mol. Biol. 284: 541548.
Mas JM, Aloy P, MartíRenom MA, Oliva B, de Llorens R, Avilés FX, & Querol E (2001). Classification of protein disulphidebridge topologies. J. Comput. Aided Mol. Des. 15: 477487.
Matsumura M, Signor G & Matthews BW (1989). Substantial increase of protein stability by multiple disulphide bonds. Nature, 342: 291293.
Matthews BW, Nicholson H & Becktel WJ (1987). Enhanced protein thermostability from sitedirected mutations that decrease the entropy of unfolding. Proc. Natl. Acad. Sci. U.S.A. 84: 66636667.
Matthews BW (1993). Structural and genetic analysis of protein folding and stability: Current Opinion in Sturctural Biology 1993, 3:589593. Curr. Opin. Struct. Biol. 3: 589593.
Maxam AM & Gilbert W (1977). A new method for sequencing DNA. Proc. Natl. Acad. Sci. U.S.A. 74: 560–564.
May A & Zacharias M (2005). Accounting for global protein deformability during proteinprotein and proteinligand docking. Biochim. Biophys. Acta, 1754: 225231.
Mazumdar PA, Hulecki JC, Cherney MM, Garen CR & James MNG (2008). Xray crystal structure of Mycobacterium tuberculosis haloalkane dehalogenase Rv2579. Biochim. Biophys. Acta, 1784: 351362.
McCammon JA & Karplus M (1977). Internal motions of antibody molecules. Nature, 268: 765766.
McCammon JA & Karplus M (1980). Dynamics of tyrosine ring rotations in a globular protein. Biopolymers, 19: 13751405.
McDonald IK & Thornton JM (1994). Satisfying hydrogen bonding potential in proteins. J. Mol. Biol. 238: 777793.
McLachlan AD (1971). Tests for comparing related aminoacid sequences. Cytochrome c and cytochrome c 551. J. Mol. Biol. 61: 409424.
McLachlan AD (1972). Repeating sequences and gene duplication in proteins. J. Mol. Biol. 64: 417437.
McMartin C & Bohacek RS (1997). QXP: powerful, rapid computer algorithms for structurebased drug design. J. Comput. Aided Mol. Des. 11: 333344.
McPherson A (2004). Introduction to protein crystallization. Methods, 34: 254265.
Medek P, Beneš P & Sochor J (2007). Computation of tunnels in protein molecules using Delaunay triangulation. In 15th international conference in central Europe on computer graphics, visualization and computer vision '2007, Journal of WSCG (pp. 107114). University of West Bohemia, Plzeň, Czech Republic.
Mehler EL & Solmajer T (1991). Electrostatic effects in proteins: comparison of dielectric and charge models. Protein Eng. 4, 903910.
Meli M, AlbertFournier B & Maurel MC (2001). Recent findings in the modern RNA world. Int. Microbiol. 4: 511.
172

References
MenaBenitez GL, GandiaHerrero F, Graham S, Larson TR, McQueenMason SJ, French CE, Rylott EL & Bruce NC (2008). Engineering a catabolic pathway in plants for the degradation of 1,2dichloroethane. Plant Physiol. 147: 11921198.
Meroueh SO, Roblin P, Golemi D, Maveyraud L, Vakulenko SB, Zhang Y, Samama J & Mobashery S (2002). Molecular dynamics at the root of expansion of function in the M69L inhibitorresistant TEM betalactamase from Escherichia coli. J. Am. Chem. Soc. 124: 94229430.
Merutka G & Stellwagen E (1990). Positional independence and additivity of amino acid replacements on helix stability in monomeric peptides. Biochemistry, 29: 894898.
Michaelis L & Menten M (1913). Die Kinetik der Invertinwirkung. Biochem. Zeits. 49: 333369.
Mikhonin AV & Asher SA (2006). Direct UV Raman monitoring of 3(10)helix and pibulge premelting during alphahelix unfolding. J. Am. Chem. Soc. 128: 1378913795.
Mildvan AS (2004). Inverse thinking about double mutants of enzymes. Biochemistry, 43: 1451714520.
Miller GP & Benkovic SJ (1998). Deletion of a highly motional residue affects formation of the Michaelis complex for Escherichia coli dihydrofolate reductase. Biochemistry, 37: 63276335.
Miller MD, Kearsley SK, Underwood DJ & Sheridan RP (1994). FLOG: a system to select 'quasiflexible' ligands complementary to a receptor of known threedimensional structure. J. Comput. Aided Mol. Des. 8: 153174.
Miller SL (1953). A production of amino acids under possible primitive earth conditions. Science, 117: 528529.
Miller SL & Orgel LE (1974). The origins of life on the earth. PrenticeHall, New Yersey, NJ, USA.
Millhauser GL (1995). Views of helical peptides: A proposal for the position of 310helix along the thermodynamic folding pathway. Biochemistry, 34: 10318.
Mills DR, Peterson RL & Spiegelman S (1967). An extracellular Darwinian experiment with a selfduplicating nucleic acid molecule. Proc. Natl. Acad. Sci. U.S.A. 58: 217224.
Milstien S & Cohen LA (1970). Rate acceleration by stereopopulation control: models for enzyme action. Proc. Natl. Acad. Sci. U.S.A. 67: 11431147.
Mine S, Tate S, Ueda T, Kainosho M & Imoto T (1999). Analysis of the relationship between enzyme activity and its internal motion using nuclear magnetic resonance: 15N relaxation studies of wildtype and mutant lysozyme. J. Mol. Biol. 286: 15471565.
Minsky A, Summers RG & Knowles JR (1986). Secretion of betalactamase into the periplasm of Escherichia coli: evidence for a distinct release step associated with a conformational change. Proc. Natl. Acad. Sci. U.S.A. 83: 41804184.
Mirsky AE & Pauling L (1936). On the structure of native, denatured, and coagulated proteins. Proc. Natl. Acad. Sci. U.S.A. 22: 439447.
Mitsuoka K, Hirai T, Murata K, Miyazawa A, Kidera A, Kimura Y & Fujiyoshi Y (1999). The structure of bacteriorhodopsin at 3.0 Å resolution based on electron crystallography: implication of the charge distribution. J. Mol. Biol. 286: 861882.
Mittermaier A & Kay LE (2004). The response of internal dynamics to hydrophobic core mutations in the SH3 domain from the Fyn tyrosine kinase. Protein Sci. 13: 10881099.
Mittermaier A & Kay LE (2006). New tools provide new insights in NMR studies of protein dynamics. Science, 312: 224228.
Mizutani MY, Tomioka N & Itai A (1994). Rational automatic search method for stable docking models of protein and ligand. J. Mol. Biol. 243: 310326.
Monincová M, Prokop Z, Vévodová J, Nagata Y & Damborský J (2007). Weak activity of haloalkane dehalogenase LinB with 1,2,3trichloropropane revealed by XRay crystallography and microcalorimetry. Appl. Environ. Microbiol. 73: 20052008.
Monod J, Wyman J & Changeux JP (1965). On the nature of allosteric transitions: A plaussible model. J. Mol. Biol. 12: 88118.
173

References
Montgomerie S, Sundararaj S, Gallin WJ & Wishart DS (2006). Improving the accuracy of protein secondary structure prediction using structural alignment. BMC Bioinf. 7: 301.
Morowitz HJ (1999). A theory of biochemical organization, metabolic pathways, and evolution. Complexity, 4: 3953.
Morris GM, Goodsell DS, Huey R & Olson AJ (1996). Distributed automated docking of flexible ligands to proteins: parallel applications of AutoDock 2.4. J. Comput. Aided Mol. Des. 10: 293304.
Morris GM, Goodsell DS, Halliday RS, Huey R, Hart WE, Belew RK & Olson AJ (1998). Automated docking using a Lamarckian genetic algorithm and an empirical binding free energy function. J. Comput. Chem. 19: 16391662.
Moult J, Pedersen JT, Judson R & Fidelis K (1995). A largescale experiment to assess protein structure prediction methods. Proteins, 23: iiv.
Moult J, Hubbard T, Bryant SH, Fidelis K & Pedersen JT (1997). Critical assessment of methods of protein structure prediction (CASP): Round II. Proteins, Suppl 1: 26.
Mu T, Ong DST, Wang Y, Balch WE, Yates JR, Segatori L & Kelly JW (2008). Chemical and biological approaches synergize to ameliorate proteinfolding diseases. Cell, 134: 769781.
Mulkidjanian AY & Galperin MY (2007). Physicochemical and evolutionary constraints for the formation and selection of first biopolymers: towards the consensus paradigm of the abiogenic origin of life. Chem. Biodivers. 4: 20032015.
Müller KM, Stebel SC, Knall S, Zipf G, Bernauer HS & Arndt KM (2005). Nucleotide exchange and excision technology (NExT) DNA shuffling: a robust method for DNA fragmentation and directed evolution. Nucleic Acids Res. 33: e117.
Müller UF (2006). Recreating an RNA world. Cell. Mol. Life Sci. 63: 12781293.
Murugan NA & Agren H (2009). 1,2dichloroethane in haloalkane dehalogenase protein and in water solvent: a case study of the confinement effect on structural and dynamical properties. J. Phys. Chem. B, 113: 32573263.
Murzin AG, Brenner SE, Hubbard T & Chothia C (1995). SCOP: a structural classification of proteins database for the investigation of sequences and structures. J. Mol. Biol. 247: 536540.
Myers JK & Oas TG (2002). Mechanism of fast protein folding. Annu. Rev. Biochem. 71: 783815.
Nabuurs SB, Nederveen AJ, Vranken W, Doreleijers JF, Bonvin AMJJ, Vuister GW, Vriend G & Spronk CAEM (2004). DRESS: a database of REfined solution NMR structures. Proteins, 55: 483486.
Naested H, Fennema M, Hao L, Andersen M, Janssen DB & Mundy J (1999). A bacterial haloalkane dehalogenase gene as a negative selectable marker in Arabidopsis. Plant J. 18: 571576.
Nagata Y, Nariya T, Ohtomo R, Fukuda M, Yano K & Takagi M (1993). Cloning and sequencing of a dehalogenase gene encoding an enzyme with hydrolase activity involved in the degradation of gammahexachlorocyclohexane in Pseudomonas paucimobilis. J. Bacteriol. 175: 64036410.
Nagata Y, Miyauchi K, Damborský J, Manová K, Ansorgova A & Takagi M (1997). Purification and characterization of a haloalkane dehalogenase of a new substrate class from a gammahexachlorocyclohexanedegrading bacterium, Sphingomonas paucimobilis UT26. Appl. Environ. Microbiol. 63: 37073710.
Nagata Y, Hynková K, Damborský J & Takagi M (1999). Construction and characterization of histidinetagged haloalkane dehalogenase (LinB) of a new substrate class from a gammahexachlorocyclohexanedegrading bacterium, Sphingomonas paucimobilis UT26. Protein Expression and Purif. 17: 299304.
Nagata Y, Prokop Z, Marvanová S, Sýkorová J, Monincová M, Tsuda M & Damborský J (2003). Reconstruction of mycobacterial dehalogenase Rv2579 by cumulative mutagenesis of haloalkane dehalogenase LinB. Appl. Environ. Microbiol. 69: 23492355.
Nagata Y, Prokop Z, Sato Y, Jeřábek P, Kumar A, Ohtsubo Y, Tsuda M & Damborský J. (2005). Degradation of betahexachlorocyclohexane by haloalkane dehalogenase LinB from Sphingomonas paucimobilis UT26. Appl. Environ. Microbiol. 71: 21832185.
174

References
Nagel ZD & Klinman JP (2006). Tunneling and dynamics in enzymatic hydride transfer. Chem. Rev. 106: 30953118.
Nam K, PratResina X, GarciaViloca M, DeviKesavan LS & Gao J (2004). Dynamics of an enzymatic substitution reaction in haloalkane dehalogenase. J. Am. Chem. Soc. 126: 13691376.
Nandi N, Bhattacharyya K & Bagchi B (2000). Dielectric relaxation and solvation dynamics of water in complex chemical and biological systems. Chem. Rev. 100: 20132046.
Nardini M & Dijkstra BW (1999). Alpha/beta hydrolase fold enzymes: the family keeps growing. Curr. Opin. Struct. Biol. 9: 732737.
Neal S, Nip AM, Zhang H & Wishart DS (2003). Rapid and accurate calculation of protein 1H, 13C and 15N chemical shifts. J Biomol. NMR, 26: 215240.
Negri A, Marco E, Damborsky J, & Gago F (2007). Stepwise dissection and visualization of the catalytic mechanism of haloalkane dehalogenase LinB using molecular dynamics simulations and computer graphics. J. Mol. Graphics Modell. 26: 643651.
Nelson JW & Kallenbach NR (1986). Stabilization of the ribonuclease Speptide alphahelix by trifluoroethanol. Proteins, 1: 211217.
Némethy G & Printz MP (1972). The turn, a possible folded conformation of the polypeptide chain. Comparison with the turn.γ β Macromolecules, 5: 755758.
Neumann E, SchaeferRidder M, Wang Y & Hofschneider PH (1982). Gene transfer into mouse lyoma cells by electroporation in high electric fields. EMBO J. 1: 841845.
Newman J, Peat TS, Richard R, Kan L, Swanson PE, Affholter JA, Holmes IH, Schindler JF, Unkefer CJ & Terwilliger TC (1999). Haloalkane dehalogenases: structure of a Rhodococcus enzyme. Biochemistry, 38: 1610516114.
Nielsen PE (1993). Peptide nucleic acid (PNA): a model structure for the primordial genetic material? Origins Life Evol. Biosphere, 23: 323327.
Nirenberg M, Leder P, Bernfield M, Brimacombe R, Trupin J, Rottman F & O'Neal C (1965). RNA codewords and protein synthesis, VII. On the general nature of the RNA code. Proc. Natl. Acad. Sci. U.S.A. 53: 11611168.
Nishida N, Sumikawa H, Sakakura M, Shimba N, Takahashi H, Terasawa H, Suzuki E & Shimada I (2003). Collagenbinding mode of vWFA3 domain determined by a transferred crosssaturation experiment. Nat. Struct. Mol. Biol. 10: 5358.
Oakley AJ, Prokop Z, Boháč M, Kmuníček J, Jedlička T, Monincová M, KutáSmatanová I, Nagata Y, Damborský J & Wilce MCJ (2002). Exploring the structure and activity of haloalkane dehalogenase from Sphingomonas paucimobilis UT26: evidence for product and watermediated inhibition. Biochemistry, 41: 48474855.
Oakley AJ, Klvaňa M, Otyepka M, Nagata Y, Wilce MCJ & Damborský J (2004). Crystal structure of haloalkane dehalogenase LinB from Sphingomonas paucimobilis UT26 at 0.95 Å resolution: dynamics of catalytic residues. Biochemistry, 43: 870878.
O'Brien PJ & Herschlag D (1999). Catalytic promiscuity and the evolution of new enzymatic activities. Chem. Biol. 6: R91R105.
Ochman H, Gerber AS & Hartl DL (1988). Genetic applications of an inverse polymerase chain reaction. Genetics, 120: 621623.
Ohmine I & Tanaka H (1993). Fluctuation, relaxations, and hydration in liquid water. Hydrogenbond rearrangement dynamics. Chem. Rev. 93: 25452566.
Ohno S (1970). Evolution by gene duplication. SpringerVerlag, Heidelberg, Germany.
Oliveberg M (2001). Characterisation of the transition states for protein folding: towards a new level of mechanistic detail in protein engineering analysis. Curr. Opin. Struct. Biol. 11: 94100.
Ollis DL, Cheah E, Cygler M, Dijkstra B, Frolow F, Franken SM, Harel M, Remington SJ, Silman I & Schrag J (1992). The alpha/beta hydrolase fold. Protein Eng. 5: 197211.
Olsson MHM & Warshel A (2004). Solute solvent dynamics and energetics in enzyme catalysis: the S(N)2 reaction of dehalogenase as a general benchmark. J. Am. Chem. Soc. 126: 1516715179.
175

References
Onufriev A, Bashford D & Case DA (2004). Exploring protein native states and largescale conformational changes with a modified generalized born model. Proteins, 55 383394.
Oprea TI, Hummer G & Garcia AE (1997). Identification of a functional water channel in cytochrome P450 enzymes. Proc. Natl. Acad. Sci. U.S.A. 94: 21332138.
Orengo CA, Michie AD, Jones S, Jones DT, Swindells MB & Thornton JM (1997). CATH – a hierarchic classification of protein domain structures. Structure, 5: 10931108.
Orengo CA, Martin AM, Hutchinson G, Jones S, Jones DT, Michie AD, Swindells MB & Thornton JM (1998). Classifying a protein in the CATH database of domain structures. Acta Crystallogr., Sect. D: Biol. Crystallogr. 54: 11551167.
Orengo CA, Bray JE, Buchan DWA, Harrison A, Lee D, Pearl FMG, Sillitoe I, Todd AE, & Thornton JM (2002). The CATH protein family database: a resource for structural and functional annotation of genomes. Proteomics, 2, 1121.
Orgel LE (1998). The origin of lifea review of facts and speculations. Trends Biochem.Sci. 23: 491495.
Osawa S (1995). Evolution of the genetic code. Oxford University Press, New York, NY, USA.
Otyepka M & Damborský J (2002). Functionally relevant motions of haloalkane dehalogenases occur in the specificitymodulating cap domains. Protein Sci. 11, 12061217.
Otyepka M, Banáš P, Magistrato A, Carloni P & Damborský J (2008). Second step of hydrolytic dehalogenation in haloalkane dehalogenase investigated by QM/MM methods. Proteins, 70: 707717.
Otzen DE & Fersht AR (1995). Sidechain determinants of betasheet stability. Biochemistry, 34: 57185724.
Otzen DE & Oliveberg M (1999). Saltinduced detour through compact regions of the protein folding landscape. Proc. Natl. Acad. Sci. U.S.A. 96: 1174611751.
Pace CN, Alston RW & Shaw KL (2000). Chargecharge interactions influence the denatured state ensemble and contribute to protein stability. Protein Sci. 9: 13951398.
Pal D & Chakrabarti P (1999). Estimates of the loss of mainchain conformational entropy of different residues on protein folding. Proteins, 36: 332339.
Pal D & Chakrabarti P (2000). betasheet propensity and its correlation with parameters based on conformation. Acta Crystallogr., Sect. D: Biol. Crystallogr. 56: 589594.
Pal SK & Zewail AH (2004). Dynamics of water in biological recognition. Chem. Rev. 104: 20992123.
Palmer AG (2004). NMR characterization of the dynamics of biomacromolecules. Chem. Rev. 104: 36233640.
Paneth P (2003). Chlorine kinetic isotope effects on enzymatic dehalogenations. Acc. Chem. Res. 36: 120126.
Parak FG (2003). Proteins in action: the physics of structural fluctuations and conformational changes. Curr. Opin. Struct. Biol. 13: 552557.
Parak FG, Achterhold K, Schmidt M, Prusakov V & Croci S (2006). Protein dynamics on different timescales. J. NonCryst. Solids 352: 43714378.
Pascarella S & Argos P (1992). Analysis of insertions/deletions in protein structures. J. Mol. Biol. 224: 461471.
Patnaik R, Louie S, Gavrilovic V, Perry K, Stemmer WPC, Ryan CM & del Cardayré S (2002). Genome shuffling of Lactobacillus for improved acid tolerance. Nat. Biotechnol. 20: 707712.
Pauling L (1946). Molecular architecture and biological reactions. Chem. Eng. News 24: 13751377.
Pauling L & Corey RB (1950). Two hydrogenbonded spiral configurations of the polypeptide chain. J. Am. Chem. Soc. 72: 5349.
Pauling L, Corey RB & Branson HR (1951). The structure of proteins: two hydrogenbonded helical configurations of the polypeptide chain. Proc. Natl. Acad. Sci. U.S.A. 37: 205–211.
176

References
Pauling L & Corey RB (1951a). Atomic coordinates and structure factors for two helical configurations of polypeptide chains. Proc. Natl. Acad. Sci. U.S.A. 37: 235240.
Pauling L & Corey RB (1951b). The pleated sheet, a new layer configuration of polypeptide chains. Proc. Natl. Acad. Sci. U.S.A. 37: 251256.
Pauling L & Corey RB (1951c). The structure of feather rachis keratin. Proc. Natl. Acad. Sci. U.S.A. 37: 256261.
Pauling L & Corey RB (1951d). The structure of hair, muscle, and related proteins. Proc. Natl. Acad. Sci. U.S.A. 37: 261271.
Pauling L & Corey RB (1951e). The structure of fibrous proteins of the collagengelatin group. Proc. Natl. Acad. Sci. U.S.A. 37: 272281.
Pauling L & Corey RB (1951f). Configurations of polypeptide chains with favored orientations around single bonds: two new pleated sheets. Proc. Natl. Acad. Sci. U.S.A. 37: 729740.
Pauling L & Corey RB (1953). Compound helical configurations of polypeptide chains: structure of proteins of the alphakeratin type. Nature, 171: 5961.
Pauling L (1960). The nature of the chemical bond. Cornell University Press, Ithaca, NY, USA.
Pavlová M, Klvaňa M, Jesenská A, Prokop Z, Konečná H, Sato T, Tsuda M, Nagata Y & Damborský J (2007). The identification of catalytic pentad in the haloalkane dehalogenase DhmA from Mycobacterium avium N85: reaction mechanism and molecular evolution. J. Struct. Biol. 157: 384392.
Pearson AR, Mozzarelli A & Rossi GL (2004). Microspectrophotometry for structural enzymology. Curr. Opin. Struct. Biol. 14: 656662.
Pelletier JN (2001). A RACHITT for our toolbox. Nat. Biotechnol. 19: 314315.
Penel S, Hughes E & Doig AJ (1999). Sidechain structures in the first turn of the alphahelix. J. Mol. Biol. 287: 127143.
Penel S & Doig AJ (2001). Rotamer strain energy in protein helices quantification of a major force opposing protein folding. J. Mol. Biol. 305: 961968.
Perola E, Xu K, Kollmeyer TM, Kaufmann SH, Prendergast FG & Pang YP (2000). Successful virtual screening of a chemical database for farnesyltransferase inhibitor leads. J. Med. Chem. 43: 401408.
Peter J, Hutter W, Stöllnberger W & Hampel W (1996). Detection of chlorinated and brominated hydrocarbons by an ion sensitive whole cell biosensor. Biosens. Bioelectron. 11: 12151219.
Petock JM, Torshin IY, Weber IT & Harrison RW (2003). Analysis of protein structures reveals regions of rare backbone conformation at functional sites. Proteins, 53: 872879.
Petoukhov MV & Svergun DI (2007). Analysis of Xray and neutron scattering from biomacromolecular solutions. Curr. Opin. Struct. Biol. 17: 562571.
Petřek M, Otyepka M, Banáš P, Kosinová P, Koča J & Damborský J (2006). CAVER: a new tool to explore routes from protein clefts, pockets and cavities. BMC Bioinf. 7: 316.
Petřek M, Kosinová P, Koča J & Otyepka M (2007). MOLE: a Voronoi diagrambased explorer of molecular channels, pores, and tunnels. Structure, 15: 13571363.
Phillips JC, Braun R, Wang W, Gumbart J, Tajkhorshid E, Villa E, Chipot C, Skeel RD, Kalé L & Schulten K (2005). Scalable molecular dynamics with NAMD. J. Comput. Chem. 26: 17811802.
Piana S, Carloni P & Parrinello M (2002). Role of conformational fluctuations in the enzymatic reaction of HIV1 protease. J. Mol. Biol. 319: 567583.
Pikkemaat MG, Ridder IS, Rozeboom HJ, Kalk KH, Dijkstra BW & Janssen DB (1999). Crystallographic and kinetic evidence of a collision complex formed during halide import in haloalkane dehalogenase. Biochemistry, 38: 1205212061.
177

References
Pikkemaat MG, Linssen ABM, Berendsen HJC & Janssen DB (2002). Molecular dynamics simulations as a tool for improving protein stability. Protein Eng. 15: 185192.
Pinakoulaki E, Yoshimura H, Daskalakis V, Yoshioka S, Aono S & Varotsis C (2006). Two ligandbinding sites in the O2sensing signal transducer HemAT: Implications for ligand recognition/discrimination and signaling. Proc. Natl. Acad. Sci. U.S.A. 103: 1479614801.
Podust LM, Poulos TL & Waterman MR (2001). Crystal structure of cytochrome P450 14alpha sterol demethylase (CYP51) from Mycobacterium tuberculosis in complex with azole inhibitors. Proc. Natl. Acad. Sci. U.S.A. 98: 30683073.
Poelarends GJ, Wilkens M, Larkin MJ, van Elsas JD & Janssen DB (1998). Degradation of 1,3dichloropropene by Pseudomonas cichorii 170. Appl. Environ. Microbiol. 64: 29312936.
Poelarends GJ, van Hylckama Vlieg JE, Marchesi JR, Freitas Dos Santos LM & Janssen DB (1999). Degradation of 1,2dibromoethane by Mycobacterium sp. strain GP1. J. Bacteriol. 181: 20502058.
Poelarends GJ, Kulakov LA, Larkin MJ, van Hylckama Vlieg JE & Janssen DB (2000a). Roles of horizontal gene transfer and gene integration in evolution of 1,3dichloropropene and 1,2dibromoethanedegradative pathways. J. Bacteriol. 182: 21912199.
Poelarends GJ, Zandstra M, Bosma T, Kulakov LA, Larkin MJ, Marchesi JR, Weightman AJ & Janssen DB (2000b). Haloalkaneutilizing Rhodococcus strains isolated from geographically distinct locations possess a highly conserved gene cluster encoding haloalkane catabolism. J. Bacteriol. 182: 27252731.
Poole AM, Jeffares DC & Penny D (1998). The path from the RNA world. J. Mol. Evol. 46: 117.
Popper KR (1959). The Logic of Scientific Discovery. Hutchinson education, Hutchinson, MN, USA.
Porter CT, Bartlett GJ & Thornton JM (2004). The Catalytic Site Atlas: a resource of catalytic sites and residues identified in enzymes using structural data. Nucleic Acids Res. 32: D129133.
Prasad S, Mazumdar S & Mitra S (2000). Binding of camphor to Pseudomonas putida cytochrome p450(cam): steadystate and picosecond timeresolved fluorescence studies. FEBS Lett. 477: 157160.
Prasad S & Mitra S (2002). Role of protein and substrate dynamics in catalysis by Pseudomonas putida cytochrome P450cam. Biochemistry, 41: 1449914508.
Presta LG & Rose GD (1988). Helix signals in proteins. Science, 240: 16321641.
Price DJ & Brooks III CL (2002). Modern protein force fields behave comparably in molecular dynamics simulations. J. Comput. Chem. 23: 10451057.
Pries F, Kingma J, Pentenga M, van Pouderoyen G, JeronimusStratingh CM, Bruins AP & Janssen DB (1994a). Sitedirected mutagenesis and oxygen isotope incorporation studies of the nucleophilic aspartate of haloalkane dehalogenase. Biochemistry, 33: 12421247.
Pries F, van den Wijngaard AJ, Bos R, Pentenga M & Janssen DB (1994b). The role of spontaneous cap domain mutations in haloalkane dehalogenase specificity and evolution. J. Biol. Chem. 269: 1749017494.
Pries F, Kingma J & Janssen DB (1995a). Activation of an Asp124>Asn mutant of haloalkane dehalogenase by hydrolytic deamidation of asparagine. FEBS Lett. 358: 171174.
Pries F, Kingma J, Krooshof GH, JeronimusStratingh CM, Bruins AP & Janssen DB (1995b). Histidine 289 is essential for hydrolysis of the alkylenzyme intermediate of haloalkane dehalogenase. J. Biol. Chem. 270: 1040510411.
Prince RC (1994). Haloalkane dehalogenase caught in the act. Trends Biochem.Sci. 19: 34.
Prokop Z, Monincová M, Chaloupková R, Klvaňa M, Nagata Y, Janssen DB & Damborský J (2003). Catalytic mechanism of the maloalkane dehalogenase LinB from Sphingomonas paucimobilis UT26. J. Biol. Chem. 278: 4509445100.
Prokop Z, Janssen DB, Sato Y, Nagata Y & Damborský J (2005). Enantioselectivity of haloalkane dehalogenases. Biotrans Symposium: The key to industrial biotechnology (Jul 38, 2005). Delft, The Netherlands.
178

References
Prokop Z, Oplustil F, DeFrank J & Damborský J (2006). Enzymes fight chemical weapons. Biotechnol. J. 1: 13701380.
Pross A (2004). Causation and the origin of life. Metabolism or replication first? Origins Life Evol. Biosphere, 34: 307321.
Prudnikova T, Mozga T, Řezáčová P, Chaloupková R, Sato Y, Nagata Y, Brynda J, Kutý M, Damborský J & KutáSmatanová I (2009). Crystallization and preliminary Xray analysis of a novel haloalkane dehalogenase DbeA from Bradyrhizobium elkani USDA94. Acta Crystallogr., Sect. F: Struct. Biol. Cryst. Commun. 65: 353356.
Puchkaev AV, Koo L S & Ortiz de Montellano PR (2003). Aromatic stacking as a determinant of the thermal stability of CYP119 from Sulfolobus solfataricus. Arch. Biochem. Biophys. 409: 5258.
Pusey ML, Liu Z, Tempel W, Praissman J, Lin D, Wang B, Gavira JA & Ng JD (2005). Life in the fast lane for protein crystallization and Xray crystallography. Prog. Biophys. Mol. Biol. 88: 359386.
Radkiewicz JL & Brooks III CL (2000). Protein dynamics in enzymatic catalysis: exploration of dihydrofolate reductase. J. Am. Chem. Soc. 122: 225231.
Radzicka A & Wolfenden R (1995). A proficient enzyme. Science, 267: 9093.
Raina V, Hauser A, Buser HR, Rentsch D, Sharma P, Lal R, Holliger C, Poiger JT, Müller MD & Kohler HE (2007). Hydroxylated metabolites of beta and deltahexachlorocyclohexane: bacterial formation, stereochemical configuration, and occurrence in groundwater at a former production site. Environ. Sci. Technol. 41: 42924298.
Raina V, Rentsch D, Geiger T, Sharma P, Buser HR, Holliger C, Lal R & Kohler HE (2008). New metabolites in the degradation of alpha and gammahexachlorocyclohexane (HCH): pentachlorocyclohexenes are hydroxylated to cyclohexenols and cyclohexenediols by the haloalkane dehalogenase LinB from Sphingobium indicum B90A. J. Agric. Food Chem. 56: 65946603.
Rajagopalan PTR, Lutz S & Benkovic SJ (2002). Coupling interactions of distal residues enhance dihydrofolate reductase catalysis: mutational effects on hydride transfer rates. Biochemistry, 41: 1261812628.
Ramachandran GN, Ramakrishnan C & Sasisekharan V (1963). Stereochemistry of polypeptide chain configurations. J. Mol. Biol. 7: 9599.
Ramachandran GN (1968). Need for nonplanar peptide units in polypeptide chains. Biopolymers, 6: 14941496.
Ramakrishnan V & Moore PB (2001). Atomic structures at last: the ribosome in 2000. Curr. Opin. Struct. Biol. 11: 144154.
Rarey M, Kramer B, Lengauer T & Klebe G (1996). A fast flexible docking method using an incremental construction algorithm. J. Mol. Biol. 261: 470489.
Reetz MT, Bocola M, Carballeira JD, Zha D & Vogel A (2005). Expanding the range of substrate acceptance of enzymes: combinatorial activesite saturation test. Angew. Chem. Int. Ed. 44: 41924196.
Reetz MT, Wang L & Bocola M (2006a). Directed evolution of enantioselective enzymes: iterative cycles of CASTing for probing proteinsequence space. Angew. Chem. Int. Ed. 45: 12361241.
Reetz MT, Carballeira JD & Vogel A (2006b). Iterative saturation mutagenesis on the basis of B factors as a strategy for increasing protein thermostability. Angew. Chem. Int. Ed. 45: 77457751.
Reetz MT & Carballeira JD (2007). Iterative saturation mutagenesis (ISM) for rapid directed evolution of functional enzymes. Nat. Protoc. 2: 891903.
Reetz MT, Kahakeaw D & Sanchis J (2009). Shedding light on the efficacy of laboratory evolution based on iterative saturation mutagenesis. Mol. Biosyst. 5: 115122.
Reeves GA, Dallman TJ, Redfern OC, Akpor A & Orengo CA (2006). Structural diversity of domain superfamilies in the CATH database. J. Mol. Biol. 360: 725741.
Richards FM & Kundrot CE (1988). Identification of structural motifs from protein coordinate data: secondary structure and firstlevel supersecondary structure. Proteins, 3: 7184.
179

References
Richardson JS (1976). Handedness of crossover connections in beta sheets. Proc. Natl. Acad. Sci. U.S.A. 73: 26192623.
Richardson JS, Getzoff ED & Richardson DC (1978). The beta bulge: a common small unit of nonrepetitive protein structure. Proc. Natl. Acad. Sci. U.S.A. 75: 25742578.
Richardson JS & Richardson DC (1988). Amino acid preferences for specific locations at the ends of alpha helices. Science, 240: 16481652.
Ringe D & Mattos C (1999). Analysis of the binding surfaces of proteins. Med. Res. Rev. 19: 321331.
Ripoll DR, Faerman CH, Axelsen PH, Silman I & Sussman JL (1993). An electrostatic mechanism for substrate guidance down the aromatic gorge of acetylcholinesterase. Proc. Natl. Acad. Sci. U.S.A. 90: 51285132.
Robustelli P, Cavalli A & Vendruscolo M (2008). Determination of protein structures in the solid state from NMR chemical shifts. Structure, 16: 17641769.
Rod TH, Radkiewicz JL & Brooks III CL (2003). Correlated motion and the effect of distal mutations in dihydrofolate reductase. Proc. Natl. Acad. Sci. U.S.A. 100: 69806985.
Rode BM, Eder AH & Yongyai Y (1997). Amino acid sequence preferences of the saltinduced peptide formation reaction in comparison to archaic cell protein composition. Inorg. Chim. Acta, 254: 309314.
Rodnina MV, Beringer M & Wintermeyer W (2007). How ribosomes make peptide bonds. Trends Biochem.Sci. 32: 2026.
Rohl CA & Doig AJ (1996). Models for the 310helix/coil, pihelix/coil, and alphahelix/310helix/coil transitions in isolated peptides. Protein Sci. 5: 16871696.
Roitberg A & Simmerling C (2004). Foreword. J. Mol. Graphics Modell. 22: 317.
Rose GD (1979). Hierarchic organization of domains in globular proteins. J. Mol. Biol. 134: 447470.
Rose GD, Fleming PJ, Banavar JR & Maritan A (2006). A backbonebased theory of protein folding. Proc. Natl. Acad. Sci. U.S.A. 103: 1662316633.
Rosta E, Klähn M & Warshel A (2006). Towards accurate ab initio QM/MM calculations of freeenergy profiles of enzymatic reactions. J. Phys. Chem. B, 110: 29342941.
Roughton FJW & Chance B (1963). 2. Investigation of rates and mechanisms of reactions. In Techniques of Organic Chemistry, Vol. VIII (pp. 703792). John Wiley and Sons, New York, NY, USA.
Rozovsky S & McDermott AE (2001). The time scale of the catalytic loop motion in triosephosphate isomerase. J. Mol. Biol. 310: 259270.
Rueda M, FerrerCosta C, Meyer T, Pérez A, Camps J, Hospital A, Gelpí JL & Orozco M (2007). A consensus view of protein dynamics. Proc. Natl. Acad. Sci. U.S.A. 104: 796801.
RuizMirazo K, Peretó J & Moreno A (2004). A universal definition of life: autonomy and openended evolution. Origins Life Evol. Biosphere, 34: 323346.
Russell RB & Sternberg MJ (1997). Two new examples of protein structural similarities within the structurefunction twilight zone. Protein Eng. 10: 333338.
Russell RB & Ponting CP (1998). Protein fold irregularities that hinder sequence analysis. Curr. Opin. Struct. Biol. 8: 364371.
Russ WP, Lowery DM, Mishra P, Yaffe MB & Ranganathan R (2005). Naturallike function in artificial WW domains. Nature, 437: 579583.
Ryckaert J, Ciccotti G & Berendsen HJC (1977). Numerical integration of the cartesian equations of motion of a system with constraints: molecular dynamics of nalkanes. J. Comput. Phys. 23: 327341.
180

References
Ryoo SW, Park YK, Park S, Shim YS, Liew H, Kang S & Bai G (2007). Comparative proteomic analysis of virulent Korean Mycobacterium tuberculosis Kstrain with other mycobacteria strain following infection of U937 macrophage. J. Microbiol. 45: 268271.
Sali A & Blundell TL (1993). Comparative protein modelling by satisfaction of spatial restraints. J. Mol. Biol. 234: 779815.
Sallis PJ, Armfield SJ, Bull AT & Hardman DJ (1990). Isolation and characterization of a haloalkane halidohydrolase from Rhodococcus erythropolis Y2. J. Gen. Microbiol. 136: 115120.
Samatey FA, Imada K, Nagashima S, Vonderviszt F, Kumasaka T, Yamamoto M & Namba K (2001). Structure of the bacterial flagellar protofilament and implications for a switch for supercoiling. Nature, 410: 331337.
Sanbonmatsu KY & Tung C (2007). High performance computing in biology: multimillion atom simulations of nanoscale systems. J. Struct. Biol. 157: 470480.
Sanger F, Thompson EO & Kitai R (1955). The amide groups of insulin. Biochem. J. 59: 509518.
Sanger F, Air GM, Barrell BG, Brown NL, Coulson AR, Fiddes CA, Hutchison CA, Slocombe PM & Smith M (1977a). Nucleotide sequence of bacteriophage phi X174 DNA. Nature, 265: 687695.
Sanger F, Nicklen S & Coulson AR (1977b). DNA sequencing with chainterminating inhibitors. Proc. Natl. Acad. Sci. U.S.A. 74: 54635467.
Sanger F, Coulson AR, Friedmann T, Air GM, Barrell BG, Brown NL, Fiddes JC, Hutchison CA, Slocombe PM & Smith M (1978). The nucleotide sequence of bacteriophage phiX174. J. Mol. Biol. 125: 225246.
Sanger F (1980). Determination of nucleotide sequences in DNA. In Nobel Lectures Chemistry 19711980 (pp. 431447). World Scientific Publishing Co. (1993), Singapore, Singapore.
Santoro SW & Schultz PG (2002). Directed evolution of the site specificity of Cre recombinase. Proc. Natl. Acad. Sci. U.S.A. 99: 41854190.
Sato Y, Monincová M, Chaloupková R, Prokop Z, Ohtsubo Y, Minamisawa K, Tsuda M, Damborský J & Nagata Y (2005). Two rhizobial strains, Mesorhizobium loti MAFF303099 and Bradyrhizobium japonicum USDA110, encode haloalkane dehalogenases with novel structures and substrate specificities. Appl. Environ. Microbiol. 71: 43724379.
Sato Y, Natsume R, Tsuda M, Damborský J, Nagata Y & Senda T (2007). Crystallization and preliminary crystallographic analysis of a haloalkane dehalogenase, DbjA, from Bradyrhizobium japonicum USDA110. Acta Crystallogr., Sect. F: Struct. Biol. Cryst. Commun. 63: 294296.
Schanstra JP & Janssen DB (1996). Kinetics of halide release of haloalkane dehalogenase: evidence for a slow conformational change. Biochemistry, 35: 56245632.
Schanstra JP, Ridder IS, Heimeriks GJ, Rink R, Poelarends GJ, Kalk KH, Dijkstra BW & Janssen DB (1996a). Kinetic characterization and Xray structure of a mutant of haloalkane dehalogenase with higher catalytic activity and modified substrate range. Biochemistry, 35: 1318613195.
Schanstra JP, Kingma J & Janssen DB (1996b). Specificity and kinetics of haloalkane dehalogenase. J. Biol. Chem. 271: 1474714753.
Schanstra JP, Ridder A, Kingma J & Janssen DB (1997). Influence of mutations of Val226 on the catalytic rate of haloalkane dehalogenase. Protein Eng. 10: 5361.
Scheiner S, Kar T & Gu Y (2001). Strength of the Calpha H..O hydrogen bond of amino acid residues. J. Biol. Chem. 276: 98329837.
Schiffer M & Edmundson AB (1967). Use of helical wheels to represent the structures of proteins and to identify segments with helical potential. Biophys. J. 7: 121135.
Schindler JF, Naranjo PA, Honaberger DA, Chang CH, Brainard JR, Vanderberg LA & Unkefer CJ (1999). Haloalkane dehalogenases: steadystate kinetics and halide inhibition. Biochemistry, 38: 57725778.
181

References
Schleinkofer K, Sudarko, Winn PJ, Lüdemann SK & Wade RC (2005). Do mammalian cytochrome P450s show multiple ligand access pathways and ligand channelling? EMBO Rep. 6: 584589.
Schlitter J, Engels M, Krüger P, Jacoby E & Wollmer A (1993). Targeted molecular dynamics simulation of conformational change – application to the T R transition in insulin. ↔ Mol. Simulation, 10: 291.
Schmidt A & Lamzin VS (2007). From atoms to proteins. Cell. Mol. Life Sci. 64: 19591969.
SchmidtDannert C (2001). Directed evolution of single proteins, metabolic pathways, and viruses. Biochemistry, 40: 1312513136.
Schmitt J, Brocca S, Schmid RD & Pleiss J (2002). Blocking the tunnel: engineering of Candida rugosa lipase mutants with short chain length specificity. Protein Eng. 15: 595601.
Scholtz JM, Marqusee S, Baldwin RL, York EJ, Stewart JM, Santoro M & Bolen DW (1991). Calorimetric determination of the enthalpy change for the alphahelix to coil transition of an alanine peptide in water. Proc. Natl. Acad. Sci. U.S.A. 88: 28542858.
Scholtz R, Leisinger T, Suter F & Cook AM (1987). Characterization of 1chlorohexane halidohydrolase, a dehalogenase of wide substrate range from an Arthrobacter sp. J. Bacteriol. 169: 50165021.
Schomburg I, Chang A, Ebeling C, Gremse M, Heldt C, Huhn G & Schomburg D (2004). BRENDA, the enzyme database: updates and major new developments. Nucleic Acids Res. 32: D431433.
Schönbrunner N, Wey J, Engels J, Georg H & Kiefhaber T (1996). Nativelike betastructure in a trifluoroethanolinduced partially folded state of the allbetasheet protein tendamistat. J. Mol. Biol. 260: 432445.
Schotte F, Lim M, Jackson TA, Smirnov AV, Soman J, Olson JS, Phillips GN, Wulff M & Anfinrud PA (2003). Watching a protein as it functions with 150ps timeresolved xray crystallography. Science, 300: 19441947.
Schotte F, Soman J, Olson JS, Wulff M & Anfinrud PA (2004). Picosecond timeresolved Xray crystallography: probing protein function in real time. J. Struct. Biol. 147: 235246.
Schwede T, Kopp J, Guex N & Peitsch MC (2003). SWISSMODEL: an automated protein homologymodeling server. Nucl. Acids Res., 31: 33813385.
Schwehm JM, Fitch CA, Dang BN, GarcíaMoreno EB & Stites WE (2003). Changes in stability upon charge reversal and neutralization substitution in staphylococcal nuclease are dominated by favorable electrostatic effects. Biochemistry, 42: 11181128.
Scott EE, Gibson QH & Olson JS (2001). Mapping the pathways for O2 entry into and exit from myoglobin. J. Biol. Chem. 276: 51775188.
Scott EE, He YQ & Halpert JR (2002). Substrate routes to the buried active site may vary among cytochromes P450: mutagenesis of the FG region in P450 2B1. Chem. Res. Toxicol. 15: 14071413.
Seifert A, Tatzel S, Schmid RD & Pleiss J (2006). Multiple molecular dynamics simulations of human p450 monooxygenase CYP2C9: the molecular basis of substrate binding and regioselectivity toward warfarin. Proteins, 64: 147155.
Senn HM & Thiel W (2009). QM/MM methods for biomolecular systems. Angew. Chem. Int. Ed. 48: 11981229.
Sen S, Venkata Dasu V & Mandal B (2007). Developments in directed evolution for improving enzyme functions. Appl. Biochem. Biotechnol. 143: 212223.
Serrano L, Bycroft M & Fersht AR (1991). Aromaticaromatic interactions and protein stability. Investigation by doublemutant cycles. J. Mol. Biol. 218: 465475.
Serrano L & Fersht AR (1989). Capping and alphahelix stability. Nature, 342: 296299.
Serrano L, Horovitz A, Avron B, Bycroft M & Fersht AR (1990). Estimating the contribution of engineered surface electrostatic interactions to protein stability by using doublemutant cycles. Biochemistry, 29: 93439352.
182

References
Sevinc MS, Maté MJ, Switala J, Fita I & Loewen PC (1999). Role of the lateral channel in catalase HPII of Escherichia coli. Protein Sci. 8: 490498.
Shen Y, Lange O, Delaglio F, Rossi P, Aramini JM, Liu G, Eletsky A, Wu Y, Singarapu KK, Lemak A, Ignatchenko A, Arrowsmith CH, Szyperski T, Montelione GT, Baker D & Bax A (2008). Consistent blind protein structure generation from NMR chemical shift data. Proc. Natl. Acad. Sci. U.S.A. 105: 46854690.
Shen Y, Vernon R, Baker D & Bax A (2009). De novo protein structure generation from incomplete chemical shift assignments. J Biomol. NMR, 43: 6378.
Shepherd JC (1981). Periodic correlations in DNA sequences and evidence suggesting their evolutionary origin in a commaless genetic code. J. Mol. Evol. 17: 94102.
Sheridan RP, Levy RM & Salemme FR (1982). alphaHelix dipole model and electrostatic stabilization of 4alphahelical proteins. Proc. Natl. Acad. Sci. U.S.A. 79: 45454549.
Shine J & Dalgarno L (1975). Determinant of cistron specificity in bacterial ribosomes. Nature, 254: 3438.
Shirts M & Pande VS (2000). COMPUTING: Screen savers of the world unite! Science, 290: 19031904.
Shoemaker KR, Kim PS, Brems DN, Marqusee S, York EJ, Chaiken IM, Stewart JM & Baldwin RL (1985). Nature of the chargedgroup effect on the stability of the Cpeptide helix. Proc. Natl. Acad. Sci. U.S.A. 82: 23492353.
Shoemaker KR, Kim PS, York EJ, Stewart JM & Baldwin RL (1987). Tests of the helix dipole model for stabilization of alphahelices. Nature, 326: 563567.
Shurki A, Strajbl M, Villà J & Warshel A (2002). How much do enzymes really gain by restraining their reacting fragments? J. Am. Chem. Soc. 124: 40974107.
Silberstein M, Dennis S, Brown L, Kortvelyesi T, Clodfelter K & Vajda S (2003). Identification of substrate binding sites in enzymes by computational solvent mapping. J. Mol. Biol. 332: 10951113.
Silberstein M, Damborský J & Vajda S (2007). Exploring the binding sites of the haloalkane dehalogenase DhlA from Xanthobacter autotrophicus GJ10. Biochemistry, 46: 92399249.
Skjaerven L, Hollup SM & Reuter N (2009). Normal mode analysis for proteins. J. Mol. Struct. 898: 4248.
Skjøt M, De Maria L, Chatterjee R, Svendsen A, Patkar SA, Ostergaard PR & Brask J (2009). Understanding the plasticity of the alpha/beta hydrolase fold: lid swapping on the Candida antarctica lipase B results in chimeras with interesting biocatalytic properties. Eur. J. Chem. Biol. 10: 520527.
Smith DE & Dang LX (1994). Computer simulations of NaCl association in polarizable water. J. Chem. Phys. 100: 37573766.
Smith LJ, Redfield C, Smith RA, Dobson CM, Clore GM, Gronenborn AM, Walter MR, Naganbushan TL & Wlodawer A (1994). Comparison of four independently determined structures of human recombinant interleukin4. Nat. Struct. Biol. 1: 301310.
Sobolev V, Wade RC, Vriend G & Edelman M (1996). Molecular docking using surface complementarity. Proteins, 25: 120129.
Socolich M, Lockless SW, Russ WP, Lee H, Gardner KH & Ranganathan R (2005). Evolutionary information for specifying a protein fold. Nature, 437: 512518.
Söll D, Ohtsuka E, Jones DS, Lohrmann R, Hayatsu H, Nishimura S & Khorana HG (1965). Studies on polynucleotides, XLIX. Stimulation of the binding of aminoacylsRNA's to ribosomes by ribotrinucleotides and a survey of codon assignments for 20 amino acids. Proc. Natl. Acad. Sci. U.S.A. 54: 13781385.
Soriano A, Silla E, Tuñón I & RuizLópez MF (2005). Dynamic and electrostatic effects in enzymatic processes. An analysis of the nucleophilic substitution reaction in haloalkane dehalogenase. J. Am. Chem. Soc. 127: 19461957.
Sousa SF, Fernandes PA & Ramos MJ (2006). Proteinligand docking: current status and future challenges. Proteins, 65: 1526.
183

References
Spera S & Bax A (1991). Empirical correlation between protein backbone conformation and C.alpha. and C.beta. 13C nuclear magnetic resonance chemical shifts. J. Am. Chem. Soc. 113: 54905492.
Sprangers R, Gribun A, Hwang PM, Houry WA & Kay LE (2005). Quantitative NMR spectroscopy of supramolecular complexes: dynamic side pores in ClpP are important for product release. Proc. Natl. Acad. Sci. U.S.A. 102: 1667816683.
Srajer V, Ren Z, Teng T, Schmidt M, Ursby T, Bourgeois D, Pradervand C, Schildkamp W, Wulff M & Moffat K (2001). Protein conformational relaxation and ligand migration in myoglobin: a nanosecond to millisecond molecular movie from timeresolved Laue Xray diffraction. Biochemistry, 40: 1380213815.
Sreerama N & Woody RW (1993). A selfconsistent method for the analysis of protein secondary structure from circular dichroism. Anal. Biochem. 209: 3244.
Steitz TA & Moore PB (2003). RNA, the first macromolecular catalyst: the ribosome is a ribozyme. Trends Biochem.Sci. 28: 411418.
Stemmer WPC (1994a). Rapid evolution of a protein in vitro by DNA shuffling. Nature, 370: 389391.
Stemmer WPC (1994b). DNA shuffling by random fragmentation and reassembly: in vitro recombination for molecular evolution. Proc. Natl. Acad. Sci. U.S.A. 91: 1074710751.
Stewart JJ (1990). MOPAC: a semiempirical molecular orbital program. J. Comput. Aided Mol. Des. 4: 1105.
Stickle DF, Presta LG, Dill KA & Rose GD (1992). Hydrogen bonding in globular proteins. J. Mol. Biol. 226: 11431159.
Stranzl GR, Gruber K, Steinkellner G, Zangger K, Schwab H & Kratky C (2004). Observation of a short, strong hydrogen bond in the active site of hydroxynitrile lyase from Hevea brasiliensis explains a large pKa shift of the catalytic base induced by the reaction intermediate. J. Biol. Chem. 279: 36993707.
Strasser A & Wittmann H (2007). LigPath: a module for predictive calculation of a ligand's pathway into a receptorapplication to the gpH1receptor. J. Mol. Model. 13: 209218.
StraszewskiChavez SL, Visintin IP, Karassina N, Los G, Liston P, Halaban R, Fadiel A & Mor G (2007). XAF1 mediates tumor necrosis factoralphainduced apoptosis and Xlinked inhibitor of apoptosis cleavage by acting through the mitochondrial pathway. J. Biol. Chem. 282: 1305913072.
Streltsov VA, Prokop Z, Damborský J, Nagata Y, Oakley A & Wilce MCJ (2003). Haloalkane dehalogenase LinB from Sphingomonas paucimobilis UT26: Xray crystallographic studies of dehalogenation of brominated substrates. Biochemistry, 42: 1010410112.
Strop P & Mayo SL (2000). Contribution of surface salt bridges to protein stability. Biochemistry, 39: 12511255.
Stsiapanava A, Koudelaková T, Lapkouski M, Pavlová M, Damborský J & KutáSmatanová I (2008). Crystals of DhaA mutants from Rhodococcus rhodochrous NCIMB 13064 diffracted to ultrahigh resolution: crystallization and preliminary diffraction analysis. Acta Crystallogr., Sect. F: Struct. Biol. Cryst. Commun. 64: 137140.
Stucki G & Thueer M (1995). Experiences of a largescale application of 1,2dichloroethane degrading microorganisms for groundwater treatment. Environ. Sci. Technol. 29: 23392345.
Sugita Y & Okamoto Y (1999). Replicaexchange molecular dynamics method for protein folding. Chem. Phys. Lett. 314: 141151.
Sullivan SM & Holyoak T (2008). Enzymes with lidgated active sites must operate by an induced fit mechanism instead of conformational selection. Proc. Natl. Acad. Sci. U.S.A. 105: 1382913834.
Sundaralingam M & Sekharudu YC (1989). Waterinserted alphahelical segments implicate reverse turns as folding intermediates. Science, 244: 13331337.
Svendsen S, Zimprich C, McDougall MG, Klaubert DH & Los GV (2008). Spatial separation and bidirectional trafficking of proteins using a multifunctional reporter. BMC Cell Biol. 9: 17.
Szathmáry E (1999). The origin of the genetic code: amino acids as cofactors in an RNA world. Trends Genet. 15: 223229.
184

References
Takano K, Funahashi J, Yamagata Y, Fujii S & Yutani K (1997). Contribution of water molecules in the interior of a protein to the conformational stability. J. Mol. Biol. 274: 132142.
Tanford C, De PK & Taggart VG (1960). The role of the helix in the structure of proteins. Optical rotatory dispersion of α βlactoglobulin. J. Am. Chem. Soc. 82: 60286034.
Tao H & Cornish VW (2002). Milestones in directed enzyme evolution. Curr. Opin. Chem. Biol. 6: 858864.
Tara S, Helms V, Straatsma TP & McCammon JA (1999). Molecular dynamics of mouse acetylcholinesterase complexed with huperzine A. Biopolymers, 50: 347359.
Taylor JS & Burnett RM (2000). DARWIN: a program for docking flexible molecules. Proteins, 41: 173191.
Teague SJ (2003). Implications of protein flexibility for drug discovery. Nat. Rev. Drug Discovery, 2: 527541.
Teeter MM (2004). Myoglobin cavities provide interior ligand pathway. Protein Sci. 13: 313318.
Teichmann SA, Chothia C & Gerstein M (1999). Advances in structural genomics. Curr. Opin. Struct. Biol. 9: 390399.
Teichmann SA, Rison SC, Thornton JM, Riley M, Gough J & Chothia C (2001). The evolution and structural anatomy of the small molecule metabolic pathways in Escherichia coli. J. Mol. Biol. 311: 693708.
Teng Q (2005). Protein structure determination from NMR data. In Structural Biology: Practical NMR Applications (pp. 211243). Springer Science+Business Media, New York, NY, USA.
Thapar R, Nicholson EM, Rajagopal P, Waygood EB, Scholtz JM & Klevit RE (1996). Influence of Ncap mutations on the structure and stability of Escherichia coli HPr. Biochemistry, 35: 1126811277.
Todd AE, Orengo CA & Thornton JM (2001). Evolution of function in protein superfamilies, from a structural perspective. J. Mol. Biol. 307: 11131143.
Todd AE, Orengo CA & Thornton JM (2002). Plasticity of enzyme active sites. Trends Biochem.Sci. 27: 419426.
Tolman JR & Ruan K (2006). NMR residual dipolar couplings as probes of biomolecular dynamics. Chem. Rev. 106: 17201736.
Tomita A, Sato T, Ichiyanagi K, Nozawa S, Ichikawa H, Chollet M, Kawai F, Park S, Tsuduki T, Yamato T, Koshihara S & Adachi S (2009). Visualizing breathing motion of internal cavities in concert with ligand migration in myoglobin. Proc. Natl. Acad. Sci. U.S.A. 106: 26122616.
Toniolo C (1980). Intramolecularly hydrogenbonded peptide conformations. CRC Crit. Rev. Biochem. 9: 144.
Torz M, Wietzes P, Beschkov V & Janssen DB (2007). Metabolism of mono and dihalogenated C1 and C2 compounds by Xanthobacter autotrophicus growing on 1,2dichloroethane. Biodegradation, 18: 145157.
Tousignant A & Pelletier JN (2004). Protein motions promote catalysis. Chem. Biol. 11: 10371042.
Trevors JT & Abel DL (2004). Chance and necessity do not explain the origin of life. Cell Biol. Int. 28: 729739.
Trifonov EN (2004). The triplet code from first principles. J. Biomol. Struct. Dyn. 22: 111.
Triglia T, Peterson MG & Kemp DJ (1988). A procedure for in vitro amplification of DNA segments that lie outside the boundaries of known sequences. Nucleic Acids Res. 16: 8186.
Trosset J & Scheraga HA (1999). PRODOCK: Software package for protein modeling and docking. J. Comput. Chem. 20: 412427.
Tugarinov V, Ollerenshaw JE & Kay LE (2005a). Probing sidechain dynamics in high molecular weight proteins by deuterium NMR spin relaxation: an application to an 82kDa enzyme. J. Am. Chem. Soc. 127: 82148225.
Tugarinov V, Choy W, Orekhov VY & Kay LE (2005b). Solution NMRderived global fold of a monomeric 82kDa enzyme. Proc. Natl. Acad. Sci. U.S.A. 102: 622627.
UniProt Consortium (2009). The Universal Protein Resource (UniProt) 2009. Nucleic Acids Res. 37: D169174.
185

References
Unwin PN & Henderson R (1975). Molecular structure determination by electron microscopy of unstained crystalline specimens. J. Mol. Biol. 94: 425440.
Valdar WS & Thornton JM (2001). Conservation helps to identify biologically relevant crystal contacts. J. Mol. Biol. 313: 399416.
Valencia A (2005). Automatic annotation of protein function. Curr. Opin. Struct. Biol. 15: 267274.
Valuev VP, Afonnikov DA, Ponomarenko MP, Milanesi L & Kolchanov NA (2002). ASPD (Artificially Selected Proteins/Peptides Database): a database of proteins and peptides evolved in vitro. Nucleic Acids Res. 30: 200202.
Van Belle D, De Maria L, Iurcu G & Wodak SJ (2000). Pathways of ligand clearance in acetylcholinesterase by multiple copy sampling. J. Mol. Biol. 298: 705726.
Van Der Spoel D, Lindahl E, Hess B, Groenhof G, Mark AE & Berendsen HJC (2005). GROMACS: fast, flexible, and free. J. Comput. Chem. 26: 17011718.
Vargas R, Garza J, Dixon DA & Hay BP (2000). How strong is the C −H...OC hydrogen bond? α J. Am. Chem. Soc. 122: 47504755.
Váró G, Needleman R & Lanyi JK (1995). Lightdriven chloride ion transport by halorhodopsin from Natronobacterium pharaonis. 2. Chloride release and uptake, protein conformation change, and thermodynamics. Biochemistry, 34: 1450014507.
Venkatachalam CM (1968). Stereochemical criteria for polypeptides and proteins. V. Conformation of a system of three linked peptide units. Biopolymers, 6: 14251436.
Verschueren KH, Kingma J, Rozeboom HJ, Kalk KH, Janssen DB & Dijkstra BW (1993a). Crystallographic and fluorescence studies of the interaction of haloalkane dehalogenase with halide ions. Studies with halide compounds reveal a halide binding site in the active site. Biochemistry, 32: 90319037.
Verschueren KH, Franken SM, Rozeboom HJ, Kalk KH & Dijkstra BW (1993b). Noncovalent binding of the heavy atom compound [Au(CN)2] at the halide binding site of haloalkane dehalogenase from Xanthobacter autotrophicus GJ10. FEBS Lett. 323: 267270.
Verschueren KH, Franken SM, Rozeboom HJ, Kalk KH & Dijkstra BW (1993c). Refined Xray structures of haloalkane dehalogenase at pH 6.2 and pH 8.2 and implications for the reaction mechanism. J. Mol. Biol. 232: 856872.
Verschueren KH, Seljée F, Rozeboom HJ, Kalk KH & Dijkstra BW (1993d). Crystallographic analysis of the catalytic mechanism of haloalkane dehalogenase. Nature, 363: 693698.
Villa J & Warshel A (2001). Energetics and dynamics of enzymatic reactions. J. Phys. Chem. B, 105: 78877907.
Vitkup D, Melamud E, Moult J & Sander C (2001). Completeness in structural genomics. Nat. Struct. Biol. 8: 559566.
Vlassov AV, Kazakov SA, Johnston BH & Landweber LF (2005). The RNA world on ice: a new scenario for the emergence of RNA information. J. Mol. Evol. 61: 264273.
Voet DJ, Voet JG, & Pratt CW (1999). Fundamentals of biochemistry. John Wiley and Sons, New York, NY, USA.
Vriend G (1990). WHAT IF: a molecular modeling and drug design program. J. Mol. Graphics, 8: 5256.
Wada A (1976). The alphahelix as an electric macrodipole. Adv. Biophys. 9: 163.
Wada H, Senoo K & Takai Y (1989). Rapid degradation of gammaHCH in upland soil after multiple applications. Soil Sci. Plant Nutr. 35: 7177.
Wade RC, Davis ME, Luty BA, Madura JD & McCammon JA (1993). Gating of the active site of triose phosphate isomerase: Brownian dynamics simulations of flexible peptide loops in the enzyme. Biophys. J. 64: 915.
Wade RC, Gabdoulline RR, Lüdemann SK & Lounnas V (1998). Electrostatic steering and ionic tethering in enzymeligand binding: insights from simulations. Proc. Natl. Acad. Sci. U.S.A. 95: 59425949.
186

References
Wade RC, Winn PJ, Schlichting I & Sudarko (2004). A survey of active site access channels in cytochromes P450. J. Inorg. Biochem. 98: 11751182.
Waldburger CD, Schildbach JF & Sauer RT (1995). Are buried salt bridges important for protein stability and conformational specificity? Nat. Struct. Biol. 2: 122128.
Wallace AC, Laskowski RA & Thornton JM (1995). LIGPLOT: a program to generate schematic diagrams of proteinligand interactions. Protein Eng. 8: 127134.
Wallace AC, Borkakoti N & Thornton JM (1997). TESS: a geometric hashing algorithm for deriving 3D coordinate templates for searching structural databases. Application to enzyme active sites. Protein Sci. 6: 23082323.
Wang J, Cieplak P & Kollman PA (2000). How well does a restrained electrostatic potential (RESP) model perform in calculating conformational energies of organic and biological molecules? J. Comput. Chem. 21: 10491074.
Wang L, Brock A, Herberich B & Schultz PG (2001). Expanding the genetic code of Escherichia coli. Science, 292: 498500.
Wang T & Duan Y (2007). Chromophore channeling in the Gprotein coupled receptor rhodopsin. J. Am. Chem. Soc. 129: 69706971.
Wang Y & Jardetzky O (2002). Probabilitybased protein secondary structure identification using combined NMR chemicalshift data. Protein Sci. 11: 852861.
Warshel A & Levitt M (1976). Theoretical studies of enzymic reactions: dielectric, electrostatic and steric stabilization of the carbonium ion in the reaction of lysozyme. J. Mol. Biol. 103: 227249.
Warshel A (1978). Energetics of enzyme catalysis. Proc. Natl. Acad. Sci. U.S.A. 75: 52505254.
Warshel A (1991). Computer modeling of chemical reactions in enzymes and solutions. John Wiley and Sons, New York, NY, USA.
Warshel A & Papazyan A (1998). Electrostatic effects in macromolecules: fundamental concepts and practical modeling. Curr. Opin. Struct. Biol. 8: 211217.
Warshel A & Florián J (1998). Computer simulations of enzyme catalysis: finding out what has been optimized by evolution. Proc. Natl. Acad. Sci. U.S.A. 95: 59505955.
Warshel A, Strajbl M, Villa J & Florián J (2000). Remarkable rate enhancement of orotidine 5‘monophosphate decarboxylase is due to transitionstate stabilization rather than to groundstate destabilization. Biochemistry, 39: 1472814738.
Warshel A (2003). Computer simulations of enzyme catalysis: methods, progress, and insights. Annu. Rev. Biophys. Biomol. Struct. 32: 425443.
Warshel A, Sharma PK, Kato M, Xiang Y, Liu H & Olsson MHM (2006). Electrostatic basis for enzyme catalysis. Chem. Rev. 106: 32103235.
Waterhous DV & Johnson WC (1994). Importance of environment in determining secondary structure in proteins. Biochemistry, 33: 21212128.
Watney JB, Agarwal PK & HammesSchiffer S (2003). Effect of mutation on enzyme motion in dihydrofolate reductase. J. Am. Chem. Soc. 125: 37453750.
Watson JD, Laskowski RA & Thornton JM (2005). Predicting protein function from sequence and structural data. Curr. Opin. Struct. Biol. 15: 275284.
Weaver TM (2000). The pihelix translates structure into function. Protein Sci. 9: 201206.
Weber AL & Miller SL (1981). Reasons for the occurrence of the twenty coded protein amino acids. J. Mol. Evol. 17: 273284.
Weiner PK & Kollman PA (1981). AMBER: Assisted model building with energy refinement. A general program for modeling molecules and their interactions. J. Comput. Chem. 2: 287303.
187

References
Welch M, Villalobos A, Gustafsson C & Minshull J (2009). You're one in a googol: optimizing genes for protein expression. J. R. Soc. Interface, 6 Suppl 4: S467476.
Welch W, Ruppert J & Jain AN (1996). Hammerhead: fast, fully automated docking of flexible ligands to protein binding sites. Chem. Biol. 3: 449462.
Wen Z, Baudry J, Berenbaum MR & Schuler MA (2005). Ile115Leu mutation in the SRS1 region of an insect cytochrome P450 (CYP6B1) compromises substrate turnover via changes in a predicted product release channel. Protein Eng. Des. Sel. 18: 191199.
Whisstock JC & Lesk AM (2003). Prediction of protein function from protein sequence and structure. Q. Rev. Biophys. 36: 307340.
White HB (1976). Coenzymes as fossils of an earlier metabolic state. J. Mol. Evol. 7: 101104.
van den Wijngaard AJ, van der Kamp KW, van der Ploeg J, Pries F, Kazemier B & Janssen DB (1992). Degradation of 1,2dichloroethane by Ancylobacter aquaticus and other facultative methylotrophs. Appl. Environ. Microbiol. 58: 976983.
van den Wijngaard AJ, Wind RD & Janssen DB (1993). Kinetics of bacterial growth on chlorinated aliphatic compounds. Appl. Environ. Microbiol. 59: 20412048.
Williams GJ, Nelson AS & Berry A (2004). Directed evolution of enzymes for biocatalysis and the life sciences. Cell. Mol. Life Sci. 61, 30343046.
Williams MA, Goodfellow JM & Thornton JM (1994). Buried waters and internal cavities in monomeric proteins. Protein Sci. 3: 12241235.
Wilson G, Hecht L & Barron LD (1996). Residual structure in unfolded proteins revealed by Raman optical activity. Biochemistry, 35: 1251812525.
Wilson J, Decius JG, Cross PG & Lagemann RT (1955). Molecular vibrations. Am. J. Phys. 23: 550.
Wilson MA & Brunger AT (2000). The 1.0 Å crystal structure of Ca(2+)bound calmodulin: an analysis of disorder and implications for functionally relevant plasticity. J. Mol. Biol. 301: 12371256.
Winn MD, Isupov MN, & Murshudov GN (2001). Use of TLS parameters to model anisotropic displacements in macromolecular refinement. Acta Crystallogr., Sect. D: Biol. Crystallogr. 57: 122133.
Winn PJ, Lüdemann SK, Gauges R, Lounnas V & Wade RC (2002). Comparison of the dynamics of substrate access channels in three cytochrome P450s reveals different opening mechanisms and a novel functional role for a buried arginine. Proc. Natl. Acad. Sci. U.S.A. 99: 53615366.
Wishart DS, Arndt D, Berjanskii M, Tang P, Zhou J & Lin G (2008). CS23D: a web server for rapid protein structure generation using NMR chemical shifts and sequence data. Nucleic Acids Res. 36: W496502.
Wishart DS & Sykes BD (1994). The 13C chemicalshift index: a simple method for the identification of protein secondary structure using 13C chemicalshift data. J Biomol. NMR, 4: 171180.
Wlodawer A, Minor W, Dauter Z & Jaskolski M (2008). Protein crystallography for noncrystallographers, or how to get the best (but not more) from published macromolecular structures. FEBS J. 275: 121.
Wlodek ST, Clark TW, Scott LR & McCammon JA (1997). Molecular dynamics of acetylcholinesterase dimer complexed with tacrine. J. Am. Chem. Soc. 119: 95139522.
Woese CR (2001). Translation: in retrospect and prospect. RNA, 7: 10551067.
Wolfenden R (1969). Transition state analogues for enzyme catalysis. Nature, 223: 704705.
Wolfenden R (1974). Enzyme catalysis: conflicting requirements of substrate access and transition state affinity. Mol. Cell. Biochem. 3: 207211.
188

References
Wolfenden R & Snider MJ (2001). The depth of chemical time and the power of enzymes as catalysts. Acc. Chem. Res. 34: 938945.
WolfWatz M, Thai V, HenzlerWildman K, Hadjipavlou G, Eisenmesser EZ & Kern D (2004). Linkage between dynamics and catalysis in a thermophilicmesophilic enzyme pair. Nat. Struct. Mol. Biol. 11: 945949.
Wombacher R, Keiper S, Suhm S, Serganov A, Patel DJ & Jäschke A (2006). Control of stereoselectivity in an enzymatic reaction by backdoor access. Angew. Chem. Int. Ed. 45: 24692472.
Wong TS, Tee KL, Hauer B & Schwaneberg U (2004). Sequence saturation mutagenesis (SeSaM): a novel method for directed evolution. Nucleic Acids Res. 32: e26.
Woycechowsky KJ, Vamvaca K & Hilvert D (2007). Novel enzymes through design and evolution. Adv. Enzymol. Relat. Areas Mol. Biol. 75: 241294.
Wriggers W & Schulten K (1999). Investigating a back door mechanism of actin phosphate release by steered molecular dynamics. Proteins, 35: 262273.
Wu J, Hong Q, Han P, He J & Li S (2007). A gene linB2 responsible for the conversion of betaHCH and 2,3,4,5,6pentachlorocyclohexanol in Sphingomonas sp. BHCA. Appl. Microbiol. Biotechnol. 73: 10971105.
Xiong H, Buckwalter BL, Shieh HM & Hecht MH (1995). Periodicity of polar and nonpolar amino acids is the major determinant of secondary structure in selfassembling oligomeric peptides. Proc. Natl. Acad. Sci. U.S.A. 92: 63496353.
Xu Y, Shen J, Luo X, Silman I, Sussman JL, Chen K & Jiang H (2003). How does huperzine A enter and leave the binding gorge of acetylcholinesterase? Steered molecular dynamics simulations. J. Am. Chem. Soc. 125: 1134011349.
Yaffe E, Fishelovitch D, Wolfson HJ, Halperin D & Nussinov R (2008). MolAxis: efficient and accurate identification of channels in macromolecules. Proteins, 73: 7286.
Yang AS, Hitz B & Honig B (1996). Free energy determinants of secondary structure formation: III. betaturns and their role in protein folding. J. Mol. Biol. 259: 873882.
Yang AS & Honig B (1995a). Free energy determinants of secondary structure formation: I. alphaHelices. J. Mol. Biol. 252: 351365.
Yang AS & Honig B (1995b). Free energy determinants of secondary structure formation: II. Antiparallel betasheets. J. Mol. Biol. 252: 366376.
Yao H, McCullough CR, Costache AD, Pullela PK & Sem DS (2007). Structural evidence for a functionally relevant second camphor binding site in P450cam: model for substrate entry into a P450 active site. Proteins, 69: 125138.
Yarus M (1988). A specific amino acid binding site composed of RNA. Science, 240: 17511758.
Yarus M & Christian EL (1989). Genetic code origins. Nature, 342: 349350.
Yarus M (1998). Amino acids as RNA ligands: a directRNAtemplate theory for the code's origin. J. Mol. Evol. 47: 109117.
Yarus M (1999). Boundaries for an RNA world. Curr. Opin. Chem. Biol. 3: 260267.
Ye X, Yu A & Champion PM (2006). Dynamics of nitric oxide rebinding and escape in horseradish peroxidase. J. Am. Chem. Soc. 128: 14441445.
Yokota T, Omori T & Kodama T (1987). Purification and properties of haloalkane dehalogenase from Corynebacterium sp. strain m153. J. Bacteriol. 169: 40494054.
Yonetani T, Tsuneshige A, Zhou Y & Chen X (1998). Electron paramagnetic resonance and oxygen binding studies of alphanitrosyl hemoglobin. A novel oxygen carrier having noassisted allosteric functions. J. Biol. Chem. 273: 2032320333.
Yonetani T & Laberge M (2008). Protein dynamics explain the allosteric behaviors of hemoglobin. Biochim. Biophys. Acta, 1784: 11461158.
189

References
Yu EW & Koshland Jr. DE (2001). Propagating conformational changes over long (and short) distances in proteins. Proc. Natl. Acad. Sci. U.S.A. 98: 95179520.
Zeeb M & Balbach J (2004). Protein folding studied by realtime NMR spectroscopy. Methods, 34: 6574.
Zelent B, Kaposi A, Nucci N, Sharp K, Dalosto S, Wright W & Vanderkooi J (2004). Water channel of horseradish peroxidase studied by the chargetransfer absorption band of ferric heme. J. Phys. Chem. B, 108: 1031710324.
Zhang Y, Perry K, Vinci VA, Powell K, Stemmer WPC & del Cardayré SB (2002). Genome shuffling leads to rapid phenotypic improvement in bacteria. Nature, 415: 644646.
Zhao H, Chockalingam K & Chen Z (2002). Directed evolution of enzymes and pathways for industrial biocatalysis. Curr. Opin. Biotechnol. 13: 104110.
Zhou HX, Wlodek ST & McCammon JA (1998). Conformation gating as a mechanism for enzyme specificity. Proc. Natl. Acad. Sci. U.S.A. 95: 92809283.
Zhou Y, Zheng Q, Li Z, Zhang Y, Sun M, Sun C, Si D, Cai L, Guo Y & Zhou H (2006). On the human CYP2C9*13 variant activity reduction: a molecular dynamics simulation and docking study. Biochimie, 88: 14571465.
Zhu G, Xia Y, Nicholson L K & Sze KH (2000). Protein dynamics measurements by TROSYbased NMR experiments. J. Magn. Reson. 143: 423426.
Zwanzig R (1992). Dynamical disorder: Passage through a fluctuating bottleneck. J. Chem. Phys. 97: 35873589.
190

List of tables and figures
It's only natural, actual facts are thrown at you; the impact'll blow trees back and crack statues.
Jason Hunter―
Fig 1 | PICERAS. [16]Fig 2 | Two hypotheses on the origin of life. [16]Table 1 | Sequence of the amino acids in the order in which they were coded for. [17]Table 2 | Origin of genetic code. [17]Table 3 | Symmetrical representation of universal genetic code. [18]Table 4 | Hypotheses related to the origin of life. [19]Table 5 | Structure of amino acids. [2021]Fig 3 | Physicochemical properties of amino acids. [22]Fig 4 | Mainchain dihedral angles. [23]Table 6 | Properties of helical conformations. [23]Fig 5 | Geometry of helical conformations. [24]Fig 6 | Geometry of sheet. β [26]Fig 7 | An example of a globular protein (cytochrome P450eryF from Saccharopolyspora erythraea; PDB ID 1Z8O). [27]Fig 8 | Protein folding hypotheses. [29]Fig 9 | Top7 de novo fold. [31]Fig 10 | Langmuir isotherm for proteinligand complex formation as a function of ligand concentration. [33]Fig 11 | Reaction progress curves for the loss of substrate and production of product during enzymecatalysed reaction. [35]Fig 12 | Substrate dependence of enzymecatalysed reaction velocities. [35]Fig 13 | Three types of inhibitor interactions with the enzyme. [38]Fig 14 | Three types of timedependent inhibition. [38]Fig 15 | Models of cooperativity. [39]Fig 16 | Early view of substrate specificity through keylock model. [39]Fig 17 | Energy level diagram of enzymecatalysed and the corresponding uncatalysed chemical reaction. [40]Fig 18 | Models of conformational distorsions for transition state stabilisation. [42]Fig 19 | Protein conformational landscape. [43]Fig 20 | Hierarchy of motions in time and space. [44]Fig 21 | Reshaping of protein conformational landscape upon ligand binding. [46]Fig 22 | Ligand migration between buried cavity and surface of a protein. [51]Table 7 | Mechanisms of controlling tunnel accessibility. [52]Table 8 | Normal mode analysis programs. [58]Table 9 | Function prediction. [5960]Table 10 | Source of (putative) haloalkane dehalogenases. [65]Table 11 | Bacteria with two or more (putative) haloalkane dehalogenase genes. [65]Table 12 | Different species of bacteria with identical or nearly identical (putative) haloalkane dehalogenases. [66]Table 13 | Natural source of substrates of haloalkane dehalogenases. [66]Table 14 | Anthropogenic source of substrates of haloalkane dehalogenases. [67]Table 15 | Bacteria growing on haloalkanes as sole carbon and energy source and responsible haloalkane dehalogenase for initial dehalogenation. [68]Fig 23 (pp. 6869)| Halogenated aliphatic hydrocarbon degradation metabolic pathways in bacteria. [68]Table 16 | XC structures of haloalkane dehalogenases. [69]Fig 24 | XC structures of haloalkane dehalogenases. [72]Fig 25 | Topological arrangement of secondary structure elements in haloalkane dehalogenases. [73]Table 17 | Haloalkane dehalogenase subfamilies and their experimentally characterised representatives. [74]Table 18 | Substrate range of haloalkane dehalogenases DhlA, DhaA and LinB. [7576]Table 19 | Substrate range of haloalkane dehalogenases DhmA, DbjA and DmlA. [76]Table 20 | The highest catalytic performances of haloalkane dehalogenases. [77]Fig 26 | Reaction cycle of haloalkane dehalogenase DhlA with 1,2dichloroethane. [79]Fig 27 | XC structures along the reaction cycle of haloalkane dehalgoenase DhlA with 1,2dichloroethane. [80]
191

List of tables and figures
Fig 28 | Unproductive substrate binding in haloalkane dehalogenases LinB (PDBIDs 1G42 and 1G5F) and DmbA (PDBID 2O2H). [80]Fig 29 | Product binding sites in haloalkane dehalogenases LinB (PDBIDs 1D07, 1G4H, 1IZ8, 1K6E, 1K63 and 2BFN) and DmbA (PDBID 2O2I). [81]Table 21 | Ratelimiting steps in dehalogenating reactions catalysed by haloalkane dehalogenases. [8182]Fig 30 | Two conformations of Asp108 nucleophile (A and B) in haloalkane dehalogenase LinB. [83]Fig 31 | Tunnels in XC structure of haloalkane dehalogenases identified by CAVER 1.0. [85]Fig 32 | Alternative conformations in haloalkane dehalogenases. [85]Fig 33 | High mobility regions of haloalkane dehalogenases identified by XC Bfactors. [85]Fig 34 | Degradation of 1,2dichloroethane by Xanthobacter autotrophicus GJ10 in a continuous stirred tank bioreactor. [86]Fig 35 | Fiber optic biosensor for 1,2dichloroethane detection in aqueous solution with haloalkane dehalogenase DhlA in whole cells of Xanthobacter autotrophicus GJ10 as the biocomponent. [87]Fig 36 | General scheme of covalindependent bioconjugations. [88]Fig 37 | Engineered TCP utilisation pathway in Agrobacterium radiobacter AD1. [89]Table 22 | Haloalkane dehalogenases active against TCP. [89]
Fig 38 | Preparation of dhaAHis gene. [92]Fig 39 | Preparation of recombinant pUC18::dhaAHis plasmid. [92]Fig 40 | Selection of Escherichia coli DH5 with pUC18::α dhaAHis. [93]Table 23 | Sitedirected mutagenesis. [94]Table 24 | Saturation mutagenesis. [94]Fig 41 | Screening a saturation mutagenesis library for dehalogenation of TCP. [95]Fig 42 | Determination of nucleotide sequence of mutant dhaA genes. [96]Table 25 | Set of substrates for determination of substrate specificity. [97]Fig 43 | Determination of secondary structure fingerprint of DhaA variants by CD spectroscopy. [98]Fig 44 | Crystallisation and Xray diffraction data collection for determination of XC structure for selected DhaA variants. [99]Table 26 | Summary of XC data and refinement. [99102]Fig 45 | Rapid quench flow experiment for determination of presteady state kinetics of dehalogenation of TCP by DhaA variants. [102]Fig 46 | In silico mutagenesis of DhaA using PYMOL mutagenesis wizard; procedure is demonstrated on Cys176Tyr substitution. [103]Fig 47 | Structures of ligands. [104]Fig 48 | Search space in DhaA for docking of DCL and TCP using AUTODOCK. [105]Fig 49 | van der Waals potential energy approximated by the 126 LennardJones potential. [106]Fig 50 | Lamarckian genetic algorithm (LGA) search stage in docking using AUTODOCK. [106]Fig 51 | The 1994 Cornell force field. [107]Fig 52 | Periodic boundary condition (PBC) MD. [107]Fig 53 | Overview of a classical MD simulation of enzymesubstrate and enzymeproduct complexes of the reaction cycle of DhaA with TCP using Sander module of AMBER. [108]Table 27 | Parameters for MD simulations of enzymesubstrate and enzymeproduct complexes of the reaction cycle of DhaA with TCP using Sander module of AMBER. [108110]Fig 54 | Principle of RAMD simulation. [111]Table 28 | RAMDspecific parameters for RAMD simulations of enzymesubstrate and enzymeproduct complexes of the reaction cycle of DhaA with TCP using Sander module of AMBER with RAMD patch. [110]Fig 55 | Visualisation of DCL and CL release pathways observed in MD simulations. [112]Fig 56 | Identification of amino acid residues belonging to the DCL release pathway. [113]Fig 57 | Visualisation of water exchange pathways observed in classical MD simulations. [113]
Fig 58 | Docked orientations of DCL in DhaA wildtype. [122]Table 29 | Overview of classical MD simulations of DhaA with DCL and CL products of TCP conversion. [122]Table 30 | Overview of classical MD simulations of DhaA with DCL product of TCP conversion. [123]Table 31 | Overview of RAMD simulations of DhaA with DCL product of TCP conversion. [123124]Table 32 | Frequency of occurrence of DCL release in the wildtype DhaA and its mutants in RAMD simulations. [124125]Fig 59 | Amino acid residues of the slot tunnel identified by RAMD simulations of DCL release in the wildtype DhaA and the 04 mutant. [125]Fig 60 | Hot spot amino acid residues lining the access tunnels selected for mutagenesis by RAMD simulations of DCL release in the wildtype DhaA and the 04 mutant. [125]Table 33 | Variability of the hot spots among members of subfamily II haloalkane dehalogenases. [126]Table 34 | DhaA variants obtained by screening saturation mutagenesis libraries A and B for enhanced activity towards TCP. [126]
192
List of tables and figures
Fig 61 | Secondary structure fingerprint of DhaA variants determined by farUV CD spectroscopy. [127]Fig 62 | Specific activities of selected DhaA variants with TCP. [127]Table 35 | Steadystate kinetic constants for TCP conversion by selected DhaA variants. [127128]Fig 63 | Inhibition of TCP conversion by DCL product. [128]Fig 64 | Substrate specificity profiles of the wildtype DhaA and the mutant 31. [128]Fig 65 | DCL release pathways observed among DhaA variants. [129]Fig 66 | Effect of mutations on the accessibility of DCL release pathways in RAMD simulations of the wildtype DhaA and its mutants. [129]Fig 67 | Effect of mutations and CL on the accessibility of water exchange pathways in classical MD simulations of the wildtype DhaA and its mutants with products of TCP conversion. [130]Fig 68 | Role of active site accessibility for bulk water molecules in the wildtype DhaA and the mutant 31' on formation of reactive complexes with TCP in classical MD simulations. [131]Fig 69 | The ratelimiting steps for conversion of TCP by the wildtype DhaA and mutant 31 identified by 2H2O kinetic isotope effect and presteady state kinetics. [132]Fig 70 | No effect of single Cys176Tyr in the main tunnel on the accessibility of p1 release pathway for CL in classical MD simulations of the wildtype DhaA and its mutants. [132]Fig 71 | Schematic representation of ligand pathways among DhaA variants. [132]Fig 72 | The XC structures of DhaA and its mutants ordered by the accessibility of their active sites via the main tunnel and the slot tunnel. [133]Table 36 | Occurrence of mechanisms of ligand exchange between the buried active site and bulk solvent in the wildtype DhaA and eight mutants in MD simulations. [133]Fig 73 | Schematic representation for three mechanisms of ligand exchange between the buried active site of DhaA and bulk solvent. [134]Fig 74 | The effect of mutations and CL on the opening and solvent accessibility of permanent and transient tunnels in classical MD simulations of the wildtype DhaA and its mutants. [134]Fig 75 | Selected attractive electrostatic (ele) and van der Waals (vdw) interactions between DCL and protein residues during release of DCL through different pathways. [135]Fig 76 | Release of CL through p1 in the wildtype DhaA. [136]Fig 77 | Release of CL through p1 in the 15 mutant. [136]Fig 78 | Release of DCL through p1 in the wildtype DhaA. [137]Fig 79 | Release of DCL through p1 in the 04 mutant. [137]Fig 80 | Release of DCL through p1 in the 31' mutant. [138]Fig 81 | Release of DCL through p1 in the 51' mutant. [138]Fig 82 | Release of DCL through p1 in the 52' mutant. [139]Fig 83 | Release of DCL through p2a in the wildtype DhaA. [139]Fig 84 | Release of DCL through p2b in the 27' mutant. [140]Fig 85 | Release of DCL through p2c in the 21' mutant. [140]Fig 86 | Release of DCL through p3 in the wildtype DhaA. [141]Fig 87 | Finding a tunnel using CAVER algorithm. [142]Fig 88 | Calculation and visualisation of tunnels using CAVER Viewer. [142]Fig 89 | Tunnels in the snapshots from MD simulations of DhaA identified manually and automatically using CAVER. [143]
193

Abbreviations
OK, now where was I? Prepared, was I. Your man broke his jaw tryin' to say what I.
Clifford Smith―
A adeninealanine
Ala alanineArg arginineAsn asparagineAsp aspartic acid
asparateATF a t omic force microscopy
Å Ångström
BFIT Bfactor saturation testBCI 5,5'dibromo4,4'dichloroindigo
BCHI 5bromo4chloro3hydroxyindole
C cytosinecysteinecarbon
CAPRI Critical Assessment of Predicted InteractionsCASP Critical Assessment of Structure PredictionCAST combinatorial active site saturation testCATH ClassArchitectureTopologyHomologous superfamily
CC loop Cterminal cap domain loopCD circular dichroismCL chloride anionCO carbon monooxide
CO2 carbon dioxideCOSY correlation spectroscopy
Cys cysteine
D aspartic acidaspartate
DCL 2,3dichloropropane1olDDBJ DNA Databank of Japan
DNA deoxyribonucleic acidDOGS degenerate oligonucleotide gene shufflingdATP deoxyadenosine triphosphatedCTP deoxycytidine triphosphatedGTP deoxyguanosine triphosphatedTTP deoxythymidine triphosphate
ddATP dideoxyadenosine triphosphateddCTP dideoxycytidine triphosphateddGTP dideoxyguanosine triphosphateddTTP dideoxythymidine triphosphate
E glutamic acidglutamate
[E] enzyme concentrationEa activation energy
EC enzyme comission; electron crystallography
194

Abbreviations
EMBL European Molecular Biology LaboratoryEPR electron paramagnetic resonance[ES] enzymesubstrate complex concentrationEVB empirical valence bond
epPCR errorprone polymerase chain reactionε0 permitivity of free spaceεr dielectric constant of medium
F phenylalanineFEP free energy perturbation
FRET fluorescence resonance energy transferff94 1994 Cornell force field
G guanineglycine
GC gas chromatographyGly glycineGln glutamineGlu glutamic acid
glutamateGNA glycol nucleic acid
H histidinehydrogen
H/D hydrogen/deuteriumHHDB Hydrogen and Hydration in proteins Database
His histidineHSQC heteronuclear single quantum coherence
h Planck's constant
I isoleucine[I] inhibitor concentrationIle isoleucineIM AMBER atom type for chloride anion
INSDC International Nucleotide Sequence Database CollaborationIPTG isopropyl Dβ thiogalactopyranoside
ISM iterative saturation mutagenesisITCHY increamental truncation for creation of hybrid enzymes
K lysineKd dissociation constantKi equilibrium inhibition constant
Km apparent dissociation (Michaelis) constantKNF KoshlandNémethyFilmer
kb Boltzmann constantkcal kilocalory
kcat catalytic constantkcat/Km performance constant
L leucine[L] ligand concentrationLB lysogeny broth
LES locally enhanced samplingLeu leucine
LRA linear response approximationLUCA the last universal common ancestor
Lys lysine
M methioninemolar concentration
195

Abbreviations
MCS multiple copy siteMD molecular dynamicsMet methionineMM molecular mechanicsMR molecular replacementMS mass spectrometry
MWC MonodWymanChangeuxmM millimolar concentrationms millisecond
N asparaginenitrogen
NAC near attack configurationNa2SO4 sodium sulphate
NC neutron crystallographyNC loop Nterminal cap domain loop
NexT nucleotide exchange and excision technologyNM normal mode
NMA normal mode analysisNMR nuclear magnetic resonance
NOESY nuclear Overhauser effect spectroscopy
O2 molecular oxygen
P proline[P] protein concentration; product concentration
PCR polymerase chain reactionPDB Protein Data BankPhe phenylalanine
PISA Protein Interfaces, Surface and Assemblies[PL] concentration of proteinligand complex Pro proline
Q glutamineQM quantum mechanics
R arginineuniversal gas constant
RACHITT random chimeragenesis on transient templatesRAMD random acceleration molecular dynamicsRDCL (R)2,3dichloropropane1olRESP restrained electrostatic potential fitRETT recombined extension on truncated templates
Rfactor global reliability factorRmerge diffraction data reliability factorRMS rootmeansquare
RMSD rootmeansquare deviationRNA ribonucleic acid
RNDM random drift mutagenesisRPR random priming recombination
S serine[S] substrate concentration
SANS small angle neutron scatteringSAXS small angle Xray scatteringSCOP Structural Classification Of Proteins
SDCL (S)2,3dichlororopane1olSec selenocysteineSer serine
SeSaM sequence saturation mutagenesis
196

Abbreviations
SMD steered molecular dynamicsSN2 bimolecular nucleophilic substitution
StEP staggered extension processs second
T thyimethreoninetemperature
TCP 1,2,3trichloropropaneTdt dynamic transition temperature
Thr threonineTLS translationlibrationscrew
TMD targeted molecular dynamicsTNA threose nucleic acid
TOCSY total correlation spectroscopyTROSY transverse relaxation optimised spectroscopy
Trp tryptophaneTyr tyrosine
U uracilselenocysteine
USMD umbrella sampling molecular dynamicsUV ultraviolet
UVRR UV resonance RAMAN
V valineVal valineVIS visible spectrumVmax maximum reaction velocity
W tryptophane
Y tyrosine
XC Xray crystallography
197

Original research articles
You scream as it enters your bloodstream; erupts your brain from the pain these thoughts contain.
Elgin Turner―
Klvaňa M,1,5 Pavlová M,1,5 Prokop Z,1 Chaloupková R,1 Banáš P,2 Otyepka M,2 Wade RC,3 Nagata Y4 & Damborský J1* (2009). Redesigning dehalogenase access tunnels as a strategy for degrading an anthropogenic substrate. Nat. Chem. Biol. 5: 727733.
1Loschmidt Laboratories, Department of Experimental Biology and National Centre for Biomolecular Research, Faculty of Science, Masaryk University, Brno, Czech Republic. 2Department of Physical Chemistry and Center for Biomolecules and Complex Molecular Systems, Palacký University, Olomouc, Czech Republic. 3Molecular and Cellular Modeling Group, EML Research gGmbH, Heidelberg, Germany. 4Department of Environmental Life Sciences, Graduate School of Life Sciences, Tohoku University, Sendai, Japan.
5These authors contributed equally to this work.*Corresponding author. Email address: [email protected].
Submission process | Received 20 January 2009; accepted 28 May 2009; published online 23 August 2009. Edited by Catherine Goodman.
Abstract | Engineering enzymes to degrade anthropogenic compounds efficiently is challenging. We obtained Rhodococcus rhodochrous haloalkane dehalogenase mutants with up to 32fold higher activity than wildtype toward the toxic, recalcitrant anthropogenic compound 1,2,3trichloropropane (TCP) using a new strategy. We identified key residues in access tunnels connecting the buried active site with bulk solvent by rational design and randomized them by directed evolution. The most active mutant has large aromatic residues at two out of three randomized positions and two positions modified by sitedirected mutagenesis. These changes apparently enhance activity with TCP by decreasing accessibility of the active site for water molecules, thereby promoting activated complex formation. Kinetic analyses confirmed that the mutations improved carbonhalogen bond cleavage and shifted the ratelimiting step to the release of products. Engineering access tunnels by combining computerassisted protein design with directed evolution may be a valuable strategy for refining catalytic properties of enzymes with buried active sites.
Keywords | haloalkane dehalogenase; 1,2,3trichloropropane; tunnel; semirational design; molecular dynamics; saturation mutagenesis; enhanced activity; reaction mechanism; substrate specificity.
Author contributions | Pavlová performed mutagenesis and activity measurements; Klvaňa performed molecular modelling and designed mutants; Prokop performed presteady state kinetics measurements; Chaloupková performed CD spectroscopy measurements and solvent kinetic isotopic effect measurements; Banáš and Otyepka designed mutants; Wade contributed the RAMD modelling tool; Tsuda and Nagata contributed molecular biology tools; Damborský interpreted data and designed mutants. All authors contributed to the writing of the paper.
Klvaňa M,1 Pavlová M,1 Koudeláková T,1 Chaloupková R,1 Dvořák P,1 Prokop Z,1 Stsiapanava A,2 Kutý M,2,3
KutáSmatanová I,2,3 Dohnálek J,4 Kulhánek P,5 Wade RC6 & Damborský J1* (2009). Pathways and mechanisms for product release in the engineered haloalkane dehalogenases explored using classical and random acceleration molecular dynamics simulations. J. Mol. Biol. 392: 13391356.
1Loschmidt Laboratories, Department of Experimental Biology and National Centre for Biomolecular Research, Faculty of Science, Masaryk University, Kamenice 5/A4, 625 00 Brno, Czech Republic. 2Institute of Physical Biology, University of South Bohemia, Zámek 136, 373 33 Nové Hrady, Czech Republic. 3Institute of Systems Biology and Ecology, Academy of Sciences of the Czech Republic, Zámek 136, 373 33 Nové Hrady, Czech Republic. 4Institute of Macromolecular Chemistry, Academy of Sciences of the Czech Republic, Heyrovského náměstí 2, 162 06 Praha 6, Czech Republic. 5Laboratory of Computational Chemistry, National Centre for Biomolecular Research, Faculty of Science, Masaryk University, Kamenice 5/A4, 625 00 Brno, Czech Republic. 6Molecular and Cellular Modeling Group, EML Research, SchlossWolfsbrunnenweg 33, D69118 Heidelberg, Germany.
198

Original research articles
*Corresponding author. Email address: [email protected].
Submission process | Received 11 March 2009; received in revised form 25 June 2009; accepted 29 June 2009; available online 3 July 2009. Edited by David A. Case.
Abstract | Eight mutants of the DhaA haloalkane dehalogenase carrying mutations at the residues lining two tunnels, previously observed by protein Xray crystallography, were constructed and biochemically characterized. The mutants showed distinct catalytic efficiencies with the halogenated substrate 1,2,3trichloropropane. Release pathways for the two dehalogenation products, 2,3dichloropropane1ol and the chloride ion, and exchange pathways for water molecules, were studied using classical and random acceleration molecular dynamics simulations. Five different pathways, denoted p1, p2a, p2b, p2c, and p3, were identified. The individual pathways showed differing selectivity for the products: the chloride ion releases solely through p1, whereas the alcohol releases through all five pathways. Water molecules play a crucial role for release of both products by breakage of their hydrogenbonding interactions with the activesite residues and shielding the charged chloride ion during its passage through a hydrophobic tunnel. Exchange of the chloride ions, the alcohol product, and the waters between the buried active site and the bulk solvent can be realized by three different mechanisms: (i) passage through a permanent tunnel, (ii) passage through a transient tunnel, and (iii) migration through a protein matrix. We demonstrate that the accessibility of the pathways and the mechanisms of ligand exchange were modified by mutations. Insertion of bulky aromatic residues in the tunnel corresponding to pathway p1 leads to reduced accessibility to the ligands and a change in mechanism of opening from permanent to transient. We propose that engineering the accessibility of tunnels and the mechanisms of ligand exchange is a powerful strategy for modification of the functional properties of enzymes with buried active sites.
Keywords | haloalkane dehalogenase; product release; random acceleration molecular dynamics; tunnel; water exchange.
Author contributions | Klvaňa performed molecular modelling, designed mutants and interpreted data; Pavlová performed mutagenesis, activity measurements and inhibition kinetics; Koudeláková performed mutagenesis; Chaloupková performed CD spectroscopy measurements; Dvorak performed activity measurements; Prokop performed inhibition kinetics; Stsiapanava, Kutý, KutáSmatanová and Dohnálek determined Xray crystal structures of mutant proteins; Kulhánek and Wade contributed the RAMD modelling tool; Damborský designed mutants and interpreted data. All authors contributed to the writing of the paper.
199

Supplementary material
That's what ya get when ya misuse what I invent; your empire falls and ya lose every cent.
Gary Grice―
The electronic version of the dissertation thesis and the summary of the dissertation thesis in PDF format (klvana_phdthesis_2009.pdf and klvana_phdthesis_2009_sum.pdf) and all figures in PNG format as well as supplementary material is available on a DVD attached to the inside front cover. All files can be accessed by launching the “klvana_phdthesis_2009.html” file in a web browser; description of each file is provided in the HTML file. The DVD content is listed below:
/ klvana_phdthesis_2009.pdf klvana_phdthesis_2009_sm.html klvana_phdthesis_2009_sum.pdf/Introduction md.avi fig01.png to fig37.png/Methods 1cqw.pdb circularly_polarised_light_right.gif linearly_polarised_light.gif
3fbw.pdb cpr.zip parm94.dat3fwh.pdb dhaawt.pdb parm94_kmunicek_etal_2001.dat3g9x.pdb fig38.png to fig57.png path.zipbfac.zip fpr.zip ramd.incircularly_polarised_light_left.gif genbank_AF060871 ramd.patch
/Publications klvana_etal_2009.pdf klvana_pavlova_etal_2009.pdf/References PDF files of selected articles/Results c01a.avi c18.avi fig58.png to fig89.png
c01b.avi c19.avi r06a.avic02.avi c20.avi r06b.avic03.avi c21.avi r09a.avic04.avi c22.avi r09b.avic05.avi c23.avi r11a.avic06.avi c24.avi r11b.avic07a.avi c25.avi r26a.avic07b.avi c26.avi r26b.avic08.avi c27.avi r54a.avic09.avi c28.avi r54b.avic10.avi c29.avi r58a.avic11.avi c30.avi r58b.avic12.avi c31.avi r66a.avic13.avi c32.avi r66b.avic14.avi c33.avi r74a.avic15.avi c34.avi r74b.avic16.avi c35.avi r82a.avic17.avi c36.avi r82b.avi
The DVD content is also available at http://phdthesis.martinklvana.com/.
200

Never make your home in a place. Make a home for yourself inside your own head. You`ll find what you need to furnish it – memory, friends you can trust, love of learning, and other such things. That way it will go with you wherever you journey.
Tad Williams―


Curriculum vitae
If you do not know how to divide a word at the end of a line then do not divide it; simply put the whole word at the beginning of next line. I am the master of dividing words: I do not divide any.
First name: MartinLast name: KlvaňaNationality: CzechLanguages: Czech (native), English (advanced)Residence: Brno, Czech RepublicEmail address: [email protected] phone: +420 737 319 948Web site: http://www.martinklvana.com/
Education
M.S. General Biology/Microbiology (2004): Faculty of Science, Masaryk University, Brno, Czech Republic.
Affiliation
None: Mar 13, 2009 to present.Loschmidt Laboratories (formerly Protein Engineering Group): May 06, 2002 to Mar 12, 2009, National Centre for Biomolecular Research (20022008) and Department of Experimental Biology (2009), Faculty of Science, Masaryk University, Brno, Czech Republic.
Research visits
Computational Chemistry Group of Prof. Shigenori Tanaka: Sep 01 to Nov 29, 2005, Graduate School of Science and Technology, Kobe University, Kobe, Japan.Molecular and Cellular Modelling group of Dr. Rebecca C. Wade: Sep 24 to Dec 18, 2004, EML Research, Heidelberg, Germany.Laboratory of Bioinformatics and Protein Engineering of Dr. Janusz M. Bujnicki: Jun 30 to Jul 11, 2003, International Institute of Molecular and Cell Biology Warsaw, Poland.
Awards
Award of the Rector of the Masaryk University (2004): Brno, Czech Republic.2nd prize at Student Scientific Conference (2003): Komensky University, Bratislava, Slovakia.
Research interests
Keywords: (Micro)biology; general principles of life; relationships between structure, dynamics, function and evolution of proteins; molecular docking; molecular dynamics; collaboration with experimentalists.Primary goal: Knowledge.
Theses
Diploma thesis (2004): Computer modelling of bacterial enzymes involved in degradation of halogenated hydrocarbons (research supervisor: Jiří Damborský; methodological advisors: Michal Boháč and Jan Kmuníček). Department of Microbiology, Faculty of Science, Masaryk University, Brno, Czech Republic.
203

Curriculum vitae
Research articles
6. Klvaňa M, Pavlová M, Koudeláková T, Chaloupková R, Dvořák P, Prokop Z, Stsiapanava A, Kutý M, KutáSmatanová I, Dohnálek J, Kulhánek P, Wade RC & Damborský J (2009). Pathways and mechanisms for product release in the engineered haloalkane dehalogenases explored using classical and random acceleration molecular dynamics simulations. J. Mol. Biol. 392: 13391356. PMID: 19577578.5. Klvaňa M, Pavlová M, Prokop Z, Chaloupková R, Banáš P, Otyepka M, Wade R, Nagata Y & Damborský J (2009). Redesigning dehalogenase access tunnels as a strategy for degrading an anthropogenic substrate. Nat. Chem. Biol. 5: 727733. PMID: 19701186.4. Ito M, Prokop Z, Klvaňa M, Otsubo Y, Tsuda M, Damborský J & Nagata Y (2007). Degradation of hexachlorocyclohexane byβ haloalkane dehalogenase LinB from hexachlorocyclohexaneutilizing bacterium Sphingobium sp. MI1205. Arch. Microbiol. 188: 313325. PMID: 17516046.3. Pavlová M, Klvaňa M, Jesenská A, Prokop Z, Konečná H, Sato T, Tsuda M, Nagata Y & Damborský J (2007). The identification of catalytic pentad in the haloalkane dehalogenase DhmA from Mycobacterium avium N85: Reaction mechanism and molecular evolution. J. Struct. Biol. 157: 384392. PMID: 17084094.2. Oakley A, Klvaňa M, Otyepka M, Nagata Y, Wilce MCJ & Damborský J (2004). Crystal structure of haloalkane dehalogenase LinB from Sphingomonas paucimobilis UT26 at 0.95 Å resolution: Dynamics of catalytic residues. Biochemistry 43: 870878. PMID: 14744129.1. Prokop Z, Monincová M, Chaloupková R, Klvaňa M, Nagata Y, Janssen DB & Damborský J (2003). Catalytic Mechanism of the Haloalkane Dehalogenase LinB from Sphingomonas paucimobilis UT26. J. Biol. Chem. 278: 4509445100. PMID: 12952988.
Software
Andres F, Beneš P, Brezovský J, Chovancová E, Jaša P, Klvaňa M, Kozlíková B, Medek P, Pavelka A, Szabó T, Zamborský M, Zruban M (in alphabetical order), Sochor J & Damborský J (2009). CAVER 2.0 tunnel calculation program. Human Computer Interaction Laboratory and Loschmidt Laboratories (in alphabetical order), Masaryk University, Brno, Czech Republic. http://www.loschmidt.chemi.muni.cz/caver
Lectures
6. Klvaňa M & Damborský J: Cavities and tunnels in enzymes (Czech). Bioinformatics III – Structural bioinformatics and molecular modelling. October 12, 2006; Brno, Czech Republic.5. Klvaňa M, Kulhánek P, Wade RC & Damborský J: Modelling of product release and identification of export routes in the haloalkane dehalogenase DhaA (English). 5th Discussions in Structural Biology and Bioinformatics. March 1618, 2006; Nové Hrady, Czech Republic.4. Klvaňa M, Kulhánek P, Wade RC & Damborský J: Modelling of export routes in haloalkane dehalogenase DhaA (English). September 6, 2005; Kobe University, Japan.3. Klvaňa M, Pavlová M, Jesenská A, Konečná H, Nagata Y & Damborský J: Homology modelling of haloalkane dehalogenase DhmA (Czech). Czech and Slovak Student Scientific Conference. May 1, 2004; Brno, Czech Republic.2. Klvaňa M, Oakley A & Damborský J: Dynamics of catalytic residues of haloalkane dehalogenase LinB: Insight from Xray crystallography and quantum mechanical calculations (English). July 9, 2003, International Institute of Molecular and Cell Biology, Warsaw, Poland.1. Klvaňa M, Boháč M & Damborský J: Computer modelling of bacterial hydrolytic dehalogenation reaction (Czech). Student Scientific Conference. April 910, 2003, Bratislava, Slovakia.
Posters
2. Klvaňa M, Pavlová M, Koudeláková T, Chaloupková R, Dvořák P, Stsiapanava A, Kutý M, Kutá Smatanová I, Dohnálek J, Kulhánek P, Wade RC & Damborský J: Pathways and mechanisms of product exit and water exchange pathways in engineered haloalkane dehalogenase DhaA explored using classical and random acceleration molecular dynamics simulations (English). ESF Conference: Protein Design and Evolution for Biocatalysis, October 2530, 2008, SaintFeliu de Guixols, Spain.1. Klvaňa M, Pavlová M, Konečná H, Nagata Y & Damborský J: Homology modelling of haloalkane dehalogenase DhmA (English). EMBO Course on Biomolecular Simulation, July 1825, 2004, Paris, France.
204

Thirtysix more chambers to take you through. Clifford Smith―