Manajemen operasi dan produktivitas
79
1 – 1 DR. SUYANTO, SE, MM, MAk ALAMAT : Perumahan : Kota Kembang Depok Raya Sektor Melati Blok F1 No. 3 RT 05/05 Jatimulya, Sukmajaya, Kota Depok 16413 Telephone : 021-87913345, Fax. 021-87913347 Mobile Phone : 0811-952956, 0813-14222230 Flexi : 021-7024 4569, 7027 7997 E-mail : [email protected]
-
Upload
independent -
Category
Documents
-
view
1 -
download
0
Transcript of Manajemen operasi dan produktivitas

1 – 1
DR. SUYANTO, SE, MM, MAk
ALAMAT :Perumahan : Kota Kembang Depok Raya Sektor Melati Blok F1 No. 3 RT 05/05 Jatimulya, Sukmajaya, Kota Depok 16413
Telephone : 021-87913345, Fax. 021-87913347 Mobile Phone : 0811-952956, 0813-14222230Flexi : 021-7024 4569, 7027 7997E-mail : [email protected]

1 – 2
MANAJEMEN OPERASI DAN STRATEGI DALAM MENGHADAPI PERSAINGAN
(Studi Kasus : ……………………………)
● BAB I : PENDAHULUAN
I.1. Latar Belakang MasalahI.2. PermasalahanI.3. Ruang LingkupBAB II : PEMBAHASANII.1. Landasan TeoriII.2. Analisa Masalah (SWOT Analysis)II.3. Pemecahan Masalah (Problem Solving)PENUTUPIII.1. KesimpulanIII.2. SaranDaftar PustakaLampiran

1 – 3
Good Corporate Governance
● Governance: Mengatur/Mengelola -- accountable● Bad Governance – rendahnya akuntabilitas ● Good Governance – accountable● Definisi:
○ Komite Cadburry: keseimbangan antara kekuatan & kewenangan – akuntabilitas kpd share/stakeholders
○ OECD: akuntabilitas kpd shareholders via proses pengambilan keputusan yg bernilai tambah (transparan, responsible, accountable, dan fairness).
○ ADB: accountability, transparency, predictability, & participation

1 – 4
Key aspect GCG
● Struktur yg mengatur hubungan yg harmonis tentang Dekom, Direksi, RUPS, & stakeholeders
● Sistem check & balance ttg perimbangan kewenangan atas pengendalian perusahaan utk mencegah pengelolaan yg salah & penyalahgunaan asset
● Proses yg transparan atas penentuan/pencapaian tujuan perusahaan & pengukuran kinerja.

1 – 5
Tujuan GCG
● Melindungi hak & kepentingan share/stakeholders
● Meningkatkan nilai perusahaan
● Meningkatkan efisiensi & efektifitas
● Meningkatkan mutu hubungan berbagai elemen organisasi di perusahaan

1 – 6
Manfaat GCG:
● Mengurangi agency cost● Mengurangi cost of capital● Meningkatkan nilai saham perusahaan● Menciptakan dukungan dari para stakeholders
Lingkup:● Extern – sistem hukum● Intern – Budaya perusahaan

1 – 7
Prinsip GCG (OECD):
● Transparency● Accountability ● Responsibility● Independency● Fairness

1 – 8
Operations ManagementChapter 1 – Operations and Productivity
© 2006 Prentice Hall, Inc.
PowerPoint presentation to accompany Heizer/Render Principles of Operations Management, 6eOperations Management, 8e

1 – 9
Outline●Global Company Profile: Hard Rock
Cafe●What Is Operations Management?●Organizing To Produce Goods And
Services ●Why Study OM?●What Operations Managers Do
○How This Book Is Organized

1 – 10
Outline - Continued
●The Heritage Of Operations Management
●Operations In The Service Sector○Differences Between Goods And
Services○Growth Of Services○Service Pay
●Exciting New Trends In Operations Management

1 – 11
Outline - Continued
●The Productivity Challenge○Productivity Measurement○Productivity Variables○Productivity And The Service Sector
●Ethics And Social Responsibility

1 – 12
Learning ObjectivesWhen you complete this chapter, you should be able to:
Identify or Define:
●Production and productivity●Operations management (OM)●What operations managers do●Services

1 – 13
Learning ObjectivesWhen you complete this chapter, you should be able to:
Describe or Explain :●A brief history of operations
management●Career opportunities in operations
management●The future of the discipline●Measuring productivity

1 – 14
The Hard Rock Cafe
●First opened in 1971○ Now – 110 restaurants in over 40 countries
●Rock music memorabilia●Creates value in the form of good food
and entertainment●3,500+ custom meals per day in Orlando●How does an item get on the menu?●Role of the Operations Manager

1 – 15
What Is Operations Management?
Production is the creation of goods and services
Operations management (OM) is the set of activities that
creates value in the form of goods and services by
transforming inputs into outputs

1 – 16
Organizing to Produce Goods and Services
●Essential functions:○ Marketing – generates demand○ Production/operations – creates the
product○ Finance/accounting – tracks how well
the organization is doing, pays bills, collects the money

1 – 17
Organizational Charts
OperationsTeller SchedulingCheck ClearingCollectionTransaction processingFacilities design/layoutVault operationsMaintenanceSecurity
FinanceInvestmentsSecurityReal estate
Accounting
Auditing
MarketingLoansCommercialIndustrialFinancialPersonalMortgage
Trust Department
Commercial Bank
Figure 1.1(A)

1 – 18
Organizational Charts
OperationsGround support equipmentMaintenanceGround OperationsFacilitymaintenanceCateringFlight OperationsCrew schedulingFlyingCommunicationsDispatchingManagement science
Finance/ accountingAccountingPayablesReceivablesGeneral LedgerFinanceCash controlInternationalexchange
Airline
Figure 1.1(B)
MarketingTraffic administrationReservationsSchedulesTariffs (pricing)SalesAdvertising

1 – 19
MarketingSales promotionAdvertisingSalesMarket research
Organizational Charts
OperationsFacilitiesConstruction; maintenance
Production and inventory controlScheduling; materials control
Quality assurance and controlSupply-chain managementManufacturingTooling; fabrication; assembly
DesignProduct development and designDetailed product specifications
Industrial engineeringEfficient use of machines, space, and personnel
Process analysisDevelopment and installation ofproduction tools and equipment
Finance/ accountingDisbursements/ creditsReceivablesPayablesGeneral ledgerFunds ManagementMoney marketInternational exchangeCapital requirementsStock issueBond issue and recall
Manufacturing
Figure 1.1(C)

1 – 20
Why Study OM?
●OM is one of three major functions (marketing, finance, and operations) of any organization
●We want (and need) to know how goods and services are produced
●We want to understand what operations managers do
●OM is such a costly part of an organization

1 – 21
Options for Increasing Contribution
Sales $100,000 $150,000 $100,000 $100,000Cost of Goods – 80,000 – 120,000 – 80,000 – 64,000Gross Margin 20,000 30,000 20,000 36,000Finance Costs – 6,000 – 6,000 – 3,000 – 6,000Subtotal 14,000 24,000 17,000 30,000Taxes at 25% – 3,500 – 6,000 – 4,250 – 7,500Contribution $ 10,500 $ 18,000 $ 12,750 $ 22,500
Finance/Marketing Accounting OMOption Option Option
Increase Reduce ReduceSales Finance ProductionCurrent Revenue 50% Costs 50% Costs 20%

1 – 22
What Operations Managers Do
●Planning●Organizing●Staffing●Leading●Controlling
Basic Management Functions

1 – 23
Ten Critical DecisionsTen Decision Areas Chapter(s)
● Service and product design 5● Quality management 6
6 Supplement● Process and capacity 7
design 7 Supplement● Location 8● Layout design 9● Human resources, 10
job design 10 Supplement● Supply-chain 11
management 11 Supplement● Inventory management 12, 14, 16● Scheduling 13, 15● Maintenance 17
Table 1.2

1 – 24
The Critical Decisions●Service and product design
○What good or service should we offer?○How should we design these products
and services? ●Quality management
○How do we define quality?○Who is responsible for quality?
Table 1.2 (cont.)

1 – 25
The Critical Decisions●Process and capacity design
○What process and what capacity will these products require?
○What equipment and technology is necessary for these processes?
●Location○Where should we put the facility?○On what criteria should we base the
location decision?
Table 1.2 (cont.)

1 – 26
The Critical Decisions●Layout design
○How should we arrange the facility and material flow?
○How large must the facility be to meet our plan?
●Human resources and job design○How do we provide a reasonable work
environment?○How much can we expect our
employees to produce?
Table 1.2 (cont.)

1 – 27
The Critical Decisions●Supply-chain management
○Should we make or buy this component?○Who are our suppliers and who can
integrate into our e-commerce program?●Inventory, material requirements
planning, and JIT○How much inventory of each item should
we have?○When do we re-order?
Table 1.2 (cont.)

1 – 28
The Critical Decisions●Intermediate and short–term
scheduling○Are we better off keeping people on the
payroll during slowdowns?○Which jobs do we perform next?
●Maintenance○Who is responsible for maintenance?○When do we do maintenance?
Table 1.2 (cont.)

1 – 29
Where are the OM Jobs?
Figure 1.2

1 – 30
Where are the OM Jobs?●Technology/methods●Facilities/space utilization●Strategic issues●Response time●People/team development●Customer service●Quality●Cost reduction● Inventory reduction●Productivity improvement

1 – 31
Significant Events in OM
Figure 1.3

1 – 32
The Heritage of OM● Division of labor (Adam Smith 1776;
Charles Babbage 1852)● Standardized parts (Whitney 1800)● Scientific Management (Taylor 1881)● Coordinated assembly line (Ford/
Sorenson/Avery 1913)● Gantt charts (Gantt 1916)● Motion study (Frank and Lillian Gilbreth
1922)● Quality control (Shewhart 1924; Deming
1950)
1 – 33
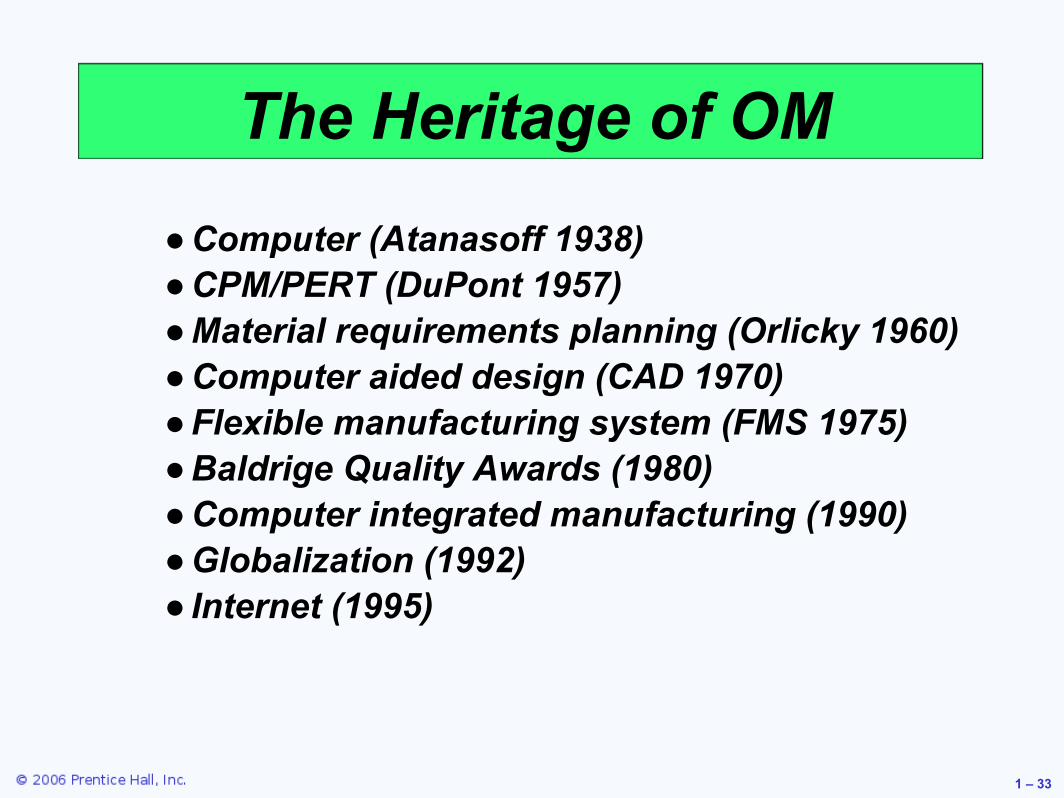
The Heritage of OM● Computer (Atanasoff 1938)● CPM/PERT (DuPont 1957)● Material requirements planning (Orlicky 1960)● Computer aided design (CAD 1970)● Flexible manufacturing system (FMS 1975)● Baldrige Quality Awards (1980)● Computer integrated manufacturing (1990)● Globalization (1992)● Internet (1995)

1 – 34
Eli Whitney
●Born 1765; died 1825●In 1798, received government
contract to make 10,000 muskets●Showed that machine tools could
make standardized parts to exact specifications○Musket parts could be used in any
musket

1 – 35
Frederick W. Taylor
●Born 1856; died 1915●Known as ‘father of scientific
management’●In 1881, as chief engineer for
Midvale Steel, studied how tasks were done○Began first motion and time studies
●Created efficiency principles

1 – 36
Taylor’s Principles
●Matching employees to right job●Providing the proper training●Providing proper work methods and
tools●Establishing legitimate incentives for
work to be accomplished
Management Should Take More Responsibility for:
1 – 37
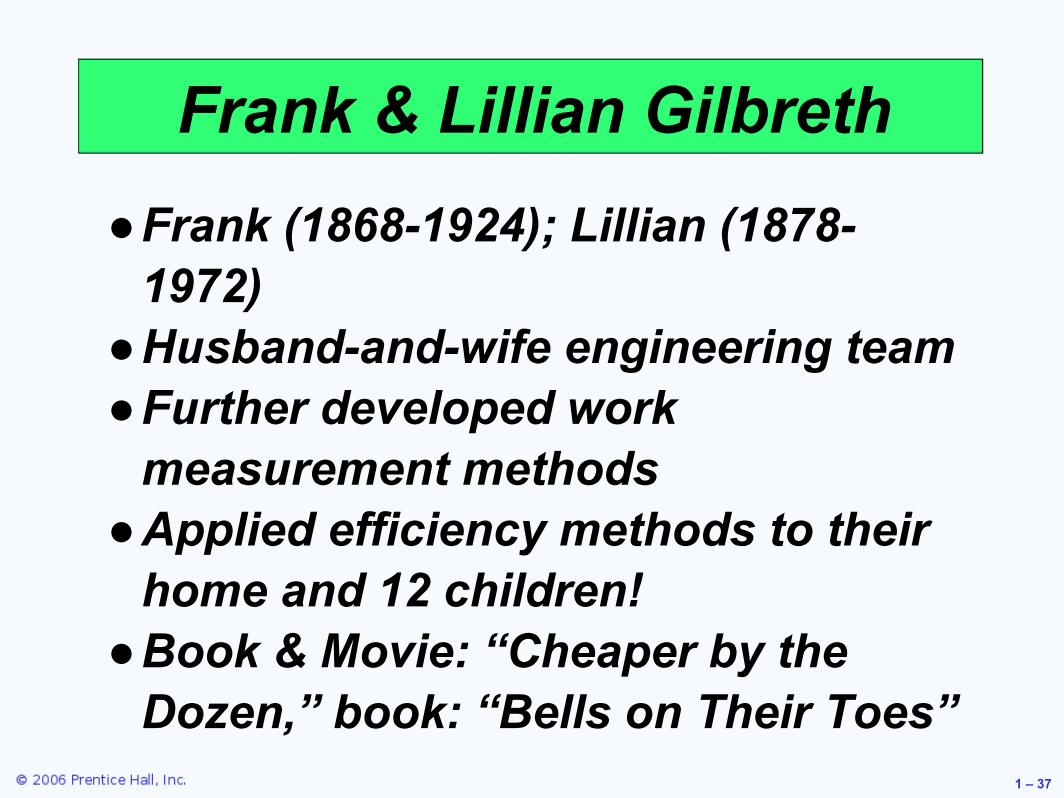
Frank & Lillian Gilbreth●Frank (1868-1924); Lillian (1878-
1972)●Husband-and-wife engineering team●Further developed work
measurement methods●Applied efficiency methods to their
home and 12 children! ●Book & Movie: “Cheaper by the
Dozen,” book: “Bells on Their Toes”

1 – 38
●Born 1863; died 1947●In 1903, created Ford Motor
Company●In 1913, first used moving assembly
line to make Model T○Unfinished product moved by conveyor
past work station●Paid workers very well for 1911
($5/day!)
Henry Ford

1 – 39
W. Edwards Deming
●Born 1900; died 1993●Engineer and physicist●Credited with teaching Japan
quality control methods in post-WW2
●Used statistics to analyze process●His methods involve workers in
decisions

1 – 40
Contributions From
●Human factors●Industrial engineering●Management science●Biological science●Physical sciences●Information science

1 – 41
New Challenges in OM
● Global focus● Just-in-time● Supply chain
partnering● Rapid product
development, alliances
● Mass customization
● Empowered employees, teams
ToFrom● Local or national focus● Batch shipments● Low bid purchasing● Lengthy product
development● Standard products● Job specialization

1 – 42
Characteristics of Goods●Tangible product●Consistent product
definition●Production usually
separate from consumption
●Can be inventoried●Low customer
interaction

1 – 43
Characteristics of Service●Intangible product●Produced and
consumed at same time●Often unique●High customer
interaction● Inconsistent product
definition●Often knowledge-based●Frequently dispersed

1 – 44
Industry and Services as Percentage of GDP
Services ManufacturingAustralia
Canada
China
Czech Rep
France
Germany
Hong Kong
Japan
Mexico
Russian Fed
South Africa
Spain
UK
US
90 −
80 −
70 −
60 −
50 −
40 −
30 −
20 −
10 −
0 −

1 – 45
Goods Versus Services
Table 1.3
Can be resoldCan be inventoriedSome aspects of quality measurableSelling is distinct from productionProduct is transportableSite of facility important for costOften easy to automateRevenue generated primarily from tangible product
Attributes of Goods(Tangible Product)
Attributes of Services(Intangible Product)
Reselling unusualDifficult to inventoryQuality difficult to measureSelling is part of service Provider, not product, isoften transportableSite of facility important forcustomer contactOften difficult to automateRevenue generated primarily from the intangible service

1 – 46
Goods and ServicesAutomobile
ComputerInstalled carpeting
Fast-food mealRestaurant meal/auto repair
Hospital careAdvertising agency/
investment managementConsulting service/
teachingCounseling
Percent of Product that is a Good Percent of Product that is a Service
100% 75 50 25 0 25 50 75 100%| | | | | | | | |
Figure 1.4

1 – 47
Organizations in Each Sector
7.1Pacific Gas & Electric, American Airlines, Santa Fe R.R., Roadway Express
Utilities, Transportation
20.6Walgreen’s, Wal-Mart, Nordstrom’s
Trade (retail, wholesale)
25.5Notre Dame University, San Diego Zoo, Arnold Palmer Hospital
Professional Services, Education, Legal, Medical
% of all JobsExampleService Sector
Table 1.4

1 – 48
Organizations in Each Sector
4.5U.S., State of Alabama, Cook County
Public Administration
5.4McDonald’s, Hard Rock Café, Motel 6, Hilton Hotels, Walt Disney, Paramount Pictures
Food, Lodging, Entertainment
6.7Citicorp, American Express, Prudential, Aetna, Trammel Crow
Finance, Insurance, Real Estate
6.9Snelling and Snelling, Waste Management, Pitney-Bowes
Business and Repair Services
% of all JobsExampleService Sector
Table 1.4

1 – 49
Organizations in Each Sector
23.3%Manufacturing
76.7%Service
Percent of all jobsSector
0.4Homestake MiningMining
2.5King RanchAgriculture
7.1Bechtel, McDermottConstruction
13.3General Electric, Ford, U.S. Steel, Intel
General
% of all JobsExample
Manufacturing Sector
Table 1.4

1 – 50
Services
Manufacturing
Development of the Service Economy
Figure 1.5 (A)
Agriculture
100
90
80
70
60
50
40
30
20
10
01800 1850 1900 1950 2000

1 – 51
Development of the Service Economy
Figure 1.5 (B)
30 –
25 –
20 –
15 –
10 –
5 –
0 –1950 1970 1990 2010
– 150
– 125
– 100
– 75
– 50
– 25
– 0
Employment (millions) Index: 1997 = 100
Manufacturingemployment
Industrial production
Estimate

1 – 52
Development of the Service Economy
Figure 1.5 (C)
United States
Canada
France
Italy
Britain
Japan
W. Germany1970 2005
| | | | |
40 50 60 70 80Percent

1 – 53
New Trends in OM
Supply-chain partners, Enterprise Resource Planning, e-commerce
Quality emphasis requires that suppliers be engaged in product improvement
Low-bid purchasing
Just-in-time shipments
Short product life cycles and cost of capital put pressure on reducing inventory
Batch (large) shipments
Global focusLow-cost, reliable worldwide communication and transportation networks
Local or national focus
Figure 1.6
Past Causes Future

1 – 54
New Trends in OM
Empowered employees, teams, and lean production
Changing socioculture milieu; increasingly a knowledge and information society
Job specialization
Mass customization with added emphasis on quality
Affluence and worldwide markets; increasingly flexible production processes
Standardized products
Rapid product development, alliances, collaborative designs
Shorter life cycles, Internet, rapid international communication, computer-aided design, and international collaboration
Lengthy product development
Figure 1.6
Past Causes Future

1 – 55
New Trends in OM
Environmentally sensitive production, green manufacturing, recycled materials, remanufacturing
Environmental issues, ISO 14000, increasing disposal costs
Low-cost focus
Figure 1.6
Past Causes Future

1 – 56
Productivity Challenge
Productivity is the ratio of outputs (goods and services) divided by the inputs
(resources such as labor and capital)
The objective is to improve this measure of efficiency
Important Note!Production is a measure of output
only and not a measure of efficiency

1 – 57
Feedback loop
Outputs
Goods and
services
Processes
The U.S. economic system transforms inputs to outputs
at about an annual 2.5% increase in productivity per
year. The productivity increase is the result of a
mix of capital (38% of 2.5%), labor (10% of 2.5%), and
management (52% of 2.5%).
The Economic SystemInputs
Labor,capital,
management
Figure 1.7
1 – 58
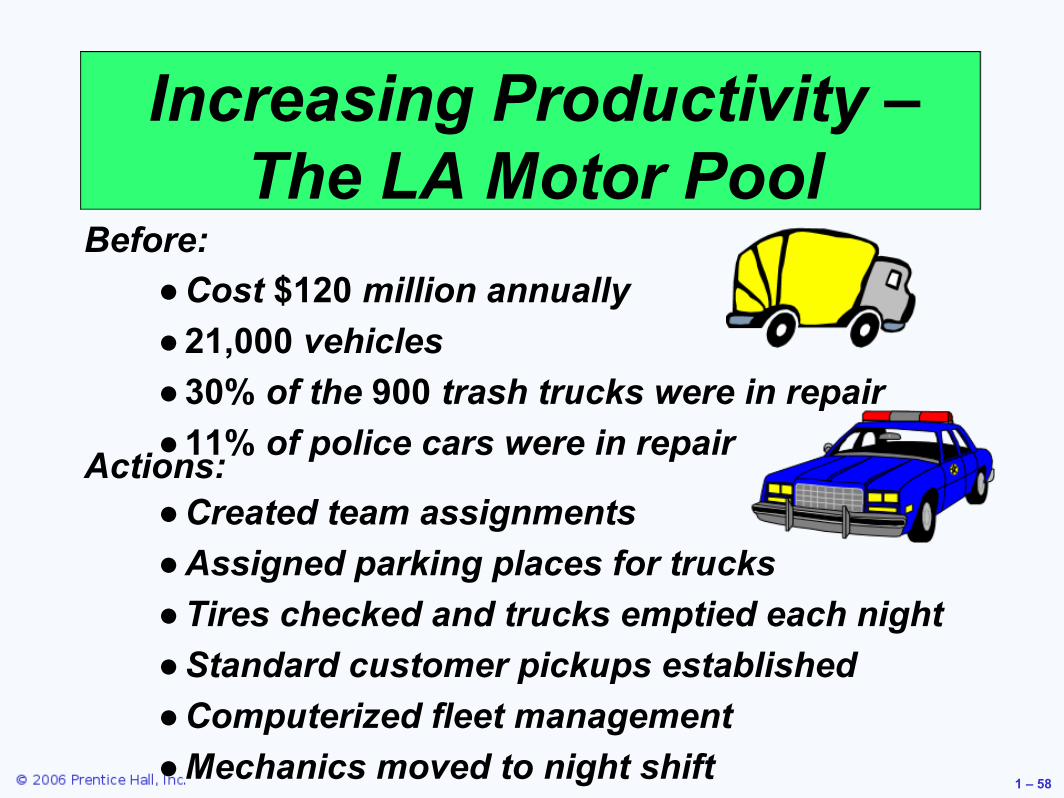
Increasing Productivity – The LA Motor Pool
Before:● Cost $120 million annually● 21,000 vehicles● 30% of the 900 trash trucks were in repair● 11% of police cars were in repairActions:● Created team assignments● Assigned parking places for trucks● Tires checked and trucks emptied each night● Standard customer pickups established● Computerized fleet management● Mechanics moved to night shift

1 – 59
Increasing Productivity – The LA Motor Pool
● Cost $120 million annually● 21,000 vehicles● 30% of the 900 garbage trucks were in repair● 11% of police cars were in repair
Before:
Actions:● Creating team assignments● Assigned parking places for trucks● Tire checked and trucks emptied each night● Standard customer pickups established● Computerized fleet management● Mechanics moved to night shift
Results:● Total fleet reduced by 500 vehicles● Parts inventory dropped 20% reducing
cost by $5.4 million annually● Standardized pickups reduced costs by
$12 million annually● Out of service garbage trucks dropped
to 18%

1 – 60
●Measure of process improvement●Represents output relative to input●Only through productivity increases
can our standard of living improve
Productivity
Productivity =Units
produced
Input used
1 – 61
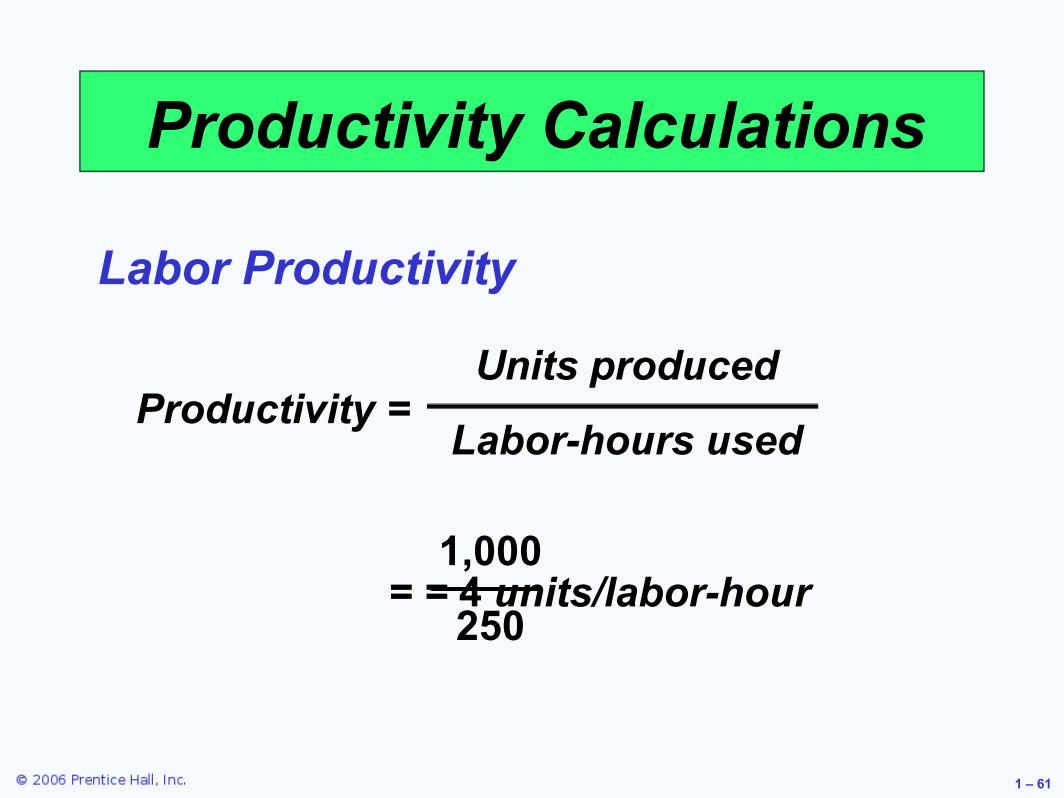
Productivity Calculations
Productivity =Units produced
Labor-hours used
= = 4 units/labor-hour1,000
250
Labor Productivity

1 – 62
Multi-Factor Productivity
OutputLabor + Material + Energy + Capital + Miscellaneous
Productivity =
●Also known as total factor productivity●Output and inputs are often expressed
in dollars

1 – 63
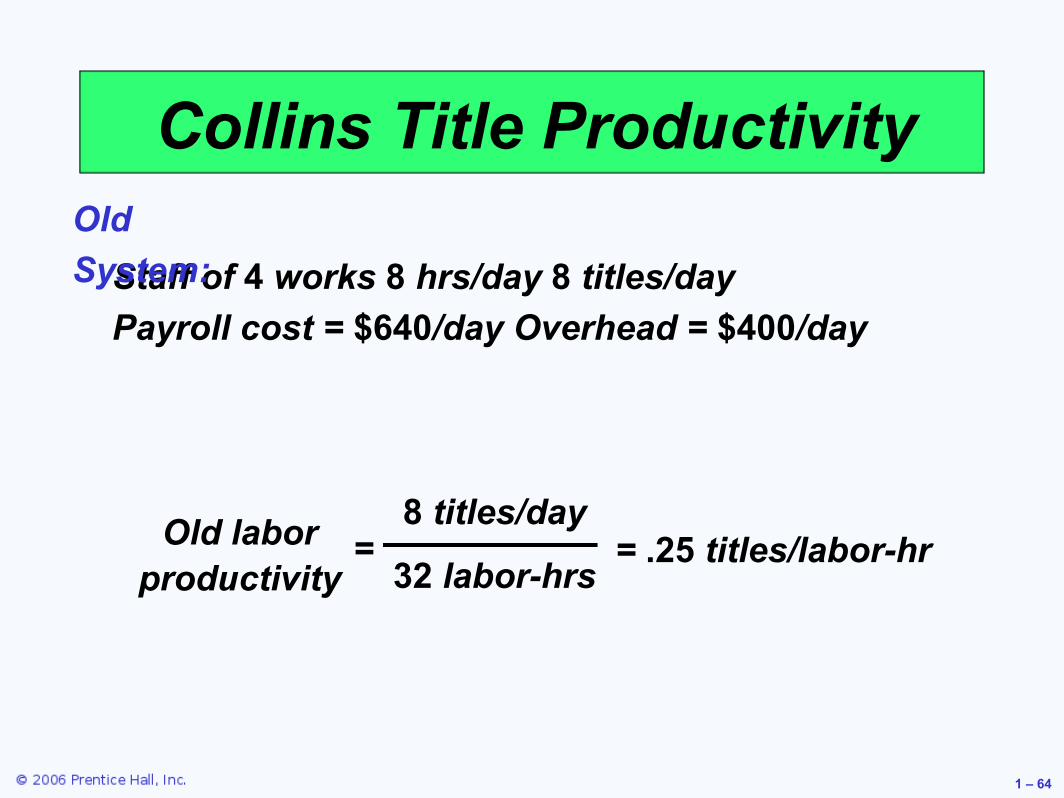
Collins Title Productivity
Staff of 4 works 8 hrs/day 8 titles/dayPayroll cost = $640/day Overhead = $400/day
Old System:
=Old labor productivity
8 titles/day
32 labor-hrs
1 – 64
Collins Title Productivity
Staff of 4 works 8 hrs/day 8 titles/dayPayroll cost = $640/day Overhead = $400/day
Old System:
8 titles/day
32 labor-hrs=Old labor
productivity= .25 titles/labor-hr

1 – 65
Collins Title Productivity
Staff of 4 works 8 hrs/day 8 titles/dayPayroll cost = $640/day Overhead = $400/day
Old System:
14 titles/day Overhead = $800/dayNew System:
8 titles/day
32 labor-hrs=Old labor
productivity
=New labor productivity
= .25 titles/labor-hr
14 titles/day
32 labor-hrs

1 – 66
Collins Title Productivity
Staff of 4 works 8 hrs/day 8 titles/dayPayroll cost = $640/day Overhead = $400/day
Old System:
14 titles/day Overhead = $800/dayNew System:
8 titles/day
32 labor-hrs=Old labor
productivity= .25 titles/labor-hr
14 titles/day
32 labor-hrs=New labor
productivity= .4375 titles/labor-hr

1 – 67
Collins Title Productivity
Staff of 4 works 8 hrs/day 8 titles/dayPayroll cost = $640/day Overhead = $400/day
Old System:
14 titles/day Overhead = $800/dayNew System:
=Old multifactor productivity
8
titles/day
$640 + 400

1 – 68
Collins Title Productivity
Staff of 4 works 8 hrs/day 8 titles/dayPayroll cost = $640/day Overhead = $400/day
Old System:
14 titles/day Overhead = $800/dayNew System:
8
titles/day
$640 + 400
=Old multifactor productivity
= .0077 titles/dollar

1 – 69
Collins Title Productivity
Staff of 4 works 8 hrs/day 8 titles/dayPayroll cost = $640/day Overhead = $400/day
Old System:
14 titles/day Overhead = $800/dayNew System:
8
titles/day
$640 + 400
=Old multifactor productivity
=New multifactor productivity
= .0077 titles/dollar
14 titles/day
$640 + 800
1 – 70
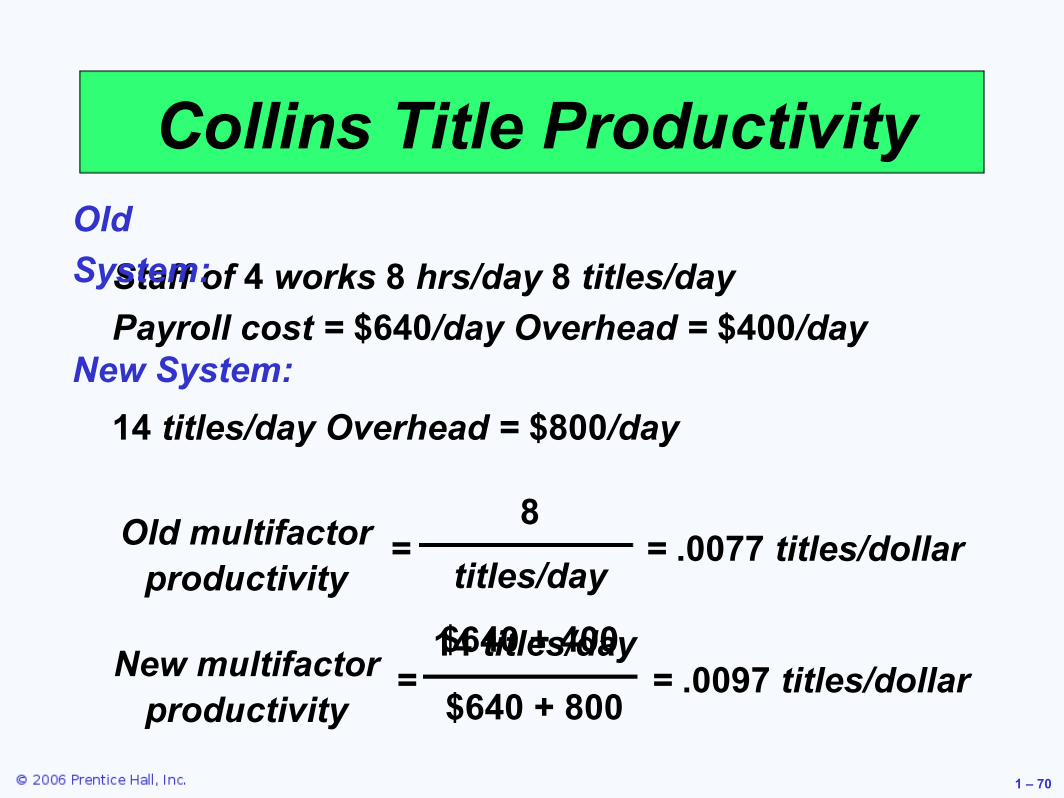
Collins Title Productivity
Staff of 4 works 8 hrs/day 8 titles/dayPayroll cost = $640/day Overhead = $400/day
Old System:
14 titles/day Overhead = $800/dayNew System:
8
titles/day
$640 + 40014 titles/day
$640 + 800
=Old multifactor productivity
=New multifactor productivity
= .0077 titles/dollar
= .0097 titles/dollar

1 – 71
Measurement Problems
●Quality may change while the quantity of inputs and outputs remains constant
●External elements may cause an increase or decrease in productivity
●Precise units of measure may be lacking

1 – 72
Productivity Variables
●Labor - contributes about 10% of the annual increase
●Capital - contributes about 32% of the annual increase
●Management - contributes about 52% of the annual increase

1 – 73
Key Variables for Improved Labor Productivity
●Basic education appropriate for the labor force
●Diet of the labor force●Social overhead that makes labor
available●Maintaining and enhancing skills in the
midst of rapidly changing technology and knowledge

1 – 74
Labor SkillsAbout half of the 17-year-olds in the US cannot correctly answer questions of this type
Figure 1.8

1 – 75
Investment and Productivity in Selected Nations
US UKCanada
Italy
Belgium
France
Netherlands
Japan
1
0
8
6
4
2
0
Percent increase in mfg productivity
Percentage investment
10 15 20 25 30 35
1 – 76
Service Productivity
●Typically labor intensive●Frequently focused on unique individual
attributes or desires●Often an intellectual task performed by
professionals●Often difficult to mechanize●Often difficult to evaluate for quality

1 – 77
Productivity at Taco BellImprovements:
● Revised the menu ● Designed meals for easy preparation● Shifted some preparation to suppliers● Efficient layout and automation● Training and employee empowerment

1 – 78
Productivity at Taco BellImprovements:
● Revised the menu ● Designed meals for easy preparation● Shifted some preparation to suppliers● Efficient layout and automation● Training and employee empowerment
Results:● Preparation time cut to 8 seconds● Management span of control
increased from 5 to 30● In-store labor cut by 15 hours/day● Stores handle twice the volume with
half the labor● Fast-food low-cost leader

1 – 79
Ethics and Social Responsibility
Challenges facing operations managers:
●Developing safe quality products●Maintaining a clean environment●Providing a safe workplace●Honoring community commitments