
Manipulation of magnetism in iron oxide nanoparticle / BaTiO3 ...

Alternative low-cost approach to the synthesis of magnetic iron oxide nanoparticles by thermal
decomposition of organic precursors
This article has been downloaded from IOPscience. Please scroll down to see the full text article.
2013 Nanotechnology 24 175601
(http://iopscience.iop.org/0957-4484/24/17/175601)
Download details:
IP Address: 163.10.60.100
The article was downloaded on 05/04/2013 at 19:00
Please note that terms and conditions apply.
View the table of contents for this issue, or go to the journal homepage for more
Home Search Collections Journals About Contact us My IOPscience

IOP PUBLISHING NANOTECHNOLOGY
Nanotechnology 24 (2013) 175601 (11pp) doi:10.1088/0957-4484/24/17/175601
Alternative low-cost approach to thesynthesis of magnetic iron oxidenanoparticles by thermal decompositionof organic precursorsI O Perez De Berti1, M V Cagnoli1, G Pecchi2, J L Alessandrini3,4,S J Stewart3, J F Bengoa1,4 and S G Marchetti1
1 CINDECA, CONICET—Universidad Nacional de La Plata, Facultad de Ciencias Exactas,Calle 47 N◦ 257, 1900, La Plata, Argentina2 Departamento de Fısico Quımica, Facultad de Ciencias Quımicas, Universidad de Concepcion,Casilla 160-C Concepcion, Chile3 IFLP-CCT-La Plata-CONICET and Departamento de Fısica, Facultad de Ciencias Exactas, C. C. 67,Universidad Nacional de La Plata, 1900 La Plata, Argentina4 Comision de Investigaciones Cientıficas de la Provincia de Buenos Aires (CIC), La Plata, Argentina
E-mail: [email protected]
Received 14 January 2013, in final form 5 March 2013Published 2 April 2013Online at stacks.iop.org/Nano/24/175601
AbstractA new approach to thermal decomposition of organic iron precursors is reported, which resultsin a simpler and more economical method to produce well crystallized γ -Fe2O3 nanoparticles(NPs) with average sizes within the 3–17 nm range. The NPs were characterized by TEM,SAED, XRD, DLS-QELS, Mossbauer spectroscopy at different temperatures, FT-IR andmagnetic measurements. The obtained γ -Fe2O3 NPs are coated with oleic acid and, in a lowerquantity, with oleylamine (about 1.5 nm in thickness). It was shown that changing operativevariables allows us to tune the average particle diameters and obtain a very narrow ormonodisperse distribution of sizes. The γ -Fe2O3 NPs behave superparamagnetically at roomtemperature and their magnetization saturation is reduced by about 34% in comparison withbulk maghemite. The results indicate that the distance between two neighbour NPs, generatedby the coating, of about 3 nm is insufficient to inhibit interparticle magnetic interactions whenthe average diameter is 8.8 nm. The good quality of the NPs, obtained through the presentlow-cost and easy-handling process, open a new perspective for future technologicalapplications.
S Online supplementary data available from stacks.iop.org/Nano/24/175601/mmedia
(Some figures may appear in colour only in the online journal)
1. Introduction
Superparamagnetic iron oxide nanoparticles (SPIONs) haveattracted a great deal of attention due to their chemical andphysical properties, which differ significantly from those ofbulk material, and their potential applications. Between actualand potential applications the following can be mentioned:in biomedical areas, in vivo drug delivery [1, 2], in vitro
cell separation [3], immunoassay [4], contrast agents inmagnetic resonance imaging [5–7], and hyperthermia [8];in technological areas, magnetic storage [9, 10], magneticink printing [11], magnetic refrigeration systems [12], andcatalysis [13].
Most of these applications require well dispersedchemically stable nanoparticles (NPs) having uniformsize and shape, superparamagnetic behaviour, and high
10957-4484/13/175601+11$33.00 c© 2013 IOP Publishing Ltd Printed in the UK & the USA
Nanotechnology 24 (2013) 175601 I O Perez De Berti et al
saturation magnetization values (Ms). Furthermore, thepreparation method would be reproducible without anycomplex purification procedure, such as ultracentrifugation,size-exclusion chromatography, etc.
Different methodologies to obtain SPIONs have beenreported in the literature. The classical synthetic techniquesof iron oxide NPs have relied on the coprecipitation ofFe2+ and Fe3+ ions by a base. The main advantage of thecoprecipitation process is that a large number of NPs can besynthesized. However, the pH of the reaction mixture, thetemperature, the ionic strength of the media, and the ageingtime have to be adjusted in a careful way, and the processtowards production of monodisperse NPs smaller than 20 nmhas a only very limited success [10].
Water-in-oil microemulsions are currently being used tosynthesize SPIONs with a narrow size range and uniformphysical properties [14]. This system is formed by welldefined nanodroplets of the aqueous phase, dispersed by theassembly of surfactant molecules in a continuous hydrocarbonphase. Therefore, the size of the NPs can be controlled byregulating the size of the aqueous droplet core. Significantdisadvantages of the microemulsion methods are the difficultyof their scale-up, and the adverse effects of residualsurfactants on the particle properties [15].
Aerosol technologies, such as spray and laser pyrolysis,are attractive because they are continuous chemical processesthat allow high rate production [16]. However, the NPsobtained by these technologies may be poorly crystalline andthe size uniformity is hard to control [17].
Alternative methods based on the thermal decompositionof organic iron precursors have been demonstrated to be verysuccessful in the preparation of iron oxide NPs with control-lable size and high quality. Thus, Rockenberger et al [18]reported the preparation of monodispersed maghemite bydecomposition of iron cupferronates (Cup: C6H5N(NO)O−)in the presence of octylamine and trioctylamine. Since then,Hyeon et al [19] have prepared monodisperse γ -Fe2O3 NPsin the size range of 4–16 nm by decomposing Fe(CO)5complexes in octyl ether at 573 K in the presence ofoleic acid as a capping agent. The narrowness of theNP distribution produces superlattice formation. However,Fe(CO)5 is highly toxic, air sensitive, and very expensive.On the other hand, Sun and co-workers [20] have synthesizedFe3O4 by heating Fe(acac)3 with oleylamine, oleic acid, and1,2-hexadecanediol. In comparison to other acetylacetonatesor acetate precursors, Fe(acac)3 is less costly and has lowmoisture sensitivity. Furthermore, the NPs are of comparableuniformity with other recipes and monodispersed.
Unfortunately, in most of the reported syntheses,only small quantities of monodisperse nanocrystals can beproduced and, in addition, some of the reagents used arevery expensive. Therefore, the development of new synthesismethods, more economical and simpler, is necessary, in orderto produce future technological applications. With this aim,we have analysed the market prices of the reagents usedin Sun’s recipe [20], and we found that the reducing agent(1,2-hexadecanediol) represents about of 86% of the totalcost. Furthermore, the inert atmosphere requirement (N2)
produces a drawback if larger product quantities need to beproduced. In order to reduce the cost and simplify the handlingprocess, in the present work, we present a new approachto the synthesis by thermal decomposition, by removing thereducing agent and the inert atmosphere. In this situationγ -Fe2O3 would be produced instead of Fe3O4. Therefore,we must check that the obtained NPs are monodisperse andcrystalline and that the magnetization saturation is of the sameorder as that obtained by Sun et al [20].
2. Experimental section
The syntheses were carried out using commercially availablereagents. Diphenyl ether (99%), oleic acid (90%), oleylamine(>70%) and iron(III) acetylacetonate (97%) were purchasedfrom Aldrich Chemical Co and dibenzyl ether (98%) fromFluka. These reactants, ethanol, and hexane, were used as theywere received.
2.1. Synthesis of iron oxide NPs
In the first synthesis the same reagent quantities as used bySun et al [20] to produce 4 nm Fe3O4 NPs were utilized,but without the reducing agent (1,2-hexadecanediol) and theN2 flow. Thus, Fe(acac)3 (4 mmol), oleic acid (12 mmol),oleylamine (12 mmol), and diphenyl ether (20 ml, boilingpoint: 532 K) were mixed and magnetically stirred under air(iron salt:surfactant:solvent molar ratio = 1:6:158). Themixture was heated to 473 K for 45 min and then heated toreflux (538 K) for another 45 min. The black–brown mixturewas cooled to room temperature by removing the heat source.Under ambient conditions, ethanol (80 ml) was added to themixture, and a black material was precipitated and separatedvia centrifugation. The black product was dispersed in hexanein the presence of oleic acid (0.1 ml) and oleylamine (0.1 ml).Centrifugation (6000 rpm, 10 min) was applied to removeany un-dispersed residue. The product, named M1, was thenprecipitated with ethanol, centrifuged (6000 rpm, 10 min) toremove the solvent, and re-dispersed into hexane.
In order to study the effect of some operativevariables, other syntheses were carried out changing the ironsalt:surfactant:solvent molar ratio. The following ratios wereused: 1:3:158, 1:30:158 and 1:30:316. The products thusobtained were called M2, M3 and M4 respectively. Anotherreaction was done in the same way as for M1 except that thesolvent diphenyl ether was changed to benzyl ether (boilingpoint: 568–571 K). This sample was called M5. All sampleswere purified in the same way as M1.
2.2. Characterization of iron oxide NPs
The samples were characterized by transmission electron mi-croscopy (TEM), selected-area electron diffraction (SAED),x-ray diffraction (XRD), dynamic light scattering/quasielasticlight scattering (DLS-QELS), Mossbauer spectroscopy (MS)between 298 and 13 K, magnetic measurements and Fouriertransform infrared spectroscopy (FT-IR).
2
Nanotechnology 24 (2013) 175601 I O Perez De Berti et al
Samples for TEM analysis were prepared by dryinga dispersion of the particles on amorphous carbon coatedcopper grids. TEM micrographs were obtained on a JEOLmodel JEM-1200 EX II microscope. The structure and thecrystallinity of the particles were characterized using electrondiffraction.
XRD patterns were measured using a standard PhilipsPW 1710 automated powder x-ray diffraction system withdiffracted-beam graphite monochromator using Cu Kαradiation (λ = 1.5406 A) in the range 2θ = 25◦–85◦ withsteps of 0.02◦ and counting time of 16 s/step.
In the DLS-QELS measurements, the time correlationfunction G(q, t) of the light scattering intensity was measuredat the scattering angle θ = 90◦ with a goniometer ALV/CGS-5022F with multiple tau digital correlator ALV-5000/EPPcovering a 10−6–103 s time range. The light sourcewas a helium/neon laser (λ = 632.8 nm) operating at22 mW. All of the measurements were carried out at roomtemperature (details appear in the supplementary file availableat stacks.iop.org/Nano/24/175601/mmedia). In order to obtainappropriate estimations of the size of the particles, numberand weight average hydrodynamic radii were calculated fromthe time correlation function with the package CONTIN [21].
Mossbauer spectra were obtained in transmission geom-etry with a 512-channel constant acceleration spectrometer.A source of 57Co in a Rh matrix of nominally 50 mCi wasused. Velocity calibration was performed against a 12 µmthick α-Fe foil. All isomer shifts (δ) mentioned in this paperare referred to this standard. The temperature was variedbetween 13 and 298 K using an ARS closed cycle cryocoolermodel ARS 8200. The spectra were evaluated using theRecoil spectral analysis software [22]. Although some spectradisplay magnetic relaxation, for simplicity Lorentzian lineswith equal widths were considered for each component. Thespectra were folded to minimize geometric effects.
The magnetic measurements were carried out using amultipurpose physical magnetic system (MPMS) supercon-ducting quantum interference device (SQUID) from QuantumDesign. The magnetization versus magnetic field (M–H)curves were recorded at 6 and 300 K up to a maximummagnetic field of 50 kOe. Thermal dependences of M underzero field cooling (ZFC) and field cooling (FC) conditionswere recorded using a field HFC of 100 Oe. After thesemeasurements, each sample was calcined in air to suppressthe organic matter. Then, the iron oxide was dissolvedwith HCl and the iron concentration was determined by acolorimetric method [23]. In this way, all magnetic results canbe normalized by the real mass of the NPs, and the saturationmagnetizations are free of a misinterpretation produced, forexample, by the mass of the surfactant adsorbed on the NPssurface.
Infrared spectra of dried particles and pure oleic acid andoleylamine mixed with KBr (1:100) were obtained on a JascoFT/IR-4200 spectrometer equipped with a PIKE diffuse IRcell with a resolution of 1 cm−1. Two hundred to four hundredscans were accumulated in each case.
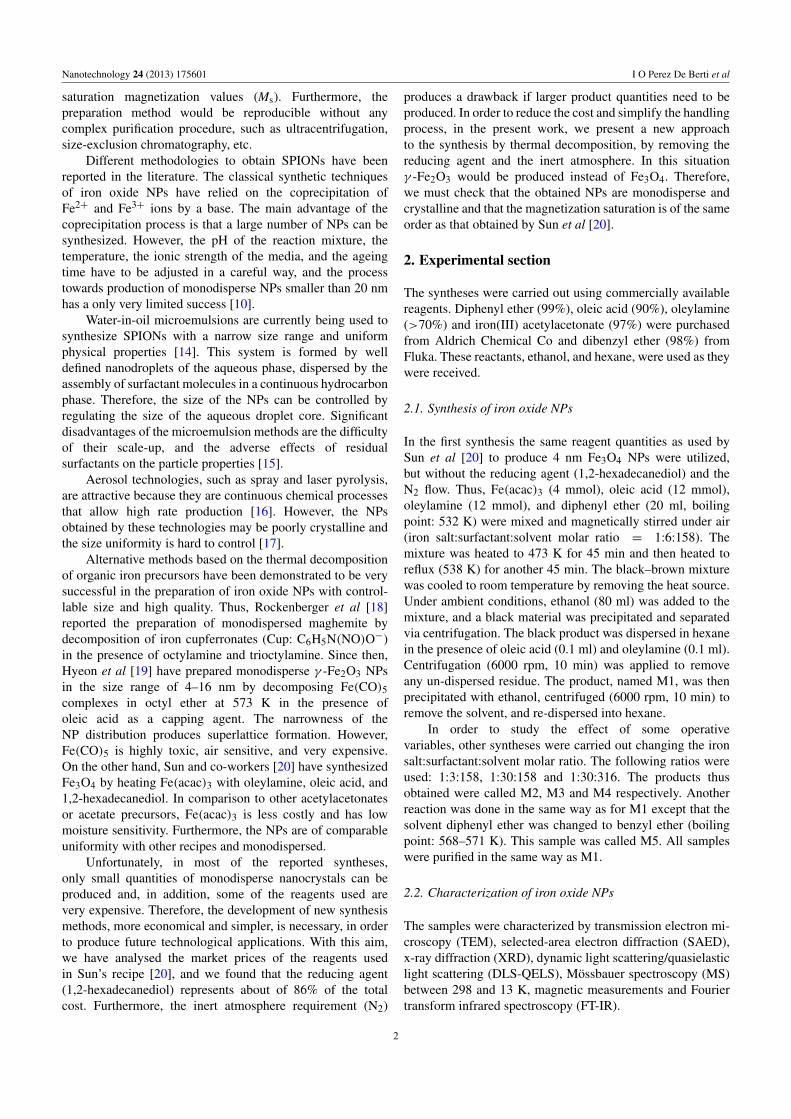
Figure 1. (a) TEM image of M1 sample. (b) Electron diffractionimage of M1 sample.
3. Results and discussion
3.1. Phase identification and particle sizes distribution
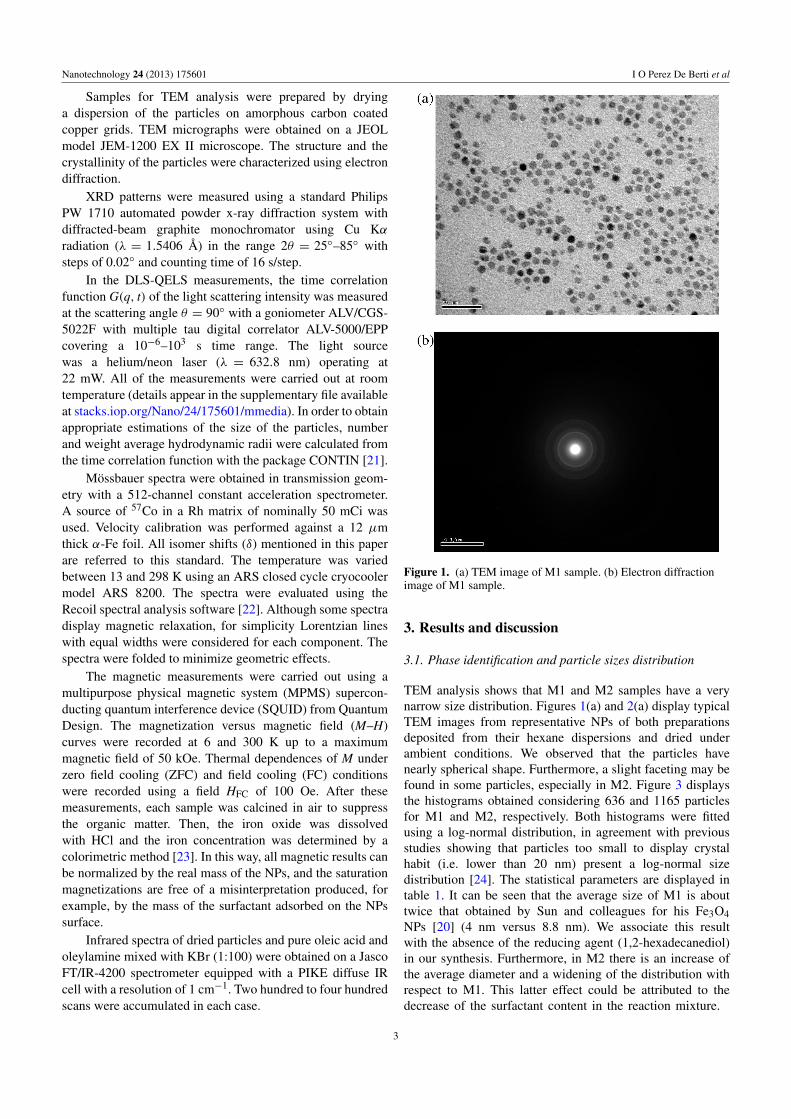
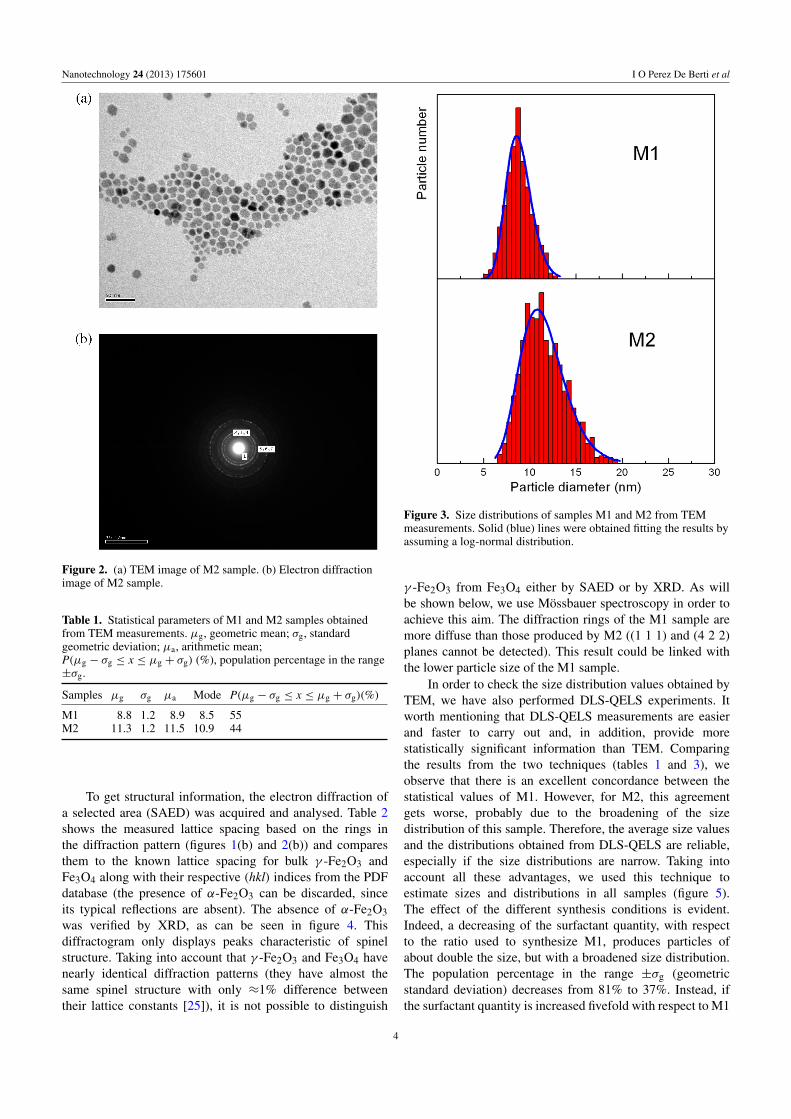
TEM analysis shows that M1 and M2 samples have a verynarrow size distribution. Figures 1(a) and 2(a) display typicalTEM images from representative NPs of both preparationsdeposited from their hexane dispersions and dried underambient conditions. We observed that the particles havenearly spherical shape. Furthermore, a slight faceting may befound in some particles, especially in M2. Figure 3 displaysthe histograms obtained considering 636 and 1165 particlesfor M1 and M2, respectively. Both histograms were fittedusing a log-normal distribution, in agreement with previousstudies showing that particles too small to display crystalhabit (i.e. lower than 20 nm) present a log-normal sizedistribution [24]. The statistical parameters are displayed intable 1. It can be seen that the average size of M1 is abouttwice that obtained by Sun and colleagues for his Fe3O4NPs [20] (4 nm versus 8.8 nm). We associate this resultwith the absence of the reducing agent (1,2-hexadecanediol)in our synthesis. Furthermore, in M2 there is an increase ofthe average diameter and a widening of the distribution withrespect to M1. This latter effect could be attributed to thedecrease of the surfactant content in the reaction mixture.
3
Nanotechnology 24 (2013) 175601 I O Perez De Berti et al
Figure 2. (a) TEM image of M2 sample. (b) Electron diffractionimage of M2 sample.
Table 1. Statistical parameters of M1 and M2 samples obtainedfrom TEM measurements. µg, geometric mean; σg, standardgeometric deviation; µa, arithmetic mean;P(µg − σg ≤ x ≤ µg + σg) (%), population percentage in the range±σg.
Samples µg σg µa Mode P(µg − σg ≤ x ≤ µg + σg)(%)
M1 8.8 1.2 8.9 8.5 55M2 11.3 1.2 11.5 10.9 44
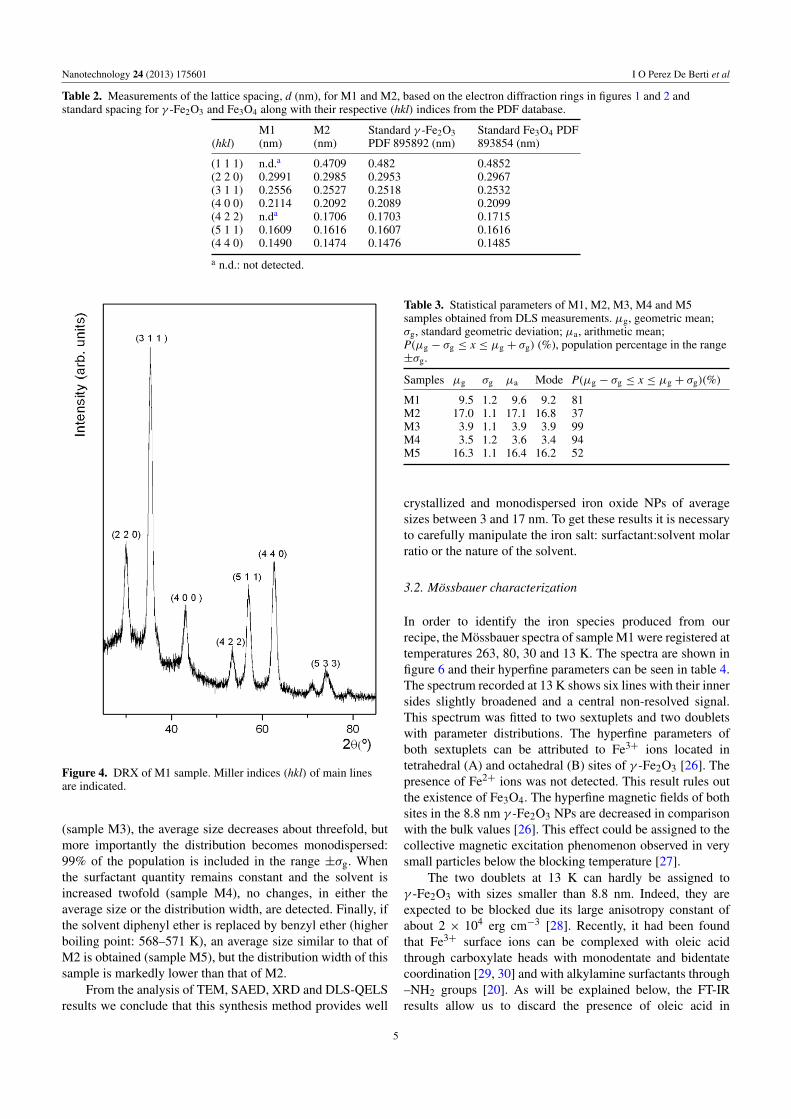
To get structural information, the electron diffraction ofa selected area (SAED) was acquired and analysed. Table 2shows the measured lattice spacing based on the rings inthe diffraction pattern (figures 1(b) and 2(b)) and comparesthem to the known lattice spacing for bulk γ -Fe2O3 andFe3O4 along with their respective (hkl) indices from the PDFdatabase (the presence of α-Fe2O3 can be discarded, sinceits typical reflections are absent). The absence of α-Fe2O3was verified by XRD, as can be seen in figure 4. Thisdiffractogram only displays peaks characteristic of spinelstructure. Taking into account that γ -Fe2O3 and Fe3O4 havenearly identical diffraction patterns (they have almost thesame spinel structure with only ≈1% difference betweentheir lattice constants [25]), it is not possible to distinguish
Figure 3. Size distributions of samples M1 and M2 from TEMmeasurements. Solid (blue) lines were obtained fitting the results byassuming a log-normal distribution.
γ -Fe2O3 from Fe3O4 either by SAED or by XRD. As willbe shown below, we use Mossbauer spectroscopy in order toachieve this aim. The diffraction rings of the M1 sample aremore diffuse than those produced by M2 ((1 1 1) and (4 2 2)planes cannot be detected). This result could be linked withthe lower particle size of the M1 sample.
In order to check the size distribution values obtained byTEM, we have also performed DLS-QELS experiments. Itworth mentioning that DLS-QELS measurements are easierand faster to carry out and, in addition, provide morestatistically significant information than TEM. Comparingthe results from the two techniques (tables 1 and 3), weobserve that there is an excellent concordance between thestatistical values of M1. However, for M2, this agreementgets worse, probably due to the broadening of the sizedistribution of this sample. Therefore, the average size valuesand the distributions obtained from DLS-QELS are reliable,especially if the size distributions are narrow. Taking intoaccount all these advantages, we used this technique toestimate sizes and distributions in all samples (figure 5).The effect of the different synthesis conditions is evident.Indeed, a decreasing of the surfactant quantity, with respectto the ratio used to synthesize M1, produces particles ofabout double the size, but with a broadened size distribution.The population percentage in the range ±σg (geometricstandard deviation) decreases from 81% to 37%. Instead, ifthe surfactant quantity is increased fivefold with respect to M1
4
Nanotechnology 24 (2013) 175601 I O Perez De Berti et al
Table 2. Measurements of the lattice spacing, d (nm), for M1 and M2, based on the electron diffraction rings in figures 1 and 2 andstandard spacing for γ -Fe2O3 and Fe3O4 along with their respective (hkl) indices from the PDF database.
(hkl)M1(nm)
M2(nm)
Standard γ -Fe2O3PDF 895892 (nm)
Standard Fe3O4 PDF893854 (nm)
(1 1 1) n.d.a 0.4709 0.482 0.4852(2 2 0) 0.2991 0.2985 0.2953 0.2967(3 1 1) 0.2556 0.2527 0.2518 0.2532(4 0 0) 0.2114 0.2092 0.2089 0.2099(4 2 2) n.da 0.1706 0.1703 0.1715(5 1 1) 0.1609 0.1616 0.1607 0.1616(4 4 0) 0.1490 0.1474 0.1476 0.1485
a n.d.: not detected.
Figure 4. DRX of M1 sample. Miller indices (hkl) of main linesare indicated.
(sample M3), the average size decreases about threefold, butmore importantly the distribution becomes monodispersed:99% of the population is included in the range ±σg. Whenthe surfactant quantity remains constant and the solvent isincreased twofold (sample M4), no changes, in either theaverage size or the distribution width, are detected. Finally, ifthe solvent diphenyl ether is replaced by benzyl ether (higherboiling point: 568–571 K), an average size similar to that ofM2 is obtained (sample M5), but the distribution width of thissample is markedly lower than that of M2.
From the analysis of TEM, SAED, XRD and DLS-QELSresults we conclude that this synthesis method provides well
Table 3. Statistical parameters of M1, M2, M3, M4 and M5samples obtained from DLS measurements. µg, geometric mean;σg, standard geometric deviation; µa, arithmetic mean;P(µg − σg ≤ x ≤ µg + σg) (%), population percentage in the range±σg.
Samples µg σg µa Mode P(µg − σg ≤ x ≤ µg + σg)(%)
M1 9.5 1.2 9.6 9.2 81M2 17.0 1.1 17.1 16.8 37M3 3.9 1.1 3.9 3.9 99M4 3.5 1.2 3.6 3.4 94M5 16.3 1.1 16.4 16.2 52
crystallized and monodispersed iron oxide NPs of averagesizes between 3 and 17 nm. To get these results it is necessaryto carefully manipulate the iron salt: surfactant:solvent molarratio or the nature of the solvent.
3.2. Mossbauer characterization
In order to identify the iron species produced from ourrecipe, the Mossbauer spectra of sample M1 were registered attemperatures 263, 80, 30 and 13 K. The spectra are shown infigure 6 and their hyperfine parameters can be seen in table 4.The spectrum recorded at 13 K shows six lines with their innersides slightly broadened and a central non-resolved signal.This spectrum was fitted to two sextuplets and two doubletswith parameter distributions. The hyperfine parameters ofboth sextuplets can be attributed to Fe3+ ions located intetrahedral (A) and octahedral (B) sites of γ -Fe2O3 [26]. Thepresence of Fe2+ ions was not detected. This result rules outthe existence of Fe3O4. The hyperfine magnetic fields of bothsites in the 8.8 nm γ -Fe2O3 NPs are decreased in comparisonwith the bulk values [26]. This effect could be assigned to thecollective magnetic excitation phenomenon observed in verysmall particles below the blocking temperature [27].
The two doublets at 13 K can hardly be assigned toγ -Fe2O3 with sizes smaller than 8.8 nm. Indeed, they areexpected to be blocked due its large anisotropy constant ofabout 2 × 10⁴ erg cm−3 [28]. Recently, it had been foundthat Fe3+ surface ions can be complexed with oleic acidthrough carboxylate heads with monodentate and bidentatecoordination [29, 30] and with alkylamine surfactants through–NH2 groups [20]. As will be explained below, the FT-IRresults allow us to discard the presence of oleic acid in
5

Nanotechnology 24 (2013) 175601 I O Perez De Berti et al
Figure 5. Size distributions of samples M1, M2, M3, M4 and M5from DLS-QELS measurements from number averages. The molarratio of iron salt:surfactant:solvent used in each synthesis is shownbetween brackets. Solid (red) lines were obtained fitting the resultswith a log-normal distribution.
Figure 6. Mossbauer spectra of M1 NPs at different temperatures.
monodentate coordination with Fe3+ ions. It is important toremark that the isomer shift of one of the doublets is verysmall (δ = 0.08±0.06 mm s−1) in comparison with the typicalvalues of high spin Fe3+ ions at low temperature (about0.4–0.5 mm s−1). This result would indicate an increase ofthe covalence of the iron bond in the presence of ligands (anincrease of 4s electron density in the iron nucleus). The strong
6
Nanotechnology 24 (2013) 175601 I O Perez De Berti et al
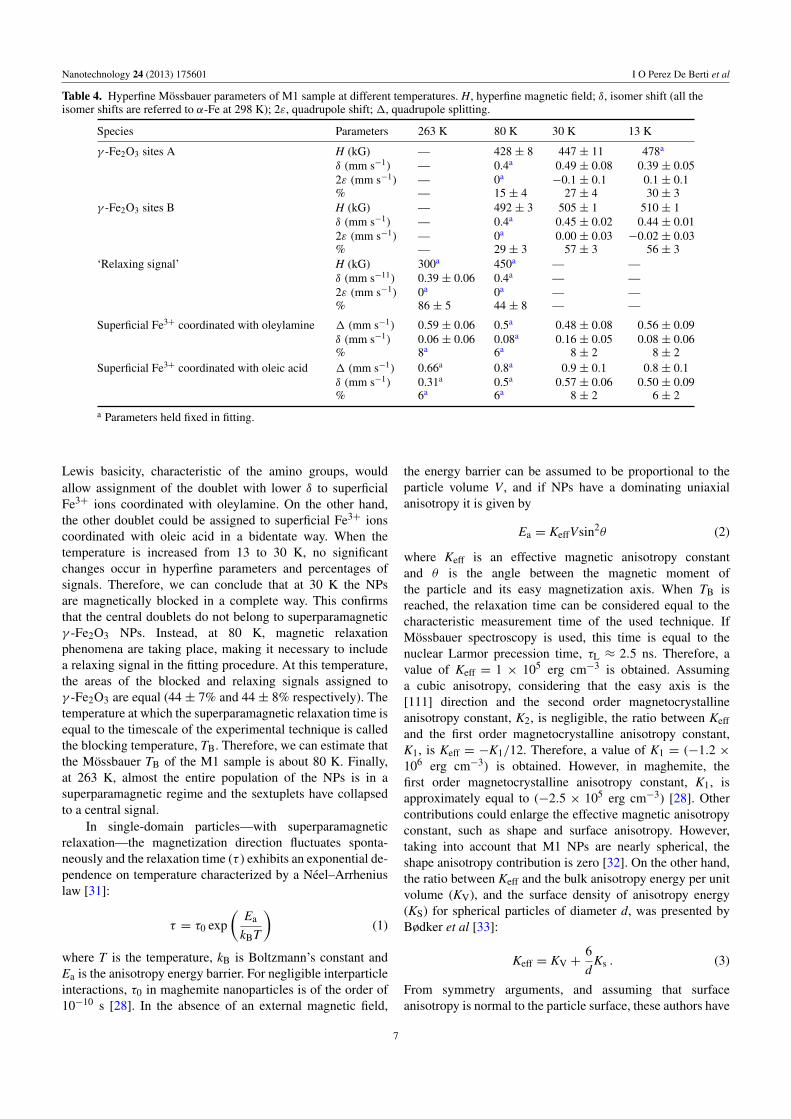
Table 4. Hyperfine Mossbauer parameters of M1 sample at different temperatures. H, hyperfine magnetic field; δ, isomer shift (all theisomer shifts are referred to α-Fe at 298 K); 2ε, quadrupole shift; 1, quadrupole splitting.
Species Parameters 263 K 80 K 30 K 13 K
γ -Fe2O3 sites A H (kG) — 428 ± 8 447 ± 11 478a
δ (mm s−1) — 0.4a 0.49 ± 0.08 0.39 ± 0.052ε (mm s−1) — 0a
−0.1 ± 0.1 0.1 ± 0.1% — 15 ± 4 27 ± 4 30 ± 3
γ -Fe2O3 sites B H (kG) — 492 ± 3 505 ± 1 510 ± 1δ (mm s−1) — 0.4a 0.45 ± 0.02 0.44 ± 0.012ε (mm s−1) — 0a 0.00 ± 0.03 −0.02 ± 0.03% — 29 ± 3 57 ± 3 56 ± 3
‘Relaxing signal’ H (kG) 300a 450a — —δ (mm s−11) 0.39 ± 0.06 0.4a — —2ε (mm s−1) 0a 0a — —% 86 ± 5 44 ± 8 — —
Superficial Fe3+ coordinated with oleylamine 1 (mm s−1) 0.59 ± 0.06 0.5a 0.48 ± 0.08 0.56 ± 0.09δ (mm s−1) 0.06 ± 0.06 0.08a 0.16 ± 0.05 0.08 ± 0.06% 8a 6a 8 ± 2 8 ± 2
Superficial Fe3+ coordinated with oleic acid 1 (mm s−1) 0.66a 0.8a 0.9 ± 0.1 0.8 ± 0.1δ (mm s−1) 0.31a 0.5a 0.57 ± 0.06 0.50 ± 0.09% 6a 6a 8 ± 2 6 ± 2
a Parameters held fixed in fitting.
Lewis basicity, characteristic of the amino groups, wouldallow assignment of the doublet with lower δ to superficialFe3+ ions coordinated with oleylamine. On the other hand,the other doublet could be assigned to superficial Fe3+ ionscoordinated with oleic acid in a bidentate way. When thetemperature is increased from 13 to 30 K, no significantchanges occur in hyperfine parameters and percentages ofsignals. Therefore, we can conclude that at 30 K the NPsare magnetically blocked in a complete way. This confirmsthat the central doublets do not belong to superparamagneticγ -Fe2O3 NPs. Instead, at 80 K, magnetic relaxationphenomena are taking place, making it necessary to includea relaxing signal in the fitting procedure. At this temperature,the areas of the blocked and relaxing signals assigned toγ -Fe2O3 are equal (44 ± 7% and 44 ± 8% respectively). Thetemperature at which the superparamagnetic relaxation time isequal to the timescale of the experimental technique is calledthe blocking temperature, TB. Therefore, we can estimate thatthe Mossbauer TB of the M1 sample is about 80 K. Finally,at 263 K, almost the entire population of the NPs is in asuperparamagnetic regime and the sextuplets have collapsedto a central signal.
In single-domain particles—with superparamagneticrelaxation—the magnetization direction fluctuates sponta-neously and the relaxation time (τ ) exhibits an exponential de-pendence on temperature characterized by a Neel–Arrheniuslaw [31]:
τ = τ0 exp(
Ea
kBT
)(1)
where T is the temperature, kB is Boltzmann’s constant andEa is the anisotropy energy barrier. For negligible interparticleinteractions, τ0 in maghemite nanoparticles is of the order of10−10 s [28]. In the absence of an external magnetic field,
the energy barrier can be assumed to be proportional to theparticle volume V , and if NPs have a dominating uniaxialanisotropy it is given by
Ea = KeffVsin2θ (2)
where Keff is an effective magnetic anisotropy constantand θ is the angle between the magnetic moment ofthe particle and its easy magnetization axis. When TB isreached, the relaxation time can be considered equal to thecharacteristic measurement time of the used technique. IfMossbauer spectroscopy is used, this time is equal to thenuclear Larmor precession time, τL ≈ 2.5 ns. Therefore, avalue of Keff = 1 × 10⁵ erg cm−3 is obtained. Assuminga cubic anisotropy, considering that the easy axis is the[111] direction and the second order magnetocrystallineanisotropy constant, K2, is negligible, the ratio between Keffand the first order magnetocrystalline anisotropy constant,K1, is Keff = −K1/12. Therefore, a value of K1 = (−1.2 ×10⁶ erg cm−3) is obtained. However, in maghemite, thefirst order magnetocrystalline anisotropy constant, K1, isapproximately equal to (−2.5 × 10⁵ erg cm−3) [28]. Othercontributions could enlarge the effective magnetic anisotropyconstant, such as shape and surface anisotropy. However,taking into account that M1 NPs are nearly spherical, theshape anisotropy contribution is zero [32]. On the other hand,the ratio between Keff and the bulk anisotropy energy per unitvolume (KV), and the surface density of anisotropy energy(KS) for spherical particles of diameter d, was presented byBødker et al [33]:
Keff = KV +6d
Ks . (3)
From symmetry arguments, and assuming that surfaceanisotropy is normal to the particle surface, these authors have
7
Nanotechnology 24 (2013) 175601 I O Perez De Berti et al
demonstrated that a perfect spherical particle should have azero net contribution from surface anisotropy. This model wasverified by Komorida et al [28], who found that the surfacecontribution is about two orders of magnitude lower than KVin maghemite NPs of 5 nm. Therefore, our result of aboutone order of magnitude larger than the magnetocrystallineanisotropy constant of bulk maghemite can be attributed to theexistence of dipolar magnetic interactions, which can decreasedramatically the τ0 values [28, 34]. The existence of theseinteractions will be confirmed by magnetic measurements, aswill be described below.
3.3. Analysis of FT-IR spectra
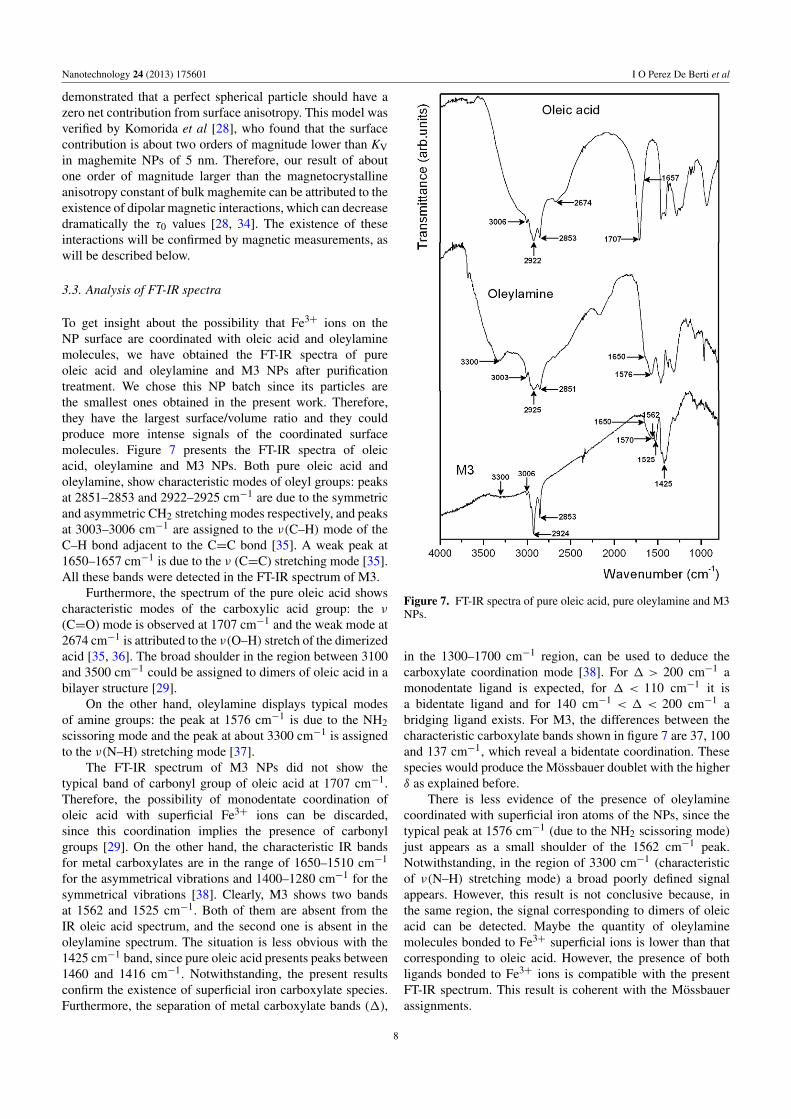
To get insight about the possibility that Fe3+ ions on theNP surface are coordinated with oleic acid and oleylaminemolecules, we have obtained the FT-IR spectra of pureoleic acid and oleylamine and M3 NPs after purificationtreatment. We chose this NP batch since its particles arethe smallest ones obtained in the present work. Therefore,they have the largest surface/volume ratio and they couldproduce more intense signals of the coordinated surfacemolecules. Figure 7 presents the FT-IR spectra of oleicacid, oleylamine and M3 NPs. Both pure oleic acid andoleylamine, show characteristic modes of oleyl groups: peaksat 2851–2853 and 2922–2925 cm−1 are due to the symmetricand asymmetric CH2 stretching modes respectively, and peaksat 3003–3006 cm−1 are assigned to the ν(C–H) mode of theC–H bond adjacent to the C=C bond [35]. A weak peak at1650–1657 cm−1 is due to the ν (C=C) stretching mode [35].All these bands were detected in the FT-IR spectrum of M3.
Furthermore, the spectrum of the pure oleic acid showscharacteristic modes of the carboxylic acid group: the ν
(C=O) mode is observed at 1707 cm−1 and the weak mode at2674 cm−1 is attributed to the ν(O–H) stretch of the dimerizedacid [35, 36]. The broad shoulder in the region between 3100and 3500 cm−1 could be assigned to dimers of oleic acid in abilayer structure [29].
On the other hand, oleylamine displays typical modesof amine groups: the peak at 1576 cm−1 is due to the NH2scissoring mode and the peak at about 3300 cm−1 is assignedto the ν(N–H) stretching mode [37].
The FT-IR spectrum of M3 NPs did not show thetypical band of carbonyl group of oleic acid at 1707 cm−1.Therefore, the possibility of monodentate coordination ofoleic acid with superficial Fe3+ ions can be discarded,since this coordination implies the presence of carbonylgroups [29]. On the other hand, the characteristic IR bandsfor metal carboxylates are in the range of 1650–1510 cm−1
for the asymmetrical vibrations and 1400–1280 cm−1 for thesymmetrical vibrations [38]. Clearly, M3 shows two bandsat 1562 and 1525 cm−1. Both of them are absent from theIR oleic acid spectrum, and the second one is absent in theoleylamine spectrum. The situation is less obvious with the1425 cm−1 band, since pure oleic acid presents peaks between1460 and 1416 cm−1. Notwithstanding, the present resultsconfirm the existence of superficial iron carboxylate species.Furthermore, the separation of metal carboxylate bands (1),
Figure 7. FT-IR spectra of pure oleic acid, pure oleylamine and M3NPs.
in the 1300–1700 cm−1 region, can be used to deduce thecarboxylate coordination mode [38]. For 1 > 200 cm−1 amonodentate ligand is expected, for 1 < 110 cm−1 it isa bidentate ligand and for 140 cm−1 < 1 < 200 cm−1 abridging ligand exists. For M3, the differences between thecharacteristic carboxylate bands shown in figure 7 are 37, 100and 137 cm−1, which reveal a bidentate coordination. Thesespecies would produce the Mossbauer doublet with the higherδ as explained before.
There is less evidence of the presence of oleylaminecoordinated with superficial iron atoms of the NPs, since thetypical peak at 1576 cm−1 (due to the NH2 scissoring mode)just appears as a small shoulder of the 1562 cm−1 peak.Notwithstanding, in the region of 3300 cm−1 (characteristicof ν(N–H) stretching mode) a broad poorly defined signalappears. However, this result is not conclusive because, inthe same region, the signal corresponding to dimers of oleicacid can be detected. Maybe the quantity of oleylaminemolecules bonded to Fe3+ superficial ions is lower than thatcorresponding to oleic acid. However, the presence of bothligands bonded to Fe3+ ions is compatible with the presentFT-IR spectrum. This result is coherent with the Mossbauerassignments.
8
Nanotechnology 24 (2013) 175601 I O Perez De Berti et al
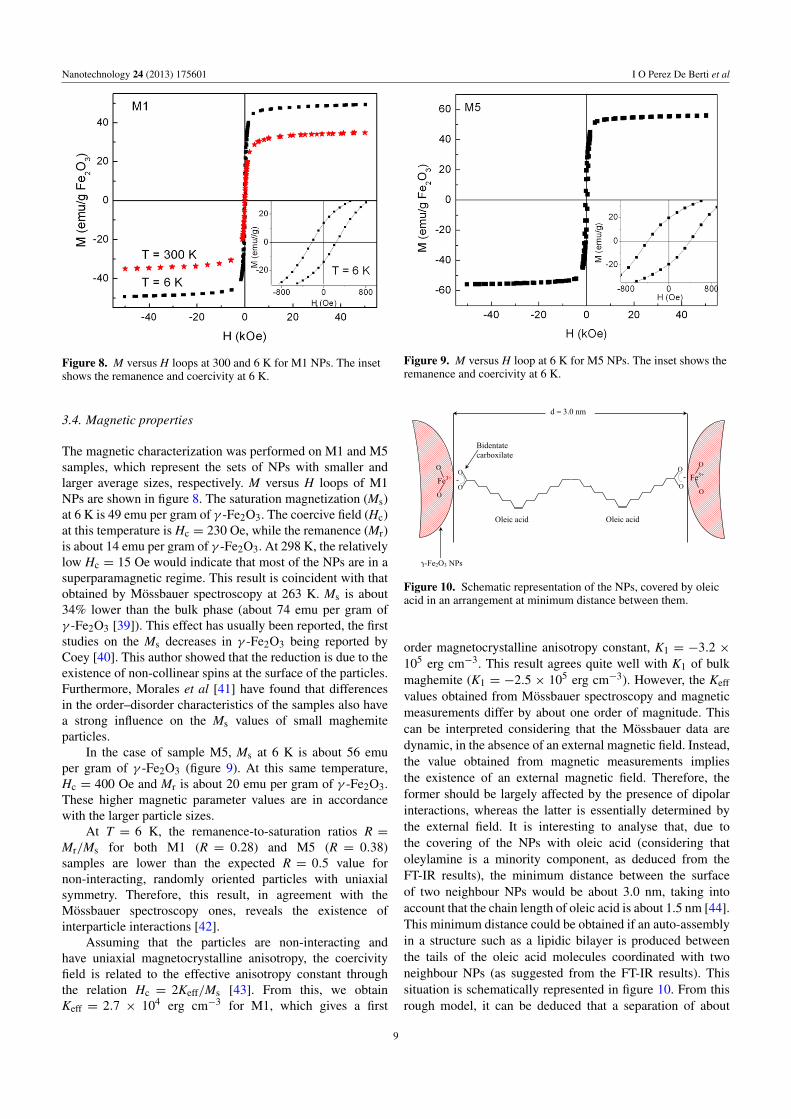
Figure 8. M versus H loops at 300 and 6 K for M1 NPs. The insetshows the remanence and coercivity at 6 K.
3.4. Magnetic properties
The magnetic characterization was performed on M1 and M5samples, which represent the sets of NPs with smaller andlarger average sizes, respectively. M versus H loops of M1NPs are shown in figure 8. The saturation magnetization (Ms)at 6 K is 49 emu per gram of γ -Fe2O3. The coercive field (Hc)at this temperature is Hc = 230 Oe, while the remanence (Mr)is about 14 emu per gram of γ -Fe2O3. At 298 K, the relativelylow Hc = 15 Oe would indicate that most of the NPs are in asuperparamagnetic regime. This result is coincident with thatobtained by Mossbauer spectroscopy at 263 K. Ms is about34% lower than the bulk phase (about 74 emu per gram ofγ -Fe2O3 [39]). This effect has usually been reported, the firststudies on the Ms decreases in γ -Fe2O3 being reported byCoey [40]. This author showed that the reduction is due to theexistence of non-collinear spins at the surface of the particles.Furthermore, Morales et al [41] have found that differencesin the order–disorder characteristics of the samples also havea strong influence on the Ms values of small maghemiteparticles.
In the case of sample M5, Ms at 6 K is about 56 emuper gram of γ -Fe2O3 (figure 9). At this same temperature,Hc = 400 Oe and Mr is about 20 emu per gram of γ -Fe2O3.These higher magnetic parameter values are in accordancewith the larger particle sizes.
At T = 6 K, the remanence-to-saturation ratios R =Mr/Ms for both M1 (R = 0.28) and M5 (R = 0.38)samples are lower than the expected R = 0.5 value fornon-interacting, randomly oriented particles with uniaxialsymmetry. Therefore, this result, in agreement with theMossbauer spectroscopy ones, reveals the existence ofinterparticle interactions [42].
Assuming that the particles are non-interacting andhave uniaxial magnetocrystalline anisotropy, the coercivityfield is related to the effective anisotropy constant throughthe relation Hc = 2Keff/Ms [43]. From this, we obtainKeff = 2.7 × 10⁴ erg cm−3 for M1, which gives a first
Figure 9. M versus H loop at 6 K for M5 NPs. The inset shows theremanence and coercivity at 6 K.
Figure 10. Schematic representation of the NPs, covered by oleicacid in an arrangement at minimum distance between them.
order magnetocrystalline anisotropy constant, K1 = −3.2 ×10⁵ erg cm−3. This result agrees quite well with K1 of bulkmaghemite (K1 = −2.5 × 10⁵ erg cm−3). However, the Keff
values obtained from Mossbauer spectroscopy and magneticmeasurements differ by about one order of magnitude. Thiscan be interpreted considering that the Mossbauer data aredynamic, in the absence of an external magnetic field. Instead,the value obtained from magnetic measurements impliesthe existence of an external magnetic field. Therefore, theformer should be largely affected by the presence of dipolarinteractions, whereas the latter is essentially determined bythe external field. It is interesting to analyse that, due tothe covering of the NPs with oleic acid (considering thatoleylamine is a minority component, as deduced from theFT-IR results), the minimum distance between the surfaceof two neighbour NPs would be about 3.0 nm, taking intoaccount that the chain length of oleic acid is about 1.5 nm [44].This minimum distance could be obtained if an auto-assemblyin a structure such as a lipidic bilayer is produced betweenthe tails of the oleic acid molecules coordinated with twoneighbour NPs (as suggested from the FT-IR results). Thissituation is schematically represented in figure 10. From thisrough model, it can be deduced that a separation of about
9
Nanotechnology 24 (2013) 175601 I O Perez De Berti et al
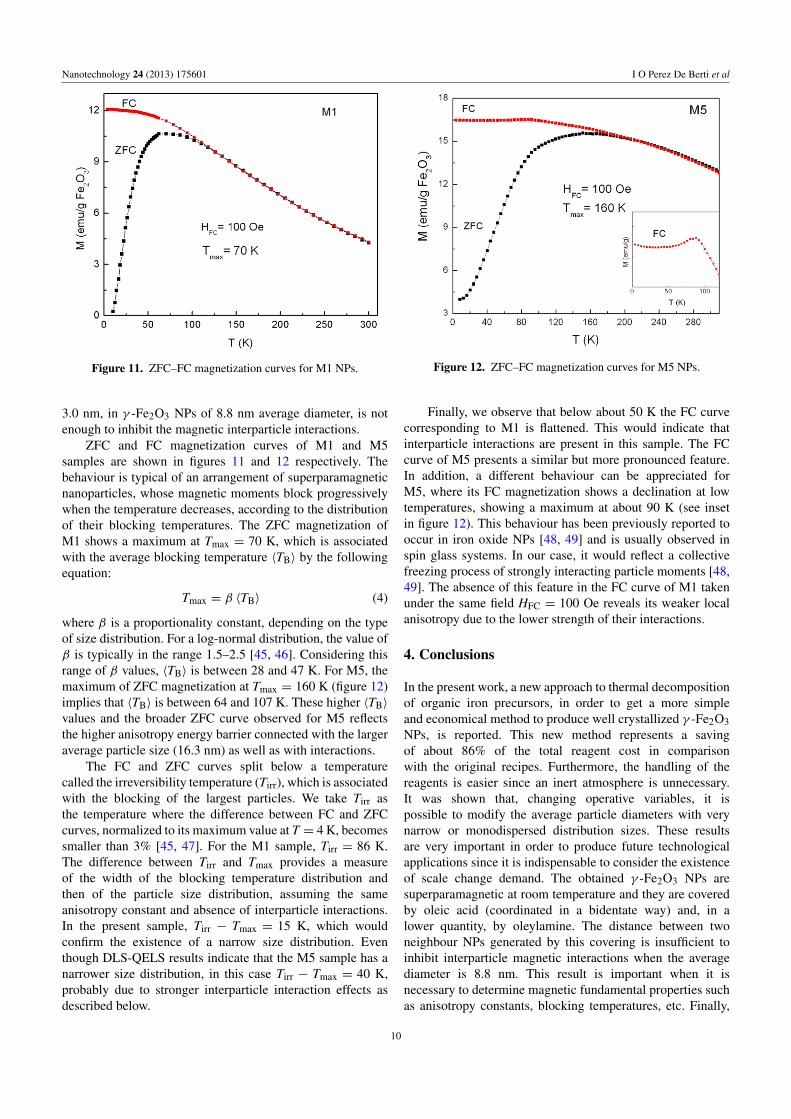
Figure 11. ZFC–FC magnetization curves for M1 NPs.
3.0 nm, in γ -Fe2O3 NPs of 8.8 nm average diameter, is notenough to inhibit the magnetic interparticle interactions.
ZFC and FC magnetization curves of M1 and M5samples are shown in figures 11 and 12 respectively. Thebehaviour is typical of an arrangement of superparamagneticnanoparticles, whose magnetic moments block progressivelywhen the temperature decreases, according to the distributionof their blocking temperatures. The ZFC magnetization ofM1 shows a maximum at Tmax = 70 K, which is associatedwith the average blocking temperature 〈TB〉 by the followingequation:
Tmax = β 〈TB〉 (4)
where β is a proportionality constant, depending on the typeof size distribution. For a log-normal distribution, the value ofβ is typically in the range 1.5–2.5 [45, 46]. Considering thisrange of β values, 〈TB〉 is between 28 and 47 K. For M5, themaximum of ZFC magnetization at Tmax = 160 K (figure 12)implies that 〈TB〉 is between 64 and 107 K. These higher 〈TB〉
values and the broader ZFC curve observed for M5 reflectsthe higher anisotropy energy barrier connected with the largeraverage particle size (16.3 nm) as well as with interactions.
The FC and ZFC curves split below a temperaturecalled the irreversibility temperature (Tirr), which is associatedwith the blocking of the largest particles. We take Tirr asthe temperature where the difference between FC and ZFCcurves, normalized to its maximum value at T = 4 K, becomessmaller than 3% [45, 47]. For the M1 sample, Tirr = 86 K.The difference between Tirr and Tmax provides a measureof the width of the blocking temperature distribution andthen of the particle size distribution, assuming the sameanisotropy constant and absence of interparticle interactions.In the present sample, Tirr − Tmax = 15 K, which wouldconfirm the existence of a narrow size distribution. Eventhough DLS-QELS results indicate that the M5 sample has anarrower size distribution, in this case Tirr − Tmax = 40 K,probably due to stronger interparticle interaction effects asdescribed below.
Figure 12. ZFC–FC magnetization curves for M5 NPs.
Finally, we observe that below about 50 K the FC curvecorresponding to M1 is flattened. This would indicate thatinterparticle interactions are present in this sample. The FCcurve of M5 presents a similar but more pronounced feature.In addition, a different behaviour can be appreciated forM5, where its FC magnetization shows a declination at lowtemperatures, showing a maximum at about 90 K (see insetin figure 12). This behaviour has been previously reported tooccur in iron oxide NPs [48, 49] and is usually observed inspin glass systems. In our case, it would reflect a collectivefreezing process of strongly interacting particle moments [48,49]. The absence of this feature in the FC curve of M1 takenunder the same field HFC = 100 Oe reveals its weaker localanisotropy due to the lower strength of their interactions.
4. Conclusions
In the present work, a new approach to thermal decompositionof organic iron precursors, in order to get a more simpleand economical method to produce well crystallized γ -Fe2O3NPs, is reported. This new method represents a savingof about 86% of the total reagent cost in comparisonwith the original recipes. Furthermore, the handling of thereagents is easier since an inert atmosphere is unnecessary.It was shown that, changing operative variables, it ispossible to modify the average particle diameters with verynarrow or monodispersed distribution sizes. These resultsare very important in order to produce future technologicalapplications since it is indispensable to consider the existenceof scale change demand. The obtained γ -Fe2O3 NPs aresuperparamagnetic at room temperature and they are coveredby oleic acid (coordinated in a bidentate way) and, in alower quantity, by oleylamine. The distance between twoneighbour NPs generated by this covering is insufficient toinhibit interparticle magnetic interactions when the averagediameter is 8.8 nm. This result is important when it isnecessary to determine magnetic fundamental properties suchas anisotropy constants, blocking temperatures, etc. Finally,
10

Nanotechnology 24 (2013) 175601 I O Perez De Berti et al
the magnetization saturation is decreased by about 34% forthe sample with the smallest average size with respect to thebulk phase.
Acknowledgment
The authors acknowledge the financial support of ANPCyT(PICT No 00549), which allowed the development of thiswork.
References
[1] Jain T K, Morales M A, Sahoo S K, Leslie-Pelecky D L andLabhasetwar V 2005 Mol. Pharm. 2 194–205
[2] Chourpa I, Douziech-Eyrolles L, Ngaboni-Okassa L,Fouquenet J F, Cohen-Jonathan S, Souce M,Marchais H and Dubois P 2005 Analyst 130 1395–03
[3] Lee K-B, Park S and Mirkin C A 2004 Angew. Chem. Int. Edn43 3048–50
[4] Mura C V, Becker M I, Orellana A and Wolff D J 2002J. Immunol. Methods 260 263–71
[5] Kim D K, Zhang Y, Kehr J, Klason T, Bjelke B andMuhammed M 2001 J. Magn. Magn. Mater. 255 256–61
[6] Modo M M J and Bulte J W M 2007 Molecular and CellularMR Imaging ed M M J Modo and J W M Bulte(Boca Raton, FL: CRC Press)
[7] Burtea C, Laurent S, Roch A, Vander Elst L andMuller R N 2005 J. Inorg. Biochem. 99 1135–44
[8] Fortin J P, Wilhelm C, Servais J, Menager C, Bacri J C andGazeau F 2007 J. Am. Chem. Soc. 129 2628–35
[9] Sun S, Murray C, Weller D, Folks L and Moser A 2000Science 287 1989–92
[10] Sun S and Zeng H 2002 J. Am. Chem. Soc. 124 8204–5[11] Peikov V T, Jeon K S and Lane A M 1999 J. Magn. Magn.
Mater. 193 307–10[12] McMichael R D, Shull R D, Swartzendruber L J,
Bennet L H and Watson R E 1992 J. Magn. Magn. Mater.111 29–33
[13] Guin D, Baruwati B and Manorama S V 2007 Org. Lett.9 1491–21
[14] Gupta A K and Wells S 2004 IEEE Trans. Nanobiosci.3 66–73
[15] Teja A S and Koh P-Y 2009 Prog. Cryst. Growth Charact.Mater. 55 22–45
[16] Veintemillas-Vendaguer S et al 2004 J. Phys. D: Appl. Phys.37 2054–9
[17] Li Z, Chen H, Bao H and Gao M 2004 Chem. Mater.16 1391–3
[18] Rockenberger J, Scher E C and Alivisatos A P 1999 J. Am.Chem. Soc. 121 11595–6
[19] Hyeon T, Lee S S, Park J, Chung Y and Na H B 2001 J. Am.Chem. Soc. 123 12798–01
[20] Sun S, Zeng H, Robinson D B, Raoux S, Rice P M,Wang S X and Li G 2004 J. Am. Chem. Soc. 126 273–9
[21] Provencher S W 1982 Comput. Phys. Commun. 27 213–27[22] Lagarec V and Rancourt D G 1998 Mossbauer Spectral
Analysis Software Dep. of Phys. University of Otawa,Version 1.0
[23] Sandell E B 1959 Colorimetric Determination of Traces ofMetals 3rd edn (New York: Interscience Publishers)
[24] Granqvist C G and Buhrman R A 1976 J. Appl. Phys.47 2200–19
[25] Zhu Y, Jiang F Y, Chen K, Kang F and Tang Z K 2011J. Alloys Compounds 509 8549–53
[26] Murad E 1998 Hyperfine Interact. 117 39–70[27] Mørup S and Topsøe H 1976 Appl. Phys. 11 63–6[28] Komorida Y, Mito M, Deguchi H, Takagi S, Millan A,
Silva N J O and Palacio F 2009 Appl. Phys. Lett. 94 202503[29] Bronstein L M, Huang X, Retrum J, Schmucker A, Pink M,
Stein B D and Dragnea B 2007 Chem. Mater. 19 3624–32[30] Lin M M and Kim D K 2012 J. Nanopart. Res. 14 688–705[31] Neel L 1949 Ann. Geophys. 5 99–136[32] Mørup S and Hansen M F 2007 Handbook of Magnetism and
Advanced Magnetic Materials Vol 4: Novel Materialsed H Kronmuller and S Parkin (New York: Wiley) p 2179
[33] Bødker F, Mørup S and Linderoth S 1994 Phys. Rev. Lett.72 282–5
[34] Dormann J L, D’Orazio F, Lucari F, Tronc E, Prene P,Jolivet J P, Fiorani D, Cherkaoui R and Nogues M 1996Phys. Rev. B 53 14291–7
[35] Lee D H, Condrate R A Sr and Lacourse W C 2000 J. Mater.Sci. 35 4961–70
[36] Lee D H and Condrate R A Sr 1999 J. Mater. Sci. 34 139–46[37] Erley W and Hemminger J C 1994 Surf. Sci. 316 L1025–30[38] Lu Y and Miller J D 2002 J. Colloid Interface Sci. 256 41–52[39] Feltin N and Pileni M P 1997 Langmuir 13 3927–33[40] Coey J M D 1971 Phys. Rev. Lett. 27 1140–2[41] Morales M P, Andres-Verges M, Veintemillas-Verdaguer S,
Montero M I and Serna C J 1999 J. Magn. Magn. Mater.203 146–8
[42] Hadjipanayis G, Sellmyer D J and Brandt B 1981 Phys. Rev. B23 3349–54
[43] Goya G F, Berquo T S, Fonseca F C and Morales M P 2003J. Appl. Phys. 94 3520–8
[44] Yang K, Peng H, Wen Y and Li N 2010 Appl. Surf. Sci.256 3093–7
[45] Peddis D, Mansilla M V, Mørup S, Cannas C, Musinu A,Piccaluga G, D’Orazio F, Lucari F and Fiorani D 2008J. Phys. Chem. B 112 8507–13
[46] Gittleman J L, Abels B and Bozowski S 1974 Phys. Rev. B9 3891–7
[47] Del Bianco L, Fiorani D, Testa A M, Bonetti E, Savini L andSignoretti S 2002 Phys. Rev. B 66 174418
[48] Zysler R D, Fiorani D and Testa A M 2001 J. Magn. Magn.Mater. 224 5–11
[49] Leite E S, Coaquira J A H, Viali W R, Sartoratto P P C,de Almeida R L, Morais P C and Malik S K 2010 J. Phys.:Conf. Ser. 200 072060
11
Copyright © 2022 FDOKUMEN