M-Protein Is Down-Regulated in Cardiac Hypertrophy Driven by Thyroid Hormone in Rats
11
M-Protein Is Down-Regulated in Cardiac Hypertrophy Driven by Thyroid Hormone in Rats Andrei Rozanski,* Ana Paula C. Takano,* Patricia N. Kato, Antonio G. Soares, Camilo Lellis-Santos, Juliane Cruz Campos, Julio Cesar Batista Ferreira, Maria Luiza M. Barreto-Chaves, and Anselmo S. Moriscot Department of Cell and Developmental Biology (A.R.), Department of Anatomy (A.R., A.P.C.T., P.N.K., J.C.C., J.C.B.F., M.L.M.B.-C., A.S.M.), Department of Pharmacology (A.G.S.), and Department of Physiology and Biophysics (C.L.-S.), Institute of Biomedical Sciences, University of São Paulo, São Paulo- SP, Brazil Although it is well known that the thyroid hormone (T 3 ) is an important positive regulator of cardiac function over a short term and that it also promotes deleterious effects over a long term, the molecular mechanisms for such effects are not yet well understood. Because most alterations in cardiac function are associated with changes in sarcomeric machinery, the present work was undertaken to find novel sarcomeric hot spots driven by T 3 in the heart. A microarray analysis indicated that the M-band is a major hot spot, and the structural sarcomeric gene coding for the M-protein is severely down-regulated by T 3 . Real-time quantitative PCR-based measurements confirmed that T 3 (1, 5, 50, and 100 physiological doses for 2 days) sharply decreased the M-protein gene and protein expression in vivo in a dose-dependent manner. Furthermore, the M-protein gene expression was elevated 3.4-fold in hypothyroid rats. Accordingly, T 3 was able to rapidly and strongly reduce the M-protein gene expression in neonatal cardiomyocytes. Deletions at the M-protein promoter and bioinformatics approach suggested an area responsive to T 3 , which was confirmed by chromatin immunoprecipitation assay. Functional assays in cultured neonatal car- diomyocytes revealed that depletion of M-protein (by small interfering RNA) drives a severe decrease in speed of contraction. Interestingly, mRNA and protein levels of other M-band com- ponents, myomesin and embryonic-heart myomesin, were not altered by T 3 . We concluded that the M-protein expression is strongly and rapidly repressed by T 3 in cardiomyocytes, which repre- sents an important aspect for the basis of T 3 -dependent sarcomeric deleterious effects in the heart. (Molecular Endocrinology 27: 2055–2065, 2013) T he heart is a major target organ for thyroid hormone (T 3 ) action, and it is well established that hypo- and hyperthyroid patients exhibit changes in cardiac function (1, 2). Acute hyperthyroidism is known to promote a rapid increase in cardiac output, contractility, and ven- tricular mass mainly due to direct effects (1) and also indirect effects such as sustained volume overload (3, 4) and activation of renin-angiotensin system (5). In addi- tion, damage to the cardiomyocyte-contractile apparatus has been reported in humans with long-term hyperthy- roidism (6). Another study has reported that the M-band, an essential element for sarcomere stabilization, is rapidly and severely affected by T 3 in the heart, whereas the Z- disc, which anchors actin filaments, endures even when sarcomere is deeply disarrayed (7). Nevertheless, the mo- lecular basis for the T 3 deleterious outcome in the myo- cardium ultrastructure, mediating sarcomeric disarray, remains unclear. In this regard, global gene expression profile assessment of genes related to sarcomere proteins through microarray analysis may produce relevant clues. Indeed, when we addressed global gene expression profile in rat hearts under experimental hyperthyroidism over ISSN Print 0888-8809 ISSN Online 1944-9917 Printed in U.S.A. Copyright © 2013 by The Endocrine Society Received January 21, 2013. Accepted October 23, 2013. First Published Online October 31, 2013 * A.R. and A.P.C.T. contributed equally to this study. Abbreviations: BW, body weight; ChIP, chromatin immunoprecipitation; EH-myomesin, embryonic heart myomesin; GAPDH, glyceraldehyde-3-phosphate dehydrogenase; LV, left ventricle; PB, phosphate buffer; siRNA, small interfering RNA; TR, thyroid hormone receptor; TRE, thyroid hormone element. ORIGINAL RESEARCH doi: 10.1210/me.2013-1018 Mol Endocrinol, December 2013, 27(12):2055–2065 mend.endojournals.org 2055
Transcript of M-Protein Is Down-Regulated in Cardiac Hypertrophy Driven by Thyroid Hormone in Rats

M-Protein Is Down-Regulated in Cardiac HypertrophyDriven by Thyroid Hormone in Rats
Andrei Rozanski,* Ana Paula C. Takano,* Patricia N. Kato, Antonio G. Soares,Camilo Lellis-Santos, Juliane Cruz Campos, Julio Cesar Batista Ferreira,Maria Luiza M. Barreto-Chaves, and Anselmo S. Moriscot
Department of Cell and Developmental Biology (A.R.), Department of Anatomy (A.R., A.P.C.T., P.N.K.,J.C.C., J.C.B.F., M.L.M.B.-C., A.S.M.), Department of Pharmacology (A.G.S.), and Department ofPhysiology and Biophysics (C.L.-S.), Institute of Biomedical Sciences, University of São Paulo, São Paulo-SP, Brazil
Although it is well known that the thyroid hormone (T3) is an important positive regulator ofcardiac function over a short term and that it also promotes deleterious effects over a long term,the molecular mechanisms for such effects are not yet well understood. Because most alterationsin cardiac function are associated with changes in sarcomeric machinery, the present work wasundertaken to find novel sarcomeric hot spots driven by T3 in the heart. A microarray analysisindicated that the M-band is a major hot spot, and the structural sarcomeric gene coding for theM-protein is severely down-regulated by T3. Real-time quantitative PCR-based measurementsconfirmed that T3 (1, 5, 50, and 100 physiological doses for 2 days) sharply decreased the M-proteingene and protein expression in vivo in a dose-dependent manner. Furthermore, the M-proteingene expression was elevated 3.4-fold in hypothyroid rats. Accordingly, T3 was able to rapidly andstrongly reduce the M-protein gene expression in neonatal cardiomyocytes. Deletions at theM-protein promoter and bioinformatics approach suggested an area responsive to T3, which wasconfirmed by chromatin immunoprecipitation assay. Functional assays in cultured neonatal car-diomyocytes revealed that depletion of M-protein (by small interfering RNA) drives a severedecrease in speed of contraction. Interestingly, mRNA and protein levels of other M-band com-ponents, myomesin and embryonic-heart myomesin, were not altered by T3. We concluded thatthe M-protein expression is strongly and rapidly repressed by T3 in cardiomyocytes, which repre-sents an important aspect for the basis of T3-dependent sarcomeric deleterious effects in theheart. (Molecular Endocrinology 27: 2055–2065, 2013)
The heart is a major target organ for thyroid hormone(T3) action, and it is well established that hypo- and
hyperthyroid patients exhibit changes in cardiac function(1, 2). Acute hyperthyroidism is known to promote arapid increase in cardiac output, contractility, and ven-tricular mass mainly due to direct effects (1) and alsoindirect effects such as sustained volume overload (3, 4)and activation of renin-angiotensin system (5). In addi-tion, damage to the cardiomyocyte-contractile apparatushas been reported in humans with long-term hyperthy-roidism (6). Another study has reported that the M-band,
an essential element for sarcomere stabilization, is rapidlyand severely affected by T3 in the heart, whereas the Z-disc, which anchors actin filaments, endures even whensarcomere is deeply disarrayed (7). Nevertheless, the mo-lecular basis for the T3 deleterious outcome in the myo-cardium ultrastructure, mediating sarcomeric disarray,remains unclear. In this regard, global gene expressionprofile assessment of genes related to sarcomere proteinsthrough microarray analysis may produce relevant clues.Indeed, when we addressed global gene expression profilein rat hearts under experimental hyperthyroidism over
ISSN Print 0888-8809 ISSN Online 1944-9917Printed in U.S.A.Copyright © 2013 by The Endocrine SocietyReceived January 21, 2013. Accepted October 23, 2013.First Published Online October 31, 2013
* A.R. and A.P.C.T. contributed equally to this study.Abbreviations: BW, body weight; ChIP, chromatin immunoprecipitation; EH-myomesin,embryonic heart myomesin; GAPDH, glyceraldehyde-3-phosphate dehydrogenase; LV,left ventricle; PB, phosphate buffer; siRNA, small interfering RNA; TR, thyroid hormonereceptor; TRE, thyroid hormone element.
O R I G I N A L R E S E A R C H
doi: 10.1210/me.2013-1018 Mol Endocrinol, December 2013, 27(12):2055–2065 mend.endojournals.org 2055

time, a potentially key sarcomeric hot spot emerged, theM-band. The M-band comprises 4 myomesin proteins,myomesin 1 and its alternative spliced isoform, the em-bryonic heart myomesin (EH-myomesin) (8), the M-pro-tein (also known as myomesin 2) (9), and the more latelycharacterized myomesin 3 (10). These closely related pro-teins are composed mainly of immunoglobulin-like andfibronectin type III domains (11, 12) and were suggestedto cross-link the titin and myosin filaments of the M-band. EH-myomesin is preferentially expressed in the em-bryonic heart of all higher vertebrates and, to a lesserextent, in slow fibers of adult mice (13). Interestingly,EH-myomesin appears to be expressed in a complemen-tary pattern with the M-protein. This differential expres-sion of the M-protein and EH-myomesin suggests that amuscle type can adjust its M-band structure to a deter-mined muscle demand (13). The most recently describedmyomesin 3 is restricted to the skeletal muscle fibers andtherefore is not expressed in the heart (10). In the presentstudy, we employed a microarray analysis to search forhighly T3-responsive sarcomeric domains, and theM-protein was identified. We showed that the M-proteinexpression, but not myomesin 1 and EH-myomesin, issharply and rapidly down-regulated by T3 in vivo and invitro. We also showed that the M-protein promoter isresponsive to T3, and an area close to the transcriptionstart point is suggested to contain TREs (thyroid hormoneelements). Finally, we showed that down-regulation ofM-protein in cultured cardiomyocytes drives a severe def-icit in contractility, highlighting the important role of M-protein in sarcomere function.
Materials and Methods
AnimalsAll animals were handled according to an experimental pro-
tocol in accordance with ethical principles in animal researchadopted by the Brazilian College of Animal Experimentation(COBEA) and approved by Institute of Biomedical Sciences/University of São Paulo Ethical Committee for Animal Utiliza-tion (CEUA). Male Wistar rats weighing 200–250 g were ob-tained from the University of São Paulo, Institute of BiomedicalSciences, in São Paulo, Brazil. The animals were given free accessto standard rodent food and water and were housed in a tem-perature- and light-controlled environment (24°C; 12-hourlight/dark cycle).
MicroarrayTotal RNA from adult rat ventricles was isolated using a
Trizol LS reagent (Life Technologies) in accordance with themanufacturer’s instructions. Total RNA was further purifiedwith RNAeasy Fibrous Tissue Mini Kit (Qiagen) to reach mi-croarray RNA quality standards. The resulting phenol-free
RNA was submitted to spectrophotometric analysis in a Nano-drop spectrophotometer (Uniscience), and RNA quantity wasdetermined by the A260 wavelength method. Total RNA (1 �g)was used in the cDNA first-strand synthesis with One-CycleTarget Labeling and a Control Reagents kit (Affymetrix). At theend of the cycle, samples were repurified using the Cleanup ofthe Double-Strand cDNA kit (Affymetrix) and requantified inNanodrop. The biotinylated cRNA synthesis was carried outwith the in vitro transcription (IVT) Gene Chip Expression 3�-the Amplification Reagents for IVT labeling kit (Affymetrix)followed by the cRNA fragmentation at a high temperature anda high Mg�2 concentration buffer. For hybridization, we usedthe Gene Chip Hybridization, Wash and Stain (Affymetrix).Chips were filled in with hybridization buffer, incubated at45°C for 16 hours and then processed in the washing station(Affymetrix). After all the treatments, the chips were scanned.
Microarray data analysisMicroarray raw data analysis were conducted using “affy”
and “simpleaffy” packages by Bioconductor (14), implementedon the R statistical program. MAS5 algorithm was applied. Thegene expression values obtained were filtered using a cutoff of50, allowing us to enrich our samples with genes with relativesecure levels of expression above background. Fold changes(fold induction in 12 hours, 24 hours, and 7 days) were calcu-lated for all genes. We decided to adopt a stringent cutoff crite-rion, only genes down-regulated by � 0.3 and up-regulatedby � 3.0-fold were considered acceptable for analysis. Based onAffymetrix annotation files, a list of probes related to sarco-meric proteins was composed and categorized in agreement toits localization in sarcomere.
Animal treatmentsFor the microarray approach, experimental hyperthyroidism
was induced in animals by daily ip injections of T3 (0.07 �g/g ofbody weight, equivalent to 20 physiological doses) during 12hours, 24 hours and 7 days. Rats were killed by decapitation.Hearts were then removed and frozen in liquid nitrogen andstored at �80°C for later analysis.
In order to validate the impact of T3 upon the M-band, ratswere previously submitted to hypothyroidism by thyroidectomyfollowed by 0,05% methimazole (Sigma) administrated indrinking water for 20 days. T3 was administered daily to 4groups (n � 4–6) via ip injection at the following doses: 3.5 ng,17.5 ng, 0.17 �g, and 0.35 �g/g/ body weight (BW). The dose ofT3 to achieve the euthyroid state (3.5 �g/g BW) is defined as 1�T3 (15), 17.5ng/g BW corresponding to 5� T3, 0.17 �g/g BW to50� T3, and 0.35 �g/g BW to 100� T3. The other 3 groups (n �4) were injected with 0.35 �g/g BW T3 for 2 and 8 days. A groupof 6 untreated rats was used as control. After the treatments, theanimals were killed by decapitation, and their hearts werequickly removed, rinsed in saline, and flash frozen in liquidnitrogen.
Primary culture of cardiomyocytes: preparationand procedures
Cultured neonatal rat cardiomyocytes were prepared as pre-viously described (16). Briefly, myocytes were dispersed fromthe ventricles of 1- to 2-day-old Wistar rats by digestion withcollagenase type II (Worthington) and pancreatin (Invitrogen) at
2056 Rozanski et al T3 Down-Regulates M-Protein in Rat Heart Mol Endocrinol, December 2013, 27(12):2055–2065

37°C. Cultures with more than 95% cardiomyocytes were ob-tained after purification of cell suspensions on a discontinuousPercoll (Pharmacia LKB Biotechnology) gradient. Cell viabilitywas estimated by the Trypan blue method, after which the cellswere counted and plated. Myocytes were cultured in DMEM(Invitrogen) containing penicillin-streptomycin (Invitrogen),10% horse serum (Invitrogen), and 5% newborn calf serum(Invitrogen). The cells were maintained at 37°C under humidi-fied conditions of 95% air and 5% CO2.
Seventy-two hours after plating, the cells were transferred toDMEM containing newborn calf serum 0.5% and maintainedovernight. Then, the medium was discarded and the cells wereincubated with either serum-free medium (control cells) or se-rum-free medium containing T3 (10�7 M; Sigma) for 12 hours,24 hours, and 48 hours. Also cells were transfected with smallinterfering RNA (siRNA) for M-protein or with a nonspecificsiRNA control (Stealth RNAi Negative Control Duplex; Invit-rogen) using Lipofectamine 2000 (Invitrogen). The oligo-lipocomplex medium was replaced after 6 hours incubation withfresh medium, and the cells were maintained in an incubator for72 hours. Subsequently, cell contraction properties of cardio-myocytes were evaluated using a video-based sarcomere-spac-ing acquisition system (SarcLen, IonOptix) as previously de-scribed (17). Cardiomyocytes were perfused with normalTyrode’s solution and electrically paced (1–3 Hz via field stim-ulation). Changes in sarcomere length were recorded and ana-lyzed using IonWizard software (IonOptix).
RNA isolation and real-time quantitative PCRRNA was isolated from ventricular samples or cardiomyo-
cytes using a Trizol reagent (Invitrogen) followed by cDNAsynthesis from 1 �g of total RNA using a SuperScript II Kit(Invitrogen) and oligo-DT primers according to manufacturer’sinstructions.
A real-time quantitative PCR (qPCR) was performed on theABI Prism 5700 sequence detection system (Applied Biosystems)using SYBR Green (Applied Biosystems). Cycling conditionswere 95°C for 10 minutes, 40 cycles of 95°C for 15 seconds, and60°C for 60 seconds. Internal control glyceraldehyde-3-phos-phate dehydrogenase (GAPDH) was amplified in separate tubesand data were expressed as the ratio from the target gene overGAPDH. Data obtained previously in our laboratory showedthat T3 does not influence cardiac or cardiomyocytic GAPDHexpression levels, functioning as an adequate internal control.Data from 5–6 determinations were expressed in all experi-ments as fold change as compared with control group, arbi-trarily set as 1.
AntibodiesMonoclonal mouse antimyomesin antibody (clone B4) (18)
and monoclonal mouse anti-M-protein antibody (clone AA259,Ig A) (19) were kindly provided by Dr. Jean Claude Perriard(Zurich University, Switzerland). Antibody against GAPDHwas obtained from Abcam. For immunofluorescence, secondaryantibodies were fluorescein isothiocyanate-conjugated goat an-timouse IgA (Sigma) and Alexa488-conjugated goat antimouseIgG and goat antirabbit (Invitrogen).
Frozen sections of rat heartRat ventricles were dissected, snap frozen in liquid nitrogen
cooled with isopentane, and stored at �80°C until sectioning.Cross-sections (7 �m thick) through the left ventricle (LV) werecut on a microtome-cryostat (IEC Minotome) at �25°C. Thesections were collected on gelatin-coated glass slides, dried for 1hour at room temperature, and stored at �20°C.
Immunostaining and image acquisitionCross-sections of rat ventricles were fixed with 4% parafor-
maldehyde in PB (phosphate buffer, Sigma) for 10 minutes atroom temperature, blocked with 0.1 M glycine (Sigma) in PB for5 minutes, and permeabilized in 0.2% Triton X-100/PB (Sigma)for 10 minutes. Primary antibodies with 3% normal goat serum(Sigma) were incubated overnight at room temperature. Afterwashing with PB, secondary antibodies were added for 2 hours.The specimens were washed in PB and mounted in Vectashield(Vector Laboratories) (20). Slides were evaluated by confocalmicroscopy (Nikon PCM2000, Nikon Instruments) using ap-propriate filter combinations of fluorescein isothiocyanate andAlexa488 (excitation filter, 460–490 nm; barrier filter, 515–550 nm). All images were acquired together with the same gainand composed in Adobe Photoshop version 7.0 (DenebaSoftware).
Cloning of M-protein promoter regionThe putative sequence of rat M-protein promoter (accession
no. XM_240481.4 GI:109503557) was aligned with murineM-protein (accession no, NM_008664.1 GI:6678995) pro-moter previously described (12) showing 87% homology usingthe BLAST tool (21) at NCBI web site (blast.ncbi.nlm.nih.gov).The rat M-protein promoter (�2294/�220bp) construct wasgenerated by amplification of genomic DNA by using sense(5�-TGACATCTTGACCTCTGA-3�) and antisense (5�-TTG-GTTTCTCCTACAGGA-3�) primers, both containing MluI re-striction site adapters that were used to clone the PCR productinto the pGL3-Luc Basic reporter vector (Promega). Fragmentscomprising the promoter deletions �158/�220bp were gener-ated by digestion with KpnI, and PstI (MBI Fermentas). Allconstruct sequences were checked by an automated sequencingreaction at Human Genome Study Center, University of SaoPaulo, Brazil.
Transfection and luciferase assayC2C12 myoblasts were cultured in 24-well plates at approx-
imately 50% confluence and transfected using Lipofectamine(Invitrogen) according to manufacturer’s instructions. Eachplate was cotransfected with 400 ng of the M-protein promoterluciferase reporter gene, 10 ng of control Renilla luciferase vec-tor, 100 ng of thyroid hormone receptor (TR)� or TR� expres-sion vector (generously provided by Dr. Wolfgang Dillmann,University of California, San Diego, CA). Cells were differenti-ated in horse serum 5% for 2 days and 24 hours before thedifferentiation endpoint, cells were treated with T3 (0.01; 0.1; 1and 100 nM) or vehicle. Firefly and Renilla luciferase activitywere determined with a Luciferase Assay kit (Promega) in lumi-nometer (Molecular Devices).
doi: 10.1210/me.2013-1018 mend.endojournals.org 2057

Chromatin immunoprecipitation (ChIP) assayCultured neonatal rat myocardial cells were processed using
buffers and reagents from EZ ChIP Kit (Upstate Biotechnology)according to manufacturer’s instructions. Briefly, cells werefixed in DMEM containing 1% formaldehyde for 10 minutes atroom temperature and transferred to lysis buffer. DNA wassheared to fragments of approximately 200–1000 bp by apply-ing 8 bursts of sonication for cells (40% of power; 10 secondseach). Samples were diluted with dilution buffer and preclearedfor 1 hour at 4°C with protein A-Sepharose (50% slurry) satu-rated with salmon sperm DNA. An aliquot of 10 �L was col-lected as “input.” The remaining supernatants were submittedto immunoprecipitation with protein A-Sepharose saturatedwith salmon sperm DNA and 5 �g of anti-TR�/ß antibody(fl-408; Santa Cruz Biotechnology). In parallel, one sample wasincubated with protein A-Sepharose only in order to generatethe negative control (no-AB). Sepharose pellets were thenwashed with buffers provided in the kit and treated with elutionbuffer. Supernatants were submitted to cross-linking reversaland RNase A treatment. DNA was purified using phenol-chlo-roform and resuspended in 20 �L of ultrapure H2O. DNA sam-ples were amplified for detection of M-protein and GH genes,the latter used as control gene. A 184-bp fragment of the mouseM-protein promoter was amplified by conventional (40 cycles)and real-time quantitative PCR. The sequences of the primerswere: GH sense, 5�-CCCTCGTCCCAGTGAACAAACG-3�;and antisense, 5�-GCTGGAGCCACTGACAGCTTG-3�; M-protein sense, 5�-TCCAGAGCTGGACTGAGGAGGAAA-3�;and antisense, 5�-TTGCTCTGGCAGCATAGGTCCA-3�. Theproducts were visualized as described for RT-PCR. Amplifica-tion values were normalized by input.
Putative TREs searching enginePutative TREs were identified by using a computer script
written using Phyton language. Briefly, the consensus sequenceA/TGGNC/GA/G/T (sense and antisense) was used to feed thescript, allowing identification of putative TREs. This script wasdeveloped by Andrei Rozanski.
Statistical analysisAll data were expressed as mean � SD. Unpaired Student’s t
test or one-way ANOVA followed by Tukey multiple-compar-ison test were employed for assessment of significance (Graph-Pad Prism version 5.0; GraphPad Software, Inc). Differenceswere considered significant when P � .05.
Results
Thyrotoxicosis-induced heart hypertrophyT3 treatment efficiency was confirmed by an increase
of 51% in LV weight of animals treated with 100� T3 for8 days, while BW decreased 12.6% as compared witheuthyroid animals. LV weights (mg) for the euthyroid andT3-treated were 905.33 � 150.05 and 1370 � 134.35,respectively, and LV:BW ratios (mg/g) of 3.8 � 0.5 and6.59 � 0.46; both parameters were significantly differentbetween groups (P � .001; n � 5).
Microarray analysis: identification of T3-dependentsarcomeric hot spots
Our first aim was to detect uncovered T3 highly re-sponsive hot spots in the sarcomere. Of 110 sarcomericgenes evaluated, which fitted within 4 distinct categoriesnamely “thick filaments,” “thin filaments,” “M-band,”and “Z-disk,” we found only 2 genes that were consideredresponsive to T3 (�0.3- and �3.0-fold): Myh7 (0.1-fold,thick filament category) and M-protein (0.3-fold, M-bandcategory) (Figure 1). Previous studies have described the re-sponsiveness of genes related to proteins of thick filaments(1, 3) under experimental hyperthyroidism; nonetheless, nostudies have indicated M-band genes as responsive to T3.Therefore we stepped further by analyzing M-band and as-suming M-protein as the main finding of our microarrayapproach under stringent cutoff conditions.
M-protein gene expression is down-regulated inthe heart by T3 treatment and up-regulated inhypothyroid animals.
An up-regulation (3.4-fold) was observed on M-pro-tein mRNA levels in hearts from hypothyroid rats, com-pared with those observed in euthyroid animals (Figure2A). On the other hand, a down-regulation to virtuallyundetectable levels was observed on M-protein mRNAlevels after 2 or 8 days of treatment (100� T3) (Figure
2A). Increasing doses of T3 for 48hours elicited a dose-dependentrepression profile of M-proteinmRNA levels (Figure 2B). The treat-ment with 1� T3 was enough to de-crease M-protein mRNA levels to67% of control levels (P � .001).Accordingly, increasing doses (5�,50�. and 100�) further decreased(P � .001) M-protein gene expres-sion (24%, 6%, and 3% of control,respectively) (Figure 2B).
In order to further evaluate theeffects of T3 upon the M-band, we
Figure 1. Identification of hot spots on heart sarcomere under T3 treatment determined bymicroarray analysis. Fold induction after 12 hours, 24 hours, and 7 days of T3 treatment, alongwith genes, are shown in boxes described as “M-Band” and “Thick Filaments.”
2058 Rozanski et al T3 Down-Regulates M-Protein in Rat Heart Mol Endocrinol, December 2013, 27(12):2055–2065

used specific antibodies against the M-protein in LV sec-tions. A striated pattern, typical of the M-band localiza-tion, was obtained (Figure 2C). Treatment (100� T3)resulted in a decrease in immunolabeling intensity at 8days of treatment (Figure 2C). Western blot analysis con-firmed decreased expression of the M-protein in T3-treated animals (Figure 2E).
M-protein gene expression is down-regulated byT3 treatment in cultured cardiomyocytes
In order to eliminate a possible systemic modulationon the M-protein gene expression, we evaluated the effectof T3 (10�7M) in cultured isolated neonatal cardiomyo-cytes. Treatment for 12, 24, and 48 hours significantlydecreased the M-protein mRNA levels (Figure 2D). Re-markably, as soon as 12 hours of treatment caused amarked reduction (�70%) on M-protein mRNA levelswhen compared with control (P � .01). This effect wassustained up to 48 hours (Figure 2D).
TR-mediated repression of M-protein promoteractivity
At this point, it was clear that T3 plays a role decreas-ing the M-protein gene expression. To investigate
whether this effect was mediated at the transcriptionallevel, we used a reporter construct containing the proxi-mal promoter region �2294 to �228 of the M-proteingene driving the firefly luciferase transcription (M-pro-tein-luc) in C2C12 cells. Transfection efficiencies werenormalized with Renilla luciferase activity. T3 treat-ment down-regulated the M-protein promoter activityin the presence of either TR�1 or TR�1, by using as lowas 1 nM T3 (Figure 3A). To decrease the M-proteinpromoter area responsive to T3, we have deleted the�2294 to �228 fragment down to �158/�228. Thisshorter construct (pGL3 �158/�228) similarlyshowed a significant repression response to the T3
treatment when compared with that related to the lon-ger construct (�2294 to �228 bp), although this dele-tion has substantially increased the basal transcrip-tional activity (Figure 3B). These results suggest that aT3 response element(s) is/are located between the nu-cleotides �158 and �228 region.
Evidence of physical association of TRs with M-protein promoter
Next, we decided to employ a computer script (devel-oped by Andrei Rozanski; see Material and Methods) de-
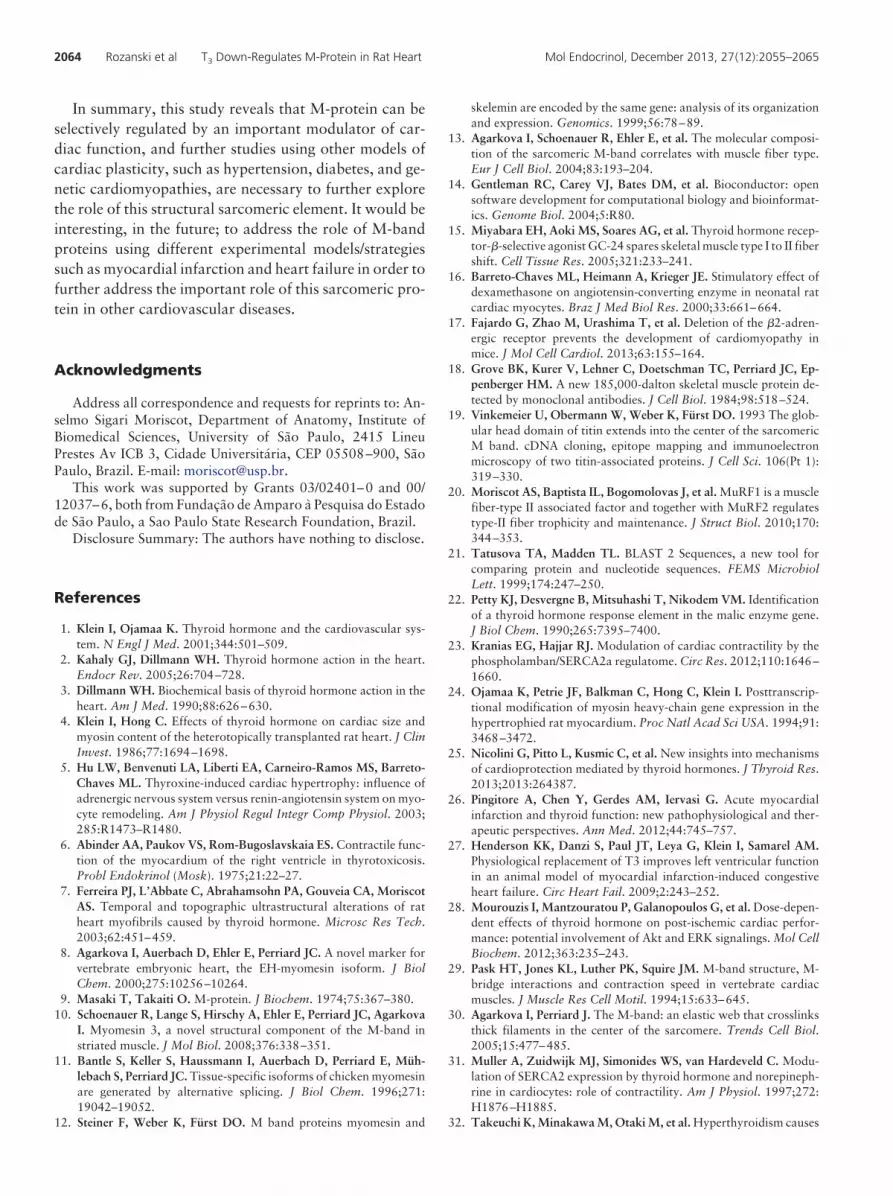
signed to identify potential half-sites(negative TREs). By using this tool,we have identified 3 putative negativeTREs within the fragment �158/�228, following a quite stringent cri-terion (A/t G G T/a C/g A/t). All ofthem are located in the sensus strandand two of them are nearby, spaced by5 nucleotides (Figure 4A), one at�200 bp and the other at �189 bprelative to the transcriptional start.The third putative negative TRE is lo-cated at �116 bp (Figure 4A). In or-der to obtain experimental evidenceof direct binding of TRs to the �158/�228 the M-protein promoter frag-ment, we have performed a ChIP as-say using primary cultures ofcardiomyocytes. Amplification of GHpromoter was used as a positive con-trol gene because it is well recognizedas extremely sensitive to T3 (22). No-antibody (AB) was used as negativecontrol. As expected, TRs was specif-ically bound to GH promoter. Like-wise, TRs were also bound to the�239 to �56 M-protein promoter re-gion (Figure 4B).
Figure 2. M-protein mRNA and protein levels are decreased by T3. A, M-protein mRNA levels ineuthyroid (control), hypothyroid (hypo) � T3 (100�) for 2 and 8 days (n � 5–6). Data areexpressed as fold induction and control is arbitrarily set as 1. Bars represent mean, and theconnected vertical lines represent SD. *, P � .05 vs control; **, P � .001 vs control. B, T3 inducesrepression of M-protein mRNA level in a dose-dependent manner. Rats were treated withincreasing doses of T3 (1�, 5�, 50�, and 100� physiological doses) for 48 hours (n � 5–6). *,P � .001 vs control. C, Immunoexpression of M-protein in LV sections from rats treated with100� of T3 for 8 days. Note decreased intensity of labeling (green) in T3-treated group ascompared with control group; Bar, 20 �m. D, M-protein mRNA levels determined by real-timequantitative PCR in cultured cardiomyocytes. Cells were treated with T3 (10�7M) for 12 hours, 24hours, or 48 hours. *, P � .001 vs control. E, Western blot analysis of T3-treated (8 days) ratsshow decreased M-protein expression compared with control.
doi: 10.1210/me.2013-1018 mend.endojournals.org 2059

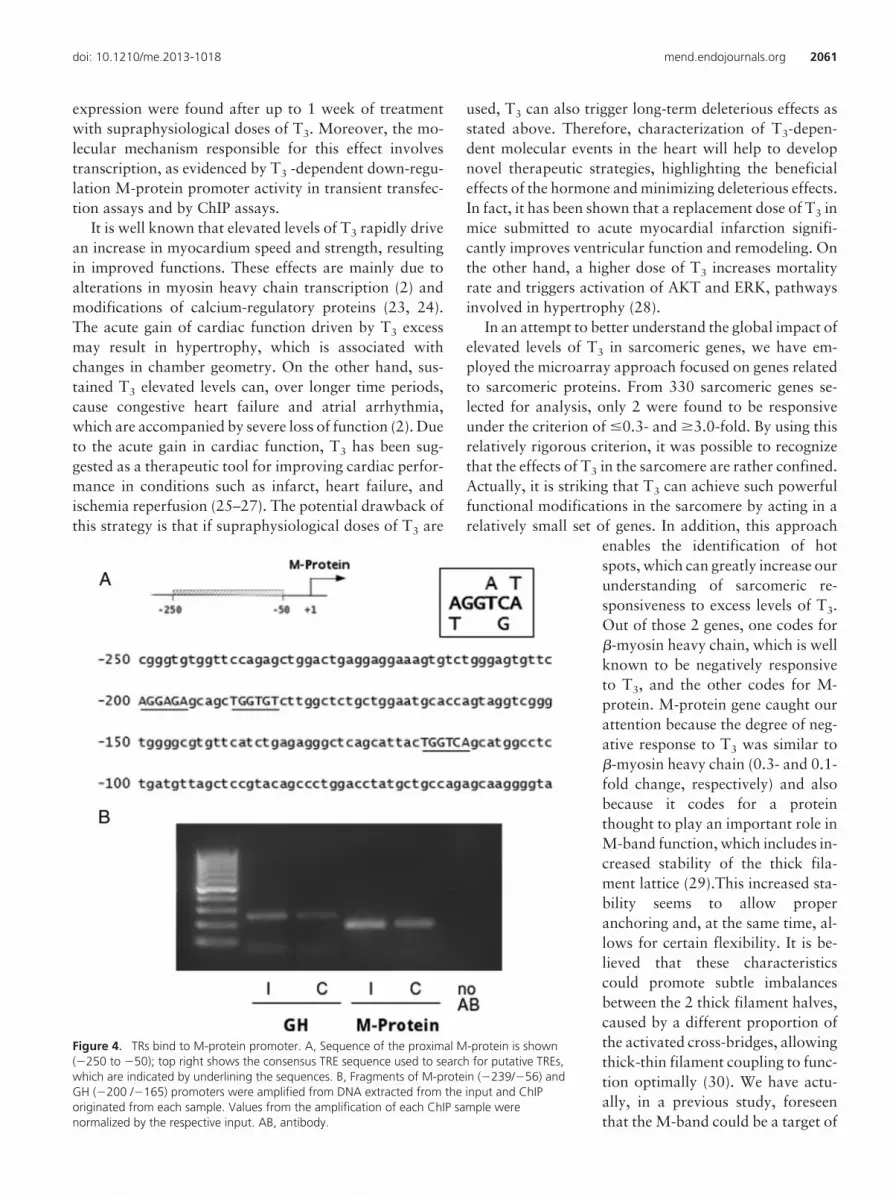
Impact of M-protein deficiency on contractileproperties in neonatal cardiomyocytes
In order to investigate the role of M-protein on car-diomyocyte-contractile function, we siRNA knockeddown M-protein and subsequently measured velocityof contraction and velocity of relaxation using a video-based sarcomere-spacing acquisition system (SarcLen,IonOptix) as described elsewhere (17). The resultsshow that M-protein deficiency drives a significantdrop in velocity of contraction at 1 Hz stimulation(77% ;P � .05; Figure 5A). No alterations in velocity ofrelaxation at 1 Hz were detected by silencing M-protein(Figure 5B). Of interest, cardiomyocytes with M-pro-tein deficiency displayed reduced rate of contractionand relaxation upon increasing stimulation frequencycompared with control cells (Figure 5, C–E).
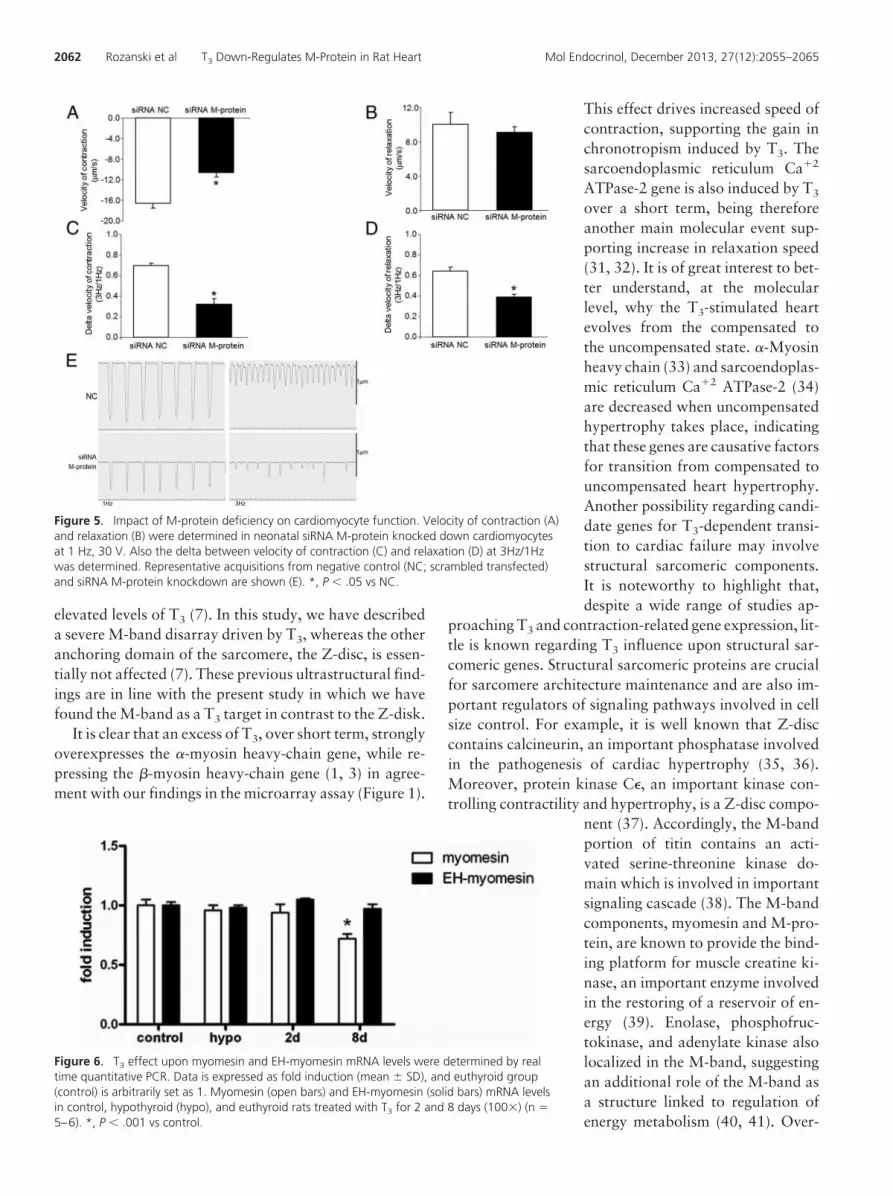
Effect of T3 upon other M-protein constituents:myomesin and EH-myomesin
To investigate the response of other structural M-bandproteins to T3, we analyzed the mRNA levels of myome-sin and EH-myomesin. Myomesin mRNA levels were notaltered in hearts from rats treated with 100� T3 for 2days, whereas those treated for 8 days presented a mod-est, but significant (P � .05), decrease (�25%) in myo-mesin mRNA levels (Figure 6).
Discussion
In the present study, we demonstrate that supraphysi-ological doses of T3 have a strong and fast repressiveeffect upon the M-protein gene and protein expression inthe heart and also in isolated cardiomyocytes. This effectwas sustained because decreased levels of M-protein gene
Figure 3. M-protein promoter is responsive to T3. A, The rat M-protein promoter driving the firefly luciferase (LUC) reporter construct wascotransfected into C2C12 cells with either TR�, TR�, or empty expression vector (pCMX). Cells were treated with progressive doses of T3 (0.01,0.1, 1, and 100 nM) or vehicle (V). *, P � .001 vs V. B, Mean � SD of transcriptional activity of 3�TRE D1 (positive control), �2298 to �228 bpand �158 to �228 bp promoter, and proximal regions of M-protein gene and promoter less pGL3 plasmid (negative control) transfected inC2C12 cells treated (�T3) or nontreated (�T3) with 50 nM T3. Promoter activity was arbitrarily set as 1 in all nontreated groups, and T3 effect wasexpressed as fold change. *, P � .01; and **, P � .001 vs respective untreated group. n � 3.
2060 Rozanski et al T3 Down-Regulates M-Protein in Rat Heart Mol Endocrinol, December 2013, 27(12):2055–2065
expression were found after up to 1 week of treatmentwith supraphysiological doses of T3. Moreover, the mo-lecular mechanism responsible for this effect involvestranscription, as evidenced by T3 -dependent down-regu-lation M-protein promoter activity in transient transfec-tion assays and by ChIP assays.
It is well known that elevated levels of T3 rapidly drivean increase in myocardium speed and strength, resultingin improved functions. These effects are mainly due toalterations in myosin heavy chain transcription (2) andmodifications of calcium-regulatory proteins (23, 24).The acute gain of cardiac function driven by T3 excessmay result in hypertrophy, which is associated withchanges in chamber geometry. On the other hand, sus-tained T3 elevated levels can, over longer time periods,cause congestive heart failure and atrial arrhythmia,which are accompanied by severe loss of function (2). Dueto the acute gain in cardiac function, T3 has been sug-gested as a therapeutic tool for improving cardiac perfor-mance in conditions such as infarct, heart failure, andischemia reperfusion (25–27). The potential drawback ofthis strategy is that if supraphysiological doses of T3 are
used, T3 can also trigger long-term deleterious effects asstated above. Therefore, characterization of T3-depen-dent molecular events in the heart will help to developnovel therapeutic strategies, highlighting the beneficialeffects of the hormone and minimizing deleterious effects.In fact, it has been shown that a replacement dose of T3 inmice submitted to acute myocardial infarction signifi-cantly improves ventricular function and remodeling. Onthe other hand, a higher dose of T3 increases mortalityrate and triggers activation of AKT and ERK, pathwaysinvolved in hypertrophy (28).
In an attempt to better understand the global impact ofelevated levels of T3 in sarcomeric genes, we have em-ployed the microarray approach focused on genes relatedto sarcomeric proteins. From 330 sarcomeric genes se-lected for analysis, only 2 were found to be responsiveunder the criterion of �0.3- and �3.0-fold. By using thisrelatively rigorous criterion, it was possible to recognizethat the effects of T3 in the sarcomere are rather confined.Actually, it is striking that T3 can achieve such powerfulfunctional modifications in the sarcomere by acting in arelatively small set of genes. In addition, this approach
enables the identification of hotspots, which can greatly increase ourunderstanding of sarcomeric re-sponsiveness to excess levels of T3.Out of those 2 genes, one codes for�-myosin heavy chain, which is wellknown to be negatively responsiveto T3, and the other codes for M-protein. M-protein gene caught ourattention because the degree of neg-ative response to T3 was similar to�-myosin heavy chain (0.3- and 0.1-fold change, respectively) and alsobecause it codes for a proteinthought to play an important role inM-band function, which includes in-creased stability of the thick fila-ment lattice (29).This increased sta-bility seems to allow properanchoring and, at the same time, al-lows for certain flexibility. It is be-lieved that these characteristicscould promote subtle imbalancesbetween the 2 thick filament halves,caused by a different proportion ofthe activated cross-bridges, allowingthick-thin filament coupling to func-tion optimally (30). We have actu-ally, in a previous study, foreseenthat the M-band could be a target of
Figure 4. TRs bind to M-protein promoter. A, Sequence of the proximal M-protein is shown(�250 to �50); top right shows the consensus TRE sequence used to search for putative TREs,which are indicated by underlining the sequences. B, Fragments of M-protein (�239/�56) andGH (�200 /�165) promoters were amplified from DNA extracted from the input and ChIPoriginated from each sample. Values from the amplification of each ChIP sample werenormalized by the respective input. AB, antibody.
doi: 10.1210/me.2013-1018 mend.endojournals.org 2061
elevated levels of T3 (7). In this study, we have describeda severe M-band disarray driven by T3, whereas the otheranchoring domain of the sarcomere, the Z-disc, is essen-tially not affected (7). These previous ultrastructural find-ings are in line with the present study in which we havefound the M-band as a T3 target in contrast to the Z-disk.
It is clear that an excess of T3, over short term, stronglyoverexpresses the �-myosin heavy-chain gene, while re-pressing the �-myosin heavy-chain gene (1, 3) in agree-ment with our findings in the microarray assay (Figure 1).
This effect drives increased speed ofcontraction, supporting the gain inchronotropism induced by T3. Thesarcoendoplasmic reticulum Ca�2
ATPase-2 gene is also induced by T3
over a short term, being thereforeanother main molecular event sup-porting increase in relaxation speed(31, 32). It is of great interest to bet-ter understand, at the molecularlevel, why the T3-stimulated heartevolves from the compensated tothe uncompensated state. �-Myosinheavy chain (33) and sarcoendoplas-mic reticulum Ca�2 ATPase-2 (34)are decreased when uncompensatedhypertrophy takes place, indicatingthat these genes are causative factorsfor transition from compensated touncompensated heart hypertrophy.Another possibility regarding candi-date genes for T3-dependent transi-tion to cardiac failure may involvestructural sarcomeric components.It is noteworthy to highlight that,despite a wide range of studies ap-
proaching T3 and contraction-related gene expression, lit-tle is known regarding T3 influence upon structural sar-comeric genes. Structural sarcomeric proteins are crucialfor sarcomere architecture maintenance and are also im-portant regulators of signaling pathways involved in cellsize control. For example, it is well known that Z-disccontains calcineurin, an important phosphatase involvedin the pathogenesis of cardiac hypertrophy (35, 36).Moreover, protein kinase C�, an important kinase con-trolling contractility and hypertrophy, is a Z-disc compo-
nent (37). Accordingly, the M-bandportion of titin contains an acti-vated serine-threonine kinase do-main which is involved in importantsignaling cascade (38). The M-bandcomponents, myomesin and M-pro-tein, are known to provide the bind-ing platform for muscle creatine ki-nase, an important enzyme involvedin the restoring of a reservoir of en-ergy (39). Enolase, phosphofruc-tokinase, and adenylate kinase alsolocalized in the M-band, suggestingan additional role of the M-band asa structure linked to regulation ofenergy metabolism (40, 41). Over-
Figure 5. Impact of M-protein deficiency on cardiomyocyte function. Velocity of contraction (A)and relaxation (B) were determined in neonatal siRNA M-protein knocked down cardiomyocytesat 1 Hz, 30 V. Also the delta between velocity of contraction (C) and relaxation (D) at 3Hz/1Hzwas determined. Representative acquisitions from negative control (NC; scrambled transfected)and siRNA M-protein knockdown are shown (E). *, P � .05 vs NC.
Figure 6. T3 effect upon myomesin and EH-myomesin mRNA levels were determined by realtime quantitative PCR. Data is expressed as fold induction (mean � SD), and euthyroid group(control) is arbitrarily set as 1. Myomesin (open bars) and EH-myomesin (solid bars) mRNA levelsin control, hypothyroid (hypo), and euthyroid rats treated with T3 for 2 and 8 days (100�) (n �5–6). *, P � .001 vs control.
2062 Rozanski et al T3 Down-Regulates M-Protein in Rat Heart Mol Endocrinol, December 2013, 27(12):2055–2065

all, it is clear that sarcomeric anchoring elements can alsobe important signaling stations; therefore a better under-standing of structural sarcomeric genes will be of use toincrease our knowledge of heart plasticity.
To our knowledge, this is the first study that system-atically addresses M-band structural proteins under T3
treatment in the heart. A previous study has shown a roleof T3 in fetal to adult titin isoform switching via a non-genomic pathway (42). Nonetheless, no studies were con-ducted in an adult rat heart. Our results obtained fromT3-treated rats show that M-protein gene is particularlysensitive to the hormone. A single physiological doseevoked significant reduction in M-protein mRNA levelsin a dose-dependent manner. The high sensitivity of thisgene to T3 was also confirmed in hypothyroid rats inwhich M-protein gene expression was increased by ap-proximately 3.5-fold. The negative effect of T3 upon M-protein mRNA expression parallels protein levels, asevidenced by Western blot and immunolabeling experi-ments. The level of M-protein expression is clearly de-creased 8 days after T3 treatment.
The cell specificity of T3 action was assessed by in vitrocardiomyocyte experiments. The results clearly showedthat T3 acts directly on cardiomyocytes to drive M-pro-tein repression and does not depend on interactions withother systems such as other hormones, ie, GH, the vascu-lar bed, and autonomic regulation.
The fact that both M-protein mRNA and protein levelswere rapidly and intensely down-regulated, raises thepossibility of a transcriptional control. Although, specificfast proteolysis such as triggered by the ubiquitin/protea-some system, could also be involved in T3-dependent M-protein cell clearance. We have not approached mRNAand protein stability in this study; however, we show thatthe M-protein promoter is strongly responsive to T3. M-protein promoter behaves similarly to TRH (43) and thepituitary TSH �-subunit gene (44), which all contain neg-ative TREs. Our promoter deletion experiments pointedthe fragment �158 and �228 bp as responsive to T3.Subsequently, by using a computer script designed to pin-point putative half-sites (negative TREs), we have found 3potential sequences that could bind TRs. All of them arelocated at the sensus strand, and the first and secondputative half-sites are spaced by 5 nucleotides (�200 and�189bp). The third putative half-site is located at �116bp. Evidence for binding of TRs to those half-sites comesfrom ChIP assay experiments, in which we have shownthat TR binds directly to M-protein promoter �239/�56fragment (which includes those putative half-sites). It willbe of interest in future studies to provide further insighton the putative negative TREs in M-protein promoter,using additional approaches such as point mutations and
footprinting. These results are in accordance with otherstudies showing the presence of negative TREs in the pro-moters very close to the TATA box (45–47). Thus, ourresults suggest that TR-DNA binding activity is requiredfor down-regulation of the M-protein promoter.
As mentioned above, we have previously shown byelectron microscopy that the M-band is firstly and pri-marily affected by T3 (7), an effect that precedes cardiacfailure, suggesting that degeneration of the M-band couldtrigger sarcomere disassembling. At the ultrastructurallevel, it has been shown that alcohol consumption dis-turbs the normal M-band structure in fetal myocardium(48). Interestingly, this effect seems to be specific to theM-band because other sarcomeric structures are well pre-served, ie, I and A bands and Z-discs (48). Subsequentstudies have addressed myomesin abundance in heart dis-eases. For instance, Hein et al (49) reported that ischemiain the myocardium results in decreased myomesin immu-noexpression. On the other hand, Wang et al (50) foundno alteration in myomesin immunoexpression in heartssubmitted to pressure overload. Finally, immunoexpres-sion was used to evaluate myomesin abundance in dys-trophic hamsters and no alteration was found (51). Thereare no studies demonstrating M-protein regulation in theheart through cardiac overload or other cardiomyopa-thies. In addition no studies have directly addressed M-protein function. In this study we have siRNA knockeddown M-protein in cardiomyocytes and evaluated con-tractile function and noted a 77% reduction in contrac-tion velocity in the M-protein deficient cells, which is inline with an important role of this protein in sarcomerefunction. It is currently not clear whether M-protein, inaddition to having a structural role, could also affect/control the contractility process; nonetheless, our func-tional results raises the possibility that M-protein couldregulate the activity of proteins such as myosin heavychain, myosin light chain, and Troponin C. It is interest-ing to note that in other pathophysiological conditions,such as heart hypertrophy and failure driven by pressureoverload, the Z-disc seems to be the preferential targetrather than the M-band (52–54), which leads to the pos-sibility that anchoring proteins in the sarcomere are dif-ferentially affected under different demands.
Because myomesin and EH-myomesin are M-bandcomponents as the M-protein, we also investigated itsexpression. Interestingly, we noticed no alterations on theEH-myomesin expression pattern under T3 treatment andhypothyroidism. Myomesin showed similar results, dif-fering only by an approximately 25% reduction of foldinduction under T3 treatment for 8 days. These findingssupport M-protein as the main gene sensitive to T3 atM-band level.
doi: 10.1210/me.2013-1018 mend.endojournals.org 2063
In summary, this study reveals that M-protein can beselectively regulated by an important modulator of car-diac function, and further studies using other models ofcardiac plasticity, such as hypertension, diabetes, and ge-netic cardiomyopathies, are necessary to further explorethe role of this structural sarcomeric element. It would beinteresting, in the future; to address the role of M-bandproteins using different experimental models/strategiessuch as myocardial infarction and heart failure in order tofurther address the important role of this sarcomeric pro-tein in other cardiovascular diseases.
Acknowledgments
Address all correspondence and requests for reprints to: An-selmo Sigari Moriscot, Department of Anatomy, Institute ofBiomedical Sciences, University of São Paulo, 2415 LineuPrestes Av ICB 3, Cidade Universitária, CEP 05508–900, SãoPaulo, Brazil. E-mail: [email protected].
This work was supported by Grants 03/02401–0 and 00/12037–6, both from Fundacao de Amparo a Pesquisa do Estadode Sao Paulo, a Sao Paulo State Research Foundation, Brazil.
Disclosure Summary: The authors have nothing to disclose.
References
1. Klein I, Ojamaa K. Thyroid hormone and the cardiovascular sys-tem. N Engl J Med. 2001;344:501–509.
2. Kahaly GJ, Dillmann WH. Thyroid hormone action in the heart.Endocr Rev. 2005;26:704–728.
3. Dillmann WH. Biochemical basis of thyroid hormone action in theheart. Am J Med. 1990;88:626–630.
4. Klein I, Hong C. Effects of thyroid hormone on cardiac size andmyosin content of the heterotopically transplanted rat heart. J ClinInvest. 1986;77:1694–1698.
5. Hu LW, Benvenuti LA, Liberti EA, Carneiro-Ramos MS, Barreto-Chaves ML. Thyroxine-induced cardiac hypertrophy: influence ofadrenergic nervous system versus renin-angiotensin system on myo-cyte remodeling. Am J Physiol Regul Integr Comp Physiol. 2003;285:R1473–R1480.
6. Abinder AA, Paukov VS, Rom-Bugoslavskaia ES. Contractile func-tion of the myocardium of the right ventricle in thyrotoxicosis.Probl Endokrinol (Mosk). 1975;21:22–27.
7. Ferreira PJ, L’Abbate C, Abrahamsohn PA, Gouveia CA, MoriscotAS. Temporal and topographic ultrastructural alterations of ratheart myofibrils caused by thyroid hormone. Microsc Res Tech.2003;62:451–459.
8. Agarkova I, Auerbach D, Ehler E, Perriard JC. A novel marker forvertebrate embryonic heart, the EH-myomesin isoform. J BiolChem. 2000;275:10256–10264.
9. Masaki T, Takaiti O. M-protein. J Biochem. 1974;75:367–380.10. Schoenauer R, Lange S, Hirschy A, Ehler E, Perriard JC, Agarkova
I. Myomesin 3, a novel structural component of the M-band instriated muscle. J Mol Biol. 2008;376:338–351.
11. Bantle S, Keller S, Haussmann I, Auerbach D, Perriard E, Müh-lebach S, Perriard JC. Tissue-specific isoforms of chicken myomesinare generated by alternative splicing. J Biol Chem. 1996;271:19042–19052.
12. Steiner F, Weber K, Fürst DO. M band proteins myomesin and
skelemin are encoded by the same gene: analysis of its organizationand expression. Genomics. 1999;56:78–89.
13. Agarkova I, Schoenauer R, Ehler E, et al. The molecular composi-tion of the sarcomeric M-band correlates with muscle fiber type.Eur J Cell Biol. 2004;83:193–204.
14. Gentleman RC, Carey VJ, Bates DM, et al. Bioconductor: opensoftware development for computational biology and bioinformat-ics. Genome Biol. 2004;5:R80.
15. Miyabara EH, Aoki MS, Soares AG, et al. Thyroid hormone recep-tor-�-selective agonist GC-24 spares skeletal muscle type I to II fibershift. Cell Tissue Res. 2005;321:233–241.
16. Barreto-Chaves ML, Heimann A, Krieger JE. Stimulatory effect ofdexamethasone on angiotensin-converting enzyme in neonatal ratcardiac myocytes. Braz J Med Biol Res. 2000;33:661–664.
17. Fajardo G, Zhao M, Urashima T, et al. Deletion of the �2-adren-ergic receptor prevents the development of cardiomyopathy inmice. J Mol Cell Cardiol. 2013;63:155–164.
18. Grove BK, Kurer V, Lehner C, Doetschman TC, Perriard JC, Ep-penberger HM. A new 185,000-dalton skeletal muscle protein de-tected by monoclonal antibodies. J Cell Biol. 1984;98:518–524.
19. Vinkemeier U, Obermann W, Weber K, Fürst DO. 1993 The glob-ular head domain of titin extends into the center of the sarcomericM band. cDNA cloning, epitope mapping and immunoelectronmicroscopy of two titin-associated proteins. J Cell Sci. 106(Pt 1):319–330.
20. Moriscot AS, Baptista IL, Bogomolovas J, et al. MuRF1 is a musclefiber-type II associated factor and together with MuRF2 regulatestype-II fiber trophicity and maintenance. J Struct Biol. 2010;170:344–353.
21. Tatusova TA, Madden TL. BLAST 2 Sequences, a new tool forcomparing protein and nucleotide sequences. FEMS MicrobiolLett. 1999;174:247–250.
22. Petty KJ, Desvergne B, Mitsuhashi T, Nikodem VM. Identificationof a thyroid hormone response element in the malic enzyme gene.J Biol Chem. 1990;265:7395–7400.
23. Kranias EG, Hajjar RJ. Modulation of cardiac contractility by thephospholamban/SERCA2a regulatome. Circ Res. 2012;110:1646–1660.
24. Ojamaa K, Petrie JF, Balkman C, Hong C, Klein I. Posttranscrip-tional modification of myosin heavy-chain gene expression in thehypertrophied rat myocardium. Proc Natl Acad Sci USA. 1994;91:3468–3472.
25. Nicolini G, Pitto L, Kusmic C, et al. New insights into mechanismsof cardioprotection mediated by thyroid hormones. J Thyroid Res.2013;2013:264387.
26. Pingitore A, Chen Y, Gerdes AM, Iervasi G. Acute myocardialinfarction and thyroid function: new pathophysiological and ther-apeutic perspectives. Ann Med. 2012;44:745–757.
27. Henderson KK, Danzi S, Paul JT, Leya G, Klein I, Samarel AM.Physiological replacement of T3 improves left ventricular functionin an animal model of myocardial infarction-induced congestiveheart failure. Circ Heart Fail. 2009;2:243–252.
28. Mourouzis I, Mantzouratou P, Galanopoulos G, et al. Dose-depen-dent effects of thyroid hormone on post-ischemic cardiac perfor-mance: potential involvement of Akt and ERK signalings. Mol CellBiochem. 2012;363:235–243.
29. Pask HT, Jones KL, Luther PK, Squire JM. M-band structure, M-bridge interactions and contraction speed in vertebrate cardiacmuscles. J Muscle Res Cell Motil. 1994;15:633–645.
30. Agarkova I, Perriard J. The M-band: an elastic web that crosslinksthick filaments in the center of the sarcomere. Trends Cell Biol.2005;15:477–485.
31. Muller A, Zuidwijk MJ, Simonides WS, van Hardeveld C. Modu-lation of SERCA2 expression by thyroid hormone and norepineph-rine in cardiocytes: role of contractility. Am J Physiol. 1997;272:H1876–H1885.
32. Takeuchi K, Minakawa M, Otaki M, et al. Hyperthyroidism causes
2064 Rozanski et al T3 Down-Regulates M-Protein in Rat Heart Mol Endocrinol, December 2013, 27(12):2055–2065

mechanical insufficiency of myocardium with possibly increased SRCa2�-ATPase activity. Jpn J Physiol. 2003;53:411–416.
33. Lowes BD, Minobe W, Abraham WT, et al. Changes in gene ex-pression in the intact human heart. Downregulation of �-myosinheavy chain in hypertrophied, failing ventricular myocardium.J Clin Invest. 1997;100:2315–2324.
34. Mercadier JJ, Lompré AM, Duc P, et al. Altered sarcoplasmic re-ticulum Ca2(�)-ATPase gene expression in the human ventricleduring end-stage heart failure. J Clin Invest. 1990;85:305–309.
35. Frey N, Barrientos T, Shelton JM, et al. Mice lacking calsarcin-1 aresensitized to calcineurin signaling and show accelerated cardiomy-opathy in response to pathological biomechanical stress. Nat Med.2004;10:1336–1343.
36. Molkentin JD, Lu JR, Antos CL, et al. A calcineurin-dependenttranscriptional pathway for cardiac hypertrophy. Cell. 1998;93:215–228.
37. Dorn GW 2nd, Force T. Protein kinase cascades in the regulation ofcardiac hypertrophy. J Clin Invest. 2005;115:527–537.
38. Lange S, Xiang F, Yakovenko A, et al. The kinase domain of titincontrols muscle gene expression and protein turnover. Science.2005;308:1599–1603.
39. Hornemann T, Kempa S, Himmel M, Hayess K, Fürst DO, Walli-mann T. Muscle-type creatine kinase interacts with central domainsof the M-band proteins myomesin and M-protein. J Mol Biol. 2003;332:877–887.
40. Keller A, Demeurie J, Merkulova T, et al. Fibre-type distributionand subcellular localisation of � and � enolase in mouse striatedmuscle. Biol Cell. 2000;92:527–535.
41. Lange S. Subcellular targeting of metabolic enzymes to titin in heartmuscle may be mediated by DRAL/FHL-2. J Cell Sci. 2002;115:4925–4936.
42. Krüger M, Sachse C, Zimmermann WH, Eschenhagen T, Klede S,Linke WA. Thyroid hormone regulates developmental titin isoformtransitions via the phosphatidylinositol-3-kinase/ AKT pathway.Circ Res. 2008;102:439–447.
43. Feng P, Li QL, Satoh T, Wilber JF. Ligand (T3) dependent andindependent effects of thyroid hormone receptors upon human
TRH gene transcription in neuroblastoma cells. Biochem BiophysRes Commun. 1994;200:171–177.
44. Bodenner DL, Mroczynski MA, Weintraub BD, Radovick S, Won-disford FE. A detailed functional and structural analysis of a majorthyroid hormone inhibitory element in the human thyrotropin�-subunit gene. J Biol Chem. 1991;266:21666–21673.
45. Belandia B, Latasa MJ, Villa A, Pascual A. Thyroid hormone neg-atively regulates the transcriptional activity of the �-amyloid pre-cursor protein gene. J Biol Chem. 1998;273:30366–30371.
46. Pérez-Juste G, García-Silva S, Aranda A. An element in the regionresponsible for premature termination of transcription mediatesrepression of c-myc gene expression by thyroid hormone in neuro-blastoma cells. J Biol Chem. 2000;275:1307–1314.
47. Santos GM, Afonso V, Barra GB, et al. Negative regulation ofsuperoxide dismutase-1 promoter by thyroid hormone. Mol Phar-macol. 2006;70:793–800.
48. Syslak PH, Nathaniel EJ, Novak C, Burton L. Fetal alcohol effectson the postnatal development of the rat myocardium: an ultrastruc-tural and morphometric analysis. Exp Mol Pathol. 1994;60:158–172.
49. Hein S, Scheffold T, Schaper J. Ischemia induces early changes tocytoskeletal and contractile proteins in diseased human myocar-dium. J Thorac Cardiovasc Surg. 1995;110:89–98.
50. Wang X, Li F, Campbell SE, Gerdes AM. Chronic pressure overloadcardiac hypertrophy and failure in guinea pigs. II. Cytoskeletal re-modeling. J Mol Cell Cardiol. 1999;31:319–331.
51. Eppenberger ME, Schoenenberger R, Eppenberger HM. Myofibril-lar M-line structure in normal and dystrophic hamster muscle. Mus-cle Nerve. 1984;7:304–311.
52. Knöll R, Hoshijima M, Hoffman HM, et al. The cardiac mechanicalstretch sensor machinery involves a Z disc complex that is defectivein a subset of human dilated cardiomyopathy. Cell. 2002;111:943–955.
53. Pyle WG, Solaro RJ. At the crossroads of myocardial signaling: therole of Z-discs in intracellular signaling and cardiac function. CircRes. 2004;94:296–305.
54. Solaro RJ. Remote control of A-band cardiac thin filaments by theI-Z-I protein network of cardiac sarcomeres. Trends CardiovascMed. 2005;15:148–152.
doi: 10.1210/me.2013-1018 mend.endojournals.org 2065