Deiodinase-mediated thyroid hormone inactivation minimizes thyroid hormone signaling in the early...
10
Deiodinase-mediated thyroid hormone inactivation minimizes thyroid hormone signaling in the early development of fetal skeleton Luciane P. Capelo a , Eduardo H. Beber b , Stephen A. Huang c , Telma M.T. Zorn a , Antonio C. Bianco d , Cecília H.A. Gouveia a,b, ⁎ a Department of Cell and Developmental Biology, Institute of Biomedical Sciences, University of Sao Paulo, Sao Paulo, 05508-000, Brazil b Department of Anatomy, Institute of Biomedical Sciences, University of Sao Paulo, Sao Paulo, 05508-000, Brazil c Division of Endocrinology, Children's Hospital Boston, Boston, Massachusetts 02115, USA d Thyroid Section, Division of Endocrinology, Diabetes and Hypertension, Brigham and Women's Hospital and Harvard Medical School, Boston, Massachusetts 02115, USA abstract article info Article history: Received 1 April 2008 Revised 24 June 2008 Accepted 28 June 2008 Available online 17 July 2008 Edited by: T. Jack Martin Keywords: Skeletal development Congenital hypothyroidism Deiodinase type 3 Deiodinase type 2 Thyroid hormone Thyroid hormone (TH) plays a key role on post-natal bone development and metabolism, while its relevance during fetal bone development is uncertain. To study this, pregnant mice were made hypothyroid and fetuses harvested at embryonic days (E) 12.5, 14.5, 16.5 and 18.5. Despite a marked reduction in fetal tissue concentration of both T4 and T3, bone development, as assessed at the distal epiphyseal growth plate of the femur and vertebra, was largely preserved up to E16.5. Only at E18.5, the hypothyroid fetuses exhibited a reduction in femoral type I and type X collagen and osteocalcin mRNA levels, in the length and area of the proliferative and hypertrophic zones, in the number of chondrocytes per proliferative column, and in the number of hypertrophic chondrocytes, in addition to a slight delay in endochondral and intramembranous ossification. This suggests that up to E16.5, thyroid hormone signaling in bone is kept to a minimum. In fact, measuring the expression level of the activating and inactivating iodothyronine deiodinases (D2 and D3) helped understand how this is achieved. D3 mRNA was readily detected as early as E14.5 and its expression decreased markedly (∼ 10-fold) at E18.5, and even more at 14 days after birth (P14). In contrast, D2 mRNA expression increased significantly by E18.5 and markedly (∼ 2.5-fold) by P14. The reciprocal expression levels of D2 and D3 genes during early bone development along with the absence of a hypothyroidism-induced bone phenotype at this time suggest that coordinated reciprocal deiodinase expression keeps thyroid hormone signaling in bone to very low levels at this early stage of bone development. © 2008 Elsevier Inc. All rights reserved. Introduction Thyroid hormone (TH) is essential for a number of metabolic and developmental processes. Its actions occur through binding of triiodothyronine (T3), the main active form of TH, to its nuclear receptors (TRs), which function as hormone inducible transcriptional factors [1]. Inappropriate levels or premature exposure of embryos to TH are deleterious, resulting in abnormal development or death [2–5]. TH is classically known to be important for the development of the central nervous system, where its deficiency promotes severe neurological deficits [6]. In similar ways, bone development, matura- tion, growth and metabolism have been shown as fundamentally dependent on TH action. The identification of TRα1, TRα2 and TRβ1 in osteoblasts [7–10], osteoclasts [11,12] and chondrocytes [12,13], as well as the responsiveness of bone cells to TH when isolated in cell culture systems are evidence of a direct effect of T3 on bone tissue. Decreased availability of TH during post-natal development results in severe abnormalities in the epiphyseal growth plates (EGP), such as disorganization of the proliferative zone, impaired differentiation of hypertrophic chondrocytes and abnormal synthesis of extra cellular matrix [14–17], resulting in growth arrest and other abnormalities [16,18]. In addition, a generalized delay in endochondral and intramembranous ossification is observed [5,17,19]. The importance of TH to the pre-natal development of the skeleton is less clear. It is well established that during development serum thyroid hormone levels are low and tissue concentration of thyroid hormone can be modified by the iodothyronine deiodinases [20–22]. While the type II deiodinase (D2) activates T4 to T3, the type III deiodinase (D3) inactivates T4 to rT3 and T3 to T2 in a tissue- and time-specific fashion. In various developing structures such as the brain, cochlea, retina, and during tadpole metamorphosis, D2- and D3-controlled thyroid hormone signaling was shown to play an important role [6,20,22,23]. In bone related structures, D2 expression has been shown in multiple bone-derived cell lines such as primary calvaria osteoblastic cells, murine bone marrow-derived stromal ST2 cell line that has the phenotypes of osteoblast- and osteoclast- Bone 43 (2008) 921–930 ⁎ Corresponding author. Department of Anatomy, Institute of Biomedical Sciences, Av. Professor Lineu Prestes, 2415, Sao Paulo, SP 05508-0, Brazil. Fax: +55 11 30917366. E-mail address: [email protected] (C.H.A. Gouveia). 8756-3282/$ – see front matter © 2008 Elsevier Inc. All rights reserved. doi:10.1016/j.bone.2008.06.020 Contents lists available at ScienceDirect Bone journal homepage: www.elsevier.com/locate/bone
-
Upload
independent -
Category
Documents
-
view
4 -
download
0
Transcript of Deiodinase-mediated thyroid hormone inactivation minimizes thyroid hormone signaling in the early...
Bone 43 (2008) 921–930
Contents lists available at ScienceDirect
Bone
j ourna l homepage: www.e lsev ie r.com/ locate /bone
Deiodinase-mediated thyroid hormone inactivation minimizes thyroid hormonesignaling in the early development of fetal skeleton
Luciane P. Capelo a, Eduardo H. Beber b, Stephen A. Huang c, Telma M.T. Zorn a,Antonio C. Bianco d, Cecília H.A. Gouveia a,b,⁎a Department of Cell and Developmental Biology, Institute of Biomedical Sciences, University of Sao Paulo, Sao Paulo, 05508-000, Brazilb Department of Anatomy, Institute of Biomedical Sciences, University of Sao Paulo, Sao Paulo, 05508-000, Brazilc Division of Endocrinology, Children's Hospital Boston, Boston, Massachusetts 02115, USAd Thyroid Section, Division of Endocrinology, Diabetes and Hypertension, Brigham and Women's Hospital and Harvard Medical School, Boston, Massachusetts 02115, USA
⁎ Corresponding author. Department of Anatomy, InAv. Professor Lineu Prestes, 2415, Sao Paulo, SP 05508-0
E-mail address: [email protected] (C.H.A. Gouveia).
8756-3282/$ – see front matter © 2008 Elsevier Inc. Aldoi:10.1016/j.bone.2008.06.020
a b s t r a c t
a r t i c l e i n f oArticle history:
Thyroid hormone (TH) play Received 1 April 2008Revised 24 June 2008Accepted 28 June 2008Available online 17 July 2008Edited by: T. Jack Martin
Keywords:Skeletal developmentCongenital hypothyroidismDeiodinase type 3Deiodinase type 2Thyroid hormone
s a key role on post-natal bone development and metabolism, while its relevanceduring fetal bone development is uncertain. To study this, pregnant mice were made hypothyroid and fetusesharvested at embryonic days (E) 12.5, 14.5, 16.5 and 18.5. Despite a marked reduction in fetal tissueconcentration of both T4 and T3, bone development, as assessed at the distal epiphyseal growth plate of thefemur and vertebra, was largely preserved up to E16.5. Only at E18.5, the hypothyroid fetuses exhibited areduction in femoral type I and type X collagen and osteocalcin mRNA levels, in the length and area of theproliferative and hypertrophic zones, in the number of chondrocytes per proliferative column, and in thenumber of hypertrophic chondrocytes, in addition to a slight delay in endochondral and intramembranousossification. This suggests that up to E16.5, thyroid hormone signaling in bone is kept to a minimum. In fact,measuring the expression level of the activating and inactivating iodothyronine deiodinases (D2 and D3)helped understand how this is achieved. D3 mRNA was readily detected as early as E14.5 and its expressiondecreased markedly (∼10-fold) at E18.5, and even more at 14 days after birth (P14). In contrast, D2 mRNAexpression increased significantly by E18.5 and markedly (∼2.5-fold) by P14. The reciprocal expression levelsof D2 and D3 genes during early bone development along with the absence of a hypothyroidism-inducedbone phenotype at this time suggest that coordinated reciprocal deiodinase expression keeps thyroidhormone signaling in bone to very low levels at this early stage of bone development.
© 2008 Elsevier Inc. All rights reserved.
Introduction
Thyroid hormone (TH) is essential for a number of metabolic anddevelopmental processes. Its actions occur through binding oftriiodothyronine (T3), the main active form of TH, to its nuclearreceptors (TRs), which function as hormone inducible transcriptionalfactors [1]. Inappropriate levels or premature exposure of embryos toTH are deleterious, resulting in abnormal development or death [2–5].TH is classically known to be important for the development of thecentral nervous system, where its deficiency promotes severeneurological deficits [6]. In similar ways, bone development, matura-tion, growth and metabolism have been shown as fundamentallydependent on TH action. The identification of TRα1, TRα2 and TRβ1 inosteoblasts [7–10], osteoclasts [11,12] and chondrocytes [12,13], aswell as the responsiveness of bone cells to TH when isolated in cellculture systems are evidence of a direct effect of T3 on bone tissue.
stitute of Biomedical Sciences,, Brazil. Fax: +55 11 3091 7366.
l rights reserved.
Decreased availability of TH during post-natal development results insevere abnormalities in the epiphyseal growth plates (EGP), such asdisorganization of the proliferative zone, impaired differentiation ofhypertrophic chondrocytes and abnormal synthesis of extra cellularmatrix [14–17], resulting in growth arrest and other abnormalities[16,18]. In addition, a generalized delay in endochondral andintramembranous ossification is observed [5,17,19].
The importance of TH to the pre-natal development of the skeletonis less clear. It is well established that during development serumthyroid hormone levels are low and tissue concentration of thyroidhormone can be modified by the iodothyronine deiodinases [20–22].While the type II deiodinase (D2) activates T4 to T3, the type IIIdeiodinase (D3) inactivates T4 to rT3 and T3 to T2 in a tissue- andtime-specific fashion. In various developing structures such as thebrain, cochlea, retina, and during tadpole metamorphosis, D2- andD3-controlled thyroid hormone signaling was shown to play animportant role [6,20,22,23]. In bone related structures, D2 expressionhas been shown in multiple bone-derived cell lines such as primarycalvaria osteoblastic cells, murine bone marrow-derived stromal ST2cell line that has the phenotypes of osteoblast- and osteoclast-
922 L.P. Capelo et al. / Bone 43 (2008) 921–930
supporting cells [24], in the MC3T3-E1 mouse osteoblastic cell line, inorgan cultures of fetal mouse tibias and ATDC5 cells, a mousechondrogenic cell line [25,26]. In the developing chicken growthplate, Sonic Hedgehog (Shh)-induced ubiquitin-mediated D2 inactiva-tion along with Dio3 induction creates a relative state of localhypothyroidism and PTHrP secretion that favors chondrocyte pro-liferation and delays chondrocyte differentiation [27]. A similarscenario was recently described in the skin, with Shh and thedeiodinases playing a role in the balance between proliferation anddifferentiation of keratinocytes [28].
In the present study, we report that marked TH deficiency onlyminimally affects bone development until 16.5 day of embryonic life(E), indicating that TH signaling in skeleton is minimal up to thisdevelopmental stage. Accordingly, D3 expression is high at E14.5 anddecreases markedly (∼10-fold) subsequently while D2 expressionprofile is the opposite. The higher expression of D3 and the modesteffects of TH deficiency in the skeleton until E16.5 suggest thatmaintaining low levels of TH is critical for early skeleton development.
Materials and methods
Animals and treatment
All experiments were performed under a protocol approved by theCommittee of Animal Ethics of the Institute of Biomedical Sciences ofthe University of Sao Paulo (protocol number 018-29/02). Two-monthold mice were obtained from our breeding colony and maintainedunder controlled conditions of light and temperature (12 h/12 h dark/light cycle at 25 °C), and access to food and water was ad libitum. Forall experiments, mice were bred in-house for 3 h at night and thepresence of a vaginal plug was considered as day zero of embryonicdevelopment (E0). A total of 65 dams were randomly divided into 2groups: euthyroid (EUT) and hypothyroid (HYPO). Hypothyroidismwas induced by maintaining the pregnant animals on methimazole(MMI; 0,05%) from E1 to E5 and MMI (0,1%) and sodium perchlorate(P; 1%) from E6 to the day of sacrifice. Both drugs were added to thedrinking water. The pregnant mice were anesthetized, bled and thefetuses were obtained at E12.5, E14.5, E16.5 and E18.5. Fetuses weredissected out from the uterus, washed in sterile PBS and placed on ice.Length and weight of the fetuses were measured using a digitalcalliper and an analytic balance, respectively. Some fetuses werefrozen in liquid nitrogen and kept at −80 °C. Others were fixed in 95%ethanol or 10% formalin for morphological analysis. Care was taken toavoid the risk of contamination by maternal blood. The post-natalstudies were performed at 2, 4, 7, 14, 21 and 35 post-natal days (P).After birth, the litter was maintained with the mother in the samecage until the day of sacrifice. The neonatal hypothyroidism was alsoinduced by adding MMI (0,1%) and P (1%) in the drinking water, asboth drugs are secreted in the maternal milk.
Determination of T4 and T3 in plasma and tissues
Wemeasured the fetal concentration of T4 and T3 before and afterthe onset of fetal thyroid activity in E12.5, E14.5, E16.5 and E18.5fetuses from EUT and HYPO dams by radioimmunoassay (RIA). At theday of sacrifice, maternal blood was collected and the serum wasseparated by centrifugation and immediately frozen. The protocolused to access total T3 and T4 on fetal tissues was modified fromObregón et al. [29]. Briefly, the whole fetuses were crushed in a steelmortar and pestle set (Fisher Scientific International, Inc, Hampton,NH) precooled in dry ice. The crushed fetuses were transferred to pre-weighted microfuge tubes precooled in ice and 0.15 M NaCl/10−3 MPTU was added in a volume that doubled the sample weight. 10−3 MPTU was added to avoid artifactual deiodinations. The samples werehomogenized, kept on ice (15min) and centrifuged (30min 2000 rpm,4 °C). Supernatant aliquots were dried in a Speedvac® at 45 °C
(Eppendorf, Hamburg, Germany) and resuspended in 80 μl (E12.5 andE14.5) or 200 μl (E16.5 and E18.5) of 0.15 M NaCl (fetus suspension). Ina second set of experiments, animals on P2, P4, P7, P14, P21 and P35from euthyroid and hypothyroid groups were killed, and the bloodwas collected and centrifuged for serum separation. The serum andfetus suspension was assayed for total T3 and T4 quantification. TotalT4 and T3 levels were measured by commercial RIA kits (RIA-gnost T4and RIA-gnost T3; CIS bio international, Schering AG, Germany).
Skeletal preparations and histology
Fetuses on E12.5, E14.5, E16.5 and E18.5 andmice on P2, P4, P7, P14,P21 and P35 from EUTand HYPO groups weremeasured andweightedimmediately after euthanasia. For histological and whole mountpreparations, micewere eviscerated and had the skin removed. After a48 h fixation in 95% ethanol, specimens were stained with alcian bluefor cartilage and alizarin red for calcified tissue as previouslydescribed [16]. For histological analysis, the samples were fixed in10% formalin for 24 h–72 h at 4 °C. Fetuses on E18.5 and all thenewborns were demineralized in 10% formalin and 10% formic acidsolution at room temperature for 48 h. Samples were dehydrated andembedded in Paraplast (Oxford, St Louis, MO, USA). The fetuses of allages studied were sectioned sagittally for analysis of vertebral columnmorphology. The vertebral column and right femur of five animals ofeach group were serially sectioned (5 μm) onto Poly-L-Lysine (EMS,Hatfield, PA, USA) coated slides, deparaffinized in xylene, rehydrated,and stainedwith alcian blue 8GX (pH 2,5), floxin and hematoxylin. Thesections were photographed under light microscopy for analyses.Femurs were analyzed morphometrically. Morphometric measure-ments were performed using the image analyzer system Image-proPlus (Media Cybernetics, Silver Spring, MD, USA).
Semi-quantitative real-time PCR
Under a stereomicroscope, femurs were dissected and thencrushed in a steel mortar and pestle set (Fisher Scientific International,Inc, Hampton, NH) precooled in dry ice. The crushed bones weretransferred to microfuge tubes precooled in ice and total RNA wasextracted using Trizol (Invitrogen, Calbard, CA, USA) following themanufacturer's instructions. Reverse transcription was performedwith RevertAid-H-Minus M-MuLV Reverse Transcriptase (Fermentas,Hanover, MD, USA) and 1 μg of total RNA. The mRNA expression ofTRα1, TRβ1, type X collagen (Col10), type I collagen (Col1), osteocalcin(OC), D1, D2 and D3 were determined by semi-quantitative real-timePCR as described previously [30,31]. mRNA levels of 18SrRNA (18S)and cyclophilin A (Cyclo A) were used as internal controls. The relativelevels of mRNA of the tested genes were estimated by real-time PCR bymeasuring the fluorescence quantified with the ABI Prism 7500sequence detector (Applied Biosystems) comparing all samples andcontrols in duplicates. The real-time PCR reactions were performed ina total volume of 25 μl containing different amounts of template andprimers, depending on the gene evaluated. D2 and D3 relativeexpression analysis was performed using 50 ng of template and300 nM of specific primers. For all the other genes evaluated in thisstudy 20 ng of template and 450 nM of specific primers were used. Allprimers were designed with the aim of the Primer Express software(Invitrogen) and were synthesized (Integrated DNA Technologies,Coralville, IA, USA) with annealing temperature between 58 and 60 °C,18 and 30 base pairs and keeping a percentage of 40–60% of G and Cbases. The PCR amplifications were performed in duplicates withcDNA diluted in a reaction buffer containing SYBR Green PCR mastermix (Applied Biosystems) and specific primers (forward and reverse)in the following cycling conditions: 1 cycle at 50 °C for 2min and 95 °Cfor 10 min, followed by 40 cycles at 95 °C for 15 s and 60 °C for 1 min.All Ct values were normalized using an internal control (18S or Cyclo AmRNA) and the results were expressed as fold-induction relative to
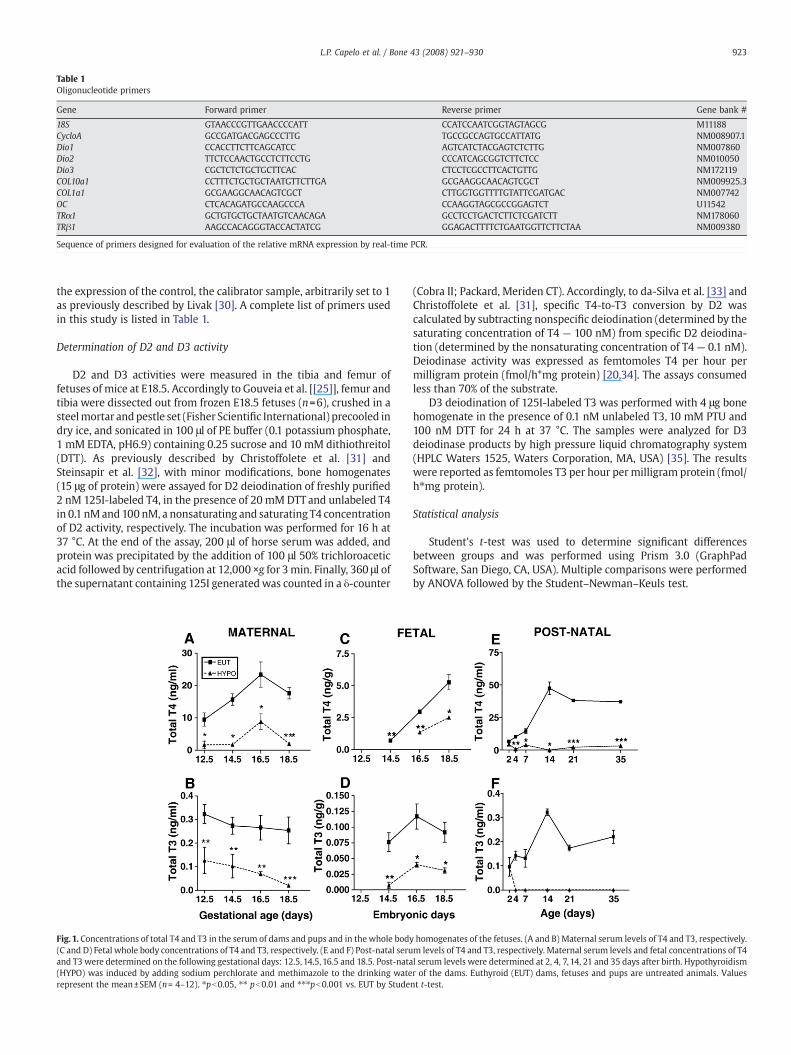
Table 1Oligonucleotide primers
Gene Forward primer Reverse primer Gene bank #
18S GTAACCCGTTGAACCCCATT CCATCCAATCGGTAGTAGCG M11188CycloA GCCGATGACGAGCCCTTG TGCCGCCAGTGCCATTATG NM008907.1Dio1 CCACCTTCTTCAGCATCC AGTCATCTACGAGTCTCTTG NM007860Dio2 TTCTCCAACTGCCTCTTCCTG CCCATCAGCGGTCTTCTCC NM010050Dio3 CGCTCTCTGCTGCTTCAC CTCCTCGCCTTCACTGTTG NM172119COL10a1 CCTTTCTGCTGCTAATGTTCTTGA GCGAAGGCAACAGTCGCT NM009925.3COL1a1 GCGAAGGCAACAGTCGCT CTTGGTGGTTTTGTATTCGATGAC NM007742OC CTCACAGATGCCAAGCCCA CCAAGGTAGCGCCGGAGTCT U11542TRα1 GCTGTGCTGCTAATGTCAACAGA GCCTCCTGACTCTTCTCGATCTT NM178060TRβ1 AAGCCACAGGGTACCACTATCG GGAGACTTTTCTGAATGGTTCTTCTAA NM009380
Sequence of primers designed for evaluation of the relative mRNA expression by real-time PCR.
923L.P. Capelo et al. / Bone 43 (2008) 921–930
the expression of the control, the calibrator sample, arbitrarily set to 1as previously described by Livak [30]. A complete list of primers usedin this study is listed in Table 1.
Determination of D2 and D3 activity
D2 and D3 activities were measured in the tibia and femur offetuses of mice at E18.5. Accordingly to Gouveia et al. [[25]], femur andtibia were dissected out from frozen E18.5 fetuses (n=6), crushed in asteelmortar andpestle set (Fisher Scientific International) precooled indry ice, and sonicated in 100 μl of PE buffer (0.1 potassium phosphate,1 mM EDTA, pH6.9) containing 0.25 sucrose and 10 mM dithiothreitol(DTT). As previously described by Christoffolete et al. [31] andSteinsapir et al. [32], with minor modifications, bone homogenates(15 μg of protein) were assayed for D2 deiodination of freshly purified2 nM 125I-labeled T4, in the presence of 20 mM DTT and unlabeled T4in 0.1 nMand 100 nM, a nonsaturating and saturating T4 concentrationof D2 activity, respectively. The incubation was performed for 16 h at37 °C. At the end of the assay, 200 μl of horse serum was added, andprotein was precipitated by the addition of 100 μl 50% trichloroaceticacid followed by centrifugation at 12,000 ×g for 3min. Finally, 360 μl ofthe supernatant containing 125I generatedwas counted in a δ-counter
Fig. 1. Concentrations of total T4 and T3 in the serum of dams and pups and in the whole body(C and D) Fetal whole body concentrations of T4 and T3, respectively. (E and F) Post-natal seruand T3 were determined on the following gestational days: 12.5, 14.5, 16.5 and 18.5. Post-nata(HYPO) was induced by adding sodium perchlorate and methimazole to the drinking waterepresent the mean±SEM (n= 4–12). ⁎pb0.05, ⁎⁎ pb0.01 and ⁎⁎⁎pb0.001 vs. EUT by Stude
(Cobra II; Packard, Meriden CT). Accordingly, to da-Silva et al. [33] andChristoffolete et al. [31], specific T4-to-T3 conversion by D2 wascalculated by subtracting nonspecific deiodination (determined by thesaturating concentration of T4 — 100 nM) from specific D2 deiodina-tion (determined by the nonsaturating concentration of T4 — 0.1 nM).Deiodinase activity was expressed as femtomoles T4 per hour permilligram protein (fmol/h*mg protein) [20,34]. The assays consumedless than 70% of the substrate.
D3 deiodination of 125I-labeled T3 was performed with 4 μg bonehomogenate in the presence of 0.1 nM unlabeled T3, 10 mM PTU and100 nM DTT for 24 h at 37 °C. The samples were analyzed for D3deiodinase products by high pressure liquid chromatography system(HPLC Waters 1525, Waters Corporation, MA, USA) [35]. The resultswere reported as femtomoles T3 per hour per milligram protein (fmol/h⁎mg protein).
Statistical analysis
Student's t-test was used to determine significant differencesbetween groups and was performed using Prism 3.0 (GraphPadSoftware, San Diego, CA, USA). Multiple comparisons were performedby ANOVA followed by the Student–Newman–Keuls test.
homogenates of the fetuses. (A and B) Maternal serum levels of T4 and T3, respectively.m levels of T4 and T3, respectively. Maternal serum levels and fetal concentrations of T4l serum levels were determined at 2, 4, 7, 14, 21 and 35 days after birth. Hypothyroidismr of the dams. Euthyroid (EUT) dams, fetuses and pups are untreated animals. Valuesnt t-test.
924 L.P. Capelo et al. / Bone 43 (2008) 921–930
Results
Serum levels and whole body T4 and T3 concentrations in mice fetuses
HYPO dams showed significantly lower serum levels of T4 (62–89%) and T3 (61–91%) in all gestational ages evaluated, whencompared to EUT group (Figs. 1A, B). In addition, HYPO dams had aprolonged gestation and reduction in litter size, due to fetal andneonatal mortality of approximately 30% (data not shown). Figs. 1Cand D show the concentration of T4 and T3 in whole bodyhomogenates of E12.5 to E18.5 fetuses. While T4 was undetectablein E12.5 EUT fetus homogenates (Fig.1C), it reached the detection levelat E14.5 and increased significantly until E18.5 (7-fold vs. E14.5). In theHYPO group, T4 levels were still undetectable at E14.5 and weresignificantly lower than in EUT fetuses at E16.5 (54%) and E18.5 (53%).
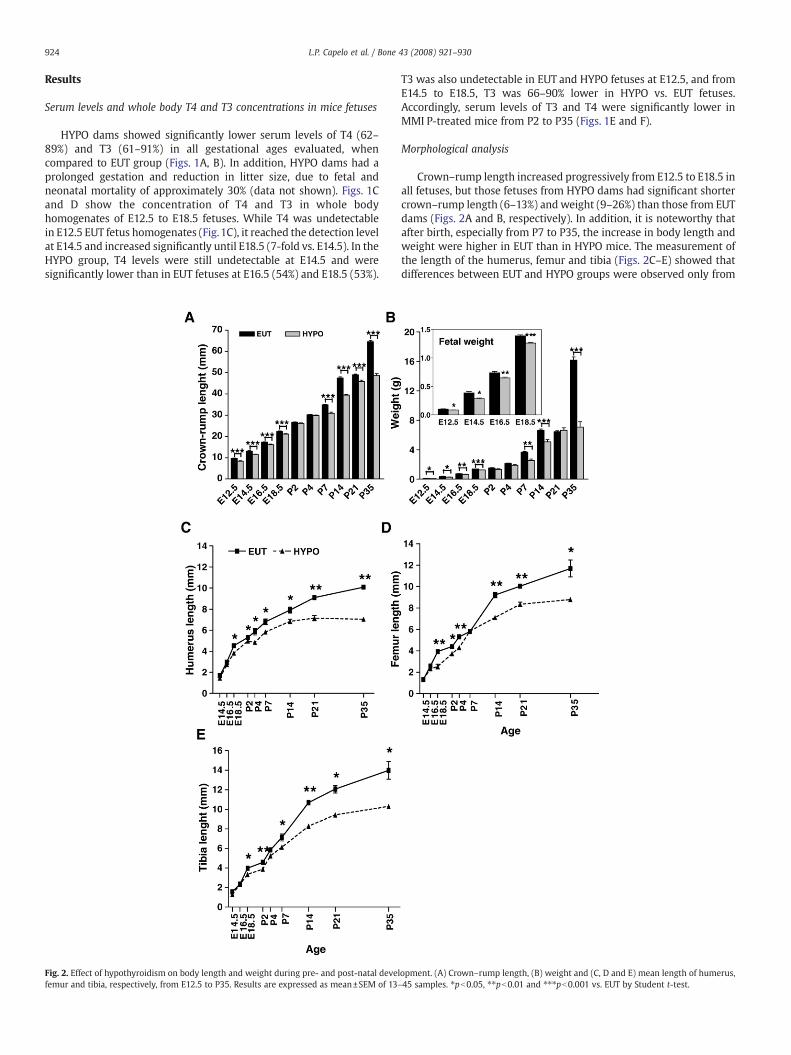
Fig. 2. Effect of hypothyroidism on body length and weight during pre- and post-natal develfemur and tibia, respectively, from E12.5 to P35. Results are expressed as mean±SEM of 13–
T3 was also undetectable in EUT and HYPO fetuses at E12.5, and fromE14.5 to E18.5, T3 was 66–90% lower in HYPO vs. EUT fetuses.Accordingly, serum levels of T3 and T4 were significantly lower inMMI P-treated mice from P2 to P35 (Figs. 1E and F).
Morphological analysis
Crown–rump length increased progressively from E12.5 to E18.5 inall fetuses, but those fetuses from HYPO dams had significant shortercrown–rump length (6–13%) and weight (9–26%) than those from EUTdams (Figs. 2A and B, respectively). In addition, it is noteworthy thatafter birth, especially from P7 to P35, the increase in body length andweight were higher in EUT than in HYPO mice. The measurement ofthe length of the humerus, femur and tibia (Figs. 2C–E) showed thatdifferences between EUT and HYPO groups were observed only from
opment. (A) Crown–rump length, (B) weight and (C, D and E) mean length of humerus,45 samples. ⁎pb0.05, ⁎⁎pb0.01 and ⁎⁎⁎pb0.001 vs. EUT by Student t-test.
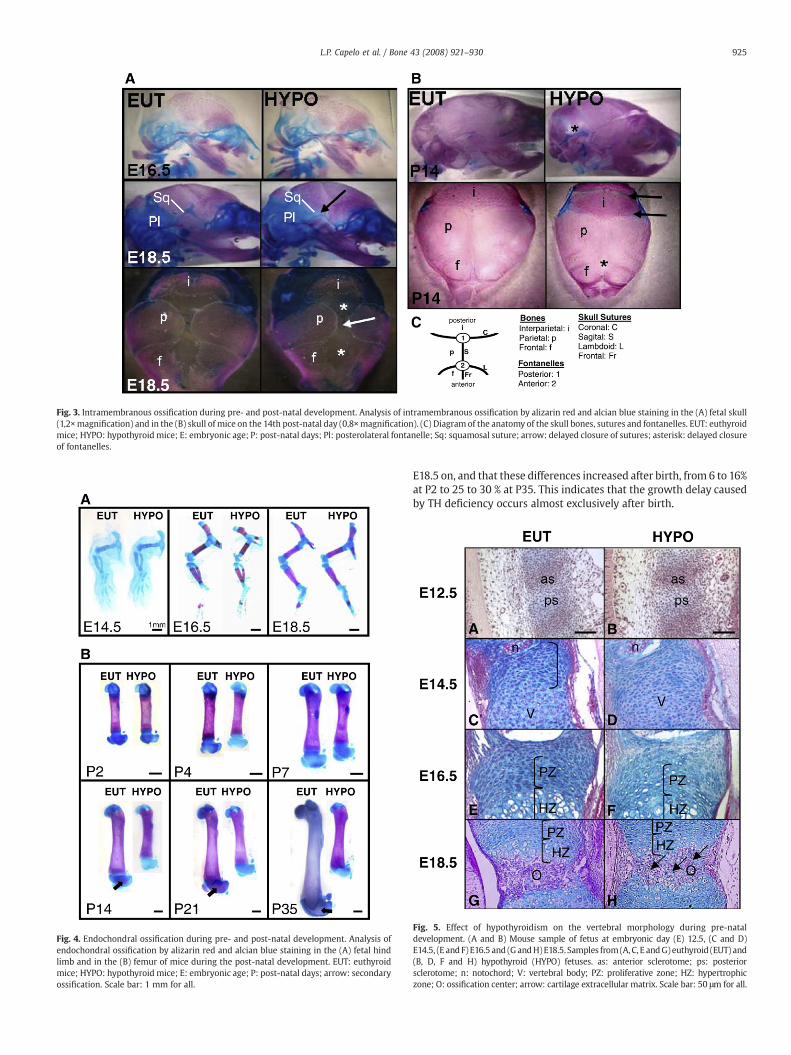
Fig. 3. Intramembranous ossification during pre- and post-natal development. Analysis of intramembranous ossification by alizarin red and alcian blue staining in the (A) fetal skull(1,2×magnification) and in the (B) skull of mice on the 14th post-natal day (0,8×magnification). (C) Diagram of the anatomy of the skull bones, sutures and fontanelles. EUT: euthyroidmice; HYPO: hypothyroid mice; E: embryonic age; P: post-natal days; Pl: posterolateral fontanelle; Sq: squamosal suture; arrow: delayed closure of sutures; asterisk: delayed closureof fontanelles.
Fig. 4. Endochondral ossification during pre- and post-natal development. Analysis ofendochondral ossification by alizarin red and alcian blue staining in the (A) fetal hindlimb and in the (B) femur of mice during the post-natal development. EUT: euthyroidmice; HYPO: hypothyroid mice; E: embryonic age; P: post-natal days; arrow: secondaryossification. Scale bar: 1 mm for all.
925L.P. Capelo et al. / Bone 43 (2008) 921–930
E18.5 on, and that these differences increased after birth, from 6 to 16%at P2 to 25 to 30 % at P35. This indicates that the growth delay causedby TH deficiency occurs almost exclusively after birth.
Fig. 5. Effect of hypothyroidism on the vertebral morphology during pre-nataldevelopment. (A and B) Mouse sample of fetus at embryonic day (E) 12.5, (C and D)E14.5, (E and F)E16.5 and (G andH)E18.5. Samples from(A,C, E andG) euthyroid (EUT) and(B, D, F and H) hypothyroid (HYPO) fetuses. as: anterior sclerotome; ps: posteriorsclerotome; n: notochord; V: vertebral body; PZ: proliferative zone; HZ: hypertrophiczone; O: ossification center; arrow: cartilage extracellular matrix. Scale bar: 50 μm for all.
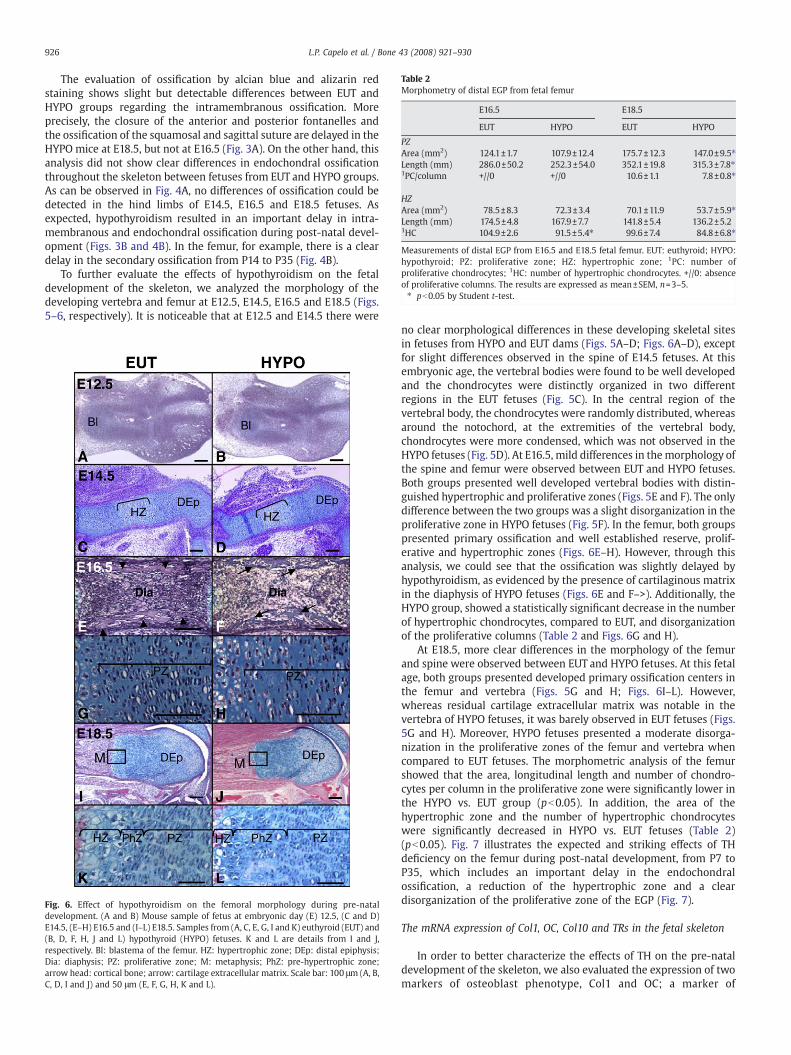
Table 2Morphometry of distal EGP from fetal femur
E16.5 E18.5
EUT HYPO EUT HYPO
PZArea (mm2) 124.1±1.7 107.9±12.4 175.7±12.3 147.0±9.5⁎Length (mm) 286.0±50.2 252.3±54.0 352.1±19.8 315.3±7.8⁎1PC/column +//0 +//0 10.6±1.1 7.8±0.8⁎
HZArea (mm2) 78.5±8.3 72.3±3.4 70.1±11.9 53.7±5.9⁎Length (mm) 174.5±4.8 167.9±7.7 141.8±5.4 136.2±5.21HC 104.9±2.6 91.5±5.4⁎ 99.6±7.4 84.8±6.8⁎
Measurements of distal EGP from E16.5 and E18.5 fetal femur. EUT: euthyroid; HYPO:hypothyroid; PZ: proliferative zone; HZ: hypertrophic zone; 1PC: number ofproliferative chondrocytes; 1HC: number of hypertrophic chondrocytes. +//0: absenceof proliferative columns. The results are expressed as mean±SEM, n=3–5.⁎ pb0.05 by Student t-test.
926 L.P. Capelo et al. / Bone 43 (2008) 921–930
The evaluation of ossification by alcian blue and alizarin redstaining shows slight but detectable differences between EUT andHYPO groups regarding the intramembranous ossification. Moreprecisely, the closure of the anterior and posterior fontanelles andthe ossification of the squamosal and sagittal suture are delayed in theHYPO mice at E18.5, but not at E16.5 (Fig. 3A). On the other hand, thisanalysis did not show clear differences in endochondral ossificationthroughout the skeleton between fetuses from EUT and HYPO groups.As can be observed in Fig. 4A, no differences of ossification could bedetected in the hind limbs of E14.5, E16.5 and E18.5 fetuses. Asexpected, hypothyroidism resulted in an important delay in intra-membranous and endochondral ossification during post-natal devel-opment (Figs. 3B and 4B). In the femur, for example, there is a cleardelay in the secondary ossification from P14 to P35 (Fig. 4B).
To further evaluate the effects of hypothyroidism on the fetaldevelopment of the skeleton, we analyzed the morphology of thedeveloping vertebra and femur at E12.5, E14.5, E16.5 and E18.5 (Figs.5–6, respectively). It is noticeable that at E12.5 and E14.5 there were
Fig. 6. Effect of hypothyroidism on the femoral morphology during pre-nataldevelopment. (A and B) Mouse sample of fetus at embryonic day (E) 12.5, (C and D)E14.5, (E–H) E16.5 and (I–L) E18.5. Samples from (A, C, E, G, I and K) euthyroid (EUT) and(B, D, F, H, J and L) hypothyroid (HYPO) fetuses. K and L are details from I and J,respectively. Bl: blastema of the femur. HZ: hypertrophic zone; DEp: distal epiphysis;Dia: diaphysis; PZ: proliferative zone; M: metaphysis; PhZ: pre-hypertrophic zone;arrow head: cortical bone; arrow: cartilage extracellular matrix. Scale bar: 100 μm (A, B,C, D, I and J) and 50 μm (E, F, G, H, K and L).
no clear morphological differences in these developing skeletal sitesin fetuses from HYPO and EUT dams (Figs. 5A–D; Figs. 6A–D), exceptfor slight differences observed in the spine of E14.5 fetuses. At thisembryonic age, the vertebral bodies were found to be well developedand the chondrocytes were distinctly organized in two differentregions in the EUT fetuses (Fig. 5C). In the central region of thevertebral body, the chondrocytes were randomly distributed, whereasaround the notochord, at the extremities of the vertebral body,chondrocytes were more condensed, which was not observed in theHYPO fetuses (Fig. 5D). At E16.5, mild differences in themorphology ofthe spine and femur were observed between EUT and HYPO fetuses.Both groups presented well developed vertebral bodies with distin-guished hypertrophic and proliferative zones (Figs. 5E and F). The onlydifference between the two groups was a slight disorganization in theproliferative zone in HYPO fetuses (Fig. 5F). In the femur, both groupspresented primary ossification and well established reserve, prolif-erative and hypertrophic zones (Figs. 6E–H). However, through thisanalysis, we could see that the ossification was slightly delayed byhypothyroidism, as evidenced by the presence of cartilaginous matrixin the diaphysis of HYPO fetuses (Figs. 6E and F–>). Additionally, theHYPO group, showed a statistically significant decrease in the numberof hypertrophic chondrocytes, compared to EUT, and disorganizationof the proliferative columns (Table 2 and Figs. 6G and H).
At E18.5, more clear differences in the morphology of the femurand spine were observed between EUT and HYPO fetuses. At this fetalage, both groups presented developed primary ossification centers inthe femur and vertebra (Figs. 5G and H; Figs. 6I–L). However,whereas residual cartilage extracellular matrix was notable in thevertebra of HYPO fetuses, it was barely observed in EUT fetuses (Figs.5G and H). Moreover, HYPO fetuses presented a moderate disorga-nization in the proliferative zones of the femur and vertebra whencompared to EUT fetuses. The morphometric analysis of the femurshowed that the area, longitudinal length and number of chondro-cytes per column in the proliferative zone were significantly lower inthe HYPO vs. EUT group (pb0.05). In addition, the area of thehypertrophic zone and the number of hypertrophic chondrocyteswere significantly decreased in HYPO vs. EUT fetuses (Table 2)(pb0.05). Fig. 7 illustrates the expected and striking effects of THdeficiency on the femur during post-natal development, from P7 toP35, which includes an important delay in the endochondralossification, a reduction of the hypertrophic zone and a cleardisorganization of the proliferative zone of the EGP (Fig. 7).
The mRNA expression of Col1, OC, Col10 and TRs in the fetal skeleton
In order to better characterize the effects of TH on the pre-nataldevelopment of the skeleton, we also evaluated the expression of twomarkers of osteoblast phenotype, Col1 and OC; a marker of
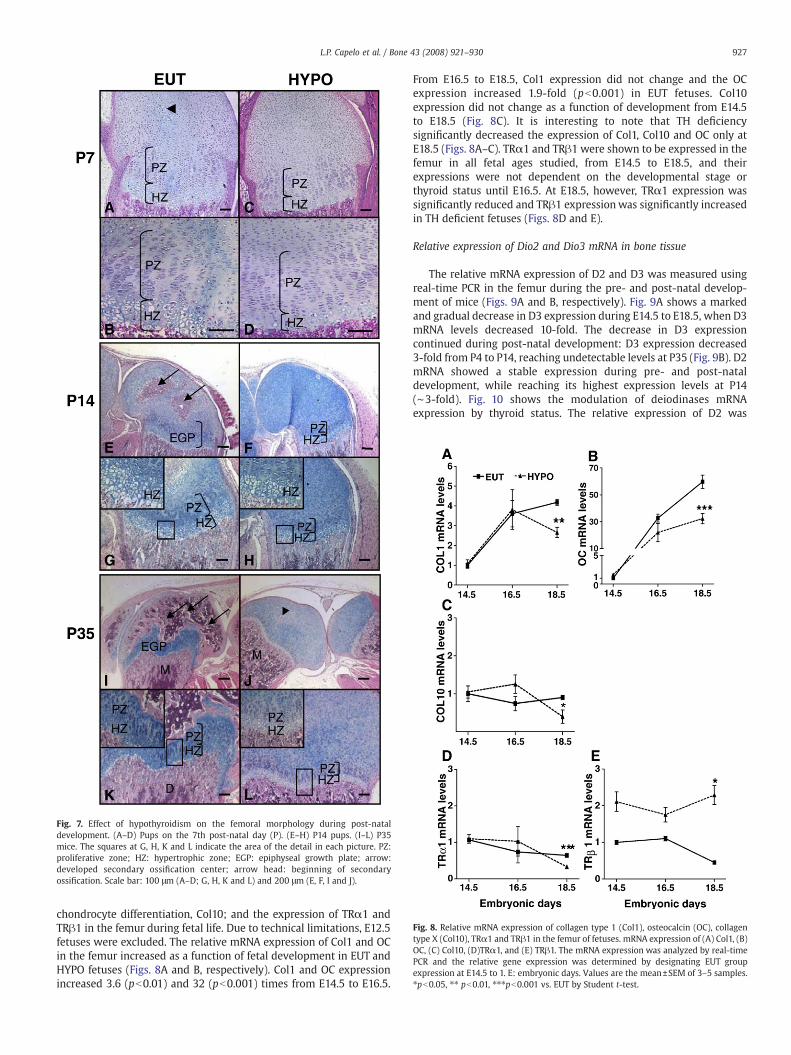
Fig. 8. Relative mRNA expression of collagen type 1 (Col1), osteocalcin (OC), collagentype X (Col10), TRα1 and TRβ1 in the femur of fetuses. mRNA expression of (A) Col1, (B)OC, (C) Col10, (D)TRα1, and (E) TRβ1. The mRNA expression was analyzed by real-timePCR and the relative gene expression was determined by designating EUT groupexpression at E14.5 to 1. E: embryonic days. Values are the mean±SEM of 3–5 samples.⁎pb0.05, ⁎⁎ pb0.01, ⁎⁎⁎pb0.001 vs. EUT by Student t-test.
Fig. 7. Effect of hypothyroidism on the femoral morphology during post-nataldevelopment. (A–D) Pups on the 7th post-natal day (P). (E–H) P14 pups. (I–L) P35mice. The squares at G, H, K and L indicate the area of the detail in each picture. PZ:proliferative zone; HZ: hypertrophic zone; EGP: epiphyseal growth plate; arrow:developed secondary ossification center; arrow head: beginning of secondaryossification. Scale bar: 100 μm (A–D; G, H, K and L) and 200 μm (E, F, I and J).
927L.P. Capelo et al. / Bone 43 (2008) 921–930
chondrocyte differentiation, Col10; and the expression of TRα1 andTRβ1 in the femur during fetal life. Due to technical limitations, E12.5fetuses were excluded. The relative mRNA expression of Col1 and OCin the femur increased as a function of fetal development in EUT andHYPO fetuses (Figs. 8A and B, respectively). Col1 and OC expressionincreased 3.6 (pb0.01) and 32 (pb0.001) times from E14.5 to E16.5.
From E16.5 to E18.5, Col1 expression did not change and the OCexpression increased 1.9-fold (pb0.001) in EUT fetuses. Col10expression did not change as a function of development from E14.5to E18.5 (Fig. 8C). It is interesting to note that TH deficiencysignificantly decreased the expression of Col1, Col10 and OC only atE18.5 (Figs. 8A–C). TRα1 and TRβ1 were shown to be expressed in thefemur in all fetal ages studied, from E14.5 to E18.5, and theirexpressions were not dependent on the developmental stage orthyroid status until E16.5. At E18.5, however, TRα1 expression wassignificantly reduced and TRβ1 expressionwas significantly increasedin TH deficient fetuses (Figs. 8D and E).
Relative expression of Dio2 and Dio3 mRNA in bone tissue
The relative mRNA expression of D2 and D3 was measured usingreal-time PCR in the femur during the pre- and post-natal develop-ment of mice (Figs. 9A and B, respectively). Fig. 9A shows a markedand gradual decrease in D3 expression during E14.5 to E18.5, when D3mRNA levels decreased 10-fold. The decrease in D3 expressioncontinued during post-natal development: D3 expression decreased3-fold from P4 to P14, reaching undetectable levels at P35 (Fig. 9B). D2mRNA showed a stable expression during pre- and post-nataldevelopment, while reaching its highest expression levels at P14(∼3-fold). Fig. 10 shows the modulation of deiodinases mRNAexpression by thyroid status. The relative expression of D2 was
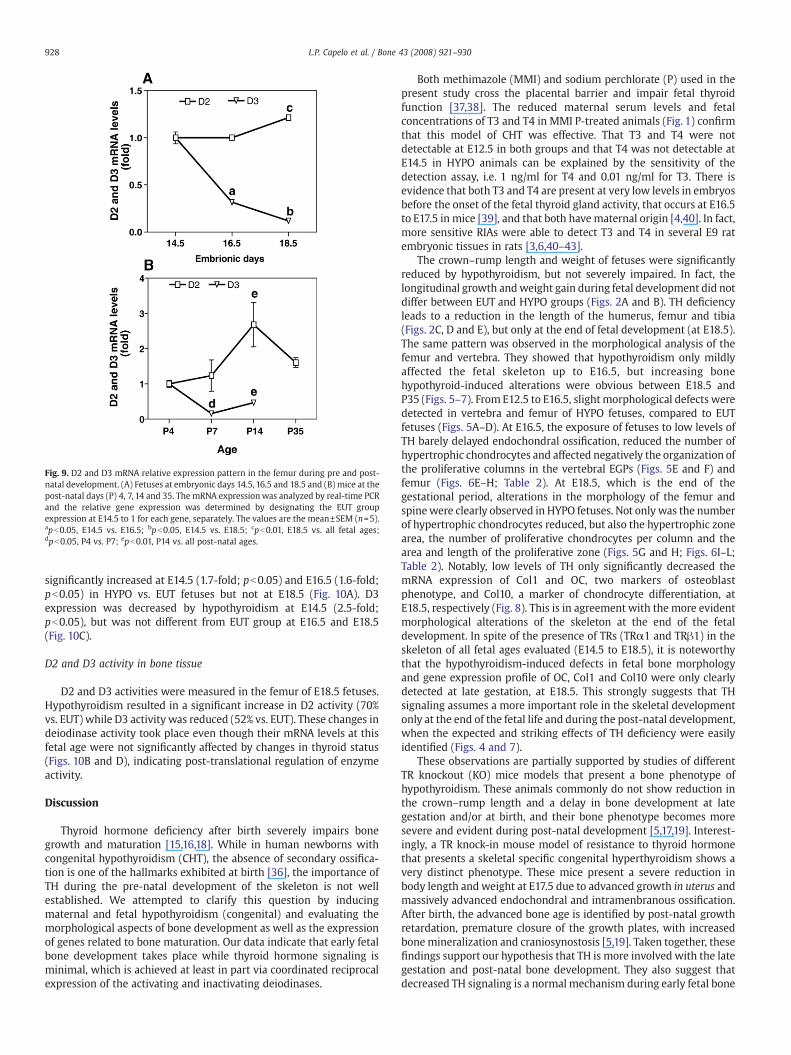
Fig. 9. D2 and D3 mRNA relative expression pattern in the femur during pre and post-natal development. (A) Fetuses at embryonic days 14.5, 16.5 and 18.5 and (B) mice at thepost-natal days (P) 4, 7, 14 and 35. The mRNA expressionwas analyzed by real-time PCRand the relative gene expression was determined by designating the EUT groupexpression at E14.5 to 1 for each gene, separately. The values are the mean±SEM (n=5).apb0.05, E14.5 vs. E16.5; bpb0.05, E14.5 vs. E18.5; cpb0.01, E18.5 vs. all fetal ages;dpb0.05, P4 vs. P7; epb0.01, P14 vs. all post-natal ages.
928 L.P. Capelo et al. / Bone 43 (2008) 921–930
significantly increased at E14.5 (1.7-fold; pb0.05) and E16.5 (1.6-fold;pb0.05) in HYPO vs. EUT fetuses but not at E18.5 (Fig. 10A). D3expression was decreased by hypothyroidism at E14.5 (2.5-fold;pb0.05), but was not different from EUT group at E16.5 and E18.5(Fig. 10C).
D2 and D3 activity in bone tissue
D2 and D3 activities were measured in the femur of E18.5 fetuses.Hypothyroidism resulted in a significant increase in D2 activity (70%vs. EUT) while D3 activity was reduced (52% vs. EUT). These changes indeiodinase activity took place even though their mRNA levels at thisfetal age were not significantly affected by changes in thyroid status(Figs. 10B and D), indicating post-translational regulation of enzymeactivity.
Discussion
Thyroid hormone deficiency after birth severely impairs bonegrowth and maturation [15,16,18]. While in human newborns withcongenital hypothyroidism (CHT), the absence of secondary ossifica-tion is one of the hallmarks exhibited at birth [36], the importance ofTH during the pre-natal development of the skeleton is not wellestablished. We attempted to clarify this question by inducingmaternal and fetal hypothyroidism (congenital) and evaluating themorphological aspects of bone development as well as the expressionof genes related to bone maturation. Our data indicate that early fetalbone development takes place while thyroid hormone signaling isminimal, which is achieved at least in part via coordinated reciprocalexpression of the activating and inactivating deiodinases.
Both methimazole (MMI) and sodium perchlorate (P) used in thepresent study cross the placental barrier and impair fetal thyroidfunction [37,38]. The reduced maternal serum levels and fetalconcentrations of T3 and T4 in MMI P-treated animals (Fig. 1) confirmthat this model of CHT was effective. That T3 and T4 were notdetectable at E12.5 in both groups and that T4 was not detectable atE14.5 in HYPO animals can be explained by the sensitivity of thedetection assay, i.e. 1 ng/ml for T4 and 0.01 ng/ml for T3. There isevidence that both T3 and T4 are present at very low levels in embryosbefore the onset of the fetal thyroid gland activity, that occurs at E16.5to E17.5 in mice [39], and that both have maternal origin [4,40]. In fact,more sensitive RIAs were able to detect T3 and T4 in several E9 ratembryonic tissues in rats [3,6,40–43].
The crown–rump length and weight of fetuses were significantlyreduced by hypothyroidism, but not severely impaired. In fact, thelongitudinal growth andweight gain during fetal development did notdiffer between EUT and HYPO groups (Figs. 2A and B). TH deficiencyleads to a reduction in the length of the humerus, femur and tibia(Figs. 2C, D and E), but only at the end of fetal development (at E18.5).The same pattern was observed in the morphological analysis of thefemur and vertebra. They showed that hypothyroidism only mildlyaffected the fetal skeleton up to E16.5, but increasing bonehypothyroid-induced alterations were obvious between E18.5 andP35 (Figs. 5–7). From E12.5 to E16.5, slightmorphological defects weredetected in vertebra and femur of HYPO fetuses, compared to EUTfetuses (Figs. 5A–D). At E16.5, the exposure of fetuses to low levels ofTH barely delayed endochondral ossification, reduced the number ofhypertrophic chondrocytes and affected negatively the organization ofthe proliferative columns in the vertebral EGPs (Figs. 5E and F) andfemur (Figs. 6E–H; Table 2). At E18.5, which is the end of thegestational period, alterations in the morphology of the femur andspinewere clearly observed in HYPO fetuses. Not only was the numberof hypertrophic chondrocytes reduced, but also the hypertrophic zonearea, the number of proliferative chondrocytes per column and thearea and length of the proliferative zone (Figs. 5G and H; Figs. 6I–L;Table 2). Notably, low levels of TH only significantly decreased themRNA expression of Col1 and OC, two markers of osteoblastphenotype, and Col10, a marker of chondrocyte differentiation, atE18.5, respectively (Fig. 8). This is in agreement with the more evidentmorphological alterations of the skeleton at the end of the fetaldevelopment. In spite of the presence of TRs (TRα1 and TRβ1) in theskeleton of all fetal ages evaluated (E14.5 to E18.5), it is noteworthythat the hypothyroidism-induced defects in fetal bone morphologyand gene expression profile of OC, Col1 and Col10 were only clearlydetected at late gestation, at E18.5. This strongly suggests that THsignaling assumes a more important role in the skeletal developmentonly at the end of the fetal life and during the post-natal development,when the expected and striking effects of TH deficiency were easilyidentified (Figs. 4 and 7).
These observations are partially supported by studies of differentTR knockout (KO) mice models that present a bone phenotype ofhypothyroidism. These animals commonly do not show reduction inthe crown–rump length and a delay in bone development at lategestation and/or at birth, and their bone phenotype becomes moresevere and evident during post-natal development [5,17,19]. Interest-ingly, a TR knock-in mouse model of resistance to thyroid hormonethat presents a skeletal specific congenital hyperthyroidism shows avery distinct phenotype. These mice present a severe reduction inbody length and weight at E17.5 due to advanced growth in uterus andmassively advanced endochondral and intramenbranous ossification.After birth, the advanced bone age is identified by post-natal growthretardation, premature closure of the growth plates, with increasedbonemineralization and craniosynostosis [5,19]. Taken together, thesefindings support our hypothesis that TH is more involved with the lategestation and post-natal bone development. They also suggest thatdecreased TH signaling is a normal mechanism during early fetal bone
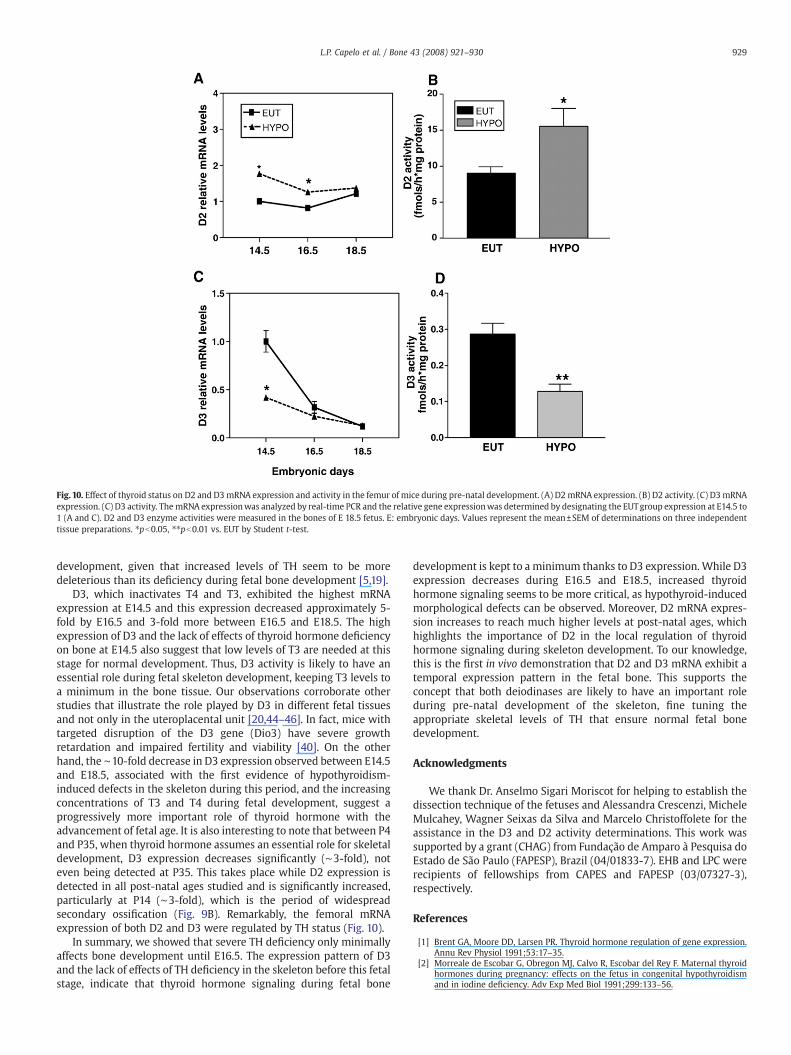
Fig. 10. Effect of thyroid status on D2 and D3mRNA expression and activity in the femur of mice during pre-natal development. (A) D2mRNA expression. (B) D2 activity. (C) D3mRNAexpression. (C) D3 activity. ThemRNA expressionwas analyzed by real-time PCR and the relative gene expressionwas determined by designating the EUTgroup expression at E14.5 to1 (A and C). D2 and D3 enzyme activities were measured in the bones of E 18.5 fetus. E: embryonic days. Values represent the mean±SEM of determinations on three independenttissue preparations. ⁎pb0.05, ⁎⁎pb0.01 vs. EUT by Student t-test.
929L.P. Capelo et al. / Bone 43 (2008) 921–930
development, given that increased levels of TH seem to be moredeleterious than its deficiency during fetal bone development [5,19].
D3, which inactivates T4 and T3, exhibited the highest mRNAexpression at E14.5 and this expression decreased approximately 5-fold by E16.5 and 3-fold more between E16.5 and E18.5. The highexpression of D3 and the lack of effects of thyroid hormone deficiencyon bone at E14.5 also suggest that low levels of T3 are needed at thisstage for normal development. Thus, D3 activity is likely to have anessential role during fetal skeleton development, keeping T3 levels toa minimum in the bone tissue. Our observations corroborate otherstudies that illustrate the role played by D3 in different fetal tissuesand not only in the uteroplacental unit [20,44–46]. In fact, mice withtargeted disruption of the D3 gene (Dio3) have severe growthretardation and impaired fertility and viability [40]. On the otherhand, the ∼10-fold decrease in D3 expression observed between E14.5and E18.5, associated with the first evidence of hypothyroidism-induced defects in the skeleton during this period, and the increasingconcentrations of T3 and T4 during fetal development, suggest aprogressively more important role of thyroid hormone with theadvancement of fetal age. It is also interesting to note that between P4and P35, when thyroid hormone assumes an essential role for skeletaldevelopment, D3 expression decreases significantly (∼3-fold), noteven being detected at P35. This takes place while D2 expression isdetected in all post-natal ages studied and is significantly increased,particularly at P14 (∼3-fold), which is the period of widespreadsecondary ossification (Fig. 9B). Remarkably, the femoral mRNAexpression of both D2 and D3 were regulated by TH status (Fig. 10).
In summary, we showed that severe TH deficiency only minimallyaffects bone development until E16.5. The expression pattern of D3and the lack of effects of TH deficiency in the skeleton before this fetalstage, indicate that thyroid hormone signaling during fetal bone
development is kept to a minimum thanks to D3 expression.While D3expression decreases during E16.5 and E18.5, increased thyroidhormone signaling seems to be more critical, as hypothyroid-inducedmorphological defects can be observed. Moreover, D2 mRNA expres-sion increases to reach much higher levels at post-natal ages, whichhighlights the importance of D2 in the local regulation of thyroidhormone signaling during skeleton development. To our knowledge,this is the first in vivo demonstration that D2 and D3 mRNA exhibit atemporal expression pattern in the fetal bone. This supports theconcept that both deiodinases are likely to have an important roleduring pre-natal development of the skeleton, fine tuning theappropriate skeletal levels of TH that ensure normal fetal bonedevelopment.
Acknowledgments
We thank Dr. Anselmo Sigari Moriscot for helping to establish thedissection technique of the fetuses and Alessandra Crescenzi, MicheleMulcahey, Wagner Seixas da Silva and Marcelo Christoffolete for theassistance in the D3 and D2 activity determinations. This work wassupported by a grant (CHAG) from Fundação de Amparo à Pesquisa doEstado de São Paulo (FAPESP), Brazil (04/01833-7). EHB and LPC wererecipients of fellowships from CAPES and FAPESP (03/07327-3),respectively.
References
[1] Brent GA, Moore DD, Larsen PR. Thyroid hormone regulation of gene expression.Annu Rev Physiol 1991;53:17–35.
[2] Morreale de Escobar G, Obregon MJ, Calvo R, Escobar del Rey F. Maternal thyroidhormones during pregnancy: effects on the fetus in congenital hypothyroidismand in iodine deficiency. Adv Exp Med Biol 1991;299:133–56.
930 L.P. Capelo et al. / Bone 43 (2008) 921–930
[3] Morreale de Escobar G, Obregon MJ, Escobar del Rey F. Maternal–fetal thyroidhormone relationships and the fetal brain. Acta Med Austriaca 1988;15(Suppl 1):66–70.
[4] Ng L, Goodyear RJ, Woods CA, Schneider MJ, Diamond E, Richardson GP, et al.Hearing loss and retarded cochlear development in mice lacking type 2iodothyronine deiodinase. Proc Natl Acad Sci U S A 2004;101:3474–9.
[5] Bassett JH,Williams GR. Themolecular actions of thyroid hormone in bone. TrendsEndocrinol Metab 2003;14:356–64.
[6] Galton VA. The roles of the iodothyronine deiodinases in mammalian develop-ment. Thyroid 2005;15:823–34.
[7] Rizzoli R, von Tscharner V, Fleisch H. Increase of adenylate cyclase catalytic-unitactivity by dexamethasone in rat osteoblast-like cells. Biochem J1986;237:447–54.
[8] Sato K, Han DC, Fujii Y, Tsushima T, Shizume K. Thyroid hormone stimulatesalkaline phosphatase activity in cultured rat osteoblastic cells (ROS 17/2.8)through 3,5,3¢-triiodo L-thyronine nuclear receptors. Endocrinology1987;120:1873–81.
[9] LeBron BA, Pekary AE, Mirell C, Hahn TJ, Hershman JM. Thyroid hormone 5 '-deiodinase activity, nuclear binding, and effects on mitogenesis in UMR-106osteoblastic osteosarcoma cells. J Bone Miner Res 1989;4:173–8.
[10] Kasono K, Sato K, Han DC, Fujii Y, Tsushima T, Shizume K. Stimulation of alkalinephosphatase activity by thyroid hormone in mouse osteoblast-like cells (MC3T3-E1): a possible mechanism of hyperalkaline phosphatasia in hyperthyroidism.Bone Miner 1988;4:355–63.
[11] Allain TJ, Yen PM, Flanagan AM, McGregor AM. The isoform-specific expression ofthe tri-iodothyronine receptor in osteoblasts and osteoclasts. Eur J Clin Invest1996;26:418–25.
[12] Abu EO, Bord S, Horner A, Chatterjee VK, Compston JE. The expression of thyroidhormone receptors in human bone. Bone 1997;21:137–42.
[13] Robson H, Siebler T, Stevens DA, Shalet SM, Williams GR. Thyroid hormone actsdirectly on growth plate chondrocytes to promote hypertrophic differentiationand inhibit clonal expansion and cell proliferation. Endocrinology2000;141:3887–97.
[14] Lewinson D, Harel Z, Shenzer P, Silbermann M, Hochberg Z. Effect of thyroidhormone and growth hormone on recovery from hypothyroidism of epiphysealgrowth plate cartilage and its adjacent bone. Endocrinology 1989;124:937–45.
[15] Stevens DA, Hasserjian RP, Robson H, Siebler T, Shalet SM, Williams GR. Thyroidhormones regulate hypertrophic chondrocyte differentiation and expression ofparathyroid hormone-related peptide and its receptor during endochondral boneformation. J Bone Miner Res 2000;15:2431–42.
[16] Freitas FR, Capelo LP, O'Shea PJ, Jorgetti V, Moriscot AS, Scanlan TS, et al. Thethyroid hormone receptor beta-specific agonist GC-1 selectively affects the bonedevelopment of hypothyroid rats. J Bone Miner Res 2005;20:294–304.
[17] Bassett JH, Nordstrom K, Boyde A, Howell PG, Kelly S, Vennstrom B, et al. Thyroidstatus during skeletal development determines adult bone structure andmineralization. Mol Endocrinol 2007;21:1893–904.
[18] Allain TJ, McGregor AM. Thyroid hormones and bone. J Endocrinol 1993;139:9–18.[19] O'Shea PJ, Bassett JH, Sriskantharajah S, Ying H, Cheng SY, Williams GR.
Contrasting skeletal phenotypes in mice with an identical mutation targeted tothyroid hormone receptor alpha1 or beta. Mol Endocrinol 2005;19:3045–59.
[20] Bates JM, St Germain DL, Galton VA. Expression profiles of the three iodothyroninedeiodinases, D1, D2, and D3, in the developing rat. Endocrinology1999;140:844–51.
[21] ObregonMJ, Calvo RM, Del Rey FE, de Escobar GM. Ontogenesis of thyroid functionand interactions with maternal function. Endocr Dev 2007;10:86–98.
[22] Bates JM, Spate VL, Morris JS, St Germain DL, Galton VA. Effects of seleniumdeficiency on tissue selenium content, deiodinase activity, and thyroid hormoneeconomy in the rat during development. Endocrinology 2000;141:2490–500.
[23] Becker KB, Stephens KC, Davey JC, Schneider MJ, Galton VA. The type 2 and type 3iodothyronine deiodinases play important roles in coordinating development inRana catesbeiana tadpoles. Endocrinology 1997;138:2989–97.
[24] Miura M, Tanaka K, Komatsu Y, Suda M, Yasoda A, Sakuma Y, et al. A novelinteraction between thyroid hormones and 1,25(OH)(2)D(3) in osteoclastformation. Biochem Biophys Res Commun 2002;291:987–94.
[25] Gouveia CH, Christoffolete MA, Zaitune CR, Dora JM, Harney JW, Maia AL, et al.Type 2 iodothyronine selenodeiodinase is expressed throughout the mouse
skeleton and in the MC3T3-E1 mouse osteoblastic cell line during differentiation.Endocrinology 2005;146:195–200.
[26] Miura M, Tanaka K, Komatsu Y, Suda M, Yasoda A, Sakuma Y, et al. Thyroidhormones promote chondrocyte differentiation in mouse ATDC5 cells andstimulate endochondral ossification in fetal mouse tibias through iodothyroninedeiodinases in the growth plate. J Bone Miner Res 2002;17:443–54.
[27] Dentice M, Bandyopadhyay A, Gereben B, Callebaut I, Christoffolete MA, Kim BW,et al. The Hedgehog-inducible ubiquitin ligase subunit WSB-1 modulates thyroidhormone activation and PTHrP secretion in the developing growth plate. Nat CellBiol 2005;7:698–705.
[28] Dentice M, Luongo C, Huang S, Ambrosio R, Elefante A, Mirebeau-Prunier D, et al.Sonic hedgehog-induced type 3 deiodinase blocks thyroid hormone actionenhancing proliferation of normal and malignant keratinocytes. Proc Natl AcadSci U S A 2007;104:14466–71.
[29] ObregonMJ, Morreale de Escobar G, Escobar del Rey F. Concentrations of triiodo-L-thyronine in the plasma and tissues of normal rats, as determined by radio-immunoassay: comparison with results obtained by an isotopic equilibriumtechnique. Endocrinology 1978;103:2145–53.
[30] Livak K. ABI Prism 7700 sequence detection system, user bulletin 2. Appliedbiosystem; 1997.
[31] Christoffolete MA, Ribeiro R, Singru P, Fekete C, da Silva WS, Gordon DF, et al.Atypical expression of type 2 iodothyronine deiodinase in thyrotrophs explainsthe thyroxine-mediated pituitary thyrotropin feedback mechanism. Endocrinol-ogy 2006;147:1735–43.
[32] Steinsapir J, Harney J, Larsen PR. Type 2 iodothyronine deiodinase in rat pituitarytumor cells is inactivated in proteasomes. J Clin Invest 1998;102:1895–9.
[33] da-Silva WS, Harney JW, Kim BW, Li J, Bianco SD, Crescenzi A, et al. The smallpolyphenolic molecule kaempferol increases cellular energy expenditure andthyroid hormone activation. Diabetes 2007;56:767–76.
[34] Galton VA, Wood ET, St Germain EA, Withrow CA, Aldrich G, St Germain GM, et al.Thyroid hormone homeostasis and action in the type 2 deiodinase-deficientrodent brain during development. Endocrinology 2007;148:3080–8.
[35] Huang SA, Tu HM, Harney JW, Venihaki M, Butte AJ, Kozakewich HP, et al. Severehypothyroidism caused by type 3 iodothyronine deiodinase in infantile heman-giomas. N Engl J Med 2000;343:185–9.
[36] Senecal J, Grosse MC, Vincent A, Simon J, Lefreche JN. Bone maturation in the fetusand newborn infant. Arch Fr Pediatr 1977;34:424–38.
[37] Marchant B, Brownlie BE, Hart DM, Horton PW, Alexander WD. The placentaltransfer of propylthiouracil, methimazole and carbimazole. J Clin EndocrinolMetab 1977;45:1187–93.
[38] Mandel SJ, Cooper DS. The use of antithyroid drugs in pregnancy and lactation. JClin Endocrinol Metab 2001;86:2354–9.
[39] Morreale de Escobar G, Pastor R, ObregonMJ, Escobar del Rey F. Effects of maternalhypothyroidism on the weight and thyroid hormone content of rat embryonictissues, before and after onset of fetal thyroid function. Endocrinology1985;117:1890–900.
[40] Obregon MJ, Mallol J, Pastor R, Morreale de Escobar G, Escobar del Rey F. L-thyroxine and 3,5,3′-triiodo-L-thyronine in rat embryos before onset of fetalthyroid function. Endocrinology 1984;114:305–7.
[41] Morreale de Escobar G, Obregon MJ, Ruiz de Ona C, Escobar del Rey F. Transfer ofthyroxine from the mother to the rat fetus near term: effects on brain 3,5,3′-triiodothyronine deficiency. Endocrinology 1988;122:1521–31.
[42] Calvo R, Obregon MJ, Escobar del Rey F, Morreale de Escobar G. The rat placentaand the transfer of thyroid hormones from the mother to the fetus. Effects ofmaternal thyroid status. Endocrinology 1992;131:357–65.
[43] Ruiz de Ona C, Morreale de Escobar G, Calvo R, Escobar del Rey F, Obregon MJ.Thyroid hormones and 5′-deiodinase in the rat fetus late in gestation: effects ofmaternal hypothyroidism. Endocrinology 1991;128:422–32.
[44] Huang TS, Chopra IJ, Boado R, Soloman DH, Chua Teco GN. Thyroxine inner ringmonodeiodinating activity in fetal tissues of the rat. Pediatr Res 1988;23:196–9.
[45] Galton VA, Martinez E, Hernandez A, St Germain EA, Bates JM, St Germain DL.Pregnant rat uterus expresses high levels of the type 3 iodothyronine deiodinase. JClin Invest 1999;103:979–87.
[46] Hernandez A, Martinez ME, Fiering S, Galton VA, St Germain D. Type 3 deiodinaseis critical for the maturation and function of the thyroid axis. J Clin Invest2006;116:476–84.