UHRF1 Overexpression Drives DNA Hypomethylation and Hepatocellular Carcinoma
Upload
independentCategory
view
0download
0
Loss of the Glycine N-Methyltransferase Gene Leads to Steatosisand Hepatocellular Carcinoma in Mice
M. Luz Martínez-Chantar1,*, Mercedes Vázquez-Chantada1,*, Usue Ariz1, Nuria Martínez1,Marta Varela1, Zigmund Luka2, Antonieta Capdevila2, Juan Rodríguez1, Ana M. Aransay1,Rune Matthiesen1, Heping Yang3, Diego F. Calvisi4, Manel Esteller5, Mario Fraga5, Shelly C.Lu3, Conrad Wagner2,6, and José M. Mato1
1CIC bioGUNE, CIBERehd, Technology Park of Bizkaia, Bizkaia, Spain
2Department of Biochemistry, Vanderbilt University, Nashville, TN
3Division of Gastrointestinal and Liver Diseases, Keck School of Medicine, University Southern California,Los Angeles, CA
4Division of Experimental Pathology and Oncology, University of Sassary, Sassary, Italy
5Centro Nacional de Investigaciones Oncológicas, Madrid, Spain
6Tennessee Valley Department of Medical Affairs Medical Center, Nashville, TN
AbstractGlycine N-methyltransferase (GNMT) is the main enzyme responsible for catabolism of excesshepatic S-adenosylmethionine (SAMe). GNMT is absent in hepatocellular carcinoma (HCC),messenger RNA (mRNA) levels are significantly lower in livers of patients at risk of developingHCC, and GNMT has been proposed to be a tumor-susceptibility gene for liver cancer. Theidentification of several children with liver disease as having mutations of the GNMT gene furthersuggests that this enzyme plays an important role in liver function. In the current study we studieddevelopment of liver pathologies including HCC in GNMT-knockout (GNMT-KO) mice. GNMT-KO mice have elevated serum aminotransferase, methionine, and SAMe levels and develop liversteatosis, fibrosis, and HCC. We found that activation of the Ras and Janus kinase (JAK)/signaltransducer and activator of transcription (STAT) pathways was increased in liver tumors fromGNMT-KO mice coincidently with the suppression of the Ras inhibitors Ras-association domainfamily/tumor suppressor (RASSF) 1 and 4 and the JAK/STAT inhibitors suppressor of cytokinesignaling (SOCS) 1-3 and cytokine-inducible SH2-protein. Finally, we found that methylation ofRASSF1 and SOCS2 promoters and the binding of trimethylated lysine 27 in histone 3 to these 2genes was increased in HCC from GNMT-KO mice.
Conclusion—These data demonstrate that loss of GNMT induces aberrant methylation of DNAand histones, resulting in epigenetic modulation of critical carcinogenic pathways in mice.
The first steps in mammalian methionine metabolism are conversion to S-adenosylmethionine(SAMe) and transfer of the methyl group of SAMe to a large variety of substrates (includingDNA, RNA, histones, and small molecules such as glycine, guanidinoacetate, andphosphatidylethanolamine) with the formation of S-adenosylhomocysteine (SAH), an inhibitorof many SAMe-dependent methyltransferases.1 Although there are a large number of SAMe-
Address reprint requests to: José M Mato, CIC bioGUNE, Technology Park of Bizkaia, 48160 Derio, Bizkaia, Spain. E-mail:[email protected]; fax: (34) 944-061301.*These authors contributed equally to this article.Published online in Wiley InterScience (www.interscience.wiley.com).Potential conflict of interest: Nothing to report.
NIH Public AccessAuthor ManuscriptHepatology. Author manuscript; available in PMC 2008 May 30.
Published in final edited form as:Hepatology. 2008 April ; 47(4): 1191–1199.
NIH
-PA Author Manuscript
NIH
-PA Author Manuscript
NIH
-PA Author Manuscript

dependent methyltransferases,2 methylation of glycine by glycine N-methyltransferase(GNMT) to form sarcosine (N-methylglycine) is one of the reactions that contribute most tototal transmethylation flux.3 The importance of GNMT is to remove excess SAMe andmaintain a constant hepatic SAMe/SAH ratio to avoid aberrant methylation.2 Consistent withthis function, the activation of GNMT in rats by the administration of retinoic acid causes areduction in plasma methionine and homocysteine levels, as well as in liver DNA methylation.4,5 In GNMT-knockout (GNMT-KO) mice, liver SAMe content is elevated 35-fold, and theSAMe/SAH ratio increases about 100-fold,6 and individuals with GNMT mutations, whichleads to inactive forms of the enzyme, have elevated plasma levels of methionine and SAMebut a normal concentration of homocysteine.7,8
GNMT is expressed in the liver, pancreas, and prostate9 and is absent in hepatocellularcarcinoma (HCC)10 and down-regulated in the livers of patients at risk of developing HCC,such as in those with hepatitis C virus–and alcohol-induced cirrhosis.11 Moreover, a loss ofheterozygosity of GNMT has been reported in about 40% of HCC patients, and GNMT hasbeen proposed to be a tumor-susceptibility gene for liver cancer.12,13 Identification of severalchildren with mutations of GNMT as having mild to moderate liver disease with elevated serumaminotransferases7,8 further suggests that a defect in this enzyme leads to liver disease.
To define the role of GNMT in the liver, we examined hepatic function in GNMT-KO mice.The GNMT-deficient mice recapitulated the situation observed in individuals with mutationsin GNMT7,8 and showed elevated serum aminotransferases, methionine, and SAMe levels.Moreover, the GNMT-KO mice developed steatosis, fibrosis, and HCC. Finally, we analyzedthe activation of the Ras and Janus kinase (JAK)/signal transducer and activator of transcription(STAT) pathways in GNMT-KO mice, as well as the methylation of DNA and H3K27, whichmay result in epigenetic modulation of critical carcinogenic pathways.
Materials and MethodsAnimal Experiments
The generation of GNMT-KO mice has been described.6 All animal experimentation wasconducted in accordance with the Spanish Guide for the Care and Use of Laboratory Animals,and protocols were approved by the CIC bioGUNE Ethical Review Committee. Three-month-old and 8-month-old male homozygous GNMT-KO and their wild-type (WT) littermates werekilled for histological examination of their livers. In addition, liver specimens were snap-frozenfor subsequent analysis. At the time of death, serum samples were collected for determinationof alanine aminotransferase (ALT) and aspartate aminotransferase (AST) levels ordeproteinized with acetonitrile for methionine and SAMe analysis.
Measurement of Methionine and SAMeSerum levels of methionine and SAMe were determined by liquid chromatography/massspectrometry (LC/MS) using a Waters Acquity ultraperformance liquid chromatography(UPLC) system equipped with a column oven, and a Waters Acquity UPLC BEH C18 column(2.1 × 100 mm, 1.7 μm). A 3-μL aliquot of sample was injected into the UPLC column, whichwas maintained at 50°C and eluted at 600 μL/min. The mobile phase consisted of water with0.05% formic acid (solvent A) and acetonitrile with 0.05% formic acid (solvent B). Separationwas carried out starting with 1% B for 1 minute, followed by a linear gradient from 1% to 95%B for 10 minutes and staying at 95% B for 6 minutes. The UPLC system was coupled to aWaters Micromass LCT Premier Mass Spectrometer equipped with a Lockspray ionizationsource operating in electrospray positive ion mode (W mode, resolution 10,000 full width athalf maximum). Full-scan time-of-flight MS spectra were acquired between m/z (mass-to-charge ratio) 80 and 1,000 using the dynamic range enhancement mode, with a total scan time
Luz Martínez-Chantar et al. Page 2
Hepatology. Author manuscript; available in PMC 2008 May 30.
NIH
-PA Author Manuscript
NIH
-PA Author Manuscript
NIH
-PA Author Manuscript

of 0.4 seconds. Leucine enkephalin was used as a reference compound for accurate massmeasurements. The reference was infused into the Lockspray reference channel, and the massesof the analyte channel were automatically mass-corrected by the software. A set of samples,prepared from all standard compounds, was acquired over the concentration range of 10 pg/μL to 50 ng/μL in order to test the linearity of the system. After analyzing all concentrationlevels, calibration curves were generatedμL and chromatogram traces of the protonated speciesof the standards were extracted with a mass window of 0.05 Da. Serum levels of methionineand SAMe were automatically calculated from the calibration curves.
Histology and ImmunohistochemistrySections from formalin-fixed liver tissue were stained with hematoxylin and eosin or withSirius red for collagen visualization. The proliferation marker Ki67 was evaluated byimmunostaining using mouse monoclonal anti-Ki67 primary antibody.
Quantitative Real-Time PCRTotal liver RNA was isolated by the guanidinium thiocyanate method. RNA concentration wasdetermined spectrophotometrically before use, and integrity was checked by electrophoresiswith subsequent ethidium bromide staining. The RNA was purified with an RNeasy Mini kit(Qiagen, Chatsworth, CA) including DNase treatment. Two micrograms of total RNA werethen retrotranscribed with the M-MLV retrotranscriptase (Promega, Madison, WI) in thepresence of an oligo dT. We performed quantitative real-time polymerase chain reaction (PCR)in a Bio-Rad iCycler thermalcycler (Bio-Rad Laboratories, Hercules, CA). All samples wererun in triplicate. Five microliters of a 1:20 dilution of cDNA was used in each PCR reactionin a total reaction volume of 30 μL using iQ SYBR Green Super Mix (Bio-Rad). Primers weredesigned with Primer Express Software (Applied Biosystems, Foster City, CA) to determinethe expression of Ras-association domain family/tumor suppressor (RASSF)–1, RASSF4,cytokine-inducible SH2-protein (CIS), SOCS1, SOCS2, SOCS3, ADFP, UCP2, CYP4A10,CYP4A14, TIMP-1, and iNOS and synthesized by Invitrogen. After checking the specificityof the PCR products with the melting curve, Ct values were extrapolated to a standard curveperformed simultaneously with the samplesμL and data were then normalized to GAPDHexpression. The complete list of primer sequences used and the PCR conditions are availableon request.
Western BlottingSamples were separated by SDS-PAGE and analyzed by immunoblotting using commercialantibodies. Blots were developed with secondary antirabbit or antimouse antibodies conjugatedto horseradish peroxidase (Invitrogen, Carlsbad, CA) and the luminal-chemiluminescencereagent (ECL; Amersham Biosciences, Upsala, Sweden). The processed blots were exposedto X-ray film, and the autoradiograms were analyzed.
Ras ActivityLiver tissue samples were homogenized in lysis buffer [125 mM HEPES (pH 7.5), 750 mMNaCl, 5% Igepal CA-630, 50 mM MgCl2, 5 mM EDTA, and 10% glycerol] containingComplete Protease Inhibitor Cocktail (Roche Molecular Biochemicals) and sonicated. Proteinconcentrations were determined with a Bio-Rad Protein Assay Kit using bovine serum albuminas a standard. Aliquots of 800 μg of tissue lysates were immunoprecipitated with 5 μg of mousemonoclonal anti–pan Ras antibody (sc-32; Santa Cruz Biotechnology, Santa Cruz, CA).Immunoprecipitated proteins were denatured by boiling in Tris-Glycine SDS Sample Buffer(Novex-Invitrogen, Carlsbad, CA), separated by SDS-PAGE, and then transferred ontonitrocellulose membranes (Novex-Invitrogen) by electroblotting. The membranes wereblocked in 5% nonfat dry milk in Tris-buffered saline containing 0.1% Tween 20 for 1 hour
Luz Martínez-Chantar et al. Page 3
Hepatology. Author manuscript; available in PMC 2008 May 30.
NIH
-PA Author Manuscript
NIH
-PA Author Manuscript
NIH
-PA Author Manuscript

and probed with the rabbit polyclonal anti-RAF-1 antibody (sc-133, Santa Cruz Biotechnology)in a 1:2,000 dilution. Immunoprecipitated proteins were revealed via enhancedchemiluminescence (Amersham), and the bands were quantified in arbitrary units byImageMaster Total Lab V1.11 software and normalized to actin levels (as detected with therabbit polyclonal antiactin antibody sc-10731; Santa Cruz Biotechnology).
Global DNA Methylation and DNA Methyltransferase Activity5-Methylcytosine (5mC) genomic content was determined by high-performance capillaryelectrophoresis, as described.14 Briefly, genomic DNA samples were boiled, treated withnuclease P1 (Sigma) for 16 hours at 37°C and with alkaline phosphatase (Sigma) for anadditional 2 hours at 37°C. After hydrolysis, total cytosine and 5mC content were measuredby capillary electrophoresis using a P/ACE MDQ system (Beckman-Coulter). All sampleswere analyzed in triplicate. Relative 5mC content was expressed as a percentage of totalcytosine content (methylated and nonmethylated). DNA methyltransferase activity wasmeasured using an EpiQuick DNA methyltransferase Activity kit.
Sequence-Specific DNA MethylationThe CpG DNA methylation status of a subtelomeric DNA region at chromosome 1 and of thepromoters of RASSF1 and SOCS2 was established by PCR analysis after bisulfite modification.Bisulfite genomic sequencing of multiple clones was then carried out as described elsewhere.15 The primers used were: 5′-AAAAGATGGTGAGTGTAGGTGT-3′ (sense) and 5′-TCACAATATCCTCCTCTTCTTC-3′ (antisense) for chromosome 1; 5′-CGAACGTGGTGAGCGCGG-3′(sense) and 5′-CGCCCCTCGACGTCTTCACCCCCTCAC-3′ (antisense) for RASSF1; and 5′-TGTCTCCCTCCTCACCCCTCTACTCCGG-3′ (sense) and 5′-ACGCGAGGTCCACTGGCCCCAGC-3′ (antisense) for SOCS2.
Promoter MethylationMspI and HpaII restriction endonucleases were used as described with modifications.16MspI and HpaII can distinguish between unmethylated and methylated cytosine in thenucleotide sequence 5′-CCGG. MspI is insensitive to the methylation status, whereas HpaIIwill digest only if the internal cytosine is unmethylated.26 DNA samples (30 μg each) werefirst digested with StuI and BbvI for RASSF1 or BspmII and TthlllI for SOCS2 at 37°C for 4hours. This was followed by overnight digestion with HpaII or MspI at 37°C. The digestedDNA was separated on 1% agarose, transferred onto nylon filters by 20× standard sodiumcitrate (SSC), and cross-linked in an ultraviolet cross-linker (FS-UVXL-1000, Fisher Biotech).The filters were prehybridized at 42°C in Rapid-Hybridization Buffer (Ambion, Austin, TX)for 2 hours and hybridized with the [32P]dCTP-labeled RASSF1 probe (corresponding to −313to −780 base pairs upstream of the mouse RASSF1 translational start site, GenBank accessionnumber NM_019713) or the SOCS2 probe (corresponding to −205 to −511 base pairs upstreamof the mouse SOCS2 translational start site, GenBank accession number NM_007706) for 8hours at 42°C in the same buffer. The blots were washed at 42°C for 20 minutes in 2× SSCcontaining 0.1% SDS twice and at 42°C for 30 minutes in 0.1×SSC containing 0.1% SDS.Autoradiography was performed by exposure to Kodak BioMax MR film at −80°C.
Analysis of Trimethylated Lysine 27 in Histone 3Chromatin immunoprecipitation assay was carried out as described15 using antibodies againsttrimethylated lysine 27 in histone 3 (H3K27me3; Abcam). Chromatin was sheared to anaverage length of 0.25 ± 1 kb, and PCR amplification was performed in 96-well optical platesin a volume of 20 μL. We used 15 ng of immunoprecipitated DNA, 5 pmol of each primer, and10 μL of 2× SYBRGreen PCR master Mix (Applied Biosystems). All measurements were
Luz Martínez-Chantar et al. Page 4
Hepatology. Author manuscript; available in PMC 2008 May 30.
NIH
-PA Author Manuscript
NIH
-PA Author Manuscript
NIH
-PA Author Manuscript

carried out in triplicate, and amounts were calculated extrapolating from a standard curve. Theprimers and conditions for each promoter are available on request.
Statistical AnalysisThe Student t test was used to evaluate statistical significance. P values < 0.05 were consideredstatistically significant.
ResultsDeletion of GNMT Gene Induces Steatosis, Fibrosis, and Hepatocellular Carcinoma
To define the metabolic role of GNMT in the liver, we examined hepatic function in GNMT-KO and WT male mice. The GNMT-deficient mice recapitulated the situation observed inchildren with mutations in GNMT8,9 and showed elevated serum aminotransferases,methionine and SAMe at both 3 and 8 months of age (Table 1). Histological examination ofthe livers of 3-month-old mutant mice showed steatosis and fibrosis, which were moreprominent in the livers of 8-month-old mice (Fig. 1A). No significant signs of inflammationwere observed at either 3 or 8 months of age. At 8 months, all GNMT-KO mice (n = 10) alsodeveloped multifocal HCC, as determined by staining with hematoxylin and eosin and withthe cellular proliferation marker Ki67 (Fig. 1). The number of liver tumors varied from 2 to 9,with an average of 4 tumors per mouse. No evidence of focal hyperplasic lesions was observedin GNMT-KO livers at 3 or 5 months of age. Histological examination of prostate, pancreas,and kidney did not reveal signs of tumor formation in 8-month-old GNMT-KO mice.
Activation of Ras and JAK/STAT Pathways in HCC from GNMT-Deficient MiceHCC in humans is characterized by the persistent activation of the Ras/mitogen-activated/extracellular-regulated kinase (MEK)/extracellular signal-regulated kinase (ERK) and JAK/STAT signaling pathways via suppression of Ras and JAK/STAT inhibitors such as RASSF1,CIS, and SOCS1, SOCS2, and SOCS3.17-21 Accordingly, we observed that the expression ofRas inhibitors RASSF1 and RASSF4 and of JAK/STAT inhibitors SOCS1, SOCS2, SOCS3,and CIS was reduced in liver tumors from 8-month-old GNMT-KO male mice (Table 2).Concomitant with the loss of Ras inhibitors, Ras and downstream effectors of Ras involved inproliferation and survival, including pRaf, pMEK1/2, and pERK1/2, were activated in livertumors from GNMT-deficient mice (Fig. 2A). Ras activity, assessed by immunoprecipitationwith anti–pan Ras antibody and probed with anti-RAF-1 antibody, was also markedly increasedin liver tumors from 8-month-old GNMT-mutant mice (Fig. 2B). Similarly, suppression ofJAK/ STAT inhibitors in liver tumors from GNMT-KO mice was associated with the activationof the JAK/STAT signaling pathway, including proliferation proteins cyclin D1 and cyclin D2and the antiapoptotic protein Bcl-xL (Fig. 2C). In these experiments we analyzed the livercontaining tumors but not the surrounding liver. We chose to compare tumors to age-matchedWT controls because the surrounding liver tissue may also be abnormal, as suggested by thefinding that the expression of Ras and JAK/STAT inhibitors was already reduced in liversamples from 3-month-old GNMT-KO male mice (Table 2) and by the observation that Rasactivity was also markedly increased in 3-month-old GNMT-KO mice liver (Fig. 2B).
Increased Promoter Methylation and Binding to H3K27me3 of RASSF1 and SOCS2 in HCCfrom GNMT-KO Mice
Because the importance of GNMT is to remove excess SAMe and maintain a constant SAMe/SAH ratio to avoid aberrant methylation reactions,2 we hypothesized that the loss of GNMTmay lead to abnormal DNA and histone methylation of specific and critical carcinogenicpathways. First, we assessed global DNA methylation and the methylation of a subtelomericDNA region of chromosome 1 and found both to be hypermethylated in 8-month-old GNMT-
Luz Martínez-Chantar et al. Page 5
Hepatology. Author manuscript; available in PMC 2008 May 30.
NIH
-PA Author Manuscript
NIH
-PA Author Manuscript
NIH
-PA Author Manuscript

KO male mice (Fig. 3A,B). Given that the inhibitors of the Ras and JAK/STAT signalingpathways are frequently inactivated by promoter methylation,17,19-21 we then examined themethylation of RASSF1 and SOCS2 promoters. Methylation-sensitive Southern blot analysisshowed hypermethylation of these 2 promoters in liver tumors from 8-month-old GNMT-mutant mice (Fig. 3D,E). Because H3K27me3 is an epigenetic marker highly associated withgenomic silencing,22 we also examined the trimethylation of H3K27 bound to RASSF1 andSOCS2 promoters. As shown in Fig. 3F,G, the level of H3K27me3 bound to RASSF1 andSOCS2 increased about 2-fold in liver tumors from GNMT-KO mice as compared with WTanimals.
Finally, we analyzed whether epigenetic pathways observed in the liver tumors were activatedin 3-month-old mice before histological evidence of tumor development. As shown in Fig. 3,global DNA methylation, CpG DNA methylation of a subtelomeric DNA of chromosome 1,promoter methylation of RASSF1 and SOCS2 promoters, and trimethylation of H3K27 boundto RASSF1 and SOCS2 promoters were all significantly increased in liver samples from 3-month-old GNMT-deficient mice as compared to WT liver samples. To determine the CpGDNA methylation status of RASSF1 and SOCS2 promoters in liver samples from 3-month-oldmice, we employed bisulfite genomic sequencing because the less sensitive technique usedwith livers from 8-month-old mice, based on the use of MspI and HpaII restrictionendonucleases, did not reveal differences between GNMT-KO and WT livers from 3-month-old mice.
Liver DNA methyltransferase activity was similar in GNMT-deficient mice and WT animalsat 3 month of age, whereas it was significantly increased (1.6 ± 0.2 fold, P < 0.05, n = 5) inthe HCC nodules of 8-month-old GNMT-KO mice. These results suggest that epigeneticchanges in GNMT-KO mice are most probably at least initially a result of the accumulation ofSAMe and the increased SAMe/SAH ratio in the livers of these animals.
DiscussionGNMT is the most abundant methyltransferase in mammalian liver.9 GNMT catalyzes theconversion of glycine into sarcosine, which is then oxidized to regenerate glycine. The functionof this futile cycle is to catabolize excess liver SAMe to maintain a constant SAMe/SAH ratioin order to avoid aberrant methylation reactions.1-3 Accordingly, the loss of GNMT in miceleads to the accumulation of hepatic SAMe and to a marked increase in the hepatic SAMe/SAH ratio without affecting SAH levels,6 and the activation of GNMT in rats by theadministration of retinoic acid causes a reduction in global liver DNA methylation.4
In the present study, we showed that GNMT-deficient mice recapitulate the situation observedin individuals with mutations of the GNMT gene7,8 and have elevated serumaminotransferases, methionine, and SAMe. Moreover, in this study we showed that GNMT-deficient mice spontaneously develop steatosis, fibrosis, and HCC. These results support theconcept that GNMT is a tumor-susceptibility gene for liver cancer12 and further suggest thatreduced GNMT activity may be an early event in the development of HCC. Recently, thephenotype of a GNMT-KO mouse model that differs from ours was published.18 Consistentwith the present results and with our previous observations,6 this other GNMT-KO mousemodel has hypermethioninemia and elevated levels of both serum ALT and hepatic SAMe.18 However, these knockout mice did not develop steatosis or HCC, but about 60% of theanimals had increased glycogen storage in the livers, as determined by staining with PAS.18In the article by Liu et al.,18 no evidence about the molecular mechanism by which an increasein hepatic SAMe content induces glycogen storage is provided. In our GNMT-KO mousemodel, hepatic PAS staining showed no differences between WT and knockout mice inglycogen staining (not shown). We believe that high SAMe levels can produce epigenetic
Luz Martínez-Chantar et al. Page 6
Hepatology. Author manuscript; available in PMC 2008 May 30.
NIH
-PA Author Manuscript
NIH
-PA Author Manuscript
NIH
-PA Author Manuscript
changes that may differ depending on the genetic background and other factors such asnutritional factors, and it is possible this is why the phenotypes differ. Nevertheless, our findingof liver cancer development in GNMT-KO mice is consistent with the reported role of GNMTas a tumor suppressor in human hepatocellular carcinoma.
Previous studies have demonstrated that the Ras and JAK/STAT pathways are universallyactivated in human HCC and that the activation of these pathways may be essential for HCCdevelopment.17 We have observed that, as in human HCC, the Ras and JAK/STAT pathwaysare activated in liver tumors from GNMT-deficient mice and that, as also found in human HCC,17 activation of these signaling pathways coincided with suppression of the Ras and JAK/STAT inhibitors RASSF1, RASSF4, SOCS1, SOCS2, SOCS3, and CIS. These inhibitors of theRas and JAK/STAT signaling pathways, which are frequently inactivated by promotermethylation, have been involved in carcinogenesis.17,19-22,24,25 Epigenetic inactivation ofRASSF1 is one of the most common molecular changes in cancer; and a direct correlationbetween promoter methylation and loss of RASSF1 expression has been shown in many tumorcell lines including hepatoma.17,24 Similarly, the frequency of promoter hypermethylation ofSOCS2 has been found to occur in more than 80% of both human HCC and hepatoma cell linesand to correlate with the loss of SOCS2 expression.17 Consistent with these findings, our datademonstrate that the methylation of RASSF1 and SOCS2 promoters is increased in liver tumorsfrom GNMT-knockout mice. Promoter hypermethylation in cancer cells is known to beassociated with a variety of alterations in histone modification, including increased H3K27methylation, which is linked to gene repression.26 Our observation that the level of H3K27me3bound to RASSF1 and SOCS2 was increased in liver tumors of GNMT-KO mice agrees withthis concept. Moreover, our results also indicate that the epigenetic pathways observed in theliver tumors were activated in 3-month-old mice, well in advance of any histological evidenceof tumor formation, strongly suggesting a pathogenic relationship between methylationchanges and hepatocarcinogenesis.
We have previously demonstrated27,28 that in mice deficient in hepatic SAMe synthesis(methionine adenosyl-transferase 1A knockout mice), SAMe levels in the liver and the SAMe/SAH ratio are reduced and that these animals spontaneously develop steatohepatitis and HCC.Mice deficient in other key enzymes of methionine and folate metabolism, such ascystathionine β synthase and methylenetetrahydrofolate reductase, also have altered levels ofhepatic SAMe and a reduced SAMe/SAH ratio and spontaneously develop fatty liver disease.29,30 These findings, together with the present observations using mice deficient in GNMT,suggest that either too much or too little hepatic SAMe in concert with abnormal SAMe/SAHratios may result in aberrant methylation of DNA and histones, resulting in epigeneticmodulation of critical metabolic and carcinogenic pathways in mice, which emphasizes thecrucial role of methionine and folate metabolism in maintaining normal liver function.1
Acknowledgements
The authors thank B. Rodríguez for technical assistance, F. Muruzabal for help with the histological preparations, G.Kanel for help with the interpretation of the histology, and OWL Genomics for methionine and SAMe analysis.
Supported by NIH grants AA12677, AA13847, and AT-1576 (to S.C.L. and J.M.M.); DK15289 (to C.W.), PN I+DSAF 2005-00855, HEPADIP-EULSHM-CT-205, and ETORTEK 2005 (to J.M.M. and M.L.M.-C.); Program Ramóny Cajal (to M.L.M.-C.); and Fundación “La Caixa” (to M.L.M.-C., R.M., and A.M.A.).
References1. Mato JM, Lu SC. Role of S-adenosyl-L-methionine in liver health and injury. Hepatology
2007;45:1306–1312. [PubMed: 17464973]
Luz Martínez-Chantar et al. Page 7
Hepatology. Author manuscript; available in PMC 2008 May 30.
NIH
-PA Author Manuscript
NIH
-PA Author Manuscript
NIH
-PA Author Manuscript

2. Clarke, S.; Banfield, K. S-Adenosylmethionine-dependent methyltransferase. In: Carmel, R.; Jacobsen,DW., editors. Homocysteine in Health and Disease. Cambridge, UK: Cambridge University Press;2001. p. 63-78.
3. Mudd SH, Brosnan JT, Brosnan ME, Jacobs RL, Stabler SP, Allen RH, et al. Methyl balance andtransmethylation fluxes in humans. Am J Clin Nutr 2007;85:19–25. [PubMed: 17209172]
4. Rowling MJ, McMullen MH, Schalinske KL. Vitamin A and its derivatives induce hepatic glycine N-methyltransferase and hypomethylation of DNA in rats. J Nutr 2002;132:365–369. [PubMed:11880556]
5. Ozias M, Schalinske KL. All-trans-retinoic acid rapidly induces glycine N-methyltransferase in a dose-dependent manner and reduces circulating methionine and homocysteine levels in rats. J Nutr2003;133:4090–3094. [PubMed: 14652353]
6. Luka Z, Capdevila A, Mato JM, Wagner C. A glycine N-methyltransferase knockout mouse model forhumans with deficiency of this enzyme. Transgenic Res 2006;15:393–397. [PubMed: 16779654]
7. Mudd SH, Cerone R, Schiaffino MC, Fantasia AR, Minniti GU, Caruso U, et al. Glycine N-methyltransferase deficiency: a novel inborn error causing persistent isolated hypermethioninaemia.J Inherit Metab Dis 2001;24:448–464. [PubMed: 11596649]
8. Augoustides-Savvopoulou P, Luka Z, Karyda S, Stabler SP, Allen RH, Patsiaoura K, et al. Glycine N-methyltransferase deficiency: a new patient with a novel mutation. J Inherit Metab Dis 2003;26:745–749. [PubMed: 14739680]
9. Ogawa H, Fujikoa M. Purification and properties of glycine N-methyltransferase from rat liver. J BiolChem 1982;257:3447–3452. [PubMed: 6801046]
10. Chen YM, Shiu JY, Tzeng SJ, Shih LS, Chen YL, Lui WY, Chen PH. Characterization of glycine-N-methyltransferase-gene expression in human hepatocellular carcinoma. Int J Cancer 1998;75:787–793. [PubMed: 9495250]
11. Avila MA, Berasain C, Torres L, Martin-Duce A, Corrales FJ, Yang H, et al. Reduced mRNAabundance of the main enzymes involved in methionine metabolism in human liver cirrhosis andhepatocellular carcinoma. J Hepatol 2000;33:907–914. [PubMed: 11131452]
12. Tseng TL, Shih YP, Huang YC, Wang CW, Chen PH, Chang JG, et al. Genotypic and phenotypiccharacterization of a putative tumor susceptibility gene, GNMT, in liver cancer. Cancer Res2003;63:647–654. [PubMed: 12566309]
13. Chen SY, Lin JR, Darbba R, Lin P, Liu TY, Chen YM. Glycine N-methyltransferase tumorsusceptibility gene in the benzo(a)pyrene-detoxification pathway. Cancer Res 2004;64:3617–3623.[PubMed: 15150120]
14. Fraga MF, Ballester E, Villar-Garea A, Boix-Chornet M, Espada J, Schotta G, et al. High-performancecapillary electrophoretic method for the quantification of 5-methyl 2′-deoxycytidine in genomicDNA: application to plant, animal and human cancer tissues. Electrophoresis 2002;23:1677–1681.[PubMed: 12179987]
15. Fraga MF, Ballester E, Villar-Garea A, Boix-Chornet M, Espada J, Schotta G, et al. Loss of acetylationat Lys16 and trimethylation at Lys20 of histone H4 is a common hallmark of human cancer. NatGenet 2005;37:391–400. [PubMed: 15765097]
16. Garcea R, Daino L, Pascales R, Simile MM, Puddu M, Ruggiu ME, et al. Protooncogene methylationand expression in regenerating liver and preneoplastic liver nodules in the rat by diethylnitrosamine:effect of variations of S-adenosylmethionine:S-adenosylhomocysteine ratio. Carcinogenesis1989;10:1183–1192. [PubMed: 2472229]
17. Calvisi DF, Ladu S, Gorden A, Farina M, Conner EA, Lee JS, et al. Ubiquitous activation of Ras andJak/Stat pathways in human HCC. Gastroenterology 2006;130:1117–1128. [PubMed: 16618406]
18. Liu S-P, Li Y-S, Chen Y-J, Chiang E-P, Li AF-Y, Lee Y-H, et al. Glycine N-methyltransferase−/−mice develop chronic hepatitis and glycogen storage disease in the liver. Hepatology 2007;46:1413–1425. [PubMed: 17937387]
19. Yang B, Guo M, Herman JG, Clark DP. Aberrant promoter methylation profiles of tumor suppressorgenes in hepatocellular carcinoma. Am J Pathol 2003;163:1101–1107. [PubMed: 12937151]
20. Okochi O, Hibi K, Sakai M, Inoue S, Takeda S, Kaneko T, et al. Methylation-mediated silencing ofSOCS-1 gene in hepatocellular carcinoma derived from cirrhosis. Clin Cancer Res 2003;9:5295–5298. [PubMed: 14614012]
Luz Martínez-Chantar et al. Page 8
Hepatology. Author manuscript; available in PMC 2008 May 30.
NIH
-PA Author Manuscript
NIH
-PA Author Manuscript
NIH
-PA Author Manuscript

21. Eckfeld K, Hesson L, Vos MD, Bieche I, Latif F, Clark GJ. RASSF4/AD037 is a potential ras effector/tumor suppressor of the RASSF family. Cancer Res 2004;64:8688–8693. [PubMed: 15574778]
22. Ogata H, Kobayashi T, Chinen T, Takaki H, Sanada T, Minoda Y, et al. Deletion of the SOCS3 genein liver parenchymal cells promotes hepatitis-induced hepatocarcinogenesis. Gastroenterology2006;131:317–319. [PubMed: 16831614]
23. Barski A, Cuddapah S, Cui K, Roh TY, Schones DE, Wang Z, et al. High-resolution profiling ofhistone methylations in the human genome. Cell 2007;129:823–837. [PubMed: 17512414]
24. Agathanggelou A, Cooper WN, Latuf F. Role of the Ras-association domain family 1 tumorsuppressor gene in human cancers. Cancer Res 2005;65:3497–3508. [PubMed: 15867337]
25. Tomasi S, Damman R, Zhang Z, Wang Y, Liu L, Tsark WM, et al. Tumor susceptibility of Rassf1aknockout mice. Cancer Res 2005;65:92–98. [PubMed: 15665283]
26. Esteller M. Cancer epigenomics: DNA methylomes and histone-modification maps. Nat Genet2007;8:286–298.
27. Lu SC, Alvarez L, Huang ZZ, Chen L, An W, Corrales FJ, et al. Methionine adenosyltransferase 1Aknockout mice are predisposed to liver injury and exhibit increased expression of genes involved inproliferation. Proc Natl Acad Sci U S A 2001;98:5560–5565. [PubMed: 11320206]
28. Martínez-Chantar ML, Corrales FJ, Martínez-Cruz A, García-Trevijano ER, Huang ZZ, Chen L, etal. Spontaneous oxidative stress and liver tumors in mice lacking methionine adenosyltransferase1A. FASEB J 2002;16:1292–1294. [PubMed: 12060674]
29. Robert K, Nehmé J, Bourdon E, Pivert G, Friguet B, Delcayre C, et al. Cystathionine β synthasedeficiency promotes oxidative stress, fibrosis, and steatosis in mice liver. Gastroenterology2005;128:1408–1415.
30. Schwahn BC, Chen Z, Laryea MD, Wendel U, Lussier-Cacan S, Genest J Jr, et al. Homocysteine-betaine interactions in a murine model of 5,10-methylenetetrahydrofolate reductase deficiency.FASEB J 2003;17:512–514. [PubMed: 12551843]
AbbreviationsGNMT
glycine N-methyltransferase
HCC hepatocellular carcinoma
H3K27me3 trimethylated lysine 27 in histone 3
JAK Janus kinase
RASSF Ras-association domain family/tumor suppressor
SAH S-adenosylhomocysteine
SAMe S-adenosylmethionine
SOCS suppressor of cytokine signaling
STAT signal transducer and activator of transcription
WT
Luz Martínez-Chantar et al. Page 9
Hepatology. Author manuscript; available in PMC 2008 May 30.
NIH
-PA Author Manuscript
NIH
-PA Author Manuscript
NIH
-PA Author Manuscript

wild type
Luz Martínez-Chantar et al. Page 10
Hepatology. Author manuscript; available in PMC 2008 May 30.
NIH
-PA Author Manuscript
NIH
-PA Author Manuscript
NIH
-PA Author Manuscript

Fig. 1. Deletion of GNMT leads to steatosis, fibrosis, and HCC(A) At 3 months of age, macro and microvesicular steatosis (white droplets) could be seenthrough the hepatic lobule in GNMT-knockout (GNMT-KO) mice compared with wild-type(WT) animals. Collagen deposits (stained red) indicate moderate liver fibrosis. By 8 monthsof age, liver steatosis and fibrosis in mutant mice were more prominent. At least 10 animalsper group were examined. (B) At 8 months of age, livers from GNMT-KO mice also hadmultifocal HCC. Liver cords up to 5 cells thick, lined by endothelial cells, could be seen, withoccasional pseudogland formation. Staining with the nuclear proliferation marker Ki67 (redspots) indicates a higher proportion of cells in the cell cycle compared with WT cells. At least10 animals per group were examined (E&H, eosin and hematoxylin staining; SR, Sirius redstaining). Original magnification ×40.
Luz Martínez-Chantar et al. Page 11
Hepatology. Author manuscript; available in PMC 2008 May 30.
NIH
-PA Author Manuscript
NIH
-PA Author Manuscript
NIH
-PA Author Manuscript

Fig. 2. Activation of Ras and JAK/STAT pathways in GNMT-mutant mice liver(A) Representative Western blot analysis of Ras downstream effectors (pRAF, pMEK1/2, andpERK1/2). Phosphorylation of RAF, MEK1/2, and ERK1/2 was markedly increased in livertumors from GNMT-knockout (GNMT-KO) mice as compared with wild-type (WT) animals.One representative data set is shown out of 4 experiments performed. (B) Ras activity, assessedby immunoprecipitation with anti-pan Ras antibody and probed with anti-RAF-1 antibody,was markedly increased in livers from 3-month-old GNMT mice and in liver tumors from 8-month-old GNMT-mutant mice. Four animals from each subgroup were analyzed (WT mice,open bars; GNMT-KO mice, filled bars). (C) Representative Western blot analysis of JAK/STAT downstream effectors (pJAK1/2, pSTAT1, pSTAT3, cyclin D1 and D2, and Bcl-xL).Phosphorylation of JAK1/2, STAT1, and STAT 3 and protein levels of the JAK/STAT targetgenes, including the proliferation proteins cyclin D1 and cyclin D2 and the antiapoptotic proteinBcl-xL, were markedly increased in liver tumors from GNMT-KO mice. One representativedata set is shown of 4 experiments performed. Unless otherwise indicated, animals were all 8months old.
Luz Martínez-Chantar et al. Page 12
Hepatology. Author manuscript; available in PMC 2008 May 30.
NIH
-PA Author Manuscript
NIH
-PA Author Manuscript
NIH
-PA Author Manuscript

Fig. 3. Deletion of GNMT induces DNA and histone hypermethylation(A) Quantification of global DNA methylation. Total cytosine and 5-methylcytosine (5mC)content was determined in genomic DNA samples isolated from livers of wild-type (WT) miceat 3 and 8 months of age, in livers from 3-month-old GNMT-knockout (GNMT-KO) mice,and in liver tumors from 8-month-old knockout animals, and relative 5mC content, expressedas the percentage of total cytosine content (methylated and nonmethylated), was determined.Data represent means ± SDs from 5 animals per subgroup (*P < 0.05 versus WT). (B) Analysisof sequence-specific DNA methylation. CpG DNA methylation of a subtelomeric DNA regionat chromosome 1 was determined by PCR analysis after bisulfite modification in samplesisolated from livers of 3- and 8-month-old WT mice, in liver samples from 3-month-oldGNMT-knockout mice, and in liver tumors from 8-month-old knockout animals. Datarepresent means ± SDs. from 5 animals per subgroup (*P < 0.05 versus WT mice). (c–e)Analysis of RASSF1 and SOCS2 promoter methylation. (C) To determine the CpG DNAmethylation status of RASSF1 and SOCS2 promoters in liver samples from 3-month-old mice,we employed bisulfite genomic sequencing because the less sensitive technique, based on theuse of MspI and HpaII restriction endonucleases, used at 8 month of age, did not revealdifferences between GNMT-knockout and WT livers at 3 month of age. Data represent means± SDs from 3 animals per subgroup (*P < 0.05 versus WT). (D, E) To analyze the methylationstate of the promoters of RASSF1 and SOCS2 at 8 month of age, Southern blot analyses ofgenomic DNA digested with the methylation-sensitive isoschizomer restriction enzymesMspI and HpaII were performed as described in the Materials and Methods sections. TwoMspI fragments were detected in Southern blots when hepatic DNA was hybridized with a
Luz Martínez-Chantar et al. Page 13
Hepatology. Author manuscript; available in PMC 2008 May 30.
NIH
-PA Author Manuscript
NIH
-PA Author Manuscript
NIH
-PA Author Manuscript

RASSF1 probe (D). All DNA samples from WT mice liver digested with HpaII showed thesame pattern of restriction fragments as that produced by MspI digestion, indicating that theCCGG sites were unmethylated. However, all DNA samples from GNMT-KO mice livertumors digested with HpaII showed additional higher-molecular-weight bands (indicated byan arrow), showing that the RASSF1 promoter was hypermethylated. When hepatic DNA washybridized with a SOCS2 probe (E), an additional band (indicated by arrows) was also detectedwhen DNA from GNMT-KO liver tumors was digested with HpaII compared with whendigested with MspI, whereas liver samples from WT mice showed the same pattern afterdigestion with either enzyme (HpaII-WT, DNA samples from WT liver mice digested withHpaII; HpaII-KO, DNA samples from GNMT-KO liver tumors digested with HpaII; 4 animalsfrom each subgroup were analyzed). (F, G) Analysis of H3K27me3 bound to RASSF1 andSOCS2. The amount of H3K27me3 bound to RASSF1 (F) and SOCS2 (G) was determined bychromatin immunoprecipitation, as described in the Materials and Methods section in liversamples of 3- and 8-month-old WT mice, in liver samples of 3-month-old GNMT-knockoutmice, and in liver tumors from 8-month-old knockout animals. Relative values of H3K27me3are shown. Data represent means ± SDs from 5 animals per subgroup (*P < 0.05 versus WT).
Luz Martínez-Chantar et al. Page 14
Hepatology. Author manuscript; available in PMC 2008 May 30.
NIH
-PA Author Manuscript
NIH
-PA Author Manuscript
NIH
-PA Author Manuscript
NIH
-PA Author Manuscript
NIH
-PA Author Manuscript
NIH
-PA Author Manuscript
Luz Martínez-Chantar et al. Page 15
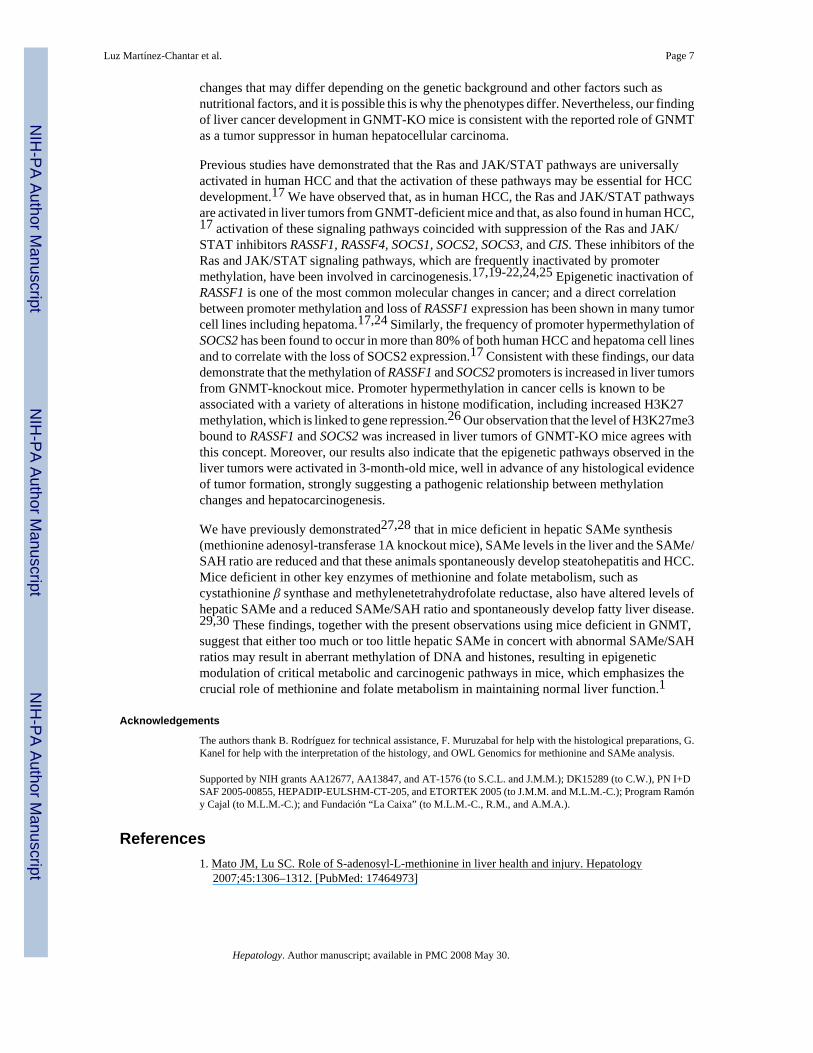
Table 1Serum Methionine (Met), S-Adenosylmethionine (SAMe), and Aminotransferases (ALT and AST) in 3-Month-Old and 8-Month-Old Wild-Type (WT) and GNMT-Deficient (GNMT-KO) Mice
WT(3 months)
GNMT-KO(3 months)
WT(8 months)
GNMT-KO(8 months)
Met (μmol/L) 24.9 ± 2.7 81.9 ± 23.3* 51.6 ± 7.5 151 ± 55.0*SAMe (μmol/L) 0.5 ± 0.05 0.9 ± 0.2* 0.6 ± 0.1 1.2 ± 0.4*ALT (IU/L) 100 ± 26.6 166 ± 45.3* 105 ± 35.6 320 ± 86.2*AST (IU/L) 47.5 ± 13.3 99.3 ± 35.8* 76.6 ± 19.4 347 ± 134*
Data are the means ± SDs. of at least 5 animals per group.
*P < 0.05 WT versus GNMT-KO.
Hepatology. Author manuscript; available in PMC 2008 May 30.

NIH
-PA Author Manuscript
NIH
-PA Author Manuscript
NIH
-PA Author Manuscript
Luz Martínez-Chantar et al. Page 16
Table 2Levels of Ras and JAK/STAT Inhibitors in GNMT-Knockout Mice
Gene
Magnitude of change inGNMT-KO versus WT mice
at 3 months P value
Magnitude of change inGNMT-KO versus WT mice
at 8 months P value
SOCS 1 −2.1 0.007 −1.6 0.040SOCS 2 −1.8 0.027 −2.5 0.002SOCS 3 −2.2 0.021 −4.3 0.001CIS −2.2 0.017 −4.1 0.040RASSF 1 −1.9 0.042 −1.6 0.024RASSF 4 −1.7 0.0003 −2.4 0.010
Levels of JAK/STAT (SOCS1, SOCS2, SOCS3, CIS) and Ras (RASSF1 and RASSF4) inhibitors were determined by quantitative RT-PCR in the liversof wild-type (WT) mice at 3 and 8 months of age, in liver samples from 3-month-old GNMT-knockout (GNMT-KO) mice, and in liver tumors from 8-month-old knockout mice, normalized using GAPDH expression as a housekeeping gene, and the ratio (magnitude of change) of GNMT-KO versus WTcalculated. Data represent means of at least 5 animals per subgroup assayed in triplicate.
Hepatology. Author manuscript; available in PMC 2008 May 30.
Copyright © 2022 FDOKUMEN


![[Hepatic steatosis, visceral fat and metabolic alterations in apparently healthy overweight/obese individuals]](https://static.fdokumen.com/doc/165x107/6324f8237fd2bfd0cb03375f/hepatic-steatosis-visceral-fat-and-metabolic-alterations-in-apparently-healthy.jpg)