Secondhand Smoke Induces Liver Steatosis through ... - MDPI
21
Int. J. Mol. Sci. 2020, 21, 1296; doi:10.3390/ijms21041296 www.mdpi.com/journal/ijms Article Secondhand Smoke Induces Liver Steatosis through Deregulation of Genes Involved in Hepatic Lipid Metabolism Stella Tommasi 1, *, Jae-In Yoon 2,† and Ahmad Besaratinia 1 1 Department of Preventive Medicine, USC Keck School of Medicine, University of Southern California, Los Angeles, CA 90033, USA; [email protected] 2 Department of Cancer Biology, Beckman Research Institute of the City of Hope, Duarte, CA 91010, USA; [email protected] * Correspondence: [email protected]; Tel:. +1-(323)-442-7753 † Current address: HANDOK, 132, Teheran-ro, Gangnam-gu, Seoul 06235, Korea Received: 14 January 2020; Accepted: 13 February 2020; Published: 14 February 2020 Abstract: We investigated the role of secondhand smoke (SHS) exposure, independently of diet, in the development of chronic liver disease. Standard diet-fed mice were exposed to SHS (5 h/day, 5 days/week for 4 months). Genome-wide gene expression analysis, together with molecular pathways and gene network analyses, and histological examination for lipid accumulation, inflammation, fibrosis, and glycogen deposition were performed on the liver of SHS-exposed mice and controls, upon termination of exposure and after one-month recovery in clean air. Aberrantly expressed transcripts were found in the liver of SHS-exposed mice both pre- and post-recovery in clean air (n = 473 vs. 222). The persistent deregulated transcripts (n = 210) predominantly affected genes and functional networks involved in lipid metabolism as well as in the regulation of the endoplasmic reticulum where manufacturing of lipids occurs. Significant hepatic fat accumulation (steatosis) was observed in the SHS-exposed mice, which progressively increased as the animals underwent recovery in clean air. Moderate increases in lobular inflammation infiltrates and collagen deposition as well as loss of glycogen were also detectable in the liver of SHS-exposed mice. A more pronounced phenotype, manifested as a disrupted cord-like architecture with foci of necrosis, apoptosis, inflammation, and macrovesicular steatosis, was observed in the liver of SHS-exposed mice post-recovery. The progressive accumulation of hepatic fat and other adverse histological changes in the SHS-exposed mice are highly consistent with the perturbation of key lipid genes and associated pathways in the corresponding animals. Our data support a role for SHS in the genesis and progression of metabolic liver disease through deregulation of genes and molecular pathways and functional networks involved in lipid homeostasis. Keywords: gene regulation; non-alcoholic fatty liver disease (NAFLD); mouse model; steatosis; tobacco smoke; transcriptome 1. Introduction Non-alcoholic fatty liver disease (NAFLD) is one of the most prevalent forms of chronic liver disorders worldwide [1,2]. The incidence of NAFLD is rising in many parts of the world, especially in developed countries [3]. In the United States alone, between 30% and 40% of the adult population is affected with NAFLD [3]. Among children and adolescents, NAFLD is currently the primary form of liver disease; it is estimated that nearly 10% of the US population aged between 2 and 19 has NAFLD [4]. NAFLD has been associated with insulin resistance and metabolic syndrome—a cluster
-
Upload
khangminh22 -
Category
Documents
-
view
0 -
download
0
Transcript of Secondhand Smoke Induces Liver Steatosis through ... - MDPI
Int. J. Mol. Sci. 2020, 21, 1296; doi:10.3390/ijms21041296 www.mdpi.com/journal/ijms
Article
Secondhand Smoke Induces Liver Steatosis through Deregulation of Genes Involved in Hepatic Lipid Metabolism Stella Tommasi 1,*, Jae-In Yoon 2,† and Ahmad Besaratinia 1
1 Department of Preventive Medicine, USC Keck School of Medicine, University of Southern California, Los Angeles, CA 90033, USA; [email protected]
2 Department of Cancer Biology, Beckman Research Institute of the City of Hope, Duarte, CA 91010, USA; [email protected]
* Correspondence: [email protected]; Tel:. +1-(323)-442-7753 † Current address: HANDOK, 132, Teheran-ro, Gangnam-gu, Seoul 06235, Korea
Received: 14 January 2020; Accepted: 13 February 2020; Published: 14 February 2020
Abstract: We investigated the role of secondhand smoke (SHS) exposure, independently of diet, in the development of chronic liver disease. Standard diet-fed mice were exposed to SHS (5 h/day, 5 days/week for 4 months). Genome-wide gene expression analysis, together with molecular pathways and gene network analyses, and histological examination for lipid accumulation, inflammation, fibrosis, and glycogen deposition were performed on the liver of SHS-exposed mice and controls, upon termination of exposure and after one-month recovery in clean air. Aberrantly expressed transcripts were found in the liver of SHS-exposed mice both pre- and post-recovery in clean air (n = 473 vs. 222). The persistent deregulated transcripts (n = 210) predominantly affected genes and functional networks involved in lipid metabolism as well as in the regulation of the endoplasmic reticulum where manufacturing of lipids occurs. Significant hepatic fat accumulation (steatosis) was observed in the SHS-exposed mice, which progressively increased as the animals underwent recovery in clean air. Moderate increases in lobular inflammation infiltrates and collagen deposition as well as loss of glycogen were also detectable in the liver of SHS-exposed mice. A more pronounced phenotype, manifested as a disrupted cord-like architecture with foci of necrosis, apoptosis, inflammation, and macrovesicular steatosis, was observed in the liver of SHS-exposed mice post-recovery. The progressive accumulation of hepatic fat and other adverse histological changes in the SHS-exposed mice are highly consistent with the perturbation of key lipid genes and associated pathways in the corresponding animals. Our data support a role for SHS in the genesis and progression of metabolic liver disease through deregulation of genes and molecular pathways and functional networks involved in lipid homeostasis.
Keywords: gene regulation; non-alcoholic fatty liver disease (NAFLD); mouse model; steatosis; tobacco smoke; transcriptome
1. Introduction
Non-alcoholic fatty liver disease (NAFLD) is one of the most prevalent forms of chronic liver disorders worldwide [1,2]. The incidence of NAFLD is rising in many parts of the world, especially in developed countries [3]. In the United States alone, between 30% and 40% of the adult population is affected with NAFLD [3]. Among children and adolescents, NAFLD is currently the primary form of liver disease; it is estimated that nearly 10% of the US population aged between 2 and 19 has NAFLD [4]. NAFLD has been associated with insulin resistance and metabolic syndrome—a cluster
Int. J. Mol. Sci. 2020, 21, 1296 2 of 21
of conditions consisting of high blood sugar, excess body fat around the waist, and abnormal cholesterol or triglyceride levels—that are key determinants of cardiovascular disease and type 2 diabetes mellitus [1]. Abdominal obesity is a common feature of patients with NAFLD; in obese individuals, the prevalence of NAFLD can exceed 95% [5]. As the epidemic of obesity continues to grow worldwide, so does the prevalence of NAFLD [5].
NAFLD is characterized by the accumulation of fat droplets within the liver cells, a condition known as hepatic ‘steatosis’ [6]. Retention of lipids within the cells reflects an impairment of the normal process of synthesis and elimination of fat, primarily triglycerides [6]. Buildup of excess lipids within the cells manifests as the accumulation of vesicles that can displace the nucleus, disrupt cell constituents and, in severe cases, lead to cell rupture/burst [7]. Non-diagnosed and untreated NAFLD can progress from benign steatosis and fatty liver to more permanent and severe liver injury, including non-alcoholic steatohepatitis (NASH) with inflammation and variable fibrosis, cirrhosis, and eventually hepatocellular carcinoma [8].
Although distinct risk factors for NAFLD have been identified, the exact cause(s) of this disease and the underlying mechanisms of its initiation and progression remain unknown. Accumulating evidence shows that exposure to environmental toxicants, including secondhand smoke (SHS), contributes to the development of NAFLD by promoting mitochondrial dysfunction and oxidative stress within the hepatocytes [9–12]. Several studies have shown that cigarette smoking is an independent risk factor for the onset of NAFLD [13–16], and significantly associated with increased intrahepatic fat [17] and advanced liver fibrosis [18,19]. Survey based reports have also shown an association between exposure to SHS and development of NAFLD in children [20,21] and in never-smoking women [22]. A more recent systematic review and meta-analysis established that SHS increases the risk of NAFLD approximately 1.38 times [23]. Animal studies have also provided support for a potential role of SHS in the genesis and progression of NAFLD [24–26]. Yuan et al. [26] have shown that subchronic exposure of mice to SHS stimulates hepatic fatty acids synthesis by modulating two key regulators of lipid metabolism, including AMP-activated protein kinase (AMPK) and sterol regulatory element binding protein-1c (SREBP-1c). The SHS-exposed mice in the Yuan et al. study developed hepatic steatosis, which—as the authors inferred—would lead to NAFLD development [26]. De la Monte et al. [25] have demonstrated that A/J mice exposed to SHS exhibit progressive liver injury and steatohepatitis, with impairments in hepatic insulin and insulin-like growth factor (IGF) signaling. Azzalini et al. [24] have shown that nose-only exposure of Zucker ‘obese’ rats to cigarette smoke, mimicking SHS exposure, worsens the histological severity of NAFLD, increases the burden of oxidative stress, and induces hepatocellular apoptosis [24,27].
Although informative, most animal studies investigating the role of SHS exposure in the development of NAFLD have been conducted in rodents fed with high-fat diets that contain cholate, a known cause of liver inflammation and dysfunction [28]. As a result, the role of SHS exposure, independently of diet, in the genesis of NAFLD is not delineated. In addition, the above studies are limited in scope, as they have focused on the analysis of ‘select’ target genes. Therefore, a comprehensive study interrogating the whole transcriptome is needed to establish the global effects of SHS on the regulation of genes that govern NAFLD development. Towards this end, we have constructed the whole hepatic transcriptome in relation to liver histology in ‘standard diet-fed’ mice subchronically exposed to SHS according to our published protocol [29–32]. More specifically, we have investigated the relationship between global regulation of genes and molecular pathways and gene networks and histological changes indicative of liver injury and hepatic steatosis (i.e., lipid accumulation, inflammation, fibrosis, and glycogen deposition) in the SHS-exposed mice both upon cessation of exposure and after one-month recovery in clean air.
2. Results
2.1. Genome-Wide Gene Expression Changes in the Liver of Secondhand Smoke (SHS)-Exposed Mice
As shown in Figure 1A, subchronic exposure of mice to SHS elicited a significant transcriptomic response, as reflected by the large number of aberrantly expressed transcripts in the SHS-exposed
Int. J. Mol. Sci. 2020, 21, 1296 3 of 21
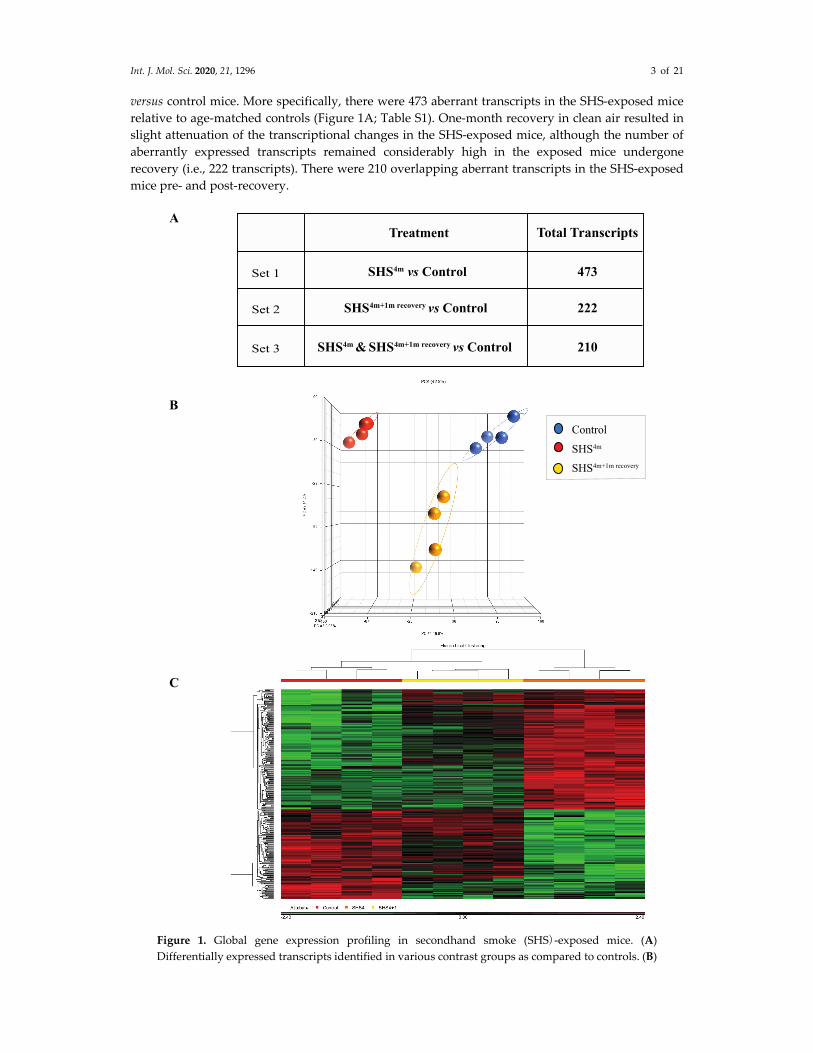
versus control mice. More specifically, there were 473 aberrant transcripts in the SHS-exposed mice relative to age-matched controls (Figure 1A; Table S1). One-month recovery in clean air resulted in slight attenuation of the transcriptional changes in the SHS-exposed mice, although the number of aberrantly expressed transcripts remained considerably high in the exposed mice undergone recovery (i.e., 222 transcripts). There were 210 overlapping aberrant transcripts in the SHS-exposed mice pre- and post-recovery.
Figure 1. Global gene expression profiling in secondhand smoke (SHS)-exposed mice. (A) Differentially expressed transcripts identified in various contrast groups as compared to controls. (B)
Control
SHS4m+1m recovery
SHS4m
B
C
ATreatment Total Transcripts
SHS4m+1m recovery vs Control
SHS4m vs Control
SHS4m & SHS4m+1m recovery vs Control
473
210
222
Set 1
Set 3
Set 2
Int. J. Mol. Sci. 2020, 21, 1296 4 of 21
Principal component analysis (PCA) and (C) hierarchical clustering analysis by Partek® GS® confirmed clustering of the datasets from mice belonging to the same experimental or control group.
Principal component analysis (PCA) and hierarchical clustering analysis in Partek GS® showed clustering of the datasets from mice belonging to the same experimental or control groups, which confirms a uniform gene expression pattern within each experimental/control group (Figure 1B,C). Compiled lists of differentially expressed transcripts in experimental groups relative to controls are shown in Table S1. The lists identify both common and unique deregulated genes in the SHS-exposed mice before and after one-month recovery. Overall, there was a high degree of overlap between differentially expressed genes in the SHS-exposed mice before and after recovery in clean air (Figure 1A; Table S1).
2.2. Modulation of Functional Networks and Biological Pathways in SHS-Exposed Mice
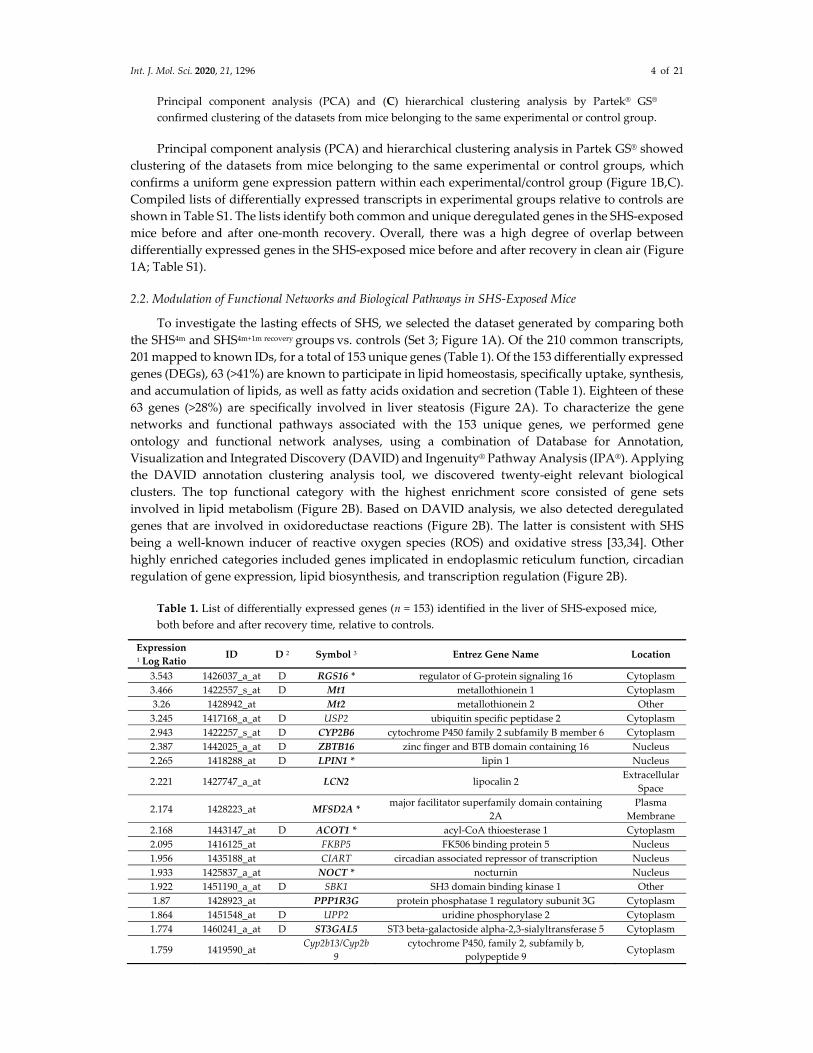
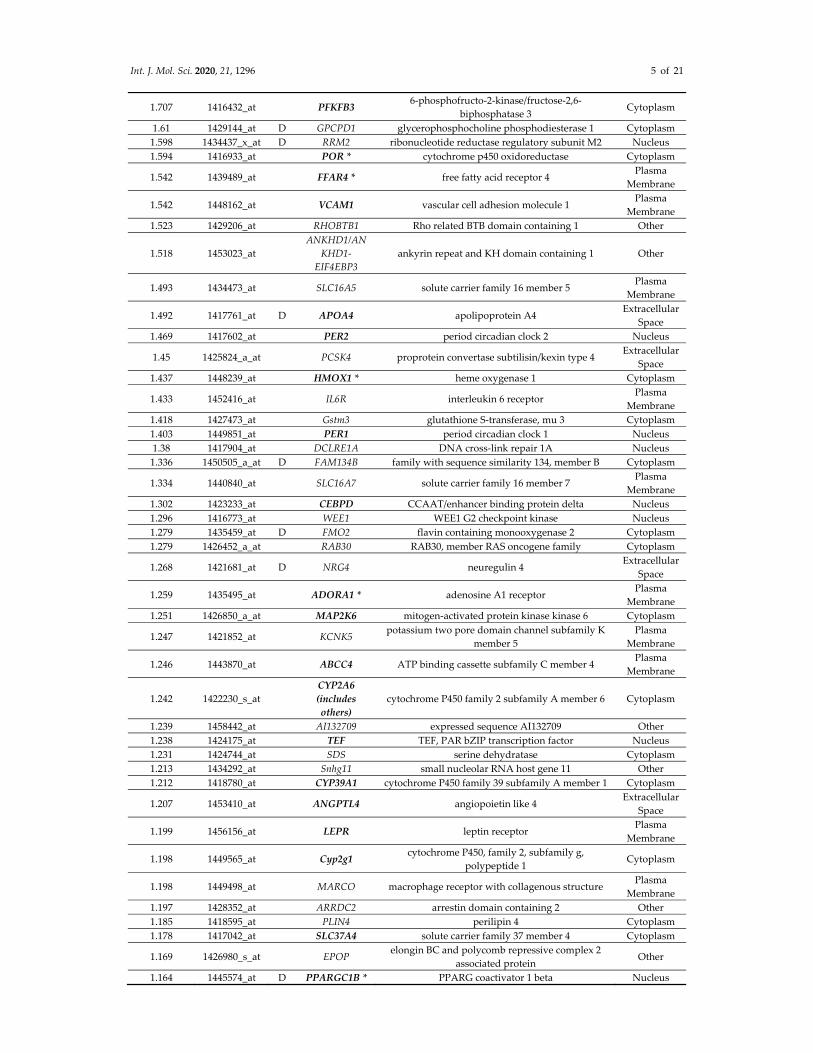
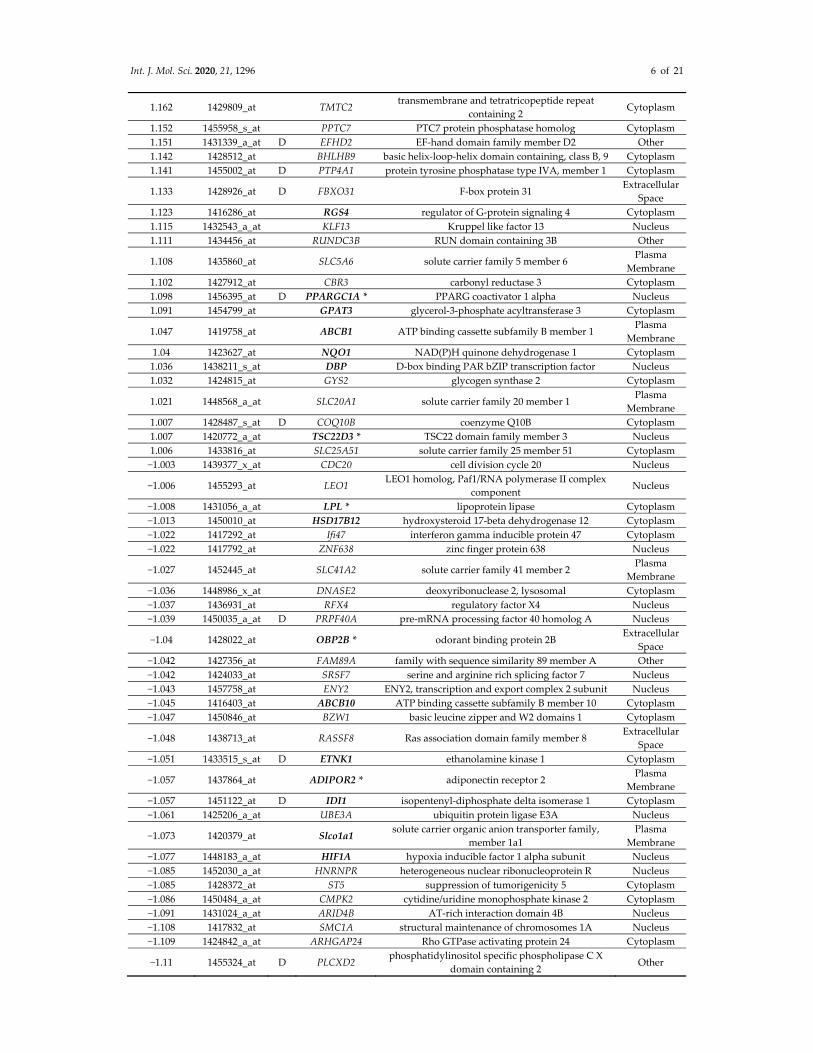
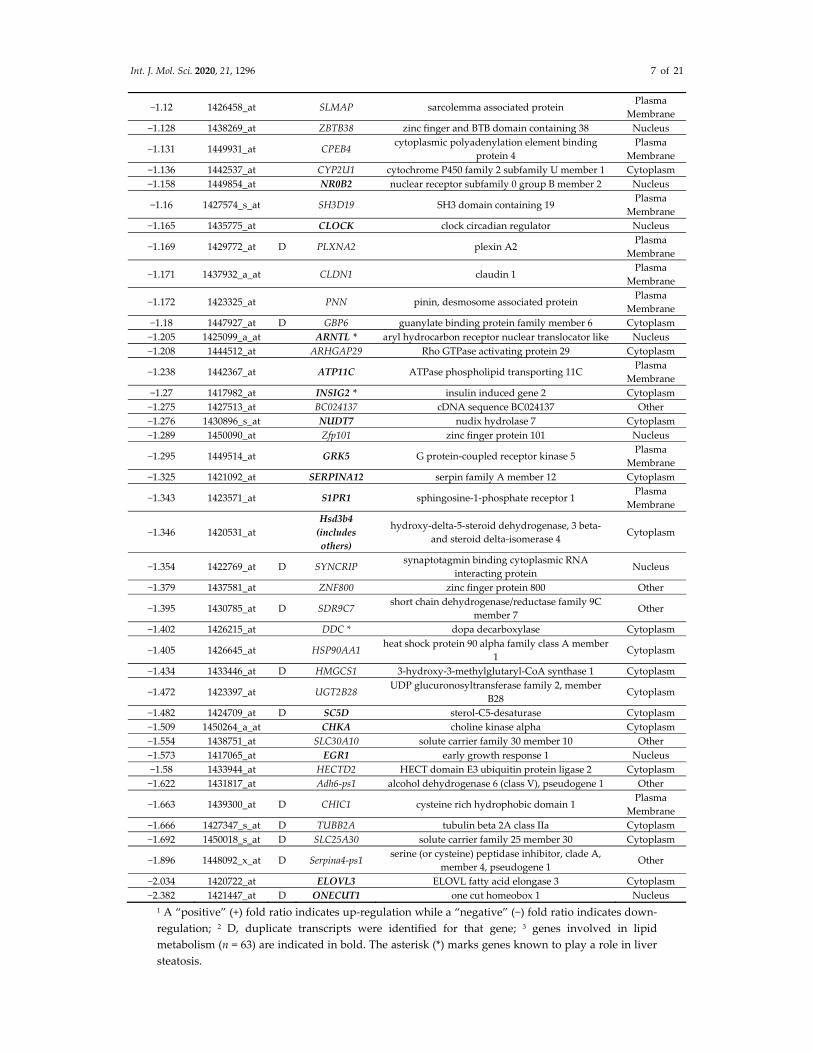
To investigate the lasting effects of SHS, we selected the dataset generated by comparing both the SHS4m and SHS4m+1m recovery groups vs. controls (Set 3; Figure 1A). Of the 210 common transcripts, 201 mapped to known IDs, for a total of 153 unique genes (Table 1). Of the 153 differentially expressed genes (DEGs), 63 (>41%) are known to participate in lipid homeostasis, specifically uptake, synthesis, and accumulation of lipids, as well as fatty acids oxidation and secretion (Table 1). Eighteen of these 63 genes (>28%) are specifically involved in liver steatosis (Figure 2A). To characterize the gene networks and functional pathways associated with the 153 unique genes, we performed gene ontology and functional network analyses, using a combination of Database for Annotation, Visualization and Integrated Discovery (DAVID) and Ingenuity® Pathway Analysis (IPA®). Applying the DAVID annotation clustering analysis tool, we discovered twenty-eight relevant biological clusters. The top functional category with the highest enrichment score consisted of gene sets involved in lipid metabolism (Figure 2B). Based on DAVID analysis, we also detected deregulated genes that are involved in oxidoreductase reactions (Figure 2B). The latter is consistent with SHS being a well-known inducer of reactive oxygen species (ROS) and oxidative stress [33,34]. Other highly enriched categories included genes implicated in endoplasmic reticulum function, circadian regulation of gene expression, lipid biosynthesis, and transcription regulation (Figure 2B).
Table 1. List of differentially expressed genes (n = 153) identified in the liver of SHS-exposed mice, both before and after recovery time, relative to controls.
Expression 1 Log Ratio
ID D 2 Symbol 3 Entrez Gene Name Location
3.543 1426037_a_at D RGS16 * regulator of G-protein signaling 16 Cytoplasm 3.466 1422557_s_at D Mt1 metallothionein 1 Cytoplasm 3.26 1428942_at Mt2 metallothionein 2 Other 3.245 1417168_a_at D USP2 ubiquitin specific peptidase 2 Cytoplasm 2.943 1422257_s_at D CYP2B6 cytochrome P450 family 2 subfamily B member 6 Cytoplasm 2.387 1442025_a_at D ZBTB16 zinc finger and BTB domain containing 16 Nucleus 2.265 1418288_at D LPIN1 * lipin 1 Nucleus
2.221 1427747_a_at LCN2 lipocalin 2 Extracellular
Space
2.174 1428223_at MFSD2A * major facilitator superfamily domain containing
2A Plasma
Membrane 2.168 1443147_at D ACOT1 * acyl-CoA thioesterase 1 Cytoplasm 2.095 1416125_at FKBP5 FK506 binding protein 5 Nucleus 1.956 1435188_at CIART circadian associated repressor of transcription Nucleus 1.933 1425837_a_at NOCT * nocturnin Nucleus 1.922 1451190_a_at D SBK1 SH3 domain binding kinase 1 Other 1.87 1428923_at PPP1R3G protein phosphatase 1 regulatory subunit 3G Cytoplasm 1.864 1451548_at D UPP2 uridine phosphorylase 2 Cytoplasm 1.774 1460241_a_at D ST3GAL5 ST3 beta-galactoside alpha-2,3-sialyltransferase 5 Cytoplasm
1.759 1419590_at Cyp2b13/Cyp2b
9 cytochrome P450, family 2, subfamily b,
polypeptide 9 Cytoplasm
Int. J. Mol. Sci. 2020, 21, 1296 5 of 21
1.707 1416432_at PFKFB3 6-phosphofructo-2-kinase/fructose-2,6-
biphosphatase 3 Cytoplasm
1.61 1429144_at D GPCPD1 glycerophosphocholine phosphodiesterase 1 Cytoplasm 1.598 1434437_x_at D RRM2 ribonucleotide reductase regulatory subunit M2 Nucleus 1.594 1416933_at POR * cytochrome p450 oxidoreductase Cytoplasm
1.542 1439489_at FFAR4 * free fatty acid receptor 4 Plasma
Membrane
1.542 1448162_at VCAM1 vascular cell adhesion molecule 1 Plasma
Membrane 1.523 1429206_at RHOBTB1 Rho related BTB domain containing 1 Other
1.518 1453023_at ANKHD1/AN
KHD1-EIF4EBP3
ankyrin repeat and KH domain containing 1 Other
1.493 1434473_at SLC16A5 solute carrier family 16 member 5 Plasma
Membrane
1.492 1417761_at D APOA4 apolipoprotein A4 Extracellular
Space 1.469 1417602_at PER2 period circadian clock 2 Nucleus
1.45 1425824_a_at PCSK4 proprotein convertase subtilisin/kexin type 4 Extracellular
Space 1.437 1448239_at HMOX1 * heme oxygenase 1 Cytoplasm
1.433 1452416_at IL6R interleukin 6 receptor Plasma
Membrane 1.418 1427473_at Gstm3 glutathione S-transferase, mu 3 Cytoplasm 1.403 1449851_at PER1 period circadian clock 1 Nucleus 1.38 1417904_at DCLRE1A DNA cross-link repair 1A Nucleus 1.336 1450505_a_at D FAM134B family with sequence similarity 134, member B Cytoplasm
1.334 1440840_at SLC16A7 solute carrier family 16 member 7 Plasma
Membrane 1.302 1423233_at CEBPD CCAAT/enhancer binding protein delta Nucleus 1.296 1416773_at WEE1 WEE1 G2 checkpoint kinase Nucleus 1.279 1435459_at D FMO2 flavin containing monooxygenase 2 Cytoplasm 1.279 1426452_a_at RAB30 RAB30, member RAS oncogene family Cytoplasm
1.268 1421681_at D NRG4 neuregulin 4 Extracellular
Space
1.259 1435495_at ADORA1 * adenosine A1 receptor Plasma
Membrane 1.251 1426850_a_at MAP2K6 mitogen-activated protein kinase kinase 6 Cytoplasm
1.247 1421852_at KCNK5 potassium two pore domain channel subfamily K member 5
Plasma Membrane
1.246 1443870_at ABCC4 ATP binding cassette subfamily C member 4 Plasma
Membrane
1.242 1422230_s_at CYP2A6 (includes others)
cytochrome P450 family 2 subfamily A member 6 Cytoplasm
1.239 1458442_at AI132709 expressed sequence AI132709 Other 1.238 1424175_at TEF TEF, PAR bZIP transcription factor Nucleus 1.231 1424744_at SDS serine dehydratase Cytoplasm 1.213 1434292_at Snhg11 small nucleolar RNA host gene 11 Other 1.212 1418780_at CYP39A1 cytochrome P450 family 39 subfamily A member 1 Cytoplasm
1.207 1453410_at ANGPTL4 angiopoietin like 4 Extracellular
Space
1.199 1456156_at LEPR leptin receptor Plasma
Membrane
1.198 1449565_at Cyp2g1 cytochrome P450, family 2, subfamily g,
polypeptide 1 Cytoplasm
1.198 1449498_at MARCO macrophage receptor with collagenous structure Plasma
Membrane 1.197 1428352_at ARRDC2 arrestin domain containing 2 Other 1.185 1418595_at PLIN4 perilipin 4 Cytoplasm 1.178 1417042_at SLC37A4 solute carrier family 37 member 4 Cytoplasm
1.169 1426980_s_at EPOP elongin BC and polycomb repressive complex 2 associated protein
Other
1.164 1445574_at D PPARGC1B * PPARG coactivator 1 beta Nucleus
Int. J. Mol. Sci. 2020, 21, 1296 6 of 21
1.162 1429809_at TMTC2 transmembrane and tetratricopeptide repeat
containing 2 Cytoplasm
1.152 1455958_s_at PPTC7 PTC7 protein phosphatase homolog Cytoplasm 1.151 1431339_a_at D EFHD2 EF-hand domain family member D2 Other 1.142 1428512_at BHLHB9 basic helix-loop-helix domain containing, class B, 9 Cytoplasm 1.141 1455002_at D PTP4A1 protein tyrosine phosphatase type IVA, member 1 Cytoplasm
1.133 1428926_at D FBXO31 F-box protein 31 Extracellular
Space 1.123 1416286_at RGS4 regulator of G-protein signaling 4 Cytoplasm 1.115 1432543_a_at KLF13 Kruppel like factor 13 Nucleus 1.111 1434456_at RUNDC3B RUN domain containing 3B Other
1.108 1435860_at SLC5A6 solute carrier family 5 member 6 Plasma
Membrane 1.102 1427912_at CBR3 carbonyl reductase 3 Cytoplasm 1.098 1456395_at D PPARGC1A * PPARG coactivator 1 alpha Nucleus 1.091 1454799_at GPAT3 glycerol-3-phosphate acyltransferase 3 Cytoplasm
1.047 1419758_at ABCB1 ATP binding cassette subfamily B member 1 Plasma
Membrane 1.04 1423627_at NQO1 NAD(P)H quinone dehydrogenase 1 Cytoplasm 1.036 1438211_s_at DBP D-box binding PAR bZIP transcription factor Nucleus 1.032 1424815_at GYS2 glycogen synthase 2 Cytoplasm
1.021 1448568_a_at SLC20A1 solute carrier family 20 member 1 Plasma
Membrane 1.007 1428487_s_at D COQ10B coenzyme Q10B Cytoplasm 1.007 1420772_a_at TSC22D3 * TSC22 domain family member 3 Nucleus 1.006 1433816_at SLC25A51 solute carrier family 25 member 51 Cytoplasm −1.003 1439377_x_at CDC20 cell division cycle 20 Nucleus
−1.006 1455293_at LEO1 LEO1 homolog, Paf1/RNA polymerase II complex component
Nucleus
−1.008 1431056_a_at LPL * lipoprotein lipase Cytoplasm −1.013 1450010_at HSD17B12 hydroxysteroid 17-beta dehydrogenase 12 Cytoplasm −1.022 1417292_at Ifi47 interferon gamma inducible protein 47 Cytoplasm −1.022 1417792_at ZNF638 zinc finger protein 638 Nucleus
−1.027 1452445_at SLC41A2 solute carrier family 41 member 2 Plasma
Membrane −1.036 1448986_x_at DNASE2 deoxyribonuclease 2, lysosomal Cytoplasm −1.037 1436931_at RFX4 regulatory factor X4 Nucleus −1.039 1450035_a_at D PRPF40A pre-mRNA processing factor 40 homolog A Nucleus
−1.04 1428022_at OBP2B * odorant binding protein 2B Extracellular
Space −1.042 1427356_at FAM89A family with sequence similarity 89 member A Other −1.042 1424033_at SRSF7 serine and arginine rich splicing factor 7 Nucleus −1.043 1457758_at ENY2 ENY2, transcription and export complex 2 subunit Nucleus −1.045 1416403_at ABCB10 ATP binding cassette subfamily B member 10 Cytoplasm −1.047 1450846_at BZW1 basic leucine zipper and W2 domains 1 Cytoplasm
−1.048 1438713_at RASSF8 Ras association domain family member 8 Extracellular
Space −1.051 1433515_s_at D ETNK1 ethanolamine kinase 1 Cytoplasm
−1.057 1437864_at ADIPOR2 * adiponectin receptor 2 Plasma
Membrane −1.057 1451122_at D IDI1 isopentenyl-diphosphate delta isomerase 1 Cytoplasm −1.061 1425206_a_at UBE3A ubiquitin protein ligase E3A Nucleus
−1.073 1420379_at Slco1a1 solute carrier organic anion transporter family,
member 1a1 Plasma
Membrane −1.077 1448183_a_at HIF1A hypoxia inducible factor 1 alpha subunit Nucleus −1.085 1452030_a_at HNRNPR heterogeneous nuclear ribonucleoprotein R Nucleus −1.085 1428372_at ST5 suppression of tumorigenicity 5 Cytoplasm −1.086 1450484_a_at CMPK2 cytidine/uridine monophosphate kinase 2 Cytoplasm −1.091 1431024_a_at ARID4B AT-rich interaction domain 4B Nucleus −1.108 1417832_at SMC1A structural maintenance of chromosomes 1A Nucleus −1.109 1424842_a_at ARHGAP24 Rho GTPase activating protein 24 Cytoplasm
−1.11 1455324_at D PLCXD2 phosphatidylinositol specific phospholipase C X
domain containing 2 Other
Int. J. Mol. Sci. 2020, 21, 1296 7 of 21
−1.12 1426458_at SLMAP sarcolemma associated protein Plasma
Membrane −1.128 1438269_at ZBTB38 zinc finger and BTB domain containing 38 Nucleus
−1.131 1449931_at CPEB4 cytoplasmic polyadenylation element binding
protein 4 Plasma
Membrane −1.136 1442537_at CYP2U1 cytochrome P450 family 2 subfamily U member 1 Cytoplasm −1.158 1449854_at NR0B2 nuclear receptor subfamily 0 group B member 2 Nucleus
−1.16 1427574_s_at SH3D19 SH3 domain containing 19 Plasma
Membrane −1.165 1435775_at CLOCK clock circadian regulator Nucleus
−1.169 1429772_at D PLXNA2 plexin A2 Plasma
Membrane
−1.171 1437932_a_at CLDN1 claudin 1 Plasma
Membrane
−1.172 1423325_at PNN pinin, desmosome associated protein Plasma
Membrane −1.18 1447927_at D GBP6 guanylate binding protein family member 6 Cytoplasm −1.205 1425099_a_at ARNTL * aryl hydrocarbon receptor nuclear translocator like Nucleus −1.208 1444512_at ARHGAP29 Rho GTPase activating protein 29 Cytoplasm
−1.238 1442367_at ATP11C ATPase phospholipid transporting 11C Plasma
Membrane −1.27 1417982_at INSIG2 * insulin induced gene 2 Cytoplasm −1.275 1427513_at BC024137 cDNA sequence BC024137 Other −1.276 1430896_s_at NUDT7 nudix hydrolase 7 Cytoplasm −1.289 1450090_at Zfp101 zinc finger protein 101 Nucleus
−1.295 1449514_at GRK5 G protein-coupled receptor kinase 5 Plasma
Membrane −1.325 1421092_at SERPINA12 serpin family A member 12 Cytoplasm
−1.343 1423571_at S1PR1 sphingosine-1-phosphate receptor 1 Plasma
Membrane
−1.346 1420531_at Hsd3b4
(includes others)
hydroxy-delta-5-steroid dehydrogenase, 3 beta- and steroid delta-isomerase 4
Cytoplasm
−1.354 1422769_at D SYNCRIP synaptotagmin binding cytoplasmic RNA
interacting protein Nucleus
−1.379 1437581_at ZNF800 zinc finger protein 800 Other
−1.395 1430785_at D SDR9C7 short chain dehydrogenase/reductase family 9C
member 7 Other
−1.402 1426215_at DDC * dopa decarboxylase Cytoplasm
−1.405 1426645_at HSP90AA1 heat shock protein 90 alpha family class A member 1
Cytoplasm
−1.434 1433446_at D HMGCS1 3-hydroxy-3-methylglutaryl-CoA synthase 1 Cytoplasm
−1.472 1423397_at UGT2B28 UDP glucuronosyltransferase family 2, member
B28 Cytoplasm
−1.482 1424709_at D SC5D sterol-C5-desaturase Cytoplasm −1.509 1450264_a_at CHKA choline kinase alpha Cytoplasm −1.554 1438751_at SLC30A10 solute carrier family 30 member 10 Other −1.573 1417065_at EGR1 early growth response 1 Nucleus −1.58 1433944_at HECTD2 HECT domain E3 ubiquitin protein ligase 2 Cytoplasm −1.622 1431817_at Adh6-ps1 alcohol dehydrogenase 6 (class V), pseudogene 1 Other
−1.663 1439300_at D CHIC1 cysteine rich hydrophobic domain 1 Plasma
Membrane −1.666 1427347_s_at D TUBB2A tubulin beta 2A class IIa Cytoplasm −1.692 1450018_s_at D SLC25A30 solute carrier family 25 member 30 Cytoplasm
−1.896 1448092_x_at D Serpina4-ps1 serine (or cysteine) peptidase inhibitor, clade A, member 4, pseudogene 1
Other
−2.034 1420722_at ELOVL3 ELOVL fatty acid elongase 3 Cytoplasm −2.382 1421447_at D ONECUT1 one cut homeobox 1 Nucleus
1 A “positive” (+) fold ratio indicates up-regulation while a “negative” (−) fold ratio indicates down-regulation; 2 D, duplicate transcripts were identified for that gene; 3 genes involved in lipid metabolism (n = 63) are indicated in bold. The asterisk (*) marks genes known to play a role in liver steatosis.
Int. J. Mol. Sci. 2020, 21, 1296 8 of 21
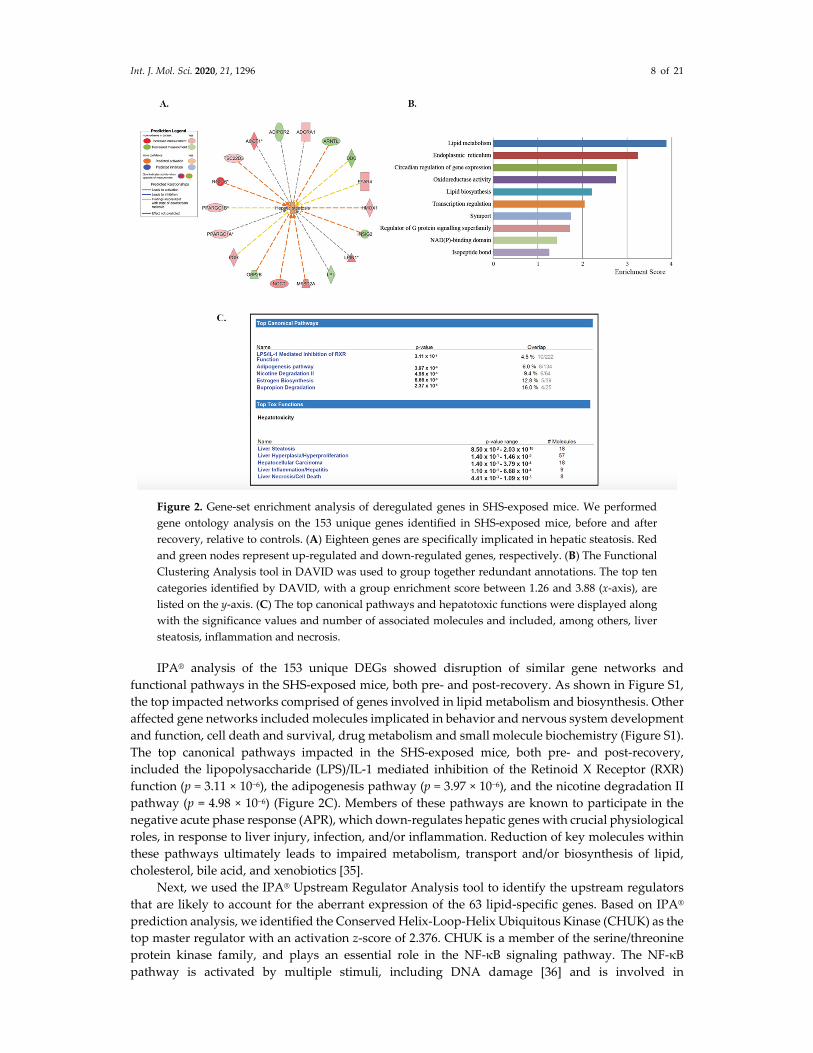
Figure 2. Gene-set enrichment analysis of deregulated genes in SHS-exposed mice. We performed gene ontology analysis on the 153 unique genes identified in SHS-exposed mice, before and after recovery, relative to controls. (A) Eighteen genes are specifically implicated in hepatic steatosis. Red and green nodes represent up-regulated and down-regulated genes, respectively. (B) The Functional Clustering Analysis tool in DAVID was used to group together redundant annotations. The top ten categories identified by DAVID, with a group enrichment score between 1.26 and 3.88 (x-axis), are listed on the y-axis. (C) The top canonical pathways and hepatotoxic functions were displayed along with the significance values and number of associated molecules and included, among others, liver steatosis, inflammation and necrosis.
IPA® analysis of the 153 unique DEGs showed disruption of similar gene networks and functional pathways in the SHS-exposed mice, both pre- and post-recovery. As shown in Figure S1, the top impacted networks comprised of genes involved in lipid metabolism and biosynthesis. Other affected gene networks included molecules implicated in behavior and nervous system development and function, cell death and survival, drug metabolism and small molecule biochemistry (Figure S1). The top canonical pathways impacted in the SHS-exposed mice, both pre- and post-recovery, included the lipopolysaccharide (LPS)/IL-1 mediated inhibition of the Retinoid X Receptor (RXR) function (p = 3.11 × 10⁻⁶), the adipogenesis pathway (p = 3.97 × 10⁻⁶), and the nicotine degradation II pathway (p = 4.98 × 10⁻⁶) (Figure 2C). Members of these pathways are known to participate in the negative acute phase response (APR), which down-regulates hepatic genes with crucial physiological roles, in response to liver injury, infection, and/or inflammation. Reduction of key molecules within these pathways ultimately leads to impaired metabolism, transport and/or biosynthesis of lipid, cholesterol, bile acid, and xenobiotics [35].
Next, we used the IPA® Upstream Regulator Analysis tool to identify the upstream regulators that are likely to account for the aberrant expression of the 63 lipid-specific genes. Based on IPA® prediction analysis, we identified the Conserved Helix-Loop-Helix Ubiquitous Kinase (CHUK) as the top master regulator with an activation z-score of 2.376. CHUK is a member of the serine/threonine protein kinase family, and plays an essential role in the NF-κB signaling pathway. The NF-κB pathway is activated by multiple stimuli, including DNA damage [36] and is involved in
Int. J. Mol. Sci. 2020, 21, 1296 9 of 21
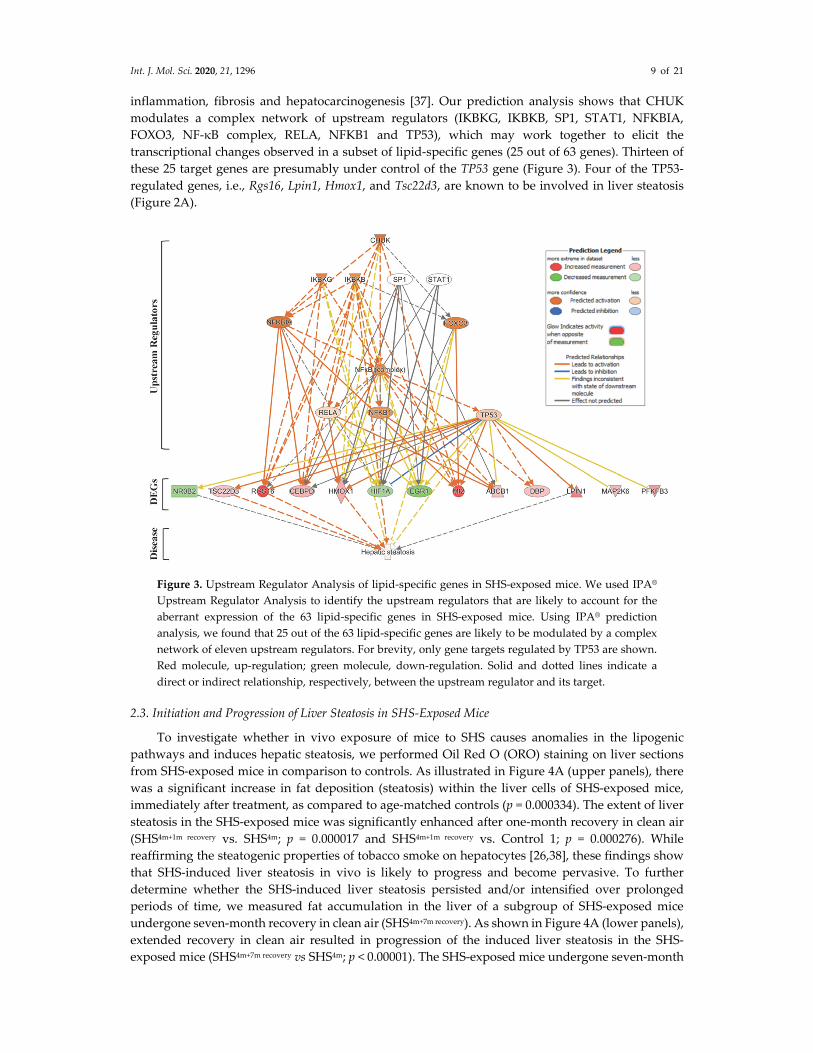
inflammation, fibrosis and hepatocarcinogenesis [37]. Our prediction analysis shows that CHUK modulates a complex network of upstream regulators (IKBKG, IKBKB, SP1, STAT1, NFKBIA, FOXO3, NF-κB complex, RELA, NFKB1 and TP53), which may work together to elicit the transcriptional changes observed in a subset of lipid-specific genes (25 out of 63 genes). Thirteen of these 25 target genes are presumably under control of the TP53 gene (Figure 3). Four of the TP53-regulated genes, i.e., Rgs16, Lpin1, Hmox1, and Tsc22d3, are known to be involved in liver steatosis (Figure 2A).
Figure 3. Upstream Regulator Analysis of lipid-specific genes in SHS-exposed mice. We used IPA® Upstream Regulator Analysis to identify the upstream regulators that are likely to account for the aberrant expression of the 63 lipid-specific genes in SHS-exposed mice. Using IPA® prediction analysis, we found that 25 out of the 63 lipid-specific genes are likely to be modulated by a complex network of eleven upstream regulators. For brevity, only gene targets regulated by TP53 are shown. Red molecule, up-regulation; green molecule, down-regulation. Solid and dotted lines indicate a direct or indirect relationship, respectively, between the upstream regulator and its target.
2.3. Initiation and Progression of Liver Steatosis in SHS-Exposed Mice
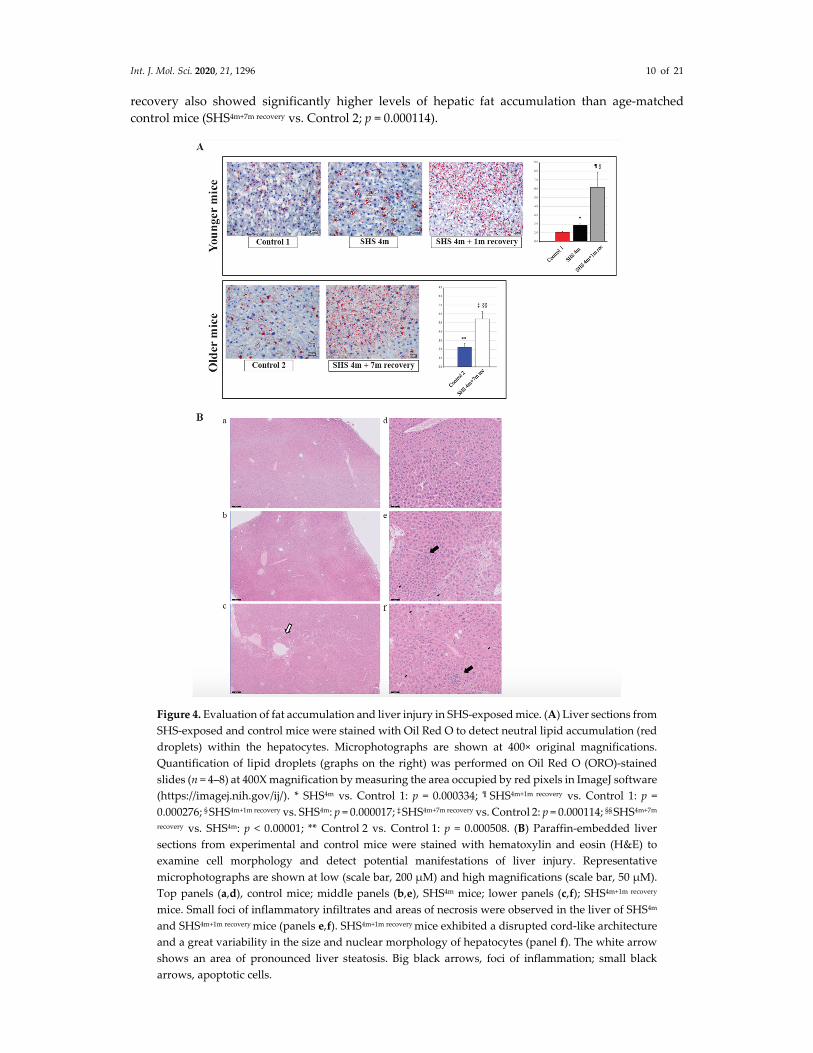
To investigate whether in vivo exposure of mice to SHS causes anomalies in the lipogenic pathways and induces hepatic steatosis, we performed Oil Red O (ORO) staining on liver sections from SHS-exposed mice in comparison to controls. As illustrated in Figure 4A (upper panels), there was a significant increase in fat deposition (steatosis) within the liver cells of SHS-exposed mice, immediately after treatment, as compared to age-matched controls (p = 0.000334). The extent of liver steatosis in the SHS-exposed mice was significantly enhanced after one-month recovery in clean air (SHS4m+1m recovery vs. SHS4m; p = 0.000017 and SHS4m+1m recovery vs. Control 1; p = 0.000276). While reaffirming the steatogenic properties of tobacco smoke on hepatocytes [26,38], these findings show that SHS-induced liver steatosis in vivo is likely to progress and become pervasive. To further determine whether the SHS-induced liver steatosis persisted and/or intensified over prolonged periods of time, we measured fat accumulation in the liver of a subgroup of SHS-exposed mice undergone seven-month recovery in clean air (SHS4m+7m recovery). As shown in Figure 4A (lower panels), extended recovery in clean air resulted in progression of the induced liver steatosis in the SHS-exposed mice (SHS4m+7m recovery vs SHS4m; p < 0.00001). The SHS-exposed mice undergone seven-month
Int. J. Mol. Sci. 2020, 21, 1296 10 of 21
recovery also showed significantly higher levels of hepatic fat accumulation than age-matched control mice (SHS4m+7m recovery vs. Control 2; p = 0.000114).
Figure 4. Evaluation of fat accumulation and liver injury in SHS-exposed mice. (A) Liver sections from SHS-exposed and control mice were stained with Oil Red O to detect neutral lipid accumulation (red droplets) within the hepatocytes. Microphotographs are shown at 400× original magnifications. Quantification of lipid droplets (graphs on the right) was performed on Oil Red O (ORO)-stained slides (n = 4–8) at 400X magnification by measuring the area occupied by red pixels in ImageJ software (https://imagej.nih.gov/ij/). * SHS4m vs. Control 1: p = 0.000334; ¶ SHS4m+1m recovery vs. Control 1: p = 0.000276; § SHS4m+1m recovery vs. SHS4m: p = 0.000017; ‡ SHS4m+7m recovery vs. Control 2: p = 0.000114; §§ SHS4m+7m
recovery vs. SHS4m: p < 0.00001; ** Control 2 vs. Control 1: p = 0.000508. (B) Paraffin-embedded liver sections from experimental and control mice were stained with hematoxylin and eosin (H&E) to examine cell morphology and detect potential manifestations of liver injury. Representative microphotographs are shown at low (scale bar, 200 μM) and high magnifications (scale bar, 50 μM). Top panels (a,d), control mice; middle panels (b,e), SHS4m mice; lower panels (c,f); SHS4m+1m recovery
mice. Small foci of inflammatory infiltrates and areas of necrosis were observed in the liver of SHS4m and SHS4m+1m recovery mice (panels e,f). SHS4m+1m recovery mice exhibited a disrupted cord-like architecture and a great variability in the size and nuclear morphology of hepatocytes (panel f). The white arrow shows an area of pronounced liver steatosis. Big black arrows, foci of inflammation; small black arrows, apoptotic cells.
Int. J. Mol. Sci. 2020, 21, 1296 11 of 21
Ogrodnik et al. [39] have recently shown that cellular senescence drives age-dependent hepatic fat accumulation and steatosis through induction of mitochondrial dysfunction, which, in turn, reduces fat metabolism. Consistent with the findings of that study, we observed higher levels of fat accumulation in the liver of control older mice than younger mice (Control 2 vs. Control 1; p = 0.000508). Altogether our data indicate that in vivo exposure of mice to SHS not only initiates liver steatosis but also exacerbates age-dependent progression of hepatic fat deposition.
2.4. Histopathological Evaluation of Liver Injury in SHS-Exposed Mice
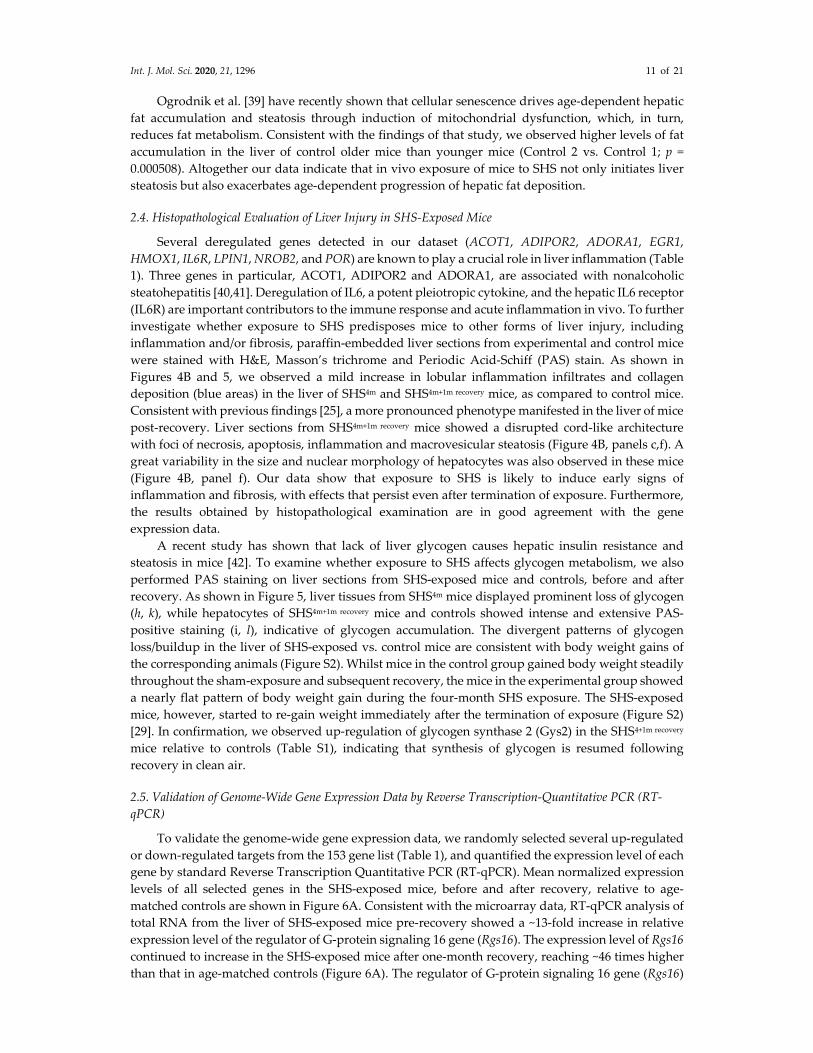
Several deregulated genes detected in our dataset (ACOT1, ADIPOR2, ADORA1, EGR1, HMOX1, IL6R, LPIN1, NROB2, and POR) are known to play a crucial role in liver inflammation (Table 1). Three genes in particular, ACOT1, ADIPOR2 and ADORA1, are associated with nonalcoholic steatohepatitis [40,41]. Deregulation of IL6, a potent pleiotropic cytokine, and the hepatic IL6 receptor (IL6R) are important contributors to the immune response and acute inflammation in vivo. To further investigate whether exposure to SHS predisposes mice to other forms of liver injury, including inflammation and/or fibrosis, paraffin-embedded liver sections from experimental and control mice were stained with H&E, Masson’s trichrome and Periodic Acid-Schiff (PAS) stain. As shown in Figures 4B and 5, we observed a mild increase in lobular inflammation infiltrates and collagen deposition (blue areas) in the liver of SHS4m and SHS4m+1m recovery mice, as compared to control mice. Consistent with previous findings [25], a more pronounced phenotype manifested in the liver of mice post-recovery. Liver sections from SHS4m+1m recovery mice showed a disrupted cord-like architecture with foci of necrosis, apoptosis, inflammation and macrovesicular steatosis (Figure 4B, panels c,f). A great variability in the size and nuclear morphology of hepatocytes was also observed in these mice (Figure 4B, panel f). Our data show that exposure to SHS is likely to induce early signs of inflammation and fibrosis, with effects that persist even after termination of exposure. Furthermore, the results obtained by histopathological examination are in good agreement with the gene expression data.
A recent study has shown that lack of liver glycogen causes hepatic insulin resistance and steatosis in mice [42]. To examine whether exposure to SHS affects glycogen metabolism, we also performed PAS staining on liver sections from SHS-exposed mice and controls, before and after recovery. As shown in Figure 5, liver tissues from SHS4m mice displayed prominent loss of glycogen (h, k), while hepatocytes of SHS4m+1m recovery mice and controls showed intense and extensive PAS-positive staining (i, l), indicative of glycogen accumulation. The divergent patterns of glycogen loss/buildup in the liver of SHS-exposed vs. control mice are consistent with body weight gains of the corresponding animals (Figure S2). Whilst mice in the control group gained body weight steadily throughout the sham-exposure and subsequent recovery, the mice in the experimental group showed a nearly flat pattern of body weight gain during the four-month SHS exposure. The SHS-exposed mice, however, started to re-gain weight immediately after the termination of exposure (Figure S2) [29]. In confirmation, we observed up-regulation of glycogen synthase 2 (Gys2) in the SHS4+1m recovery mice relative to controls (Table S1), indicating that synthesis of glycogen is resumed following recovery in clean air.
2.5. Validation of Genome-Wide Gene Expression Data by Reverse Transcription-Quantitative PCR (RT-qPCR)
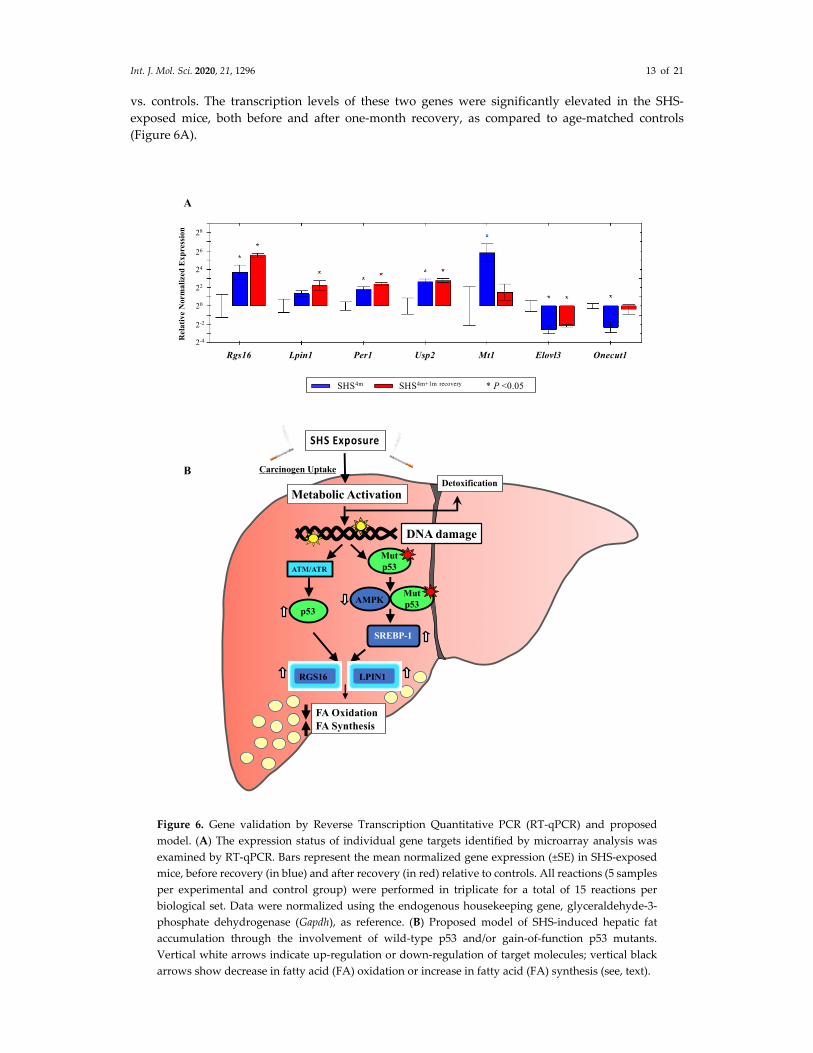
To validate the genome-wide gene expression data, we randomly selected several up-regulated or down-regulated targets from the 153 gene list (Table 1), and quantified the expression level of each gene by standard Reverse Transcription Quantitative PCR (RT-qPCR). Mean normalized expression levels of all selected genes in the SHS-exposed mice, before and after recovery, relative to age-matched controls are shown in Figure 6A. Consistent with the microarray data, RT-qPCR analysis of total RNA from the liver of SHS-exposed mice pre-recovery showed a ~13-fold increase in relative expression level of the regulator of G-protein signaling 16 gene (Rgs16). The expression level of Rgs16 continued to increase in the SHS-exposed mice after one-month recovery, reaching ~46 times higher than that in age-matched controls (Figure 6A). The regulator of G-protein signaling 16 gene (Rgs16)
Int. J. Mol. Sci. 2020, 21, 1296 12 of 21
is a key determinant of lipid metabolism and biosynthesis [43]. RGS16 has been shown to induce hepatic steatosis by inhibiting Gi/Gq-mediated fatty acid oxidation. Transgenic mice specifically expressing RGS16 protein in their hepatocytes have shown to have elevated levels of triglycerides and accumulation of fat deposits in their liver compared to control littermates, while Rgs16 knockout mice have displayed the opposite phenotype [43].
Figure 5. Evaluation of liver fibrosis and glycogen deposition in SHS-exposed mice. Paraffin-embedded liver sections from experimental and control mice were stained with Masson’s trichrome (a–f) and Periodic Acid-Schiff (PAS) stain (g–l) to evaluate fibrosis and glycogen deposition, respectively. Representative microphotographs are shown at low (scale bar, 200 μM) and high magnifications (scale bar, 50 μM). Panels a, d, g, j, control mice; panels b, e, h, k, SHS4m mice; panels c, f, i, l, SHS4m+1m recovery mice. Areas of mild liver fibrosis (blue areas) are increasingly observed in the experimental mice. The white arrow shows an area of pronounced liver steatosis. Black arrows indicated parenchymal invasion of collagen fibers. Prominent loss of glycogen was observed in the liver of SHS4m mice, while SHS4m+1m recovery mice and controls show intense and extensive PAS-positive staining.
Likewise, over-expression of the Lipin1 (Lpin1) gene, which plays a crucial role in liver metabolism [44,45], was confirmed in the SHS-exposed mice by RT-qPCR analysis. LPIN1 is a bi-functional protein with distinct roles in lipid metabolism, depending on its subcellular localization [46]. In the nucleus, Lpin1 interacts with the peroxisome proliferator-activated receptor α (PPARα) and PPARγ coactivator 1α (PGC-1α) to modulate the expression of genes involved in mitochondrial fatty acid oxidation [44]. In the cytoplasm, LPIN1 functions as a Mg2+-dependent phosphatidate phosphatase enzyme that catalyzes the conversion of phosphatidate to diacylglycerol, a key step in the biosynthesis of triacylglycerol [45]. As shown in Figure 6A, the expression level of Lpin1 was increased in the SHS-exposed mice pre-recovery (2.5-fold) and continued to rise after one month of recovery (~5-fold) relative to age-matched controls. Of significance, both Rgs16 and Lpin1 were identified by IPA® analysis as part of a subset of molecules affecting liver steatosis in the SHS-exposed mice (Figure 2A).
We also confirmed over-expression of the metallothionein 1 (Mt1) gene in the SHS-exposed mice before and after one-month recovery (Figure 6A). Mt1 and its isoform Mt2 belong to a family of small cysteine-rich and heavy metal binding proteins, the metallothioneins (MTs), that are involved in protective stress responses [47]. Synthesis of MTs has been reported to significantly increase due to a variety of stimuli, including oxidative stress, cytotoxicity, irradiation, and DNA damage [47]. Furthermore, we detected SHS-induced up-regulation of the ubiquitin specific peptidase 2 (Usp2) gene and its downstream target, the period circadian clock 1 (Per1) gene, in the SHS-exposed mice
Int. J. Mol. Sci. 2020, 21, 1296 13 of 21
vs. controls. The transcription levels of these two genes were significantly elevated in the SHS-exposed mice, both before and after one-month recovery, as compared to age-matched controls (Figure 6A).
Figure 6. Gene validation by Reverse Transcription Quantitative PCR (RT-qPCR) and proposed model. (A) The expression status of individual gene targets identified by microarray analysis was examined by RT-qPCR. Bars represent the mean normalized gene expression (±SE) in SHS-exposed mice, before recovery (in blue) and after recovery (in red) relative to controls. All reactions (5 samples per experimental and control group) were performed in triplicate for a total of 15 reactions per biological set. Data were normalized using the endogenous housekeeping gene, glyceraldehyde-3-phosphate dehydrogenase (Gapdh), as reference. (B) Proposed model of SHS-induced hepatic fat accumulation through the involvement of wild-type p53 and/or gain-of-function p53 mutants. Vertical white arrows indicate up-regulation or down-regulation of target molecules; vertical black arrows show decrease in fatty acid (FA) oxidation or increase in fatty acid (FA) synthesis (see, text).
Rgs16 Lpin1 Per1 Usp2 Mt1 Elovl3 Onecut1
20
22
24
26
2-2
28
2-4Rel
ativ
e N
orm
aliz
ed E
xpre
ssio
n
SHS4m SHS4m+1m recovery * P <0.05
A
SHS Exposure
Carcinogen Uptake
Metabolic Activation
DNA damage
ATM/ATR
SREBP-1
FA Oxidation FA Synthesis
p53AMPK
Mutp53
LPIN1RGS16
Detoxification
Mutp53
B
Int. J. Mol. Sci. 2020, 21, 1296 14 of 21
Moreover, we verified the SHS-induced down-regulation of other functionally important genes. The hepatocyte nuclear factor 6 (Hnf6/Onecut1) is a member of the one cut family of transcription factors, which modulates expression of numerous genes required for hepatocyte function. Hfn6 is known to be down-regulated during liver injury [48]. The elongation of very long chain fatty acids (FEN1/Elo2, SUR4/Elo3, yeast)-like 3 (Elovl3) gene encodes a protein that plays a key role in elongation of long chain fatty acids, thus providing precursors for synthesis of sphingolipids and ceramides [49]. Down-regulation of Onecut1 and Elovl3 transcripts was confirmed in the SHS-exposed mice upon termination of exposure (0.20-fold and 0.17-fold, respectively) and remained persistent in the counterpart mice undergone one-month recovery in clean air (0.78-fold and 0.22-fold, respectively) (Figure 6A).
3. Discussion
First, we analyzed the hepatic transcriptome of SHS-exposed mice, pre- and post-recovery, using genome-wide gene expression analysis followed by functional network and molecular pathway analyses. As shown in Figure 1A and Table S1, SHS-exposure resulted in a significant transcriptomic response, with several hundred differentially expressed transcripts being detectable in the exposed mice immediately after treatment. One-month recovery in clean air only partially mitigated the SHS-induced transcriptional changes as the number of aberrant transcripts in the exposed mice undergone recovery remained substantially high (Figure 1A and Table S1). The persistent transcriptional changes in the SHS-exposed mice predominantly affected genes and functional networks involved in lipid metabolism and biosynthesis as well as in regulation of the endoplasmic reticulum where manufacturing of lipids occurs (Figure 2B, Figure S1 and Table 1). Of the common DEGs in the SHS-exposed mice pre- and post-recovery, 41% are known to modulate lipid metabolism, with 28% being specifically involved in the development of hepatic steatosis (Figure 2A and Table 1).
Upstream Regulator Analysis by IPA® identified a complex network of eleven transcription factors and/or regulators (CHUK, IKBKG, IKBKB, SP1, STAT1, NFKBIA, FOXO3, NF-κB complex, RELA, NFKB1 and TP53) that are likely to account for the observed deregulation of lipid metabolism-specific genes and associated pathways in the SHS-exposed mice (Figure 3). This network includes NF-κB, whose activation in non-parenchymal cells is generally recognized to promote inflammation, fibrosis and hepatocarcinogenesis [37]. Of significance is also the predicted activation of TP53, a preferential target of DNA-damaging agents, such as tobacco smoke carcinogens [30,50,51], and a key regulator in fatty liver and insulin resistance [52]. TP53 interacts with the NK-kB complex, and crosstalk between the TP53 and NF-kB transcription factors has been shown to play a pivotal role in determining the cellular response to certain stimuli, e.g., DNA damage [53]. The predicted activation of TP53 is in accordance with the expression status of several downstream lipid targets found in the SHS-exposed mice, both before and after recovery in clean air (Figure 3).
A novel finding of our study is the SHS-induced up-regulation of Rgs16 and Lpin1, two TP53 downstream effectors with crucial roles in lipid metabolism and liver steatosis (Figure 2A). RGS16 is known to be induced by doxorubicin in cells expressing wild-type p53 [54]. In normal lung fibroblasts, RGS16 is transcriptionally activated by exogenous expression of p53, either individually or in combination with retinoblastoma 1 [55]. TP53 can also up-regulate the expression of Lpin1 via three p53 binding sites located on the first intron of the gene [56]. Whole body γ-irradiation of wild-type p53 mice, but not p53−/− mice, has been shown to cause up-regulation of Lpin 1 in several organs, with a pattern of expression resembling that of typical p53-responsive genes, including the p21WAF1 gene [56]. In addition to being bona fide targets of p53, Rgs16 and Lpn1 contain potential sterol regulatory element (SRE) binding sites for SREBP-1, a key regulator of lipid metabolism under the negative control of AMPK [57].
A growing number of studies has shown a ‘noncanonical’ role for p53 in modulating lipid metabolism by either transcriptional regulation of target molecules involved in fatty acid synthesis and oxidation and lipid droplet formation or via direct protein-protein interactions [58–61]. Based on our results, we propose a model in which SHS induces TP53 via the DNA-damage response pathway, the ataxia–telangiectasia mutated/ataxia–telangiectasia and Rad3 related (ATM/ATR) kinase
Int. J. Mol. Sci. 2020, 21, 1296 15 of 21
pathway). Active TP53, in turn, transcriptionally activates Rgs16 and Lpin1, and most likely additional steatogenic genes in a tissue-specific context, ultimately leading to liver steatosis (Figure 6B). Alternatively, SHS can cause mutations in the TP53 gene, and gain-of-function mutant forms of TP53 have been found to enhance fatty acid synthesis by inhibitory interaction with AMPKα, and consequent activation of SREBP-1 (Figure 6B) [60]. In turn, SREBP-1 can transcriptionally activate Rgs16 and Lpin1 through the SRE binding sites located on these genes. Yuan et al. have previously reported inactivation of AMPK and activation of SREBP-1c concurrent with hepatic lipid accumulation in mice fed with high-fat-diet and exposed to SHS [26]. Altogether, the deregulation of Rgs16 and Lpin1 in the SHS-exposed mice found in our study may provide novel insights into the interplay of carcinogen exposure, TP53-dependent response, and metabolic liver disease. Work in our laboratory is currently underway to further investigate the herein proposed model of SHS-induced hepatic steatosis via the TP53 pathway.
Lastly, the perturbation of key lipid genes in the SHS-exposed mice, which persisted after recovery in clean air, is highly consistent with the progressive accumulation of fat and other adverse histological changes observed in the liver of corresponding animals (Figures 4 and 5). As shown in Figure 4A, the extent of fat accumulation in the liver of SHS-exposed mice progressively increased after recovery time in clean air (Figure 4A). Furthermore, SHS-exposed mice undergone recovery displayed more pronounced signs of liver injury, including disorganized lobular architecture, foci of inflammation, necrosis, and variable fibrosis (Figures 4B and 5). One possible explanation for this observation is that the cascade of events triggered by exposure to SHS can further progress, even in the absence of SHS, and cause potentially irreversible liver injury. According to the ‘multiple-hit’ hypothesis, multiple events are required to promote NAFLD initiation and progression. Based on our results, SHS-induced disruption of lipid homeostasis with consequent steatosis may constitute the first hit. Additional factors (metabolic, environmental, genetic and/or epigenetic mechanisms) can further exacerbate liver injury mostly through modulation of pathways involved in mitochondrial dysfunction, oxidative stress, fatty acid biosynthesis, and inflammation, thus, leading to more severe forms of NAFLD. In other words, the first hit (SHS-induced liver steatosis) can increase the susceptibility to subsequent hits, and this could explain why we observed more pronounced effects in SHS4m+1m recovery mice. Future follow up studies are needed to investigate the likelihood of the above scenarios in human populations.
4. Materials and Methods
4.1. Animal Care and Maintenance
This study was conducted in accordance with the recommendations described in the Guide for the Care and Use of Laboratory Animals of the National Institutes of Health, and all efforts were made to minimize animal suffering [62]. The study was approved by the Institutional Animal Care and Use Committee (IACUC) of the City of Hope (Protocol Number: 09012, 07 January 2009). All mice were fed a standard diet consisting, at a caloric level, of 25% proteins, 13% fat, and 62% carbohydrates (PicoLab® Rodent Diet 20, PMI Nutrition International, LLC., Brentwood, MO, USA). At all times, including the exposure phase and recovery period, the mice had access to food and water ad libitum.
4.2. Smoking Machine and SHS Exposure
The smoking machine and exposure protocol have been described in detail in [29,30]. Briefly, SHS was generated using a custom-made TE-10 smoking machine (Teague Enterprises, Woodland, CA, USA). The TE-10 smoking machine is a microprocessor-controlled unit that can generate mainstream smoke, sidestream smoke, or a combination of the two. The machine was programmed to burn 3R4F Reference Kentucky cigarettes (Tobacco Research Institute, University of Kentucky, Lexington, KY, USA), and produce a mixture of sidestream smoke (89%) and mainstream smoke (11%). This formulation is conventionally used to mimic SHS for in vivo exposure and is representative of the SHS inhaled by humans in real life [32,63,64].
Int. J. Mol. Sci. 2020, 21, 1296 16 of 21
At the outset, all experimental mice underwent an acclimatization period during which they were gradually exposed ‘whole body’ to incremental doses of SHS. Following the acclimatization period, the mice were maintained on a SHS exposure regimen, which included 5 h per day, 5 days per week, and four-month whole body exposure to SHS, produced by continuous burning of 7–9 cigarettes. The average concentrations of total suspended particulate (TSP) in the exposure chambers were 233.0 ±15.4 mg/m3 at any given time during the four-month SHS exposure. The respective average TSP concentrations correspond to SHS generated through continuous smoking of 8.0 ± 0.5 cigarettes, at any given time during the four-month SHS exposure [29].
We note that whole body smoke exposure in rodents may result in residual transdermal and gastrointestinal absorption of smoke particles consequent to grooming [30]. However, ‘nose-only’ exposure can cause stress and discomfort for the animals, which would be pronounced in long-term studies, such as the present one. Therefore, we chose whole body exposure of mice to SHS based on tolerability and practicality of this approach and its compatibility with our study design. In addition, whole body smoke exposure in mice recapitulates real-life human exposure to SHS [30].
4.3. Study Design
Adult male mice (6–8 weeks old), on a C57BL/6 genetic background, were randomly assigned to two groups, including (1) ‘experimental’ (SHS exposure) and (2) ‘control’ (sham-treatment in clean air). The experimental group was divided in two subgroups (5 mice per subgroup), including four-month SHS exposure (SHS4m) and four-month SHS exposure plus one-month recovery in clean air (SHS4m+1m recovery). Age-matched control mice were similarly subdivided in sham-treatment subgroups, with and without recovery (5 mice per subgroup). The sham-treated mice were exposed to filtered high-efficiency particulate air (HEPA) in lieu of SHS, as described previously [29–32]. At the end of all experiments, the SHS-exposed and control mice were euthanized by CO2 asphyxiation and various tissues and organs, including the liver, were harvested and kept at −80 °C until further analysis. We note that based on life span, four-month SHS exposure in mice is equivalent to approximately 12 years human exposure to SHS, which is a realistic and biologically relevant exposure scenario in real-life. In our previously published studies [29–32,65,66], we have also verified that four-month SHS exposure is sufficient to elicit significant genotoxic, epigenetic, and transcriptomic responses in various organs and tissues of male C57BL/6 mice. We have also confirmed that five mice per group are sufficient to yield, at a minimum, a study power of 1 − β = 80%, and statistically significant results at p < 0.05.
4.4. Genome-Wide Gene Expression Analysis
To construct the hepatic transcriptome in SHS-exposed mice, we used the GeneChip® Mouse Genome 430 2.0 Array (originally from Affymetrix Inc., Santa Clara, CA, USA; currently Thermo Fisher Scientific, Waltham, MA, USA). This microarray platform enables interrogation of over 39,000 transcripts and variants from more than 34,000 well-characterized mouse genes. Briefly, total RNA was isolated from liver tissues of SHS-exposed mice and controls, using the RNeasy Mini Kit (Qiagen, Valencia, CA, USA). Synthesis of double-stranded cDNA from total RNA, fragmentation, hybridization, staining, and microarray scanning were performed according to the manufacturer’s instructions (Affymetrix Inc.). Quality control evaluation and processing and analysis of expression data were performed using the Affymetrix Expression Console™ software (Affymetrix Inc.). The Bioconductor package ‘ArrayTools’ was used to identify differentially expressed genes in experimental groups relative to controls, as described previously [67]. To establish gene expression trends within each experimental group, significant gene lists were examined by hierarchical clustering analysis and principal component analysis (PCA) using the Partek® Genomics Suite® software (Partek Incorporated, St. Louis, MO, USA). Raw microarray data have been deposited in the Gene Expression Omnibus database at NCBI (accession number: GSE139440; htttp://www.ncbi.nlm.nih.gov/geo/).
Int. J. Mol. Sci. 2020, 21, 1296 17 of 21
4.5. Gene Ontology and Canonical Pathways Analysis
Gene ontology (GO) analysis was performed using a combination of the Database for Annotation, Visualization and Integrated Discovery (DAVID) Bioinformatics Tool v.6.8 [68] and the Ingenuity® Pathway Analysis (IPA®) v.9 tool (QIAGEN Bioinformatics, Redwood City, CA, USA; www.qiagenbioinformatics.com). The Functional Clustering Analysis tool in DAVID was used to group together similar annotation terms for all categories, while functional identification of gene networks, canonical pathways, and upstream regulators was done by IPA®.
4.6. Histological Examination
For histological visualization of fat content and neutral triglycerides, we performed Oil Red O (ORO) staining on liver sections prepared from SHS-exposed mice and controls, according to a published protocol [69]. Bright-field images were captured with an Olympus microscope (Camera Model DP27, Tokyo, Japan), at several magnifications, using the CellSens Standard software (Olympus, Tokyo, Japan). Quantification of lipid droplets in the ORO-stained slides was achieved by measuring the area occupied by red pixels, in ImageJ software (https://imagej.nih.gov/ij/), as described previously [69].
Paraffin-embedded liver sections were stained with hematoxylin and eosin (H&E), Masson’s trichrome and Periodic Acid-Schiff (PAS) stain according to standard procedures [70,71]. Images were acquired with the Philips IntelliSite Pathology Solutions (PIPS) system.
4.7. Reverse Transcription Quantitative PCR (RT-qPCR)
For validation purposes, we used a standard RT-qPCR protocol [66] to determine the expression level of single up-regulated or down-regulated genes identified by microarray analysis. Detailed descriptions for RT-qPCR method are available in Supplementary Material.
5. Conclusions
We have demonstrated, for the first time, that subchronic exposure of mice to SHS, independently of diet, induces liver steatosis by modulating genes and functional pathways involved in lipid metabolism. Our findings underscore how an environmental carcinogen, such as SHS, in addition to cancer-causing effects, may contribute to other adverse health consequences, specifically metabolic liver disease.
Supplementary Materials: The following are available online at www.mdpi.com/xxx/s1, Figure S1: title, Table S1: title, Video S1: title.
Author Contributions: S.T. & A.B.: Conceived and designed the study; S.T., J.I.-Y. & A.B.: Performed experiments and collected data; S.T. & A.B.: Analyzed data and interpreted the results; S.T. & A.B.: Wrote the manuscript. All authors have read and agreed to the published version of the manuscript.
Acknowledgments: Work of the authors was supported by grants from Tobacco-Related Disease Research Program (25IP-0001 and 26IP-0051) awarded to ST and grants from National Institute of Dental and Craniofacial Research (1R01DE026043) and Tobacco-Related Disease Research Program (26IR-0015) awarded to AB. The sponsors of the study had no role in study design, data collection, data analysis, data interpretation, writing of the report, or in the decision to submit for publication.
Conflicts of Interest: All authors declare no conflict of interest.
Abbreviations
AMPK AMP-activated kinase APR Acute Phase Response CHUK Component of inhibitor of nuclear factor kappa B kinase complex DAVID Database for Annotation, Visualization and Integrated Discovery DEGs Differentially expressed genes Elovl3 Elongation of very long chain fatty acids (FEN1/Elo2, SUR4/Elo3, yeast)-like 3
Int. J. Mol. Sci. 2020, 21, 1296 18 of 21
FOXO3 Forkhead box O3 GO Gene Ontology Gapdh Glyceraldehyde-3-phosphate dehydrogenase H&E hematoxylin and eosin Hmox1 Heme oxygenase 1 Hnf6/Onecut1 Hepatocyte nuclear factor 6 HEPA High-efficiency particulate air IPA Ingenuity Pathway Analysis IKBKB Inhibitor of nuclear factor kappa B kinase subunit beta IKBKG Inhibitor of nuclear factor kappa B kinase regulatory subunit gamma IACUC Institutional Animal Care and Use Committee IGF Insulin-like growth factor IL-1 interleukin-1 Lpin1 Lipin 1 LPS lipopolysaccharide NAFLD Non-alcoholic fatty liver disease MTs Metallothioneins Mt1 Metallothionein 1 NFKBIA NFKB inhibitor alpha NF-κB Nuclear factor kappa B NFKB1 Nuclear factor kappa B subunit 1 ORO Oil Red O PAS Periodic Acid-Schiff PCA principal component analysis PPARα Peroxisome proliferator-activated receptor α PGC-1α PPARγ coactivator 1α RELA RELA proto-oncogene RXR NF-κB subunit Retinoid X Receptor Per1 Period circadian clock 1 SHS Secondhand smoke ROS Reactive oxygen species Rgs16 Regulator of G-protein signaling 16 RT-qPCR Reverse transcription quantitative polymerase chain reaction SP1 Sp1 transcription factor STAT1 Signal transducer and activator of transcription 1 SREBPs Sterol regulatory elements binding sites for proteins SREBP-1c Sterol regulatory element binding protein-1c TSP Total suspended particulate Tsc22d3 TSC22 domain family, member 3 TP53 Tumor protein p53 Usp2 Ubiquitin specific peptidase 2
References
1. Byrne, C.D.; Targher, G. NAFLD: A multisystem disease. J. Hepatol. 2015, 62, S47–S64. 2. Younossi, Z.M.; Koenig, A.B.; Abdelatif, D.; Fazel, Y.; Henry, L.; Wymer, M. Global epidemiology of
nonalcoholic fatty liver disease-Meta-analytic assessment of prevalence, incidence, and outcomes. Hepatology 2016, 64, 73–84.
3. Neuschwander-Tetri, B.A. Fatty liver and the metabolic syndrome. Curr. Opin. Gastroenterol. 2007, 23, 193–198.
4. Takahashi, Y.; Fukusato, T. Pediatric nonalcoholic fatty liver disease: Overview with emphasis on histology. World J. Gastroenterol. 2010, 16, 5280–5285.
Int. J. Mol. Sci. 2020, 21, 1296 19 of 21
5. Ofosu, A.; Ramai, D.; Reddy, M. Non-alcoholic fatty liver disease: Controlling an emerging epidemic, challenges, and future directions. Ann. Gastroenterol. 2018, 31, 288–295.
6. Kawano, Y.; Cohen, D.E. Mechanisms of hepatic triglyceride accumulation in non-alcoholic fatty liver disease. J. Gastroenterol. 2013, 48, 434–441.
7. Mashek, D.G.; Khan, S.A.; Sathyanarayan, A.; Ploeger, J.M.; Franklin, M.P. Hepatic lipid droplet biology: Getting to the root of fatty liver. Hepatology 2015, 62, 964–967.
8. Zoller, H.; Tilg, H. Nonalcoholic fatty liver disease and hepatocellular carcinoma. Metabolism 2016, 65, 1151–1160.
9. Armstrong, L.E.; Guo, G.L. Understanding Environmental Contaminants’ Direct Effects on Non-alcoholic Fatty Liver Disease Progression. Curr. Environ. Health Rep. 2019, 6, 95–104.
10. Klaunig, J.E.; Li, X.; Wang, Z. Role of xenobiotics in the induction and progression of fatty liver disease. Toxicol. Res. (Camb.) 2018, 7, 664–680.
11. VoPham, T. Environmental risk factors for liver cancer and nonalcoholic fatty liver disease. Curr. Epidemiol. Rep. 2019, 6, 50–66.
12. Tommasi, S.; Besaratinia, A. DNA Hydroxymethylation at the Interface of the Environment and Nonalcoholic Fatty Liver Disease. Int. J. Environ. Res. Public Health 2019, 16, 2791.
13. Hamabe, A.; Uto, H.; Imamura, Y.; Kusano, K.; Mawatari, S.; Kumagai, K.; Kure, T.; Tamai, T.; Moriuchi, A.; Sakiyama, T.; et al. Impact of cigarette smoking on onset of nonalcoholic fatty liver disease over a 10-year period. J. Gastroenterol. 2011, 46, 769–778.
14. Chang, Y.; Jung, H.S.; Yun, K.E.; Cho, J.; Cho, Y.K.; Ryu, S. Cohort study of non-alcoholic fatty liver disease, NAFLD fibrosis score, and the risk of incident diabetes in a Korean population. Am. J. Gastroenterol. 2013, 108, 1861–1868.
15. Oniki, K.; Hori, M.; Saruwatari, J.; Morita, K.; Kajiwara, A.; Sakata, M.; Mihara, S.; Ogata, Y.; Nakagawa, K. Interactive effects of smoking and glutathione S-transferase polymorphisms on the development of non-alcoholic fatty liver disease. Toxicol. Lett. 2013, 220, 143–149.
16. Okamoto, M.; Miyake, T.; Kitai, K.; Furukawa, S.; Yamamoto, S.; Senba, H.; Kanzaki, S.; Deguchi, A.; Koizumi, M.; Ishihara, T.; et al. Cigarette smoking is a risk factor for the onset of fatty liver disease in nondrinkers: A longitudinal cohort study. PLoS ONE 2018, 13, e0195147.
17. Kato, A.; Li, Y.; Ota, A.; Naito, H.; Yamada, H.; Nihashi, T.; Hotta, Y.; Chiang, C.; Hirakawa, Y.; Aoyama, A.; et al. Smoking results in accumulation of ectopic fat in the liver. Diabetes Metab. Syndr. Obes. 2019, 12, 1075–1080.
18. Zein, C.O.; Unalp, A.; Colvin, R.; Liu, Y.C.; McCullough, A.J.; Nonalcoholic Steatohepatitis Clinical Research Network. Smoking and severity of hepatic fibrosis in nonalcoholic fatty liver disease. J. Hepatol. 2011, 54, 753–759.
19. Huang, C.W.; Horng, C.T.; Huang, C.Y.; Cho, T.H.; Tsai, Y.C.; Chen, L.J.; Hsu, T.C. Tzang BS Secondhand smoke induces hepatic apoptosis and fibrosis in hamster fetus. Hum. Exp. Toxicol. 2016, 35, 1005–1015.
20. Al-Sayed, E.M.; Ibrahim, K.S. Second-hand tobacco smoke and children. Toxicol. Ind. Health 2014, 30, 635–644.
21. Lin, C.; Rountree, C.B.; Methratta, S.; LaRusso, S.; Kunselman, A.R.; Spanier, A.J. Secondhand tobacco exposure is associated with nonalcoholic fatty liver disease in children. Environ. Res. 2014, 132, 264–268.
22. Liu, Y.; Dai, M.; Bi, Y.; Xu, M.; Xu, Y.; Li, M.; Wang, T.; Huang, F.; Xu, B.; Zhang, J.; et al. Active smoking, passive smoking, and risk of nonalcoholic fatty liver disease (NAFLD): A population-based study in China. J. Epidemiol. 2013, 23, 115–121.
23. Rezayat, A.A.; Moghadam, M.D.; Nour, M.G.; Shirazinia, M.; Ghodsi, H.; Rouhbakhsh Zahmatkesh, M.R.; Noghabi, M.T.; Hoseini, B.; Rezayat, K.A. Association between smoking and non-alcoholic fatty liver disease: A systematic review and meta-analysis. SAGE Open Med. 2018, 6, 2050312117745223.
24. Azzalini, L.; Ferrer, E.; Ramalho, L.N.; Moreno, M.; Domínguez, M.; Colmenero, J.; Peinado, V.I.; Barberà, J.A.; Arroyo, V.; Ginès, P.; et al. Cigarette smoking exacerbates nonalcoholic fatty liver disease in obese rats. Hepatology 2010, 51, 1567–1576.
25. De la Monte, S.M.; Tong, M.; Agarwal, A.R.; Cadenas, E. Tobacco Smoke-Induced Hepatic Injury with Steatosis, Inflammation, and Impairments in Insulin and Insulin-Like Growth Factor Signaling. J. Clin. Exp. Pathol. 2016, 6, 269.
26. Yuan, H.; Shyy, J.Y.; Martins-Green, M. Second-hand smoke stimulates lipid accumulation in the liver by modulating AMPK and SREBP-1. J. Hepatol. 2009, 51, 535–547.
Int. J. Mol. Sci. 2020, 21, 1296 20 of 21
27. Zein, C.O. Clearing the smoke in chronic liver diseases. Hepatology 2010, 51, 1487–1490. 28. Yuan, H.; Wong, L.S.; Bhattacharya, M.; Ma, C.; Zafarani, M.; Yao, M.; Schneider, M.; Pitas, R.E.; Martins-
Green, M. The effects of second-hand smoke on biological processes important in atherogenesis. BMC Cardiovasc .Disord. 2007, 7, 1.
29. Kim, S.I.; Arlt, V.M.; Yoon, J.I.; Cole, K.J.; Pfeifer, G.P.; Phillips, D.H.; Besaratinia, A. Whole body exposure of mice to secondhand smoke induces dose-dependent and persistent promutagenic DNA adducts in the lung. Mutat. Res. 2011, 716, 92–98.
30. Kim, S.I.; Yoon, J.I.; Tommasi, S.; Besaratinia, A. New experimental data linking secondhand smoke exposure to lung cancer in nonsmokers. FASEB J. 2012, 26, 1845–1854.
31. Tommasi, S.; Zheng, A.; Yoon, J.I.; Li, A.X.; Wu, X.; Besaratinia, A. Whole DNA methylome profiling in mice exposed to secondhand smoke. Epigenetics 2012, 7, 1302–1314.
32. Tommasi, S.; Zheng, A.; Besaratinia, A. Exposure of mice to secondhand smoke elicits both transient and long-lasting transcriptional changes in cancer-related functional networks. Int. J. Cancer 2015, 136, 2253–2263.
33. Sundar, I.K.; Yao, H.; Rahman, I. Oxidative stress and chromatin remodeling in chronic obstructive pulmonary disease and smoking-related diseases. Antioxid. Redox Signal. 2013, 18, 1956–1971.
34. Izzotti, A.; Pulliero, A. Molecular damage and lung tumors in cigarette smoke-exposed mice. Ann. N. Y. Acad. Sci. 2015, 1340, 75–83.
35. Strnad, P.; Tacke, F.; Koch, A.; Trautwein, C. Liver—Guardian, modifier and target of sepsis. Nat. Rev. Gastroenterol. Hepatol. 2017, 14, 55–66.
36. Huang, W.C.; Hung, M.C. Beyond NF-kappaB activation: nuclear functions of IkappaB kinase alpha. J. Biomed. Sci. 2013, 20, 3.
37. Luedde, T.; Schwabe, R.F. NF-kappaB in the liver—Linking injury, fibrosis and hepatocellular carcinoma. Nat. Rev. Gastroenterol. Hepatol. 2011, 8, 108–118.
38. Mallat, A.; Lotersztajn, S. Cigarette smoke exposure: a novel cofactor of NAFLD progression? J. Hepatol. 2009, 51, 430–432.
39. Ogrodnik, M.; Miwa, S.; Tchkonia, T.; Tiniakos, D.; Wilson, C.L.; Lahat, A.; Day, C.P.; Burt, A.; Palmer, A.; Anstee, Q.M.; et al. Cellular senescence drives age-dependent hepatic steatosis. Nat. Commun. 2017, 8, 15691.
40. Kaser, S.; Moschen, A.; Cayon, A.; Kaser, A.; Crespo, J.; Pons-Romero, F.; Ebenbichler, C.F.; Patsch, J.R.; Tilg, H. Adiponectin and its receptors in non-alcoholic steatohepatitis. Gut 2005, 54, 117–121.
41. Karczewski, K.J.; Dudley, J.T.; Kukurba, K.R.; Chen, R.; Butte, A.J.; Montgomery, S.B.; Snyder, M. Systematic functional regulatory assessment of disease-associated variants. Proc. Natl. Acad. Sci. USA 2013, 110, 9607–9612.
42. Irimia, J.M.; Meyer, C.M.; Segvich, D.M.; Surendran, S.; DePaoli-Roach, A.A.; Morral, N.; Roach, P.J. Lack of liver glycogen causes hepatic insulin resistance and steatosis in mice. J. Biol. Chem. 2017, 292, 10455–10464.
43. Pashkov, V.; Huang, J.; Parameswara, V.K.; Kedzierski, W.; Kurrasch, D.M.; Tall, G.G.; Esser, V.; Gerard, R.D.; Uyeda, K.; Towle, H.C.; et al. Regulator of G protein signaling (RGS16) inhibits hepatic fatty acid oxidation in a carbohydrate response element-binding protein (ChREBP)-dependent manner. J. Biol. Chem. 2011, 286, 15116–15125.
44. Finck, B.N.; Gropler, M.C.; Chen, Z.; Leone, T.C.; Croce, M.A.; Harris, T.E.; Lawrence, J.C., Jr.; Kelly, D.P. Lipin 1 is an inducible amplifier of the hepatic PGC-1alpha/PPARalpha regulatory pathway. Cell Metab. 2006, 4, 199–210.
45. Han, G.S.; Wu, W.I.; Carman, G.M. The Saccharomyces cerevisiae Lipin homolog is a Mg2+-dependent phosphatidate phosphatase enzyme. J. Biol. Chem. 2006, 281, 9210–9218.
46. Bi, L.; Jiang, Z.; Zhou, J. The role of lipin-1 in the pathogenesis of alcoholic fatty liver. Alcohol. Alcohol. 2015, 50, 146–151.
47. Ruttkay-Nedecky, B.; Nejdl, L.; Gumulec, J.; Zitka, O.; Masarik, M.; Eckschlager, T.; Stiborova, M.; Adam, V.; Kizek, R. The role of metallothionein in oxidative stress. Int. J. Mol. Sci. 2013, 14, 6044–6066.
48. Wang, M.; Chen, M.; Zheng, G.; Dillard, B.; Tallarico, M.; Ortiz, Z.; Holterman, A.X. Transcriptional activation by growth hormone of HNF-6-regulated hepatic genes, a potential mechanism for improved liver repair during biliary injury in mice. Am. J. Physiol. Gastrointest. Liver Physiol. 2008, 295, G357–G366.
Int. J. Mol. Sci. 2020, 21, 1296 21 of 21
49. Zadravec, D.; Brolinson, A.; Fisher, R.M.; Carneheim, C.; Csikasz, R.I.; Bertrand-Michel, J.; Borén, J.; Guillou, H.; Rudling, M.; Jacobsson, A. Ablation of the very-long-chain fatty acid elongase ELOVL3 in mice leads to constrained lipid storage and resistance to diet-induced obesity. FASEB J. 2010, 24, 4366–4377.
50. Besaratinia, A.; Pfeifer, G.P. Applications of the human p53 knock-in (Hupki) mouse model for human carcinogen testing. FASEB J. 2010, 24, 2612–2619.
51. Hecht, S.S. Tobacco carcinogens, their biomarkers and tobacco-induced cancer. Nat. Rev. Cancer 2003, 3, 733–744.
52. Huang, S.; Sun, C.; Hou, Y.; Tang, Y.; Zhu, Z.; Zhang, Z.; Zhang, Y.; Wang, L.; Zhao, Q.; Chen, M.G.; et al. A comprehensive bioinformatics analysis on multiple Gene Expression Omnibus datasets of nonalcoholic fatty liver disease and nonalcoholic steatohepatitis. Sci. Rep. 2018, 8, 7630.
53. Tergaonkar, V.; Perkins, N.D. p53 and NF-kappaB crosstalk: IKKalpha tips the balance. Mol. Cell 2007, 26, 158–159.
54. Buckbinder, L.; Velasco-Miguel, S.; Chen, Y.; Xu, N.; Talbott, R.; Gelbert, L.; Gao, J.; Seizinger, B.R.; Gutkind, J.S.; Kley, N. The p53 tumor suppressor targets a novel regulator of G protein signaling. Proc. Natl. Acad. Sci. USA 1997, 94, 7868–7872.
55. Carper, M.B.; Denvir, J.; Boskovic, G.; Primerano, D.A.; Claudio, P.P. RGS16, a novel p53 and pRb cross-talk candidate inhibits migration and invasion of pancreatic cancer cells. Genes Cancer 2014, 5, 420–435.
56. Assaily, W.; Rubinger, D.A.; Wheaton, K.; Lin, Y.; Ma, W.; Xuan, W.; Brown-Endres, L.; Tsuchihara, K.; Mak, T.W.; Benchimol, S. ROS-mediated p53 induction of Lpin1 regulates fatty acid oxidation in response to nutritional stress. Mol. Cell 2011, 44, 491–501.
57. Seo, Y.K.; Chong, H.K.; Infante, A.M.; Im, S.-S.; Xie, X.; Osborne, T.F. Genome-wide analysis of SREBP-1 binding in mouse liver chromatin reveals a preference for promoter proximal binding to a new motif. Proc. Natl. Acad. Sci. USA 2009, 106, 13765–13769.
58. Goldstein, I.; Ezra, O.; Rivlin, N.; Molchadsky, A.; Madar, S.; Goldfinger, N.; Rotter, V. p53, a novel regulator of lipid metabolism pathways. J. Hepatol. 2012, 56, 656–662.
59. Goldstein, I.; Rotter, V. Regulation of lipid metabolism by p53—Fighting two villains with one sword. Trends Endocrinol. Metab. 2012, 23, 567–575.
60. Parrales, A.; Iwakuma, T. p53 as a Regulator of Lipid Metabolism in Cancer. Int. J. Mol. Sci. 2016, 17, 2074. 61. Berkers, C.R.; Maddocks, O.D.; Cheung, E.C.; Mor, I.; Vousden, K.H. Metabolic regulation by p53 family
members. Cell Metab. 2013, 18, 617–633. 62. Council, N.R. Guide for the Care and Use of Laboratory Animals, 8th Ed.; The National Academies Press:
Washington, DC, USA, 2011. 63. D’Agostini, F.; Izzotti, A.; Balansky, R.; Zanesi, N.; Croce, C.M.; De Flora, S. Early loss of Fhit in the
respiratory tract of rodents exposed to environmental cigarette smoke. Cancer Res. 2006, 66, 3936–3941. 64. Besaratinia, A.; Pfeifer, G.P. Second-hand smoke and human lung cancer. Lancet Oncol. 2008, 9, 657–666. 65. Tommasi, S.; Zheng, A.; Yoon, J.I.; Besaratinia, A. Epigenetic targeting of the Nanog pathway and signaling
networks during chemical carcinogenesis. Carcinogenesis 2014, 35, 1726–1736. 66. Tommasi, S.; Zheng, A.; Besaratinia, A. Expression of epigenetic modifiers is not significantly altered by
exposure to secondhand smoke. Lung Cancer 2015, 90, 598–603. 67. Tommasi, S.; Zheng, A.; Weninger, A.; Bates, S.E.; Li, X.A.; Wu, X.; Hollstein, M.; Besaratinia, A.
Mammalian cells acquire epigenetic hallmarks of human cancer during immortalization. Nucleic Acids Res. 2013, 41, 182–195.
68. Huang da, W.; Sherman, B.T.; Lempicki, R.A. Systematic and integrative analysis of large gene lists using DAVID bioinformatics resources. Nat. Protoc. 2009, 4, 44–57.
69. Mehlem, A.; Hagberg, C.E.; Muhl, L.; Eriksson, U.; Falkevall, A. Imaging of neutral lipids by oil red O for analyzing the metabolic status in health and disease. Nat. Protoc. 2013, 8, 1149–1154.
70. Krishna, M. Role of special stains in diagnostic liver pathology. Clin. Liver Dis. (Hoboken) 2013, 2, S8–S10. 71. Cardiff, R.D.; Miller, C.H.; Munn, R.J. Manual hematoxylin and eosin staining of mouse tissue sections.
Cold Spring Harb. Protoc. 2014, 2014, 655–658.
© 2020 by the authors. Licensee MDPI, Basel, Switzerland. This article is an open access article distributed under the terms and conditions of the Creative Commons Attribution (CC BY) license (http://creativecommons.org/licenses/by/4.0/).