The Impact of Tax and Smoke-Free Air Policy Changes
48
Authors Frank J. Chaloupka David Levy Jidong Huang April 2011 The Impact of Tax and Smoke-Free Air Policy Changes RWJF Retrospective Series A companion report to The Tobacco Campaigns of the Robert Wood Johnson Foundation and Collaborators, 1991 – 2010
-
Upload
khangminh22 -
Category
Documents
-
view
0 -
download
0
Transcript of The Impact of Tax and Smoke-Free Air Policy Changes
Authors
Frank J. Chaloupka
David Levy
Jidong Huang
April 2011
The Impact of Tax and Smoke-Free Air Policy Changes
RWJF Retrospective Series
A companion report to The Tobacco Campaigns of the Robert Wood Johnson Foundation and Collaborators, 1991 – 2010

Frank J. ChaloupkaDistinguished Professor of Economics and Public Health, University of Illinois at Chicago Director, UIC Health Policy Center
David LevyProfessor of Economics, University of Baltimore Senior Scientist, Center for Public Health Improvement and Innovation, Pacific Institute for Research and Evaluation
Jidong HuangResearch Specialist, Health Policy Center, University of Illinois at Chicago
© 2011 Robert Wood Johnson Foundation
Route 1 and College Road EastP.O. Box 2316Princeton, NJ 08543-2316
This publication is available for downloading from the Foundation’s website at: www.rwjf.org/pr/product.jsp?id=72056
Companion Reports in this RWJF Tobacco Retrospective Series
The Tobacco Campaigns of the Robert Wood Johnson Foundation and Collaborators, 1991–2010
n Smoking in Movies and Television: Research Highlights
n Clearing the Air: An Overview of Smoke-Free Air Laws
n Social Norms and Attitudes About Smoking, 1991–2010
n More Than a Decade of Helping Smokers Quit: RWJF’s Investment in Tobacco Cessation
n RWJF’s Tobacco Work: Major Programs, Strategies and Focus Areas
n Major Tobacco-Related Events in the United States
n Surgeon General’s Reports on Tobacco
n The Way We Were: Tobacco Ads Through the Years
n Tobacco-Control Work, 1991–2010: RWJF and Collaborators Slideshow
n IMPACT: Smokers and Smoking-Related Deaths Slideshow

© 2011 Robert Wood Johnson Foundation | April 2011 | RWJF Retrospective Series: The Impact of Tax and Smoke-Free Air Policy Changes page iii
Contents
RWJF Retrospective Series
The Impact of Tax and Smoke-Free Air Policy Changes
Preface 1
Executive Summary 2
Introduction 5
Tobacco Taxation 8
Smoke-Free Air Policies 20
Modeling the Impact of Tobacco Taxes and Smoke-Free Policies 25
Conclusions 38
Sources 40
Figures:
Figure 1: State and Federal Cigarette Taxes, 1990–2009 11
Figure 2: State Cigarette Taxes and Prices, November 1, 2008 11
Figure 3: Cigarette Taxes and Prices, United States, 1954–2009 12
Figure 4: Cigarette Prices and Cigarette Sales, United States, 1970–2009 13
Figure 5: Cigarette Prices and Adult Smoking Prevalence, United States, 1970–2008 14
Figure 6: Cigarette Prices and Former Smoking Rates, 50 States and District of Columbia, 2007 15
Figure 7: Cigarette Prices and Youth Smoking Prevalence, United States, 1991–2008 17
Figure 8: Cigarette Prices and 12 to 17-Year-Old Smoking Prevalence Rates, 50 States and District of Columbia, 2005/2006 17
Figure 9: Restrictiveness of State Laws Regulating Smoking in Public Places, 1960–2003 21
Figure 10: Major Smoke-Free Air Legislation in the 50 States and District of Columbia, 1991–2008 22
© 2011 Robert Wood Johnson Foundation | April 2011 | RWJF Retrospective Series: The Impact of Tax and Smoke-Free Air Policy Changes page iv
Figure 11: Smoke-Free Air Policies and Adult Smoking Prevalence, 2003–2004 24
Figure 12: Smoke-Free Air Policies and Youth Smoking Prevalence, 2003–2004 24
Figure 13: Reduction in the Number of Smokers; Tax and MSA Price Increase Impact, 1993–2010 29
Figure 14: Reduction in Deaths Caused by Smoking; Tax and MSA Price Increase Impact, 1993–2010 30
Figure 15: Reduction in Number of Smokers; Tax and MSA Price Increase Impact, 1993–2063 31
Figure 16: Reduction in Deaths Caused by Smoking; Tax and MSA Price Increase Impact, 1993–2063 31
Figure 17: Reduction in Number of Smokers; Smoke-Free Air Policy Impact, 1993–2010 32
Figure 18: Reduction in Deaths Caused by Smoking; Smoke-Free Air Policy Impact, 1993–2010 32
Figure 19: Reduction in Number of Smokers; Smoke-Free Air Policy Impact, 1993–2063 33
Figure 20: Reduction in Deaths Caused by Smoking; Smoke-Free Air Policy Impact, 1993–2063 33
Figure 21: Reduction in Number of Smokers; Combined Tax and Smoke-Free Air Policy and MSA Price Increase Impact, 1993–2010 34
Figure 22: Reduction in Deaths Caused by Smoking; Combined Tax and Smoke-Free Air Policy and MSA Price Increase Impact, 1993–2063 35
Figure 23: Reduction in Number of Smokers; Combined Tax and Smoke-Free Air Policy and MSA Price Increase Impact, 1993–2063 35
Figure 24: Reduction in Deaths Caused by Smoking; Combined Tax and Smoke-Free Air Policy and MSA Price Increase Impact, 1993–2063 36
Tables:
Table 1: Summary of Impact of State Smoke-Free Air Policy Changes, State and Federal Tax Increases, and MSA Price Increase, 1993–mid-2009 4
Table 2: Data Used in SimSmoke 26
Contents
© 2011 Robert Wood Johnson Foundation | April 2011 | RWJF Retrospective Series: The Impact of Tax and Smoke-Free Air Policy Changes page 1
PrefaCe
Preface
Twenty years ago the Robert Wood Johnson Foundation decided to put our name and substantial
financial and human resources behind a bold initiative to reduce tobacco use in this country. For two
decades, RWJF has been working with partners in government, education, philanthropy and the
private sector to make literally the air that we breathe safe to inhale and to free many Americans from
a gripping, destructive addiction to which they were seduced in their youth. As this retrospective
indicates, our tobacco-control campaigns often have seemed an uphill battle, but they have made
significant inroads against the harmful effects of tobacco.
Because of that significant progress, we have scaled back our investments in tobacco
control to allow us to focus on new public health challenges. Yet the moral injunction of medicine is
“First, do no harm.” As we wound down these investments (though ongoing, we are still providing
$3,589,258 to reduce tobacco use), I was adamant that we needed to monitor the state of tobacco
control going forward and to assess the legacy and impact of our body of tobacco-control work.
As we address other critical public health challenges, like the need to roll back the epidemic of
childhood obesity, it is important to harvest lessons that can be learned from our tobacco-control work,
which has been unique in terms of magnitude, duration, scope and methods. We therefore asked
the Center for Public Program Evaluation to conduct an independent assessment to help us and the
field understand the results of our efforts, what worked, what didn’t, and what could be adopted or
adapted to fulfill our mission to improve and make a demonstrable difference in health and health care
for all Americans.
I wish to emphasize our insistence that the center’s work be truly independent. The center’s
president, George Grob, is a former Deputy Inspector General of the U.S. Department of Health and
Human Services, who personally took charge of this assessment. Grob asked Henry Aaron, Bruce and
Virginia MacLaury, senior fellow and former director of economic studies at the Brookings Institution,
and Michael O’Grady, senior fellow at the National Opinion Research Center and principal, O’Grady
Health Policy, to provide an additional layer of independent review. Aaron and O’Grady advised on
study methods and findings, and reviewed draft reports. The resulting assessment report describes
both the significance and limits of RWJF’s contributions and achievements.
I want to thank the many individuals and organizations—often working in collaboration—
who conducted the tobacco-control campaigns, and I especially want to thank the many RWJF staff
members (and former staff) who have worked with such competence and endurance on reducing
Americans’ addiction to tobacco. Among them were: Diane Barker, Michael Beachler, Sallie Petrucci
George, Karen Gerlach, Marjorie Gutman, Robert Hughes, Nancy Kaufman, Jim Knickman, Michelle
Larkin, Joe Marx, Tracy Orleans, Marjorie Paloma and Steven Schroeder, and many others behind
the scenes and too numerous to name.
Risa Lavizzo-Mourey, M.D., M.B.A.
President and Chief Executive Officer Robert Wood Johnson Foundation

© 2011 Robert Wood Johnson Foundation | April 2011 | RWJF Retrospective Series: The Impact of Tax and Smoke-Free Air Policy Changes page 2
Executive Summary
the past two decades have seen unprecedented progress in tobacco control, with
governments at all levels adopting and strengthening a range of tobacco-control
policies and other interventions to promote cessation among current tobacco
users and preventing youth from taking up tobacco use.
A variety of factors have contributed to these changes, including greater recognition of the
health consequences of tobacco use and exposure to tobacco smoke and related changes in social
norms. These changes have been accelerated by the efforts of governmental and nongovernmental
organizations that have invested considerable resources in building the evidence base for the
effectiveness of tobacco-control interventions, implementing and evaluating a variety of
innovative programs to reduce tobacco use, and supporting grassroots and national efforts to
advocate for proven tobacco-control policies and programs.
Prominent among these are the substantial investments that the Robert Wood Johnson
Foundation has made in all three areas—building the evidence base for tobacco-control policies
and programs through diverse research; implementing a variety of innovative programs aimed at
reducing tobacco use, particularly in high-risk populations; and supporting a range of national,
state and local organizations to advocate for adopting and implementing effective tobacco-
control strategies.
Progress has been particularly evident with respect to increases in tobacco product excise
taxes and strengthened smoke-free air policies. Between 1990 and 2009, the federal excise tax rose
from 16 cents per pack to just over $1, average state cigarette excise taxes more than quadrupled,
and a number of communities adopted significant additional excises. These tax increases,
coupled with tobacco company pass-throughs of costs from legal settlements (most notably the
1998 Master Settlement Agreement [MSA]), led to an increase of more than 125 percent in
the inflation-adjusted price of cigarettes during this period.
Similarly, as evidence about the harmful effects of nonsmokers’ exposure to tobacco
smoke accumulated, state and local governments adopted and strengthened policies limiting
smoking in public places and private workplaces. Currently, every state and hundreds of localities
have policies in place that limit smoking in at least some venues, with nearly three-quarters
of the U.S. population residing in a jurisdiction that bans smoking in restaurants, bars and/or
private worksites.
The past two decades have
seen unprecedented progress
in tobacco control, with
governments at all levels
adopting and strengthening
a range of tobacco-control
policies and other inter-
ventions to promote cessation
among current tobacco
users and preventing youth
from taking up tobacco use.
exeCutive
summary

© 2011 Robert Wood Johnson Foundation | April 2011 | RWJF Retrospective Series: The Impact of Tax and Smoke-Free Air Policy Changes page 3
These policy changes provided numerous natural experiments for tobacco-control policy
researchers to evaluate. Over the past two decades, dozens of studies have clearly demonstrated
that higher taxes and price increases on tobacco lead to significant reductions in tobacco use,
particularly among youth and those with lower incomes. This is evident both in the number of
current users who quit using tobacco and the number of young people who do not begin.
Likewise, comprehensive smoke-free air policies not only protect nonsmokers, but also
increase cessation among existing smokers and prevent smoking initiation among youth. Several
studies have paid particular attention to establishing the causal relationships between the policies
and tobacco use. The accumulating evidence of the effectiveness of these policies has contributed
to further policy changes.
This report summarizes the progress made over the past two decades in raising cigarette and
other tobacco product excise taxes and in adopting and strengthening policies that limit smoking
in public places and private worksites. The evolution of these policies is discussed and the
evidence of their effectiveness in reducing tobacco use is reviewed.
Using this information, we use the SimSmoke tobacco-control policy simulation model to
estimate the impact of changes in tobacco-control policy, especially taxation and smoke-free air
policies, on the number of persons who smoke and on premature deaths caused by smoking.
We use 1993 as our baseline, given the available data and timing of significant governmental and
nongovernmental programs designed to reduce tobacco use through policy and media advocacy,
building the evidence base for tobacco control, and other interventions (e.g., RWJF’s efforts,
the ASSIST program of the National Cancer Institute [NCI], the IMPACT program of the
Center for Disease Control and Prevention [CDC]). We assess the impact of state and federal
cigarette tax changes and state smoke-free air policies adopted through mid-2009. Finally, we also
estimate the impact of the significant price increase that followed the Master Settlement
Agreement in November 1998.
We estimate the impact of these policy changes on the number of individuals who smoke in
2010 and the cumulative number of premature deaths avoided by smoking policies put in place
between 1993 and 2010. We find that the impact of these policy changes is substantial. According
to our estimates:
• Morethan2.4millionfewerindividualssmokedin2010becauseofthestateandfederaltax
increases that occurred from 1993 through mid-2009.
• Nearly1.7millionfewerpeoplesmokedin2010asaresultofthestatesmoke-freeairpolicies
adopted during this period.
• Morethan5.3millionfewerpeoplesmokedin2010asaresultofthecombinedeffectofthe
tax increases, smoke-free air policies and MSA price increase.
• Morethan60,000prematuredeathswouldhavebeencausedbysmokingbetween1993and
2010 had these policies changes not been made. (See Table 1 for a summary of these estimates.)
Given that these policies will deter many young people from taking up smoking in future
years, and given the lags between smoking initiation and the onset of smoking-related diseases,
Over the past two
decades, dozens of studies
have clearly demonstrated
that higher taxes and price
increases on tobacco lead
to significant reductions
in tobacco use, particularly
among youth and those
with lower incomes.
exeCutive
summary
© 2011 Robert Wood Johnson Foundation | April 2011 | RWJF Retrospective Series: The Impact of Tax and Smoke-Free Air Policy Changes page 4
the longer-term impact of these policies changes will be enormous. We estimate, for example,
that by 2063:
• Morethan12millionfewerpeoplewillsmokeasaresultofthecombinedtax,price,and
smoke-free air policy changes that occurred from 1993 through mid-2009—that includes
almost2.4millionfewersmokersbecauseofthestatesmoke-freeairpoliciesandmorethan
6.3 million fewer because of the state and federal tax increases.
• Nearly2.1millionprematuredeaths,whichwouldhaveotherwisebeencausedbysmoking
between 1993 and 2063, will have been prevented.
Given the substantial reductions in the number of smokers by 2063, the public health
impact of the policy changes will continue to grow, preventing millions of additional premature
deaths in the later years of this century. (See Table 1 for a summary of these estimates.)
Moreover, these figures considerably underestimate the full impact of the changes that
have occurred as a result of tobacco-control efforts over the past two decades, including the
effects of local policy changes, exposure to effective mass-media countermarketing campaigns,
greatly expanded support for cessation efforts, and the many other activities supported by
various public and private organizations. Similarly, they do not capture the full extent of health
benefits produced by the reductions in smoking, as they do not reflect the increases in quality-
adjusted life years gained as a result of the premature deaths averted.
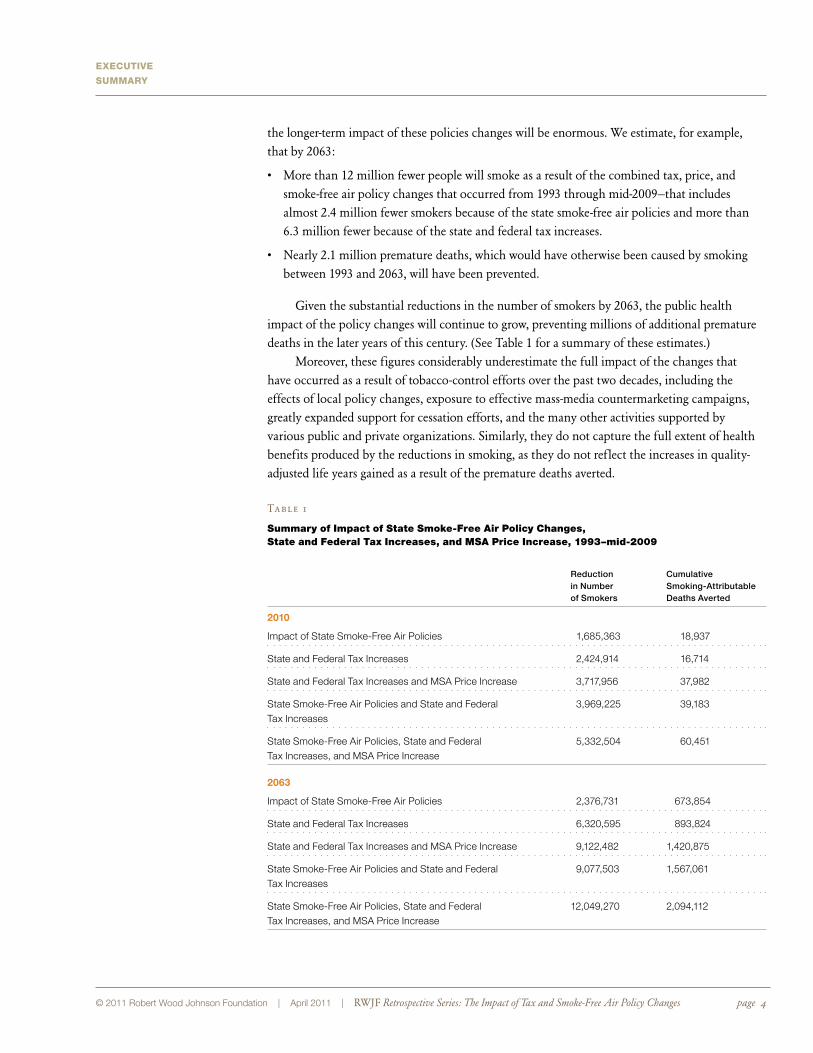
Table 1
Summary of Impact of State Smoke-Free Air Policy Changes, State and Federal Tax Increases, and MSA Price Increase, 1993–mid-2009
Reduction Cumulative in Number Smoking-Attributable of Smokers Deaths Averted
2010
Impact of State Smoke-Free Air Policies 1,685,363 18,937
State and Federal Tax Increases 2,424,914 16,714
State and Federal Tax Increases and MSA Price Increase 3,717,956 37,982
State Smoke-Free Air Policies and State and Federal 3,969,225 39,183 Tax Increases
State Smoke-Free Air Policies, State and Federal 5,332,504 60,451 Tax Increases, and MSA Price Increase
2063
Impact of State Smoke-Free Air Policies 2,376,731 673,854
State and Federal Tax Increases 6,320,595 893,824
State and Federal Tax Increases and MSA Price Increase 9,122,482 1,420,875
State Smoke-Free Air Policies and State and Federal 9,077,503 1,567,061 Tax Increases
State Smoke-Free Air Policies, State and Federal 12,049,270 2,094,112 Tax Increases, and MSA Price Increase
exeCutive
summary
© 2011 Robert Wood Johnson Foundation | April 2011 | RWJF Retrospective Series: The Impact of Tax and Smoke-Free Air Policy Changes page 5
introduCtion
Introduction
much of the progress in reducing tobacco use in the United States over the past few
decades can be attributed to the adoption and strengthening of tobacco-control
policies at the state and local levels (Giovino et al., 2009). Inflation-adjusted
federal and state cigarette taxes have more than tripled since the early 1990s, and
significant taxes have been adopted in several localities. On average, federal, state and local
cigarette taxes currently add well over $2 to the price of a pack of cigarettes, and much more in
some localities.
Several states earmark a portion of the revenues generated from these taxes to comprehensive
state tobacco-control programs that aim to prevent smoking initiation and encourage smoking
cessation; others use the payments they receive from tobacco companies as part of the MSA to
fund these programs. Every state and hundreds of communities now restrict smoking in at least
some public places, with a growing number banning smoking in virtually all indoor public
places, including restaurants, bars and worksites. As of March 2010, nearly three-quarters of the
U.S. population resides in a jurisdiction that bans smoking in private worksites, bars and/or
restaurants. In response to federal legislation, all states have implemented policies prohibiting the
sale of tobacco products to minors, with many states and communities adopting policies that go
well beyond the mandated minimum.
These positive trends are likely to continue as governments at all levels continue to raise
tobacco taxes, strengthen smoke-free air laws, and implement other policies and programs aimed
at reducing tobacco use and its consequences. Moreover, new policies are likely to emerge as a
result of the authority to regulate tobacco products given to the U.S. Food & Drug Administration
under the Family Smoking Prevention and Tobacco Control Act of 2009 and the elimination of
federal pre-emption of subnational restrictions on tobacco company marketing practices included
in that act.
A variety of forces have contributed to these significant policy changes, including greater
recognition of the health consequences of tobacco use and exposure to tobacco smoke and related
changes in social norms. These changes have been accelerated by the efforts of governmental and
nongovernmental organizations that have invested considerable resources in building the evidence
base for the effectiveness of tobacco-control interventions, implementing and evaluating a variety
of innovative programs to reduce tobacco use, and supporting grassroots and national efforts to

© 2011 Robert Wood Johnson Foundation | April 2011 | RWJF Retrospective Series: The Impact of Tax and Smoke-Free Air Policy Changes page 6
advocate for proven tobacco-control policies, programs and other interventions. These include
programs such as:
• NCI’sAmericanStopSmokingInterventionStudy(ASSIST),whichsupportedmediaand
advocacy efforts aimed at strengthening state tobacco-control policy in the 1990s.
• CDC’sInitiativetoMobilizeforthePreventionandControlofTobaccoUse(IMPACT)
program, which funded non-ASSIST states to support a variety of tobacco-control efforts.
• CDC’sNationalTobaccoControlProgram,whichfundedrelatedeffortsinallstatesfollowing
the end of the ASSIST program.
• TheRobertWoodJohnsonFoundation’sSmokeLess States®: National Tobacco Policy Initiative,
which funded nearly all states at some point in the 1990s and 2000s to support policy and
media advocacy efforts to raise tobacco taxes, adopt and strengthen smoke-free air policies,
and implement other policy initiatives.
• ComprehensiveprogramsfundedfirstbyCaliforniain1989andlaterbymanyotherstates,
using earmarked tobacco tax revenues, funds from legal settlements or general revenues.
These efforts often included support for three activities—building the evidence base for
tobacco-control policies and programs through diverse research programs and projects;
implementing a variety of innovative programs aimed at reducing tobacco use, particularly in
high-risk populations; and supporting a range of national, state and local organizations to
advocate for adopting and implementing effective tobacco-control strategies.
While existing research clearly demonstrates that funding for these efforts has significantly
impacted tobacco-control policies and tobacco use, it is impossible to sort out the full effect of
funding for a specific program. These programs worked together in complementary ways, with
funding for one often spurring funding for others (as in the case of the SmokeLess States efforts
to increase state taxes and the MSA funding for comprehensive state tobacco-control programs,
which generated more funding for state tobacco-control efforts). Existing data and methods
cannot disentangle the synergies among these programs or attribute to any one program some
fraction of the changes that have occurred in tobacco-control policies and tobacco use.
This report summarizes the progress made over the past two decades in raising excise taxes
on cigarettes and other tobacco products, and in adopting and strengthening policies limiting
smoking in public places and private worksites. The evolution of these policies is discussed and
the evidence of their effectiveness in reducing tobacco use is reviewed. Using this information,
we apply the SimSmoke tobacco-control policy simulation model to estimate the impact of
changes in state and federal cigarette taxes and state smoke-free air policies on the number of
persons who smoke and on premature deaths caused by smoking. Given available data and the
timing of significant governmental and nongovernmental programs, we use 1993 as our baseline
and assess the impact of state and federal cigarette tax changes and state smoke-free air policies
adopted through mid-2009, in line with the timing of our analyses. Finally, we estimate the
impact of the significant price increase that followed the MSA in 1998.
introduCtion

© 2011 Robert Wood Johnson Foundation | April 2011 | RWJF Retrospective Series: The Impact of Tax and Smoke-Free Air Policy Changes page 7
We estimate the impact of these policy changes on the number of individuals who smoke
(as of 2010) and the cumulative number of premature deaths that would have been caused by
smoking had these policies not been put into place from 1993 through 2010. Since these policies
will deter many young people from taking up smoking in future years, and since there are lags
between smoking initiation and the onset of diseases caused by smoking, we also estimate the
longer-term impact of these policies, specifically through 2063.
Given the substantial rise in cigarette prices and the diffusion of comprehensive smoke-free
air policies during this period, we conclude that the number of smokers will be significantly
reduced by 2010, with these reductions growing over time as these policy changes prevent youth
from taking up smoking in future years. We project that these policy changes will prevent many
premature deaths that otherwise would have been caused by smoking by 2010, with the number
of deaths averted growing over time so that by 2063, millions of premature deaths will have been
averted. The impact of these policy changes will continue to grow beyond that endpoint.
introduCtion

© 2011 Robert Wood Johnson Foundation | April 2011 | RWJF Retrospective Series: The Impact of Tax and Smoke-Free Air Policy Changes page 8
Tobacco Taxation
in the United States, cigarettes and other tobacco products are taxed in various ways by
federal, state and local governments. Historically, the primary motivation for these taxes
was to generate revenue. In recent years, however, growing evidence about the impact of
higher tobacco taxes and prices on youth and adult tobacco use and the consequences
has led to increased interest in tobacco taxation. This section reviews the recent history of these
taxes, their relationship to price and evidence of the impact of price on tobacco use, both
generally and in key populations.
federal tobaCCo taxation
The federal government has applied excise taxes to tobacco products in the United States since
the late 18th century; these taxes rose and fell over time depending on the government’s revenue
needs, often rising during wartime and falling during times of peace and prosperity. The federal
cigarette excise tax was set at 8 cents per pack in November 1951 and remained at that level until
it was doubled in January 1983 as part of deficit reduction legislation. For two decades, the tax
then rose modestly, increasing to 39 cents per pack in January 2003. Given the infrequent and
typically small increases in the federal cigarette tax since 1951, the tax in 2003 amounted to about
70percentoftheinflation-adjustedvalueofthe1951tax.
In April 2009, the federal cigarette excise tax was increased significantly to just over $1 per
pack($1.0067),withrevenuesfromthetaxusedtofundanexpansionoftheStateChildren’s
Health Insurance Program. With this tax increase, the nominal federal cigarette tax more than
quadrupled from January 1, 1993, while the real value of the tax nearly tripled.
In addition to cigarettes, federal excise taxes are applied to most other tobacco products,
including cigars, pipe tobacco, chewing tobacco, snuff and roll-your-own tobacco (with a separate
tax on rolling papers). Historically, these taxes have generally accounted for a lower percentage of
the total retail price of the product, compared to the federal cigarette tax. As with cigarettes,
federal excise taxes on other tobacco products had mostly been raised infrequently and modestly
over time, but the April 2009 increases were much more significant. The new tax meant that the
share of taxes in the total price of other tobacco products was comparable to the share
represented by taxes in the total price of cigarettes.
While the public health benefits of higher federal tobacco taxes had been noted in debates
over tax increases, the small, infrequent increases of the 1980s and early 1990s were generally
adopted as part of budget deficit legislation (e.g., the Tax Equity and Fiscal Responsibility Act
tobaCCo
taxation

© 2011 Robert Wood Johnson Foundation | April 2011 | RWJF Retrospective Series: The Impact of Tax and Smoke-Free Air Policy Changes page 9
of 1982, which doubled the tax, effective January 1983; and the Omnibus Budget Reconciliation
Act of 1990, which included four-cent increases in 1991 and 1993). In contrast, the public health
impact of higher tobacco taxes appears to be a key factor in the larger federal tax increases of the
past decade, particularly the unprecedented increases in 2009.
state tobaCCo taxation
All states apply an excise tax on cigarettes. In 1921 Iowa became the first to adopt a state cigarette
excise tax. Not surprisingly, North Carolina, one of the major tobacco growing and manufacturing
states, was last, imposing a tax only in 1969. Similarly, most states impose excise taxes on other
tobacco products. States also generally apply the sales tax to cigarettes and other tobacco
products, usually adding it to the total price, including the excise taxes.
There is considerable variation across states in these taxes, as well as within most states over
time. Currently, the simple average of cigarette excise taxes in the 50 states and the District of
Columbiais$1.34perpack,withtaxesashighas$3.46perpackinRhodeIsland.Asmightbe
expected, given tobacco’s historical and economic importance, cigarette taxes in the six major
tobacco-growing or manufacturing states (Georgia, Kentucky, North Carolina, South Carolina,
Tennessee and Virginia) are low, ranging from seven cents per pack in South Carolina to 62 cents
per pack in Tennessee—with an average tax just over one-quarter of the average cigarette tax in
other states.
The first evidence of states using higher taxes to improve public health comes from the
numerous state cigarette tax increases following the dissemination about the early evidence on
thehealthconsequencesofsmokinginthemid-1950sand1960s.From1950through1954,there
wereatotalof14statecigaretteexcisetaxincreases(andonereduction),andaveragetaxesin
tobacco-growing/manufacturing states were only slightly below those in other states (U.S.
Department of Health and Human Services [U.S. DHHS], 2000). As information spread about
the health consequences of smoking, many states continued to raise their cigarette taxes, some
multipletimes;from1955through1971,anaverageofmorethan10statesperyearraisedtheir
tax. Not surprisingly, major tobacco growing and manufacturing states were least likely to do so;
indeed,VirginiaandKentuckyloweredtheirtaxes.Bytheendoffiscalyear1971,theaveragetax
in the six major tobacco growing and manufacturing states was less than 60 percent of that in
other states.
Concerns about interstate cigarette smuggling, especially in states with higher taxes than
their neighbors, deterred states from continuing to raise taxes over the next decade. Beginning in
1982, however, states again began raising taxes, partly because of the need for revenues caused by
the significant economic slowdown of the early 1980s and partly in response to legislation that
doubled the federal cigarette tax, which went into effect in 1983. At least some of these tax increases
were most likely a response to the early economic research (described below) demonstrating that
higher cigarette taxes reduced smoking, particularly among youth and young adults (Lewit and
Coate, 1982; Lewit, Coate and Grossman, 1981). Further interest in raising state taxes to
discourage tobacco use was almost certainly stimulated by subsequent studies concluding that the
federal tax increase that went into effect in 1983 would prevent more than 100,000 deaths caused
bysmoking(e.g.,Warner,1986;Harris,1987).
tobaCCo taxation

© 2011 Robert Wood Johnson Foundation | April 2011 | RWJF Retrospective Series: The Impact of Tax and Smoke-Free Air Policy Changes page 10
The emerging evidence on the effectiveness of state cigarette taxes in reducing smoking
and improving public health inspired a renewed interest in using tax increases to discourage
tobacco use. In 1988 California led this next wave with a voter initiative—Proposition 99, the
Tobacco Tax and Health Protection Act—which increased the state’s cigarette excise tax by
25 cents per pack (then the largest single increase in a state cigarette tax) and raised other tobacco-
product taxes. Voters went further and earmarked 25 percent of the revenues generated from these
new state taxes to fund a comprehensive tobacco-control program. Massachusetts voters did the
same in 1992, approving Question 1, which raised the state cigarette tax by 25 cents per pack,
increased other tobacco product taxes, and recommended that part of the new revenues be used
to fund a comprehensive tobacco-control program.
State tobacco taxes continued to increase over the next two decades, with the inflation-
adjusted average state tax more than tripling since 1990. Nearly all states, even most major
tobacco growing/manufacturing states, have increased their cigarette excise tax in recent years,
and many have done so multiple times, often using the revenues generated from these taxes to
fund tobacco-control programs. Politicians from both parties have supported increases in excise
taxes on cigarettes, often pointing to the health benefits of reducing tobacco use. Similarly, public
support for these taxes tends to be high, particularly when the new revenues are earmarked for
comprehensive tobacco-control and other public health programs.
Over time, the number of states that also impose taxes on other tobacco products has
increased—all states now do so except Pennsylvania—as have the rates applied to these products.
These taxes have historically been ad valorem excises, levied as a percentage of distributor or
manufacturer price, although some states have moved to specific excises (usually based on weight)
in recent years to reduce the price gap between premium and discount brands. As with federal
taxes on other tobacco products, these taxes have historically accounted for a smaller percentage
of the total retail price, compared to the percentage of taxes in the total price of a cigarette pack.
However, many states have narrowed or closed this differential in efforts to reduce incentives to
substitute other tobacco products for cigarettes.
loCal tobaCCo taxation
Hundreds of communities also tax tobacco. While most apply relatively small taxes to cigarettes
and, in some cases to other tobacco products, a few cities and counties have in recent years
adopted significant local cigarette taxes. In 2002 New York City increased its cigarette tax from
8 cents per pack to $1.50 per pack, with the public health impact of the higher tax the primary
rationale for this unprecedented rise. Smokers buying cigarettes in New York City now pay more
than $5.25 per pack in local, state and federal excise taxes alone.
Over the past decade, Cook County, Illinois, raised its cigarette tax to $1 per pack, followed
a year later by an increase to $2 per pack. Chicago’s cigarette tax has risen 68 cents per pack on
top of that. A number of Alaska communities have adopted local taxes of $1 per pack or more,
and many Virginia communities have adopted or increased local taxes to 50 cents per pack or
more. The public health impact of the taxes has often been a motivating factor for these and the
many other local tax increases that have been imposed nationwide.
tobaCCo taxation

© 2011 Robert Wood Johnson Foundation | April 2011 | RWJF Retrospective Series: The Impact of Tax and Smoke-Free Air Policy Changes page 11
the relationshiP between tobaCCo taxes and tobaCCo PriCes
Sizable increases in state and local cigarette taxes have contributed to a significant increase in
inflation-adjusted cigarette prices over the past decade. While many factors influence price,
several studies demonstrate that the price of cigarettes rises to include the new taxes and
sometimes goes even higher. Figure 1 shows the growth in inflation-adjusted state and federal
cigarette excise taxes over the past two decades, while Figure 2 illustrates the clear relationship
between state cigarette taxes and average state-level cigarette prices.
Figur e 1
State and Federal Cigarette Taxes, 1990–2009
n State Taxn Federal Tax
Sep
tem
ber
20
09 D
olla
rs (i
nfla
tion-
adju
sted
)
1990 1991 1992 1993 1994 1995 1996 1997 1998 1999 2000 2001 2002 2003 2004 2005 2006 2007 2008 2009
Source: Tax Burden on Tobacco, 2009, and authors’ calculations
$2.00
$1.50
$1.00
$0.50
$0
0.42
0.27 0.32 0.31 0.37 0.36 0.35 0.34 0.33 0.32 0.320.44 0.42
0.410.46
0.46 0.440.43
0.42 0.39
1.01
0.42 0.42 0.43 0.47 0.45 0.42 0.44 0.46 0.50 0.53 0.51 0.59 0.71 0.75 0.80 0.86 0.94 1.01 1.12
Ave
rage
Cig
aret
te P
rice
Per
Pac
k
Figur e 2
State Cigarette Taxes and Prices, November 1, 2008
$7.00
$6.00
$5.00
$4.00
$3.00
$0 $0.50 $1.00 $1.50 $2.00 $2.50
State Tax Per Pack
Source: Tax Burden on Tobacco, 2009, and authors’ calculations. Note that state taxes do not include the significant local taxes imposed in some jurisdictions in some states (notably: New York City; Chicago, Cook County, and others in Illinois; and multiple communities in Alaska and Virginia, among other states); this accounts for some of the apparent outliers.
y = 1.2066x + 13.1132 R2 = 0.9214
tobaCCo taxation
© 2011 Robert Wood Johnson Foundation | April 2011 | RWJF Retrospective Series: The Impact of Tax and Smoke-Free Air Policy Changes page 12
Likewise, the settlements of state and local lawsuits against tobacco companies have resulted
in cigarette price increases. The pass-through of costs resulting from settlements of lawsuits with
Mississippi,Florida,TexasandMinnesotain1997and1998accountedformost,ifnotall,ofthe
more than 25 cents per pack increase in wholesale prices during this period. The November 1998
Master Settlement Agreement, which settled remaining lawsuits, resulted in an immediate
wholesalepriceincreaseof45centsperpack.
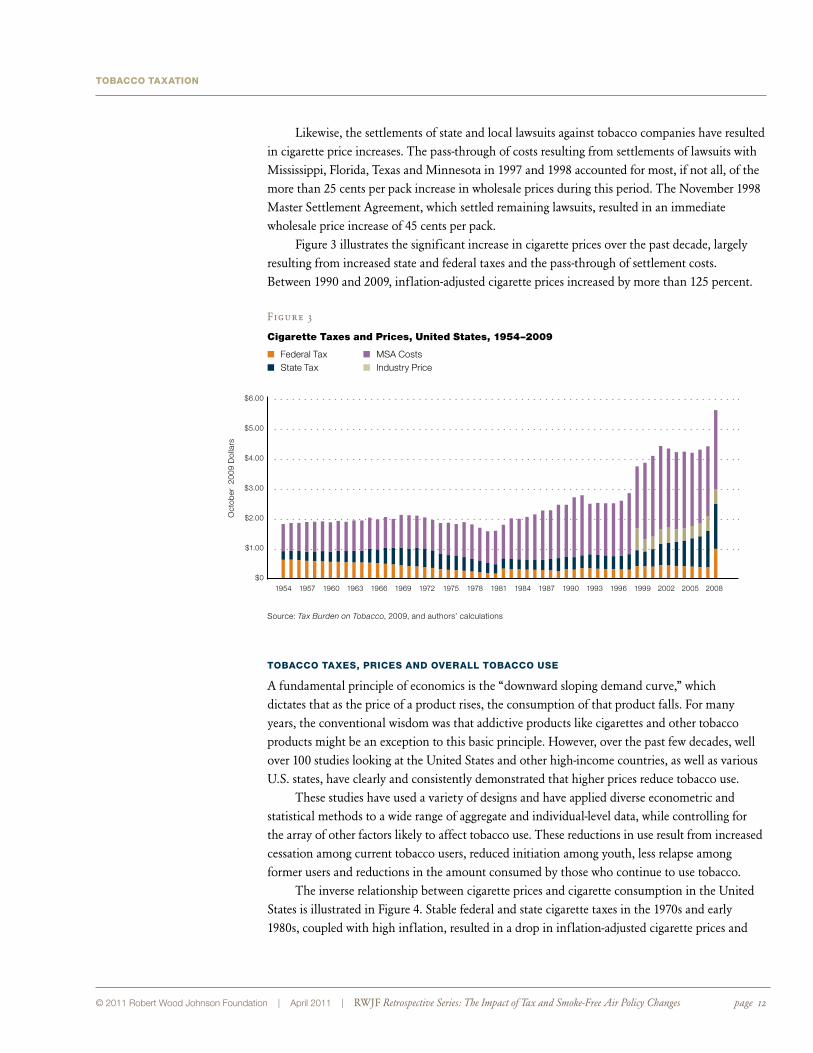
Figure 3 illustrates the significant increase in cigarette prices over the past decade, largely
resulting from increased state and federal taxes and the pass-through of settlement costs.
Between 1990 and 2009, inflation-adjusted cigarette prices increased by more than 125 percent.
tobaCCo taxation
tobaCCo taxes, PriCes and overall tobaCCo use
A fundamental principle of economics is the “downward sloping demand curve,” which
dictates that as the price of a product rises, the consumption of that product falls. For many
years, the conventional wisdom was that addictive products like cigarettes and other tobacco
products might be an exception to this basic principle. However, over the past few decades, well
over 100 studies looking at the United States and other high-income countries, as well as various
U.S. states, have clearly and consistently demonstrated that higher prices reduce tobacco use.
These studies have used a variety of designs and have applied diverse econometric and
statistical methods to a wide range of aggregate and individual-level data, while controlling for
the array of other factors likely to affect tobacco use. These reductions in use result from increased
cessation among current tobacco users, reduced initiation among youth, less relapse among
former users and reductions in the amount consumed by those who continue to use tobacco.
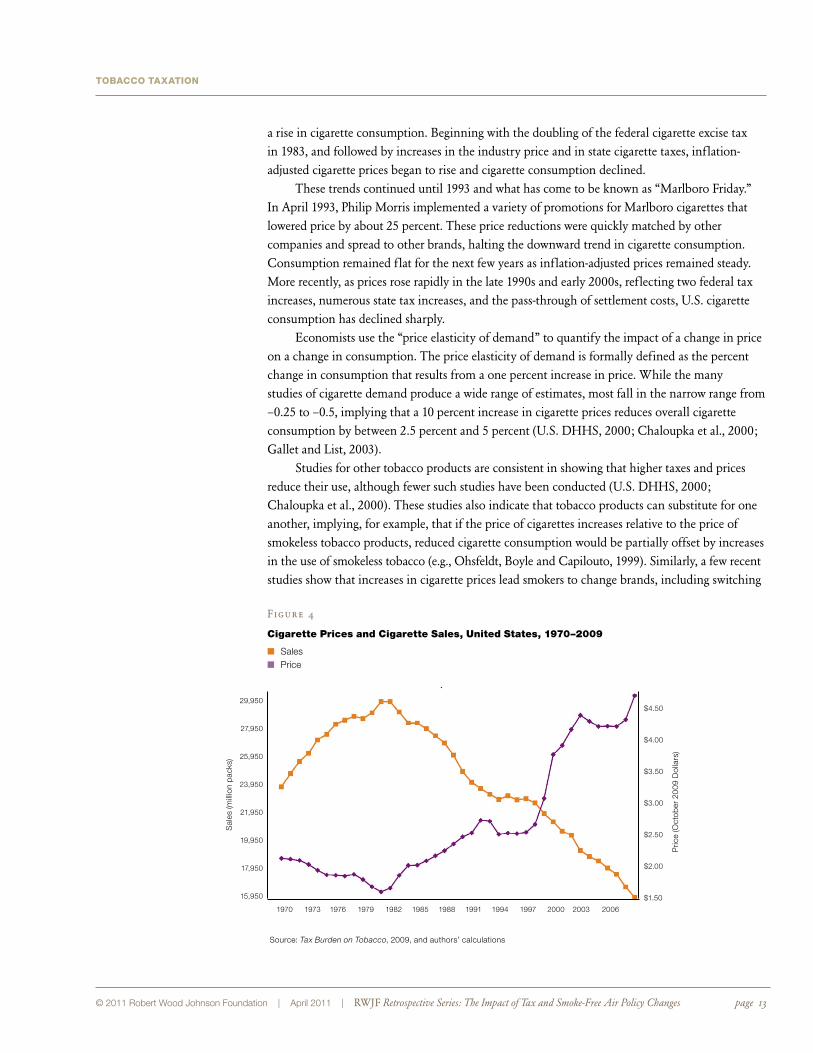
The inverse relationship between cigarette prices and cigarette consumption in the United
StatesisillustratedinFigure4.Stablefederalandstatecigarettetaxesinthe1970sandearly
1980s, coupled with high inflation, resulted in a drop in inflation-adjusted cigarette prices and
Figur e 3
Cigarette Taxes and Prices, United States, 1954–2009
n Federal Tax n MSA Costsn State Tax n Industry Price
Oct
ober
20
09 D
olla
rs
1954 1957 1960 1963 1966 1969 1972 1975 1978 1981 1984 1987 1990 1993 1996 1999 2002 2005 2008
Source: Tax Burden on Tobacco, 2009, and authors’ calculations
$6.00
$5.00
$4.00
$3.00
$2.00
$1.00
$0
© 2011 Robert Wood Johnson Foundation | April 2011 | RWJF Retrospective Series: The Impact of Tax and Smoke-Free Air Policy Changes page 13
a rise in cigarette consumption. Beginning with the doubling of the federal cigarette excise tax
in 1983, and followed by increases in the industry price and in state cigarette taxes, inflation-
adjusted cigarette prices began to rise and cigarette consumption declined.
These trends continued until 1993 and what has come to be known as “Marlboro Friday.”
In April 1993, Philip Morris implemented a variety of promotions for Marlboro cigarettes that
lowered price by about 25 percent. These price reductions were quickly matched by other
companies and spread to other brands, halting the downward trend in cigarette consumption.
Consumption remained flat for the next few years as inflation-adjusted prices remained steady.
More recently, as prices rose rapidly in the late 1990s and early 2000s, reflecting two federal tax
increases, numerous state tax increases, and the pass-through of settlement costs, U.S. cigarette
consumption has declined sharply.
Economists use the “price elasticity of demand” to quantify the impact of a change in price
on a change in consumption. The price elasticity of demand is formally defined as the percent
change in consumption that results from a one percent increase in price. While the many
studies of cigarette demand produce a wide range of estimates, most fall in the narrow range from
–0.25 to –0.5, implying that a 10 percent increase in cigarette prices reduces overall cigarette
consumption by between 2.5 percent and 5 percent (U.S. DHHS, 2000; Chaloupka et al., 2000;
Gallet and List, 2003).
Studies for other tobacco products are consistent in showing that higher taxes and prices
reduce their use, although fewer such studies have been conducted (U.S. DHHS, 2000;
Chaloupka et al., 2000). These studies also indicate that tobacco products can substitute for one
another, implying, for example, that if the price of cigarettes increases relative to the price of
smokeless tobacco products, reduced cigarette consumption would be partially offset by increases
in the use of smokeless tobacco (e.g., Ohsfeldt, Boyle and Capilouto, 1999). Similarly, a few recent
studies show that increases in cigarette prices lead smokers to change brands, including switching
Sal
es (m
illio
n p
acks
)
Figur e 4
Cigarette Prices and Cigarette Sales, United States, 1970–2009
n Salesn Price
Pric
e (O
ctob
er 2
009
Dol
lars
)
29,950
27,950
25,950
23,950
21,950
19,950
17,950
15,950
$4.50
$4.00
$3.50
$3.00
$2.50
$2.00
$1.50
1970 1973 1976 1979 1982 1985 1988 1991 1994 1997 2000 2003 2006
Source: Tax Burden on Tobacco, 2009, and authors’ calculations
tobaCCo taxation

© 2011 Robert Wood Johnson Foundation | April 2011 | RWJF Retrospective Series: The Impact of Tax and Smoke-Free Air Policy Changes page 14
from premium to discount brands (e.g., Tauras, Peck and Chaloupka, 2006) and switching to
longer cigarettes, or cigarettes higher in tar and nicotine (e.g., Evans and Farrelly, 1998).
Experiences from U.S. states that have significantly increased cigarette taxes, as well as from
a variety of high-income countries where taxes account for a much higher share of cigarette
prices, and where the per-pack price is well above that in the United States as a whole, suggest that
these estimates apply over a wide range of prices. These experiences also suggest that additional
increases in taxes and total prices would continue to reduce cigarette smoking by a comparable
magnitude. Recent studies that account for the addictive nature of cigarette smoking find that
smokers respond gradually to price increases so that the effect grows over time—the long-run
impact of price is about twice as large as the immediate impact (Chaloupka, 1991; Becker,
GrossmanandMurphy,1994;Chaloupka,TaurasandGrossman,2000).
taxes, PriCes, and adult PrevalenCe and Cessation
A growing number of studies based on individual-level survey data attempt to disentangle the
effects of taxes and higher prices on prevalence and consumption. These studies generally find
that about half of the drop in overall cigarette consumption that results from a price increase
reflects a decline in smoking prevalence, with the remainder accounted for by reductions in the
number of cigarettes consumed by continuing smokers (e.g., Hu et al., 1995; Farrelly et al., 2001).
Estimates from most of these studies indicate that a 10 percent increase in price reduces adult
smoking prevalence by between 1 percent and 2.5 percent. The relationship between cigarette
prices and adult smoking prevalence is illustrated in Figure 5. As with cigarette consumption, the
downward trend in adult prevalence was halted in the mid-1990s following the Marlboro Friday
price cuts and resumed later in the decade as taxes and prices rose. During much of the first
decade of the 21st century, prior to the 2009 federal tax increase, cigarette prices held steady and
the downward trend in prevalence flattened out.
Figur e 5
Cigarette Prices and Adult Smoking Prevalence, United States, 1970–2008
n Prevalencen Price
Pre
vale
nce
Price (O
ctober 20
09 Dollars)
39
35
31
27
23
19
$4.50
$4.00
$3.50
$3.00
$2.50
$2.00
$1.50
1970 1973 1976 1979 1982 1985 1988 1991 1994 1997 2000 2003 2006
Note: Grey data points for prevalence are interpolated assuming linear trend.
Sources: National Health Interview Surveys, various years; Tax Burden on Tobacco, 2009; and authors’ calculations
tobaCCo taxation

© 2011 Robert Wood Johnson Foundation | April 2011 | RWJF Retrospective Series: The Impact of Tax and Smoke-Free Air Policy Changes page 15
Changes in adult prevalence result from increased cessation among adult smokers, rather
thansmokinginitiation,mostofwhichoccursduringadolescence(U.S.DHHS,1994).Early
studies of the relationship between cigarette prices and smoking cessation based on retrospective,
cross-sectional data found that higher prices reduced the duration of smoking and increased the
likelihoodofquitting(DouglasandHariharan,1994;Douglas,1998).
More recent studies based on longitudinal data that directly assesses cessation behavior
conclude that higher cigarette prices increase the likelihood that a smoker will try to quit
smoking. Tauras and Chaloupka (2001), for example, estimate that a 10 percent increase in
cigarette prices increases the probability of a quit attempt among young adult smokers by
between 6 percent and 9 percent. In a subsequent study that accounted for unsuccessful quit
attempts,Tauras(2004)estimatesthata10percentpriceincreaseincreasesthelikelihood
of a successful quit attempt by about 3.5 percent.
Figure 6 illustrates the association between cigarette prices and cessation; consistent
with the findings from more rigorous empirical studies, there is a higher percentage of former
smokers in states with higher cigarette prices.
Recent research on the demand for cessation pharmacotherapies produces consistent
findings. Tauras and his colleagues (2003, 2005), for example, find that higher cigarette prices
increase the sales of nicotine replacement products.
Ad
ult P
reva
lenc
e
Figur e 6
Cigarette Prices and Former Smoking Rates, 50 States and District of Columbia, 2007
31.5
29.5
27.5
25.5
23.5
21.5
19.5
17.5
15.5
$3.25 $3.75 $4.25 $4.75 $5.25 $5.75 $6.25
Price Per Pack
Source: Behavioral Risk Factor Surveillance System, 2009; Tax Burden on Tobacco, 2009; and author’s calculations
tobaCCo taxation
© 2011 Robert Wood Johnson Foundation | April 2011 | RWJF Retrospective Series: The Impact of Tax and Smoke-Free Air Policy Changes page 16
taxes, PriCes, and youth and young adult tobaCCo use
Economic theory suggests several reasons that prices have more impact on youth smoking,
compared to adult smoking (Chaloupka, 2003; Chaloupka et al., 2000). These include:
• Lowerdisposableincomeofthetypicalyouth,suchthatchangesinthepricesofany
of the products they consume will have a greater impact on their consumption.
• Greaterimportanceofpeerbehavioramongyouth,withprice-inducedchangesinthe
smoking behavior of some youth leading to changes in the smoking behavior of others.
• Shortersmokinghistoriesofyoungersmokers,suggestingthattheymaybelessaddicted
and able to respond more quickly to price changes.
• Greaterrelativeimportanceofshort-termcosts(e.g.,price)comparedtolong-termcosts
(e.g., health consequences), given the greater propensity of youth to discount the future.
• Otherchannelsthroughwhichpriceindirectlyinfluencesyouthsmoking(e.g.,reducing
parental smoking).
Early research on youth smoking based on cross-sectional survey data confirmed these
predictions. In the first studies of the impact of price on youth, young adult and adult smoking,
Lewit and his colleagues (1981, 1982), found that smoking among teens was about three times
more responsive to price than among adults, with young adults about twice as responsive as older
adults. While some studies do not find differences in the effects of price on smoking among
different age groups (e.g., Wasserman et al., 1991), most studies have confirmed the greater impact
among younger persons. For example, Harris and Chan (1999) estimated that a 10 percent price
increasewouldreducesmokingbyabout10percentamong15-through17-year-olds;almost
8percentamong18-through20-year-olds;between6percentand7percentamong21-through
26-year-olds;andjustover3percentamong27-through29-year-olds.Similarly,asmallnumber
of studies have examined the impact of smokeless tobacco taxes and concluded that higher taxes
are effective in reducing the prevalence and frequency of youth use of these products (e.g.,
Chaloupka,TaurasandGrossman,1997;Taurasetal.,2007).
TherelationshipsbetweencigarettepricesandyouthsmokingareillustratedinFigures7and
8, which show cigarette prices and youth smoking rates over time and across states, respectively.
As with cigarette sales and adult prevalence, youth smoking responds inversely to price. The rise
in youth smoking in the mid-1990s, is in part explained by the Marlboro Friday price cuts of 1993;
Gruber and Zinman (2001), for example, estimate that more than one-quarter of the increase was
caused by price reductions for Marlboro and other leading brands. The declines beginning in the
late 1990s and continuing for much of the first decade of the 21st century are partly explained by
the increased prices that followed state and federal tax increases and the pass-through of litigation
settlement costs.
A few recent studies have explored the direct and indirect influences of price on youth
smoking that are suggested by economic theory (Chaloupka, 2003). For example, Powell and
colleagues (2005) found that more than one-third of the overall impact of price on youth
smoking is linked to peer behavior—that is, as some youth are deterred from smoking by higher
prices, other youth are less likely to smoke because fewer of their peers smoke. Similarly, Powell
and Chaloupka (2005) found that about one-fifth of the overall impact of price on youth
smoking is explained by the effects of price on parental smoking.
tobaCCo taxation

© 2011 Robert Wood Johnson Foundation | April 2011 | RWJF Retrospective Series: The Impact of Tax and Smoke-Free Air Policy Changes page 17
Figur e 7
Cigarette Prices and Youth Smoking Prevalence, United States, 1991–2008
n Cigarette price n 10th grade prevalencen 12th grade prevalence n 8th grade prevalence
Pric
e P
er P
ack
(Feb
uary
20
09 D
olla
rs)
Sm
okin
g P
reva
lenc
e
36
31
26
21
16
11
6
$4.50
$3.75
$3.00
$2.25
1991 1993 1995 1997 1999 2001 2003 2005 2007
Source: Monitoring the Future, 2008; Tax Burden on Tobacco, 2009; and author’s calculations
Pre
vale
nce
Figur e 8
Cigarette Prices and 12 to 17-Year-Old Smoking Prevalance Rates, 50 States and District of Columbia, 2005/2006
16
15
14
13
12
11
10
9
8
7
$3.00 $3.50 $4.00 $4.50 $5.00 $5.50 $6.00
Price Per Pack
Source: Monitoring the Future, 2008; Tax Burden on Tobacco, 2009; and author’s calculations
tobaCCo taxation

© 2011 Robert Wood Johnson Foundation | April 2011 | RWJF Retrospective Series: The Impact of Tax and Smoke-Free Air Policy Changes page 18
More recent research has focused on the role of cigarette prices in the youth smoking
uptakeprocess.TheSurgeonGeneral(U.S.DHHS,1994)describesuptakeasmovingthrough
several stages, including experimentation, regular smoking and addiction. A few recent studies
using cross-sectional data find that prices have relatively little impact on the early stages of
smoking uptake, but have a much greater impact on moving from experimentation into regular
smoking and, eventually, addiction (e.g., Gruber and Zinman, 2001; Liang and Chaloupka, 2002;
Emery et al., 2001; Ross et al., 2006). This is consistent with the observation that most youth at
early stages of uptake smoke few cigarettes and typically get their cigarettes from social sources,
while those smoking more regularly are more likely to buy their own cigarettes and thus be more
directly influenced by price.
This finding is generally confirmed by studies using longitudinal data on youth (for an
exception, see DeCicca et al., 2002). For example, Tauras and colleagues (2001) use the
Monitoring the Future longitudinal data on youth smoking, with baseline data collected from
eighth and tenth graders in the early 1990s, to examine the impact of cigarette price on smoking
initiation. These data are ideal given the multiple cohorts (six) they include and the fluctuation
of cigarette prices in the 1990s. Tauras and colleagues estimate that a 10 percent price increase
reduces the probability of any smoking initiation (including experimentation) by 1 percent to
3 percent; reduces the probabilities of initiating daily smoking by 8 percent to 12 percent; and
reduces the probability of heavy daily smoking (half pack or more per day) by 10 percent to
14percent.Tauras(2005)findssimilareffectsinhismorerecentresearchontheeffectsofprice
on smoking escalation among young adults, concluding that higher cigarette taxes and prices are
most effective in keeping young adults from moving from less than daily smoking into daily
and heavy daily smoking.
differenCes in the effeCts of taxes and PriCes by soCioeConomiC status
Economic theory predicts that the effects of price on consumption will be larger among lower-
income consumers than among higher-income consumers, if all else remains the same. Several
studies have examined differences in price responsiveness by income and related characteristics
(e.g., education and socioeconomic class), and generally conclude that persons in lower
socioeconomic groups are more responsive to changes in cigarette prices than those in higher
socioeconomic groups.
Farrelly and colleagues (2001), for example, estimate that smoking among persons in U.S.
households below the median income level was about four times more responsive to changes in
cigarette prices than smoking among those in higher-income households. Similarly, Chaloupka
(1991) found that smoking among less-educated people was more sensitive to price than among
moreeducatedpersons,whileTownsendandcolleagues(1994)foundthatsmokingamongpeople
in the lowest socioeconomic classes in the United Kingdom was much more responsive to price
than among those in the highest socioeconomic classes.
Emerging evidence from low and middle-income countries produces similar findings, with
smoking in the lowest-income countries more influenced by price than smoking in higher-income
countries (Ross and Chaloupka, 2006).
tobaCCo taxation

© 2011 Robert Wood Johnson Foundation | April 2011 | RWJF Retrospective Series: The Impact of Tax and Smoke-Free Air Policy Changes page 19
summary
Research evidence clearly demonstrates that increases in cigarette taxes result in at least
comparable increases in cigarette prices. Well over 100 studies from the past three decades have
consistently found that these higher prices significantly reduce cigarette smoking by motivating
current smokers to quit, preventing youth from becoming regular smokers and reducing
consumption among those who continue to smoke. Price elasticity estimates from studies are
generally consistent, with most indicating that a 10 percent increase in cigarette prices reduces
overall consumption by between 2.5 percent and 5 percent; about half the overall impact is on
prevalence and the remainder on consumption among continuing smokers, with even greater
effects among young people and those in lower socioeconomic groups. This evidence has played
a critical role in motivating governments at all levels to adopt and increase taxes as a way of
promoting public health by reducing tobacco use and the death and disease it causes.
tobaCCo taxation
© 2011 Robert Wood Johnson Foundation | April 2011 | RWJF Retrospective Series: The Impact of Tax and Smoke-Free Air Policy Changes page 20
Smoke-Free Air Policies
diffusion of smoke-free air PoliCies
state and local governments have restricted smoking in a variety of places for
many years. The earliest of these policies typically limited smoking in venues such
as theaters and food preparation areas, and were intended to prevent fires or food
contamination. Further policies were adopted as more evidence emerged about the
health consequences of smoking (including limited evidence about the consequences of exposing
nonsmokerstotobaccosmoke,whichwasfirstreportedbytheSurgeonGeneralina1972
report(U.S.DepartmentofHealth,EducationandWelfare[U.S.DHEW],1972).
Theearliestofthesestatepolicieswasa1973Arizonalawwhichlimitedsmokingina
numberofplaces.In1974Connecticutbecamethefirststatetorestrictsmokinginrestaurants
andin1975Minnesotabecamethefirsttodosoinprivateworksites.In1977Berkeley,California,
adopted the first local restrictions on smoking in restaurants and other public places. Over the
next few years, a growing number of state and local governments adopted increasingly strong
restrictions.
Given the success of Berkeley’s local ordinance and the adoption of comparable ordinances
in other California communities, legislative efforts were undertaken and ballot initiatives
proposed to enact statewide restrictions on smoking. Somewhat surprisingly, given that California
has been at the forefront of other tobacco-control efforts (e.g., higher taxes and funding for
comprehensive tobacco-control programs), voters twice rejected ballot initiatives (Proposition 5
in1978andProposition10in1980)andthelegislaturerejectedsimilarmeasures.Thefailureat
the state level led to increased momentum for strong local policies, resulting additional
ordinances restricting smoking in San Francisco, Los Angeles, Sacramento, San Diego and many
other California communities in the early 1980s.
The local successes in California and the lack of action (or adoption of relatively weak
policies) at the state level led to similar local efforts across the United States. These grassroots
efforts were supported by a variety of organizations, including Americans for Nonsmokers’ Rights
(ANR), the Group Against Smoking Pollution, the American Lung Association, the American
Heart Association and the American Cancer Society. Efforts to mobilize support for local
ordinances included intensive public education efforts and the resulting ordinances typically went
as far in restricting smoking as public sentiment allowed (U.S. DHHS, 2006). In some states, the
smoke-free
air PoliCies

© 2011 Robert Wood Johnson Foundation | April 2011 | RWJF Retrospective Series: The Impact of Tax and Smoke-Free Air Policy Changes page 21
spread of local ordinances eventually led to state policies limiting smoking, but in some instances
those policies pre-empted communities from adopting more restrictive ordinances.
Momentum for smoke-free policies increased significantly with the release of the 1986
Surgeon General’s report, The Health Consequences of Involuntary Smoking, which concluded that
exposure to tobacco smoke caused diseases, including lung cancer, and that children of smoking
parents were at increased risk of respiratory diseases (U.S. DHHS, 1986). In addition, the report
found that simply separating smokers and nonsmokers might reduce, but did not eliminate, the
exposure risks. This report prompted new federal regulations banning smoking on domestic
flights of two hours or less and, eventually, on virtually all domestic flights (in 1990) and all
international flights departing from or arriving in the United States (in 2000). Similarly, it
spurred state and local government to strengthen existing policies and to adopt new policies,
including complete bans on smoking in some venues (e.g., health care facilities). In addition, it
led numerous private companies to adopt policies governing smoking in their workplaces.
As evidence mounted about the risks of tobacco smoke to nonsmokers, state and local
policiesgrewincreasinglystrong.The1997releaseoftheCaliforniaEnvironmentalProtection
Agency’s(EPA)reportonthehealthconsequencesofexposure(CaliforniaEPA,1997)was
followed in 1998 by California’s law banning smoking in bars without separately ventilated
smoking areas. In 2002 New York City made history by banning smoking in bars, restaurants and
virtually all other workplaces beginning the following year, while Florida voters overwhelmingly
supported a ballot initiative that, with some exceptions (notably in bars), did the same. By 2003
every state and thousands of localities had adopted policies limiting or banning smoking in a
variety of locales. The growth and strengthening of these state policies is illustrated in Figure 9.
smoke-free
air PoliCies
Figur e 9
Restrictiveness of State Laws Regulating Smoking in Public Places, 1960–2003
n Extensive n Basicn Moderate n Nominal
1960 1964 1970 1971 1973 1975 1977 1979 1981 1983 1985 1987 1989 1991 1993 1995 1997 1999 2001 2003
Note: Classification scheme from 1989 Surgeon General’s Report (U.S. DHHS, 1989) used to define restrictiveness as follows: Nominal—one to three public places, not including restaurants or worksites; Basic—four or more public places, not including restaurants or worksites; Moderate—regulates smoking in restaurants but not worksites; Extensive—regulates smoking in private worksites.
Source: Roswell Park Cancer Institute and the ImpacTeen Project, unpublished data
Num
ber
of S
tate
s
50
40
30
20
10
0

© 2011 Robert Wood Johnson Foundation | April 2011 | RWJF Retrospective Series: The Impact of Tax and Smoke-Free Air Policy Changes page 22
Most recently, the 2006 Surgeon General’s report The Health Consequences of Involuntary
Exposure to Tobacco Smoke (U.S. DHHS, 2006) stimulated further action, leading a growing
number of states and communities to adopt comprehensive bans on cigarette smoking in virtually
all public places and private worksites, as well as some outdoor spaces (e.g., sports stadiums and
publicparks).Asofearly2010,34states,Washington,D.C.,andhundredsofcommunities
had adopted comprehensive smoke-free air policies banning smoking in some combination of
restaurants, bars and/or private worksites, while similar measures are pending in a number of
other jurisdictions (American Nonsmokers’ Rights Foundation [ANRF], 2010). The growth in
these comprehensive policies from 1991 through 2008 is illustrated in Figure 10.
Comprehensive state policies (including those scheduled to take effect in the future), coupled
with comparable local policies, currently apply to nearly three-quarters of the U.S. population.
Further limits on smoking are beginning to appear in some jurisdictions, with new policies
banning smoking in casinos and a wide variety of outdoor spaces, prohibiting smoking in private
cars when children are present, and limiting smoking in multi-unit housing complexes.
In addition, as awareness of the health consequences of exposure to tobacco smoke grew
and public and private policies were implemented and strengthened, a growing number of
households, including those of smokers, adopted personal rules governing smoking in the home.
By 2002 about two-thirds of U.S. households had smoke-free rules in place at home (U.S. DHHS,
2006; International Agency for Research on Cancer [IARC], 2009).
Figur e 10
Major Smoke-Free Air Legislation in the 50 States and District of Columbia, 1991–2008
n Smoke-free worksites, restaurants and bars n Smoke-free worksitesn Smoke-free restaurants and bars n Smoke-free restaurantsn Smoke-free worksites and restaurants
Num
ber
of S
tate
s
1991 1992 1993 1994 1995 1996 1997 1998 1999 2000 2001 2002 2003 2004 2005 2006 2007 2008
Source: Giovino GA, Chaloupka FJ, Hartman AM, et al. Cigarette Smoking Prevalence and Policies in the 50 States: An Era of Change—The Robert Wood Johnson Foundation ImpacTeen Tobacco Chart Book. Buffalo, NY: University at Buffalo, State University of New York, 2009.
35
30
25
20
15
10
5
00 0 0 0
4 4 4 4 4 4 4
6
9
12
16
23
29
32
smoke-free
air PoliCies

© 2011 Robert Wood Johnson Foundation | April 2011 | RWJF Retrospective Series: The Impact of Tax and Smoke-Free Air Policy Changes page 23
imPaCt of smoke-free air PoliCies
In general, research suggests that smoke-free policies are self-enforcing and that compliance is
highwithinashorttimeaftertheirimplementation(e.g.,JacobsonandWasserman,1997,1999;
Borland et al., 2006; IARC, 2009). As a result, these policies are highly effective in reducing
nonsmokers’ exposure to tobacco smoke (Task Force on Community Preventive Services, 2001,
2005; U.S. DHHS, 2006; IARC, 2009). Somewhat surprisingly perhaps, most smokers residing in
communities where smoking is banned in restaurants indicate that they support such bans
(Borland et al., 2006). For example, in one recent survey, 83 percent of Irish smokers said that the
comprehensivesmokingbanimplementedinIrelandinMarch2004wasa“good”or“verygood”
policy (Fong et al., 2006).
In addition to protecting nonsmokers from exposure to tobacco smoke, these policies are
effective in reducing cigarette smoking, both by encouraging adult smokers to quit and preventing
youth from starting. These reductions result, in part, from the strengthening of social norms
against smoking that follows the adoption of new policies, as well as from limiting opportunities
to smoke and raising the “costs” (e.g., the inconvenience of or discomfort associated with
smoking outdoors).
Dozens of studies have assessed the relationship between smoke-free policies and smoking
behavior, using alternative designs and both aggregated and individual-level data, with many
focused on assessing the causal nature of these relationships. Comprehensive reviews of the
research evidence on the impact of smoke-free workplace policies by the NCI (2000), the Task
Force on Community Preventive Services (2001, 2005), the Surgeon General (U.S. DHHS, 2006),
and the International Agency for Research on Cancer (2009) find that these policies cause some
smokers to quit and reduce the number of cigarettes consumed by those who continue to smoke.
Likewise, among youth and young adults, these policies are associated with stronger
perceptions of the risks from smoking and the perception that fewer adults smoke. These factors
and the increased “costs” of smoking associated with the policies help explain the consistent
findings from a growing number of studies that comprehensive smoke-free air policies reduce
youth smoking prevalence, initiation and uptake (Task Force on Community Preventive Services,
2005; U.S. DHHS, 2006; IARC, 2009).
The associations between state smoke-free air policies and adult and youth smoking
prevalence are illustrated in Figures 11 and 12, respectively. While these simple graphs do not
control for the other factors that affect smoking prevalence, or for the potential reverse causality
between prevalence and state policies, they are consistent with the extensive and growing body
of research that does incorporate these factors. Both figures use an index developed by the
ImpacTeen Project to reflect the number of places covered by state smoke-free air policies and
the extent of their restrictions (which range from no restrictions to a complete ban).
smoke-free
air PoliCies

© 2011 Robert Wood Johnson Foundation | April 2011 | RWJF Retrospective Series: The Impact of Tax and Smoke-Free Air Policy Changes page 24
Age
s 12
–17
Sm
okin
g P
reva
lenc
e
Figur e 1 2
Smoke-Free Air Policies and Youth Smoking Prevalence, 2003–2004
20
18
16
14
12
10
8
6
0 10 20 30 40 50
Smoke-Free Air, State Policy Index
Source: Substance Abuse and Mental Health Services Administration (2006a) and Roswell Park Cancer Institute and the ImpacTeen Project, unpublished data
y = –0.052x + 13.851 R2 = 0.0885
Ad
ult S
mok
ing
Pre
vale
nce
Figur e 1 1
Smoke-Free Air Policies and Adult Smoking Prevalence, 2003–2004
31
29
27
25
23
21
19
17
15
0 10 20 30 40 50
Smoke-Free Air, State Policy Index
Source: Substance Abuse and Mental Health Services Administration (2006a) and Roswell Park Cancer Institute and the ImpacTeen Project, unpublished data
y = –0.0791x + 26.516 R2 = 0.1169
summary
Growing evidence of the health consequences of exposure to tobacco smoke led many governments
to adopt policies that first restricted and eventually banned smoking in a variety of public places,
including bars and restaurants, as well as in private worksites. These policies are generally self-
enforcing with high compliance, and substantially reduce nonsmokers’ exposure to tobacco smoke
and the associated health consequences. These policies also have proven effective in reducing
smoking by inducing adult smokers to quit and preventing young people from ever starting.
smoke-free
air PoliCies

© 2011 Robert Wood Johnson Foundation | April 2011 | RWJF Retrospective Series: The Impact of Tax and Smoke-Free Air Policy Changes page 25
Modeling the Impact of Tobacco Taxes and Smoke-Free Policies
increases in cigarette taxes and prices and the adoption and strengthening of smoke-free air
policies will substantially reduce the death and disease caused by cigarette smoke. A few
early studies used estimates of the impact of price on smoking prevalence to predict that
significant federal cigarette excise tax increases would prevent hundreds of thousands of
prematuredeaths(e.g.,Warner,1986;Harris,1987).Morerecentstudieshavedirectlydemon-
strated the link between higher cigarette taxes and improved health outcomes. For example,
Moore (1996) used state-level data on death rates from smoking-related diseases to estimate that
a 10 percent increase in cigarette taxes would prevent more than 5,000 smoking-attributable
premature deaths each year in the United States. Likewise, Ringel and Evans showed that higher
cigarette excise taxes reduce smoking prevalence among pregnant women and that birth outcomes
improve as a result (Ringel and Evans, 2001; Evans and Ringel, 1999). Similarly, a growing
number of studies from various jurisdictions in the United States, Canada, Scotland, Italy and
elsewhere have found that cardiovascular health improves significantly following the adoption
and implementation of a comprehensive smoke-free policy (IARC, 2009).
methodology
Over the past decade, multiple simulation models have been developed that assess and predict
the impact of tobacco-control interventions on smoking prevalence, premature deaths caused by
smoking, tax revenues, health care costs and related outcomes (Levy and Zaloshjna, in progress;
Chaloupka and Tauras, 2009). Of these, the SimSmoke tobacco-control policy simulation model
is the most well-developed for projecting the impact of changes in tobacco taxes, smoke-free air
policies, mass-media campaigns, limits on youth access to tobacco and cessation interventions.
For this analysis, we use SimSmoke to assess the impact on cigarette smoking and smoking-
attributable deaths from 1993 through 2063 of: 1) increases in state and federal cigarette excise
taxes, and 2) adoption and strengthening of state smoke-free air policies.
Discussed in detail elsewhere (Levy et al., 2010; Levy et al., 2006; Levy et al., 2002; Levy et
al., 2000; Levy et al., 2005a; Levy et al., 2005b), SimSmoke begins in 1993, a year chosen for the
availability of key smoking-prevalence data. In this model, the population, distinguished by age,
evolves over time through birth and death rates following a discrete first-order Markov process.
modeling
the imPaCt

© 2011 Robert Wood Johnson Foundation | April 2011 | RWJF Retrospective Series: The Impact of Tax and Smoke-Free Air Policy Changes page 26
The 1993 population is further divided into never, current and former smokers (by year,
corresponding to years quit). Smokers are defined as individuals who have smoked more than
100 cigarettes in their lifetime and are currently smoking some or all days. Former smokers are
defined as those who have smoked more than 100 cigarettes, but are not currently smoking and
are distinguished by years quit. Those who have not smoked 10 cigarettes are never smokers.
Individuals are classified as never smokers from birth until the age when they initiate smoking.
In the absence of policy changes, individuals evolve into and out of smoking through initiation,
cessation and relapse following a discrete first-order Markov process. To insure stability of the
model, initiation rates at a particular age are measured as the difference between the prevalence
of smoking at that age and the prevalence of smoking among individuals one year younger.
Since almost all initiation occurs before age 25 (U.S. DHHS, 1992), initiation is tracked only
untilthatage.Cessationandrelapsearetrackedafterage24,whenthosewhoquitmaystillhave
elevated mortality risks (U.S. DHHS, 1990). One-year cessation rates are defined as the number
of people who were smokers one year ago and had quit at the time of the survey.
Smoking-attributable deaths in the SimSmoke model are estimated using standard
attribution methods (Shultz et al., 1991). The relative risks, prevalence rate of smokers and
ex-smokers, and death rates are used to estimate separate death rates for never smokers, smokers,
and ex-smokers. The number of smokers and ex-smokers at each age is then multiplied by their
respective death rate minus the death rate of never smokers to obtain the excess deaths due to
smoking. Data sources for the full SimSmoke model, including modules not employed in this
analysis, are presented in Table 2.
Table 2
Data Used in SimSmoke
Variable Current Source Current Specifications
I. Population Model
A. Population 1993 Current Population Survey (CPS) Breakdowns by age
B. Fertility rates U.S. Census Vital Rate Inputs Tables Breakdowns by age
C. Mortality rates 2000 Multiple Cause-of-Death File Breakdowns by age
II. Smoking Model
A. Baseline smoking rates Tobacco Use Supplement of the CPS Based on 100+ cigarettes for current and ex-smokers (1992–1993) for age 15+, and 1993 lifetime and distinction between Teenage Attitudes and Practices current and former smokers. Survey for < age 15. Breakdowns by age and for former
smokers by years quit (<1, 1–2, 3–5, 6–10, 11–14, 15+ years)
B. Initiation rates Change in smoking rates between Breakdowns by age contiguous age groups
C. First-year cessation rates Calculated from cessation module Breakdowns by age with adjusters for demographic group based on the CPS
continued on next page
modeling
the imPaCt
© 2011 Robert Wood Johnson Foundation | April 2011 | RWJF Retrospective Series: The Impact of Tax and Smoke-Free Air Policy Changes page 27
Data Used in SimSmoke (continued)
Variable Current Source Current Specifications
II. Smoking Model (continued)
D. Relapse rates U.S. DHHS, 1990, and various Breakdowns by age studies (Gilpin et al., 1997; Hughes
et al., 2004; McWhorter et al., 1990)
E. Relative death risks of Cancer Prevention Study II— Breakdowns by age smokers and ex-smokers see National Cancer Institute 1997;
U.S. DHHS, 2004
III. Policy Modules
A. Price and Taxes Tobacco Institute, Prices and CPI for 1993–2002 www.bls.gov/cpi/home.htm As available at the ImpacTeen website
B. Clean-air laws As available at the ImpacTeen website Different types of laws and their stringency
C. Tobacco-control spending ImpacTeen Expenditures per capita
D. Youth access CDC, SAMHSA (Levy et al., 2001) Enforcement checks, penalties, community campaigns, self-service and vending machine bans
E. Cessation-treatment policies Various sources (Levy et al., 2010) Quitlines, financial coverage and health care provider interventions
Over time, smoking rates are affected by changes in policy. Each policy is expressed in
terms of a percentage reduction: PR = (post-policy rate– initial rate)/initial rate. Policies have
their greatest effect on cessation directly through an additive effect on prevalence [i.e., prevalence*
(1+PR)] spread equally over the first three years that the policy is in effect. The percentage
reduction is also applied to the initiation rate as (1+PR) and to the first-year cessation rate as
(1-PR) while the policy is in effect. When more than one policy is being modeled, the percentage
reductions are multiplied, implying that the effect of an additional policy is reduced
proportionally to the effect of any other policy.
SimSmoke models the effects of price interventions (taxes), smoke-free air policies, tobacco-
control mass-media campaigns and other interventions. Estimates for the impact of these policies
and interventions on smoking rates are based on the evidence from current research, as well as
the advice of an expert panel. This includes evidence on the effects of taxes/prices and smoke-free
air policies on youth and adult smoking described earlier in this paper. The SimSmoke model has
beenvalidatedfortheUnitedStates(Levyetal.,2005),variousstates(Levyetal.,2007;Levy
etal.,2007;Levyetal.,2008)andseveralnations(Levyetal.,2008;Levyetal.,inpress).Forthe
U.S. model used here, validation has been conducted by examining how well the model predicts
actual smoking rates for the period 1993–2008.
When estimating the impact of tax increases (Levy et al., 2000), the effects are modeled as
age-specific constant proportional effects on prevalence, initiation and cessation rates resulting
from the higher prices associated with a tax increase. Changes in price are then translated into
changes in smoking prevalence through an equation dependent on price elasticities. Based on the
extensive evidence described above of differences in price elasticity by age, the model shows that
a 10 percent increase in price reduces prevalence by 6 percent for individuals below age 18; by
modeling
the imPaCt

© 2011 Robert Wood Johnson Foundation | April 2011 | RWJF Retrospective Series: The Impact of Tax and Smoke-Free Air Policy Changes page 28
3percentforthoseages18to24;by2percentforthoseages25to34;andby1percentforthose
ages 35 and above. When the tax rate changes, an equation translates that change directly into
a price change of the same magnitude. Prices are measured in real (i.e., inflation-adjusted) terms;
for future taxes, we assume that the real values of average state taxes and the federal tax in 2009
are maintained over time.
The SimSmoke smoke-free air policy module focuses on smoke-free policies in three venues:
private worksites, restaurants and bars (Levy et al., 2001). Based on empirical evidence, a
comprehensive smoke-free policy is modeled as reducing smoking prevalence by 10 percent,
compared to the prevalence when no smoke-free policy is in place. Given the research evidence,
policies covering private worksites are assumed to have the largest effect (an estimated seven of
the 10 percent reduction in prevalence), with smaller impacts from smoke-free restaurant laws
(2% reduction) and laws covering bars (1% reduction). Given the evidence that less comprehensive
policies have weaker effects, the smoke-free policy component of the model is modified to
account for less than complete restrictions, with smoking restricted to a common area having
25 percent of the effect of a comprehensive policy and smoking restricted to ventilated areas as
having 50 percent of the comprehensive policy effect.
Because this approach involves non-linearities in the policies (where marginal changes at the
top—e.g., moving to a complete ban—have a larger impact than those at the bottom—e.g., moving
from no policy to limited restrictions) and because the values of aggregated measures based on
state policies will fall between the four levels that are modeled, we assumed a linear interpolation
of the effects. More details on these underlying assumptions are contained in Levy et al. (2001,
2003,2004),withestimatedeffectsizesbasedontheresearchevidencedescribedabove.
Actual policies for the United States are programmed into the model for the period from
1993 through mid-2009. Because most policies are at the state level, policies are entered into the
national model as a population-weighted average of the policies in states. We tested alternative
measures weighted based on adult population, cigarette sales and number of adult smokers; results
from these alternative measures are consistent with those presented below. The policy measures
were obtained from the ImpacTeen state tobacco-control policy database (www.impacteen.org).
To assess and project the impact of state and federal taxation and of state smoke-free air
policies implemented since 1993, we compared two scenarios: 1) what would have happened had
there been no tax or policy changes since January 1993, and 2) what actually happened as a result
of policies adopted from January 1, 1993, through June 30, 2009. The difference between the
estimated prevalence under each scenario represents the effects of policies implemented from
1993 to 2009. Similarly, we compute the effect of policies on deaths attributable to smoking.
We conduct two sets of analyses on the effect of policy-induced price effects. When
modeling the effects of taxes in the first set, we use a measure of price that subtracts state and
federal tax changes during these years, but incorporates price changes due to industry actions and
other factors. This gives a conservative estimate of the impact of the cigarette tax changes, since
local tax increases are not included, due to lack of data, nor are the effects of the price increase
following the MSA. It may also underestimate the effects of the tax since it assumes that taxes
increase price only by the amount of the tax, even though some recent studies conclude that the
industry actually raises prices beyond that. (Sullivan, 2010). In a second set of analyses, we
incorporate the effects of the significant November 1998 price increase that followed the MSA
(in addition to the tax increases). Although the MSA price increase is not directly related to a
modeling
the imPaCt
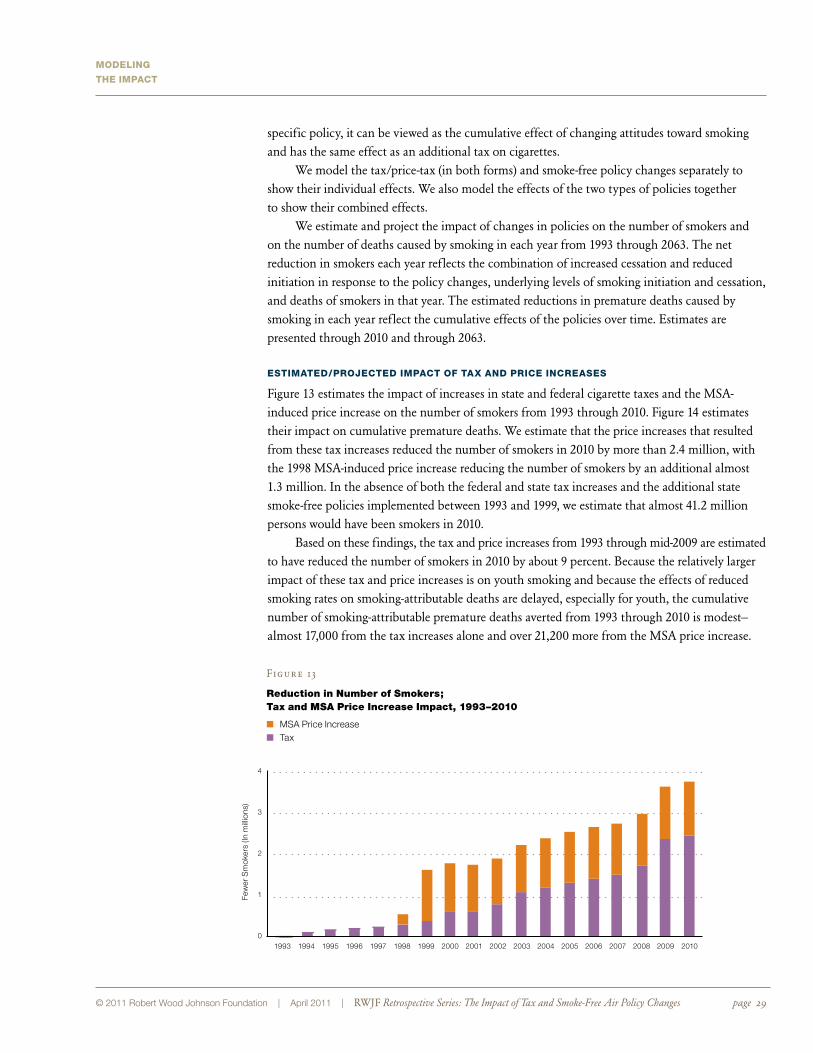
© 2011 Robert Wood Johnson Foundation | April 2011 | RWJF Retrospective Series: The Impact of Tax and Smoke-Free Air Policy Changes page 29
specific policy, it can be viewed as the cumulative effect of changing attitudes toward smoking
and has the same effect as an additional tax on cigarettes.
We model the tax/price-tax (in both forms) and smoke-free policy changes separately to
show their individual effects. We also model the effects of the two types of policies together
to show their combined effects.
We estimate and project the impact of changes in policies on the number of smokers and
on the number of deaths caused by smoking in each year from 1993 through 2063. The net
reduction in smokers each year reflects the combination of increased cessation and reduced
initiation in response to the policy changes, underlying levels of smoking initiation and cessation,
and deaths of smokers in that year. The estimated reductions in premature deaths caused by
smoking in each year reflect the cumulative effects of the policies over time. Estimates are
presented through 2010 and through 2063.
estimated/ProjeCted imPaCt of tax and PriCe inCreases
Figure 13 estimates the impact of increases in state and federal cigarette taxes and the MSA-
inducedpriceincreaseonthenumberofsmokersfrom1993through2010.Figure14estimates
their impact on cumulative premature deaths. We estimate that the price increases that resulted
fromthesetaxincreasesreducedthenumberofsmokersin2010bymorethan2.4million,with
the 1998 MSA-induced price increase reducing the number of smokers by an additional almost
1.3 million. In the absence of both the federal and state tax increases and the additional state
smoke-freepoliciesimplementedbetween1993and1999,weestimatethatalmost41.2million
persons would have been smokers in 2010.
Based on these findings, the tax and price increases from 1993 through mid-2009 are estimated
to have reduced the number of smokers in 2010 by about 9 percent. Because the relatively larger
impact of these tax and price increases is on youth smoking and because the effects of reduced
smoking rates on smoking-attributable deaths are delayed, especially for youth, the cumulative
number of smoking-attributable premature deaths averted from 1993 through 2010 is modest—
almost17,000fromthetaxincreasesaloneandover21,200morefromtheMSApriceincrease.
modeling
the imPaCt
Figur e 1 3
Reduction in Number of Smokers; Tax and MSA Price Increase Impact, 1993–2010
n MSA Price Increasen Tax
Few
er S
mok
ers
(In m
illio
ns)
1993 1994 1995 1996 1997 1998 1999 2000 2001 2002 2003 2004 2005 2006 2007 2008 2009 2010
4
3
2
1
0
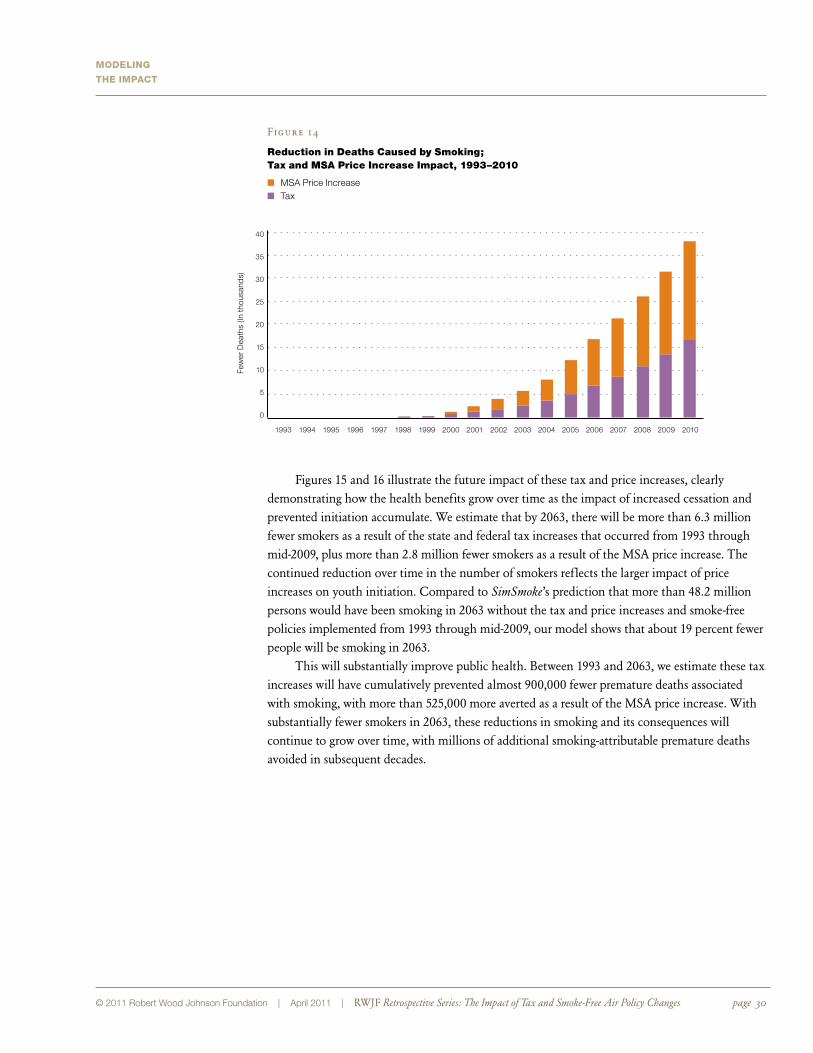
© 2011 Robert Wood Johnson Foundation | April 2011 | RWJF Retrospective Series: The Impact of Tax and Smoke-Free Air Policy Changes page 30
Figur e 1 4
Reduction in Deaths Caused by Smoking; Tax and MSA Price Increase Impact, 1993–2010
n MSA Price Increasen Tax
Few
er D
eath
s (In
thou
sand
s)
1993 1994 1995 1996 1997 1998 1999 2000 2001 2002 2003 2004 2005 2006 2007 2008 2009 2010
40
35
30
25
20
15
10
5
0
modeling
the imPaCt
Figures 15 and 16 illustrate the future impact of these tax and price increases, clearly
demonstrating how the health benefits grow over time as the impact of increased cessation and
prevented initiation accumulate. We estimate that by 2063, there will be more than 6.3 million
fewer smokers as a result of the state and federal tax increases that occurred from 1993 through
mid-2009, plus more than 2.8 million fewer smokers as a result of the MSA price increase. The
continued reduction over time in the number of smokers reflects the larger impact of price
increases on youth initiation. Compared to SimSmoke’spredictionthatmorethan48.2million
persons would have been smoking in 2063 without the tax and price increases and smoke-free
policies implemented from 1993 through mid-2009, our model shows that about 19 percent fewer
people will be smoking in 2063.
This will substantially improve public health. Between 1993 and 2063, we estimate these tax
increases will have cumulatively prevented almost 900,000 fewer premature deaths associated
with smoking, with more than 525,000 more averted as a result of the MSA price increase. With
substantially fewer smokers in 2063, these reductions in smoking and its consequences will
continue to grow over time, with millions of additional smoking-attributable premature deaths
avoided in subsequent decades.
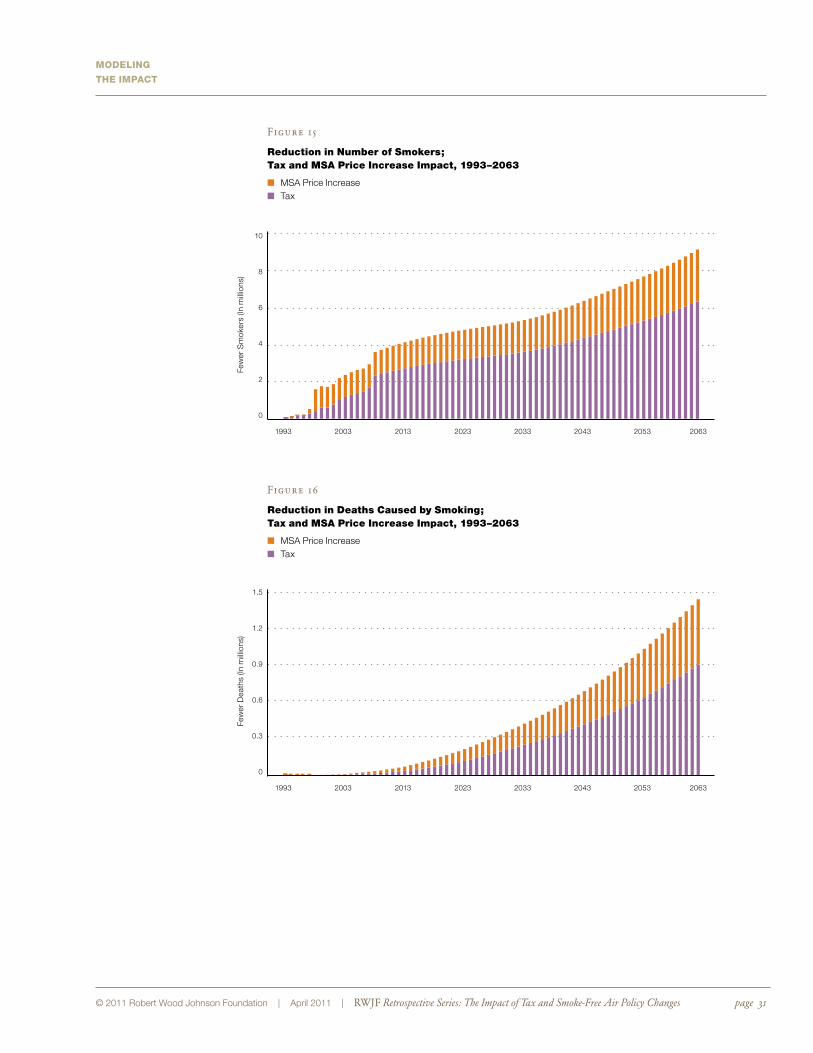
© 2011 Robert Wood Johnson Foundation | April 2011 | RWJF Retrospective Series: The Impact of Tax and Smoke-Free Air Policy Changes page 31
Figur e 1 5
Reduction in Number of Smokers; Tax and MSA Price Increase Impact, 1993–2063
n MSA Price Increasen Tax
Few
er S
mok
ers
(In m
illio
ns)
1993 2003 2013 2023 2033 2043 2053 2063
10
8
6
4
2
0
modeling
the imPaCt
Figur e 1 6
Reduction in Deaths Caused by Smoking; Tax and MSA Price Increase Impact, 1993–2063
n MSA Price Increasen Tax
Few
er D
eath
s (In
mill
ions
)
1993 2003 2013 2023 2033 2043 2053 2063
1.5
1.2
0.9
0.6
0.3
0

© 2011 Robert Wood Johnson Foundation | April 2011 | RWJF Retrospective Series: The Impact of Tax and Smoke-Free Air Policy Changes page 32
estimated/ProjeCted imPaCt of smoke-free air PoliCies
Figures17and18presenttheestimatedimpactoftheadoptionandstrengtheningofstate
smoke-free air policies on the number of smokers and premature deaths caused by smoking,
respectively, from 1993 through 2010. We estimate that these smoke-free air policy changes
reducedthenumberofsmokersin2010bynearly1.7million(amorethan4%reduction
compared to the number of smokers predicted in the absence of the policies), and that these
policies prevented nearly 19,000 premature deaths that would have resulted from cigarette
smoking during this period.
Figur e 1 7
Reduction in Number of Smokers; Smoke-Free Air Policy Impact, 1993–2010
Few
er S
mok
ers
(In m
illio
ns)
1993 1994 1995 1996 1997 1998 1999 2000 2001 2002 2003 2004 2005 2006 2007 2008 2009 2010
2.0
1.6
1.2
0.8
0.4
0
modeling
the imPaCt
Figur e 1 8
Reduction in Deaths Caused by Smoking; Smoke-Free Air Policy Impact, 1993–2010
Few
er D
eath
s (In
thou
sand
s)
1993 1994 1995 1996 1997 1998 1999 2000 2001 2002 2003 2004 2005 2006 2007 2008 2009 2010
20
16
12
0.8
0.4
0

© 2011 Robert Wood Johnson Foundation | April 2011 | RWJF Retrospective Series: The Impact of Tax and Smoke-Free Air Policy Changes page 33
Figures 19 and 20 illustrate the future impact of these smoke-free air policy changes, again
demonstrating how the health benefits grow over time as the longer run impact of increased
cessation and prevented initiation accumulate. We estimate that by 2063, there will be nearly
2.4millionfewersmokersasaresultofthestatesmoke-freeairpolicychangesthatoccurredfrom
1993 through mid-2009, a reduction of about 5 percent in the estimated number of smokers in
the absence of the policies we model. In contrast to the more rapid rise over time seen for the
tax and price increases, the relatively stable estimated impact over the next few decades reflects
the comparable impact of smoke-free policies on adult cessation and on youth initiation; the rise
in later years reflects underlying increases in population. Between 1993 and 2063, we estimate
thatthesmoke-freeairpolicychangeswillhavepreventedacumulativetotalofalmost700,000
fewer premature deaths from smoking.
Figur e 19
Reduction in Number of Smokers; Smoke-Free Air Policy Impact, 1993–2063
Few
er S
mok
ers
(In m
illio
ns)
1993 2003 2013 2023 2033 2043 2053 2063
2.5
2.0
1.5
1.0
0.5
0
modeling
the imPaCt
Figur e 20
Reduction in Deaths Caused by Smoking; Smoke-Free Air Policy Impact, 1993–2063
Few
er D
eath
s (In
mill
ions
)
1993 2003 2013 2023 2033 2043 2053 2063
0.7
0.6
0.5
0.4
0.3
0.2
0.1
0

© 2011 Robert Wood Johnson Foundation | April 2011 | RWJF Retrospective Series: The Impact of Tax and Smoke-Free Air Policy Changes page 34
As with the tax/price-induced reductions in smoking and its consequences, the reductions
resulting from the adoption and strengthening of state smoke-free air policies will continue to
grow over time.
Combined tax/PriCe and smoke-free air PoliCy imPaCt
Figures21through24illustratethecombinedeffectsofthetax/priceincreasesandsmoke-free
policy changes occurring from 1993 through mid-2009. By 2010, the tax and smoke-free policies
areestimatedtohavereducedthenumberofsmokersbynearly4million,withanadditional
1.3 million fewer smokers as a result of the MSA price increase. This is a reduction of about
13 percent in the number of persons we estimate would have been smoking in 2010 in the
absence of these policies. We estimate that these policies will reduce the number of smokers in
2063 by more than 9 million, with an additional almost 3 million fewer smokers as a result
of the MSA price increase. Together, these two modeled policies will result in 25 percent fewer
smokers in 2063.
The health impact of these reductions is enormous. By 2063 we estimate that these tax
and smoke-free air policy changes will have cumulatively prevented more than 1.5 million deaths,
with an additional half-million premature deaths prevented by the MSA price increase. The
longertermhealthimpactwillbeevenlarger—asmanyas4.5millionmoreprematuredeaths
prevented in the cohort of youth, young adults and adults alive in 2063. For deaths in 2063 alone
(not cumulatively), we estimate that the modeled policies will have reduced premature deaths
caused by smoking by more than 21 percent.
modeling
the imPaCt
Figur e 2 1
Reduction in Number of Smokers; Combined Tax and Smoke-Free Air Policy and MSA Price Increase Impact, 1993–2010
n MSA Price Increasen Tax and Smoke-Free Air
Few
er S
mok
ers
(In m
illio
ns)
1993 1994 1995 1996 1997 1998 1999 2000 2001 2002 2003 2004 2005 2006 2007 2008 2009 2010
6
5
4
3
2
1
0

© 2011 Robert Wood Johnson Foundation | April 2011 | RWJF Retrospective Series: The Impact of Tax and Smoke-Free Air Policy Changes page 35
Figur e 2 2
Reduction in Deaths Caused by Smoking; Combined Tax and Smoke-Free Air Policy and MSA Price Increase Impact, 1993–2010
n MSA Price Increasen Tax and Smoke-Free Air
Few
er D
eath
s (In
thou
sand
s)
1993 1994 1995 1996 1997 1998 1999 2000 2001 2002 2003 2004 2005 2006 2007 2008 2009 2010
60
50
40
30
20
10
0
modeling
the imPaCt
Figur e 2 3
Reduction in Number of Smokers; Combined Tax and Smoke-Free Air Policy and MSA Price Increase Impact, 1993–2063
n MSA Price Increasen Tax and Smoke-Free Air
Few
er S
mok
ers
(In m
illio
ns)
1993 2003 2013 2023 2033 2043 2053 2063
12
10
8
6
4
2
0
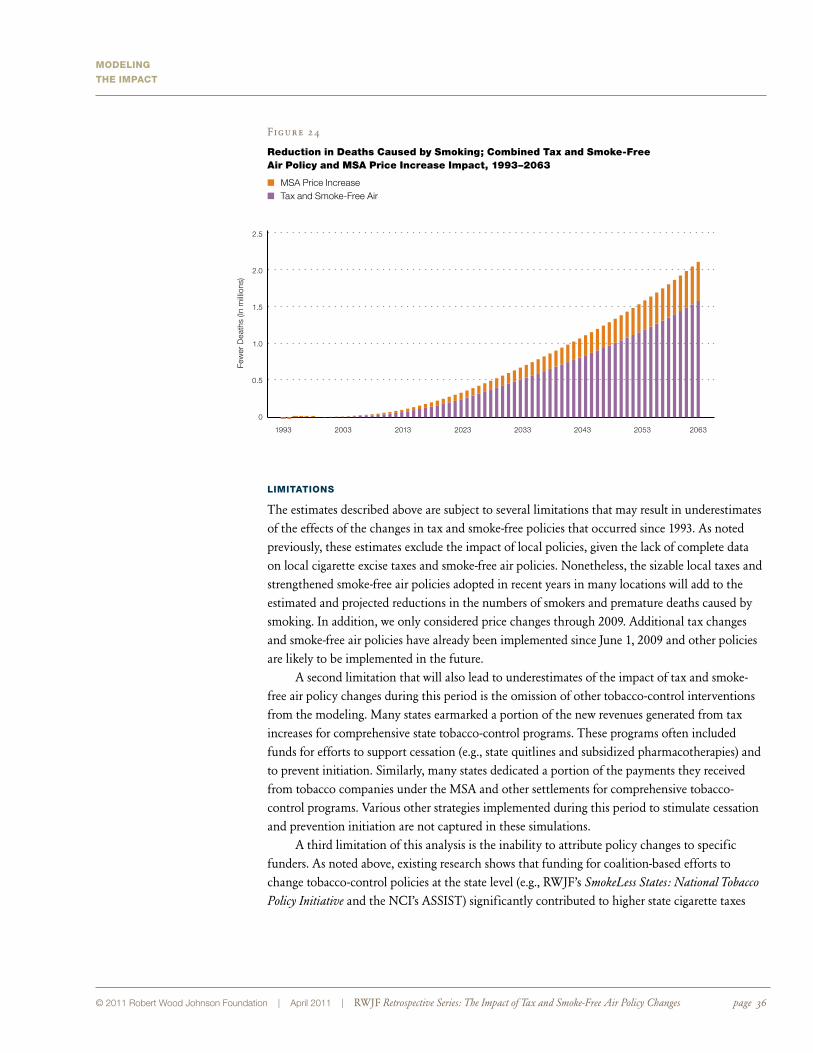
© 2011 Robert Wood Johnson Foundation | April 2011 | RWJF Retrospective Series: The Impact of Tax and Smoke-Free Air Policy Changes page 36
Figur e 24
Reduction in Deaths Caused by Smoking; Combined Tax and Smoke-Free Air Policy and MSA Price Increase Impact, 1993–2063
n MSA Price Increasen Tax and Smoke-Free Air
Few
er D
eath
s (In
mill
ions
)
1993 2003 2013 2023 2033 2043 2053 2063
2.5
2.0
1.5
1.0
0.5
0
modeling
the imPaCt
limitations
The estimates described above are subject to several limitations that may result in underestimates
of the effects of the changes in tax and smoke-free policies that occurred since 1993. As noted
previously, these estimates exclude the impact of local policies, given the lack of complete data
on local cigarette excise taxes and smoke-free air policies. Nonetheless, the sizable local taxes and
strengthened smoke-free air policies adopted in recent years in many locations will add to the
estimated and projected reductions in the numbers of smokers and premature deaths caused by
smoking. In addition, we only considered price changes through 2009. Additional tax changes
and smoke-free air policies have already been implemented since June 1, 2009 and other policies
are likely to be implemented in the future.
A second limitation that will also lead to underestimates of the impact of tax and smoke-
free air policy changes during this period is the omission of other tobacco-control interventions
from the modeling. Many states earmarked a portion of the new revenues generated from tax
increases for comprehensive state tobacco-control programs. These programs often included
funds for efforts to support cessation (e.g., state quitlines and subsidized pharmacotherapies) and
to prevent initiation. Similarly, many states dedicated a portion of the payments they received
from tobacco companies under the MSA and other settlements for comprehensive tobacco-
control programs. Various other strategies implemented during this period to stimulate cessation
and prevention initiation are not captured in these simulations.
A third limitation of this analysis is the inability to attribute policy changes to specific
funders. As noted above, existing research shows that funding for coalition-based efforts to
change tobacco-control policies at the state level (e.g., RWJF’s SmokeLess States: National Tobacco
Policy Initiative and the NCI’s ASSIST) significantly contributed to higher state cigarette taxes

© 2011 Robert Wood Johnson Foundation | April 2011 | RWJF Retrospective Series: The Impact of Tax and Smoke-Free Air Policy Changes page 37
and more comprehensive smoke-free air policies (NCI, 2006; Chaloupka, 2008). However, efforts
to fully disentangle the related and complementary funding streams in order to attribute some
fraction of the changes in policies and smoking rates to any single funder are hampered by the
lack of necessary data and appropriate methods. Efforts to attribute changes in the estimates
contained in this report specifically to RWJF funding were limited by challenges in modeling the
impact of funding for national level programs, an inability to model the synergies among RWJF,
NCI, CDC and other funding, and an inability to model the stimulating effect that funding
from one source had on funding from other organizations working on tobacco control.
A fourth limitation of this analysis is the underestimation of the full health impact of the
changes in smoking that result from the policy changes. SimSmoke estimates of premature deaths
caused by smoking reflect the direct impact of smoking and do not include the reductions in
deaths that result from cancer, cardiovascular disease, respiratory disease and other causes as a
result of nonsmokers’ exposure to tobacco smoke (U.S. DHHS, 2006). In addition, SimSmoke
uses the relatively conservative estimates of the increased risk of premature death resulting from
smoking available when the model was developed. More recent evidence suggests that this risk
may be considerably higher, with as many as half of regular adult smokers dying prematurely
from a disease caused by smoking (e.g., Jha et al., 2008). Further, the savings in medical costs and
lost productivity resulting from less smoking are not considered in this analysis, including the
high costs associated with maternal and child health (e.g., SIDS, the high and continuing costs
associated with low-birthweight babies, and pregnancy-related complications [U.S. DHHS,
2004]).Finally,theSimSmoke model does not capture the health gains that result from reduced
morbidity and related increases in disability-adjusted life years.
An additional limitation concerns the inputs into the SimSmoke simulation model. There
are inherent limitations in the data used to estimate smoking prevalence, smoking initiation and
smoking cessation that can affect the estimated impact and projections. Similarly, while the
assumed effect sizes for the tax and smoke-free air policies reflect the best evidence currently
available, these effects may change over time as the composition of tobacco users (including
smokeless tobacco) and the mix of tobacco-control policies change.
A final limitation of this analysis is an inability to fully estimate the long-term impact of
these policy changes. As demonstrated by the projections presented here, there will be very large
and growing reductions in the number of smokers over time as a result of the policies adopted
from 1993 through mid-2009, with as many as 12 million fewer smokers—a 25 percent reduction—
in 2063. The premature deaths avoided among this population will continue to grow for many
years after 2063 so the full, long-term impact of these policy changes is considerably understated.
modeling
the imPaCt

© 2011 Robert Wood Johnson Foundation | April 2011 | RWJF Retrospective Series: The Impact of Tax and Smoke-Free Air Policy Changes page 38
Conclusions
the past two decades have seen considerable progress in tobacco control. The inflation-
adjusted value of state and federal cigarette taxes has more than tripled since 1990.
These tax increases, combined with the pass-through of costs from tobacco company
litigation settlements, have more than doubled inflation-adjusted cigarette prices.
All states have enacted legislation limiting smoking in a variety of public places, with many
states and numerous localities banning smoking in some combination of restaurants, bars and
private worksites. These changes were fueled by growing evidence on the health consequences
of tobacco use and exposure to tobacco smoke and on the effectiveness of tax and smoke-free
policies in reducing tobacco use.
Funding to build the evidence base for these and other tobacco-control interventions was
provided by a variety of public and private organizations, most notably the Robert Wood
Johnson Foundation, National Cancer Institute, the Centers for Disease Control and Prevention,
and many state governments. Additional funding from these and other organizations supported
the policy and media advocacy efforts (e.g., SmokeLess States and ASSIST) that further drove
tobacco-control policy change at the national, state and local levels.
Research evidence clearly shows that higher cigarette and other tobacco product taxes and
prices and strong smoke-free air policies induce adult users to quit, prevent young people from
starting and reduce consumption among continuing users. Given the extensive evidence on its
health consequences, these policy-induced declines in tobacco use have significantly reduced the
death, disease and economic costs caused by tobacco.
By 2010, we estimate that the price increases resulting from the federal and state tax
increases from 1993 through mid-2009, coupled with the MSA price increase of 1998, reduced
thenumberofsmokersintheUnitedStatesbymorethan3.7million,whilepreventingalmost
38,000prematuredeathsfromsmoking.Additionally,weestimatethatnearly1.7millionfewer
people smoke in 2010 as a result of the state smoke-free air policies adopted during these years,
preventing almost 19,000 more premature deaths caused by smoking by 2010. The impact of
these price and policy changes will grow considerably over time. In 2063, we estimate that there
will be over 12 million fewer smokers as a result and that more than two million premature
deaths that would have been caused by smoking will have been averted, with millions more
prevented in subsequent decades.
ConClusions
© 2011 Robert Wood Johnson Foundation | April 2011 | RWJF Retrospective Series: The Impact of Tax and Smoke-Free Air Policy Changes page 39
These are but a fraction of the public health gains resulting from the tobacco-control efforts
of the past two decades. Local tax and smoke-free air policies, other tobacco-control policy
changes at all levels of government, greatly expanded access to cessation products and support,
extensive mass-media public education campaigns, and more have further strengthened anti-
tobacco norms and reduced tobacco use, further improving public health.
ConClusions
© 2011 Robert Wood Johnson Foundation | April 2011 | RWJF Retrospective Series: The Impact of Tax and Smoke-Free Air Policy Changes page 40
Sources
Americans for Nonsmokers’ Rights Foundation (ANRF) (2010). Smokefree Lists, Maps, and Data. Berkeley, CA: Americans for Nonsmokers’ Rights Foundation. (www.no-smoke.org/pdf/mediaordlist.pdf ).
Becker GS, Grossman M and Murphy KM. “An Empirical Analysis of Cigarette Addiction.” American Economic Review, 84(3): 396–418, 1994.
Borland R, Yong HH, Siahpush M, Hyland A, Campbell S, Hastings G, Cummings KM and Fong GT. “Support for and Reported Compliance With Smoke-Free Restaurants and Bars by Smokers in Four Countries: Findings From the International Tobacco Control (ITC) Four Country Survey.” Tobacco Control, 15(SIII): iii34–iii41, 2006.
California Environmental Protection Agency. Health Effects of Exposure to Environmental Tobacco Smoke. Sacramento, CA: California Environmental Protection Agency, Office of Environmental Health Hazard Assessment, Reproductive and Cancer Hazard Assessment Section and Air Toxicology and Epidemiology Section, 1997.
Chaloupka FJ. “Rational Addictive Behavior and Cigarette Smoking.” Journal of Political Economy, 99(4): 722–742, 1991.
Chaloupka FJ. “Contextual Factors and Youth Tobacco Use: Policy Linkages.” Addiction, 98(S1): 147–150, 2003.
Chaloupka FJ. Evaluating SmokeLess States. Final Report prepared for the Robert Wood Johnson Foundation, 2008.
Chaloupka FJ, Hu TW, Warner KE, Jacobs R and Yurekli A. “The Taxation of Tobacco Products.” In Tobacco Control in Developing Countries, Jha P and Chaloupka FJ (eds). Oxford: Oxford University Press, 2000.
Chaloupka FJ and Tauras JA. The Impact of Alternative Federal Cigarette Excise Tax Increases on Cigarette Smoking, Cigarette-Related Revenues, Smoking Attributable Deaths, and Related Health Care Costs. Final Report prepared for the American Cancer Society, 2009.
Chaloupka FJ, Tauras JA and Grossman M. “Public Policy and Youth Smokeless Tobacco Use.” Southern Economic Journal, 64(2): 503–516, 1997.
Chaloupka FJ, Tauras JA and Grossman M. “The Economics of Addiction.” In Tobacco Control in Developing Countries, Jha P and Chaloupka FJ (eds). Oxford: Oxford University Press, 2000.
DeCicca P, Kenkel D and Mathios A. “Putting Out the Fires: Will Higher Taxes Reduce Youth Smoking?” Journal of Political Economy, 110: 144–169, 2002.
Douglas S. “The Duration of the Smoking Habit.” Economic Inquiry, 36(1): 49-64, 1998.
Douglas S and Hariharan G. “The Hazard of Starting Smoking: Estimates From a Split Population Duration Model.” Journal of Health Economics, 13(2): 213–230, 1994.
Emery S, White MM and Pierce JP. “Does Cigarette Price Influence Adolescent Experimentation?” Journal of Health Economics, 20(2): 261–270, 2001.
Evans WN and Farrelly MC. “The Compensating Behavior of Smokers: Taxes, Tar and Nicotine.” RAND Journal of Economics, 29(3): 578–595, 1998.
Evans WN and Ringel JS. “Can Higher Cigarette Taxes Improve Birth Outcomes?” Journal of Public Economics, 72: 135–154, 1999.
Farrelly MC, Bray JW, Pechacek T and Woollery T. “Response by Adults to Increases in Cigarette Prices by Sociodemographic Characteristics.” Southern Economic Journal, 68(1): 156–165, 2001.
sourCes

© 2011 Robert Wood Johnson Foundation | April 2011 | RWJF Retrospective Series: The Impact of Tax and Smoke-Free Air Policy Changes page 41
Fong GT, Hyland A, Borland R, Hammond D, Hastings G, McNeill A, Anderson S, Cummings KM, Allwright S, Mulcahy M, Howell F, Clancy L, Thompson ME, Connolly G and Driezen P. “Reductions in Tobacco Smoke Pollution And Increases in Support for Smoke-Free Public Places Following the Implementation of Comprehensive Smoke-Free Workplace Legislation in the Republic of Ireland: Findings From the ITC Ireland/UK Survey.” Tobacco Control, 15(SIII): iii51–iii58, 2006.
Gallet CA and List JA. “Cigarette Demand: A Meta-Analysis of Elasticities.” Health Economics, 12: 821–835, 2003.
Gilpin EA, Pierce JP and Farkas AJ. “Duration of Smoking Abstinence and Success in Quitting.” Journal of the National Cancer Institute, 89(8): 572–576, 1997.
Giovino GA, Chaloupka FJ, Hartman AM, et al. Cigarette Smoking Prevalence and Policies in the 50 States: An Era of Change—the Robert Wood Johnson Foundation ImpacTeen Tobacco Chartbook. Buffalo, NY: University of Buffalo, State University of New York, 2009.
Gruber J and Zinman J. “Youth Smoking in the U.S.: Evidence and Implications.” In Risky Behavior Among Youth: An Economic Analysis. Chicago: University of Chicago Press for the National Bureau of Economic Research, 2001.
Harris JE. “The 1983 Increase in the Federal Cigarette Excise Tax.” In Tax Policy and the Economy. Cambridge, MA: MIT Press, 1987.
Harris JE and Chan SW. “The Continuum of Addiction: Cigarette Smoking in Relation to Price Among Americans Aged 15-29.” Health Economics, 8(1): 81–86, 1999.
Hu TW, Ren QF, Keeler TE and Bartlett J. “The Demand for Cigarettes in California and Behavioural Risk Factors.” Health Economics 4(1): 7–14, 1995.
Hughes JR, Keely J and Naud S. “Shape of the Relapse Curve and Long-Term Abstinence Among Untreated Smokers.” Addiction, 99(1): 29–38, 2004.
International Agency for Research on Cancer (IARC). IARC Handbooks of Cancer Prevention, Tobacco Control, Volume 13: Evaluating the Effectiveness of Smoke-Free Policies. Lyon, France: International Agency for Research on Cancer, 2009.
Jacobson PD and Wasserman J. Tobacco Control Laws: Implementation and Enforcement. Santa Monica, CA: RAND Corp., 1997.
Jacobson PD and Wasserman J. “The Implementation and Enforcement of Tobacco Control Laws: Policy Implications for Activists and the Industry.” Journal of Health Politics, Policy and Law, 24(3): 567–598, 1999.
Jha P, Jacob B, Gajalakshmi V, Gupta PC, Dhingra N, Kumar R, et al. “A Nationally Representative Case–Control Study of Smoking and Death in India.” New England Journal of Medicine, 358(11): 1137–1147, 2008.
Levy DT et al. “The Role of Public Policies in Reducing Smoking Prevalence and Deaths Caused by Smoking in Arizona: Results From the Arizona Tobacco Policy Simulation Model.” Journal of Public Health Management and Practice, 13(1): 59–67, 2007.
Levy DT et al. “The Use of Simulation Models for the Surveillance, Justification and Understanding of Tobacco Control Policies.” Health Care Management Science, 5(2): 113–120, 2002.
Levy DT et al. “The Kentucky SimSmoke Tobacco Policy Simulation Model: Reaching Healthy People 2010 Goals Through Policy Change.” Southern Medical Journal, 101(5): 503–507, 2008.
Levy D et al. “The Role of Tobacco Control Policies in Reducing Smoking and Deaths in a Middle Income Nation: Results From the Thailand SimSmoke Simulation Model.” Tobacco Control, 17(1): 53–59, 2008.
Levy D et al. “SimSmoke Model Evaluation of the Effect of Tobacco Control Policies in Korea: The Unknown Success Story.” American Journal of Public Health, 100(7): 1267–1273, 2010.
Levy D et al. American Journal of Public Health, 100(7): 1253–1259, 2010.
Levy DT, Bauer JE and Lee HR. “Simulation Modeling and Tobacco Control: Creating More Robust Public Health Policies.” American Journal of Public Health, 96(3): 494–498, 2006.
Levy DT, Cummings KM and Hyland A. “Increasing Taxes as a Strategy to Reduce Cigarette Use and Deaths: Results of a Simulation Model.” Preventive Medicine, 31(3): 279–286, 2000.
sourCes

© 2011 Robert Wood Johnson Foundation | April 2011 | RWJF Retrospective Series: The Impact of Tax and Smoke-Free Air Policy Changes page 42
Levy DT, Cummings KM and Hyland A. “A Simulation of the Effects of Youth Initiation Policies on Overall Cigarette Use.” American Journal of Public Health, 90(8): 1311–1314, 2000.
Levy DT and Friend K. “A Computer Simulation Model of Mass Media Interventions Directed at Tobacco Use.” Preventive Medicine, 32(3): 284–294, 2001.
Levy DT and Friend KB. “The Effects of Clean Indoor Air Laws: What Do We Know and What Do We Need to Know?” Health Education Research, 18(5): 592–609, 2003.
Levy DT, Friend K, Holder H and Carmona M. “Effect of Policies Directed at Youth Access to Smoking: Results From the SimSmoke Computer Simulation Model.” Tobacco Control, 10(2): 108–116, 2001.
Levy DT, Friend K and Polishchuk E. “Effect of Clean Indoor Air Laws on Smokers: The Clean Air Module of the SimSmoke Computer Simulation Model.” Tobacco Control, 10(4): 345–351, 2001.
Levy DT, Gitchell JG and Chaloupka FJ. “The Effects of Tobacco Control Policies on Smoking Rates: A Tobacco Control Scorecard.” Journal of Public Health Management and Practice, 10: 338–351, 2004.
Levy DT et al. “The Role of Public Policies in Reducing Smoking Prevalence in California: Results From the California Tobacco Policy Simulation Model.” Health Policy, 82(2): 153–166, 2007.
Levy DT, Graham AL, Mabry PL, Abrams DB and Orleans CT. “Modeling the Impact of Smoking Cessation Treatment Policies on Quit Rates.” American Journal of Preventive Medicine. 39(3 suppl.): S364–S372, 2010.
Levy DT, Nikolayev N and Mumford EA. “The Healthy People 2010 Smoking Prevalence and Tobacco Control Objectives: Results From the SimSmoke Tobacco Control Policy Simulation Model.” Cancer Causes and Control, 16(4): 359–371, 2005.
Levy DT, Nikolayev N and Mumford EA. “Recent Trends in Smoking and the Role of Public Policies: Results From the SimSmoke Tobacco Control Policy Simulation Model.” Addiction, 10(10): 1526–1537, 2005.
Levy DT and Zaloshjna E. “The Role of Tobacco Control Policies in Reducing Smoking and Deaths Caused by Smoking in the Eighteen Largest Nations: Results From the MPOWER SimSmoke Tobacco Control Policy Model.” In The Economics of Tobacco and Tobacco Control, Chaloupka FJ, Yurekli A and GT Fong (eds). Washington: National Cancer Institute and World Health Organization (in progress).
Lewit EM and Coate D. “The Potential for Using Excise Taxes to Reduce Smoking.” Journal of Health Economics, 1(2): 121–145, 1982.
Lewit EM, Coate D and Grossman M. “The Effects of Government Regulation on Teenage Smoking.” Journal of Law and Economics, 24(3): 545–569, 1981.
Liang L and Chaloupka FJ. “Differential Effects of Price on Youth Smoking Intensity.” Nicotine & Tobacco Research, 4: 109–114, 2002.
McWhorter WP, Boyd GM and Mattson ME. “Predictors of Quitting Smoking: The NHANES I Followup Experience.” Journal of Clinical Epidemiology, 43 (12): 1399–1405, 1990.
Moore MJ (1996). “Death and Tobacco Taxes.” RAND Journal of Economics, 27(2): 415–428.
National Cancer Institute (NCI). “Cigarette Smoking Behavior in the United States.” In Changes in Cigarette-Related Disease Risks and Their Implication for Prevention and Control, Smoking and Tobacco Control. Monograph 8. Burns DM, Lee L, Shen LZ, Gilpin EA, Tolley HD, Vaughn J and Shanks TG (eds). Bethesda, MD: National Cancer Institute, National Institutes of Health, 1997.
National Cancer Institute. Population Based Smoking Cessation: Proceedings of a Conference on What Works to Influence Cessation in the General Population, Smoking and Tobacco Monograph 10. Bethesda, MD: U.S. Department of Health and Human Services, National Institutes of Health, National Cancer Institute, 2000.
National Cancer Institute. Evaluating ASSIST: A Blueprint for Understanding State Level Tobacco Control, NCI Tobacco Control Monograph 17. Bethesda, MD: U.S. Department of Health and Human Services, National Institutes of Health, National Cancer Institute, 2006.
Ohsfeldt RL, Boyle RG and Capilouto EI. “Tobacco Taxes, Smoking Restrictions, and Tobacco Use.” In The Economic Analysis of Substance Use and Abuse: An Integration of Econometric and Behavioral Economic Research, Chaloupka FJ, Grossman M, Bickel WK and Saffer H (eds). Chicago: University of Chicago Press for the National Bureau of Economic Research, 1999.
sourCes

© 2011 Robert Wood Johnson Foundation | April 2011 | RWJF Retrospective Series: The Impact of Tax and Smoke-Free Air Policy Changes page 43
Powell LM and Chaloupka FJ. “Parents, Public Policy, and Youth Smoking.” Journal of Policy Analysis and Management, 24: 93–112, 2004.
Powell LM, Tauras JA and Ross H. “The Importance of Peer Effects, Cigarette Prices, and Tobacco Control Policies for Youth Smoking Behavior.” Journal of Health Economics, 24(5): 950–968, 2005.
Ringel JS and Evans WN. “Cigarette Taxes and Smoking During Pregnancy.” American Journal of Public Health, 91(11): 1851–1856, 2001.
Ross H and Chaloupka FJ. “Economic Policies for Tobacco Control in Developing Countries.” Salud Pública de México, 48(S1): S113–S120, 2006.
Ross H, Chaloupka FJ and Wakefield M. “Youth Smoking Uptake Progress: Price and Public Policy Effects.” Eastern Economic Journal, 32(2): 355–367, 2006.
Shultz JM, Novotny TE and Rice DP. “Quantifying the Disease Impact of Cigarette Smoking With SAMMEC II Software.” Public Health Reports, 106(3): 326–333, 1991.
Sullivan R. “The Effect of Cigarette Taxation on Prices: An Empirical Analysis Using City-Level Data.” Manuscript. Department of Economics, Syracuse University, 2010.
Task Force on Community Preventive Services. “The Guide to Community Preventive Services: Tobacco Use Prevention and Control.” American Journal of Preventive Medicine, 20(2S): 1–88, 2001.
Task Force on Community Preventive Services. The Guide to Community Preventive Services: What Works to Promote Health? New York: Oxford University Press, 2005.
Tauras JA. “Public Policy and Smoking Cessation Among Young Adults in the United States.” Health Policy, 68(3): 321–332, 2004.
Tauras JA. “Can Public Policy Deter Smoking Escalation Among Young Adults?” Journal of Policy Analysis and Management, 24(4): 771–784, 2005.
Tauras JA and Chaloupka FJ. “Determinants of Smoking Cessation: An Analysis of Young Adult Men and Women.” In The Economic Analysis of Substance Use and Abuse: The Experience of Developed Countries and Lessons for Developing Countries, Grossman M and Hsieh CR (eds). Northampton, MA: Edward Elgar Publishing, 2001.
Tauras JA and Chaloupka FJ. “The Demand for Nicotine Replacement Therapies.” Nicotine & Tobacco Research, 5(2): 237–243, 2003.
Tauras JA, Chaloupka FJ and Emery SL. “The Impact of Advertising on Nicotine Replacement Therapy Demand.” Social Science and Medicine, 60: 2351–2358, 2005.
Tauras JA, Johnson LD and O’Malley PM. Effects of Price and Access Laws on Teenage Smoking Initiation: A National Longitudinal Analysis. Cambridge, MA: National Bureau of Economic Research Working Paper Number 8331, 2001.
Tauras JA, Peck RM and Chaloupka FJ. “The Role of Retail Prices and Promotions in Determining Cigarette Brand Market Shares.” Review of Industrial Organization, 28: 253–284, 2006.
Tauras JA, Powell LM, Chaloupka FJ and Ross H. “The Demand for Smokeless Tobacco Among Male High School Students in the United States: The Impact of Taxes, Prices and Policies.” Applied Economics, 39(1): 31–41, 2007.
Townsend J, Roderick P and Cooper J. “Cigarette Smoking by Socioeconomic Group, Sex, and Age: Effects of Price, Income and Health Publicity.” British Medical Journal, 309(6959): 923–926, 1994.
U.S. Department of Health, Education and Welfare (DHEW). The Health Consequences of Smoking, A Report of the Surgeon General. Washington: U.S. Department of Health, Education and Welfare; Public Health Service; Health Services and Mental Health Administration, 1972.
U.S. Department of Health and Human Services (DHHS). The Health Consequences of Involuntary Smoking: A Report of the Surgeon General. Rockville, MD: U.S. Department of Health and Human Services, Public Health Service, Centers for Disease Control, Office on Smoking and Health, 1986.
U.S. DHHS. The Health Benefits of Smoking Cessation: A Report of the Surgeon General. Atlanta: U.S. Department of Health and Human Services, Public Health Service, Centers for Disease Control and Prevention, National Center for Chronic Disease Prevention and Health Promotion, Office on Smoking and Health, 1990.
sourCes
© 2011 Robert Wood Johnson Foundation | April 2011 | RWJF Retrospective Series: The Impact of Tax and Smoke-Free Air Policy Changes page 44
U.S. DHHS. Smoking and Health in the Americas: A Report of the Surgeon General, in Collaboration with the Pan American Health Organization. Atlanta: U.S. Department of Health and Human Services, Public Health Service, Centers for Disease Control and Prevention, National Center for Chronic Disease Prevention and Health Promotion, Office on Smoking and Health, 1992.
U.S. DHHS. Preventing Tobacco Use Among Young People: A Report of the Surgeon General. Atlanta: U.S. Department of Health and Human Services, Public Health Service, Centers for Disease Control and Prevention, National Center for Chronic Disease Prevention and Health Promotion, Office on Smoking and Health, 1994.
U.S. DHHS. Reducing Tobacco Use: A Report of the Surgeon General. Atlanta: U.S. Department of Health and Human Services, Public Health Service, Centers for Disease Control and Prevention, National Center for Chronic Disease Prevention and Health Promotion, Office on Smoking and Health, 2000.
U.S. DHHS. The Health Consequences of Smoking: A Report of the Surgeon General. Atlanta: U.S. Department of Health and Human Services, Public Health Service, Centers for Disease Control and Prevention, National Center for Chronic Disease Prevention and Health Promotion, Office on Smoking and Health, 2004.
U.S. DHHS. The Health Consequences of Involuntary Exposure to Tobacco Smoke: A Report of the Surgeon General. Atlanta: U.S. Department of Health and Human Services, Public Health Service, Centers for Disease Control and Prevention, National Center for Chronic Disease Prevention and Health Promotion, Office on Smoking and Health, 2006.
Warner KE. “Smoking and Health Implications of a Change in the Federal Cigarette Excise Tax.” Journal of the American Medical Association, 255(8): 1028–1032, 1986.
Wasserman J, Manning WG, Newhouse JP and Winkler JD. “The Effects of Excise Taxes and Regulations on Cigarette Smoking.” Journal of Health Economics, 10(1): 43–64, 1991.
sourCes