Circuit Bridging of Components by Smoke - International ...
206
NUREG/CR-6476 SAND96-2633 Circuit Bridging of Components by Smoke RECEIVED DEC t 6 1996 OSTI Prepared by T. J. Tanaka, S. P. Nowlen, D. J. Anderson Sandia National Laboratories Operated by Sandia Corporation Prepared for U.S. Nuclear Regulatory Commission
-
Upload
khangminh22 -
Category
Documents
-
view
0 -
download
0
Transcript of Circuit Bridging of Components by Smoke - International ...

NUREG/CR-6476SAND96-2633
Circuit Bridging of Componentsby Smoke
RECEIVEDDEC t 6 1996
OSTI
Prepared byT. J. Tanaka, S. P. Nowlen, D. J. Anderson
Sandia National LaboratoriesOperated bySandia Corporation
Prepared forU.S. Nuclear Regulatory Commission

AVAILABILITY NOTICE
Availability of Reference Materials Cited in NRC Publications
Most documents cited in NRC publications will be available from one of the following sources:
1. The NRC Public Document Room, 2120 L Street, NW., Lower Level, Washington, DC 20555-0001
2. The Superintendent of Documents .U.S. Government Printing Office, P. O. Box 37082, Washington. DC20402-9328
3. The National Technical Information Service, Springfield, VA 22161-0002
Although the listing that follows represents the majority of documents cited in NRC publications, it is not in-tended to be exhaustive.
Referenced documents available for inspection and copying for a fee from the NRC Public Document Roominclude NRC correspondence and internal NRC memoranda; NRC bulletins, circulars, information notices, in-spection and investigation notices; licensee event reports; vendor reports and correspondence; Commissionpapers; and applicant and licensee documents and correspondence.
The following documents In the NUREG series are available for purchase from the Government Printing Office:formal NRC staff and contractor reports, NRC-sponsored conference proceedings, international agreementreports, grantee reports, and NRC booklets and brochures. Also available are regulatory guides, NRC regula-tions in the Code of Federal Regulations, and Nuclear Regulatory Commission Issuances.
Documents available from the National Technical Information Service include NUREG-series reports and tech-nical reports prepared by other Federal agencies and reports prepared by the Atomic Energy Commission,forerunner agency to the Nuclear Regulatory Commission.
Documents available from public and special technical libraries include all open literature items, such as books,journal articles, and transactions. Federal Register notices. Federal and State legislation, and congressionalreports can usually be obtained from these libraries.
Documents such as theses, dissertations, foreign reports and translations, and non-NRC conference pro-ceedings are available for purchase from the organization sponsoring the publication cited.
Single copies of NRC draft reports are available free, to the extent of supply, upon written request to the Officeof Administration, Distribution and Mail Services Section, U.S. Nuclear Regulatory Commission, Washington,DC 20555-0001.
Copies of industry codes and standards used in a substantive manner in the NRC regulatory process are main-tained at the NRC Library, Two White Flint North, 11545 Rockville Pike, Rockville. MD 20852-2738. for use bythe public. Codes and standards are usually copyrighted and may be purchased from the originating organiza-tion or, if they are American National Standards, from the American National Standards Institute. 1430 Broad-way, New York, NY 10018-3308.
DISCLAIMER NOTICE
This report was prepared as an account of work sponsored by an agency of the United States Government.Neither the United States Government nor any agency thereof, norany of their employees, makes any warranty,expressed or implied, or assumes any legal liability or responsibility for any third party's use, or the results ofsuch use, of any information, apparatus, product, or process disclosed in this report, or represents that its useby such third party would not infringe privately owned rights.

NUREG/CR-6476SAND96-2633
Circuit Bridging of Componentsby Smoke
Manuscript Completed: October 1996Date Published: October 1996
Prepared byT. J. lanaka, S. P. Nowlen, D. J. Anderson
Sandia National LaboratoryAlbuquerque, NM 87185
C. Antonescu, NRC Project Manager
DISTRIBUTION OF THIS DOCUMENT ISP r e p a r e d forDivision of Systems TechnologyOffice of Nuclear Regulatory ResearchU.S. Nuclear Regulatory CommissionWashington, DC 20555-0001NRC Job Code W6051

DISCLAIMER
Portions of this document may be illegiblein electronic image products. Images areproduced from the best available originaldocument

DISCLAIMER
This report was prepared as an account of work sponsored by an agency of theUnited States Government. Neither the United States Government nor any agencythereof, nor any of their employees, makes any warranty, express or implied, orassumes any legal liability or responsibility for the accuracy, completeness, or use-fulness of any information, apparatus, product, or process disclosed, or representsthat its use would not infringe privately owned rights. Reference herein to any spe-cific commercial product, process, or service by trade name, trademark, manufac-turer, or otherwise does not necessarily constitute or imply its endorsement, recom-mendation, or favoring by the United States Government or any agency thereof.The views and opinions of authors expressed herein do not necessarily state orreflect those of the United States Government or any agency thereof.

Abstract
Smoke can adversely affect digital electronics; in the short term, it can lead to circuitbridging and in the long term to corrosion of metal parts. This report is a summary of thework to date and component-level tests by Sandia National Laboratories for the NuclearRegulatory Commission to determine the impact of smoke on digital instrumentation andcontrol equipment. The component tests focused on short-term effects such as circuitbridging in typical components and the factors that can influence how much the smokewill affect them. These factors include the component technology and packaging,physical board protection, and environmental conditions such as the amount of smoke,temperature of burn, and humidity level. The likelihood of circuit bridging was tested bymeasuring leakage currents and converting those currents to resistance in ohms.Hermetically sealed ceramic packages were more resistant to smoke than plasticpackages. Coating the boards with an acrylic spray provided some protection againstcircuit bridging. The smoke generation factors that affect the resistance the most arehumidity, fuel level, and burn temperature. The use of CO2 as a fire suppressant, thepresence of galvanic metal, and the presence of PVC did not significantly affect theoutcome of these results.
iii NUREG/CR-6476


Table of Contents
List of Figures vii
List of Tables vii
Acknowledgments viii
List of Acronyms ix
Introduction 1
Circuit Bridging Tests on Components 3
Overview 3Components Tested 4
Chip Packages 8Comb Patterns 8Optical Isolators 10Memory Chips 10
Scenarios Tested 10Fuel Level 11Burn Temperature 11Humidity 11Suppression (CO2) and Galvanic 12Other Measurements 12
Test Matrix 12
Results 13
Resistance Measurements 13Scatter Diagrams 15Parameter Modeling 18Summary of Factors Important to Change in Resistance 22
Optical Isolator Chip 23Memory Chips 23
Summary of Results 28
Technology and Packaging 28Protection 28Significant Factors in Determining Circuit Bridging 29
Conclusions 30
References 31
Appendix A Defining Credible Smoke Exposure Scenarios A-lAppendix B A Review of Smoke Damage to Electrical Equipment B-l
NUREG/CR-6476

Appendix C Preliminary Tests of the Impact of Smoke on Digital I&CEquipment C-l
Appendix D Smoke Exposure Conditions for Experimental Digital TripSystem D-l
Appendix E Impact of Smoke on Advanced I&C: Selection of SampleComponents and Test Matrix E-1
NUREG/CR-6476 vi

List of FiguresFigure 1. Combustion chambers (quartz cylinders) underneath the exposure
chamber 5Figure 2. Exposure chamber of Lexan on top of combustion chamber 6Figure 3. (a) Chip mounting board, (b) Comb pattern board 7Figure 4. Setup for smoke exposure test 9Figure 5. The PC unit covered with housing for the test 9Figure 6. Switching test circuit 11Figure 7. Exposed chip-mounting boards from different tests 15Figure 8. Exposed comb pattern boards 16Figure 9. Plot of resistance against time for comb pattern (test 23) 17Figure 10. Log10(R) during smoke production compared with pretest levels for a 160-
V comb pattern 17Figure 11. Log10(R) after exposure compared with pretest for 160-V comb patterns 18Figure 12. Comparison of average resistance during smoke production and after
venting 19Figure 13. Pareto analysis of significant factors 21Figure 14. Optical isolator delay from test 27 24Figure 15. Optical isolator rise time from test 27 24Figure 16. Optical isolator delay from test 5 25Figure 17. Optical isolator rise time from test 5 25
List of TablesTable 1 Cable Fuel Weights, Total (g) 12Table 2 Test Matrix 14Table 3. Optical Isolator Measurements 26Table 4. Memory Chips and Optical Isolator 27
vii NUREG/CR-6476

Acknowledgments
The authors would like to acknowledge the following people who have contributed to thisexperimental work: John Garcia, D. Michael Ramirez and Edward Baynes for their hardwork in setting up the experiments, building and maintaining equipment, and cleanup atSandia National Laboratories; David W. Palmer, Mike Knoll, and Richard S. Flores ofSandia National Laboratories and Kofi Korsah of Oak Ridge National Laboratories fortheir contributions and consultations on digital electronics; and Ruth Haas and EllenWalroth for their contributions to improving the report. This work has been sponsored bythe USNRC Office of Research under the project management of Christina Antonescu,FIN W6051. Stephen J. Martin and Allen Camp are thanked for their encouragement andsupport.
NUREG/CR-6476 viii

List of Acronyms
PTA Comb pattern A with 160-V biasPTB Comb pattern B with 50-V biasPTC Comb pattern C with 5-V biasPTD Comb pattern D with 0-V bias except 5 V during measurementLCC Ceramic leadless chip carrierCDIP Ceramic dual-in-line packageCFP Ceramic flat packageTOC Transistor outline canTTL Transistor transfer logic (0- to 5-V logic)PDIP Plastic dual-in-line packageSOIC Plastic small outline integrated chip packagePLC Plastic leaded chip carrier package
NUREG/CR-6476
Introduction
Smoke can adversely affect the electronics in telecommunications and computerequipment. In a fire, smoke can spread easily and quickly, hence it may cause equipmentfailure over a widespread area. Many of the instrumentation and control systems innuclear power plants are based on old technologies and replacements are no longer beingmanufactured. Instead, digital (microprocessor-based) technologies are being proposed.As a result, the U.S. Nuclear Regulatory Commission (USNRC) has determined that thepotential for smoke damage to digital systems warrants investigation. As a part of anongoing assessment of environmental qualification guidelines to determine theirapplicability to microprocessor-based equipment, a study of the impact of smoke wasinitiated. A user-need letter to the Office of Nuclear Regulatory Research included arequest to specifically study the effects of smoke along with other environmental stressorsto confirm the adequacy of the qualification process for advanced instrumentation andcontrol (I&C) systems.
Consequently, an overall program to confirm the qualification process for digital I&Csystems was initiated. The program has been coordinated through Oak Ridge NationalLaboratory (ORNL), which has performed susceptibility tests for electromagneticinterference (EMI), temperature, humidity, and smoke (conducted with the author) on anexperimental digital system (Korsah et al., 1996). ORNL has also investigated likelydesigns for future digital safety systems (Korsah et al., 1994). The overall programincludes a study by Brookhaven National Laboratory (BNL) to determine the risksensitivities of environmental stressors. To determine the risk sensitivities of selectedenvironmental stressors on the safety systems, BNL studied the reliability of digitalelectronics in different environments and their relative contribution to the power plantrisk (Hassan and Vesely, 1996).
In order to assess the impact of smoke on digital I&C systems, Sandia NationalLaboratories (SNL) is conducting studies and tests on digital I&C equipment exposed tosmoke. This research includes background studies on the smoke scenarios that arepostulated to occur in nuclear power plants, smoke damage to electrical equipment, andtypical microprocessor equipment that should be tested. The letter reports to the USNRCon these studies are included as Appendices A, B, and E in this report. Two series ofpreliminary smoke exposure tests have also been conducted: one on an active multiplexerboard and the other on ORNL's experimental digital safety system. These results areincluded as Appendices C and D of this report. The results from all of the appendices arebriefly summarized below. The main objectives of this report are to consolidate theseprevious results and to report on the first series of component exposure tests.
"Defining Credible Smoke Exposure Scenarios" (Appendix A) describes the scenariosthat are postulated to occur in a nuclear power plant. It is difficult to define the exactnature of smoke because it is so dependent on the fire conditions and the surroundingenvironment. The scenarios are defined in terms of factors that are of primary importancefor generating smoke in different areas of a plant. These include configuration of fuel,quantity of fuel, the type of fuel, the size of the fire, and the duration of the smokeexposure. Other factors are fire suppression agents and humidity levels. This report hasformed the basis for the smoke exposure tests. Because the scenarios are defined in termsof factors in smoke production rather than the smoke products, they are easier toreproduce.
"A Review of Smoke Damage to Electrical Equipment" (Appendix B) surveys the publicliterature on the results of accidental fires, controlled fire tests, and smoke corrosivity
NUREG/CR-6476

tests. Accidental fires in the telecommunications industry and in the U.S. Navy promptedthis study of smoke corrosivity because much of the damage in these fires was caused bysmoke. Although there are detailed reports on the results of accidental fires, theuncontrolled nature of the events makes it difficult to draw conclusions on how electronicequipment functioned during a fire and what the levels of smoke exposure were. Therewere few controlled fire tests that monitored the functioning of electronic equipmentwhile it was exposed to smoke. Most of the testing identified was concerned withsalvage of equipment after fires rather than performance during a fire. Despite theinterest in the effects of smoke on electronics by the telecommunications industry and theU.S. Navy, there are no existing military specifications for smoke survivability; however,they do exist for temperature and humidity survivability.
"Preliminary Tests of the Impact of Smoke on Digital I&C Equipment" (Appendix C)reports the results of exposing an operating multiplexer board to smoke. The boardconfiguration was designed by ORNL, as was the software to test functionality, and it issimilar in function to equipment that is likely to be used for advanced I&C safetysystems. The multiplexer board was connected to a personal computer (PC), which wasoutside the smoke chamber, through a serial communications port. The multiplexer'stask was to measure the current output from a similar board that was placed outside thesmoke chamber and to report digitized current output values to the controlling PC. Themultiplexer board was exposed to a relatively high smoke level produced by burningthree different types of cable—ethylene propylene rubber, chlorosulfonated polyethylene,and polyvinyl chloride (PVC). A new multiplexer board was used for each test.
The multiplexer boards performed flawlessly during the exposures to the first two typesof cable smoke, but the program that ran the measurements halted several times duringthe smoke exposure with PVC. The program indicated that communication errorsoccurred between the PC and the multiplexer board. The program could be restarted andthe multiplexer continued to work correctly for the next month. The intermittent failuressuggest that the electronics could be experiencing circuit bridging by the smoke, causingintermittent shorts.
"Smoke Exposure Conditions for an Experimental Digital Trip System" (Appendix D)describes the smoke conditions that were used to expose the ORNL experimental digitaltrip system. The results are described in a report by ORNL (Korsah et al , 1996) and apaper (Tanaka et al., 1996). There were eight smoke exposures for three differentmodules of the experimental digital trip system, which consisted of computers linked by afiber optics network. A host computer that was not exposed to smoke logged the state ofa reactor trip channel. Multiplexer boards similar to those tested and reported inAppendix C provided the input signals to the computers. The smoke affected thecommunications on the network, causing temporary error states for lighter smokeexposures, and failures for some of the heavier exposures. Because of the cost of thesystem, the modules were exposed to smoke several times and cleaned betweenexposures. After the first exposure, error states occurred even after the modules werecleaned, leading to some uncertainty in the overall results. These tests showed thatsmoke will affect a digital safety system, but it is unclear how much exposure will resultin failures.
Results from both preliminary smoke tests (Appendices C and D) showed that, inaddition to the corrosion of metal contacts that can occur weeks to months after exposure,computer systems fail during smoke exposures. The failures were intermittent in manycases and primarily affected the communications between computers or betweencomputers and multiplexer boards. Communication links between computers or betweena computer and a multiplexer board are especially vulnerable to the effects of smoke
NUREG/CR-6476 2
because these components are typically made so that the connectors can be rapidlyconnected and thus they are not highly protected. Digital communications depend uponhigh-speed variation in voltages in the output circuitry. If any connector pin ismomentarily shorted, the communication may be interrupted. Analysis of the failuresindicates that the smoke was bridging contacts that should have been electrically isolated.
All of these preliminary tests were performed on systems that included several operationssuch as voltage measurement (analog measurement), conversion to digital output, anddigital communications. By testing systems, all possible failure points are exposed, butthe tests are complicated and expensive because it is difficult to analyze the errors in alarge system. Ideally, an entirely new system should be used for each smoke exposure,but this is expensive for a large system. It is easier to test smaller subsections of thesystems, such as components or circuits, but such tests can only be useful if the expectedfailure mechanisms are identified and monitored. The balance of this report describes theresults of one series of component tests.
Circuit Bridging Tests on Components
Overview
Since circuit bridging by smoke was isolated as an early failure mechanism, it isimportant to study factors in smoke generation that affect circuit bridging. The SNLprogram is based on two series of tests to explore this question. The first series of testshas been completed and is the focus of this report. "Impact of Smoke on Advanced I&C:Selection of Sample Components and Test Matrix" (Appendix E) summarizes the testsand the equipment that were chosen for studying component reliability and the tests thatare planned for studying functional board reliability. Results of the first series of tests arediscussed in the following sections. The second series of tests on functional circuits isunder way.
Experience with shorts in the preliminary tests indicated that intermittent pathwaysdevelop between contacts as a result of smoke. Thus the objective of the component-level tests was to determine the smoke-related factors that are important in causingfailures from shorts. Components were exposed to smoke, and responses indicative ofthe formation of leakage paths that would lead to shorting or loss of function weremeasured. Leakage of current indicates a drop in resistance. In these tests the leakagecurrents are expressed in terms of resistance for seven chip packages and four combpatterns with different voltages. Loss of function for the optical isolator chip wasdetermined by changes in the amplitude, delay, and rise time of an output pulse. Thefunctionality of memory chips was measured before and after the smoke exposures.
It is known from surface insulation resistance tests that current leakage increases at hightemperature (85 °C) and humidity (85% RH) (Iman et al., 1995). Typical pretestresistance measurements are >102 ohms, which drop to approximately 10s ohms withinhours after introduction of environmental conditions. This experiment raised two issuesin the measurement of current leakage for chip packages and comb patterns: (1) given thetemperature and humidity levels for these tests, the levels to which the resistance willdrop are unknown, and (2) the expected resistance levels for the components exposed tosmoke are unknown. Because of these issues, the circuit bridging tests had no predictedoutput and no predetermined pass or failure limits for the measurements. Instead, smokegeneration factors were varied to determine which factors had significant impact on theelectrical characteristics of components and leakage between contacts.
NUREG/CR-6476

The factors that were tested included the amount of fuel, the presence of PVC in the fuel,the burning temperature, the humidity, introduction of CO2, and the presence of galvanicmaterial. Some of the factors that were varied directly affected the smoke production;however, humidity, CO2 and galvanic metal were included because they were likely tointeract with the smoke and affect electronic components. High humidity is known toaffect electronics and is commonplace after a fire if sprinklers or water-based fireextinguishers were used. CO2 is another common fire suppressant. It has been proposedthat CO2 may affect electronics by suddenly cooling the electronics and cracking thebonds. It has been included in some of the smoke exposures to determine if it wouldcause problems for the electronics. Zinc in galvanized metals has been known tocombine with chlorides that are frequent components of smoke. ZnCl2 is hygroscopic andwill absorb water from the air. The ZnCl2-water mixture forms a syrup, which can driponto components under the right conditions.
The test objects included seven chip packages, four comb patterns at different voltages,optical isolators, and 16 K memory chips. To determine whether coatings or housingshad any effect on the chips or comb patterns, some of these test components were coatedwith an acrylic spray or housed in a computer case.
The tests were similar to the smoke exposure tests that were conducted for the digitalsafety system for ORNL (Appendix D). The components to be exposed were placed in aLexan smoke exposure chamber which was connected by stainless steel chimneys to thecombustion chamber underneath the exposure chamber (Figures 1 and 2). Smoke wasproduced by heating the fuel with radiant heat lamps. The smoke was produced over aperiod of 15 minutes to an hour and the components were exposed to the smoke forapproximately 1 hour. Then the smoke was vented and the exposure chamber wasopened, exposing the components to the controlled temperature and humidity of theenvironmental chamber. The components were monitored before each smoke exposureand at least every 5 minutes throughout the test for 24 hours from the beginning of theexposure. During this monitoring period the components were either in the controlledenvironmental chamber or in the sealed smoke exposure chamber.
This experiment was not a standardized test and no baselines for acceptable orunacceptable performance exist. However, the test and the current leakage measured forthe various chip packages, comb pattern bias conditions, and control parameters haveyielded a considerable amount of information that can be used to analyze the effect ofsmoke on electrical components.
Components Tested
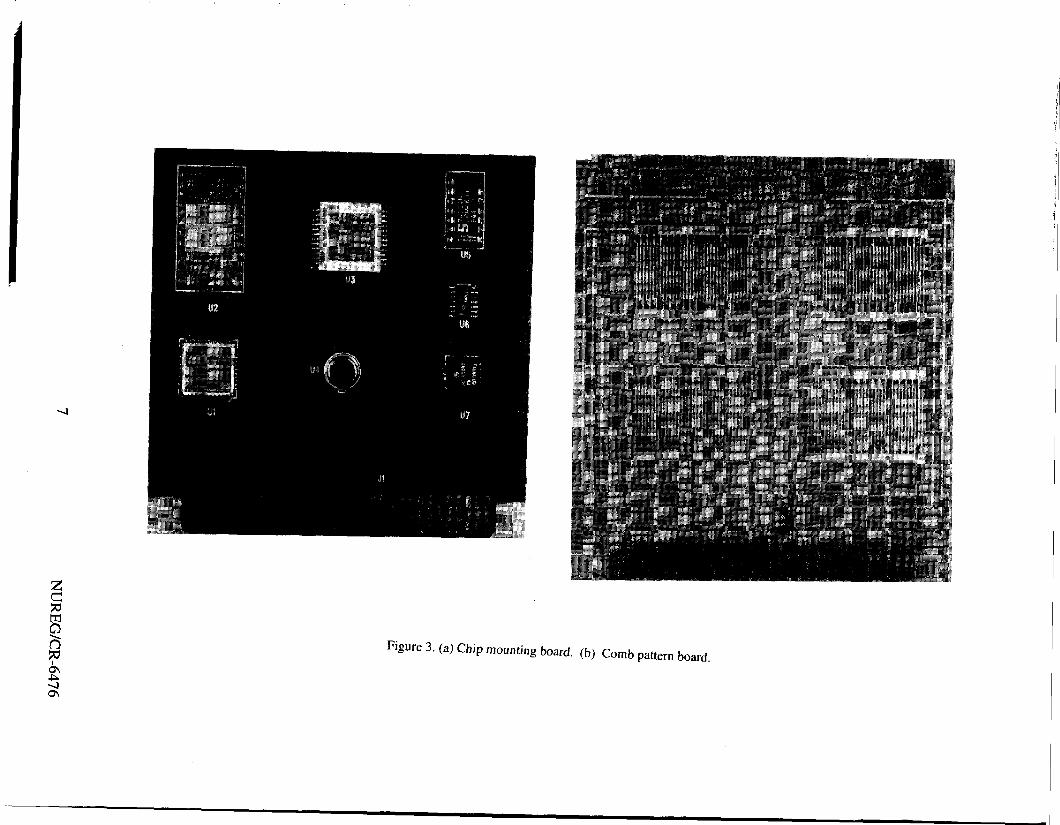
The components tested consisted of seven chip packages (Figure 3a), four comb patternsat different voltages, an operating optical isolator chip, and two 16-K memory chips. Thechip packages included a ceramic leadless chip carrier (LCC, Ul in Figure 3a), a ceramicdual-in-line package (CDIP, U2), a ceramic flat package (CFP, U3), a transistor outlinecan (TOC, U4), a plastic dual-in-line package (PDIP, U5), a small-outline integratedcircuit (SOIC, U6), and a plastic leaded chip carrier (PLCC, U7). The ceramic packagesand the TOC were empty packages while the PDIP and SOIC both contained four hexinverter circuits. These components were chosen because they typify modernmicroprocessor electronics. They represent both surface and plated-through-holemounting schemes and standard patterns used to measure soldering process quality andsurface insulation resistance.
NUREG/CR-6476
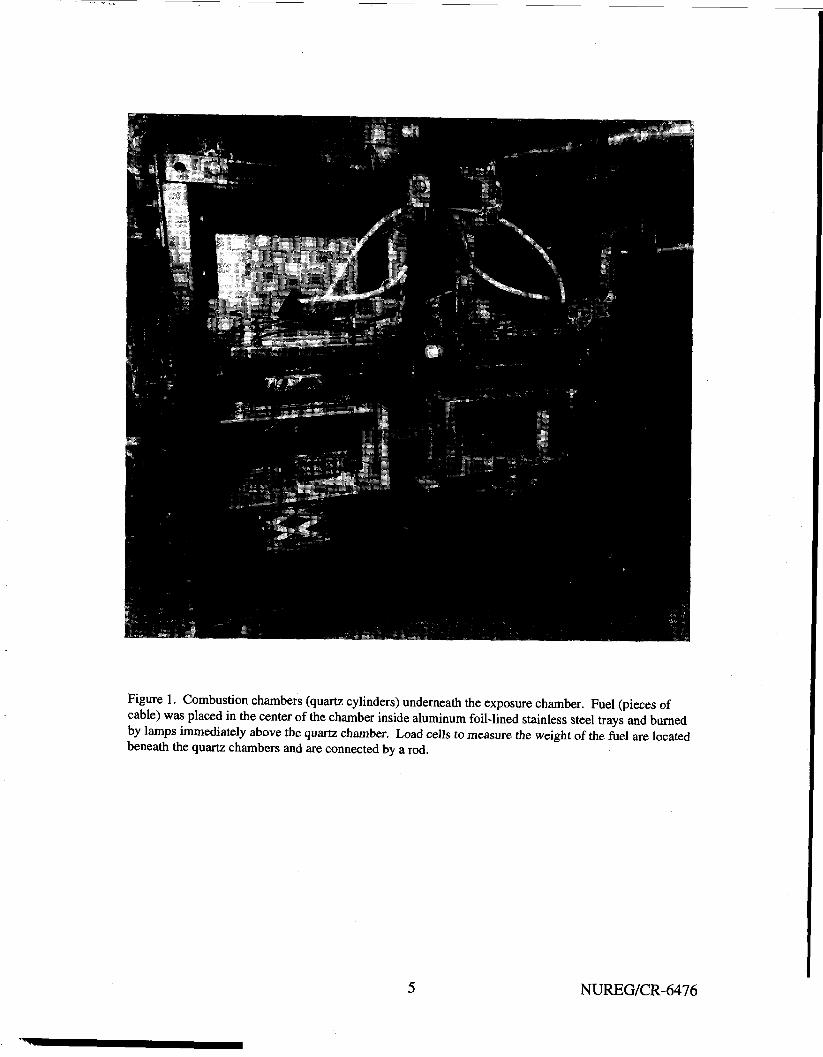
Figure 1. Combustion chambers (quartz cylinders) underneath the exposure chamber. Fuel (pieces ofcable) was placed in the center of the chamber inside aluminum foil-lined stainless steel trays and burnedby lamps immediately above the quartz chamber. Load cells to measure the weight of the fuel are locatedbeneath the quartz chambers and are connected by a rod.
NUREG/CR-6476

Figure 2. Exposure chamber of Lexan on top of combustion chamber. The Lexan is opaque because thechamber is filled with smoke. The lower right quartz lamp is emitting heat to burn fuel.
NUREG/CR-6476
a$ooON
ill ! {;:• ^:vi:«ffltt-Hit •( is - • " . ' . ..•••iii.!i|in!it|i :;
I ' ' i C' l !>.- I >•(• r I• i i ••
' 1 II f \!
ll ff'-lf''
•• u
I * i • • ' • •» . ' . i | • •, i i'(.«*, ^ '-if} . i
•'I ' .* tI i .
•I . IM ' " 1 . J
Figure 3. (a) Chip mounting board, (b) Comb pattern board.

Chip Packages
The objective of the chip package experiments was to measure the changes in resistancedue to smoke between contacts in components. A chip mounting board was designed thatallowed the leakage current between adjacent conductors to be measured while 5 V of dcwas supplied to the contacts. There were between 7 and 44 contacts for the seven chips.(Appendix E describes these packages.) Since any pair of contacts may be bridged, asmany contacts as possible were monitored.
When plastic chip packages are made, the chip and pins are manufactured first, and thenthe plastic package is molded around the electronics. For metal or ceramic packages, thepackage is fabricated first, and then the chip is mounted within the package. The easiestpackages to monitor were the four empty chip packages; every other conductor wasconnected by paths on the printed circuit board. The three plastic packages containedintegrated chips; therefore, only adjacent conductors that were independent of oneanother were monitored. The leadless plastic chip carrier (PLCC) was especiallycomplicated, because it contained an 8-bit A/D converter with serial interface with 1370field effect transistors. Both through-hole and surface-mounted components arerepresented in this list of chip packages. The LCC, CFP, SOIC, and PLC are surface-mounted packages and the CDIP, PDIP, and TOC are through-hole-mounted packages.
For the empty packages, all of the even-numbered pins were connected to a 5-Vdc supplyand all of the odd-numbered pins were connected to ground. For the hex inverters, thepower and ground pins were allowed to float, the inputs to the inverters were connectedto 5 V, and the outputs were connected to ground. The PLC chip has 11 analog inputpins; alternate input pins were connected to the power and ground While the chip waspowered with 5 V. The chip-mounting boards were connected by ribbon cables and cardedge connectors to the instrument measuring current leakage, which was located outsideof the environmental chamber.
For each smoke exposure, four chip-mounting boards in different configurations weretested (Figure 4). Three boards were mounted inside the smoke exposure chamber; theseboards were either bare, coated with an acrylic spray, or housed in a personal computerchassis (Figure 5) with an operating fan (i.e., a typical chassis "muffin" fan). A barecontrol board was located inside the environmental chamber, but outside the smokeexposure chamber. The boards were placed in position approximately 1 hour before thetest in most cases. The card edge connectors were wrapped in black electrical tape toprevent smoke from corroding the connectors.
The resistances were measured with a Keithley 617 multimeter and two HPswitcher/controllers. The multimeter, used as an ammeter, was switched between thechip packages and comb patterns. The switching was controlled so that the chip packagesalways had 5 V between the pins. The ammeter was switched into a circuit for 3 secondsbefore each measurement to allow it to reach to a stable condition. To ensure that thepower supplies were not overloaded by chip package shorts, limiting resistors wereincluded in the circuit.
Comb Patterns
Surface insulation resistance was measured on comb patterns on Institute forInterconnecting and Packaging Electronic Circuits (IPC) B-24 printed circuit boards.The IPC-B-24 boards (Figure 3b) contain four identical comb patterns. The comb teethwere 0.4 mm wide with 0.5-mm spaces between opposing teeth. The resistances of the
NUREG/CR-6476

Figure 4. Setup for smoke exposure test. The bare and coated chip-mounting boards and comb patternsare on left and right sides, respectively. The PC chassis with the cover removed is located in the center ofthe exposure chamber. The bare control board, located outside of the chamber, is draped over the ladder atthe right rear.
Figure 5. The PC unit covered with housing for the test. The discoloration is the result of earlier testssince the units were reused.
9 NUREG/CR-6476

comb patterns were measured similarly to those of the chip packages except that thevoltages were different. (One hundred sixty volts were applied to comb pattern A, 50Vdc to pattern B, and 5 Vdc to pattern C.) Pattern D was grounded except duringmeasurements, when 5 Vdc was applied. The different voltages allowed evaluation of theeffect of electric field strength on circuit bridging during and after smoke exposure.
As with the chip boards, four boards were included for each test: a bare board, an acrylic-coated board, a board housed in the PC chassis, and an unexposed control board (seeFigure 4). The boards were connected to the power and measurement circuit in the samemanner as the chip boards and were measured by the same ammeter.
Optical Isolators
A functioning 6N138 optical isolator, which provides a coupling for electrical circuitswith a direct electrical connection, was included in all of the smoke exposures. Thisdevice operates by using a light-emitting diode and a photodetector that are built into aplastic DIP body. The 6N138 is a low-input current, high-gain optocoupler built fortransistor-transistor logic (TTL) applications. The test circuit consisted of a square waveinput pulse, and the resistors and capacitors necessary to provide a switching test circuitas shown in Figure 6 (Hewlett-Packard, 1993).
For each exposure, a new optical isolator chip was placed in a socket containing thesupporting circuit. The input and output wave form parameters, pulse rise time,amplitude, and delay from the input pulse were measured on a digital oscilloscope. Astarting wave form was recorded, and if the values of rise time, delay, or amplitude variedby more than 5% from the starting values, a new wave form was recorded.
Memory Chips
Two package types for 16-K memory chips were exposed during each test: a plastic-packaged commercial chip and a ceramic-packaged chip developed at Sandia NationalLaboratories. The two chips had identical circuitry. They were subjected to a potentialof 5 V across their voltage supply and ground pins, but were not operated during theexposure. Standard functional tests were performed on the chips before and after thetests.
Scenarios Tested
The factors that were varied for the smoke exposures were fuel amount, presence ofpolyvinyl chloride as part of the fuel, burn temperature, humidity, addition of CO2, andpresence of galvanic metal. Fuel load, burn temperature, and humidity factors were eitherat a high or low level. The levels were chosen to span a range for a credible fire. ForCO2 and galvanic metal, the material was either present or absent. Because of the highnumber of parameters, every possible permutation was not performed; instead, onlyconditions that corresponded to likely scenarios in plants were produced.
A fire condition matrix was generated according to likely smoke scenarios, and tests 1 to15 followed this procedure until CO2and galvanic metal were determined not to bedetrimental to the components. The experimental design matrix was then modified sothat PVC could be included as a parameter and other combinations of factors could betested, such as the combination of high burn temperature and high fuel load. In all, 27tests were performed.
NUREG/CR-6476 10

2 channelOscilloscope
Figure 6. Switching test circuit. (Adapted from Hewlett-Packard Optoelectronics Designer's catalog.)
Fuel Level
Two standard amounts of cable were used as fuel in these tests as the high and low levels:3 g and 100 g of plastic insulation and jacket material. The fuel consisted of a mixture ofcables that are typical of nuclear power plants. The exact amount of plastic that wasavailable for burning is not known because the plastic was not stripped from the cableconductors and measured directly; however, the mass loss of the fuel was measured foreach test. The proportion of each type of cable was determined by the number of plantsthat use the cable as reported by EPRI in their study, "Low-Voltage Environmentally-Qualified Cable License Renewal Industry Report; Revision 1" (Bustard and Holzman,1994). Table 1 shows the total mass of the fuel samples used to produce smoke for thetests.
Burn Temperature
The cable material was burned at either high (50 kW/m2) or low heat fluxes (25 kW/m2).At low heat flux the cables just smoldered, but for high heat flux tests the cables wereignited if possible with a butane pilot light. For all high-heat flux burns, at least part ofthe burn took place with a flaming fire; however, the flame did not last the full time thatthe radiant lamps were on, presumably because the amount of oxygen available in thecombustion cell had dropped.
Humidity
High (75% RH) and low (<20% RH) humidity levels were controlled by anenvironmental chamber that housed the smoke exposure chamber. The humidity wasalways set before the test, but the humidity within the smoke exposure chamber was notcontrolled during the smoke exposure since the chamber was entirely enclosed to controlthe corrosive smoke. After the smoke was vented, the smoke exposure chamber wasopened and the environmental chamber controlled the humidity and temperature. Thehumidity level before the test can affect the resistance of the circuit bridgingmeasurements before the smoke is introduced.
11 NUREG/CR-6476

Table 1. Cable Fuel Weights
Cable Name
Rockbestos Firewall IIIAnaconda Flameguard lkvBrand Rex XLPEOkonite OkolonKerite HTKRockbestos Coax (le)Raychem XLPEDekoran DekoradBIWKerite FRPVC
Total (g)
Insulation
FRXLPEEPRXLPEEPR
XLPEEPDMEPR
PVC
Jacket
CSPECSPECSPECSPE
CSPECSPE
PVC
Low Fuelno PVC1.81.0
0.80.50.4 _ j0.7
High Fuelwith PVC38.617.320.016.316.713.89.911.78.117.04.4
High Fuelno PVC57.030.4
23.315.610.223.3
Suppression (CO2) and Galvanic
Additional effects were added by flooding the exposure chamber with CO2 from a fireextinguisher after the fuel was burned and adding a piece of corrugated galvanic roofingmaterial above the test articles. When the CO2 was added, 60% of the volume of thesmoke exposure chamber was filled with CO2, a standard percentage of the volume thatautomatic fire suppression systems will flood a room with in the case of a fire. Thiscorresponds to 2.5 lb of CO2 in the smoke exposure chamber.
The galvanized roofing material was included in some of the tests to simulate industrialenvironments. Zinc in the galvanized coating could combine with chlorides in smoke toform ZnCl2, which readily absorbs water from the atmosphere to form syrupy deposits.In past fires (Reagor, 1992), the presence of galvanic metal has increased damage toelectronics because droplets of ZnCl2 and water have deposited on the electronics. Theroofing material was cut so that it was above all of the test samples, but did not cover thechimney areas of the chamber. This metal piece was suspended approximately 1 footabove the test samples and covered almost the entire smoke exposure chamber.
Other Measurements
Temperature, humidity, smoke deposition, smoke optical density (turbidity), and fuelmass loss were measured, and soot samples were chemically analyzed. Descriptions ofthe methods used for these measurements can be found in Appendix D under smokeenvironment measurements. The results of these measurements are presented inAppendix F.
Test Matrix
The test matrix for all exposures performed is presented in Table 2. A value of 1indicates a high level for fuel, burn, or humidity. A value of 1 for PVC, suppression, orgalvanic indicates the presence of these conditions. Results of the tests were evaluated interms of these bipolar indicators rather than individual values. Test numbers wereassigned in order of the test performance.
NUREG/CR-6476 12

Results
Resistance Measurements
Smoke exposure caused changes in resistance in all components and comb patterns.Figure 7 shows exposed chip-mounting boards from several different tests. The upperleft board is a control board (unexposed to smoke) from test 25, the upper right board isthe coated board from test 16, the lower left board was in the PC chassis during test 25,and the lower right board was in the PC chassis during test 17. During test 25 the sootfrom the fan tended to form clumps, fly off the fan, and deposit on the boards housedinside the chassis. The lower right-hand board from test 17 experienced very nearly thesame environment as the lower left-hand board from test 25, differing only in that the fuelmixture for test 17 contained PVC while that for test 25 did not.
The comb pattern boards shown in Figure 8 are arranged according to the same tests asthe boards in Figure 7, with soot discoloration more evident on these lighter coloredprinted circuit boards. Although the effects of different voltages are not evident in thesereproductions, the higher voltage comb patterns (160 and 50 Vdc) collected more sootthan the lower voltage patterns (5 and 0 Vdc). The voltage on the 160-Vdc comb patternwas sufficiently high that when large pieces of soot landed on the bare board, sparks wereobserved.
The resistances of 44 components (7 types of chips and 4 combs in each of 4configurations: bare, coated, in housing, and control) per test were measured for a 24-hour period. In this period, approximately 450 measurements were made on eachcomponent.
The pretest values of resistance were expected to be the same between chips of the sametype; however, this was not the case. In addition to differences caused by pretesthumidity, the resistances of similar components were also different.
Figure 9 shows the plot of log10 [resistance(R)] against time of the four 160-V combpatterns for test 23. This plot can be used to draw some conclusions about the differencesbetween the surface insulation resistance of the board that was bare and exposed tosmoke, the coated board that was exposed to smoke, the bare board that was mounted in aPC chassis, and the control board, which was not exposed to smoke. The control boardhad very high resistance throughout the exposure; although some variation was evident,all values were quite high and changes were insignificant compared with the boardsexposed to smoke. The coated board and the board housed in a PC chassis behavedsimilarly; they both started at high resistance values and then their resistance values fellby 3 or 4 orders of magnitude when the smoke was produced. The bare board had thelowest resistance of all of the boards.
Resistances measured in these circuit bridging tests varied over many orders ofmagnitude, from a maximum of almost 1 petaohm (1015 ohms) to a minimum of 1milliohm (103 ohms). This large range was easier to analyze in terms of logarithms ofresistance. By analyzing the data in terms of logarithms of resistance rather thanresistance itself, more emphasis was placed on the smaller values of resistance thanwould have been the case if the data were analyzed in terms of just resistance.Henceforth, all discussion in this report is in terms of the log,0(R).
13 NUREG/CR-6476
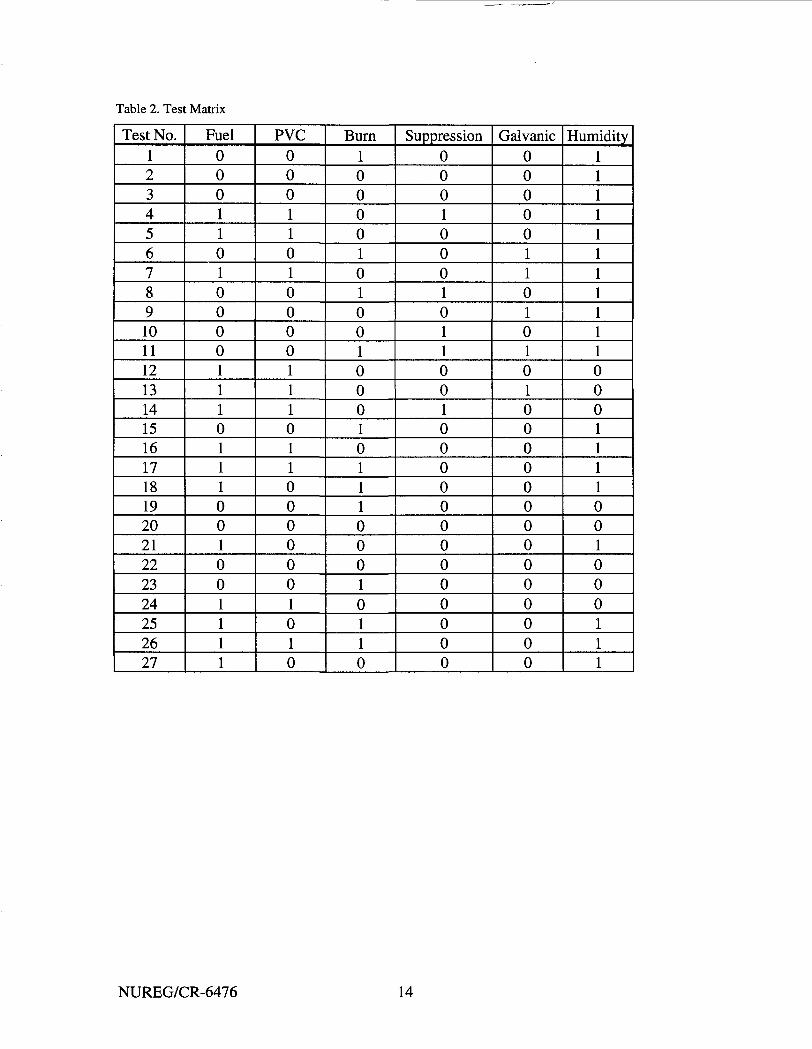
Table 2. Test Matrix
Test No.123456789101112131415161718192021222324252627
Fuel000110100001110111001001111
PVC000110100001110110000001010
Burn100001010010001011100010110
Suppression000100010110010000000000000
Galvanic000001101010100000000000000
Humidity111111111110001111001000111
NUREG/CR-6476 14

Figure 7. Exposed chip-mounting boards from different tests. Upper left: control. Upper right: test 16.Lower left: in PC chassis for test 25. Lower right: in PC chassis for test 17.
Scatter Diagrams
L°gio(R) w a s plotted against time from all 27 tests, but the plots are not reproduced herebecause of the large number (27 x 11=297 in all). Instead, scatter plots have beendeveloped to condense the data into fewer pages. For each component, the log10(R) atpretest, the log]0(R) averaged during the smoke production, and an average log10(R)starting 2 hours after the smoke exposure for 24 hours were determined for each test.Scatter plots of these averaged resistances (on a log scale) are presented in Figures 10,11,and 12 for the 160-V comb pattern for all tests. All of the points represented by the solidcircles are bare patterns, all of the squares are coated patterns, all of the triangles arepatterns placed inside the PC housing, and all of the asterisks are control patterns.
The averaged values that are plotted in the scatter diagrams represent a varied number ofpoints. In many cases the pretest value was only one measurement, whereas the after-smoke value represents the average of as many as 430 data points. Analysis of each datapoint as a function of time would have been an overwhelming task; therefore, all of theanalysis henceforth deals with the averaged values of pretest, during smoke, and aftersmoke.
15 NUREG/CR-6476

Figure 8. Exposed comb pattern boards. Arranged as in Figure 7.
Figure 10 compares log10(R) during smoke production with pretest levels. Values locatedalong a line between (0,0) and (15,15) correspond to patterns whose resistance did notchange because of the addition of the smoke. It had been expected that all of the pointsrepresented by * (control) would be located along this diagonal because these patternswere not exposed to smoke. As shown by the scatter plot, many of the control patternsdid not change value significantly, but some of the resistances increased, as indicated bytheir position above the diagonal line. The points that are below the line indicate that theresistance fell as a result of the smoke. Note that the pretest values range between 8 and15 while the log10(R) during smoke exposure ranges between 3.5 and 15. The range ofresistances for the presmoke patterns is much smaller than the resistances during thesmoke exposure.
Figure 11 compares the Iog10(resistance) pretest with the average after the smoke wasvented (2 to 24 hours after the smoke exposure began). In this figure it is interesting tonote the clump of solid dots (bare board) at approximately 1010 ohms along the diagonalline. This indicates that the resistances of the bare boards reverted back to their starting
NUREG/CR-6476 16

1E+15
1E+14
1E+13
1E+12
1E+11
1E+05
40. 50.
Time(hrs)
Figure 9. Plot of resistance against time for comb pattern (test 23).
IO.UU '
14.00 •
12.00 •
10.00 •
8.00 •
6.00 •
4.00 •
2.00 •
0.00
s^ A
^ _ 1 1 1 »_
X
n
AA
X
X
X *
¥a
X A _ AXA X X Xy
a *
•
A
A A
1 1—
AA
a
a
ft
••AX
BareCoatedChassisControl
- Slope 1
0.00 2.00 4.00 6.00 8.00
Pretest
10.00 12.00 14.00 16.00
Figure 10. Log10(R) during smoke production compared with pretest levels for a 160-V comb pattern.
17 NUREG/CR-6476

14.00 •
12.00 •
10.00 •
8.00 •
6.00 •
4.00 •
2.00 •
0.00 •
A
XX X
ja• j4ByS a
yS A
y S A MD D
/
£- 1 1 1 1 1.
1?X y
D
#
* ^ « X X j>
yK
D
A3 A
1 1—
AXX
a
a
•DAX
BareCoatedChassisControl
-SeriesS
0.00 2.00 4.00 6.00 8.00
Pretest
10.00 12.00 14.00 16.00
Figure 11. Log,0(R) after exposure compared with pretest for 160 V comb patterns.
value after the smoke was vented. The dots were not as tight on the previous figure. Ingeneral, most of the resistance measurements were higher after the smoke was ventedthan they were when the smoke was being produced, indicating some recovery.
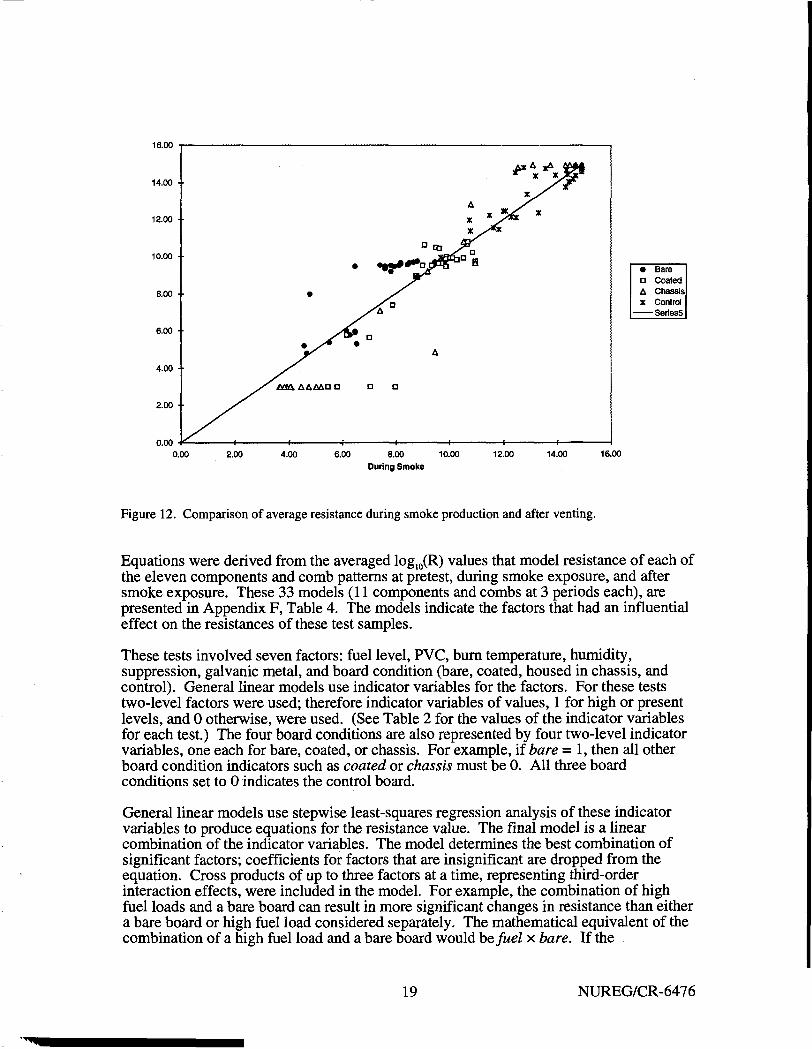
Figure 12 shows the comparison of the average resistance during the smoke productionwith the average after the venting period. In this figure a large number of points arelocated above the diagonal, indicating that the resistance was lower during the smokeexposure than during the venting period. For these boards, after the smoke exposure, theresistances recovered to some extent. For the values below the diagonal, the resistancesbecame worse as time went on even though the smoke was vented from the chamber. Itis interesting to note that the boards that had lower resistance values (higher degradation)during the smoke exposure did not recover as well as those that had higher resistances(lower degradation) during the smoke exposures. This would indicate that, for lightersmoke exposures, the electronics may recover from the smoke exposure, whereas forheavier smoke exposures, they may not. Similar figures for all of the componentpackages and comb patterns are included in Appendix F, figures 1 to 33.
Parameter Modeling
The scatter plots provide a good intuitive grasp of the effects of smoke in generalthroughout these tests and show the differences among different protective measures forthe boards, but in order to determine which of the smoke generation, environmentalcondition, or board condition factors were most significant, variances in resistance wereanalyzed using general linear models. The effect of these different factors is determinedby assessing the contribution of each factor to resistance in the linear models.
NUREG/CR-6476 18
16.00
14.00 •
12.00 •
10.00 •
8.00 •
6.00 •
4.00 •
2.00 •
0.00
••AX
BareCoatedChassisControl
-Series5
0.00 2.00 4.00 6.00 8.00During Smoke
10.00 12.00 14.00 16.00
Figure 12. Comparison of average resistance during smoke production and after venting.
Equations were derived from the averaged log,0(R) values that model resistance of each ofthe eleven components and comb patterns at pretest, during smoke exposure, and aftersmoke exposure. These 33 models (11 components and combs at 3 periods each), arepresented in Appendix F, Table 4. The models indicate the factors that had an influentialeffect on the resistances of these test samples.
These tests involved seven factors: fuel level, PVC, burn temperature, humidity,suppression, galvanic metal, and board condition (bare, coated, housed in chassis, andcontrol). General linear models use indicator variables for the factors. For these teststwo-level factors were used; therefore indicator variables of values, 1 for high or presentlevels, and 0 otherwise, were used. (See Table 2 for the values of the indicator variablesfor each test.) The four board conditions are also represented by four two-level indicatorvariables, one each for bare, coated, or chassis. For example, if bare = 1, then all otherboard condition indicators such as coated or chassis must be 0. All three boardconditions set to 0 indicates the control board.
General linear models use stepwise least-squares regression analysis of these indicatorvariables to produce equations for the resistance value. The final model is a linearcombination of the indicator variables. The model determines the best combination ofsignificant factors; coefficients for factors that are insignificant are dropped from theequation. Cross products of up to three factors at a time, representing third-orderinteraction effects, were included in the model. For example, the combination of highfuel loads and a bare board can result in more significant changes in resistance than eithera bare board or high fuel load considered separately. The mathematical equivalent of thecombination of a high fuel load and a bare board would be fuel x bare. If the
19 NUREG/CR-6476

combination of high fuel and a bare board is more significant than either high fuel or bareboard alone, a coefficient for this combination of factors appeared in the model. Thismodeling process determines the most significant factors influencing test results.
The following empirical general linear model shows the relationship between resistanceand the significant factors for the transistor outline can (TOC) for all conditions beforesmoke exposure:
Iog10(/?) = 12.27- 4.6 l x humidity
+1.09 x chassis
+3.82 x bare x humidity
+3.05 x coated x humidity
This model includes a constant value that was based on the control board, andcoefficients that are added or subtracted from the constant depending on whether any ofthe factors are in their "high" state (indicator variable value =1). The constantcorresponds to the resistance of the control TOC for low humidity.
This model can be used to determine a value for the control TOC in high humidity. Inthis case, the contributions from bare, coated, and chassis would be 0 because for thecontrol board, the indicator variables of bare, chassis, and coating are 0, and only thecontribution due to high humidity, -4.61, would remain because humidity would be 1.The model would give a value of:
Iog10[/?(Q)] = 12.27 - 4.61 = 7.66
When all of the models are analyzed on an individual basis, they may yield confusinginformation. For example, for the ceramic leadless chip carrier during pretest, thecontrol, bare, and chassis boards are all exposed to the same environments. Table 4 inAppendix F shows that the values "before" the test are different, as noted by the value -4.04 under the column marked "bare." This large variation between the differentconditions of the ceramic leadless chip carrier is again modified for the case of a highburn temperature by the value +4.28 under BxBare, and by the value -4.81 for the high-humidity, high-burn temperature case (BxHxBare).
To obtain an overall understanding of the most influential effects, a Pareto analysis wasperformed (Figure 13) on all 11 components taken as a whole. The height of the columnindicates the number of times that each factor or combination of factors appears in the 33models. A separate column was graphed for each period that was analyzed: presmoke,during smoke, and after smoke. Single occurrences of any factor were not included in thegraph. Since there were 7 chip components and 4 comb patterns, 11 is the maximumpossible number of times that a factor or combination of factors could appear in themodels. Figure 13 does not indicate whether the factor will increase or decrease theresistance, it merely indicates whether the factor is significant. Significant factorsappearing most frequently in the different resistance models had more influence on theoverall test results.
Not only do the models provide information on significant factor effects, they alsoprovide insight into the experimental test conditions, the conduct of the experiment, anddata variability. For example, the constant term corresponding to the control board at the
NUREG/CR-6476 20

3TO
I
S3
EL
O
en
ri5'Io
Occurrences
Bare
Coated
Chassis
Humidity
Bare x Burn
Bare x Fuel
Bare x Humidity
Coated x Fuel
Coated xPVC
Coated x Humidity
Chassis x Burn
Chassis x Fuel
Chassis x Humidity
Fuel x Humidity
Bare x Fuel x Burn
Bare x Burn x Humidity
Bare x Fuel x Humidity
Bare x Fuel x Supression
Coated x Fuel x Humidity
Coated x Fuel x Supression
Coated x Fuel x Bum
Coaled x Burn x Galvanized
Coated x Suppression x Galvanized
Chassis x Burn x Humidity
Chassis x Bum x Galvanized
Chassis x Fuel x Galvanized
Chassis x Humidity x Suppression
Chassis x Suppression x Galvanized
Fuel x Humidity x Galvanized

low or absent levels varies widely—the 5-V comb pattern is particularly low, as can beseen in Appendix F.
The models also show the four different boards to be significantly different from eachother before the smoke exposure began, which was unexpected. The coated boards weresprayed with an acrylic coating, so they may have been different, but differences in thebare, chassis, and control boards are probably the results of variation in the testingcircuitry. A low-resistance measurement could be caused in two ways, leakage across thechip or comb pattern, or leakage in the measurement circuit such as shorts in theconnectors or cables. Although the circuits were checked before testing began, they werenot checked regularly between tests. Stray wires or solder may affect the leakage currentmeasurements because the leakage currents for these components are very low to startwith.
Another issue brought out by the models is the identification of some exposure factors asbeing significant at pretest, before the exposure begins. For example, in the presmoke160-V comb model, coefficients for burn and fuel should not be included because theamount of fuel and the burn temperature should not have any effect on leakage before thefuel is ignited. The analysis should not have allowed these factors to enter the models.Their inclusion in some of the models indicates that they account for some of thevariation in the response variables. Further investigation into the inclusion of thesespurious factors at pretest was not possible due to insufficient sample size and lack ofrepetition.
Summary of Factors Important to Change in Resistance
The coefficients for all of the components were considered together to determine whichfactors were the most significant during the different periods of the exposures. Thefactors that were significant before the smoke exposures were the type of board and thehumidity level. The humidity was applied to all boards prior to the test, and the highlevel of humidity lowered the resistance. The type of board (bare, coated, or chassis) alsowas significant, but unlike humidity, the values of the coefficients were not consistentlynegative or positive, possibly reflecting the variation in test circuitry or in the boardsthemselves.
During the smoke exposure, more factors became significant for resistance. These factorsincluded burn temperature, amount of fuel, a combination of fuel level and humidity, anda combination of burn temperature and galvanic metal. In the modeling of therelationships of significant factors, these additional factors appeared as products withboard type, indicating that the control boards were not influenced by these factors. The"high" or "present" state for all of these factors tended to lower the resistance (increasedegradation).
The same factors that were significant during the exposure were significant for resistanceafter the smoke exposure: type of board, humidity, burn temperature, fuel, and acombination of fuel and humidity. The presence of galvanic metal was not significant forthe after-smoke resistance.
The factors that appear to be most significant overall are humidity, fuel level, and burntemperature. Humidity appears alone, which is reasonable since the humidity wasapplied to all boards, including the control board, but fuel level and burn temperature
NUREG/CR-6476 22

appear as products with board condition or with humidity and board condition. Thecondition of the board strongly affected how much these factors influenced the resistance.For example, the combination of fuel and humidity had a larger effect on bare and chassisboards than on the coated boards after the smoke exposure. Also, the combination of fueland humidity was stronger than the effect of fuel or humidity alone, indicating asynergistic effect on the circuit bridging.
Optical Isolator Chip
The amplitude, rise time, and delay of the output of the optical isolator was recorded oncefor each scan of the resistance measurements. The recorded measurements were averagedfor 16 consecutive traces by a digitizing oscilloscope and recorded with the resistancemeasurements by the computer. When the change in the amplitude, rise time and delaywere large enough, the wave form was also recorded. The following equation, which ineffect averages the changes of all of the measured parameters, provides the criterion forrecording a wave form:
where A is the amplitude, tr is the rise time, td is the delay time, and A indicates thechange in the corresponding value from the last recorded wave form.
The values of rise time and delay are plotted in Figures 13 to 16 for tests 27 and 5 andillustrate how the rise time and delay are affected by smoke. Both of these tests had highfuel humidity, high fuel loads, and low burn temperature. During test 27, the opticalisolator ceased pulsing during the smoke exposure, resulting in the rise time and delayvalues approaching infinity. The optical isolator in test 5 did not quit functioning, butsome jitter in rise time is shown. Such jitter may affect the performance of thecommunications between digital systems, but the reliability of those systems will dependupon the particular circuits that are involved. Table 3 presents some of the measurementstaken during the smoke exposures. The columns that start with "1 s t" ratio, rise, or delayare pretest values. Note that the pretest ratios generally dropped as the tests progressed,presumably due to some degradation in the chip-mounting fixture that was reused, withnew chips, in each test. The same was true in general for the pretest rise and delay times.The average values represent averages during the entire test and the "STD" values are thestandard deviations. No statistical evaluation of these data has been performed.
Memory Chips
The 16-K memory chips were tested both before and after the smoke exposures, but werenot tested during the exposures, though 5 V was applied during the exposures. Table 4lists the pass/failure (1 stands for pass and 0 stands for failure) of each chip. Morefailures occurred for the plastic-bodied chips than the ceramic-bodied chips. Thehermetic seal on the ceramic-bodied chips may have increased their reliability. Theoptical isolator output is also presented in the table in terms of passing or failing. Thecriterion used for the optical isolator was whether the chip continued to put out a signal.
The optical isolator and both memory chips were dual in-line packages (DIPS), socomparisons can be made between the failures of these chips and the resistance measuredfor the plastic DIP on the bare chip mounting board for particular tests. The modelingequation for a bare plastic DIP was used to derive the resistances in Table 4. The failures
23 NUREG/CR-6476

10 15Time (Hr)
Figure 14. Optical isolator delay from test 27.
10 15
Time (Hr)
1.0E-4 •
9.0E-5 •
8.0E-5 •
7.0E-5 •
6.0E-5 •
5.0E-5 •
4.0E-5 •
3.0E-5 •
2.0E-5
1.0E-5
0.0E+O
¥
IIIj
illll
1ill > 11 it \ i 1 uriiin Jhk th •! i t .AI A )u J l i s l i i i i f l i i f t i d i l i l b L l i J M lifll^
1 1 1 1
20 25
Figure 15. Optical isolator rise time from test 27.
NUREG/CR-6476 24

1E-04
9E-05
8E-05 •
7E-05 •
6E-05 • •
5E-05
4E-05
3E-05
2E-05
1E-05
OE+00
15 20 25
Time (Hr)
Figure 16. Optical isolator delay from test 5.
Figure 17. Optical isolator rise time from test 5
25 NUREG/CR-6476
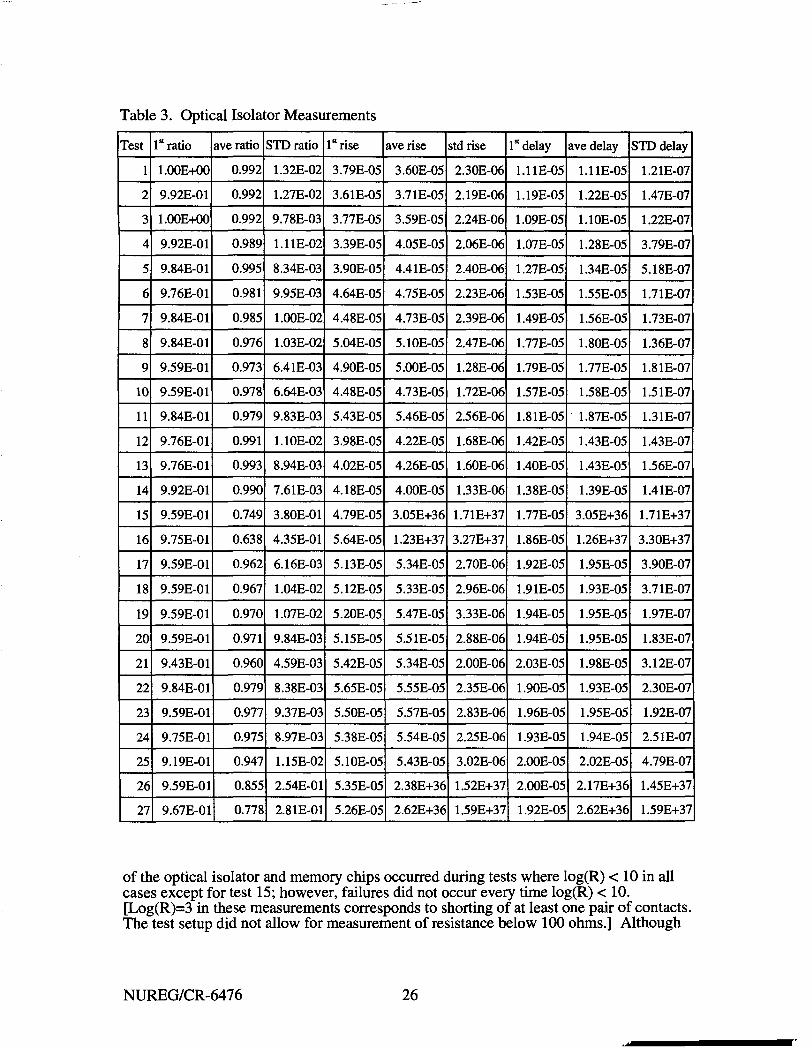
Table 3. Optical Isolator Measurements
Test
1
2
3
4
5
6
7
g
9
10
11
12
13
14
15
16
17
18
19
20
21
22
23
24
25
26
27
1st ratio
1.00E+00
9.92E-01
1.00E+00
9.92E-01
9.84E-01
9.76E-01
9.84E-01
9.84E-01
9.59E-01
9.59E-01
9.84E-01
9.76E-01
9.76E-01
9.92E-01
9.59E-01
9.75E-01
9.59E-01
9.59E-01
9.59E-01
9.59E-01
9.43E-01
9.84E-01
9.59E-01
9.75E-01
9.19E-01
9.59E-01
9.67E-01
ave ratio
0.992
0.992
0.992
0.989
0.995
0.981
0.985
0.976
0.973
0.978
0.979
0.991
0.993
0.990
0.749
0.638
0.962
0.967
0.970
0.971
0.960
0.979
0.977
0.975
0.947
0.855
0.778
STD ratio
1.32E-02
1.27E-02
9.78E-03
1.11E-02
8.34E-03
9.95E-03
1.00E-02
1.03E-02
6.41E-03
6.64E-03
9.83E-O3
1.10E-02
8.94E-03
7.61E-03
3.80E-01
4.35E-01
6.16E-03
1.04E-02
1.07E-02
9.84E-03
4.59E-03
8.38E-03
9.37E-03
8.97E-03
1.15E-02
2.54E-01
2.81E-01
1st rise
3.79E-05
3.61E-05
3.77E-05
3.39E-05
3.90E-05
4.64E-05
4.48E-05
5.04E-05
4.90E-05
4.48E-05
5.43E-05
3.98E-05
4.02E-05
4.18E-05
4.79E-05
5.64E-05
5.13E-05
5.12E-05
5.20E-05
5.15E-05
5.42E-05
5.65E-05
5.50E-05
5.38E-05
5.10E-05
5.35E-05
5.26E-05
ave rise
3.60E-05
3.71E-05
3.59E-05
4.05E-05
4.41E-05
4.75E-05
4.73E-05
5.10E-05
5.00E-05
4.73E-05
5.46E-05
4.22E-05
4.26E-05
4.00E-05
3.05E+36
1.23E+37
5.34E-05
5.33E-05
5.47E-05
5.51E-05
5.34E-05
5.55E-05
5.57E-05
5.54E-05
5.43E-05
2.38E+36
2.62E+36
stdrise
2.30E-06
2.19E-06
2.24E-06
2.06E-06
2.40E-06
2.23E-06
2.39E-06
2.47E-06
1.28E-06
1.72E-06
2.56E-06
1.68E-06
1.60E-06
1.33E-O6
1.71E+37
3.27E+37
2.70E-06
2.96E-06
3.33E-06
2.88E-06
2.00E-06
2.35E-06
2.83E-06
2.25E-06
3.02E-06
1.52E+37
1.59E+37
1st delay
1.11E-05
1.19E-05
1.09E-05
1.07E-05
1.27E-05
1.53E-05
1.49E-05
1.77E-05
1.79E-05
1.57E-O5
1.81E-05
1.42E-05
1.40E-05
1.38E-05
1.77E-05
1.86E-05
1.92E-05
1.91E-05
1.94E-05
1.94E-05
2.03E-05
1.90E-05
1.96E-05
1.93E-05
2.O0E-05
2.00E-05
1.92E-05
ave delay
1.11E-05
1.22E-05
1.10E-05
1.28E-05
1.34E-05
1.55E-05
1.56E-05
1.80E-05
1.77E-05
1.58E-05
1.87E-05
1.43E-05
1.43E-05
1.39E-05
3.05E+36
1.26E+37
1.95E-05
1.93E-05
1.95E-05
1.95E-05
1.98E-O5
1.93E-05
1.95E-05
1.94E-05
2.02E-05
2.17E+36
2.62E+36
STD delay
1.21E-07
1.47E-07
1.22E-07
3.79E-07
5.18E-07
1.71E-07
1.73E-07
1.36E-07
1.81E-07
1.51E-07
1.31E-07
1.43E-07
1.56E-07
1.41E-07
1.71E+37
3.30E+37
3.90E-07
3.71E-07
1.97E-07
1.83E-07
3.12E-07
2.30E-07
1.92E-07
2.51E-07
4.79E-07
1.45E+37
1.59E+37
of the optical isolator and memory chips occurred during tests where log(R) < 10 in allcases except for test 15; however, failures did not occur every time log(R) < 10.[Log(R)=3 in these measurements corresponds to shorting of at least one pair of contacts.The test setup did not allow for measurement of resistance below 100 ohms.] Although
NUREG/CR-6476 26

Table 4.
Test No.
123456789101112131415161718192021222324252627
Memory Chips and
Calculated log (R)
12121233123121212121313131233313133131313333
Optical Isolator
Ceramic Mem
111111111111111111111111011
Plastic Mem.
111011011111111100111111010
OpticalIsolator
111111111111110011111111100
the chips package measurements indicated that the contacts of the plastic DIP shorted forcertain tests, the optical isolator and memory chips did not always fail on the same tests.The chip package measurements were more sensitive because they monitored all pairs ofcontacts rather than only those required for a chip to operate. The chip packages werealso placed in slightly different locations in the smoke exposure chamber than thememory and optical isolator chips (both were on the right side of the chassis as shown inFigure 4), exposing the different chips to different amounts of smoke and in differentorientations. No measurements were made of amount of smoke or soot in the immediatevicinity of these chips, so no conclusions can be drawn regarding the effect of differentlocations in the exposure chamber. Also, no thermocouples were located close enough tothe chip boards to resolve differences between them.
27 NUREG/CR-6476

Summary of Results
Technology and Packaging
Digital I&C components are available with many different technologies and packages.Metal and ceramic packaging, which are hermetically sealed, tend to be more reliablethan plastic packages. The data from the 16-K memory chips show that the ceramicpackages were more robust than the plastic packages in a smoke environment.Differences between ceramic and plastic packages were not evident from the resistancemeasurements; therefore, the higher failure rate of plastic packages may be due topenetration of the plastic by humidity rather than shorting of contacts with soot. Mostcommon digital electronics, however, use inexpensive plastic packages. Hermeticallysealed packages are significantly more expensive and are not typically available unlessused for military applications.
The voltages at which the digital electronics operate vary according to the digital chiptechnology. Resistance measurements on the comb patterns indicate that patterns areaffected by smoke more if the applied voltage is higher. The higher voltage lowers theresistance before the smoke is applied and continues to produce more leakage currentthroughout the exposure. Visually, soot tends to accumulate more around the highvoltage patterns, and the 160-V pattern was observed to be arcing during the smokeexposure.
Two hex inverter chips were included on the chip mounting board to determine thedifference between an SOIC package and a DIP. The data indicated no appreciabledifference between these two packages: when the fuel was high, both packages shorted;when the fuel was low, the resistance dropped slightly for both packages, and thenrecovered. Little difference was observed among all of the chip packages. A reason fornot being able to determine differences may be that the low fuel loads were too low tocause much change in resistance, while for a high fuel load, virtually all of the packagesshorted.
These tests measured leakage currents that determined the change in resistance betweencontacts on components. Loss of resistance can cause problems in many components andcircuits; for example, if the resistance between a contact to supply voltage and one to aninput signal drops, a false signal may be received by the device input from the voltagesupply. The likelihood of this happening depends on many factors such as the amount ofsmoke, location of the contacts, and humidity level. In general, loss of resistancebetween contacts will cause serious problems in any digital circuit. The exposures ofseveral different circuits will be tested next in this project.
Protection
Bare boards were highly affected by smoke while coated boards seemed to be lessaffected. Housing the boards in a PC chassis, which contained a fan, only minimallyprotected them. Visually, some of the boards that were placed within the chassis lookedworse than those that were unprotected because clumps of soot were deposited on theboard. For the high fuel tests, however, virtually all components in the PC chassis wereshorted in these situations and little difference could be observed in the resistancemeasurements.
NUREG/CR-6476 28

Significant Factors in Determining Circuit Bridging
Several observations can be made from the component tests; the most significant factorsare humidity, fuel level, and burn temperature. High humidity has been shown to affectthe surface insulation resistance of printed circuit boards in environmental testing (Imanet al., 1995). Other fire corrosivity tests that used comb patterns also showed that theresistance of exposed comb patterns is highly affected by humidity (Caudill et al., 1995).
As more fuel is burned, resistance drops. Smoke from plastic leaves a film, which isblack and powdery if the plastic is burned in the flaming mode with adequate oxygen.The film is white and oily if produced without a flame and black and oily if producedwith a flame but the flame extinguishes due to lack of oxygen. For low fuel loads, theresistance generally dropped during the smoke exposure but recovered after the smokewas vented. This recovery was not often the case with the high fuel loads; once thecircuit was shorted, it never recovered.
The burn temperature ( flaming vs. smoldering) did not affect the resistance as much asthe humidity or fuel amount. The burn temperature would be expected to change thesmoke products in two ways: different chemical products can be produced at differenttemperatures, and the mass loss rate of the fuel is slower if the fire is smoldering.Chemical analyses for Cl, Br and SO4 show a low correlation between burn temperatureand the amount of these chemicals in the soot (Appendix F). Analysis of the amount offuel that was burned shows that neither the burn temperature nor the fuel level alonedetermines the percentage of fuel that is burned. If a large amount of fuel was burned at alow temperature, approximately 20% of the fuel was consumed, while if a small amountof fuel was burned at either temperature or a large amount of fuel was burned at hightemperature, approximately 40-50% of the fuel was burned. These results are presentedin Appendix F.
The circuit bridging tests showed that the synergistic effects of smoke and humidity arehigher than for humidity alone. This observation is supported by the frequency withwhich the modeling equations contain the combination of fuel level and humiditycoefficients. If each factor, fuel and humidity, reduced the resistance in an additive wayinstead of synergistically, the effect of these two factors could be adequately modeled byeach factor alone.
PVC (included as part of the fuel load on the high fuel tests only) showed very littleeffect on resistance. Only a small proportion of the fuel was PVC in these tests and, withthe high fuel load, many of the components shorted without PVC. There is also littlecorrelation between the Cl deposition found by chemical analysis and the presence ofPVC. Although the other cable materials did not contain PVC, some had highproportions of Cl and Br, which are typically used as fire retardants. No other cablematerials were singled out for study in these tests.
The addition of CO2 as a fire suppressant did not affect the resistance adversely,supporting results from the ORNL smoke exposures. The addition of CO2 may bebeneficial to the electronics by cooling the room and blowing away some of the sootdeposition. These findings are supported by tests on the effect of CO2 on computers(Arvidson and Persson, 1993).
The galvanic metal was expected to trap Cl in the form of ZnCl2, form a thick liquid, anddrip onto the electronics (Reagor, 1992). Although a greasy film formed on the galvanicmetal that was suspended in the smoke exposure chamber, the film never accumulated
29 NUREG/CR-6476

enough water to drip. Instead, the metal piece formed a surface upon which some of thesmoke deposited. The overall effect was to reduce deposition on the surface of theelectronics and reduce the negative effect of the smoke. On some high-humidity tests,water appeared to be collecting at the base of the PC chassis. This water did not affectany of the components. Overall, these tests were found to be of an inadequate scale toproperly assess the importance of this factor.
Resistances of control board components varied during the smoke exposures. It is notclear if factors other than humidity affected these boards. Other possibilities includeEMI. For the functional circuit tests planned for fall 1996, several "dry" runs areplanned. These runs will include tests of humidity only and tests in which the radiantheat lamps are turned on but no fuel will be available to create smoke.
Some of the resistance values were lower than expected even before the smoke wasapplied. The electrical circuitry had leakage currents that were not resolved beforetesting. Although most of these problems were resolved before testing the circuits,leakage remained in a few. This indicates circuits should be carefully tested before eachsmoke test.
The card edge connectors and sockets for the functional chips were not changed betweentests although they were protected by electrical tape. These connectors were still affectedby smoke and were replaced once during the test series. Accumulated smoke can causecurrent leakage paths over time with repeated exposures.
Conclusions
The tests described in this report studied factors that could possibly affect circuit bridgingin typical digital electronic components. The factors that were studied can be dividedinto three categories: component technology and packaging, circuit board protection withcoatings or enclosures, and smoke generation factors. Several conclusions may be drawnfrom the results of these circuit bridging tests and the previous tests described in theappendices to this report. These conclusions include:
1. Smoke causes circuit bridging in components. Circuit bridging increases leakagecurrents and can cause failures because stray currents cause errors in digitalcircuitry.
2. Factors that affect circuit bridging are the amount of smoke, humidity level, andburning mode.
3. Although surface deposits cause some circuit bridging, the presence of smoke inthe air also causes increased leakage.
4. The effect of circuit bridging on digital I&C equipment depends on the particularcomponents and circuits. Component packaging (plastic, ceramic, or metal) andtechnology (CMOS, FET, or fast Schottsky) are only a few of the factors thatdetermine the likelihood of survival of a circuit or component.
5. Conformal coatings add some protection to circuits.
NUREG/CR-6476 30

6. Mechanical protection may also protect circuits, depending on the presence of aventilation fan. A fan may draw more smoke into the electronics.
Smoke may have a very destructive impact on digital electronics, producing immediatecircuit bridging and, after several weeks, corrosion of metal parts. The component testsfocused on circuit bridging in typical components and the factors that can influence howmuch the smoke will affect them. These factors include the component technology andpackaging, physical board protection, and environmental conditions such as the amountof smoke, temperature of burn, and humidity level. Hermetically sealed ceramicpackages were less affected by smoke than plastic packages. Coating the boards with anacrylic spray provides some protection against circuit bridging. The most significantfactors were humidity, fuel level, and burn temperature. The use of CO2 as a firesuppressant, the presence of galvanic metal, and the presence of PVC did notsignificantly affect resistance measurements. The next series of tests will include a studyon functional circuits and will be reported in a separate NUREG/CR.
References
Arvidson, M., and H. Persson. 1993. Koldioxids (CO2) paverkan pa elektronik -slackning med laga koncentrationer. [Carbon Dioxide Suppression Systems - Risk ofDamage to Electrical Equipment.] Swedish National Testing and Research Institute, SRReport 1993:20.
Bustard, L., and P. Holzman. 1994. Low-Voltage Environmentally Qualified CableLicense Renewal Industry Report; Revision 1, Electric Power Research Institute, PaloAlto, CA.
Caudill, L. M., J. T. Chapin, R. B. Comizzoli, et al., 1995. "Current State of FireCorrosivity Testing: Preliminary Electrical Leakage Current Measurements," in Proc.International Wire & Cable Symposium, pp. 432-437.
Hassan, M., and W. E. Vesely. 1996. Risk-based Prioritization of EnvironmentalStressors Which Can Affect Advanced Digital I&C Equipment in Nuclear Power Plants,Technical Report L-1908, T6, Brookhaven National Laboratories, Upton, NY.
Hewlett-Packard, 1993. Optoelectronics Designer's Catalog: U.S.A., Hewlett-PackardCo. 5091-4573E.
Iman, R. L., R. V. Burress, D. J. Anderson, et al., 1995. "Evaluation of Low-ResidueSoldering for Military and Commercial Applications: A Report from the Low ResidueSoldering Task Force," Sandia National Laboratories, Albuquerque, NM.
Korsah, K., R. L. Clark, and R. T. Wood. 1994. Functional Issues and EnvironmentalQualification of Digital Protection Systems of Advanced Light-Water Nuclear Reactors,NUREG/CR 5904, Oak Ridge National Laboratories, Oak Ridge, TN.
Korsah, K., T. J. Tanaka, T. L. Wilson, and R. T. Wood. 1996. Environmental Testing ofan Experimental Digital Safety Channel, NUREG/CR 6406, Oak Ridge NationalLaboratories, Oak Ridge, TN.
31 NUREG/CR-6476

Reagor, B., 1992. "Smoke Corrosivity: Generation, Impact, Detection, and Protection,"Fire Sciences, v. 10, pp. 169-179.
Tanaka, T. J., K. Korsah, and C. E. Antonescu. 1996. "Preliminary Studies on the Impactof Smoke on Digital Equipment," in Proc. Twenty-Third Water Reactor SafetyInformation Meeting, U. S. Nuclear Regulatory Commission, Office of NuclearRegulatory Research, Washington, DC, pp. 85-99.
NUREG/CR-6476 32

Appendix ADefining Credible Smoke Exposure ScenariosPrepared by:Steve NowlenSandia National Laboratories
September 1994
Abstract
This letter report defines smoke threat scenarios which are likely to be experienced byadvance electronic circuit components during a fire event in a nuclear power plant.Smoke is, in general, a very poorly understood material. The direct definition of thecomposition of the smoke likely to be generated during any given fire event is notpossible based on the current state of knowledge. Hence, for this report, the approachtaken is to identify and define those factors which are considered of primary importanceto the generation of "representative" smoke, rather than attempting to define the exactnature of the smoke itself. This definition includes the consideration of the "quantity,""quality," and duration of the smoke exposure. Smoke quantity is defined in terms of theratio between the mass of fuel burned during a given fire scenario and the volume of airinto which the fire products will be distributed. Smoke quality is defined as those aspectsof the threat scenario which will influence the chemical composition of the smoke. Theseinclude the materials likely to be burned, the anticipated modes of burning, andsynergistic interactions with transport surfaces and fire suppressants. The duration of theexposure considers both the duration of the component exposure to the actual smoke-filled environment, and the post-exposure period during which continue exposure to theaccumulated deposits would be expected. The smoke threat scenario definitions providedrepresent a range of conditions which are expected to encompass the likely smoke threatscenarios for nuclear power plant fires.
NUREG/CR-6476 A-l

Table of ContentsI. Introduction .4
A. Objective 4B. Scope of Definition 4
II. Equipment Threat Issues 5A. Overview 5B. Direct Corrosive Attack 5C. Circuit Bridging Faults 7D. Contact Fouling 7E. Degradation of Fine Movement 8F. Interactions at Elevated Temperatures 8
III. Characterization of Smoke Quantity 9A. Introduction 9B. Small In-Cabinet Electrical Control Panel Fire 9
1. General Scenario Description 102. Quantity of Combustible Materials Involved 11
C. Large Electrical Control Panel Fire 121. General Scenario Description 122. Quantity of Combustible Materials Involved 14
D. General Fire Area Scenarios 151. General Scenario Description 152. Quantity of Combustible Materials Involved 16
E. Smoke Spread from an Adjacent Fire Area 17F. Summary of Scenario Fuel Mass to Air Volume Ratios 17
IV. Identification and Characterization of Critical Smoke Quality Parameters 18A. Overview 18B. Type of Materials Burned 19
1. Combustible Gases 19C. Liquid Fuels 20
1. Transient Fuels 202. In situ Solids 203. Material Identification Conclusions 22
D. Combustion Mode.... 23E. Suppressant Interactions 24
1. Water-Based Suppressant Interactions 242. Carbon Dioxide Suppressant Interactions 243. Dry Chemical Powder Interactions 254. Halon Suppressant Interactions 25
F. Transport Interactions 26G. Summary of Smoke Quality Insights 26
V. Duration of Smoke Exposure 27A. Overview 27B. Smoke Purge Time 28C. Post-Fire Recovery Times 29D. Transport/Exposure Duration Interactions 29E. Summary of Exposure Duration Times 30
A-2 NUREG/CR-6476

VI. Summary of Exposure Characterization Insights 30VII. References 32
NUREG/CR-6476 A-3

I. Introduction
A. Objective
The objective of this report is to define smoke exposure scenarios representative of thoselikely to be encountered in the event of a fire within a nuclear power plant. Thesescenarios are expected to be used as the basis for testing nuclear power plant equipment,and in particular advanced types of integrated circuit and fiber optic based components,for smoke damage vulnerability.
B. Scope of Definition
In the definition of smoke exposure scenarios, the factors considered to be of primaryimportance are those which will determine the quantity, quality, and duration of thesmoke exposure. Quantity is associated with both the gross amount of smoke generatedand with the dilution of that smoke into the affected air volume. Quality is related to thephysical nature of the smoke itself, and in particular, to its chemical composition. Theduration of the exposure will include consideration of the fire growth and suppressionperiods, as well as the post-fire recovery times. A number of parameters can be identifiedwhich will influence these aspects of the smoke exposure environment. This study hasattempted to identify and characterize those parameters that will be of primary influence.
It must be recognized at the outset that the current state of knowledge regarding thenature of smoke is relatively poor. This primarily affects those issues associated withsmoke quality. In fact, even the definition of what constitutes smoke varies. Smoke isoften considered synonymous with soot, that is, the carbonaceous particulate formed as apart of the combustion process. However, in this study a more liberal definition of smokewill be used. That is, smoke will be defined in a broader sense to include both soot andany other combustion products that have the potential to become surface deposits, or tointeract with surface deposits, during a fire. This definition will also include theconsideration of chemical changes induced through interactions with enclosure surfacesduring the process of smoke transport, and though interactions with fire suppressionagents.
Under this fairly broad definition, smoke will be composed of a wide variety of chemicalspecies, and a definition of a smoke threat scenario must include some consideration ofthis chemical composition. To the extent possible, expected chemical species andinteractions will be discussed as documented in both experimental research andinformation based on actual fire experience. However, it is well beyond the scope of thisstudy to provide a full definition of the anticipated chemical composition of surfacedeposits.
A-4 NUREG/CR-6476

Instead, the definition of smoke threat will be addressed primarily through the source ofthe smoke, rather than through the smoke itself. That is, rather than defining the exactcomposition of the smoke, this study will define smoke by identifying (1) the type andmass of materials most likely to be the source of smoke, (2) how smoke might begenerated and transported to the site of the component, and (3) how long the smokeexposure is likely to last. These factors correspond to the quantity, quality, and durationof the smoke exposure as defined above. It is expected that by reproducing these factorsin testing, the chemical composition of the smoke generated will be representative of thatwhich would be encountered in an actual fire incident, even though the exact compositionof the smoke may remain poorly defined at the outset of testing. It is expected thattesting will include a variety of diagnostic measures to assess the actual nature of thesmoke generated and hence will greatly improve our overall understanding of smokegeneration and characteristics.
II. Equipment Threat Issues
A. Overview
Before considering those aspects of a fire that are important to the definition of crediblesmoke threat scenarios, it is useful to consider the mechanisms by which a device mightbe disabled by smoke. In particular, this project is interested in the impact of smoke onthe performance of advanced types of electronic components. Such devices are unique incomparison with older-style electromechanical devices that have typically been the focusof past fire vulnerability investigations [1,2,3]. The factors that make advanced circuitcomponents unique include the compact nature of the devices, the nature of the individualcomponents which comprise an overall device, and the nature and sensitivity of thedevice's operation.
Because the advanced electronic devices are unique in their construction and operation,unique modes of component failure are to be expected. The following sections identifythose mechanisms which are expected to represent important potential modes of failurefor integrated circuitry-based devices and systems.
B. Direct Corrosive Attack
One of the principal means by which smoke can threaten the operability of electronicequipment is through direct corrosive attack on the metallic surfaces of the components.In general, such attack has not been considered a short-term concern. That is, for theolder style electromechanical devices most commonly used in current reactorapplications, the relatively massive nature of the components implies that extensive levelsof corrosion would be required to compromise component functionality. The time framerequired for such extensive corrosion was considered inconsistent with the short time
NUREG/CR-6476 A-5

frames typically considered risk important (fire risk is generally dominated by short-termscenarios). Hence, direct corrosive attack has not been considered as a potentialcontributor to plant fire risk.
However, when advanced electronic circuits are considered, a potential does exist forshort-term corrosive attack to compromise circuit performance, and hence, to represent asignificant contributor to plant fire risk. For example, circuit miniaturization efforts areresulting in smaller circuit path traces being used in the fabrication of printed circuitboards. For these small circuit traces, even a relatively limited and short-term corrosiveattack, particularly if the attack is in the form of "pitting" corrosion rather than generalsurface corrosion, may result in the short-term loss of circuit functionality. Hence, foradvanced circuit board-based devices, direct corrosive attack is of potential concern.
In general, fire-induced corrosion has been attributed primarily to acidic combustionproducts (acid gases). In fact, the German DIN 57 472 Part 813 standard simply makes adirect measurement of acid gas content of material combustion products and assumes adirect correlation between acid gas content and corrosive potential [4]. In a similarfashion, the French CNET test will also provide corrosion assessments that are directlycorrelated to the acid gas content of the fire products (due to the high moisture content ofthe test cell and to the induced condensation of moisture directly onto the measurementtarget) [5].
For the purposes of this project, a somewhat broadened view of the corrosive attack issueis appropriate in order to support realistic assessment of threats to components. Forexample, experience in the telecommunications industry [6] has shown that interactionsof the acidic smoke from a cable fire with the galvanized surfaces of common air-handling ductwork can introduce galvanic salts into the smoke stream. These galvanicsalts readily deposit onto component surfaces, resulting in direct and aggressive corrosiveattack.
Another important consideration is the potential that fire suppressants might acceleratethe rate of corrosion through synergistic interactions with the smoke deposits. One suchsynergistic effect is clearly anticipated in the case of water-based suppressants. Acidgases are generally very hygroscopic. Moisture condensation onto a component surfacewill act to "scavenge" acid gases from the airborne smoke onto the components, and willpromote the formation of acid on the components. As a second example, consider thatmany nuclear plants utilize carbon dioxide fire suppression systems in either a room-flooding or manual distribution mode. The presence of high concentrations of carbondioxide in combination with moisture can lead to the formation of carbonic acid deposits,and carbonic acid can be an aggressive corrosion agent. This is hypothetical only, thereis no known experience.
Interaction of a fire with Halon may also be of concern because Halon has a relativelyhigh bromine content. Thermal breakdown of the Halon will result in the generation ofacidic HBr. However, it should also be noted that the importance of Halon as a firesuppressant agent is decreasing rapidly due to concerns that fluorocarbons are attacking
A-6 NUREG/CR-6476

the Earth's ozone layer. Halon is one of the products targeted for removal from use as aresult of the international Montreal Accords on the use of fluorocarbons. Hence, it is notrecommended that extensive investigations of Halon interactions be undertaken at thistime.
C. Circuit Bridging Faults
The deposition of smoke onto a component carries a potential for the creation ofelectrically conductive short circuit or circuit bridging paths [1]. Such paths may beformed at any point on a component, but would be of particular concern where smallerphysical separation distances are present. For advanced electronic circuits, smallseparations will be quite common. In particular, closely packed circuit traces on thesurface of a printed circuit card would be vulnerable to bridging unless protectivecoatings are applied to these traces. Also, the "pin outs" or connection pins associatedwith various integrated circuitry devices (chips, transistors, resistors, capacitors, selectorswitches, etc.) are typically quite close together and hence will also be vulnerable tocircuit bridging failures.
It is likely that scenarios involving water used as a fire suppressant will be the mostaggressive environment for circuit bridging faults. As discussed above, the formation ofa condensation droplet on a printed circuit card will likely act as an agglomeration pointfor soot particulates and acid gases. Such a droplet could easily bridge several exposedcontact points on closely packed printed circuit boards such as those typically used in theconstruction of advanced electronics. Such failures have been noted in prior experimentalstudies [1].
Attack by "dry" smoke in the absence of water sprays is less likely to result in circuitbridging failures. However, as discussed further below, test experience with cable fires inparticular has revealed that even in the absence of water sprays, cable fire smoke can beheavily laden with tar-like substances which may also act as circuit bridging agents [1].
Another mechanism for circuit bridging faults derives from the observation that smokeinteractions with galvanized air handling ducts can result in the formation of galvanicsalts. The deposition of these salts onto a printed circuit card may also induce circuitbridging failures. Such deposits have been observed in recently documentedtelecommunications industry fire events [6]. It is currently unclear whether such depositsresulted in circuit bridging faults during these events.
D. Contact Fouling
Another potential mechanism for electronic component failure due to smoke depositionwould be contact fouling. That is, the deposition of smoke particulates onto open contactpairs may result in degraded contact resistance or contact fouling. Such a failuremechanism is, perhaps, of relatively minor concern for integrated circuitry devices
NUREG/CR-6476 A-7

because of the more typical use of solid-state switching devices. However, the potentialfor contact fouling should be considered should a device include open, unprotectedcontact pairs in its design.
E. Degradation of Fine Movement
In past testing [1], it has been observed that the deposition of smoke onto a device canresult in the degradation of fine mechanical movements. In particular, one mode offailure identified for a strip chart recorder exposed to the smoke from a cable fire was thefouling of the mechanical indicator pen, preventing proper operation.
In the case of advanced circuitry components, this mechanism is likely to be of relativelyminor concern. In general, such components would be expected to be less dependent onfine mechanical movements, but rather, would be primarily dependent on the operation ofsolid state devices. However, in certain cases vulnerabilities might exist. In particular,output or indicator devices associated with such systems may incorporate such finemechanical movements in their operation. Degradation of these outputs may constitutefailure of the system.
F. Interactions at Elevated Temperatures
In general, the older-style electromechanical devices that have been used in currentreactor designs have relatively high thermal damage limits. In comparison, advancedelectronic circuits are much more sensitive to elevated temperatures, and may experiencea loss of function at relatively modest temperatures. Many of the fire scenarios likely tobe considered important with regard to smoke damage will involve relatively modestelevated temperatures.
In particular, note that during a fire event a loss of the normal enclosure HVAC air flowis likely. That is, most ventilation supply and exhaust systems will be designed to shutdown during a fire event to contain the spread of smoke and fire beyond the room oforigin. Such control may be exercised either through mechanical dampers actuated by afusible link, or through the ventilation control system based on actuation of smokedetectors either in the room of fire origin or in the ventilation duct work. Hence, a loss ofenclosure ventilation is a likely occurrence in the event of a fire, and manual recovery ofthe system may take a significant period of time. This will likely lead to an increase inthe general room temperature for even a relatively small fire.
Given the likelihood that room temperatures will be increased for even a small fire, it isimportant to consider the potential for interactions involving a combination of smokeexposure and modest temperature increases. In particular, exposure to modesttemperature increases may place advanced electronic devices in a generally more fragileoperational state and hence may make the components more susceptible to other forms ofdegradation, including smoke-induced damage in a synergistic manner.
A-8 NUREG/CR-6476
III. Characterization of Smoke Quantity
A. Introduction
The first step in the process of defining credible smoke threat scenarios for advancedelectronic equipment is to define the quantity of smoke to which a component is likely tobe exposed. In this context, quantity refers to the amount of smoke per unit volume onewould expect a component to become immersed in. This will vary depending on the typeof fire scenario one is attempting to represent. Hence, the definition of the "quantity" ofthe smoke exposure considered appropriate will be approached by first defining thosegeneral fire threat scenarios that might lead to such exposures. Based on the types of firethreat scenarios that are considered relevant, many other aspects of the expected firethreat can be defined. In particular, this would include factors such as the types ofmaterials burned, the amount of material burned, mode of combustion, suppressioninteractions, and likely transport interactions. There are many additional factors whichcould also be included in this list (e.g. configuration of combustible material and airsupply.) However these are considered the most significant.
There are any number of possible fire scenarios that might be considered threats tonuclear power plant operations. However, in the context of the current study, only alimited subset of these scenarios is likely to be of significant concern. In particular, thisstudy is concerned with the potential exposure of advanced electronic components tosmoke. Hence, only those areas which will house such equipment, or which might leadto a smoke exposure for that equipment (e.g., adjacent rooms), will be of interest. Thisnarrows the range of relevant fire scenarios which must be considered.
There are four general fire scenarios that could result in the exposure of plant equipmentto smoke. Each of these four scenarios would lead to a somewhat different smoke threat.These general fire scenarios are described in the following sections. These descriptionsinclude a discussion of the likely progress of each fire event, and other important fireparameters.
Also presented is a discussion of the total amount of material likely to be burned in eachscenario. This value is then coupled to an assessment of the volume of air into which thecombustion products are likely to be distributed. Hence, the final assessment of smoke"quantity" is given as a mass of combustible materials burned per unit volume of affectedair.
NUREG/CR-6476 A-9

B. Small In-Cabinet Electrical Control Panel Fire
1. General Scenario Description
This scenario would involve a very limited fire which remains confined to a small subsetof an overall electrical control panel. In this case, it is postulated that the fire would havevirtually no impact on the environment within the overall fire area, but that modest heatinput and significant amounts of smoke might be generated and contained within theelectrical control panel itself. Thus, those components housed within the same electricalcontrol panel but not involved directly in the burning process would be exposed to acombined mild-to-moderate thermal exposure and smoke deposition environment.
The most likely source of such a fire would be a self-ignited electrical fire initiated by thefailure of a component within the cabinet. Hence, the fuels which might burn would bethose associated with the construction of electrical components, and potentially, a limitedquantity of instrumentation and control wiring. For fires of this type, the early stages arelikely to be characterized by overheating of a component which might experience anextended period of smoldering combustion. This might be followed by a brief period ofopen flaming. The fire might be extinguished naturally (self-extinguishing) or through afire suppression agent.
In most cases, fires of this type would be expected to be short lived. That is, if the fireremains confined to a small subset of the available fuel, then that fuel will be quicklyexhausted, and even barring suppressant intervention, self-extinguishment would beexpected in a short time. (By definition, a cabinet fire that grows to involve a significantfraction of the available in-cabinet fuel load would be classified as a large cabinet fire.This scenario is presented in Section 3.3 below.)
It is somewhat difficult to establish bounds on fuel involvement associated with a "small"fire. During the SNL cabinet fire test program [7,8], preliminary testing to assess theimpact of various cabinet and fuel loading parameters on fire development often notedthat on the order of 5-15% of the available fuel would be consumed during fire tests forwhich very limited fire growth was observed. For tests in which more extensive fuelinvolvement was noted, it was also noted that continued fire growth would occur andeventually virtually all of the available fuel would be consumed. That is, a threshold typeof behavior was noted.
Based on actual in-plant experience, much smaller fires than those observed in the SNLtest program have been experienced [12]. In some cases, self-extinguishing fires havebeen observed that involved only a single electrical component (e.g., a relay or singleprinted circuit card). While no actual value of the quantity of fuel burned in these eventswas given, a lower limit on fuel involvement will be established as 1% of the availablecabinet fuel load. Hence, these values of 1-15% will be used as upper and lower boundson fuel involvement for the small cabinet fire scenario.
A-10 NUREG/CR-6476

Also note that in most of the limited-involvement SNL tests, the fire would typicallycontinue for no more than 15 minutes before self-extinguishing. If an initial period ofsmoldering combustion were included, then a maximum time interval on the order of 30minutes during which actual combustion takes place might be expected.
If a fire suppression agent is involved, it may be applied though a fixed general areasystem, a fixed local system, or through manual intervention. If manual suppressionmethods are employed, the most likely approach would be application of a hand-heldextinguisher. Since this scenario involves an electrical equipment fire, the most likelysuppression agent would be CO2 or dry chemical. Water might also be used to suppresssuch a fire, but only if the particular area were protected by a fixed fire suppressionsystem triggered by either area or in-cabinet smoke detectors. Note that both water anddry chemicals would be less likely agents given current plant practice. (Even a cross-zoned detection system would be likely to actuate in this situation.) In this case, thecomponents might also experience an increase in humidity to essentially saturationconditions, but would not likely be subject to direct sprays.
Plant areas subject to this type of fire would be any area that houses electrical controlpanels. Of particular interest to the current study, this would include the main controlroom and the remote shutdown areas. Also of potential interest might be areasimmediately surrounding the containment structure in which one might find electronicmultiplexing equipment.
2. Quantity of Combustible Materials Involved
In this scenario, the fire is postulated to remain confined to a small subset of a singleelectrical control panel. Hence, the quantity of material burned will be relatively small.However, the smoke is also assumed to remain largely confined to the fire cabinet itself,and hence, the volume of air into which the combustion products are distributed issimilarly small.
In general, there are three types of control panels used in the nuclear industry. These arevertical, benchboard, and console type cabinets [7]. A wide variety of cabinet sizes areused, depending on the particular application. In general, a typical single electricalcontrol panel may have a volume ranging from about 30 to 300 cubic feet. Much largercabinets may also be encountered, although beyond this limit, it is relatively common toemploy some form of internal partitioning. Cabinets may also have either open back orclosed back designs. For the purposes of this scenario, it will be assumed that the cabinethas a closed back. In this case, the cabinet will typically be equipped with open air flowlouvers which allow for the natural ventilation of the cabinet.
The fuel loadings contained within a control panel may also vary widely [7]. Somecabinets, such as switchgear, motor control center, and breaker cabinets, will haveminimal combustible fuel loads. However, those panels associated with instrumentation
NUREG/CR-6476 A-11

and control will typically have much higher fuel loads due to the concentration of controland instrumentation wires and components within the cabinet.
In the SNL cabinet fire test program [7,8], fuel loads were calculated on the basis of theheat content of the available fuel per unit of floor area in the cabinet (MJ/m2 or Btu/ft2).The fuel loadings that were tested were based on an extensive review of industrypractices. The maximum fuel loads for control panels were determined to be 258 MJ/m2
(22,700 Btu/ft2) with a typical load determined to be 170 MJ/m2 (15,000 Btu/ft2).
For the purposes of this program, it is of greater interest to express these values in termsof the fuel mass per unit volume of enclosed cabinet space. These values can be "re-normalized" by assuming two values. First, the "typical" heat of combustion for a cableinsulation material used in the SNL study was 30 kJ/g. Second, a typical cabinet wasidentified in that same study as having a height of approximately 2.3 m (7.5'). Usingthese values, one can calculate that the maximum fuel load in a control panel would beapproximately 3.7 kg/m3 (0.23 lb/ft3) and a typical fuel load would be approximately2.5 kg/m3 (0.15 lb/ft3).
As discussed above, in the scenario involving a limited in-cabinet fire, it is assumed thatfrom 1 to 15% of this fuel will be consumed in the fire. Using these values the range offuel burned per unit volume of affected air space (in this case, the cabinet air volume) canbe determined. For a cabinet with the maximum fuel load, values ranging from 0.038 to0.56 kg/m3 (0.0024-0.035 lb/ft3) are obtained. For the typical fuel load, values rangingfrom 0.026-0.38 kg/m3 (0.0016-0.023 lbs/ft3) are obtained. Hence, the range of fuelloadings recommended for testing to simulate this scenario is from 0.026 to 0.56 kg/m3
(0.0016-0.035 lb/ft3).
Note that in calculating these values the effects of natural circulation through the cabinethave been ignored. Such circulation would be expected to dilute the smoke to someextent, although the rate of dilution is unknown. The values obtained assuming that nodilution takes place would represent a conservative upper bound value.
C. Large Electrical Control Panel Fire
1. General Scenario Description
In the second scenario of interest, it is postulated that a large fire occurs within anelectrical control panel, but that the fire remains confined to that one panel. This firewould be the type experienced in certain of the fire tests performed by SNL as a part ofan experimental investigation of electrical control panel fires [7,8]. This type of scenariohas been postulated as representing the most severe fire that might be experienced in themain control room, for example [9]. Such fires might also be experienced in other plantareas as well [12].
A-12 NUREG/CR-6476

In this scenario, it is postulated that a fire has been ignited through either a small transientfuel source or through an electrical fault. However, in contrast to the small cabinet firescenario, it is postulated that the fire grows beyond the initial ignition source, andeventually consumes all of the combustible materials within the cabinet in the fire. In theSNL tests, growth times from the onset of open flaming to peak fire intensity ofapproximately 10 to 15 minutes were experienced for fires of this type. Total fire durationof from 15 to 30 minutes were recorded before all of the available fuel was consumed.(No fire suppression attempts were employed in these tests.)
In this scenario, the most important aspect of the smoke exposure question will beassociated with the equipment located in the balance of the fire area, rather than thathoused within the burning cabinet itself. That is because it is postulated that a relativelylarge fire has occurred, it would also be postulated that all of the equipment within thefire source cabinet would be destroyed by direct thermal exposure. Hence, the smokeexposure question would be associated with the balance of the equipment within theaffected fire area. This equipment might experience only a modest increase intemperature, but may experience significant and extended smoke exposures [9,10],
In this scenario, the most important aspects of the fire will be those associated withgrowth of the fire and fully developed fire stages. Ignition may involve initial smolderingfollowed by open flaming, but in terms of the overall fire area exposure, the smokegenerated during this stage will be relatively unimportant. Once open flaming begins andthe fire begins to grow, however, the enclosure environment will rapidly deteriorate, anda dense layer of smoke is likely to form in the room as a whole. In testing, it wasobserved that the smoke layer descended to the floor of the test enclosure withinapproximately 6-12 minutes of ignition [10].
Once the fire becomes fully developed, it is also likely that a period of oxygen-limitedcombustion may be experienced. This would generally result from local ventilationeffects associated with the burning cabinet itself, rather than global oxygen depletionwithin the overall fire area. This effect may be particularly pronounced for cabinetswhich have closed doors so that only limited natural ventilation opening are available.Hence, in the fully developed stages of the fire, a relatively inefficient combustionprocess may be experienced, resulting in the generation of significant amounts of sootand other unburned pyrolysates.
The methods likely to be employed in the suppression of such a fire would depend on thearea in which such a fire occurred. For example, if the fire occurs within the main controlroom, then manual suppression by operators using hand-held extinguishers or by the firebrigade is the most likely response. Fixed fire suppression systems are very rarelyinstalled in the main control room. For other plant areas, either manual response or fixedfire suppression system response may occur. Hence, these fires would be subject to thefull range of potential suppression agents (see further discussion of suppressantinteractions in Section 4 below).
NUREG/CR-6476 A-13
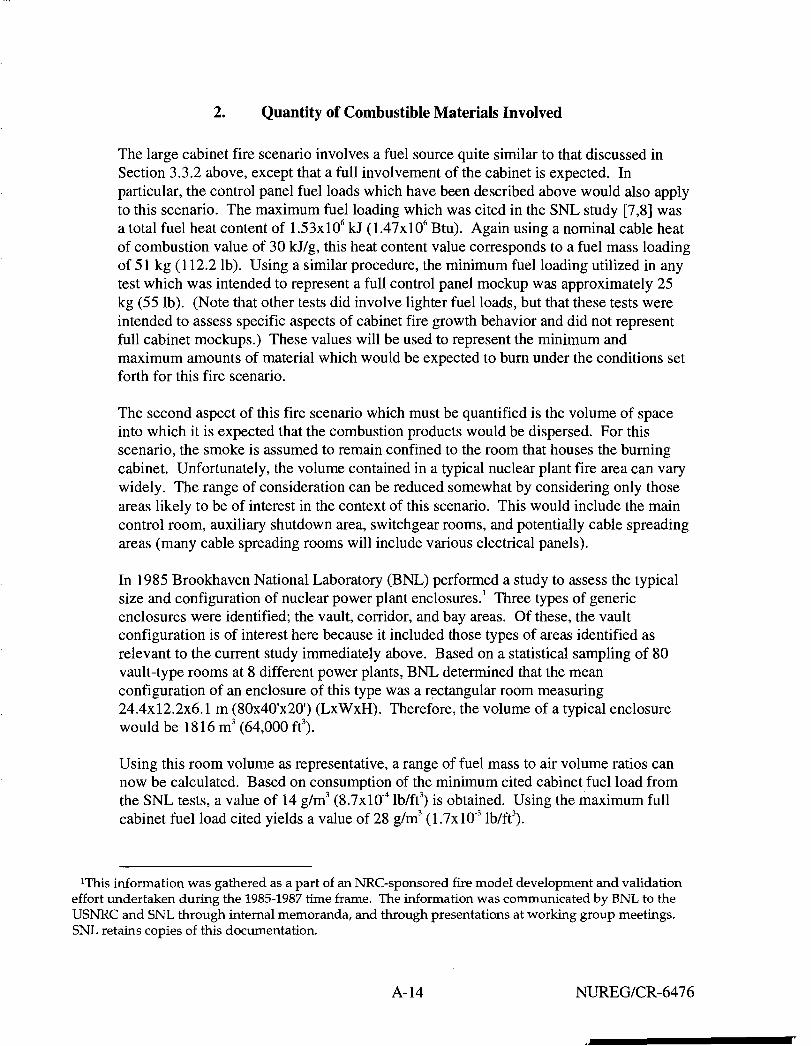
2. Quantity of Combustible Materials Involved
The large cabinet fire scenario involves a fuel source quite similar to that discussed inSection 3.3.2 above, except that a full involvement of the cabinet is expected. Inparticular, the control panel fuel loads which have been described above would also applyto this scenario. The maximum fuel loading which was cited in the SNL study [7,8] wasa total fuel heat content of 1.53xlO6 kJ (1.47xlO6 Btu). Again using a nominal cable heatof combustion value of 30 kJ/g, this heat content value corresponds to a fuel mass loadingof 51 kg (112.2 lb). Using a similar procedure, the minimum fuel loading utilized in anytest which was intended to represent a full control panel mockup was approximately 25kg (55 lb). (Note that other tests did involve lighter fuel loads, but that these tests wereintended to assess specific aspects of cabinet fire growth behavior and did not representfull cabinet mockups.) These values will be used to represent the minimum andmaximum amounts of material which would be expected to burn under the conditions setforth for this fire scenario.
The second aspect of this fire scenario which must be quantified is the volume of spaceinto which it is expected that the combustion products would be dispersed. For thisscenario, the smoke is assumed to remain confined to the room that houses the burningcabinet. Unfortunately, the volume contained in a typical nuclear plant fire area can varywidely. The range of consideration can be reduced somewhat by considering only thoseareas likely to be of interest in the context of this scenario. This would include the maincontrol room, auxiliary shutdown area, switchgear rooms, and potentially cable spreadingareas (many cable spreading rooms will include various electrical panels).
In 1985 Brookhaven National Laboratory (BNL) performed a study to assess the typicalsize and configuration of nuclear power plant enclosures.1 Three types of genericenclosures were identified; the vault, corridor, and bay areas. Of these, the vaultconfiguration is of interest here because it included those types of areas identified asrelevant to the current study immediately above. Based on a statistical sampling of 80vault-type rooms at 8 different power plants, BNL determined that the meanconfiguration of an enclosure of this type was a rectangular room measuring24.4x12.2x6.1 m (80x40'x20') (LxWxH). Therefore, the volume of a typical enclosurewould be 1816 m3 (64,000 ft3).
Using this room volume as representative, a range of fuel mass to air volume ratios cannow be calculated. Based on consumption of the minimum cited cabinet fuel load fromthe SNL tests, a value of 14 g/m3 (8.7xlO4 lb/ft3) is obtained. Using the maximum fullcabinet fuel load cited yields a value of 28 g/m3 (1.7xlO3 lb/ft3).
xThis information was gathered as a part of an NRC-sponsored fire model development and validationeffort undertaken during the 1985-1987 time frame. The information was communicated by BNL to theUSNRC and SNL through internal memoranda, and through presentations at working group meetings.SNL retains copies of this documentation.
A-14 NUREG/CR-6476

Note that in developing these fuel mass to air volume ratios, it has been assumed that theventilation system will not dilute the smoke exposure. This assumption is appropriate forgeneral plant areas where the normal ventilation system would typically be shut downautomatically upon fire detection. However, this assumption would not reflect theconditions that would prevail in the main control room where the ventilation systemwould likely be placed in a full exhaust, emergency smoke purge mode of operation. Inthis case it would be appropriate to assume that some dilution of the smoke would occur.A typical control room ventilation system will provide a smoke purge mode ventilationrate of approximately 10 room air changes per hour [11]. Hence, for a 15-30 minute firescenario, it would be appropriate to assume that the smoke would be diluted by a factor ofapproximately 2.5-5. Incorporating these values into the above estimates of fuel mass toair volume ratio yields control room scenario values of from 2.8 g/m3 (1.7xlO'4 lb/ft3) to11.2kg/m3(7.0xl0-4lb/ft3).
D. General Fire Area Scenarios
1. General Scenario Description
In addition to the large electrical control panel fires, one might also expect that significantroom-wide smoke exposures could also occur as a result of a more generalized fire withina fire area. In this case, the most likely materials to be involved would be electricalcables (see further discussion of likely fuel sources presented below). Fires may alsoinvolve an initial transient fuel or electrical panel fire which then spreads to nearbyelectrical cables.
The parameters of a fire of this type would be quite similar to those discussed above for alarge electrical panel fire. Differences might include somewhat larger and longer lastingfires, and higher enclosure temperatures. Thus, a more severe smoke exposureenvironment might be experienced. As with the large electrical panel fires, the full rangeof fire suppression systems utilized by the industry may come into play in such a fire. Inparticular, the use of water for a more generalized fire would be much more likely than inthe case of the large electrical panel fire.
Most any fire area in the plant would be subject to fires of this type [12]. The oneexception would be the main control room. That is, the main control room is unique inseveral ways which will significantly reduce the likelihood of a large generalized area fireoccurring. First, the main control room is continuously manned, and hence, very rapidfire detection and intervention times are expected. This will also imply that a transientfuel source will be very effectively controlled and limited. Second, high-energy electricalequipment is not typically housed in the control room, and hence, the number of potentialhigh energy fire sources is very limited. Based on these factors, the occurrence of a large,generalized fire in the main control is not considered likely, and hence, this scenariowould not generally be considered applicable to the main control room.
NUREG/CR-6476 A-15

2. Quantity of Combustible Materials Involved
In this case, the quantity of combustible materials involved would include both thetransient combustibles if such fuels are involved, and the in situ fuels. A wide range offuel involvement levels is possible. Recall that this scenario is associated with generalarea fires which are of sufficient size to present a smoke exposure threat to the entire firearea. The objective here, then, is to establish reasonable upper and lower bounds onsignificant general area fire fuel consumption values. Hence, very small fires will not beconsidered because they are unlikely to produce sufficient quantities of smoke torepresent a threat to an entire fire area.
As a rough estimate, the minimum fuel involvement for a significant general area fire willbe assumed to correspond to the minimum fuel loads cited above for the full-simulationcabinet fire tests. Recall that the minimum full-simulation cabinet fuel load evaluated inthe SNL cabinet fire test program was 25 kg (55 lb). Note that the peak heat release ratemeasured by SNL for this particular test was approximately 840 W [8]. However, in thecabinet fire test program, a significant fire intensity enhancement occurred due to thecontainment of some of the fires' heat output within the cabinet and radiative feedbackfrom the heated cabinet surfaces [7,8]. In an open fire configuration, the same fuelconfiguration would not benefit from the enhanced feedback, and might be expected toyield a peak heat release rate on the order of 500-600 kW, a reasonable lower boundintensity for significant fires.
For the upper bound, it would be appropriate to consider a fire that might involve a stackof cable trays, perhaps in addition to a electrical panel fire as an initiation source. Hence,as an upper bound, one might consider a fire involving the maximum full-simulationcabinet fire loads cited above, in addition to supplemental fuel from overhead cable trays.The amount of overhead cable fuel that might become involved in such a fire could,again, vary widely depending on the plant-specific conditions which prevail. As a roughestimate, it will be assumed that an additional cable tray fuel load equal to that availablein the cabinet might become involved. Hence, the upper bound fuel consumption will beset at twice that cited above for the most heavily loaded of the full-simulation cabinet firetests. This would correspond to 102 kg (224 lb) of fuel.
In the assessment of the typical enclosure volume into which the fire products might bedistributed, the same arguments presented above would also directly apply to thisscenario. Hence, a typical enclosure of the type of interest here will be assumed to have atotal volume of 1816 m3 (64,000 ft3). Based on these values, the lower bound on fuelmass to air volume ratio for the significant general area fire scenario would be the sameas the lower bound cited above for the large cabinet fire in the absence of ventilationdilution effects, 14 g/m3 (8.7xlO4 lb/ft3). The upper bound value would correspond to 56g/m3 (3.4xl03 lb/ft3).
Note that these values include no consideration of ventilation system diluting effects. Inthis case, the scenario is not considered applicable to the control room, and hence,
A-16 NUREG/CR-6476

ventilation shutdown would be expected. No additional dilution due to ventilation effectswould be recommended for this scenario.
E. Smoke Spread from an Adjacent Fire Area
The final fire threat scenario of potential interest would involve the spread of smoke fromone fire area into an adjacent fire area. The most likely paths for such spread would betransport through ventilation ductwork (should the fire dampers not close), or transportthrough doorways that might be opened for manual fire fighting and post-fire recoveryaccess.
In this fire scenario, the fire source could be either the large cabinet fire or the generalarea fire as discussed above. However, in this case the smoke exposure would involve alower density of smoke, and a reduced thermal threat. Fire suppressant interaction wouldalso be less important because the adjacent area components would not be subject todirect application of fire suppressants unless a spurious actuation of a fixed firesuppression system in the adjacent area were to occur. Components might be subjectedto very high levels of humidity, however, if water is used to fight the fire in the adjacentspace.
For this scenario, a significant dilution effect would be expected. That is, as the smokespreads from the room of fire origin, it would mix with the fresh air in the adjacent space.Under conditions in which both rooms became equally involved in the spread of smoke, adoubling of the affected air volume would occur (assuming the rooms are essentially thesame size). Hence, dilution of the general enclosure fuel mass to affected air volumeratios cited above by a factor of 2 would be appropriate. This would yield values rangingfrom 7 g/m3 (4.3x10⁴ lb/ft3) to 28 g/m3 (1.7xlO3 lb/ft3).
F. Summary of Scenario Fuel Mass to Air Volume Ratios
For each of the fire scenarios identified, a range of values on the anticipated fuel massconsumed to affected air volume ratio has been provided. Table 1 summarizes theseresults.
Note that by far the most severe ratios are associated with the localized effects within anelectrical control panel due to a small electrical fire occurring within that cabinet (thesmall cabinet fire scenario). This results primarily from the fact that a very small volumeof space (that within the cabinet only) is assumed to be involved in the distribution ofsmoke. Hence, relatively large fuel mass to affected air volume ratios are predicted,despite the fact that as little as 5% of the cabinet fuel load is assumed to burn.
In contrast, the least severe exposures are those associated with a large cabinet fireoccurring within the main control room. In this scenario, it is postulated that the smokegenerated by the burning of a single control panel is distributed throughout the full room
NUREG/CR-6476 A-17

Table 1. Summary of recommended fire scenario fuel mass to affected air volume ratios.
Scenario (affected area)
Small Cabinet Fire (in-cabinet effects)
Large Cabinet Fire(room effects)
Control Room
General Areas
General Area Fire (room effects)
Adjacent Area Fire (room effects)
Fuel mass to affect air volume ratio
Lower Bound
26 g/m3
1.6xlO"3lb/ft3
2.8 g/m3
1.7xlO"4lb/ft3
14 g/m3
8.7xlO"4 lb/ft3
14 g/m3
8.7x 10⁴ lb/ft3
7 g/m3
4.3xlO"4 lb/ft3
Upper Bound
560 g/m3
3.5xlO"2 lb/ft3
11.2 g/m3
7xlO4 lb/ft3
28 g/m3
1.7xlO"3 lb/ft3
56 g/mJ
3.4xlO"3 lb/ft3
28 g/m3
1.7xlO"3 lb/ft3
air volume and that the ventilation system would continue to operate in an emergencysmoke purging mode. The high rates of air exchange associated with this mode of controlroom ventilation system operation would significantly dilute the smoke exposure, eventhough a smoke layer would still be expected to form.
The difference between the lower and upper bounds for all of the cases cited represents afactor of 200. That is, the overall lower bound cited is 2.8 g/m3 (1.7xlO4 lb/ft3) and theoverall upper bound cited is 560 g/m3 (3.5x10² lb/ft3). This wide range of values reflectsthe wide variability in the types of fire scenarios which might be encountered, and isconsidered representative of actual plant conditions. As a result, it is recommended that avery wide range of fuel mass to test enclosure air volumes be evaluated to ensure that thiswide range of anticipated behavior is assessed.
IV. Identification and Characterization of Critical SmokeQuality Parameters
A. Overview
The issue of smoke quality is the issue of the chemical composition of the smoke,including the changes in composition that might take place during the processes ofgeneration, transport, and deposition. As discussed above, the definition of smokequality will be significantly affected by the general lack of knowledge regarding thechemical nature of smoke. Hence, in this study, smoke quality will be addressed throughthe definition of the source of the smoke and through identification of potential transportand suppressant interactions that might alter the nature of the smoke exposure.
A-18 NUREG/CR-6476

Consistent with this approach, those parameters which are considered critical to theproper characterization of smoke quality are identified in the following subsections. Inparticular, the following parameters are discussed in detail below:
the type of material burned,the mode of combustion experienced,suppressant interactions, andtransport interactions.
B. Type of Materials Burned
Perhaps the most critical parameter in the determination of smoke quality will be thenature of the material(s) which is(are) actually burned. A variety of combustiblematerials are likely to be encountered in a nuclear power plant fire. The smoke generatedby different materials will be inherently different. That is, while virtually all thematerials of interest will produce some quantity of carbonaceous soot, the balance of thesmoke chemical composition will vary widely. The range of potential chemicalcombustion products will depend on the chemical composition of the burning material(s).In general, the combustible materials of interest in a nuclear power plant can be dividedinto four fuel categories; namely, combustible gases, liquid fuels, solid transient fuels,and solid in situ fuels.
1. Combustible Gases
Combustible gases are often present in a power plant. The most common would behydrogen which is present as both a component coolant (particularly as a turbine-bearingcoolant), and as a by-product of the reactor operation (through dissociation of water).Many fire events have involved combustible gases, and particularly hydrogen fires andexplosions [12].
However, in terms of the generation of smoke and the threat to plant equipmentrepresented by that smoke, the importance of combustible gases is minimal because thesefuels tend to be very clean burning and introduce no exotic chemical species into thecombustion products. Hence, while such fires may generate significant quantities ofsmoke, the smoke generated by the combustible gases themselves will generally becomposed of relatively "clean" carbonaceous soot. Such soot will not likely result in asignificant threat to electronic equipment because of the minimal potential for corrosiveattack or creation of electrical short circuit paths. Some difficulties with contact pairfouling and restriction of fine mechanical movement can be anticipated, but as discussedabove, these degradation modes are not considered critical for advanced electroniccomponents.
The importance of combustible gases as a fuel is much more significant if they are asource of fire exposure for the other in situ fuels that might become involved in such afire. Even issues of fire suppressant interactions are of secondary concern because
NUREG/CR-6476 A-19

virtually all of the fires that have involved combustible gases have been controlled bysimply isolating the source of the gas [12]. The remaining concerns would center on anyother local fuel source, as discussed below, which had become ignited during the initialgas fire. The smoke threat to electrical equipment represented by the direct combustionof gaseous fuels is not considered significant and will not be discussed further.
2. Liquid Fuels
Liquid fuels would include such items as lubricating and cooling oils, cleaning solvents,and diesel fuel. These items are commonly used in pumps, hydraulic-operatedequipment, diesel-driven motors, and other equipment requiring lubrication. Firesinvolving such fuels are relatively common for plant areas housing such equipment(generally due to leakage problems) [12]. These types of materials are generallycomposed of relatively simple chemical species, primarily hydrocarbons. Hence, thesmoke generated by fires involving such fuels will be composed largely of carbonaceoussoot. The only other significant chemical species that might be evolved would beassociated with any additives included in the material's formation. Such additives arerelatively uncommon for most fuels of interest and hence invasive chemical compoundsare not likely to be produced during their burning. Based on these observations,conclusions similar to those cited above for gaseous fuel sources would apply to liquidfuels as well, and no further consideration will be given to such fuel sources.
3. Transient FuelsSolid transient fuels would include general trash, paper waste, wood, plastics, cloth, etc.These fuels can generally be found in small quantities in most plant areas at any giventime. However, plant fire protection procedures typically will include administrativecontrols that actively limit the extent to which such items are allowed to accumulatewithin critical plant areas. While the smoke from transient fuel fires may contain avariety of chemical species (depending on the exact materials present at the time of thefire), fires involving such fuels will generally be limited in both extent and duration. Dueto the limited availability of such fuels, a fire that remains limited to transient fuels isunlikely to produce sufficient quantities of smoke to result in short-term equipmentdamage problems. Because of these factors, conclusions similar to those cited above forgaseous fuels would also apply to transient fuels. In this case, the transient fuels wouldbe considered of secondary importance, and would be of interest primarily for the extentto which they represent a potential fire exposure source for the other in situ fuel items.
4. In situ Solids
The final, and by far most important, category of fuels is the in situ solid fuel elements.Of these materials, the majority will be in the form of cable insulation and jacketingmaterials. Several factors combine to support a conclusion that cable insulation andjacketing materials will represent far and away the most important materials to beconsidered in assessing a smoke threat to electrical equipment. Of secondary interest will
A-20 NUREG/CR-6476

be the materials used in the construction of the other types of electrical components(including phenolics and other types of hardened plastics).
A variety of cable insulation materials are commonly employed in the nuclear industry.Each of these materials is likely to introduce unique constituents when burned. Hence, itis expected that testing might be expected to involve both individual materials assessedon a relative basis, and the use of combinations of materials to assess potential synergisticeffects. Cable insulations popularly applied in the nuclear industry include materialsbased on the following compounds [13,14]:
Cross-linked polyolefin (XLPO) (including the morespecific class of cross-linked polyethylene (XLPE))Polyvinyl chloride (PVC)Ethylene-propylene rubber (EPR)Chlorosulfonated polyethylene (CSPE or Hypalon)TeflonSilicone and silicone/rubber compounds
Virtually any significant fire scenario in a nuclear power plant will involve cableinsulation materials to some extent. In particular, those fire scenarios expected to resultin the exposure of advanced electronic components are likely to involve the burning ofcables. This would include control room and remote shutdown area fires, and firesassociated with electrical penetration areas of the containment structure where signalprocessing and multiplexing systems are likely to be located [15]. Hence, cableinsulation and jacketing materials are considered the single most important class of fuelto be considered in this program. Most of the other materials used in plant constructionare noncombustible.
The importance of cables as a threat to electronic equipment also derives from the natureof the smoke produced in a cable fire. Today cable insulation and jacketing materials aregenerally composed of either rubber-based, silicone-based, or polymer-based materials.Typical production processes for multiconductor cables will also include some type ofphysical binding material such as nylon or cellulose strands or a cellophane-typeoverwrap. In the formulation of cable insulations, a wide range of chemical species areadded for use as plasticizers, aging performance enhancers, and fire retardants. Firesinvolving cable insulations are particularly "dirty" in comparison with fires involvingother types of fuels because these various chemical species are also liberated during thefire. Of particular concern, a variety of acid gas species are likely to be produced duringany such fire due to the wide use of halogen additives [chlorine (Cl), fluorine (F),bromine (Br), iodine (I), etc.] as fire retardant agents. The extent of chemical productionis dependent on the specific chemical composition of a particular cable.
For example, polyvinyl chloride (PVC) materials are composed of as much as 40% byweight chloride. This chloride is released during a fire, and much of it eventuallybecomes bound to the soot particulates in the form of soluble chloride ions [1]. Uponcontact with water, a hydrochloric acid (HC1) solution is readily produced. While PVC is
NUREG/CR-6476 A-21

no longer popularly used as a cable insulation for new applications, it is commonlypresent in most areas of nuclear power plants constructed prior to 1980. (PVC fell out offavor in the U.S. nuclear industry as a result of the 1975 Brown's Ferry fire and theensuing regulatory actions.)
For other cable insulation types, other chemical species will be of predominant concern.It is expected that these acidic combustion products will play a key role in the problem ofsmoke damage to advanced types of electrical equipment. This role will likely involveboth direct corrosive attack on the components and the formation of electrical currentleakage or shorting paths as discussed above.
The presence of these varied chemical species can also lead to interactions of the smokewith other materials in the plant. For example, experience in the telecommunicationsindustry [6] indicates that the interaction between acidic smoke from a cable fire andgalvanized ventilation ducts can result in the formation of galvanic salts, which can inturn be deposited on electrical equipment. This has been identified as the source ofsignificant nonthermal fire damage in this industry. (This issue is discussed furtherbelow as associated with transport issues.)
Further, fires involving cable insulation materials are typically low-efficiency fires. Thatis, due to the nature and the arrangement of fuel, the fires produced are inefficient inconverting fuel to heat. This means that the combustion process results in the release ofmany intermediate combustion products (see further discussion of burning mode effectsbelow). These products are often composed of relatively massive molecules thatagglomerate easily, accelerating the process of surface deposition. Hence, theaccumulation of tar-like deposits has been noted in cable fire tests [13].
The final class of in situ solid fuel which is also of potential interest would be thosematerials used in the construction of other types of electrical equipment. In particular,those materials used in the construction of such items as printed circuit boards, relays,switches, indicators, plastic cable routing devices, wire ties, and cable splicing connectorsare also generally composed of a variety of polymeric materials. These materials are alsolikely to produce a relatively aggressive form of smoke when burned, although relativelylittle information on the burning of these materials is currently available.
5. Material Identification Conclusions
Based on these considerations, it is concluded that, far and away, the most significantthreat of smoke damage to electrical equipment will be associated with the burning ofcable insulation and jacketing materials. This conclusion is based on both the dominantrole cables play in the overall plant combustible fuel load, and on the nature of thecombustion products expected. Of secondary importance are other materials use in theconstruction of other types of electrical equipment.
A-22 NUREG/CR-6476

C. Combustion Mode
When materials burn, that burning can take place in different ways. In particular, burninghas classically been divided into open flaming and smoldering modes of combustion.Open flaming is generally the more efficient mode of burning and is typically associatedwith more volatile fuels, larger fires, and higher temperature fires. Smoldering isgenerally a less efficient mode of burning, and is often associated with less volatile fuels,lower temperature exposures, and either the very early or late stages of a fire event.Smoldering combustion will also dominate the early stages of an electrical fire initiatedthrough component failure.
However, in the consideration of the smoke threat, it would also be useful to consider theimpact of oxygen availability on fire burning. That is, fires can also be classified in termsof fuel surface controlled and oxygen-limited fires. In a fuel surface-controlled fire, therate of combustion is limited only by the quantity of fuel that has actually been ignited.In oxygen-limited burning, the fire intensity will be limited to that which the availableoxygen can support. In general, a fuel-surface controlled fire is associated with moreefficient burning. Oxygen-limited burning may occur during the later stages of a fire, anda decrease in combustion efficiency will typically result. Oxygen-limited burningconditions may prevail as a result of either limited availability of oxygen in the fire areaas a whole, or due to more localized ventilation limitations. For example, a closedelectrical control panel in which a significant fire occurs is likely to involve oxygen-limited burning even though the room as a whole may be well ventilated.
Both of these factors, flaming versus smoldering and fuel surface versus oxygen-limitedburning, are expected to affect the type of smoke generated during a fire. For example,the overall efficiency of the fire will determine the extent to which combustiblecompounds are actually oxidized. Fires with low burning efficiencies will result in manyunburned pyrolysates being generated. This can be a very important factor because theseunburned pyrolysates tend to be relatively heavy (dense) compounds and will quicklydeposit onto the available surfaces, including the electronic components. In a high-efficiency fire, the products of combustion will be more heavily dominated by gaseousspecies such as CO2, CO, and water vapor. One would also expect the particulate in ahigh-efficiency fire to be dominated by carbonaceous soot, which is likely to remainairborne much longer.
The effects of open flaming versus smoldering may also be important beyond thequestion of combustion efficiency. Under open flaming conditions, it would be expectedthat virtually all of the combustible material would be burned over a relatively shortperiod of time, and much more of the carbonaceous material would be liberated asairborne gases and soot. This would imply that all of the chemical species likely to begenerated would be generated simultaneously making subsequent chemical interactionsmore likely. Under smoldering fire conditions, the material will burn much more slowlywith the most volatile compounds liberated first. A larger fraction of the carbonaceousmaterial would likely remain as char as well. Unfortunately, the more volatile
NUREG/CR-6476 A-23

compounds include the plasticizing and flame retardant additives that are likely to resultin significant production of acid gas.
As a result of these anticipated differences, it is recommended that investigations beundertaken to assess the impact of burning mode on the smoke threat. That is, each modeof combustion is likely to result in a somewhat different smoke threat, and it is not clearwhich mode might be most significant. Controlled tests should be performed to exploreeach mode to ensure that the most significant mode of combustion is identified andunderstood.
D. Suppressant Interactions
In most fire events, some form of active fire suppression is likely to come into play. Themost commonly applied suppressants in the nuclear industry are water, water-basedfoams, and carbon dioxide (CO2). Each of these types may be used in either hand-applieddevices (hose streams, fire extinguishers, and hand-held CO2 discharge nozzles) and infixed fire suppression systems (area coverage and directed spray systems for the water-based systems and room flooding or local discharge systems for CO2). Also commonlyencountered are hand-held fire extinguishers that use dry chemical powder. This is a firesuppression agent often used to fight electrical equipment fires. Each of these systemsrepresents a unique potential for interactions involving combustion products. To a muchlesser extent, Halon systems may also be used.
1. Water-Based Suppressant Interactions
For the water-based systems, the obvious effect will be to increase the general humiditylevels within the fire area to near saturation levels. The suspended droplets can act asagglomeration points for the soot in the air and hence can lead to an increased rate of sootdeposition on exposed surfaces. Moisture droplets will also form on the various exposedsurfaces, including the surfaces of the advanced electronic components. Due to thehighly hygroscopic nature of acid gas molecules, the deposited moisture will then act toscavenge acid gas molecules from the environment, creating liquid acid deposits. Theseacidic deposits can cause direct corrosive attack, and can create short circuits and circuitbridging faults. Hence, the interactions with moisture are expected to be a generalincrease in the rate of soot deposition, and the formation of liquid acid deposits.
2. Carbon Dioxide Suppressant Interactions
For CO2 systems there are three potential modes of interaction that might be observed.First, the discharge of a CO2 system can introduce very high levels of static electriccharge on surfaces that are not fully grounded. Such static charges may induce very largecurrent surges, which could easily destroy solid-state chips (note that even relatively mild
A-24 NUREG/CR-6476

static charges can cause failures in various types of solid-state chips). This potential maybe enhanced by smoke deposits, which can partially bridge circuit paths. Second, thedischarge of CO2 will introduce a pronounced and very abrupt cooling effect. This wouldbe expected to lead to water vapor condensation and the formation of moisture droplets,or even frost, as surface deposits. Third, the increased concentration of CO2 gas couldresult in the formation of carbonic acid in surface moisture droplets. Carbonic acid is anaggressive, albeit short-lived, corrosion agent that might aggressively attack circuitcomponents. This aggressive attack, when combined with smoke, might increase thevulnerability of circuit components to damage.
3. Dry Chemical Powder Interactions
Dry chemical powder is a suppression agent which is commonly used to fight electricalequipment fires. It is one of the most commonly encountered fire suppressant agentsused for hand-held extinguishers. Hence, its use in fighting smaller electrical fires isquite likely.
Dry chemical powder is generally considered an aggressive corrosion agent. Often,electrical equipment sprayed with dry chemicals will be destroyed in a relatively shorttime if it is not cleaned. Hence, it is likely that dry chemical powder may introduce asignificant threat to electronic equipment in and of itself. In addition, it may introducesynergistic interactions with the smoke deposition, which might accelerate the rate ofcomponent degradation.
It is recommended that some tests be performed to assess the potential for synergisticeffects involving fire-fighting powders. However, because the powders themselvesrepresent a potential threat to electronic equipment, it may be necessary to test suchmaterials in the absence of smoke to determine whether synergistic effects with thesmoke exposure are significant. Hence, testing in both the presence and absence of asmoke exposure is recommended.
4. Halon Suppressant Interactions
To a lesser extent Halon is also used as a fire suppressant by the nuclear industry. Halonis a fluorocarbon compound with a particularly high Br content. It is well known thatwhen it is discharged into a high-temperature environment, or brought into contact withhigh-temperature surfaces, Halon will break down, releasing this Br as an acidic gas.Hence, an increased acid attack potential could be introduced by Halon release. Inaddition, Halon discharge will result in a pronounced localized cooling effect, though notas severe as that expected for CO2 discharge. However, it is not recommended that anexperimental investigation of Halon and smoke interactions be undertaken at this time.Halon has been identified as an ozone threat, and hence, it being phased out of all use inresponse to international accords on the protection of the ozone layer. It is anticipatedthat the use of Halon in nuclear power plants will become more and more rare in the near
NUREG/CR-6476 A-25

future, and the importance of Halon as a fire suppressant will be largely negated. Itshould be noted that efforts to find a replacement for Halon are being pursued by variousindustrial concerns. Should such replacements be brought to the market and findapplication in the nuclear industry, then the new materials should be reviewed todetermine whether an investigation of potential adverse effects might be warranted.
E. Transport Interactions
The transport of smoke from the fire source to the component of concern is an importantaspect of the smoke quality definition. This transport may take place through simplepassive spread of the smoke within the fire cabinet or fire area, or through the localventilation and air-handling systems. There is one important potential interactionassociated with this transport process which should be considered. That is, chemicalinteractions may take place between the smoke and the various surfaces involved in themovement of smoke from one location to another.
In many fires involving cables in communications facilities [6], it has been observed thatthe acidic smoke will interact with galvanized metals, resulting in the formation ofgalvanic salts. These salts are hygroscopic and in a humid environment, can attract waterfrom the air, forming a liquid zinc chloride solution. This solution can run or drip ontoelectronics. Once these deposits form on a component, an aggressive and debilitatingattack will begin. In a nuclear power plant, extensive galvanized metals will typically bepresent. This will certainly include the cable trays and conduits, and may also includecertain of the electrical control panels themselves. Ventilation air handling ducts are alsotypically constructed from galvanized sheet metal.
Testing should be performed to assess this interaction. It is recommended that sheets ofgalvanized metal be place within the test enclosure during some of the controlled tests.Placement of metal platens in the general smoke environment should be sufficient tosimulate interactions remote from the fire source, such as those that might occur with air-handling ducts. It is also suspected that elevated temperatures might significantlyincrease the rate of these interactions. Hence, it is recommended that some of these testsbe performed with the metals in close proximity to the actual fire source in order tosimulate situations in which, for example, the burning cables are housed in galvanizedcable trays or in close proximity to galvanized conduits.
F. Summary of Smoke Quality Insights
The issue of smoke quality has been approached by defining those factors consideredimportant in determining the nature of the smoke to which components would be exposedin a nuclear power plant fire. It is anticipated that by reproducing these factors in thelaboratory, a representative smoke exposure will result, even if the a priori knowledge ofthe smoke composition remains poor.
A-26 NUREG/CR-6476
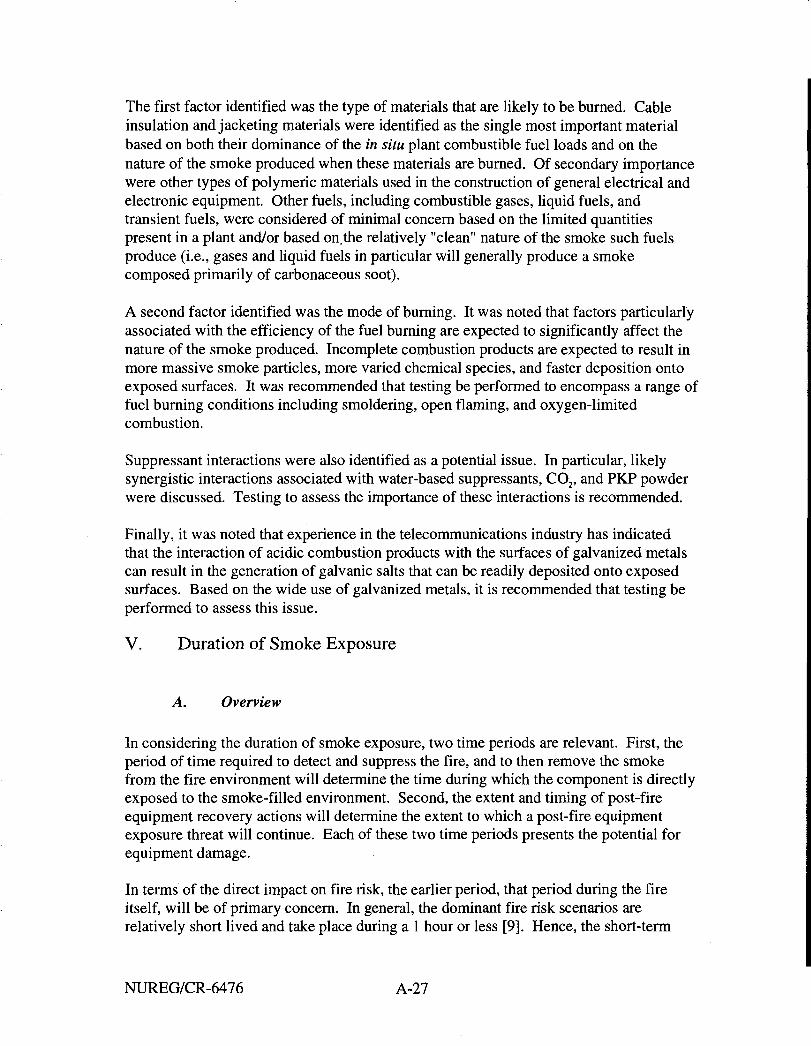
The first factor identified was the type of materials that are likely to be burned. Cableinsulation and jacketing materials were identified as the single most important materialbased on both their dominance of the in situ plant combustible fuel loads and on thenature of the smoke produced when these materials are burned. Of secondary importancewere other types of polymeric materials used in the construction of general electrical andelectronic equipment. Other fuels, including combustible gases, liquid fuels, andtransient fuels, were considered of minimal concern based on the limited quantitiespresent in a plant and/or based on.the relatively "clean" nature of the smoke such fuelsproduce (i.e., gases and liquid fuels in particular will generally produce a smokecomposed primarily of carbonaceous soot).
A second factor identified was the mode of burning. It was noted that factors particularlyassociated with the efficiency of the fuel burning are expected to significantly affect thenature of the smoke produced. Incomplete combustion products are expected to result inmore massive smoke particles, more varied chemical species, and faster deposition ontoexposed surfaces. It was recommended that testing be performed to encompass a range offuel burning conditions including smoldering, open flaming, and oxygen-limitedcombustion.
Suppressant interactions were also identified as a potential issue. In particular, likelysynergistic interactions associated with water-based suppressants, CO2, and PKP powderwere discussed. Testing to assess the importance of these interactions is recommended.
Finally, it was noted that experience in the telecommunications industry has indicatedthat the interaction of acidic combustion products with the surfaces of galvanized metalscan result in the generation of galvanic salts that can be readily deposited onto exposedsurfaces. Based on the wide use of galvanized metals, it is recommended that testing beperformed to assess this issue.
V. Duration of Smoke Exposure
A. Overview
In considering the duration of smoke exposure, two time periods are relevant. First, theperiod of time required to detect and suppress the fire, and to then remove the smokefrom the fire environment will determine the time during which the component is directlyexposed to the smoke-filled environment. Second, the extent and timing of post-fireequipment recovery actions will determine the extent to which a post-fire equipmentexposure threat will continue. Each of these two time periods presents the potential forequipment damage.
In terms of the direct impact on fire risk, the earlier period, that period during the fireitself, will be of primary concern. In general, the dominant fire risk scenarios arerelatively short lived and take place during a 1 hour or less [9]. Hence, the short-term
NUREG/CR-6476 A-27

equipment damage questions are of primary concern. However, longer term damagequestions should also be considered. That is, one of the questions that should beaddressed as a part of this program is the potential that smoke deposition might lead tocomponent failures at some time after the fire. The following subsections discuss variousaspects of the exposure duration question during each of these time periods
B. Smoke Purge Time
In the first case, the time required to purge the smoke from the environment, a wide rangeof exposure duration times should be expected. These will be directly related to themagnitude of the postulated fire event, and would be significantly affected by suchfactors as the availability of detection and fixed fire suppression systems.
The shortest time frames expected for smoke purging would be associated with the smallcabinet fires in which the only actions required to remove the smoke would be opening ofthe cabinet doors and suppression of the fire. In this case, the postulated fire remainsquite small and hence no significant smoke accumulation in the general area is assumed.Once the cabinet has been opened, the smoke will dissipate and be handled by the normalventilation system. Times on the order of 15-30 minutes would be considered typical forsuch scenarios [12].
The time to purge smoke from the environment would increase as the magnitude of thefire threat increased. For the fire scenarios involving a large cabinet fire and the resultinggeneral area smoke exposure, times on the order of 1 to 2 hours might be expected tofully purge the environment of smoke for general plant areas [8,9]. This includes thetime required for manual suppression and for manual recovery of the ventilation system.If the fire is postulated to occur in the main control room, somewhat shorter time frameswould be expected, on the order of 30-60 minutes, because faster intervention andcontinued ventilation system operation are expected.
For scenarios involving generalized room fires and the potential for the spread of smoketo adjacent areas, times of anywhere from 30 minutes to 4 hours might be anticipated. Inthis case, a very broad range of fire suppression and ventilation recovery times can beexpected given the variety in fire threats, fire detection capability, and fire suppressionavailability which could be encountered [12].
In summary, the minimum time frame required to purge smoke from the environment inthe event of a fire is expected to be on the order of 15 minutes. This would correspond tothe scenarios involving small in-cabinet fires which are very quickly detected andsuppressed. The maximum time required to purge smoke is considered to be on the orderof 4 hours. This assessment is based largely on past fire experiences and includes anassumption that manual recovery of the ventilation capability will be required. Thiswould also correspond to the most severe and generalized of the fire scenarios postulated.It is recommended that electronic components be tested to encompass this range of actualsmoke exposure durations.
A-28 NUREG/CR-6476

C. Post-Fire Recovery Times
Once a fire has been suppressed and smoke has been purged from the environment, apotential still remains that some equipment failures might occur at some time after thefire. Clearly, the extent and timing of post-fire equipment recovery actions will play acritical role. In particular, studies have shown that immediate intervention to reduceambient humidity levels can minimize the extent of corrosion damage [16]. It has alsobeen shown that much equipment can be cleaned and restored to operation if such effortsare begun shortly after the fire (within on the order of 24 hours of the fire event) [16].However, it is currently unclear to what extent plant operating procedures provide forsuch actions to be taken in the nuclear industry.
Hence, it should be expected that an extended period of exposure to smoke deposits maybe experienced with only minimal post-fire intervention. This could lead to subsequentunanticipated equipment failures, which might result in triggering of a plant transient.
However, it must also be recognized that, based on the results of past fire riskassessments, the most important fire scenarios from a plant risk perspective occur duringtime frames of roughly one hour or less [9]. Hence, the issue of longer term exposureswill be more important to the question of general post-fire equipment reliability, andconsidered of secondary concern. Nonetheless, it is recommended that the smokeexposure testing include an assessment of equipment performance over a minimumperiod of 24 hours.
It is also recommended that, should the scope of work allow, certain of the exposedcomponents be monitored for extended periods of time (on the order of a month) after theexposure. This would provide an additional assessment of the long-term failure potentialof smoke-exposed equipment. This approach could also be used to assess theeffectiveness of various component cleaning procedures.
D. Transport/Exposure Duration Interactions
It should be noted that there is a direct relationship between the issues of exposureduration and smoke transport. That is, the duration of the smoke exposure may bedirectly affected by the manner in which the smoke reaches the component of interest. If,for example, the component is contained within an electrical panel in which a small fireoccurs, then much of the smoke may remain contained within the cabinet for extendedperiods. If the component is affected by a more generalized smoke layer developedduring a larger fire impacting a full room, similarly long residence times should beexpected. In contrast, certain fire scenarios may involve only minimal exposure times if,for example, a component is located directly in the path of the fire plume from arelatively small fire. In this case, smoke exposures lasting no longer than the fire itselfmay result.
NUREG/CR-6476 A-29
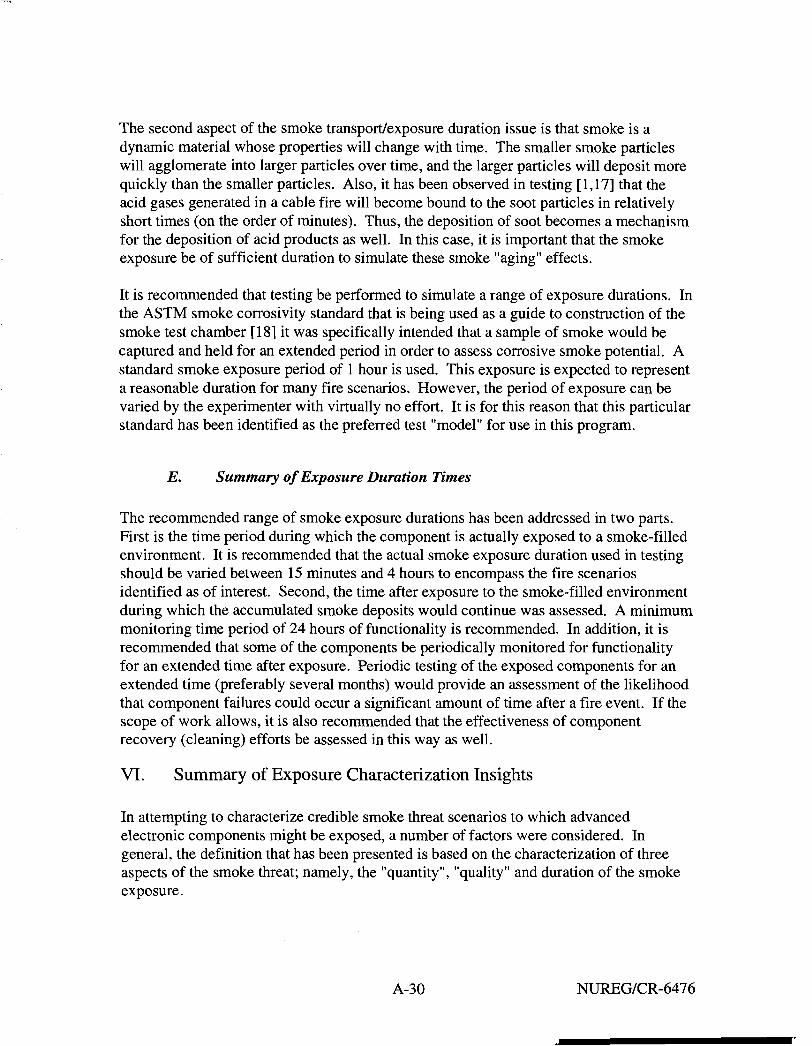
The second aspect of the smoke transport/exposure duration issue is that smoke is adynamic material whose properties will change with time. The smaller smoke particleswill agglomerate into larger particles over time, and the larger particles will deposit morequickly than the smaller particles. Also, it has been observed in testing [1,17] that theacid gases generated in a cable fire will become bound to the soot particles in relativelyshort times (on the order of minutes). Thus, the deposition of soot becomes a mechanismfor the deposition of acid products as well. In this case, it is important that the smokeexposure be of sufficient duration to simulate these smoke "aging" effects.
It is recommended that testing be performed to simulate a range of exposure durations. Inthe ASTM smoke corrosivity standard that is being used as a guide to construction of thesmoke test chamber [18] it was specifically intended that a sample of smoke would becaptured and held for an extended period in order to assess corrosive smoke potential. Astandard smoke exposure period of 1 hour is used. This exposure is expected to representa reasonable duration for many fire scenarios. However, the period of exposure can bevaried by the experimenter with virtually no effort. It is for this reason that this particularstandard has been identified as the preferred test "model" for use in this program.
E. Summary of Exposure Duration Times
The recommended range of smoke exposure durations has been addressed in two parts.First is the time period during which the component is actually exposed to a smoke-filledenvironment. It is recommended that the actual smoke exposure duration used in testingshould be varied between 15 minutes and 4 hours to encompass the fire scenariosidentified as of interest. Second, the time after exposure to the smoke-filled environmentduring which the accumulated smoke deposits would continue was assessed. A minimummonitoring time period of 24 hours of functionality is recommended. In addition, it isrecommended that some of the components be periodically monitored for functionalityfor an extended time after exposure. Periodic testing of the exposed components for anextended time (preferably several months) would provide an assessment of the likelihoodthat component failures could occur a significant amount of time after a fire event. If thescope of work allows, it is also recommended that the effectiveness of componentrecovery (cleaning) efforts be assessed in this way as well.
VI. Summary of Exposure Characterization Insights
In attempting to characterize credible smoke threat scenarios to which advancedelectronic components might be exposed, a number of factors were considered. Ingeneral, the definition that has been presented is based on the characterization of threeaspects of the smoke threat; namely, the "quantity", "quality" and duration of the smokeexposure.
A-30 NUREG/CR-6476
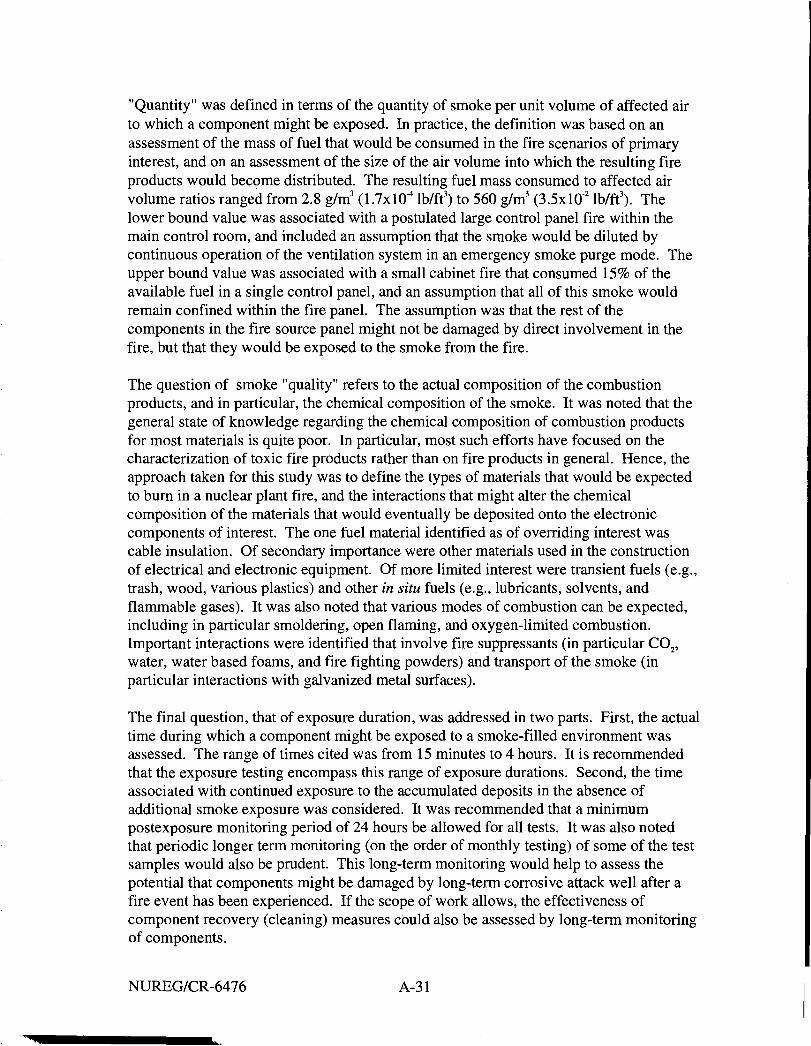
"Quantity" was defined in terms of the quantity of smoke per unit volume of affected airto which a component might be exposed. In practice, the definition was based on anassessment of the mass of fuel that would be consumed in the fire scenarios of primaryinterest, and on an assessment of the size of the air volume into which the resulting fireproducts would become distributed. The resulting fuel mass consumed to affected airvolume ratios ranged from 2.8 g/m3 (1.7xlO4 lb/ft3) to 560 g/m3 (3.5x10² lb/ft3). Thelower bound value was associated with a postulated large control panel fire within themain control room, and included an assumption that the smoke would be diluted bycontinuous operation of the ventilation system in an emergency smoke purge mode. Theupper bound value was associated with a small cabinet fire that consumed 15% of theavailable fuel in a single control panel, and an assumption that all of this smoke wouldremain confined within the fire panel. The assumption was that the rest of thecomponents in the fire source panel might not be damaged by direct involvement in thefire, but that they would be exposed to the smoke from the fire.
The question of smoke "quality" refers to the actual composition of the combustionproducts, and in particular, the chemical composition of the smoke. It was noted that thegeneral state of knowledge regarding the chemical composition of combustion productsfor most materials is quite poor. In particular, most such efforts have focused on thecharacterization of toxic fire products rather than on fire products in general. Hence, theapproach taken for this study was to define the types of materials that would be expectedto burn in a nuclear plant fire, and the interactions that might alter the chemicalcomposition of the materials that would eventually be deposited onto the electroniccomponents of interest. The one fuel material identified as of overriding interest wascable insulation. Of secondary importance were other materials used in the constructionof electrical and electronic equipment. Of more limited interest were transient fuels (e.g.,trash, wood, various plastics) and other in situ fuels (e.g., lubricants, solvents, andflammable gases). It was also noted that various modes of combustion can be expected,including in particular smoldering, open flaming, and oxygen-limited combustion.Important interactions were identified that involve fire suppressants (in particular CO2,water, water based foams, and fire fighting powders) and transport of the smoke (inparticular interactions with galvanized metal surfaces).
The final question, that of exposure duration, was addressed in two parts. First, the actualtime during which a component might be exposed to a smoke-filled environment wasassessed. The range of times cited was from 15 minutes to 4 hours. It is recommendedthat the exposure testing encompass this range of exposure durations. Second, the timeassociated with continued exposure to the accumulated deposits in the absence ofadditional smoke exposure was considered. It was recommended that a minimumpostexposure monitoring period of 24 hours be allowed for all tests. It was also notedthat periodic longer term monitoring (on the order of monthly testing) of some of the testsamples would also be prudent. This long-term monitoring would help to assess thepotential that components might be damaged by long-term corrosive attack well after afire event has been experienced. If the scope of work allows, the effectiveness ofcomponent recovery (cleaning) measures could also be assessed by long-term monitoringof components.
NUREG/CR-6476 A-31

VII. References
1. Screening Tests of Representative Nuclear Power Plant Components Exposed toSecondary Fire Environments, SAND86-0394, NUREG/CR-4596, Sandia NationalLaboratories, June 1986.
2. Investigation of Potential Fire-Related Damage to Safety- Related Equipment inNuclear Power Plants, SAND85-7247, NUREG/CR-4310, Sandia National Laboratories,November 1985.
3. Prioritization of Reactor Control Components Susceptible to Fire Damage as aConsequence of Aging, SAND93-7107, NUREG/CR-6103, Sandia National Laboratories,January 1994.
4. "Corrosivity Test Methods for Polymeric Materials. Part 3- Modified DIN TestMethod," Journal of Fire Sciences, V12, No. 2, pp. 155-174, March/April 1994.
5. "Corrosivity Test Methods for Polymeric Materials. Part 2- CNET Test Method,"Journal of Fire Sciences, VI2, No. 2, pp. 134-154, March/April 1994.
6. Hinsdale Central Office Fire Final Report, Joint report of the Office of the State FireMarshal (Illinois) and the Illinois Commerce Commission Staff, March 1989.
7. An Experimental Investigation of Internally Ignited Fires in Nuclear Power PlantControl Cabinets, Part I - Cabinet Effects Tests, SAND86-0336, NUREG/CR-4527/V1,Sandia National Laboratories, April 1987.
8. An Experimental Investigation of Internally Ignited Fires in Nuclear Power PlantCabinets, Part II - Room Effects Tests, SAND86-0336, NUREG/CR-4527/V2, SandiaNational Laboratories, October 1988.
9. Fire Risk Scoping Study: Investigation of Nuclear Power Plant Fire Risk, IncludingPreviously Unaddressed Issues, SAND88-0177, NUREG/CR-5088, Sandia NationalLaboratories, December 1988.
10. Enclosure Environment Characterization Testing for Base Line Validation ofComputer Fire Simulation Codes, SAND86-1296, NUREG/CR-4681, Sandia NationalLaboratories, March 1987.
11. A Review of Regulatory Requirements Governing Control Room HabitabilitySystems, SAND84-0978, NUREG/CR-3786, Sandia National Laboratories, August 1984.
A-32 NUREG/CR-6476

12. Users Guide for a Personal-Computer-Based Nuclear Power Plant Fire Data Base,SAND86-O3OO, NUREG/CR-4586, Sandia National Laboratories, August 1986.
13. A Summary of the USNRC Fire Protection Research Program at Sandia NationalLaboratories; 1975-1987, NUREG/CR-5384, Sandia National Laboratories, December1989.
14. Aging, Condition Monitoring, and Loss-of-Coolant Accident {LOCA) Tests of ClassIE Electrical Cables, SAND91-1766/1-3, NUREG/CR-5772, Sandia NationalLaboratories, August 1992 (report in three volumes).
15. Functional Issues and Environmental Qualification of Digital Protection Systems ofAdvanced Light-Water Nuclear Reactors, ORNL/TM-12164, NUREG/CR-5904,Brookhaven National Laboratory, April 1994.
16. "Damage Management," Fire Surveyor, June 1992, pp. 20-23.
17. " Transport and Decay of Hydrogen Chloride: Use of a Model to Predict HydrogenChloride Concentrations in Fires Involving a Room-Corridor-Room Arrangement," FireSafety Journal, 16 (1990), pp. 33-52.
18. "Standard Test Method for Measuring the Corrosive Effect of Smoke fro the Burningor Thermal Decomposition of Materials and Products," ASTM E05.21.70, Draft #2,November 1992.
NUREG/CR-6476 A-33

Appendix B
A Review of Smoke Damage to Electrical Equipment
July 27, 1995
Revised July 26, 1996
A letter report for the USNRC Office of Research
Prepared by:
Tina J. Tanaka
Components & Structures Safety & Reliability Department
Sandia National Laboratories
NRCFINW6051
Abstract
This report reviews literature on smoke damage to electrical equipment. Smoke can damageelectrical equipment because soot and acidic gases can corrode metals, coat contacts, and causeshorts. Smoke damage to electronics is not limited to immediate failures, but also includes long-term failures. Some smoke damage statistics are available from accidental fires, but detailedinformation on long-term damage from accidental fires is not readily available because bestpractices for fire recovery include immediate cleaning of electronic equipment to halt corrosion.Detailed information on long-term damage from smoke is available from controlled fire tests andhas also been correlated with damage due to ionic substances in the air. Nuclear power plantoperators should be aware of both the short-term and the long-term failures that can result fromsmoke exposure.
NUREG/CR-6476 B-l

Introduction
This report summarizes information available in the public literature on smoke damage fromboth actual fires and smoke damage testing. A related subject, corrosion of electroniccomponents and assemblies, is also discussed here because the contamination produced by a firecan be compared to long-term contamination from a polluted atmosphere.1 Other aspects ofsmoke damage considered include cleaning of smoke-exposed equipment, and methods used tomonitor the amount of corrosion that equipment experiences in order to predict the equipment'suseful lifetime. These aspects will be touched on briefly.
Assuming that all fires cannot be prevented, minimization of smoke damage to electricalequipment may be approached in four ways: (1) regulate the type of fuel available to ensure thatthe smoke will be noncorrosive, (2) control the smoke propagation so that the electronics will notbe exposed, (3) protect the electronics with conformal coatings or otherwise encase it to preventsmoke deposition, and (4) immediately following a fire, take aggressive measures to clean andrecover smoke-exposed components. Some industries use combinations of smoke damageprevention and equipment recovery. Once electrical equipment has been exposed to smoke, it isimportant to determine whether the equipment must be replaced or can be cleaned. This reportincludes findings by other researchers on the amount of chemical deposition that can be toleratedby electrical equipment.
Smoke Damage Reported from Accidental Fires
This section reviews the smoke damage information available in the public literature from thenuclear power, telecommunications, shipboard, and other industries. Reports on fire events inthe nuclear power industry are unique in that the reports concentrate on root causes of the fireand actions by personnel during the fire rather than on the total cost and personal injury, as inother industries. As a result, fire damage reports from the nuclear power industry have littleinformation on the type of damage to equipment experienced or on the long-term effects of a fire.This singular viewpoint by the nuclear power industry reflects its emphasis on public safetyrather than economics.
Nuclear Power Industry
Two databases on fire events in nuclear power plants are available: the EPRI database,2 whichincludes fire events dating from 1965 to 1988,and the Sandia National Laboratories (SNL)database,3 which includes fire events from 1965 to June 1985. The information reported in thesedatabases was obtained from several sources, including the licensee event reports (LERs),American Nuclear Insurers, nuclear power experience, power reactor events, and severalprobabilistic risk assessments. The main function of these databases is to provide information onthe frequency, severity, locations, and ignition sources of fires in nuclear power plants for riskassessment analyses. Although these databases include a field to list the damaged equipment, the
B-2 NUREG/CR-6476

reporting of such information tends to be sparse and the mode of damage is not given. Damagereported in these databases was mainly the result of direct effects such as burned equipment.
The LER database does not reveal any specific information on equipment damaged by smoke orthe synergistic effects of smoke and other chemicals introduced during fire suppression. Smokedamage probably occurs, but because the LER is more related to the root cause of a problemrather than the resulting damage, not much analysis of the damage is reported.
Nuclear industry surveys contained little information on smoke damage to electrical equipment.Smoke damage is probably a factor in the failure of equipment after a fire; however, littleattention has been paid to the failure mechanisms of electronics in a fire.
Telecommunications Industry
The telecommunications industry currently leads the nation in the investigation of smoke damageto electrical equipment. Several telephone central offices have been severely damaged by fireand smoke.4'5'6 Studies of these events have revealed that smoke can account for up to 95% ofthe total equipment damage.7 The most extensively studied central office fire, in Hinsdale,Dlinois, in 1988, resulted in lost communication for 42,000 customers for several days, althoughthe fire was confined to cables in an area about 6 feet in diameter and several punch card binsdirectly below the fire source. Included in the loss of communication was contact with the firestation and the FAA air traffic control center for O'Hare airport.
Smoke induced failures were observed within 6 hours at the Hindsdale fire. Although much ofthe switching equipment was functional after the fire, the equipment was badly corroded and hadto be replaced in a matter of weeks. The switching system used electromechanical switches(relays). Much of this damage arose from acid gases, produced primarily from the burning ofpoly vinyl chloride (PVC) cable insulation. Burning PVC generates hydrochloric acid becausePVC is 35% chlorine by weight. Hydrochloric acid attacks electronics by forming metal saltsthat both weaken the metal structure and erode the conducting metal. The hydrochloric acidcorroded the switch contacts, allowing them only 1 month of life after the fire.
Bellcore (Bell Communications Research) has been a leader in the studies on smoke damage forthe telecommunications industry.6'7 Reagor from Bellcore reports that the level of chloride attackis the most important parameter in determining if equipment should be cleaned. The expectedtotal amount of zinc chloride (a metal salt) that a piece of equipment will accumulate on itssurface from the environment over a lifetime is 30 to 60 ^ig/in2. In contrast, fires can contributebetween 30 and 600 fig/in2 in a matter of minutes to hours. Bellcore research has shown that ifcontamination levels are below 200 ug/in2, the equipment can be restored easily, and at levelsbetween 200 |ig/in2 and 600 [ig/in2, it can also be restored with some effort, but levels above 600
2 are uneconomical to salvage.
Comizzoli and Sinclair, at AT&T Bell Laboratories, have studied corrosion of electroniccomponents and assemblies.8'910 Comizzoli proposed that the corrosion of metal contacts onelectronic equipment such as integrated circuits is accelerated by the combination of exposure toatmospheric contaminants and an environment above a critical relative humidity of about 60%.
NUREG/CR-6476 B-3
Atmospheric contaminants include dust and acid gases such as sulfur dioxide, nitrogen oxides,and chlorides. Above the critical relative humidity, dust and moisture combine to formelectrolytic solutions. These solutions cause electrical leakage and corrosion on the componentor assembly. Comizzoli also proposed some test methods to determine how well the electroniccomponents are protected by assembly designs and coatings. These tests involved controlledapplication of ionic particles by a forced air system.
The oil fires in Kuwait offered Comizzoli et al.n an opportunity to study the effects of oil smokeon electronics. The Kuwait oil fire experiments showed that H2S from the burning oil was asignificant contributor to corrosion of silver and copper coupons and to contact resistance of pinand socket connectors. Coupons and connectors that were housed in filtered areas showed farless corrosion. These results suggest that electronic equipment should be protected by eithercoating the electronics with materials that will not allow the penetration of ionic substances andhumidity or controlling the air flow so that smoke will not come into contact with the electronics.
The telecommunications industry has emphasized the reduction of fuels that produced corrosivesmoke as a method to limit smoke damage to their equipment. For example, most telephonecompanies now require that cable suppliers for the telecommunications industry manufacturecables that produce less corrosive smoke. As a result, both the plastics industry12 and FactoryMutual Research Corporation (FMRC) have become heavily involved in testing the relativecorrosivity of the smoke from different materials. The efforts of the plastic manufacturers toproduce standards for testing the corrosivity of materials are documented in a later section.
Most research into the effects of smoke on telecommunications systems has concentrated on thelong-term effects of smoke exposure, such as corrosion, rather than short-term effects, such ascircuit bridging. This may be a result of the amount of attention paid to the Hinsdale fire wherethe power was turned off before the fire could be extinguished; it was this power loss that led tothe most extensive loss of function. During the fire, some smoke exposed switching equipmentfailed, but little research has been devoted to prevention of immediate failures of the electricalequipment. Instead the telephone industry has concentrated on reducing the losses fromcorrosion after the fire. Although the telephone industry stressed the need for continuous service,they can tolerate a temporary loss of service. The need for continuous service at a nuclear powerplant is much more critical.
Shipboard Fires
Shipboard fires have caused extensive loss of life and damage to equipment. Damage in theBritish Navy in the period 1988 to 1989, for example, included 279 fires of different sizes andamounted to £12IK in losses.13 Pivotal fire events leading to changes in the cable materialspecifications for the British navy were fires started by missiles during the Falkland Islands warin 1982.14 The HMS Sheffield and HMS Ardent were both hit with missiles and sank because theheavy black smoke from PVC cabling and linoleum prevented sailors from extinguishing thefires. PVC (a halogenated compound) is considered inherently flame retardant because it isapproximately 35% chlorine by weight. However, given enough heat, PVC will burn andproduce black sooty smoke and large quantities of hydrochloric acid. Halogenated compounds(those compounds which include fluorine, chlorine, bromine, and iodine) and Halon suppress
B-4 NUREG/CR-6476

fires by action of the halogen ions. Halogen ions react with hydrogen faster than oxygen,preventing the oxygen from reacting with the fuel, thus extinguishing the fire.15 In the process ofextinguishing the fire, however, toxic and corrosive acid gases form. Since smoke fromhalogenated cables (such as PVC) is especially black and toxic, the British Navy has eliminatedPVC cables from their ships.
Fire-resistant cables that are nonhalogenated have been developed in the past 10 years. Thesecables are doped with metal hydrates instead of halogens. Aluminum trihydrate and magnesiumhydroxide are two fillers that reduce the flammability of polyethylene, but do not containhalogens. The flame retardancy is the result of (a) a smaller proportion of polymer, (b)absorption of heat by the metal hydrates, and (c) release of water upon decomposition.16 Cablesfilled with metal hydrates produce less smoke, are less corrosive, and are less toxic thanhalogenated cables.
The U.S. Navy has studied fire and smoke production for many years,1718 and they also changedtheir specifications as a result of changes made by the British Navy. The older specifications oncables, such as MEL-C-915, included physical characteristics such as tensile strength, elongation,and bending endurance. The newer specifications, MIL-C-24640 (1984) and MIL-C-24643(1986), also include measurements of acid gas production, halogen content, smoke index, andtoxicity index. The smoke index and toxicity index are related to Naval Engineering Standardsborrowed from the British Navy. The smoke index measures the optical density of smoke, whilethe toxicity index measures the amount of toxic gases produced by burning cables. Halogens areno longer allowed in the cable jacket, which is the outermost layer of a cable. Research fundedby the U. S. Navy includes an assessment of the toxicity and the optical density of smoke fromshipboard materials.19 Work performed after 1985 includes studies on smoke damage tostructural materials such as steel that may be used in bulkheads.20 These studies included smokecorrosivity tests from different types of cables. Current studies include an investigation ofpotential damage to electrical equipment from Halon and its replacement fire suppressants.21
Other Fire Events
Factory Mutual is the leading insurance company organization doing research on fire and smokedamage. FMRC claims that the effects of fire on a computer system, even a small smolderingfire, can be extensive over a period of time, even if the fire is not located in the same room.According to FMRC, computer rooms have been damaged more often by fires originatingoutside the rooms than by fires originating within the room.22 Unfortunately, the bulk of FMRCdata related to these findings is proprietary, and hence, was unavailable.
Smoke Exposure Testing
This section discusses failure modes of electrical equipment in a smoke environment, equipmentsurvivability tests, and smoke corrosivity tests. Smoke-generated failures are specific to theequipment exposed, and while some failure modes are very quick, others, such as corrosion, areslower. Equipment survivability tests in this context are tests of the reliability or performance of
NUREG/CR-6476 B-5
equipment in a smoke-filled atmosphere. Equipment survivability tests have generally beenperformed during full-scale fires and using equipment that is typical of systems that will beexposed to smoke. No standard tests exist for equipment survivability in a smoke-filledenvironment. In contrast, smoke corrosivity tests are small-scale material tests that measure howcorrosive the smoke from a particular material is to a specified metal target. Manufacturers ofcable and building materials developed these tests to prove that smoke from their cables isbenign. These tests provide only a relative measure of the corrosivity of combustion productsunder very specific test conditions and the results cannot be used directly to predict equipmentdamage.
Failure Modes
Most smoke failure modes are similar to failures caused by environmental pollution, but theytake place more quickly. In atmospheric pollution, dust and small particles can coat equipmentover periods of years and cause damage and failure. This damage occurs because of corrosion ofmetal contacts, bridging of conductor circuits, and formation of nonconducting surfaces onelectrical contacts. Dust can damage moving parts, such as in mechanical timers and relays,interfering with movement. Pollutants can also obscure optical equipment. The deposition ofsmoke from a fire can be the equivalent of decades of dust in a normal environment. During afire, the environment is not only very polluted by smoke, but often the addition of humidity andfire suppressant chemicals produces harmful synergistic effects. These conditions can producecatastrophic failures for electrical equipment over relatively short periods (minutes to hours).
Smoke produces many problems for humans; it is toxic and obscures vision. For electronicequipment, these qualities are not usually important, except in the case of optical equipment.Because these qualities are very important for humans, however, standard tests have beendeveloped for measuring both smoke obscuration23 and toxicity. These tests are material tests,that is, the various materials that will be the fuel are tested rather than any equipment. No studieshave been published on the effect of smoke on optical equipment.
Smoke damage to electrical equipment through corrosion of metal, especially from plastics suchas PVC, has been known for several decades.24 The development of standards to test materialsfor smoke corrosivity has only been actively pursued since the mid-1980s. Present and proposedsmoke corrosivity tests concentrate on measuring the loss of metal through corrosion, althoughcorrosion is not the only failure mode for electrical equipment in a smoke environment.
Recently, several investigators in the field of smoke damage (including SNL) have proposedexperiments25 that will also measure insulation resistance between contacts on a printed circuitboard. Soot deposits can reduce the insulation resistance by providing a conductive pathbetween contacts or circuit traces. Loss of insulation resistance can lead to undesired currentpaths (leakage currents) or circuit bridging. Circuit bridging as a failure mode can be asdestructive as corrosion, but will occur on a much shorter time scale. No standards have beendeveloped to measure this effect.
The formation of nonconducting deposits on contacts can also lead to circuit failure. Formechanical relays and switches, this can be an important failure mode. No standard test for the
B-6 NUREG/CR-6476

effect of smoke from different materials has been developed to investigate this failure mode;however, tests on switchgear16 and sockets11 show that smoke has a significant effect on contactresistance. This particular failure mode is not considered relevant to digital circuits becausethese circuits do not generally use open contact pairs as switching devices.
Failures due to circuit bridging, changes in contact resistance, loss of mechanical motion, andoptical obscuration can occur immediately from smoke exposure, while metal loss failures willtake place slowly over a period of weeks to months following the fire. Delayed failures are aproblem that may be overlooked by plant operators and that can seriously affect reliability andplant safety. The most important failure mode is highly dependent on the type of electricalequipment that is exposed to smoke. Studies of the reliability of electrical equipment in a smokeenvironment must include equipment that is typical of the equipment under study and a smokeenvironment that is characteristic of the type of environment that can occur in a fire. Somefailures, such as a change in contact resistance and inhibition of motion, are not consideredrelevant to digital equipment. Material tests such as those published by the ASTM are importantto qualify material for use in a plant, but are no substitute for testing electrical equipment in thesmoke environment.
Smoke Exposure to Electrical Equipment
In 1986 Jacobus26 performed full-scale fire tests and smoke exposures on electrical equipment.The test articles (equipment considered to be typical of that used in nuclear power plants) weretested in a room that contained a burning electrical cabinet. Jacobus tested twenty-four switches,thirteen meters, five relays, two strip chart recorders, two electronic counters, one power supply,one power amplifier, and one oscilloscope amplifier. Some of the equipment was tested withprotective covers on, while other equipment was tested with the covers off. The protectivecovers significantly reduced particulate accumulation. The components that were most stronglyaffected were those with mechanical moving parts, such as chart recorders. Circuit boards on theelectronic counter also failed because of leakage currents. Switches and relays experiencedproblems due to high contact resistance at low voltage levels. Nuclear-qualified cables and PVCcables provided the fuel for these experiments.
Bridger et a/16performed two full-scale tests on switchgear using standard switchgear wire andnew low-emission switchgear wire. The switchgear included pushbuttons, indicator lights,ammeters, relays, and switches. Bridger monitored the equipment before the test, immediatelyafter the exposure, 7 days after the exposure, and 3 weeks after the exposure. The low-emissionwire, which contained no halogens, caused less change in contact resistance in the equipment.The residue from the low-emission wire was also easier to clean than that from the standard wire.
DuPont has tested three commercial 386 PCs using smoke from a dynamic combustioninstrument called a cone calorimeter.27 Commercially available utility programs tested the PC forfunctionality during and after the smoke exposure. Three different cables provided the smoke forthese tests. Of the three tests, two PCs failed and one survived. DuPont considers these testsimportant as far as illustrating the potential for damage from smoke originating from differentmaterials; however, a PC is much too complicated as a test object to reveal the precise causes offailure.
NUREG/CR-6476 B-7

Smoke Corrosivity Testing
Low smoke corrosivity requirements by the telecommunications industry have produced greatinterest in smoke corrosivity testing. Early tests have been performed using a full-scale fire, thatis, the fire is contained in a room about the size of a small office or larger, and the smokeexposure samples are contained in an adjacent comparable room. Since full-scale testing is notvery economical, standards committees have concentrated on developing small-scale tests thatare supposed to simulate the effects of a real fire. The controversy that develops over use of asmall-scale test is: does the small-scale test really produce smoke has the characteristics of a full-scale fire and are the exposure conditions typical of those expected in real fires? Hydrochloricacid gases, which cause corrosion, combine quickly with water. As a result, these gases may notbe well distributed throughout a room after a fire.28-29 In a fire, soot is also not well distributed;the heavier deposits are closer to the fire. The extent to which factors such as these areaccounted for in the various standard tests is questionable.
Since the mid-1980s there have been many proposed test standards to measure the corrosivity ofsmoke from solid materials. These tests measure either smoke acidity or metal loss. Chapin hascompiled a list of smoke corrosivity tests that are currently in use or proposed by organizationsaround the world30 (see Table 1). These tests only assess one failure mode (corrosion) eitherdirectly, as in the last four methods on Table 1 that measure loss of metal by measuringresistance, or indirectly by measuring the acidity of the smoke as in the first eight tests listed inthe table. Note that acid gas generation tests consist of percolating smoke through distilled waterand then measuring the resulting acidity with a pH meter or by other chemical analysis. Sincemany halogenated materials produce acidic gases when burnt, and the acidity of the gases isassumed to determine how corrosive they are, the acidity measured by these tests gives someindication of how corrosive the smoke may be.
The early work on smoke corrosivity concentrated on measuring corrosion through the loss ofmetal from solid metal coupons. The loss of metal was measured in either of two ways: (1)measuring the weight gain as a function of time ~ this measures the additional weight of oxygendue to formation of rust (metal oxides),31-20 or (2) sandblasting off all of the corroded metal andthen weighing the metal loss.12 In either case, the change in weight is very small compared withthe weight of the original piece of metal; thus, the measurements must be done very accurately.Other uncertainty is added because for the first technique other materials may add to the weight.With the sandblasting technique, some noncorroded metal may be lost in the sand-blastingprocess.
Instead of measuring weight changes, metal corrosion can be measured by measuring resistivity.On the basis of this idea, corrosivity probes have been developed which are made up of thinmetal traces on printed circuit boards of a standard thickness. Instead of a simple trace, however,a two-legged bridge is formed; one leg is protected by epoxy and the other leg is exposed andallowed to corrode. The change in resistance of the exposed leg determines the metal loss, andhence the rate of corrosion. The reason that two legs of a bridge are needed is that as temperaturefluctuates, the resistance of a single trace may fluctuate; however, if a bridge formation is used,temperature effects common to both legs are eliminated. Currently both the ASTM standardsdeveloped by the D9 and E5 committees use this corrosion probe (manufactured by Rohrback) as
B-8 NUREG/CR-6476

Detailed Summary of Smoke Corrosivity Test Methods
ON
W
Category
Add Ga« Generation IEC 754-1. 1994-01(dynamic method,stationary furnace)
Add Gas Generation BS 802-1(dynamic method,stationary furnace)
Acid Gas Generation BS 8245: Part 1(dynamic method,stationary furnace)
Add Gas Generation CSA C22.2. No. 0.3-(dynamlc method, M19«5-«ec 4.31traveing tbmaee)
Add Gas Generation S M AS 1880.5.3(dynamic method,stationary ftjmace)
Sample CvnbustionChamber
H..t source Heatlno Condition. Carriergas/atmosphere
Corrosion Measurement Expression of Results
Test on Gases Evolved Ourlng Material from Slice tubeCombustion of Materials from cable, 0.5-1.0 g cutCables, Part 1 Into pieces
Test on Gases Evoked Ouring Material from SllcatubeCombustion of Materials from cable, 0.5-1.0 g cutCables, Part 1 Into pieces
Gases Evolved During Material from Sllca tubeCombustion of Materials from cable, 0.5-1.0 g cutCables, Part 1: Determination of Into piecesAmount of Halogen Add OasEvolved During Combustion ofPolymeric Materials Taken fromCablesTe»t to Determine Add Oaf Material from SllcatubeEvolution cable, 500 mg, 60
mm long
Stationary rumace, heat dry air 20ramped from 23-aOOC In ml/mm2/h40mlnth.nmilnt.20mln
Stationary lumace, heal dry air 20ramped from 23-800C In mVmm2/h40rmn(henmalnt. 20
Stationary furnace, heat dry air 20ramped from 23-800C In irt/mrrOro40rrinth*nmalnt. 20mln
2 water traps 220 Titrate with HNO3,ml 0.1N NaOH AgNOJ, F*NH4SO4,
NH4SCN
2 water traps 220 Titrate with HNO3,ml 0.1N NaOH AgNO3, FeNH4SO4,
NH4SCN
2 water traps 220 Titrate with HNO3,lrt0.1NNaOH AgNO3. FeNH4SO4,
NH4SCN
BOOC, 8-1* moves. dry air, 100rnVmln 3 water traps, pH 5 Titrate w«h0.1N NaOHsimple heated 5 mln, 10 7. add 5ml 0.1Nmln to heat deposits NaOH
Method* of Test for Electrical Material fromCables, Cords and Conductors, cable, 500 mgPart 5: Fire Tests - Part 5.3::Determination of Amount ofHalogen Add Oat EvolvedDuring Combustion of PolymericMaterials Taken from Cables
Test on Gases Evolved During Material fromCombustion of Materials from cable, 1000 mgCables, Part 2
Test on Gases Evolved During Material fromCombustion of Materials from cable, 1000 mgCables, Part 2
Sllcatube Tube furnace »0OC for 10 minutes dry air 6 Mi pHbytltratlon
Slica tube Tube furnace preheat >»35C for 30minutes
Acid Gas Generation IEC 754-2 Test on Gases Evolved During Material from Sllcatube Tube furnace preheat > 835C for 30and Conductivity Combustion of Materials from cable, 1000 mg minutes
(dynamic method,stationary furnace)
Acid Gas Generation BS 802-2and ConductMty(dymmic method,stationary furnace)
Add Gas Generation SAS AS 88003 (prop to Methods of Test for Electricalind Conductivity become AS 1690.5.4) Cables, Cords and Conductors:(dynamic method, Determination of Amount ofstationary ftmace) Halogen Add Gas Evolved
During Combustion of PolymericMaterials Taken from Cables
CNET (static method) ISO/DIS 11907 Part 2, Plastics -Smoke Generation- Material from 20lterPMMA InconeHadteted 800C for 150 sec8 Jin 1091 Determination of the Corrosivity cable, 600 mg with seals, nlchrome wire
of Fire Effluents, Part 2.: Static granules mixed with heated lo 50CMethod lOOmgPE with wire
wrapped around
dryalr, lOOmVmln 1 w 2 wash bottles pH and conductivity(15-30 Vh) (vd 1000ml) pH 5-
7
dryalr, 100 mVmin 1 or 2 wash bottles pH and conductivity(voMOOOmQpHS-7
Ory air, Irjected PWB 33 tracks 52 Insulation resistance ofwith water to a mm long. 0.3 mm PWB every 1501 for 1sptdflc RH (»0 or wide, 17 microns hour40-60%) ttJck; cooled 10C
below chamber
Amount of halogen addexpressed as mg HCI/gsample
Amount of halogen addexpressed as mg HCVgsample
Amount of halogen addexpressed as mg HCVgsample
Materials containingfluoride or halogen•eld > 5 mg/Q. notsuitable for zerohalogen materialsMaterials containingfluoride or halogenscld > 5 mg/g, no<suitable for zerohalogen materialsMaterials containingfluoride or halogen*dd > 5 mg/g, notsuitable for zerohalogen materials
Percentage of add gas Requires ID of addevolved (bated on MW gas beforehandof add)
3 runt; pH, mean, stdev,covar, conductivity;pH>4.3andcond<10mlcroSiemens/mm
3 runs; pH, mean, stdev,covar, conductMty; .pH>4.3 and cond < 10mlcroSlemens/mm
Percent corrosivity•dfusted to 40C, 8 ohm
DIN 53433 Traveing ISO/DIS 11907 Part 3 Plastics • Smoke Generation - Material from SllcatubeTube Furnace(dynamic method)
Cone Calorimeter(dynamic method)
Determination of the CorrosMty cable, tpgr > 0.4of Fire Effluents, Part3.: g/ce 400mm X15Dynamic Method
ISO/DIS 11907 Part 4, Standard Test Method forASTM 05485 Determining the Corrosive
Effect of Combustion ProductsUsing the Cone Con-oslmeter
NIBS Smoke Chamber ASTM E5.21.70 N8S(static method)
mmx2mmIntact cable or 1/4a
plaques 100mmsquare, endssealed, ALwrapped, in frameIntact cable orStandard Test Method for
Measuring the Corrosivt Effects plaques 50 mmof Smoke from Burning or square, < 25 mmThermal Decomposition of thick, A] wrapped InMaterials and Products frame
Ut terpolycarbonatechamber, 105Cheated SStransfer tubingNBS RadartHeat Chamber,200 iter volume,combustion eelchamber andchimney
conical heater,variable fluxfrom 10-100kW/m2
Combustion eelwith load eel 4quartx IR lampsat 2000W and240V, flux 50kW/m2, sparkIgniter
600C, motorized drivepass ftjmace oversample, 20 mln duration
Initial mass lossdetermination, lest lo70% of total mass tots,expos* probe to tmokefor 60 mln15 minutes
air at 100*5 Ifh CNET PWB watercoded at 100during exposure
ambient air,samplng rate of4.5 IMn
Rohrbae Cotawo4S.0OOA
60S RH humidlfl*d Rohrbac Coatcoair In chamber CK5 corroslmeter
45.000Aandmeasuring bridge
IntJalion resistance 1.3 % change In reslsMy.and 24 hrt alter exposure RCHTat23C75»5%RH
Measure resistance after Report catorimetry data60 mln exposure and after for matt lost and24 hr exposure to 23C, corrosion runs,75*5% RH calculated metal loss (1
hr and 24 hrt)Close shutter alter 15 mln Plot metal lost for totalheating ends, measure exposure time and afterchange in resistance for 24 hours, report15 mln Intervals for 1 hr, ealorimetry data; metalremove and expose to lost A • (RrRe)S/1000 S23C and 75*5% RH for Is probe span from mfgr24 hrs and remeature IR

does the French CNET test. Both ASTM standards suggest using the 2500-A and the 45,000-Athick probes, however; Rohrback produces these in different ways. The "thick" and "thin"probes never correlate very well; at times the thin probe will be corroded away, while the thickprobe does not show any corrosion at all.
Many workers in this field have compared the various international standards or proposedstandards.32-33-34-35'36 The most frequently compared techniques are the last four on Table 1, theCNET method developed in France, the DIN 53436 method developed in Germany, the conecalorimeter developed in the United States and the National Institute of Building Standards'smoke chamber also developed in the Unites States. Factory Mutual also has their own testingstandards and has attempted to correlate large- and small-scale testing.37
Two methods of producing smoke for small-scale fire corrosivity tests have been developed: thestatic method contains all of the air and fuel in an enclosed space, while the dynamic methodconsists of a continuous air flow that is pumped past the burning material. While the dynamicmethod ensures a more even burn, the target will not be exposed to all of the smoke. The staticmethod ensures that the target will be exposed to all of the smoke products because they arecontained, but the mode of burning is not very even.
The ASTM standard developed by the D9 committee, D5485, uses a cone corrosimeter to burnthe material and is a dynamic test.38 Air is pulled through the burning area with a fan at aprescribed rate. A small amount (0.3%) of the smoke is pulled through a bell jar that contains thecorrosion target (Rohrback probe). Gases are pulled through the jar until 70% of the material isburned up. The target remains in the bell jar for 1 hour. After this smoke exposure period, thetarget is moved to an environmentally controlled chamber (20° C, 75% relative humidity), andtested for 24 hours. One shortcoming of this test is that hydrochloric acid is one of the firstcombustion by-products to be produced. Since smoke is pulled through the bell jar until a givenamount of fuel is burned, the hydrochloric gas may not be allowed to remain in the bell jar withthe target. That is, the early release HC1 may be "flushed out" of the exposure by the continuousflow of sample gas.
The ASTM standard developed by the E5.21.70 committee uses a radiant heat furnace and anenclosed box.39 This is a static test in which all combustion products are confined to the exposurechamber. The burning material is exposed to radiant heat for 15 minutes, and all of the smoke iscaptured in a polycarbonate box that contains the target (Rohrback probe). The target remains inthe box with the smoke for a total of 1 hour. After this period, the target is moved to anenvironmentally controlled chamber (20°C, 75% relative humidity) and tested for 24 hours. Oneshortcoming of this test is that the fuel combustion process is not well controlled; the quartzlamps provide radiant heat through a clear quartz combustion chamber that may become opaquefrom soot. The advantage of this method is that all of the combustion products over the fullcourse of the burn are captured.
Material smoke corrosivity measurements are also made by measuring the acidity of gasesproduced by the fire.40 The DIN test 57 472 Part 813 Standard is one such test. In this test, onegram of material is burned in a quartz combustion chamber using radiant heat lamps. Acontinuous bottled air flow is maintained during the combustion and the gaseous burn products
B-10 NUREG/CR-6476

are percolated through distilled water. The pH and conductivity of the distilled water aremeasured with electrode probes. Changes in PH are correlated to the acidity of the combustionproducts.
General Reliability Testing
Reliability testing for electronics has proceeded along a different path than that for smokecorrosivity. Reliability testing has been performed on actual electronic parts such as connectors,printed circuit boards, and chips, rather than metal blanks and resistive traces. The emphasis inreliability testing has been on both metal loss and circuit bridging in both individual componentsand assemblies. Although smoke corrosivity can be considered a subset of reliability testing ingeneral, the differences in approach of the two test communities are remarkable.
Accelerated Corrosion Testing
In "accelerated testing" the environments in which the components are tested are more harsh thannormal operating environments because the tester wants to accelerate the failure rate. Highertemperature and relative humidity are the bases for most accelerated testing. For example, testson printed circuit board reliability are conducted at 85°C and 85% relative humidity.41 Highlyaccelerated stress tests (HAST) require high pressures, while the temperature and relativehumidity are maintained at 140°C and 85% relative humidity.42
Ionic contaminants increase the corrosion of electronic components.9 The ionic contaminants canbe added in the form of a mixed gas or salt spray, and these are usually accompanied by elevatedtemperature and humidity.43 Bottled gases such as hydrogen sulfide or chlorine are added intothe test chamber to increase the corrosion rates. Nueberger44 developed a detector to measure theHC1 distribution in the test chamber. The synergistic effect of humidity and ionic gases hasbeen found to be very important in determining the corrosion rate. Sometimes a "critical"humidity, in the neighborhood of 60-70%, is defined to identify the onset of much fastercorrosion.
In general, the failure rate of electronics is dependent on the accumulation and type of deposition,relative humidity, temperature, packaging, connector design, and bias voltage. In smokecorrosion, the deposition rate of the contaminant is much higher than that experienced undernormal circumstances. The deposition occurring during a fire in a communications center in LosAngeles, for example, was found to be equivalent to 9 years of deposition under normalcircumstances.9 The bias voltage influences the corrosion process by encouraging dendriticgrowth of conductors; therefore, it is important to apply typical voltages when testing forreliability.
NUREG/CR-6476 B-ll

Special Testing Chips
Most digital electronic devices have high reliability, but fail rapidly and without warning.Emerson has developed "assembly" test chips that are more susceptible to environmentalproblems and will start to fail earlier and more gradually than production chips.37 These chipscan be used to indicate corrosion in accelerated tests and for tests of printed circuit boardassembly lines. They can also be used for highly critical applications to monitor the amount ofdegradation of an electronic assembly. The assembly test chip may be used to indicate predictedfailure rates for critical digital assemblies. This represents a potentially promising approach tonuclear plant applications as these chips might be used in actual components and might provideearly warning of impeding failures.
Surface Insulation Resistance
Surface insulation resistance (SIR) is a measurement of the resistance between two parallelcircuit traces. In practice SIR can be measured using a board with two interlaced electrodes thatform a comb. The resistance between the combs gives a measure of the amount of conductivematerial that is deposited on top of the comb. These measurements have been used to ascertainthe quality of soldering on printed circuit boards. The combs may also be used to indicate circuitbridging effects as a result of surface contamination or dendritic growths between combmaterials. The boards can also be used to assess the effectiveness of various coatings to preventsuch failures.
Summary
Very little information on the reliability of electronics has been gathered from accidental fires.Most damage information from actual fires is anecdotal and not well documented. In a real fire,no one stops to make careful measurements of the soot deposition or perform a chemical analysisof the soot; instead, the immediate job is to put out the fire and clean up the equipment so it canbe salvaged. More information has been found from the study of controlled fires, but few tests ofthe reliability of electronics in a controlled fire have been performed. The emphasis has insteadbeen on the relative corrosivity of the smoke produced by burning different materials.
Studies of corrosion on electronic equipment are more advanced than tests of the reliability ofequipment in a smoky environment. Reliability tests generally use mixed gases, hightemperatures, and humidity and hence are easier to reproduce than a consistent smokeenvironment. The main problem that must be resolved is determining how to relate the corrosiveatmosphere to a smoke environment, and then, how to relate a simulated smoke environment to areal fire. It is also important that smoke testing be expanded to include the use of more variedtargets in order to assess each of the potential failure mechanisms. To date, smoke exposuretesting has focused primarily on direct corrosive attack. Relatively little work on circuit bridgingfaults has been undertaken.
B-12 NUREG/CR-6476

References
Private conversation with D. Karydas, Factory Mutual Research Corporation, Norwood,MA, March 2, 1995.
Science Applications International Corporation, Fire Events Database for U.S. NuclearPower Plants, NSAC/178L, Revision 1. EPRI licensed material, January 1993.
W. T. Wheelis, "Users' Guide for a Personal-Computer-Based Nuclear Power Plant FireData Base," NUREG/CR-4586, SAND86-0300, August 1986.
"Hinsdale Central Office Fire," Joint Report of Office of the State Fire Marshall andIllinois Commerce Commission Staff, March 1989.
A. Tewarson, "Nonthermal Damage Associated with Wire and Cable Fires," Presentationat the 42nd International Wire and Cable Symposium, St. Louis, MO, Nov. 15-18, 1993.
B. Reagor, "Smoke Corrosivity: Generation, Impact, Detection, and Protection," FireSciences Vol. 10, pp. 169-179, Mar/Apr 1992.
D. M. Karydas, "Smoke Management Systems for the Telecommunications Industry,"Network Reliability: A Report to the Nation, Compendium of Technical Papers Presentedby the Federal Communications Commission's Network Reliability Council, NationalEngineering Consortium, Chicago, IL, pp. G15-18, June 1993
R. B. Comizzoli and J. D. Sinclair, Electronic Components and Assemblies: Reliabilityand Testing, AT&T bell Laboratories, Murray Hill, Encyclopedia of Applied Physics Vol.6. pp. 21-44.
J.D. Sinclair, "Corrosion of Electronics: The Role of Ionic Substances," Electrochem.Soc, Vol. 135, No. 3 pp. 89c-95c, 1988.
R. B. Comizzoli, R. P. Frankenthal, R. E. Lobnig, G. A. Peins, L. A. Psota-Kelty, D. J.Siconolfi and J. D. Sinclair, "Corrosion of Electronic Materials and Devices bySubmicron Atmospheric Particles," Interface, 1993
R. B. Comizzoli, J. P. Franey, G. W. Kammlott, A. E. Miller, A. J. Muller, G. A. Peins,L. A. Psota-Kelty, J. D. Sinclair, R. C. Wetzel, and E. S. Sproles, Jr., "The KuwaitEnvironment and its Effects on Electronic Materials and Components," /. Electrochem.Soc, Vol. 139, No. 7, pp. 2058-2066, 1992.
M. M. Hirschler and G. F. Smith, "Corrosive Effects of Smoke on Metal Surfaces." FireSafety J. Vol. 15, pp. 57-93, 1989.
NUREG/CR-6476 B-13

J. A. Pownall, "Cables Designed to Give Reduced Corrosive Products Resulting fromFire on Warships," Fire Safety J. Vol. 16, No. 3, pp. 197-211,1990.
CDR Robert Meyron, Passive Fire Protection Symposium, November 4, 1984, Arlington,VA.
D. Drysdale, An Introduction to Fire Dynamics, John Wiley and Sons, New York 1975,pp. 28 and 110-111.
B. Bridger, W. F. Powers, D. W. Cooper, B. L. McClung, "Use of Reduced EmissionsWire in Switchgear Equipment," paper presented at EEEE/IAS/I &CPS Conference,Irvine, CA May 1994.
R. S. Alger, and S. J. Wiersma, "Ship Fire Characteristics: Part 1, Sealed Compartments,"Naval Surface Weapons Center, White Oak, Silverspring, MD, Nov., 10, 1976.
R. S. Alger et al, "Fire Characteristics and Fire Protection in High Performance Ships,"Final report, Naval Weapons Center, China Lake, CA, NWC Technical Memorandum3332, Nov. 1977.
"Determination of the Smoke Hazards Resulting from the Burning of ShipboardMaterials Utilized by the US Navy," Georgia Institute of Technology, Aug. 31, 1981.
J. S. Patton, "Fire and Smoke Corrosivity of Metals," David Taylor Research Center,Annapolis, MD, J Fire Sci., Vol. 9, No. 2, pp. 149-161, March/April 1991.
Private communication with Lisa O'Connor, Naval Surface Warfare Center, Annapolis,MD, October 1994.
L. P. Sptis, "Post-Halon Computer Protection," RECORD Vol. 70, No. 6, pp. 3-9,Nov./Dec. 1993.
ASTM Standard E 622-94a
"Plastics~Fire~Corrosion," SKYDD 69 (Protection 69) Proc. Int. Symp. and 15th.Nordic Fire Protection Day, Stockholm, April 23, 1969, Swedish Fire Protection Assoc,Stockholm, October 1969.
Private Communication with Lauren M. Caudill, DuPont Polymers, Wilmington, DE.
M. J. Jacobus, "Screening Tests of Representative Nuclear Power Plant ComponentsExposed to Secondary environments Created by Fires," NUREG/CR-4596, SandiaNational Laboratories, June 1986.
B-14 NUREG/CR-6476

Private communication with Robert Backstrom of Underwriters Laboratory, Northbrook,IL, March 13, 1995.
G. M. Galloway, and M. M. Hirschler, "Transport and Decay of Hydrogen Chloride: Useof a Model to Predict Hydrogen Chloride Concatenation in Fires Involving a Room-Corridor-Room Arrangement," Fire Safety J. Vol. 16, pp. 33-52, 1990.
J. J. Beitel, C. A. Bertelo, W. F. Carroll, Jr., "Hydrogen Chloride Transport and Decay ina Large Apparatus. Part 2. Variables Affecting Hydrogen Chloride Decay," J. Fire Sci.Vol. 5, No. 2, pp. 105-145, Mar/Apr 1987.
T. Chapin, "Detailed Summary of Smoke Corrosivity Test Methods," Presented atmeeting April 27, 1995 at AT&T Bell Laboratories at Murray Hill, NJ.
E. A. Powell, and B. T. Zinn, "Corrosion of Metals Exposed to Combustion ProductsGenerated During Shipboard Fires," Final Report, April 13, 1988, Naval ResearchLaboratory, Washington D.C. 9105; 47 p.
S. L. Kessel, C. E. Rogers, and J. G. Bennett, Jr., "Corrosivity Test Methods forPolymeric Materials, Part 5A Comparison of Four Test Methods," /. Fire Sci. Vol. 12,No 2, pp. 196-233, Mar/Apr 1994.
P. J. Briggs, "Corrosivity of Fire Effluents: International Development in Performance-Related Test Procedures," Recent Advances in Flame Retardancy of Polymeric Materials:Materials, Applications, Industry Developments, Markets, Business Communications Co.Inc. (BCC), Norwalk, CT, Vol. 2, pp. 121-130, May 14-16, 1991.
L. M. Caudill, "International Testing for the Corrosive Effects of Combustion Products,"Intl. Conf. on Fire Safety-Fire Retardant Technology and Marketing, March 25-28, 1990New Orleans, LA, Fire Retardant Chemicals Assoc, Lancaster, PA, pp. 223-225, 1990.
S. J. Gray son, and M. M. Hirschler, "Testing for Corrosivity of Smoke in Materials andProducts," 1st Fire and Materials International Conference, September 24-25, 1992,Arlington, VA, pp. 201-212, Interscience Communications Ltd., London, Eng., 1992.
M. M. Hirshler, "Discussion of Smoke Corrosivity Test Methods: Analysis of ExistingTests and of their Risks," Fire and Materials, Vol. 17, No. 5, 231-247, Sept/Oct 1993.
A. Tewarson, "Nonthermal Fire Damage," J. Fire Sci., Vol. 10, No. 3, pp. 188-242,May/June 1992.
J. G. Bennett, Jr., S. L. Kessel, C. E. Rogers, "Corrosivity Test Methods for PolymericMaterials. Part 4. Cone Corrosimeter Test Method," /. Fire Sci. Vol 12, No. 2, pp. 175-195, Mar/Apr 1994.
NUREG/CR-6476 B-15

S. L. Kessel, J. G. Bennett, Jr., C. E. Rogers, "Corrosivity Test Methods for PolymericMaterials. Part 1. Radiant Furnace Test Method," J. Fire Set, Vol. 12, No. 2, pp 109-133,Mar/Apr 1994.
G. C. Stevens, M. R. Dickson, M. G. Weller, "Acid Gas Emissions from ElectricalInsulation and Their Influence on Electronic Components," in IEEE Dielectric Materials,Measurements and Applications. 5th Int. Conf. IEEE Conf. Publication 289. June 27-30,1988, London, England, pp. 51-54.
D. Pauls, "IPC Cleaning and Cleanliness Test Program: Phase 3 Water Soluble FluxesPart 1," Institute for Interconnecting and Packaging Electronic Circuits (IPC), IPC 1992Fall Meeting, Published by IPC, Lincolnwood, IL, Oct 12-15, 1992.
J. A. Emerson, D. W. Peterson, and J. N. Sweet, "HAST Evaluation of Organic Liquid ICEncapsulants Using Sandia's Assembly Test Chips," IEEE Proceedings of 42ndElectronic Components & Technology Conference, 1992, pp. 951-956.
W. H. Abbott, "Comparison of Electronic Components Degradation in Field andLaboratory Environments," Materials Performance, Vol. 30, No. 6, pp. 55-58, 1991.
G. G. Neuburger, "Detection of Ambient Hydrogen Chloride with Zinc-CoatedPiezoelectric Crystal Resonator Operating in a Frequency-Time Differential Mode,"Anal. Chem, Vol. 61, p. 1559, 1989.
B-16 NUREG/CR-6476

Appendix CPreliminary Tests of the Impact of Smoke on Digital I&C Equipment
Prepared by:
Tina J. Tanaka
Sandia National Laboratories
W6051
August 31,1995
Abstract
This report presents the results of three preliminary smoke exposure tests on active digitalequipment. The smoke from three different types of cable was used to generate the testenvironments. These tests show that intermittent failures of digital equipment can occur withinminutes of exposure to smoke. These failures are most likely caused by bridging of circuits bysoot. Although loss of metal due to corrosion is highly correlated to the failures exhibited inthese tests, it is not a likely short-term failure mode. Measurements such as temperature,humidity, soot deposition, and chemical analysis of the soot and gases are also presented;however, these measurements do not correlate well to the failures that occurred.
NUREG/CR-6476 C-l

Introduction
Objective
Sandia National Laboratories (SNL) has been tasked by the USNRC to investigate the impact ofsmoke on the performance and reliability of digital instrumentation and control (I&C) equipmentwhich may be used in nuclear power plants. Studies on the failure of digital equipment in asmoke atmosphere are rare, at least in part because smoke environments are not easy to quantifyand reproduce. Standardized tests have been developed by professional groups such as theAmerican Society for Testing and Materials (ASTM) and the National Institute of Standards andTechnology. However, at most, these tests have been developed to measure the relativecorrosivity of the smoke from various materials or to characterize the smoke output of materials.These tests do not directly address the problems of electrical equipment operation which is thesubject of this effort. Because of the lack of a standard test method, SNL has adopted anapproach to testing that includes features from standardized smoke corrosivity tests that arecurrently being developed by the American Society for Testing and Materials. This reportprovides a description of preliminary experiments performed by SNL. The objective of thesepreliminary smoke exposure tests was to explore and demonstrate a procedure for investigatingthe impact of smoke on digital I&C equipment.
Scope
Three multiplexer units were exposed to three different smoke atmospheres. One unit failed,while the other two performed without problems. This report describes the exposure method andresults of these tests. These tests were only preliminary in nature and a much broader follow-onstudy is currently underway.
Smoke Exposure method
Smoke Exposure Environment
Smoke is a known hazard for electronic equipment; however, very few tests have been performedto determine the reliability of electronic equipment in a smoke atmosphere. Smoke compositioncan vary depending upon fire characteristics such as burn temperature, oxygen availability,material burned, and whether the fire is smoldering or openly flaming. In order to producesmoke in a standard and reproducible way for the purpose of these preliminary tests, the ASTMdraft corrosivity test standard produced by the E5.21.70 Subtask group was followed. This draftstandard was based on a standard toxicity test that has been in use for many years. The primarymeasurement of this draft standard is the loss of metal from a corrosion probe as a function of thematerial burned. Although the objective of this ASTM test (relative corrosivity) is different fromour objective of testing electronic equipment reliability in a smoke environment, the methods ofsmoke production and the time of exposure to the smoke were adopted as the fundamental basisfor producing a "standard" smoke environment and exposure scenario.
The fuel was burned using radiant heat from a tungsten-quartz lamp aided by spark ignitioninside a cylindrical quartz combustion chamber. The smoke production and exposure equipmentis illustrated in Figure 1. The radiant heat lamps are adjusted so that a fixed heat flux level of 50
C-2 NUREG/CR-6476

kW/m2 is produced at the fuel surface. The heat flux was measured with a Schmidt-Boelter(thermopile) heat flux meter before each test to determine the amount of heat that is incident onthe fuel at the beginning of the test. Small variations in the positions of the lamps can affect theheat flux that is incident on the sample. As smoke is produced, the quartz chamber becomescoated with some soot and so the heat flux is reduced. No attempts were made to compensate forthis effect.
Nowlen1 reported on the types of fires that take place at nuclear power plants and their typicalfuel load, where the fuel load is defined as the ratio of the weight of fuel consumed to volume ofair. The highest fuel load occurs in cabinet fires because of the limited volume of air in, thecabinet. Of course, if the fire is very large it will burn up all of the equipment in the cabinet, butfor a moderate fire, the equipment may survive the heat and flames but not the smoke. For thesepreliminary smoke exposures, the fuel load was selected to simulate this high fuel load condition.A fuel load between 26 g/m3 and 560 g/m3 corresponds to a small cabinet fire; therefore, a fuelload of 75 g/m3 was chosen for these tests.
The volume of the exposure chamber was 0.2 m3, so 75g/m3 requires 15 g of burnable fuel. Sincethe most abundant fuel in a nuclear power plant is cable insulation and jacketing material, cableswere used to produce the smoke. The amount of cable material burned was determined bystripping the insulation material from a sample cable piece and weighing the fraction of the totalcable weight that is made up of insulation. Typically, the insulation and jacketing materialscomprised 50 to 75% of the total mass of the cable. Lengths of cable which corresponded to 15 gof insulation were loaded into the combustion cell on aluminum trays. The loaded trays wereweighed before and after the burn.
We expect that the type of fuel determines how destructive the smoke will be. In a power plantthere are several different types of cables used for instrumentation, power and control. Inaddition, there are cables with insulation types that are no longer used for new applications, suchas as polyethylene and poly vinyl chloride (PVC), but which remain in place at the plants. Forthese smoke exposures, three types of cable were burned, one type in each test. Test 1 usedBrand Rex cable made with cross-linked polyethylene (XLPE) insulation with a chlorosulfonatedpolyethylene (CSPE) jacket. Brand Rex cable is the third most utilized cable supplier for nuclearpower containment.2 Test 2 used Anaconda Flameguard cable made with ethylene propylenerubber (EPR) insulation and CSPE jacket. This is the most common combination of materialsused for insulation in containment.2 Test 3 used a Belden, non-nuclear qualified PVC jacketedand insulated cable. Although PVC cables are no longer widely used in nuclear powerapplications, they are still present in power plants and represent one of the most corrosive ofcable insulation materials. The weights of the fuel loaded in the trays are presented in Table 1.
Table 1. Table of Cable Materials used in Smoke Exposures
Test
1
2
3
Cable
XLPE/CSPE
EPR/CSPE
PVC/PVC
Weight/in
4.93 g/in
6.07g/in
6.41 g/in
% plastic
54.6
76.0
57.4
Sampleweight
27.54g
20.25g
26.42g
Plastic weight
15.04g
15.4g
15.17g
NUREG/CR-6476 C-3

As the radiant heat lamps were turned on and the fuel heated, hot gases and smoke rose up the30-cm long stainless steel chimney to the Lexan exposure chamber. The lamps exposed the fuelmaterial for 15 minutes as specified in the ASTM draft standard. During the entire 15-minuteperiod, a sparker, located 2.5 cm above the fuel, continuously sparked to provide an ignitionsource for hot gases produced by the radiant heat lamps. After the 15-minute period, the lampswere shut off, the chimney damper was closed, and a small mixed the smoke vapors. Since thiswas a static smoke exposure, the smoke was not allowed to leave the exposure chamber for thefirst hour of the test. The smoke chamber was sealed as well as possible to prevent smoke leaks.To allow for the expansion of air and smoke vapors due to the initial heating and subsequentcooling of the contained air volume, an empty plastic bag was placed over one of the ports. Aftera total of one hour from the beginning of the test, the smoke was vented.
After the smoke exposure, the ASTM draft standard recommends that the target material (thecorrosion probe in the case of the standard) be placed in a controlled environment at 75%humidity and 23°C for a 24-hour period after which the target is retested. This step simulates theenvironment of a water suppressed fire. This would normally take place in an environmentalchamber; however, our environmental chamber was not completed at the time of these tests.Hence, a variety of interim methods were attempted to control humidity with differing levels ofsuccess.
In Test 1 we did not add any humidity for the first 24 hours so that the equipment remained at thenormal humidity for Albuquerque in the winter, below 20% relative humidity (RH). Since thedraft standard recommends holding the RH at 75%, we attempted to do this after the preliminary24 hours by setting a beaker of hot water in the exposure chamber. However, this added toomuch humidity. The test unit was left in the humid environment for three days. In Test 2 weadded humidity right after venting the smoke, using a portable hot steam humidifier. Thehumidity was adjusted by opening doors and running fans, but there was no control over thehumidity overnight. In Test 3 we added humidity right after venting the smoke. This humiditywas added using a portable hot steam humidifier, but it in a more controlled way than for Tests 1or 2.
According to the draft standard, the RH of the sample should be maintained at 60% prior to thetest. The humidity inside of the box was measured before the lamps were turned on, but thehumidity sensor was removed after the initial reading to prevent damage to the sensor. Thehumidity sensor was reintroduced to the smoke exposure chamber after the chamber was vented.Due to the nature of the ambient environment prevailing at the time of the tests, a 60% RH wasnot achieved in these tests.
Smoke Environment Measurements
The measurement of metal loss, while important in determining the relative corrosivity of thesmoke, is not the only parameter of interest in the smoke environment. Other standardmeasurements of smoke, such as optical density, rate of fuel combustion, and time of ignitionand extinguishment, have been specified by the ASTM. We attempted to characterize the smoke
C-4 NUREG/CR-6476

environment by making these measurements, along with others such as temperature, smokedeposition, and chemical analyses of gases and soot.
Corrosion Probe
The metal loss measurement is made with Rohrback/Cosasco probes that measure metal loss viachanges in resistance of a copper trace deposited on a printed circuit board. In the SNL testsresistance was monitored with a high precision LCR (inductance, capacitance and resistance)meter. The probe contains two copper traces of the same thickness and width: an uncoated tracethat is allowed to corrode and a reference epoxy-coated trace. The purpose of the two traces is toseparate the changes in resistance due to metal loss from changes due to temperature fluctuations.Since the original intent of these probes was to measure atmospheric corrosion, the copperprobes normally sold by Rohrback/Cosasco (250 nm thick) are too sensitive (thin) and werefound to corrode away too quickly. The ASTM draft standard suggests using a thicker probe(4500 nm) for greater longevity. The process used to deposit the copper traces on the thickerprobes differs from that used on the thin probes. For these tests both probe thicknesses wereused. Since changes in these measurements were expected to occur relatively slowly, themeasurements were made at one minute intervals during the first hour of the test, and at 10-minute intervals during the rest of the test.
Load Cell
A commercial load cell (Single Point I, Interface Inc.) measured the loss of mass of the fuel as itburned. The load cell was mounted under the quartz combustion cell as shown in Figure 1. Thefuel tray was mounted to the load cell through a hole in the combustion cell. The load cellconverts force by means of a strain gage into voltage and can measure weights up to threepounds. Load cell output was recorded at five second intervals during the first 15-minute periodto determine how quickly the fuel was consumed. This measurement is included in the ASTMdraft standard.
Thermocouples
Temperature measurements were made throughout the test, in seven locations in the smokeexposure chamber. Five Chromel-Alumel (type K) thermocouples housed in stainless steelsheaths penetrated the walls and floors of the smoke chamber, (Figure 1). Two non-sheathedtype K thermocouples were welded to the surface of the quartz crystal microbalance cases (seediscussion in Section 0.) Although the temperature of the chamber was not controlled,temperatures were measured to determine if any failures could have resulted from heat ratherthan smoke. Temperatures were logged at five-second intervals while the lamps were on and atone-minute intervals for the remaining time that the smoke was in the chamber. After the smokeexposure chamber was vented, the temperatures were logged at 10-minute intervals.
NUREG/CR-6476 C-5

Turbidimeter
A turbidimeter measures the optical density of smoke by passing light through the smoke anddetermining the loss of light intensity. Light from a high intensity bulb (white light) is focusedwith a lens and then passed through a glass slide into the smoke exposure area. After crossing a3.2 cm-section of the smoke chamber, the light passes through a second glass slide and intoanother lens. The purpose of the glass slides is to keep smoke from fouling the opticalcomponents of the turbidimeter. Beyond the second lens, a combination of prisms and filtersdivide the light into three colors: red, blue, and infra-red. The optical throughput of each color isthen converted by photodiodes into an electrical signal. The voltage from the photodiodes wasrecorded at five-second intervals while the radiant lamps were on, 1-minute intervals for the restof the first hour, and at 10-minute intervals after the smoke was vented.
The glass slides collected a coating of soot which should not be included in the smoke densitymeasurements since the measurement should only include the smoke that is suspended in the air.The optical density of the smoke can be estimated from the difference in the turbidimeter outputbefore and after the smoke is vented.
Gas analysis
Gases for the analysis of the smoke were captured in two ways. A vacuum grab system captureda 10 ml filtered sample of gas in a stainless steel bottle. For fuel samples that ignited (flamingrather than smoldering), the gas sample was taken within a minute of the flame extinguishment.If there were no flames, a grab sample was taken after the quartz lamps were turned off (15minutes into the test). The samples were analyzed by a Tracor gas chromatograph. Thesemeasurements provided the percentage of methane, carbon monoxide, nitrogen, carbon dioxideand oxygen present in the sample. The amount of heat releasedwas estimated from the amountof carbon dioxide and carbon monoxide in the air, or the amount of oxygen remaining in the air.
Samples of acids contained in the smoke were collected in a silica-gel-filled sorption tube. Asampling pump pulled 20 ml per minute of smoke through the sorption tube during the entireburn time (15 minutes). Analysis of the tube contents provided information on the relativeamount of chlorine present in the chamber. The materials that remained in the sorption tubeswere analyzed using ion chromatography following the procedure contained in NIOSH 7903.
Soot Deposition Measurement
Quartz crystal microbalances (QCMs) measured the mass deposition of the smoke as a functionof time. The purpose of this measurement was to determine the amount of soot deposited onelectronic equipment. Quartz is a piezoelectric material that undergoes shear deformation whensubjected to an electrical field. Conversely, if it is strained, it will generate an electrical field.The QCM consists of a quartz crystal with electrodes to connect it to an electrical oscillator thatis tuned to the fundamental frequency of oscillation of the crystal. When material such as soot isdeposited on the surface of the crystal, the oscillation frequency decreases. The change infrequency can be related to the additional mass on the quartz crystal. The frequency of
C-6 NUREG/CR-6476

oscillation is also dependent on the temperature of the crystal, so thermocouples were attached tothe QCM case to determine the temperature around the crystal (as noted in Section 0 above).
Two QCMs were used to measure the deposition, one in a horizontal face-up orientation and onein a vertical orientation. The oscillation frequency was recorded at intervals of five secondswhile the heat lamps were on, and at one-minute intervals for the remaining first hour. After thesmoke was vented, the frequency was recorded at 10-minute intervals.
Soot Analysis
Ashless filter papers were used as a substrate to collect soot samples for chemical analysis. Twofilters were placed at the bottom of the smoke exposure chamber for each test to gather samplesof soot. These samples were submitted for chlorine analysis by ion chromatography and fortrace metals analysis by plasma-excited atomic emission spectroscopy (IPC). Ashless filters areused because the analysis involves burning up the filter paper. Soot samples were also scrapedfrom a stainless steel sheet placed on the bottom of the smoke exposure chamber. The soot wasanalyzed for total organic carbon.
Digital Equipment Description
The first component smoke tests at SNL have evaluated the affect of smoke deposited on theAnalog Devices® modules and backplanes. These components were selected by Oak RidgeNational Laboratory for testing because they incorporated operations needed for a reactor tripsystem in a commercially available product.
Hardware
Analog Devices sells a series of plastic encased modules that can perform different functions:measure voltage, measure thermocouple or resistive temperature device (RTD) output, and thenoutput current or voltage. All of these modules plug into a printed-circuit type board called abackplane. The backplanes are powered with a 5 volt DC power supply. For these tests webought a 6BP04-2 backplane that can support up to four modules at one time. The backplane hasports for an RS232 communication and an RS485 connection. The communication ports allowthe backplane to send and receive information from a computer to the various modules usingASCII characters.
The modules are sold with a computer program that can configure and calibrate the modules.Configuring the module includes determining the address of the module, the mode of function ofthe module, and defining which port of the computer the module is located. The program canalso be used in conjunction with other calibrated equipment to calibrate the modules.
The Analog Output Module, model 6B21, can output a current between 0-20 mA or between 4-20 mA. We configured it to output 0-20 mA. The module was set to use engineering units forthe output which means that the units are in milliamps (as opposed to a percent of span or ahexadecimal output.) When assembled the module produced a current through a load resistor
NUREG/CR-6476 C-7

attached to the adjoining terminal strip on the backplane. The address of the output module wasconfigured to be 02.
To act as test equipment, three 6B12 input modules were configured to measure between -20 to+20 mA. The input modules were also configured to present the data in engineering units(milliamps.) Since the module actually reads voltage rather than current, a precision load fromAnalog Devices was placed across the terminal strip to act as the load for the output module. Theinput modules were configured to be at address 01.
In order to allow the physical separation of the input and output modules needed for this test, twoseparate backplanes were used, each requiring its own serial port. We used a Hauppage 386personal computer with an additional 10 board to provide the serial ports (RS232). Thus theinput module was plugged into a backplane connected to the RS232 port called C0M1 and theoutput module was plugged into a separate backplane that was connected to the RS 232 portCOM2. The mode of communications was 9600 baud, eight data bits, no parity, and one stopbit.
A diagram of the hardware wiring is shown in Figure 2. The current from the output module wasdetermined by measuring the voltage (using the input module) across a precision resistor. Theinput module was placed inside of the smoke chamber and the output module was placed outsideof the smoke chamber. During the smoke exposure the input module measurements werecompared to the output module readings. Ideally the measurements should match exactly.
Software
The software for assessing the performance of the test modules was developed by Kofi Korsah atOak Ridge National Laboratory in the form of a Turbo Basic program,. It has several menuitems to test the modules singly or to test the system as wired above. There are also options toprint out the data files to the screen or to a printer.
For the system test, the computer directs the output module to feed a known current to the inputmodule. The computer reads the actual output module current and reads the input modulemeasurements at one-second intervals. The computer then changes the output current andrepeats the readings. The current output starts at 0 and is incremented by +0.1 mA steps up to 20mA. After the current output reaches 20 mA, the data from the previous 1400 readings arerecorded in a data file. The process is then repeated. Because the program only stores data after1400 readings (approximately 20 minutes of data measurements), system failures can causesignificant loss of data.
Test Results
General Observations
Before each smoke exposure, the test units were assembled and tested to verify functionality.The test program, MUXTEST5 was then run continuously throughout the smoke exposure andpost-exposure periods. The results of the multiplexer board exposures are listed in Table 2. TheXLPE/CSPE cable (Brand Rex) and PVC cable (Belden) both caught fire while the EPR/CSPE
C-8 NUREG/CR-6476

cable (Anaconda Flameguard) only smoldered. In fact, the PVC cable caught fire at 1:39(min:sec), extinguished at 4:02, and reignited at about 5:00 and extinguished at approximately8:00. The XLPE/CSPE cable ignited at 3:18 into the test and extinguished at 5:18.
Table 2. General Results of Smoke Exposure
Test
1
2
3
Cable
XLPE/CSPE
EPR/CSPE
PVC/PVC
Equipment performance
No change
No change
Intermittent failures
The smoke affected the equipment by halting MUXTEST5 rather than affecting the output datavalues. Intermittent failures during Test 3 occurred three times. The first malfunction occurredat 8:40 after the start of the test, while the radiant heat lamps were on and resulted in stoppingMUXTEST5. The computer indicated an error code and returned to the disk operating system(DOS) prompt, indicating that MUXTEST5 had stopped. MUXTEST5 was restarted and thedata was normal. The next malfunction occurred at about 1:00:00 (one hour) when the chamberwas beginning to be vented. This malfunction did not stop the program, however the numbers inthe data file were unusual and the printout on the screen was shifted. At 1:20:00 humidity wasadded to the environment. The next malfunction at 1:29:00 stopped MUXTEST5 and returnedthe DOS prompt with the same error code as the first malfunction. Again, the program could berestarted and the data was normal. The first and third failures are believed to be acommunications error, but since the there was no error trapping in the program to accommodatethese problems, the true nature of the failures are unknown. MUXTEST5 stopped again aroundmidnight, but that failure was probably due to problems in accessing the timer during the changefrom one day to another.
The smoke-exposed equipment from Tests 1 and 2 both operated normally throughout and afterthe smoke exposures. Although the equipment showed some visible soiling, this did not affectthe performance of the equipment. Steel parts that were exposed to Test 3 are especiallycorroded after exposure.
To further explore failures in the equipment exposed during Test 3, the equipment wasperiodically tested for one month after the smoke exposure. The equipment continued to operatenormally until humidity was added in the form of mist from a cool water mister. The mistcondensed on the backplane and caused the backplane to short. When the backplane began toshort, MUXTEST5 stopped again and produced the same error message as at 8:40 and 1:29:00into the smoke exposure. This time, however, the equipment was permanently damaged andwould not restart.
NUREG/CR-6476 C-9
Comparison of Measured Values
Physical Measurements
Physical measurements of the smoke environment include the temperature, humidity, opticaldensity of smoke, mass deposition of soot, and loss of mass from the burning fuel. Thesequalities help to identify the environment of the smoke exposure chamber.
The temperature was measured in seven locations in the smoke enclosure. The temperatures inthe exposure chamber varied depending on the position in the chamber. The heat in the chamberwas created by two sources, the radiant heat of the lamps and the heat from burning fuel. Thehighest temperature was measured in the chimney. The second highest temperatures wererecorded at the top of the exposure chamber above the chimney. Temperatures in the middle ofthe chamber, where the test equipment was located, were very close in value to temperatures atthe top of the chamber in the corner away from the chimney. The lowest temperatures werelocated along the floor in the corner away from the chimney. These temperatures are presentedin Figure 3 for Test 1. Tests 2 and 3 had similar differences in temperature within the chamber.After the first hour, when the chamber is vented to the atmosphere, there is little variation in thetemperature from location to location.
Temperatures in the exposure chamber were increased by addition of heat from both the radiantheat lamps and the burning fuel. The heat from the burning fuel is a significant contributor to thetemperature of the chamber as shown by the Figure 4. Here both the PVC and XLPE/CSPEcables, which were openly flaming, have higher temperatures than the EPR/CSPE cables whichonly smoldered. The XLPE/CSPE cable showed an especially prominent peak at approximately0.09 hours into the test. Since the PVC cable flame extinguished and then reignited, the peak intemperature is not as evident. This peak is more prominent for temperatures measured nearer thechimney than for those located away from the chimney as shown in Figure 3. For the locationsfarther away from the chimney, the heat is more dispersed and does not have such a sharp peak intime while the fuel was flaming.
The load cell information (Figure 5) shows the change in mass of the fuel as it is consumed. Thesmoldering EPR/CSPE fire consumed less fuel than the two flaming fires. The rate of mass lossis much higher while flaming than after the flames are extinguished.
The humidity measurements in the smoke exposure chamber were only valid after the smoke wasevacuated from the exposure chamber, about one hour and 20 minutes after the start of the smokeexposure. As can be seen in Figures 6, 7 and 8, humidity was added to the smoke exposurechamber after the first 24 hours for Test 1 and after the first hour and 20 minutes for Tests 2 and3. Since one of the intermittent failures during Test 3 occurred nine minutes after the humiditywas first introduced, we can conclude that humidity was a contributor to the failure.
The optical density of the smoke includes the optical density of the deposit on the surface ofglass slides which protected the optical parts of the turbidimeter. The maximum optical densityfor all of the tests was between 0.33 and 0.40/cm2. However, the quality of smoke from Test 2was very different from those from 1 and 3. Smoke from flaming fires tend to be very blackwhile the smoke from smoldering fires is white. The soot from flaming fires is black while the
C-10 NUREG/CR-6476

soot from smoldering fires is brown. While optical density is a standard measurement endorsedby the ASTM, it did not seem to be particularly significant for these tests. Typically the smokewas the most dense after the first five minutes of the burn, and then tended to clear up as the sootsettled out of the air. Figure 9 shows a typical output from the turbidimeter.
The soot deposition varied as a function of time, and as expected, the horizontally oriented probecollected more soot than the vertical orientation as shown in Figures 10 through 12. The massdeposition measurements were not continuous because of problems with shorting of the quartzcrystal oscillator circuit during some of the tests. Because the quartz crystal oscillator frequencywill change as the temperature changes, one thermocouple was attached to the case of eachoscillator. The temperature of these thermocouples never varied as much as the thermocouplethat was suspended in the middle of the exposure chamber, although they were placed very closetogether. The temperature of the air fluctuates more rapidly than that of a stainless steel case dueto the differences in material thermal capacity; which accounts for the differences. Thetemperature for which the oscillator circuit should actually be compensated is that of the quartzcrystal itself; however, these measurements were not made. The values of deposition in Table 3were measured after the smoke exposure chamber was vented.
Table 3. QCM results
Test
1
2
3
Vertical Deposition
29 |ig/cm2
17 |Xg/cm2
17 \i?Jcm
Horizontal Deposition
42 Ug/cm2
182mg/cm2
47 jtig/cm2
The deposition in the horizontal orientation was much higher for Test 2 than for Tests 1 and 3,although the deposition in the vertical orientation was not significantly different from Test 3.The soot was also much more tacky and black in the cases of Tests 1 and 2.
Chemical Measurements
The chemical measurements of the gases and material were performed at SNL. Ionchromatography analysis of the filter paper and sorption tubes as well as the total carbon in asample of soot are included in Table 4. Analysis of metals from the filter paper is presented inTable 5. The analyses of the vacuum grab samples by gas chromatography is presented in Table6.
Table 4. Cl and C Chemical Analysis
Test
1
2
Cable
XLPE/CSPE
EPR/CSPE
Filter Paper
Total Cl (14 cm2)
0.45 mg
1.13 mg
Sorption Tube
Total Cl
0.24 mg
0.07 mg
% Carbon (wt)
13.4
37.6
NUREG/CR-6476 C-ll
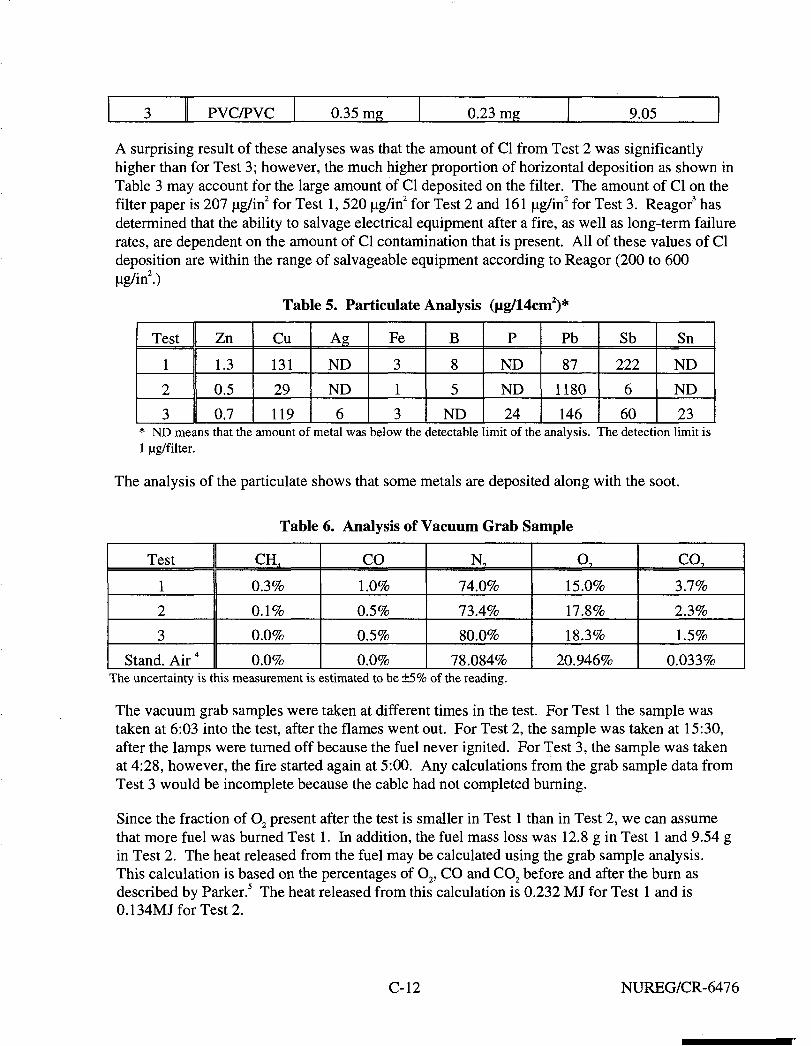
3 1 PVC/PVC 0.35 mg 0.23 mg 9.05
A surprising result of these analyses was that the amount of Cl from Test 2 was significantlyhigher than for Test 3; however, the much higher proportion of horizontal deposition as shown inTable 3 may account for the large amount of Cl deposited on the filter. The amount of Cl on thefilter paper is 207 ug/in2 for Test 1, 520 ug/in2 for Test 2 and 161 ug/in2 for Test 3. Reagor3 hasdetermined that the ability to salvage electrical equipment after a fire, as well as long-term failurerates, are dependent on the amount of Cl contamination that is present. All of these values of Cldeposition are within the range of salvageable equipment according to Reagor (200 to 600ug/in2.)
Table 5. Participate Analysis (ug/14cm2)*
Test
1
2
3
Zn
1.3
0.5
0.7
Cu
131
29
119
Ag
ND
ND
6
Fe
3
1
3
B
8
5
ND
P
ND
ND
24
Pb
87
1180
146
Sb
222
6
60
Sn
ND
ND
23* ND means that the amount of metal was below the detectable limit of the analysis. The detection limit is1 |ag/filter.
The analysis of the particulate shows that some metals are deposited along with the soot.
Table 6. Analysis of Vacuum Grab Sample
Test
1
2
3
Stand. Air4
CH,
0.3%
0.1%
0.0%
0.0%
CO
1.0%
0.5%
0.5%
0.0%
N,
74.0%
73.4%
80.0%
78.084%
o,15.0%
17.8%
18.3%
20.946%
CO,
3.7%
2.3%
1.5%
0.033%The uncertainty is this measurement is estimated to be ±5% of the reading.
The vacuum grab samples were taken at different times in the test. For Test 1 the sample wastaken at 6:03 into the test, after the flames went out. For Test 2, the sample was taken at 15:30,after the lamps were turned off because the fuel never ignited. For Test 3, the sample was takenat 4:28, however, the fire started again at 5:00. Any calculations from the grab sample data fromTest 3 would be incomplete because the cable had not completed burning.
Since the fraction of O2 present after the test is smaller in Test 1 than in Test 2, we can assumethat more fuel was burned Test 1. In addition, the fuel mass loss was 12.8 g in Test 1 and 9.54 gin Test 2. The heat released from the fuel may be calculated using the grab sample analysis.This calculation is based on the percentages of O2, CO and CO2 before and after the burn asdescribed by Parker.5 The heat released from this calculation is 0.232 MJ for Test 1 and is0.134MJforTest2.
C-12 NUREG7CR-6476

Corrosion Probe Results
Loss of metal measurement on corrosion probes may be the factor most closely related to thefailures of the test unit. Test 3 (PVC) cable was by far the most corrosive smoke and also wasthe only test to have failures. Because of the intermittent nature of these failures, however, thefailures themselves were probably not due to loss of metal, but rather to circuit bridging by soot.Perhaps the increased corrosivity of the smoke (which produces more metal loss) also encouragescircuit bridging. Figures 13 through 15 show the loss of metal for the corrosion probes for Tests1, 2 and 3. The effect of adding humidity to the environment severely affected the corrosivityprobes: for both Test 1 and 3 the change in rate of metal loss for the thin probes is significantafter the humidity was raised.
There is very little correlation between the loss of metal for the thick and thin probes. Theprocesses for depositing the copper is different for the two types of probes so the structure of thecopper on the probes may be different. In general it was found that the thick probes are tooinsensitive and the thin probes are too sensitive for our purposes. A probe thickness that is inbetween 250 and 4500nm would be better for corrosivity testing.
Conclusions
Our tests show that smoke can cause failures in digital electrical equipment during the first 24hours. These failures may be intermittent. These failures may be caused by intermittent shortsfrom soot that bridges conductors in circuits. One explanation as to why the shorts observed inthese tests were intermittent is that when the short occurs, the current flow will cause the soot onthe current track to be burned off or to move. The equipment could then be restarted because thecurrent path for the short circuit would no longer exist. Corrosion also occurs, but it takes muchlonger to cause failures. We conclude that the failures observed were in fact caused by circuitbridging faults.
Humidity is a significant factor in producing failures. Humidity may add to the conductivity ofthe soot as well as increasing the metal loss of conductors. Unfortunately, the humidity in asmoke environment is difficult to measure since the smoke will damage the sensor and canproduce erroneous readings. Humidity control is important for standardizing any smokeexposure tests. Future SNL tests are to be performed under closely controlled humidityconditions.
When the physical and chemical measurements taken during these tests are compared, few showsignificant differences between those exposures that resulted in equipment failure and those thatdid not. The loss-of-metal measurement was the strongest indicator of failure for the digitalequipment although the suspected failure mode was not loss of metal (corrosion). A bettermeasurement would be to test directly for circuit bridging. One such test would be to measurethe insulation resistance loss between conductor traces as smoke is deposited. As insulationresistance is lost, the likelihood of shorting will increase. Such tests are planned as a part offollow-up efforts.
Needed improvements in testing software were identified in these tests. The testing softwareshould be robust enough to recover from intermittent failures. In these tests intermittent failures
NUREG/CR-6476 C-13

caused the testing software to stop which resulted in losing data from the computer andinterrupting the testing process routine. Determination of the time of failure could only beestimated based on when the operator noticed that the program had failed. The software alsoshould include error trapping features which would allow errors to be detected and recorded, andyet not cause the program to stop because of the smoke-induced equipment malfunctions. It wasfound that the computer timer is reset at midnight, and since MUXTEST5 accesses the timer, theprogram always failed at midnight.
In summary, the preliminary smoke exposure tests reported here show that intermittent failuresof digital equipment may occur within minutes of exposure to smoke. These failures are mostlikely caused by bridging of circuits by soot. Although loss of metal due to corrosion is highlycorrelated to the failures exhibited in these test, it is not a likely failure mode in such a shortperiod of time.
References
1 Nowlen, S. P. Letter report on "Defining Credible Smoke Scenarios" dated September 30,1994.
2 Bustard, L. and Holzman, P. "Low-Voltage Environmentally Qualified Cable LicenseRenewal Industry Report; Revision 1", TR-103841, Published by Electric Power ResearchInstitute, July 1994.
3 Reagor, B.T., "Smoke Corrosivity: Generation, Impact, Detection, and Protection", J. Of FireSciences, Vol. 10, March/April 1992.
4 Weast, R.C., CRC Handbook of Chemistry and Physics, 69th Edition, p. F-155, 1988-1989.5 Parker, W. J. "Calculations of the Heat Release Rate by Oxygen Consumption for Various
Applications," NBSIR 81-2427-1, March 1982.
C-14 NUREG/CR-6476

Appendix D
Letter Report to the USNRC
Smoke Exposure Conditions for Experimental DigitalTrip System
Prepared by
Tina J. TanakaSandia National Laboratories
February 22,1996
Revised July 26,1996
NUREG/CR-6476 D-l
Smoke Exposure Conditions for Experimental Digital TripSystem
AbstractIn collaboration with Oak Ridge National Laboratory (ORNL), Sandia NationalLaboratories (SNL) performed a series of tests exposing an experimental digital safetysystem to smoke to determine the reliability of such a digital system in fires in nuclearpower plants. ORNL built the experimental digital trip system to serve as a representativesafety trip channel in environmental tests. Eight smoke exposures and a high temperaturetest were performed, as well as a test with CO2. The smoke environments were specifiedby the amount and type of fuel burned, the burn temperature, and the humidity level ofthe environment after the burn. This report documents the physical and chemicalmeasurements of the environment to which the digital safety system was exposed.
D-2 NUREG/CR-6476

AcknowledgmentsI would like to acknowledge the help of Kofi Korsah, Brian Swail, and Richard Woodfrom Oak Ridge National Laboratory in providing a test unit, assisting in the exposures,and documenting the test. They are to be especially commended for the excellent cleanupof the smoke exposure unit. I would also like to thank D. Michael Ramirez for hisparticipation in the tests, in both setting up the equipment, helping to run the tests, andbeing in charge of the cleanup after every test. This work has been sponsored by theUSNRC under the technical monitoring of Christina Antonescu.
NUREG/CR-6476 D-3

Table of Contents
Introduction 5
Project Objectives 5Scope of Study 5
Experimental Setup and Procedure 6
Test Equipment 6Smoke Production 7Exposure of Electronic Equipment 11Smoke Environment Measurements 13
Temperature 14Fuel Mass Loss 15Smoke Opacity 15Gas Analysis 16Soot Deposition 17Soot Analysis 17
Test Schedule 17
Results of ORNL Exposures 20
Testl 20Test 2 24Test 3 28Test 4 32Test 5 37Test 6 41Test 7 45Test 8 49
Conclusions 54
References 55
D-4 NUREG/CR-6476
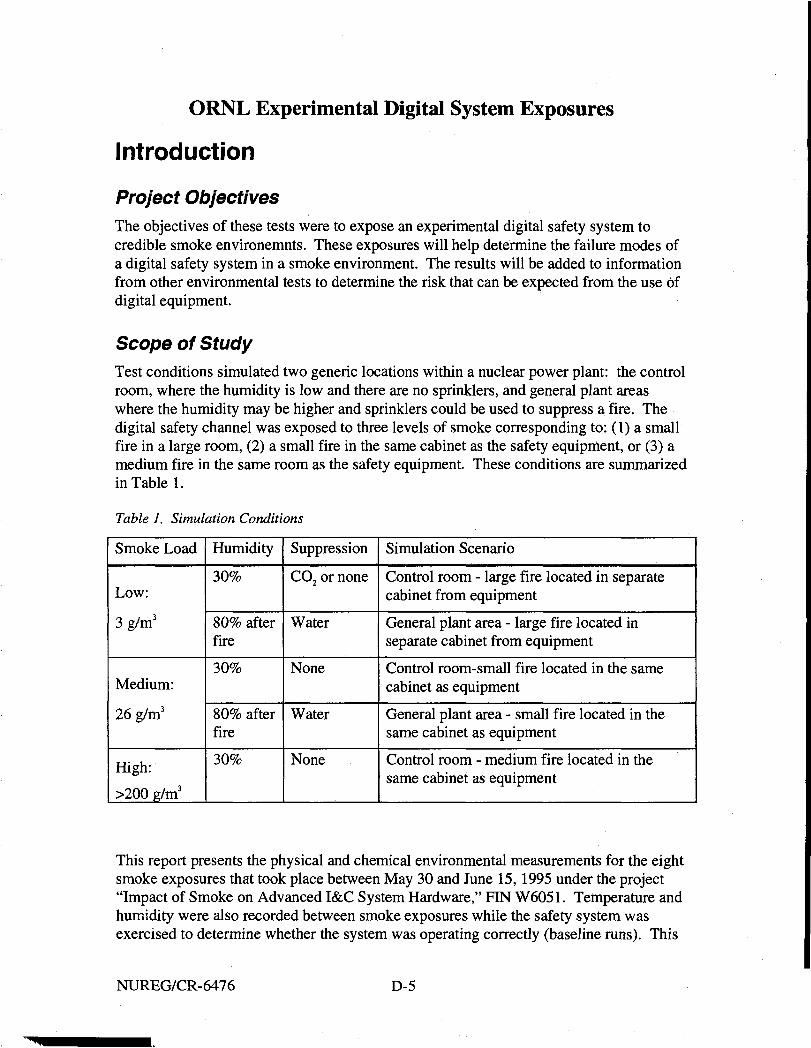
ORNL Experimental Digital System Exposures
Introduction
Project ObjectivesThe objectives of these tests were to expose an experimental digital safety system tocredible smoke environemnts. These exposures will help determine the failure modes ofa digital safety system in a smoke environment. The results will be added to informationfrom other environmental tests to determine the risk that can be expected from the use ofdigital equipment.
Scope of StudyTest conditions simulated two generic locations within a nuclear power plant: the controlroom, where the humidity is low and there are no sprinklers, and general plant areaswhere the humidity may be higher and sprinklers could be used to suppress a fire. Thedigital safety channel was exposed to three levels of smoke corresponding to: (1) a smallfire in a large room, (2) a small fire in the same cabinet as the safety equipment, or (3) amedium fire in the same room as the safety equipment. These conditions are summarizedin Table 1.
Table 1. Simulation Conditions
Smoke Load
Low:
3g/m3
Medium:
26 g/m3
High:
>200 g/m3
Humidity
30%
80% afterfire
30%
80% afterfire
30%
Suppression
CO2 or none
Water
None
Water
None
Simulation Scenario
Control room - large fire located in separatecabinet from equipment
General plant area - large fire located inseparate cabinet from equipment
Control room-small fire located in the samecabinet as equipment
General plant area - small fire located in thesame cabinet as equipment
Control room - medium fire located in thesame cabinet as equipment
This report presents the physical and chemical environmental measurements for the eightsmoke exposures that took place between May 30 and June 15,1995 under the project"Impact of Smoke on Advanced I&C System Hardware," FIN W6051. Temperature andhumidity were also recorded between smoke exposures while the safety system wasexercised to determine whether the system was operating correctly (baseline runs). This
NUREG/CR-6476 D-5

report only contains information on the smoke conditions, such as temperature, amount offuel burned, smoke deposition and chemical analysis. Information on the errors of theexperimental digital system is included in NUREG/CR 6406 [Korsah et al., to bepublished].
Experimental Setup and ProcedureThis section describes the test equipment, smoke exposure method, measurements, andschedule. The tests were based on the ASTM E05.21.70 draft standard on corrosivity[Kessel, et al., 1994], but we enlarged the smoke exposure volume, and added other typesof measurements. The enlarged volume accommodated rack-mounted equipment. Inorder to produce enough smoke for the larger volume, four combustion cells were usedinstead of one. Measurements besides those used on the corrosivity draft standard wereadded so that the environment could be more fully characterized. These additionalmeasurements included chemical analysis of soot and gases, smoke optical density, massdeposition rates, and temperature.
Test EquipmentThe experimental digital trip system tested consisted of three main components: themultiplexer and its computer (PRS/MUX), the digital trip computer (DTC), and the fiberoptic modules (FOMs). These components were individually exposed to smoke;however, in order to determine the condition of the exposed component, they all neededto operate and communicate with one another during the smoke exposure.Communications between these components were monitored by a separate host computerthat was never exposed to smoke.
It is known from previous smoke exposures that in digital equipment communicationerrors may result in intermittent failures rather than permanent failures (Appendix 3).The software for this system was designed to wait for the correct response for a specifiedperiod of time and then to retry the operation rather than halt it when an incorrectresponse was received. Because of the critical safety issues during a fire, theseintermittent failures can be important for a nuclear power plant. The tests were designedto study only short-term failures which would take place within 1 day of the smokeexposure. Long-term failure modes (on the order of several days to weeks), which canalso be important, were not pursued because the test schedule did not allow for it. Such astudy may be important in the future in terms of what equipment can be reused after afire.
The equipment was exposed for 1 hour and then the smoke was vented. Equipment wasmonitored for at least 12 hours after exposure and then cleaned. The cleaned equipmentwas used for subsequent exposures. To determine if the cleaning process was effective,the baseline operation of the equipment was monitored in a controlled environment forseveral hours. The PRS/MUX was exposed to smoke four times while the DTC wasexposed to smoke three times and once to CO2. The FOMs were exposed to a smoke
D-6 NUREG/CR-6476

environment as well as high-temperature tests since earlier tests showed that they werevery sensitive to heat.
Smoke ProductionNo standard procedure exists to test the reliability of electrical equipment exposed tosmoke and smoke is a difficult environment to reproduce consistantly. When fuel burns,it produces many different chemicals whose concentrations are dependent on the burningconditions. Conditions such as the fire temperature, amount of oxygen available forburning, whether the fuel is stacked tightly or spread out, and whether there is a flame oronly a smoldering fire can affect the type of smoke that is produced. The amount ofdamage to the equipment may be affected by the temperature and humidity during andafter the fire. The soot that deposits on the equipment will be affected by the distance thesmoke travels from the fire to the equipment. In order to test the reliability of a digitalsafety system, it must be exposed to a known, reproducible environment.
In these tests, the fire scenarios for different areas of a nuclear power plant were specified(Appendix 1) in terms of (1) the ratio of fuel mass available to be burned to the volume ofair available defined as the smoke load, (2) the presence of humidity, and (3) addition offire suppression agents. The scenarios were selected from this set of possible smokeconditions as shown in Table 1.
The smoke was produced in an enclosed volume following the basic protocol (with somemodification) of the American Society for Testing and Materials (ASTM) draft standardon smoke corrosivity as developed by subtask group E05.21.70 [Kessel, et al., 1994].These exposures are small-scale tests. No claims have been made by the ASTM that thistest models a true fire; however, the fuel-to-air volume, smoke duration, and humiditylevels were modified to simulate nuclear power plant fires.
The type of fuel burned to produce the smoke is a key factor in the amount of damage tothe electronic equipment. In a nuclear power plant, there are many sources of fuel for anaccidental fire, but the most abundant source is cable insulation. Many different qualifiedcables are used for instrumentation and control. In addition, there are cables that are nolonger in use but are still in place. Because of the wide variety of available cables and thelimited scope of these tests, we burned a mixture of cable types rather than testing theeffect of individual cables.
The cables were selected from Table 3.4 in "Low-Voltage Environmentally-QualifiedCable License Renewal Industry Report; Revision 1" [Bustard and Holzman, 1994],which lists the ten most popular cable types used inside containments and the number ofplants that use these cables. From this table, the proportion of plants in which each of thecables were used was determined. Common materials used for insulation and jacketingfor these cables include ethylene propylene rubber (EPR), chlorosulfonated polyethylene(CSPE), neoprene, and cross-linked polyethylene (XLPE). The mass of a particularcable's insulation and jacket material in the fuel mixture was proportional to the numberof plants that used the cable in containment.
NUREG/CR-6476 D-7
A list of cable materials used in the smoke exposures for each of the tests is presented inTable 2. The amount of fuel for each test corresponds to the conditions that were to besimulated as presented in Table 1. Tests 1 to 4 correspond to a low smoke load, tests 5and 6 to a medium smoke load, and tests 7 and 8 to a high smoke load. The weight of thecable per length and percentage of plastic was measured by stripping the insulationmaterial from sample pieces. Typically the insulation material weighed 50 to 75% of thetotal mass of the cable. After determining the length of cable required to obtain thecorrect amount of fuel, the lengths were measured and cut for the fuel load. Rather thanjust the insulation, the entire cable was placed in the combustion cell. The fuel wasloaded into small aluminum trays for ease of weighing before and after the exposure.These measurements determined how much fuel was burned.
Small amounts of cable are difficult to cut and measure; therefore, for the small smokeloads of 3 g/m\ a reduced number of cables was used to produce the necessary amount offuel. The masses for cables of similar composition from the cable mixture werecombined and one cable was used to represent this combination. For the larger smokeloadings, poly vinyl chloride (PVC) cable insulation and jacket materials were included.Smoke from PVC contains hydrochloric acid and is very corrosive. Although few plantsuse PVC cables today, PVC used to be a very popular cable insulation, and power plantsmay still contain some of this material. Approximately 2% of the mass of the fuelconsisted of PVC for these larger smoke loads.
D-8 NUREG/CR-6476

Table 2. Fuel
O
Cable Name
Rockbestos Firewall IIIAnaconda Flameguard lkvBrand Rex XLPEOkonite OkolonKerite HTKRockbestos Coax (le)Raychem XLPEDekoran DekoradBIWKerite FRPVC
Insulation
FRXLPEEPRXLPEEPRunknownunknownXLPEEPDMEPR
PVC
Jacket
CSPECSPECSPECSPEunknownunknownNACSPECSPE
PVC
% plastic
56.775
54.660.9735871
54.275.665.656
g/inch
5.076.024.935.7311.11.381.232.743.6
2.136.25
Fuel (grams)Test #1 to 4
1.871.24
1.420.530.400.80
Test #5 and 610.494.955.264.334.833.642.663.372.161.811.34
Test #7139.4948.4271.3353.4144.9247.6628.02
4521.3
21.0414.72
Test #840.6618.5220.0116.6217.5213.688.778.938.056.924.62

The smoke production and exposure equipment is illustrated in Figure 1. Tungsten-quartz lamps provided the heat for combustion. In order to produce flaming combustion,ignition was aided by either an electrical spark or butane pilot flame. The cables wouldnot ignite without the spark or flame. The cylindrical quartz combustion chamber, 32 cmlong x 14 cm in diameter, contained the fuel during smoke production. The heat lampswere placed outside of the combustion chambers, directed toward the fuel.
The heat flux was measured with a Schmidt-Boelter (thermopile) heat flux meter prior toeach test to ensure that smoke was produced in a consistent manner. Small variations inthe positions of the lamps can affect the heat flux that is incident on the fuel. Themeasured heat flux included heat from the lamps as well as indirect heating from othersurfaces surrounding the test chamber which were heated by the lamps. As thetemperature of the surrounding surfaces rises, less power is needed from the radiant heatlamps to obtain the same reading from the meter, thus the power needed to obtain a fixedheat flux on the meter constantly decreases. To obtain a single power setting, a computercontrolled the lamps and measured the flux meter output to determine the power settingneeded to produce 50 kW/m2 at the fuel surface after 5 minutes of irradiation. Thiscorresponds to the radiant heat produced by a flaming fire. Although the heat fluxincident on the fuel could be reduced during a burn by coating the combustion chamberwith soot, the lamp power was not adjusted for this effect since the amount of reductionwould vary from test to test. The combustion cell was also cleaned thoroughly after eachtest.
For small amounts of smoke, only one combustion chamber out of the four was used. Formedium or high smoke densities, two to four combustion chambers were used. Thesmoke from the combustion chamber was conducted to the exposure chamber throughstainless steel chimneys. Each chimney had a motor-driven damper so that it can beopened and closed remotely. The dampers were opened while the lamps were on, andthen closed when the 15- minute burn time was over. The dampers reduced the amountof soot from one combustion chamber that could coat the surface of another chamber.
D-10 NUREG/CR-6476

Results of Test 1
123 cm
ExposureChamber
92 cm
Load Cell
w / / oCombustion Chambers
32 cm x 14 cm quartz cylinders
Figure 1. Smoke exposure unit
Exposure of Electronic EquipmentThe smoke exposure unit is entirely housed in a walk-in temperature and humidity-controlled environmental chamber. The temperature in the environmental chamber ismeasured by a type T thermocouple and controlled within about 1 _F. For most of thetests this temperature was 75_ F. The humidity in the environmental chamber ismeasured using a capacitive humidity sensor. The humidity is produced by an electricalcoil submerged in a tank of water within the environmental chamber, and theenvironmental chamber reduces humidity by running the refrigeration and main heatingsimultaneously. Because of the lag time in both producing and reducing humidity, thehumidity in the chamber is probably only controlled within 5% RH. For these tests thehumidity was set for 30% RH.
NUREG/CR-6476 D-ll
Although the environmental chamber entirely surrounded the smoke exposure unit, thetemperature or humidity within the smoke exposure unit was uncontrolled while the unitwas closed up for the smoke exposure. After the smoke exposure, the smoke was ventedout of the exposure unit and environmental chamber.
Individual components of the experimental digital safety system were exposed to smokewhile the system was operating. In general, the equipment was exposed to smoke for atotal of 1 hour, after which the smoke was vented. The exposure time included the timethe smoke was being produced. The system was monitored for 24 hours after thebeginning of the smoke exposure. Given the limited time of measurements, only short-term failure mechanisms were expected. Potential short-term failures include circuitbridging, contact fouling, or loss of optical transmission. The effects of metal loss due tocorrosion would probably not cause failures during these short exposures.
The day after the exposure, the equipment was cleaned using spray degreasingcompounds. This process of cleaning the equipment for the next test exposure wasimportant because all the components were necessary to run the system. The intent wasto return the component to pre-exposure condition so that it could be reused as either theexposure subject or as an unexposed part of the system during exposures involving othercomponents. The spray degreasing chemicals included Tech Spray ElectronicsCleaner/Degreaser and Chemtronics CFC-Free Electrowash 2000. Prior to eachexposure, the full system was subjected to baseline monitoring for several hours. Thiswas to determine the pre-exposure state. During the baseline tests, any errors as well asthe temperature and humidity of the equipment were logged.
The conditions of each of the eight smoke exposures varied according to the type ofenvironment that was to be simulated as shown in Table 2. The temperature andhumidity in a nuclear plant control room are well controlled, but in other areas in a plantthe humidity may be high because it is uncontrolled, or the fire may be extinguished withwater. For tests simulating conditions outside of the control room, humidity was addedduring the smoke exposure.
To simulate the high humidity condition, steam was added to the smoke exposurechamber after the fuel was burned. A standard amount of water, 34 g, was converted tosteam by heating it for 15 minutes in the combustion chamber. This allowed the digitalsystem to be exposed to smoke and steam at the same time. The amount of water addedto the exposure chamber was determined by calculating the volume of water needed toproduce 80% RH if the chamber was 80_ F. The amount of water present in the chambergiven starting conditions of 30% RH and 75_ F was subtracted from the water needed forthe humid condition.
Because of the corrosivity of smoke, an inexpensive humidity sensor with an uncertaintyof ±2% RH was placed in the smoke chamber with the equipment rather than using amore expensive sensor with an output signal. This sensor had only a liquid crystalreadout, and could not transmit information to the computer. The humidity was recordedmanually at intervals during the tests.
D-12 NUREG/CR-6476

Results of Test 1
Carbon dioxide was added to test 4 after the smoke exposure. The CO2 was added bymeans of a fire extinguisher connected to the top of the exposure chamber. While the fireextinguisher was being discharged, the extinguisher was weighed so that approximately2.5 pounds of CO2 was added to the chamber. This would correspond to filling thechamber with CO2 to 60% by volume. The effect was to lower the temperature in thechamber and to remove much of the soot from the air. CO2 can also induce high staticcharges.
Smoke Environment MeasurementsThe measurements presented in the results section of this report include bothmeasurements suggested by the ASTM draft standard and other standard measurementsof smoke, such as optical density, rate of fuel combustion, and time of ignition andextinguishment. We have characterized the smoke environment by making thesemeasurements, along with others such as temperature, smoke deposition, and chemicalanalyses. This section describes how the results were obtained. The measurementsperformed are listed in Table 3 and procedures are described in this section.
Table 3. Measurements on Smoke Exposure Tests
Measurement
Temperature
Humidity
Fuel
Smoke OpticalDensity
Soot Deposition
Gas Analysis
Soot Analysis
Analysis
Baseline temperatures and smoke exposure temperatureswere statistically analyzed. The smoke exposure temperatureswere plotted.
The relative humidity of the environmental chamber wasstatistically analyzed. Maximum values for the smokeexposure chamber are given if available.
Total mass of fuel burned, weight of each cable type in fuelmixture and time for 10 - 90% weight loss.
Graph of turbidity of smoke for red, blue, and IR wavelengthsvs. time.
Graph of mass deposition vs. time in horizontal and verticalorientations.
Grab sample: Proportion of atmospheric gases in chamberafter fire. Sorption tube: analysis of acid gases
Filter paper: Chemical analysis of acids deposited on filterpaper
NUREG/CR-6476 D-13

Temperature
Temperatures were measured in ten fixed locations in the smoke exposure chamberthroughout the test. The locations of the thermocouples are presented in Table 4. Twononsheathed type K thermocouples (Tql and Tq2) were welded to the surface of thequartz crystal microbalance cases. T12 and T13 logged the temperature inside of theexperimental digital system that was being exposed to smoke. T17 logged thetemperatures near the computers located outside of the environmental chamber, such asthe host computer and the parts of the system that were not being tested. T18 and 19logged the temperatures that were inside the environmental chamber but not in the smokeexposure chamber. Temperatures were logged at 5-second intervals while the lamps wereon and at 1-minute intervals for the remaining time that the smoke was in the chamber.After the smoke exposure chamber was vented, the temperatures were logged at 10-minute intervals.
Temperatures were also recorded for the baseline equipment checks. The humiditysensor houses a platinum resistive temperature detector (RTD) for use in calculatingrelative humidity. This RTD was the only temperature monitored during the baselineruns.
D-14 NUREG/CR-6476

Results of Test 1
Table 4. Thermocouple locations
TO
Tl
T2
T3
T4
T5
T6
T7
T8
T9
Tql
Tq2
T12
T13
T17
T18
T19
Center of floor of smoke exposure chamber
Near lamp 1 in floor of exposure chamber
Near lamp 2 in floor of exposure chamber
Near lamp 3 in floor of exposure chamber
Near lamp 4 in floor of exposure chamber
Top of smoke exposure chamber
Above lamp 1 in smoke exposure chamber ceiling
Above lamp 2 in smoke exposure chamber ceiling
Above lamp 3 in smoke exposure chamber ceiling
Above lamp 4 in smoke exposure chamber ceiling
On vertical QCM case
On horizontal QCM case
In experimental digital system
In experimental digital system
Laboratory temperature near computers
Floor of environmental chamber
Floor of environmental chamber
Fuel Mass Loss
The fuel mass loss was measured in two ways: aluminum foil trays containing the fuelwere weighed before and after each test on a calibrated scale, and load cells measured theloss of fuel mass during the burn at 5-second intervals. The load cells were mountedunder the quartz combustion cell as shown in Figure 1. The stainless steel fuel trays wereattached to the load cells by a shaft through a hole in the combustion cells. The foil trayscontaining the fuel were placed on the stainless steel trays for simultaneous burning andweighing. The load cell converts the weight into voltage by means of a strain gage. Theactive measurement of fuel loss is recommended in the ASTM draft standard. Since thescale used for these measurements was more accurate than the load cell, the final valuesreported on the amount of fuel burned were determined from scale measurments.
Smoke Opacity
A turbidimeter measured the optical density of smoke by passing light through the smokeand determining the loss of light intensity. The ratio of the initial intensity, Io, to the
NUREG/CR-6476 D-15

transmitted intensity through smoke, /, is related to the turbidity (or extinctioncoefficeint), %, and pathlength, I. The ratios are related by the following equation [Van deHulst, 1957]:
1= Ioexp(-tl).
The ideal experiment would only measure the optical density of the smoke in the air, butnot that deposited on any surfaces. Because we wished to protect our optical componentsfrom the smoke, glass slides were installed. To account for the loss of intensity due tosmoke on the protecting glass surfaces, we used two separate turbidimeters with differentpathlengths, assuming that the amount of smoke deposited on each glass slide would beequal.
The turbidimeter was arranged as follows: Light from a high-intensity bulb (white light)was focused with a lens and then passed through a glass slide into the smoke exposurearea. After crossing an open section of the smoke chamber, the light passed through asecond glass slide and into another lens which was isolated from the smoke exposurechamber. The turbidimeter is well collimated A combination of prisms and filtersdivided the light into three colors: red (0.6328 |X), blue (0.4579 (X), and infrared (1.060 \i).The optical throughput of each color was converted by photodiodes into an electricalsignal. The voltage from the photodiodes was recorded at 5-second intervals while theradiant lamps were on, at 1-minute intervals for the rest of the first hour, and at 10-minuteintervals after the smoke was vented. One turbidimeter had a pathlength of 1.9 cm andthe other had a pathlength of 3.2 cm through the smoke exposure chamber. The resultingturbidity, %, can be calculated using this formula:
U(QH(t)J1, — 12
where the subscripts 1 and 2 describe the two turbidimeters; / is the intensity measuredthrough the turbidimeters at zero time (before the smoke is added) and at any time t; and Iis the respective pathlength for each turbidimeter.
Gas Analysis
Gases were captured in two ways-by a vacuum grab sample bottle and through a sorptiontube. A vacuum grab system captured a 10-ml filtered sample of gas in a stainless steelbottle. These samples were analyzed by gas chromatography, which provided thepercentage of methane, carbon monoxide, nitrogen, carbon dioxide, and oxygen presentin the sample. (For reference, a standard air mixture contains 78% nitrogen, < 2 1 %oxygen, < 1 % carbon dioxide, and < 1 % argon.)
Samples of acids contained in the smoke were collected in silica gel-filled sorption tubes.A sampling pump pulled 20 ml per minute of air through the sorption tube during theentire burn time (15 minutes). Analysis of the tube contents provided information on therelative amount of acid gases (chlorine, sulfur, and bromine) present in the chamber.The materials that remained in the sorption tubes were analyzed using ion
D-16 NUREG/CR-6476

Results of Test 1
chromatography following the procedure contained in NIOSH 7903. Before the contentsof the sorption tube were measured, the instruments were calibrated for chlorine andsulfur only. After all the samples were measured, bromine was found to be a significantcontributor for some tests. Since the procedure was not calibrated for bromine, onlyestimates of the amount of bromine are reported. These estimates are the results of thereported relative sensitivity of the procedure to chlorine and bromine.
Soot Deposition
The purpose of this measurement was to determine the amount of soot deposited on theelectronic equipment. Quartz crystal microbalances (QCMs) measured the massdeposition of the smoke as a function of time. Quartz is a piezoelectric material thatundergoes shear deformation when subjected to an electrical field. Conversely, if it isstrained, it will generate an electrical field. The QCM consists of a quartz crystal withelectrodes to connect it to an electrical oscillator that is tuned to the fundamentalfrequency of oscillation of the crystal. When material such as soot is deposited on thesurface of the crystal, the oscillation frequency decreases. The change in frequency canbe related to the additional mass on the quartz crystal. The frequency of oscillation isalso dependent on the temperature of the crystal, so thermocouples were attached to theQCM case to determine the temperature around the crystal.
Two QCMs were used to measure the deposition-one in a horizontal face-up orientationand one in a vertical orientation. The oscillation frequency was recorded at intervals of 5seconds while the heat lamps were on, and at 1-minute intervals for the remaining firsthour. When the sparkers were used to ignite the fuel, the QCM data were noisier;however, the frequencies recorded at the beginning of the smoke exposure before thesparkers were started and late in the smoke exposure after the sparkers were turned offindicate the amount of soot deposited during the exposure.
Soot Analysis
Previous studies have linked the amount of chlorine in smoke to equipment damage,therefore it is important to determine the acidic compounds deposited on equipmentduring a fire [Reagor, 1992]. Ashless filter papers were used as a substrate to collect sootsamples for chemical analysis. Two filters (4.25 cm diameter) were placed at the bottomof the smoke exposure chamber for each test to gather samples of soot. The samples wereanalyzed for chlorine, sulfur, and bromine by ion chromatography and for trace metals byplasma-excited atomic emission spectroscopy. As in the sorption tube samples, theprocedure was originally calibrated only for chlorine and sulfur, but since a significantamount of bromine was found in the samples, estimates of the amount of bromine arereported using published relative sensitivities between chlorine and bromine. Ashlessfilters were used because the analysis involves burning the filter paper.
Test ScheduleThe smoke exposure schedule is presented in Table 5 and shows the type of exposure,type of equipment (EUT), and conditions such as addition of fire suppression agents.Since the TRP/MUX was most likely to be situated in general plant areas rather than the
NUREG/CR-6476 D-17

control room, it is most likely to encounter higher humidity; thus water was added only toexposures of the TRP/MUX. The DTC is most likely to be placed in the control room, soCO2 was added to a test for the DTC. On June 6, two separate tests were performed-atest to determine the effect of CO2 alone, and a smoke exposure with the addition of CO2.
Before each test the equipment to be used was installed in the smoke exposure chamberand the environmental chamber was used to control the temperature and humidity forbaseline information. The baseline conditions for each test were recorded with the resultsof that test.
The last test (8) on the FOMs was performed differently than the others. Because of theanticipated problems due to heat on the FOMs, the environmental chamber was cooled sothat when the lamps were on they would not cause the FOMs to fail. Smoke was alsoproduced differently. A low smoke load was burned in lamp 1, and then the smoke wasallowed to remain in the chamber for 1 hour. After this, a second lamp with enough fuelto provide for a medium smoke load when combined with the first lamp was burned andthe smoke was contained for 1 hour. For the last part of the test, lamps 3 and 4 wereburned to bring the total smoke load up to a high level, and then the smoke was containedfor 1 hour.
D-18 NUREG/CR-6476

Results of Test 1
Table 5.
Date
5/30/955/316/16/26/36/56/66/66/76/86/9
6/106/126/136/146/156/16
Schedule of Smoke Exposures
Activity
SmokeCleanSmokeClean
SmokeCleanSuppr.SmokeCleanSmokeCleanSmokeCleanSmokeCleanSmokeClean
Smoke (g/m3)
2.8
2.8
2.8
02.8
26w/PVC
26w/PVC
320 w/PVC
200 w/PVC
EUT
TRP/MUX
TRP/MUX
DTC
DTCDTC
DTC
TRP/MUX
TRP/MUX
FOM
Suppres-sionnone
water
none
CO,CO,
none
water
none
none
Exposure Time
1 hour
add H,0 immed. after burn
1 hour
add CO, onlyadd CO, immed. after burn
1 hour
add H,O immed. after burn
1 hour 20 min.
4 hours
Notes:(1) No PVC in smoke, unless otherwise noted.(2) Water suppression to TRP/MUX is not a direct spray of water. It is a humidityincrease in the area near the unit.
NUREG/CR-6476 D-19

Results of ORNL Exposures
TestiTest name:Test date:Test time:
0RNL1May 30, 199516:35:36 EDT
Baseline information: 4.3-hour baseline on May 30, 1995 beginning at 09:36:43 EDT.ConditionTemperature(_C):Relative humidity (%):
Minimum19.9729.2
Maximum22.3742.0
Mean21.332.1
SD0.872.46
Cable Mixture:Cable nameRockbestos Firewall IIIAnaconda Flameguard lkvKerite HTKRockbestos Coax (le)Raychem XLPEDekoran Dekorad
InsulationFRXLPEEPRunknownunknownXLPEEPDM
JacketCSPECSPEunknownunknown
CSPE
% plastic56.77573587154.2
Total g21.231.9370.590.530.923
Heat flux: 50 kW/m2, 1 lamp onlyIgnition: SparkersLamp start time: 16:35:53 EDTFlame start time: 16:37 EDT approx.Flame off time: 16:38 EDT approx.Mass loss of cables: 3 gTime for 10-90% loss of cable mass: 2 min
Suppression: None
Sorption tube time: lhourSorption tube results:
ChlorideFront filter0.023 mg
Back filter0.003 mg
SulfateFront filter0.013 mg
Back filter0.003 mgv
Bromide (estimate)Front filter0.023 mg
Back filterND
Filter paper results:Chloride0.022 mg
Sulfate0.003 mg
Bromide*0.009 mg (estimate)
* The bromide values are estimated because the instruments were not calibrated.
D-20 NUREG/CR-6476

Results of Test 1
Grab sample% Argon
0.8
results:%N,78.9
%O,20.0
%H,0.0
%CH_0.0
%CO,0.2
%COND
Temperature in chamber (_C):TCTOTlT2T3T4T5T6T7T8T9TqlTq2T18T19
Minimum24.9324.5223.9624.0125.9022.5822.5522.6322.3622.9224.3724.5020.6820.61
Maximum28.2430.2328.5130.0931.3026.7832.1325.9825.2025.0828.9728.8922.9423.04
Mean26.4227.7427.4127.5828.8525.0228.1024.6824.0324.1626.6726.6721.9021.90
SD0.951.311.171.611.530.992.510.810.680.551.321.260.490.51
NUREG/CR-6476 D-21

Chamber Temperature (°C)
Testi
34
32
oo0
1?0Q .
0
O
0Urn
• •
eraf
diu
0
30
28
26
24
22
2032
31
30
29
28
27
26
2524
230.00
1 i i i
Bottom
_ | I I I I t I ,
0.25 0.50 0.75
Time (hr)
1.00
D-22 NUREG/CR-6476

Results of Test 1
Smoke Optical Density and Accumulation
Testi
0.6 1 1 1 1 1
Time (hr)
NUREG/CR-6476 D-23

Test 2Test name:Test date:Test time:
0RNL2June 1, 199511:48:49 EDT
Baseline information: 16 hour baseline run on May 31, 1995, starting at 18:42:06 EDTConditionTemper ature(_C):Relative humidity (%):
Minimum22.520.4
Maximum23.231.7
Mean22.924.1
SD0.164.0
Cable Mixture:Cable NameRockbestos Firewall HIAnaconda Flameguard lkvKerite HTKRockbestos Coax (le)Raychem XLPEDekoran Dekorad
InsulationFRXLPEEPRUnknownUnkownXLPEEPDM
JacketCSPECSPEUnknownUnknownNACSPE
% plastic56.77573587154.2
Total g1.9221.3361.1590.580.3840.601
Heat Flux: 50kW/m2, 2 lamps (one for water)Ignition: SparkersLength of flame: 2 minutesMass loss of cables: 2.8 g
Time for 10-90% loss of cable mass: 2 minutes
Suppression system: Water, 34 g boiled off after first 15 min cable burn
Maximum relative humidity in sensor inside chamber: 84%
Filter paper results:Chloride0.029 mg
Sulfate0.004 mg
Bromide0.007 mg Estimated
Grab sample results% Argon0.8
%N,79.0
%-o,20.0
%H,0.0
%CH,0.0
%co,0.2
%CO0.0
D-24 NUREG/CR-6476
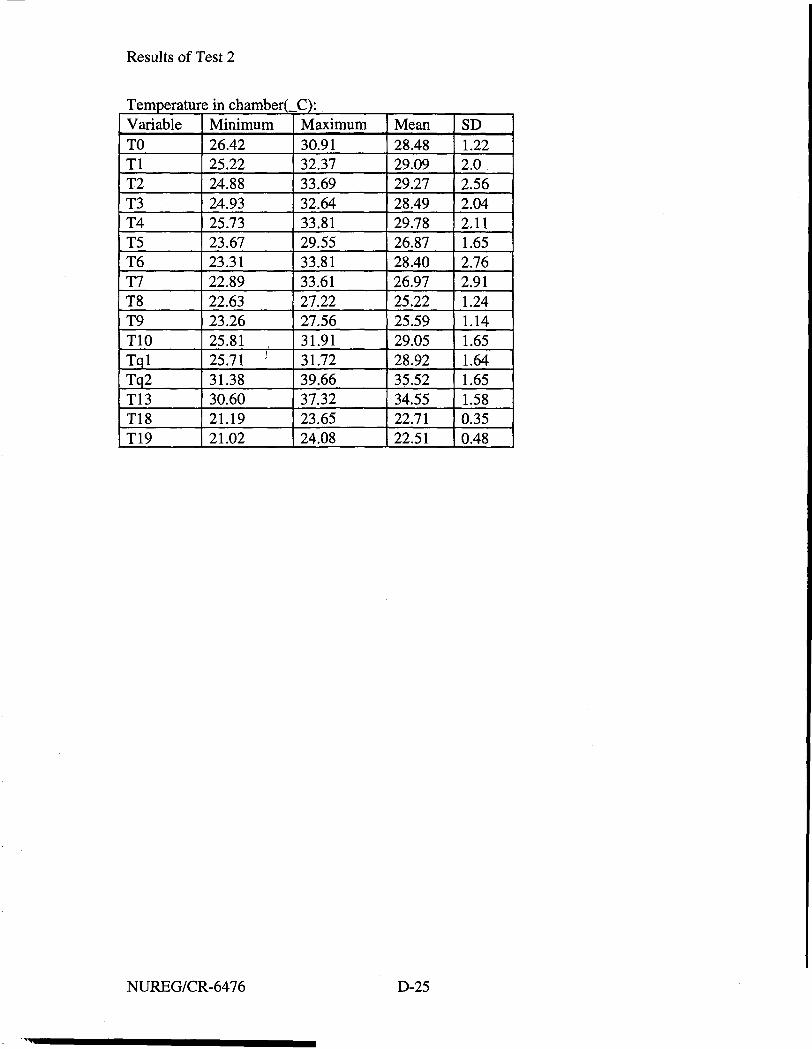
Results of Test 2
Temperature in chamber(_C):VariableTOTlT2T3T4T5T6T7T8T9T10TqlTq2T13T18T19
Minimum26.4225.2224.8824.9325.7323.6723.3122.8922.6323.2625.8125.71 J
31.3830.6021.1921.02
Maximum30.9132.3733.6932.6433.8129.5533.8133.6127.2227.5631.9131.7239.6637.3223.6524.08
Mean28.4829.0929.2728.4929.7826.8728.4026.9725.2225.5929.0528.9235.5234.5522.7122.51
SD1.222.02.562.042.111.652.762.911.241.141.651.641.651.580.350.48
NUREG/CR-6476 D-25

Chamber Temperature (°C)Test 2
36
34 r
o^32
^ 30
fe 28aI 26
I -24
2236
Topi,
11
1 i i i i 1 i i i i 1 i i i i
T5T617T8T9
1 i , i
-
-
-
i r i i I i i i i I i i i i I i i i i
15 20
Time (hr)
D-26 NUREG/CR-6476

Results of Test 2
Smoke Optical Density and Accumulation
Test 2
i i i i I i i i i i i i I i •
I • • • • i
Horizontal
0.00
NUREG/CR-6476
0.25 0.50 0.75
Time (hr)
D-27
1.00

Test 3Test name:Test date:Test time:
ORNL3June 3, 199511:15:46 EDT
Baseline Information: 16 hour baseline run on June 2, 1995, starting at 19:28:32 EDT.Condition:Temperature (_C):Relative humidity (%):
Minimum22.226.0
Maximum31.434.4
Mean25.9130.2
SD4.11.1
Cable Mixture:Cable NameRockbestos Firewall IIIAnaconda Flameguard lkvKerite HTKRockbestos Coax (le)Raychem XLPEDekoran Dekorad
InsulationFRXLPEEPRUnknownUnknownXLPEEPDM
JacketCSPECSPEUnkownUnknownNACSPE
% plastic56.77573587154.2
Total g1.7261.0541.2190.470.3960.91
Heat flux: 50 kW/m2,1 lampIgnition: SparkersMass loss of cables: 2.63 g
Time for 10-90% loss of cable mass: 2.5 min
Suppression system: None
Sorption tube time: 15 min.
Sorption tube results:ChlorideFront filter0.012 mg
Back filter0.002 mg
SulfateFront filter0.007 mg
Back filter0.004 mg
BromideFront filter0.009 mg Est.
Back filterND
Filter paper results:Chloride0.030 mg
Sulfate0.003 mg
Bromide0.009 (Est)
Grab sample results:% Argon
0.8%N,79.0
%O,20.0
%H,0.0
%CH,0.0
%CO1
0.2%CO
0.0
D-28 NUREG/CR-6476

Results of Test 3
Temperature in chamber (_C):TCTOTlT2T3T4T5T6T7T8T9T10TqlTq2T13T18T19
Minimum25.4923.6923.9124.3724.5222.5022.6722.5022.0222.5325.4225.3934.0828.4620.0319.76
Maximum29.2130.2829.9229.3330.8426.8832.5426.7625.9025.7629.1429.0439.7532.6423.1622.97
Mean27.7327.1227.0726.6827.7624.8126.2624.7824.2524.6227.9428.0537.7230.8822.3822.18
SD0.841.331.240.891.720.802.450.750.600.470.830.901.030.800.420.44
NUREG/CR-6476 D-29

Chamber Temperature (°C)Test 3
. I , , I , , ,
10 15
Time (hr)
20
D-30 NUREG/CR-6476

Results of Test 3
Smoke Optical Density and Accumulation
Test 31.5
*- 1.0 -
NUREG/CR-6476
0.25 0.50 0.75
Time (hr)D-31
1.00

Test 4Test name: ORNL4Test date: June 6,1995Test time: Two start times, 12:33:13 and 13:25:19 EDT
The first start was aborted after 1 minute because of failures in experimentalsystem due to EMI from sparkers. As a result sparkers were removed and test proceededwithout ignition.
Baseline information: 16.9 hour run on June 5, 1995 begining at 17:55:56 EDT.ConditionTemperature(_C):Relative humidity (%):
Minimum22.1429.79
Maximum22.9132.74
Mean22.6031.19
SD0.180.79
CO2 only: This was a test to determine the effect of CO2 on system.2.6 lb of CO2 were added to exposure chamber.Temperatures in exposure chamber (_C)TC
TOTlT2T3T4T5T6T7T8T9T12T13T18T19
Minimum24.11-10.56-11.25-10.24-3.3018.6017.3117.3617.1416.5821.8021.6321.9021.75
Maximum25.7623.8923.5723.8926.1722.6522.8723.0122.7223.2829.1628.7822.7722.94
Mean
24.6818.4018.4419.2421.7521.5221.7121.8021.6221.7424.7125.5322.2622.25
SD
0.638.78.98.66.80.851.21.21.21.42.32.00.260.36
The following information refers to the smoke exposure portion of the test.
D-32 NUREG/CR-6476

Results of Test 4
Cable Mixture:Cable NameRockbestos Firewall IIIAnaconda Flameguard lkvKerite HTKRockbestos Coax (le)Raychem XLPEDekoran Dekorad
InsulationFRXLPEEPR
XLPEEPDM
JacketCSPECSPE
CSPE
% plastic56.77573587154.2
Total g1.8031.3511.3850.4970.3130.777
Heat Flux: 50kW/m2, 1 lampIgniter: None.Note: No flames, only smouldering on this test. Igniter of some type necessary for
flames.Mass loss of cables: 2.8 gTime for 10-90% loss of cable mass: 2 minutes
Suppression system: 2.48 lb. CC^added after lamps turned off (15 minutes after secondstart of test)
Sorption tube time: 16 minSorption tube results:
ChlorideFront filter0.018 mg
Back filter0.002 mg
SulfateFront filter0.007 mg
Back filter0.004 mg
BromideFront filter0.008 (Est)
Back filterND
Filter paper results: None, filter paper was blown away.Grab sample results:% Argon0.5
%N,51.0
%O,12.1
%H,0.0
% CH,0.0
%CO,36.4
%COND
Temperature in chamber (_C)TCTOTlT2T3T4T5T6-T7T8T9TqlTq2
Minimum24.931.1691.1441.5314.04419.8819.7418.1618.5717.9724.8824.79
Maximum27.9229.3628.7529.4331.8425.9029.2825.4725.1025.1828.4328.36
Mean27.1826.2525.9925.9127.9924.0924.3923.8423.6624.6227.8427.76
SD0.491.061.021.041.110.481.090.480.400.410.550.56
NUREG/CR-6476 D-33

T12T13T18T19
26.6129.1920.0820.00
32.5436.8323.1628.07
31.4335.7622.3922.35
0.641.010.390.55
D-34 NUREG/CR-6476

Results of Test 4
Chamber Temperature (°C)
Test 4
i i i I
2 3
Time (hr)
NUREG/CR-6476 D-35

Smoke Optical Density and Accumulation
Test 4
12
£ 10o
co
"55oo .a>a</)(003
8
6
4
2
0
Horizontal
Vertical
-20.00 0.25 0.50
Time (hr)
D-36
0.75 1.00
NUREG/CR-6476

Results of Test 5
Test5Test name: ORNL5Test date: 8 June 1995Test time: 13:09:27 and 12:26:50 EDT, problem with program and restarted after
15.5 minutes (after burning Lamp 1)
Baseline Information: 16-hour baseline run on June 7 1995 starting at 19:09:27 EDT.
Condition:Temperature (_C):Relative humidity (%):
Minimum22.2527.32
Maximum23.1135.09
Mean22.6230.15
SD0.150.81
Cable Mixture:
Cable nameRockbestos Firewall IIIAnaconda Flameguard lkvBrand Rex XLPEOkonite OkolonKerite HTKRockbestos Coax (le)Raychem XLPEDekoran DekoradBIWKerite FRPVC
Total
InsulationFRXLPEEPRXLPEEPR
XLPEEPDMEPR
PVC
JacketCSPECSPECSPECSPE
CSPECSPE
PVC
% plastic56.77554.660.973587154.275.665.656
Total g10.644.965.274.234.753.692.73.542.11.811.4
45.09
Heat flux: 50 kW/m2,2 lamps, 1 and 3Ignition: Sparkers plugged in individually; problems with program, had to restart
BIGTEST (the program to run smoke system)Mass loss of cables: 10.38 g from tray 1,10.01 g from tray 3
Suppression system: none
Filter paper results: None.
NUREG/CR-6476 D-37

Grab sample results:
% Argon1.1
%N,78.5
%O,18.6
%H,0.0
%CH,0.0
%CO,2.0
%CO0.5
Temperature in chamber (_C):
TCTOTlT2T3T4T5T6T7T8T9T12T13T18T19
Mean28.5230.0529.3829.9930.5727.1228.9826.1327.8326.0635.2532.9921.8521.64
Minimum25.9524.4524.3324.2825.0122.8723.0122.9422.7723.1826.9527.8319.4019.11
Maximum31.1134.5632.8836.3235.8830.9134.3728.5837.2729.1442.1736.9522.8022.87
SD0.592.262.081.581.261.523.251.170.940.651.961.430.290.41
D-38 NUREG/CR-6476

Results of Test 5
Chamber Temperature (°C)Test5
10 15
Time (hr)20
NUREG/CR-6476 D-39

Smoke Optical Density and AccumulationTest5
1.00
CM
"3)
co
"woQ.<DQW0)
-0.2535
30
25
20
15
10
5
0
-5
-100.00
/^Horizontal
Vertical
i . . . . i , .
0.25 0.50 0.75
Time (hr)
1.00
D-40 NUREG/CR-6476

Results of Test 6
Test 6Test name:Test date:Test time:
0RNL6June 10, 199512:38:01 EDT
Baseline information: 17.25-hour run on June 9, 1995 starting at 19:04:25 EDT.Condition:Temperature (_C):Relative humidity (%):
Minimum22.5816.87
Maximum23.7731.11
Mean22.9126.45
SD0.203.7
Cable Mixture:Cable NameRockbestos Firewall IIIAnaconda Flameguard lkvBrand Rex XLPEOkonite OkolonKerite HTKRockbestos Coax (le)Raychem XLPEDekoran DekoradBIWKerite FRPVC
Total
InsulationFRXLPEEPRXLPEEPRUnknownUnknownXLPEEPDMEPR
PVC
JacketCSPECSPECSPECSPEUnknownUnknownNACSPECSPE
PVC
% plastic56.77554.660.973587154.275.665.6
L 56
Totalg10.344.945.244.424.923.582.633.22.221.791.27
44.55
Heat flux: 50 kW/m^, three lamps, 1 and 3 for fuel and 2 for waterMass loss of cables: 9.93 g from lamp 1 and 10.04 g from lamp 3Time for 10-90% loss of cable mass: Lamp 1,4.3 min; lamp 3, 6.0 min.
Suppression system: 34 g water boiled off on lamp 2
Sorption tube time: 1 hour
Sorption tube results:Chloride
Front filter0.514 mg
Back filter0.006 mg
SulfateFront filter0.152 mg
Back filter0.039 mg
BromideFront filter0.270 mg Est.
Back filterND
Filter paper results:Chloride0.057 mg
Sulfate0.004 mg
Bromide0.062 mg Estimate
NUREG/CR-6476 D-41

Temperature in chamber (_ C):TCTOTlT2T3T4T5T6T7T8T9T1OTqlTq2T13T18T19
Minimum24.0623.6523.6223.4824.1822.2621.9922.0921.5322.0425.2524.7931.1132.3720.1720.00
Maximum31.0135.2535.8835.9836.6132.0835.0536.6137.4430.3835.7835.8144.9051.0524.1824.54
Mean27.3229.8729.7629.9430.5627.5128.6727.4228.2226.5530.2730.0638.7041.5522.8122.57
SD1.53.33.53.83.52.83.53.54.52.23.03.13.54.30.570.72
D-42 NUREG/CR-6476

Results of Test 6
p
"atu
reT
emp
ei
p
-atu
t
Q .
4038
36
34
CM
OC
O C
O
28
26
24
22
2038
36
34
32
30
28
26
24
22
Chamber Temperature (°C)Test 6
i . . . i . . . . i . . . . ,
Top
ilI
. . . . i . . . . i . . . . i
. . . | . . .
T6T7T8T9
-
—
o r, , . i . . .
_j Bottom
1j f lT l11
i l l l l l l l l l l l l l l l
TOT-l1 1T2T3
. . . . . . T 4
-
—
-
10 15
Time (hr)
20
NUREG/CR-6476 D-43

Mass Loss and Accumulation
Test 6D)
o
5T3C(0
uel
u_Eototo
toto
0
-5
-10
-15
-20
-25
-30
-35
-4035
-50.0
Horizontal
Vertical
0.5
Time (hr)
1.0
D-44 NUREG/CR-6476

Results of Test 7
Test 7Test name:Test date:Test time:
0RNL7June 13,199511:59:59 EDT
Baseline Information: 15-hour baseline run on June 12,1995 starting at 19:09:27 EDT.No temperature and humidity information available
Cable mixture:Cable NameRockbestos Firewall IIIAnaconda Flameguard lkvBrand Rex XLPEOkonite OkolonKerite HTKRockbestos Coax (le)Raychem XLPEDekoran DekoradBIWKerite FRPVC
InsulationFRXLPEEPRXLPEEPRunknownunknownXLPEEPDMEPR
PVC
JacketCSPECSPECSPECSPEunknownunkownNACSPECSPE
PVC
% plastic56.77554.660.973587154.275.665.656
Total g139.4948.4271.3353.4144.9247.6628.024521.321.0414.72
Heat flux: 50 kW/m2, all 4 lamps (overloaded trays)Mass loss of cables: Tray 1, 45.37 g (flaming); Tray 2, 52.66 g (flaming); Tray 3, 29.01
g (smoldering only); Tray 4, 33.09 g (smoldering only).Time for 10-90% loss of cable mass: Lamp 1, 9:10 min; Lamp 2, 6:15 min; Lamp3, 8:02
min; Lamp 4, 9:09 min.
Suppression system: None
Sorption tube time: 1 hour, 20 minutes/
Sorption tube results:Chloride
Front filter0.752 mg
Back filter0.007 mg
SulfateFront filter0.149 mg
Back filter0.042 mg
BromideFront filter0.233 Est.
Back filterND
Filter paper results:Chloride0.742 mg
Sulfate0.005 mg
Bromide0.547 mg Estimate
NUREG/CR-6476 D-45

Grab sample results% Argon1.0
%N,80.0
%O,13.6
%H,0.6
%CH,0.0
%CO,5.2
%CO1.5
Temperature in chamber (_C):TCTOTlT2T3T4T5T6T7T8T9T12T13T17T18T19
Minimum14.0614.0214.0413.8013.9012.5612.4912.8511.9312.3418.9118.5518.609.8989.874
Maximum27.7531.9136.0731.7634.6930.4831.6444.8734.3734.0340.2442.7025.5218.9919.13
Mean21.4925.4725.6424.3225.8223.1723.8824.5622.3921.7430.9432.1822.4414.4014.40
SD3.55.05.65.15.54.94.66.56.05.46.55.90.71.61.6
D-46 NUREG/CR-6476

Results of Test 7
50
45 h
O 40oCD 3 5 -
| 30
CL 25E£ 20
15 h
1040
35
30Oo
CD
I 25CD
I" 20
I -15
10
Chamber Temperature (°C)Test 7
1 1 . . 1 . • . • 1 1 1 . 1 1 . 1 . 1 1 . 1 • .
Top
I'III
- 1
1
1 1 1 ^ ^ ^ ^ ^
T5T6T7T8T9
VIT
i i i
BottomTOT1T2TOI O
T4
5 10 15
Time (hr)
20 25
NUREG/CR-6476 D-47

Smoke Optical Density and Accumulation
Test 7
, „
Vertical
1.0Time (hr)
D-48
1.5 2.0
NUREG/CR-6476

Test 8
Test name: 0RNL8Test date: June 15, 1995Test time: 12:53:28 EDT
Baseline Information: 17.5-hour temperature test for fiber optic modules on June 14,1995, starting at 12:53:28. See temperature plot.
Cable Mixture:Cable Name
Rockbestos Firewall IIIAnaconda Flameguard lkvBrand Rex XLPEOkonite OkolonKerite HTKRockbestos Coax (le)Raychem XLPEDekoran DekoradBIWKerite FRPVC
Insulation
FRXLPEEPRXLPEEPR
XLPEEPDMEPR
PVC
Jacket
CSPECSPECSPECSPE
CSPECSPE
PVC
%plastic56.77554.660.973587154.275.665.656
Lamp 1 g
1.941.040.000.001.020.430.300.480.000.000.00
Lamp 2 g
8.914.035.414.473.993.092.301.812.051.811.21
Lamp 3and4g29.8113.4514.6012.1512.5110.166.176.646.005.113.41
Heat flux: 50 kW/m2 on all four lampsIgnition: Sparkers only until ignited, no flame on lamp 4Mass loss of cables: Tray 1, 2.43 g (flaming); Tray 2, 15.45 g (flaming); Tray 3, 23.14 g
(flaming); Tray 4, 23.28 g (smoldering).Time for 10-90% loss of cable mass: Lamp 1, 2:27 min.; lamp 2, 5:26 min.; lamp 3, 6:20
min., lamp 4, 8:20 min.
Suppression system: NoneSorption tube time: 4 hours
Sorption tube results:Chloride
Front filter0.124 mg
Back filter0.050 mg
SulfateFront filter0.012 mg
Back filter0.006 mg
BromideFront filter0.075 mg Est.
Back filterND
Filter paper results:Chloride0.509 mg
Sulfate0.010 mg
Bromide0.512 mg Estimate
NUREG/CR-6476 D-49
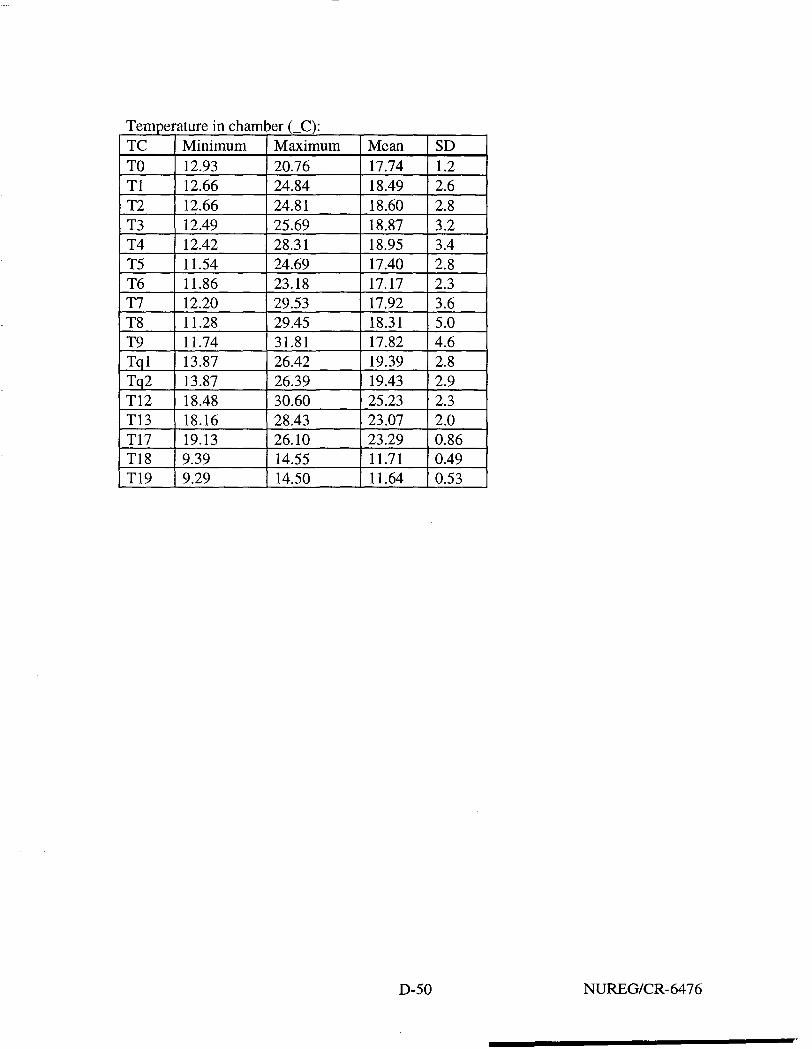
Temperature in chamber (_C):TCTOTlT2T3T4T5T6T7T8T9TqlTq2T12T13T17T18T19
Minimum12.9312.6612.6612.4912.4211.5411.8612.2011.2811.7413.8713.8718.4818.1619.139.399.29
Maximum20.7624.8424.8125.6928.3124.6923.1829.5329.4531.8126.4226.3930.6028.4326.1014.5514.50
Mean17.7418.4918.6018.8718.9517.4017.1717.9218.3117.8219.3919.4325.2323.0723.2911.7111.64
SD1.22.62.83.23.42.82.33.65.04.62.82.92.32.00.860.490.53
D-50 NUREG/CR-6476

35
^ 30Oo
£ 25
2g. 20
"- 15
Chamber Temperature (°C)
Fiber Optic Module Temperature TestTest 8
5 10
Time (hr)
i r i i I i.
Bottom
f«IH»l«H)W»»» \
NUREG/CR-6476 D-51

Chamber Temperature (°C)Test 8
35
Top
10 15Time (hr)
20
D-52 NUBIEG/CR-6476
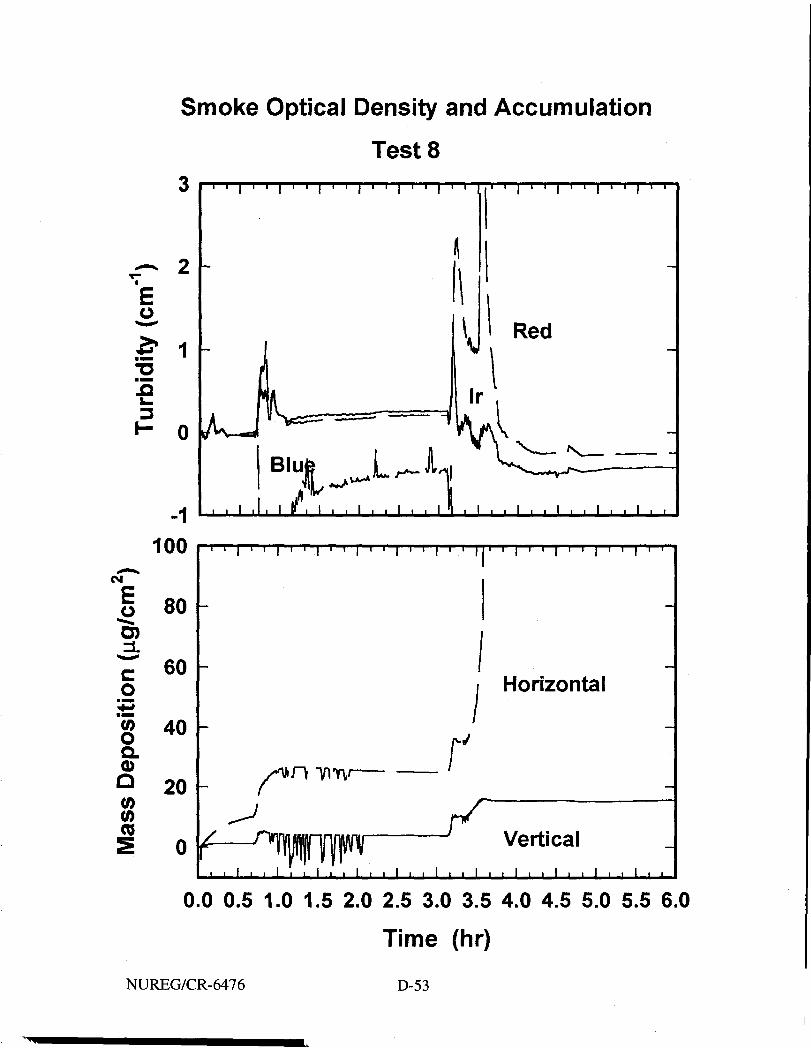
Smoke Optical Density and Accumulation
Test 83 • i i I i i • i i i • i I • • I • • I • i I • • I • • i i • i • i
T r - 2£
i 1
-1100
<M
I 80
co
• MM
"55oo .o
(00)(0
60
40
20
, , i , 1 , i if. i , , i . .
i • • i • • i • • i
Red
, I , , I . . I , . I . . I . ,
-
f—n^^\i f l i i l i i l i i l i i
i/
_rHorizontal
Verticali i l i i l i i l i i l i i
0.0 0.5 1.0 1.5 2.0 2.5 3.0 3.5 4.0 4.5 5.0 5.5 6.0
Time (hr)
NUREG/CR-6476 D-53

Conclusions
The smoke exposures for the ORNL experimental digital system were sucessful inproviding a general indication of whether a digital safety system would perform undersmoke conditions. Three levels of smoke density were tested: low (approximately 3 g offuel/m3), medium ( approximately 20 g of fuel/m3), and high (more than 60 g of fuel/m3).For high levels of smoke density, the fuel near the end of the exposure would not ignite,but instead smouldered. This indicates that there was not enough oxygen to support opencombustion at this level. The grab sample from test 7 also supported this theory becausethe level of CO was much higher than in any other tests and the level of oxygen wasdown to only 13.6%.
Several fire suppression simulations were part of these tests. This included the additionof humidity in the form of steam and CO2 from a fire extinguisher. When humidity wasadded during the smoke exposure, the objective was to reach at least 80% RH. This wasaccomplished using a simple calculation of the amount of water required in the chamberto raise the humidity to this level given the temperature that was expected at the end ofthe exposure. The addition of CO2 was accompanied with a test of CO2 alone from thefire extinguisher. The CO2 had very little effect on the equipment, although thetemperatures in the exposure chamber dropped drastically. Filters that were placed in theexposure chamber to determine the chemical composition of the soot were blown awayby the action of the fire extinguisher and were not analyzed.
The method of igniting the fire was changed partway through these tests because the DTCwas found to be too sensitive to the EMI generated by the sparkers. A butane lighter wasused instead. The lighter burned very cleanly and was used only for a short time to ignitethe fuel after it had been heated. The sparkers were used as a source of ignition when thetest equipment did not have failures from the EMI that they produced.
The results of this series of tests have shown that the SNL large smoke exposure chambercan produce consistent smoke exposures as measured by the chemical products of gasesand soot. This is very important when considering the need for a standardized test andfor the upcoming circuit bridging series.
D-54 NUREG/CR-6476

References
Bustard, L., and Holzman, P., 1994. "Low-Voltage Environmentally Qualified CableLicense Renewal Industry Report; Revision 1," TR-103841, published by ElectricPower Research Institute, Palo Alto, CA.
Kessel, Stephen L., Bennett, James G. Jr., and Rogers, Charles E., 1994. "CorrosivityTest Methods for Polymeric Materials. Part 1-Radiant Furnace Test Method [1],"Journal of Fire Sciences, Vol. 12, No. 2, pp. 107-133.
Korsah, K., Tanaka, Tina J., and Wilson, T. L., to be published. "Environmental Testingof an Experimental Digital Safety System," NUREG/CR 6406, Oak Ridge NationalLaboratory, Oak Ridge, TN.
Reagor, Barbara T., 1992. "Smoke Corrosivity: Generation, Impact, Detection, andProtection," Journal of Fire Sciences, Vol. 10, pp. 169-179.
NUREG/CR-6476 D-55

Appendix E
Impact of Smoke on Advanced I & C: Selection of Sample Components and Test
Matrix
A letter report to the USNRC, Office of Research
Prepared by:Tina J. Tanaka
Components and Structures Safety and Reliability DepartmentSandia National LaboratoryAlbuquerque, New Mexico
July 27, 1995
Abstract
Smoke can be a serious threat to electrical equipment. A number of plants are starting to retrofittheir safety systems and may upgrade them to microprocessor based systems. Because of thesmaller size and density of the newer equipment, smoke may cause more widespread problems inthe replacement system than in the original equipment. As a result of the concern about theeffects of smoke in nuclear power plants, the Nuclear Regulatory Commission (NRC) sponsoreda study by Sandia National Laboratory on the impact of smoke on advanced instrumentation andcontrol (I&C) equipment. This report describes some of the equipment that SNL will expose tosmoke, and the specific scenarios that it will simulate for this effort. Three types of equipmentwill be exposed: surface insulation resistance (SIR) boards, individual components (i.e., chips),and functional circuit boards. The SIR test patterns imprinted on printed circuit boards will beused to measure surface conductivity as a function of smoke deposition. Individual componentsamples will be tested to determine the effect of smoke on various kinds of chip packaging.Smoke obscuration of optical isolators will also be studied. For the functional board tests, SNLwill use a single standardized circuit board to assess the effects of smoke on functional circuits ofvarious types. To test individual components, SNL will vary the exposure conditions such asburn temperature, fuel-to-air ratio, presence of galvanic metals, humidity level, and firesuppression agents. The range of exposure conditions for the functional circuit tests will bebased on the results of the individual component tests. SNL will determine what exposureconditions will cause functional boards to fail. Using this approach, the tests will cover bothvariations in smoke exposure scenarios and variations in their effect on different types ofadvanced digital instrumentation.
NUREG/CR-6476 E-l

Acknowledgments
I would like to acknowledge the assistance of Dr. Kofi Korsah of Oak Ridge NationalLaboratory, Dr. Mahbubul Hassan of Brookhaven National Laboratory, and Dr. David Palmerand Dr. Dennis Anderson, both of Sandia National Laboratory, for educating me on digitalcomponents and component reliability. Ms. Christina Antonescu has been invaluable inprocuring funding from the U.S. Nuclear Regulatory Commission and in providing advice on theproject direction. This work was supported by the U.S. Nuclear Regulatory Commission andwas performed at Sandia National Laboratories, which is operated for the U.S. Department ofEnergy under Contract DE-AC04-94AL85000.
E-2 NUREG/CR-6476

Table of Contents
1. Introduction 4
2. Summary of Likely Failures in Microprocessor-Based Systems 4
3. Equipment to be Tested 6
3.1. SIR Boards 6
3.2. Integrated Circuits 8
3.3. Functional Board Tests 10
4. Schedule 11
4.1. Total Test Matrix 11
4.2. Schedule of Testing 12
5. Summary 12
6. References 13
NUREG/CR-6476 E-3

1. Introduction
Smoke can be a serious threat to both digital and analog electrical equipment. Research bytelecommunications companies shows that in a fire, up to 95% of the damage to electronicequipment results from smoke.1 This threat also affects nuclear power plants. In many casesnuclear power plants have had to upgrade their safety systems with microprocessor-basedsystems because no analog replacement parts are available. The newer digital equipment is morecompact and can combine many functions, such as transmitting several different reactorinstrument readings over one cable, by using networking techniques. However, as a result of thisreduction in size and combination of functions, an environmental hazard such as smoke maycause more widespread problems in a replacement digital system than it would in the originalanalog system.
In a nuclear power plant, the first few hours after a fire are critical for plant safety (the timerequired to achieve safe shutdown). Little information is available on the reliability of electronicequipment that is exposed to fire and smoke for this critical period, although some data exist onthe reliability of electrical equipment in the long term (more than several days after the fire).Short-term effects may include intermittent short circuits and may depend on conditions such ashumidity or the presence of fire suppression agents. There have been a few fire tests in whichoperating electronic equipment was exposed to smoke, but there is no standard procedure forsuch exposures. As a result of concern about the effects of smoke in nuclear power plants, the U.S. Nuclear Regulatory Commission (NRC) began a program at Sandia National Laboratories(SNL) in 1994 to study the impact of smoke on advanced instrumentation and control equipment(I&C).
The types of digital equipment that can be used to retrofit safety systems can vary widely. Inorder to limit time and effort in this project, SNL will test a limited set of typical digitalequipment. The smoke tests will expose three types of equipment: SIR boards with a specializedtest circuit, individual components (i.e., chips), and functional circuits. This report describes thevarious components that will be tested and the likely failures anticipated. SIR boards andindividual components will be tested between August and December 1995. The tests of thefunctional circuits are planned for 1996.
In a related effort, SNL and Oak Ridge National Laboratories (ORNL) are cooperating on testingthe effect of smoke on a simulated operating reactor trip system. ORNL designed, assembledand programmed the system, certain parts of which were exposed to smoke under their programon Advanced Instrumentation and Control. The tests took place in December 1994 and May-June 1995 and the results will be published shortly.2-3
2. Summary of Likely Failures in Microprocessor-Based Systems
When determining the type of equipment to test and the diagnostics required to assessperformance, it is important to determine the likely failure modes of a microprocessor system.Based on a review of the literature and discussions with experts in digital circuits, four likelymodes of smoke damage have been identified: circuit bridging, contact fouling, corrosion, and
E-4 NUREG/CR-6476

Table 1. Summary of Anticipated Failure Modes of Electronic Components in a SmokeEnvironment
Failure mechanism
Corrosion
Shorts
Increased contact resistance
Mechanical binding
Obscuration
Galvanic salt shorts
Failure cause
Acid gases can combine with water to corrode metalcontacts and cause open circuits.
Soot can act as a circuit bridge between contacts and causeleakage of currents and shorts.
Electrical contacts can be coated with soot, causingincreased contact resistance.
Mechanical equipment, such as timers, may be impeded bysoot
Smoke and soot may coat optical interfaces and reduceoptical transmission
Chlorine gases can combine with zinc from galvanizedsurfaces to form ZnCl. This compound is hygroscopic andconductive. When it combines with water it forms a syrup-like liquid that can then drip onto electronics and causeshorts.
hindering mechanical motion. Optical components may also fail because of obscuration. Failuremechanisms from smoke are believed to be similar to those due to a polluted environment.Although failures caused by pollution may occur over decades, the soot and smoke from a firecan produce failures in minutes to weeks. Table 1 summarizes the types of failures anticipatedfor electronic equipment. For advanced digital equipment, we expect failures primarily due tocorrosion and circuit bridging shorts. Contact fouling and mechanical binding are consideredunique to older analog equipment.
As a part of their collaborative work, in December 1994, ORNL and SNL exposed a smallmicroprocessor-based digital system to smoke.2 These tests provided information on the kinds offailure modes that may be possible. In the tests, a host computer interrogated the condition of theexposed digital system, but remained outside of the exposure. For one of the smoke exposures,the interrogation program stopped, which indicated an error in the exposed system, but once thesystem was restarted it then acted normally. Other failures occurred in the first 24 hours ofexposure, but also were intermittent. After exposure to smoke, the uncleaned system againworked as designed. The system was periodically tested over 1 month without failure untilhumidity was added with a cool-mist humidifier. The humidifier water condensed on the boardand shorted some of the contacts. This caused the same error that was seen during the smoketest; however, in this case the equipment would not restart.
Based on this experience, we believe that during the smoke exposure, currents leaking from thecircuit bridging caused by soot probably caused a transient error which in turn caused the
NUREG/CR-6476 E-5
program to stop, but these shorts were of such limited duration that they did not destroy theequipment. Shorts caused by circuit bridging were expected to take place during the smokeexposure and the likelihood of such shorts is probably strengthened by the introduction ofhumidity. This happened within an hour of the smoke exposure. Other effects, such as contactcorrosion, take place more slowly, perhaps over months. Since the time during and immediatelyafter a fire is so critical for a nuclear power plant if shutdown is required, SNL plans to mainlyinvestigate failure modes that are immediate (i.e., shorting and obscuration) rather than longerterm (i.e., corrosion).
3. Equipment to be Tested
Advanced microprocessor-based equipment can be classified in many ways, but all are based ona printed circuit board populated with integrated circuits (ICs) or chips. ICs are designed usingvarious technologies: transistor-transistor logic (TTL), complementary metal-oxidesemiconductor technology (CMOS) and emitter-coupled logic (ECL). Within each of thesebroad categories there as subcategories such as low-power Schottky (LS), advanced low-powerSchottky (ALS) and advanced Schottky (FAST), which are all TTL-based designs.4 The choiceof technology in a circuit is based on speed, power consumption, output, supply voltage, andnoise considerations.
The complexity of the IC determines the design and packaging of the final component. An IC byitself is very small and delicate; it is the packaging that allows digital equipment to be handledand assembled. As memory and logic chips become more complex, the density ofinterconnections within the chip grows. The number of connecting pins on the final package alsogrows with each advance in digital technology. These smaller, more densely packed connectionsmake the circuitry more susceptible to shorts or open circuits.
With respect to corrosive failures, the particular technology type, speed, or complexity of a chipshould have little effect; however, the way the ICs are packaged and mounted should affectreliability greatly. Since the IC is encased in a package, the smoke will attack the package first.Important considerations affecting corrosion include the metal or combination of metal contacts,contact spacing, applied voltages, bonding techniques, and the material which protects the chip.5
In order to understand the relative importance of these aspects, SIR boards, ICs, and functionalboards will be exposed to smoke at SNL. The SIR boards and ICs will be exposedsimultaneously while the functional boards will be tested separately in 1996. The sections whichfollow describe the test items.
3.1. SIR Boards
Soot from a fire can form a semiconductive layer on printed circuit boards. This layer can inducecurrent leakage between contacts on the boards and lead to immediate failure. One way tomeasure the change in resistance of the surface of a printed circuit board is to measure thesurface insulation resistance (SIR). This is done with a dual comb pattern made of interlaced
E-6 NUREG/CR-6476

conducting tines (see Figure 1). A voltage across the comb pattern will create a field on thesurface of the board. To measure surface insulation, the current leakage between the combpatterns is monitored. The Institute for Interconnecting and Packaging Electronic Circuits (IPC)has developed several standard SIR boards and procedures for use in measuring surfaceinsulation resistance.6 Although SIR is not a standard measure for smoke corrosivity testing, acollaborative effort of AT&T, DuPont and Underwriter's Laboratory (UL) is planning somesmoke exposures in 1995 using this technique to evaluate its use as a standard.
SNL will measure surface insulation resistance using one of these standard printed circuit boards(IPOB-24). The surface insulation resistance will be actively monitored during the smokeexposure. In order to study the effect of various coatings, three boards will be testedsimultaneously in the smoke chamber while another will be monitored as a control board outsideof the smoke exposure chamber. The boards in the smoke chamber will include an uncoatedboard, a conformally coated board, and a board enclosed in a metal box. The control board willbe at the same temperature and humidity conditions as the rest of the boards, but will not beexposed to the smoke. The SIR will be measured at three different voltages: 5 V, 50 V, and 160V. The 5-V measurement corresponds to the voltage found on many printed circuit boards. The160-V measurement was chosen to match the fields on similar boards to be tested at UL. The50-V measurement was chosen because it is in between the low and high voltage level and mayaid in determining the effect of different voltages on these circuits. Since the smoke depositioncan be affected by fields near the boards, the comb patterns will remain at the test voltage evenbetween measurements.
NUREG/CR-6476 E-7

Figure 1. Comb pattern
3.2. Integrated Circuits
Integrated circuits are generally contained in a package that allows for electrical connections butwhich protects the IC from the environment. Many of these packages are made of either plastic,ceramic, or metal bodies with copper contacts. The packages come in seven families: (1)transistor outline (TO) can, (2) single-in-line package (SIP), (3) dual-in-line package (DIP), (4)small-outline integrated circuit (SOIC) package, (5) chip carrier (this can be leadless or leaded),(6) flatpack made of ceramic or metal, and (7) grid array.7 See Figure 2 for illustrations of someof these chip packages. The first three families, the TO can, SIP, and DIP package, are mountedto a printed circuit board by drilling holes in the board and soldering the connectors to the board(through-hole mounting). The last four families are surface-mounted packages. The surface-mounted packages are connected by coating bonding pads on the printed circuit board withsolder paste, then placing the chips on the board and heating the board.
Newer surface mounting techniques allow many more connections per surface area than olderthrough-hole mounting schemes. Compact circuits not only allow for smaller packages, but alsoimprove the speed of a circuit. In a smoke environment, however, these smaller, more closelypacked connections can prove to be less reliable than the older through-hole mounted chips.Conductors that are spaced more closely together may be easier to bridge with soot and smallerconductors may corrode faster.
E-8 NUREG/CR-6476

SNL will investigate the effects of smoke on the chip-to-printed circuit board mounts bymeasuring the resistance between leads on empty chip packages. Seven different chip packageswill be mounted on a printed circuit board and tested in four different configurations: exposed tosmoke, coated with a conformal coating and then exposed to smoke, packaged in a protectivebox and then exposed to smoke, and unexposed to smoke. The seven chip packages are shown inFigure 2.
Chip packages such as the ceramic dip, ceramic flat pack, ceramic leadless chip carrier, and TOcan are initially manufactured without an IC. Typically the IC is then bonded to the connectionsinside the package and the package is sealed later. To test these chip packages, empty packages(sealed but without an internal IC) will be mounted on a printed circuit board so that theresistance between adjacent connectors can be measured during the smoke exposure. There willbe no connections inside the chip packages. Every other connector will either be connected toground or 5 V. The insulation resistance between the connectors will be monitored during thesmoke exposure. We expect that the insulation resistance will drop as the soot gets deposited,indicating the possibility of circuit bridging or leakage currents.
Small Outline IC (SOIC)Plastic
Dual-m-line (DIP) Dual-in-line (DIP)P l a s t l c Ceramic
Leaded Chip Carrier (PLCC) 3 - ..-\*Plastic % *}J}
\
Transistor Outline Can (TO) FlatpackMetal Ceramic
Leadless Chip CarrierCeramic
Figure 2. Chip packages used in chip mounting tests.
NUREG/CR-6476 E-9

Plastic-bodied chips are manufactured by first connecting the IC to the connectors, then moldingthe plastic body around the IC. It is difficult to obtain this type of chip package without aninterconnecting IC. Instead, SNL will use simple chips that contain several independent circuitsand will measure the resistance between adjacent connectors that are not on the same circuit andthus should have no interconnection. One such type of chip is the 74/04 quad hex invertercontaining four independent circuits which should have no interconnection. We purchased botha DIP- and SOIC-style hex inverter. These chips will also be mounted on the same printedcircuit board as the empty chip packages and will be subjected to the same tests.
Plastic leaded chip carrier (PLCC) bodies are only manufactured for complex integrated circuits.The simplest PLCC circuit we were able to identify is an 8 bit A/D converter with serial interface(this contains 1370 transistors!). This CMOS chip exhibits high resistance between contacts onthe input terminals when the chip is powered; therefore the chip will be powered while theresistance between adjacent contacts is measured. This chip will be mounted on the same printedcircuit board as the empty chip packages and two hex inverter chips.
Chip packaging protects the IC from stresses due to vibration and chemical attack. Ceramic andmetal packages are hermetically sealed, that is, moisture cannot get into the package; however,plastic chip bodies are permeable and exhibit less reliability in humidity tests.8 To study thedifference between plastic and ceramic packages, 16 K memory chips using both packages willbe exposed to smoke. The chips will be tested for functionality before and after the exposure.During the smoke exposure, the chips will be powered with 5 V; however, they will not beactive. These tests should determine how smoke affects the integrity of the two kinds ofpackaging.
Optical isolators are commonly used to isolate electrical signals from the rest of the circuit. Theelectrical signal is converted to an optical signal (with perhaps a light-emitting-diode, LED) andthe optical signal is then converted back into an electrical signal with a photodiode. Electricalsignals generated on the photodiode side of the circuit are not allowed to pass through to theother (LED) side of the circuit. Optical isolators are usually packaged the same way astransistors, either in metal cans or in plastic sealed packages. Because of their rather uniqueoperation, unique failure modes are expected.
SNL will actively monitor the function of a 6N135 optical isolator. This isolator is sold in amolded plastic DIP form. Previous tests showed that the smoke was the most dense withinminutes of the start of the test; therefore the performance of the isolator will be continuouslymonitored during the smoke exposure test.
3.3. Functional Board Tests
The functional board tests will use a multifunctional board developed by the Low-Residue SolderTask Force whose goal is to investigate ways to reduce the amount of ozone-depleting chemicalsused in the manufacture of printed circuit boards.9 The task force is composed of experts inprinted circuit assemblies from the military and military contractors, Department of Energy, and
E-10 NUREG/CR-6476

the Environmental Protection Agency. This task force developed a multifunctional board to testthe effectiveness of various soldering processes. The board contains four different types offunctional circuits: high voltage and low current, low voltage and high current, high-speeddigital, and high frequency. Each of these circuits includes a mixture of through-hole andsurface-mount components. In many respects, the goal in testing a functional board that usesdifferent soldering and cleaning processes is similar to the goal of the SNL smoke tests. In bothcases, deposits on the board could affect their function.
SNL plans to assess the impact of smoke on these functional boards as the third type of smokeexposure. By testing functional boards after the individual component tests, we will be able tocorrelate the change in resistance to actual failures of functional circuits. The smoke exposureconditions selected for these tests will be based on the results of the component tests.
4. Schedule
4.1. Total Test Matrix
The test conditions for a smoke scenario are affected by many factors, as discussed by Nowlen inan earlier report.10 These include the fuel composition, fuel-to-air ratio, temperature of burn,humidity, presence of galvanic metals, and presence of fire suppression agents. To limit thescope of the SIR board and individual component tests, we will allow only two conditions foreach characteristic; a high or low value, or the presence or absence of a chemical. In all cases thefuel composition will be a mixture of the most common cable insulation and jacket materials thatare now in use at commercial nuclear power plants." This reduces the complexity of the testssomewhat, but since we have identified five characteristics, each with two states, there are still32 possible environments to test (25). To increase the robustness of the test results, each testshould be performed twice, yielding 64 tests.
Some tests can be eliminated as not applicable to fires in a nuclear power plant. For example, ahigh-temperature fire implies that the fire is quite large; in such a case, all of the equipment inthe cabinet where the fire originates would most likely be destroyed. Thus, the effects of a largefire inside an equipment cabinet will not be tested. Using this reasoning, we eliminated tests fora high fuel /air ratio that also includes high heat flux (note that a small fire with the smokeconfined to a single cabinet results in the highest fire/air ratio). In most cases the relativehumidity will be high following a fire. The only case in which it would remain low is if a smallfire were confined to a single panel in the control room. This eliminates all conditions where alow fuel/air ratio can occur in conjunction with low humidity.
By considering only credible combinations of fire conditions, the total number of fireenvironments can be reduced to 14 (see Table 2). For the sake of robustness, each test will beperformed twice (a total of 28). Each of these tests will include SIR boards, the chip mountingtests, the chip packaging tests, and optical isolator tests.
NUREG/CR-6476 E-ll
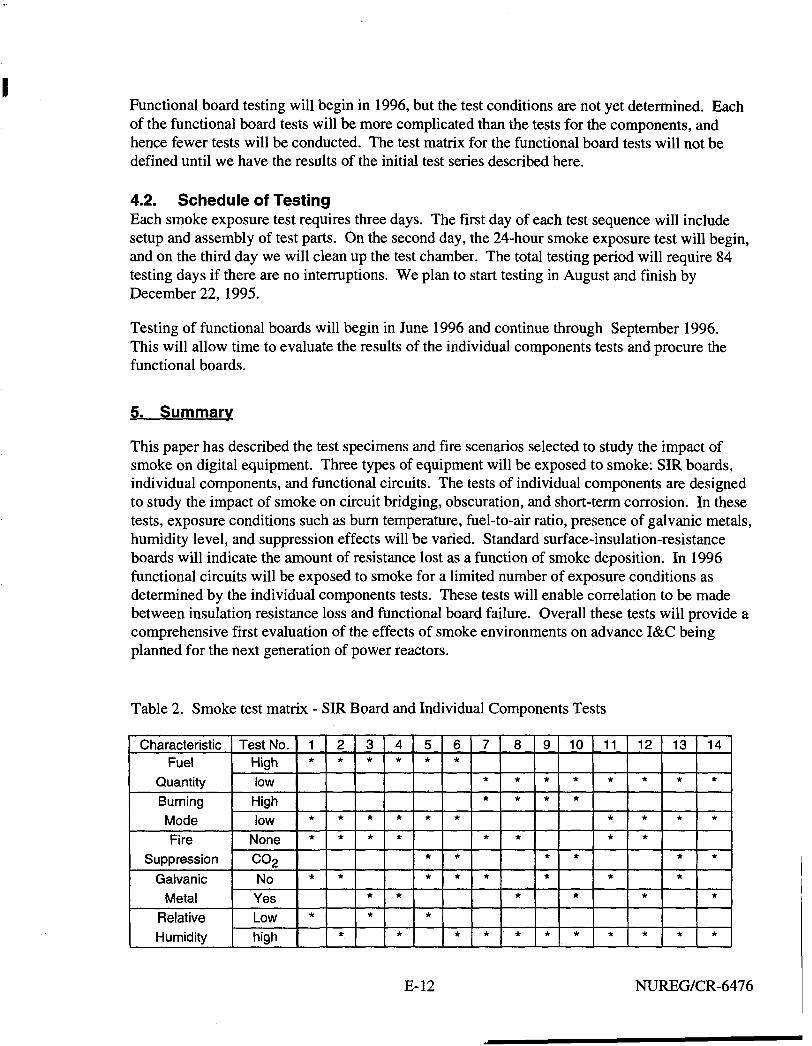
Functional board testing will begin in 1996, but the test conditions are not yet determined. Eachof the functional board tests will be more complicated than the tests for the components, andhence fewer tests will be conducted. The test matrix for the functional board tests will not bedefined until we have the results of the initial test series described here.
4.2. Schedule of TestingEach smoke exposure test requires three days. The first day of each test sequence will includesetup and assembly of test parts. On the second day, the 24-hour smoke exposure test will begin,and on the third day we will clean up the test chamber. The total testing period will require 84testing days if there are no interruptions. We plan to start testing in August and finish byDecember 22, 1995.
Testing of functional boards will begin in June 1996 and continue through September 1996.This will allow time to evaluate the results of the individual components tests and procure thefunctional boards.
5. Summary
This paper has described the test specimens and fire scenarios selected to study the impact ofsmoke on digital equipment. Three types of equipment will be exposed to smoke: SIR boards,individual components, and functional circuits. The tests of individual components are designedto study the impact of smoke on circuit bridging, obscuration, and short-term corrosion. In thesetests, exposure conditions such as burn temperature, fuel-to-air ratio, presence of galvanic metals,humidity level, and suppression effects will be varied. Standard surface-insulation-resistanceboards will indicate the amount of resistance lost as a function of smoke deposition. In 1996functional circuits will be exposed to smoke for a limited number of exposure conditions asdetermined by the individual components tests. These tests will enable correlation to be madebetween insulation resistance loss and functional board failure. Overall these tests will provide acomprehensive first evaluation of the effects of smoke environments on advance I&C beingplanned for the next generation of power reactors.
Table 2. Smoke test matrix - SIR Board and Individual Components Tests
CharacteristicFuel
QuantityBurning
ModeFire
Suppression
GalvanicMetal
RelativeHumidity
Test No.Highlow
Highlow
None
CO2
NoYes
Lowhigh
1*
**
*
*
2*
**
*
*
3*
**
**
4*
**
*
*
5*
*
*
*
*
6*
*
*
*
*
7
•
*
*
*
*
8
**
*
*
*
9
**
*
*
*
10
*
*
*
*
11
*
**
*
*
12
*
**
*
13
*
*
*
*
14
*
*
*
*
*
E-12 NUREG/CR-6476

6. References
1 Karydas, D. M., "Smoke Management Systems for the Telecommunications Industry," inNetwork Reliability: A Report to the Nation, Compendium of Technical Papers Presented bythe Federal Communications Commission's Network Reliability Council, NationalEngineering Consortium, Chicago, EL, June 1993, pp. G15-18.
2 Report to be published by SNL September 1995 on smoke exposures to multiplexer unit.
3 Report of system tests to be published by ORNL in 1995.
4 "Motorola Logic Families, Which is Best for You?", Gary Tharalson, Motorola MasterSelection Guide Rev .7, p. 3.1-3 - 3.1-6, 1994.
5 "Electronic Components and Assemblies: Reliability and Testing" by R. B. Comizzoli and J.D. Sinclair, Encyclopedia of Applied Physics, Vol. 6, 1993 VCH Publishers, Inc. pp. 21-44.
6 "IPC Cleaning and Cleanliness Test Program: Phase 3 Water Soluble Fluxes Part 1" DouglasPauls, September 30, 1992, Institute for Interconnecting and Packaging Electronic Circuits(IPC). Presented at IPC 1992 Fall Meeting Oct. 12-15, 1992.
7 "Overview of Chip-Level Packaging," Barry C. Johnson, Electronic Materials Handbook,ASM International Handbook Committee, pp. 398-407.
8 "Corrosion Criteria for Electronic Packaging: Part Ill-Corrosion by Package Family," Carl E.Hoge, IEEE Trans, on Components, Hybrids, and Manufacturing Technology, Vol 13, no 4p. 1105, 1990.
9 "Test Plan for the Evaluation of Low-Residue Soldering in Military Applications," Preparedby the Low-Residue Soldering Task Force, R. Iman, Sandia National Laboratories, March 1,1994.
10 "Defining Credible Smoke Exposure Scenarios," A letter report to the NRC, prepared bySteve Nowlen, Sandia National Laboratories, Albuquerque, NM, September 1994.
11 "Low-Voltage Environmentally Qualified Cable License Renewal Industry Report; Revision1," by L. Bustard and P. Holzman, TR-103841, Published by Electric Power ResearchInstitute, Palo Alto, CA, July 1994,
NUREG/CR-6476 E-13

Appendix F
Component Test Results
This appendix is composed of tables and plots of information from the component testsand includes the physical and chemical measurements of the smoke environment, scatterplots of the resistance of the circuit bridging measurements, and coefficients that modelresistances from the circuit bridging measurements. These measurements may be usefulfor comparing smoke exposure tests and for in-depth analysis of the results.
Table
Test12345678910111213141516171819202122232425 ^2627
1. Temperature and humidity during smoke exposures.
Ave Temp25.124.324.426.226.725.426.325.424.825.025.127.025.825.525.226.329.629.924.624.125.924.024.026.130.029.025.9
Min Temp22.921.421.3-3.421.021.821.58.7
22.320.821.522.322.22.2
23.023.122.222.421.222.621.720.221.321.923.021.522.2
Max Temp30.828.727.331.231.732.531.432.728.928.831.931.930.930.533.033.341.238.132.327.329.629.632.230.540.047.530.2
Ave Hum70.973.271.270.670.368.471.269.471.771.569.520.121.422.266.870.058.560.118.115.872.315.913.014.452.163.569.6
Min Hum61.464.861.563.763.557.965.353.136.251.154.619.220.320.454.559.940.242.213.611.464.79.311.512.138.048.861.5
Max Hum76.877.275.679.678.676.978.979.076.378.479.828.524.424.977.278.677.676.420.518.776.918.814.516.577.481.577.3
NUREG/CR-6476 F-l

Table 1 presents the temperatures in the exposure chamber and the humidity that wasmeasured inside the environmental chamber surrounding the exposure chamber. Thetemperatures in the exposure chamber were measured in 10 locations, 5 near the ceilingof the chamber, and 5 near the floor. The average temperature presented in the table isthe average for the entire 24 hour test for all 10 locations. The locations and methods ofmeasurements are the same as those in Appendix 4. The very low temperatures that wererecorded for tests 4, 8, and 14 are the result of cooling by the addition of CO2. Humiditywas measured inside the environmental chamber, but outside of the smoke exposurechamber throughout the 24-hour test. The smoke would have affected the accuracy andlifetime of the humidity sensor, therefore, the humidity inside the exposure chamberduring the smoke exposure was not recorded. Immediately after the 1 hour smokeexposure, the exposure chamber was vented and the air from the environmental chamberwas drawn into the exposure chamber, so the humidity of most of each test is included inTable 1, but not the humidity during the actual smoke exposure.
Measurements of the fuel trays before and after the burn determined the amount of fuelburned in grams. Although this does not indicate how much is deposited, it is a practicalmeasurement for reproduction of the effects. In the main body of this paper, the results ofthe tests were evaluated in terms of high and low states of such factors as fuel load andburn temperature. These factors determine how much smoke is deposited on the samples,but are not direct measurements of the smoke deposition. Table 2 presents severaldifferent measurements of how much smoke was deposited during the smoke exposuretests; some of these measurements are direct while others are measurements of secondaryeffects. Most of the smoke was deposited on horizontal surfaces, especially as theamount of deposition increased. These measurements are included in this appendix sothat comparisons can be made with other experiments.
Quartz crystal microbalances (QCM) actively measured the smoke deposition in twoplanes, vertical and horizontal, in jxg/cm2. A description of the QCMs is included inAppendix 4. Mass densities greater than 200 |ig/cm2 frequently caused the QCM to stoposcillating; therefore, for most high fuel load tests, the QCMs did not provide ameasurement for the horizontal plane. Although the QCMs were not placed at the sameposition in the chamber as the components, the QCM measurements are the most directmeasurement of deposition that was obtained in these tests.
The turbidimeter measured the smoke optical density in terms of the extinctioncoefficient (turbidity). The turbidity in cm'1 is presented for three wavelengths, IR (1.060|i), red (0.6328 (i), and blue (0.4579 (i). The larger extinction coefficients correspond tomore opaque smoke. The optical density is often measured on standard smoke tests ofmaterials and was included here for reference.
Many studies on corrosion and electronic equipment damage are based on the density ofchlorides, bromides and sulfates on surfaces. Threfore 4.25 cm circles of ashless filterpaper were placed in the smoke exposure chamber and were analyzed by ionchromotography for chlorine, bromine, and sulfate. The results of these analyses arepresented in Table 2 in terms of milligrams of chemical per filter.
F-2 NUREG/CR-6476

1?
ON
Table 2.
Test No.
1
Is)
3
4
5
6
7
8
9
10
11
12
Smoke generation measurements.
Wt. Loss
2.48
2.15
2.12
30.8
31.47
2.51
31.26
2.54
2.1
1.6
2.15
34.93
Hor.QCM
5.6
15
10.7
>200
>200
3.1
194
5.1
10.7
5.1
3.5
>200
Vert.QCM
1.5
1.6
0.8
4.9
7.2
1.8
4
2.2
0.7
0.68
1.1
2.4
IR
„
Red
„
—-
Blue
„
_
Cl (norm)
0.044
_.
0.175
0.027
..
. .
0.098
(Cl)lim
0.005
..
. .
0.005
0.005
_.
0.005
Bromide
0.014
__
. .
0.139
0.008
_
. .
0.216
(Br) lim
0.001
„
0.005
0.001
. .
. .
0.005
Sulfate (norm)
0.005
..
. .
0.007
0.003
. „
. .
0.005
(S) lim
0.001
0.001
0.001
0.001
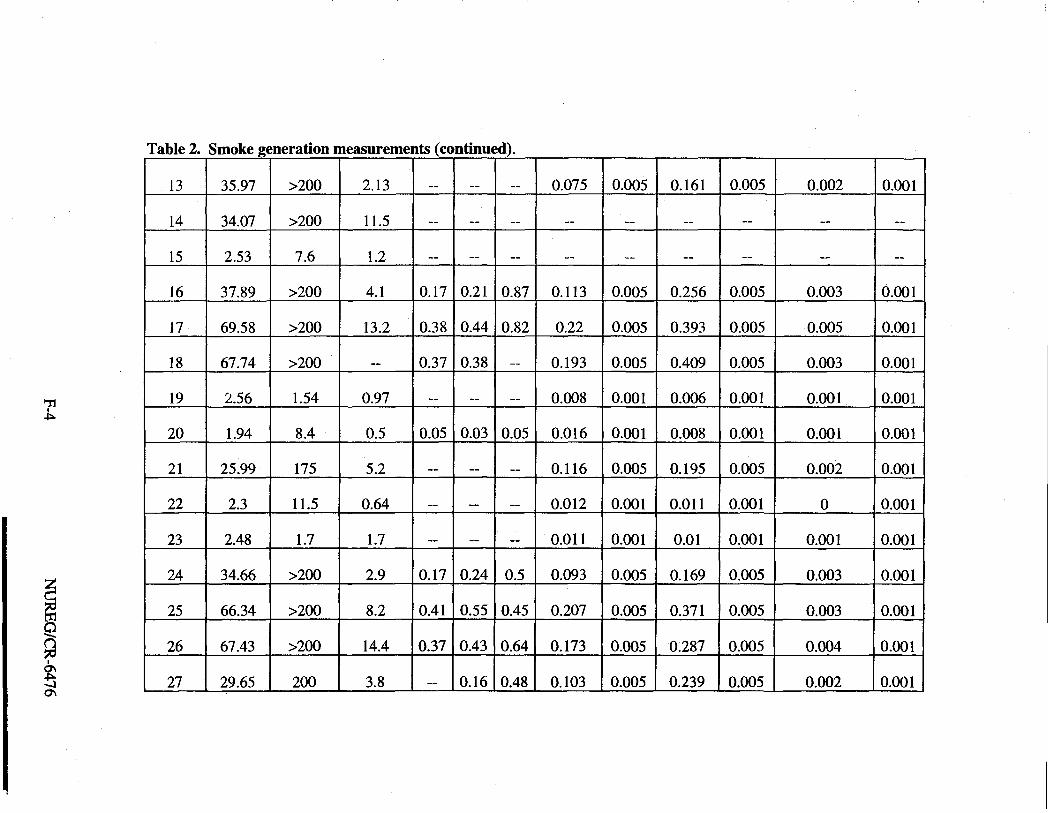
O
s
Table 2.
13
14
15
16
17
18
19
20
21
22
23
24
25
26
27
Smoke generation measurements (continued).
35.97
34.07
2.53
37.89
69.58
67.74
2.56
1.94
25.99
2.3
2.48
34.66
66.34
67.43
29.65
>200
>200
7.6
>200
>200
>200
1.54
8.4
175
11.5
1.7
>200
>200
>200
200
2.13
11.5
1.2
4.1
13.2
_
0.97
0.5
5.2
0.64
1.7
2.9
8.2
14.4
3.8
..
. .
0.17
0.38
0.37
0.05
. .
. .
0.17
0.41
0.37
. .
0.21
0.44
0.38
0.03
_
..
0.24
0.55
0.43
0.16
_
0.87
0.82
0.05
..
0.5
0.45
0.64
0.48
0.075
..
. .
0.113
0.22
0.193
0.008
0.016
0.116
0.012
0.011
0.093
0.207
0.173
0.103
0.005
_
0.005
0.005
0.005
0.001
0.001
0.005
0.001
0.001
0.005
0.005
0.005
0.005
0.161
_.
0.256
0.393
0.409
0.006
0.008
0.195
0.011
0.01
0.169
0.371
0.287
0.239
0.005
. .
. .
0.005
0.005
0.005
0.001
0.001
0.005
0.001
0.001
0.005
0.005
0.005
0.005
0.002
..
. .
0.003
0.005
0.003
0.001
0.001
0.002
0
0.001
0.003
0.003
0.004
0.002
0.001
..
. .
0.001
0.001
0.001
0.001
0.001
0.001
0.001
0.001
0.001
0.001
0.001
0.001

The amount of smoke that was produced was not only dependent on the amount of fuel,but also upon the burn temperature. This point is illustrated in Table 3 where thepercentage of weight lost by the fuel (including copper conductors) can be compared withthe conditions under which the fuel was burned. The lowest percentages of weight lostcorrespond to the conditions of high fuel and low burning temperature; the highestpercentages of weight lost correspond to a small amount of fuel and a high burntemperature. Large amounts of fuel are slower to burn, especially if the burningtemperature is low. The burn temperature also influences how much of the available fuelis released in the fire.
Table 3. Percentage of fuel 1
Test No.
123456789101112131415161718192021222324252627
PercentWt. Loss
48.740.342.518.618.748.518.849.139.331.444.121.321.920.848.623.442.441.849.339.816.245.448.421.241.441.418.5
Fuel
000110100001110111001001111
burned.
Burn
100001010010001011100010110
NUREG/CR-6476 F-5

Figures 1 to 33 are scatter plots of the resistance for the 7 chips and 4 comb patternsmeasured in these tests. These plots show how the chips and comb patterns as a wholereact to the smoke. Each chip or comb pattern has three plots of logw(R): pretest valueagainst during smoke, pretest value against after smoke, and during smoke against aftersmoke. The pretest value was a single measurement; the values for during and aftersmoke values were averages. Four symbols were used to depict the four board conditionsof bare (solid circle), coated (open square), chassis (open triangle), and control (*). Aline with a slope of 1 is included for reference. Points that fall on the line indicate nochange among the values that are plotted. These plots provide a general indication ofhow the different components reacted to smoke during the various stages of the test.
LCC
16.00
14.00 -•
1 2 . 0 0 -
1 0 . 0 0 -
8.00 • •
6.00 • •
4.00 -
2.00 •
0.00
•
n
X
BareCoatedChassisControl
-Slope 1
0.00 2.00 4.00 6.00 8.00 10.00
Pretest
12.00 14.00 16.00
Figure 1. Leadless Chip Carrier Log10(R) Pretest vs. During Smoke
F-6 NUREG/CR-6476

LCC
16.00
14.00 -•
12.00 --
10.00 -•
8.00 -
6.00 -•
4.00 -•
2.00 -•
0.00
•
D
A
SK
BareCoatedChassisControl
-Series5
0.00 2.00 14.00 16.00
Figure 2. Leadless Chip Carrier Log10(R) Pretest vs. After Smoke
LCC
I
16.00
14.00--
12.00 -
10.00 ••
8.00 -
6.00 - •
4.00 • •
2.00 ••
0.00
•
•
X
Bare
Coated
Chassis
Control
-Series5
0.00 2.00 4.00 6.00 8.00 10.00
During Smoke
12.00 14.00 16.00
Figure 3. Leadless Chip Carrier LogU)(R) During Smoke vs. After Smoke
NUREG/CR-6476 F-7

CDP
16.00
14.00 - -
12.00 - -
10.00 • •
8.00 -•
6.00 -
4.00 --
2.00 - •
0.00
0.00 2.00 4.00 6.00 8.00 10.00
Pretest
12.00 14.00
•aA
X
Bare
Coated
Chassis
Control
-Slope 1
16.00
Figure 4. Ceramic DIP Log10(R) Pretest vs. During smoke
CDP
16.00
0.00
0.00 2.00 4.00 6.00 8.00 10.00
Pretest
12.00 14.00
•D
A
X
Bare
Coated
Chassis
Control
-Series5
16.00
Figure 5. Ceramic DIP Log10(R) Pretest vs. After smoke
F-8 NUREG/CR-6476

CDP
16.00
14.00 -
12.00 •
10.00 • •
Iat 8.00 -
6.00-
4 . 0 0 • •
2.00 -
0.00
ACM S
•aA
X
Bare
Coated
Chassis
Control
-Series5
0.00 2.00 4.00 6.00 8.00 10.00
During Smoke
12.00 14.00 16.00
Figure 6. Ceramic DIP Log10(R) During smoke vs. After smoke
CFP
16.00
14.00 -
12.00 • •
10.00 -•
8.00 •
6.00 - •
4.00 •
2.00 •
0.00
•
D
A
X
Bare
Coated
Chassis
Control
-Slope 1
0.00 2.00 4.00 6.00 8.00
Pretest
10.00 12.00 14.00 16.00
Figure 7. Ceramic Flat Pack Log,0(R) Pretest vs. During smoke
NUREG/CR-6476 F-9

CFP
16.00
0.00
0.00
•
•
X
Bare
Coated
Chassis
Control
-Series5
2.00 4.00 6.00 8.00 10.00
Pretest
12.00 14.00 16.00
Figure 8. Ceramic Flat Pack Log10(R) Pretest vs. After smoke
CFP
16.00
14.00 -
12.00 ••
1 0 . 0 0 -
8.00 • •
6 .00 •
4 .00 • •
2 .00 • •
0.00
•
a
X
Bare
Coated
Chassis
Control
-SeriesS
0.00 2.00 4.00 6.00 8.00 10.00
During Smoke
12.00 14.00 16.00
Figure 9. Ceramic Flat Pack Log10(R) During smoke vs. After smoke
F-10 NUREG/CR-6476

TOC
16.00
14.00 - •
1 2 . 0 0 • •
10.00
8.00 -
6.00 -
4.00-•
2.00 -
0.00
•
•A
X
Bare
Coated
Chassis
Control
-Slope 1
0.00 2.00 14.00 16.00
Figure 10. Transistor Outline Can Log10(R) Pretest vs. During smoke
TOC
1
16.00
1 4 . 0 0 • •
1 2 . 0 0 • •
1 0 . 0 0 -
8.00 - -
6.00 -
4 .00 - •
2 .00 • •
0.00
•
D
A
X
Bare
Coated
ChassisControl
•SeriesS
0.00 2.00 14.00 16.00
Figure 11. Transistor Outline Can LogI0(R) Pretest vs. After smoke
NUREG/CR-6476 F-ll

TOC
16.00
0.000.00 2.00 4.00 6.00 8.00
During Smoke
•aA
X
Bare
Coated
Chassis
Control
-Series5
10.00 12.00 14.00 16.00
Figure 12. Transistor Outline Can Lglo(R) During smoke vs. After smoke
PLC
16.00
0.00
0.00 2.00
•
D
A
X
BareCoated
Chassis
Control
- Slope 1
14.00 16.00
Figure 13. Plastic Leaded Chip Carrier Logl0(R) Pretest vs. During smoke
F-12 NUREG/CR-6476

PLC
10.UU •
14.00 •
12.00
10.00 •
8.00 •
6.00-
4.00-
2.00-
0.00-
• n o %r
JC AA A • • ABUB
/
Z_ 1 1 1 1 1 1
/
AT^ i
D
D
a
•D
A
X
Bare
Coated
Chassis
Control
-Series5
0.00 2.00 4.00 6.00 8.00
Pretest
10.00 12.00 14.00 16.00
Figure 14. Plastic Leaded Chip Carrier Log1()(R) Pretest vs. After smoke
PLC
16.00
14.00 -•
12.00 -
10.00-
t& 8.00 •
I6.00 • •
4 . 0 0 • •
2 . 0 0 • •
0.00
•D
A
X
Bare
Coated
Chassis
Control
-Series5
0.00 2.00 4.00 6.00 8.00 10.00
During Smoke
12.00 14.00 16.00
Figure 15. Plasctic Leaded Chip Carrier Log 10(R) During smoke vs. After smoke
NUREG/CR-6476 F-13

SOIC
16.00
1 4 . 0 0 • •
12.00--
1 0 . 0 0 -
8.00 - -
6.00 - -
4.00 -
2.00 - -
0.00
•
•A
X
Bare
Coated
Chassis
Control
-Slope 1
0.00 2.00 14.00 16.00
Figure 16. Small Outline Integrated Chip Log10(R) Pretest vs. During smoke
16.00
14.00-
12.00 ••
10.00 •
8.00-
6.00-
4.00 •
2.00 -
0.00
SOI
•
aA
X
Bare
Coated
Chassis
Control
-Series5
0.00 2.00 4.00 6.00 8.00 10.00
Pretest
12.00 14.00 16.00
Figure 17. Small Outline Integrated Chip Log10(R) Pretest vs. After smoke
F-14 NUREG/CR-6476

SOIC
16.00
0.000.00 2.00 4.00 6.00 8.00 10.00
During Smoke
•
aA
X
BareCoatedChassisControl
-Series5
12.00 14.00 16.00
Figure 18. Small Outline Integrated Chip Log1Q(R) During smoke vs. After smoke
PDP
IO.UU •
14.00 -
12.00 -
10.00-
2o
iro 8.00c
Uur
6.00-
4.00
2.00-
0.00
X X X
S& A
/
. x* x
r>^J
X y S
+S xa a/% °a a
Ufa
a A . AA . *
A A
A\i
A
*
G
0•
••A
X
BareCoatedChassisControl
-Slope 1
0.00 2.00 4.00 6.00 8.00Pretest
10.00 12.00 14.00 16.00
Figure 19. Plastic DIP Log10(R) Pretest vs. During smoke
NUREG/CR-6476 F-15

PDP
16.00
14.00 •
12.00 • •
10.00--
8.00 - •
6 .00 - •
4 . 0 0 • •
2 . 0 0 • •
0.00
•oA
X
BareCoated
Chassis
Control-Series5
0.00 2.00 14.00 16.00
Figure 20. Plastic DIP Log10(R) Pretest vs. After smoke
PDP
16.00 •
I
14.00 - •
12.00 ••
10.00--
8 . 0 0 • •
6.00 • •
4.00 • •
2.00 • -
0.00
0.00
A •
•
D
A
X
BareCoated
Chassis
Control-Series5
2.00 4.00 6.00 8.00 10.00
During Smoke
12.00 14.00 16.00
Figure 21. Plastic DIP Log10(R) During smoke vs. After smoke
F-16 NUREG/CR-6476

Comb Pattern, 160 V
16.00
14.00
12.00-
10.00
I8.00-
6.00 •
4.00 - -
2 . 0 0 • •
0.00
•
aA
X
Bare
Coated
Chassis
Control
-Slope 1
0.00 2.00 14.00 16.00
Figure 22. Comb Pattern, 160 V, Log10(R) Pretest vs. During smoke
COMB PATTERN 160 V
I
1O.UU -
14.00 •
12.00 •
10.00 -
8.00-
6.00-
4.00-
2.00 •
0.00-
A
x *XX * ,
o Jf* °
y S A AAD D
<?L i 1 1 1 1
J*A A x A
xs'
yK
# D
a A
yA' X
X
a
B
0.00 2.00
•
aA
X
Bare
Coated
Chassis
Control-Series5
4.00 6.00 8.00 10.00
Pretest
12.00 14.00 16.00
Figure 23. Comb Pattern, 160 V, Log10(R) Pretest vs. After smoke
NUREG/CR-6476 F-17

COMB PATTERN, 160 V
16.00
0.00
•
•A
X
BareCoaledChassisControl
-Series5
0.00 2.00 4.00 6.00 8.00 10.00
During Smoke
12.00 14.00 16.00
Figure 24. Comb Pattern, 160 V, Log]0(R) During smoke vs. After smoke
Comb Pattern, 50 V
16.00
14.00 -
12.00
10.00 •
I8.00 •
6.00
4.00 - -
2.00
0.00
•
aA
X
BareCoatedChassisControl
-Slope 1
0.00 2.00 4.00 6.00 8.00 10.00
Pretest12.00 14.00 16.00
Figure 25. Comb Pattern, 50 V, Log10(R) Pretest vs. During smoke
F-18 NUREG/CR-6476
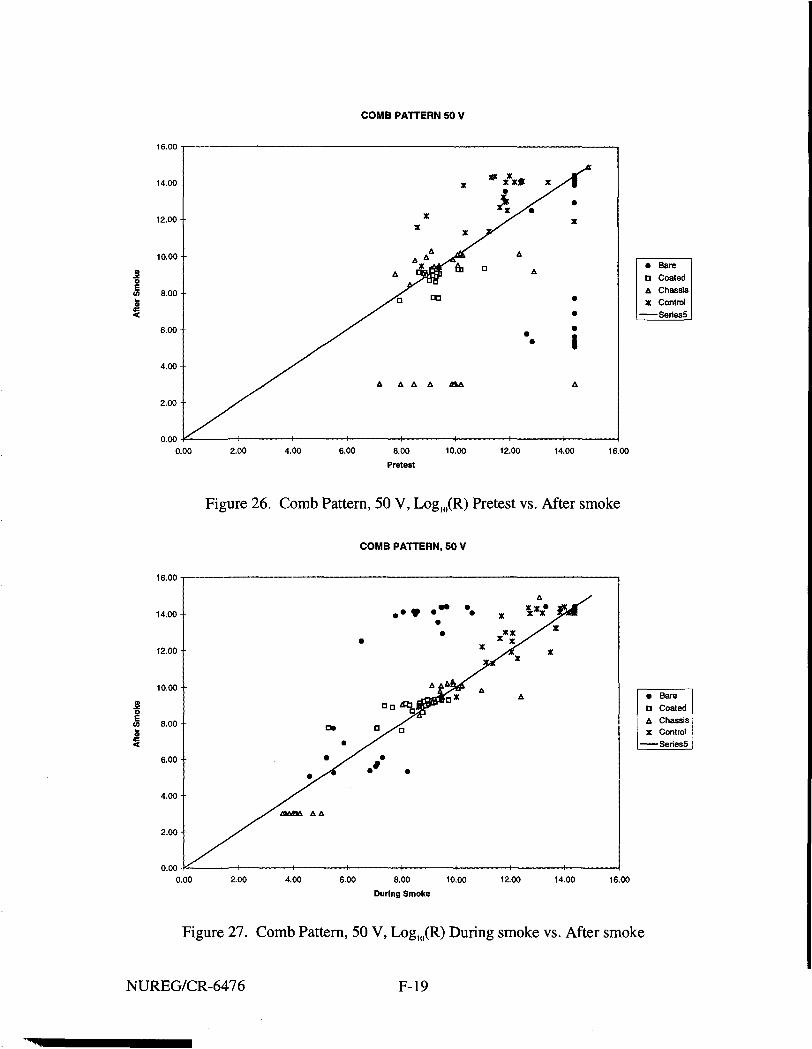
COMB PATTERN 50 V
0.000.00 2.00 4.00 6.00 8.00 10.00
Pretest
•aA
X
BareCoatedChassisControl
-Series5
12.00 14.00 16.00
Figure 26. Comb Pattern, 50 V, Log10(R) Pretest vs. After smoke
COMB PATTERN, 50 V
IO.UU -
14.00 -
12.00 -
10.00 •
8.00 •
6.00-
4.00-
2.00-
0.00 •
•
/
1 1 , 1
••A
X
Bare
Coated
Chassis
Control-SeriesS
0.00 2.00 4.00 6.00 8.00
During Smoke
10.00 12.00 14.00 16.00
Figure 27. Comb Pattern, 50 V, Log]0(R) During smoke vs. After smoke
NUREG/CR-6476 F-19

Comb Pattern, 5 V
16.00
14.00 •
12.00 •
10.00
8.00-
6.00
4.00
2.00 •
0.000.00 2.00 4.00 6.00 8.00 10.00
Pretest
12.00 14.00
•D
A
X
Bare
Coated
Chassis
Control
- Slope 1
16.00
Figure 28. Comb Pattern, 5 V, Log10(R) Pretest vs. During smoke
COMB PATTERN 5 V
16.00
0.00
0.00 2.00 14.00
•
D
A
X
Bare
Coated
Chassis
Control
-Serles5
16.00
Figure 29. Comb Pattern, 5 V, Log10(R) Pretest vs. After smoke
F-20 NUREG/CR-6476

COMB PATTERN, 5 V
16.00
14.00 •
12.00
10.00 •
8.00 -
6.00 •
4.00-
2.00-
0.00
•
a
A
X
BareCoated
Chassis
Control-Series5
0.00 2.00 4.00 6.00 8.00 10.00
During Smoke
12.00 14.00 16.00
Figure 30. Comb Pattern, 5 V, Log10(R) During smoke vs. After smoke
Comb Pattern, ground
16.00
14.00 •
12.00-
10.00 • -
8.00-
6.00 • •
4.00 - •
2.00-
0.00
•
a
A
X
Bare
Coated
Chassis
Control
-Slope 1
0.00 2.00 14.00 16.00
Figure 31. Comb Pattern, Grounded, Log10(R) Pretest vs. During smoke
NUREG/CR-6476 F-21

COMB PATTERN, GROUNDED
1
16.00
14.00 -
12.00 -
10.00 •
8.00 - •
6.00 -
4.00 -
2 . 0 0 • •
0.00
•
D
A
X
BareCoatedChassisControl
-Series5
0.00 2.00 14.00 16.00
Figure 32. Comb Pattern, Grounded, Logl0(R) Pretest vs. After smoke
COMB PATTERN, GROUNDED
16.00
14.00
12.00 -
10.00 -
8.00 •
6.00
4 . 0 0 • •
2.00
0.00
•
D
X
BareCoatedChassisControl
-Series5
0.00 2.00 4.00 6.00 8.00 10.00
During Smoke12.00 14.00 16.00
Figure 33. Comb Pattern, Grounded, Log10(R) During smoke vs. After smoke
F-22 NUREG/CR-6476

Table 4 presents the coefficients for the equations from the general linear regressionanalyses. The resistance responses that were modeled were those that were plotted inFigures 1 to 33: \ogm(R) at pretest, during the smoke production, and after the smokeexposure. The coefficients in the table are for the factors determined to be significant.Abbreviations have been used in this table to depict fuel level (F), burn temperature (B),PVC (P), humidity (H), galvanic metal (G), and suppression (S). Combinations of termsare indicated by F x B x G, for example. The column labeled R2 quantifies the percent ofthe observed variation in the response variable that is explained by the model.
NUREG/CR-6476 F-23
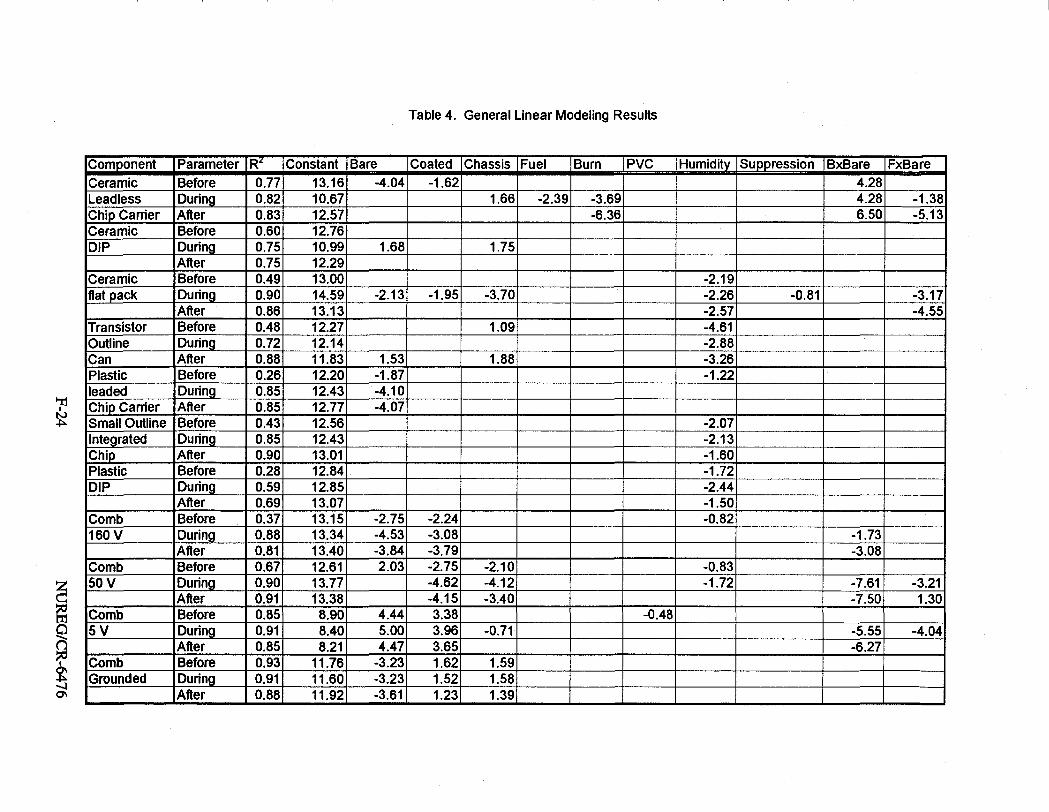
Table 4. General Linear Modeling Results
ON
ComponentCeramicLeadlessChip CarrierCeramicDIP
Ceramicflat pack
TransistorOutlineCanPlasticleadedChip CarrierSmall OutlineIntegratedChipPlasticDIP
Comb160 V
Comb50 V
Comb5V
CombGrounded
ParameterBeforeDuringAfterBeforeDuringAfterBeforeDuringAfterBeforeDuringAfterBeforeDuringAfterBeforeDuringAfterBeforeDuringAfterBeforeDuringAfterBeforeDuringAfterBeforeDuringAfterBeforeDuringAfter
RJ
0.770.820.830.600.750.750.490.900.860.480.720.880.260.850.850.430.850.900.280.590.690.370.880.810.670.900.910.850.910.850.930.910.88
Constant13.1610.6712.5712.7610.9912.2913.0014.5913.1312.2712.1411.8312.2012.4312.7712.5612.4313.0112.8412.8513.0713.1513.3413.4012.6113.7713.388.908.408.21
11.7611.6011.92
Bare-4.04
1.68
-2.13
1.53-1.87-4.10-4.07
-2.75-4.53-3.842.03
4.445.004.47
-3.23-3.23-3.61
Coated-1.62
-1.95
-2.24-3.08-3.79-2.75-4.62-4.153.383.963.651.621.521.23
Chassis
1.66
1.75
-3.70
1.09
1.88
-2.10-4.12-3.40
-0.71
1.591.581.39
Fuel
-2.39
Burn
-3.69-6.36
PVC
-0.48
Humidity
-2.19-2.26-2.57-4.61-2.88-3.26-1.22
-2.07-2.13-1.60-1.72-2.44-1.50-0.82
-0.83-1.72
Suppression
-0.81
BxBare4.284.286.50
-1.73-3.08
-7.61-7.50
-5.55-6.27
FxBare
-1.38-5.13
-3.17-4.55
-3.211.30
-4.04

Table 4. General Linear Modeling Results
n
7Is)
ComponentCeramicLeadlessChip CarrierCeramicDIP
Ceramicflat pack
TransistorOutlineCanPlasticleadedChip CarrierSmall OutlineIntegratedChipPlasticDIP
Comb160 V
Comb50 V
Comb5V
CombGrounded
ParameterBeforeDuringAfterBeforeDuringAfterBeforeDuringAfterBeforeDuringAfterBeforeDuringAfterBeforeDuringAfterBeforeDuringAfterBeforeDuringAfterBeforeDuringAfterBeforeDuringAfterBeforeDuringAfter
HxBare
-3.38-4.18-2.72-4.41-2.87
3.821.682.01
2.171.11
-3.03
SxBare
-1.81
GxBare-1.97
BxCoated
1.51
-0.88
FxCoated
5.12
-5.67-3.12-7.06
-3.38-2.22
PVCxCoated
2.79
3.08
-1.72
-1.66
-1.65
-1.78
HxCoated
3.05
3.14
-1.95-2.68
1.39
GxCoated
-2.26
BxChassis
3.466.59
-1.27
-1.57
-2.97-4.13
FxChassis
1.92
-1.14
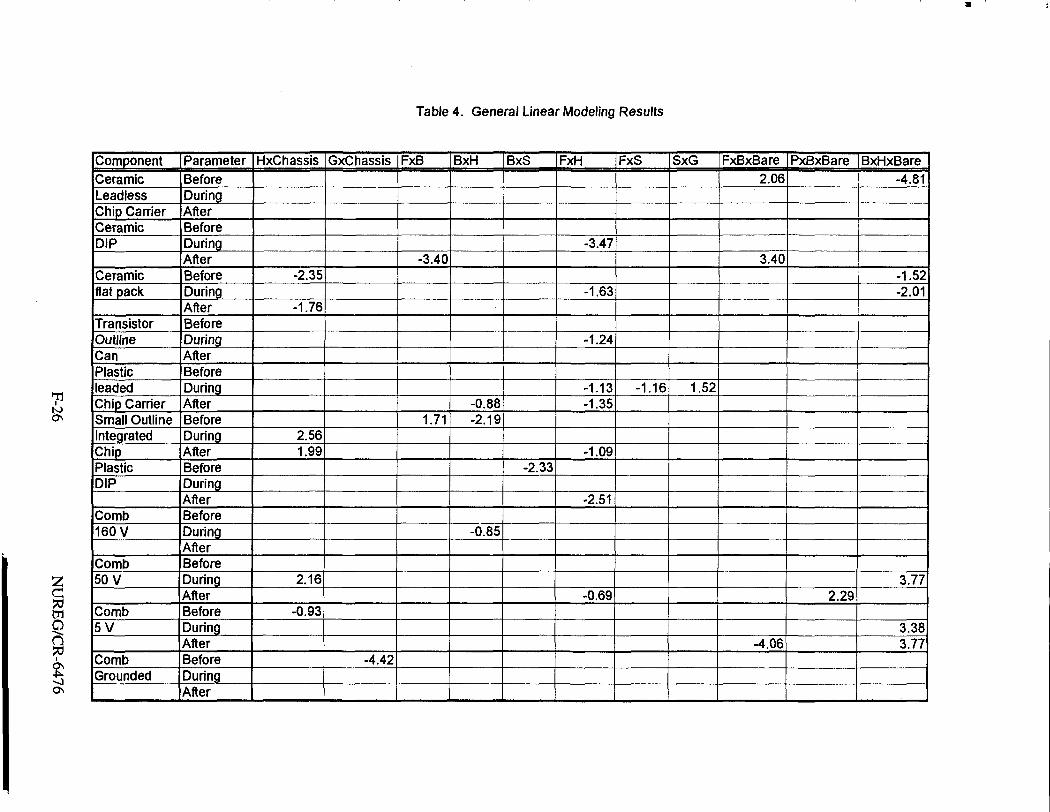
Table 4. General Linear Modeling Results
7*to
9
ComponentCeramicLeadlessChip CarrierCeramicDIP
Ceramicflat pack
TransistorOutlineCanPlasticleadedChip CarrierSmall OutlineIntegratedChipPlasticDIP
Comb160 V
Comb50 V
Comb5V
CombGrounded
ParameterBeforeDuringAfterBeforeDuringAfterBeforeDuringAfterBeforeDuringAfterBeforeDuringAfterBeforeDuringAfterBeforeDuringAfterBeforeDuringAfterBeforeDuringAfterBeforeDuringAfterBeforeDuringAfter
HxChassis
-2.35
-1.76
2.561.99
2.16
-0.93
GxChassis
-4.42
FxB |BxH
-3.40
1.71-0.88-2.19
-0.85
BxS |FxH
-2.33
-3.47
-1.63
-1.24
-1.13-1.35
-1.09
-2.51
-0.69
FxS
-1.16
SxG
1.52
FxBxBare2.06
3.40
-4.06
PxBxBare
2.29
BxHxBare-4.81
-1.52-2.01
3.77
3.383.77

Table 4. General Linear Modeling Results
ComponentCeramicLeadlessChip CarrierCeramicDIP
Ceramicflat pack
TransistorOutlineCanPlasticleadedChip CarrierSmall OutlineIntegratedChipPlasticDIP
Comb160 V
Comb50 V
Comb5V
CombGrounded
ParameterBeforeDuringAfterBeforeDuringAfterBeforeDuringAfterBeforeDuringAfterBeforeDuringAfterBeforeDuringAfterBeforeDuringAfterBeforeDuringAfterBeforeDuringAfterBeforeDuringAfterBeforeDuringAfter
BxGxBare
-2.84
-3.55
FxHxBare
-6.42
-3.27
-3.70-9.11
-2.73-3.69
-6.71-6.89
-5.58-6.06
-1.08
1.73
FxSxBare
-2.78
-3.17
-3.49-4.22
FxGxBare
2.54
HxSxBare-2.32
SxGxBare6.59
FxBxCoated
1.85
-1.99
-3.13
PxBxCoated
-5.18
BxHxCoated
2.95
-1.76

Table 4. General Linear Modeling Results
to00
n
§as
ComponentCeramicLeadlessChip CarrierCeramicDIP
Ceramicflat pack
TransistorOutlineCanPlasticleadedChip CarrierSmall OutlineIntegratedChipPlasticDIP
Comb160 V
Comb50 V
Comb5V
CombGrounded
ParameterBeforeDuringAfterBeforeDuringAfterBeforeDuringAfterBeforeDuringAfterBeforeDuringAfterBeforeDuringAfterBeforeDuringAfterBeforeDuringAfterBeforeDuringAfterBeforeDuringAfterBeforeDuringAfter
BxSxCoated
-9.76-7.09-8.34
BxGxCoated IFxHxCoated
6.75
-2.29
-4.89-4.75
-3.13
-7.77
-2.40-4.11
FxSxCoated
-4.43
3.01
-1.05
FxGxCoated
2.62
1.55
PxHxCoated
4.94
-1.12
SxHxCoated
1.28
GxHxCoated
-3.44
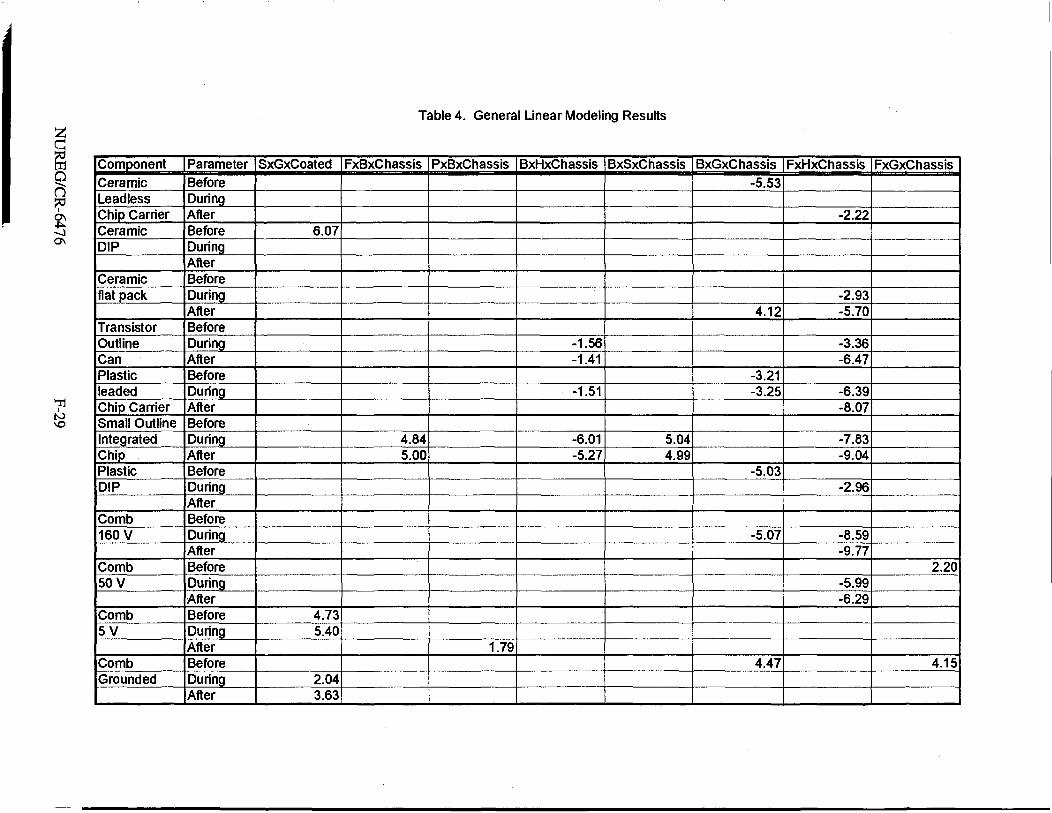
Table 4. General Linear Modeling Results
8nON
ComponentCeramicLeadlessChip CarrierCeramicDIP
Ceramicflat pack
TransistorOutlineCanPlasticleadedChip CarrierSmall OutlineIntegratedChipPlasticDIP
Comb160 V
Comb50 V
Comb5V
CombGrounded
ParameterBeforeDuringAfterBeforeDuringAfterBeforeDuringAfterBeforeDuringAfterBeforeDuringAfterBeforeDuringAfterBeforeDuringAfterBeforeDuringAfterBeforeDuringAfterBeforeDuringAfterBeforeDuringAfter
SxGxCoated
6.07
4.735.40
2.043.63
FxBxChassis
4.845.00
PxBxChassis
1.79
BxHxChassis
-1.56-1.41
-1.51
-6.01-5.27
BxSxChassis
5.044.99
BxGxChassis-5.53
4.12
-3.21-3.25
-5.03
-5.07
4.47
FxHxChassis
-2.22
-2.93-5.70
-3.36-6.47
-6.39-8.07
-7.83-9.04
-2.96
-8.59-9.77
-5.99-6.29
FxGxChassis
2.20
4.15

Table 4. General Linear Modeling Results
ComponentCeramicLeadlessChip CarrierCeramicDIP
Ceramicflat pack
TransistorOutlineCanPlasticleadedChip CarrierSmall OutlineIntegratedChipPlasticDIP
Comb160 V
Comb50 V
Comb5V
CombGrounded
ParameterBeforeDuringAfterBeforeDuringAfterBeforeDuringAfterBeforeDuringAfterBeforeDuringAfterBeforeDuringAfterBeforeDuringAfterBeforeDuringAfterBeforeDuringAfterBeforeDuringAfterBeforeDuringAfter
PxHxChassis
-2.99
SxHxChassis-1.88
2.55
-1.51
SxGxChassis7.65
3.56
9.63
8.56
FxSxH
-1.93
FxGxH
2.00
0.63

liiRCFORM 335 US. NUCLEAR REGULATORY COMMISSION
* 3201, 3202
IBIBLIOGRAPHIC DATA SHEET
(See instructions on the reverse)
2. TITLE AND SUBTITLE
iI Circuit Bridging of Components by Smoke
1 . REPORT NUMBER(Assigned by NRC, Add Vol., Supp., Rtv.,and Addendum Numbers, If any.)
NUREG/CR-6476SAND96-2633
DATE REPORT PUBLISHED
MONTH
October
YEAR
19964. FIN OR GRANT NUMBER
W60515. AUTHOR(S)
T. J. Tanaka, S. P. Nowlen, D. J. Anderson
6. TYPE OF REPORT
Technical
7. PERIOD COVERED (Inclusive Dates)
8. PERFORMING ORGANIZATION - NAME AND ADDRESS (If NRC, provide Division, Office or Region, U.S. Nuclear Regulatory Commission, and mailing address; if contractor,provide name and mailing address.)
Sandia National LaboratoriesAlbuquerque, NM 87185-0747
9. SPONSORING ORGANIZATION • NAME AND ADDRESS (If NRC, type "Same as above-; if contractor, provide NRC Division, Office or Region, U.S. Nuclear Regulatory Commission,and mailing address.)
Division of Systems TechnologyOffice of Nuclear Regulatory ResearchU.S. Nuclear Regulatory CommissionWashington, DC 20555-0001
10. SUPPLEMENTARY NOTES
C. Antonescu, NRC Project Manager11. ABSTRACT (200 words or less)
Smoke can adversely affect digital electronics; in the short term, it can lead to circuitbridging and in the long term to corrosion of metal parts. This report is a summary of thework to date and component-level tests by Sandia National Laboratories for the NuclearRegulatory Commission to determine the impact of smoke on digital instrumentation andcontrol equipment. The component tests focused on short-term effects such as circuitbridging in typical components and the factors that can influence how much the smokewill affect them. These factors include the component technology and packaging,physical board protection, and environmental conditions such as the amount of smoke,temperature of burn, and humidity level. The likelihood of circuit bridging was tested bymeasuring leakage currents and converting those currents to resistance in ohms.Hermetically sealed ceramic packages were more resistant to smoke than plasticpackages. Coating the boards with an acrylic spray provided some protection againstcircuit bridging. The smoke generation factors that affect the resistance the most arehumidity, fuel level, and burn temperature. The use of CO2 as a fire suppressant, thepresence of galvanic metal, and the presence of PVC did not significantly affect theoutcome of these results.
12. KEY WORDS/DESCRIPTORS (List words or phrases that will assist researchers in locating the report.)
SmokeElectronic Equipment DamageCable FiresDigital Equipment
13. AVAILABILITY STATEMENT
unlimited14. SECURITY CLASSIFICATION
(This Page)
unclassified(This Report)
unclassified15. NUMBER OF PAGES
16. PRICE
NRC FORM 335 (2-89) This form was electronically produced by Elite Federal Forms, Inc.