Smoke Alarm Nuisance Source Characterization - NFPA
59
Smoke Alarm Nuisance Source Characterization – Phase 1 Final Report Prepared by: Joshua Dinaburg Daniel Gottuk, Ph.D. Hughes Associates Baltimore, MD © March 2014 Fire Protection Research Foundation THE FIRE PROTECTION RESEARCH FOUNDATION ONE BATTERYMARCH PARK QUINCY, MASSACHUSETTS, U.S.A. 02169-7471 E-MAIL: [email protected] WEB: www.nfpa.org/Foundation
-
Upload
khangminh22 -
Category
Documents
-
view
5 -
download
0
Transcript of Smoke Alarm Nuisance Source Characterization - NFPA
Smoke Alarm Nuisance Source
Characterization – Phase 1
Final Report
Prepared by:
Joshua Dinaburg Daniel Gottuk, Ph.D.
Hughes Associates
Baltimore, MD
© March 2014 Fire Protection Research Foundation
THE FIRE PROTECTION RESEARCH FOUNDATION ONE BATTERYMARCH PARK
QUINCY, MASSACHUSETTS, U.S.A. 02169-7471 E-MAIL: [email protected] WEB: www.nfpa.org/Foundation

—— Page ii ——

—— Page iii ——
FOREWORD During the revision cycle for the 2010 edition of NFPA 72, National Fire Alarm and Signaling Code, the Technical Committee on Single- and Multiple-Station Alarms and Household Fire Alarm Systems (SIG-HOU) focused renewed attention on nuisance alarms. According to Marty Ahrens in the NFPA report “Smoke Alarms in U.S. Home Fires”:
Half of smoke alarm failures in reported home fires were due to missing or disconnected batteries. Nuisance alarms are the leading cause of occupants disconnecting their smoke alarms. Cooking is the leading cause of nuisance alarms. Ionization and photoelectric sensing technologies are both sensitive to cooking aerosols such as pan frying baking or sautéing. Several studies have shown that ionization type detectors installed too close to a cooking appliance have a higher frequency of nuisance alarms than photoelectric type detectors.1
Based on this information, the SIG-HOU Technical Committee added new smoke detection placement requirements to the 2010 edition. The new requirements are intended to reduce nuisance alarms from smoke alarms and detectors installed too close to stationary cooking appliances.
During the development of the 2013 edition of NFPA 72 the SIG-HOU Technical Committee added several new provisions to Chapter 29 to further reduce nuisance alarms.
29.8.4(5): Effective 1/1/16 smoke alarms installed between 10’ and 20’ from a fixed cooking appliance shall be listed for the application.2
29.7.3: Effective 1/1/19 smoke alarms shall be listed for resistance to common nuisance sources.
At present there is a lack of characterization of common nuisance sources for the development of new performance test protocols. Accordingly, the Foundation initiated a project to work toward characterizing common nuisance sources for the development of new performance test protocols in ANSI/UL 217 and ANSI/UL 268 product standards in order to meet the NFPA 72-2013 requirements intended to reduce nuisance alarms. This Phase 1 project involved a literature review, gap analysis, and development of a research plan for Phase 2.
The Research Foundation expresses gratitude to the report authors Joshua Dinaburg and Daniel Gottuk, Ph.D. with Hughes Associates located in Baltimore, Maryland. The Research Foundation appreciates the guidance provided by the Project Technical Panelists and all others that contributed
1 Ahrens, Marty. September 2011. “Smoke Alarms in U.S. Home Fires.” NFPA Fire Analysis and Research Division. http://www.nfpa.org/~/media/Files/Research/NFPA%20reports/Fire%20Protection%20Systems/ossmokealarms.ashx 2 Efforts are currently underway to changes the effective date references in Section 29.8.4(5) to 1/1/19.
—— Page iv ——
to this research effort. Special thanks are expressed to the National Fire Protection Association (NFPA) for providing the project funding through the NFPA Annual Code Fund. The content, opinions and conclusions contained in this report are solely those of the authors. About the Fire Protection Research Foundation
The Fire Protection Research Foundation plans, manages, and communicates research on a broad range of fire safety issues in collaboration with scientists and laboratories around the world. The Foundation is an affiliate of NFPA.
About the National Fire Protection Association (NFPA)
NFPA is a worldwide leader in fire, electrical, building, and life safety. The mission of the international nonprofit organization founded in 1896 is to reduce the worldwide burden of fire and other hazards on the quality of life by providing and advocating consensus codes and standards, research, training, and education. NFPA develops more than 300 codes and standards to minimize the possibility and effects of fire and other hazards. All NFPA codes and standards can be viewed at no cost at www.nfpa.org/freeaccess.
Keywords: fire alarm, smoke alarm, smoke detection, nuisance sources, spot detectors

—— Page v ——
—— Page vi ——
PROJECT TECHNICAL PANEL
Don Brighenti, SimplexGrinnell Tom Cleary, NIST
L.J. Dallaire, US Architect of the Capitol Tom Fabian, UL
Dan Finnegan, Siemens Wendy Gifford, Consultant Tom Hammerberg, AFAA
Stephen Olenick, Combustion Science & Engineering Richard Roberts, Honeywell
Arthur Lee, CPSC Jim Milke, University of Maryland
Dave Newhouse, Gentex Larry Ratzlaff, UTC
Lee Richardson, NFPA Staff Liaison
PROJECT SPONSOR
National Fire Protection Association (NFPA)

—— Page vii ——
FIRE SCIENCE & ENGINEERING
Smoke Alarm Nuisance Source Characterization
Prepared for
Ms. Kathleen Almand Executive Director
The Fire Protection Research Foundation 1 Batterymarch Park
Quincy, MA 02169-7471
Prepared by
Joshua Dinaburg Dr. Daniel Gottuk
Hughes Associates, Inc. 3610 Commerce Drive, Suite 817
Baltimore, MD 21227-1652 www.haifire.com
March 20, 2014

SMOKE ALARM NUISANCE SOURCE CHARACTERIZATION 1DTG02049.012 PAGE ii
HUGHES ASSOCIATES
TABLE OF CONTENTS
1. INTRODUCTION ............................................................................................................................ 1
2. OBJECTIVE ................................................................................................................................... 1
3. APPROACH ................................................................................................................................... 2
4. LITERATURE REVIEW .................................................................................................................. 2
4.1. Nuisance Source Identification .................................................................................... 3
4.1.1. Nuisance Alarm Problem ..................................................................................... 3
4.1.2. Cooking Nuisances ........................................................................................... 10
4.1.3. Other Household Nuisances ............................................................................. 11
4.2. Emission Characterization Methods ......................................................................... 12
4.2.1. Particle Size and Shape .................................................................................... 12
4.2.2. Particle Number Density .................................................................................... 14
4.2.3. Mass Concentration .......................................................................................... 15
4.2.4. Ionization Response .......................................................................................... 16
4.2.5. Carbon Content and Color ................................................................................ 16
4.2.6. Detector Response ........................................................................................... 16
4.2.7. Gas Emissions .................................................................................................. 17
4.3. Experimental Nuisance Simulations ......................................................................... 18
4.3.1. Smoke Alarm Response Studies ....................................................................... 19
4.3.2. Nuisance Characterization ................................................................................ 28
4.3.3. Air quality assessments ..................................................................................... 30
5. GAP ANALYSIS ........................................................................................................................... 32
5.1. Selection and categorization of nuisance sources to be evaluated ........................ 33
5.2. Test methods for re-creation of common nuisance sources ................................... 34
5.3. Configuration of the test space ................................................................................. 35
5.4. Measurements to characterize nuisance source tests and related instrumentation ..................................................................................................................................... 36
5.5. Methodology for evaluation of a smoke alarm/detector .......................................... 37
5.6. Justification for Standard .......................................................................................... 38
6. GAP TEST PLAN ......................................................................................................................... 39
7. REFERENCES ............................................................................................................................. 42
SMOKE ALARM NUISANCE SOURCE CHARACTERIZATION 1DTG02049.012 PAGE 1
HUGHES ASSOCIATES
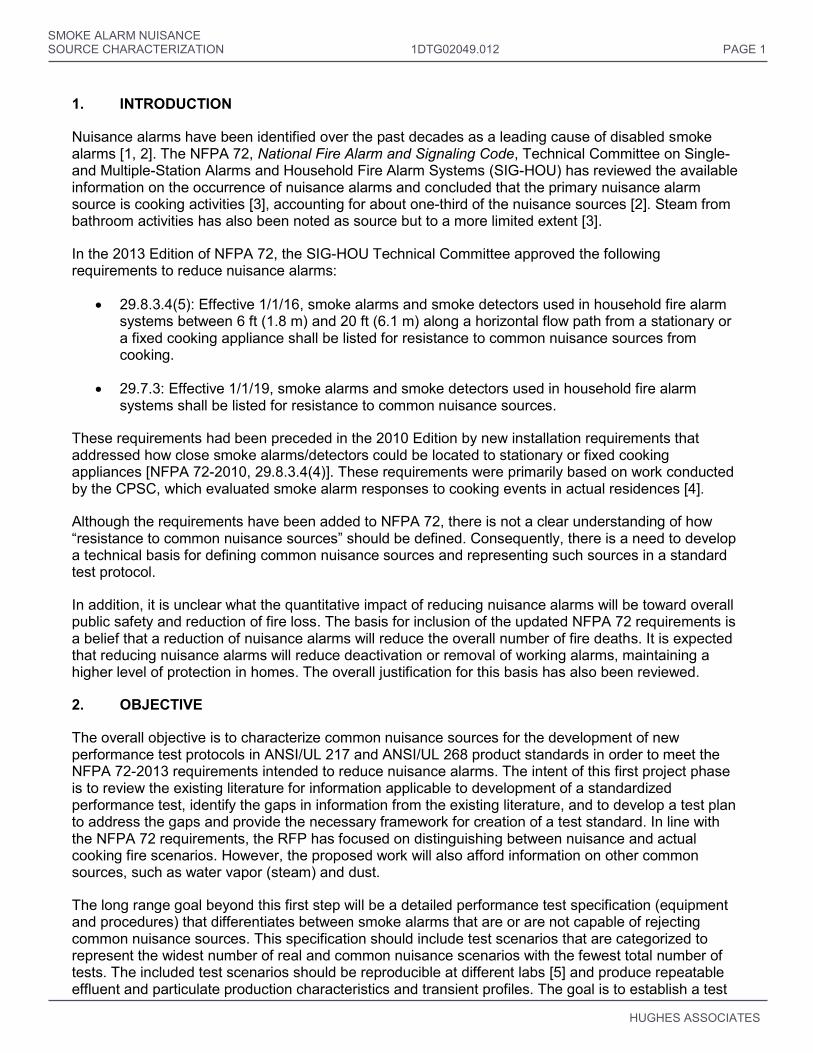
1. INTRODUCTION
Nuisance alarms have been identified over the past decades as a leading cause of disabled smoke alarms [1, 2]. The NFPA 72, National Fire Alarm and Signaling Code, Technical Committee on Single- and Multiple-Station Alarms and Household Fire Alarm Systems (SIG-HOU) has reviewed the available information on the occurrence of nuisance alarms and concluded that the primary nuisance alarm source is cooking activities [3], accounting for about one-third of the nuisance sources [2]. Steam from bathroom activities has also been noted as source but to a more limited extent [3].
In the 2013 Edition of NFPA 72, the SIG-HOU Technical Committee approved the following requirements to reduce nuisance alarms:
29.8.3.4(5): Effective 1/1/16, smoke alarms and smoke detectors used in household fire alarm systems between 6 ft (1.8 m) and 20 ft (6.1 m) along a horizontal flow path from a stationary or a fixed cooking appliance shall be listed for resistance to common nuisance sources from cooking.
29.7.3: Effective 1/1/19, smoke alarms and smoke detectors used in household fire alarm systems shall be listed for resistance to common nuisance sources.
These requirements had been preceded in the 2010 Edition by new installation requirements that addressed how close smoke alarms/detectors could be located to stationary or fixed cooking appliances [NFPA 72-2010, 29.8.3.4(4)]. These requirements were primarily based on work conducted by the CPSC, which evaluated smoke alarm responses to cooking events in actual residences [4].
Although the requirements have been added to NFPA 72, there is not a clear understanding of how “resistance to common nuisance sources” should be defined. Consequently, there is a need to develop a technical basis for defining common nuisance sources and representing such sources in a standard test protocol.
In addition, it is unclear what the quantitative impact of reducing nuisance alarms will be toward overall public safety and reduction of fire loss. The basis for inclusion of the updated NFPA 72 requirements is a belief that a reduction of nuisance alarms will reduce the overall number of fire deaths. It is expected that reducing nuisance alarms will reduce deactivation or removal of working alarms, maintaining a higher level of protection in homes. The overall justification for this basis has also been reviewed.
2. OBJECTIVE
The overall objective is to characterize common nuisance sources for the development of new performance test protocols in ANSI/UL 217 and ANSI/UL 268 product standards in order to meet the NFPA 72-2013 requirements intended to reduce nuisance alarms. The intent of this first project phase is to review the existing literature for information applicable to development of a standardized performance test, identify the gaps in information from the existing literature, and to develop a test plan to address the gaps and provide the necessary framework for creation of a test standard. In line with the NFPA 72 requirements, the RFP has focused on distinguishing between nuisance and actual cooking fire scenarios. However, the proposed work will also afford information on other common sources, such as water vapor (steam) and dust.
The long range goal beyond this first step will be a detailed performance test specification (equipment and procedures) that differentiates between smoke alarms that are or are not capable of rejecting common nuisance sources. This specification should include test scenarios that are categorized to represent the widest number of real and common nuisance scenarios with the fewest total number of tests. The included test scenarios should be reproducible at different labs [5] and produce repeatable effluent and particulate production characteristics and transient profiles. The goal is to establish a test
SMOKE ALARM NUISANCE SOURCE CHARACTERIZATION 1DTG02049.012 PAGE 2
HUGHES ASSOCIATES
that reflects a consensus performance criteria for nuisance source rejection for smoke alarms and detectors, regardless of the technology of detection.
3. APPROACH
The objective of this project will be achieved via in-depth knowledge and analysis of smoke alarm technologies, the alarm environment, and research and testing results and protocols. The project will consist of the following three tasks:
1. Literature Review
2. Identification of Knowledge Gaps
3. Development of a Test Plan to Address Gaps
Ultimately, the goal of the larger project is to provide a framework for listing smoke alarms/detectors for resistance to common nuisance sources. This framework would include a thorough understanding of the common nuisance sources for inclusion into the required suite of tests. This understanding will include the mechanisms for creation of the nuisance sources, as well as the physical characteristics of the effluent/particulate causing alarms. In addition to understanding the nuisance sources themselves, it will be necessary to develop methods for conduct of testing, including the spatial construct of the test space, the type, number, and location of instrumentation, and the interpretation of test data to evaluate the performance of smoke alarms/detectors and to verify repeatable test conditions.
4. LITERATURE REVIEW
A vast array of previous work has been conducted on identifying, reproducing, and characterizing smoke alarm nuisance sources. The existing literature on this topic has been reviewed in order to:
Assess the impact of reducing nuisance alarms;
Identify common and/or likely nuisance sources;
Identify methods of quantifying and characterizing the aerosol production from nuisance sources;
Review methods used to simulate the production of nuisance aerosols; and,
Combine simulated nuisance data to combine sources for subsequent testing.
Although much work on nuisance sources has been done, no collective analysis has been completed to synthesize the various studies, particularly with the goal of framing specific sources that are also broadly representative of the most common nuisance sources in the field. It is the intent of this project to evaluate this existing data and utilize it to develop standardized nuisance resistance tests.
Previous work has been conducted to characterize the particulate production and smoke alarm response to various nuisance sources [22, 38]. Studies have included identification of applicable nuisance sources as well as methods for testing such sources. Justifications have been made for selection of the sources tested in these experiments. These justifications are reviewed for applicability to the selection of sources for this project and to determine if there is a consensus of rationale.
Some of these research projects have also used advanced instrumentation to characterize the properties of nuisance particulate. Characterizations include the particle size distributions and number densities, particle masses, optical densities, temperatures, chemical properties, colors, and/or mass transport rates. This data will be valuable for determining the repeatability and reproducibility for conduct of various nuisance sources. The methods used to simulate nuisances between different test series and the similarities and differences in effluent/particulate production will help identify the best

SMOKE ALARM NUISANCE SOURCE CHARACTERIZATION 1DTG02049.012 PAGE 3
HUGHES ASSOCIATES
sources and methods for incorporation into the standardized testing. In addition, the classification of nuisance sources into groups based on similar particulate behavior and properties may be used to reduce the number of tests required for implementation of a thorough test standard.
4.1. Nuisance Source Identification
Automatic detectors and smoke alarms are devices intended to provide advance warning of the development of hazardous conditions. In some cases however, these devices can produce alarms in the absence of real threats. The NFPA has defined a continuum of smoke alarm responses shown in Figure 1 [6].
Figure 1 – Continuum of smoke alarm response [6]
NFPA 72 defines unwanted alarms to include all those occurring in the absence of a hazardous condition. This includes nuisance alarms, malicious alarms, unintentional alarms, and unknown alarms. The nuisance alarms include all unwanted activations to stimuli or conditions that are not hazardous. Similarly, British Standard BS 5839 [7] and the New Zealand Fire Service [8] define “unwanted” fire alarms to include alarms caused by cooking, steam, tobacco smoke, dust, insects, or due to faulty equipment. These alarms are distinguished in fire department reporting from alarms caused by malicious intent, good intentions, or for unknown reasons.
For the purposes of this study, a nuisance alarm will be considered any activation of an automatic smoke alarm resulting from exposure to non-threatening aerosol particulate or other normally occurring environmental stimuli. This will not include alarms caused by faulty electrical or mechanical equipment, physical damage, or activation by malicious or good intentions. It is the intent of this paper to identify and categorize the normally occurring stimuli and aerosol sources causing the most real world nuisance alarms. In order to develop a standard test for the upcoming nuisance resistant requirements of NFPA 72, the primary focus of these nuisance sources will be residential cooking nuisances. Some additional consideration will be given toward nuisances caused by dust, bathroom mists, insects, cigarette smoke, incense, candles, and poor cleaning practices.
4.1.1. Nuisance Alarm Problem
In the design of automatic smoke alarm equipment, it is often necessary to balance the sensitivity of the device between the detection of hazards and the rejection of nuisance sources. While nuisance alarms may be considered unpleasant, it is obviously more desirable for an alarm system to detect all hazards than to reject all nuisances.
Nuisance alarms present more than just an annoyance, however. Nuisance alarms have been noted as the leading reason for smoke alarms being disabled. The fact that approximately 2/3 of fire deaths occur in homes with no functional alarms (e.g., not installed or not powered) [2] indicates that disablement of smoke alarms from nuisance sources likely impacts public fire safety. However, there is no current data to fully quantitatively establish this impact.
SMOKE ALARM NUISANCE SOURCE CHARACTERIZATION 1DTG02049.012 PAGE 4
HUGHES ASSOCIATES
According to the NFPA smoke alarm analysis report [2], smoke alarms were present but did not operate in 24% of home fire deaths. Of these 24%, 50% (12% of all deaths) of the alarms did not operate because the battery was missing or disconnected. An additional 38% of all fire deaths occur in homes where no smoke alarm was present. It is imperative to understand how many of the disconnected or absent detectors are directly linked to the occurrences of nuisance alarms. This link would provide quantitative evidence of the impact on public safety of eliminating nuisance alarms.
The intent of the NFPA 72 requirements for installation of “nuisance resistant” smoke alarms is to prevent the disabling of the devices and potentially prevent fire deaths. According to the NFPA, there were 2,470 civilian deaths from structure fires in 2012 [2]. Considering alarms that did not operate because the battery was missing or disconnected, preventing the disabling of smoke alarms due to nuisances could potentially reduce this number by as many as 296 deaths. (2,470 deaths x 0.24 non-operating alarms x 0.50 missing/disconnected power). Obviously, this number is a best case possible impact, assuming all nuisance alarms are prevented, all missing or disconnected batteries were intentionally removed because of nuisances, and all deaths in these scenarios would be prevented by a working smoke alarm. This number does not include an estimate of the number of deaths resulting from smoke alarms that have been physically removed due to nuisances. Deaths occurring with no smoke alarm present represent an additional 38% of all fire deaths, and some portion of homes without alarms may be attributed to removal due to nuisances. However, no data exists to quantify this potential impact, but it may represent anywhere from 0 to 939 additional preventable deaths annually, assuming all cases with no device is because it was removed due to a nuisance. This assumption is obviously not valid. The results of various statistical surveys and home studies have been reviewed in order to better understand the potential impact of reducing nuisance alarms.
Although the sources identified and proposed for standardized testing through this study will focus on environmental stimuli causing nuisance alarms, it is possible other steps can be taken to prevent the disabling of smoke alarms. This may include having an audible voice signal that the battery is low instead of chirping, which can lead to nuisance disconnections, or reducing the need for cleaning, or better dust/bug resistance.
4.1.1.1. Fire Department Response Data
Much of the statistical data regarding nuisance alarm activations is obtained through fire department reporting following false alarm calls [2, 6, 9–11]. This data generally includes all false alarms, and is often focused toward reducing the costs associated with unnecessary response. It is difficult to determine from this data the magnitude of the unreported nuisance alarm problem or the relationship between nuisance responses and intentional disabling of smoke alarms. There is, however, valuable information within the false alarm response data for quantifying the scope of the problem and for identifying the primary sources of nuisance alarms.
According to Marty Ahrens of the NFPA, fire departments in the US responded to 16 false alarms for every 10 real fires and 45 false alarms for every 10 structure fires. It was determined that 45% of these false alarms were due to unintentional activations, and 55% of the unintentional activations occurred in residential properties. Residential properties were the only occupancies observed to have most false alarms occur due to nuisance detector responses [6]. It is likely that residential activities, such as cooking, cleaning, showering, etc. are more prevalent sources of nuisance conditions that activities occurring in businesses, offices, retail, or assembly type occupancies.
It has also been reported by the NFPA that unintentional detector responses have been increasing in prevalence. In 1988, unintentional activations accounted for 20% of false calls, increasing to 45% in 2011. A portion of the increase in unintentional activations attributed by the author to an increase in installation of carbon monoxide detectors [9].

SMOKE ALARM NUISANCE SOURCE CHARACTERIZATION 1DTG02049.012 PAGE 5
HUGHES ASSOCIATES
Statistics regarding fire department response to false alarms have also been compiled in New Zealand [10]. This data indicates that commercial buildings had the highest number of unwanted or false fire alarm activations (42.5%) followed by residential (19%) and educational (17%). These unintentional alarms were attributed to cooking, dust, or the actions of trade persons. While the data indicates a prevalence of false alarms in commercial buildings, it is also likely that the monitoring of detectors in these buildings is more common than in residential occupancies, where nuisances most often do not result in fire department response. It was the intent of the New Zealand report to address the costs associated with false alarms, including “costs in anticipation”, “costs as a consequence”, and “costs in response.” None of these aspects encompass the potential costs of reducing consumer faith in the performance of alarms, or the costs of disabled alarms resulting from nuisances failing to protect life and property.
A review of fire reports in Norway by Steen-Hansen identified the prevalence of installed and functioning smoke alarms at households having fires. It was determined that while 97% of Norwegian homes in 2000 had smoke alarms (mandatory since 1991), only 60–80% of homes actually had working devices. It was also observed that in data from fire brigade reports that working alarms are less likely in households that have fires compared to the general population. Smoke alarms were less likely to be present or operational in fatal cooking fires, compared to fires resulting in only injuries or no harm [11]. This data is indicative that in homes where alarms are disabled or allowed to sit in place without batteries, fires may also be more likely to occur due to the level of disregard or negligence in the home.
4.1.1.2. Residential Smoke Alarm Surveys and Studies
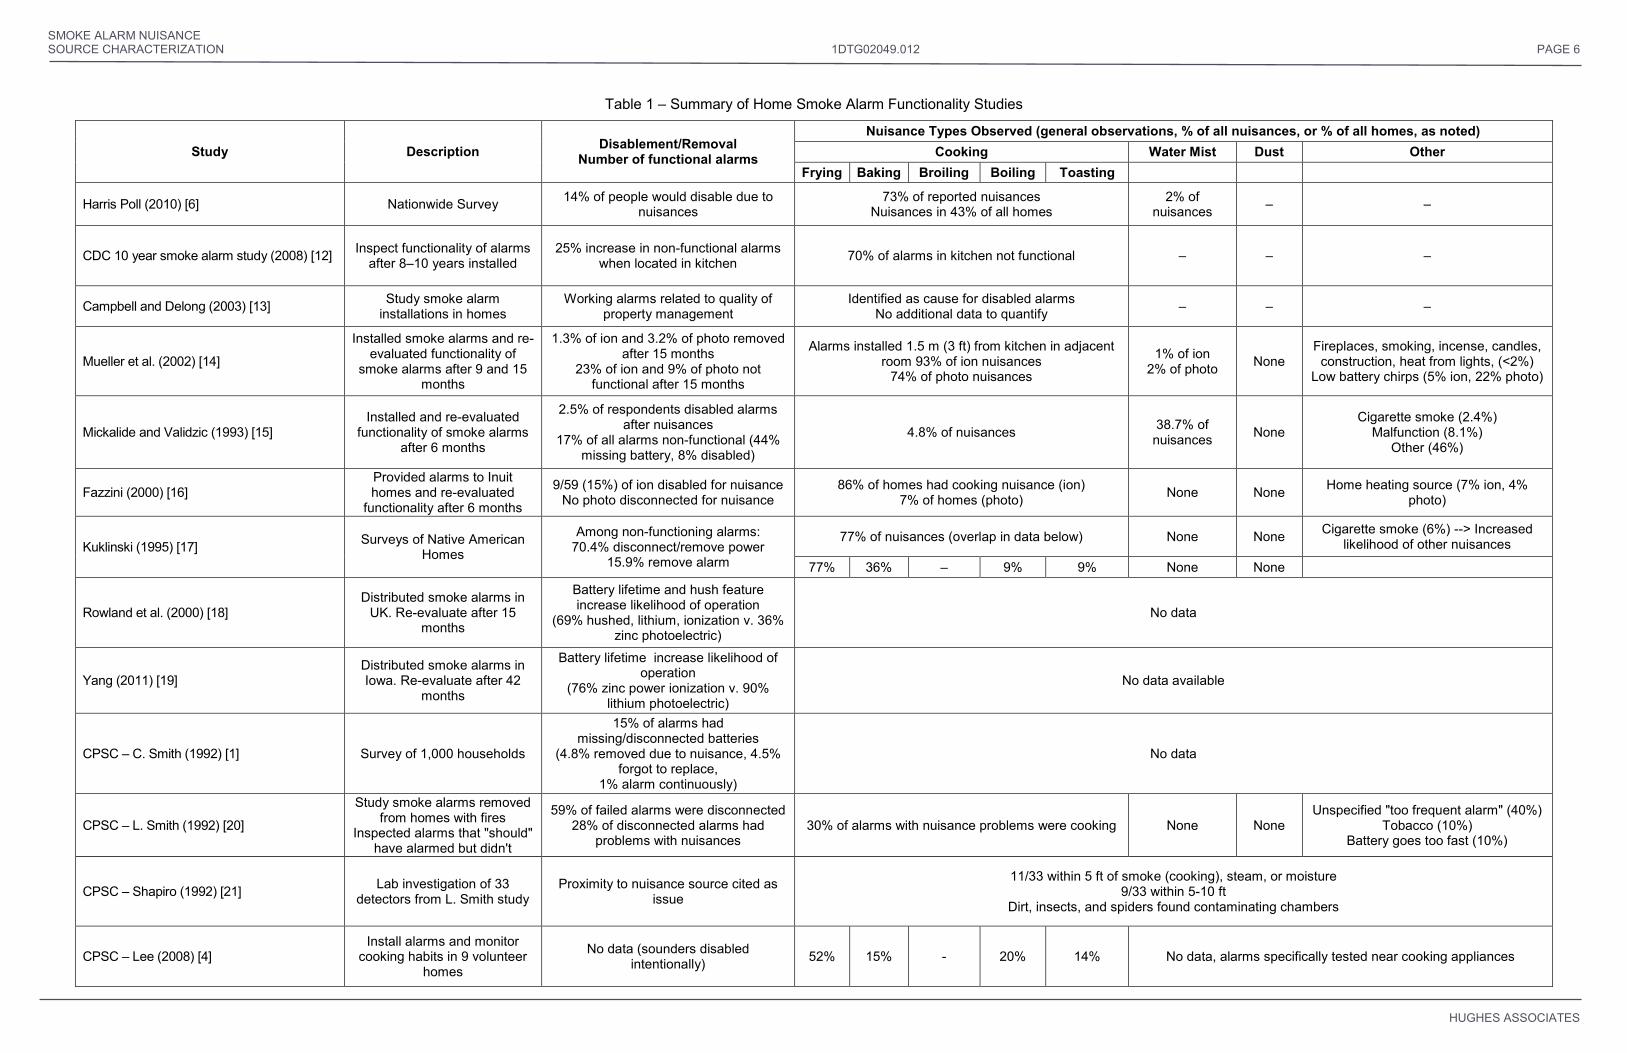
While fire department response reports provide well categorized and detailed data regarding false alarms, they fail to depict the full scope of the nuisance alarm problem. Most residential occupancies do not have monitored alarms, and thus the fire department likely will rarely be notified in the event of nuisance alarms. Private homes also do not often have qualified professionals installing or maintaining smoke alarms, and improper installations or maintenance may contribute to the nuisance alarm problem. Several recent studies have been conducted to determine the numbers, causes, and implications of nuisance alarms in the home. A summary of these studies is provided in Table 1. Additional discussion for each study is provided in the following section.
In a 2010 Harris poll conducted by the NFPA and reported by Ahrens [6], it was identified that 52% of homes with smoke alarms have one located in the kitchen. No additional information regarding distance to cooking appliances was obtained. Of the people surveyed, 43% reported a nuisance alarm within the last year, with 73% of reported alarms occurring due to cooking. Of these alarms, 63% were reported to occur during normal cooking, and 43% were noted to occur after food had burned. There is some overlap due to the yes/no responses used in the poll (>100%). Only 2% of alarms were reported to occur from steam and 3% from a malfunction or for no apparent reason. Among the people surveyed, 14% indicated that they would take out the batteries or disconnect an alarm because of a nuisance. This data clearly indicates that cooking events cause nuisance alarms and that some people (14%) will disable an alarm due to the nuisance. It also showed a high number of homes with alarms in the kitchen (52%), a location that is obviously more prone to nuisance alarms.
In a 2008 study of 10-year installations of smoke alarms with lithium batteries, the Center for Disease Control recorded the number of working alarms as a function of location within the house. After 8–10 years, just 53% of the alarms were still installed, powered, and operational. Of the installed alarms at the end of the study, 70% of the alarms in kitchens did not function, compared to just 45% of devices installed in other locations in the home [12]. This indicates that kitchen installations are more likely to be disabled or not have batteries replaced. Based on the other studies, the lower number of functional alarms in kitchens may be attributable to the occurrences of additional nuisances in these areas. This data provides no evidence for how many alarms may have been physically removed from kitchens or the rest of the home due to nuisance alarms nor did it directly relate the number of devices that were nonfunctional because of disablement due to nuisance alarms.
SMOKE ALARM NUISANCE SOURCE CHARACTERIZATION 1DTG02049.012 PAGE 6
HUGHES ASSOCIATES
Table 1 – Summary of Home Smoke Alarm Functionality Studies
Study Description Disablement/Removal Number of functional alarms
Nuisance Types Observed (general observations, % of all nuisances, or % of all homes, as noted) Cooking Water Mist Dust Other
Frying Baking Broiling Boiling Toasting
Harris Poll (2010) [6] Nationwide Survey 14% of people would disable due to nuisances
73% of reported nuisances Nuisances in 43% of all homes
2% of nuisances – –
CDC 10 year smoke alarm study (2008) [12] Inspect functionality of alarms after 8–10 years installed
25% increase in non-functional alarms when located in kitchen 70% of alarms in kitchen not functional – – –
Campbell and Delong (2003) [13] Study smoke alarm installations in homes
Working alarms related to quality of property management
Identified as cause for disabled alarms No additional data to quantify – – –
Mueller et al. (2002) [14]
Installed smoke alarms and re-evaluated functionality of
smoke alarms after 9 and 15 months
1.3% of ion and 3.2% of photo removed after 15 months
23% of ion and 9% of photo not functional after 15 months
Alarms installed 1.5 m (3 ft) from kitchen in adjacent room 93% of ion nuisances
74% of photo nuisances
1% of ion 2% of photo None
Fireplaces, smoking, incense, candles, construction, heat from lights, (<2%)
Low battery chirps (5% ion, 22% photo)
Mickalide and Validzic (1993) [15] Installed and re-evaluated
functionality of smoke alarms after 6 months
2.5% of respondents disabled alarms after nuisances
17% of all alarms non-functional (44% missing battery, 8% disabled)
4.8% of nuisances 38.7% of nuisances None
Cigarette smoke (2.4%) Malfunction (8.1%)
Other (46%)
Fazzini (2000) [16] Provided alarms to Inuit homes and re-evaluated
functionality after 6 months
9/59 (15%) of ion disabled for nuisance No photo disconnected for nuisance
86% of homes had cooking nuisance (ion) 7% of homes (photo) None None Home heating source (7% ion, 4%
photo)
Kuklinski (1995) [17] Surveys of Native American Homes
Among non-functioning alarms: 70.4% disconnect/remove power
15.9% remove alarm
77% of nuisances (overlap in data below) None None Cigarette smoke (6%) --> Increased likelihood of other nuisances
77% 36% – 9% 9% None None
Rowland et al. (2000) [18] Distributed smoke alarms in
UK. Re-evaluate after 15 months
Battery lifetime and hush feature increase likelihood of operation
(69% hushed, lithium, ionization v. 36% zinc photoelectric)
No data
Yang (2011) [19] Distributed smoke alarms in Iowa. Re-evaluate after 42
months
Battery lifetime increase likelihood of operation
(76% zinc power ionization v. 90% lithium photoelectric)
No data available
CPSC – C. Smith (1992) [1] Survey of 1,000 households
15% of alarms had missing/disconnected batteries
(4.8% removed due to nuisance, 4.5% forgot to replace,
1% alarm continuously)
No data
CPSC – L. Smith (1992) [20]
Study smoke alarms removed from homes with fires
Inspected alarms that "should" have alarmed but didn't
59% of failed alarms were disconnected 28% of disconnected alarms had
problems with nuisances 30% of alarms with nuisance problems were cooking None None
Unspecified "too frequent alarm" (40%) Tobacco (10%)
Battery goes too fast (10%)
CPSC – Shapiro (1992) [21] Lab investigation of 33 detectors from L. Smith study
Proximity to nuisance source cited as issue
11/33 within 5 ft of smoke (cooking), steam, or moisture 9/33 within 5-10 ft
Dirt, insects, and spiders found contaminating chambers
CPSC – Lee (2008) [4] Install alarms and monitor
cooking habits in 9 volunteer homes
No data (sounders disabled intentionally) 52% 15% - 20% 14% No data, alarms specifically tested near cooking appliances
SMOKE ALARM NUISANCE SOURCE CHARACTERIZATION 1DTG02049.012 PAGE 7
HUGHES ASSOCIATES
In a study of residents of the Tualatin Valley conducted by Campbell Delong in 2003, a correlation was observed between disabled alarms and low income and non-English speaking households [13]. It was identified, however, that the relationship appeared more related to the quality of property management than these factors. In general, negligent building managers produced negligence in tenants. The reasons identified for disabled alarms included alarming frequently during cooking, a lack of awareness of the hush feature, a lack of awareness that chirping indicates a low battery, a lack of awareness that night time is most common time for fire death, removal of the battery for use by children in other items, and a lack of concern by the landlord [13]. Although this data reinforces the impacts of cooking nuisance alarms, it also indicates that the availability of nuisance resistant alarms, potentially at increased cost, may not penetrate the core of the problem in already unaware or negligent households.
In addition to polling and census data regarding smoke alarms, a number of other studies have been conducted to identify the causes and occurrences of nuisance alarms by either giving smoke alarms to the public or by monitoring existing installations. In these experiments, the number of nuisance alarms have been evaluated by installation location and detector technology. The prevalence of disabled alarms after specified time intervals have also been assessed through polling and/or physical inspections.
In a study conducted by Mueller et al, smoke alarms were installed in 761 households in King County, Washington between 2000–2002 [14]. The functionality of the alarms was assessed 9 and 15 months after installation. Photoelectric and ionization alarms were installed by trained personnel. Most alarms were located in rooms adjacent to kitchens, placed 1 m (3 ft) from the kitchen entrance and 10–30 cm (4–12 in.) from the ceiling. The location was selected to be at a high risk for potential kitchen nuisance alarms. Both alarm types installed included zinc batteries and hush button features. After 9 months, 20% of the ionization alarms and 5% of the photoelectric alarms were not functional. Among all detectors, 6% of the ionization batteries were disconnected (1% photoelectric), and 13% of the ionization had missing batteries (1% photoelectric). It was reported by the residents that 78% of the installed ionization alarms had sounded since installation (39% of photoelectric). It was also observed that 0.3% of ionization alarms and 1.8% of photoelectric alarms had been physically removed. These rates increased to 1.3% (ion) and 3.2% (photo) after 15 months.
In a study conducted by Mickalide and Validzic in 1993, 595 smoke alarms were distributed and installed in low income households [15]. After 6 months, the state of the devices was investigated. At this time, 17% of the alarms were no longer working. Among the non-functional devices, 44% had missing batteries, 41% had dead batteries, and 8% had been otherwise disabled. No alarms had malfunctions due to dirt, dust, or insect intrusion. Of the 595 devices, 124 (21%) had sounded from non-fire, nuisance causes. The most common nuisance source identified was the shower (40%). Other causes included malfunctions (8%), cooking smoke (5%), and cigarettes (2%). Most people (68.8%) indicated that they had ventilated following the nuisance, but 2.5% of respondents had disabled the alarms [15]. This study indicates a much higher prevalence of shower/steam nuisance alarms, with relatively few cooking nuisance alarms compared to most other studies conducted.
In a study conducted by Fazzini in 2000 [16], homes in four rural Inupiat Eskimo villages in Alaska were randomly provided with a free ionization or photoelectric smoke alarm. Among homes with ionization alarms, 11 of 59 had been disconnected after 6 months, with 9 reported because of nuisance alarms, and two because of dead batteries. Among the 59 homes with ionization alarms, 92% had reported some nuisance alarm, either due to cooking (93%) or a home heating source (8%). Among the ionization cooking alarms, 81% were reportedly due to frying. Among the 45 photoelectric alarms installed, 11% had reported a nuisance alarm and 2 devices were disconnected. One disconnected alarm was accidentally broken and the other had the battery removed to operate a toy. Among the photoelectric nuisance alarms, 67% were from cooking and 33% were from the home heating source [16].
SMOKE ALARM NUISANCE SOURCE CHARACTERIZATION 1DTG02049.012 PAGE 8
HUGHES ASSOCIATES
Another study was conducted by Kuklinski in 1995 evaluating the performance of smoke alarms in Native American homes in South Dakota [17]. Random surveys were conducted among the residents to determine whether any smoke alarms were installed, the installation locations, and the occurrences of nuisance alarms. Among the surveyed households with a smoke alarm, 38% were not working. Over 87% of the non-functional alarms observed were intentionally disconnected from power or physically removed due to nuisance alarms. Among the disabled devices, 78% were battery operated and 22% were hardwired, while the overall installation rates between battery and hardwired alarms were closer to 50/50. When asked about the number of nuisance alarms, 43% of alarms were identified to have produced a nuisance more than 25 times in the previous 12 months, and 54% of alarms having fewer than 25 alarm responses. It was also noted that among the inoperable alarms, 86.3% of the devices were intentionally disabled due to nuisance alarms (47.7% battery removed/disconnected, 22.7% electrical power disconnected, 15.9% detector physically removed) [17].
The Kuklinski survey revealed that nuisance alarms were a significant problem among this Native American community. Cooking was identified as the cause of 77% of the nuisance alarms, with bathroom steam (18%), cigarettes (6%), fireplace smoke (5%), and battery chirping (2%) also contributing. Among the cooking activities, frying was reported as the primary cause (77%), with baking (36%), boiling (9%), and toasting (9%) all contributing (some overlap in data) [17].
Although cigarette smoking only caused 6% of reported nuisance alarms in the Kuklinski survey, it was observed that reported nuisances increased from 57% in homes without a smoker, to 71% in homes with one smoker, and to 80% in homes with more than one smoker [17].
Installation locations were observed to contribute to nuisance alarms in the Kuklinski survey. Occurrences of nuisance alarms were observed to decrease from 61% to 35% frequency when installed more than 7.6 m (25 ft) from a cooking appliance. It was also found that operating kitchen fans reduced the nuisance alarm rate from 80% to 60% for alarms installed within 6.1 m (20 ft) of the cooking appliance. Similarly, nuisance alarm rates dropped from 19% to 0% when moved greater than 3.0 m (10 ft) from a bathroom [17]. While is it clear that the installation location can significantly reduce nuisance alarms, the development of a nuisance resistant smoke alarm test would likely include operation of devices at close distances to cooking appliances and/or bathrooms.
In a study conducted in the UK in 2000 by Rowland et al., 5 different types of smoke alarms were distributed among 2145 households [18]. The devices included various ionization and photoelectric alarms with either zinc or lithium type batteries. In addition, some ionization alarms included either a pause (hush) button. After 15 months, only 50% of the households had a working smoke alarm. The battery lifetime and presence of a hush feature contributed to increase the likelihood of working alarms, with 69% of hushed, lithium battery, ionization alarms still functioning and 36% of zinc battery photoelectric alarms still functioning. No further investigation was conducted concerning the role of nuisance alarms on device operability.
A similar study was conducted among 628 homes in rural Iowa by Yang in 2011 [19]. Smoke alarms were randomly given out to households including zinc and lithium battery powered ionization and photoelectric alarms. The alarm functionality was assessed after 42 months of installation. The device operability ranged from 76% (ion/zinc battery) to 90% (photo/lithium battery). It was determined that the higher rate of non-functioning ionization alarms was due to a higher rate of nuisance alarm.
A significant amount of study has been conducted by the Consumer Product Safety Commission (CPSC) with regard to smoke alarm operability and nuisance alarm activations [1, 4, 20, 21]. A survey of over 1000 households was conducted in 1992 by Charles Smith to determine the number of working smoke alarms and how non-functioning devices had failed [1]. This survey revealed that among households with alarms, 20% were not working, represented by 15% with missing or disconnected power and 5% with dead batteries. Non-functioning alarms were more common in low income households.

SMOKE ALARM NUISANCE SOURCE CHARACTERIZATION 1DTG02049.012 PAGE 9
HUGHES ASSOCIATES
For the 15% with missing or disconnected power, the breakdown of reasons for the condition is shown in Table 1. Based on the presentation of the data, the leading cause for removal of power was nuisance alarms at 32%. Nearly the same number of alarms had no power (30%) because occupants forgot to replace. The report does not provide the raw data, so it is unknown why the sum of the percentages is greater than 100 (i.e., 124%). It was also determined that among several alarms, low battery chirps were interpreted as nuisance alarms [1].
Table 2. Reasons for Missing or Disconnected Batteries or Disconnected AC Power [1]
Reason % Removed, Nuisance 32 Forgot to Replace 30 Alarmed Continuously 7 Never Looked 5 No Batteries in House 5 Removed Batteries for Other Use 4 Hadn't Had a Chance to Install 4 Detector Malfunctioned 3 Wasn't Properly Connected 3 Battery Type Unavailable/Costly 2 House Repair/Removed Temporarily 2 Waiting for Someone to Install 1 Other Reason 8 Don't Know/No Answer 18 Total 124
In addition to the survey study conducted by C. Smith, the CPSC conducted a companion study by Linda Smith to evaluate smoke alarms removed from the homes with fires [20]. Data was collected for 273 alarms that did not alarm but it was believed that they “should” have due to exposure to smoke. It was determined that 162 (59%) of these devices were disconnected from a power source, either due to a missing battery (37%), a disconnected battery (15%), or disconnected AC power (7%). When possible for the devices without power (115 of 163), residents were asked about problems with the smoke alarms. It was reported by 35% (40 of 115) of the interviewed residents that disconnected devices had problems. These problems included “too frequent alarms” (16 of 40, 40%), alarms to cooking (12 of 40, 30%), alarms to tobacco smoke (4 of 40, 10%), battery runs down too often (4 of 40, 10%), or other (10 of 40, 10%). There is some overlap in reported reasons, as the total of these alarms is 46 of the original 40. It is indicative that among devices with disconnected power supplies that approximately 28% had problems with frequent nuisances (35% of disconnected alarms with problems x 80% of problems were nuisances).
Thirty-three of the non-functioning alarms were collected as part of the L. Smith study and evaluated in the laboratory by Shapiro [21]. One third of these units were found located within 1.5 m (5 ft) of smoke, steam, or moisture sources, and nine more within 1.5-3.0 m (5–10 ft). It was also determined that the presence of dirt, insects, or spiders within chambers could increase overall sensitivity and cause additional nuisance alarms. One third of the alarms sampled were found to be excessively dirty, including three samples with broken covers allowing for additional infiltration of particulate.

SMOKE ALARM NUISANCE SOURCE CHARACTERIZATION 1DTG02049.012 PAGE 10
HUGHES ASSOCIATES
A recent CPSC study conducted by Lee and Pineda attempted to measure the actual rates and causes of cooking related nuisance alarms [4]. Multiple smoke alarms were placed in nine volunteer homes in the Washington, DC area in 2008. Volunteers were asked to record all cooking activities, and the alarms were continuously monitored and responses recorded for 30 days. As expected, the nuisance rates were observed to increase with decreased distance from the kitchen stove/oven. The alarm rate per cooking event ranged from 3–11% for alarms located at 1.5 m (5 ft), 5–9% for alarms located at 3.0 m (10 ft), and dropped to 1% for alarms located at 6.1 m (20 ft). The most nuisance alarms were observed to occur during sautéing, pan frying, and stir frying type cooking. Although most of the cooking data was obtained from one household, the type of cooking was observed to be as important to nuisance responses as the installation location. The cooking methods recorded included:
Frying (browning meats or vegetables with oil coating the pan)
o Sautéing
o Pan frying
o Stir frying
Toasting (bread or meat in portable appliance)
Baking in an oven
Boiling (simmering and steaming)
o Pasta
o Soup
o Vegetable steaming
o Shellfish steaming
It was determined that pan and stir frying were responsible for the most nuisance alarm responses (219). Other nuisance responses were recorded for boiling or simmering (82), baking (61), and toasting (58) [4]. These tests did not incorporate a wide range of households, and may not represent the range of ethnic, region, or economic cooking methods common among a wider range of households. In addition, no data was collected regarding the relationship between nuisance alarms and disabling of devices, as all alarms were monitored electronically and had the sounders removed. This cooking type and response data has been used as the basis for selection of cooking processes for subsequent laboratory nuisance alarm testing conducted by Chernovsky and Cleary [22]. These test methods and data are further discussed in Section 4.3.
4.1.2. Cooking Nuisances
Cooking nuisances have been identified as representing between 60–80% of nuisances in various studies. The CPSC study by Lee and Pineda [4] identified several cooking actions most associated with nuisance responses in alarms located adjacent to stove tops and ovens. Although the range of cooking events investigated was limited by the scope of the study, it was identified that frying produced the highest number of responses, with additional responses occurring from boiling, toasting, and baking.
Cooking nuisances can be categorized according to the appliance being used, the normal required cooking temperatures, and the ingredients included. Cooking appliances of interest include all types of range tops, including open coil electric, smooth top electric, induction, and gas fired. Other appliances include the oven, used for baking and broiling, the toaster, both pop-up and oven type, and the microwave. Although other appliances may be involved in nuisances, such as free standing electric griddles, deep fryers, radiant ovens, or dehydrators, it is expected the impacts are minimal compared to the more standard kitchen equipment.
SMOKE ALARM NUISANCE SOURCE CHARACTERIZATION 1DTG02049.012 PAGE 11
HUGHES ASSOCIATES
The normal cooking temperatures expected are a function of the cooking activities being performed. Frying or blackening is often performed at high temperatures about 200°C (~400°F). This type of cooking was also correlated with the highest observed incidents of nuisance alarms by Lee and Pineda [4]. Boiling and simmering have a fixed maximum temperature of 100°C (212°F), while toasting and baking generally occur at temperatures ranging from (350–450°F) and broiling reaches temperatures as high as 260°C (500°F). The cooking temperatures and surface properties (pan type, convection oven, radiative broiling, etc.) can impact the production of aerosol particulate, changing the particle concentrations, sizes, colors, etc. These factors can all impact the response of smoke alarms.
In addition to the cooking type, the ingredients impact the production of particulate. The particles produced from cooking of breads, vegetables, meats, and cheeses are all likely very different in size, shape, and composition. The addition of oils, butters, and other lubricants to the cooking processes can also impact the aerosol production. These factors can directly impact the response of detectors.
Another factor involved in identification of cooking nuisance sources is the criteria used for distinguishing between a nuisance and hazardous condition. When left unattended, many cooking scenarios can develop into hazardous fire conditions. In order to evaluate cooking scenarios for nuisance rejection, clear distinctions must be defined regarding when a nuisance becomes a real threat. For example, “burned” toast may be considered a potential nuisance source, but burned toast can develop into a flaming fire without intervention. In addition, as a source transitions toward a fire condition or becomes substantially burnt, it may produce significant amounts of smoke that most people would likely want to be made aware. A clear distinction between “normal” cooking and hazardous or unwanted conditions must be defined to develop standardized cooking nuisance tests.
Although there is a nearly infinite range of combinations of cooking appliances, methods, and ingredients, it is necessary to select a representative set of cooking practices for standardizing testing. It is desirable to select the sources that produce a range of particles sizes, shapes, and compositions representative of the most challenging sources with regard to nuisance rejection. Several studies have attempted to replicate cooking events for nuisance evaluation and are discussed in Section 4.3. The setups, procedures, and results of these tests are discussed with the intent of developing standard procedures and in order to group sources to limit the number of necessary tests. A summary list of devices and methods capable of measuring and characterizing particulate is also included in Section 4.2.
4.1.3. Other Household Nuisances
Although the primary focus of the NFPA 72 nuisance rejection standard is cooking, they do not represent the complete range of household nuisance sources. Water vapor (commonly referred to as steam) produced by showers, dust from cleaning or home repairs/alterations, cigarette smoke, burning candles or incense, and even insects have been identified as other sources. In order to broadly list an alarm as “nuisance resistant”, these other types of sources would need to be included.
In addition to dust acting as a direct source of a nuisance alarm, it is possible that sustained exposure to small amounts of dust can increase the sensitivity of a device. This would result in additional nuisance alarms to other sources. It has been reported by Wang et al. [23] that photoelectric detectors can be particularly sensitive to this effect. The normally black photo chambers absorb all the light, allowing the sensor to measure only the reflection from smoke particulate. As dust builds up in the chamber, more internal reflections increase the background sensor signals. It is claimed that as many as 70% of false alarms result from contaminated chambers. This effect is especially relevant for devices improperly installed near air conditioning, in corridors, or near air inlets. It may be advisable to include an accumulated dust resistance test in addition to normal nuisance testing in the suite of standardized tests.
As evidenced in the study conducted by Kuklinski [17], while cigarette smoke did not cause numerous nuisance alarms, the number of nuisance alarms increased with the presence of cigarette smoke in the

SMOKE ALARM NUISANCE SOURCE CHARACTERIZATION 1DTG02049.012 PAGE 12
HUGHES ASSOCIATES
home. This may be a similar effect of long term exposure and contamination creating more sensitive smoke alarms.
Insect intrusion has been identified as another possible source of home nuisance alarms. Reports in the UK [24] have shown that small bugs called thrips, or thunderflies, have been found to penetrate detection chambers and produce false alarms. This problem was observed to increase dramatically during the summer months, and it was found that attaching dog flea collars to smoke alarms mitigated the problem. Intrusion by these and other insects can increase the sensitivity of devices or directly cause nuisance alarms. The cause for this type of alarm may not be apparent to a resident and could increase the likelihood of disabling the alarm. No data was found in the U.S. that indicates bugs as a problem for smoke alarms with the current bug screens incorporated into designs.
4.2. Emission Characterization Methods
In order to select nuisance source scenarios for standardized testing, an understanding of the properties of the aerosol particulates is necessary. Characterization allows for the grouping of sources to eliminate the infinite range of possible tests, and for the identification of the most challenging nuisance rejection scenarios.
Aerosol particulate can be measured and characterized using a number of different sensors and technologies. Measurable properties include the particles sizes, the particle shapes, the particle number density, the particle mass density, the light obscuration/reflection properties, the ionization and charge properties, and the chemical composition. Nuisance responses in some multi-sensor smoke alarms/detectors can also occur due to gas production, such as carbon monoxide, and the concentration and types of gases produced can also be measured and quantified for sources.
Some quantities of interest for aerosol characterization include the number of particles per volume (d0), the total length of all particles in a volume arranged in a line (d1), the total surface area of all particles in a volume (d2), and the total volume of all particles in a volume (d3). Others include the geometric mean particle diameter, the volume mean particle diameter, geometric standard deviation (assuming log-normal distributions), and the mass mean diameter. These values can be calculated by measuring the number concentrations, mass concentrations, and size of the particulate [25].
4.2.1. Particle Size and Shape
The size and shape of aerosol particles is a key parameter in understanding the response of standard photoelectric and ionization type smoke alarms. It has been reported by Mulholland [25] that the response of ionization smoke detectors can be correlated to the particle number mean diameter, and the response of light scattering detectors can be correlated to the particle volume mean diameter.
There are a number of devices available for measuring the size of suspended aerosol particles. These devices include:
Electrical low pressure impactor (ELPI);
Diesel particle scatterometer (DPS);
Scanning mobility particle sizer (SMPS); and,
Microscopic image analysis.
The Electrical low pressure impactor (ELPI) is used to measure the size of nuisance and smoke aerosol particulate. This device uses a 12 stage cascade impactor to sort particles by size, ranging between 0.03 µm to 10 μm. Tested air is flowed through the impactors and collected by size, and a measurement of the mass concentration of particles of each size is measured in a 10 second sample

SMOKE ALARM NUISANCE SOURCE CHARACTERIZATION 1DTG02049.012 PAGE 13
HUGHES ASSOCIATES
time. This device operates fairly quickly and is able to provide good resolution of particle sizes in the ranges of interest for smoke alarm detection [26].
The diesel particle scatterometer (DPS) utilizes the polarization of scattered light to measure the size, shape, and complex refractive index of the aerosol particulate. Most light scattering sensors (nephelometers) measure only the intensity of reflected light at a specific angle. The DPS measures the effects of the scattering on polarization of incident light using photomultipliers at multiple reflection angles. In this way, it is able to solve numerous linear algebraic equations and calculate the Mueller scattering matrix elements utilizing Mie scattering theories for spherical particles [27]. The sampled air is often diluted to help prevent coagulation of particles and has a low residence and fast response time for transient aerosol concentrations. This device has been used by Hunt [28] to measure the exhaust from diesel engines and by Keller [29] to measure the size and refractive indices of the EN54 standard test fires, and could easily be applied to future measurements of nuisance aerosols.
The scanning mobility particle sizer (SMPS) classifies sampled particles by electrical mobility and counts the number of particles optically using a condensation particle counter (CPC). The particle counter is discussed in Section 4.2.2. The particle sizes are measured by passing the particles through an electric field and measuring the drift of the particles, which is a function of the particle size. These devices range from 15 sec to 10 minute sampling times to a complete spectrum of particle sizes, and therefore is best applied to steady or slowly changing aerosols [30]. When used for transient particulate concentration, the average diameter measured is inflated for increasing concentrations and reduced for decreasing concentrations due to the delay in measurement.
Microscopic image analysis involves the direct visualization of aerosol particulate using cameras and strong lenses. The average size and shape of sampled particles can be visualized and analyzed directly using this method. Characterization of smoke and dust particles using this method has been conducted by Shultze [31] by illuminating an air sample with a high power LED and gas flash lamp and recording with a CCD camera and powerful lens. This method was able to distinguish the differences in particle sizes and shapes of smoldering wood fires and fine and ultrafine dust samples.
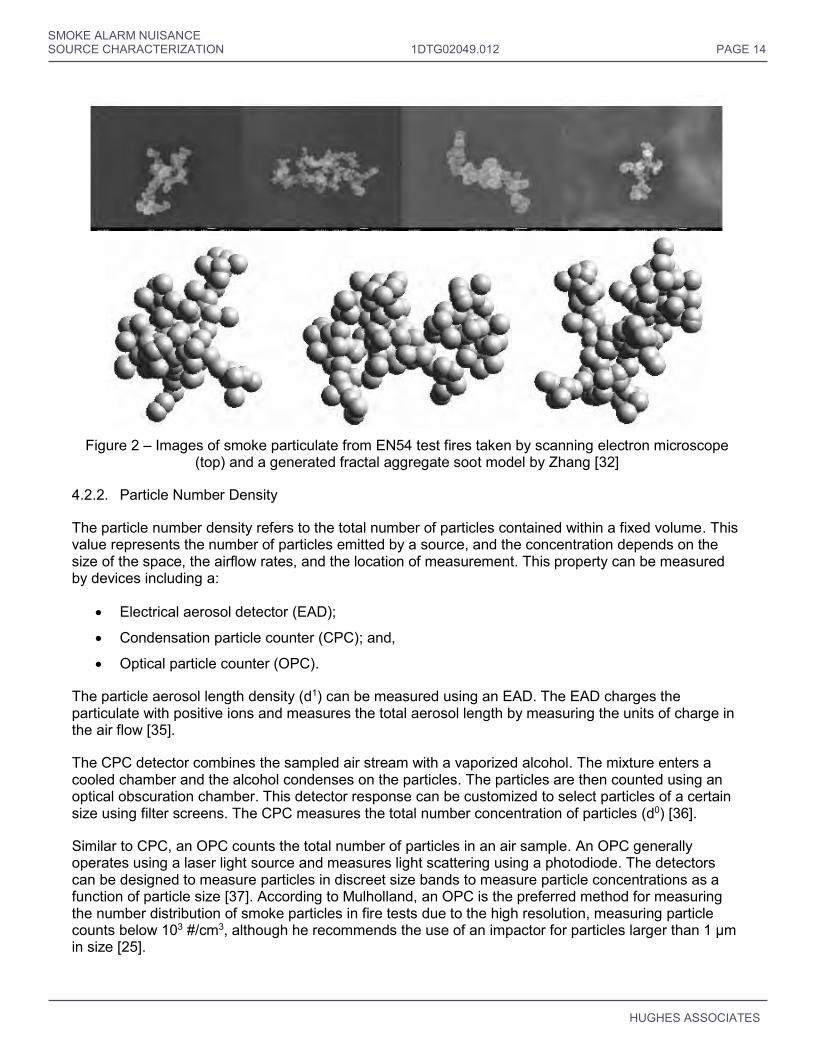
Most optical particulate measuring devices depend on the assumptions of Rayleigh and Mie light scattering theory to predict the response of light exposed to particulate. It has been proposed that these theories do not adequately predict the response of light to complex soot and other oddly shaped, aggregate particulate. Zhang has proposed a fractal aggregate model with complex refractive indices for estimating the polarization of scattered light [32] using the direct dipole approximation software developed by Draine and Flatau [33, 34]. Images of the smoke particulate from EN54 test fires by a scanning electron microscope and a computer generated soot model by Zhang are shown in Figure 2 [32].
SMOKE ALARM NUISANCE SOURCE CHARACTERIZATION 1DTG02049.012 PAGE 14
HUGHES ASSOCIATES
Figure 2 – Images of smoke particulate from EN54 test fires taken by scanning electron microscope
(top) and a generated fractal aggregate soot model by Zhang [32]
4.2.2. Particle Number Density
The particle number density refers to the total number of particles contained within a fixed volume. This value represents the number of particles emitted by a source, and the concentration depends on the size of the space, the airflow rates, and the location of measurement. This property can be measured by devices including a:
Electrical aerosol detector (EAD);
Condensation particle counter (CPC); and,
Optical particle counter (OPC).
The particle aerosol length density (d1) can be measured using an EAD. The EAD charges the particulate with positive ions and measures the total aerosol length by measuring the units of charge in the air flow [35].
The CPC detector combines the sampled air stream with a vaporized alcohol. The mixture enters a cooled chamber and the alcohol condenses on the particles. The particles are then counted using an optical obscuration chamber. This detector response can be customized to select particles of a certain size using filter screens. The CPC measures the total number concentration of particles (d0) [36].
Similar to CPC, an OPC counts the total number of particles in an air sample. An OPC generally operates using a laser light source and measures light scattering using a photodiode. The detectors can be designed to measure particles in discreet size bands to measure particle concentrations as a function of particle size [37]. According to Mulholland, an OPC is the preferred method for measuring the number distribution of smoke particles in fire tests due to the high resolution, measuring particle counts below 103 #/cm3, although he recommends the use of an impactor for particles larger than 1 µm in size [25].

SMOKE ALARM NUISANCE SOURCE CHARACTERIZATION 1DTG02049.012 PAGE 15
HUGHES ASSOCIATES
4.2.3. Mass Concentration
In addition to the size, shape, and number of particles, the mass density of particulate is of interest for characterization. This gives an impression of the amount of mass being converted into particulate at the source and the overall volume density of particles in the air stream. The mass concentration can be measured through:
Gravimetric particle collection;
ELPI cascade impactor;
Tapered element oscillatory microbalance;
DustTrakTM mass monitor; and,
Obscuration and specific extinction coefficient.
Gravimetric sampling involves passing sampled air and particulate through a series of filters to collect particles of discreet size. After an extended duration, often, several minutes, the air sample is stopped and the filter papers are carefully removed and weighed. The increase in weight for each particle size filter is used to identify the average mass concentration from the sampled air. This method is slow and requires fairly long integration times, even when using a microbalance to weigh fine sample changes. When used with a cascade of separate filter collection sizes, it can also provide information regarding the particle size distribution. The accuracy of gravimetric sampling can be increased by using pre-baked quartz filters and conditioning samples in a desiccator and anti-static compounds as was utilized by Huboyo for analysis of small particulate from normal cooking emissions [38]. Sample filters used in gravimetric analysis can also be submitted for additional tests to measure the chemical composition of the collection particulate as described in Section 4.2.5.
The mass concentration can be measured much faster than gravimetric sampling using an ELPI as described in Section 4.2.1. The ELPI combines the cascading filter collection method with a real-time electrometers measuring the transient smoke collection rates at rates up to 1 Hz [26].
A TEOM particle mass sensor utilizes an oscillating collection filter to continuously measure the collected particulate. An air sample is passed through a collection filter, and the collection filter is mechanically oscillated at the natural frequency. As the mass of the filter increases, the frequency of the oscillation slows. By measuring the frequency of oscillation, the collected sample mass is measured in real time [39]. By selecting the filter to collect particles of the desired size, the selected mass concentration can be measured continuously.
An optical method of mass concentration measurement has been developed and patented in the TSI DustTrakTM devices. These devices use laser light scattering measurements and individual pulses to measure the mass concentrations of particulate of selected size in sampled air. The response of these detectors are correlated and calibrated using known concentrations of Arizona road dust of known particle size, but can be correlated to measure other particles (or just include some uncertainty due to particle type) [40].
Approximate smoke mass concentrations can be calculated using a light extinction meter and a specific extinction coefficient. Values of the extinction coefficient of 8.7 ±1.14 have been obtained for flaming sources using red light sources by Mulholland and Croarkin [41]. For pyrolysis, the value of σ may be lower than reported by Mulholland and Croarkin, and has been reported to be 4.4 m2/g for pyrolysis of wood and plastics by Seader and Einhorn [42]. It is expected that the specific extinction coefficient is not a fixed value, but rather is dependent on the material being burned, the rate of burning, and pyrolysis versus flaming combustion. The calculation of smoke mass production using this method is
SMOKE ALARM NUISANCE SOURCE CHARACTERIZATION 1DTG02049.012 PAGE 16
HUGHES ASSOCIATES
considered only an approximation. These measurements can be made easily and cheaply using the optical density meters already specified by UL 217 and UL 268.
4.2.4. Ionization Response
The response of an ionization smoke alarm can be related to the measured number of smoke particles and the average particle size. Laboratory equipment used to measure responses of ionization devices include the measuring ionization chamber (MIC) and the ion mobility spectrometer (IMS).
The MIC is similar in concept and design to a commercial ionization smoke alarm. An electric field is created between electrodes and radioactive radiation bombards the air creating ion pairs, which create a current when interacting with the electrodes. When aerosol particulate pass in the air space, they reduce the ion mobility and reduce the measured current [43]. The change in current can be correlated to the particle size and number count. This type of standardized ionization sensor is used in many smoke measurement experiments, including the UL 217 and UL 268 standards.
The concept of MIC measurement of particles has been further explored by Lenkeit et al. in development of the high field asymmetric wave form ion mobility spectrometer (FAIMS). This more theoretical work uses the concept of IMS to identify different particulate species due to variance in response to high and low electric fields. Initial experiments identified the ability to detect very fine particulate and early smoke signatures long before aspirated smoke detectors (ASD) using light scattering sensors. The differential fields allowed for distinguishing of particles from fire sources and nuisance cigarette smoke evaluated [44].
4.2.5. Carbon Content and Color
The chemical composition of particulate can provide information regarding its influence on smoke alarms. It has been proposed by Kuhlbusch that the elemental carbon within soot particles absorbs light, while the organic carbon and other contents generally scatter light [45]. The ratio of the scattering to absorption is referred to as the albedo of the particles. A scattering sensor will generally be influenced by the organic carbon content, and extinction sensors will respond to the sum of organic and elemental carbon (scattering + absorption = extinction). It was also proposed by Widmann that the mass specific extinction area increases with the ratio of elemental to total carbon [46]. Quantifying the carbon components of the aerosol particulate may be useful in understanding the response of light scattering type detectors.
A carbon analysis can be performed using the same quartz filter used for gravimetric collection and mass concentration analysis. The organic and elemental carbon contents have also been linked to potential adverse health effects, and this type of measurement is the accepted practice for evaluating diesel particulate for NIOSH Method 5040 [47]. The filters are thermally desorbed in a helium atmosphere and then oxidized and monitored using a flame ionization detector (FID). This process measures the organic, elemental, and total carbon content of the particulate.
The content of “black carbon” can also be measured using an aethalometer. Air is sampled onto filter paper similar to the TEOM and gravimetric sampling methods. The color of the filter is measured using one or several wavelengths in real time. The absorption of light on the filter can identify the content of “black” carbon or other color properties of the particulate [48].
4.2.6. Detector Response
It is also possible to characterize aerosol particulate by the analog responses from well characterized smoke alarms. Continuously monitoring and recording the output signals of ionization, photoelectric, or other novel sensors provides particulate level data uniquely applicable to the nuisance alarm problem.
SMOKE ALARM NUISANCE SOURCE CHARACTERIZATION 1DTG02049.012 PAGE 17
HUGHES ASSOCIATES
While these sensors do not provide concrete measures of particulate, such as size or mass, they do provide useful signals for understanding the detection response characteristics.
Photoelectric smoke alarms operate using the principles of light scattering. Light beams are intercepted and reflected by particles moving through the detection chamber. The scattered light is measured by photosensors. The scattering response is strongest when particles passing through the chamber are close in size to the wavelength of the incident light. It is reported by Mulholland that the response of most photoelectric smoke alarms to particles greater than 0.3 µm in size is proportional to the smoke mass concentration [49]. Other work conducted for the UL smoke characterization project indicates that the scattering response is proportional to the number density of particles and the square of the particle diameter [50].
Ionization smoke alarms detect particles by passing ions through an electric field between two plates. When particles pass through the ion field, they disrupt the flow of ions and reduce the current between the plates. It is reported by Mulholland that the response of ionization smoke alarms is proportional to the product of the number concentration and the particle diameter [25]. It has also been proposed by Newman that the charge of the particles also influences the response of ionization smoke alarms. He has proposed that this charge factor decreases with the fuel bond unsaturation (double and triple bonds between carbon atoms) and the aromaticity (stability of the unsaturated bonds), and also varies with pyrolysis or flaming combustion [51]. The charge distribution of the particles can be measured using a tandem differential mobility analyzer (TDMA) by measuring forces on the particles in electric fields [52].
Several experimental smoke detectors have also been developed and used for particulate characterization. A multi-angle scattering detector developed by Wang et al. is reportedly capable of distinguishing the color of particulate and distinguishing between fires and nuisance sources. This detector measures the intensity of scattered light at 30, 90, and 150 degree angles [53]. Multi-spectral photoelectric detectors have also been recently evaluated by Fujisawa, utilizing blue and infrared (IR) LEDs and comparing the ratios of the scattered light. The different wavelengths are scattered proportionally depending on the size of the particles, and the ratios can be used to identify the particulate [54]. Another photoelectric sensor has been used by Huboyo et al. to measure PM2.5 (particles less than 2.5 micron in size) in cooking experiments [38]. This device is called the UCB (University of California at Berkeley) particle monitor, and has a combined photoelectric and ionization sensor calibrated to the outputs of a DustTrak, TEOM, and gravimetric smoke collection to measure particles sizes and smoke concentrations cheaply and in real time [55]. The device operates on the combined light scattering and ionization principles proposed by Litton et al. [56].
Smoke concentrations are often measured and reported in fire testing using an optical density meter (ODM). For UL 217 and 268 test methods, this device uses a white tungsten halogen light source and measures the visual obscuration within a space. ODMs can also use a laser beam of various colors. As indicated above, the properties of smoke can affect the response of each type of ODM depending on the light source used. Therefore, the response of an ODM is dependent on the color of the light source and the proportional difference between ODMs of with different sources are not constant for all smoke types. Data from an ODM is often used to assess the total visibility available for occupants to safely egress. Similar to the scattering response, the UL Smoke Characterization work proposed that the obscuration response could be correlated to the number density and the cube of the particle diameter [50].
4.2.7. Gas Emissions
Advancements in home smoke alarms have led to an increase in the use of carbon monoxide (CO) detectors. These detectors can operate in a stand-alone mode to detect concentrations of the gas, but can also be combined with smoke sensor data in multi-criteria detectors. In order to fully evaluate a nuisance test source, it will be important to measure and characterize the production of CO. The
SMOKE ALARM NUISANCE SOURCE CHARACTERIZATION 1DTG02049.012 PAGE 18
HUGHES ASSOCIATES
concentrations of other gases can also be measured and may provide additional information about the nature of the nuisances and/or influence the operation of novel detection equipment.
Carbon monoxide is commonly measured in laboratory experiments via air sampling and non-dispersive infrared (NDIR) analyzers. The absorption spectra of CO are well defined and the concentration of the gas can be measured by the spectral attenuation of light. Similar analyzers can be used for carbon dioxide (CO2), another key product of combustion that can be used to indicate fire conditions. Alternate measurement techniques include FTIR (see below) and electrochemical cells.
Combustion reactions consume oxygen, and the reduction of oxygen is often measured to identify and quantify the rate of combustion. Oxygen concentrations are often measured using an air sampling system comparable to the CO and CO2 systems, but utilizing a paramagnetic sensor. This sensor operates by measuring the response of the gas in a magnetic field, and correlating the induced force to the oxygen concentration.
The radiative absorption spectra of numerous potential combustion gases are well defined, and a range of species can be identified by analyzing the air using Fourier Transform Infrared (FTIR) spectroscopy. This device identifies all absorption bands across a wide spectrum, isolates each signal and compares with known spectra to identify the gas species and concentrations present in the sample.
4.3. Experimental Nuisance Simulations
The ultimate intent of this project is to develop standardized nuisance source exposure tests to verify the nuisance resistance of smoke alarms. Several laboratory experiments have been conducted to evaluate the production of particulate from potential nuisance sources and/or the response of smoke alarms exposed to such sources. The test environments and conditions, nuisance source simulations, and measured characterization data of these studies have been reviewed to help guide the selection of these factors for standardized nuisance testing.
The key test data to review include the measured particle number count densities, mean particle diameters, and mass concentrations. This data can be combined to predict the general response of photoelectric and/or ionization alarms according to the proportional relationships shown in Eq. 1-3. The response of obscuration measurements also been shown to correlate to these parameters as shown in Eq. 4.
𝑃 ∝ 𝑛𝑑2 Eq. 1 [50]
𝑃 ∝ 𝑚 Eq. 2 [49]
𝐼 ∝ 𝑛𝑑 Eq. 3 [49, 50] 𝑂𝐷
𝑙 ∝ 𝑛𝑑3 Eq. 4 [50]
where:
P – Photoelectric (scattering) sensor response
I – Ionization sensor response
n – Number density of particles
d – Geometric mean particle diameter
m – Mass concentration of particles
OD/l – Optical density per unit length

SMOKE ALARM NUISANCE SOURCE CHARACTERIZATION 1DTG02049.012 PAGE 19
HUGHES ASSOCIATES
The particle size will be influenced by the nuisance source tested (i.e., materials) and the conditions (temperature, cooking type, etc.) used to reproduce the real world conditions. The particle size can also be affected by agglomeration over the path between the source and sensors (i.e., particles combine and form larger agglomerates as shown in Fig. 2). The particle density and mass concentrations are functions of both the source production rate and the test space size, shape, and air flow conditions.
Valuable information can also be obtained from tests measuring the responses of actual smoke alarms. Understanding how the different alarm technologies respond to various sources is useful for selecting a range of nuisance sources for evaluation of universally nuisance resistant technologies. Where included, the general alarm response measured by photoelectric and ionization type devices in close proximity have been discussed. Essentially, if current smoke alarms do not alarm to test sources that are deemed a common condition, then the source is not a nuisance source.
Other test series have been conducted to evaluate the potential health effects of particulate and/or gas production rates from cooking. While these tests were not directed at the nuisance alarm problem, they can provide valuable characterization data regarding the particulate, as well as indicate the potential changes to particulate or gas production rates from more cooking types or methods, such as gas range CO production rates or impacts of ingredient types (meat, vegetable, fatty, extra oil, etc.) on particulate production.
In order to compare laboratory experiments, the primary factors of interest will be summarized. These factors include:
Physical test space design (size, shape, air flow, etc.)
Nuisance source production methods (cooking type, ingredients, temperatures, times, etc.)
Characterization Instrumentation (type and location)
o Peak mass concentration
o Peak number density
o Particle size (mean and distribution)
o Gas concentrations
Detector response
4.3.1. Smoke Alarm Response Studies
Numerous test studies have been conducted to evaluate the response of smoke alarms to various nuisance sources. The detailed studies are not an exhaustive list of all nuisance particulate or detector response studies, but represent the some of the more recent work to understanding that production of particulate and alarm response. Additional literature relevant to nuisance alarm responses is provided in the Additional References section of this report. The procedures, environments, instrumentation, and analysis methods used for these experiments are directly applicable toward development of standardized nuisance sources.
Nuisance alarm responses have been evaluated in great detail by the National Institute of Standards and Technology (NIST) [22, 57–63]. Initial nuisance aerosol testing was conducted in the late 1990s [54] evaluating the response of photoelectric and ionization detectors to vaporized peanut oil droplets and clay dust in the Universal Fire Emulator/ Detector Evaluator (FE/DE) [57], an enclosed duct allowing exposure to controlled aerosol concentrations. It was found that the light scattering sensors (photoelectric) responded more strongly than light extinction sensors to peanut oil droplets. The scattering and extinction responses were found to be much closer in proportion for the propylene smoke samples tested. Cleary proposed this was due to the smaller particle size and increased
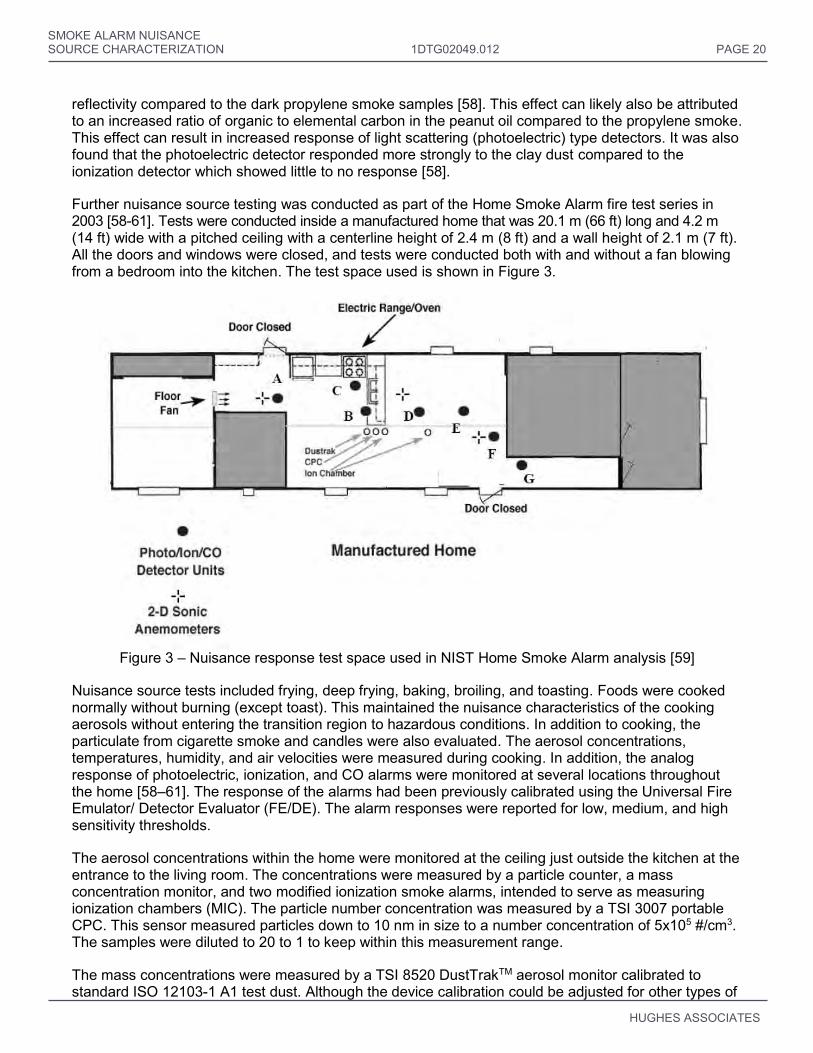
SMOKE ALARM NUISANCE SOURCE CHARACTERIZATION 1DTG02049.012 PAGE 20
HUGHES ASSOCIATES
reflectivity compared to the dark propylene smoke samples [58]. This effect can likely also be attributed to an increased ratio of organic to elemental carbon in the peanut oil compared to the propylene smoke. This effect can result in increased response of light scattering (photoelectric) type detectors. It was also found that the photoelectric detector responded more strongly to the clay dust compared to the ionization detector which showed little to no response [58].
Further nuisance source testing was conducted as part of the Home Smoke Alarm fire test series in 2003 [58-61]. Tests were conducted inside a manufactured home that was 20.1 m (66 ft) long and 4.2 m (14 ft) wide with a pitched ceiling with a centerline height of 2.4 m (8 ft) and a wall height of 2.1 m (7 ft). All the doors and windows were closed, and tests were conducted both with and without a fan blowing from a bedroom into the kitchen. The test space used is shown in Figure 3.
Figure 3 – Nuisance response test space used in NIST Home Smoke Alarm analysis [59]
Nuisance source tests included frying, deep frying, baking, broiling, and toasting. Foods were cooked normally without burning (except toast). This maintained the nuisance characteristics of the cooking aerosols without entering the transition region to hazardous conditions. In addition to cooking, the particulate from cigarette smoke and candles were also evaluated. The aerosol concentrations, temperatures, humidity, and air velocities were measured during cooking. In addition, the analog response of photoelectric, ionization, and CO alarms were monitored at several locations throughout the home [58–61]. The response of the alarms had been previously calibrated using the Universal Fire Emulator/ Detector Evaluator (FE/DE). The alarm responses were reported for low, medium, and high sensitivity thresholds.
The aerosol concentrations within the home were monitored at the ceiling just outside the kitchen at the entrance to the living room. The concentrations were measured by a particle counter, a mass concentration monitor, and two modified ionization smoke alarms, intended to serve as measuring ionization chambers (MIC). The particle number concentration was measured by a TSI 3007 portable CPC. This sensor measured particles down to 10 nm in size to a number concentration of 5x10⁵ #/cm3. The samples were diluted to 20 to 1 to keep within this measurement range.
The mass concentrations were measured by a TSI 8520 DustTrakTM aerosol monitor calibrated to standard ISO 12103-1 A1 test dust. Although the device calibration could be adjusted for other types of
SMOKE ALARM NUISANCE SOURCE CHARACTERIZATION 1DTG02049.012 PAGE 21
HUGHES ASSOCIATES
particulate, the default dust calibration was used. The measured mass is then proportional to equivalent mass of test dust. The monitor measured concentrations in the range from 0.001–150 mg/m3 for particles 0.1–10 µm. The modified ion chamber detector responses were linearly correlated to the particle mean diameter as shown in previous work by Cleary and Yang [62]. The measured data was combined to produce several characteristics of the smoke particulate. The ratio of the mass concentration and the number concentration provided a measure proportional to the mass average particle diameter. The ratio of the mean particle diameter to the number concentration was used to calculate the count median diameter of the particulate.
Test data from select sources is summarized in Table 3, including the methods used for producing the source, whether alarms responded, and the approximate peak particle concentration, ionization chamber voltage, and mass concentrations measured. A relative estimate of the particle sizes can be inferred from the ratios of the mass concentration and ion chamber voltage to the number concentration as described above. However, these measurements are all transient during the tests, and the peak values do not necessarily occur simultaneously. These estimates are provided for comparison only, and do not represent actual physical particle sizes. All calculated particle sizes are presented as relative to the largest measured for this project.
It was determined by the authors that the nuisance responses were affected by the properties of the aerosol, the concentrations, the alarm locations, and the air flow conditions. Some of the primary observations following the tests included [59]:
Air flow showed mixed responses, occasionally suppressing all alarms but occasionally suppressing only ionization alarm responses with no reduction in photoelectric alarms
The pan types and heat sources affected the response of alarms
o Bacon fat stuck to cast iron and smoked more than in aluminum
o Butter in aluminum alarm ionization, butter in cast-iron alarm photoelectric
Opening an oven causes a blast of heat and particulate
Cheese browning resulting in an increase in aerosol mass
Number concentration increased before mass concentration in broiling tests (small particles early)
Little to no response from boiling, candles, or cigarettes
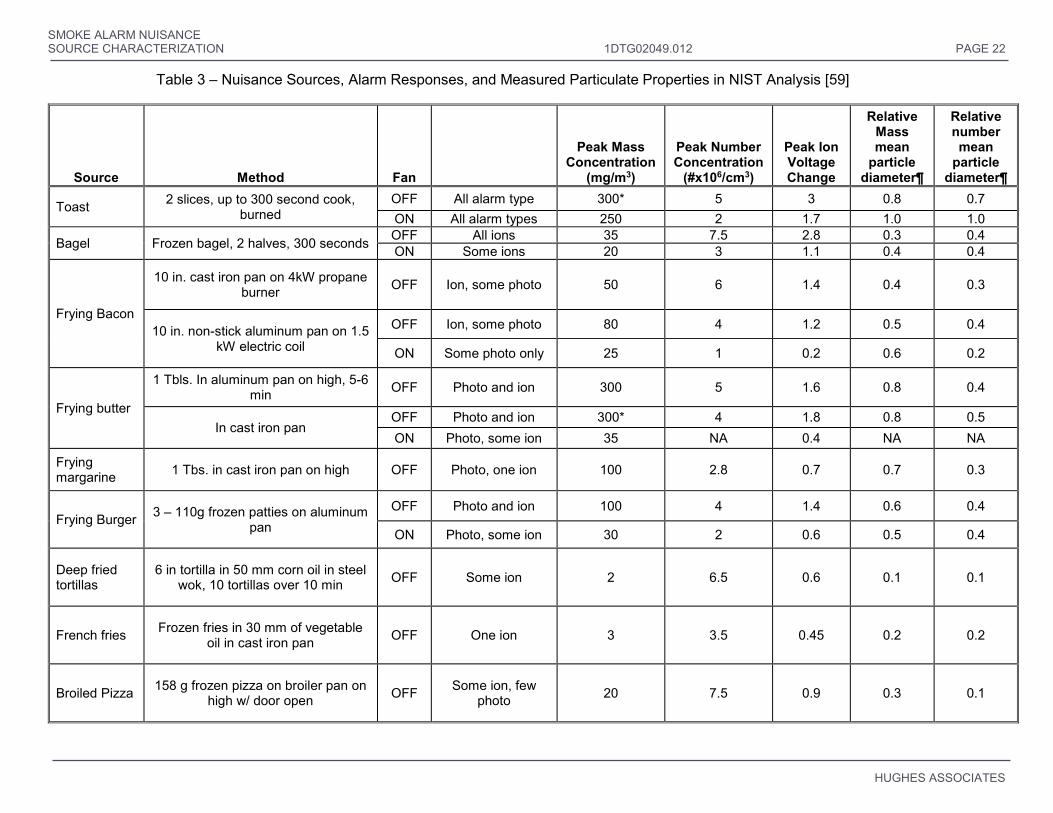
SMOKE ALARM NUISANCE SOURCE CHARACTERIZATION 1DTG02049.012 PAGE 22
HUGHES ASSOCIATES
Table 3 – Nuisance Sources, Alarm Responses, and Measured Particulate Properties in NIST Analysis [59]
Source Method Fan
Peak Mass Concentration
(mg/m3)
Peak Number Concentration
(#x106/cm3)
Peak Ion Voltage Change
Relative Mass mean
particle diameter
Relative number mean
particle diameter
Toast 2 slices, up to 300 second cook, burned
OFF All alarm type 300* 5 3 0.8 0.7 ON All alarm types 250 2 1.7 1.0 1.0
Bagel Frozen bagel, 2 halves, 300 seconds OFF All ions 35 7.5 2.8 0.3 0.4 ON Some ions 20 3 1.1 0.4 0.4
Frying Bacon
10 in. cast iron pan on 4kW propane burner OFF Ion, some photo 50 6 1.4 0.4 0.3
10 in. non-stick aluminum pan on 1.5 kW electric coil
OFF Ion, some photo 80 4 1.2 0.5 0.4
ON Some photo only 25 1 0.2 0.6 0.2
Frying butter
1 Tbls. In aluminum pan on high, 5-6 min OFF Photo and ion 300 5 1.6 0.8 0.4
In cast iron pan OFF Photo and ion 300* 4 1.8 0.8 0.5 ON Photo, some ion 35 NA 0.4 NA NA
Frying margarine 1 Tbs. in cast iron pan on high OFF Photo, one ion 100 2.8 0.7 0.7 0.3
Frying Burger 3 – 110g frozen patties on aluminum pan
OFF Photo and ion 100 4 1.4 0.6 0.4
ON Photo, some ion 30 2 0.6 0.5 0.4
Deep fried tortillas
6 in tortilla in 50 mm corn oil in steel wok, 10 tortillas over 10 min OFF Some ion 2 6.5 0.6 0.1 0.1
French fries Frozen fries in 30 mm of vegetable oil in cast iron pan OFF One ion 3 3.5 0.45 0.2 0.2
Broiled Pizza 158 g frozen pizza on broiler pan on high w/ door open OFF Some ion, few
photo 20 7.5 0.9 0.3 0.1
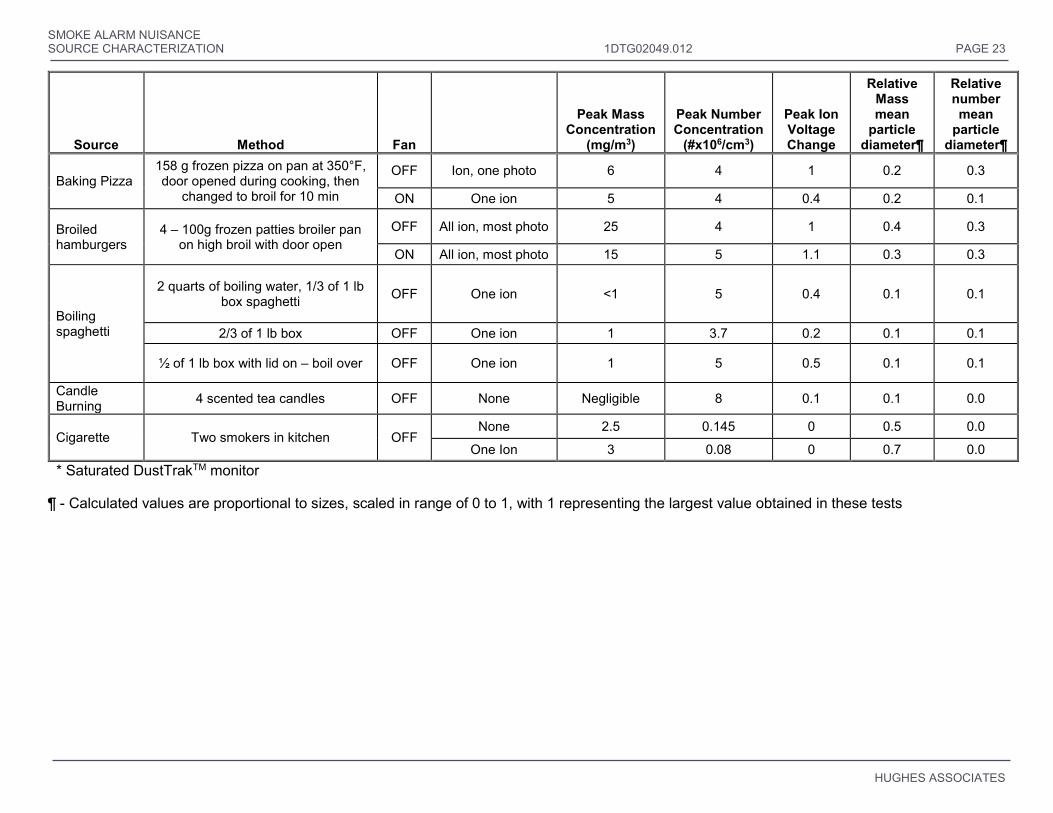
SMOKE ALARM NUISANCE SOURCE CHARACTERIZATION 1DTG02049.012 PAGE 23
HUGHES ASSOCIATES
Source Method Fan
Peak Mass Concentration
(mg/m3)
Peak Number Concentration
(#x106/cm3)
Peak Ion Voltage Change
Relative Mass mean
particle diameter
Relative number mean
particle diameter
Baking Pizza 158 g frozen pizza on pan at 350°F, door opened during cooking, then
changed to broil for 10 min
OFF Ion, one photo 6 4 1 0.2 0.3
ON One ion 5 4 0.4 0.2 0.1
Broiled hamburgers
4 – 100g frozen patties broiler pan on high broil with door open
OFF All ion, most photo 25 4 1 0.4 0.3
ON All ion, most photo 15 5 1.1 0.3 0.3
Boiling spaghetti
2 quarts of boiling water, 1/3 of 1 lb box spaghetti OFF One ion <1 5 0.4 0.1 0.1
2/3 of 1 lb box OFF One ion 1 3.7 0.2 0.1 0.1
½ of 1 lb box with lid on – boil over OFF One ion 1 5 0.5 0.1 0.1
Candle Burning 4 scented tea candles OFF None Negligible 8 0.1 0.1 0.0
Cigarette Two smokers in kitchen OFF None 2.5 0.145 0 0.5 0.0
One Ion 3 0.08 0 0.7 0.0 * Saturated DustTrakTM monitor
¶ - Calculated values are proportional to sizes, scaled in range of 0 to 1, with 1 representing the largest value obtained in these tests

SMOKE ALARM NUISANCE SOURCE CHARACTERIZATION 1DTG02049.012 PAGE 24
HUGHES ASSOCIATES
More recent work conducted by Chernovsky and Cleary provided additional focus toward development of standardized nuisance resistance testing [22]. Tests were conducted in a simulated home, smaller than that used for the Home Smoke Alarm Project, as shown in Figure 4. The total home size was 8.6 x 4.4 m (27.5 ft x 14.4 ft), and included a 3.6 m x 3 m (11.8 ft x 9.8 ft) kitchen space with 3 openings, each with a 30 cm (1 ft) soffit to contain combustion products at the ceiling. Smoke alarms were located throughout the space at 2 m, 3 m, 4 m, and 6.5 m (6.6 ft, 9.8 ft, 13.1 ft, and 21.3 ft) from the cooking range.
Figure 4 – Schematic of simulated home used in 2013 NIST nuisance study including instrumentation
(top) and smoke alarms (bottom) [22]
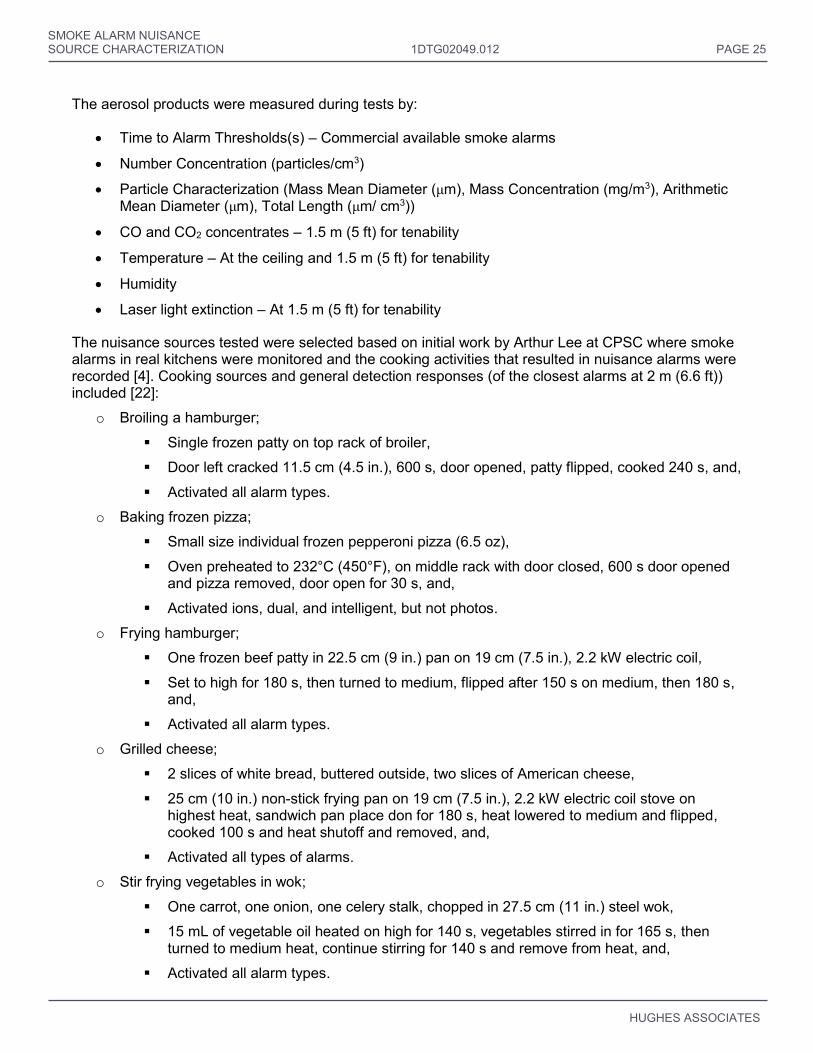
SMOKE ALARM NUISANCE SOURCE CHARACTERIZATION 1DTG02049.012 PAGE 25
HUGHES ASSOCIATES
The aerosol products were measured during tests by:
Time to Alarm Thresholds(s) – Commercial available smoke alarms
Number Concentration (particles/cm3)
Particle Characterization (Mass Mean Diameter (μm), Mass Concentration (mg/m3), Arithmetic Mean Diameter (μm), Total Length (μm/ cm3))
CO and CO2 concentrates – 1.5 m (5 ft) for tenability
Temperature – At the ceiling and 1.5 m (5 ft) for tenability
Humidity
Laser light extinction – At 1.5 m (5 ft) for tenability
The nuisance sources tested were selected based on initial work by Arthur Lee at CPSC where smoke alarms in real kitchens were monitored and the cooking activities that resulted in nuisance alarms were recorded [4]. Cooking sources and general detection responses (of the closest alarms at 2 m (6.6 ft)) included [22]:
o Broiling a hamburger;
Single frozen patty on top rack of broiler,
Door left cracked 11.5 cm (4.5 in.), 600 s, door opened, patty flipped, cooked 240 s, and,
Activated all alarm types.
o Baking frozen pizza;
Small size individual frozen pepperoni pizza (6.5 oz),
Oven preheated to 232°C (450°F), on middle rack with door closed, 600 s door opened and pizza removed, door open for 30 s, and,
Activated ions, dual, and intelligent, but not photos.
o Frying hamburger;
One frozen beef patty in 22.5 cm (9 in.) pan on 19 cm (7.5 in.), 2.2 kW electric coil,
Set to high for 180 s, then turned to medium, flipped after 150 s on medium, then 180 s, and,
Activated all alarm types.
o Grilled cheese;
2 slices of white bread, buttered outside, two slices of American cheese,
25 cm (10 in.) non-stick frying pan on 19 cm (7.5 in.), 2.2 kW electric coil stove on highest heat, sandwich pan place don for 180 s, heat lowered to medium and flipped, cooked 100 s and heat shutoff and removed, and,
Activated all types of alarms.
o Stir frying vegetables in wok;
One carrot, one onion, one celery stalk, chopped in 27.5 cm (11 in.) steel wok,
15 mL of vegetable oil heated on high for 140 s, vegetables stirred in for 165 s, then turned to medium heat, continue stirring for 140 s and remove from heat, and,
Activated all alarm types.
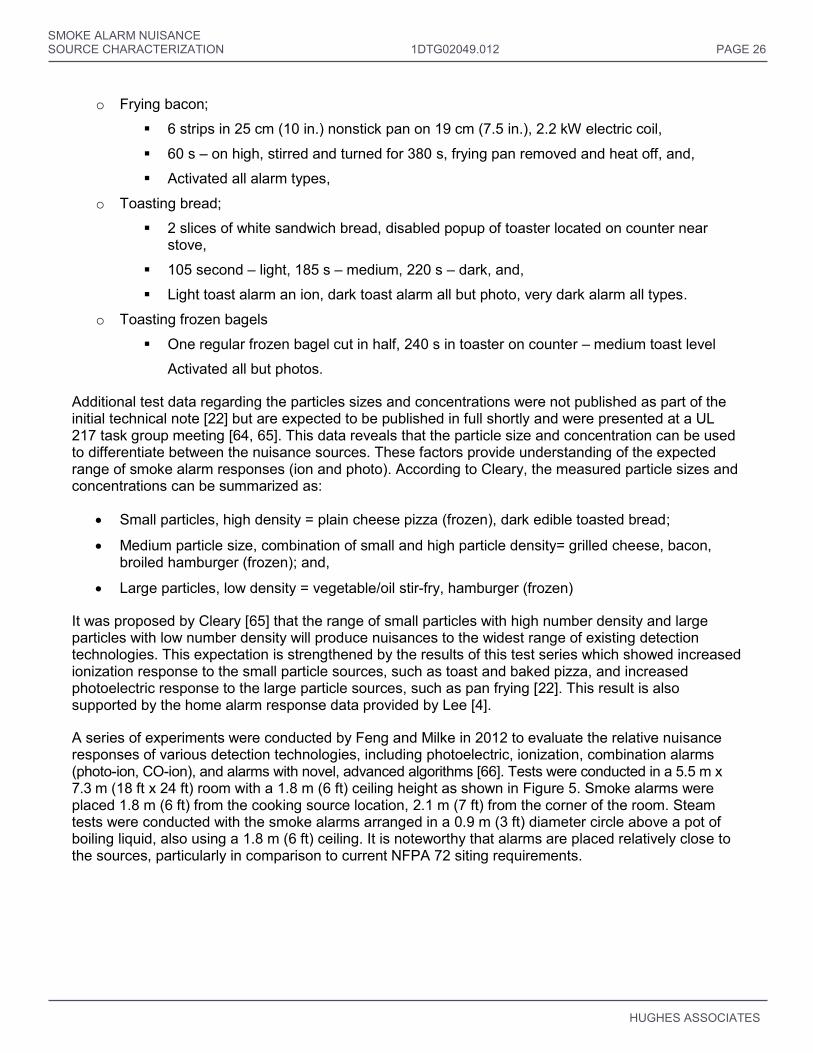
SMOKE ALARM NUISANCE SOURCE CHARACTERIZATION 1DTG02049.012 PAGE 26
HUGHES ASSOCIATES
o Frying bacon;
6 strips in 25 cm (10 in.) nonstick pan on 19 cm (7.5 in.), 2.2 kW electric coil,
60 s – on high, stirred and turned for 380 s, frying pan removed and heat off, and,
Activated all alarm types,
o Toasting bread;
2 slices of white sandwich bread, disabled popup of toaster located on counter near stove,
105 second – light, 185 s – medium, 220 s – dark, and,
Light toast alarm an ion, dark toast alarm all but photo, very dark alarm all types.
o Toasting frozen bagels
One regular frozen bagel cut in half, 240 s in toaster on counter – medium toast level
Activated all but photos.
Additional test data regarding the particles sizes and concentrations were not published as part of the initial technical note [22] but are expected to be published in full shortly and were presented at a UL 217 task group meeting [64, 65]. This data reveals that the particle size and concentration can be used to differentiate between the nuisance sources. These factors provide understanding of the expected range of smoke alarm responses (ion and photo). According to Cleary, the measured particle sizes and concentrations can be summarized as:
Small particles, high density = plain cheese pizza (frozen), dark edible toasted bread;
Medium particle size, combination of small and high particle density= grilled cheese, bacon, broiled hamburger (frozen); and,
Large particles, low density = vegetable/oil stir-fry, hamburger (frozen)
It was proposed by Cleary [65] that the range of small particles with high number density and large particles with low number density will produce nuisances to the widest range of existing detection technologies. This expectation is strengthened by the results of this test series which showed increased ionization response to the small particle sources, such as toast and baked pizza, and increased photoelectric response to the large particle sources, such as pan frying [22]. This result is also supported by the home alarm response data provided by Lee [4].
A series of experiments were conducted by Feng and Milke in 2012 to evaluate the relative nuisance responses of various detection technologies, including photoelectric, ionization, combination alarms (photo-ion, CO-ion), and alarms with novel, advanced algorithms [66]. Tests were conducted in a 5.5 m x 7.3 m (18 ft x 24 ft) room with a 1.8 m (6 ft) ceiling height as shown in Figure 5. Smoke alarms were placed 1.8 m (6 ft) from the cooking source location, 2.1 m (7 ft) from the corner of the room. Steam tests were conducted with the smoke alarms arranged in a 0.9 m (3 ft) diameter circle above a pot of boiling liquid, also using a 1.8 m (6 ft) ceiling. It is noteworthy that alarms are placed relatively close to the sources, particularly in comparison to current NFPA 72 siting requirements.

SMOKE ALARM NUISANCE SOURCE CHARACTERIZATION 1DTG02049.012 PAGE 27
HUGHES ASSOCIATES
Figure 5 – Nuisance source test space used by Feng and Milke [66]
Instrumentation used to measure the nuisance particulate included only the smoke alarms and an ODM located just below the devices. No additional instruments were used to characterize the particle size, number, or mass concentrations.
Nuisance sources evaluated included toast, frying onions, hamburgers, and heating vegetable oil. In addition to these cooking sources, the responses to steam and cement dust were evaluated. The setup of the nuisance sources and the general alarm responses included:
o Toasting bread
2 slices in a toaster with a 4 minute cycle
2 cooking cycles evaluated (<5.73 minutes considered nuisance)
Activated all alarm types except photo during nuisance phase
o Fried Onion
1 lb onion quartered twice (2.5-5.0 cm (<1 in. x 2 in. pieces)) coated in 0.025 L vegetable oil
Cooked on high heat in 30 cm (1 ft) frying pan, flipped every 5 minutes for 30 minutes (<23.4 minutes considered nuisance)
Alarmed only advanced algorithm alarm during nuisance phase
o Frying hamburger
Three 1/3 lb. frozen beef patties in 30 cm (1 ft) pan on high heat
Flipped every 5 minutes for 20 minutes (<16.9 minutes considered nuisance)
Activated ion, ion-photo, and advanced algorithm alarm during nuisance phase
o Vegetable oil
0.3 L of vegetable oil in 30 cm (1 ft) pan on high heat
Vaporized for 30 minutes (<18 minutes considered nuisance)
SMOKE ALARM NUISANCE SOURCE CHARACTERIZATION 1DTG02049.012 PAGE 28
HUGHES ASSOCIATES
Activated ion, ion-photo, and ion-CO detector during nuisance phase
o Steam
1 L of water brought to boil, lid removed for 20 seconds every 2 minutes
Located below 0.9 m (3 ft) circle of detectors (closer than other tests)
Activated photo and combo photo-ion
o Cement dust
Cement ejected at 12-13 psi from powder coating gun
Ejected over a hot plate on high to provide thermal buoyancy
Activated photo, photo-ion, and ion detectors
A key factor for developing nuisance resistance testing is defining the transition between a nuisance alarm and the development of a real hazard. The cooking tests conducted by Feng and Milke investigated this transition by allowing the toast, onion, hamburger, and vegetable oil cooking sources to continue cooking beyond normal temperatures and developing into potential hazards. They did not allow for the development of fires (flaming or smoldering), but they did continue cooking beyond normal conditions, burning food to a point that would likely require cook intervention. This was referred to as “aggressive” cooking by Feng and Milke [66].
Criteria were developed to analyze the test data to identify the nuisance phase and the aggressive cooking phase. This distinction was based on the ODM measurements reaching a level of 0.5 %/m (0.15 %/ft), and was generally confirmed by visual observations of the food remaining edible and not burned [66]. Similar criteria will need to be developed for standardized nuisance testing to distinguish between nuisance responses and valid alarm responses.
A series of tests were conducted in 2002 by Qiyuan [67] to determine the responses of photoelectric and ionization smoke detectors to various sources. The detectors were analyzing using a modified FE/DE apparatus at the State Key Laboratory of Fire Science (SKLFS) in University of Science and Technology of China (USTC). Aerosol exposures included real fires as well as nuisance sources such as dry flour, dust, and steam at hot 82°F (28°C) and cold 45°F (7°C) ambient conditions.
Qiyuan observed that the photoelectric detector was more prone to nuisance alarms from the dust and steam than the ionization detector. After the flour dust exposure testing, the photoelectric signal remained elevated due to adhered flour dust within the chamber. This increase in baseline signal could result in additional nuisance sensitivity in the future.
It was also observed that the photoelectric detector was more prone to nuisance alarms to steam when the ambient temperature was cold. This was attributed to condensation of the humidity in cold air (45°F (7°C)) forming into water droplets that better scatter light. No condensation occurred at hotter temperatures (82°F (28°C)), and no alarms occurred. It was also concluded by the author that the photoelectric detector signal decreased when the ambient was hot because of decreased resistance in the sensor. This would also make the detector less prone to nuisance alarms in hot temperatures.
4.3.2. Nuisance Characterization
In addition to work conducted to evaluate the performance of smoke alarms to nuisance sources, other work has been done to characterize nuisance aerosols themselves. This work includes measurements of many of the parameters critical to defining alarm response, but focuses more on the physical aspects of the particulate.
SMOKE ALARM NUISANCE SOURCE CHARACTERIZATION 1DTG02049.012 PAGE 29
HUGHES ASSOCIATES
Work conducted by Chen et al. utilized the FE/DE to analyze the aerosol produced by dust, water mist, cooking oil mists, and cigarette smoke [68]. The size and number concentrations were measured using a SMPS (see Section 4.2.1) and a multi-angle (30, 60, 90, 120, and 150 degree) light scattering sensor.
Analyzed particulate included Loess dust (<60 µm), gray and white cement (10% of dust <80 µm), water mist from an ultrasound humidifier, peanut oil mixed with soy sauce on an induction stovetop, and cigarette smoke. The nuisance test data was compared with the results from several smoldering and flaming fire sources.
It was determined that the particle sizes increased and the number concentrations decreased with increased air flow velocities. This was considered a result of particle agglomeration due to collisions from increased turbulence. It was also observed that the vaporized peanut oil had similar particle sizes to smoldering cotton, but that the size was greatly influenced by the remaining soy sauce content throughout the test. The size of the water mist and cigarette smoke were also found to be similar, and were generally smaller than the oil vapors. No actual particle sizes are reported in the data.
With respect to angular light scattering (as applicable to photoelectric technologies), it was observed that the large dust and oil particles responded similar to the smoldering sources, with the strongest scattering at 30 degrees and the weakest at 120 degrees. The water mist and cigarettes (smaller particles) were observed to have the strongest scattering at 150 degrees and the weakest at 120 degrees. The flaming sources showed the greatest scattering at 30 degrees, with the weakest at 90 degrees [68].
A series of recent experiments have been conducted by Fabian, Zevotek, and Milke by Underwriter’s Laboratory and the University of Maryland to try to identify the potential indicators of cooking fires [69]. Cooking was conducted on an electric coil stovetop placed in a typical kitchen setup. Measurements included air temperatures, obscuration levels, gas concentrations, pan temperatures, and ionization detector signal strength located above the range top.
Cooking methods included frying lean ground beef, blackening fish, frying vegetables, searing steak, frying bacon, and deep frying potatoes in peanut oil. In addition to measuring the emissions during these normal cooking activities, the experiments were extended to investigate production during hazardous conditions. Additional hazardous condition testing included a pot of corn oil left unattended and an oven mitt placed on the stovetop. Test data was used to identify the most effective sensing methods at distinguishing between the normal cooking and the hazardous conditions.
In order to perform this analysis, clear distinctions were drawn between the end of normal cooking, the start and end of pre-flame conditions, and flaming ignition. Such distinctions are key in defining smoke alarm responses as nuisances or valid during standardized testing. The criteria used to define these distinctions is not clearly presented, however.
Recent work conducted by Dinaburg and Gottuk for the Fire Protection Research Foundation (FPRF) has attempted to identify potential nuisance to hazard threshold criteria [70, 71]. This work evaluated the pre-ignition characteristics of various cooking oils heated on an electric range in order to develop standardized tests for evaluation of automatic fire prevention devices. Measurements were made of the pan surface and oil temperatures. In addition, air temperature, smoke obscuration, and O2, CO2, and CO gas concentrations were measured in a 1.2 m x 1.2 m x 0.9 m (4 ft x 4 ft x 1 ft) deep enclosed collection hood placed 0.9 m (3 ft) above the stove top.
The pan and oil temperatures associated with normal cooking procedures and oil ignition were considered [72, 73] and a maximum normal cooking temperature of 260°C (500°F) was suggested as a possible nuisance threshold. Measurement of smoke obscuration before this temperature would indicate a test with potential for nuisance alarms to occur. It was determined that the free fatty acid content of the oil tested was proportional to the amount of smoke and the smoke production
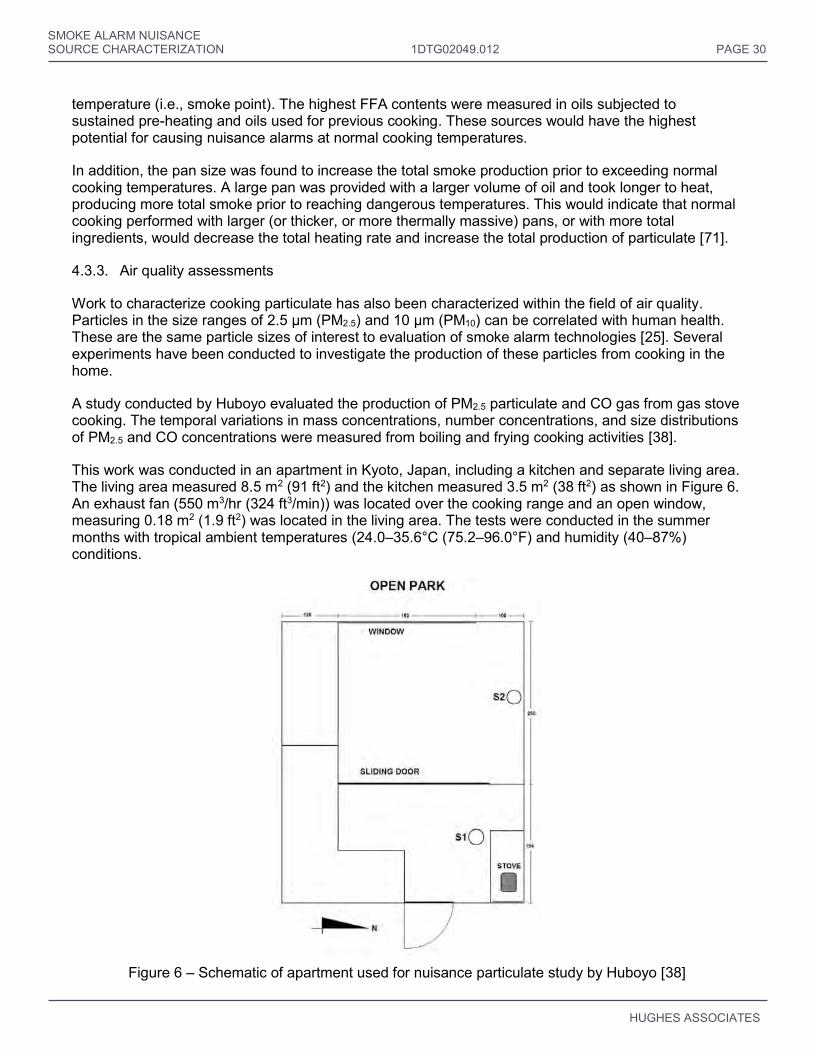
SMOKE ALARM NUISANCE SOURCE CHARACTERIZATION 1DTG02049.012 PAGE 30
HUGHES ASSOCIATES
temperature (i.e., smoke point). The highest FFA contents were measured in oils subjected to sustained pre-heating and oils used for previous cooking. These sources would have the highest potential for causing nuisance alarms at normal cooking temperatures.
In addition, the pan size was found to increase the total smoke production prior to exceeding normal cooking temperatures. A large pan was provided with a larger volume of oil and took longer to heat, producing more total smoke prior to reaching dangerous temperatures. This would indicate that normal cooking performed with larger (or thicker, or more thermally massive) pans, or with more total ingredients, would decrease the total heating rate and increase the total production of particulate [71].
4.3.3. Air quality assessments
Work to characterize cooking particulate has also been characterized within the field of air quality. Particles in the size ranges of 2.5 µm (PM2.5) and 10 µm (PM10) can be correlated with human health. These are the same particle sizes of interest to evaluation of smoke alarm technologies [25]. Several experiments have been conducted to investigate the production of these particles from cooking in the home.
A study conducted by Huboyo evaluated the production of PM2.5 particulate and CO gas from gas stove cooking. The temporal variations in mass concentrations, number concentrations, and size distributions of PM2.5 and CO concentrations were measured from boiling and frying cooking activities [38].
This work was conducted in an apartment in Kyoto, Japan, including a kitchen and separate living area. The living area measured 8.5 m2 (91 ft2) and the kitchen measured 3.5 m2 (38 ft2) as shown in Figure 6. An exhaust fan (550 m3/hr (324 ft3/min)) was located over the cooking range and an open window, measuring 0.18 m2 (1.9 ft2) was located in the living area. The tests were conducted in the summer months with tropical ambient temperatures (24.0–35.6°C (75.2–96.0°F) and humidity (40–87%) conditions.
Figure 6 – Schematic of apartment used for nuisance particulate study by Huboyo [38]
SMOKE ALARM NUISANCE SOURCE CHARACTERIZATION 1DTG02049.012 PAGE 31
HUGHES ASSOCIATES
During the cooking experiments, the particle mass and size distributions were measured by a Sioutas cascade impactor with a 9 L/m sample rate. This device does not provide real-time measurements, but rather an integrated result from a complete test. The particulate collected from an entire test was collected on quartz filters exposed to desiccants and anti-static chemical to increase accuracy before weighing the collected particles. The organic and elemental carbon contents on the collection filters were also evaluated after testing (see Section 4.2.5).
The particulate was also measured in real time using UCB particle monitors which include light scattering and ionization sensors correlated to the particle mass concentrations and sizes (see Section 4.2.6 and [55, 56]). In addition, the CO concentrations were measured by a Lascar CO sensor with 1000 ppm range, the indoor temperature and humidity were measured by a thermohygrometer. The sensors were located at a height of 1.5 m (4.9 ft), 1 m (3.3 ft) in front of the stove. This was considered to be representative of the location of a cook. In addition to the indoor measurement, ambient outdoor particulate levels were obtained from a nearby monitoring station and recorded.
In each experiment, the cooking temperature, ingredients, cooking time, and cooking method were recorded. Cooking was conducted during breakfast, lunch, and dinner times to evaluate the impacts of diurnal ambient particle concentrations. Experiments conducted included:
Emissions from gas stove w/o cooking;
Frying in sunflower oil (maximum temperature 160°C (320°F));
o Soybean curd tofu (low fat), and,
o Chicken (high fat).
Boiling without a lid (maximum temperature 100°C (212°F));
o Soybean curd tofu (low fat), and,
o Chicken (high fat).
It was determined from these experiments that a significant number of fine particles were produced during the cooking experiments. Frying was found to produce higher emission of total particles and a wider range of particle sizes than boiling. Frying produced particles ranging from 0.3 to 5 µm, while boiling produced particles from 0.3 to 1 µm in size. The number concentration of 0.3–0.5 µm particles increased by 134–247% over ambient for frying but only by 29–48% for boiling. Frying at higher temperatures was found to produce more particle emissions. It was also determined that cooking of foods with higher fat produced greater mass of particle emissions.
High concentrations of organic carbon were measured in the PM2.5 emissions, with the highest concentrations produced by frying high fat ingredients [38]. The organic carbon content has been linked to increased light scattering, and therefore likely response of photoelectric type detectors [45].
The highest levels of CO were measured when running the gas stove without a utensil (i.e., pan or pot) or food cooking on top. It is believed by the author that the water aerosol produced during cooking absorbs the CO produced by the range. This effect is less pronounced for oil mists. CO gas has been found to have a solubility of 0.024 g/kg of water and has a similar polarity, increasing the rate of absorption [74]. The absorption of CO by water mist droplets was confirmed in cooking oil fire extinguishing tests conducted by Fang et al. [75]. It was found that the use of water mist over cooking fires greatly reduced the CO concentrations due to absorption. It is not noted by the author if chemical kinetics was considered as a mechanism for the effect.
It was generally observed that frying increased the CO production rates over boiling, and that cooking foods with higher fat contents also increased the CO production rates. However, CO levels in no test reached higher than 4 ppm levels, so CO production rates were generally low for all tests [38].

SMOKE ALARM NUISANCE SOURCE CHARACTERIZATION 1DTG02049.012 PAGE 32
HUGHES ASSOCIATES
Continuous 3 hour mean CO levels in kitchens with natural gas stoves were generally not found to exceed 2 ppm in experiments conducted by Tian et al. [76].
Other work has shown that CO levels can be increased well above the values measured by Huboyo or Tian by cooking with a gas oven. Field studies were conducted to measure the ambient CO levels in kitchens with an operating gas oven by Tsongas at Portland State University. They found ambient levels in small, but semi-leaky kitchens to reach over 9 ppm in half of kitchens, and greater than 35 ppm in 15% of kitchens. One reported measurement recorded ambient CO levels greater than 330 ppm [77].
A range of other air quality evaluation tests verify the findings of Huboyo. Cooking tests conducted by Wallace et al. [78] and Balasubramanian [79] confirm that frying increases the amount of PM2.5 emissions compared to other cooking methods. Buonanno demonstrated that the emission of particles increased both with the cooking temperature and the fat content of the ingredients [80].
Work conducted by Yeung and To evaluated the emissions in commercial restaurants, including traditional Chinese and Western cooking. They found that peak cooking aerosol emissions were found in the 100–160 nm range, but that the distributions were generally bi-modal. It was also determined that higher cooking temperatures increased the mode emission diameter [81].
The elemental and organic carbon levels were also analyzed in work by Balasubramanian. It was found that frying produced between 52–63% of organic carbon and boiling produced 44% organic carbon particulate [80]. These are higher levels than those measured by Huboyo, likely due to the sampling location at 20 cm from the stove, rather than 1 m. Increased organic carbon levels have been attributed to greater light scattering, and therefore photoelectric response [45]. It is possible that these levels decay with the distance from the cooking action.
5. GAP ANALYSIS
The identification and discussion of gaps is provided in the following section by assessing the elements needed to develop a standard set of nuisance source tests. Development of a standardized test should consider the following items:
1. Selection and categorization of nuisance sources to be evaluated;
a. Common and likely sources to be encountered in real life, and,
b. Categorized to represent wide array of sources with limited testing.
2. Test methods for re-creation of common nuisance sources;
3. Configuration of the test space representative of “typical” residence(s) ;
4. Measurements to characterize nuisance source tests and related instrumentation ;
a. Verify repeatability and reproducibility for the specified test conditions, and,
b. Develop criteria for conduct of a “valid” test.
5. Methodology for evaluation of a smoke alarm/detector including:
a. Installation locations;
b. Test performance evaluation criteria (i.e. delayed or no response, x of y tests…); and,
c. Definition of nuisance resistant smoke alarm/detector.
Each of these elements are discussed below in light of the literature review conducted.
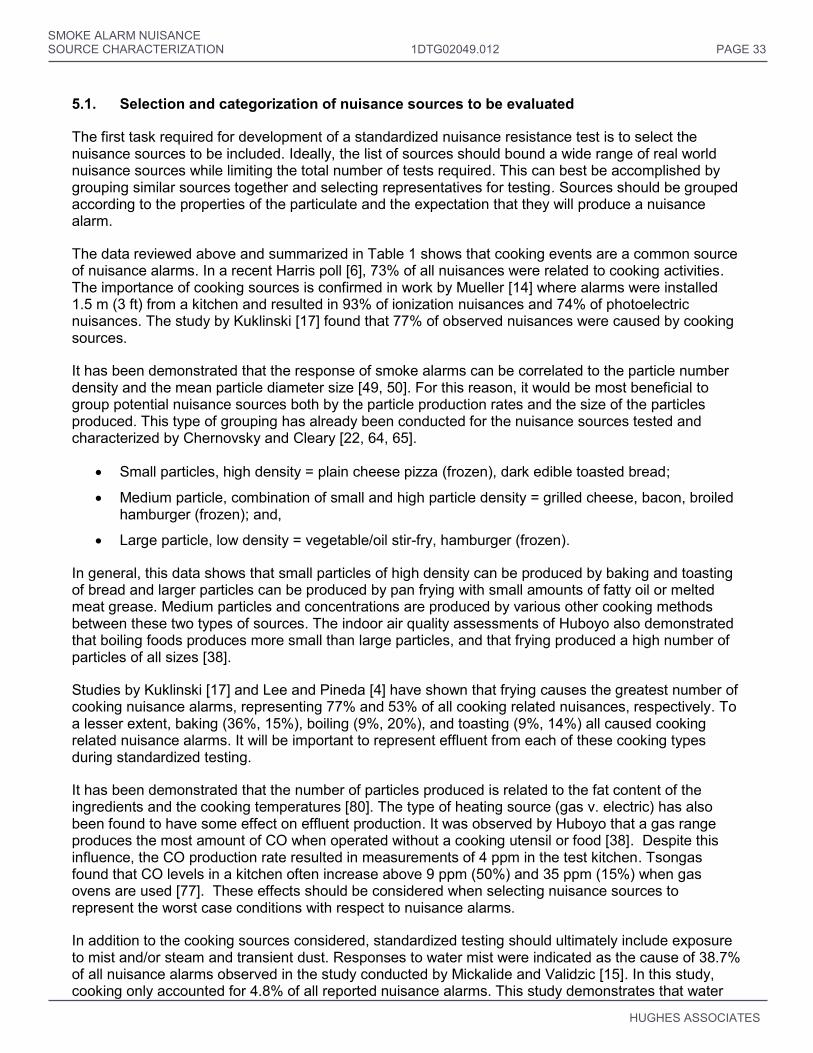
SMOKE ALARM NUISANCE SOURCE CHARACTERIZATION 1DTG02049.012 PAGE 33
HUGHES ASSOCIATES
5.1. Selection and categorization of nuisance sources to be evaluated
The first task required for development of a standardized nuisance resistance test is to select the nuisance sources to be included. Ideally, the list of sources should bound a wide range of real world nuisance sources while limiting the total number of tests required. This can best be accomplished by grouping similar sources together and selecting representatives for testing. Sources should be grouped according to the properties of the particulate and the expectation that they will produce a nuisance alarm.
The data reviewed above and summarized in Table 1 shows that cooking events are a common source of nuisance alarms. In a recent Harris poll [6], 73% of all nuisances were related to cooking activities. The importance of cooking sources is confirmed in work by Mueller [14] where alarms were installed 1.5 m (3 ft) from a kitchen and resulted in 93% of ionization nuisances and 74% of photoelectric nuisances. The study by Kuklinski [17] found that 77% of observed nuisances were caused by cooking sources.
It has been demonstrated that the response of smoke alarms can be correlated to the particle number density and the mean particle diameter size [49, 50]. For this reason, it would be most beneficial to group potential nuisance sources both by the particle production rates and the size of the particles produced. This type of grouping has already been conducted for the nuisance sources tested and characterized by Chernovsky and Cleary [22, 64, 65].
Small particles, high density = plain cheese pizza (frozen), dark edible toasted bread;
Medium particle, combination of small and high particle density = grilled cheese, bacon, broiled hamburger (frozen); and,
Large particle, low density = vegetable/oil stir-fry, hamburger (frozen).
In general, this data shows that small particles of high density can be produced by baking and toasting of bread and larger particles can be produced by pan frying with small amounts of fatty oil or melted meat grease. Medium particles and concentrations are produced by various other cooking methods between these two types of sources. The indoor air quality assessments of Huboyo also demonstrated that boiling foods produces more small than large particles, and that frying produced a high number of particles of all sizes [38].
Studies by Kuklinski [17] and Lee and Pineda [4] have shown that frying causes the greatest number of cooking nuisance alarms, representing 77% and 53% of all cooking related nuisances, respectively. To a lesser extent, baking (36%, 15%), boiling (9%, 20%), and toasting (9%, 14%) all caused cooking related nuisance alarms. It will be important to represent effluent from each of these cooking types during standardized testing.
It has been demonstrated that the number of particles produced is related to the fat content of the ingredients and the cooking temperatures [80]. The type of heating source (gas v. electric) has also been found to have some effect on effluent production. It was observed by Huboyo that a gas range produces the most amount of CO when operated without a cooking utensil or food [38]. Despite this influence, the CO production rate resulted in measurements of 4 ppm in the test kitchen. Tsongas found that CO levels in a kitchen often increase above 9 ppm (50%) and 35 ppm (15%) when gas ovens are used [77]. These effects should be considered when selecting nuisance sources to represent the worst case conditions with respect to nuisance alarms.
In addition to the cooking sources considered, standardized testing should ultimately include exposure to mist and/or steam and transient dust. Responses to water mist were indicated as the cause of 38.7% of all nuisance alarms observed in the study conducted by Mickalide and Validzic [15]. In this study, cooking only accounted for 4.8% of all reported nuisance alarms. This study demonstrates that water
SMOKE ALARM NUISANCE SOURCE CHARACTERIZATION 1DTG02049.012 PAGE 34
HUGHES ASSOCIATES
mist can be a significant cause of nuisance alarms. Steam tests conducted by Feng and Milke utilized a boiling water pot with the lid removed. This source was located very close (1.5 ft radius) from the alarms due to the rapid dissipation of the steam source. In addition to boiling water, other possible steam sources include mist from showers. This type of source could produce larger amounts of steam for evaluation purposes. The steam source selected should be large but representative of realistic conditions.
Nuisance dust tests have previously been conducted using Arizona road dusts, various cement dusts, Loess dust, and flour. While these dusts have been evaluated for nuisance alarm potential, it has been noted in discussions with smoke alarm manufacturer Kidde [82] that long fiber lint is a common source of nuisance or malfunctioning alarms in hotel rooms. These rooms are subjected to daily vacuuming and changing of bed linens, representing a severe exposure of conditions similar to typical residential dust conditions. Evaluation of this type of dust, acquired from vacuuming, clothing, or dryer lint may provide a more realistic representation of the problem compared to road dust or cement.
Long term exposure to dust and/or cigarette smoke may impact overall sensitivity of a device and susceptibility to other nuisance sources. Although no studies reviewed indicated dust as a direct cause of nuisance alarms, examination by Shapiro [18] found significant amounts of contamination located inside of the chambers of disconnected and disabled alarms. It was also observed by Qiyuan that photoelectric chambers measured increased background signals after exposure to flour dust. Real world nuisance data has shown that while cigarette smoke does not cause many nuisances (2.4% [15] to 10% [17], the presence of ambient cigarette smoke has been correlate to increased nuisance alarms [17]. The impact of long term ambient smoke and dust exposures should be investigated.
In general, previous testing and surveys provide a fairly well defined set of likely sources of nuisance alarms. It is clear that cooking sources such as frying, baking, broiling, boiling, and toasting must be represented by the final set of tests. Chernovsky and Cleary demonstrated that these sources could be categorized by particulate sizes and concentrations. Dust, water mist, and tobacco smoke are also either directly or indirectly linked to nuisance alarms. The remaining gaps to selection and characterization of nuisance sources include:
Validating the categorization (bounding) of sources as proposed from the NIST data;
Verification of the reproducibility of categorized cooking by particle size and production rate;
Selection of a representative steam source;
Selection of a test dust and exposure method; and,
Quantifying the effects of long term dust/cigarette smoke exposure on nuisance alarm proclivity.
5.2. Test methods for re-creation of common nuisance sources
Potentially the most time consuming and difficult part of developing standardized tests is defining the detailed methodology and characterizing the acceptable variance in tests so that the objective of the test is achieved. In this case, the objective is to repeatedly simulate common household occurrences that are known to cause nuisance alarms. Although there are a number of studies that have conducted various cooking sources, even with generally similar methods (e.g., heating oil in a pot), there are no established cooking sources that have been both defined and replicated by multiple labs. The work of Chernovsky and Cleary [22] to simulate the field observations of Lee [4] has taken a first step toward this end. However, unpublished work by Gottuk et al. has recently shown significant variations in effluent and smoke alarm responses to some of the cooking events defined by Chernovsky and Cleary. This highlights the need to identify parameters in the test method that are most influential on the effluent (particle generation) profiles.
SMOKE ALARM NUISANCE SOURCE CHARACTERIZATION 1DTG02049.012 PAGE 35
HUGHES ASSOCIATES
The work by Dinaburg and Gottuk [70, 71] in developing standardized cooking fires with heating oil has shown that parameters, such as free fatty acid of the oil, can significantly affect the smoke production temperature and rate. Besides the specific oil characteristics, other factors, such as the size of the pan, can impact the smoke production. Despite the number of variables that can impact heating oil and effluent production, this source is actually relatively simple compared to other cooking events that include food materials that are less defined in composition. For example, the use of vegetables for stir fry or hamburgers for frying and broiling can be highly variable in composition (fat and water content) and quality. The variable food characteristics will likely impact the source effluent.
Slight variations in the method of cooking can also impact the source development. For example, how a hamburger is placed on a broiling pan relative to the design of the drip openings in the pan and the distance from the heating element can determine whether grease from the hamburger ignites during the broiling process.
Consequently, the current gap in test methods is that there has been little to no work in systematically evaluating the parameters that most influence the cooking source effluent production relative to the degree these parameters can be practically defined with a reasonable variance. Particularly with food materials, defining a consistent composition can be difficult. So the goal is to define the source in a way that is still practical to execute.
The gaps toward defining test methodology include:
Parametric evaluation of factors affecting production of cooking particulate; and,
Reproducibility of effluent produced by cooking real food sources.
5.3. Configuration of the test space
The physical architecture of the test setup needs to be representative of residences while also providing the most challenging conditions for nuisance alarm resistance. A standardized test enclosure and ambient conditions need to be selected. In the literature, there has been a wide range of compartment sizes used in smoke alarm testing with no standard size established. These have ranged from enclosed ducts (such as FE/DE), to small rooms, to multi-room apartments and houses. In the field, the range of kitchen sizes and layouts of houses is even more varied than those used in alarm tests.
However, the smoke alarm performance field studies [4, 17–18], and even some laboratory tests [22] have clearly shown that the closer a smoke alarm is to a source, the higher likelihood for a nuisance alarm. Although this finding is no surprise, the data also shows that there is a correlation between disabled smoke alarms relative to distance from a source. For example, the CDC 10-year smoke alarm project found that 70% of alarms located in kitchens were not functional compared to 45% of alarms located in other parts of the home [12]. The CPSC study by Smith [17] and Shapiro [18] found that among 33 disabled alarms, 11 were within 1.5 m (5 ft) of cooking, steam or moisture, and an additional nine were within 1.5–3.0 m (5-10 ft). Alarms that were closer to the kitchen/cooking source (or other likely nuisance source) were more apt to be disabled.
Consequently, the test enclosure should be representative of a small kitchen to provide a worst case nuisance scenario, increasing the concentrations and reducing distances to the alarms. The intent of the code is to provide alarms capable of operating within 6.1 m (20 ft) of cooking appliances, and the test space should be smaller than this limit to provide sufficient evidence of nuisance resistance at this range. Field testing as well as experimental testing has shown that many nuisance sources need to be located rather close (potentially less than 2 m (6.6 ft)) from a smoke alarm to cause a nuisance activation. Consequently, a room on the order of 2.4 x 3.7 x 2.4 m high (8 x 12 x 8 ft) is expected to be a reasonable size that allows smoke alarms to be spaced 1.8 and 3.0 m (6 and 10 ft) from a source.
SMOKE ALARM NUISANCE SOURCE CHARACTERIZATION 1DTG02049.012 PAGE 36
HUGHES ASSOCIATES
However, to the extent that data exists, this recommended enclosure size should be compared to kitchen sizes across the country to determine if a different size space should be used.
The UL Fire Test room is 11 m x 6.7 m x 3 m (36 x 22 ft x 10 ft) in size and is currently used for testing smoke alarm response to fire sources. This space has been used for testing alarms and detectors for response to real fire conditions [50]. It is expected, however, that this space is too large to provide a realistically challenging nuisance source evaluation.
The test enclosure should be sealed with no open vents. This provides the most uniform, test-to-test environment that replicates the worst case scenario for exposure to an alarm. Although most kitchens are not fully closed, they commonly have soffits above all doors and path-through openings that will cause a layer of smoke/particulate to build up at the ceiling from many sources. While open kitchens are also common, they do not represent a worst case scenario for nuisance alarms, and do not require consideration for testing. The closed test space also prevents unintentional air flows from affecting the movement of source effluent relative to smoke alarms.
However, the introduction of defined mechanical ventilation may be warranted. It is a common phenomenon in smoke alarm/detector testing that some devices will not alarm to smoke exposures until ventilation is introduced into the space, either from an opening door or a fan used to clear the test space. This is reflective of the entry resistance of devices exposed to weakly buoyant smoke/aerosol sources. It has also been demonstrated that particle concentrations generally decrease and that particles tend to agglomerate and increase in size due to air flow [59, 68]. The agglomeration of soot particulate in airflow was demonstrated through evaluation of detection in HVAC ducts by Wolin et al. [83].
The agglomeration of smoke increases the size of smoke particles, but decreases the number of particles. These effects are diametrically opposed with respect to predicting smoke alarm response [49, 50]. For this reason, it may be necessary to test smoke alarms both in still and turbulent air conditions as induced by typical HVAC air flows in a house. Ventilation should be provided using a fan in the space that would recirculate or move air within the space without introducing new outside air that would tend to dilute the source effluent and decrease the nuisance effect.
The primary gap toward defining a test space includes obtaining consensus on a representative kitchen test space. It is believed that this space should be representative of a small kitchen in order to provide the most challenging yet realistic nuisance conditions.
5.4. Measurements to characterize nuisance source tests and related instrumentation
The main reasons to have measurements in a standard nuisance source test is to verify repeatability and reproducibility (i.e., lab to lab) for the specified test conditions. This also serves as a means to develop criteria for establishing whether a valid test has been conducted.
Current testing conducted for smoke alarm/detector evaluations in UL 217/UL 268 utilize light obscuration sensors (ODMs) and a MIC. The ODM and MIC measurements do not provide sufficient measurement of the particle size, particle number density, mass concentration, or gas species production, which more directly impact the response of smoke alarms. These measurements provide a better means of distinguishing between nuisance sources, particularly as different test parameters are varied. Devices capable of making these types of measurements are discussed in Section 4.2.1, 4.2.2, 4.2.3, and 4.2.7, respectively.
These measurements are necessary for an understanding of the different test effluent/particulate and how they should be grouped so that bounding sources can be selected. These measurements should be included in any initial testing used to identify and select the final standard sources. Analog photoelectric and ionization smoke alarms should also be included for verification that nuisance alarms
SMOKE ALARM NUISANCE SOURCE CHARACTERIZATION 1DTG02049.012 PAGE 37
HUGHES ASSOCIATES
will occur. Instrumentation should be collocated with the alarms being tested, discussed in the next section. This data will be used for selection of the final nuisance source conditions.
Depending on the degree of repeatability and the variance of the different effluent characteristics observed in initial characterization tests, not all measurements may be necessary for use in the final standardized nuisance tests. Measurements of particle size, particle number density, and mass concentration can be expensive and time-consuming, and if these parameters remain consistent between repeated tests, the obscuration and MIC responses would be sufficient for demonstration of repeatability in final test scenarios. If, however, large variations in particles sizes or concentrations are measured without variations in the MIC or obscuration responses, additional measurements will be required to verify repeatability in standardized testing. The gap is establishing a clear correlation between the MIC and obscuration response and the more complex measurements of particle size and concentration.
In addition to particulate characterization, the concentration of CO gas should be measured to understand nuisance response. This value will likely not correlate to obscuration or MIC response and should be independently measured during standardized testing.
Using the source characterization data, a set of criteria must be developed to identify the conditions necessary for establishing whether a nuisance source test is valid. The expected variability between tests in the ODM, MIC, and CO responses should be considered as minimum criteria, and bounds of acceptable variation from the baseline tests should be determined. The repeatability and reproducibility of the selected sources must be demonstrated and an acceptable level of variation defined for running a valid test.
A nuisance resistant smoke alarm should be able to avoid alarming to the selected nuisance sources regardless of similarities in properties to design test fire sources. However, it is instructive to evaluate the differences between the nuisance source particulate and real fire source particulate to gain insight of the challenges of designing nuisance resistant smoke alarms.
Remaining gaps related to measurements include:
Demonstrate whether obscuration, MIC, and CO measurements provide sufficient data for establishing repeatability; and,
Assess whether other measurements are needed for standard test.
5.5. Methodology for evaluation of a smoke alarm/detector
A set of criteria for how smoke alarms/detectors are setup along with how they are to be evaluated needs to be established. Several items that need to be addressed are
Installation locations;
Test performance evaluation criteria (i.e., delayed or no response, x of y tests); and,
Definition of nuisance resistant smoke alarm/detector.
Since NFPA 72-2013 Section 29.8.3.4(4) requires alarms/detectors for installation within 1.8–6.1 m (6–20 ft) of cooking appliances to be listed as resistance to nuisances sources from cooking, a maximum alarm/detector distance to the nuisance source of 1.8 m (6 ft)should be selected. Particulate sensing instrumentation should be collocated with the alarm/detector under test. As noted previously, the recommended test room size would allow for 1.8 m (6 ft) and 3.0 m (10 ft) spacing of alarms from a source. Both values correspond to criteria in NFPA 72.
SMOKE ALARM NUISANCE SOURCE CHARACTERIZATION 1DTG02049.012 PAGE 38
HUGHES ASSOCIATES
A set of criteria must be defined for evaluating the response of alarms/detectors. Some previous nuisance testing has attempted to distinguish between alarms occurring during normal cooking and those occurring during development of hazardous conditions [66, 69–70]. These distinctions were based on subjectively visual assessments of the cooking processes and/or sensor measurements, such as total obscuration (e.g. 0.5 %/m (0.15 %/ft) [66]) or cooking temperature (e.g., 260°C (500°F) [71]). The particulate characterization profiles must be examined in order to define clear distinctions for labeling of alarm responses as nuisances. It will likely be necessary to conduct initial source characterization tests beyond the point of normal cooking in order to better define this transition period.
Once the distinction between an acceptable and a nuisance response has been defined for each standardized test, the definition of a “passing” test result must be established. Must an evaluated alarm/detector avoid alarm to all nuisance sources, or some defined ratio? Would a device that produces no nuisances at 3.0 m (10 ft) distance be provided the same listing as a device that produces no nuisance responses at a 1.8 m (6 ft) distance? Would alarms/detectors need to be individually “listed” to each nuisance source to which it is resistance and to each that it is not? These answers would need to be defined after subjecting several test alarms/detectors to the standard suite of nuisance source tests. While the ideal would be a device that does not respond to any nuisance sources, this may not be a realistic achievement. Nuisance resistant does not mean nuisance proof. The definitions for devices receiving a nuisance resistant rating would need to be defined.
Consensus criteria needs to define the number of tests that need to be conducted, the number of sources and the success rate that is acceptable to establish an alarm/detector as nuisance resistant. There is no existing data or definition available to select this criteria, and a consensus must be reached among representative parties, including fire safety experts, code officials, alarm/detector manufacturers, and standards organizations.
The primary gaps remaining toward defining the methodology for evaluation an alarm/detector include:
Defining the threshold criteria for nuisance alarms vs. valid alarms;
Developing criteria for conduct of a valid test; and,
Defining minimum requirements for listing alarms/detectors as “nuisance resistant.”
5.6. Justification for Standard
An additional gap exists in providing clear justification for the creation of such a standard. A quantified understanding of the impact of eliminating nuisance alarms on fire deaths is needed to fully justify the need for such a standard. Statistical fire data indicates that as many as 296 deaths (2470 total deaths x 0.24 non-operating alarms x 0.50 missing/disconnected power) from disconnected alarms and another 939 deaths from missing alarms could be prevented [2]. Survey data from L. Smith of the CPSC indicates that 28% of disconnected alarms had reported problems with nuisances [20]. This adjustment would reduce the expected impact of nuisances causing disconnected alarms from 296 to 83 deaths.
Work by Mueller indicates that although the number of non-functional alarms was between 9–23%, the number of alarms that had been physically removed was found to be between 1–3% [14]. This would indicate that the number of fires occurring with no alarms present may include some portion of alarms removed due to nuisances. If 28% of the non-functional alarms are the result of intentional disablement, this would represent between 2.5–6.4% of all alarms, roughly twice the number of alarms found to be removed. By this estimate, it could be assumed that approximately 14% deaths occurring with no alarm present could be the result of removed alarms. This would represent 131 additional deaths. Although based on limited numbers, a representative number of total preventable deaths from the elimination of nuisance alarms is 214, or approximately 10% of all fire deaths. A gap does remain to determine a more accurate representation of the expected impact of eliminating nuisance alarms on fire deaths.

SMOKE ALARM NUISANCE SOURCE CHARACTERIZATION 1DTG02049.012 PAGE 39
HUGHES ASSOCIATES
In addition to reducing residential fire deaths, there is also potential to reduce the total costs of fire department response to false alarms. Fire departments respond to 16 false calls for every 10 real fires, and 45 false calls for every 10 structure fires. It has been shown that 45% of these false calls are due to unwanted alarm activations, and that 55% of them occur in residential occupancies [6].
6. GAP TEST PLAN
A test plan has been developed to specifically address the gaps in available data required for the development of a draft test standard to distinguish between cooking nuisance alarms and actual cooking fire scenarios. This test plan layouts a specific road map of research and outcomes directed toward the realization of a completed standardized evaluation test. The gaps have been assessed based on the specific aspects of the overall test development described above.
TASK (1) – Conduct Survey to Correlate Nuisance Alarms and Disablement and Removal
Gap Addressed:
Quantify the impact of reducing nuisance alarms on fire deaths
Approach:
Although a range of alarm installation surveys have reviewed the occurrences of nuisances and the functionality of smoke alarms, there is still insufficient data to quantify the full impact of eliminating nuisance alarm on fire deaths.
A broad survey should be conducted with the specific aim of quantifying how many smoke alarms are intentionally removed and/or disabled specifically due to nuisance alarms. This number should be compared to the number of homes that had never installed an alarm, have dead batteries due to negligence, or removed/disabled alarms for other reasons. This information can be used to determine the number of total fire deaths expected to be saved by eliminating nuisance alarms. Ultimately, this could be used in a cost-benefit analysis of requiring nuisance resistant alarms.
TASK (2) – Selection of the Test Space
Summary of Gaps Addressed:
Determine the range of common kitchen sizes; and,
Obtain consensus on the dimensions of the standard test space.
Approach:
A study of common kitchen sizes, shapes, and dimensions should be conducted. This study would provide guidance on the smallest size kitchens and the distribution of sizes. A representative kitchen size (e.g., 20th percentile) should be selected for standardized testing.
The kitchen size selected should at a minimum allow for the installation of an alarm/detector at a distance of 3.0 m (10 ft) to meet the criteria of NFPA 72 (listing for 1.8 m–3.0 m (6–10 ft) and listing for 3.0–6.1 m (10–20 ft).
The size of the test space is one of the most important criteria for causing nuisance responses in a standardized test. A smaller space will increase the concentrations of particulate and gases and increase the likelihood for nuisance alarms. Consensus should be reached based on information
SMOKE ALARM NUISANCE SOURCE CHARACTERIZATION 1DTG02049.012 PAGE 40
HUGHES ASSOCIATES
provided by the kitchen size study. A phone conference or meeting among the project steering committee should be conducted to discuss and obtain consensus.
TASK (3) – Initial Characterization of Cooking Nuisance Sources
Summary of Gaps Addressed:
Evaluate reproducibility of small, medium, and large particle nuisance sources as defined by Chernovksy and Cleary [22]
Systematic evaluation of the parameters that may influence cooking source effluent production, such as:
o Fat content of ingredients;
o Cooking temperature;
o Pan size or material; and,
o Heat source (gas v. electric).
Select the set of standardized tests required to bound the particle sizes and produce the most challenging conditions for smoke alarm rejection;
Establish the repeatability and reproducibility of potential standard tests;
Determine if obscuration, MIC, and CO provide sufficient data for establishing repeatability; and,
Provide data for determining threshold criteria for nuisance alarms v. valid alarms.
Approach:
A series of initial tests should be conducted in the standardized test space to characterize the particulate produced by the candidate test sources. At least one source from each of the small, medium, and large cooking particle groups should be selected and tested using clearly defined procedures (temperatures, pots/pans, range type, etc.). A parametric evaluation should be conducted to determine how slight alterations to the test conditions (ingredients, pans, temperatures) may increase the challenges to smoke alarms. Tests should be conducted both with and without forced airflow (but no outside ventilation).
Effluent should be measured and characterized at the ceiling located 1.8 m (6 ft) and 3.0 m (10 ft) from the cooking source. Measurements should include:
Obscuration;
MIC response;
CO concentration;
Particle size distribution;
Particle number density;
Particle mass concentration;
Air velocity;
Representative photoelectric, ionization, and CO alarms; and,
Ambient temperature, humidity, and atmospheric pressure.
SMOKE ALARM NUISANCE SOURCE CHARACTERIZATION 1DTG02049.012 PAGE 41
HUGHES ASSOCIATES
The particle sizes and concentrations measured will be used to verify the initial categorization of test methods to provide a range of source types. The results of the parametric study will be used to select the most challenging realistic scenarios with respect to producing nuisance alarms.
The test data should be evaluated to determine whether the response of the MIC, ODM, and CO analyzer can characterize the tests for repeatability. If repeatable measurements are made with these devices, it must be demonstrated that repeatable particle sizes and concentrations are measured for each source. If there is variability in the particulate without variation in the MIC or ODM response, than additional instrumentation must be specified for inclusion in the standard testing.
Normal cooking experiments should be continued until food samples are burned/ruined. This data will be used in a subsequent task to define thresholds for nuisance alarms relative to alarms of developing hazards.
TASK (4) – Characterization of Non-cooking Sources
Summary of Gaps Addressed:
Evaluation of representative water mist/steam sources;
Evaluation of representative dust exposure sources; and, Quantifying the effects of long term dust/cigarette smoke exposure on nuisance alarm proclivity
Approach:
Testing should be conducted to determine the nuisance alarm responses to dust and water mist/steam sources. Tests should be conducted in the standardized test space. The ability to induce nuisance alarm responses with steam/mist generated by boiling water and a hot shower should be comparatively investigated.
An investigation should be conducted into the ability to characterize long fiber dust sources. These sources are common to the household and can easily be found in vacuum cleaners or dryer lint traps. It will be necessary, however, to develop a method for characterizing (or filtering) this type of particulate for inclusion into standardized testing.
After characterizing fiber dusts exposure testing should be conducted. It should be determined whether exposures to suspended dust particulate can (1) induce nuisance alarms with short term exposure, and/or (2) increase the overall sensitivity to other nuisance sources after long term exposure. After long term dust exposure to smoke alarms, a selected set of cooking nuisance source tests should be repeated and any changes in response recorded.
Comparable long term exposure testing could be conducted with exposure to cigarette smoke. Smoke alarms should be subjected to high levels of smoke for a sustained period and any alterations in nuisance response evaluated.

SMOKE ALARM NUISANCE SOURCE CHARACTERIZATION 1DTG02049.012 PAGE 42
HUGHES ASSOCIATES
TASK (5) – Committee Meeting to Determine Final Test Criteria
Summary of Gaps Addressed:
Select standardized nuisance sources;
Determine criteria for conduct of a valid test; Defining the threshold criteria for nuisance alarms vs. valid alarms; and,
Defining minimum requirements for listing alarms/detectors as “nuisance resistant.”
Approach:
The initial cooking and non-cooking nuisance test data will be summarized and presented to the project steering committee. The committee will review the data and discuss to select the final sources and criteria for evaluation.
The sources will be selected based on demonstration that they are representative of a wide range of sources, bound the worst case realistic scenarios, and are reproducible. Criteria for conduct of a valid test will require demonstration of sufficient instrumentation and measurements and sufficiently narrow bounds for expected reproducibility.
A clear, quantitative distinction should be made between the nuisance portion and potential hazard portion of the tests conducted. When left unattended, the standard cooking procedures will likely progress to potentially hazardous conditions. A measureable quantity must be identified (obscuration, MIC response, air temperature, etc.) that can be used to distinguish between alarms occurring before and after this time during nuisance resistance testing.
Finally, the committee will review the nuisance test data and determine a minimum acceptable response to the array of tests to achieve a “nuisance resistant” listing. Consensus should be reached to provide a recommendation for this minimum level of performance.
7. REFERENCES
[1] Smith, C.L., “Smoke Detector Operability Survey Report on Findings,” U.S. Consumer Product Safety Commission, Washington, DC, February 18, 1994 (Revised October 1994).
[2] Ahrens, M., “Smoke Alarms in U.S. Home Fires,” NFPA 2011, National Fire Protection Association, Quincy, MA, September 2011.
[3] Gottuk, D.T., “Single-and Multiple-Station Alarms and Household Fire Alarm Systems,” Chapter 29, NFPA 72–National Fire Alarm and Signaling Code Handbook, Sixth Edition, National Fire Protection Association, Quincy, MA, 2010, pp. 669–718.
[4] Lee, A. and Pineda, D., “Smoke Alarms – Pilot Study of Nuisance Alarms Associated with Cooking,” CPSC, Bethesda, Maryland, March 2010.
[5] ASTM E456-13, “Standard Terminology Relating to Quality and Statistics, ASTM International,” West Conshohocken, PA, 2013.
[6] Ahrens, M., “Unwanted Fire Alarms,” NFPA 2011, National Fire Protection Association, Quincy, MA, April 2011.

SMOKE ALARM NUISANCE SOURCE CHARACTERIZATION 1DTG02049.012 PAGE 43
HUGHES ASSOCIATES
[7] British Standards Institution (BSI) British Standard: Fire Detection and Alarm Systems for Buildings, BS5839:2013, BSI, UK.
[8] New Zealand Fire Service, Code of Practice for the Automatic Fire Alarm System (28/4/2005), Version Final 1.1, New Zealand Fire Service Commission, Wellington, 2005.
[9] Karter, M.J., “False Alarm Activity in the U.S. 2011,” National Fire Protection Association, Quincy, MA, 2012.
[10] New Zealand Fire Service Commission, “Unwanted (False) Alarms from a Fire Alarm System,” Wellington, 2003.
[11] Steen-Hansen, A., Stensaas, J., Sessend, C., Stolen, R. “Analysis of Cooking Fires in Norway,” Interflam 2010, SINTEF NBL Norwegian Fire Research Laboratory, Trondheim, Norway.
[12] Wilson, J. et al. “Evaluation of the “10-Year” Smoke Alarm Project,” National Center for Healthy Housing, Prepared for the Center for Disease Control and Prevention, October 2008.
[13] Campbell Delong Resources, Inc., “Barriers to Maintaining Working Smoke Alarms, Service Area Demographic Study and Interview Research,” conducted for Tualatin Valley Fire and Rescue, Portland, OR, May 2003, 61 p.
[14] Mueller, B. et al. “Randomized Controlled Trial of Ionization and Photoelectric Smoke Alarm Functionality,” Injury Prevention, 2008, 14, pp. 80–86.
[15] Mickalide, A. and Validzic, A, “Smoke Alarm Maintenance in Low Income Families,” American Journal of Public Health, 89 (10), October 1999, p. 1584.
[16] Fazzini, Perkins, R. and Grossman D., “Ionization and Photoelectric Smoke Alarms in Rural Alaskan Homes,” Western Journal of Medicine, 173 (2), August 2000, pp. 89–92.
[17] Kuklinski D., Berger L., and Weaver J., “Smoke Detector Nuisance Alarms: A Field Study in a Native American Community,” NFPA Journal, 90 (5), National Fire Protection Association, Quincy, MA, 1996, pp. 65–72.
[18] Rowland D. et al., “Prevalence of Working Smoke Alarms In Local Authority Inner City Housing: Randomized Controlled Trial,” British Medical Journal (BMJ), 325, 2002, pp. 998–1001.
[19] Yang, J., Jones, M.P., Cheng, G., Ramirez, M., Taylor, C., and Peek-Asa, C., “Do Nuisance Alarms Decrease Functionality of Smoke Alarms near The Kitchen? Findings from a randomized control trial,” Journal of Injury Prevention, 17 (3), June 2011, pp. 160-165.
[20] Smith, L. “Fire Incident Study: National Smoke Detector Project,” Consumer Product Safety Commission, Bethesda, MD, 1995.
[21] Shapiro J., “Smoke Detector Operability Survey, Engineering Laboratory Analysis, Appendix B. Engineering Analysis Report, revised,” Shapiro J. US Consumer Product Safety Commission, Directorate for Engineering Sciences, Division of Engineering Laboratory, Bethesda, MD, October 1994.
[22] Chernovsky, A. and Cleary, T., “Smoke Alarm Performance in Kitchen Fires and Nuisance Alarm Scenarios" NIST TN-1784 Report, January 2013, 80 p.
SMOKE ALARM NUISANCE SOURCE CHARACTERIZATION 1DTG02049.012 PAGE 44
HUGHES ASSOCIATES
[23] Wang, A., Wang, J., Yang, Z., and Zu, M., “Research on Dust-proof Performance of Photoelectric Smoke Detector,” 2004 AUBE Conference Proceedings, Duisburg, Germany, September 14–16, 2004.
[24] Cambridge Times, “Put a Flea Collar on your Smoke Alarm,” web editorial, June 13 2007.
[25] Mulholland, G.W., “Smoke Production and Properties,” Section 2, Chapter 13, SFPE Handbook of Fire Protection Engineering, Fourth Edition, Society of Fire Protection Engineers, 2008.
[26] Dekati® Manual, ELPI™ Electrical Low Pressure Impactor, Tampere, Finland, January 2012.
[27] Bohren, C and Huffman, D., “Absorption and Scattering of Light by Small Particles,” Wiley, Hoboken, NJ, March 1983.
[28] Hunt, A., Quinby-Hunt, M., and Shepherd, I., “Diesel Exhaust Particle Characterization by Polarized Light Scattering,” SAE Technical Paper 982629, 1998.
[29] Keller, A., Burtscher, H., Loepfe, M., Nebiker, P., Pleisch, R., “Online Determination of The Refractive Index Of Test Fires,” 2004 AUBE Conference Proceedings, Duisburg, Germany, September 14–16, 2004.
[30] TSI, SMPS spec sheet, Scanning Mobility Particle Sizer™ Spectrometer (SMPS) Model 3936, TSI, Inc., Shoreview, MN, 2012.
[31] Shultze, T. and Willms, I., “Smoke and dust monitoring by a microscope video sensor,” 2004 AUBE Conference Proceedings, University Duisburg, Duisburg, Germany, September 14–16, 2004.
[32] Zhang, Q., Wang, J., Fang,J. and Zhang, Y., “Characteristics of Light Scattering By Smoke Particles Produced In Test Fires Based On Fractal Aggregate Shape Model,” 2009 AUBE Conference Proceedings, Duisburg, Germany, September 8–10, 2009.
[33] Draine, B. and Flatau, P., “Discrete Dipole Approximation For Scattering Calculations,” Journal of the Optical Society of America, 11, 1994, pp. 1491–1499.
[34] Draine, B. and Flatau, P., “User guide to the Discrete Dipole Approximation Code DDSCAT 6.1,” http://arxiv.org/abs/astroph/0409262v2.
[35] Kaufman S.L. et al., “An Electrical Aerosol Detector Based on the Corona-Jet Charger,” Poster PI2-07, Abstracts of 2002 AAAR, Charlotte, NC, 2002, p. 223.
[36] TSI CPC Spec sheet, Electrical Aerosol Detector Model 3070A, Application Note EXPMN-002, TSI, Inc., Shoreview, MN, 2012.
[37] Rion OPC spec sheet, Particle Sensor for Multi-point Monitoring Applications, KA-02, Tokyo, Japan.
[38] Huboyo, H. et al. “Indoor PM2.5 Characteristics and CO Concentration Related to Water-Based and Oil-Based Cooking Emissions Using a Gas Stove,” Aerosol and Air Quality Research, 11, Taiwan Association for Aerosol Research, Tokyo, Japan, 2011, pp. 401–411.
[39] Patashnick, H., Meyer, M., and Rogers, B., “Tapered Element Oscillating Microbalance Technology,” Proceedings of the North American/Ninth U.S. Mine Ventilation Symposium, Kingston, ON, June 2002, pp. 625–631.
SMOKE ALARM NUISANCE SOURCE CHARACTERIZATION 1DTG02049.012 PAGE 45
HUGHES ASSOCIATES
[40] TSI DustTrakTM DRX Aerosol Monitor Theory of Operation,” Application Note EXPMN-002, TSI, 2012.
[41] Mulholland, G.W. and Croarkin, C., “Specific Extinction Coefficient of Flame Generated Smoke,” Fire and Materials, 24 (5), 2000, pp. 209–252.
[42] Seader, J.D. and Einhorn, I.N., Proceedings of the 16th International Symposium on Combustion, Combustion Institute, Pittsburgh, PA, 1976.
[43] MIC Instruction Manual, “Smoke measuring equipment MIC type EC-912 Serial No.: 20000201”, DELTA Danish Electronics, Light & Acoustics, Horsholm, Denmark.
[44] Lenkeit, K., Schumann, A., and Becke, C., “New Fire Detection Method using the Field Dependence of Ion Mobility for Early Detection of Thermal Decomposition Products,” 2009 AUBE Conference Proceedings, Duisburg, Germany, September 8–10, 2009.
[45] Kuhlbusch, T. et al. “Measurement of Elemental and Organic Carbon in Europe,” JRC Scientifc and Technical Reports, EUR 23992 EN – 2009, Ispra (VA), Italy, 2009.
[46] Widmann, J. et al. “Measurement of the Optical Extinction Coefficient of Combustion-Generated Aerosol,” National Institute of Standards and Technology, Gaithersburg, MD, 2004.
[47] NIOSH Method 5040, Diesel Particulate Matter, NIOSH Manual of Analytical Methods (NMAM), Fourth Edition, August 1994.
[48] Teledyne Spec Sheet, Black Carbon Monitor Model 633 Aethalometer, San Diego, CA, 2011.
[49] Mulholland, G. and Liu, B.Y.U., “Response of Smoke Detectors to Monodisperse Aerosols,” NBS Journal of Research, 85, 1980, pp. 223–238.
[50] Fabian, T. and Gandhi, P., "Smoke Characterization Project,” Underwriters Laboratories, Northbrook, IL, April 2007.
[51] Newman, J.S. and Steciak, J. “Characterization of Particulates from Diffusion Flames.” Combustion and Flame, 67, 1987, pp. 55–64.
[52] Kim, S.H., Woo, K.S., Liu, B.Y.H., Zachariah, M.R., “Method of measuring charge distribution of nanosized aerosols,” Journal of Colloid and Interface Science, 282, 2005, www.elsevier.com/locate/jcis, pp. 46–57.
[53] Wang, W., Pan, G., Liu, X., Wang, Y. Liu, Y., Liu, B., and Jiang, L., “Multi-angle Scattering Characteristic of test Fire Smoke and Typical Interference Aerosol,” 2009 AUBE Conference Proceedings, Duisburg, Germany, September 8–10, 2009.
[54] Fujisawa, T., Suzuki, T., Yashikawa, Y., and Ohkuma, S., “Optical Smoke Detector Using Dual Light Spectrum,” 2004 AUBE Conference Proceedings, Duisburg, Germany, September 14–16, 2004.
[55] Edwards et al. “An Inexpensive Dual-Chamber Particle Monitor,” Journal of the Air & Waste Management Association, Air & Waste Management Association, 56, 2006.
[56] Litton, C., Smith, K., Edwards, R., and Allen, T., “Combined Optical and Ionization Techniques for Measurement and Characterization of Sub-Micrometer Aerosols,” 2004 AUBE Conference Proceedings, Duisburg, Germany, September 14–16, 2004.
SMOKE ALARM NUISANCE SOURCE CHARACTERIZATION 1DTG02049.012 PAGE 46
HUGHES ASSOCIATES
[57] Cleary, T., Donnelly, M., and Grosshandler, W., “The Fire Emulator/Detector Evaluator: Design, Operation, and Performance,” 1999 AUBE Conference Proceedings, Duisburg, Germany, March 16–18, 1999.
[58] Cleary, T.G., Grosshandler, W., and Chernovsky, A., “Smoke Detector Response to Nuisance Aerosols,” 1999 AUBE Conference Proceedings, Duisburg, Germany, March 16–18, 1999.
[59] Bukowski, R. et al. “Performance of Home Smoke Alarms Analysis of the Response of Several Available Technologies in Residential Fire Settings,” NIST Technical Note 1455-1 (Revision), National Institute of Standards and Technology, Gaithersburg, MD, 2004.
[60] Cleary, T., “Home Smoke Alarm Project, Alarm Responses to Nuisance Sources,” Report of FR 1419, National Institute of Standards and Technology, Gaithersburg, MD, 2003.
[61] Cleary, T., “Time Resolved Size Distributions of Test Smokes and Nuisance Aerosol,” 2004 AUBE Conference Proceedings, Duisburg, Germany, September 14–16, 2004.
[62] Cleary, T., Yang, J. “Prediction of Light Scattering and Ionization Chamber Sensor Response to Smolder Smoke Aerosols,” 2009 AUBE Conference Proceedings, Duisburg, Germany, September 8–10, 2009.
[63] Cleary, T., “A Test Methodology for Multiple Sensor – Multiple Criteria Alarms,” 2004 AUBE Conference Proceedings, Duisburg, Germany, September 14–16, 2004.
[64] Cleary, T. “Characterization of Residential Nuisance Sources,” NIST Technical Note in preparation.
[65] Cleary, T. “Characterization of Residential Nuisance Sources,” presentation at UL 217 Task Group on Nuisance Alarms, November 21, 2013.
[66] Feng, J. and Milke, J., "Analysis of the Response of Smoke Detectors to Smoldering Fires and Nuisance Sources," University of Maryland study, Prepared for Maryland Industrial Partnerships and USI Electric, January 2013, 29 p.
[67] Qiyuan X., Hongyong, Y. and Yongming Z., “Experimental Study on the Sensitivity and Nuisance Immunity of Smoke Detector,” J. Applied Fire Science, 11 (4), 2002–2003, pp. 323–334.
[68] Chen, N., “A Smoke Particle Measuring Method of Laser Scattering and It’s Applied Researches,” 2004 AUBE Conference Proceedings, Duisburg, Germany, September 14–16, 2004.
[69] Fabian, T., Zevotek, R., Milke, J., “Smoke Alarm Response in One and Two-Story Residential Structures,” Suppression, Detection and Signaling Research and Application Symposium (SUPDET), Orlando, FL, February 25th– March 1st 2013, pp. 27.
[70] Dinaburg, J. and Gottuk, D.T., “Home Cooking Fire Mitigation: Technology Assessment – Final Report,” prepared for The Fire Protection Research Foundation, Quincy, MA, HAI Project #1DTG0 2049.006, October 31, 2011.
[71] Dinaburg, J. and Gottuk, D.T., “Development of Standardized Testing for Range Cooking Fire Mitigation Technologies,” presentation at UL 217 Task Group on Nuisance Alarms, November 21, 2013.
SMOKE ALARM NUISANCE SOURCE CHARACTERIZATION 1DTG02049.012 PAGE 47
HUGHES ASSOCIATES
[72] ADL (Arthur D. Little, Inc.), Technical, Practical and Manufacturing Feasibility of Technologies to Address Surface Cooking Fires, May 2001.
[73] Primaira, LLC. “Pan Temperature-Limiting Control Technology to Reduce Incidence of Unattended Cooking Fires,” prepared for United States Consumer Product Safety Commission, 2011.
[74] Weast, R.C., (editor), CRC Handbook of Chemistry and Physics, 1st Student Edition, CRC Press, Inc., Boca Raton, FL, 1988.
[75] Fang, Y.D., Liu, J.H., Lin, L. and Liao, G.X., “Fullscale Experimental Studies on Extinguishing Cooking Oil Fires with Water Mist,” Combust. Sci. Technol., 12, 2006, pp. 318–322.
[76] Tian, L., Zhang, G., Zhang, Q., Moschandreas, D.J., Hao, J., Lin, J. and Liu, Y., “The Impact of Kitchen Activities on Indoor Pollutant Concentrations,” Indoor Built Environ, 17, 2008, pp. 377–383.
[77] Tsongas, G. “Carbon Monoxide from Ovens: A serious IAQ Problem,” Home Energy Magazine Online, September/October 1995.
[78] Wallace, L. et al. “Ultrafine Particles: 3 Years of Measurements in the NIST Test House,” National Institute of Standards and Technology, Gaithersburg, MD, 2011.
[79] See, S.W. and Balasubramanian, R., “Chemical Characteristics of Fine Particles Emitted from Different Gas Cooking Methods,” Atmos. Environ., 42, 2008, pp. 8852–8862.
[80] Buonanno, G., Stabile, L., and Morawska, L., “Particle Emission Factors During Cooking Activities,” Atmospheric Environment, 43 (20), 2009, pp. 3235–3242.
[81] To, W. et al. “Emission of Carcinogenic Components from Commercial Kitchens in Hong Kong,” SAGE Publications DOI:10.1177/1420326X06074500, accessible online at http://ibe.sagepub.com, 2007.
[82] Representative for Kidde, Telephone Interview, February 4, 2014.
[83] Wolin, S.D., Ryder, N.L., Leprince, F., Milke, J.A., Mowrer, F.W. and Torero, J.L., “Measurements of Smoke Characteristics in HVAC Ducts,” Fire Technology, 37 (4), 2001, pp. 363–395.
ADDITIONAL RESOURCES
Auker, B., “Nuisance Alarm Reduction on Campus,” Models in Fire Prevention Symposium 2012, Weston, VA, May 4–6, 2012.
Berger, l. and Kuklinski, D., “When Smoke Alarms are a Nuisance,” National Institute of Standards and Technology, Gaithersburg, MD, 2004, February 2006.
Chen, N. et al. “The Experimental Study On Influencing Factors Of The False Alarm In Photoelectric Smoke Fire,” AUBE Conference Proceedings, 2009, Duisburg, Germany, September 8–10, 2009.
Chowdhury, Z. et al. “Field Validation of the UCB Particle Monitor,” University of California, Berkeley, CA, April 2006.
SMOKE ALARM NUISANCE SOURCE CHARACTERIZATION 1DTG02049.012 PAGE 48
HUGHES ASSOCIATES
Dell’Orfano, M., Analysis of False Alarms in Commercial Occupancies for South Metro Fire Rescue Authority South Metro Fire Rescue Authority, Centennial, CO, June 2005.
DiGuiseppi C. et al. “Incidence of Fires and Related Injuries After Giving Out Free Smoke Alarms: Cluster Randomized Controlled Trial,” BMJ (British Medical Journal), 325, London, England, November 2002, 995–999.
DiGuiseppi, C., Roberts I. and Speirs, N., “Smoke Alarm Installation and Function in Inner London Council Housing,” Archives of Disease in Childhood, 81 (5), London, England, November 1999, pp. 400–403.
Environmental Systems Products Holdings, Smoke Factor Measurements with Remote Sensing Device Technology, Tucson, AZ, November 2010.
Fabian, T., “Smoke Alarm Response in One and Two-Story Residential Structures,” Suppression, Detection and Signaling Research and Application Symposium (SUPDET), Orlando, Florida, February 25th– March 1st 2013, pp. 27.
Fleming, J., (critique) “Smoke Alarms – Ionization and Photoelectric Technology, International Association of Fire Chief’s Position Paper, Boston, MA, September 2007.
Freiling, A., “Standardization of False Alarm Rejection Capability Assessment,” TBCEC43 - Ref. X2616PR0916816 - Issue 2, AIRBUS Operations, Herndon, VA, September 2009
Gehin, E. et al. “Size Distribution Measurement Of Fine And Ultrafine Particle Emission From Cooking Activities,” European Aerosol Conference 2008, Thessaloniki: Greece (2008).
Goto, Y. and Tamura, G., “Measurement Of Combustion Products From A Gas Cooking Stove In A Two-Storey House,” National Research Council of Canada, Presented at the 77th Annual Meeting of the Air Pollution Control Association San Francisco, CA, June 24–29,1984, 84–32.5, 13 p.
Gottuk, D.T., Peatross, M.J., Roby, R.J., and Beyler, C.L., “Advanced Fire Detection Using Multi-Signature Alarm Algorithms,” Fire Safety Journal, 37, 2002, pp. 381–394.
Gottuk, D.T., Hill, S.A., Schemel, C.F., Strehlen, B.D., Rose-Pehrsson, S.L., Shaffer, R.E., Tatem, P.A., and Williams, F.W., “Identification of Fire Signatures for Shipboard Multi-criteria Fire Detection Systems,” NRL/MR/6180--99-8386, Naval Research Laboratory, Washington, DC, June 18, 1999.
He, L., Huang, X. et al., “Submicron Aerosol Analysis And Organic Source Apportionment in an Urban Atmosphere In Pearl River Delta Of China Using High‐ Resolution Aerosol Mass Spectrometry,” Journal Of Geophysical Research, 116, D12304, doi:10.1029/2010JD014566, 2011.
Hussein, T. et al., “Local Air Pollution versus Short–range Transported Dust Episodes: A Comparative Study for Submicron Particle Number Concentration,” Aerosol and Air Quality Research, 11, 2011, pp. 109–119.
Istre G. and Mallonee S., “Commentary, Smoke Alarms and Prevention of House-Fire Related Deaths and Injuries,” Western Journal of Medicine, 173 (2), August 2000, pp. 92–93.
Johnsson, E.L. “Study of Technology for Detecting Pre-Ignition Conditions of Cooking-Related Fires Associated with Electric and Gas Ranges and Cooktops, Phase 1 Report, NIST IR 5729, National Institute of Standards and Technology, Gaithersburg, MD, 1995.
SMOKE ALARM NUISANCE SOURCE CHARACTERIZATION 1DTG02049.012 PAGE 49
HUGHES ASSOCIATES
Johnsson, E.L. “Study of Technology for Detecting Pre-Ignition Conditions of Cooking-Related Fires Associated with Electric and Gas Ranges and Cooktops, Final Report, NIST IR 5950, National Institute of Standards and Technology, Gaithersburg, MD, 1998.
Kitteringham, G., “Nuisance Alarms,” NFPA Journal®, March/April 2007, National Fire Protection Association, Quincy, MA, 2007.
Koffel, W., “Preventing Detector Nuisance Alarms,” NFPA Journal®, September/October 1993, National Fire Protection Association, Quincy, MA, 2007, p. 16.
Ludington J. and Newsad R., “Home Safety Assessment/Intervention in American Indian Homes in California: A Role for IHS Engineering Staff,” Journal of Environmental Health, 2000, pp.13–18.
Mallonee S., Evaluating Injury Prevention Programs: The Oklahoma City Smoke Alarm Project, Unintentional Injuries in Childhood, 10 (1), Spring/Summer 2000, pp. 164–174.
Maggio, J. et al. “Kitchen 2.0: Household Air Pollution Model Utilizing Open Source Software for Application in Developing Countries,” Michigan Technological University, 2012.
Mei, Z., Song, L., Li, J., Wang, Z., and Li, N., “Data Acquisition and Characteristic Analysis of the Early Fire Smoke Aerosol Information,” 2004 AUBE Conference Proceedings, Duisburg, Germany, September 14–16, 2004.
Milke, J. and McAvoy, T., “Analysis of Fire and Non-fire Signatures for Discriminating Fire Detection,” Fire Safety Science-Proceedings of the Fifth International Symposium, Melbourne, Australia, March 3–7, 1997, pp 819-828
Mohr, C. et al. “Characterization of Primary Organic Aerosol Emissions from Meat Cooking, Trash Burning, and Motor Vehicles with High-Resolution Aerosol Mass Spectrometry and Comparison with Ambient and Chamber Observations,” Environmental Science & Technology, 2009, 43 (7), Publication Date (Web): 04 March 2009, pp 2443-2449.
MSP Corporation, Spec Sheet: Wide Range Particle Spectrometer, Model 1000XP, Shoreview, Minnesota, 2010.
Nam S. and Cleary, T., “Fire Tests For Smoke Characterization,” FM Global, Norwood, MA and National Institute of Standards and Technology, Gaithersburg, MD.
Ouf, F. et al. “Measurement of the Mass Specific Extinction Coefficient of Acetylene, Toluene and Polymethyl Methacrylate Soot Particles in Visible and Near-Infrared Wavelengths,” Fire Safety Science–Proceedings of the Ninth International Symposium, International Association for Fire Safety Science, 2008, pp. 231–240.
Patty, P., “A Scientific Approach to Characterize Smoke from Flaming and Smoldering Fires,” 2004 AUBE Conference Proceedings, Duisburg, Germany, September 14–16, 2004.
Reece, E., “Reducing Risks from False Fire Alarms in Appleton, Wisconsin,” Appleton Fire Department, Appleton, WI, 2009.
Roberts, H. et al. “Putting Public Health Evidence Into Practice: Increasing The Prevalence Of Working Smoke Alarms In Disadvantaged Inner City Housing,” J Epidemiol Community Health, 58, 2004, pp. 280–285.

SMOKE ALARM NUISANCE SOURCE CHARACTERIZATION 1DTG02049.012 PAGE 50
HUGHES ASSOCIATES
See, S.W. and Balasubramanian, R., “Physical Characteristics of Ultrafine Particles Emitted from Different Gas Cooking Methods,” Aerosol Air Qual. Res., 6, pp. 82–92.
Scott, C. and Moore, W., “Preventing Nuisance Alarms,” International Fire Protection (IFP) Magazine, September 2002.
Siebel, R., “Test Of Fire Detection Algorithms Using Artificially Generated Events,” 2004 AUBE Conference Proceedings, Duisburg, Germany, 2004.
Su, G. et al. “Experimental Study on Nuisance Alarms of Smoke Detectors Caused by Steam,” Fire Safety Science–Proceedings of the Eighth International Symposium, September 18–23, 2005, Beijing, China.
Torkmahalleh, M. et al. “Influence Of Food Surface Area On PM2.5 And Particle Number Concentration During Frying,” Center for Air Resources Engineering and Science, Clarkson University, Potsdam, NY, February 2013.
Weinert, D. et al. “Light Scattering Characteristics and Size Distribution of Smoke and Nuisance Aerosols,” Fire Safety Science--Proceedings of The Seventh International Symposium, Worcester, MA, June 16–21 2002, pp. 209–220.
Weinert, D. et al. “Size Distribution and Light Scattering Properties of Test Smokes,” AUBE 12th International Conference on Automatic Fire Detection Proceedings, March 25–28, 2001, National Institute of Standards and Technology, Gaithersburg, MD.
Wong, A. et al. “An Experimental Study on the Photoelectric Optical Smoke Detector Response,” International Association for Fire Safety Science, 2007.
Xie, Q. et al. “Experimental Study on Response Sensitivity of Smoke Detectors in High Flow Velocity,” Fire Safety Science–Proceedings of the Eighth International Symposium, September 18–23, 2005, Beijing, China, pp. 1533–1542.
Xie, Q. et al. “Experimental Study on the Sensitivity and Nuisance Immunity of Smoke Detectors,” J. Applied Fire Science, 11 (4), 2002, pp. 323–334.
Yan, S. et al. “An Energy Model in Fire Detection and Integrated Analysis on False Alarms,” AUBE 12th International Conference on Automatic Fire Detection Proceedings, March 25–28, 2001, National Institute of Standards and Technology, Gaithersburg, MD.
Yang, J., Jones, M.P., Cheng, G., Ramirez, M., and, Taylor, C., and Peek-Asa, C., “Do Nuisance Alarms Decrease Functionality of Smoke Alarms Near The Kitchen? Findings from a Randomized Control Trial,” Journal of Injury Prevention, June 2011, 17 (3), pp. 160–165.