
MMI, SCADA AND ALARM PHILOSOPHY - CORE
118
MMI, SCADA AND ALARM PHILOSOPHY FOR DISTURBED STA'fE OPERATING CONDITIONS IN AN ELECTRICAL UTILITY Richard Brodrick Charles Candy A project report submitted to tht?Faculty of Engineering, University of the Witwatersrand, in partial fulfilm It of the requirements for 'the degree of Master of Science in Engineering. Johannesburg 1995
-
Upload
khangminh22 -
Category
Documents
-
view
3 -
download
0
Transcript of MMI, SCADA AND ALARM PHILOSOPHY - CORE

MMI, SCADA AND ALARM PHILOSOPHY
FOR DISTURBED STA'fE OPERATING CONDITIONS
IN AN ELECTRICAL UTILITY
Richard Brodrick Charles Candy
A project report submitted to tht?Faculty of Engineering, University of theWitwatersrand, in partial fulfilm It of the requirements for 'the degree of Master ofScience in Engineering.
Johannesburg 1995

DeclarationI declare that this report is my own, unaiqed work.
It is being submitted, ig.fulfilment of the requirements for the Degree of Master of Science inEngineering at the University of tne Witwatersrand, Johannesourg.
It has not been submitted before for any degree or examlnanon at any other University.
~,8f}:~Richatl:J I3rodricl<Charles Qandy
5 July, 1995 Ii

APstract
5 July, 1995
(I
Advances in digital computing technology make it possible to improve the designof the Man Machine Interfa,oe (MMI), SCADA and ,,\LARM modules used inelectrical utility control centres. to overcome; the problem o('Oootrol staff dataoverloading. A possible ~,olution is proposed, based on-an explicit representationof a disturbed power system state in addition to quiescent conditions.
The structure of modem SCADA,inst81lations is\analysed ,interms of thecomputing power of full graphic workstations, the quantities of element datadelivered to the control room and the capabilities of intelligent remote terrrina!units. This analysis indicates that existing deSigns for the presentation of SCADAqata need to change to solve the data overloadinq-problem.
The proposed philosophy moves the focusrpf attention from the element level u'pto the device level by grouping and dividing all elements into categories at theRTU and linking them to their parent device, Control staff are notified graphicallyon the one-line displays, next to the device in question, of the existence ofabnormal elements by category. The element sta\l=ldetalls for the device are onlydisplayed on demand, resulting in a 95% redUlmior:iof alarm text messages.
Suggestions are made as to the software functions needed at tbe RTU and theworkstation to assist with the display of system data. Lastly racommendations areoffered to reduce maintenance by standardising ~nd pre-ordering device elementdata.
iii

Acknowled9§!!!!entsI would like to thank the members of ESKOM's National Control for their help andsupport in preparing this document, in particular Mr. Len H~rvey, Mr. RobertGubbins, Mr. Emile Venter, the National Control Manager, rVtr.Charles Geldard,the System Operations Manager, Mr. Juan La Grange for permission to publishthls docurnent. I would like to express my appreciation to AnthCJnyBlake and WallyWebb for their time and suggestions while proOf reading this document.
I would also like to thank Professor jan M. MacLeoci who acted as supervisor, forhis assistance and enthusiasm in preparing this report. .
iv

Contents
1. INTRODUCTION
1.1 Overview
1.2 Problem Background
1.3 Alarm Messages
1.4 SCADA and MMI Oesign
1.5 Data Overloading Definition
1.6 Control Staff Disturbance Activity.
1.7 Importance Of The Rpsearch
1.8 Solution Options
1
11
1
1
2
2
3
3
1.9 Solution Objective
1.10 Picto('" 'l1~pof the project report
1.11 Overview of the project report
1.12 Summary
4
4
5
5
2. BACKGROUND
2.1 Introduction
2.2 Telemetered Data
2.3 Plant structure
2.4 Mental Models
2.5 Remote Terminal Unit (RTU)
2.6 Enhanced Remote Terminal Unit
2.7 ESTEL Protocol
2.8 Host Computer System
2.9 Data Base
2.10 Telecontrol Standard
2.11 Man Machine Interface
2.12 Summary
6
6
6
7
7
8
8
9
9
10
10
10
11
3. MMI RESEARCH REVIEW
3.1 Overview
3.1.1 Control Room Task Analysis
$.1.2 Control Staff Requirements
3.1.3 Regional Control Consideration
3. 'l.4 National Control Manager
3.1.5 SCADA Vendor Comments
3.1.6 Enhanced Remote Terminal Units
3.1.7 ESTEL Protocol
3.1.8 Telecontrol Standard
1.212
12
13
13
13
14
14
14
14
5 JUly, 1995 v

3.2 Summary 15
4. THE PROBLEM OF DATA OVERLOADiNG
4.1 IntroduCtion
4.2 Daily Tasks
4.3 Alarm Philosophy
4.4 Progress Message$
4.5 The Fire Hose Syndrome
4.6 Summary
16
16
16
16
17
18·
;>19
5. EVALUATION OF MMI LITERATURE
5.1 Introduction
5.2 General Philosophy
5.2.1 EPRI
5.2.2CIGRE
5.2.3 CDC
5.2.4 Dept. Of Electrical Engineering, Washington Univers~:r
5.2.SIEEE
5.2.6 Helander
5.3 Expert Systems
5.3.1 EDF
5.3.2 Portuquese
5.3.3 Hydro-Quebec
5.:),4 Strathclyde Univ~:;,,(y
5.3.5 SLJmmarypf;''::xpert Systems
5.4 Full Grap~:6.~
5.5 SU!O";rrlary
2020202021
2122.122223
23
23
23
23
2424
25
o. POSSIBLE SOLUTION TO THE DATA OVERLOAD PROBLEM
6.1 Introduction
6.2 Disturbed state
6.3 Design Brief
6.4 Solution Mechanir..$
6.5 Proposed solution
6.6 Categories
6.6.1 MMI indication of abnormal element states
6.7 Abnormal counts
6.8 Text alarm messages
6.9 Data structure changes
6.10 Cummunication cycles
6,10,1 Communication network loading
26
26
26
2626
27
27
2828~929
30
30
'.i JUly, 1995 vi

6.11 MMI Icons
6.11.1 Icon duration
6.11.2 Flashing icons
6.12 Additional Fields
6.12.1 AadiUonal Host. fields
6.12.2 Additional ERTU fields
6.13 Host changes
6.14 ERTU changes
6.15 Maintenance
6.15.1 Plant commissioning
6.16 Example
6.17 Summary
31
3232
32
3334
34
35
35
37
37
38
7. HOST MMI FUNCTIONS
1.1 Introduction
7.2 Data view philosophy
7.3 New·MMI Phi;bsophv
7.3.1 Output views
1.3..2. Input views7.4 MMI Data flow7.5 Output behaviour on display call-up
7.6 Input view areas
7.6.1 Category Filter
7.6,2 Alarm query
7.6.3 Secretary mode
7.6.4 Displa.y controls
7.7 One-line display representation
7.7.1 Voltage Colours
7.8 Viewing controls
'1.9 Summary
393939
as404040
414142
4242
4~4J
444444
8. SECRETARY MODE FUNCTIONS
8.1 Introduction
8.2 Secre~ary actions
8.3 The role of intelligent systems
8.4 ERTU actlvitles
8.5 Host activities
8.6 Summary
45
45
45
45
46
4747
9. JUSTIFICATION Or- THE SOLUTION AND EVALUATION Or- ALTERNA1nVES
9.1 Introduction
48
48
5 July. 1995 vii

9.2 Data Sase Increases
9.3 Installing new elements
9.4 CPU Lo~ding Consequences
904.1 Expected changes in the computing and electrical industry
9.5 Summary
48
48
494950
10. CONCLUSI($N
10.1 Introduction
10.2 Evaluation ofthe new MMI
10.3 Concept model MMI
10.4 Prototype
10.5 Financial consequences
10.5.1 ERTI.iCosts
10.5.2 Host costs
10.5.3 Protocol costs
H).SA MMI costs
10.6 Responsibilities /'"
51
515152525252
52535353535354
54
54
54
54
55
55
10.7lmplernelltation Plan
10.8 Critical Review Of This Report
10.8.1 Mental rrl:~dels
10.3.2 New knowledge
10.8.3 Support
10.8.4 Academic view
10.8.5 Advantages
10.8.S Disadvantages
10.9 Conclusions
Appendix 1 Examples of an ESKOM disturbance log.
Appendix 2 A copy of the 1994 ESKOM Teleccntrol Standard used to wire up Remote Termlnal Units.
Appendix 3 Task analysis of ESKOM's National Control Staff.
Appendix 4 Man Machine Interrace functionality comments and requirements.
,',Appendix 5 Phase 3 protection element data for a Static Voltage Compensator.
Appendix 6 Glossary.
Appendix 7 Copies of character graphic displays used by ESKOM's National Control staff.
Appendlx s References.
5July,1995 vm

List of figu:res
Figure 1-1 fliotol'ial map ohhe project report ...Figure 2-1 Pictenal View oflhe data path from th~ RTU to the controt roomFigure 2-2 Electrioal network struoture .Figure 2-3 $ubstl:ltion ,and 8Rl'U interfacing structureFigure 2-4 Host hardware configur~tion
, Figure 2-5 Ml;U haluware r:conflgurationFlgure 3-1 Arrangement of eonsoies in National ControlFigure 4-1 The fire nose analogy ..Figure 4-2 Alarm rste.'fo!lowing a minordisturoanceFigure 4-'3q::lower system freql!lency; responseFigqre 6.,1 Existiri~'Bnd new face) levelsFigure 6"'G (13raphf~lmodel oftl:le proposed data structureFigure ~-3 Comparison 01the .classlcal and proposed data strncturesFigure si4 Modelof'tr.a two cycle data acquisition modeFigure 6-0 da~egory loons and associated popup windowFigure 6-6 pte of pulse trace behaviourFigure 6..'7>, 1'Ipleoft.l1e presence bit in useFigure 7·1 MMI Work benct\ layout:Figure 7~2 l,.()gicaldata.base1.fStructl.lres at thehost and workstationsFigure 7~aData flow When a djSPI~~lin called in to the work areaFigure 7-4 ~mple.of a,one~line display with grey out and icon indication::>
467891112181819;,2628293031343640414243
11 July. 1995 ix

List ofTabJes
Table 1 Typical format of alarm messagesTable 2 MMI Question topicsTable 3 Transformer breaker elements divided by categoryTable 4 Hydro unit state change messagesTable 5 Transformer elements divided into categoriesTable 6 Additional fields needed on aUhost deia base recordsTable 7 Category field layout. .Table 8 Comparison of the difference,~.sbetWeen classical and the new MMI.Table 9 Elemtint difference.s betwee.x'jthe 1990 and .1904Telecontrol StandardsTable 10 List of devices per electlica! objectTable 11 List of devices per electric9~ object (continued)Table 12 Evaluation of initial?fOhl:.1(tl in terms of the new MMI
113151727,33333948484951
5 J~~!.".1995

r,INTRODUCTION
1.1 Overviewthis chapter iUroduces the problem of data and alarm message overloading experiencedby staff in electrical utility control centres and examines the factors ~h~t make it a seriousproblem that requires an immediate solution. It also provides. a pictorial map of the entireproject report.
1.2 Problem BackgroundThe Supervisory Control and Data Acquisition systems (SCAOA) used to monitorElectric8rPower Networks are designed to provide the control staff with up to dateinform~tkm on the current state ot the [lower netw01''<as rapidly as possible. This is toensure that problems detected in the power network are corrected as fast as possible toprevent further degradation ofthe power supply to consumers,
Currently, control staff are notified of network problems via text messages, gef'!~rallyreferred to as alarms or alarm messages, sentto them by the "alarm system" software.
1.3 Alarm MessagesAlarm messages indicate that a power system element has changed state or has crosseda limit btlimdary. They are generated by the Host computer following the detection of thechange by the SCADA system, The text for the alarm message is inherent in thedefinition of the element in the Host data base. Non-intelligent Remote Tenninal Units(RTUs) are responsible for the collection and delivelY of the current element statesfollowing. a request for data from the host. Therefore the RTU is ultimately r~;5ponsible forthe generation otthe alarm messages.
Each message seen by the C I)ntrol staff is actually very primitive. The current design ofSCADA and ALARM software apPlications only allows for messages that refer to a singleelement at the RTU.
An alarm message is normally made up of 6 basic fields as can be seen in Table 1 e.g.1. Time at which the event occurred2, Priority of the message from 1 to 6 with 1 high3. station initiating the alarm4. Name of the device or element to which the message belongs5. Element 10 in alarm if the device has more than one element6. Alarm state, LOW, High, Normal or Alarm. For analogue alarms the message also
includes the value and limit boundary crossed.
LOWALARM
NORM:~LNORMAL~------------------------------~--------
12315:23:29 *515:31:23 "615:31:25 *615:31:31 *5
456MERSEY 1/275B KV 280 278AVON STANG1_GROUP1UMFOLOZI NORRX1_GROUP1MERSEY CORPR1 MVA 71
Table 1 Typical format of alarm messages
1.4 SCADAand MMI DesignA quiescent system is one in which the alarm rate, is roughly, less than 10 alarmmessages per minute. These alarm messages, each of which has to be read,understood. acknowletlged and then deleted, are routinely hardled by the contret staff •
6 JulY, 1995 1

little or i\o effective pro.vision is made for dealing with excessive alarm data, nor with itspresentation Q,uringa-pnwer system disturbance. It i.> during disturbances that the controlstaff suffer from data overloading in its extreme form,
1.5 Data Overloadil'l.g Definitionpata overloadihg is a situation that occurs when the number of alarm messages arrivingat operator ~or\~sf~(;ons exceeds the ability of the control staff to use, process or react to
t') .i '--. \them·, \,.... 10. . rl
During a distu~ance" the control stafftend to ignore most of the atarm messages, since99% of these m;~ssages represent the effect of a primary cause and not a definition ofthe problem. Apipendix 1coot" .is a sample listing from a disturbance on the ESKOMnetwork, By ob~iervation it can be seen that the primary event was a fault at the Tutukapo~{er station at 15h23:21, the causewas unknown. The effecfs ofthe fault are thesubsequent 43(1 odd alarms as seen by the control staff, who have to determine thecause of the problem frem the multiplicity of the effects.
Associated with the sudden surge of alarm data, is a corresponding demand forexplanations as to what has gone wrong, both from staff and management. To ada to theconfusion, some messages f1asn and have audible tones associated with them.
B~twe.en 25 to sa alarm messages tan be viewed at any Me time, usuallybhronologically with the newest message at the top. Control staff page or scroll throughthe listing using a mouse or key sirokes to review the messages, When a new messageis added to the top. of the list, the display is re-autput starting at the top. This makes italmost impossible to read each message or do anything until the messages Mtllslly stoparriving. An altemative is to pause the screen output or generate a hard copy of themessages in the window. During a distuli)ance this can be difficult to do Of dangerous asthe control staff need to see what else is' going wrong.
The structure and format of the messages are designed for a quiescent power systemstate and not for a disturbance conditions. This can be seen by examining Appendix 1,each of the messages refers to a single fact or state change. Many messages refer tosimilar things at the same substation at the same time, such as the frequency indicationsfrom Lethabo power station. No pruvision is made to compensate for conditions that arealready known by the control staff, nor things that will always take place under givenconditions such as the voltage of a unit dropping to zero if the generator breaker isopened. In gener~1 the design ofthe alarm messages, their structure and content isbased on each device reporting its own state changes with no regard to what ishappening around it. There is no method yet, of combining messages at the source toreduce the number of messages sent to the control staff. The post disturbance evaluationtechniques are manual, laborious and it is very difficult to determine what actuallyhappened without accurate time stamped data.
All messages have to be acknowledged individually or by page before they can bedeleted. Audible alarms have to. be acknowledged each time they are triggered. Added tothts, is the pressure to perform and make the correct decision as fast as possible so as toarrest further degradation of the electrical network.
Currently. the only concession made for disturbance conditions is the size of alarmmessage buffers. These butters are usually big enough to handle the maximum numberof potential alarm messages expected during a disturbance perle-
1.6 Control Staff Disturbance Activity.Initial activity focuses on establishing the extent ot the disturbance and the potentialkntick~on effects. Control staff manitoj' the system disturLance behaviour initially fromatarrmmessaqes and secondly by watChing the system frequency meter, whichgrtfp~lically and digitally indicates that the system is suffering from a disturbance.
5 July, 199G 2

Once control staff have a mental picture of the power system following a disturbance, thegeneration 0f additional alarm messages is highly anno~ing. Control stati.kno\\ltf)ey havea problem and the repeHtlon otexisting rnessaqes is unnecessary.
Control 5taft have two major issues to deal with during a disturbance:a) Qnders'lsnding the nature oUhe (iisturbance and its. potential consequencesb) Correcting the problem as fast as possible.
Their priorities are:G Find out how secure the remainder of the network. is and carry out any necessary
switching.o Determine the generation neected to restore the frequency to its normal state.• Find out how it will takelt> repair the fault and restore the supply to normal,• Request the powers stations to increase or decrease generation if necessary.• Request regions. to shed load if necessary.
In effect the job of the control staff resembles the assernbly of a jigsaw puzzle from anoverabundance of pieces, nClt aUof which are relevant to the puzzte·at hand, but includesome pieces that belong to lid.ilfterent pUZ7.lethat must be assembled and understoodsimultaneously.
The speed with I,Afhichthe puz,a:11ftis put together determines the speed Of solution. In thisanalogy the Jigsaw pieces have to be e;;traCl.ed from the alarm message texts and thedisplays."
in the proqess of solving the pro(llem, large quantities Of alarm text and dispfay c.!2ta hav~to be processed and discarded in order to understand the basic problem and theh correctthe fault. During serious disturbar'lces, additional help is often required from field staff toobtain confirmation Of the 8}"l;lImptions made from the reporteci effects.
It should be remembered thai: the format and struc;ture of an alarm m'~age is based ona quiescent power system state p;j)t a distulbed o~!~, and as such only Simple. statechange messages are ever allowed for. There has been no acknowledgement of theneed, for tM control staff to have a different alarm message forma1 Oi"structure, to caterfor a (Jisturoed power system state.
1.7 Importance Of The ResearchThe consequence of a disturbance is usually the loss of supply to consumers. byreducing the time required to restore supply, the utility "educes the loss of income,prestige and decreases the irritation to its customers.
By providing the control staff with the ability to rapidly obtain a clear picture of the faultand its effects, the power system can be restored sooner. The savings to me utility areextremely valuable and can be measured in millions of Rand.
On page 18 of the Oec. 1994 EPRI journal {18} the comment is made" ,•.researchers atthe University of Washington concluded that the problem in power system applications isno longer computation time - it is comprehension time."
1.8 Solution OptionsA pre-requisite for the solution to the problem of control staff data overloading, is therealisation that the existing data presentation and delivery philosophy are no longeradequate for the control of large electric power systems. This is particularly relevant inthe light of the additional data demands on the SCADA system, from both inside andoutside the control room.
There appear to b~ two possible solution options:• The use of expert systems to process alarm messages!sent to the control staff and to
produce diagnostic messages to explain the network behaviour.
5 July. 19!16

.. The Introduction ·of a new Man Machine Interface and data acquisition philosophymaking use of FuJIgraphic workstations.
The use Of Expert systems has be.M tried on a number of occasions but does not seemto be widely aocepted or implemented, [see g, 1.0, 12, 151. Expert systems running inparallel to the exi$ting alarm system. provide control staff with a list of potentialexplanations or pos~\ible diagnostics of the prob!~m. but not the .exao~caus& The control'stfilfl'~W,have to wade through the incoming mass of messaces in ol'detl to validate theES output [9]. Expert systems are also very expensive to build and mai~~ain particularlyfor a dynamic system such as. an e='~ctricalUtility. '
Fundamentally the solution to the data overload problertllies in understanding Mdchanging the way alarm information is acquired, delivered and presented to the oontrolstaff. It is important to recognise tile needs of tM. control staff under different operatingconditions and to support their requirements by uSing a full graphics man machine' '.interface to the fullest extent before expert systems are installed.
I2xpert systems have a large part, to piily in the monitOring and control Of power systems,.but their integration haG to be reconsidered in terms of available input data, computerpower and communications f~c?ities, as well as the value of pote,Q:tim~~;t,*g~that can beprovided. ' ,\ ' .
1.9 Solution ObjectiveThe objective of the solution proposed in this report, is to reduce the time it takes thecontrol staff to understand a problem on the power system and increase speed of faultoorrection without farcing the control staff to process unnecessary aM unwanted data, ordelaying the deliv~ry of oruoial data.
1.10 Pictorial map of the project reportFigure 1-1 illustrates the different stages inVOlved in the development of the (lew alarmplJiJosophy to improve \lisualisation of the power system state by control staff where eachblock represents one or more sections in the project report.
J July, 1S96
DtlsCrlpt(~n of thecurrent MMI,__~--:<\_~ ----'
Current h/W and slwInfrastructurc.
Juslifloalioll in terms ofo Taskso Mental Modol() lnfraetructure
I. Evaluation of new phllosophy I
Figure 1-1 Pictorial map of the project report
4

1.11, Overview of the project reportchapter '1 is an introductian to the problem of data overloadhlg.
Chapter 2 discusS:es the bacKground and reviews all the factors affecting the dataoverloading problem.
Chapter 3 covers the task analysis and control staff requirements used to design the newMMI.
Chapter 4 is an analy~j!.? of the associated literature relating to data overloading and (I
existing solutions. I, f "
Chapter S analyses the existing data processing philosophy and control room activity, inorder to identity the problems and needs of ESKOM's National Control staff.
Chapter 6 proposes a possibl~ solution to the data overload problem and defin,es thebasic requirements needed to Implement .it. The three areas are a) Host data basestructure, b) Ma~Machine Interface and c) Remote Terminal changes.
Chapter 7 explains how the chal'iges defined in chapter 6 can be implemented in the ManMachine Interface and Mw the control staff use the new MMi faoilities.
Chapter 8 discusses how the "secretary mode" 'functions referred to in chapter 6 are usedto control displayed data and the how the ERTU supplements conventional telemetereddata.
Chapter 9 examines the ongoing changes taking place in SCADA systems and theconsequences jf nothing is done to change the existing methods of displaying largeqUantities ottelemetered data.
Chapter 10 is the concluding chapter and ei,aluates the proposed solution in terms of theinitial problem definition. The costs of impleirnenting the proposed ~olution are examinedalong with an implementation plan. This enapter also includes a critical review of theproject report.
There are seven appendices:
1 Examples of an ESKOM disturbance IOSI. "2 A copy of the 1994 ESKOM TelecontrQI Standard U~ed to wire up Remote Terminal
Units.3 Task analysis of ESKOM's National Control staff.4 Man Machine Interface functionality comments and requirements,5 Phase 3 protection element data for a StatiC Voltage Compensator6 Glossary.7 References.
1.12 SummaryThis chapter defined data over loading and reviewed the actions of control staff during adisturbance in the ppwer system, Of the Mo possible options examined, the ExpertSystem one was rejected since it was unable to solve the basic problem of dataoverloading. Lastly there is a pictorial map of project report.
I) July, 1995 6

z, BACKGROUND
2.1 IntroductionThis section discusses the relevant staqes that make up the path taken by the raw dataas it travels from the plant in a substation to its final output on the displays in the 'Controlroom.
Figure 1-1 shows the major stages making up the data path from the monitored plant tothe control room, the substation RTU sends the data via microwave radio to the controlcentre where the front end hardware combines all tM radio signals stores them in tl1'3:host data base ..The MMI software uses .tne plant data to updat~ the displays used by thecontrol staff at the workstations to monltortne plant state, within two seconds of theelements being scanned by the RTU.
Substation Remote Terminalunit (RTU)
Microwave linkto Control C()ntre
Host computer anddata base
Control staff work stationand CRT monitor with one-linedisplay of the substation
elmtral Centre
."
Front End
Figurfl 2-1 Pictorial view of the data path from the RTU to the control room
2.2 Telemetel'ed DataThe transfer of information between the RTU and the control staff involves a number oftranstormatlons.
Initially the data is no more than signals in the substation. In the process of telemeteringor moving data to the control centre and ultimately presenting it to the control staff, thefollowing changes take place:
1. Basic Signals are supplied to the RTU from the substation switching yard.2. These signals in the RTU are telemetered to the Control Centre were they are stored
in the Host data base.3. The Host converts the data into information by adding text and presenting the
information to the control staff either as an alarm message or as changes on thedisplays.
6,JUly,19i15 6

4. As the ct~!'Itrol staff interpret the messages 01' the changes on the displays theinforrnatidt,.b€lcQmes knowledge of the current power system state.
It is this knowled'tle that is used to understand the behaviour of the power system and tooontrcl it. Uoaerst::mding the exact nature ofttle different stages in the datapath andmatching the mentatimages the control staff have ofthe power system,. with the plantdata, win reduce the tI~~eneeded to make decisions as to how to correct problems in thepower system.
2.3 Plant structureIn general terms, the eler,nocnl equipment at a substation is referred to by different namesclepending upon the leve[pf detail under discussion. These different levels as lndloated inFigure 2-2 have definite divisions, and fit neatly into a pyrami~1 structure as. follows:
Figure 2-2 Electrical network structure
• At the lowest level are the individual dataeit)ments such as single or double bit statuspoints, analogs, controllable polnts, tappositions, etc.
• When the elements are grl1uped togetherthey form devices such as breakers andlinks.
• When the devices are grouped together theyform electrica' objects such as feeders,bus bars, reactors, capacitors andtransformers, etc,
• Grouping objects together creates thesubstation Of power station .
., Grouping the substations together forms theelectrical network.
2.4 Mental ModelsDiSCussions with the control and the .distribution staff involved with the physical plant atthe S!lbstations and power stations nevealed that ahey support and use the pyramidstructure shown in Figure 2·2. They confirm that it is a correct interpretation of theconcept model used in discussions 0,( power system problems among themselves.
Observing the working behaviour at 'the control staff, they constantly traverse the differentlevels of the pyramid. The structure of the alarm messages match the lower four levels ofthe pyramid. However the electrical object name is 'not implicitly defined I')ufcan bedetermined from the device name. For example, in the alarm message below, the stationis HYDRA, the electrical object is TR_2 or transformer 2, the device is tile 400KV MAL_2or the number 2 motor operated link on the 400kV busbar and the element state indicatesthat it is now closed.
eS:24:31 HYDRA TR_2_ 400_MAL2 CLOSE
Once the device and element details are sorted out, in this case the link has been closed,the focus then moves upwards again to Object I(::\(el,Le. the transtormer, where the nextdecision ,s made. This can be verified by listing to the communications between thedis~ribution field staff and the control staff. The focus of attention is initially directed to agiven problem area by referring to the net1.VOrkand station, followed by the electricalobject under review followed by the device and elements with the problem.
It should be remembered that only the element data at the lowest level otthe pyramid isphysically connected or wired into tM Remote Terminal Units,
5 JUly, 1995 1

The rest of the data in the other levels in Figure 2..2. is purely abstract and is assembledmanually, based. on the element states from the element level.
2.5 Remote Terminal Unit (RTU)The R"f'U has two primary funcnons:t, Receives scan requests and supervisory commands from the host2. Transmits thG requested scanned element data back to the host
Normally, each element in the station has its own unique location in the RTU. However,due to hardware and communication resmoticns, not all the element states can beconnected individually to the RTU. The restrictions force a large number of elements tobe gathered into separate groups. If one element in a group is abnormal, then the wholegroup is considered to be abnormal. Control staff have to call out distribution staff to visit'ihe site and determine which one of the elements caused the group to be abnormal whichincreases the time it takes before the problem can be solved.
The first generation of RTUs installed at the substations and power stations were usedpurely to forward the plant data values to the host computer system. These older RTUsare oof)sidered primitive in comparison with ihe current generation. New RTUs are beingdelivered with enhanced facilities and are called Enhanced RTUs, or simply'ERTUs.
2.6 Enhanced Remot~ Terminal UnitIn practloe the ERTU is a centralised, stand alone data capture unit that can actindependently of any host computer system. 11ha5 its own onooard computer and database which allows it to act as host device to a number of smaller' RTI ' i.1 or bay processorswhich are In tum connected directly to the plant.
Bayr:ro::e:;scr
Bedrica ~octs havatheir 0M1Bay JlOOOSSOI'
Figure 2-3 Substation and ERTU interlacing structure
An ERTU is designed not only to act as the interface between the control staff and theplant but also to provide general 'Ilteliaclng facilities to the plant as a whole and thesubstation control room. as indicated in Figure 2-3. The need to have multiple host usersconnecting their"own wiring to the plant is replaced by a single 110 polnt to the entiresubstation via the ERTU,
6 July, 1996

The users of the ERrU are:• tocal $l.Ibstation control room MMI computer• Local b~y RTUs or PLCs controlling a single feeder or lransform~r panelII Additional host SCAOA systerns supporting regional control centresI) National contror SCADA $ysterrio Local maintenance aotivitv to the bay processors or ERTU data base and software
facilities. '.. ... .»:
The desigrt of the new ERTUs provides major advantages over the olde~.CONITEL.RTLJ$, e.g.• Ability to access a far larger number of element data points at the substation.• Provide millisecond resolution sequence of event logging on all status pOints." Perform software functions on multiple inputs.• Communicate with multiple hosts and slave RTUs.• Pt{)VidS pr~-pr(;lcesSltlg of data prior 1(;1 sending the results to the host.e Removal of grouped data points.
Since the ERTU facilities cemnot ,be supported by the existing CONITEL pi6toC61 used fjythe older RTUs, a ne'N protocol called ESTEL has been developed to support the ERTUfunctions. .
2.7 ESTELProtocolSinqe 1988, ESKOM has be~lldeveloping its own standard communications protocoloal®d ESTEL [19]. This pr( 1 is based on the Open Systems lnterconnect Referel,vvMoqel (OSI~~M). ESKOM \. ._.Jloped ESTEL to' avoid being locked into proprietary:vendor communication hardware and software.
ESTEL is designed to solve many of the problems encountered with the various vendor-specific communlcanons ptotocolS. ESTEL was also d.9veloped to meet ESKOM's futureprotocol j"ieeds for the IW.Q.eVariE!ty (If dHta d~mai'td~t:t by ttte vsn(lUs hMt (lompUfetS amito be compatible with international telecommunication standards.
2.8 Host Computer SystemThe existit1{) computer systl:in Iconsists of up..to-date modem VAX llatdwate C(jf1f1~~,~tlvia DECnet using two Ethernet b.:lckbones as indicated in Figure 2-4.
Front Ends
MMI Eth&rhet
Figure 2-4 Host hardware configuration
9

Two separate Etht!tfl!'R Cltcutts are ossd to reduce Ute risk l.:lf sll1(:jIE!~fjQII:tt-failute.ASindicated, each Ethernet backbone is used for different purposes,
The primary e.'lataacquisition softWare modules, i.e. SCADA, Alarm and the Man MachineIntlenaee software are all relatively Old and are based on a 1986 release of the originalvendors product. They have since been modified to communicate with the ERTUs usingtbe eSTEL protocol, The SCADA system was initially clIstomised tf,) communicate withthe existing Leeds and Northrop RTUs using CONITEL protocol developed by t.&N andIJOm~j~SiOOed for ESKOM in 1976.
2.9 Data BaseAs indicated in Figure 2~4, the host computers receive the telemetered data from theRTUs and store it in Internal data bases. The data is then extracted by the MMI softwarewhen required. and displayed graphically on workstation video display units for use by thecontrol staff. .
;,:
ilThe existing host data base structures are well de\:fe1oped and have reliable supportsoftware to meet the needs of the older RTUs. Wit~ the installation of the ERTUs and theESTEL protocol, far more data elements can be accessed and telernetered to the hostdata base. Grouped element points can now be unqrouped and alarmed individually.
The ungrouping of the approximately 20 different sets of group elements, has promptedthe SCADA stante list all the expanded data elements required from each electricaldevice in a document called the Telecontrol standard.
2.10 Telecontrol StandardThe wiring standard lists all the input status and measurement elements requlred fromeach device scanned by ail\',E:RTUAppendix 2: !s a copy of the Telecontrol Standard.ESKOM Is pianriirtg II:! insiau ERTUS at allff!> Interconnected substations during the nextfive years.
Implementing the new Telecontrol Standard at aU sUDs{atiinlS will cause tile total nurrioerof elements processed by the SCADA syst~m to increase by a daunting 250%. thedetails of this growth are covered in Chapter 9.\}~Sthere has not been any changes in the host data proceS,s)ng philosopny, thesea~~itional data points will be treated in the same manner as the current methods of datastc:rage and display. The MMI and host data base are not currently able to use theadd~ional facilities offered by the ERTUs and no consideration has yet been given as tohow the control staff or the MMI will handle the additional data and display load.
2.11 Man Mal,;hine hlterfaceThe e>l:1stingMan Machine Interface uses DEC Workstations to run a software emulationof the I~ONLOG character graphics hardware. The original CONLOG display units .allowetl one display per screen, with multiple screens combined to form an operatingconsoh~.The DEC Workstations have been configured to have four different displaywindow~ ViSihlEf':un one'screert at the same time.
\
Each d~.lplay window uses eight colours, 64 pre-defined graphic symbols and 64QWERTV characters defined for CONLOG displays, Each display window is a fixed 80 x64 charscter area. Thef!~ are usually tWll worKstl:ltlM screens per C!Oflsole as ii'1di~ate(j infigure 2·.~\
Each (,'Qns$l~Mas a fttbUSe and dedi/j~U~a l<.eybo~utl to Interaot with the display hardwareand call up displays in anyone of the of the windows •
.~ July. 199$ 10

DIsplay l'e~p6lise,tjme is u~ually witl'ihi 2 seoonQsexcept irl tile case M alarm Qat~ivJ@icl:\can taktr tiP, to 20 seconds from the time of request to display qepending upon the up thenumbar (If ~IEii'ms il1 tHe tluff~r O£ldthe 110 load 011 ttn~CPU.
Figure 2-5 MMI hardware configuration
A new t:lIli graphics display facility is ~vailab!ethat can run side by side'with charaCtergraphics th,e' on the same Workstations, but as the full graphics softWare. is still in thedevelopment stage, there are a large number of desired. functions not yet available whichprevent its on-line implementation.
Based on the needs of the control staff during a disturbance and the-ease Of use of the6liilra61er grapnics, mere are serious reservations as to tM ability of itia Full gl'a~liiMpaokage (in its current form), to prOVide additional value over and above the charactergl'apliios paCkage.
As me Full grdptlics package is C!esigriedto wortu:iire.Ctly witli tile f\6st daia oase and notwith the ERTUs there has to be a serious evaluation of its ability to replace the Charactergraphics package.
2.12 Summal),ihis chapter reviewed the physical components of the- SCAOA system, the networKstructure and the mental models used by the control staff to monitor the power system.'oetans Ofll'le "aW RTUs and -ina commufll<mt!Of1 rm.:U()C(:IIWare msCUssea al(mg WithtMTelecontrobstandard and the physical design ofthe MMI.
GJuly, 1996 11

a,MN'iI RESEARCH REVIEW
3.1 OverviewThis Chapter reviews an investigation undertaken to determine the practic~l Man MachineInterface problems experienced by control staff while carrying out their daily tasks. Theobjective of the investigation was to establish a composite MMl.view of the ooolroi roomenvironment in terms of the tasks carried out by the control statt as a whole and then toexamine the external ractors influencing the behaViour ofthe control staff.
The research covers the (ollowing aspects:1. Control room task analySiS2. Cuntrol staff interviews3. B~gional Control requirements4. Natiyt;lal Control manager's nee.~s5. seN JA vendors comments .6. ~e"" .ete Terminal Unit changes7. Data communication changes8. Teleoontrol standard
Each of the 8 items investigated are listed under headings 3.1.1 to 3.1.8 below,
3.1.1 Control Room Task Analysis
TM investigation started off with a task analysis of each of the four working positions illthe.~ontrol room, l.e. :1. Shift Supervisor (.)ifl-lread ofSl1iff2. Generation control <:3. Network voltage conttQI.4. Transmission or network st<;!pility control
r~'('
Figure 3·4 shQWSthe ah'angement ot the desks in the control room. staff are seated inan..arc facing the dynamic mapboard or mimic. There are 5 shifts working in rotation;between,8 and 12 hours a day depending upon the day in the week.
Voltage
~
Dynamic Mapboard
Generation Transmission
Shiftsupervlsor
Figure 3~1 Arrangement of consoles in National Contra'
The task analySis was aimed at determining the basic problems experienced by themembers of National Control while engaged in carrying out their daily tasks using theexisting Character Graphic MMI facilities.
GJl,lly,1996 12

The details of the task analysis are documented in Appendix 3. The results of theanalysis ~ere used to guide the interviews described in section 3.1.2.
3.1.2 Control Staff Requirements
Each of the ~hifts at National Control Were interviewed with discussions based on thetask an&.Ysis described io Appendix 3. Each of their MMI actions was listed. discussedand analysed with respect to the eXisting Man M~chine Interface both for quiescentbehaviour and disturbance conditions. The questions used for the discussions are lister.in Table 2.
Are there a large number of incorrect values on th...:..e_d__;i~sp,:..:I.;.:.:aYl-__ ....,....... ...,l
Table.2 MMIQuestion topiCS
The responses to the questions are discussed and tabulated in Appendix 4.
The results of the interviews provided overall comments and highlighted many problemsexperienced by the national control staff land provideo the opportunity to test a number ofa!temative methods and philosophies for the presentation of SCADA data using Fullgraphic workstations, especially during disturbances.
What 3r~ the major frustrations with the MMI in generalWhatM<.,"~(mal data Is needed on the displayNavigafiOil-problems experienced~-~~~~--~~-.-~--~~~--------~Is mapboard information sufficient or is additional data neededMethods of calling up displays and associated probleZ'1rI ,.~.-~----.--,.,-jPrimary displays used most often and whyMost difficult task to carry (Jut due to data availability and MMI problemsExamples of well designed MMIFunction~lityneeded to make the MMI easier to useProblems assOciated With alarm processing in generalQuiescent alarm process;ing problems"
r-Oisturbed state alarm processing problemsSymbolised alarm data compared to the text formAdvanced data processing. needs at the RTU and the workstationPotential of 3D gra'Phj~ as a u.s~fll! toolProblems involving operatingerr6rs>';'.-a~n-:d-:'id-:-e-a-s~t-o-re-d-:-u-c-e~t:-he-m---~----.-Use of vector or Kiviat diagrams [6]
'use of Venn diagrams to indicate protection informationNeed for additional protection data and display methodsUse of Sequence of event dataNeed for hypermedia and hypertext facilitiesGI'oupeci alarm data details on demandTo what extent are faise alarms a problem
3.1.3 Regional Control Consideration
The data overload problem was discussed with the control staff from tile five regionalcontrol centres in ESKOM during aseries of meeting to establish a standard MMIphilosophy for building displays using full graphic software. The regional control staffconfirmed ~.heneed for a method of reducing data ovenoad conditions experienced by thedistribution and reticulation control centres. They emphasised that they required a fewadditional facilities over and above the basic design specified in chapters 6,1& 8. Ingeneral they supported the proposed ohilosophy and wanted to be involved in itsdevelopment
3.1.4 National Control Manager
The National Control manager was interviewed in order to determine his needs, both forcurrent and future changes in the power system. The discussions revealed problemareas and possible solution directions. He highlighted the fact that ESKOM is expanding
GJuly, 1995 13

both locally and internationally. The expansion activities are gOing ttl add an additionalwQrk,load to the National Control Staffin the near future. tie supported the need toexamine alternative methOds to display disturbarure data to the control staff.
3.1.5 SCADA Vendor ComHlents
Discussions were also held with the staff oft:uropean an~ American vendors(Westinghouse and Siemens) who are delivering Energy Management Systems in SouthAfrica and to a m~mber of overseas countries.
The olJjective Was to establish whether there have been any Change on either theVendors' side or by their development staff with respect to new ideas for alarmprocessing and data visualisation philosophy. Both vendor representatives indicated thatthey had 'not really thought about the problem and did not have short term plans tochange their existing display and data delivery facilities.
3.1.6 Enhanced Remote Terminal UnitsThe ERTU hardware structure and sottware facilities were investigated to see whatfunctionality was available and to \7RSUrethat the needs of the control staff could bc:..net.Interviews were conducted with ESKOM design teams that s~cified the ERTUfunctionality (19}. They indicated: that the initial deSign of the ERrU was, based on thepremise that local RTU proces.:;ing could and would be supported, however, at the time,they did not know what shape it would take. The design team completely supported the"secretary mqde" functions suggested in Chapters 7 & 8.
3.1.7 ESTEL Protocol
The philosophy and' behaviour of tM ne$p(otocol were io~~~~ated to sea what facilitieswere available and what the restrictions were. [201.·The protfii:;Jt~esign J#+amsrecognised that some ..Changes would be needed to implement the n~wPhjIO~l~phYandsupported th.e ideas in chapters 6, 7 & 8 in principle.
$.1.8 Telecontrol StandardThe element data requirements specified for each device in the standard were studied todetermine rf there were any logical groupings that the elements could be divided into.Discussions were held with the individual shift managers to obtain ttl~ir feelings andneeds in respect of'the data ill the new standard in terms of quiescent End disturbednet-Nark conditions.
Section 7 of the standard (see AppendiX 2) is structured by equipment type, te ..1. Generators2. Feeders3. Bus coupler and section I transformer breakers4. Transformers5. Shunt Reactors6. Shunt Capacitors7, Series Capacitors8, stanc Voltage Compensators9. Station Leveli0.Physical Security11. Integrated Values
From an examination of the element data per device and discussions with the shiftmanagers and the National Control Manager, the element data for saoh device, can bedivided iota three broad categories called Health, Protection and Information.
For example, the elements belonging to Transformer Breakers (see pages 9,and 10 ofAppendix 2) have be divided into the three categories as shown in Table 3.
GJUly,1996 14

M2 protection trip
Health (.\ Protection InformationAir pressti~t,i-..?I..,..,u:-"rg~e...;.;n...;.;t~-:-I--:P=-ole Discrepancy Breaker state (open/closed)Air Pressure~Non urgent BlIs zone Breaker ChargedMain 1 DC fail Bus strip Breaker control - local/remoteMain 2 DC fail Mt protection trip SupeNisory Control- On/OffControl DC fail M1 HV instantaneous over current Malf' 1 protection on/off
!--::C-:-lo"';';s-e-::D::-:C::--7'fa"::iI-~""""--I-M:-:·:-:-1-:H·.:;v"7.':""b-ac-:k-u-p-o-v-e-rc-u-rr-e=n~t=========:2M~=a~jn~2:.!..pro:_~t_e_ct_i_or_'_o_n/_o...;.;ff~....,Spring rewind fail M1 HV earth fault operatedIsolator DC fail M1 MV instantaneous over currentAC/DC Converter fail M1 MV.backup over CUITent
M1 MV Earth fault operatedM1 Tertiary instantaneous over.currentr---------------~-I-~~--:M1 Tertiary IOMT over current
M2 HV instantaneous over currentM2 HV backup over currentM2 HV Earth fault operatedM2MV instantaneous over currentM2 MV backup over currentM2 MV Earth fault operatedM2 Tertiary instantaneous over currentM2 Tertiary IOMT over current
Table:3 1t~m.former breaker elements divid~d by category i'1 .,.'< "
After further discussions With-the National Control manager and protecti\'''' ' ~<,ft • ,""asdecided to subdivide the protection category into two groups, Main 1 or (hu~I"~(j{edtionand Main 2 or Backup protection.
There is a significant difference between the .two protection categories. Gen~rally, Main 1protects the device from local faults, where as Main 2, (or backup) provides protectionfrom remote faults. During a disturbance the ability to differentiate between the twocategories at a glance will allow control sta.ff to quickly identify equipment that has faultedto protect itself and that which has operated to stop a cascaded fault.
Separating the two categories can significantly reduce the time it takes to restore supplyto consumers and assist comror staff to understand the nature and source of the fault.The subdivision of the protection element data also makes it possible to provideadditional graphical feedback of thE!system state in terms of actual device protectionactivity and assist with dynamic fault~iagnosis. Figure 7A has examples of how theprotection element data can be used t&display graphically the zones in which protectionequipment has operated. ..
3.2 SummaryThis chapter established the·MMI view of the control room environment in terms of thetasks carrieo. out by the contror staff. The topic.."icovered were :1. Controt rcom task analysis2. Control staff interviews3. Regional Control requirements4. National Control manager's needs5. SCADAvendors comments6. Remote Term'lOal Unit changes7. Data communication changes8. Telecontrol standard.9.The chapter also lists the needs and opinions of ClU interest groups and factors external tothe control centre influencing the new MMI design.
IiJulY, 1995 16

4.· THE PROBLEM OF DATA OVERLOADING
4.1 ~ntroductionThis chapt~r reviews control.:,room aCiflVityand analyses the ,~Xistingdata procAssifittphilosophy Which causes data overloading in power systeny/CQhtroi rooms. -
4.2 Daily TasksThe. minute by minute management Qf a power utility is concerned with:• Keeping the voltage and frequency within limits$ Ensuring that power is delivered to the consumer" Preventing the overloading of lines and transformer)• Adapting to seasonal and climatic changes in consumer demand'41 Planned outages of generating plant and power lines• M!"~aging the system in the most economic manner available• filoblems caused by thunder storms, wind, lightning, floods, fog, etc.• Equipment failure causing generator or litle trips., ..' Operating errorsiii Primary protection equipment failure and consequent secondary protection operation& Grass or forest fires causing line trips.. Pollution deposits on the insulators causing Iin'7 tripslt False alarms from the RTU• Network changes in the form of new equipment and new transmisslon lines• Inter~utility power transactions
From the above list, it is obvious that the work of the control staff is \tariM and requires agreat deal of background knowledge and skill to meet contin4~U$ly all the. consumers'expectations. A large number and many different typ~p-of-r:.l!:~b[~mshave to be solved ona daily basis.
\-.
The primary source of information on the state of the power ~~~ork is the output fromcomputer system. The output ofthe existing system is in the form of alarm messagesand changes to the one-line displays. Since the computer system does not provide thecontrol staff with all the required infQr.nation, the control staff have to work closely withthe distributip'll and power station S\I·' 11order to keep the power system operatingefficiently. The trensmlssion and distrlQlItion staff have to be available to travel to thesubstations to provide the control staff with additional information as and when required.substatlons are not permanently manned and it can take staff many hours to reach asubstation. It is this reason which has prompted the existing alarm philoso, ',W,
4.3 Alarm PhilosophyThe philosophy behind the generation of alarm messages in ESKOM, and in virtuallyevery other electric utility, is based on the assumption of a quiescent network state. r:;ismeac ...~hat whenever any measured value crosses a limit boundary or any singleelement changes state without authority. an alarm message is produced. The alarmmessage is used to alert the control staff to respond to the event and taKe correctiveaction where needed.
There is a problem with this approach, because each device in a substation isindependent of all other devices and responsible for its own protection. As a result, eachdevice will produce an alarm message of a fault, detected by its sensing equipment. atthe same time as the same fault is detected and reported by all other devices. This is theorigi;t of the data overload problem.
To make matters worse, the designers of power system control rooms tend to follow therule. "Give the control staff all the data you can and they will make the correct declslonmore easily and faster!" [13], The underlying assumption is that the additiQnal data willprovide proof of the problem and help prevent further problems. The effect Of thiS
5 July, 1996 16

approach is to exacerbate an already difficult snuatiQO which aggravate~ the dataoverload problem. Progress ,messages are a case In point.
4.4 Progress MessagesThe SCAOAsystem is r:lf'-signed not generate alarms when eQ,uipment reac~'es the finalstate following a commal1de!1 state change. However if a device; such as a hydrogenerator, is requestectto <Jhange state; the intermediate state changes are alarmedsince they are not the final state I but change state as part of the progress of the devicefrom one state to another. There is no way currently to suppress these messages withoutadding code at the RTU or at the ho~Ho suppress the messages under specificconditions.
Table 4 lists 11 messages from a single hydro generating unit as it moves from one stateto another. These messages are generated each time any of 12 hydro units changestate.
The messages indicate the various pre-programmed stages that the hydro unit takes as itmoves from a generating mode to standstill. In the messages. G/M refers togenerator/motor, The stages are;
1. Automatic power factor regulation is switched on2. The current GEN. state is no longer true3. The unit is not able to move directly to pumping4. KV unit breaker is open (tripped)5. Unit output voltage drops to 1 KV ( It must as the unit has stopped generating and is
not connected to the network)6. The exciter voltage becomes O.7. Unit exciter voltage becomes hi~lh (note the time)8. Unit exciter voltage goes to 0 volts 10 seconds later;9. Automatic power factor regulation. is SWitched off \10. Unit shutdown state is reached after 4 minutes11. Minutes tater ihe pony motor breaker closes to allow the unit to start up again if
required
1) 09:20:17 *6 PRAKN G/M_ARPR..,4 ON_OFF ON2) 09:20:17 *6DRAKN G/M_GEN_4 YES_NO NO3) 09:20:17 *60RAKN PMP_START_NOT_REAP_4YE~_NO NO4} 09:22;20 *4 ORAKN G/M4_400_BKR TRIP5) 09:22:26 *5 ORAKN G/M_4 KV 9 1 LOW6) 09:22:26 *5 PRAKN EXCITER_VOLTS_4 VOLT 0 ~58 LOW7) 09:2?:26 *5 PRAKN PK_EXC_PLT_VOLTS_4 VOLT 1 HIGH8) 09:22:36 *5 PRAKN DK_EXC_OLT_VOLTS_4 VOLT 0 0 LOW9) 09:22:38 *6 PRAKN G/M_ARPR_4 ON_OFF OFF10) 09:24:38 *6 DRAKN G/M_SHUTPOWN_4 YES_NO YES11) 09:26:04 'k4 PRAKN GIM 4PM_BKR CLOSEL-.=-....._~ --==----==;.__ ~ ....... .--.- ''',~-_''''f.'''''''''''_
Table 4 Hydro unit state challge messages
The messages are generated on the assumption that the control staff can spot a potentialproblem with the unit in question, and react to it by noticing when a specific messagedoes NOT appear. these messages do not appear nec.;tly as a group but areinterspersed with other messages.
if there is a problem in the network these same 11 messages (and more. depending onthe number of units in use) get in the way of more Important messages. The control staffdo not need these hydro Imlt data messages, wh10h are not related to a disturbance andthey become extremely annoyed, since these messages do not assist them at all. As aresult they are ignored and deleted out of hand,Puring a disturbance these messages just clutter the alarm page and in the process ofbeing deleted, useful valid messages can also be mistakenly deleted,
6 July. 1996 17

4.5 The Fire Hose SyndromeCurrently, working ilt'J contrcl roornls eq'JivalenHo tying the control room operator to agarden ohair and djrecting 'a jet of water at him~~wjth.1hejet of wat~r representing tpe rateOf alarm data. See Figure 4-1, Thtquantity and freqJJencyof the alarm data changeswith the state of the power system and matches ttle qua~jt~' and pressure of the watE;lr,frool the hose pipe. When a disturbance occurs the nose pipe is replaced by a fire hose.(The quantity and type of alarms being reported inorea~es significantly.) Remember, thecontrol room operat",,, Is unable to get out <Jf the garden ohair or avoid the water.
DisturbedQUiesecent
Figure 4~1 The fire hose analogy
DlJring a disturbance the control staff have two basic problems;1.· They can never stop alarm messages being generated.2. AUalarms have to be aoknowledqed before they can be deleted otherwise the alarm
buffers ovelf)ow causing messages, some new and necessary, to be lost and potentialcomputer system problems.
This situation is exacerbated when the control staff know what caused the condition, butthey are unable to tell the computerthey know. This is demonstrated in Appendix 1,which lists part of the first 3 minutes of alarm messages from a minor disturbance in theESKOM in~eroonnected network during April 1994.
The disturbance was eaused by the opening of an energised busbar isolator (JirIk)inerror. The protection schemes at Tutuka power station deteoted this as ,afault on thebusbars amftrippeg all 5 generator breakers with consequentlal 105$ of 1750 Megawatt.sof generation. This minor event generated 433 alarms in 10 minutes, with 79 in the first30 seconds as indicated in Figure 4-2.
~-:I '! 60 .....
j§ 50.l 40
! 30§ 20;i 10
o .·~;::::;!-~-··+---I---f-·-I-··--f--+--~I.,,·""+---+--+---1---11---115:27 16:2915;25 1$:31
'rilM In one minute Intervals •••>
& July. 1996 18

4.5 The Fire Hose Syndrome,"
currently. working in a control room is equivalent to tying the control room operator to ao~rden chair 1,inddirecting a jet of water at him, with the jet of water representing the ratecit'alarm data. See Figure 4·1. The quantity and frequency ofthe alarm da~a change~with the state ~tJh~power system and matches the quantity and pressure of the waterfrom the hose,:pipe, When a disturbance oC9urs the hose pipe is replaced by a fire hose.(The quantity and type of alarms being reported lncreases significantLy.) Remember, thecontrol room operator is unable to get out of the garden chair ora\lOid the water.
DIsturbedQule$ec~nt
Figure 4·1 The fire nose analogy\-;
During a disturbance the control staff have two basic problems;1. They can never stop alarm messages being generated.2. All alarms have to be acknowledged before they can be deleted otherwise the alarm
I:;buffers overflow causing messages) some new and necessary, to be lost and pOtentialcomputer system J~roblems.
This situatioJ'}.,is exacerbated wh~n the nontrol staff know what'oau~ed the oondition, butthey are unable to tell the computer they know.. Thi,~.,is demonstrated in Appendix 1,which lists part of the first 3 minutes of alarm mes~ipges from a minor dlsturbanpe in theESKOM interconnected network during April 1994.
The disturbance Was caused by the opening of an energised busbar isolator (link) inerror. The protection schemes at 'futuka power station detected this as a fault on thebusbars and tripped all 5generator tlreakers with conseqnenna! loss of, 1750 MegawattS,of generation. This' minot event generated 433 alarms ln "0 mlnl.-ltes, with 7Q in the first30 seconds as indicated in Figure 4-2. .
-------~,,----so70
01 60~~ 50..11 40Gl
'B 30~ 20.!! 10c(
0
Time In ena mlnut~ Int~rvals .,..>
Figure 4..2 Alarm rate following a minor disturba.'icqJ:
18

4.6 Summary
The resetting sustained low frequenoy caused automatic load sheddil1~ to take placewhich returned the system frequency to. flannal some four minutes later as indicatedFigure 4~~.
r-::'"t"'f"-_-.,'r-: _-_-_-rr_-··_-_-1"1'"1_-_-'4_:-...-_-..."r'+-_-_-,r"'I_-_-_-r~-~---1,...1-----.....,rr--.-_-_,.-}-_-_-'_1""'":_- ........_
I ~ 49.00 __ ~- .. _:- •. _~._- •.:---+ __...{---~--~--.:..I __ I,i 49040 • ~ - - - :-. - - i..--:--..+ - - -: .. - - t- - -1- - f-..- i-..-:--..~ 49.20 - l---;--···i---:---+·-··: ...--L :---f---i---:---! 49.00 - -," - -:- - -, - I - T .. - y --~- -1- -- r - - i---:---~ 48.a.o. --i---:---i---:---+·---i- ..-t·--i---:~- 1---:---(/) 48.60 ..... 1 1__ .. .1 .... _1_ .. _ J. , ~. _1 L .. _ J .. _ .. ,-.__ J __ ~'- _ ..
I I I I I I , 1 I I I~.40+_ ~~---~~ ~---+_ ~-_4 __~---~ +_ __ ~~
23:28 2'$:44 24:00 ~4:16 24:32 24:48 25:04 25:20 26:37 25:62 26:06 26:24.i2'S:40't~lTIeIn 16 second IntervallS
startl1l9 at 151-123:28L ..._. . ----,~ _
Figul"~4..3 Power;;ystem frequency response
comparing figures 4·2 and 4~3 poe can see hOw the alarm rate ohanges as the frequencyohanqes, The time intervals on the two graphs are not Identical but at the start of thq faurtat 1S:2$, the alarm rate is at ,its highest, with messages stili coming It aft~r the frequ,en¢yhas returned to nOlmaI15:27. Examining the messages In Appendix 1, illustrates howmany duplicated messages are generated. If this number can be reducedwithout the lOSSof critical information, a major step would have be1Jntaken in reduoing Jha'data oVerloadproblem.
Currently no structures exist to prevent unnecessary message generation. The designersof SCADA systems do'not 1'6co.gnisethat different network conditions require differentalarm handling and display tools, As a consequence the control staff suffer from theuncontrolled generation ,nf alarm messages when more than a handful of electricaldew1:es ohanqe state at the same time.
It can therefore be argued tMt the necessity for the current alarm message phil6sophy isprimarily due to poor Man Mat'~ine 'nterface ft.mctlonality. If better ways can be found ofindicnting the current state, then alarm text messages can be removed I..~ a .vlewsupported by ABB. [15].
i,/
A possible alternative to alarm messages is disoussed In chapter 6, but before that, It isimportant to review the literature on the subject on Man Machine Interfaoes used inpower system control.
19

s,EVALUATION OF MMI LITERATURE
5.1 ~ntroduttionThis chapter examines the literature relating to alarm data presentation and \.t;tefactors.affectingthe design of the Mar. Machine Interface used by control staff of Elet..'tc'icPowerSystems. ,-
The available literaturs on Alarm Processing, Data Visualisation and MMI developmentswa~'Ianslyserl. The primary focus was on articles related to Expert Systems and Humancomputer Interaction connected with power system control.
5.2 GeneralmmosophyPapers covering the phHosophy used in the monitoring and control of electrical pc)Vernetworks since 1976 were stutiied. An overall impression is that there has been n6 realchange irl thinking with respect to the presentation or processing of alarm data for control$t\~ffby millnagement or vendors. The methods pf data presentation used today are stillth(~same as those defined in the proposals laid down in the EPRI report on HumanFa~';torsReview of Electric Power control Cent! ss [1] in 1981. Max Fax8r said the samethili(:l in 1f,l85[81in the section called the "Too-much too-Quick syndrome" on page 139of hls paper.
5.2.1 EPRIT~e initial detil'litive reference work on the entire subject of alarm processing wascci~llpiledby thl~American based Electric Power Research Institute (EPRI) in 1981. Thereport [1] is in six volumes, three detailed and three management summaries, covering aUaspects of SCAl')A system implementation and practices for Electric Power Systems.
The EPRI report £11.pg. 2-108ldenUfied the problems assootated with alarm processingin electriCal utilities as being :
• Inconsistent significance• Recurring alarms• AI~irmoverload during a disturbance• Alal'm threshold too sensitive• Lact\ of alarms on key parameters• Too many alarms• Need for more detail from substations• Alarm display problems with paging• Bottom lme changes too fast
From interviews conducted with ESKOM's control staff, three other SCADA users inESKOM and the Johannesburg Municipality, it would seem that these problems are thesame now as they were in 1981. These findings are supported by papers published up toand including 1a95. The problems Identified in the EPRI report have been the startingpoint for many of the papers covered in this review and Indicate that many people havetried to solve the data overload problem since 1981, with little success,
One of the papers in the EPRI journal [181(DEC 1994) comments on the use of star plotsand Kiviat diagrams to facilitate the visualisation of power system varia'"' 'So The biggestproblem with this idea Is that currently the vendors of full graphic software tools do notseem able to offer the. recommended features to the utilities.
EPRI [18] is currently sponsoring projects to develop advanced Visualisation methodsthat can shorten the time needed bv power system operators to perform functions suchas system restoration.
5 Juty, 1996

6..2.2 \";IGRE
5.2.3 COC
GJl.!ly.191)1i
At.the CJGRE Conference in Japan in 1987 is], Van Son at al. acknowledged the problemin the growth of alarm data arriving at control centres reaching.upwards of 3000 alarmsper minute dudng a disturbance. The paper identified 3D graphic tools as a possiblesolution for displaying some of the data. It does n.01offer any alternative ideas to thefundamental question of how alarm data should be processed or presented to the controlstaff.
In a similar report [91 on the HydrO"Quebec power system the number of alarm messages'~enerated during .adisturbance ranges from 20 to 75 alarms per second. It is surpri&ingtlJat the number of alarm messages generated by a SCADA system can be allowed tor~?ch such high numbers, without anyone stopping to examine what the basic problem is
. in~~efirst place.
The ~)aperby the staff of the Control Data Corporation ['12) (1989) called IIControllingpowe\r Systems Ouring Emergencies; The role of Expert Systems" explains the dataoverlO\~dproblem very well. The authors acknowledge that the primary problems faced byoontrol;~taff aod hence by expert systems are:
\
" som~ alarm messages do not contain enough information... som~, alarm messages contain too much information• som~\alarms are needlessly repeated• Ml.lltipi~ messages are generated for the same condition.. The nw"nber of alarms is SOmetimes overwhelming
Appendix 1 has examples of these problems from the ESKOM network.
CDC highlight the bsstc requirements of system control during disturbances as being:• 1<~6j) the operator aware of the most urgent matters.e Keep the operator aware of problems as they occur.• Reduce alarm loading and present strategic situations.• Provide the abllity to perform deeper analysis.
The proposed CDC solution to solve the data overload problem is the installation of anintelligent Alarm ProcessQr or :AP. The lAP takes the incoming alarm messages, filtersthem and then divides them into four categories:1. Those that need to be displayed immediately2. Those that can be permanently Ignored3. Those that carl be temporarily ignored4. ThOse thf\f need deeper analysis.
An expert system is not neec;!edto dynamically filtel' alarms into four categories. Initialanalysis of the alarm data shows that alarms belong permanently to one of the fourgroups. Assigning the different category to each element at data base generation time,allows each alarm element to be sorted ar. it arrives. By pro\tiding the control staff withfour pre-defined alarm categories, one for each group, that can be called up on demandremoves the need for lAP. As for the messages that can be permaf.~ntly Ignored why notleave them at RTU or leave them undisplayed and access them when required?
Ouring a disturbance it is the repetition of known states that causes the data overloadingas indicated by examining Appendix 1. An lAP does offer some relief by preventingduplication of similar messages but the medium of communication between the RTU andthe control staff is still via alarm text messages and the potential power of the full graphicMMI hardware is neither considered nor addressed.
21

5..2.4 Dept. Of Electrical Engineering, W8shin.gton University
The paper "Envisioning Power System Data" published in 19~13Ie] by the staff of thedepartment of Electrical Engineering of Washington University discusses the use of fullgraphic facilities to understand power systems. They make the comment,
liThe easier iUs to obtain insight from a computational tool, the more useful the tool," andacknowledge that "power system data does not consist of high levels (It abstraction of thetype. that people use in the mental problem~solving process. Instead the data consistsalmost exolusively of numbers".
This is the only paper that mentions mental models and data visualisation with respect topower system control but they do not pursue the relationship between the physical modeland the data model and seem to be locked into the display of the lowest leve! of thesource data. They use full graphics for display of load flow data but ignore device statedata.
their comment fhalpower system data" ...consists almost exclusively of numbers" ispatently false. All electrical devices have numerical components, but the ratio of binarystatesJo numbers is nearly 20 to 1. Also, it is the attributes of the numerical data thatindicate the serlousness o.f the value, not the value itself. If the attributes. are not used toindicate the limit positions of the value, the memory demands on the control staff to keeptrack of all values would be completely unreasonable, For each value, there are at least 4to 10 attrib\.lte flags that the computational tools can use to set the context of the valueboth locally and remotely. When the values and the device status flags are cornblned,greater use can be made of full graphics to match the abstraction ievel currently used bythe control staff, during the problem solution phase of a disturbance.
The paper provides ideas to display SCADA numerical values using dynamic full graphicobjects but points out that the existing methods of displaying numeric data are inefficient.
The authors touch on a number of valid aspects with regard to the presentation andvisualisation of power system data, highlighting the need to find an alternative method ofdisplaying data. They champion the benefits of human pattern recognition skills to solvethe problem of numerical data display but do not offer any ideas on the presentation ofalarm data. This paper is not a very satisfactory report on the USe of full graphics.
5.2.5 IEEEA similar paper on "Modem User Interfaces" (Jan 1994) [14] refers to the 1981 IEEEtutorial on the Fundamentals of Supervisory ContrQI systems [4], which emphasises thelack of new thought on the practical (not theorettcal) aspects of displaying powers systemdata to meet the thinking needs of the control staff. The paper commends the use of fuilgraphic workstations using the functions of Motif and X~Windows to display power systemdata in an enhanced manner compared with the past. They do not consider the use fullgraphics for alarm data presentation, which is the prime reason why the control centrewas created in the first place.
6.2.6 HelanderIn Chapters 1 through 8 of his "Handbook ofHuman-Cotnputor Interaction" [7], Helandertakes an in depth look at all aspects of the MMI. He points the way to an alternativemethod of modelling data using Metaphors and Icons. The question is raised about themental models used by Control Staff and others lnvolved in Human computer interaction,among many other aspects of the MMI. There are a lot of good ideas but unfortunately hedoes not deal with alarm processing per se,
5 July, 1995 22

5.3 Expert SystemsA great deal of theoretical work has been done on the potential benefits of irrlplementingExpert Systems to assist With the processing of "alarm messages". These specific expertsystems are referred to as Intelligent Alarm Processors or lAPs. This type of expertsystem has been proposed t\~ra number of years [11 and 12] as the solution to the dataov~rtoad proble!tl. There appt.iar to be only three documented Intelligent AlarmProcessing systeme in operation in the Electric PowEll'lndustry Which are those of EDF(Of .France) [10], Portllgal [171 and Hydro-Quebec (of Canada) [9]. These systems arediscussed below.
5.3.1 EDFThe French electricity supply utility. EDF. uses an expert system called ALOUETTE in anattemotto shield the control staff from data overloading. The objective oft!1eit ExpertSystem is "to solve the problem caused by the massive arrival of alarms related to faultsoccurring in the power system".
However the EOP expert system has to wait 30 seconds to allow all alarms to be groupedinto a coherent *hole before ded;'otive processing can begin. The inference engineprocesses the "facts" using a rule base and provides the diagnosis of the problem via an"idealll list of alarm text messages. Control staff however are not prepared to wait 30seconds before they do anything. The need to take corrective action during thedisturbance is of absolute importance and can not be delayed due to expert sys~em·5equirements.
5.3.2 Portugu~$eThe Portuguese SPARSS Intelligent Alarm Processor is expected to produce anexplanation of a serious incident within 5 minutes of the disturbance starting. The inputdata to SPARSE is SCADA alarm messages with the objective of converting the flood ofmessages into a Simple explanation of what happened. From the paper, it appears thatthey have succeeded, but the time delay before the explanation is available is notpractical.
5.3.3 Hydro-Quebec
Tila LANGAGS expert system has been used by Hydro~Quebec since 1992. It is analarm diagnosis package attached to the main computer system and uses the sameSCADA alarm te>..1data that is sent to the control staff. LANGAGE does not reduce thenumber of alarm rnessaqes but does attempt to provide explanations based on them. Theexplanations are available to the control staff on the same screen as the incoming alarmmessages are displayed on.
One of the justifications used by Hydro~Quebec to install LANGAGS is the prevention ofdamage caused by the inadvertent re~energising of faulted transformers. A differentprotection scheme at the transformer, requiring manual intervention before a transformercan be energised, would be more appropriate. The authors also note that messages getlost during a disturbance. A possible solution is to create alarm categories based ondevice type rather than on a station basis. This will allOWall transformer messaqes to becollected in one alarm bin rather than have them split among all the stations.
5.3.4 strathclyde UniversityStaff at the Strathclyde University in Glasgow in 1992 [15] published an article on thepotential of Expert systems to solve the data overload problem using the APEX (AlarmProcessing Expert system) and RESPONDO (Rule. based Expert system for PowerNetwork Disturbance Diagnosis) programs.
In their opinion" the Expert System acts as buffer between the control system and theoperator, which digests the vast quantities of SCADA data and supports control staff intheir analysis of the system disturbance". The Strathclyde staff suggest that the CPU
6 July, 1996 23

power at the ijTU is used to perform local diagnosis on the output of the protection, thenuse the indioations fa "influence tAe transmission of alarm messages from thesubstationll• This solution ihey indicate would "tackle the problem ofvoiumirlou5 data atthe alarm generation side." The examples given in the paper are relatooto low voltagesystems where disturbance activity is restricted to small local networks. The ideas offereddo not appear to have been tested in interconnected systems with voltages above 275f<Vwhich cause far more messages to be generated than at low voltages.
The most signiticant comment made by the Strathclyde staff is to acknowledgeavaifability of th.e unused CPU power of the SUbstation computers. which, to date no otherauthor has done.
',~$:~Q)marYof Expert SystemsThe most significantaspect of all the Expert System proposals (Portuguese, EDF, Hydro-Quebec and Strathclyde) is the retention of alarm text messages from SCADA, as theinput to their expert systems. They neitber examine nor question the basic reason for theinstallation oUhe Expert Syst~1l1in the first place, which initially is to reduce the quantityof alarm text data delivered to 'fhe control staff,
By ohanging the type ornata. the point of measurement and making more Intelligent USeof text deSCriptions to convey information to the control staff. the need for a centralisedexpert system at the host computer to filter alarm data can be reconsidered.
Rule-based expert systems can provide some asslstanee to the control staff in limiteddomains. However the number of rules needed to:. cover all possible scenarios in a largepower system Is so large, that it would be impossible to make an expert system costeffective in a growing environment.
However, local expert systems situated at the RTU which deliver explanations ofelectrical protection operations are possible and form part of the RTU secretary mDdeactivity recommended in chapter 8 of this report.
it should be remembered that, coupled to the alarm text data is the need for an efficientmethod of presentation that facilitates the rapid visualisation of'the information, which isan essential requirement during a disturbance. At no siage. in any of the papers onexpert systems, is this addressed. The installation of a centralised expert system toprocess. alarm messages is not the answer to the data overload problem. They do have arole to play at the R'TU where they can be used for many applications including alarmprocessing. However, the output would be a text message built up by the Expert Systemand sent directly to the control staff via the RTU. This is discussed in more detail jf)chapter 8.
6.4 Full GraphicsSince full graphic displays are very recent innovations in control rooms, there has notbeen much experience with them nor with 'their limitations. ABS. [is] have noted theproblems associated with using full graphic hardware and identify the primary MMlneedof the control staff as being" ...to show the operator the precise information r£quired atany particular time - and no more."
The question of what the operator actually needs during his daily work routine is thenasked. The answer is not provided, but the ABe authors define the two major aspects ofMMI deSign as being "Information selection" and "display form".
The authors recommend solutions based on the arrangement of "windows'.' at theworkstation and the use of "fish-eye" graphics to allow greater visibility of specific networkitems.
They also recommend the expedient use of expert systems and appropriate and clearsummary information derived from the large volume of data arriving. This
5.July, 11196

, 5.5 Summary
5 July, 1~196
recommendation is qlX9st.ionable in ligt:lt ofiha Qttantities of data ..g~\lal:1rat~d'duril1g adisturbance and indicates that the atl~hor$have little knowledge of what the. installation ofan expert system entails.
-err" :i1'..~ar poses the question ofUWhat ought to be displayed and what is the. optimumoutput in terms of hurpon engineering?". The authors do not provide conc~ete solutionsbut do provide guidelines for display ·staff to keep in mind when designing displayS.
The staff at EDF R&D diVision [111 noted that future higher performance computers andVisual displays would allow " ...a better MMt, wen adapted tMha needs of the ope!1ators,net only in lhe normal but al~'O in the emergency state and for restoration", This is theonly inslance noted which recognised that the MMII1as to cater for different operatingstates,
From a review of tha.literatureJt is apparent that a lot of research andwork has bermdone in an attempt to improve the working environment of Control Staff by:;"a) Reduoing data overloadingb) Using full graphic facilities andc) Recommending the use Qf expert systems to provide summa~ information
\',
However. it seems that the current designs of $CADA systems are b~ed on the premisethat the'power system is quiescent. Nearly every paper complains aboutthe dataoverload problem but the a.ffort to solve the problem is concentrated at the receiving end,flow control at the source is the cfj.lcial requirement to solve the data overload problem. .
In general there does not appear to have been any cnange in the theory or practice in th:~presentation of alarm data for use by.Contra. Staff (or as input to an Expert System)since the initial design guidelines formlllated in the 1961 EPRI,report 1112.S}.
Solutions have been deSigned and implemented in an attempt 10 filter the data or bufferthe user from the. results. No attempt has been madSc!~ ex~mine the root causa of tliledata overload problem nor what effect the state of the power system has on the operatingneeds of the Control Stefl.
Three expert systems. have beeWdesigned.and built in an attempt to help the control staffto understan? alarm messages, but there is no general move. by the industry to embracethem becaU!i{e of the limitations imposed by retaining the old philosophy of using textmessages.
211

e,POSSIBLE SOLUTION TO THE DATA.OVERLOAD PROBLEM
6.1 IntroductionThis chapter proposes an alternative appro;.lCOtothe data overload problem and definesthe structures on which the new Philosophy is built.
6.2 Disturbed stateHistOrically the MMI and ALARM systems were designed on the assumption thaHhepower network is quiescent 99% of the time with limited facilities for disturbed stateconditions. In fact, the facilities for disturbed state operation are the same as those forquiescent operation, the size of the alarm buffers being the only concession provided fordisturbance conditiOns. Alarm messages. are generated for each and every noncommanded state change in the network and whenever an analog exceeds a limit orreturns to normal, The alarm messages are used as the primary method of notifying thecontrol staff of network element state changes. Therefore the root cause of the dataoverloading is the uncontrolled delivery of alarm text messages and the lack of ~.: 'Yalternative means of networl{ notification.
Any solution to the data overloading problem has to be based on the reduction of alarmmessages delivered to the control staff, but without the Joss of critical infOJTTlJ:lfiontoenable them to do their job efficiently. The solution parameters for the reduction of dataoverloading can be defined in terms of a design brief.
6.3 Design Brief"Communicate the current and potential state of the electrical power network to ti:\econtrol staff as fast as pOSSible and in such a manner that they are able to appreolate theproblems and potential problems without the need for repeated or unnecessary alarm textmessages".
The solution assumes two distinct behaviour states of the power system, disturbed andquiescent, and that the SCADA, ALARM and MMI modules of the computer system canbe changed to support these two different modes of operation. The solution is designedto solve a disturbed state data overload condition first, with quiescent operation toolsadded once the disturbed state foundation is in place.
6.4 &~Iution MechanicsIn chapter 2, the mental and concept models used by the control staff were defined as apyramid as per t=igure 6~1 A and B. Wrttt respect to this pyramid structure, itwas foundthat 99% of the alarm messagesmakino liP the data overload problem are produced fromchanges that take place at the element :avel.
New Focus
ExistingFocus
A B
Figure 6-1 Existing and new focus levels
s July, 1995 26

Re~examjning the control staff beha'Vioul'and their mental models, it was found that they\>, are foclIsed at element level and had to use element data to determine the overall state,_,/the device when c .in effect, they needed to be focused at the device level, with theaoi!ity to examine a. specific element when required. See Figure 6~1 A and B.
The same ~naly$i$ revealed that a de"ice can have a number of different states,depending upon the operauonal mode and str*e of the power network. Examining thtaelements belonging to each device revealed that the division into the threecategoriesmatohed the. initial mental models of the possible network activities referred to in the taskanalysis. see Appendix: 3. A further division of the elements into four categories provideda Petter structure on which to hang the device state abnormalities.
6.5 ProJ!JQ$edsolutionThe proposed ~s9lution is:
1. Mov~He control staff fodtlSfrom the element level up to the device level as in Figuree~1JY;
?~\t(de ail element data for evel'V\deViCein Appendix 2 into four categories called- Health. Protection Main, ProtecOw'1 Backup and Information3. Count the number of abnormal el~~ments, for each of the four categories and store the
result at the device level. \\4. Indicate the existence of abnormal\\~lements in a category, using icons next to the
device on the one-line display, \\5. Notify the parent level otthe eXistenc1ilof abnormal states in the current level, as per
the data pyramid. . ..6. Allolill the control staff to. traverse the datt~~yramid and filter and suppress data
dynamically, to suit their requirements. . .7. Limit te;xt alarms to Breaker trips, Susbar and Transformer protection messages only,
The next few paragraphs expand on these topics and provide examples of their, Implementation.
6.6 CategoriesThe elements belonging to a device are divided into four categories as indicated in Table5. The informatioll in Table 5 is taken from page 9 & 10 ofthe Telecontrol standard InAppertdix 2 ..Each element state change causes the category counter to be updated onthe parent device, There is a separate counter for each category along with space tostore the tilTle at which the last element became SET and RESET. This require changesto the data base structure,
Health Main Protection Backup Protection InformatiohPole discrepancy M2 protection trip Breaker state
..SF6 - Urgent ~n/olosed)SF6 - Non urgent Bus zone M2 HV lnst, 0/0 Break~rChar~~d "-Main 1 DC fail Bus strip M2 HV backup o/c Breaker control - toea:Main 2 DC fail M1 prote~tion trip M2 HV ElF operated Supervisory Control - On/OffControl DC fail M1 HV Inst. ole M2 MV Inst. 'J/e Main 1 protection onloffClose DC fail M1 HV backup ole M2 MV backup ole Main 2 protection on/offSpring reWind fail M1 HV ElF operated M2 MV ElF operated MW jitterIsolator DC fail M1 MV Inst. ole M2 Tertiary lnst, 0/0 MV jitterI\C/DC conv, rail M1 MV backup olc M2 Tertiary IDMT 0/0 KV jitterMVA 70 deg. Limit M1 MV ElF operated Neutral Earthing comp, Hz jitter
~lVA 90 deg. Limit M1 Tertiary lnst, ole Neutral Earthing React. ERTU MessageKV limit M1 Tertiary IDMT ole
Table 5 Transformer elements divided into categories
The bottom of Figure 6-3 B indicates the logic::ti arrangement needed to track thechanges in the elements.
GJl.lly, ·19S>!i 27

6.6.1 MMIindicatioo of abnormal element statesAs the focus is moved to the device I~vel the oontrot staff have to be notified of theexictenoe of abnormal elements related to;the deVice. This is achieved by assigning,.different coloured icons to each category tillat become visible the mOment there is apOSitive abnormal count in the categ(j!ry fie'ld. This topic is discussed in more detsillateron.
6.7 Abnormal countsThe abnormal counts are not limited to the device level but are propagated right up to thetop of the data pyramid. See Figure 6-2. each level has a set of category counters andtime stamp fields. The counts at each level. reflect the number of abnormal states in Utelevel below. not the summated count of all the elements owned by the level. The stationlevel counters indicate how many electrical objec..'tshave abnormal states, the electricalobject counters indicate how many devices have categories with abnormal counts. <
n Substations_...
hElectricalobjects ...._...
..,.if- ~:¥:" ......,.~~~1•.~u.Hbe~.:tlon c.ounts;;:: ,"" etc, n Main Prot./ etc. n Ba.:kup Prot.
etc. n Information
StationState____"it Object counts
:::"'c --=-....... n Healtl',-'" r etc. . n Main Prot./ etc . - n Back'Jp Prot.
etc: n Information
ObjectSta'e-:-, Device counts
:::;::'~~~ nHealth. ~r; ~ '. n Main Prot.
f .;etc. n Backup Prot.etc. . n Information.1 Devices_..,..
1f'"~ ElementState counts
__ - - ~ n Health.- .- 1- n Main Prot..--.c n Backup Prot.
.... " n Information 11"~ Four /'
Cat~gories
'--~Element data by category
Device Elementstate counts..--i hH •• 11h_. - _.,.. oM'.in Prot.-..... n Backup Prot .
.... ' n Information·
'----......--JElement da I:a by catego~'Y
L...... ---,._ ........ --- -___.".~ __ ---'- -_-l
Figure 6-'-\ Graphical model of th~ proposed data stn~(:ture
II July, 1996 28

6.8 Text af'8fltn·messagesAs 1tl,~liItlonedin Chapter 1, ollrrently, every time an element changes state; it causes analarm text message to be created and delivered. Control staff stili need 10 be notified byteXfi message an(!i audible tOA.S of the existence of specific devi0Eilstate changes thate1f~~the state of the: netwCtrk, but not each and every minnr element ohange.
=;
'rae .praposed solution limits the automatic production of text alarm messages to justt1'U-eetypes ;1. All breaker trips2. All l3\Jsbar zone protectlc'., operations,a. All fransformer protection operations
This subset of alarm messages represent the trigger that wams the control staff ofpoteAtlally serious network problems and draws their attention to the site in question, All'1ther a;t\rm abnormal G"ates are indioated by the category loona next to the relevantdGvice at the devloe level. Since the existence of abnormal st~: as is provided at esohlevel Qt the data pyramid, the control staff are able to see whe "G they have problems andIn Which category. This allows them to selectively e)'.amlne the problem. when timepermits, knowing that they will be warned audibly if 'there are any disturbance relatedmessages.
Restricting the text messages requiring manuat acknowledgement and deletionrepresents a major reduction In the potential data overloading during a disturbancewithOut the loss of ability to get information when required
Lists of alarm actions are still vitally Important and they can be produced on demand viathe MMI secretary mode tools on the workstation, Control sta·ff have the ability to filier thealarm lists to suit their needs depending upon the network activity and the demands frommanagement. This faollity puts them in control of tile data they need when they need it.
>(6.9 Qata~tructurechangesIn the existing hierarchical data base a pseudc-rnodel of the network is supported asindjcated in Figure 6·3 A. However provlslcn is only made for element data modelling.IThe changes needed to support neW philosophy are indicated in Figure 6-3 13which\ matches the pyramid data structure mentioned In Figure 6..1. The entire tree structure l,'\)defined In Figure 6-2. Note how the abnormal counts are accumulated at each level.
I Slation record _.,.. Sialkln
Parent dllvic;e record \lithno overall dovlce stalQ
A • Cla$$lc~IItQ$t data baso structure
!;tamonts records ...
Elam~mt$ divided and groupedInlo Dna of foUf categories ....-- 1·Eleroo.nt
Analog
controlete,
Region Regionstateand countrl;lcortls ..... of ebnQmlal slatklns
Slatton slale elld count ofStl;ltlon record _..,.. Ilbnormal ellwtrldll obJ®ts
Electrical obJ$ct IllataElectrical obJecl record -...... and abnormal dOl/ice counl$
Pllront dllvlc;e record \lith ,___- .....dQvlce lIIal& and cat!lilory counts
Figur*il e-a Co ""'uarison of the ~las$ical and proposed data structures
6 July, 11)$I1S 29

6.10 Communicatioo··(tyclesTo support the MO modespf,:'oetwork bahaviour (di~turbed and quiescent) and to allowthe focus of atten~ion to be moved to the device Ie-vel. requires changes In the dataacquisition philosophy as well. The changes amount to creating two different dataacquiSition cyoles called ctasst and Clsss2 •.where Ctass1 is used to acquire device levAIand category count data, and Class .2 is. used to fetch and deliver element data, Class 1data messages not only deliver device level data but inciude the device category countsand associated time stamps as Indicated in Figure 6-4.
Figure 6-4 Model of the two t:ycle data acquisition mode
Keeping in mind the disturbed state design philosophy. the category counts in Class 1messages are used in two ways, one to advise the data acquisition software to solicit theassoclated category data and secondly by the MMI to indicate the exlstenoe ofabnomlalelements by category on the displays. These two aspects are dlsoussed in more detail inthe next two sections. . "
6.10.1 Communication network loading
Dividing the data acquisition into two modes, allows the urgently needed Class 1 devicestate data to be delivered to the control staff without the communlcationsi1etw~rk beingslowed down by the clutter of Class 2 element data until actually required. Changes in thecategory counts sent as part of the Class 1 device iaval dnto are used by the front enddata acqulsltton software at the h~-)t to request the delivery of all the element data for-thedevice.
The changed elements are not transferred on their own, the entire category set is sent asa Class 2 single packet Since the overhead to send a single packet is the same as it is tosend an entire category. There are also maintenance reasons why category data shouldbe transferred as a whole. This is discussed in more detail In sectlon 6.15
An example of the two DAQ cyoles is shown In Figure 6·4.
Using two different DAQ oycles. eYfectively delays the delivery of element state changesto the host. but as the ERTU stores beth set and reset times for each element, there isno need to move the element data to the host immediately. The element change timestamping is carried out at the er:tTU. not at the host. Class 2 element data remains .at theERTU until requested by the nost, The host uses the category count changes in theClass 1 message to post Class 2 requests.
I'i July, 'l996 30

The host issues Class 2 requests whenever there are no more Class 1 changes, orwhencontrol staff specifically request the Class 2 categor.y set. There will of cour~e be a shorttime delay following a demanded request for a category set. but this delay is acceptableas dlsturbance Class 1 device state Information is not hald up by quiescent systemneeds. Class 2 data. is transferred almost immediately if there are no outstanding Class 1messages.
6.11 MMllconsThe second use of the category counts is to indicate the existence of abnormal elements.The MMI uses the positive catego~y counts to display coloured icons next to the deviceas Indicated in Figure 6-5. The existence of one or more category icons notifies thecontrol staff of~~e existence of one or more elements in the abnormal state. Device andelement leveH:;aiegory data is then displayed on demand by selecting either the categoryicon or selecting the device which will bring up all the elements divided by category,
During a disturbance when there would be a large number of icons on display, the controlstaff make use of the secretary mode tools to filter and suppress the icons on the one-line displa,s to suit thair needs. Sincl;! the existence of abnormal states is known at eachlevel of the daia pyramid, Control staff do not have to examine each station to see whatdevices have abnormal states. The ability exists to create selected lists of elements in theabnormal state. The secretary mode actioflS are explained fully in Chapter 8.
Popup windowshowing elementsdivided by categorr~6
Figure 6M5 Category iCOhs and as,~ociate.Jpopup windowAn element In the apl10rmal state is lnoicated by the backgroUnd text defining theelement beill9 invected. This is'indicated in the element called "Main 1 DC faU" in HealthcategooJ shbwn In Figure ~~5. Once the element state is acknowledged the uackgroundcolour will slowly become grey. They ql.lanUt'Jof grey is a function of the time since theelement was acknowledged. This match the Icon duration next to the device.
Ii July, 1996 31
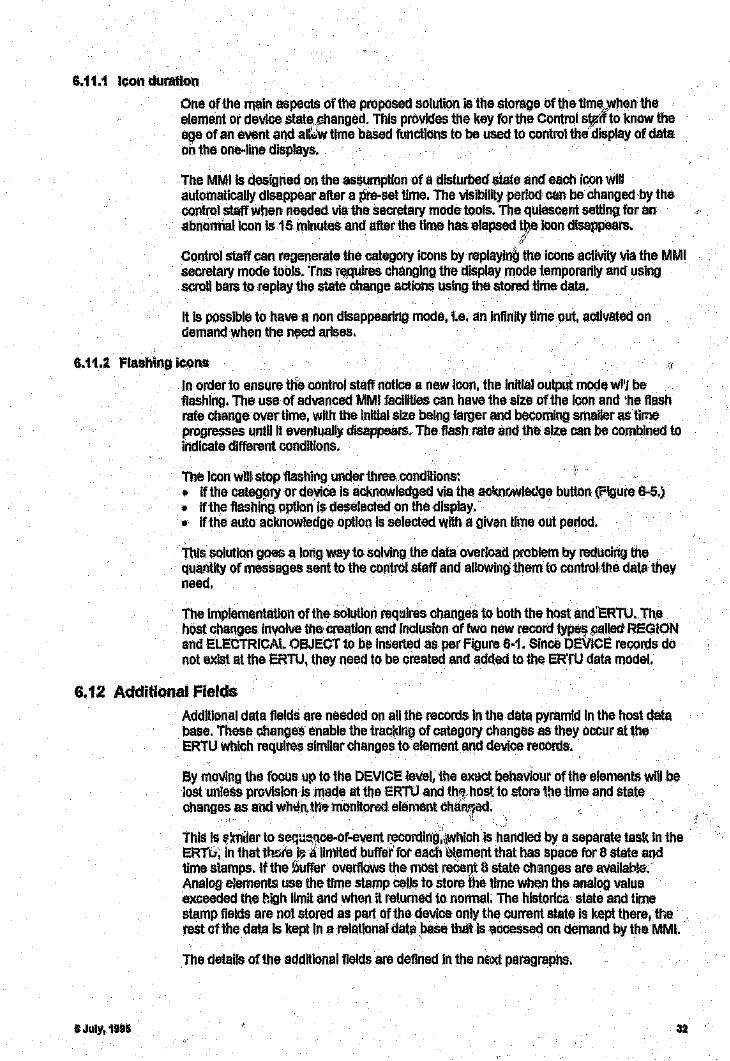
6.11.1 ICOll duration
One oHM main aspects of the proposed solution is the storage of the tima_lNhen theelement or device state Dhanged. This provides the key for the Control s\~if to know theage of an event and al(;Jw time based functions to be used to control the display of dataon the one-line displays.
The MMI is designed on the assumption of a disturbed state and each icon willautomatically disappear after a pre-set time. The visibility period can be changed by thecontrol staff when needed via the secretary mode tools. The quiescent setting for anabnormal icon Is 15 minutes and after the time has elapsed t~,e icon disappears.
,(
Control staff can regenerate the category icons by replaying the icons activity via the MMIsecretary mode tools. TnJS r~,quires Changing the display mode temporarily and usingscroll bars to replay the state change actions using the stored time data. .
It is possible to have a non disappearing mode, i.e, an infinity time out, activated ondemand when the need arises.
6.11.2. flashing leans
In order to ensure the control staff notice a new icon, the initial output mode wi'J beflashing. The use of advanced MMI facilities can have the slze of the icon and 'he flashrate change over time, with the initial Size being larger and becoming smaller as timeprogresses until it eventually disappears. The flash rate and the size can be combined toindicate different conditions.
The Icon will stop flashing underthree ..conditions:• if the categ~)I'y or device is acknowledged via the ackn(;wleclge button (Figure 8-5.)It if the tlashing option is deselected on the display.e if the auto acknOWledge option Is selected with a givan tlme out period.
This solution goes a lorig way to solving the data overload problem by reducing thequantity of messages sent to the control staff and allowing them to controlthe data theyneed.
The implementation otthe solution requires changes to both the host and'ERTU.ThehOst changes involve the; creation and inclusion of two new record type9 9sUed REGIONand ELECTRICAl_ OBJEOT to be inserted as per Figure 6~1. Since DEVICE records donot exist at the ERTU, they need to be created and added to the ER'fU data model.
6.12 Additional FieldsAdditional data fields are needed on aUthe records in the data pyramid in the host database. These changes enable the tracltlng of category changes as they occur at theERTU Which requires similar changes to element and device records.
By moving the focus up to the DEVICE leve!, the exact behaViour of the elements will belost unless provlslon is made at the ERTU and thq host to store tl1e time and statechanges as and wMo th~ monitored element chan,~\~d.
1,
This is ~;rnilar to sequ~~ce~of-event r.ecoj'dirJg,,~whichis handled by a separate task in theERT6, in that th!i(e jl; .:1 limited buffer for each el..ement that has space for 8 state aodtime stamps, If the 0uffer overflows the mast recent 0 state Changes are availab!{1.Analog elements use the time stamp cell~ to store the time When the analog valueexceeded the high limit and when it returned to normal. The hlstorlca state and timestamp fields are not stored as part of the device only the current state Is kept there, therest cfthe data is kept in a relational data base that is accessed on demand by the MMI.
The details of the additional fields are defined in the nEl>d paragraphs.
32

6.12.1 Additi~l)~llllQ,$t;r.eld$
T:1l~~~$ic .additional fields added to tl1e host data base records are indicated in Table 6" 'tbe tlel~$.~re;
1. !~tiJiTlestamp field to slare 'lM! time and date when the monitored state changed to;$l1i'l' 01' exoeeded a.ltligh al(~rrl~limit •
•~ itA time stamp fil:lId to store fn0r.~time and date when the monitored state. changed to'R8'SEr or returned to norm,~1.iA "preselilCe II or active!hit tf!16t defines whether or not the record is commissioned at'the RTU, This Bf:lplies mainl~! to el.ements but is applicable to all records including the
. st~tion record. ;.' n4. A bit ll1dloatiag if the record i~\the head of a oategory (nor«)ally only applicable to an
elemeat reoord ).5. A pointer to the location in thel,relational data base for the last 15 minutes of element
history minutes 01"to the Ilist 1~)element state changes.
5JulY,1995
State SET state REi:SET Category rointertotimestamp timestamp indicationbit historicaldata
'\ Table 6 Additional fields needed on·aU host data base recordsJ)
On the device, object, station and region record, four category integer counter fields· andiii state field are required. Each of the catetlory fields require twO' tim~.s,tamf.t records totraok tile time at which counters ohanqed.
In addition to the category counters on the st~tion, region and network records, there arealso cross reference ot,lject counters that track the total number objf:Qis that haveelements in the abnormal state by category for each pyramid level. there are 9 basicobject types Le., busbars, couplers, lines, transformers, loads, generators. capacnors,reactors and SVCS. The counters for these objecfl~. are UPdated as the elements Changeand a~eused by the control staff!o determine the i?\lectrical equipment with problems andin which categories. C .
T~a"cross reference counters are displayed in the "Associated level category counts"~jeld as specified at the top of Figure 7~1. The values l~ the counts change as the control$t~ff move up and down the data pyramid and track th~lcounts in the level dynamically.
The time stamp fields· for each device category are used to trace times when theGategol)l count was set and when the count is eventually reset to zero as indicated inTable 7.
Number of abnormalelements in tOElHealthcategory
Number of abnormalelements in the MainProtectlcm catl';gory
Number of abnormal Number ofelements In thi~ Backup abnormal elements"r"tactlon cab~90ry in the Information
category
Tlable 7 Category field layQut.
Figl..f'I..'0"6 shows a putse trace Of a selected number of elements. 'rhis is one of thesecretary mode tools that allow the control staff to obtain a very QUil1k picture of whathappened amongst selected eleme~ts or devices. Multiple state changes are kept in theassociated relational data base and '~re accessed on demand when pulse data Isrequired. Only a latest set and reset times are stored in the SQAOA data base with thehlstorlcal data stored in the reiationsil data base,
33

The generatioft of the pulse trace is a secretary made function used to deterrninesequenoe,.of~event behaviouratter the event and is performed in an aff-line: mode,
MOhitoredelementtraces
CategorySET time
categoryR~SETtlll'le
6.12.2 Additional ERTUfields
The additional fieldS needed at the ERTU are:11 A time stamp field to store the tir1;leand date when the state of trie element or device
chanqedro SET or exceeded a high alarm limit.2. A time stamp field to store the time and date when the state of the element otdevice
changed to RESET or returned to normal.3. A "presence II. or active bit that defines whether Of not the element or device is
commissioned.4, FOUi category integer counter fields are required initially on each device. Future
growth must be catered for and at least 4 more categories should be aVailable.5. Pointer to the location in the data base where the last 8 state changes and time
stamps are stored.
J---- Elemer,t state
~ __ Element state
OVlilrall category state
6.,13 Host changesonce the extra records and fi~lds nave been added, the changes needed In the hostSCADA data base are:e All elements and analogs are moved ancii~ll(ed to their f)arent device.• Elements are divided and grouped into categories. .• The electrical object, station and region records are IInl<.egto their Child records as per
the physical structure at the station as indicated in.• Code is added to track and update the counters for eaon category on the device
record, (Initially this code can be added to the host q.lIt eventually it would be installedat the ERTU).,Simllar code will update the counters at the object, station and regionrecords to reflect ',·I.e totals below each record.
• Code is added to store the last 16 element and analog changes receive-d from theERTU in a relational data base accessible by the MMI.
• The full graphics displays are modified to have adifferent icon for each oategorydisplayed next to the device, object, station and region If there are elements in thelabnormal state in the source category
Time
Figure 6-' ExamplQ of pulse trace behaviour
34

• Tools are created and addf)d to th~ full graphics displays to allow the control staff todisPlay the contents of a category hy selecting the iCOnor the device to see the €lntireelement set. Ii
ill each MMI workstation has Ifsecret~lry mode" tools to suit the needs otthe Oontrol staffand state of the power system. TM changes to the MMl are explained in detail inchppter&.
6.14 ERTU changesonce the device record and the extra fields have been created, the structure andsoftware needed at the ERTU must be changed as follows;II» Element and analog data is divide.d, grouped into categories and wired up according
to the order in the Teleoontrol Standard. If specified elements are not available,spaces are left for them and the presence bit is set to zero. This is a crucial point inthe deSign as regards dual host access and on-line maintenance.
e Code is added to track and count the number of elements in the abnormal state ineach category for each devlce in the ERTU. The counts and time stamps are updatedwhenever an element changes state. This change tracking code is initially installed atthe host and moved to the ERTU once the communications protocol has beenupdated.
• The data acqUisition processing is modified to transfer the category counts and timestamps with the devloe state whenever the device state is scanned or polled.
• Code is added to save the time state and time stamp When each element and analogchanged in a buffer that holds the last 8 Changes.
• The ERTU has "secretary mede" software programs to provide additional $ervices tethe control staff during qulescent periods and advise them of potential problemsdUling disturbances. This is <.IiSbussed in chapter S.
6.15 Maintenance''linten.ance is one Of the biggest areas of concern in large Energy Management
Sysn~ms. Tile eSKOM ER1Us are accessed by more than one control centre, whichcauses serious problems when new points have to be commissi<med. The problems startwith the need to ensure that the plant data is correctly wired up to the ERTU for accessby multiple host computers at the same time. How are new configurations of the ERTUsynchronised for all users at the same time?
The propos~d SOlution recognises the need for parallel commissioning activity and allowsmultiple host data bases to commission new points at their own pace. The firstrequirement is that each device has the category data built in the same way in all therelevant data bases. including the ERTU before Rny element is commissioned at theERTU.
The desIQI;tl$ aimed at reducing the maintenance load at the different host computers byusing a standard IElyout for all elements; wired to similar devices. All missing or futureelements must be wired to the ERTU. Parallel to each element state is a presence bit.These presence bits are applicable to the device and element records at both the ERTlland the host. see Figure 6-7.
The benefits of standardising the element name order I'il the ERTU and the host are:• There is no need to have. a separate MMI display 10 for each element.• AU elements have the ~ame pre-defined position in the category which is the same for
aU similar devices.• Tllere is no need for majo)' data base update to commission a new element because
the element already exists in the data base once the device record has been defined.
To comrnlsslon an element, all that is required is that the element is wired up. and testedlocally and the 'presence' bit is set to the active state at the ERTU.
6 July. 199& 36

6 July, 1998
At first glance the advantage of not needing to have separate MMllDs for each elementis not appreciated until one considers the space required to display element data and thetime it takes to add new pOints to the data base. By grouping the element data into predefined categories at the ERTU and the host allows the mapping of the individualelements to be pre-defined ID text displays,
As specified, the order of the elements is the same in each category for similar devices.Thus, at display time, the elements for a given device can be displayed in the sameformat using pre-defined 1extwindows. There has to be an identical copy of popupwindows for each category, device, object, station and region on each workstation withthe pre-defined text or symbols in it.
At run time, when the category elements are displayed, the element order, state and'. (presence bits are used to tailor the popup, to match the state otthe data and display it
correctly.
Pre-defined listof element ID textin a popup window
State Bitcontrols thecolour and textof the element
Presence bitcontrols thegrey out
Health category popup window illustratingthe use Of the presence bit and state bit
Figure 6-7 Exampie of the presence bit in use
Control staff know that the order of element information is always the same for Similardevic4'ls. Non commlssloned elements are (eft out and elements in the abnormal statet>ave the background colour behind the text il1verted as indicated in Figure 6-7. .
When new equlprneat is added at the substation, a data base update has to be done at.the host to add equivalent device records. The elements, category details are addedautomatically when the device is sudeci: The presence bit~ on the device and individualelements are used to ct., •••",I how these items are displayed on-the Screen at runtime. Ifthe presence bit is inactive, the MMI will display the relevant device or element in greyout mode. When elements get commissioned at the substation the 'presence' bit is set toactive at the ERTU making the device or element potentially visible on the screen, Settingthe matching presence bit at the host to active, completes the data path and the relevantelement or device becomes visible and usable by the control staff of the different controlcentres.
36

This techniQ4e allows the different control centres to activate new elements, devices orelectrical objects at their leisure t::goviding th~0the relevant record is active at the ..cRTUand that the host data base has been updated. For this philosophy to work, it is essentialto have an agreed wiring standard in place and used by all ERTUs.
6.15.1 Plant c.ommissioliing'fhe plant commissioning stage of new equipment can also be reduced by negotiatingwith the vendor of the equipment to have the interface cables from his equipment to thebay processor match a standard wiring code. This will allow plug compatibility to beinstituted across all equipment of the same type. The saving in commissioning time andlabour charges will be enormous as there is no need to wire out each element state fromthe plant cable to the ERTU. The vendors cable is plugged in 1..111 ectly to the bayprocessor and tested automatically from the ERTU using software programs.
6.16 ExanlpleUsing the conditions in Appendix 1, to demonstrate what the control staff would see USingthe new philosophy, the alarm data sent to the control staff would be combined by theERTU to form the following messages;
15.23:27 *4 TIJTUKA MAJUI31_ BKR, 1/ -;OSEC 1 & 2, UNIT 2_ 400 BUSZONE...I0nsS, 6,.TRIPPED ON R .VERSE POWER
15:23:31 *4 MAJUBA TUTUK1_BKR TRIPPED - CARRI~R_R_EC_E_I_V_ED ~ ---l
Returning to Appendix 1, the frequenpy analogs on the one-line displays would all be inred indicating a low frequency, but there would not have been any alarm text messagessent to the control staff. They would always be a member of the control staff monitoring.the frequen~y who would react accordingly and notify the.rest of the shift.
The next three Breaker close messages w'Juld be logged with explanations using theelement detailS (if they were available). H,)wever in the example there are no indicationas to wllat caused the devices to close. 11 'l text would be the same as it is in Appendix1,
RUSCM_£:JKRTUTUK1_BKRSVC.2_CX3_BKR
~):23:34 *4 TRIDENT15:23:35 *4 MAJUBA1~:23:41 *4 HYDRA
The next phase of the disturbance involves automatic load shedding causing thefollolNing messages to be logged.r-----------------~------------~~----~--~~~~----------.15:23:42 *4 APOU~O CNVRT FILTR2_BKR TRIPPED on Under frequency
15:23:42 *4 AVON UMGEN 1 s 2 BKRs TRIPPED on Under frequency15:23:42 *4 AVON STANG 1 & 2_BKRs TRIPPED on Under frequency15:23:45 *4 HYDRA SVC2_CX3 ....BKR TRIPPED on Under frequency15:23:47 *4 KOMATIPOORT INFLN_BKR TRIPPED on under frequencyi5:24:29 *4 IMPALA PONGL & HILLV BKRs TRIPPED on Under frequency15:24:31 *4 MULDERSVLEI TRFR 4 & 5 (66 Kv) BKRs TRIPPED on Under frequency
Effectively the first 106 messages from Appendlx 1 would be reduced t012 textmessages. They provided the control staff will the necessary level of detail withoutunnecessary clutter. The icons next to the relevant devices would t~ displayed andautomatically cleared as the system stabilised. The control staff would be able togenerate· the various message listings, Similar to Appendix 1, depending upon what theyneeded. In general the critical iQformation was providf';('j in the form of messages and theexistence Of abnormal elements in the form of iCc:'is, providing the control staff with theability to see the detail when required.
G July, 19115 37

~7~m_~ ~ThiS ohapter has proposed a solution to the data over loading problem. The' So!utiol~~isbased on the mental modol of the,.power system data py,ramid .alild .reql:liFes a Gertailliamount of restructuring of the host and ERTU data bases. Once the host data baae hasbeen chali1g~ so that there are distinct levels, the fecus of aitetltiOB is moved from tlilee~ement level up to the device level. 111e sOlution also reqUires the siandarcfisatiGo oHheelemellt prder for each ·de\liGe 8l1d,tl1eir gr.oupil'lg into oategaries, bath at the ERTU andthe Host.
The device record at both the host and ERTU Is ch~ngedto inolude the number Melements per category in the abnormal state. The data acquisition retrieves the devicestate and the oategory det.a.ils as o~,e pass and uses ohanges in the category counts tof~~:!~~~!~:::!:b~sr:frt~r~~~~rl~~~~~:~P~::~~~i~~~'~fT~~r~~~n~::r:~i~ethe logged messages in AppendiX 1 w~re used to demonstrate how the number ofmecsages are reduced/The ERTU combines the element information from the device tooonstruct a text n~essage with additional information end send it to the host.
5July,1l)9G

7.1 IntroducticUl,It:!the previous ohapter dett'lIs were given of the data structure at the ERTU and the host.Mentioll was made of pyramid structure and how the category counts are propagated totU.Q:Ii;}vel Qb.)ve. This ohapter explains how these category counts are used by the MMIand<li(;)w. the MMt is used by the control staff to cpntrol the data displayed and the options,~va.II~bledurlt1@tRe two distinct network operating modes,
7~a·gI~avi~~',~bil~$0phYIn clq$.SicalSCADA systems the behaviour of one-line displays cannot be controlled ormodified by the user at run time, However, in line with the philosophy of giving the usercontrol of the data sent to him, facilities are provided to change the display ancl:the data"to suit his needs and the state of the power system. The difference between the classicalal.splay philosophy and the proposed solut,on is defined in Table a.
Classicai MMIThere is an additional plant model between .,.......1M displays and the SCADA data base thatsupports network connectivity
New MMI philosophyOisplays are built from the SOADA database with no knowledge of the actualnetwork. connectivity Or topology.Displays are gompiled off-line and storedon the host. At. run time the display isdown loaded to the host and updatedevery 4 seconds
Displays are builtoff-line but propagated toall workstations. At run time all SCADA dataIs transferred to the workstation. Thechanges cause the MMI to display the iconsnext to the appropriate devices.
Alarm messages are built for every state Icons are used to indicate element changes.change and analog limit excursion. Control staff generate alarm lists on d~mand.All iiiarm messages have-t;-o"":'b-e---'--------t-A:-;I:--arm--s-a--r-e-a"":ut~o-m-at;-ic-l:l7."!ly-a-c7k-no--w-=l-ed7"g....e"":'d-a-=ft-er-lacknowledged from the alarm list; a pre-set interval or manually by selecting
the icon or device.No ability to channe the dispiaybehaviour
Filters are available to tlte Control staff todynamically alter the displays. The filters arebased on the data pyramid levels, thecategories and busbar voltages VlsllJltI on thedisplay at run time.
No time line faeiltties\\
A cievice event tillle line (similar to alarm list)is visible that allows the tracking of thedevice changes over a time period relative tothe contents of the display. The range of thetime line and its content are selected andbased on the time stamp data stored in therelatiOilal data base on the workstation.
There are query faCiilties------i-AIE,rm lists can be generated by query basedon the contents of the display, the data
1-- ---- -- -J...t..py:<.:r..;.;am.,.;,;..;.;id,..;.l.:...ev.;..;e,..;.ls.....a;;,.;n:~!~ categories __Table U Comparison of the differences between classical and the new MMI.
7.3 Now MMI philosophyClassically tile CRT Is used to display data from the host with no abmty to actIndependently of the host. The dynamic needs of the control staff are not cOO$ider~d andthe best common denominator is used to define the contents of each oneMlinf'Jdisplay,which tended to add fuel to the data over:oad tire during a,tjisturbance, An alternativemethod of data display Is needed to assist the control staff with ~he monitoring orthepower system.
5 July, 1995 39

Tt:l~ pliilosaphy prQP6SeS a different approaoh that regards the wOrkstatfon window as a.WQr.~beRchCCJAsistirn qf a number of input and Gutpa! areas. In ~~e oemre is the primary0m'e"lil!ledisplay outJ:>. area and around the periphery are the related and assg¢iatedQl1ItPutareas as indioated in Figure 7-1. '
7.3.1 ¢t~tp(ttIt:iaw~t~~·~ssooiated output view areas are:, OIlf1tent category counts for the' pyramid level visible on the one-line display area.' Network navigation window• Region navigation window• l..iS1of the previous 20 one-line displays referencedIII Time line window'" Alarm Sin notification area
The 'n\Jut view areas are:" Category filter selection.• Alarm message query and Secretary mode functionsI. Display controls" Time line controls• Supervisory control and data entry input window
Figure 7-1 MMI Work bench layout
The view areas are updated when E.lier a new one-line display is placed' in the one-nneoutput window.
1.4 MMI Data flowAs Indicated in Table V, there Is a complete nodal based plant model of $C ~DA systembetween the SCADA data base and the one-line displays on each worl,statiot~ as shownin Figure 7-2.
6 July, 1995 40

Element data,. devloe state and c~tegory coams are sent from the $CADA data base toeach workstation connected to the host whenever there is an element change. It Is the ..[\responsibility of the MMI softWare on each workstation to update the category counte ai;"each level in its plant model to match the network behaviour.
Changes in the plant model cause the graphloal model to be updated based on "if-,change" logiC in t~e plant model. Each one-line d:Splay has a list of dlspls}; attributes matretain the state anhe display ",hen it was ia~(caUed up on the workstation. Theseattributes settings are restor~~ to the relevant output views when the displa.,' is called up,
Figure 1-2 Logical data base strl.lcturas at the hostltlld workstations
7.5 Output behavioue- on display can·upWhen a display is loaded into the one-line w~':k area.the workstati(l!'1 MMI has todetermlne the state of the associated ouipul views and update them acq'prdingly asindicated In Figure 7...3: "
EaCh view is updated in pardllel when the one-nne display is r()qu~sted. The output viewsare changed to reflect the previous stored settings last used and the current values of thedynamic valuEls. l.e,
• New category counts for the associated level being displayedtI Grey I)ut of all the electrical objects buttons not represented by the current on-llne
display• Time line events acc:)rding to the time range and category selection flags associated
with the current one-line display• Update the navigation windows to reflect the position in the network that is on display,
Once th~ output areas have been updated the user can alter the display by changing iheinput viEiwvalues.
7.6 Input view areasThe Input view areas are:• Category filter selection
6 July, 1996

• Alarm message query ahcl secretary mode area• Display controls• Time Une controls
The content of these view areas allow the control st?ffto affect the behaviour of tileOtltput views. ThE' view functions are detailed below;
IIIIIIIIIII
~~"'<----.
Last 20 a:::wsa~displays
Figur9 7..;J Data flow when a display in called in to the work area
7.6.1 Category Filterthe buttons allow the user to eithl\)r display or hfde category icons on the display
7.6.2 Alarm queryThis view allows the control staff to generate a listing of alarm text messages based onselected criteria. The last < 18 state changes of each element are stored in a relationaldate. base that i$ used to satisfy time based queries. The options are:• Sy Time ( in the range specitied)• ay,~-ategory type• By electrical Objee'( type., B:i( Voltage level1t By regHm, or station, or object or devioe
In r,ddition the user can set up pre-defined sets of conditions and save them by name.Saved queries are acUvated by selecting the saved name from the alarm bip,output \l1~MDt the bottom of the screen, r)e output from the query is a display oontaining theselected alarm message text data which can be printed as required.
7.6.3 Secretary modeTh!S activity allows the control staff to set up a series of functions to be performed on theplant model data so as to advise them of states in the network, region, station, object ordevicl'! that he requires. This activity is covered in more detali in the next chapter.
5 July, 1996

7.6.4 Display controls
These funotions aHowthe oontrol staff to chQilge the data on the display by usingoondltionsln the plant model. The options available are :(I lndloate the range'.)f proteotlon operation on an electrical ohject or station or network• Connectivity tracing of a selemtJd obJeet• ' Grey out (<tr reduce the visibility) of devlces, objects or stations according to the
selection criteria.• Declu\ter the display by removing text, analog end oategory indications... Tum off all flashing Indications
aefore the effects of the display oontrols can be demonstrated it Is necessary to d~tlne!he layout of a one-line display.
1.'1 On~..line dS$play representati9"Fililure 7-41$ an axamplEMlfthe one-llns diagram of a substih'.I~'as seen by thticontrol$ta,f::; The diagram consists of two sets of busbars, each with a busbar couplet and twotransformers ooupling the busbars together. There are three feeders connected to eachbus with a QI!S section coupl~r on the lower 400 KV busb~r.
Figure 14 Example of a one..line display with grey out and icon Indications
The diagram represents a situation where there has been a fa~.t on the 4QOKV busbarand the bus zone protection has operated causing the feeder. the transformer and thebus section breakers to trip. As a consequence of the transformer tripping, the loadacross the second transformer has exceeded the high limit, resulting in the analog valuebeing displayed In yellow. The consequential category Icons are dlspl~yed I1El.xt to therelevant devices.

i$~h el~:otr,igal ~t>~,et'td~\li'(;!1Z ~mdanalqg are deflnediQr d!s~lay pu,:pQses using uniquegraPfilio1 symbols and colours;
A·< ".. areaker . ReCtangle(Red~Qlosed, Green;::; open)" , f,.inlSlqlsconnectDiamond (Red':; closed, Graen Open) ..... .~.\~iQ~ ~e~ment~ Lines ( soUd:.:on load. dotted :.:dIScQnrtect~).. a~~,~l:\rs Narrow reotangles coloured aocordlFlg to vriltaQs,.. AM16gs Numbers (Blue in limits, red:::; exceeded liMits
1.7.1 Voltage Uol~.ltl"~~~f1'~leotnQalobjeot fsras$oofated with a bus bar and voltaoe, The busbars are (''lDloLJreda~llonjih9to the voltaga as follows;las KV Magenta400 KV Gr-sen27'5J22:0 KV orange132KV CyanSSKV Blue
II .V$lng the vIewing ,toolsJhe control staff osn ohange the details of the one~line.display asrequired. .
u
7.8 VtewhlQ cOrit)"QI$The advantages of the plant rt'Iodel allows the control staff to examine the effects of theG'OrnneotMtybetween the different electrioal objects. Without the plant model, it would beimpossible to determine the effect of protection operation on the power netwQr~, ner howa' purtlowl~r transmissioilline is connected in a station or a region. The plMt model allowsthe control staff to see the protectial'l operation effects graphioally by changing thebackground behind a feeder or transformer dynamioally on demand as inciloatad in Figure70.4, '
By ollanglng the bao.l(ground behind the electriCal objeots allows the oontrol·staff to obtaina very quiok understanding Of the pro~eotionoperation "in-context" wlth the state Of thenetwork and not have to wade through miles of text messages to determine the ourrentstate.
7.9 SummaryThis cnapter explained the layout and struoture of the workstation and how the contcalstaff have different input and output windows through whicll they oontrol the data ondisplay by manipulating th~"'tlifferent options available. in the Input views. Details areprovldfld of the tools the used to control the one-llne display to match the operatingneeds of the system. An example Is provided of how the one ..Unedisplay would be O!.,ltputfollowing a busbar strip using the protection information to change the display .baokground around thellfiEtmed eleotrlcal objects on view.

a,SECRETARY MODE FUNCTIONS
8.1 IntroductionThis ohapter e.xamines the role Of an Intelligent system. located at the ERTU and the tYPEof functions that such a system can perform and how they interact with the control stgff athe oontrol centre.
8.2 Secretary acti.QIl:sIn most business organisations the manager has a sJ~£l"_etarywho's task it is, to provide anumber of services such as:
• ~hield the manager from unimportant phone calls.• Take messages for delivery later on., Make appointments• :Advise the manager of meetings and events• Type letters and reports• 00 searches for specific things• construct cross references of various documents
For example, a manager, one can assume, has requested the secretary to "hold all calls"under given circumstances,
It can also be assumed that the secretary "knows" that calls from certain people havemore weight than others or provided the caller u$;wJhe correct "passwords" such as"very urgent", "flre" or "life and death". Under these c~ntJitions, the secretary has implicitpermission to interrupt the manager and put the phone call through to him.
This simile could be taken a bit further. if the ERTU is equipped with sottware that candetect when the rate-of-change ()f a particular valu~ is about to exceed a previously setlimit, callsing a breaker to trip. The ERTU Can use this information to formulate and senda text message to the Host advish.g the control staff of the impending event.
The first point to remember is the ERTU would initially have raised a Health flag againstthe device in question. If there is no change within a given time period the ERTU has theability to raise the state of the alarm to' a higher level, which it can do, by setting a stationlevel alarm element. the last stage Is to formulate and send a complete "text" messagewhiCh can, if needed an audible alarm can be attached to it. It would be up to the controlstaff to take the necessary action to prevent the breaker form tripping if possible.
"Secretary Mode" activity is the result of intelligent system software installed at the ERTUand the host .The results from the Intelligent System at the ERTU are passed to thecontrol staff via the SCADA, the ALARM and the Man Machine Interface.
8.3 The role of intelligent systemsA lot of time and money has been spent implementing E..'!pert Systems for use in alarmprocessing with the Expert System centrally situated at the Host, For any Electricity Utilityalarm processing Expert System to function correctly, the Host must have ALL therequired data and be able to deliver a solution in real time. ihis is not really possiblesince the Expert System requires a valid network state in order for the rules to workcorrectly. During a disturb~nce, the coherent network state needed for topologyprocessing tJsually takes between 10 to 20 seconds to achieve from the time the lastbreaker tripped. Thus a disturbance lasting minutes, effectively disables the expertsystem using topOlogy software, until the last Breaker trip message has been deliveredand a scan of all the analogues has been completed.
Since RTUs now have more CPU power, there is every reason to split up the IntelligentSystem logio between the ERTU and the Host. This provides far more opportunities to
I) July, 1995

imp!em~nt simple rule based algorithms at both the Host and the ERTU. Apart from theCPU power available, the ERTU has its own data base whiGh is updated with live 1:Iatabetween 1 and 5 milli-seconds. Adding code at the ERTU to process the live data willallow local algorithms to perform such activities as ;
.. Local "simple" state Estimation or Power balancing
For example, apply Ohm's and Kirchoff's laws to aUelectrical objects for exempts,feeders, transformers and bus bars at the station. The benefits are indication of badanalogue and status indication more rapidly, clean input data to the Host StateEstimator, more precise data for control staff. reduction of false alarms, There aremany more advantages that affect the Power Application sonware than the SOADAside.
• cross checked breaker indications
For example, if the ERTU has to send a message that a Breaker has tripped but thereis still power on the line then this fact can be added to the reported initial tripmessage.
.. rhe ERTU monitoring ornme based elements
For example, transformer winding temperatures monitored, the ERTU can performrate calculations and predict when the transformer protection will operat~ if nothing isdone to relieve the situation, A message indicating potential trip oan be sent to theOontrol staff, informing them of the pl"{;blem. This will allow the control staff to thepower system in advance and not wait for tne deVice to trip before doing anything.
• Protection flags can be used to provide additional details of what has tripped and why
For example, applying simple rules using the element data belonging to an electricalobject it is possible to determine the cause of the protection operation. The fauttdiagnostic text message can be ssnt to the Control staff under the informationcategory of the object,
Additional fault diagnosis algorithms can be used to offer a number of possiblereasons causing the event. When the fault is between substation, both ERTUs sendtl1e list of possible reasons to the host. Ifthe host finds matching suggestions thesecan be forwarded to the control staff, In the event of no matching suggestions, thistoo, can be used to allow the control staff to examine the offered suggestions andmake deolslons, It is easier. cheaper and more maintainable to set up a IntelligentSystem located at the ERTU, that 1nteracts with the Host as and when required, thanit Is to build a complete Expert 8ystem at the Host alone.
The benefrts ot using the CPU power available at the R'rU are substantial andinexpensive compared to using the Host to supply element data to an Intelligent system,The complt:.'xity of the ERTU fault diagnostic software does not have to be very involved,or expensive as the number of inputs available for processing are not that large but thepotential benefits during quiescent and disturbed states are enormous.
8.4 ERTU activitiesThe ERTU seer,eta!), mode activity involves the normal actions of supporting andpropagating PYI"t1'mid data changes and performing the algorithmic. activities as required.These involve:'" category abnormal element counting and time traoklng• Critical device state message formulation and delivery• Status and analogue error notification to maintenance staff43 False alarm detection'" Power BalanCing and mismatch error reporting
5 July, 1995

·~~~~I~Qtlii~.alOlrUe(lt,mode transitions and liep~iitlng,on If)(pi!Gted events not,I)raa:a.. )···.fl. 1l1aililteman~1erelated messages to ~tati()n and maintenance ~ff
.,$Ii\eoo aile addiiW>nal.aotivitles that ean he implenlentecl oRce the software has been.iP$t,llgq, ~.Iil,clde.mf)l(lstrale(i to the .oontrQIstaff.
S.S Host aofivj~i~~l'h~$e revolve around the MMI needs of the control staff and initially take the fomt ofgl~-nall'a~eaf{Grstation summaries ·ofspeQfficdevice. states, for examp~i '. .'...... )Jl~ltbe ~isl'i'la¥ta iAdiQate only those devices-with the conditiolls as specified by
!~~ial1pliteria ourrently active.,5.of sp.eQffic de'lllce types current state
ilO.emts ilil a giVen alarm.state silace a given time.;~1iIaut;Jibfealarms if a selected number of analogues exceed specific: limits at..~time.
" AA~ (!J,!'Mate 1TJ(;)tlitoring alarming.. Reaotln!ll and respon.ding to ERtU secretary results
~~~~,e~,eft$¥$tem $o1tware is introduced,. a large number ot,additional station specifici;!Qll$ ean be implemented.
'8.~.··~.·~.i}S·,~~~trIl:'.-:i'm; :':"!f~~J'ir.'M'IJ,'~'l,,~':I;
'thIs Qba!\lter deti\tOd the,concept of seQretary i~()de functions using limited versionsl.6f)n\eJligent systeKjoftware that can be install~d at the ERTU and the hcst. The functionsbare designed to assist the control. staff in o\(erooming the problem otaata overioadlng bymal<ing use of new technology situated"at the workstation and, the ERTU.
liJuly, 1996 47

9•.,·JUSttALTERN:
t",·OF THEr$OLUTION AND EVALUATION OF}
9.1 IntrodactifJliI'1i!i!I~·iQ~lqPl:ElIexamines the current upgrades taking. place at the ERTUs and examines
if nothing is done to change the 'existing method of data acquisitiondisplay of data.
:~$K0l~ SQAOA .~ystem in its current form has 28 000 element points Installed with45000 allowed for. With the replacement ofthe 140 RTUs by ERTUS
the 4 years and plans to wire up each device accordil'l.tl to the Teleeontrol'll:irit1g standard, the number (:)f elements being telemetered and modelled in the SCADA'~~ta base is going to increase by 71000 elements. The consequences of this action will,~~11Jeratedenormous problems during a distul'b{ -oe, unless something is done to change ..fp,e method of data acqulsltlon and display.
Jable 9 lists the number of elements per ~"'"'9ker device for the previous and currentfejeoontroi standards. The table lists tha ief of breakers in each of the differentelectrical object types In me ESKOM interCI..iilected power system whioh covers voltagt;lsfrom '132 to 765 KV. The combined number of breakers devlces for aUobjects is 2578 •
."
i C Generators Feeder ,Couplers Transformer ShuntBreakers 121 1069 ~18 869 113
1990 Elements/BKR 1 8 4 6 61994 Elements/BKR 3 35 27 39 40
Difference 2 27 23 33 34.. --9614Extra Elements 242 2886 28677 3842
Table 9 Element t!ifferences betw~w :990 and 1994 Telecontrol standarlls
The additional elements ,',;71238. If all ~l1eseadditional elements are implemented, therewill. be a potential increase Of 250% in the data loading of the control staff.
9.3 Installing new elementsAssuming it takes 5 minutes ttl add each of the 71000 new records, it will take nearly 3man years just to add the data into the ~CADA data base. This excludes time needed fordisplay building, testing and commissioning. once new records have been added, a database update it. required before the new elements can be scanned.
Implementing a standard where the elements of each device are pre-ordered and pre-defined for identical devices and wired up with presence bits set accordingly, will reducethe time needed to edd new element significantly.
Generators Fee~er Couplers Transfonver Shunt SeriesCapacitor CapaCitor
Breaker Breaker Breaker Breaker Breaker BreakerLinks Links Links Links Links Links
Generator Transformer Reactor Cap
Table 10 List of deVices per electrical object

Accordin(r to the Telecontrol standard, there are eight electrical object types. and a threestation related objects. Each electrical Object consiSts of one or more devices as definedin Table 10 aFld Table 11. Each device requires its own pre~defined and pre-orderedelement structure. Thus there have to be twelve unique pre-defined sets of elementtables, The~e tables have in-tum to be.,divided into four categories
Ll1lks8reaker
StaticVAR.Compensators
Station Security i sent Out
Sent out valuesLinks
Bus Zone SeCl.lrity
ShuntR9actor
SeriesReae~ori
: El.teaker BreakerLinks DC suppl,'
Reactor Reactor I VAR. Unit Comms
Table 11 List of devices per electrical pbje~t(continUed)
To aotivate a "new" element in the data base is limited to setting the presence bit to 1 inthe relevant device and ensurlnq that the ERTU commissioning staff have wired theelement to the correct "pre-defined" index. There is no need for data base updates tocommission new elements as the space is already reserved. TIl~ data base staff simplychange tl1e presence flag to active and the element ls in serviCf,t
Totally new devices still require a data base and display update.
Sinc\9 the commissioning of neW elements is carried out on-line the need for large intercontrol room planning by data base and RTU,1!?ld staff to synchronise the commiSsioningof new elements largely faUs away.
(I
9.4 CPl." Loading ConsequencesAn increase from 20 000 to 71 000 elements may require additional CPU pC.Werif theexisting 2 and·4 second response time is to be maintained.
ThE! proposed solution is based on the current trends in the computing. industry, theneeds of control staff and the demands for additional Information in the control room.
9.4.1 Expecied changes in the computing and electrical industryThe changes in the monitoring and control of the electrical utility industry are expected tobe;• Host computer power will increase by between 10 and 100 fold in and around the
control room during the next five years.• Full graphics workstations will be delivered and installed with very superior MMI
facilities in comparison to the classic character graphic display deviceS of the past,() Power system protection schemes will move towards qigital protection equipment.
This protection equipment will interface directly to the RTU, providing useful additionaldata to the control staff, The protection information, linked to expert systems at theRTU will provide for tt,e rapid understanding of condhlons in title power system duringand following a disturbance,
• Remote terminal Units will be replaced by intelligent versions equipped with increasedcomputer power.
• The introdUction of wide area networks providing more secure data communicationsand wider bandwidths.
• The need for the SCAOA system to provide high value, low priority data outside thecontrol room, e.g. hoUrly consumer metering data and sequence of event data forprotectlon and fault analysts,
• MUltiple control centres will access the same ERTU at the same time._. Phase three protection will provide additionei element data point as indicated in
Appendix 5, which lists the elements for I~ Static Var. Compensator. This Appendixcompletely changes the values in Table 11 where only a fraction of the. information isused •. The consequences ·of adding the additional daia elements will place additionalburdens on the Control staff if the existing methods of display are used.
6 July, 1995 49

5 July, 1895
This i~,$tle of,ool1(lurrent aesess of the same ~RTU by different uSers causes sev,e,remaintenanoe problems. Currently when new paints are cOI11fl1isSioned'sttl!le~R"FU~thediffefenl hosts scanning the 6RTU need to !:is",e their datl:l bases uf)Qate~ at tfle sf,ln1etime. otherwise there Gould be Q~era"·loss of data until the ERTU an(iJ'the hast arebro.u.ghtbato line. The proposed s!l)}utiOA'J:).lto\ddes.a possible sOLuUQf;l,toJne 1¥!J:lIt[pleQQ$taccess ptQfule~ by, inoluding maintenance related data bits in,th~ ~RTlhl,lild .the nastdatf\ bases.
Tne aim ofthis paper is the disc.ussion of ways and means to remove or curtail dataoverto3(:.liog suffered by the control staff during dlsturbances, In acldition there is also theneed to speed up the time. it takes Jo obtain a clear picture of the current power syst,emstate.
Retaili)ing the existing methods of data storage and OAQ functionality and implementingthe ad~ittonal element data as per the 1994 Teleoontrol standard, the ~tentialcon$:equenq~s to be cOtlsidered af(;l; .
\II Massi\1e data overloading of the controls staff during disturbances,\II Additional data base and display staff will be required to keep up with system growth._, Additional communi~tions bandwidth will be required to' cater for the increase in data
acquisition needs. c.
• The ability to access phase three protection indioations will be restricted,• CPU IQading will have to be increased to sup,?ort the additional MMI activity.• The {.;traduction of Expert Systems will be delayed and their functionality reduced.
On lhe oUjer hand if the proposed ERTU, communication 'philosophy and MMI deSign isimplemented in conjunction with the 1994 TelecontrQI Standard,. there are, a number of aadvantages;
tl The need fOf large numbers of data base updates is reduced.. On~Une commissioning of new elements is possible "'" II
• Clearer understanding of the total electrioal state more easily aohieved and in ashorter time
fJ Expert systems (both central and distributed) can be added at the RTU and the Hostto provide real time asslstance to the control staff.
50

10. CONCLUSION
10.1 introductionThis chapter ovaluates the proposed solution and offers a critical review ofthe,report as awhole. Lastly, the development pl~rffor the implementation of the new MMI philosophy isconsidered. '
10.2 Evaluation of the new MMIF
EQch of tl'Je problem$l.hitially defined in Chapter 1, are re-examined in Table 12, in thelight of the proposed new MMI philosophy.
Problem .a) iMMsistent significance in
alarm messages.
b) Recurring alarms.
0) Too many alant/s.a) Alarm overload during a
disturbance.e) The number of alarms is
sometimes overwi1elming.
SolutionCOITected by matching the data on display to the mentalmodel required by the Control staff. They are no longer atthe mercy of the text in the message but are able to seewhat-they-want-when-they-want-to.Apatt from the three "required" text alarm messages types,there is very little chance of recurring alarms being sent tothe control staff directly.
Secretary mode functions at the RTU and the Host woulddetect them and it would then be up to the malnter.ancestaff to correct the problem at the ERTU.These problems are no longer relevant if the propose,"!solution is implemented. The control staff will not haveunwantecLtext_messages sent to them directly. Icons next tothe df'vices-W!!l hldica!e the presence of abnermal states.
As!,uming that this refers to analog alarms, secretary modefunctions CRn be used to ensure that in-context limit :checking is within bounds to provide some relief. The initialcause of ine problem is usually the inflexibility of the limits orthe width of the dead band. Simple pattern recognition andime of day checking can prevent this.
I-g-'~:---L:-a-c~k-o":"f-a':-ann-s-o-n"_k""'e-y-'---r It appears as if these problems relate to the needs of theparameters. control staff when attempting to construct a mental model of
h) Need for more Jetailfrom a particular situation. Implementing the 1994 Telecontrolsubstations. standard Should correct these problems as well as providing
I) Some etenn messages do not Control staff with the ability to access all the element datacontain enough information. I;:elonging to a device on demand.
j) Some alarm messagescontain too muoh information.
f) Alarm tllreshold too sensitive.
K) Alarm display problems witllpaging.
I) Bottom line ohanges too fast (this is the current alarm list).
m) Some a/anns are needlesslyrepe.ated.
n) ''''11J(tipfemessages aregenercifed for the samecondition.
Apart from the extremely limited number of Breaker textmessages, this problem no longer exists as aU "alarm" datais visible as icons on the display. However the inherentproblems with any data list still remain, particularly wherenew messages are being inserted and deleted on demand.By implementing the proposed solution the element changewill only be seen ifthe control staff examine the device In fullvia a popup window. Secretary mode software would notifythe control staff if something did not happen as expected.
5 July, 1986
Table 12 Evaluation of initial problem in terms of the new MM.From the review of the defined problems, the proposed solution, it is believed, will providea solution te- "he data overload problem. Only careful testing under controlled conditionswill provide eoncrete proof of the theories In chapters 6, 7,8 and 9.
51

10.3 Concept model MMIThe ideas in this report were used to build a concept model ofthe proposed MMI uSingMicrosoft ACOeSs and demonstrated to control staff and management. The conceptmodel 'is primitive but does contain enough dynamic behaviour to demonstrate theviability of the theories.
10.4 PrototypeBased on the concept model, eSKOM management have .Buthorised the development ofa prototype to be used by the control staff under controlled conditions to prove thefunctionality of the new philosophy. The prototype will be connected to a power systemsimulator to provide disturbance data, will be used to check the precise requirements anddetermine the full functionality of all MMI actions and tools.
the ~tot()type will provide a complete environment in which the control staff will have theopportunity to test all possible network scenarios using controlled network Ilctlvity. Theprototype will also provide the basis for controlled MMI usability engineering studies toassess performance accurately and for the accurate comparison of the existing andproposed Man Machine intertaces.
Before the prototype can be developed, a number of areas need attentlon;• What is the best hardware and-sojtware environment to be used to develop the test
bed?• Is an object model the best way to represent a power network?4> How easy Is it to build an object oriented plant and graphical model and get them to
talk tti each other and to the data source?• How easy will it be to 1ssess the Control staff acceptance and the efficiency of the
new philosophy? .
10.5 Financial consequencesIt 15not easy to accurat\~ly estimate the full impact. of ':he proposed solution in financialterms, However it is important to examine the cost to f:SKOM and the country during adisturbance, if the existing alarm philo~ophY is retained,
The initial costs are In the design of the new MMI and the Changes to the ERTUs and thecornrnunication protocol. the cost of ohanging the host data base and adding thecategory count changes Is far smaller.
TM inifial estimates of the financial costs are;
10.5.1 ERTU costsThe estimated costs to develop the ERTU to meet the requirements is approximatelyR500,OOO an~Hnvolve:• Derived value code• Data Sase changes• ERTU secretary mode functions• Category counting• Text message fom:' .Jlation and transmission
10.5.2 Host costsThe estimated cost to develop the changes needed at the host to support the workstationis approXimately R300,OOO and include:.. Data Base ohanges• Category count propagation up the pyramid• ERTU text message receipt
6July, 1~e~ 62

10.6.3 Protocol costsThe estimatep. 'costs ~o upgrade the protocol to support to changes needed for the <hostand ERTU communications are appr9ximately R500,OOO and include:.. Transmission of mixed data messages• Inclusion of the time stamp dote.. Text message transmission.
10.5.4 MMI costs
Once the test bed interface has been developed and tested using live data by all theinterested users, it can be used as a living specification for the production version of theMMI. The estimated costs for its development by a vendor is R 300,000 and assumesthat the prototype software is not reused.
10.6 Responsibilitiesonce the proposed changes are in place, ESKOM woulq have to ensure that the pre-ordering of the data elements at the RTU are adhered ti!l in all installations.
Training will have to be provided for the control staff and C" maintenance staff involvedwith the operation of the control system.
All existing intelligent ERTUs will have to have changes made to their wiring ~Qd internaldata bases to match the Telecontrol standard. It is possible to phase in the changesgradually, with a hybrid system ;,) place during the implementation.
10.7 Implementation PlanOnce the prototype has been build and approved by aU potential users, a jointdevelopment team should be set up to plan and install the proposed changes with theoriginal SCADA equlpment system vendor. The complete project would Hike about 24months to complete.
Software and hardware staff are required in the following disciplines to assist in theimplementation Or the philosOphy;• Data Base maintenance.. Application Software to ensure that SCADA funcnons still operate correctly• Data Acquisition staff to develop tM RTU end DAQ interfaces at the RTUs and Host.to Man Machine staff to build the support tools.e Power Application Software staff investigate and maximise the ERTU options
available to POWer Engineering facilities.
There are a number of additional areas that still need to be investigated;e The Ilbility of the communications protocol to support the requirements.• More work nee-is to be done using Simulators and hands on evaluation of the
proposed solution before a full acceptance by manaqems.. •• It is diffir.ult to do a full cost benefit analysis as there are stili a number of ullkllowns.• No work has been done on the Impact on any of the POWer Application Software such
as Contingency Analysis, Short Circuit Analysis or State Estimation. These modulesmay need changes to benefit from the ERTU secretary mode options.
10,8 Critical ReView Of This ReportWhile it Is believed that the proposals outlinel1ln this report are, in general new anduntried, they should meet what Is considered a critir.al and growing problem facing notonly ESKOM, but all major Utilities. It is, however, conceded that the proposed solution isunlikely make the work Of control staff easier during quiesc.ent network conditions. Inaddition the methods of monitoring the power system state in the control room will needto be examined to see if changes must be made to bater for the proposed display ofabnc.mal element indications.
G~IUly,1995 53

However, the enthusiasm demonstrated by the 'eontn,1 sto;i,ffduring the demonstrations .ofthe concept models indicate that they are more than ready for the otfersd lunctlonallty.They are also more than ready to suggest ways and means to improve the fQcilitt~s that ".ttley badly need. ."
One of the foreseeable problem areas Will be control staff reliance on the ERTUaqgorithms to advise them of problems at the sl!bstation.lo th~ evellt that the algorithmicoutput i~4ncon'ect, the control $taffwill blame the new philosophy., The prototype whlhave to be used to evaluated 1hese ~rgorithms in more detail with the intention of makingthem more robust and testing the built-in self diagnostic functions.
The following sections highlight specifiC areas of concern.
1.0.8.1 '.!leotalmodels
The concept of a m~mta[ model is still open to debat~ as there is no unanimity as to whata mental model is or how it is formed. To quote from staggers and Norolo [19] "Mentalmodels are created by the users as they interact with the target system images and maynot be equiI!',llent to the conceptual models. These are what people really have in thereheads to guide their use ofthings.u
The mental models used in the study are stili very much based on group discussions andnot on exhaustive studies of the individual Control staff members. More work isnecessary, as the tools to determine whai constitutes an accurate model of a physicalsystem, are not av::;;ilable at present.
10.8.2 Newknowledge
01. cemptencn ofthe prototype, the metrtcs used to evaluate the Control staff behaviourwill be availab!e for use in other dir i.,Unes usfnpJ'.na~~trial Man Machlf\e Interfaces.
10.8.3 SupportStaff from a nUll ' sr of disciplines in ESKOM hfl.rJ:& =en r;;xpOr~~pto the$~ Ideas andhav~ weloomed them. There are many areas th!~lneed addlt!f)na3 work, .especially in theareaJ~f nOh-standard element. O'Jclsions wil~b~)\need'idon t~e best methods of groupingthe elements and s.;.Jecting the category that the. t Sll,lUld balUn!) to.
More details could by required in the area of MMI secretary mode tools, however as thisis still a concept, more time is needed to develop the functionality.
10.8.4 Academic view
From-an academic point of view, the suggestions In this report add to the wea!th ofcomments on MMI in general, but do provide useful Input from a practicel point of view,based on first hand experience of MMI design. From an Industrial aspect, they offer apossible solution that could be lmplemented in similar disciplInes such as oil refining.ships, alrcraft",mlning and steel mills, to name a few.
Once implemented, there will also be £i major change in (he role of th'a Man Ma.chineInterface as it will be able to respond to a wider range Of user dem~ud5 to meet thenelwork changes.
If the id~as are lrnptemented, there will be serious de ;opments in IISecr~rtar;,mode"tools to satisfy the heeds of the control staff Md pr~\ection engineers. thesedevelopments will offer many opportunities for the usa of Expert and Intelligent Systeus.
10.8.S Advantages
The benef:s of irn0lementing the proposed Sf ;icn are:ill Reducth,>~ of control staff stress d'~ring a disturbance.
s July, 1995 64

.. Control staff have more' control (iver the data they need rather thati being at the mercyof the SCADA system.
• Development and introduction of ,low cost "value added software" at the RTU and Hostas an aiternative to the very expensive centralised expert systems •
. « Reduction in data base. and display maintenance time.ii, enhanced matching of the mental models used by the control stafflo the phys;osl
system.'" Very rapid visualisation of the power system state becomes possible... i3etter,})se of the fun graphic workstations. .• Provide live data Via standard one-line displays users outside the control room.
Moving the responsibilily for the accuracv of tile SCADAdata to the R.TU.,will speed upthe ability of the t,' ,infenance staff to correct problems in the field. Since fl1e"Vhecking orppw~r balancing software c::m,be R'lked to tne substation bay computers. Accuracychecks. cart be run "off-line" ~dh results available to the RTU commissioning staffindependently otthe State Estimation software at the Host, which lip until now was theonly way Qf completelyccheckil1g the analog values in a station.
iO.8.6 Oi~advantages
The main disadvantage of these suggestions are the number of changes needed to th~ .existing faCilities. specifically the. Host data base, the ERTU software anu lha .....communications protocol. However, there does not appear to be any other alternativeavailable.
10.9 ConclusionsAfter examining the problems and the benefits offered by the proposed solution, thehighlights of the philosophy are;• Control staff are not subjected to large volumes of unsolicited data.• Elementdata belongs to the device and hence to the object.
All data for a given device or object can be viewed in the same time context.o Control staff obtain an instantaneous feel for the system and the element state in
question from a single window, uncluttered by unwanted dala.o Icons displayed next to 3 device indicate the existence of one or more child elements
in the abnormal state.• Staff using the new MMI determine the level of abstraction that they use to view the
network data and control the data is displayed on th~ one-line displays.• Cross reterenoes of individual device states are Indlbated by Object and Device Ty~,
nllowing the control staff to rapidly find information related to the problem they areworking on.
• Control staff no longer have to wade through pages of teXl: lists to "see" what thecurrent state orthe power network is.
It is belie~ sd that. it is important to build a prototype MMI and test the proposed solutionusing live data and demonstrate the results to control staff and management Only thenwill it be possible to g~t support to finance the instalration of these ideas.
5 JUly. 1995 65

APPENDIX 1 ..COpy t')F THE ALARM LOG
Appendix 1 Example of ESKOM disturbance loglntroducticn
Example of an event on the ESKOM network which generated 431 of alarms in 10minutes, with 79 in the first 30 seconds. There was a BUStONE operation at TUTUKA,caused by the opening of the Tutuka_Majuba KV line links under (oad conditions. Thiscaused the loss of 1155 MW of generation and 179 MW load by under frequency loadshedding. The frequency dropped from 50.00 Hz to 48.88 Hz which triggered automaticload shedding and returned to normal 4 mlnuteslater,
15:21:45 *4 KRONOS 40t)CPLRA BKR CLOSE15:21:51 *5 UMFOLOZI NORRX1 EKR TRIP CONTROL SUCCESS15:21:47 *4 UMFOLOZI NORRX1 BKR TRIP15:21:48 *5 MERSEY 1/27$B- KV 281 NOIDR..AL15:22:23 *6 KRONOS 400CPt,RA GROU1 NORMAL15:23:16 *6 TRIDENT RUSCM GROUP1 NORMAL15:23:20 *4 VERWOERDBURG VERWR 'J'HIP_ ALRH ALARM15:23:27 *4 'l'UTUKA MAJUB1 ERR TRIP-15:23:27 *4 TUTUKA UNIT2 400 BKR TRIP15:23:27 *4 TUTUKA UNIT3 22 BRR TRIP15:23:27 *4 TUTUKA 1/400SEC1:=BKR TRIP15:23:27 *4 TUTUKA 1!400SEC2_BKR TRIP15:23,:27 *4 TUTUKA UNIT6 22 BKR TRIP15:23:29 *5 MERSEY 1/275B KV 280 278 LOW15:23:29 *5 TUTUKA UNIT 3 KV 19 0 1.0'1'715:23:29 *5 TUTUKA UNIT 6 KV 19 0 LOW15:23:31 *4 MAJUBA TGTUK1 BRR TRIP15:23:32 *5 LETHABO 2/275-1 HZ 49 49 LOW15:23:32 *5 LETHABO l/275-1 HZ 49 49 LOW15:23:32 *s LETHA130 1/275'",6 HZ 49 49 LOW15:23:32 'k5 LETHABO 2/275-4 HZ 49 49 LOW15:23:32 *5 APOLLO 2/400 HZ 49 49 LOW15:23:32 *5 PALMIET 1/400 HZ 49 49 LOW15:23:32 *5 GRASSRIDGE 1/132 RV 135 134 LOW15:23:32 *4 TUTUKA MAJUB1 MOLT" OPEN15:23:32 *4 TUTUKA UNIT6 22 MAL OPEN15:23:32 *4 TUTUKA UNIT3 22 MAL OPEN15:23:32 *4 TUTUKA UN!'l'2400 MAL OPEN15:23:32 *6 TUTUKA UNIT2 ISLAT'WEALRM ALARM_15:23:32 *6 TU'1'UI<A UNIT 5 ON OFF ON15:23:32 *6 TUTUKA UNIT 1 ON OFF OFF15:23:32 *6 TUTUKA UNIT 2 ON OFF OFF-15:23:32 *6 TUTUKA UNIT 3 ON OFF OFF15:23:32 *6 TUTUKA UNIT 6 ON OFF OFF15:23:32 *5 TUTUKA BATTERY COMMO ALARM-15:23:33 *5 POSEIDON 1/400 HZ 49 49 LOW15:23:33 *5 DUVHA 1/400N HZ 49 49 LOW15:23:33 *s MATLA 1/400N HZ 49 49 LOW15:23:33 *5 HIGHVELD 1/2758 HZ 49 49 LOW15:23:33 *5 ARNOT 1/400N HZ 49 49 LOW15:23:33 *5 ,l\RNOT 1/275 HZ 49 49 LOW15:23:33 *5 GROOTVLEI 1/400N HZ 49 49 LOW15:23:33 *5 HENDRINA 1/400N HZ 49 48 LOW15:23:33 *5 MULDERSVLEI SYNCH3 MVAR 72 82 HIGH15:23:33 *5 MUI.l)ERSVI,EI 1/400 KV 380 375 LOW15:23!33 *s ~.mLDERSVLEI 2/400 KV 380 379 LOW15:23:33 *5 DRAKEN'SBERG 1/400 HZ 49 49 LOW15:23:33 *5 SALT RIVER Y/33 HZ 49 49 LOW15:23;34 *4 TRIDENT RUSCM BRR CLOSE15:23:35 *4 MAJUBA TUTUI<l BKR CLOSE15:23:35 *5 KENDAL 2/400-'1 HZ 49 49 LOW
5 July, 1995 Appendix 1 • Alari'Jllog 1

15:23:3515:23:3915;23:3915:23:411.5:23:4215:23:4215:23:4215:23:4215:23:42
5 July, 1995
APPENDIX 1 ..COP¥ OF THE AlAt~MlOG*5 KRIEL*5 KOEBERG*5 DRAKENSBERG*4 HYDRA*4 APOLLO CNVR'1'*5 ACACIA*5 ACACIA*4 AVON*4 AVON
*5 M.D.JUBA-I-. .•j; !'1AJUBA*s AVON*5 AVON*5 MAJUBA*5 PORT REX*5 PORT REX*5 POR1'REX*6 APOLLO CNVRT*5 ALPHA*5 AURORA*4 KRONOS*4 HYDRA*6 CROYDON*4 KOMATIPOORT*4 ARIES*5 MERSEY*5 MULDl'lRSVLEI*5 MULDERSVLEI*5 MULDERSVLEI*9 HYDRA*6 MAJUBA*5 AVON*5 AVON*5 BOUNDARY*5 THESEUS*6 KRIEL*4 IMPALA*4 IMPALA.*6 IMPALA*5 VD K1.00F*4 HYDRA
UNIT 1UNIT_2tlNIT 3FILTR2 GRotJP2BATTERY COMMO1/400PER~URBOORAl?HSVC2 CX3 BI{RTRFR 3 GROUP1INFLN EKRPERTURBOGRAPH1/275BSYNCH31/4002/400SVC2 CX3 BKR NOP'I'UTUK1BKRCARRIER UPS FIt.BA'I'TERYLOW VLTAGECARRI.ER UPS FlLTR_3. TAPUNIT_2 ON OFF
1/400N1/40013G/M_3svcz CX3 BI{RFILTR2 EKR1/400 -1/132UMGEN1 BKRUMGEN2 BRRSTANG2 BRRSTANGl BRR2/400-'11/400-1TUTUK1 BKRCARRIER UPS FILBATTERY LOW VLTAGEBATTERY COMMO
PONGli BKR,'_HILLV BKR
HZ 49 49HZ 49 49HZ 49 49
HZ '4:9 49HZ 49 49
KV 420 425KV 420 425SIR/INIT_RESET
HZHZHZ
49 4949 49;1.9 49
49 49
15:23:42 (,'4 AVON15:23~42 *4 AVON15:23:42 *5 MAJrTBA15:23:4215:23:4215:23:4215:23:4215:23:4315:23:4315:23:4315:23:4315:23:4415·...3:4415:'23:4515:23:4515:23:4515:23:4715:23:4715:23:4B15:23:4915:23:5315:23:5315:23:5315:23:5815:24:0215:24:0315:24:0315:24:1115:24:1315:24:2415:24~2915:24:2915:24:2915:24:3315:24:3115:24:3215:24:3215:24:3215:24:3115:24:3115:24:3115:24:3315:24:4515:24:4615:24:4315:24:43
HZ
KV 282MVAR 20KV 393KV 396
SIR/INIT_RESET
1
HILLV GROTJP1GEN/CONP_STAR ••••1 GENTR_2_400_MAL2
*5 VERWOEhO~TJRG 220V_SUPPLY_FIL*4 VERWOERDBURG VERWR_'l'RIP__ALRM*5 VERWOEROBURG 220V_STJl?PLY_FIL*4 MULOERSVLEI TR_4__66_BKR*4 MULDERSVLEI TR_5__ 66_BKR*6 MU.tDERSVLEI*5 THESEUS*5 VD KLOOF*5 HF VERWOERD*6 VD KLOOF*6 VO KLOOF
TRFR_B_GROUP2
CONTROL
TR 3 'rAPGEN/COND S~AR 2 GENGEN/COND:STAR: •••1 GENBRAKES .•••••••.••10N_OFFINITIATE SHUTOWN.I0N OFF- _
3CONTROLCON~ROL
Appendix 1 - Alarm log
o
LOWLOWLOWCLOSETRIPLOWLOW~RIPTRll?TRIPTRIPHIGHHIGHINITDALARMALARMALARMLOWLOWLQtllALARMALARM.LOWA N 1i.TRIPNORMALTRIPA_N~ANORMALNORMALNORMALNORMALALARMRESETNORl4ALNORMALNORMALLOWOFFTRIPTRIPALARMSUCCESSCLOSENORMALNORMALALARMTRIPTRIPALARMNORMALSUCCESSSUCCESSOFFON
2

APPENDIX 2 ..ESKOM TELE..CONTROl STANDARD
Appendix 2 ESKOM Tele-Control standard
ESKOM OPS5026/22·5 REV. 2-STANDARD FOR EMS TELECONTROL REQUIREMENTS DECEMBER 1994DE1AilED DEFINITION OF TElECONTROl DATA REQUIREMENTS FOR PAGE 1 OF 26EMS SYSTEMS AT MAIN TRANSMISSION STATIONS
Compiled by Accepted By Recommended By Approved By
RAGUBBINS 1::0SMANAGER S-O-M (-S-MAccepted By Accepted By Accepted By Authorised By
D~T-I\!I T-E-M P-S-E~M GM(G)
Rev. Description of Revision
2 General Update.Added changes for the ERTU.Added changes to take lnto account the sharing of ERTUs by Transmission and Dlstrlbuflon.Removed rc::quirernentsfor Group 1, Group 2 and Secondary Protection combination alarms.Clarification of single/double bit indication alarms.Added requirement for battery backup of measurement transducers.Added security controls and alarms.Added station emission data for coal fired power stations (sectlon 7.10)
.-INDEX
1.0 PURPOSE2.0 SCOPE3.0 REFERENCES4.0 DEFINITIONS5.0 RESPONSIBILlllES6,0 ACTIONS7.0 lELECONTROL REQUIREMENTS
7.1 GENERA10RS AT COAL FIRED POWER STATIONS7,2 GENERATORS AT HYDRO, PUMP STORAGE AND GAS TURBINE STA110NS7.3 FEEDERS7.4 BUS COUPLER AND SECTIONITRANSFER BREAKERS7.5 TRANSFORMERS7.6 SHUNT REACTORS7.7 SHUNl CAPACITORS7.8 SERIES CAPACITORS7,9 STATIC VOLTAGE COMPENSATORS7.10 SlATION LEVEL7.11 SECURITY7.12 INTEGRATED VALUES
8.0 ALARM STATE CONVENTION9.0 TELECONTROL. WIRING REQUIREMENTS
10,0 AUTOMATIC GENERATION CONTROL REQUIREMENTS11.0 POWER REQUIREMENTS12.0 DOCUMENTATION13,0 RECORDS':4.0 REVIEW DATE15.0 DIS1RIBUTION16.0 DRAWING· 0.64/13497 (1 SHEET)
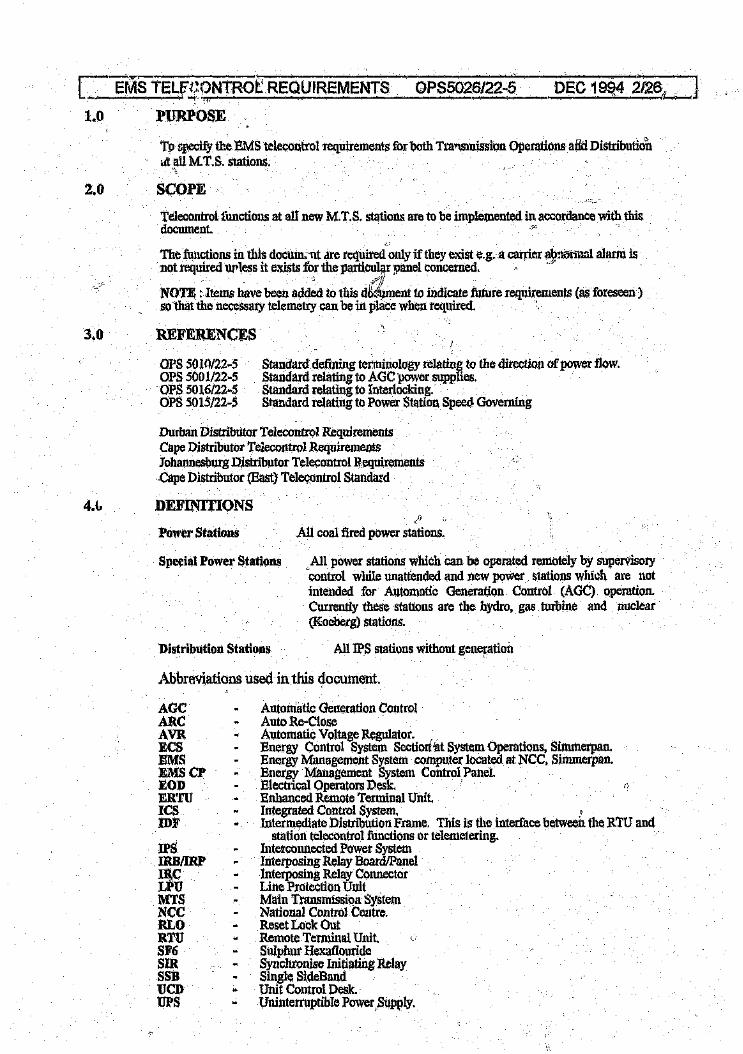
CsJ1s TELf.EpNTRot REQUIREMENTS1.0 PLTRPOSE
OPS5026l22-5
to tpecify the EMS telecontrol requirements for both Transrnission Operations arid Distributionat all M.t.S. stations.
2.0 SCOPETelecontrol functions at alt new M.T.S. stations are to be implemented in accordance with thisdocument.
The functions in this docum; nt are required only if they exist e.g, a carrier a9~(ijjn:Jlalarm isnot required unless it exists for the particu~r panel concerned. '
, '-, ...·r~)/NOn; :1tems have been added to this dMument to indicate future requirements (as foreseen)so that the necessary telemetry can be in place when required.
3.0 REFERENCES
OPS 50 Hl/22~5OPS 500 1/22~5OPS 5016/22~5OPS 5015122~5
Standard defining terminology relating to the direction cf'power flow.Standard relating to AGe power supplies.Standard relating to Interlocking,Standard relating to Power Station Speed Governing
Durban Distributor Telecontrol RequirementsCape Distributor Telecontrol RequirementsJohannesburg Distributor Telecontrol RequirementsCape Distributor (East) Telecontrol Standard
4.(. .DEFINITIONS
Power Stations
Special Power Stations
All coal fired power stations.
.All power stations which can be operated remotely by supervisory'control while unattended and new power . stations which are notintended fOT Automatic Generation Control (AGC) operation.Currently these stations ate the hydro, gas turbine and nuclear(Koeberg) stations.
All IPS stations without generationDistribution Stations
Abbreviations used in this document.
AGCARCAVRECSEMSEMSCPEODER'fUleSIDF
IPSIRBIIRPIReLPUMTSNeeRLORTl1SF6SIRSSBueDUPS
Automatic Generation ControlAuto Re-CloseAutomatic Voltage Regulator.Energy Control System Sectiorrat System Operations, Sirnmerpan,Energy Management System computer located at NCC, Simmerpan,Energy Management System Control Panel.Electrical Operators Desk.Bnhanced Remote Terminal Unit.Integrated Control System. •Intermediate Distribution Frame. This is the interface between the R'rU andstation telecontrol functions or telemetering.
Interconnected Power SystemInterposing Relay Board/PanelInterposing Relay ConnectorLine Protection UnitMain Transmission SystemNational Control Centre,Reset Lock OutRemote Terminal Unit.Sulphur HexaflourideSynchronise Initiating RelaySingle SideBandUnit Control Desk.Uninterruptible PowerSupply,

C EMS TELECONTROL REnUIREMENTS
5.0 RESl>ONSIBILITIES
OPS5026/22-5.. DEC 1994 3/26~.-~----~------.----~Engineering, Transmission PTM and Distribution Maintenance departments shall ensure thatthe requirements of this standard are complied with at all new Power and Distribution Stations.
\.,
Transmission Operations shall specify telecontrol requirements for special Power Stations on anindividual basts; 1S telecontrol facilities depend on station design."'~A1 existing' stations where improved telecontrol is essential, it may be necessary to providefunctions not existing presently at the station concerned. Some new stations will requirefacilities not specified in this document. Special requests will be made by TransmissionOperations or the Distributor in such cases.
All non-demarcated IPS equipment, i.e, equipment within Transmission boundaries, will bemanaged and controlled by facilities at the National Control Centre (NCC) and StandbyNational Control Centre (STABNAC).
Where Distribution facilities are non-existent, transmission Operations will attempt toaCicommodate supervisory control for non-Il'S equipment at IPS stations in the Distributionarea.
Where.Distribution and Transmit ,.lionshare an ERTU, any operation on or changes to the ERTUmust be done in accordance with the respective Standards documents and with the r' tsent ofboth parties. When the ERTU is in a lvITS station, all operations on and changes to 4•..:ERTUmust be authorised by System Operations.
6.0 ACTIONS
6.1" Standards.~i-'
Wiring standards shall comply with the requirements of Section 9 (Telecontrol WiringRequirements). Megawatt and Megavar direction of flow shall comply with ESKOM StandardOPS 5010!?2-5
6.2 Alarm grouping
In IPS stations where an ERTU is installed, alarm grouping if required will be carried out bysoftware in the BRTU. There will be no hardwired commonlng of alarms in the IDF. Thegroupings, GROUP 1, GROUP2, and SECONDARY PROtECTION, will be maintained assoftware groupings in the same form as when they were hardwired.
6.3 Timetag data.
Time tagging must be implemented at all IPS stations where an ERTU is installed. The pointsto be marked will be specified by System Operations. These points will be defined in the ERTUat configuration time.
6.4 Telemetry Indication (Status) State Conventions.
Section 8,0 specifies the recommended normal "States" of Telemetered Indications/Alarms forCONITEL RTUs. The convention is that a State 0, at. closed contact, indicates the desiredcondition.
Section 8.1 refers to the ERTU and the convention for double bit indications when used with theERTU.
This table should be adhered to when RTU maintenance and EMS databaee-engineering staffrespectively commission and define newstatlons.

I ' EMS TELECONTROL REQUIREMENTS OPS5026/22-o DEC 1994' 4/26
7.1 GENERATORSAT
'COAL FIRED POWER STATIONS
CONTROLS
ANALOGS
BREAKER INDICATIONS
LINK INDICATIONS
A.G.C. INDICATIONS ,
GJuly, 1995 Appendix 2 Telecontrol Standard 4

I...--E_'M~S~T.,....E_L_EC_O_N_T_R_O_L_R_E_Q'C"U_IR_E_M_E~N_TS__ O_P_.S_5_O_26_/2_2_-5 DEC 1~14 5/26 ~ I7.2 GENERATORS
ATHYDRO, PUMP STORAGE AND GAS TL\Q.BINE STATIONS
CONTROLS
ANALOGS
BREAKER & DEVICE ThlJJICATIONS
5 July. 1995 Appendix 2 Telecontrol Standard 5

r EMS TELECONTROL R.EQUIREMENTS QPS5026/22-5 DEC 1994 6/26 ..J7.3 FEEDERS
CONTROLS
ANALOGS
INDICATIONS
5 JUly, 1995 Appendix.a Telecontrol Standatd 6

[EMS 1§LECON"TROL REQUIREMENlS OPS5026/22-5\ . . .. "
7.3 FEEDERSDEC.1994 t12iL]
BREAKER & DEVICE INDICATIONS (continued)
LINK INDICATIONS
GENERAL
5 July,1S95 Appendix 2 relecontrol Standard 7

EMS TEl.ECONTROL RE;QUIREMENTS OPS5026/22 ..5.. .••..•. ..••... r '(I"""'". ...........,
DEC 1994~13f26
7.4 BUS COUPLER AND SEC'EIONITRANSFERBREAKERS
CONTROLS
BUS COUPLER & SECTIONITRANSFER BREAKER INDICATIONS
IiJuly. 199!i Appendix 2 Telecontrol Standard

EMS TELECONTROL REQUIREMENTS OPS5026122-5 "DEC 1994 9/26
7,,5 TRANSFORl\1ERS
CONTROLS
ANALOGS
BREAKER INDICATIONS
S July, 1995 Appendix 2 Telecolltrol Stand;ud 9

EMS TELECONTROL REQUIREMENTS OPS5026/22-5 D~~~1~"~~L,10/26I7.5 TRANSFORMERS
nmAKER INDICAT]:ONS (continued)
Ln~K INDICATIONS
TRANSFORMER DEVICE INDICATIONS
TAP CHANGER INDICATIONS
5 July, 1995 Appendix 2 Telecontrol Standard 10

EMST~L- ,"0 _ . "'_' __ '.
, DEC 1994 11t!2.6
CONTROLS
F.EAI(ER INDICATIONS
5. July, 1995 Appent\~l(2 'Telecon(rol St"n<tal'd,\
"
11

I EM~ Te~lSc9;M'f'~O~1Ri~,Q:MJJ:REMENTS OPS502~J22-5.
~.6 SIItJNT REACTORS
BR11-:AKERlNDICATIONS (continued)
.LINK INDICATIONS
5 July, 1995 App~ndi)(2 r"lecontroi Standard 12

~-------,~,~------------~----------~~~~~--~EMS TELECONTf{OL REQUIREMENTS OPS5026/22-5 . DEC 1994 13/26
7.7 SHUl'TT CAPACITORS
CONTROLS
ANALOGS
BREAKER JNDICATIONS
LINK INDICATIONS
5 July, 1995 Appendix 2 Teteeollt~()1Standard

EMS TELECONTROL REQUIREMENTS OPS5026/22~5 DEC 1994" 14/26 . I7.8 SERIES CAPACITORS
CONTROLS
ANALOGS
BREAKER,INDICATIONS
LINK lNDICATIONS
5 July, 1996 Appendix 2 Te!(!(:otltrol Standard 14

EMS TELEGONTROL REQUIREMENTS OPS5026/22-5 II DEC 1994 '15/26J
7.9 STATIC VOLTAGE; COMPENSATORS
CONTROLS
INDICATIONS
Ii
ANALOGS
5 JuIV, 1995 Appe!ldh< 2 Telecontrol Standard["OJ
15

[}MS TELECONTROLREQUH'{EMENTS,., OPS50Z€3t22-o
7.10 "STATION LEVELBUS ZONE INDICATIONS
AUXILIARY SUPPLY INDICATlONS
GENERAL INDICATIONS
6 July, 1996 Appendix 2 T~letontt()1 Standard 1("

ISMSl'~LeC'()W"'ROLRIt.Q{lliREMENTS OPS5026/22w5
7.10 ,STATlONLEVELJ1SC 1GJ94.•••1712(J
cOM1\roNICATIONS CONTROLS
COMMUNICATIONS INDICATIONS
WEATHER INDICATIONS
Ii JUly, 199$ Appendix 2 Telecol1trol Stal1dard 17

[E!J18 TELECONTROLREQU!.l~~MENTS OPS5026/22-5
7.11 SECURITY
DEC 1994 1'8/26
,,f"')
CONTROLS
INDICATIONS'
7.12 INTEGRATED VAI.lUES
SENt OUTS PERGENERATOR ANDPER TRANSMISSION L~
5 July, 1995 A~pendiX 2 Telecontl'ol Standard 18

~~-----~~-------~----~~----.~------~--------------~}[ EMS TELECONTROL REQUIREMENTS OPS5026122-5 DEC 199419126J
8.0 AL,ARM STATE CONVENTION
CONITEL RTUs
In the table below, STATE "0" indicates the normal state for devices and, indications, and the alarmstate for ALARMS. The CONTACTS column gives the state of the contacts When this state is selected.The convention is that a closed contact indicates the desired state,
See Section 8.1 for ERTU and double bit indications.
CONTACTS CLOSE FOR ALARM CONDITIONCONTACTS OPEN FOR BREAKER/LINK OPEN CONDITION
5 July, 1995 Appendix 2 Telecontro! Stalld~rd

.,.,......---~_,. .........~ .... ~,._.;'~......,EMS TELEGONTROL REQUIREM(NTS QPS5026/~2-5 DEC 19~i~,20/26------~----.--~--------~--~----~~.--~~
S.l ALARM STATE CONVEN'TION FOR ERTUs
III the case oftll? ER"ru, the indication is the inverse of the CONITEL RTU. Column 4 of Sect" ••8.0 gives the relMant contact states for devices and indications on CONITEt RTUs, when applied to theERTU, the STATE "0" and STATE "1" referenc(;ls ml~~tbe reversed.
DOUBLE BIT INDICATION CONVENTION
In the case of doliblb·Jit indications, the following conventions should be followed.
The qvo bits in tl)e table below.will be referred to as the X and th~)e~~it,where the X bit i~the MostSignificant Bit and the S bit is the Least Significant Bi.t. .
STATE TABLl~
INDICATION CONVENTION
5 July, 1995 Appendix 2 Telecontrol Standard 20
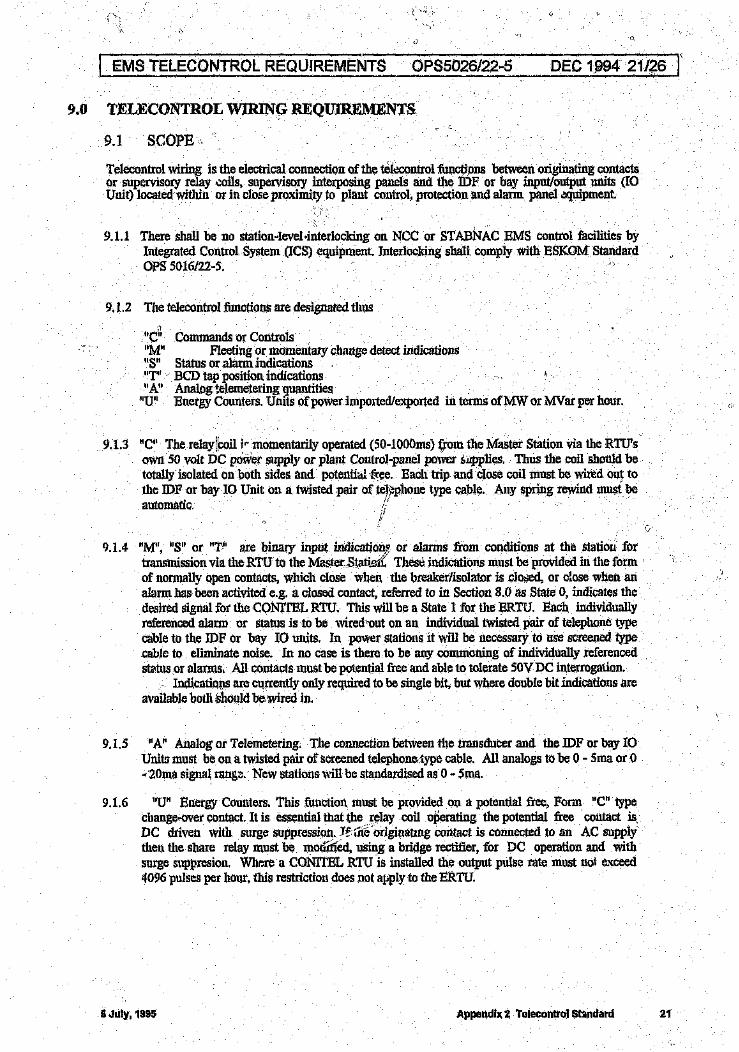
I EMS TELECONTROL REQUIREMENTS OPS5026/22 ...5 DEC 1994 21/26 r9.0 l'EI.JECONTROLWIRING-REQUIREMENTS
9.1 SCOPE
Telecontrol wiring is the electrical connection of the telecontrol functions between originating contactsor supervisory relay coils, supervisory interposing panels and the IDF or bay input/output units (IOUnit) located within or in close proximity to plant control, protection and alarm panel equipment.
9.1.1 There shall be no station-level-interlocking on NeC or STA.BNAC EMS control facilities byIntegrated Control System (ICS) equipment. Interlocking shall comply with ESKOM StandardOPS 5016/22w5.
9.1.2 TIle telecontrol functions are designated thus
ltd"~A""S""T""A""U"
Commands OrControlsFleeting Ormomentary change detect indications
Status or alarm indications .BCD tap position indicationsAnalog telemetering quantitiesEnergy Counters. Units of power imported/exported in terms ofMW or MVar per hour.
9.1.3 "C" The relay!~oil i"momentarily operated (SOwlOOOms)from the Master Station via the RTU'sown 50 volt DC power supply or plant Control-panel power t.applies. Thus the coil should betotally isolated on both sides and potentia! free. Each trip and close coil must be wired out tothe JDF or bay 10 Unit on a twisted pair of tei:llphone type cable. AllY spring rewind must beautomatic 'i;'
):
9.1.4 "M", "S" or "TI' are binary input indication,~ or alarms from conditions at the station fortransmission via the RID to the Master$tattei{. These indications must be provided in the formof normally open contacts, which close when the breaker/isolator is closed, or dose when analarm has been activited e.g, a closed contact, referred to in Section 8.0 as State 0, indicates thedesired signal for the CONlTEL RTU. This will be a State 1 for the ERTU. Each individuallyreferenced alarm or status: is to be wired-out on an individual twisted pair of telephone typecable to the JDF Or bay IO units. In power stations it will be necessary to use screened typecable to eliminate noise. In no case is there to be any commoning of individually referencedstatus or alarms. All contacts must be potential free and able to tolerate SOVDC interrogation.
Indications are currently only required to be single bit, but where double bit indications areavailable both should be wired in.
9.1.5 'W' Analog or Telemetering. The connection between the transducer and the IDF or bay 10Units must be on a twisted pair of screened telephone.type cable. All analogs to be 0 w5ma or 0.. 201l1~signal range. New stations will be standardised as 0 - Sma.
9.1.6 "U" Energy Counters. This function must be provided on a potential free, Form "C" typechange-over contact. It is essential that the relay coil operating the potential free contact isDC driven with surge suppression. Jf llfe originatmg contact is connected to an AC supplythen the share relay must he modiried, using a bridge rectifier, for DC operation and withsurge suppresion, Where a CON1TEL RTU is installed the output pulse rate must not exceed4096 pulses per hour, this restriction does not apply to the ERTU.
S July, 1995 Appendix 2 Telecontroi Standard 21

I....-.~E_M_S_T_E~L~EC_O~~N_T_R_O_L~R_E_,;,Q-'-UI_R_EM_,;,E_,;,·...f\__lT....-8_' ~O P...:..$_50_2...:....6/.:..;;;~2~~5..:___ D_,;,E..:;....:!C_1__9--,94_;__··_22::.:..;/2::.:..;6~· ~I·10.0 AU'r,~),MATIC GENERATION CONTROL REQUIREME~TS
ThISsection gives afunctional outline of AGC requirements and soine details of the equipment tobe. provided together. with specific . functions. Before proceeding with the Interface . design forconnecting the AGe to the turbine units, please refer to drawing 0.64/134971, contained on page 26 ofthis document, This drawing shows all the signals. currently required by System Operations for AGe.The general outline of the modifications that have been made to more recent Power Stations are shownin this diagram. Further information can be obtained from System Operations and/or the EMS co~ordinator at Simmerpan.
This section should be read in conjunction with the ESKOM Standard on Power Station SpeedGoverning (OPS 5015/22-5.Rev. 1)
The Setpoint Megawatts analog. specified in the Analog table of Section7.1 and Section 7.2 must beprovided for all stations that ate required to be on A.G.C. to enable setpoint control to be performed;
The following nomenclature is used in this schedule>
AGC is. Automatic Generation .Control as carried out by the National EMS facilities, a'~NationalControl, Simmerpan,
EMS AGC. CONTROLLER is a self-contained unit control system at the station that communicateswith the EMS computer via the EMS Remote Terminal Unit at the station and forms part of theEMS equipment adjacent to the RTU in the Comrnunication and Metering room.
EMS CP - EMS Control Panel (provided as part of the EMS equipment) located on the EOD in themain control room or unit control room.
RTU EMS Remote Tcniilnal Unit at the station (provided as part of the EMS ~quipment)located in the CQmmurti~\ationand Me~f}ringroom. (', .
UCP Unit (turbine-generator) Control Panel, Orrelay panel, located in the rela)'va.ul("room.
UCD Unit Control Desk, located in the Unit Control Room,
10.1 FUNCTIONS TO BE PROVIDED BY POWER STATION DESIGN
10.1.1 SuPERVISORY ISOLATION SWITCH
As the National EMS is part of the Supervisory function, it is necessary that .each UeD (UnitControl Desk) be provided with a supervisory isolation switch. The switch must provideisolation of the EMS AGC controller raise and lower signals from the load controller or turbo-generator control equipment, When the switch is "ON" the unit is available for EMS control.When "OFF" the unit is not available and the external trip circuit must be open. See drawing0.64 113497. '~
\10.1.2 SUPERVISORYINDICATIONL~S ,
Two indication lamps of different cOlour~l as per Power staton Stand.-"\1:dsare required at theueD. ' '
Governor Control-AGC ':liffiD" (preferably).Governor Control-Uf'P ltGREEN" (preferably).
See drawing 0.64 1I34Q7
At the UCD, the suggested location is adjacent to the existing load dispatch ON/OFFindications.
5 July, 1995 Appendix 2:,.1elecontro;i Standard 22

EMS TELECONTROL R2QUIREMENTS'----~--10.1.3 ANALOG INDICATIONS
OPS5026/22-5 DEC 1994 23/2fL J
GEl\r.ERATORMEGAWATTS
An analog indication (preferably 0 - SmA transducers, 0 - 20tnA are acceptable) of generatormegawatts is required. The signal must be provided over II twiste¢ pair to the IDF.
SET POINT MEGAWATTS
An analog indication (preferably 0 - 5mA, 0 - tOlnA acceptable) of generator set-pointmegawatts is required, This signal must be provided over a twisted parr.
HIGHILOW REGULATING LIMIT
An analog. indication (preferably 0 - SmA, 0 ...20tnA acceptable) of maximum and minimumpermissible MW's for c(~ntroIof tile machine i~required if available and applicable.
\\u10.1A .DESIGN CONSD1~ERATIONS
IiCONVERSION CONS~JwrS
At au early stage in the design work, the conversion constants of the transducer output milliampsagainst megawatts are required to enable the correct scaling resistors to be ordered.
NATIONAL EMS liON/OFF" CONTROL
Potential free change-over contacts within the AGe controller give an indication to the stationthat AGC is "OFF" Or "OW. It is operated by push buttons on the EMS Control Panel, If poweris removed from the AGe controller, the contact will fail over to the "OFF" position. Seedrawing' 0.64 113497 ."The supervisory Isolgtion switch on the UCD shoqld isolate the AGC controller raise/lowerfunction connections'irom the load controller or the \'urbo-generator control equipment, towardsthe (heavy current) MDF. See drawing 0.64 113497.
NOTE: .The AGC controller can only be selected to "AGC ON" if external trip is not activated (i.e,machine healthy), and supervisory isolation switched to "ON", (Contacts on this switch are inseries with EXT TRIP).
RAISEILOWER CONTROL INPUTS
A raise and lower control input connection is required, by means of which the turbine governorset point (or target load) setting can be increased or decreased by the Natio ,J EMS AGecontroller. This control k;mt connection could be connected to the same coinrol input usedby power station operator to effect load changes. It shall not be possible, however tosimultaneously perform control from both Nat. EMS and the UCP or Mimic.. Since the EMSwill make regular and precise load changes it .3 essential that no intermediate contactors OJ:relays be present between the AGC controller output and the governor set point control circuits.Otherwise this will result in distortion of; and delay of, control pulses from the Acecontioher, However, control of the turbine unit at the unit can be affected in the normal way.When the unit is controlled in this manner, a "set point" operated contact, to be provided, opensand effects external trip to the EMS AGe software.
In the Case of governor control bear with selectable ramp rates, the maximum or another pre-defined ramp rate shall be automatically selected when the unit is selected to AGe. This isnecessary because the AGe control system tuning will be based on the set ramp rate. There isno danger that AGC will cause the unit to exceed the maximum permissible ramp rate due toextensive ramp rate protection provided ill the computer as well as the AGe controller ofthe individual generating units.
5 July, 1995 Appendix 2 'reler,ontrol Standard 23

10.1.4 l\)~~(lN C'®~SIDBRATIONS (continued)c.
EX1ERWAi;~FONcTrON
'1'h(l~tl'(pi;~$\:!~Qf~!>':lilllcttonis to allow the station to regain control of the maohine in ita. evento . ;of;the tnaohine. The trip will be caused by an aonofmru. condition(.lU the
.\~fM5~.l!.t'.•the turbil1e driver openlted the llmt, or It unit oapability restriqtion
thlil. AGe controller to trip itself'(i.e, change from AGe "ON" to HOFF").thismetered to the National EMS computer, by the Natioual EMS RTU.series normally closed contacts are to be operated by t~e~ise and lower
..~1il mimic to iuitiate a trip." Generator islanding should also inn"~tethis trip.
r')11tocK • ro}ISE AND LOWER{"k'~>' .,'}
fils for future use, where it may be necessary to temporarily inhibit the AGC·~M'Clrpulsing, whilst other SI'll;POIloperations are in progress.
~~!l;l~~;i,l!UlMg~!lerated program allow~ th~ power station operator to rai$e or lower. the machineQU~uttot4e limits set on the EMS Contil~l Panel.Use oHhis function is telemetered to the Nat. EMS~p.mt:iutef:;;,.The :srvrs Control Panel push button ON/OFF mnst be "OFF" before a local raise or lowertu:tQgram is i¢IiElted,ltowever When'ihe local raise or lower programjs initiated, for the durationorpulses, flit indication is sent to tbe UCJ.)that AGe is liON",
~.\
5 July, 1995 Appendix 2 Tltillcontrol S~ndard 24

DMSTELECONTROL··REQUfREMENiS11.0 :POWERREQUIREMENTS
n.r RTUIERTU AND RELATED EQuIPMENT
OP85026/22~5,"""'"
DEC 1994· 25/26 . {I
:the .National EMS Remote Tenninal Unit (RTU) together with the EMS Automatic GenerationControl System (AGC controller) and EMS Control Panel (EMS CP) require three (3) separately fed50 volt DC power supplies derived from a battery and charger system which can maintain supplies fora minimum period of 8 hours at the following rates:
New RTU installations will be supplied with ii'll ERTU which requires a supply as shown below
1 CONlTEL: "Cleantl SOVDC 6 amps, S hours)) e.g. 150 AlII
ERTU : "Clean" SOVDC 10 amps, 8 hours)
2. "Cloan" .sOVDC 9 amps, 8 hours;
3. IIDhty" 50VDC Jamps, 8 hours;
The "fall of" voltage should llot be less than 35 volts at the end of the 8 hour period. It follows that 1& .2can be from tIle same system.
S~~ply No.1 powers the RTU logic and modems.
Supply No.2 powers tIle AGC logtc.
Supply No.3 powers the optical isolating equipment used to transmit indications from the H.V. yard.
The above requirements are laid down in OPS 5001l22~5.
The ERTU can be supplied with a number of different input voltages as indicated below
1. 110VDC SA2. 220V AC 2.SA3 220V DC 2,5A
11.2 TRANSDUCERS
The measurement transducers must be fed by power supplies derived from a battery and oharger .system WIlictt can maintain supplies for a minimum period of 8 hours.
5 July, 1996 25

;------E-M-S-T-E~L~E-qO....".. N-T-R--O-.~-R"_E-Q-_'O"_'R__;"'EMENT8---0-P-S~""_rf26I-22_''...5---D-E.........C--1-99--4-2-S-/2-o......--,:1
12.0 DOCUMENTATION
Nil.
13.0 RECORDS
Nil.
14.0 REVIE\,,';DATE
This document is due for review by 15December 1995
15.0 DISTRIBUTlON
G-E-ME-B-M(Generation)T-C~E..MNPTM&C ManagerPM&C ManagerS..T..MT-P-MT-O-MP-S-MPSLibraryD-T-1\.1DT AB ChairmanN-P-MS..O-MECS ManagerPT(ECS)
5July,199S
MegawattparkMegawattparkMegawattparkMeg,\lwattparkShnmerpanMegawattpark.MegawattparkMegawattparkAll Power StationsAll Power StationsSimmerpenBelville, Cape TownSimmerpanSimmerpanSimmerpanSimmerpan
,1 copy10 copies10copies1copies
10 copies5 copies5 copies5 copies2 copies (16 stations,1 copy (16 stations)
10 c(,~pies(AU Distribution Engineering)20 copiesl(l copies:4 copies~ocopies2 copies
26

APPENDIX 3 ..CONTROL STAFF TASK ANALYSIS
Appendix 3 National Control staff Task analysis
IntroductionThe methods of working and the behaviour of members of Nanonat Control wereanalysed for both quiescent and disturbed network Jonditions. T-he task analysis tool, theform of observation followed by group question and answer sessions with each shift. Thequestions were divided into two basic groups, one for quiescent conditions and one forclisturbed network conditions. The responses from the! five shifts were almost identicalwith some of the shifts expanding on one or two areas based on the Individual membersexperiences in other utilities.
OV(;!Niew of the National Control RoamESKOM's National Control has a four control desks. One tor the shift supervisor andthree for!he controllers woo are responsible for;II System frequency and'generator loading• System voltages• Transmission network state
The primary task of each shift Is to maintain the health of the netdork. re .~a.bywhich the system state is determined are;• System Prequency• Voltage profile across the network• Total system lasses.. Automatic Generation Control performanceII Overall electrical security of the nelw')rk
The instantaneous state of the power sy. n is determined from the dibfJ'ays and alarmmessages sent to the controllers from tile RTUs,
Display Facilitieseach desk is equipped with two or three 425 rnm (or 17 inch) high- solutlr,ii cciourmonitors, a Qwerty keyboard, dedicated statlon selection keybrC\fo and a mouse.
An audible tone is triggered when .evar a Breaker trips, This audible alarm has to beSilenced manually by the control staff each time It is triggered.
Each controller has a dedicated telephone link to each regional control room, powerstation and dlstrlbutlort station. He is thus able to contact all his customers directly and tobe contacted by staft fJ1 the field.
Along one wall of the control room is mimic or Map .Ioard. The Map,board Indicates thestate of all power lines belonging to National Control dynamically via light emittingdiodes. each Une has an embedded meter displaying the Instantaneous megawatt loadand its direction.
CRT Displaysj'he state of the power system is determined from the following displays available ateach workstation,1. Station one-line displays2. Station alarms pages3. SYstem alarm message pages4. System voltage page5. . Tie·linf;l overviews'S, Generation status display
5 July, '1$95 App~ndi)(3 .:task "m~lysis 1

,PI?ENOIX 3 ~CONTROL STAFF TASK ANALYSISStation one-line
These operator displays are blrd's-eye model of the actual physical structure and layoutof a single pOW6r station or distribution station.
The one-line representatlon supports the abstract view and the bottom layer Of themental modell{sed by the control staff during daily operatlons. The order of the electricalequipment on the display matches the physical arrangement at the station.
The graphical data on the one-line display is limited by character graphics functionality todevice states (breaker and link) and analog values. See fig 1 in appendix 7.
$tati~t'Alarm pagethis is a tabular list of the status elements and their current state at the statton asIndioated in Figure 3 d~\Appendix 1. The alarm points are displayed under the headingsof ~• Communication Alarms• Station Alarms• Panel Alarms
The elements are displayed as a list since there is no other SUitable means ofrepresentation on the one-line displays. The relationship of the alarm or status elementdata is usually alphabetical.
It IS Important to note that tl:lere is no posltlon relationship between the alarm elementsand the points on the one-llne displays otner than by the name of the alarm will matchone of the electrical objects on the one-line display.
Alarm messagesWhen ever there is an unauthorised change of state in the network. the data acquisitionsystem or SCADA software notifies the control staff via message otherwise known as an"alarm message", This can be Seen in Figure 3 of Appendix 7. At the same time thecorresponding element will reflect the new stale with a change of colour and shape ortext on the displays ..
Each alerm message consists of at least five fieldS;o T .me Indicating when the event occurredo Priority of the messageo Name of the station at which the state change occurredo ..\ nne of the point changing stateQ 1he current state of the point
Alarm BinsAt national control all elements are associated with a device alarm bit'. This is in contrastto the classical manner of displaying alarms by station.
Alarm bins are defined by the name of the device type. For example;a Breakers (1 national and 3 regional)'" Generator Unit Breakers• Natlonal analog limit infringements1 Regional analog limit infringements (we have three set of ret:1onfll alarm bins)• Feeder 111"'1 or panel alarm bin:" (1 national and 3 regional)• AGC alarms• KV and freqllency limits
There are approximately 40 alarm bins in use on the eSKOM system at National Control.The alarm bins are displayed in the two lines at the bottom of every display and are ~.characters in length. A maximum of 20 bins can be Viewed at anyone time. ...
s July,1995 2

APPENDIX 3 ..CONTROL STAFF TASK ANALYSISEach desk is set up to reoetve a specific sub-set of the alarm messages. It is theresponsibility of the controller manning the desk to take the necessary action followingthe arrival of the message. Each messages has then to be acknowledged and deleted.
System VQltageThis display provides the control staff with a complete list of all busbar voltages fromevery station under national's control. Each station is listed vertically and the associatedvoltages at the station are placed horizontally next to the station name. J
The stations on display are grouped by region rather than alphabetically as shown InFigure 4 of Appendix 1.
Tie~lineoverview ')\ !/
These displays and the Mapboard afe the top layers of the mental model';.'~lsedby fifocontrol staff to establish position relationships between the different stations in thfA'.)owernetwork. See figure ~ In Appendix 7. //
//The information on the tle-Hne displays is a subset of the data from all the ont1i;h1eswithin the view area. The factors determining the size of the one-line subset [';1 display isa function of the space allocated to each station. The smaller the space, th~')ess datadisplayed per station. 1;/
/;The control staff influence the design of the tieuline displays based on ttl/level ofabstraction needed for disturbance control and restoration. ///!The various Man Machine Interface tasks carried out by the 5 man!~ift (four active andone spare) for each of the four work areas are listed below; /: /
Stafftas/(sEach shift has five members - four active and one Spare. Tj:'i;/actual tasks carried out byeach staff member depends upon which desk he is on. E~UI desk has its ownresponsibilities. The scope of this task analysis is limiie>l::a) the MMI actions related tothe USeof the National controt computers and not to V,;.:! full range of responsibilities.Details are included where applicable to MMI interapt.6n of other activities.
The individual tasks for each of the four desks ~r~~r quiescent conditions are;
SupervisorContinuously monitor the overall state orr)power network and the performance of shiftmembers using the system displays. O{f)t guidance and assistance to the shift memberswhen required. ,.
The primary outputs for the Shift supervisor are;Ii Sufficient generation8 Valid load flow• Optimised loading• Acceptable vol~age profile• Short term contingenoy plan.. Accurldte Morning report• Secure power system
During disturbances make decisions on system restoration, liaise with management onthe state of the power system. Once the disturbance has started and after the system hassettled down he has to;
• Determine the Cause of the disturbance• Inform management of the event and the scope of the damage.
5 July, 1995 Appendix 3 .Task analysis 3

APPEN'DIX 3 ..CONTROL STAFF TASK ANALYSISII Determine the sequence of events.. Start rest9ra~i(1),@II Write up Hie Incideliit report
To fin(;) out th~ ~~tgll~,(!)f J:iilt>faull his only source of information is the alarm logs and theone-llns diSI1>J~lY!?£Pi:§Q~ssiqlils with field staff assist in isolating the exact problem but thisIJ5,uaUytakes r:lIace after the system has settled down.
Frequenay ControlTht~tg:s~ involye:s th~ frequenoy of the power system. The primary display used tomonlt&1t1tb'e,gelll11ijfatloA 15 the AGe display Shown in Figure 6 of Appendix 7.
Iitthl'l~lt!:r'b~nlil!1inUj~equlescenf tasks are;IililSul!!~'tfuiaUJtl:!i"$Y$'tem frequency is kept at 50.00 Hertz.
of coet reserves at the various power stations to achieve the.towestusing the economic dispatch programis suffiolent spinning reserve for the Automatic Generation Controluse in the event of an unexpected losses of generation.is al,,,vaylS sufficient plant avaiiable for the next 24 ~48 hours.
of control and the rest of the shift on the current state of thesUpply at the power stations.the power stations on actual and potential loss of generation particularly in
o:f "ri$k~of-tr'ip" activities on a generating unit or feeder.
involves getting the power from the power station to the distribution stations.by minute quiescent tasks are;
after the security of the network by ensuring that there are multiple connectionsbelWeEmthe different stations in the power network.Authorl!';EI the handing over equipment to the regions for maintenance.
• 00 the necessary switching of lines in accordance with daily mamtenance schedule.• Where possible ensure that the system voltages are at there correct levels.• Read, understand. aoknowledge and delete all the alarms sent to work station CRT.ill Call out maintenance staff to investigate and correct problems highlighted by the
alarm messages.
lti!)lta.§e ControlThe primary task Is to ensure that the system voltages are kept at there correct valuesfollowing any network switching or any change in generation. This is particularly relevantwhen the transmlsslon desk is very busy or there has been a sudden loss of generation.The role of the voltage controller considered to be the most cruolal of all the tasks in thecontrol room.
The quiescent activities are;• Monitor all the system voltages.• Monitor the state of voltage control equipment such as reactors and capacitors and
switch them in and out as required.• Monitor the tap posltlons of all transformers and change them if required
SCADA DeSignIn principle SCADA is designed to report the change of state of every point monitored bythe system. This theory of operation is based on the assumption need to be informed ofwhat is happening
5 July. 1995 AppendiX 3 ..'Task lInalysis 4
APPI!,NiDbt 3'..~(jvNtRO'LSTAFF TASK ANALYS!S
Pi~tl/.r:btJnr;~ceJ/Jliti~l!~t::~" ".~;::::.. I:. i!!~t~! )'~? ; .,. •
Durin€! ~ dislurrpafiToe,tbe qtj[eso-ent tasks still oontlnue but added them are the problems ,-c:>oHhe drsfurb.~a ~ystem. .
:"-.::,:>
o:rrue¢diliJ;~··.Q.~tl\lf:li~alitiq(:'l·~~t~I~$i!~.r,Iil'eC;(lmEls·~ltr~,:'I'eI1t,two phasesof activity take place. on. on th.e other is behaviour and aotiyity of the (I
~~tmI~l~11~l(3,~~~E..e and e~e~d of the<problem.
pf atarm messages sent to all control staff
from the area of concern at the crucial momentdU~to increased alarm load and display demand.
G July, 1995 Appendix 3 .Task analysis 5

APPENDiX 4 ..M'MI FUNCTIONALITY COMMENTS
Appendix 4 MMIfunctionality comments
IntroductionThis appendi* Q'ontains the eomments made by the control staff on t<Jpics related to theirdaily activity While using the Character Graphics Man Machine Interface. Thesecomments are in response to the questionnaire sent to aU the shifts.
To Ic Comments b National Control staffAlarming in general, AlarmPa e la out and content.
Aftefa fallover, an the 120 comms alarms are re-output, both in alarm and"refqrn to norma! - Questipn - why cant the exceptions be reported?NMd to be able to mark or reserve alarms to prevent them from beingd'(~'letedb aocldent,
to be able to move directly to the station name mentioned in theessa e. Not have to use the system menu.l~ybetween the audible alarm and the display of the Breaker
"atatl'll messa es Is far too IonF'i:rfto many unnecessary alarms, each of which has to be acknowledged
, ((leleted - .articular! durin a disturbance .. are alarm messages sent to National Control from manned stations
le·~F[)rakensburg). 'Why cant the Hydro and Gas station alarms be sent to the Loading orFre uenc desk instead of the Transmission deskThere is a constant number of nuisance alarms generated by th.o Hydroand Gas stations ~can these not be eliminated?There are an enormous number of false alarms- need to prevent (hem atthe RTU.General roblerns with the transformer alarms from lnqa aneNeed se uence of event data if ossible from the RTUs.
'G€~~~~mr::ITi'1p)flroOfbiiile;rmn;s~TTrco;oo~mTliUL«c}ii.hiltr;;imi1ie~.'iiSsss:PpeBin1ttruacknowledgIng and deleting alarms messages thanfix;n the roblem durin disturbances.PageS and pages of frequency alarms are generated each time thefreauenc moves in and out of limits durlnQ a disturbance.Following a disturbance, once the basic cause of the problem has beenfound the remaining alarms are ignored and deleted. The problem withdoing this is that an important alarm message may be missed in the heatof the moment. Need a better way to display alarm data in eneral.
I Navigation - Need to be able to move to the station one-line display from any place inwhich the station nam~ is displayed.When traversing a menu M preference is for automatic wrap around at thetop and bottomDefinite need for cordless mice to drive the disela}' call-up,On dual headed consoles would like the cursor to move from CRT to CRTautomatically when moving_ off the screen bounda!y. --Need geographic map indicating physical layout of stations and linesNeed global indication map - on demand I to indicate current view insystem overview display.
IAutomatic ~enel'ation Control Need to be able to base load a whole power station at the same time andto cancel the reguest during a low freguencll incident. _On standby display need colour change In the sent-out-megawatt values ifthe value changes b~ more than 5%Very big need for capability diagrams of all generating units
5 JtUy, 1995 Appendix 4 - MMI Functionality 1

APPENDIX 4 - MMI FUNCTIONALITY COMMENTSl)
IMapboard Need to Indicate on the Mapboard that. live line maintenance is in.Pfqgress,.
like direct access to station one line displays from dedicated push buttonsrather than from a CRT menu.
1,-.;..T~le~.I.:.:.;;n~e_;:o",-r..;;_ov..:;..;·e;;.;.r..;;.;vj:.;:.ew.:.;.._;:q;.:.;;iS:J:;p~lla:LYls=-.•-+.;..N~.o~tl1appY.~lth the exi$ting 6 page (2x3) overview displaysWould prefer to have system overview display match the Mapboard layout.Have four or five display pages horizontally rather than 2 by 3 that don'tline up with the Ma"",p~b~oa~rd;;;,;',--:--~-:--:,:_:,;-__ ~~---""",,----;Need to indicate live line work on the tie-lines
Need to be able to Indicate split busbars at a station
Need to indicate when a feeder is not-in-serviceNeed to indicate helicopter line spraying,
Need to be able 'to access additional data on demand from the RTU aboutthe state of the protection and group alarm details following Breakers,Transformers, svc etc, problems.
Provlde intelligent and look ahead spelling checks when entering stationname data to avoid text ent roblemsGet consistency for all data entry activity (Tag and NIS have are notconsistent.Need to move the manually entered data for the regions o"t.:>separate liststo reduce the time it takes to find national data,Be able to ente ..text Of information against a point and to have anindication of the message on demand and prior to issuing a control to thedeviceProvide indication of live-line work and helicopter washing on the overviewdis la sProvide the ability to inhibit all the alarm elements at a device and anentire electrical oblect, e. ,a feeder, enerator or transformer etc.
@uQerYisoty CO_9trol Indicate that the SuQervisory Inhibit state Of a device on the one-lineBefore allowing a control to be sent to a device, display any operatorentered notes in a pOIJUDwindowProvide the ability to cross check parallel lines prior to issuing a control, ifr-M~line is alread~ oQenwarn the controller'Warn the controller if he is tripping the wrong breaker of a set of doublelines after opening one end,
5 July, 1995 Appendix 4 - MMI Functionality 2

APPENDIX 5 ..STATIC VAR COMPENSATOR
Appendix 5 Static VAR. Compensator
IntroductionSample of Status and Analog element data available from a static VAR. Compensator.This device is a good example of the phase three protection scheme that uses digitalinputs fed directly to the ERTU from the protection equipment that monitors and protectsthe whole Compensator.
Signal Description RTU RTU Pin No.Digital Inputs Plug
No,
SVC OFF (COMMAND 1) PBi C32SVC ON (COMMAND 1) PB1 C31SVC OFF (STATUS) ~HIGH PBi C30SVC ON (STATUS) ~LOW PBi C29SVC TRIP (COMMAND 1) PBi C28'AAISE,VOLTAGE SET POINT {COMMAND 1} PBi C27LOWER VOLTAGE SET POINT (COMMAND 1) PBi C26RAISE REACrlVE OUTPUT (COMMAND 1) PBi C25LQWER RE;ACTIVEOUTPUT (COMMAND 1) PBi C24MANUAL CONTROL SELECTION_(POMMAND 1) PBi C23 -~AUTOMATIC CONTROL SELECTION (COMMAND 1) PB1 C22.MANUAL CONTROL SELECTION (STATUS) PBi C21AUTOMATIC CONTROL SELECTION (SrATUS) PBi C20MASrER TRIP MAIN (-K9) PB1 C7MASTER TRIP BACK..UP (~K19) PBi C6TNS $WITCH(-S1~ IN TEST POSi"!;lON PBi C5SPARE ,.-"
SPARECONTROL SYSTEM SLOPE RAISE {COMMAND 1} PB4 C30CONTROL SYSTEM SLOPE LOWER (COMMAND 1) PB4 C29CAPACITIVP- DYNAMIC RANGE (SrATUS) PB4 C28REACTIVE DYNAMIC RANGE (STATUS) PB4 C27AUXILIARY AC SUPPLY ESKOM (STATUS) PB4 C26AUXILIA~Y ACSUPPLY AUX. TRANSFORMER (STATUS} PB4 C25MMI CONTROL SYSTEM HEALTHY PB4 C24MMI CONTROL SYSTEM FAILURE PB4 C23AUXILIARY AC SUPPLY UNHEALTHY PB4 C22AUXILIARY AC SUPPLY FAILURE TRIP ~ PB4 C21EXPANSION UNIT FAILURE ~_~4 _~20HV VT MCB'S TRIPPED F C19VALVE ROOM 1 AIRCON {ALARM} ~1PL cfar¥:~LVEROOM 2 AIRCON {ALARM} PB..,. 6:1'7CHARGER 1 FAILURE AC PB4 C16~~GER 2 FAILURE AC PB4 CiSCHARGER 1 FAILURE DC PB4 C14CHARGER 2 FAILURE DC PB4 C13CHARGER 1 DC SYSTEM ABNORMAL PB4 C12,CHARGER 2 DC SYSTEM ABNORMAL PB4 C11DC BOARD 1 DC FAIL PB4 C10DC BOARD 2 DC FAIL PB4 C9DC BOARD 'I DC ABNORMAL PB4 C8DC BOARD 2 DC ABNORMAL PB4 C7
5 July, 1995 Appendix 5 ..static VAR compensator 1

APPENDIX 5 ..STATIC VAR COMPENSATOR
5 July, 1995 Appendix 5 -s{atic VAR cQll1pensatpr 2

: I
SJuly, 199~ Appendix 5 -static VAR compensator 3

APPENDIX 6 ..GLOSSARY
Appendix 0 G,lossaryThe following are explanations of words and abbreviations used In the document.
Alarm processing
Bay Processor
16KR or B.'eaker
CommunicationLim~loading
Communicationprocessing
5 July, 1995
//This, is the service provided by the ALARM program to all other softwaremodules in the computer system. Applications needing to alert the control staffof specific alarm conditions, S€lndthe ALARM program the necessary values asparameters in a messaq« packet. Tht ALARM program unpacks the values,builds up the AnCIl text according to predefined structures and places the textmessage in the appropriate buffer.
Th~ MMI detects the existence of new messages In the buffers and re-dlsplaysthe ALARM buffer name in the bottom line of ail displays. To see the alarm text,the centro' staff select the buffer name and the appropriate alarm message"display is sent to the screen. The control staff then acknowledge and delete thealarms once they have read them.
In high voltage substations there are S() many signals that it requires adedicated computer to handle and record all the changes taking place for eachelectrical object such as a feeder, transformer, etc, Figure 2-3 show therelationship between the individual Bay Processors and the ERTU.
The word "bay" comas from the physical structure and location at the substationIn which the feeder Is installed. Thus tile pro: sssor associated with a particularfeeder, is referred to as the "bay processor",
A large switch used to turn on and off the electricity at the power stations anddistribution stations.
The general terms usee!to indicate the state of the breaker are tripped (open)and closed (on). A breaker Is operated eilher manually, remotely from a controlroom or automatically by protection equlprnent,
The overall communication line loading for a single comms line or channel Wafunction of : j,
l\l/• The number of RTUs on the communications line., The number of grQUpaddresses per RTU., The rate at which each group Is scanned• The number of data bits per groupII The number of interlaced control requests Sent to the RTUs
The cornrnunlcatlc, '.lIne loading should not exceed 80% of the maximum linecarrying capacity IVI anyone cycle period. The period Is determined by the scanInterval of the gr/ ap with the lowest priority. The 80% limit Is Important If theqUAlity of the communications lines are poor and there are a large number ofretries needed to cater for missing or lost data. Later versions of softwareincorporate algorithms to maxhntse the data acquisition rate so as to aVoidinactive periods while k'~eplng the line load below 80%.
Due to the limited bandwidth in the communications links, there are usually 6 to8 RTUs per circuit, set up In a party line fashion.
Each communications link also provides alternate communications paths toanother 6 to 8 RTUs should the primary communications link fall. Themaximum number of RTUs per party line was determined by the vendor andthe data loading, l.e, the data quantities at each remote required to be scanned.Each RTU, depending upon the RTU vendor, would have up to 64 unique groupaddresses which would allow between 300 and 400 bits of data per group
App~ndil( II ..GIO$$ilry

DAQ
Data Base
Data processing\\
EMS
ERTU
ESTEL
,; July, 1996
APPENDIX 6 ~GLOSSARYaddress to be sent back to the Host per scan. The hlstorlcal restrictions being aoornblrtatlon of the baud rate the Host computer functionality and power.
TM current SCADA systems make use of fibre optic communication links andwith the latest computer hardware the CPU power is not a problem for dataaoqulsltlon but is for the control staff, due to the quantities of data presented tothem. Historically, there w!'Jre in-buHt restrictions in both communications abilityand CPU resources, that limited the quantity of data that could be sent to theHo,st for processing from the RTUs.
rhese restrictions acted as a physical filter both to the data that could betransmitted and the speed at which it arrived. These delays gave the controlstaff time to breath and take stock of the situation during a disturbance. Withthe faster and more powerful CPUs and better communications (via satelliteand fibre optics) the problem of data overloading becomes a very seriousindeed.
Data Acquisition. The process of moving data from the RTU to the Host
A storage area In the form of a tables used to hold the all the data needed bythe computer programs.
The data brought back by the SCAPA module, Is stored In a central data base.The type and structure of the data base is vendor specific. The market doestend to drive the deSign but currently it is determined by the needs of the tasksthat interface to It.
Since SOADA autlvity has to run in real time. all 110 to the SCADA data basehas to be as fast as possible, Thus, the design of the data case is around thestoring of the latest data from the RTUs and not the ease of maintenance. In alarge real time process control system, there are many different data basesusually one per application. The vendor provides means of cross linking databetween the data bases to avoid duplication .
.It is the responsibility of the SCADA software to determine what has changed atthe RTU by comparing the current scanned data with the previous scan andIssuing the appropriate text message to the ALARM program for any changesdetected. The text messages are usually hard coded and there Is little or no waythe control staff can verify the accuracy of the majority of the messages, shortof sending a someone out to the station to get confirmation that the message isvalid.
The data coming back from the RTU can only be Identified by its group addressand an asscclated Index. Currently there Is no additional processing done toconfirm the validity 1.7the message received from the SCADA system.Depending upon what has changed. it Is sometimes possible to verify thereported action by observed changes in associated elements of the powernetwork.
Energy Management system. The abbrevtatlon used in the Electrical Industryto reter to the complete supervisory and control computer system used in themonitoring and control of an Integrated power system.
Enhanced Remote Terminal Unit. It is similar to the standard RTU but containson board computers that provide additional functionality over and above theRTU.
ESKOM Standar£J Telecommunications Protocol. This protocol was designedand specified by ESKOM to avoid the problems of being locked Into proprietary
Appendix 6 •Glossary

lAP
InterconnectedPower System
MMI ..
M," Mauh'i:n,1\)Interfa~e•/)
One ..line display).1
Periodic OataAcquisition
Protection
I) July, 1996
6 APPENDIX 6 ..GLOSSARYc vendor' communication hardware anc sottware. The ESTeL Pf9tocol is based
on the Open Systems Intaroonneot Reference Model (OSI-RM), developed bythe Internattona! st~ndards Organisation (1$0) and CCITT. The protocol usesthe OUftent internatIonal Telecontrol standards proposed by the IEC.
Intelligent Ala,nn Processor. A software program used to summarise theresult$ of multiple al€lrm. messages and reduce the number of messages sent tocontrol staff. They aria usually "rule" based which makes them very expensiveto mlilintain tn a ol1anging environment.
leleotrloity Is transmitted from power stations to distribution stations and toijo:n&drnSts at dIfferent voltages. The National Control Centre is only concernedwlUHne lill'strlbutlon of power above 132 KV. Voltages below 132 KV are the!fespoflsibU1ty of the regional distri.bution stations,
c. The power network above 132 KV Is referred to ('IS the Interconnected PowerSystem or Main Transmission System.
This OaVElrsboth the h~rdware and software used by control staff to monitor andcontrOl the integrated power system. II'l general terms it refers to the methodand means of exchanging Information between a parson and a machine. itprimartly encompasses the method of displaying data on. a computer screen.
The primary reason why data is brought back from the RTU is to allow Controlstaff to "See" what is happening at the remote site. This is done via the ManMaohlne In{erface,(MMI). ,
The MMI up until quite recently was limited to character graphic CRTs that~~ovlded apout 96. possible shapes apart fromthe ncrmr' alphabet In 7 or 8dQlours~_TM electrlcallnd'>lstry Is in the process of moving towards what is knowas FuJI CZlraphios. In which the conventional CRT Is replaced by a desktopwQrkstatlon offering Pan, Zoom, aeclutter, Popup windows and Pull downmenus.
The displays built with these tools have up to 32 000 colours and the usercreates the Shapes required from the simple primitives of clrcle, Box, Polylineetc,
At present the development of the Full Graphics MMI is still It its infancy and itwill be a number of years before formal trends and needs have been Identifiedand Incorporated into the control rooms.
A blrd's eye view of a single substation drawn symbolically. Figure 7-4 is anexample of iii one-line diagram.
During "periodlc" data acquisition, the Host requests speoltlc pre-defined datasets or groups of data from the RTU pre-set Intervals.
All groups at the RTU are scanned at different rates depending upon the datatype and the rate at which data changes. Obviously the faster the better! Thedata In each group Is transferred to the Host Irresll6ctive {If what it1f)S changedat the RTU. This is an overkilfln one way but during a disturbance thecommunlcatton line loading does not change where as the Host prQoes:~lngdoes. .All electrical equipment used by utilities Is protected against faults that canpotentially destroy It. A protection scheme has two parts, th~ detectioneq·jipment and the physical method of interrupting the electric ":', TM detectionequipment uses the rate change In voltage and current to determine where thefault Is located and acts to trip'the breakers nearest to the fault.
Appendix G • Glossary 3

Phase 3 protection
Polled exceptionreporting
Power ApplicationSoftware
PLC
Prototype
RTU
Remote TerminalUnit
i.J July, 1$95
APPENDIX 6 -Gl..aSSA~Y
.Electronic rather than physical protection sensing equipment used by ESKOM'to protect !lJe power system from faults. This form of protection does not rely onmechanical relays to determine the existence of a fault. The PHASE 3electronic protection equipment lnterraces directly to the Bay processor RTU.
The data at the RTU is divided in to a number of categories (between 2 and 8).The Host initiates (fata transfer from the RTU by sending a "request forchanges" message, specifying the category of data it is expecting.
If the RTU has any changes to report for the seJ~cted category, then thechange, identified by its group address and in(.l~x into the group is dispatched.This same pddressing structure is matched at the Host which decodes thechange message and produces the appropriate canned message for the MMI.
If no elements have changed In the requested category the RTU returns a "nodata" response.Once all the RTUs have peen upolled" for the current category the nextcategory Is processed until it Is time to start over again.
The RciUs are polled at least once a second depending on the baud rate andthe amount of data returned to the Host. It becomes obvious that he lineloading will change considerably during a disturbance for "exceptl.:!n" reportingas will the Host processing.
Software used to carry out "what-W' studies of different states of the electricalnetwork as weI! the automatic control Of generator output,
/'
Programmable Logic Controller, a device In which a series of rrogrammedcommands C;flnbe Inserted. The device is used to control industrial plant, In theCase of a feeder, all the functions that would have required physical relays arereplaced by logical relays In the PLC. The PLC outputs are usecjo drive thephysical plant to match fUnctions sent to the Pl_C from the ERTU.
A model of the real thing 1 mainly used to testing ideas
A Remote Terminal Unit, Is an electronic devices Situated at a power station 01'distribution station. This. device acts as a link between the plant and the SCADAsystem. It is the interface between the plant and the Energy Control computersystem situated at the control centre. An RTU Is connected to tho eleotricalequipment via optically isolated wiring. (The optical Isolation is to prevent faultcurrents and induced high voltages destroying hIghly sensitive low Voltage RTUequlpment.)
The Host communications to and from tho RTU are provided by various meanse.g. Microwave links, Power Hne carriers and Telephone qata Circuits,The older RTUs are made up Of a number of standard hardware componentssuch as:• Host request address decoding arid requested data export4¥ Status "Ilputs (from 1 to I; bit valu~~~)• Analogue inputs (8 to 16 bit dJ1lues)• Host"Qpmputer contf:?1 request, execution" AC9'amulated power measuterrients (12 to 32 bit values)• Communications channel selecnon hardware• PC 1/0 connections• Power supplyElectrical equipment status inputs are interfaced to the RTU at various v\)lta~eand current levels such as 2Q mllll amp current loops. (Field bus protocol rs
AppendiX ~ • Glossary 4

!')
..GL.OSSARYan appearance though there appears to be a reluctance by
$ to offer it,}"R.TUs, Measurement or t4Al1alogue" inputs are converted to digital
a $i;lared Analogue to Digital converter in the RTU just prior to the,-,1!l.a'li!ell1lgtelemetered to the Host computer,
RTU designs, the RTU Is not longer a hard wired inaotive deviceactuall'W a powerful micro processor with considerable facilities.
rhe~e faofUties allow it to provide a number of additional functions and to addvalt,te to the data sent to the Host. It is this, so f~r, unused capability that cangreatly change the way SCADA systems operaW.;n the fyture.
For example the latest generation of RTUs process an input data from the yardevery rnllll-seoond, They have their own data base into which all status andanalogue values are stored ip digital form. This allcws the RTU to do limitcheoking em the analogues ahd advise the Host of the fact when an Analoguehas exoeeded limits or Is In an alarm statel
The general name that refers ~othe process of obtaining data from an RTU ore~TU. Electrical Utilities (such'~s ESKOM) are monitored and controlled viacomputer based Supervisory Control and Data Acquisition (SCADA) facilities'from a central control room.
Simulator
The Substations and Power Stations comprising the power network are IInkecl tothe control room via a network of cornmunloatlons clrcults in a radial mode. Thestate of equlpment in the power network is retrieved anc:,ctelivered to the centralcomputer via the "Data Acquisition" part of the SCA011 module.
When the control staff need to alter the, state of an electrical element. such as aSreoker, they send a control signal to the Breaker Instl'Uctitlg it to Change state,The control message is delivered to the deVice by the "Supervisory Control"part of the SCADAmodule.
Ttmsihere are two distinct parts to SCADA, firstly the acquiring of network dataand the subsequent supervisory control of the network objects.
A device used to emulate an active industrial process wlthout the risk ofdamaging real plant,
Similar to one- line displays but showing inter-station connection data frommany stations. The tie line data includes power flows, Voltages and breakerstates for all stations on display. There are tie-line displays for all regions in thepower network.
l·ie ..Line Displays
5 Jull{1 19!15. Appendix II • GII)$sil~Y 5

APPENDIX 7 - COPIES OF DISPLAYS
Figure 1Appendix 7 Copies of displa'ys from the ESKOM control system
5July,1995
: One-line display of the Drakensburg pump storage station.The top of the display indicates the electrical configuration and the state diagram at thebottom show the current modes of the four units.
...Z-G:I'll
":;)0....
(l) I.!l,(i) 0:::"III W:t:t-l p:}.Jz to0
Z1.1
<t0 W~
~eIII, a:::!~ 0' ()'It "'0
" I::l za
~ /!(!)ti/ .11
""...~i!1
~.0:;) 0III
G(i)::I'
!>l>I!
.e
H:t 'J) "" (l)
"" .... 1\ • "".... VI... ""
Appendlx,1 • One line displays
0 0Z 'It:z 0.., .11 Il. 0 .JH I Itt: tt: 0
~ Il. l-tt: ::l
III -G: 'ItH, .H .".. ... •
o a:z: <t
Z 00II. "I Il. 0 .J
~ I IIt It 00I- Il. l-I It ::l
III 'It 'It... Ui 1"
•• 11
o a:z 'It:z 00
HI , .. Il. 00 .JM I ,It a; 0
I~U
1

<ItCo.C
~....(D(I)CIt
ORA""''',SCAOAE:Ot·Il...INElG,-!
:g"t:J
'"!:ICo.)f.....o::IIII
s-IDC-iii'tI;;~III
N
EKA
NOOD.R£k'£NSBERGriiI:til:I~rn1I~~':ii~iIiR_"''';liIU::::l
N?RNOftNOP.NORNORNOR
SATTERY_COHMON'Iii SEARER_LPU_)(M I.T_FLCARRIER_SSS_XMIT_FLOOHITEL_i_XNO_r"AILOON ITEL_3_1 NO_FA It_,OONITEL_OHARGER_FAI,L
-TAT-I:-ON::ALA.RMSNORNORNOR
NORNORNORALRNORNOR:
SUS_S.RI?_O?ERATEDSUS_ZONE_DISAGREEMNTOONrROl._OOMMON
AUTO_U~fF _CONTROl-_ FA I LDR:KLF _.WATER_LOJ-l_'rR:IP-HEAD._RAOE_GTE_ONT _FAX LKLBR:N_WATER_LOW_TRI?MDF_ZER:O_VO.L TSSTATION';'EH"ERGENOYc
f>ACNE.-'lRL'ARMSNORNORNORNORNORNOP:NORNORNORNOR:NORNORNORNOR
'+0eO?LR_GROU?1'te0_sF-~_NON_URGENTG/Hi_U/F_?MP'_TO_STNOG/t1i_U/F _STND_ TO_GENG/MZ_U/F_?MP_TO_STNOG/t1'2_U/F_STNO_ TO_GENG/M3_U/F_PH?_TO_STNDG/M3_U/F_S'rNO_'r0_GENG/t1'f_U/F_PMP _TO_S'rNOG/Wt_U/F _STND_ TO_GENPEGSS __ SF~_O IF.F_PROTTRr"R_:l._GR:OUPZTR:FR_'l:_GROUP'2VENUS __ SF~_OIFF_?ROT
NORNORNOR.NORNOR:NOR
NO.RNOR
NOR:NORALRINORNORNOR:
NORNORNORNORNORt-tOR;NOR:NORNOR:NOR:ALR c·NORNOR:
eS-JUL-19,S le:3'fIGZ
<~> ••• II it ••
Iii SEAR5:R_LPU_REO __ FL.OARRIER_SSS_REO __ FLOARRIER_UPS_FAILOONLTEL_2_IND_FAILOONITEL_,+_INO_FAIL.l:'R~KN_IT_URGENT
SUS_ZONE_OC_FA.ILauS·"",ZONE_OPERtfTEO
,+ee_INTER_SUPPLY_FAILORK L.F_OATA_EGVFSE_FA! L.FIRE_ALARMKLSRN_OATA_EQ/FSE_FAILKLSRN_WATER_HIGH_ALAR:MSEQ_STAR:T_OO_FAIL
'fee_SF-~_UR:GENT_ALRMIii G/M:I._GENERAL._ALAR:MG/Hi_U/F_SOO_TO_GEN~ G/M2_GENERAL_ALAR:HG/M'2_U/F_SOO_TO_GENIii G/M3_GENERAL_ALAR:MG/M3_U/F_SCO_TO_GENIii G/M'f_GENER:AL_ALARMG/M'f_U/F_SCO_TO_GENP'EGSS__ GROUPl. o-r~Ffl;_1_GROUP:l.-~''rRFR_'Z_GROUp:I.VENUS __ GROUPi
zo00--0!il,<::rO0_=::-_.._::r::rCllCIl.:::!!f.ll~~;;;=s ii)
:. 3a-gace<CIl--'-h.e. ...CIlO0.3Ei" -_ ::r
OCll::To-. ....CIl.ll>CIl::o>"ceCIl...,:::s:0(1)cO"-aCpcCi
-0C
3"'0
~,oiiIceCIl~~o?
11cO.·C(ilK'I
",'"0."mZoX......& '.
d/.Flo~.
1l-meno"TlC(ji"'0r~CJ>

en'-c~...:l-ao"'CIt
-n«'S"c:iVVl
::"0<1>:Ja.X"'I•o:::q
ia.co~II>
w
LEST,ALARMrONLINz~.,aCURRENT PAGE 3:
TOTAL NO OF: ALARMs i3G
EKAGLOBAL ALARMS _PRIORITY STATES ~. i '2:- 3 Lf 5 6 7 Blila T.... R~FRESH THE _IUS.PLAY. _ii.l§Ji'B11- - :t-1W11-CONTROL ;AUD!SLE _ : _REAl?_ .. f* 1* - - - --..,it.rua; Ii<DATE PERMISS.ION t1AP'.
§iliII
10:ze,e,+ *3 RTU GRTVLM ONLINEONLINE.HIGH
eS-JUL-i~gS le:3Lf;'+e
:aSU'l::::a:::s .. iW ::NOC~EOK_-;MC'J!!;'4''''.j
CHANGED STATE TOOHANGED STATE TO
t1VA 3'fSe 3lfS7
CHANGED STATE TO(SFN OONSOLE 1. HEA
Q..(".j»
!!:t -<! .:<1ll"S.-oc- 0' o·III -!ll ""-en=r- .-m (II 0" "'tJ!!L 3 l:!: "'C.... CD:;:, mt::en«:!geno ZCIIl_
!1l cg s: 0cn('!l ~Ill- _
..., !t§ .....!1l(l! .,-10 ¥::1" .... _.(ii" m .. ,(ii' ~. 0£3 :Bc: - mcn!~ . en0'3 a'<3l .....,........en II
~~ "=(0 _£cn C/):::J g; 1iJ'~;:;. r-O:o »-_ -<! g- C/)-'030-0::10-ena'(11-
Q..!!t.C"1Il'<~~.::Tz(II O.(Il-0<11»=rg~
le!Ze.~ez. *3 LINE EKF~;LS-OTRL_O.t1F-HATCHD~1.e: 'Zs' .$ *S :s:IMpAN LOOAL LO_OUVHA_.sQ.O_t1 I4
tete!:$~ *S NA"T"ERSHED ER SAT"T"ERV_COM110t-l ALARMFAILEDFAILED
07:33~S6 PS R:~GI OARRIER_LPU_XHIT_FL ALARMj .:£ iiUC ••• J;;w:-:'!!!!!t-:mli.IIi!Ut ...-"j _
0$: 16:'2.'':' P3 RTU ARIESee'e'2;'Lj?:P3 EKA OEVICE: NATtONAL_AQSFN;1A09:S6>:2'+ ?5 THESEUS CARRIER_LPU_Re:O __ FL ALARM(:';e '.tJ<1 :.Ife PS ATHE:NE ERTU OARRI ER_L?-U_SEARER: ALARM

at<-
II
ccO
~c
..... Ol<C
'"~
en
~"CIIII::JQ,x·'l.oifiQ,
Dr"CI
~
•
~99'fee'f0'2~99:If:1Z'faE>lfas~SE>lfa'f'fe<f&.;.·04-lf$9lfl.a'+1elfa:1FlflZlfa1399:393lf01'}a6-lfa3 Flf0....~9Z rlfe3'+02395393395'fa5
Q'fa::3'f1.1
2S5Z9:ZZS1
ZS~Z·S'f
ZSl
Z7'9Z'2:SZZE>Zi9Z17
ZZ3
~7S,+a3 F<fa5lfa5 F
Z6.Zr F29:-[
EKA 05-JUL-199S 10:3$:a6-ZZ0KVNAHEI76-5KV 'fe0KV Z7SKV 11_lrD
13'f133 HARTHP~!R:FOSKr;:HERMSWITK?HATHSHIOA.SMER:CR:TABOR:HERMSPLUTOTRIONBIGHRWAI~HSWATR:S5P.ITSARARTKOH.TPHINR:VA.f>OLLC~OYO-JUf>TRESSLNLETHBHERAf>EVRSTGLOCKBERNNHERAKKFNVERON
HERSYIMf>ALINVUBUMFLZNORMNGRGOLVENUSORAJ<Nf>EGSSCHIV!...INCN!.)KLRWTCAHONTUTUKALf>HA 75qBETA 755LNOERTHESS?ERS'SHYDRAf>Q·$DNG.ftASSNEf>TNf>EHBRK R;ONSARIESAGGNS'HELS-JUNOAURORKOEBGAOp..OHULDR8:ACOHPALMTPROTSOROESF<BUFF'LILLOVKRIELSOLZEUS'KOliATKRSPN Z7'ARNOT =~:->2-HENOR 'f;!)'f 13E> NESTR ~ ~ _::J F"ERSS - 'f6-VULON 39S 136. LUCKH F F 0 F HYDRA -96-K~NnL lfiq F VIOTA: f>OSDN -Z.OUVHA 'f:1'f KOHSB GRASS -ZMATLA 'f07 ZS9 BUFFL -a FROCKO 13'f IMPAL - 7
[ "'M"~ 2~. in '~LOV 2
VOLT_SUM,S'CAOAroNL1NE10,a~~ I.. ZZ~KVNA~6-5KV 'f00KV Z7~KV 1.~ZKV
135137 '"9:993
135
i35135 F1Z913Z13513513E>
13Z13013313313E> ORAKNGARPSVOKLFPORRXPALMTHULDFtACOf>S'KOEBG
139135 F1351~'f
-lSS1-0-0-a-aai.
-'H..
"Hz'f054a3399396-3954-al
'{-alf399
413399 F
:1
'2:S12S3Z79'2:SSF 2S:?
2
z-I;)-0-a-a-0is:-30
13ZK -.;o:::o:::ra::zz~1391391~913.
F 134 F1.33135133137 F.136.
zs.. F
zss.Z7.z....s- ~'2:7 rzee.ZSZ27S.~S52S9-27S'2:79ZS5'2:91Z70'2:7.Z9G2e2ZS:52S9
9a9a1:3:S:
13:3:13913:S
..1SS
1 2 3 'f
F 135 FFF
8.9 F.(l) M
13:q1:3:Z
F 13S FF 923 q
-G-0-a719
33-a
SVCi 5V02
53 F-89
:T~::!ro ..., :._OUlo en _.UlUlUlen ..... ,.....Q,~~-m<~::SOCD.·~ ..;:;:3"'ll)CDecsa.::sm-< sa.11=t':::!:ecog(j)3 r: r=.... _{ til::T::s-CI>CI>(J)o..!!l UI :g1ll ,.~ ~g.~::;::somUl::lO_.Ul 0::Sll)::S.g @I;§"mO-!!la!!l-om ll)0-"' ....::s (1) .....• 0.0
~.g:..,(1)Jg~_. ::s-Oll)::s .....~s:::s-CD(1)0.(') -.ll)~-gOl~a=<':!o
Ul- ;::;:_.IU::secc.mOOUlIUmmOl
»"'0"'0rn:zcX-...(
no"0-rn(J)
o"11C(ij'tJ
~
~

Figure 5
5 July, 1!11J5
.A..Qpr::NDIX1 ..COPIES OF DlSPLAYS: This is a typical regional Tie-line display indicating the MW line flows and variousvoltages of the stations, The solid rectangles indicate closed breakers, holl!;Jwones showthat the breaker is open. .
(0:t':t'+
APpendix 7 • One line displays 5

eft.~1:
~~,CDCDeft
AREASTAT~RTGEN~ONLXNE~e.s~g~ 1.S S Y S T £ M
FREQUENCYCURRENT S~,.SS6- HZSCHEO 50.000 HZ ~S:IAS : 300. 0 MH/. 1.HZ.",?<_,
TItiE ERRORCURRENT G.00 SECCORRECTION"?" :N10 ::OFFSET; +0.7t3S HZSTART ;01.-JAN-1.979 aa:88STO~ :20-0CT-1.999 1.5:30
!JRT VALUE a. 0Fl1H INACjACE HZ-COM~ 1.S HH •
PLAI·n' CU~NAME GENORA"N ~~l> I GAR~S .~-,::; PALMT 'E'.'C VOKLF Eo·tD::s 1-(YDR -7c.><"'" I ACCPS ~2. I ~ORR:X 00 GT -z::stD J AGc.;.NS -$3'S" t.'OGN ~€;6tDg. ~RN~T ~S7~ OUVI-{A 3SZ't'C HEHOR 13SSco'< KENOL Z7if3II' '''RIEL ZZ6.9LETHB 3'"1-91.MATMS: 3Z3SHATLA i779TUTUK 3'.2:8$FOSS Z'.2:3ZZ
KOES:G iS60NUOL i$60TOTL 2'+0$'7
EKASTATUS
as-JUL-i99s 10'35'25
STATUS :ONMOI)E :f!JiSIIlFLAT F'REQHOY
[. ~ INTERCHANGE ~MH 1BOT SHAN A 36. . SCHEDULED 0
MISO : 0FRANOISTOI-lN 0
L~INADV.ERTENT. "Pj!\. 'I'BAOK. AUTO?":NSTART:01~OCT-i99aSTOP =01-00T-199E)MANUAL'?":NSTART:81-00T-i99E)STOP :E)1-00T-1998+FR-TIEHH+G
[ACE--- i$ M~ir
1i"'·SIR~D ZtfE)s::9]
fCt-------- ~~RRENT ~q0$~
LOCI{ S'rATE
II]LOAD IN tutTOTALM!SQLOSSES
Zqesi€I'+55
r------,
RATE <HH/HIH>UP DOWN9'76 9'7S
EOONOMIC DISPAToHOONTROL ADVISORYLAMS:,DA _ W.. ..<H Z1 ,'7SCRANO/HWH)LAST RUN 10'35 10.3iRUN NOW~:Y EN
97~€I o
INADVERTE;NT HWH(UNOF'FICIAL)PEAK 5'tE).5 '.2:0.'.2:RANO/I1HHOFFPI{ Z16..7 i$.5RAND/f-'WH
CI) :PLTSTAT :PLOSTAT :UN:ITSTAT
976-
:Ur-UTLl:I1S : I;:;; 1IIIt"l1llf,,'iI]i II
1.'.2: 1E)3X'.2:3:001'.2::1,015.Z8
CUR SCHEDMW MWG.0
¢t.a: ZE)
RESERVES ~'---OPER REGUP REGON3$09 .. Ifl 1.35$S:Pl:Ni$s0
e iSS WMii:il eis-5a 5€I 6If .="'>1 1358
:1'ti!f§!iI)
co ::T 0$, o -I(J)oo:::!::T:::J"~ _ ll) (J)CII""ll)_@c;:::l-:P::t~C£5=G)O .....(J)(J)Q:::!:;:r-·oo..'0 (J):::J0-'in G) .::;: ~..gj3,(J)CII:::!!m• :::J0 (ti'<
~ ~ 0. (ii'll) __
g-@offi:::lo:em_(Do 0..~ ....... ....,.,..ll)::TVlO~. Q). nr -.lllae.5,.....VlO-(J)'0 :::!0tT-Vllll~~ 0 CDIII _.0 __:::Jv,:::J::To o·::;"m-OOCll.::J_=,~IQOCIIIll::;:Eio..CDCII (J) tTo0..'< ....0';02:5=8_(J)!a.(J):..._0.. 0 »::rQ:::!S.(J) .., ~ 0c-§n3(J)CO 0 ~-(J).:::!._,00::;"0O .... OG)!!l.G):-(J)lll-r-l:::J:::l(J) ::T (J)~~~§l:;:r 1).).-'(J)a...,oCIIco :::JlU"c (J) .....~~CIl~== f!:~.:rI.\):::Jo..~Q;cc;S:O'<-o-...
"TlcO'c@0>
»."."mZCS<.....oo:gmCJ'Jo"T1C.....t»"tJ
Sen
"cmo(J)

APPENDIX 8 - REFERENces
A~pendix 8 Reference
[11
f~'
EPRI, "Detailed Survey results", HUman Factors Review of Electric poJer DispatchControl Center, Volume 2 , JUly 1981, Electric Power Research Institute ,EI..-1960
[Lj EPRI, "Operator Information Needs", Human Factors Review of Electric Power DispatchCOntrol Center", Volume 4 , July 1981, Electric Powel' Research institute ,EL~1geo
EPRI, "Information management and Presentation", Human Factors Review of electriCPower Dispatch Control Center, Volume 6,. July 1981, Electric Power Research Institute,EL·1960
IEEE, "Tutori~1 Course Fundamentals of Superv:s~cy Control Systarrts", 1981, 81 EHO188-3-PWR \'
[3J
[4]
[5] Amlink, H. Ligtvoet, P. Van S:..,.l,P. "Data Flows. Data Processing and Data Presentationfor Power System Operation and Control ", CIGRE, International Conference on Largehigh Voltage Electric Systems, 1987, Study Committee 39 meeting in Tokyo, JapanOctober 26-31, 1987 \\
[6] Mahadev, P.M. and Christie, R.D. "Envisioning Power System Data: Concepts and aPrototype System State Representation", IEEE, Vol. 8 No 3August 1993, pages 1084 -1090
[71
[8]
Helander, M. "Handbook of Human-computer Inter~ction", Elsevier Science av, 1994
Faxer, M. "Man-Machine Systems for Power System Control, ~!~tritical Review", IEEE-Intern"ttlonal Conference on Systems, Man and Cybernetics (lC$MC)1985
Bernard, J.-P. and Durocher D" "An expert System for Fault Diagnosis Integrated InExisting SCADA Systems". PICA Conference on Power Industry Computer Applications.4~7 May 19931E8E u
(9)
[10] Tadec, Y. "Alarm Analysis in the ~rench Regional Control Centres", CEGLr:C .. ERE TDivision, EDF 1989. ';
[\
['11] Merlin, A.S. "Latest developments and future prospects of power system operation andcontrol", Electrical Power & Energy Systems, Butterworth-Heinemann Ltd., Vol. 16Number 3 1994.
[12] Kirchen, Wollenberg at al, "Controlling Power Systems during Emergencies: The role ofthe Expert Systems", IE1EEComputer Applications in Power, April 1989.
Ackoff, Russell .1..., "From Data to Wisdtlrtl, Presidential Address to ISGSP, June 1988,"Journal of Applied Systems Analysis, Vol. 16, 1989
[13)
[141 0' Amour, P.R. Block, W.R. "Modern User Interface Revolutlonlses SupervisorySystems", Il:EE Computer Applications in Power. January 1994.
McDonald, J.R., Burt, G.M. and Young, D.J. "Alarm ProceSSing and Fault DiagnOSisusing knowledge based systems for transmission and distribution network control", IEEETransactions on Power Systems, Vol. 7, No. ~; August 1992
Engel, B., Muller, H'I "An intelligent user lnterface for emergency operation", CIRED, lEEConference Publications No:373, Subject area 4, Operation and controllh Public SupplySystems, 1993.
[15J
[16]
5 July, 1995 Appendix n • References 1

[17]
[18]
[19]
[20]
5 July, 1995
APPENDIX a - REFEREINCESVale, Z.A., Machado e M6ura A., Fernandes M.P., Marques A., "SPARSE - An,Jr~elligentAlarm Pro'Bessorfor Portuguese, Substations Control Centres",'lnternational,{Jo!mial ofEngineering Intelligent System for Electrical Engineering and communlcattens; SpecialIssue on ESAP'93, December 1993. .
Staggers, N'I Norcia, A. F. "Mental Models: concepts for human-computer ili....:II'!\lcUonresearch", International Journal on Man-Machine Studies, 1993, Volume 38, pages 587-605Tallus RTU tunetlonal specification ..Westingtloi.lse UK.
ESTEL Telecontroi Protoool Speoification (Master/Slave) Functional Profile definition,~tepared by.Measurement and Control Oepa~ment, National PTM&(,\ TransmissionGroup, ESKOM, Revision 6, July 1993. .
AppellcliX II .. fMerellc;es

Author: Candy Richard Brodrick Charles.Name of thesis: MMI, SCADA and ALARM philosophy for disturbed state operating conditions in an electrical utility.
PUBLISHER:University of the Witwatersrand, Johannesburg©2015
LEGALNOTICES:
Copyright Notice: All materials on the Un ive rs ity of th e Witwa te rs ra nd, J0 han nesb u rg Li b ra ry websiteare protected by South African copyright law and may not be distributed, transmitted, displayed or otherwise publishedin any format, without the prior written permission of the copyright owner.
Disclaimer and Terms of Use: Provided that you maintain all copyright and other notices contained therein, youmay download material (one machine readable copy and one print copy per page)for your personal and/oreducational non-commercial use only.
The University of the Witwatersrand, Johannesburg, is not responsible for any errors or omissions and excludes anyand all liability for any errors in or omissions from the information on the Library website.