Longitudinal transformation of nitrogen and carbon in the hyporheic zone of an N-rich stream: A...
14
To link to this article: DOI:10.1016/j.pce.2011.05.003 http://dx.doi.org/10.1016/j.pce.2011.05.003 This is an author-deposited version published in: http://oatao.univ-toulouse.fr/ Eprints ID : 5715 To cite this version: Peyrard, D. and Delmotte, S. and Sauvage, Sabine and Namour, Ph. and Gérino, Magali and Vervier, Philippe and Sanchez-Pérez, José- Miguel Longitudinal transformation of nitrogen and carbon in the hyporheic zone of an N-rich stream: A combined modelling and field study. (2011) Physics and Chemistry of the Earth, vol. 36 . pp. 599-611. ISSN 1474-7065 (Unpublished) Open Archive Toulouse Archive Ouverte (OATAO) OATAO is an open access repository that collects the work of Toulouse researchers and makes it freely available over the web where possible. Any correspondence concerning this service should be sent to the repository administrator: [email protected]
-
Upload
independent -
Category
Documents
-
view
1 -
download
0
Transcript of Longitudinal transformation of nitrogen and carbon in the hyporheic zone of an N-rich stream: A...
To link to this article: DOI:10.1016/j.pce.2011.05.003 http://dx.doi.org/10.1016/j.pce.2011.05.003
This is an author-deposited version published in: http://oatao.univ-toulouse.fr/ Eprints ID: 5715
To cite this version: Peyrard, D. and Delmotte, S. and Sauvage, Sabine and Namour, Ph. and Gérino, Magali and Vervier, Philippe and Sanchez-Pérez, José-Miguel Longitudinal transformation of nitrogen and carbon in the hyporheic zone of an N-rich stream: A combined modelling and field study. (2011) Physics and Chemistry of the Earth, vol. 36 . pp. 599-611. ISSN 1474-7065 (Unpublished)
Open Archive Toulouse Archive Ouverte (OATAO) OATAO is an open access repository that collects the work of Toulouse researchers and makes it freely available over the web where possible.
Any correspondence concerning this service should be sent to the repository administrator: [email protected]
Longitudinal transformation of nitrogen and carbon in the hyporheic zoneof an N-rich stream: A combined modelling and field study
D. Peyrard a,b, S. Delmotte c, S. Sauvage a,b,⇑, Ph. Namour d, M. Gerino a,b, P. Vervier a,b, J.M. Sanchez-Perez a,b
aUniversité de Toulouse, INPT, UPS, ECOLAB (Laboratoire Ecologie Fonctionnelle et Environnement), Ecole Nationale Supérieure Agronomique de Toulouse (ENSAT),
Castanet Tolosan, FrancebCNRS, ECOLAB (Laboratoire Ecologie Fonctionnelle et Environnement), Castanet Tolosan, FrancecMAD-Environnement (Modeling and Analysis of Data in Environment), Allée des Demoiselles, 33170 Gradignan, FrancedCemagref, UR QELY Qualité des eaux et préventions des pollutions, 3 bis quai Chauveau – CP 220 Lyon, France
a r t i c l e i n f o
Keywords:
Hyporheic zone
Denitrification
N-rich stream
Reactive-transport model
Organic matter
Nitrate
a b s t r a c t
A combined modelling and field study approach was used to examine biogeochemical functioning of the
hyporheic zone in two gravel bars in an N-rich fourth-order stream (River Hers, south-west France).
Surface water and interstitial waterwere sampledmonthly (August 1994–January 1995), the latter in a net-
work of 29 piezometers in the first gravel bar and 17 in the second. In both gravel bars, the hyporheic zonewas
createdonlybyadvected channelwaterwithout any connectionwithgroundwater. Longitudinal chemical pro-
files of Dissolved Organic Carbon (DOC), nitrate (NO3–N), ammonium (NH4–N) and Dissolved Oxygen (DO)
were established for both gravel bars. Ambient and potential denitrification were measured in the laboratory
during the same period using the acetylene inhibition technique. Factors limiting denitrification were also
examined by testing the separate effects of nitrate or nitrate + carbon additions.
A 1D reactive-transport model was used to simulate longitudinal transformation of nitrogen in the hyp-
orheic zone, and to estimate the role of organicmatter (DOC and POC) in the biogeochemical functioning of
the hyporheic zone.
Denitrificationmeasurementswithnitrate andnitrate + carbonadditionsboth showed increaseddenitri-
fication, suggesting that denitrification might not be C-limited at this site. Observations andmodel results
showed the hyporheic zone to be a sink of DOC and nitrate, but DOC consumption appeared insufficient to
explain nitrate depletion measured in the two gravel bars. Field data were better modelled when an addi-
tional DOC source from the POC fraction degraded by anaerobic respiration was included in the model.
1. Introduction
The hyporheic zone (HZ) is the area of saturated sediments
beneath the stream bed and into the stream banks that contains
some proportion of channel water (Findlay, 1995; Triska et al.,
1989; White, 1993). The HZ is commonly defined as the zone that
contains at least 10% stream water and less than 90% subsurface
water (Triska et al., 1989). Research over the past two decades
has established that the HZ has a great impact for stream ecosys-
tem function and biogeochemistry (see reviews in Jones and
Holmes, 1996; Brunke and Gonser, 1997; Boulton et al., 1998;
Jones and Mulholland, 2000; Sophocleous, 2002; Birgand et al.,
2007) because hyporheic exchanges enhance the mass transfer of
dissolved solutes and particulates between the stream and the
stream bed, which contains metabolically active microbial com-
munities (Grimm and Fisher, 1984; Pusch and Schwoerbel, 1994;
Sobczak et al., 1998; Sobczak et al., 2003). Flow patterns in the
HZ create distinct gradients of physical and chemical conditions
(Hendricks and White, 1991). Gradients between surface water
and subsurface water develop by mixing of water with different
physical and chemical characteristics and by biochemical pro-
cesses in conjunction with the local residence time of water (Ver-
vier et al., 1992; Brunke and Gonser, 1997). In particular, flow
patterns may regulate the supply of oxygen and organic material
to the HZ, thus influencing hyporheic metabolism and the process-
ing of nutrients (Findlay et al., 1993; Jones et al., 1995; Boulton
et al., 1998; Jones and Mulholland, 2000; Hinkle et al., 2001; Storey
et al., 2004; Birgand et al., 2007).
Many studies have examined nutrient transformation processes
in the hyporheic zone, with particular focus on nitrogen, and have
shown that nitrogen dynamics operate quite differently in different
stream systems (Duff and Triska, 1990; Jones et al., 1995; Holmes
et al., 1996; Chestnut and McDowell, 2000; Hinkle et al., 2001;
⇑ Corresponding author. Address: Université de Toulouse, INPT, UPS, ECOLAB
(Laboratoire Ecologie Fonctionnelle et Environnement), Ecole Nationale Supérieure
Agronomique de Toulouse (ENSAT), Castanet Tolosan, France.
E-mail address: [email protected] (S. Sauvage).
Kasahara and Hill, 2006). A variety of factors can control nitrogen
processing. For example, Holmes et al. (1996) showed that denitri-
fication rates beneath a riffle of an Arizona desert stream were ele-
vated at the head of the riffle by downwelling labile DOC, and were
not inhibited by high oxygen levels in this zone. In contrast, Hill
et al. (1998) found that denitrification in a lowland agricultural
stream was limited by the rate of nitrate supply. Duff and Triska
(1990) found a negative correlation between denitrification rates
and DO along a transect away from a small forest stream. It thus
appears that the factors controlling nitrogen processing differ
among stream systems, probably due to differences in nutrient sta-
tus and quality and amount of organic carbon (Storey et al., 2004).
Other factors, such as sediment particle size (Jones 1995; Baker
et al., 2000; Findlay and Sobczak, 2000) and temperature (Pusch,
1996), also potentially determine the types and rates of biogeo-
chemical processes. However, despite the great number of studies
describing nutrient and organic matter transformations along HZ
flow paths, many challenges remain, such as the conditions that
determine whether the HZ will be a source or a sink of nitrogen
(Dent et al., 2000) and the role of organic matter quality for HZ
metabolism (Butturini et al., 2000). One reason is that most inves-
tigations to date have focused on N-low streams (e.g. Triska et al.,
1993; Holmes et al., 1996; Wondzell and Swanson, 1996), or on
systems where the activity of nitrifying bacteria in HZ or ammo-
nium-rich groundwater can provide a source of nitrate to surface
water (e.g. Jones et al., 1995; Duff and Triska, 2000; Pretty et al.,
2006).
In contrast to these studies where the HZ exports nitrate, Pinay
et al. (1994), Hill et al. (1998), Storey et al. (2004), Lefebvre et al.
(2006) and Kasahara and Hill (2007) found that the HZ in N-rich
streams is a sink for nitrate arriving from the surface water. These
results confirm the conceptual model of Jones and Holmes (1996),
who proposed that low dissolved oxygen concentrations in the
stream bed and high nitrate levels in the stream may result in a
HZ that functions as a sink of nitrate where denitrification is the
major nitrogen transformation process. The previous results also
highlight the importance of comparing HZ functioning in different
stream types (Stanley and Jones, 2000) and particularly the need
for further studies in N-rich streams (Storey et al., 2004).
In this work, we addressed the dynamic of nutrients within the
HZ by combining transport and biogeochemical activity in a mod-
elling approach based on field study of an N-rich stream (River
Hers, south-west France), where the HZ is created only by advected
channel water (cf. White, 1993) without any connection with the
groundwater. The model was applied to the data set: (1) to assess
the role of transport and reactive processes in the longitudinal dis-
tribution of the chemical components in the HZ of the River Hers
and (2) to estimate by numerical experimentation the rates of or-
ganic matter processing and the role of DOC and POC in the biogeo-
chemical functioning of the HZ.
2. Study site
2.1. Location and hydro-geological context
The experimental site chosen was part of the River Hers (south-
west France). It is a fourth-order stream tributary of the Garonne
River, the third longest river in France (Fig. 1). The Hers provides
a great opportunity to improve knowledge from less-studied
stream types as it is an N-rich stream in which NO3–N concentra-
tions in surface water of 10 mg Lÿ1 and more are common. The
Hers watershed occupies an area of 972 km2, and the river is
95 km long. The annual mean flow at the confluence with the Gar-
onne is 4.13 m3 sÿ1, with a value of 0.54 m3 sÿ1 for low water peri-
ods and 52 m3 sÿ1 for annual floods. The Hers is 20 m wide at the
study site and the mean water depth is about 2 m. The river flows
over Garonne alluvia composed of elements from crystalline silts
to gravels from the Pyrenees mountains (particle diameter 5–
20 cm).
The site is located downstream from the confluence with the
River Girou (Fig. 1A) near the confluence with the Garonne. Here,
hydrological and morphological conditions are particularly
adapted for the study of HZ biogeochemistry, since the river bed
is located on a molassic substratum which disconnects the river
and the HZ from groundwater inputs (Fig. 1B and C). The hyporheic
zone is thus created only by advected channel water (cf. White,
1993) and consequently nutrient transformations in the HZ can
be investigated without any influence of groundwater intrusion.
The River Hers receives important quantities of peri-urban zone
effluents and drains agricultural land. Water quality is thus poor,
with high NO3–N concentrations in surface water (10 mg Lÿ1 and
more) and high Chemical Oxygen Demand (COD > 80 mg Lÿ1) and
Biochemical Oxygen Demand (BOD5 > 25 mg Lÿ1).
2.2. Equipment
Two gravel bars (GB1 and GB2) were investigated for this study
(Fig. 1B). In 1994, the site was equipped with a network of 29 piez-
ometers in GB1 and 17 piezometers in GB2. Piezometers made
from PVC (diameter: 4.5 cm) perforated along its entire length
were introduced until the impermeable substratum (1–1.3 m
depth) was reached. These piezometers were grouped by transects
(5 transects for GB1 and 7 for GB2). Previous modelling works at
this site have shown that flow in the two gravel bars is mainly lon-
gitudinal (Boly, 1997; Mear-Caubel, 2004). Piezometers in the
same transect were thus considered to be replicates.
2.3. Field work
Patterns in nitrate (NO3–N), ammonium (NH4–N), Dissolved Or-
ganic Carbon (DOC) and Dissolved Oxygen (DO) were determined
by measuring temporal data along the two gravel bars on five occa-
sions at monthly intervals, from August 1994 to January 1995.
Hydrology in the River Hers during the period was stable (Fig. 2)
and corresponded to low water periods (discharge 1–7 m3 sÿ1).
Particulate Organic Carbon (POC) concentrations were also mea-
sured in the two gravel bars three months prior to this study
(May 1994).
One litre of interstitial water was collected from each piezome-
ter on each measuring occasion using a peristaltic pump. Water
sampling commenced 10 min after the start of pumping in order
to ensure that water chemistry was stable (monitored by oxygen
concentration) and that only hyporheic water was sampled. Dis-
solved Oxygen was measured using a specific probe (WTW Multi-
line P4).
During the study period, ambient and potential denitrification
rates were estimated by experimentation in the laboratory to
determine the factors that control hyporheic denitrification in this
stream. For denitrification measurements, sediments were sam-
pled by vacuum pump on 26 July and 19 October 1994. All piezom-
eters from A, B and C transects were sampled in GB1, and from
transects K, L, M and N in GB2 (see Fig. 1). Sediments were also
sampled through piezometers on the first day of the study period
to estimate porosity.
2.4. Laboratory methods
Water samples for measurements of NO3–N and NH4–N were
filtered through Whatman GF/F filters (nominal pore size 0.7 lm)
prior to analysis. NO3–N and NH4–N concentrations were then
determined using standard methods (NF T 90-015-2 and ISO 10
304 methods, respectively). Water samples for measurement of
DOC were filtered using combusted GF/F filters (450 °C for 4 h)
and analysed using a platinum catalyser at 650 °C (Shimadzu,
Model TOC 5000).
Denitrification activity was estimated on sediment samples
from the HZ using the acetylene block technique (Yoshinari and
Knowles, 1976) to inhibit N2O reduction to N2 gas. Denitrification
rates (ng NO3–N removed gÿ1sediment h
ÿ1) in the HZ were determined
by measuring N2O production at in situ NO3–N and carbon concen-
trations. Three replicates were made for each sampled piezometer.
For each replicate, approximately 10 g of sediment (wet mass)
were placed in a 250-mL serum bottle and then slurried with
10 mL of hyporheic water. Anoxic conditions were induced
throughout the incubation by purging the 250-mL serum bottles
containing sediment and HZ water slurries with industrial helium
(99%) for 10 min before adding 25 mL of acetone-free acetylene gas
to each bottle to yield 10% by total volume. The slurries were incu-
bated for 24 h at 16 °C in the dark under moderate shaking. For
each bottle, 3 mL of gas were sampled after 24 h and stored in vac-
uum tubes (Venoject; Terumo Scientific, NJ, USA) at room temper-
ature until analysis. N2O concentration was determined using a gas
chromatograph (GIRDEL, Série 30, France) fitted with an electron
capture detector (ECD 63Ni) and Porapak Q columns (2 m long
packed columns).
Factors limiting denitrification were examined by measuring
the separate effects of nitrate and nitrate + C-glucose additions.
Three replicates were made for each sampled piezometer and for
each experiment. To estimate the effect of nitrate, approximately
10 g of each sediment sample were placed in a 250-mL serum bot-
tle and slurried with 10 mL of hyporheic water mixed with a
NaNO3 (100 mg N Lÿ1) solution. Denitrification Enzyme Activity
(DEA) was determined by adding NaNO3 (100 mg N Lÿ1) solution
and glucose (50 mg C Lÿ1) solution to 10 g of sediment and 10 mL
of hyporheic water. Mean denitrification was then calculated for
each gravel bar using all piezometers for each experiment.
3. Numerical model
A 1D reactive-transport model was used as an exploratory tool
to assess the role of transport and reactive processes in the
longitudinal distribution of the chemical components, and to
determine the role of organic forms (DOC and POC) in the HZ of
the River Hers. The model presented here is a simplified adapta-
tion of the model presented by Hunter et al. (1998), which was
developed for subsurface environments. It incorporates four
dissolved components (NOÿ3 ; NHþ
4 , DOC and DO) and one solid
component (POC).
3.1. Mass balance equation
The general mass conservation equation for dissolved compo-
nents in the gravel bars is of conventional advection–dispersion-
reaction form and can be written as:
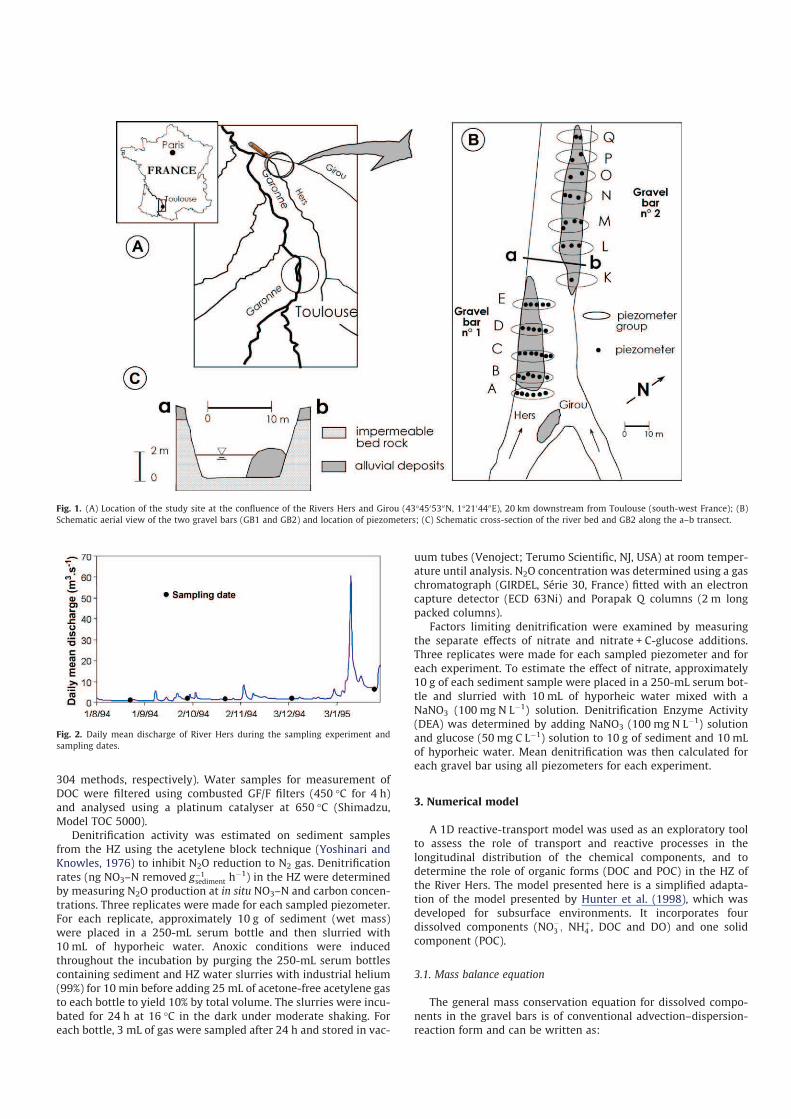
Fig. 1. (A) Location of the study site at the confluence of the Rivers Hers and Girou (43°4505300N, 1°2104400E), 20 km downstream from Toulouse (south-west France); (B)
Schematic aerial view of the two gravel bars (GB1 and GB2) and location of piezometers; (C) Schematic cross-section of the river bed and GB2 along the a–b transect.
Fig. 2. Daily mean discharge of River Hers during the sampling experiment and
sampling dates.

@Cfi
@t¼ ÿu
@Cfi
@xþ Di
@2Cf
i
@x2þ Rf
i ð1Þ
where Cfi is the concentration (lM) of the dissolved component i, u
represents interstitial average flow velocity (m dÿ1), Di denotes the
apparent/effective dispersion coefficient (m2 dÿ1, see Eq. (2)) and Riis the reaction term (lM dÿ1) for the component i. All concentra-
tions used by the model are in lM but results in the following sec-
tions are in mg Lÿ1. Eq. (1) assumes that flow is uniform, permanent
and one-dimensional. In this equation, Di and u are considered to be
spatially and time independent.The dispersion coefficient Di is the
result of the sum of the physical dispersion and the molecular dif-
fusion of the dissolved components:
Di ¼ Dp þ Dim ð2Þ
Dp is the physical dispersion (m2 dÿ1) and Dim denotes the effective
molecular diffusion. Dim is generally in the order of 1–2 � 10ÿ4
m2 dÿ1. Measurements showed the value of Dp for the site to be
about 5 � 10ÿ2 m2 dÿ1, and hence Dim can be considered negligible.
Following Hunter et al. (1998), the solid matrix was assumed to
be immobile. Hence, the mass conservation equation for the solid
component is:
@Cpoc
@t¼ Rpoc ð3Þ
where Cpoc represents the POC concentration (mg gÿ1) and Rpoc is
the reaction term (mg gÿ1 dÿ1) for POC.
3.2. Reactions
The modelled reactions are presented in Table 1. In this paper,
organic compounds are considered the source of energy for hetero-
trophic micro-organisms in the hyporheic zone. Organic matter is
oxidised into inorganic molecules through microbial reactions. In
the conventional presentation of biogeochemical models to date,
these reactions are classified into two categories (Van Cappellen
and Wang, 1995; Hunter et al., 1998; Wijsman et al., 2002): pri-
mary reactions (organic matter degradation pathways) and sec-
ondary reactions (microbial and chemical reactions using by-
products of primary reactions). Moreover, these biogeochemical
models incorporate mineralisation-precipitation reactions, acid
dissociation reactions and adsorption processes. Here, available
data did not allow a model as complex as that presented by Hunter
et al. (1998) to be developed and applied, because this would have
led to calibration of too many unknown parameters. Following the
principles of simplicity and parsimony recommended in such mod-
elling work (Burnham and Anderson, 2001; Johnson and Omland,
2004), a simplified view of the organic matter degradation pro-
cesses was adopted by making several assumptions. Two organic
forms were taken into account: dissolved organic carbon and par-
ticulate organic carbon. These forms were assumed to be degraded
through three pathways: (1) aerobic mineralisation and nitrogen
nitrification; (2) anaerobic degradation and nitrogen denitrifica-
tion; (3) anaerobic degradation other than denitrification and
ammonia release. Only nitrification was included as a secondary
reaction. This model differs from that of Hunter et al. (1998) in
number of organic degradation pathways (three versus five) and
number of secondary reactions (one versus ten). Following Soeta-
ert et al. (1996), the final anaerobic degradation pathway was de-
scribed as an holistic reaction term called ‘anaerobic degradation’
which accounts for manganese reduction, iron reduction and
methanogenesis. However, neither the electron acceptors involved
nor the re-oxidation reactions of their reduced form are explicitly
included, which could lead to an underestimation of oxygen con-
sumption. However, these re-oxidation reactions proved to have
a weak influence on the final results because oxygen does not
reach high concentrations in the HZ of the River Hers.
3.3. Kinetics
The multi-G modelling approach (Berner, 1980) was adopted. A
general mineralisation rate was allocated to each form of organic
carbon (DOC and POC), which could be modelled independently
from the other compounds. The model calculates the relative
contribution of each degradation pathway depending on the con-
centration of the various electron acceptors. Final anaerobic degra-
dation occurs when O2 and NO3- are consumed. First order kinetics
were adopted as commonly used in studies of the hyporheic zone
(e.g. Butturini et al., 2000) and of porous media in subsurface zones
(Hunter et al., 1998). Saturation constants and inhibition constants
were added to characterise the succession sequence of the degra-
dation pathways. The general form for the limitation term is:
½EAlim�
KEA þ ½EAlim�ð4Þ
where [EAlim] is the limiting concentration (lM) of electron accep-
tor and KEA (lM) is the limitation constant for the electron acceptor.
It generates a decrease in the associated degradation process when
the elector acceptor concentration decreases.
The inhibition term is written:
1ÿ½EAin�
K 0EA þ ½EAin�
� �
ð5Þ
where [EAin] is the inhibiting concentration of electron acceptor
(lM) and K 0EA is the inhibition constant (lM) for the electron accep-
tor. It suppresses the latter reactions in the sequence by the occur-
rence of electron acceptors involved in the previous reactions. Rate
laws for the reactions are given in Table 2 and model parameters
are detailed in Table 3.
3.4. Numerical implementation
The partial differential equations (1)–(3) were solved using a
Crank–Nicholson finite differencing scheme. We implemented this
model resolution in a C code, using the developing platformMicro-
soft Visual C++ 2005 Express. The simulations were all transient
simulations. The time step for numerical resolution was fixed at
10 min, and spatial resolution was 5 cm. For results, time step
was 1 day and spatial resolution was 1 m. The conservation of mat-
ter was checked, and the accuracy and stability of the numerical
solution were verified using analytical solutions for simplified test
cases.
Table 1
Overview of the reactions included in the biogeochemical model. (1) Aerobic mineralisation; (2) Anaerobic degradation and nitrogen denitrification; (3) Aerobic nitrogen
nitrification; (4) Anaerobic degradation other than denitrification and ammonia release. According to the Redfield ratio for organic matter, x = 106 and y = 16.
(CH2O)x(NH3)y(H3PO4) + xO2? xCO2 + yNH3 + HPO4 + xH2O (1)
(CH2O)x(NH3)y(H3PO4) + 0.8xHNO3? xCO2 + yNH3 + 0.4xN2 + HPO3 + 1.4xH2O (2)
NH3 + 2O2? HNO3 + H2O (3)
(CH2O)x(NH3)y(H3PO4) + oxidant? xCO2 + yNH3 + H3P04 + xH2o (4)

4. Field application
4.1. Boundary conditions
Dissolved components enter the head of the gravel bars at x = 0,
so the following boundary condition was adopted:
Cfi ¼ Cf
i;0 ð6Þ
where Cfi;0 denotes the concentration (lM) of component i mea-
sured at x = 0. Data in transects A and K were used as initial data
at the boundary condition x = 0 for GB1 and GB2 respectively (see
Fig. 1B). During the simulations, the concentrations of dissolved
components at the head of the gravel bars were calculated using a
linear interpolation between the concentrations measured at x = 0
on the different dates.
At the lower boundary, we assumed a no-gradient condition for
the solutes:
@Cfi
@x
�
�
�
�
�
x¼L
¼ 0 ð7Þ
where L represents the length of the gravel bar.
4.2. Initial conditions
Initial concentrations corresponded to the first sampling date
(24 August 1994) and simulations were run for the four other
dates. The initial concentrations along the gravel bars were calcu-
lated using a linear interpolation between the concentrations mea-
sured on the first sampling date in the different transects. In the
simulations where POC was included (see the following section),
the concentration of POC was considered constant along the longi-
tudinal profile, and no new entry of POC occurred during the sim-
ulation period. Its concentration along the two gravel bars was
fixed to 20 mg gÿ1sediment (2%), as measured on 31 May 1994 (Vervier,
unpublished data).
4.3. Model parameters
Parameters used for the reactions are summarised in Table 3.
With respect to the reaction rates, we used limitation and inhibi-
tion constant values reported in Wijsman et al. (2002). The model
provides 12 parameters to be fixed. Estimation of reaction rates
strongly depends on the transport rates, and it appears unrealistic
to calibrate both the transport and the reaction rates on a limited
dataset. Values for some parameters were thus determined from
the literature, or directly derived from data. At this point, three
parameters remain to be calibrated with our data set: the constant
rates of DOC and POC degradation (kDOC and kPOC) and the nitrifica-
tion rates (kNHþ4).
Physical dispersion was fixed to 4.8 � 10ÿ2 m2 dÿ1, following
the estimation of Mermillod-Blondin et al. (2003) in experimental
gravel cores. Advective velocity was set to 2 m dÿ1, as estimated
from conservative tracer experiments by Vervier et al. (1993) and
Bernard et al. (1994) in River Garonne gravel bars.
4.4. Simulations
To assess the possible role of POC and DOC in the biogeochem-
ical functioning of the gravel bars, three modelling approaches
were tested:
Simulation A. Reactive processes were set to zero and only the
transport processes were considered, to assess how this
affected the distribution of dissolved components along the lon-
gitudinal profiles.
Simulation B. Only DOC was accounted for and POC concentra-
tion was set to zero. The DOCmineralisation rate (kDOC) was cal-
ibrated to obtain the best fit between model and output data,
particularly for NO3–N. In other words, we examined whether
the DOC entering from surface water only could explain the
nitrate consumption.
Table 2
Biogeochemical model formulations for each component. Parameter descriptions and values are given in Table 3.
RDOC = ÿkDOC [DOC]
RPOC = ÿkPOC [POC]
RO2¼ ÿ xþ2y
x
� �
q1ÿuu
kPOC ½POC� þ kDOC ½DOC�� �
½O2 �KO2
þ½O2 �ÿ 2kNHþ
4½NHþ
4 �½O2 �
KO2þ½O2 �
RNOÿ3¼ ÿ0:8x q
1ÿuu
kPOC ¼ ½POC� þ kDOC ½DOC�� �
½NOÿ3 �
KNOÿ3þ½NOÿ
3 �1ÿ ½O2 �
K 0O2
þ½O2 �
� �
þ kNHþ4½NHþ
4 �½O2 �
KO2þ½O2 �
RNHþ4¼ y
x½O2 �
KO2þ½O2 �
þ½NOÿ
3 �KNOÿ
3þ½NOÿ
3 �1ÿ ½O2 �
K 0O2
þ½O2 �
� �
þ 1ÿ½NOÿ
3 �
K 0NOÿ
3þ½NOÿ
3 �
� �
1ÿ ½O2 �
K 0O2
þ½O2 �
� �� �
kDOC ½DOC� þ q1ÿuu
kPOC ½POC�� �
ÿkNHþ4½NHþ
4 �½O2 �
KO2þ½O2 �
Table 3
Model parameter descriptions and values. (1) Boly (1997); (2) Mermillod-Blondin et al. (2003); (3) Vender et al. (1993) and Bernard et al. (1994); (4) Vender (unpublished data);
(5) Wijsman et al. (2002); (C) Calibrated on data.
Variable Unit Value Description
u – 0.34 Sediment porosity in the gravel banks (1)
q kg dmÿ3 1.3 Dry sediment density
DP M2 dÿ1 4.8 � 10ÿ2 Physical dispersion for solutes (2)
u m dÿ1 2 Mean advective velocity in gravel bars (3)
CPOC mg gÿ1 20 POC concentration in the gravel bars (4)
KDOC dÿ1 0.68 (Simulation B) Mineralisation rate constant of DOC (C)
KPOC dÿ1 0.06 (Simulation C)
kþNH4
dÿ1 1.1 � 10ÿ4 (Simulation C) Mineralisation rate constant of POC (C)
dÿ1 0.01 Nitrification rate constant (C)
KO2lM 3.1 Half-saturation for oxygen limitation in oxic mineralisation (5)
K 0O2
lM 10 Half-saturation for oxygen inhibition (5)
KÿNO3
lM 30 Half-saturation for nitrate limitation (5)
K 0NOÿ
3lM 10 Half-saturation for nitrate inhibition (5)
Simulation C. In this, DOC and POC were simulated. For each one,
the mineralisation rates (kDOC and kPOC) were calibrated to pro-
vide the best fit between model output and data.
5. Results
5.1. Field chemical results
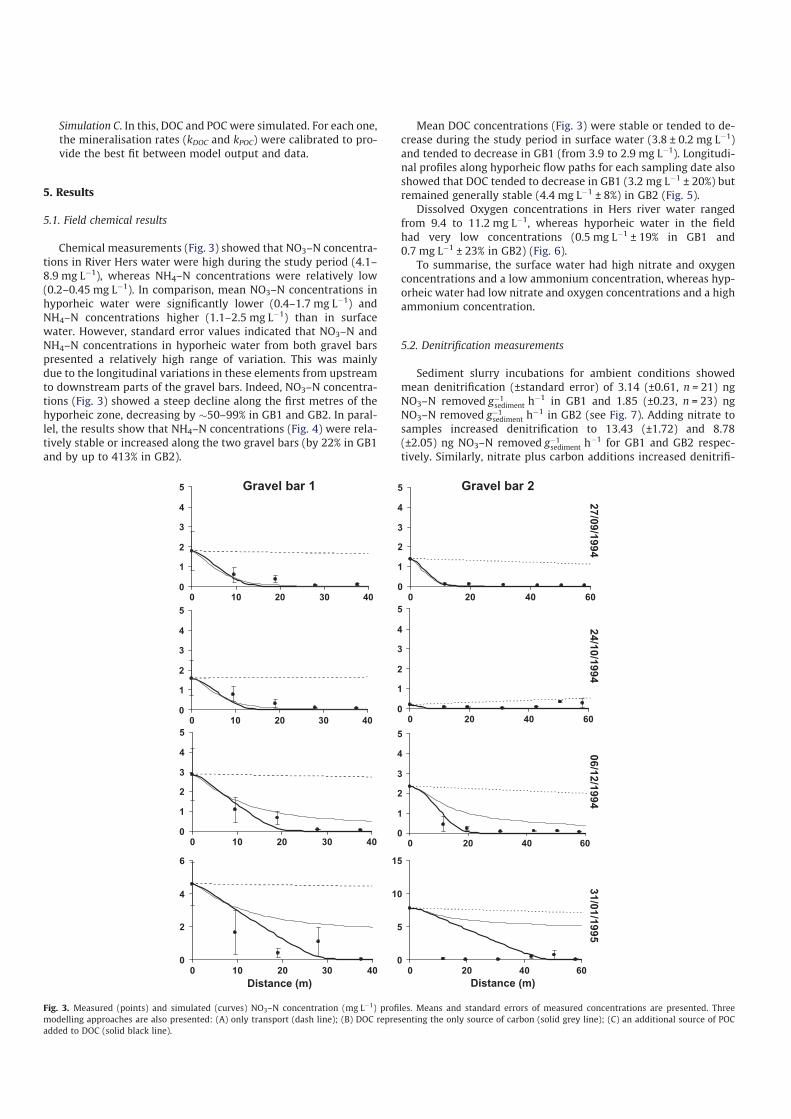
Chemical measurements (Fig. 3) showed that NO3–N concentra-
tions in River Hers water were high during the study period (4.1–
8.9 mg Lÿ1), whereas NH4–N concentrations were relatively low
(0.2–0.45 mg Lÿ1). In comparison, mean NO3–N concentrations in
hyporheic water were significantly lower (0.4–1.7 mg Lÿ1) and
NH4–N concentrations higher (1.1–2.5 mg Lÿ1) than in surface
water. However, standard error values indicated that NO3–N and
NH4–N concentrations in hyporheic water from both gravel bars
presented a relatively high range of variation. This was mainly
due to the longitudinal variations in these elements from upstream
to downstream parts of the gravel bars. Indeed, NO3–N concentra-
tions (Fig. 3) showed a steep decline along the first metres of the
hyporheic zone, decreasing by �50–99% in GB1 and GB2. In paral-
lel, the results show that NH4–N concentrations (Fig. 4) were rela-
tively stable or increased along the two gravel bars (by 22% in GB1
and by up to 413% in GB2).
Mean DOC concentrations (Fig. 3) were stable or tended to de-
crease during the study period in surface water (3.8 ± 0.2 mg Lÿ1)
and tended to decrease in GB1 (from 3.9 to 2.9 mg Lÿ1). Longitudi-
nal profiles along hyporheic flow paths for each sampling date also
showed that DOC tended to decrease in GB1 (3.2 mg Lÿ1 ± 20%) but
remained generally stable (4.4 mg Lÿ1 ± 8%) in GB2 (Fig. 5).
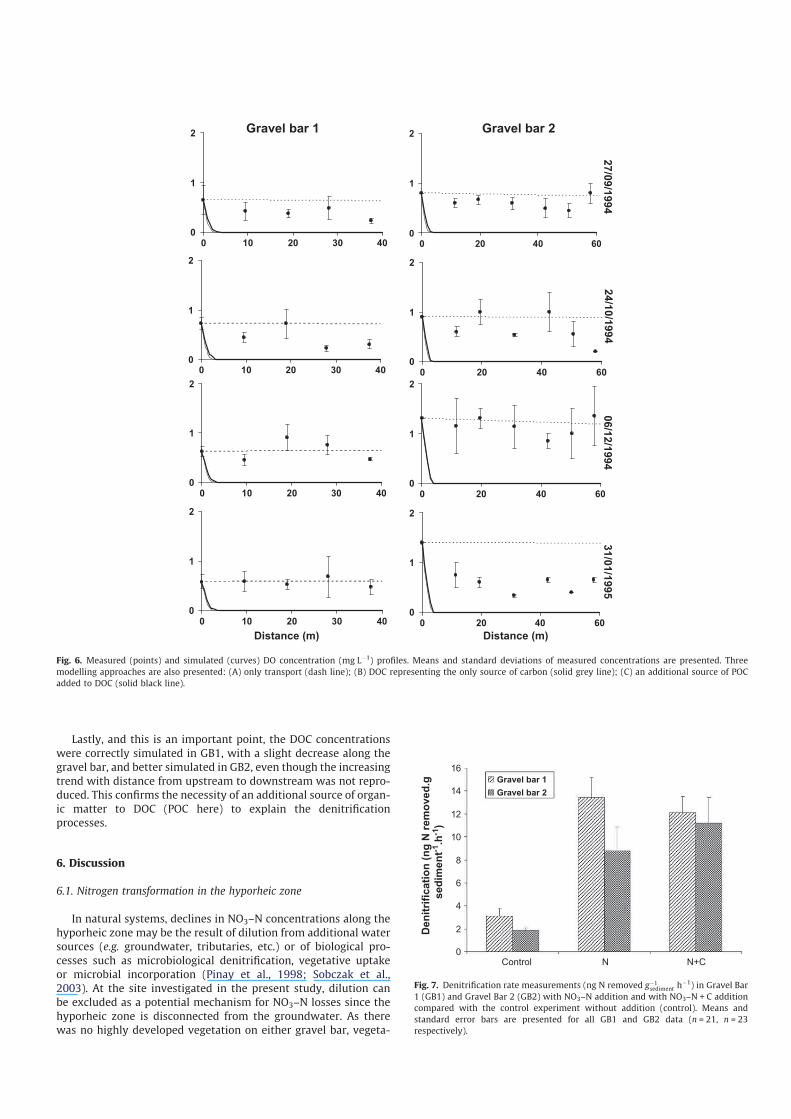
Dissolved Oxygen concentrations in Hers river water ranged
from 9.4 to 11.2 mg Lÿ1, whereas hyporheic water in the field
had very low concentrations (0.5 mg Lÿ1 ± 19% in GB1 and
0.7 mg Lÿ1 ± 23% in GB2) (Fig. 6).
To summarise, the surface water had high nitrate and oxygen
concentrations and a low ammonium concentration, whereas hyp-
orheic water had low nitrate and oxygen concentrations and a high
ammonium concentration.
5.2. Denitrification measurements
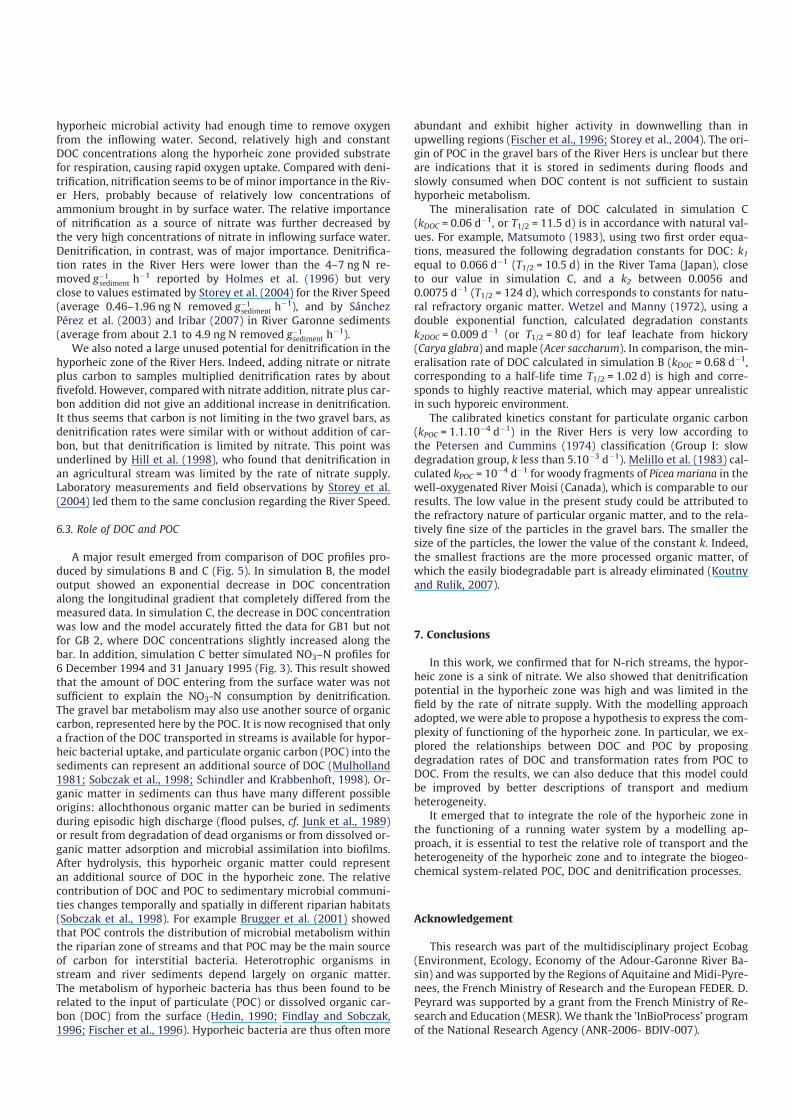
Sediment slurry incubations for ambient conditions showed
mean denitrification (±standard error) of 3.14 (±0.61, n = 21) ng
NO3–N removed gÿ1sediment h
ÿ1 in GB1 and 1.85 (±0.23, n = 23) ng
NO3–N removed gÿ1sediment h
ÿ1 in GB2 (see Fig. 7). Adding nitrate to
samples increased denitrification to 13.43 (±1.72) and 8.78
(±2.05) ng NO3–N removed gÿ1sediment h
ÿ1 for GB1 and GB2 respec-
tively. Similarly, nitrate plus carbon additions increased denitrifi-
0
1
2
3
4
5
0 10 20 30 40
0
1
2
3
4
5
0 10 20 30 40
0
1
2
3
4
5
0 10 20 30 40
0
2
4
6
0 10 20 30 40
0
1
2
3
4
5
0 20 40 60
0
1
2
3
4
5
0 20 40 60
0
1
2
3
4
5
0 20 40 60
0
5
10
15
0 20 40 60
27
/09
/19
94
24
/10
/19
94
06
/12
/19
94
31
/01
/19
95
2rablevarG1rablevarG
Distance (m) Distance (m)
Fig. 3. Measured (points) and simulated (curves) NO3–N concentration (mg Lÿ1) profiles. Means and standard errors of measured concentrations are presented. Three
modelling approaches are also presented: (A) only transport (dash line); (B) DOC representing the only source of carbon (solid grey line); (C) an additional source of POC
added to DOC (solid black line).

cation to 12.11 (±1.39) and 11.21 (±2.23) ng NO3–N re-
moved gÿ1sediment h
ÿ1 in GB1 and GB2 respectively. Compared to ni-
trate addition alone, nitrate plus carbon addition did not give rise
to a significant additional increase in denitrification (ANOVA, ns).
Nitrate is thus a limiting factor for denitrification reactions in the
two gravel bars, whereas organic carbon is not.
5.3. Model results
5.3.1. Simulation A (conservative transport)
As expected with this simulation, the modelled concentrations
of NO3–N, NH4–N, DOC and DO were quasi-homogeneous along
the longitudinal profiles of GB1 and GB2 (see Figs. 3–6 respec-
tively). This is due to the constant mean porewater advection
(2 m dÿ1) and the absence of gross variation in concentrations on
entering the gravel bars. In most cases, transport alone could not
explain the longitudinal distribution of the chemical components,
particularly for the measured NO3–N profiles (Fig. 3), which always
showed an exponential decrease along the gravel bars. Except in
GB1 on 31 January 1995, measured NH4–N concentrations
(Fig. 4) showed an increasing trend in all profiles that was not
reproducible with transport only. As regards the DOC concentra-
tions (Fig. 5), the modelled concentrations were slightly overesti-
mated in GB1, where the measured concentrations tended to
decrease, whereas they were underestimated in GB2, where the
measured concentrations were generally stable or increasing. The
case of DO (Fig. 6) was more sensitive, because the transport only
seemed to be sufficient to explain the longitudinal concentrations.
However, note that with our measurement procedure (water
pumped up from piezometer, then probe plunged inside sample),
it was not possible to determine whether these concentrations
were significant or due to empirical errors (see discussion below).
5.3.2. Simulation B (reactive transport with DOC and without POC)
The main discrepancy was in the shape of the simulated pro-
files, in that whereas measured concentrations of the four compo-
nents showed peaks and sometimes strong variations among the
piezometers, the model provided highly smooth shapes and trends
in the simulated profiles. This is a consequence of the assumption
of homogeneous transport and reactive processes along the gravel
bars, where in fact the actual physio-chemical conditions are prob-
ably longitudinally heterogeneous. Nevertheless, simplification is
the foundation of any modelling exercise and in the present case,
despite this assumption, the model provided important insights
about biogeochemical functioning within the HZ.
The estimation of model parameters was optimised to provide
the best fit for NO3-N profiles. With DOC as the only source of or-
ganic matter and with a degradation coefficient of kDOC = 0.68 dÿ1,
0
1
2
3
4
5
0 10 20 30 400
1
2
3
4
5
0 20 40 60
0
1
2
3
4
5
0 10 20 30 40
0
1
2
3
4
5
0 10 20 30 40
0
1
2
3
4
5
0 10 20 30 40
0
1
2
3
4
5
0 20 40 60
0
1
2
3
4
5
0 20 40 60
0
1
2
3
4
5
0 20 40 60
27
/09
/19
94
2rablevarG1rablevarG
Distance (m) Distance (m)
24
/ 10
/19
94
06
/12
/19
94
31
/ 01
/19
95
Fig. 4. Measured (points) and simulated (curves) NH4–N concentration (mg Lÿ1) profiles. Means and standard errors of measured concentrations are presented. Three
modelling approaches are also presented: (A) only transport (dash line); (B) DOC representing the only source of carbon (solid grey line); (C) an additional source of POC
added to DOC (solid black line).
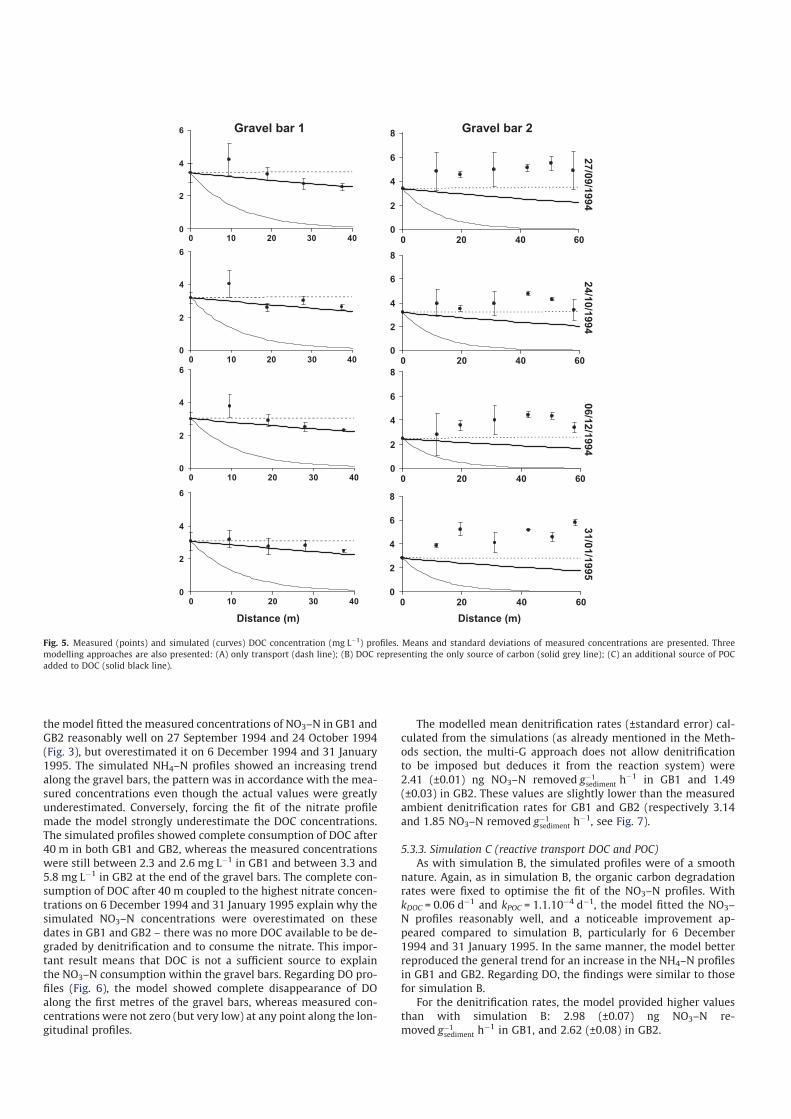
the model fitted the measured concentrations of NO3–N in GB1 and
GB2 reasonably well on 27 September 1994 and 24 October 1994
(Fig. 3), but overestimated it on 6 December 1994 and 31 January
1995. The simulated NH4–N profiles showed an increasing trend
along the gravel bars, the pattern was in accordance with the mea-
sured concentrations even though the actual values were greatly
underestimated. Conversely, forcing the fit of the nitrate profile
made the model strongly underestimate the DOC concentrations.
The simulated profiles showed complete consumption of DOC after
40 m in both GB1 and GB2, whereas the measured concentrations
were still between 2.3 and 2.6 mg Lÿ1 in GB1 and between 3.3 and
5.8 mg Lÿ1 in GB2 at the end of the gravel bars. The complete con-
sumption of DOC after 40 m coupled to the highest nitrate concen-
trations on 6 December 1994 and 31 January 1995 explain why the
simulated NO3–N concentrations were overestimated on these
dates in GB1 and GB2 – there was no more DOC available to be de-
graded by denitrification and to consume the nitrate. This impor-
tant result means that DOC is not a sufficient source to explain
the NO3–N consumption within the gravel bars. Regarding DO pro-
files (Fig. 6), the model showed complete disappearance of DO
along the first metres of the gravel bars, whereas measured con-
centrations were not zero (but very low) at any point along the lon-
gitudinal profiles.
The modelled mean denitrification rates (±standard error) cal-
culated from the simulations (as already mentioned in the Meth-
ods section, the multi-G approach does not allow denitrification
to be imposed but deduces it from the reaction system) were
2.41 (±0.01) ng NO3–N removed gÿ1sediment h
ÿ1 in GB1 and 1.49
(±0.03) in GB2. These values are slightly lower than the measured
ambient denitrification rates for GB1 and GB2 (respectively 3.14
and 1.85 NO3–N removed gÿ1sediment h
ÿ1, see Fig. 7).
5.3.3. Simulation C (reactive transport DOC and POC)
As with simulation B, the simulated profiles were of a smooth
nature. Again, as in simulation B, the organic carbon degradation
rates were fixed to optimise the fit of the NO3–N profiles. With
kDOC = 0.06 dÿ1 and kPOC = 1.1.10ÿ4 dÿ1, the model fitted the NO3–
N profiles reasonably well, and a noticeable improvement ap-
peared compared to simulation B, particularly for 6 December
1994 and 31 January 1995. In the same manner, the model better
reproduced the general trend for an increase in the NH4–N profiles
in GB1 and GB2. Regarding DO, the findings were similar to those
for simulation B.
For the denitrification rates, the model provided higher values
than with simulation B: 2.98 (±0.07) ng NO3–N re-
moved gÿ1sediment h
ÿ1 in GB1, and 2.62 (±0.08) in GB2.
0
2
4
6
0 10 20 30 40
0
2
4
6
0 10 20 30 40
0
2
4
6
0 10 20 30 40
0
2
4
6
0 10 20 30 40
0
2
4
6
8
0 20 40 60
0
2
4
6
8
0 20 40 60
0
2
4
6
8
0 20 40 60
0
2
4
6
8
0 20 40 60
27
/09
/19
94
24
/ 10
/19
94
06
/12
/19
94
31
/ 01
/19
95
2rablevarG1rablevarG
Distance (m) Distance (m)
Fig. 5. Measured (points) and simulated (curves) DOC concentration (mg Lÿ1) profiles. Means and standard deviations of measured concentrations are presented. Three
modelling approaches are also presented: (A) only transport (dash line); (B) DOC representing the only source of carbon (solid grey line); (C) an additional source of POC
added to DOC (solid black line).
Lastly, and this is an important point, the DOC concentrations
were correctly simulated in GB1, with a slight decrease along the
gravel bar, and better simulated in GB2, even though the increasing
trend with distance from upstream to downstream was not repro-
duced. This confirms the necessity of an additional source of organ-
ic matter to DOC (POC here) to explain the denitrification
processes.
6. Discussion
6.1. Nitrogen transformation in the hyporheic zone
In natural systems, declines in NO3–N concentrations along the
hyporheic zone may be the result of dilution from additional water
sources (e.g. groundwater, tributaries, etc.) or of biological pro-
cesses such as microbiological denitrification, vegetative uptake
or microbial incorporation (Pinay et al., 1998; Sobczak et al.,
2003). At the site investigated in the present study, dilution can
be excluded as a potential mechanism for NO3–N losses since the
hyporheic zone is disconnected from the groundwater. As there
was no highly developed vegetation on either gravel bar, vegeta-
0
1
2
0 10 20 30 40
0
1
2
0 10 20 30 40
0
1
2
0 10 20 30 40
0
1
2
0 10 20 30 40
0
1
2
0 20 40 60
0
1
2
0 20 40 60
0
1
2
0 20 40 60
0
1
2
0 20 40 60
27
/09
/19
94
24
/ 10
/19
94
06
/ 12
/19
94
31
/ 01
/19
95
2rablevarG1rablevarG
)m(ecnatsiD)m(ecnatsiD
Fig. 6. Measured (points) and simulated (curves) DO concentration (mg Lÿ1) profiles. Means and standard deviations of measured concentrations are presented. Three
modelling approaches are also presented: (A) only transport (dash line); (B) DOC representing the only source of carbon (solid grey line); (C) an additional source of POC
added to DOC (solid black line).
0
2
4
6
8
10
12
14
16
N+CNControl
De
nit
rifi
ca
tio
n (
ng
N r
em
ov
ed
.g
s
ed
ime
nt-1
.h-1
)
Gravel bar 1
Gravel bar 2
Fig. 7. Denitrification rate measurements (ng N removed gÿ1sediment h
ÿ1) in Gravel Bar
1 (GB1) and Gravel Bar 2 (GB2) with NO3–N addition and with NO3–N + C addition
compared with the control experiment without addition (control). Means and
standard error bars are presented for all GB1 and GB2 data (n = 21, n = 23
respectively).
tive uptake can also be excluded. The NO3–N and DO concentra-
tions in the River Hers were more than 4.1 and more than
9.4 mg Lÿ1 respectively. However, streamwater entering the gravel
bars showed a rapid decline in NO3–N within a short distance and a
strong decrease in DO, generally to under 1 mg Lÿ1 (Fig. 3). These
patterns indicate a strong redox gradient in the hyporheic zone
and suggest the occurrence of aerobic microbial respiration fol-
lowed by denitrification (Hedin et al., 1998). Denitrification mea-
surements and NO3–N losses through hyporheic flow paths
indicate that this process appears to very important in the assimi-
lative processes in the River Hers. As reported for other N-rich sys-
tems (e.g. Hill et al., 1998; Storey et al., 2004), measured
denitrification rates were limited by the rate of nitrate supply,
whereas organic carbon did not seem to be an important factor
in the hyporheic zone of the River Hers. However, simulations
showed that NO3–N longitudinal profiles were better reproduced
by the model when a source of POC was added (see section on Sim-
ulation C above). For simulations B and C, simulated denitrification
rates are close to measured denitrification and, in view of model
simplifications and as the denitrification was not measured di-
rectly in situ, the slight differences between observations and pre-
dictions were expected.
Despite the simplicity of the model, its outputs fitted measured
NO3–N and NH4–N data reasonably well, particularly with simula-
tion C. Concentration profiles of NO3–N (Fig. 3) adopted an expo-
nentially decreasing shape, denoting consumption through the
denitrification process, except on 31 January 1995, where the influ-
ence of a previous flood event (Fig. 2) was probably non-negligible
(NO3–N concentration up to 35 mg Lÿ1 at the head of GB2). The
hyporheic zone at this site is thus an NO3–N sink, rather than a
source, in agreement with results from other N-rich streams (Pinay
et al., 1994; Hill et al., 1998; Storey et al., 2004; Kasahara and Hill,
2006 and 2007), and fits the conceptual framework of Jones and
Holmes (1996). In contrast, NH4–N concentrations increased along
the longitudinal gradient (Fig. 4). The DOC concentration being rel-
atively stable along the gravel bars (Fig. 5), these converse ammo-
nium and nitrate concentration gradients suggest that the
hyporheic zone supports coupled nitrification–denitrification,
where a part of ammonium comes from nitrate ammonification.
Some studies have also reported an ammonium increase in the hyp-
orheic zone due to Dissimilatory Nitrate Reduction to Ammonium
(DNRA) (Storey et al., 2004). In the case of the River Hers, DNRAdoes
not seem to be possible because nitrate concentrations fell quickly
along the first metres of the gravel bars and there was no more ni-
trate available for DNRA in downstream parts. The increase in
ammonium at the end of GB2 is undoubtedly attributable to partic-
ulate organic matter (POM) desamination (see last paragraph in
Simulation C section above). This nitrate-derived ammonium was
first oxidised intonitrate, then subsequently reduced viadenitrifica-
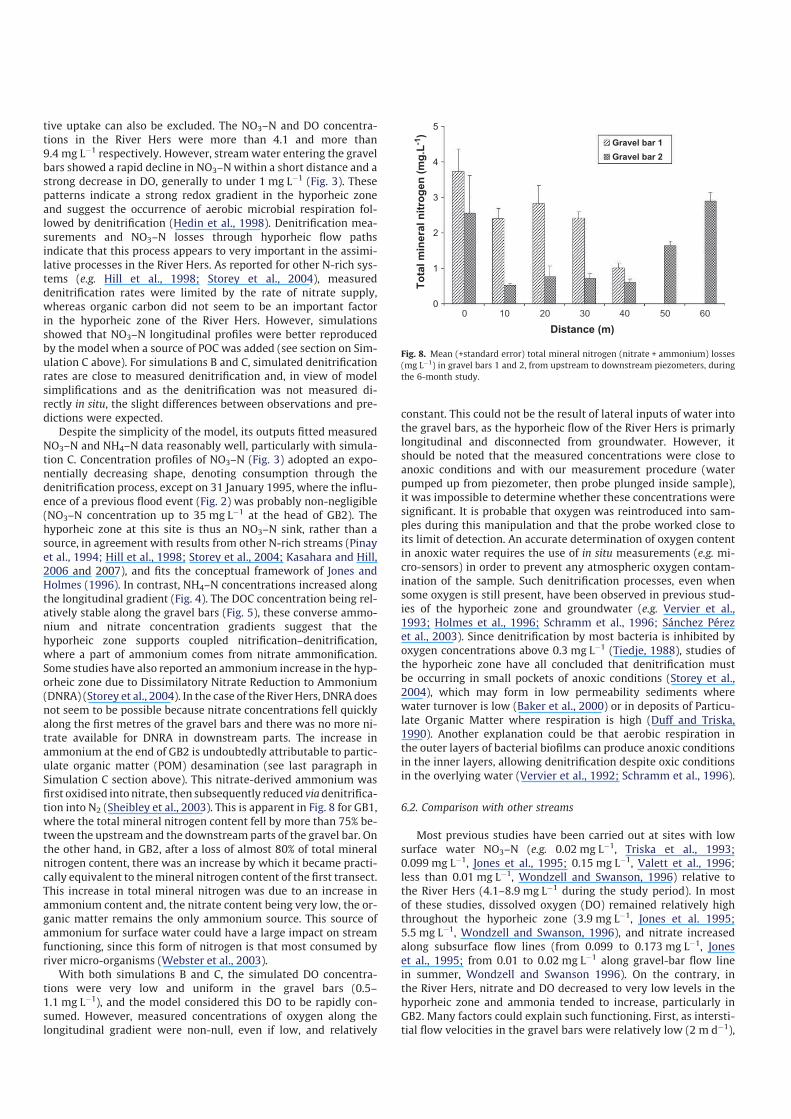
tion into N2 (Sheibley et al., 2003). This is apparent in Fig. 8 for GB1,
where the total mineral nitrogen content fell by more than 75% be-
tween the upstream and the downstream parts of the gravel bar. On
the other hand, in GB2, after a loss of almost 80% of total mineral
nitrogen content, there was an increase by which it became practi-
cally equivalent to themineral nitrogen content of the first transect.
This increase in total mineral nitrogen was due to an increase in
ammonium content and, the nitrate content being very low, the or-
ganic matter remains the only ammonium source. This source of
ammonium for surface water could have a large impact on stream
functioning, since this form of nitrogen is that most consumed by
river micro-organisms (Webster et al., 2003).
With both simulations B and C, the simulated DO concentra-
tions were very low and uniform in the gravel bars (0.5–
1.1 mg Lÿ1), and the model considered this DO to be rapidly con-
sumed. However, measured concentrations of oxygen along the
longitudinal gradient were non-null, even if low, and relatively
constant. This could not be the result of lateral inputs of water into
the gravel bars, as the hyporheic flow of the River Hers is primarly
longitudinal and disconnected from groundwater. However, it
should be noted that the measured concentrations were close to
anoxic conditions and with our measurement procedure (water
pumped up from piezometer, then probe plunged inside sample),
it was impossible to determine whether these concentrations were
significant. It is probable that oxygen was reintroduced into sam-
ples during this manipulation and that the probe worked close to
its limit of detection. An accurate determination of oxygen content
in anoxic water requires the use of in situ measurements (e.g. mi-
cro-sensors) in order to prevent any atmospheric oxygen contam-
ination of the sample. Such denitrification processes, even when
some oxygen is still present, have been observed in previous stud-
ies of the hyporheic zone and groundwater (e.g. Vervier et al.,
1993; Holmes et al., 1996; Schramm et al., 1996; Sánchez Pérez
et al., 2003). Since denitrification by most bacteria is inhibited by
oxygen concentrations above 0.3 mg Lÿ1 (Tiedje, 1988), studies of
the hyporheic zone have all concluded that denitrification must
be occurring in small pockets of anoxic conditions (Storey et al.,
2004), which may form in low permeability sediments where
water turnover is low (Baker et al., 2000) or in deposits of Particu-
late Organic Matter where respiration is high (Duff and Triska,
1990). Another explanation could be that aerobic respiration in
the outer layers of bacterial biofilms can produce anoxic conditions
in the inner layers, allowing denitrification despite oxic conditions
in the overlying water (Vervier et al., 1992; Schramm et al., 1996).
6.2. Comparison with other streams
Most previous studies have been carried out at sites with low
surface water NO3–N (e.g. 0.02 mg Lÿ1, Triska et al., 1993;
0.099 mg Lÿ1, Jones et al., 1995; 0.15 mg Lÿ1, Valett et al., 1996;
less than 0.01 mg Lÿ1, Wondzell and Swanson, 1996) relative to
the River Hers (4.1–8.9 mg Lÿ1 during the study period). In most
of these studies, dissolved oxygen (DO) remained relatively high
throughout the hyporheic zone (3.9 mg Lÿ1, Jones et al. 1995;
5.5 mg Lÿ1, Wondzell and Swanson, 1996), and nitrate increased
along subsurface flow lines (from 0.099 to 0.173 mg Lÿ1, Jones
et al., 1995; from 0.01 to 0.02 mg Lÿ1 along gravel-bar flow line
in summer, Wondzell and Swanson 1996). On the contrary, in
the River Hers, nitrate and DO decreased to very low levels in the
hyporheic zone and ammonia tended to increase, particularly in
GB2. Many factors could explain such functioning. First, as intersti-
tial flow velocities in the gravel bars were relatively low (2 m dÿ1),
0
1
2
3
4
5
0 10 20 30 40 50 60
Distance (m)
To
tal
min
era
l n
itro
ge
n (
mg
.L-1
)
Gravel bar 1
Gravel bar 2
Fig. 8. Mean (+standard error) total mineral nitrogen (nitrate + ammonium) losses
(mg Lÿ1) in gravel bars 1 and 2, from upstream to downstream piezometers, during
the 6-month study.
hyporheic microbial activity had enough time to remove oxygen
from the inflowing water. Second, relatively high and constant
DOC concentrations along the hyporheic zone provided substrate
for respiration, causing rapid oxygen uptake. Compared with deni-
trification, nitrification seems to be of minor importance in the Riv-
er Hers, probably because of relatively low concentrations of
ammonium brought in by surface water. The relative importance
of nitrification as a source of nitrate was further decreased by
the very high concentrations of nitrate in inflowing surface water.
Denitrification, in contrast, was of major importance. Denitrifica-
tion rates in the River Hers were lower than the 4–7 ng N re-
moved gÿ1sediment h
ÿ1 reported by Holmes et al. (1996) but very
close to values estimated by Storey et al. (2004) for the River Speed
(average 0.46–1.96 ng N removed gÿ1sediment h
ÿ1), and by Sánchez
Pérez et al. (2003) and Iribar (2007) in River Garonne sediments
(average from about 2.1 to 4.9 ng N removed gÿ1sediment h
ÿ1).
We also noted a large unused potential for denitrification in the
hyporheic zone of the River Hers. Indeed, adding nitrate or nitrate
plus carbon to samples multiplied denitrification rates by about
fivefold. However, compared with nitrate addition, nitrate plus car-
bon addition did not give an additional increase in denitrification.
It thus seems that carbon is not limiting in the two gravel bars, as
denitrification rates were similar with or without addition of car-
bon, but that denitrification is limited by nitrate. This point was
underlined by Hill et al. (1998), who found that denitrification in
an agricultural stream was limited by the rate of nitrate supply.
Laboratory measurements and field observations by Storey et al.
(2004) led them to the same conclusion regarding the River Speed.
6.3. Role of DOC and POC
A major result emerged from comparison of DOC profiles pro-
duced by simulations B and C (Fig. 5). In simulation B, the model
output showed an exponential decrease in DOC concentration
along the longitudinal gradient that completely differed from the
measured data. In simulation C, the decrease in DOC concentration
was low and the model accurately fitted the data for GB1 but not
for GB 2, where DOC concentrations slightly increased along the
bar. In addition, simulation C better simulated NO3–N profiles for
6 December 1994 and 31 January 1995 (Fig. 3). This result showed
that the amount of DOC entering from the surface water was not
sufficient to explain the NO3-N consumption by denitrification.
The gravel bar metabolism may also use another source of organic
carbon, represented here by the POC. It is now recognised that only
a fraction of the DOC transported in streams is available for hypor-
heic bacterial uptake, and particulate organic carbon (POC) into the
sediments can represent an additional source of DOC (Mulholland
1981; Sobczak et al., 1998; Schindler and Krabbenhoft, 1998). Or-
ganic matter in sediments can thus have many different possible
origins: allochthonous organic matter can be buried in sediments
during episodic high discharge (flood pulses, cf. Junk et al., 1989)
or result from degradation of dead organisms or from dissolved or-
ganic matter adsorption and microbial assimilation into biofilms.
After hydrolysis, this hyporheic organic matter could represent
an additional source of DOC in the hyporheic zone. The relative
contribution of DOC and POC to sedimentary microbial communi-
ties changes temporally and spatially in different riparian habitats
(Sobczak et al., 1998). For example Brugger et al. (2001) showed
that POC controls the distribution of microbial metabolism within
the riparian zone of streams and that POC may be the main source
of carbon for interstitial bacteria. Heterotrophic organisms in
stream and river sediments depend largely on organic matter.
The metabolism of hyporheic bacteria has thus been found to be
related to the input of particulate (POC) or dissolved organic car-
bon (DOC) from the surface (Hedin, 1990; Findlay and Sobczak,
1996; Fischer et al., 1996). Hyporheic bacteria are thus often more
abundant and exhibit higher activity in downwelling than in
upwelling regions (Fischer et al., 1996; Storey et al., 2004). The ori-
gin of POC in the gravel bars of the River Hers is unclear but there
are indications that it is stored in sediments during floods and
slowly consumed when DOC content is not sufficient to sustain
hyporheic metabolism.
The mineralisation rate of DOC calculated in simulation C
(kDOC = 0.06 dÿ1, or T1/2 = 11.5 d) is in accordance with natural val-
ues. For example, Matsumoto (1983), using two first order equa-
tions, measured the following degradation constants for DOC: k1equal to 0.066 dÿ1 (T1/2 = 10.5 d) in the River Tama (Japan), close
to our value in simulation C, and a k2 between 0.0056 and
0.0075 dÿ1 (T1/2 = 124 d), which corresponds to constants for natu-
ral refractory organic matter. Wetzel and Manny (1972), using a
double exponential function, calculated degradation constants
k2DOC = 0.009 dÿ1 (or T1/2 = 80 d) for leaf leachate from hickory
(Carya glabra) and maple (Acer saccharum). In comparison, the min-
eralisation rate of DOC calculated in simulation B (kDOC = 0.68 dÿ1,
corresponding to a half-life time T1/2 = 1.02 d) is high and corre-
sponds to highly reactive material, which may appear unrealistic
in such hyporeic environment.
The calibrated kinetics constant for particulate organic carbon
(kPOC = 1.1.10ÿ4 dÿ1) in the River Hers is very low according to
the Petersen and Cummins (1974) classification (Group I: slow
degradation group, k less than 5.10ÿ3 dÿ1). Melillo et al. (1983) cal-
culated kPOC = 10ÿ4 dÿ1 for woody fragments of Picea mariana in the
well-oxygenated River Moisi (Canada), which is comparable to our
results. The low value in the present study could be attributed to
the refractory nature of particular organic matter, and to the rela-
tively fine size of the particles in the gravel bars. The smaller the
size of the particles, the lower the value of the constant k. Indeed,
the smallest fractions are the more processed organic matter, of
which the easily biodegradable part is already eliminated (Koutny
and Rulik, 2007).
7. Conclusions
In this work, we confirmed that for N-rich streams, the hypor-
heic zone is a sink of nitrate. We also showed that denitrification
potential in the hyporheic zone was high and was limited in the
field by the rate of nitrate supply. With the modelling approach
adopted, we were able to propose a hypothesis to express the com-
plexity of functioning of the hyporheic zone. In particular, we ex-
plored the relationships between DOC and POC by proposing
degradation rates of DOC and transformation rates from POC to
DOC. From the results, we can also deduce that this model could
be improved by better descriptions of transport and medium
heterogeneity.
It emerged that to integrate the role of the hyporheic zone in
the functioning of a running water system by a modelling ap-
proach, it is essential to test the relative role of transport and the
heterogeneity of the hyporheic zone and to integrate the biogeo-
chemical system-related POC, DOC and denitrification processes.
Acknowledgement
This research was part of the multidisciplinary project Ecobag
(Environment, Ecology, Economy of the Adour-Garonne River Ba-
sin) and was supported by the Regions of Aquitaine and Midi-Pyre-
nees, the French Ministry of Research and the European FEDER. D.
Peyrard was supported by a grant from the French Ministry of Re-
search and Education (MESR). We thank the ’InBioProcess’ program
of the National Research Agency (ANR-2006- BDIV-007).
References
Baker, M.A., Dahm, C.N., Valett, H.M., 2000. Anoxia, anaerobic metabolism, andbiogeochemistry of the stream-water-groundwater interface. In: Jones, J.B.,Mulholland, P.J. (Eds.), Streams and Ground Waters. Academic Press, Boston, pp.259–283.
Bernard, C., Fabre, A., Vervier, P., 1994. DOC cycling in the surface and ground waterinteraction zone in a fluvial ecosystem. Verh International Verein Limnology 25,1410–1413.
Berner, R.A., 1980. Early Diagenesis: A Theoretical Approach. Princeton UniversityPress, Princeton.
Birgand, F., Skaggs, R.W., Chescheir, G.M., Gilliam, J.W., 2007. Nitrogen removal instreams of agricultural catchments – a literature review. Critical Reviews inEnvironmental Science and Technology 37 (5), 381–487.
Boly, K.A., 1997. Pénétration des bancs de sable et de graviers par les courantsfluviaux; incidence sur le devenir de polluants. Ph.D., Université Bordeaux I,Bordeaux, France.
Boulton, A.J., Findlay, S., Marmonier, P., Stanley, E.H., Valett, H.M., 1998. Thefunctional significance of the hyporheic zone in streams and rivers. AnnualReview of Ecology and Systematics 29, 59–81.
Brugger, A., Reitner, B., Kolar, I., Queric, N., Herndl, G.J., 2001. Seasonal and spatialdistribution of dissolved and particulate organic carbon and bacteria in thebank of an impounding reservoir on the Enns River, Austria. Freshwater Biology46, 997–1016.
Brunke, M., Gonser, T., 1997. The ecological significance of exchange processesbetween rivers and groundwater. Freshwater Biology 37, 1–33.
Burnham, K.P., Anderson, D.R., 2001. Kullback–Leibler information as a basis forstrong inference in ecological studies. Wildlife Research 28, 111–119.
Butturini, A., Battin, T.J., Sabater, F., 2000. Nitrification in stream sediment biofilms:the role of ammonium concentration and DOC quality. Water Research 34, 629–639.
Chestnut, T.J., McDowell, W.H., 2000. C and N dynamics in the riparian andhyporheic zones of a tropical stream, Luquillo Mountains, Puerto Rico. Journal ofthe North American Benthological Society 19, 199–214.
Dent, C.L., Schade, J.D., Grimm, N.B., Fisher, S.G., 2000. Subsurface influences onsurface biology. In: Jones, J.B., Mulholland, P.J. (Eds.), Streams and GroundWaters. Academic Press, Boston, pp. 381–402.
Duff, J.H., Triska, F.J., 1990. Denitrification in sediments from the hyporheic zoneadjacent to a small forested stream. Canadian Journal of Fisheries and AquaticSciences 47, 1140–1147.
Duff, J.H., Triska, F.J., 2000. Nitrogen biogeochemistry and surface-subsurfaceexchange in streams. In: Jones, J.B., Mulholland, P.J. (Eds.), Streams and GroundWaters. Academic Press, Boston, pp. 197–220.
Findlay, S., 1995. Importance of surface-subsurface exchange in stream ecosystems:the hyporheic zone. Limnology and Oceanography 40, 159–164.
Findlay, S., Sobczak, W.V., 1996. Variability in removal of dissolved organic carbonin hyporheic sediments. Journal of the North American Benthological Society15, 35–41.
Findlay, S., Sobczak, W.V., 2000. Microbial communities in hyporheic sediments. In:Jones, J.B., Mulholland, P.J. (Eds.), Streams and Ground Waters. Academic Press,Boston, pp. 284–306.
Findlay, S., Strayer, D., Goumbla, D., Gould, K., 1993. Metabolism of streamwaterdissolved organic carbon in the shallow hyporheic zone. Limnology andOceanography 38, 1493–1499.
Fischer, H., Pusch, M., Schwoerbel, J., 1996. Spatial distribution and respirationof bacteria in stream-bed sediments. Archiv für Hydrobiologie 137,281–300.
Grimm, N.B., Fisher, S.G., 1984. Exchange between interstitial and surface water:implications for stream metabolism and nutrient cycling. Hydrobiologia 111,219–228.
Hedin, L.O., 1990. Factors controlling sediment community respiration in woodlandstream ecosystems. Oikos 57, 94–105.
Hedin, L.O., von Fischer, J.C., Ostrom, N.E., Kennedy, B.P., Brown, M.G.,Robertson, G.P., 1998. Thermodynamic constraints on nitrogentransformations and other biogeochemical processes at soil–stream interfaces.Ecology 79, 684–703.
Hendricks, S.P., White, D.S., 1991. Physicochemical patterns within a hyporheiczone of a northern Michigan river, with comments on surface water patterns.Canadian Journal of Fisheries and Aquatic Sciences 48, 1645–1654.
Hill, A.R., Labadia, C.F., Sanmugadas, K., 1998. Hyporheic zone hydrology andnitrogen dynamics in relation to the streambed topography of a N-rich stream.Biogeochemistry 42 (3), 285–310.
Hinkle, S.R., Duff, J.H., Triska, F.J., Laenen, A., Gates, E.B., Bencala, K.E., Wentz, D.A., Silva,S.R., 2001. Linking hyporheic flow and nitrogen cycling near theWillamette River –a large river in Oregon, USA. Journal of Hydrology 244, 157–180.
Holmes, R.M., Jones, J.B., Fisher, S.G., Grimm, N.B., 1996. Denitrification in anitrogen-limited stream ecosystem. Biogeochemistry 33, 125–146.
Hunter, K.S., Wang, Y., Van Cappellen, P., 1998. Kinetic modeling of microbially-driven redox chemistry of subsurface environments: coupling transport,microbial metabolism and geochemistry. Journal of Hydrology 209, 53–80.
Iribar, A., 2007. Composition des communautés bactériennes dénitrifiantes au seind’un aquifère alluvial et facteurs contrôlant leur structuration: relation entrestructure des communautés et dénitrification. Ph.D., Université Paul Sabatier-Toulouse III, Toulouse, France.
Johnson, J.B., Omland, K.S., 2004. Model selection in ecology and evolution. Trendsin Ecology and Evolution 19, 101–108.
Jones, J.B., 1995. Factors controlling hyporheic respiration in a desert stream.Freshwater Biology 34, 91–99.
Jones, J.B., Holmes, R.M., 1996. Surface–subsurface interactions in streamecosystem. Trends in Ecology & Evolution 11 (6), 239–242.
Jones, J.B., Mulholland, P.J. (Eds.), 2000. Streams and Ground Waters. AcademicPress, San Diego.
Jones, J.B., Fisher, S.G., Grimm, N.B., 1995. Nitrification in the hyporheic zone of adesert stream ecosystem. Journal of the North American Benthological Society14, 249–258.
Junk, J.W., Bayley, P.B., Sparks, R.E., 1989. The flood pulse concept in river floodplainsystems. Canadian Special Publications of Fisheries and Aquatic Sciences 106,110–127.
Kasahara, T., Hill, A.R., 2006. Effects of riffle–step restoration on hyporheic zonechemistry in N-rich lowland streams. Canadian Journal of Fisheries and AquaticSciences 63, 120–133. doi:10.1139/F05-199.
Kasahara, T., Hill, A.R., 2007. Lateral hyporheic zone chemistry in an artificiallyconstructed gravel bar and a re-meandered stream channel, Southern Ontario,Canada. Journal of the American Water Resources Association 43 (5), 1257–1269. doi:10.1111/j.1752-1688.2007.00108.x.
Koutny, J., Rulik, M., 2007. Hyporheic biofilm particulate organic carbon in a smalllowland stream (Sitka, Czech Republic): structure and distribution.International Review of Hydrobiology 92 (4–5), 402–412.
Lefebvre, S., Marmonier, P., Peiry, J.L., 2006. Nitrogen dynamics in rural streams:differences between geomorphologic units. International Journal of Limnology42 (1), 43–52.
Matsumoto, G., 1983. Changes in organic constituents in river water duringincubation. Water Research 17, 1803–1810.
Mear-Caubel, N., 2004. Dynamique des éléments biogènes dans le sous-écoulement.Approche par modélisation mathématique. Master d’Ecologie des SystèmesContinentaux, Universités Paul Sabatier-Toulouse III, Blaise Pascal-Clermont IIet Montpellier II.
Melillo, J.M., Naiman, R.J., Aber, J.D., Eshleman, K.N., 1983. The influence of substratequality and stream size on wood decomposition dynamics. Œcologia 58, 281–285.
Mermillod-Blondin, F., Gaudet, J.P., Gérino, M., Desrosiers, G., Creuzé des Châtelliers,M., 2003. Influence of macroinvertebrates on physico-chemical and microbialprocesses in hyporheic sediments. Hydrological Processes 17, 779–794.
Mulholland, P.J., 1981. Formation of particulate carbon in water from asoutheastern swamp-stream. Limnology and Oceanography 26 (4), 790–795.
Petersen, R.C., Cummins, K.W., 1974. Leaf processing in a woodland stream.Freshwater Biology 4, 343–368.
Pinay, G., Haycock, N.E., Ruffinoni, C., Holmes, R.M., 1994. The role of denitrificationin nitrogen removal in river corridors. In: Mitsch, W.J. (Ed.), Global Wetlands:Old World and New. Elsevier, Amsterdam, pp. 101–116.
Pinay, G., Ruffinoni, C., Wondzell, S., Gazelle, F., 1998. Change in groundwaternitrate concentration in a large river floodplain: denitrification, uptake ormixing? Journal of the North American Benthological Society 17 (2), 179–189.
Pretty, J.L., Hildrew, A.G., Trimmer, M., 2006. Nutrient dynamics in relation tosurface–subsurface hydrological exchange in a groundwater fed chalk stream.Journal of Hydrology 330, 84–100.
Pusch, M., 1996. The metabolism of organic matter in the hyporheic zone of amountain stream, and its spatial distribution. Hydrobiologia 323, 107–118.
Pusch, M., Schwoerbel, J., 1994. Community respiration in hyporheic sediments of amountain stream (Steina, Black Forest). Archiv für Hydrobiologie 130, 35–52.
Sánchez Pérez, J.M., Vervier, P., Garabetian, F., Sauvage, S., Loubet, M., Rols, J.L.,Bariac, T., Weng, P., 2003. Nitrogen dynamics in the shallow groundwater of ariparian wetland zone of the Garonne, south-western France. Nitrate inputs,bacterial densities, organic matter supply and denitrification measurements.Hydrology and Earth System Sciences 7, 97–107.
Schindler, J.E., Krabbenhoft, D.P., 1998. The hyporheic zone as a source of dissolvedorganic carbon and carbon gazes to a temperate forest stream. Biogeochemistry43, 157–174.
Schramm, A., Larsen, L.H., Revsbech, N.P., Ramsing, N.B., Amann, R., Schleifer, K.H.,1996. Structure and function of a nitrifying biofilm as determined by in situhybridisation and the use of microelectrodes. Applied and EnvironmentalMicrobiology 62, 4641–4647.
Sheibley, R.W., Jackman, A.P., Duff, J.H., Triska, F.J., 2003. Numerical modeling ofcoupled nitrification–denitrification in sediment perfusion cores from thehyporheic zone of the Shingobee River, MN. Advances in Water Resources 26,977–987.
Sobczak, W.V., Hedin, L.O., Klug, M.J., 1998. Relationships between bacterialproductivity and organic carbon at a soil–stream interface. Hydrobiologia386, 45–53.
Sobczak, W.V., Findlay, S., Dye, S., 2003. Relationships between DOC bioavailabilityand nitrate removal in an upland stream: an experimental approach.Biogeochemistry 62, 309–327.
Soetaert, K., Herman, P.M.J., Middleburg, J.J., Heip, C., DeStigter, H.S., Van Weering,T.C.E., Epping, E., Helder, W., 1996. Modeling 210Pb-derived mixing activity inocean margin sediments: diffusive versus nonlocal mixing. Journal of MarineResearch 54, 1207–1227.
Sophocleous, M., 2002. Interactions between groundwater and surface water: thestate of the science. Hydrogeology Journal 10, 52–67.

Stanley, E.H., Jones, J.B., 2000. Surface–subsurface interactions: past, present, future.In: Jones, J.B., Mulholland, P.J. (Eds.), Streams and Ground Waters. AcademicPress, Boston, pp. 405–417.
Storey, R.G., Williams, D.D., Fulthorpe, R.R., 2004. Nitrogen processing in thehyporheic zone of a pastoral stream. Biogeochemistry 69, 285–313.
Tiedje, J.M., 1988. Ecology of denitrification and dissimilatory nitrate reduction toammonium. In: Zehnder, A.J.B. (Ed.), Biology of Anaerobic Microorganisms. JohnWiley & Sons, Toronto, pp. 179–244.
Triska, F.J., Kennedy, V.C., Avanzino, R.J., Zellweger, G.W., Bencala, K.E., 1989.Retention and transport of nutrients in a third-order stream in northwesternCalifornia: hyporheic processes. Ecology 70 (6), 1893–1905.
Triska, F.J., Duff, J.H., Avanzino, R.J., 1993. The role of water exchange between astream channel and its hyporheic zone in nitrogen cycling at the terrestrial–aquatic interface. Hydrobiologia 251, 167–184.
Valett, H.M., Morrice, J.A., Dahm, C.N., Campana, M.E., 1996. Parent lithology,surface-groundwater exchange, and nitrate retention in headwater streams.Limnology and Oceanography 41, 333–345.
Van Cappellen, P., Wang, Y., 1995. Cycling of iron and manganese in surfacesediments: a general theory for the coupled transport and reaction of carbon,oxygen, nitrogen, sulfur, iron and manganese. American Journal of Science 296,197–243.
Vervier, P., Gibert, J., Marmonier, P., Dole-Olivier, M.J., 1992. A perspective on thepermeability of the surface freshwater–groundwater ecotone. Journal of theNorth American Benthological Society 11 (1), 93–102.
Vervier, P., Dobson, M., Pinay, G., 1993. Role of interaction zones between surfaceand ground waters in DOC transport and processing: considerations for riverrestoration. Freshwater Biology 29, 275–284.
Webster, J.R., Mulholland, P.J., Tank, J.L., Valett, H.M., Dodds, W.K., Peterson, B.J.,Bowden, W.B., Dahm, C.N., Findlay, S., Gregory, S.V., Grimm, N.B., Hamilton, S.K.,Johnson, S.L., Marti, E., McDowell, W.H., Meyer, J.L., Morrall, D.D., Thomas, S.A.,Wollheim, W.M., 2003. Factors affecting ammonium uptake in streams–aninterbiome perspective. Freshwater Biology 48, 1329–1352.
Wetzel, R.G., Manny, B.A., 1972. Decomposition of dissolved organic carbon andnitrogen compounds from leaves in an experimental hard water stream.Limnology & Oceangraphy 17, 927–931.
White, D.S., 1993. Perspectives on defining and delineating hyporheic zones. Journalof the North American Benthological Society 12 (1), 61–69.
Wijsman, J.W.M., Herman, P.M.J., Middelburg, J.J., Soetaert, K., 2002. A model forearly diagenetic processes in sediments of the continental shelf of the black sea.Estuarine Coastal and Shelf Science 54, 403–421.
Wondzell, S.M., Swanson, F.J., 1996. Seasonal and storm dynamics of the hyporheiczone of a 4th order mountain stream II: nitrogen cycling. Journal of the NorthAmerican Benthological Society 15, 20–34.
Yoshinari, T., Knowles, R., 1976. Acetylene inhibition of nitrous oxide reduction bydenitrifying bacteria. Biochemical and Biophysical Research Communications69 (3), 705–710.