Identifying Functional Flow Linkages Between Stream ...
14
Identifying Functional Flow Linkages Between Stream Alteration and Biological Stream Condition Indices Across California Ryan Peek 1 *, Katie Irving 2 , Sarah M. Yarnell 1 , Rob Lusardi 1,3 , Eric D. Stein 2 and Raphael Mazor 2 1 Center for Watershed Sciences, University of California, Davis, Davis, CA, United States, 2 Southern California Coastal Water Research Project, Costa Mesa, CA, United States, 3 Department of Wildlife, Fish, and Conservation Biology, University of California, Davis, Davis, CA, United States Large state or regional environmental flow programs, such as the one based on the California Environmental Flows Framework, rely on broadly applicable relationships between flow and ecology to inform management decisions. California, despite having high flow and bioassessment data density, has not established relationships between specific elements of the annual hydrograph and biological stream condition. To address this, we spatially and temporally linked USGS gage stations and biological assessment sites in California to identify suitable paired sites for comparisons of streamflow alteration with biological condition at a statewide scale. Flows were assessed using a set of functional flow metrics that provide a comprehensive way to compare alteration and seasonal variation in streamflow across different locations. Biological response was evaluated using the California Stream Condition Index (CSCI) and Algal Stream Condition Index (ASCI), which quantify biological conditions by translating benthic invertebrate or algal resources and watershed-scale environmental data into an overall measure of stream health. These indices provide a consistent statewide standard for interpreting bioassessment data, and thus, a means of quantitatively comparing stream conditions throughout the state. The results indicate that indices of biological stream condition were most closely associated with flow alteration in seasonality and timing metrics, such as fall pulse timing, dry-season timing, and wet season timing. Magnitude metrics such as dry-season baseflow, wet season baseflow, and the fall pulse magnitude were also important in influencing biological stream conditions. Development of ecological flow needs in large-scale environmental programs should consider that alteration to any of the seasonal flow components (e.g., dry-season baseflow, fall pulse flow, wet-season baseflow, spring recession flow) may be important in restructuring biological communities. Keywords: bioassessment, flow modification, ecological flow management, seasonality, flow-ecology relationship, California environmental flows framework Edited by: Carlo Camporeale, Politecnico di Torino, Italy Reviewed by: Ben Stewart-Koster, Griffith University, Australia Rui Manuel Vitor Cortes, University of Trás-os-Montes and Alto Douro, Portugal *Correspondence: Ryan Peek [email protected] Specialty section: This article was submitted to Freshwater Science, a section of the journal Frontiers in Environmental Science Received: 07 October 2021 Accepted: 29 November 2021 Published: 04 January 2022 Citation: Peek R, Irving K, Yarnell SM, Lusardi R, Stein ED and Mazor R (2022) Identifying Functional Flow Linkages Between Stream Alteration and Biological Stream Condition Indices Across California. Front. Environ. Sci. 9:790667. doi: 10.3389/fenvs.2021.790667 Frontiers in Environmental Science | www.frontiersin.org January 2022 | Volume 9 | Article 790667 1 ORIGINAL RESEARCH published: 04 January 2022 doi: 10.3389/fenvs.2021.790667 SCCWRP #1240
-
Upload
khangminh22 -
Category
Documents
-
view
1 -
download
0
Transcript of Identifying Functional Flow Linkages Between Stream ...

Identifying Functional Flow LinkagesBetween Stream Alteration andBiological Stream Condition IndicesAcross CaliforniaRyan Peek1*, Katie Irving2, Sarah M. Yarnell 1, Rob Lusardi 1,3, Eric D. Stein2 andRaphael Mazor2
1Center for Watershed Sciences, University of California, Davis, Davis, CA, United States, 2Southern California Coastal WaterResearch Project, Costa Mesa, CA, United States, 3Department of Wildlife, Fish, and Conservation Biology, University ofCalifornia, Davis, Davis, CA, United States
Large state or regional environmental flow programs, such as the one based on theCalifornia Environmental Flows Framework, rely on broadly applicable relationshipsbetween flow and ecology to inform management decisions. California, despite havinghigh flow and bioassessment data density, has not established relationships betweenspecific elements of the annual hydrograph and biological stream condition. To addressthis, we spatially and temporally linked USGS gage stations and biological assessmentsites in California to identify suitable paired sites for comparisons of streamflow alterationwith biological condition at a statewide scale. Flows were assessed using a set offunctional flow metrics that provide a comprehensive way to compare alteration andseasonal variation in streamflow across different locations. Biological response wasevaluated using the California Stream Condition Index (CSCI) and Algal StreamCondition Index (ASCI), which quantify biological conditions by translating benthicinvertebrate or algal resources and watershed-scale environmental data into an overallmeasure of stream health. These indices provide a consistent statewide standard forinterpreting bioassessment data, and thus, a means of quantitatively comparing streamconditions throughout the state. The results indicate that indices of biological streamcondition were most closely associated with flow alteration in seasonality and timingmetrics, such as fall pulse timing, dry-season timing, and wet season timing. Magnitudemetrics such as dry-season baseflow, wet season baseflow, and the fall pulse magnitudewere also important in influencing biological stream conditions. Development of ecologicalflow needs in large-scale environmental programs should consider that alteration to any ofthe seasonal flow components (e.g., dry-season baseflow, fall pulse flow, wet-seasonbaseflow, spring recession flow) may be important in restructuring biological communities.
Keywords: bioassessment, flow modification, ecological flow management, seasonality, flow-ecology relationship,California environmental flows framework
Edited by:Carlo Camporeale,
Politecnico di Torino, Italy
Reviewed by:Ben Stewart-Koster,
Griffith University, AustraliaRui Manuel Vitor Cortes,
University of Trás-os-Montes and AltoDouro, Portugal
*Correspondence:Ryan Peek
Specialty section:This article was submitted to
Freshwater Science,a section of the journal
Frontiers in Environmental Science
Received: 07 October 2021Accepted: 29 November 2021Published: 04 January 2022
Citation:Peek R, Irving K, Yarnell SM, Lusardi R,
Stein ED and Mazor R (2022)Identifying Functional Flow Linkages
Between Stream Alteration andBiological Stream Condition Indices
Across California.Front. Environ. Sci. 9:790667.
doi: 10.3389/fenvs.2021.790667
Frontiers in Environmental Science | www.frontiersin.org January 2022 | Volume 9 | Article 7906671
ORIGINAL RESEARCHpublished: 04 January 2022
doi: 10.3389/fenvs.2021.790667
SCCWRP #1240

1 INTRODUCTION
Flow alteration is a pervasive and significant issue globally and inCalifornia, where over 95% of California’s gaged streams havealtered flow (Poff et al., 2007; Grantham et al., 2014; Zimmermanet al., 2017). Hydrologic alteration of flow by dams, diversions,and urbanization impacts seasonal and inter-annual flowvariability, population connectivity, gene flow, biodiversity,and ecological processes (Dudgeon et al., 2006; Yarnell et al.,2010; Carlisle et al., 2011; Peek et al., 2021). While the causes andrelated impacts of flow alteration are well documented (Poff et al.,2007), significant gaps remain in linking flow management withecological responses to track current stream conditions, evaluaterestoration efficacy, and provide future flow recommendations(Poff and Zimmerman, 2010).
A critical component of developing ecological flow needs formanagement is to identify relationships between specific flowmetricsthat represent distinct characteristics of the annual hydrograph andmeasures of biological stream conditions at broad spatial scales (Poffand Zimmerman, 2010). A variety of datasets and approaches havebeen used for assessing stream conditions, with benthic invertebratesand algae as the most common indicators of stream health in a widerange of flow alteration studies across the United States (Stevensonand Smol, 2003; Lawrence et al., 2010; Stevenson et al., 2010; Lundeet al., 2013; Stevenson, 2014; Mazor et al., 2016; Steel et al., 2018). Forexample, hydrologic alteration or impairment has been shown tostrongly influence aquatic benthic invertebrate communities (Poffet al., 2007; Rehn, 2009), and benthic invertebrates have been used tolink metrics of hydrologic variability to biological communityresponse (Poff and Zimmerman, 2010; Steel et al., 2018). Studiesof the direct relationships between algae and flow are limited(Kirkwood et al., 2009; Miller et al., 2009; Schneider et al., 2016),with some exceptions involving algal blooms in large rivers (Chenget al., 2019; Xia et al., 2020) and directly following a flood (Schneideret al., 2016). However, impacts of flow alteration on water quality(Nilsson and Renöfält, 2008) can also indirectly influence thecomposition of algal communities (Allan, 2004; Lange et al.,2016). Yet, evaluation of direct relationships between individualflow metrics and biologic response across broad spatial scales andassessment of whether such relationships provide a means ofquantitatively comparing stream conditions across large regionsremains limited.
Unified assessment tools have been developed to comparebiologic stream conditions across large heterogeneouslandscapes, such as California (see (Mazor et al., 2016; Becket al., 2019b; Theroux et al., 2020); however, quantitativecomparison of biologic metrics with flow metrics to assessecological response to flow alteration at these large spatial scaleshas not been completed. Two key datasets in California provide theopportunity to explore quantitative flow-ecology relationshipsacross a diversity of climate, geology, hydrology, and land useimpacts. For streamflow data, the US Geological Survey (USGS)National Water Information System (NWIS) is a comprehensiveand distributed application that provides a wide range of waterdata, including daily stream flows from over 28,000 stations acrossthe United States, including over 700 stations in California. Todescribe and quantify the different flow components and
characteristics of California’s seasonal hydrograph, a functionalflows approach provides a standardized hydrologic method toevaluate the role of the flow regime in structuring streamecosystems (Yarnell et al., 2020). Twenty-four functional flowmetrics were developed for California by Yarnell et al. (2020)that quantify five key flow components (fall pulse flow, wet-seasonbaseflow, peak flow, spring recession flow, and dry-seasonbaseflow) of the flow regime, with individual metrics describingthe magnitude, timing, frequency, duration and rate of change ofeach functional flow component (Supplementary Appendix S1).The functional flow metrics are not directly linked to individual/specific organisms/groups, but are associated with specificbiological and ecosystem processes (Yarnell et al., 2020).Calculated from existing daily flow data, functional flow metricsprovide a comprehensive way to compare alteration and seasonalvariation in streamflow across different locations.
For biological and biophysical data, the SurfaceWater AmbientMonitoring Program (SWAMP) is tasked with assessing surfacewater quality throughout California. The program coordinateswater quality monitoring across the state and collects data tosupport water resource management by the State Water Board.The data collected by SWAMP’s probabilistic Perennial StreamAssessment survey is used to characterize in-stream biologicalconditions and make estimates about the extent of healthystreams in different regions of the state. These data include twostandardized bioassessment indices, the California StreamCondition Index (CSCI) based on benthic macroinvertebratedata and the Algal Stream Condition Index (ASCI), thatprovide quantitative measures of biologic stream conditionsacross broad spatial scales (Mazor et al., 2016; Theroux et al.,2020). CSCI and ASCI are predictive multimetric indicesdeveloped for California streams (Mazor et al., 2016; Therouxet al., 2020) and include many stream and landscape componentsthat describe biological sensitivities or tolerances to disturbance.The indices allow for the evaluation of biotic response withoutspecificity to one individual metric (e.g., taxa richness), enablingcoverage of a broader range of characteristics and stressorsassociated with individual watersheds. These indices areintended to aid stream management (e.g., condition assessment,prioritization, and flow target development; see (Stein et al., 2017;Mazor et al., 2018; Beck et al., 2019a)) and have been integratedinto unified assessments of stream health (Beck et al., 2019b). Withlow regional bias and consideration of natural variation, CSCI andASCI can distinguish between reference and biologically degradedsites, can be applied at multiple scales, and are appropriate to applyto the diverse landscapes of California (Mazor et al., 2018).Leveraging these statewide biological datasets in conjunctionwith methods for quantifying hydrologic variability viafunctional flow metrics across California (Grantham et al., 2021.this issue; Stein et al., 2021 this issue; Yarnell et al., 2020) provides aunique opportunity to assess biological response to hydrologicalteration across the large-scale diversity of California.
Here, we aim to address the need for broadly applicablequantitative relationships between flow and ecology thatinform management decisions across large diverse regions,such as California. Our objectives were to: 1) identifyfunctional flow and biological condition metrics that explain
Frontiers in Environmental Science | www.frontiersin.org January 2022 | Volume 9 | Article 7906672
Peek et al. Linking Functional Flows with Stream Condition

the greatest variation in statewide and regional data, and 2) assessrelationship trends between functional flow metrics andbiological condition. This research has important implicationsfor environmental flow management, particularly wherepractitioners seek to link biological response to functionalflows, assess restoration efficacy, and track change in managedfreshwater systems.
2 MATERIALS AND METHODS
2.1 General ApproachTo assess relationships between streamflow condition and streamhealth, all ASCI and CSCI sites were spatially and temporallypaired with proximal USGS gages across California. In some caseswhere ASCI and CSCI sites were associated with more than oneUSGS gage, all site pairs were retained for the analysis. Usingthese paired sites, we calculated 24 functional flow metricsdefined by Yarnell et al. (2020), using a minimum of 10 yearsof continuous flow data at each selected USGS gage site. Wecalculated hydrologic alteration (delta hydrology) using anormalized difference between the observed median value andpredicted median value of each functional flow metric. Statisticalmodels were then developed to identify which of the functionalflow metrics were most closely associated with biological indexscores, and the directionality of those relationships.
2.2 Pairing of Biological Stream Condition(California Stream Condition Index andAlgal Stream Condition Index) Sites With USGeological Survey Gage SitesWe identified all bioassessment sites (n � 2,935) in the SWAMPdataset with available ASCI and CSCI scores from data sampledbetween 1994–2018 during late spring and summer months (May
to September, when sampling typically occurs). To pairbioassessment sites with USGS gage sites, we filtered locationsto include only bioassessment sites occurring in the sameHydrologic Unit Code (HUC) catchment as USGS gages with atleast 10 years of contiguous daily flow data (Figure 1). We filteredbioassessment sites from the previous step to include only sites onthe same National Hydrography Dataset (NHD) mainstem streamor river as the USGS gage (in the same HUC12 catchment)—provided each site was within 10 km downstream of thegage—using the nhdplusTools, dplyr, and sf packages in Rversion 4.1.1 (Blodgett, 2018; Pebesma, 2018; Wickham et al.,2018, 2019; R Core Team, 2021). Using this list of biological-gage site pairs, we removed sites that did not contain flow data after1994 to ensure temporal overlap with the biological assessmentsampling events (i.e., all ASCI and CSCI data was collected andcalculated after 1994). Data from final site pairs were used in allsubsequent analyses. For bioassessment sampling events andresulting ASCI or CSCI scores that occurred in the same wateryear at the same location, we calculated the median value of thesereplicate scores to use in the statistical modeling.
2.3 Calculating Delta Hydrology UsingFunctional Flow MetricsOnce the selected ASCI and CSCI sites were paired with proximalUSGS sites, we calculated functional flow metrics (FFM) over thelongest contiguous period of record for each USGS gage using theusing the Functional Flows Calculator API client package in R(version 0.9.7.2)1, which uses hydrologic feature detectionalgorithms developed by Patterson et al. (2020) and thePython functional flows calculator2. We calculated a
FIGURE 1 | Workflow diagram of steps used to pair biological stream condition sites with USGS gage locations.
1https://github.com/ceff-tech/ffc_api_client.2https://github.com/NoellePatterson/ffc-readme.
Frontiers in Environmental Science | www.frontiersin.org January 2022 | Volume 9 | Article 7906673
Peek et al. Linking Functional Flows with Stream Condition

normalized hydrologic alteration metric based on the departurefrom the predicted reference flow (difference between theobserved FFM and the predicted [unimpaired referencecondition] FFM) associated with the stream segment at theUSGS gage (see Grantham et al. this issue for additionaldetails on how predicted reference-based functional flowmetrics were modeled). This measure of delta hydrology wascalculated as:
(50 percentile Observed FFM
− 50th percentile Predicted FFM)/ 50th percentile Predicted FFM
In some cases, the FFM value for a single water year at a gagecould not be calculated, resulting in an “NA” value. This couldoccur for several reasons, such as the data record was incompleteor the annual hydrograph was extremely different compared withthe predicted reference condition. These instances would oftenlack a seasonal flow pattern that the flow calculator relies on toderive subsequent metrics (Patterson et al., 2020). If more than70% of the annual values for a metric across the period of recordat a gage were NA, then the flow alteration for that metric at thatgage was not included in the dataset. One additional metric,seasonality, was calculated for each gage using the same period ofrecord; seasonality is based on Colwell’s metrics, which measurethe seasonal predictability of environmental phenomena(Colwell, 1974). These metrics are defined in terms ofPredictability (P), Constancy (C), and Contingency (M)—where M represents temporal variability and P is the reliablerecurrence of seasonal patterns across multiple cycles.Importantly, Colwell’s P is maximized when environmentalphenomenon is constant throughout the year, if the seasonalfluctuation is consistent across all years, or a combination of both(Tonkin et al., 2017). Following Tonkin et al. (2017), wecalculated seasonality as Colwell’s M/P, as it can be applied ina wide range of ecological studies (Tonkin et al., 2017; Radecki-Pawlik et al., 2020; Peek et al., 2021) and provides a measureranging from 0 to 1, with 1 being highly seasonal, of how theenvironment or daily flow varies within a single year.
2.4 Statistical Analysis of Stream ConditionIndices vs. Functional Flow MetricsTo determine which FFMs had the strongest association withstreamflow alteration, we modeled estimates of delta hydrology(departure from the predicted reference flow) for each FFMagainst biological condition scores (i.e., ASCI and CSCI) usingboosted regression tree analysis, following methods from Steelet al. (2018).
Each model was run with CSCI or ASCI as the response andthe delta hydrology statistic for each FFM and seasonality as thecovariates. Boosted regression trees, a method from the decisiontree family of statistics, are well suited for large and complexecological datasets; they do not assume normality nor linearrelationships between predictor and response variables, theyignore non-informative predictor variables, and they canaccept predictors that are numeric, categorical, or binary (Elithet al., 2008; Brown et al., 2012). Boosted regression trees are also
unaffected by outliers and effectively handle both missing dataand collinearity between predictors (De’ath, 2007; Dormannet al., 2013). Importantly, such methods are becoming morecommon in ecological analyses and have been shown tooutperform many traditional statistical methods such as linearregression, generalized linear models, and generalized additivemodels (Guisan et al., 2007). Boosted regression tree models wererun with grid iteration and tuning across parameters (shrinkage[0.001–0.005], interaction depth [3–5], number of minimumobservations in a node [3–10], and bag fraction [0.75–0.8]) inmodel validation, following guidelines from Elith et al. (2008). Toassess the relative influence of each FFM in the model, we usedthe mean-square error method (Ridgeway, 2015).
The most influential FFMs were further examined by plottingthe delta hydrology metric values against biological conditionscores. To better understand regional patterns and assessrelationships across different scales, we also analyzed ASCIand CSCI scores and delta hydrology for FFMs across threestream classifications—snowmelt, rain, and mixed (combinationof rain, snow, or groundwater)—based on Patterson et al. (2020)and (Lane et al., 2017). Thus, each model was also run using onlysites associated with one of these stream classes.
3 RESULTS
3.1 Pairing of Biological Stream ConditionSites With US Geological Survey Gage SitesWe mapped a total of 2,935 unique locations with CSCI values,2,320 unique locations with ASCI values, and 736 USGS gage sites(Figures 2–3) across California. Despite a relatively large pool ofsites to work with, after filtering and pairing, we identified 233ASCI and 231 CSCI sites associated with 222 USGS gages acrossthe state. Thus, approximately 10% of the total bioindicator sitesexist in close spatial proximity (<10 river kilometers) to USGSgage sites with long-term flow data (>10 years). Eight metricswere dropped (Supplementary Appendix S1) from the FFMcalculations due to incomplete data, thus, for every site pair, dataincluded a single biologic condition score, and 16 flow alterationmetric scores, one for each of the remaining functional flowmetrics. The functional flow calculator returned a wide range ofvalues that indicate the broad array of regional hydrologicconditions across California, including a small percentage (<2)of extreme outliers that occurred in the 98th percentile or greaterof all data (Figure 4).
3.2 Statistical Analysis for Statewide SitePair DatasetBoosted regression tree models with delta hydrology andseasonality metrics explained 46% of the deviance in CSCIdata, with a cross-validation correlation of 0.678 (se � 0.019)and 31% in ASCI with a cross-validation correlation of 0.552 (se �0.041). Of the 16 functional flow metrics included in the model,eight had relative importance values greater than 5%, andColwell’s seasonality metric was consistently one of the topthree variables in all models (Figure 5, Table 1). The two
Frontiers in Environmental Science | www.frontiersin.org January 2022 | Volume 9 | Article 7906674
Peek et al. Linking Functional Flows with Stream Condition
most influential FFMs in the statewide model were fall pulsetiming (CSCI � 13.6, ASCI � 12.3% relative influence) andseasonality (CSCI � 15.5%, ASCI � 7.6%) (Figure 5). Dryseason timing was one of the most important variables in theCSCI model, but it was not influential in the ASCI model(Table 1). Three of the top metrics for CSCI related to timing(fall pulse timing, Coldwell’s seasonality, and dry-season timing),while the remaining significant metrics were associated with flowmagnitudes (wet-season baseflow and fall pulse magnitude)(Table 1, Figure 5). For ASCI, the top metrics were alsoprimarily associated with timing (fall pulse timing, Colwell’sseasonality, wet season timing, and spring timing), while otherinfluential metrics were largely associated with flow magnitude(dry-season baseflow, wet-season baseflow, and fall pulsemagnitude). When comparing both ASCI and CSCIcumulatively, the strongest metrics were fall-pulse timing andColwell’s seasonality, followed by dry-season baseflow and wet-season timing. Interestingly, the smallest difference in relativeimportance occurred in the fall pulse magnitude metric (Figure 5,Table 1).
Normalized delta hydrology (departure from referencevalue) for three of the top FFMs was plotted against theASCI and CSCI scores, grouped by the degree of streamalteration based on bioassessment stream conditionthresholds defined by Mazor et al. (2016) and Theroux et al.(2020). Values that fall below zero indicate flow values that areearlier (timing) or decreased (magnitude) from the expectedreference condition (Figure 6). Based on the delta hydrology,fall pulse timing occurred earlier than the expected reference
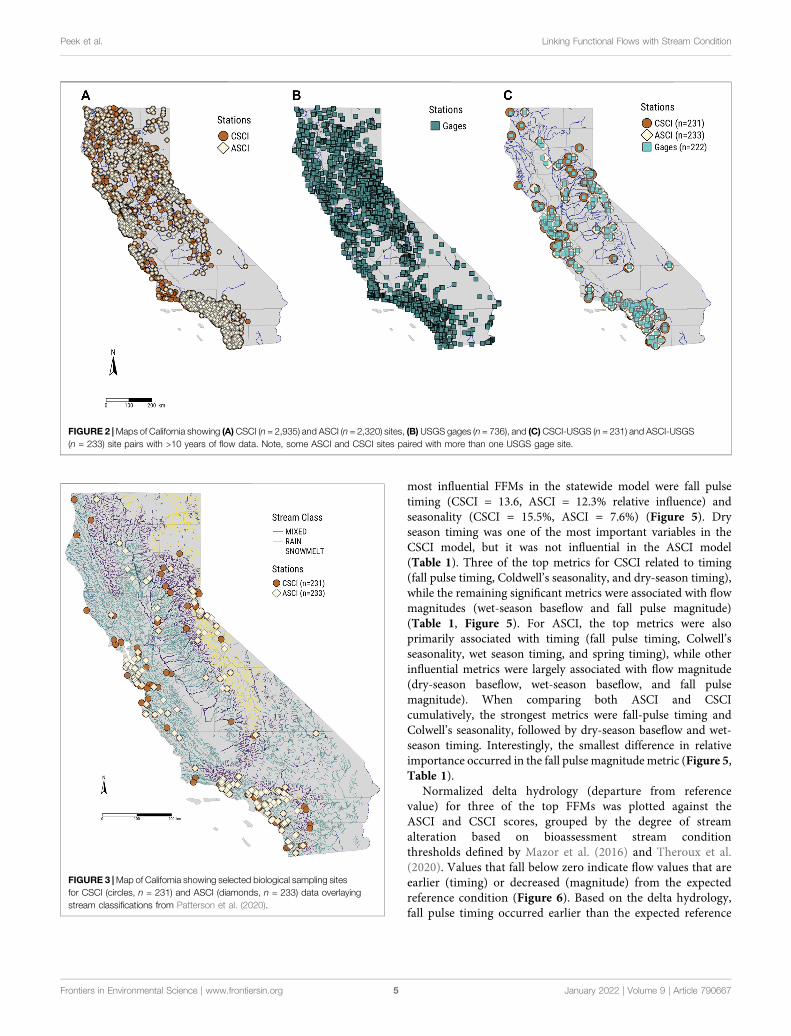
FIGURE 2 |Maps of California showing (A)CSCI (n � 2,935) and ASCI (n � 2,320) sites, (B) USGS gages (n � 736), and (C)CSCI-USGS (n � 231) and ASCI-USGS(n � 233) site pairs with >10 years of flow data. Note, some ASCI and CSCI sites paired with more than one USGS gage site.
FIGURE 3 |Map of California showing selected biological sampling sitesfor CSCI (circles, n � 231) and ASCI (diamonds, n � 233) data overlayingstream classifications from Patterson et al. (2020).
Frontiers in Environmental Science | www.frontiersin.org January 2022 | Volume 9 | Article 7906675
Peek et al. Linking Functional Flows with Stream Condition

condition across all bioassessment thresholdcategories—though the lowest values typically correspondedwith the most altered category—for both ASCI and CSCI.For magnitude metrics, the pattern was more distinct in thefall pulse magnitude metric for ASCI, which showed all but the“Likely intact” scores were reduced from the expected referencecondition, and for CSCI, all the “very likely altered” and “likelyaltered” categories had distributions that were reducedcompared to the expected reference conditions (Figure 6).Interestingly, for Colwell’s measure of seasonality, there wasa consistent positive trend towards higher CSCI and ASCIscores with more predictable and consistent seasonality(recurring intra-annual patterns of temporal variability, e.g.,summer low flow periods and winter floods occurring each year)(Figure 7).
3.3 Statistical Analysis by Stream ClassUsing the paired sites, we split sites based on stream class(Patterson et al., 2020), with the largest number of sitesoccurring in stream segments classified as Rain (Snowmelt:ASCI � 37, CSCI � 55; Mixed: ASCI � 88, CSCI � 83; andRain: ASCI � 231, CSCI � 226). Because ASCI and CSCI sitespaired with multiple proximal USGS gages, sample sizes differedfrom the total number of unique stations (Figures 2–3). Streamclass models of delta hydrology showed seasonality, fall pulse, dryseason, and wet season flow components were consistently
important in all regional models, while spring recession flowwas important primarily in the rain and mixed stream classmodels (Table 1, Figure 8). The only regional model thatincluded a peak flow component was the ASCI-snowmelt classmodel. In the snowmelt class models, the 10-years floodmagnitude had the highest relative influence score for ASCI,while seasonality and fall pulse timing had the highest influencefor CSCI, respectively (Table 1). The fall pulse timing was also themost influential metric for CSCI in the rain class model and forASCI in the model of mixed stream class sites (Table 1, Figure 9).
Several metrics with the highest relative influences in theregional stream class models were further examined byplotting the delta hydrology values for each FFM against thepaired bioindicator scores by the thresholds identified in eachbioassessment index. Figure 9 shows the highly variable nature ofdata inherent to the wide diversity of climate and topographyacross California. However, trends in the data indicated potentialunderlying relationships that should be explored further. Inparticular, the data indicated that as seasonality increases,stream condition (ASCI or CSCI) index also generallyincreased, with this pattern most pronounced in the mixedand snowmelt stream classes (Figure 9A). For fall pulsetiming, the data indicated sites with much earlier fall flowpulses than the expected reference condition generallycorresponded with the more altered flow categories for bothASCI and CSCI (Figure 9B).
FIGURE 4 | Boxplots of delta hydrology for functional flow metrics used in the modeling analysis for paired sites across California. The solid pink line in thebackground indicates no difference between the observed 50th percentile and the predicted reference 50th percentile metric value. Values to the left of the line arereduced or early, and values to the right are inflated or late, relative to the expected reference value. Extreme outliers (>98 percentile) have been removed from theboxplot.
Frontiers in Environmental Science | www.frontiersin.org January 2022 | Volume 9 | Article 7906676
Peek et al. Linking Functional Flows with Stream Condition

4 DISCUSSION
Quantitatively linking flow and bioassessment data across large diverseregions, such as California, sheds light on which types of relationshipsare important to consider when establishing ecological flow needs.Our results support previous findings that flow seasonality and
alterations to seasonal flow components are closely related tostream health and are likely important in restructuring biologicalcommunities (Tonkin et al., 2017, 2021). Specifically, we found thatmetrics associated with flow timing (including seasonality) were themost influential in linking functionalflowmetrics with biologic streamcondition. Interestingly, while altered seasonality and timing were the
FIGURE 5 | Relative importance of functional flow metrics in boosted regression tree models assessing flow alteration relative to ASCI and CSCI scores for pairedsites across California. Relative influence values were calculated using a mean-square error (MSE) approach, which determines those variables with the largest averagereduction in MSE. Functional flow metrics are described in Supplementary Appendix S1.
TABLE 1 | Mean relative influence values for functional flow metrics included in four models (with data from all California and three regions based on stream class) thatassessed flow alteration in relation to ASCI and CSCI scores. Bolded values were most influential (>5%).
Flow metric name All CA Rain Mixed Snowmelt
CSCI ASCI CSCI ASCI CSCI ASCI CSCI ASCI
Fall pulse timing 13.6 12.3 20.2 3.6 2.6 35.7 8.6 10.4Fall pulse magnitude 6.4 6.9 6.3 4.9 2.7 8.1 10 5.9Wet-season timing 5.1 13.8 2.8 17.6 3.6 6.5 2.1 11.6Wet-season baseflow 5.8 5 6.6 4.4 1.1 4.6 1.1 5.8Wet-season duration 4.4 2.7 4.4 3.4 9.7 8.1 5.1 2.5Wet-season median flow 2.2 3.7 2.7 5.7 3.2 0.7 8.2 1.910-year flood magnitude 3.8 3.1 3.5 2.7 5.3 3.3 3.4 16.72-year flood magnitude 4.8 2.8 5.2 2.3 3.6 3.1 4.1 2.55-year flood magnitude 3 1.4 3.4 1.1 3.3 1.2 3.6 0.9Spring timing 4.4 4.1 8 6.8 9.1 1.5 1.7 8.4Spring duration 3.8 4 3.5 2.2 8 7.3 2.7 2.4Spring recession magnitude 3.8 6.5 2.8 5.8 3 6.7 7.6 1.5Dry-season high baseflow 2.7 5 3 5.8 9 1 1.2 9.7Dry-season baseflow 5.9 15.8 6.5 16.4 4.7 3.2 7.4 2.8Dry-season timing 9.7 1.2 5.1 1.1 11.4 2.7 5 2.6Dry-season duration 5.2 4 6.2 3.5 5.7 4 8 1.4Colwell’s M/P 15.5 7.6 9.8 12.7 14.2 2.1 20.3 13
Frontiers in Environmental Science | www.frontiersin.org January 2022 | Volume 9 | Article 7906677
Peek et al. Linking Functional Flows with Stream Condition

FIGURE 6 | Influential functional flow metric values (normalized as delta hydrology) versus binned ASCI and CSCI values (based on thresholds from Mazor et al.(2016) and Theroux et al. (2020) for all paired sites across California. The red zero line delineates departure from expected reference flow metric, where values <0 arereduced or early, and values >0 are inflated or late, relative to the expected reference value. Notches indicate an approximate 95% confidence interval to comparemedians, where if notches of two boxplots do not overlap, this suggests the medians are significantly different (see McGill et al. (1978).
FIGURE 7 | Colwell’s seasonality versus binned ASCI and CSCI values (based on thresholds from Mazor et al. (2016) and Theroux et al. (2020) for all paired sitesacross California. Notches indicate an approximate 95% confidence interval to compare medians, where if notches of two boxplots do not overlap, this suggests themedians are significantly different (see McGill et al. (1978).
Frontiers in Environmental Science | www.frontiersin.org January 2022 | Volume 9 | Article 7906678
Peek et al. Linking Functional Flows with Stream Condition

most influential flow metrics for CSCI, altered dry season baseflowand timing were most informative for ASCI, indicating at large spatialscales (e.g., California), there may be differences in how exactlyseasonal flow changes invertebrate and algal communities. Indeveloping environmental flow recommendations, managersshould look to retaining the natural seasonal timing of higher andlowermagnitude flows in order to support native aquatic assemblages.
4.1 TimingMetrics had the Strongest Link toBiological Stream ConditionIn both statewide and regional stream class models, timingmetrics were the most important, often comprising three ormore of the top five influential metrics. Of the timing metrics,fall pulse timing was the most influential in describing biologicaldifferences in the statewide CSCI and ASCI models. The timing ofthe fall pulse flow in California typically occurs in November(Ahearn et al., 2004) but varies widely between 1st October and15th December (Patterson et al., 2020). It represents the firstprecipitation event following the dry season baseflow period, andthus is important in determining the biological condition ofstreams (Yarnell et al., 2015). During the prior dry season lowflow period, filamentous algal mats typically become moreprevalent and are associated with increases in streamtemperature, reduced streamflow velocity, and nutrientenrichment (McIntire, 1966; Poff et al., 1990; Suren et al.,2003). Changes in stream velocity associated with the arrival
of the fall pulse flow may scour and effectively remove algal mats,ultimately flushing organic material downstream. The fall pulseflow is also known to flush organic matter and nutrient subsidiesfrom adjacent riparian habitats to streams, enhancing foodresources and detrital carbon for foraging invertebrates(Ahearn et al., 2004; Blanckaert et al., 2013). During the dryseason low flow period, invertebrates commonly use thehyporheic zone as a refuge from potentially unsuitableenvironmental conditions (e.g., temperature) (Wood et al.,2010; Stubbington, 2012). Fall pulse flows reconnect streamswith their hyporheic zone and decrease water temperature(Yarnell et al., 2015) providing a cue for fall or winterinvertebrate emergence (Ward and Stanford, 1982), the timingof which may help synchronize life history events or behavioraladaptations that increase reproductive success (Lytle, 2001; Lytleand Poff, 2004). As a result, fall pulse flows not only increaseinvertebrate habitat availability and heterogeneity (Blanckaertet al., 2013; Naman et al., 2016), but reconnect invertebratecommunities and population gene flow through dispersal(Townsend and Hildrew, 1976; Mackay, 1992), providing avital food resource for resident fishes and other higher orderconsumers. Thus, fall pulse flow timing may be a key factor in re-establishing food web and community connectivity (Elliott, 1973;Nislow et al., 1998; Romaniszyn et al., 2007).
While timing was highly influential in the statewide ASCImodel, dry season baseflow was the most influential metric, suchthat flows both above and below reference condition may impact
FIGURE 8 | Relative importance of functional flow metrics in boosted regression tree models assessing flow alteration relative to ASCI and CSCI scores by streamclassification (Patterson et al., 2020). Relative influence values were calculated using a mean-square error (MSE) approach, which determines those variables with thelargest average reduction in MSE. Functional flow metrics are described in Table 1.
Frontiers in Environmental Science | www.frontiersin.org January 2022 | Volume 9 | Article 7906679
Peek et al. Linking Functional Flows with Stream Condition
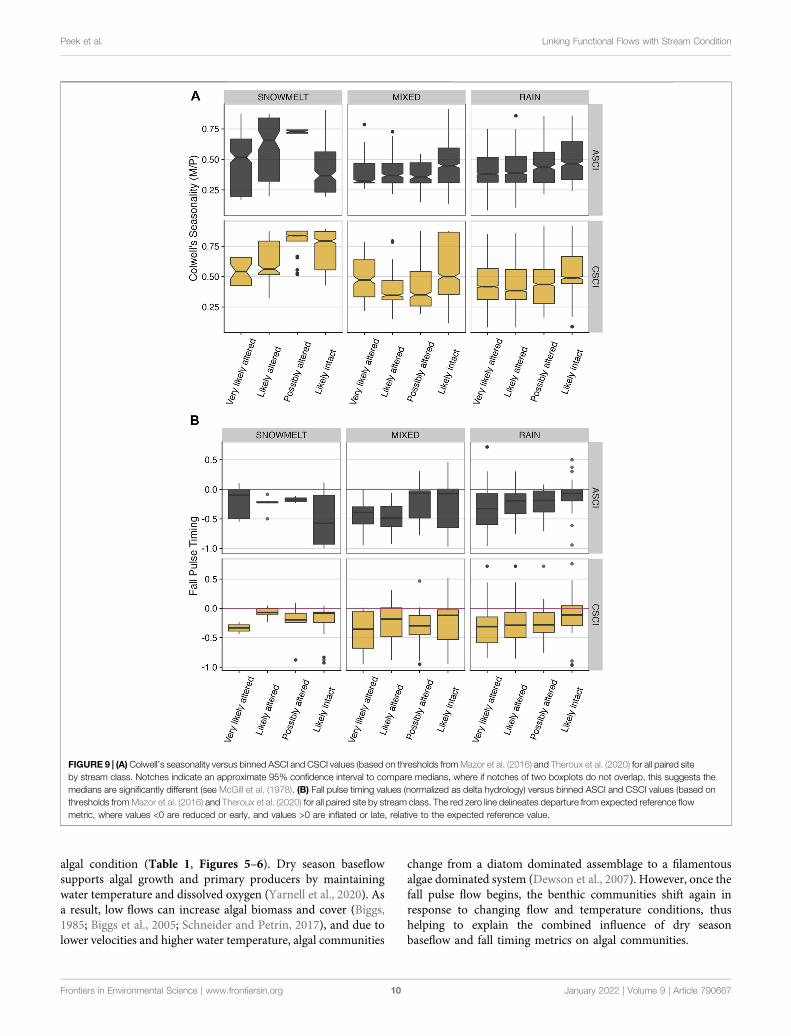
algal condition (Table 1, Figures 5–6). Dry season baseflowsupports algal growth and primary producers by maintainingwater temperature and dissolved oxygen (Yarnell et al., 2020). Asa result, low flows can increase algal biomass and cover (Biggs,1985; Biggs et al., 2005; Schneider and Petrin, 2017), and due tolower velocities and higher water temperature, algal communities
change from a diatom dominated assemblage to a filamentousalgae dominated system (Dewson et al., 2007). However, once thefall pulse flow begins, the benthic communities shift again inresponse to changing flow and temperature conditions, thushelping to explain the combined influence of dry seasonbaseflow and fall timing metrics on algal communities.
FIGURE 9 | (A)Colwell’s seasonality versus binned ASCI and CSCI values (based on thresholds fromMazor et al. (2016) and Theroux et al. (2020) for all paired siteby stream class. Notches indicate an approximate 95% confidence interval to compare medians, where if notches of two boxplots do not overlap, this suggests themedians are significantly different (see McGill et al. (1978). (B) Fall pulse timing values (normalized as delta hydrology) versus binned ASCI and CSCI values (based onthresholds from Mazor et al. (2016) and Theroux et al. (2020) for all paired site by stream class. The red zero line delineates departure from expected reference flowmetric, where values <0 are reduced or early, and values >0 are inflated or late, relative to the expected reference value.
Frontiers in Environmental Science | www.frontiersin.org January 2022 | Volume 9 | Article 79066710
Peek et al. Linking Functional Flows with Stream Condition
4.2 Seasonality and Climate ChangeOur results indicated that timing was the most important factor toconsider when linking biological stream condition with flow,especially for invertebrates that have evolved in river systemswith consistent hydrologic seasonality and predictability. Timingmetrics such as wet season timing, dry season timing, spring timing,and seasonality were all influential in the statewide and regionalmodels. While California’s Mediterranean climate integrates asignificant amount of interannual variation (Persad et al., 2020),flow regulation has altered patterns of hydrologic seasonality andpredictability in many watersheds (Kupferberg et al., 2012; Peeket al., 2021). Climate change is expected to exacerbate these patternssuch that earlier peak flow and snowmelt timing will occur (Kapnickand Hall, 2010) and seasonal predictability will decrease as moreextreme wet and dry events take place (Swain et al., 2018; Persadet al., 2020). Therefore, environmental flow recommendationsshould incorporate the ecological flow needs of benthicinvertebrate and algal communities with consideration for bothcurrent and future conditions, particularly if existingcommunities are mismatched to current environmentalconditions (Botero et al., 2015).
4.3 Modeling LimitationsThere are many potential factors that cannot be accounted for withinmodeling frameworks focused solely on the impacts of flowmodification on biologic conditions. Interactions with streamtemperature, ecological dynamics associated with populationdensity and predation, as well as water chemistry and nutrientloads can all play important roles in influencing biological streamcondition (Nilsson and Renöfält, 2008; Miller et al., 2009; Lange et al.,2016; Schneider et al., 2016). However, the benefit of linking biologicalindices like CSCI orASCIwith flow is the ability to quantify and assessstream conditions across broad spatial areas, often with very differentunderlying geography, geology, and watersheds. The biologic indicesare designed to be regionally stable and are standardized so they can becompared across large spatial scales (Mazor et al., 2016). BRTs do notexplicitly account for spatial autocorrelation, thus models may haveunder or overestimated the strength of the relationships we identifiedbased on systematic similarities associated with spatial clumping ofsites. However in the context of our study, we do not believe this is anissue because the sampling design selected both ASCI and CSCI sitesindependently, and by using stream class, we were able to comparesamples across very different geographic space (i.e., “mixed” streamclass can occur in the northern coast of California or in the SierraNevada or in the Southern Coast). Nonetheless, patterns we identifiedacross stream class and statewide scales showed similarities that areunlikely to be influenced by spatial autocorrelation. It is also importantto use caution when interpreting regional stream class models forecological meaning because CSCI and ASCI produce locally relevantreference expectations. For example, landscape heterogeneity andlocal climate variability could contribute to variation in the datawithin models from the same stream class. Future approaches toassessing flow alteration and biologic stream condition at finerscales may benefit from more specific models that account forimportant local variables or use individual functional feedinggroups or taxa as the biologic response. Nonetheless, identifying
key functional flow metrics that influence stream health, asshown here, will help inform the development of ecological flowneeds across broad regions, such as California.
5 CONCLUSION
We paired bioassessment sites and hydrologic gaging sites acrossthe broad diversity of California’s landscape to evaluate linksbetween flow alteration and stream health conditions. Despite asignificant limitation in the number of available sites with pairedbiologic and hydrologic data, we identified relationships betweenfunctional flow metrics and biologic condition indices and foundthat alterations in seasonality, fall pulse and wet season timing, anddry season baseflow were the most influential in shaping streamcommunities. These results can help to inform flow managementboth in terms of developing ecological flow needs that explicitlymimic natural seasonal timing and monitoring changing streamconditions with restoration activities or future climate changes.
Future analyses may leverage this information and approach tofocus on more discrete flow-ecology relationships, with particularattention to temporal lags associated with drought impacts or thesensitivity of biological metrics. More specific hydrologicallysensitive biological metrics (e.g., more distinct functional feedinggroups in benthic invertebrate data, hydrologically sensitivetaxonomic groups, etc.) may provide additional detail forassessment of the impacts of flow alteration on a given streamreach. Furthermore, this approach provides a method to assess suchmetrics and relationships through time, so adaptive approaches toflow management can be implemented, monitored, and revised.
This analysis highlights that despite the information-rich spatialdatasets that spanmuch of California, there remains a significant gapin leveraging and layering these datasets in an effective manner.Pairing biological and flow sites spatiotemporally was challenging,and sites were limited across all stream classes, but particularly insnowmelt dominated systems. When data from biological orhydrological time series are limited, alternative approaches can beimplemented using modeled streamflow or modeled streamcondition indices to predict whether or not flow alterationdeviates from reference expectations (Stein et al., 2017; Mazoret al., 2018; Irving et al., 2021; Maloney et al., 2021).Furthermore, ongoing monitoring may benefit from morediscrete and targeted sampling to link biological data moreaccurately with surface flow data. Nonetheless, this currentapproach provides a novel integration of disparate spatiotemporaldatasets and indicates broad relationships can be identified betweenfunctional flow metrics and indices of biological stream condition.
DATA AVAILABILITY STATEMENT
Publicly available datasets were analyzed in this study. Thisdata can be found here: Functional Flow Metrics: Naturalfunctional flow metrics for California: rivers.codefornature.orgBioassessment Data: https://www.waterboards.ca.gov/water_issues/programs/swamp/bioassessment/csci_scores_map. html
Frontiers in Environmental Science | www.frontiersin.org January 2022 | Volume 9 | Article 79066711
Peek et al. Linking Functional Flows with Stream Condition

USGS Gage Flow Data: https://waterdata.usgs.gov/nwis/rt. ASCIscores can be calculated using code from: https://sccwrp.github.io/ASCI/index.html and data from: https://smc.sccwrp.org.
AUTHOR CONTRIBUTIONS
RP led the preparation of this manuscript, data analysis, coding,and project design. KI contributed to data analysis and coding. RP,ES, KI, RM, SY, and RL contributed to the conceptualization andproject design. All authors contributed to writing this manuscript.
FUNDING
Funding for this work was provided by the California WildlifeConservation Board (Agreement WC-1849AB). Open access
publication fees were provided by the Library and Center forWatershed Sciences at the University of California, Davis, CA.
ACKNOWLEDGMENTS
Wewould like to thankmembers of the California EnvironmentalFlows Framework technical team for providing input and reviewof this manuscript.
SUPPLEMENTARY MATERIAL
The SupplementaryMaterial for this article can be found online at:https://www.frontiersin.org/articles/10.3389/fenvs.2021.790667/full#supplementary-material
REFERENCES
Ahearn, D. S., Sheibley, R. W., Dahlgren, R. A., and Keller, K. E. (2004). TemporalDynamics of StreamWater Chemistry in the Last Free-Flowing River Drainingthe Western Sierra Nevada, California. J. Hydrol. 295, 47–63. doi:10.1016/j.jhydrol.2004.02.016
Allan, J. D. (2004). Landscapes and Riverscapes: The Influence of Land Use onStream Ecosystems. Annu. Rev. Ecol. Evol. Syst. 35, 257–284. doi:10.1146/annurev.ecolsys.35.120202.110122
Beck, M.W., Mazor, R. D., Johnson, S., Wisenbaker, K., Westfall, J., Ode, P. R., et al.(2019a). Prioritizing Management Goals for Stream Biological Integrity withinthe Developed Landscape Context. Freshw. Sci. 38, 883–898. doi:10.1086/705996
Beck, M. W., Mazor, R. D., Theroux, S., and Schiff, K. C. (2019b). The StreamQuality Index: A Multi-Indicator Tool for Enhancing EnvironmentalManagement. Environ. Sustainability Indicators 1-2, 100004. doi:10.1016/j.indic.2019.100004
Biggs, B. (1985). Algae, A Blooming Nuisance in Rivers. Soil & Water 2, 27–31.Biggs, B. J. F., Nikora, V. I., and Snelder, T. H. (2005). Linking Scales of Flow
Variability to Lotic Ecosystem Structure and Function. River Res. Applic. 21,283–298. doi:10.1002/rra.847
Blanckaert, K., Garcia, X.-F., Ricardo, A.-M., Chen, Q., and Pusch, M. T. (2013).The Role of Turbulence in the Hydraulic Environment of Benthic Invertebrates.Ecohydrol. 6, 700–712. doi:10.1002/eco.1301
Blodgett, D. (2018). nhdplusTools: Tools for Accessing and Working with theNHDPlus. Reston, VA. U.S. Geological Survey Available at: https://code.usgs.gov/water/nhdplusTools.
Botero, C. A., Weissing, F. J., Wright, J., and Rubenstein, D. R. (2015). EvolutionaryTipping Points in the Capacity to Adapt to Environmental Change. Proc. Natl.Acad. Sci. USA 112, 184–189. doi:10.1073/pnas.1408589111
Brown, L. R., May, J. T., Rehn, A. C., Ode, P. R., Waite, I. R., and Kennen, J. G.(2012). Predicting Biological Condition in Southern California Streams.Landscape Urban Plann. 108, 17–27. doi:10.1016/j.landurbplan.2012.07.009
Carlisle, D. M., Wolock, D. M., andMeador, M. R. (2011). Alteration of StreamflowMagnitudes and Potential Ecological Consequences: a MultiregionalAssessment. Front. Ecol. Environ. 9, 264–270. doi:10.1890/100053
Cheng, B., Xia, R., Zhang, Y., Yang, Z., Hu, S., Guo, F., et al. (2019).Characterization and Causes Analysis for Algae Blooms in Large RiverSystem. Sust. Cities Soc. 51, 101707. doi:10.1016/j.scs.2019.101707
Colwell, R. K. (1974). Predictability, Constancy, and Contingency of PeriodicPhenomena. Ecology 55, 1148–1153. doi:10.2307/1940366
De’ath, G. (2007). Boosted Trees for Ecological Modeling and Prediction. Ecology88, 243–251.
Dewson, Z. S., James, A. B. W., and Death, R. G. (2007). Stream EcosystemFunctioning under Reduced Flow Conditions. Ecol. Appl. 17, 1797–1808.doi:10.1890/06-1901.1
Dormann, C. F., Elith, J., Bacher, S., Buchmann, C., Carl, G., Carré, G., et al. (2013).Collinearity: a Review of Methods to deal with it and a Simulation StudyEvaluating Their Performance. Ecography 36, 27–46. doi:10.1111/j.1600-0587.2012.07348.x
Dudgeon, D., Arthington, A. H., Gessner, M. O., Kawabata, Z.-I., Knowler, D. J.,Lévêque, C., et al. (2006). Freshwater Biodiversity: Importance, Threats, Statusand Conservation Challenges. Biol. Rev. 81, 163–182. doi:10.1017/s1464793105006950
Elith, J., Leathwick, J. R., and Hastie, T. (2008). A Working Guide to BoostedRegression Trees. J. Anim. Ecol. 77, 802–813. doi:10.1111/j.1365-2656.2008.01390.x
Elliott, J. M. (1973). The Food of Brown and Rainbow trout (Salmo trutta and S.Gairdneri) in Relation to the Abundance of Drifting Invertebrates in aMountain Stream. Oecologia 12, 329–347. doi:10.1007/bf00345047
Grantham, T. E., Carlisle, D. M., Howard, J., Lane, B., Lusardi, R., Obester, A., et al.(2021). Modeling Functional Flows in California’s Rivers. Frontiers inEnvironmental Science-Freshwater Science.
Grantham, T. E., Viers, J. H., and Moyle, P. B. (2014). Systematic Screening ofDams for Environmental Flow Assessment and Implementation. Bioscience 64,1006–1018. doi:10.1093/biosci/biu159
Guisan, A., Zimmermann, N. E., Elith, J., Graham, C. H., Phillips, S., and Peterson,A. T. (2007). What Matters for Predicting the Occurrences of Trees:Techniques, Data, or Species’ Characteristics. Ecol. Monogr. 77, 615–630.doi:10.1890/06-1060.1
Irving, K., Taniguchi-Quan, K. T., Poresky, A., Wildman, R., Aprahamian, A.,River, C., et al. (2021). A Process for Applying Effective Flow Ecology Analysis toAid Management Decision Making. Frontiers in Environmental Science-Freshwater Science.
Kapnick, S., and Hall, A. (2010). Observed Climate-Snowpack Relationships inCalifornia and Their Implications for the Future. J. Clim. 23, 3446–3456.doi:10.1175/2010jcli2903.1
Kirkwood, A. E., Jackson, L. J., and McCAULEY, E. (2009). Are Dams HotspotsforDidymosphenia Geminatablooms. Freshw. Biol. 54, 1856–1863. doi:10.1111/j.1365-2427.2009.02231.x
Kupferberg, S. J., Palen, W. J., Lind, A. J., Bobzien, S., Catenazzi, A., Drennan, J.,et al. (2012). Effects of Flow Regimes Altered by Dams on Survival, PopulationDeclines, and Range-wide Losses of California River-Breeding Frogs. Conserv.Biol. 26, 513–524. doi:10.1111/j.1523-1739.2012.01837.x
Lane, B. A., Dahlke, H. E., Pasternack, G. B., and Sandoval-Solis, S. (2017).Revealing the Diversity of Natural Hydrologic Regimes in California withRelevance for Environmental Flows Applications. J. Am. Water Resour. Assoc.53, 411–430. doi:10.1111/1752-1688.12504
Lange, K., Townsend, C. R., and Matthaei, C. D. (2016). A Trait-basedFramework for Stream Algal Communities. Ecol. Evol. 6, 23–36.doi:10.1002/ece3.1822
Lawrence, J. E., Lunde, K. B., Mazor, R. D., Bêche, L. A., McElravy, E. P., and Resh,V. H. (2010). Long-term Macroinvertebrate Responses to Climate Change:
Frontiers in Environmental Science | www.frontiersin.org January 2022 | Volume 9 | Article 79066712
Peek et al. Linking Functional Flows with Stream Condition

Implications for Biological Assessment in Mediterranean-Climate Streams.J. North Am. Benthological Soc. 29, 1424–1440. doi:10.1899/09-178.1
Lunde, K. B., Cover, M. R., Mazor, R. D., Sommers, C. A., and Resh, V. H. (2013).Identifying Reference Conditions and Quantifying Biological Variability withinBenthic Macroinvertebrate Communities in Perennial and Non-perennialNorthern California Streams. Environ. Manage. 51, 1262–1273. doi:10.1007/s00267-013-0057-1
Lytle, D. A. (2001). Disturbance Regimes and Life-History Evolution. The Am.Naturalist 157, 525–536. doi:10.1086/319930
Lytle, D. A., and Poff, N. L. (2004). Adaptation to Natural Flow Regimes. TrendsEcol. Evol. 19, 94–100. doi:10.1016/j.tree.2003.10.002
Mackay, R. J. (1992). Colonization by Lotic Macroinvertebrates: A Review ofProcesses and Patterns. Can. J. Fish. Aquat. Sci. 49, 617–628. doi:10.1139/f92-071
Maloney, K. O., Carlisle, D. M., Buchanan, C., Rapp, J. L., Austin, S. H., Cashman,M. J., et al. (2021). Linking Altered Flow Regimes to Biological Condition: anExample Using BenthicMacroinvertebrates in Small Streams of the ChesapeakeBay Watershed. Environ. Manage. 67, 1171–1185. doi:10.1007/s00267-021-01450-5
Mazor, R. D., May, J. T., Sengupta, A., McCune, K. S., Bledsoe, B. P., and Stein, E. D.(2018). Tools for Managing Hydrologic Alteration on a Regional Scale: SettingTargets to Protect Stream Health. Freshw. Biol. 63, 786–803. doi:10.1111/fwb.13062
Mazor, R. D., Rehn, A. C., Ode, P. R., Engeln, M., Schiff, K. C., Stein, E. D., et al.(2016). Bioassessment in Complex Environments: Designing an index forConsistent Meaning in Different Settings. Freshw. Sci. 35, 249–271.doi:10.1086/684130
McGill, R., Tukey, J. W., and Larsen, W. A. (1978). Variations of Box Plots. TheAm. Statistician 32, 12–16. doi:10.1080/00031305.1978.10479236
McIntire, C. D. (1966). Some Effects of Current Velocity on PeriphytonCommunities in Laboratory Streams. Hydrobiologia 27, 559–570.doi:10.1007/bf00042713
Miller, M. P., McKnight, D. M., Cullis, J. D., Greene, A., Vietti, K., and Liptzin, D.(2009). Factors Controlling Streambed Coverage of Didymosphenia Geminatain Two Regulated Streams in the Colorado Front Range. Hydrobiologia 630,207–218. doi:10.1007/s10750-009-9793-x
Naman, S. M., Rosenfeld, J. S., and Richardson, J. S. (2016). Causes andConsequences of Invertebrate Drift in Running Waters: from Individuals toPopulations and Trophic Fluxes. Can. J. Fish. Aquat. Sci. 73, 1292–1305.doi:10.1139/cjfas-2015-0363
Nilsson, C., and Renöfält, B. M. (2008). Linking Flow Regime andWater Quality inRivers: a Challenge to Adaptive Catchment Management. E&S 13. doi:10.5751/ES-02588-130218
Nislow, K. H., Folt, C., and Seandel, M. (1998). Food and Foraging Behavior inRelation to Microhabitat Use and Survival of Age-0 Atlantic salmon. Can.J. Fish. Aquat. Sci. 55, 116–127. doi:10.1139/f97-222
Patterson, N. K., Lane, B. A., Sandoval-Solis, S., Pasternack, G. B., Yarnell, S. M.,and Qiu, Y. (2020). A Hydrologic Feature Detection Algorithm to QuantifySeasonal Components of Flow Regimes. J. Hydrol. 585, 124787. doi:10.1016/j.jhydrol.2020.124787
Pebesma, E. (2018). Simple Features for R: Standardized Support for Spatial VectorData. R. J. 10, 439. doi:10.32614/rj-2018-009
Peek, R. A., O’Rourke, S. M., and Miller, M. R. (2021). Flow ModificationAssociated with Reduced Genetic Health of a River-breeding Frog, RanaBoylii. Ecosphere 12. doi:10.1002/ecs2.3496
Persad, G. G., Swain, D. L., Kouba, C., and Ortiz-Partida, J. P. (2020). Inter-modelAgreement on Projected Shifts in California Hydroclimate CharacteristicsCritical to Water Management. Climatic Change 162, 1493–1513.doi:10.1007/s10584-020-02882-4
Poff, N. L., Olden, J. D., Merritt, D. M., and Pepin, D. M. (2007).Homogenization of Regional River Dynamics by Dams and GlobalBiodiversity Implications. Proc. Natl. Acad. Sci. 104, 5732–5737.doi:10.1073/pnas.0609812104
Poff, N. L., Voelz, N. J., Ward, J. V., and Lee, R. E. (1990). Algal Colonization underFour Experimentally-Controlled Current Regimes in High Mountain Stream.J. North Am. Benthological Soc. 9, 303–318. doi:10.2307/1467898
Poff, N. L., and Zimmerman, J. K. H. (2010). Ecological Responses to Altered FlowRegimes: a Literature Review to Inform the Science and Management of
Environmental Flows. Freshw. Biol. 55, 194–205. doi:10.1111/j.1365-2427.2009.02272.x
R Core Team (2021). R: A Language and Environment for Statistical Computing.Vienna, Austria: R Foundation for Statistical Computing. Available at: https://www.R-project.org/.
Radecki-Pawlik, A., Wałęga, A., Młyński, D., Młocek,W., Kokoszka, R., Tokarczyk,T., et al. (2020). Seasonality of Mean Flows as a Potential Tool for theAssessment of Ecological Processes: Mountain Rivers, Polish Carpathians.Sci. Total Environ. 716, 136988. doi:10.1016/j.scitotenv.2020.136988
Rehn, A. C. (2009). Benthic Macroinvertebrates as Indicators of BiologicalCondition below Hydropower Dams on West Slope Sierra Nevada Streams,California, USA. River Res. Applic. 25, 208–228. doi:10.1002/rra.1121
Ridgeway, G. (2015). Gbm: Generalized Boosted Regression Models. Available at:http://CRAN.R-project.org/package-gbm.
Romaniszyn, E. D., Hutchens, J. J., and Bruce Wallace, J. (2007). Aquatic andTerrestrial Invertebrate Drift in Southern Appalachian Mountain Streams:Implications for trout Food Resources. Freshw. Biol 52, 1–11. doi:10.1111/j.1365-2427.2006.01657.x
Schneider, S. C., Hilt, S., Vermaat, J. E., and Kelly, M. (2016). “The ‘Forgotten’Ecology behind Ecological Status Evaluation: Re-assessing the Roles of AquaticPlants and Benthic Algae in Ecosystem Functioning” in Progress In Botany.Springer International Publishing.
Schneider, S. C., and Petrin, Z. (2017). Effects of Flow Regime on Benthic Algae andMacroinvertebrates - A Comparison between Regulated and UnregulatedRivers. Sci. Total Environ. 579, 1059–1072. doi:10.1016/j.scitotenv.2016.11.060
Steel, A. E., Peek, R. A., Lusardi, R. A., and Yarnell, S. M. (2018). AssociatingMetrics of Hydrologic Variability with Benthic MacroinvertebrateCommunities in Regulated and Unregulated Snowmelt-Dominated Rivers.Freshw. Biol. 63, 844–858. doi:10.1111/fwb.12994
Stein, E. D., Sengupta, A., Mazor, R. D., McCune, K., Bledsoe, B. P., and Adams, S.(2017). Application of Regional Flow-Ecology Relationships to InformWatershed Management Decisions: Application of the ELOHA Frameworkin the San Diego River Watershed, California, USA. Ecohydrology 10, e1869.doi:10.1002/eco.1869
Stein, E. D., Zimmerman, J., Yarnell, S., Stanford, B., Lane, B., Taniguchi-Quan, K.T., et al. (2021). The California Environmental Flows Framework: Meeting theChallenges of Developing a Large-Scale Environmental Flows Program. Frontiersin Environmental Science-Freshwater Science.
Stevenson, J. (2014). Ecological Assessments with Algae: a Review and Synthesis.J. Phycol. 50, 437–461. doi:10.1111/jpy.12189
Stevenson, R. J., Pan, Y., and van Dam, H. (2010). “Assessing EnvironmentalConditions in Rivers and Streams with Diatoms,” in The Diatoms: Applicationsto the Environmental and Earth Sciences. Editors E. F. Stoermer and J. P. Smol(Cambridge: Cambridge University Press), 57–85.
Stevenson, R. J., and Smol, J. P. (2003). “Use of Algae in EnvironmentalAssessments,” in “Use of Algae in Environmental Assessments,” inFreshwater Algae In North America: Classification and Ecology. EditorsJ. D. Wehr and R. G. Sheath (San Diego, CaliforniaSan Diego, California):Academic Press), 775–804. doi:10.1016/b978-012741550-5/50024-6
Stubbington, R. (2012). The Hyporheic Zone as an Invertebrate Refuge: A Reviewof Variability in Space, Time, Taxa and Behaviour. Mar. Freshw. Res. 63,293–311. doi:10.1071/mf11196
Suren, A. M., Biggs, B. J. F., Kilroy, C., and Bergey, L. (2003). Benthic CommunityDynamics during Summer Low-flows in two rivers of Contrasting Enrichment1. Periphyton. New Zealand J. Mar. Freshw. Res. 37, 53–70. doi:10.1080/00288330.2003.9517146
Swain, D. L., Langenbrunner, B., Neelin, J. D., and Hall, A. (2018). IncreasingPrecipitation Volatility in Twenty-First-century California.Nat. Clim Change 8,427–433. doi:10.1038/s41558-018-0140-y
Theroux, S., Mazor, R. D., Beck, M. W., Ode, P. R., Stein, E. D., and Sutula, M.(2020). Predictive Biological Indices for Algae Populations in Diverse StreamEnvironments. Ecol. Indicators 119, 106421. doi:10.1016/j.ecolind.2020.106421
Tonkin, J. D., Bogan, M. T., Bonada, N., Rios-Touma, B., and Lytle, D. A. (2017).Seasonality and Predictability Shape Temporal Species Diversity. Ecology 98,1201–1216. doi:10.1002/ecy.1761
Tonkin, J. D., Olden, J. D., Merritt, D. M., Reynolds, L. V., Rogosch, J. S., and Lytle,D. A. (2021). Designing Flow Regimes to Support Entire River Ecosystems.Front. Ecol. Environ. 19, 326–333. doi:10.1002/fee.2348
Frontiers in Environmental Science | www.frontiersin.org January 2022 | Volume 9 | Article 79066713
Peek et al. Linking Functional Flows with Stream Condition

Townsend, C. R., and Hildrew, A. G. (1976). Field Experiments on the Drifting,Colonization and Continuous Redistribution of Stream Benthos. J. Anim. Ecol.45, 759–772. doi:10.2307/3579
Ward, J. V., and Stanford, J. A. (1982). Thermal Responses in the EvolutionaryEcology of Aquatic Insects. Annu. Rev. Entomol. 27, 97–117. doi:10.1146/annurev.en.27.010182.000525
Wickham, H., Averick, M., Bryan, J., Chang, W., McGowan, L., François, R., et al.(2019). Welcome to the Tidyverse. Joss 4, 1686. doi:10.21105/joss.01686
Wickham, H., François, R., Henry, L., and Müller, K. (2018). Dplyr: A Grammarof Data Manipulation. Available at: https://CRAN.R-project.org/package�dplyr.
Wood, P. J. B., Boulton, A. J., Little, S., and Stubbington, R. (2010). Is the HyporheicZone a Refugium for Aquatic Macroinvertebrates during Severe Low FlowConditions. fal 176, 377–390. doi:10.1127/1863-9135/2010/0176-0377
Xia, R., Wang, G., Zhang, Y., Yang, P., Yang, Z., Ding, S., et al. (2020). River AlgalBlooms Are Well Predicted by Antecedent Environmental Conditions. WaterRes. 185, 116221. doi:10.1016/j.watres.2020.116221
Yarnell, S. M., Petts, G. E., Schmidt, J. C., Whipple, A. A., Beller, E. E., Dahm, C. N.,et al. (2015). Functional Flows in Modified Riverscapes: Hydrographs, Habitatsand Opportunities. Bioscience 65, 963–972. doi:10.1093/biosci/biv102
Yarnell, S. M., Stein, E. D., Webb, J. A., Grantham, T., Lusardi, R. A., Zimmerman,J., et al. (2020). A Functional Flows Approach to Selecting Ecologically RelevantFlow Metrics for Environmental Flow Applications. River Res. Applic 36,318–324. doi:10.1002/rra.3575
Yarnell, S. M., Viers, J. H., andMount, J. F. (2010). Ecology andManagement of theSpring Snowmelt Recession. Bioscience 60, 114–127. doi:10.1525/bio.2010.60.2.6
Zimmerman, J. K. H., Carlisle, D. M., May, J. T., Klausmeyer, K. R., Grantham, T.E., Brown, L. R., et al. (2017). Patterns and Magnitude of Flow Alteration inCalifornia. Usafreshw. Biol. 16, 1311.
Conflict of Interest: The authors declare that the research was conducted in theabsence of any commercial or financial relationships that could be construed as apotential conflict of interest.
Publisher’s Note: All claims expressed in this article are solely those of the authorsand do not necessarily represent those of their affiliated organizations, or those ofthe publisher, the editors and the reviewers. Any product that may be evaluated inthis article, or claim that may be made by its manufacturer, is not guaranteed orendorsed by the publisher.
Copyright © 2022 Peek, Irving, Yarnell, Lusardi, Stein and Mazor. This is an open-access article distributed under the terms of the Creative Commons AttributionLicense (CC BY). The use, distribution or reproduction in other forums is permitted,provided the original author(s) and the copyright owner(s) are credited and that theoriginal publication in this journal is cited, in accordance with accepted academicpractice. No use, distribution or reproduction is permitted which does not complywith these terms.
Frontiers in Environmental Science | www.frontiersin.org January 2022 | Volume 9 | Article 79066714
Peek et al. Linking Functional Flows with Stream Condition