Lauro, SE, et al. "A strategy for an accurate estimati - arXiv
21
"This is the peer reviewed version of the following article : Lauro, S. E., et al. "A strategy for an accurate estimation of the basal permittivity in the Martian North Polar Layered Deposits." Geophysical Prospecting (2016) which has been published in final form at http://onlinelibrary.wiley.com/doi/10.1111/1365-2478.12443/full. This article may be used for non-commercial purposes in accordance with Wiley Terms and Conditions for Self-Archiving."
-
Upload
khangminh22 -
Category
Documents
-
view
0 -
download
0
Transcript of Lauro, SE, et al. "A strategy for an accurate estimati - arXiv

"This is the peer reviewed version of the following article: Lauro, S. E., et al. "A strategy for an accurate estimation of the basal permittivity in the Martian North Polar Layered Deposits." Geophysical Prospecting (2016) which has been published in final form at http://onlinelibrary.wiley.com/doi/10.1111/1365-2478.12443/full. This article may be used for non-commercial purposes in accordance with Wiley Terms and Conditions for Self-Archiving."

ABSTRACT
The paper deals with the investigation of the Mars subsurface by means of data collected by the Mars
Advanced Radar for Subsurface and Ionosphere Sounding working at few MHz frequencies. A data
processing strategy, which combines a simple inversion model and an accurate procedure for data selection
is presented. This strategy permits to mitigate the theoretical and practical difficulties of the inverse
problem arising because of the inaccurate knowledge of the parameters regarding both the scenario under
investigation and the radiated electromagnetic field impinging on the Mars surface. The results presented in
this paper show that, it is possible to reliably retrieve the electromagnetic properties of deeper structures, if
such strategy is accurately applied. An example is given here, where the analysis of the data collected on
Gemina Lingula, a region of the North Polar layer deposits, allowed us to retrieve permittivity values for
the basal unit in agreement with those usually associated to the Earth basaltic rocks.
Key words—Mars exploration, ground penetrating radar, dielectric properties.
INTRODUCTION
A strategy for an accurate estimation of the basal
permittivity in the Martian North Polar Layered
Deposits
S. E. Lauro
1, G. Gennarelli
2, E. Pettinelli
1, F. Soldovieri
2, F. Cantini
3, A. P. Rossi
4, and
R. Orosei5
1 Dipartimento di Matematica e Fisica, Università degli Studi Roma Tre, 00146 Rome, Italy
2 Istituto per il Rilevamento Elettromagnetico dell’Ambiente, Consiglio Nazionale delle Ricerche, 80124, Naples, Italy
3 École Polytechnique Fédérale de Lausanne (EPFL), Space Engineering Center (eSpace), CH - 1015 Lausanne
4 Jacobs University Bremen, 28759 Bremen, Germany
5 Istituto di Radioastronomia, Istituto Nazionale di Astrofisica, 40129 Bologna, Italy

Mars is today a cold, dry, and sterile world with a thin atmosphere made of CO2. However, the geologic
and compositional record of its surface reveals that in the past Mars had a thicker atmosphere and liquid
water flowing on its surface (Jakosky and Phillips 2001). It has been postulated that life could have
developed and that some primitive life forms may be existing even today (McKay and Stoker 1989). For
this reason Mars Express, the first European Mars mission orbiting around the red planet since December
2003, has been designed to focus on two main issues: the inventory of ice or liquid water in the Martian
crust and the search for possible traces of past or present biological activity on the planet (Chicarro 2004).
Mars Advanced Radar for Subsurface and Ionosphere Sounding (MARSIS) is the instrument on board
Mars Express devoted to search for ice and water in the Martian subsurface. MARSIS antenna transmits
radio pulses in Nadir direction, which are capable to penetrate the surface and be reflected by the dielectric
discontinuities associated to structural or compositional changes (Picardi et al. 2004). In particular,
MARSIS transmits 1 MHz bandwidth pulses centred at 1.8 MHz, 3 MHz, 4 MHz and 5 MHz, alternating
the transmission at two different frequencies. The radar transmits a 10W, 250µs chirped (linear FM) pulse
from a 40 m dipole antenna with a repetition frequency of 127 Hz. The choice of these relatively-low
working frequencies makes MARSIS suitable for deep penetration in Mars subsurface, although the use of
such frequencies entails a low range resolution, which is approximately 210 m in air after the application of
a Hanning windowing to reduce the pulse side-lobes. MARSIS has been collecting data for over ten years
acquiring thousands of radar images of the Martian subsurface (Orosei et al. 2014).
Despite the available huge amount of data, so far only a limited number of studies attempted to address the
problem of supporting the identification of the compositional nature of the subsurface by quantitatively
estimating the dielectric properties of the Martian subsoil. Indeed, the evaluation of such parameters from
the backscattered signal requires to solve a non-linear inverse problem and different approaches have been
proposed to retrieve such information from radar sounding data (e.g., Picardi et al. 2007; Campbell et al.
2008; Zhang et al. 2008; Grima et al. 2009; Carter et al. 2009; Lauro et al. 2010; Alberti et al. 2012; Lauro
et al. 2012). In these works, the inversion algorithm is based on a simple model where a plane wave
normally impinges on a layered medium with some additional assumptions (e.g., the complex permittivity
of the first layer is known). The permittivity of the subsurface layer is retrieved from the ratio between the
power of the electromagnetic field reflected at the Mars surface and the power of the electromagnetic field
reflected by the unknown medium. Despite the simplicity of the inverse modeling, the estimation of the
dielectric permittivity of the subsurface layers is a very challenging task, due to the uncertainties affecting
the value of above mentioned power ratio and the inaccurate knowledge of the parameters involved in the
inverse model.
In this paper, we develop a new strategy to address these problems by applying a procedure that ensures a
stringent data selection with the aim to improve the reliability of the inversion scheme. As a test site, we
chose Gemina Lingula, a region of Martian Northern polar cap characterized by a km-thick ice deposit
consisting mostly of water ice with a small amount of dust and CO2 (see e.g., Byrne 2009). We apply the
inversion algorithm only to the data satisfying the imposed rigorous selection criteria in order to estimate
the dielectric permittivity of the bedrock underlying the polar deposits. The values of the retrieved
permittivity are found to be in good agreement with previous evaluations made in a different area of the
Northern Polar cap of Mars (Lauro et al. 2010) and are also similar to those known for terrestrial basaltic
rocks (Rust et al. 1999).
INVERSION PROCEDURE AND DATA SELECTION
The overall data processing strategy consists of two steps: inversion scheme and data selection. For the
clarity, these two logical steps are described in two separate subsections.
Inversion Model
When MARSIS moves along an orbit, it collects a large number of observations: each observation consists
of about 200 radar pulses (measurements) transmitted in a segment of orbit approximately 5-10 km long.
Through unfocused SAR processing (azimuth and range compression), the measurements are reduced to a

single radar trace (frame), which accounts for the power backscattered from the surface and subsurface
discontinuities versus the two-way travel time. Thus, each frame probes an area on the Martian surface
(footprint) that extends 5-10 km along track and 10-30 km across track, depending on the spacecraft
altitude and surface roughness. As an example, Figure 1 shows the behaviour of the measured
backscattered power versus two-way travel time for a single frame. The peak at time zero accounts for the
reflection from the surface whereas the other main peak at about 18 μs is indicative of a reflection for a
subsurface discontinuity.
Figure 1 A typical MARSIS frame where the x-axis denotes the two-way travel and y-axis the scattered
power in dB. The reference time is the surface echo arrival time and the reference power is the noise level.

The inversion model exploited for the quantitative estimation of the electromagnetic properties of the
subsurface layers has been recently presented in (Lauro et al. 2010; Lauro et al. 2012) and is briefly
described in the following. The input data for the inversion procedure is the ratio between the power
𝑃𝑠 reflected at surface by the air/soil interface and the power 𝑃𝑠𝑠 reflected by the bedrock (subsurface
discontinuity). This quantity is collected at each sounding point at the two operating frequencies of
MARSIS. Note that here it is assumed that MARSIS only detects two sharp strong reflectors (surface and
bedrock). The use of 𝑃𝑠 𝑃𝑠𝑠⁄ as input parameter is dictated by the lack of accurate measurements of the field
radiated by such a long dipole antenna (40 m). Indeed, the electromagnetic interaction of the antenna with
the satellite platform would require the measurement of the field radiated by the antenna in operational
conditions, which could not be performed due to the dimension and the characteristic of the antenna and the
spacecraft.
A three-layered medium with flat interfaces is considered for the inversion model (see Figure 2); each layer
is characterized by different electromagnetic parameters and the structure is illuminated by a plane wave
with normal incidence (e.g., Lauro et al. 2010; Zhang et al., 2009).
Figure 2 Geometry relevant to the inversion problem.
The upper layer (layer 0 above the Martian surface) is free-space with permittivity 𝜀0 and permeability 𝜇0.
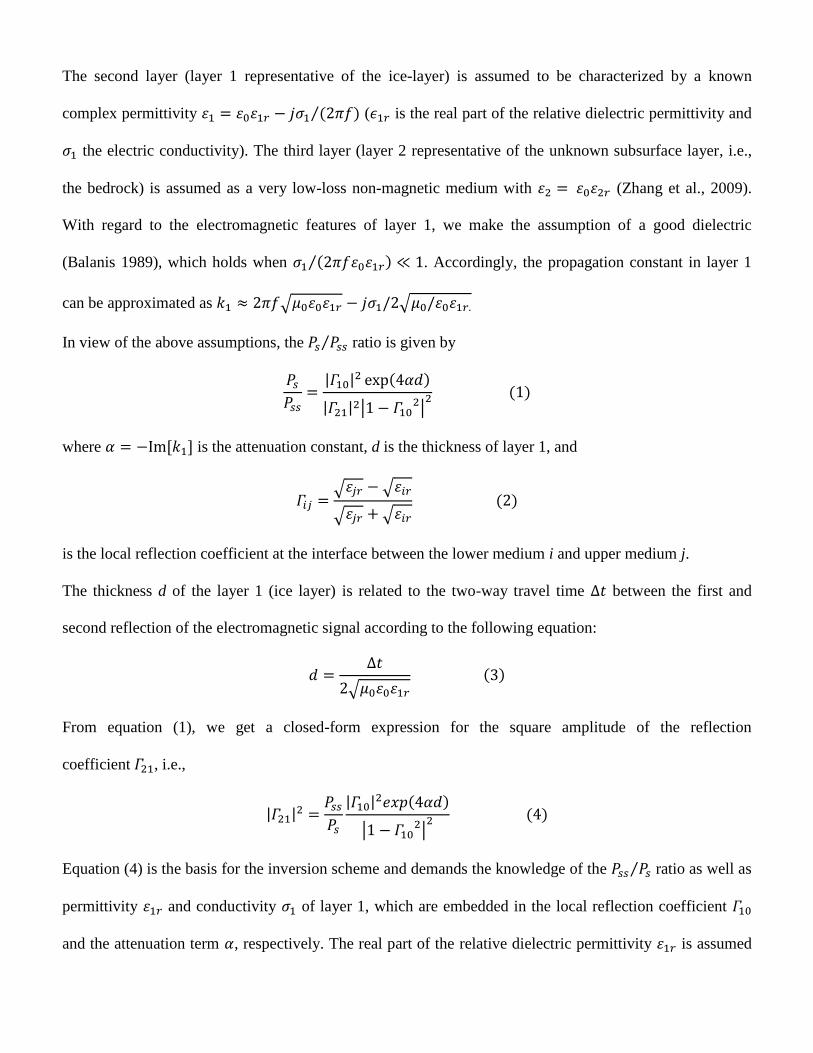
The second layer (layer 1 representative of the ice-layer) is assumed to be characterized by a known
complex permittivity 𝜀1 = 𝜀0𝜀1𝑟 − 𝑗𝜎1 (2𝜋𝑓)⁄ (𝜖1𝑟 is the real part of the relative dielectric permittivity and
𝜎1 the electric conductivity). The third layer (layer 2 representative of the unknown subsurface layer, i.e.,
the bedrock) is assumed as a very low-loss non-magnetic medium with 𝜀2 = 𝜀0𝜀2𝑟 (Zhang et al., 2009).
With regard to the electromagnetic features of layer 1, we make the assumption of a good dielectric
(Balanis 1989), which holds when 𝜎1 (2𝜋𝑓𝜀0𝜀1𝑟)⁄ ≪ 1. Accordingly, the propagation constant in layer 1
can be approximated as 𝑘1 ≈ 2𝜋𝑓√𝜇0𝜀0𝜀1𝑟 − 𝑗𝜎1/2√𝜇0/𝜀0𝜀1𝑟.
In view of the above assumptions, the 𝑃𝑠 𝑃𝑠𝑠⁄ ratio is given by
𝑃𝑠
𝑃𝑠𝑠=
|𝛤10|2 exp(4𝛼𝑑)
|𝛤21|2|1 − 𝛤102|
2 (1)
where 𝛼 = −Im[𝑘1] is the attenuation constant, d is the thickness of layer 1, and
𝛤𝑖𝑗 =√𝜀𝑗𝑟 − √𝜀𝑖𝑟
√𝜀𝑗𝑟 + √𝜀𝑖𝑟
(2)
is the local reflection coefficient at the interface between the lower medium i and upper medium j.
The thickness d of the layer 1 (ice layer) is related to the two-way travel time ∆𝑡 between the first and
second reflection of the electromagnetic signal according to the following equation:
𝑑 =∆𝑡
2√𝜇0𝜀0𝜀1𝑟
(3)
From equation (1), we get a closed-form expression for the square amplitude of the reflection
coefficient 𝛤21, i.e.,
|𝛤21|2 =𝑃𝑠𝑠
𝑃𝑠
|𝛤10|2𝑒𝑥𝑝(4𝛼𝑑)
|1 − 𝛤102|
2 (4)
Equation (4) is the basis for the inversion scheme and demands the knowledge of the 𝑃𝑠𝑠 𝑃𝑠⁄ ratio as well as
permittivity 𝜀1𝑟 and conductivity 𝜎1 of layer 1, which are embedded in the local reflection coefficient 𝛤10
and the attenuation term 𝛼, respectively. The real part of the relative dielectric permittivity 𝜀1𝑟 is assumed

as a-priori information based on the knowledge of ice sheet properties (see next section); moreover, by
taking into account the transparency of the ice in the North Pole (Grima et al. 2009) and considering a
temperature of about 180 K for the ice at surface (Larsen and D. Dahl-Jensen 2000), we can assume in the
𝜎1 inversion algorithm which implies that 𝛼 ≅ 0 (Pettinelli et al. 2015). The assumption of null attenuation
(i.e., ≅ 0 ) entails that the retrieved values of the dielectric permittivity of the basal units might be
underestimated with respect to the true values (see equation (4)).
In light of the previous assumptions, the unknown quantity 𝜀2𝑟 is estimated from the local reflection
coefficient as
𝛤21 =√𝜀1𝑟 − √𝜀2𝑟
√𝜀1𝑟 + √𝜀2𝑟
(5)
Note that the layer 2 is expected to be a denser medium than layer 1 (𝜀2𝑟 > 𝜀1𝑟), as it should be composed
by rock materials (Rust et al., 1999). Accordingly, the Fresnel reflection coefficient 𝛤21 is a real and
negative quantity. Finally, we can determine 𝜀2𝑟 as
𝜀2𝑟 = 𝜀1𝑟 (1 + |𝛤21|
1 − |𝛤21|)
2
(6)
Some consideration should be made about the robustness of the inversion scheme. As is known, an
inversion problem is said to be “ill posed” when small uncertainties on the data produce large variations on
the retrieved unknown (Bertero and Boccacci 1998), preventing the accurate estimation of the real value.
Keeping in mind that the datum is the 𝑃𝑆𝑆/𝑃𝑆 ratio, which is linked to 𝛤21 through equation (4), the degree
of ill-posedness for the inverse problem at hand can be appreciated by evaluating the derivative of the
reflection coefficient 𝛤21 with respect to 𝜀2𝑟, i.e.,
𝜕𝛤21
𝜕𝜀2𝑟=
−√𝜀1𝑟
√𝜀2𝑟(√𝜀2𝑟 + √𝜀1𝑟)2= −
1
𝜀1𝑟 𝑟𝜀(𝑟𝜀 + 1)2 (7)
with 𝑟𝜀 = √𝜀2𝑟
√𝜀1𝑟.
Equation (7) clearly highlights that for high values of 𝜀2𝑟, i.e., when 𝜀2𝑟 ≫ 𝜀1𝑟, i.e., 𝑟𝜀 ≫ 1, 𝜕𝛤21/𝜕𝜀2𝑟 →

0 thus there is poor “sensitivity” of the reflection coefficient 𝛤21 with respect to 𝜀2𝑟 variations. The plots
reported in Figure 3 display the behavior of Γ21 (left panel) and its derivative (right panel) versus relative
permittivity 𝜀2r, which is supposed to vary in the range of 3-80. Here, the real part of the dielectric
permittivity of the ice-layer 𝜀1𝑟 is assumed equal to 3.1, according to previously published data (Grima et
al. 2009). As expected, 𝛤21 assumes negative values with its amplitude growing monotonically with respect
to 𝜀2𝑟. Most notably, the derivative of the local reflection coefficient 𝛤21 is different from zero for low
values of 𝜀2𝑟 (<15) whereas it becomes almost equal to zero for higher values (see right panel of figure 3),
thus making the inversion less robust with respect to measurement fluctuations and uncertainties.
Figure 3 Local reflection coefficient 𝛤21 (left panel) and its derivative (right panel) versus relative dielectric
permittivity 𝜀2𝑟.
Data selection
The reliability of the inversion scheme requires an accurate selection of the radar observations to fulfil the
assumptions introduced by the model described in Inversion Model Subsection. The criteria applied for the
data selection are presented below.
The first criterion deals with the smoothness of Martian surface in the investigated area, as the inverse
model requires that the surface is flat with respect to the wavelength of the radar signal. To satisfy such
criterion, we have chosen a roughness threshold of λ/16 (with λ being the free-space wavelength) and we

have selected only the frames acquired in areas where the roughness was smaller than the threshold. For the
frequencies 1.8, 3, 4, 5 MHz, the maximum admissible surface roughness (root mean square height) are
10.4, 6.25, 4.7, 3.7 m, respectively. Note that the surface roughness was independently estimated by
resorting to the data acquired by Mars Orbiter Laser Altimeter (MOLA), whose primary objective is to map
globally the topography of Mars at a level suitable for geophysical, geological, and atmospheric circulation
studies of Mars. This altimeter operates at a wavelength of 1.064 μm and with a range resolution of 37.5 cm
and provides information about the topography with a vertical accuracy of 1m (Smith et al. 2001).
The second criterion refers to the assumption of normal incidence for the plane wave impinging the
surface. This assumption is consistent with the observation modality of MARSIS that looks in Nadir
direction. Since, as expected, the Martian surface is subjected on slope variations, we have selected only
the data collected where the plane wave field was impinging with an angle smaller than 0.5 degrees with
respect to the normal to the surface.
The third criterion deals with the actual signal to noise ratio (SNR) on the data. The SNR is computed as
the ratio between the peak of the reflected power at the air/soil interface and the noise power estimates as
the average of the first portion of the signal before the first peak, i.e., the arrive of the surface echo. We
have selected only data frames characterized by SNR ≥35 dB.
The fourth criterion regards the rejection of those frames affected by ionospheric distortions. Indeed,
MARSIS data are corrected for such distortion through the application of a proper signal processing
algorithm (Safaeinili et al. 2003). To select only the frames that do not show any ionospheric effect, we
adopted a criterion based on the similarity between the original data frames (i.e., before the ionospheric
correction) and the processed ones. The similarity was quantified in terms of the maximum of the cross-
correlation function
𝐶 = 𝑚𝑎𝑥𝜏 ∫ 𝑟𝑐(𝑡)𝑟𝑛𝑐(𝑡 − 𝜏)𝑑𝑡 (8)
where 𝑟𝑐(𝑡) and 𝑟𝑛𝑐(𝑡) are the corrected and non-corrected radar echoes, respectively. Note that 𝐶 has
maximum value equal to 1 when 𝑟𝑐(𝑡) and 𝑟𝑛𝑐(𝑡) have the same shape and only differ for a temporal shift.

We selected the frames having 𝐶 ≥ 0.95.
DATA ANALYSIS AND RESULTS
The strategy presented in the previous section (data selection and inversion algorithm) has been applied to
the radar data collected in the Gemina Lingula region (the area delimited by the white line in Figure 4),
which is located within the Martian Northern polar cap. As mentioned in the Introduction, this region is
characterized by a km-thick ice deposit about 250000 km2
in extension, consisting mostly of water ice with
a small amount of dust and CO2 (Byrne 2009). Figure 4 also illustrates Gemina Lingula topography
measured by MOLA.
Figure 4 Shaded relief map of the Northern polar cap of Mars based on the MOLA topographic dataset
(Smith et al. 2001). The white contour outlines Gemina Lingula.

The data analysis has been applied to 705 orbits passing over Gemina Lingula that corresponded to a total
number of 73770 frames. Note that large part of the frames has been acquired at 3 and 4 MHz and only few
data were collected at 1.8 and 5 MHz. The selection of the radar traces suitable for the inversion has been
carried out in agreement with the four criteria previously described regarding surface roughness, incidence
angle, SNR, and ionospheric effects.
Furthermore, two additional criteria have been introduced on the basis of the peculiar topographic features
of the Gemina Lingula region. As clearly visible in Figure 4, the area under investigation is characterized
by the presence of several superficial channels, which can generate strong radar echoes arriving after the
surface echo. As such echoes can mask, or be mistaken for, subsurface echoes, numerical electromagnetic
models of surface scattering have been developed (see e.g., Nouvel et al. 2004; Spagnuolo et al. 2011) to
validate the detection of subsurface interfaces in MARSIS data. They are used to produce simulations of
surface echoes, which are then compared to the ones detected by the radar: any secondary echo visible in
radargrams but not in simulations is interpreted as caused by subsurface reflectors.
We developed a code for the simulation of radar wave surface scattering (Cantini et al. 2014) based on the
algorithm of Nouvel et al. (2004). The MOLA topographic dataset (Smith et al. 2001) was used to represent
the Martian surface as a collection of flat plates called facets. Radar echoes were computed as the coherent
sum of reflections from all facets illuminated by the radar. The computational burden of simulations was
well above the capabilities of PC’s, and required the use of a supercomputer. The selection has thus been
carried out by comparing real and simulated frames and discarding all those frames in which simulations
showed secondary surface echoes less than 10 dB weaker than nadir echoes.
Moreover, on the basis of the composition and thickness of the polar deposits (Grima et al. 2009), we have
only selected frames for which the two-way travel time ∆𝑡 was larger than 12 µs. The choice of this travel
time was made in order to consider only the subsurface discontinuities at a depth larger than 1 km (see
equation (3), where the relative dielectric permittivity of the ice-layer is assumed equal to 3.1); this
assumption is consistent with the a-priori information about the thickness of the ice-layer in Gemina

Lingula area (Grima et al. 2009).
Table I summarizes the values of the parameters adopted for the selection of the frames. Such severe
selection drastically reduced the number of useful data: only 124 out of the original 73770 frames can be
considered suitable for the inversion. Most of these data refer to the acquisitions at 3 and 4 MHz, since the
1.8 MHz frames have been completely removed and the number of the 5MHz frames significantly
decreased.
TABLE I
PARAMETERS ADOPTED FOR FRAME SELECTION
SELECTION CRITERION VALUE
Max. incidence angle [°] 0.5
Max. surface roughness λ/16
Min. SNR [dB] 35
Max. cross-correlation 0.95
Min. two-way travel time [µs] 12
Min. simulated Ps/Pss [dB] 10

Figure 5 An example of data selection for the orbit 11905 at 4 MHz as a function of longitude. The surface
and subsurface powers are plotted (dashed lines) in the first panel together with the selected values for the
inversion procedure (solid circles). The estimated subsurface permittivity (dashed lines) and the selected
results (solid circles) are plotted in the second panel. In the lower panels are plotted the SNR, two-way
travel time and the surface roughness; the red lines represent the values of the parameters adopted in the
data selection (see table 1).
An example of the effect of the selection criteria is shown in Figure 5 for the orbit 11905 at 4 MHz. The
power 𝑃𝑠 reflected at surface and the power 𝑃𝑠𝑠 reflected at subsurface are plotted in the first panel as
dashed lines; the solid circles indicate the selected values after the adoption of the criteria in Table 1. The

second panel reports the values of subsurface permittivity estimated applying equations (4-6) using the
whole data set (dashed line) and the selected frames (solid circles). In the lower panels are plotted the SNR
and the two-way travel time values extracted from the radar data and the surface roughness values from
MOLA data; the red lines represent the adopted values of parameters applied in the data selection. For
brevity, the other three criteria are not shown in Figure 5 as, in this specific case, they do not further filter
the data. Figure 5 shows how the severe data selection is able to filter out very high and unrealistic values
of the dielectric permittivity (in this specific case it results 12 permittivity values greater than 20).
The first main result obtained after applying the selection strategy proposed above, regards the surface
radar response in the investigated area. In fact, thanks to the high resolution of MOLA data, the simulator
has also been able to estimate the effect of the roughness on the power 𝑃𝑆𝑆𝑖𝑚 reflected by the surface. It
should be highlighted however that the power of the simulated signals is only affected by the surface
roughness, whereas the power of MARSIS data can also be influenced by local variations of the surface
composition (i.e., dielectric properties). Thus, in principle, comparing the statistical distribution of the real
𝑃𝑆 and simulated 𝑃𝑆𝑆𝑖𝑚 power for the subset of data satisfying the first four criteria (as the last two
specifically refer to subsurface features), we should be able to infer some information on the compositional
homogeneity of the investigated area. Figure 6 illustrates the results of this analysis in terms of power
distribution normalized to the average power value proper of each frequency. In the figure, left panels refer
to measured data and right panels to simulated ones. Note that due to the strong reduction of data set after
selection, only channels 3 and 4 MHz are shown as they preserve a meaningful number of data frames.
Figure 6 shows that the four distributions exhibit similar width (about 10 dB) and do not significantly differ
from each other; this result suggests that the strong fluctuation in the surface power can mainly be ascribed
to the roughness, since every local variation in dielectric property is masked by such strong first order
effect.

Figure 6 Histograms of measured (left panels) and simulated (right panels) surface reflected power
(expressed in dB) normalized to their average value for 3 and 4 MHz frequency.
The latter consideration allows us to assume a spatial homogeneity for the material composing Gemina
Lingula area. Thus, we have imposed a relative dielectric permittivity value of 3.1 for 𝜀1𝑟 (i.e. the
permittivity value of pure water ice) in the inversion algorithm (equations 4 and 6); this choice is based on
the results reported in (Grima et al. 2009).
Figure 7 depicts the spatial map of the estimated subsurface permittivity 𝜀2𝑟, where the small circles
represent the real footprint of MARSIS antenna over the surveyed region and the color code (ranging
between 3 and 10) the estimated value of the relative dielectric permittivity of the bedrock. The 124 dots
are randomly distributed and no specific clustered zone is recognizable in the investigated area. Moreover,
large part of the dots is blue-green indicating that the bedrock retrieved permittivity values are
predominantly lower than 6. The average value of the bedrock permittivity can be extracted from the

histogram shown in Figure 8, which confirms that the distribution is peaked around 5 and most of the
estimated values range between 4 and 8. These values are in very good agreement with previous findings
(Lauro et al. 2010) and are compatible with the permittivity of terrestrial basaltic rocks (Rust et al. 1999).
Figure 7 Reconstruction of the relative dielectric permittivity of the subsurface in the range 3-10 based on a
relative dielectric permittivity of the first layer equal to 3.1. The small circles denote the real footprint of
MARSIS.

Figure 8 Histogram of the estimated relative subsurface permittivity based on a constant relative
permittivity of the first layer equal to 3.1.
CONCLUSIONS
In this work we presented a novel strategy to apply a simple inversion algorithm for Martian subsurface
dielectric properties estimation using MARSIS observations. We have shown that, since the data cannot be
calibrated and are affected by several factors peculiar to Mars environment (ionosphere, surface topography
and roughness, noise, etc.), it is mandatory to operate a stringent data selection before using any inversion
procedure. Our procedure has been tested on a “well known” area, as Gemina Lingula, which has been
studied for a long time and exhibits several favorable conditions in terms of composition, topography and
roughness. For this large area, we considered a starting dataset of more than seventy thousand observations
and, after the rigorous selection, we drastically reduced the number of reliable radar frames useful for the
inversion to about a hundred. Nevertheless the remaining data, even if scattered in the investigated area, are
quantitatively consistent and have been used to estimate the average permittivity of the bedrock in the
overall region.
The approach proposed here requires a very large dataset to ensure a sufficient number of outcomes; as a
consequence it is mainly suitable for the investigation of fairly large areas. In smaller regions, although the
possibility to obtain a significant statistics is low, such strategy could still help to define zones where the
outcomes are spatially clustered and quantitatively consistent.
ACKNOWLEDGMENTS
This work was supported by the Italian Space Agency (ASI) through contract no. I/032/12/1. The numerical
code for the simulation of surface scattering was developed at the Consorzio Interuniversitario per il
Calcolo Automatico dell'Italia Nord-Orientale (CINECA) in Bologna, Italy. Simulations were produced
thanks to the Partnership for Advanced Computing in Europe (PRACE), awarding us access to the
SuperMUC computer at the Leibniz-Rechenzentrum, Garching, Germany. This research has made use of
NASA's Astrophysics Data System.

REFERENCES
Alberti, Giovanni, et al. 2012. Permittivity estimation over Mars by using SHARAD data: the Cerberus Palus area. Journal of
Geophysical Research: Planets 117.E9.
Balanis C. A. 1989. Advanced Engineering Electromagnetics. John Wiley & Sons.
Bertero M. and Boccacci P. 1998. Introduction to Inverse Problems in Imaging. Bristol, U.K.: Inst. Phys.
Byrne S. 2009. The Polar Deposits of Mars. Annual Review of Earth and Planetary Sciences 37, 535–560.
Campbell B. et al. 2008. SHARAD radar sounding of the Vastitas Borealis Formation in Amazonis Planitia. Journal of
Geophysical Research (Planets) 113, 12010.
Cantini F. et al. 2014. MARSIS data and simulation exploited using array databases: PlanetServer/EarthServer for sounding
radars. EGU General Assembly Conference Abstracts 16, p. 3784.
Carter, L. M., et al. 2009. Dielectric properties of lava flows west of Ascraeus Mons, Mars. Geophysical Research Letters, 36.23:
L23204.
Chicarro A., Martin P., and Trautner R. 2004. The Mars Express mission: an overview. Mars Express: the Scientific Payload,
ser. ESA Special Publication, A. Wilson and A. Chicarro, Eds. 1240, 3–13.
Grima C. et al. 2009. North polar deposits of Mars: Extreme purity of the water ice. Geophysical Research Letters 36, 3203,
2009.
Jakosky B. M. and Phillips R. J. 2001. Mars’ volatile and climate history. Nature 412, 237–244.
Larsen J. and Jensen D. Dahl 2000. Interior temperatures of the northern polar cap on Mars. Icarus 144, 456-462.
Lauro S. E. et. al. 2010. Permittivity estimation of layers beneath the northern polar layered deposits, Mars. Geophysical
Research Letters 37, 14201.
Lauro S. E. et al. 2012. Dielectric constant estimation of the uppermost Basal Unit layer in the martian Boreales Scopuli region.
Icarus 219, 458–467.
McKay C. P. and Stoker C. R. 1989. The early environment and its evolution on Mars: implications for life. Reviews of
Geophysics 27, 189–214.
Nouvel, J.-F., Herique, A., Kofman, W., and Safaeinili, A.: Radar signal simulation: Surface modeling with the Facet Method,
Radio Science, 39, RS1013, doi:10.1029/2003RS002903, 2004.
Orosei R. et al. 2014. Mars advanced radar for subsurface and ionospheric sounding (MARSIS) after nine years of operation: a
summary. Planetary and Space Science 112, 98–114.
Pettinelli E. et al. 2015. Dielectric properties of Jovian satellite ice analogs for subsurface radar exploration: a review. Reviews of
Geophysics 53, 593–641.
Picardi G. et al. 2004. MARSIS: Mars advanced radar for subsurface and ionosphere sounding. Mars Express: the Scientific
Payload, ser. ESA Special Publication, A. Wilson and A. Chicarro, Eds. 1240, 51–69.
Picardi G. et al. 2007. MARSIS, a radar for the study of the Martian subsurface in the Mars Express mission. Memorie della
Società Astronomica Italiana Supplementi 11, 15-25.
Rust A. C., Russell J. K., and Knight R. J. 1999. Dielectric constant as a predictor of porosity in dry volcanic rocks. Journal of
Volcanology and Geothermal Research 91, 79–96, 1999.
Safaeinili A. et al. 2003. Impact of Mars ionosphere on orbital radar sounder operation and data processing. Planetary and Space
Science 51, 505-515.
Smith D. E. et al. 2001. Mars orbiter laser altimeter: experiment summary after the first year of global mapping of Mars. Journal
of Geophysical Research 106, 23689-23722.

Spagnuolo, M. G., Grings, F., Perna, P., Franco, M., Karszenbaum, H., and Ramos, V. A. Multilayer simulations for accurate
geological interpretations of SHARAD radargrams, Planetary and Space Science, 59, 1222-1230, doi:10.1016/j.pss.2010.10.013,
2011.
Zhang Z. et al. 2008. Dielectric properties of the Martian south polar layered deposits: MARSIS data inversion using Bayesian
inference and genetic algorithm. Journal of Geophysical Research (Planets) 113, 5004.