Irã ameaça cortar petróleo se ricos decidirem se unir Militares ...
Upload
khangminh22Category
view
0download
0
KPMG Audit
A division of KPMG S.A.
ERNST & YOUNG Audit
This is a translation into English of the statutory auditors’ report on the consolidated financial
statements of the Company issued in French and it is provided solely for the convenience of
English-speaking users.
This statutory auditors’ report includes information required by European regulation and French
law, such as information about the appointment of the statutory auditors or verification of the
information concerning the Group presented in the management report and other documents
provided to shareholders.
This report should be read in conjunction with, and construed in accordance with, French law and
professional auditing standards applicable in France.
TOTAL SE (Previously TOTAL S.A.) Year ended December 31, 2020
Statutory auditors’ report on the consolidated financial statements

KPMG Audit ERNST & YOUNG Audit
A division of KPMG S.A.
Tour EQHO
2, avenue Gambetta
CS 60055
92066 Paris-La Défense cedex
775 726 417 R.C.S. Nanterre
Tour First
TSA 14444
92037 Paris-La Défense cedex
S.A.S. à capital variable
344 366 315 R.C.S. Nanterre
Commissaire aux Comptes
Membre de la compagnie
régionale de Versailles et du Centre
Commissaire aux Comptes
Membre de la compagnie
régionale de Versailles et du Centre
TOTAL SE (Previously TOTAL S.A.) Year ended December 31, 2020
Statutory auditors’ report on the consolidated financial statements
To the Annual General Meeting of TOTAL SE,
Opinion
In compliance with the engagement entrusted to us by your Annual General Meeting, we have audited
the accompanying consolidated financial statements of TOTAL SE for the year ended December 31,
2020.
In our opinion, the consolidated financial statements give a true and fair view of the assets and
liabilities and of the financial position of the Group as at December 31, 2020 and of the results of its
operations for the year then ended in accordance with International Financial Reporting Standards as
adopted by the European Union.
The audit opinion expressed above is consistent with our report to the Audit Committee.
Basis for Opinion
Audit Framework
We conducted our audit in accordance with professional standards applicable in France. We believe that
the audit evidence we have obtained is sufficient and appropriate to provide a basis for our opinion.
Our responsibilities under those standards are further described in the Statutory Auditors’
Responsibilities for the Audit of the Consolidated Financial Statements section of our report.
Independence
We conducted our audit engagement in compliance with independence requirements of the French
Commercial Code (Code de commerce) and the French Code of Ethics (Code de déontologie) for statutory
auditors for the period from January 1, 2020 to the date of our report and specifically we did not
provide any prohibited non-audit services referred to in Article 5(1) of Regulation (EU) No 537/2014.

2
Justification of Assessments - Key Audit Matters
Due to the global crisis related to the Covid-19 pandemic, the financial statements of this period have
been prepared and audited under specific conditions. Indeed, this crisis and the exceptional measures
taken in the context of the state of sanitary emergency have had numerous consequences for
companies, particularly on their operations and their financing, and have led to greater uncertainties on
their future prospects. Those measures, such as travel restrictions and remote working, have also had
an impact on the companies' internal organization and the performance of the audits.
It is in this complex and evolving context that, in accordance with the requirements of Articles L. 823-9
and R. 823-7 of the French Commercial Code (Code de commerce) relating to the justification of our
assessments, we inform you of the key audit matters relating to risks of material misstatement that, in
our professional judgment, were of most significance in our audit of the consolidated financial
statements of the current period, as well as how we addressed those risks.
These matters were addressed in the context of our audit of the consolidated financial statements as a
whole and in forming our opinion thereon, and we do not provide a separate opinion on specific items
of the consolidated financial statements.
Evaluation of the impairment of non-current assets of exploration and production activities of
the Exploration & Production and Integrated Gas, Renewables and Power segments (“E&P and
iGRP segments”)
Risk identified Our response
As discussed in Notes 7.1, 7.2, and 3 to the
consolidated financial statements as of December 31,
2020, the non-current assets of exploration and
production activities of the E&P and iGRP segments
are mainly comprised of proved and unproved
properties and work in progress of exploration and
production activities (83,700 million US dollars),
proved mineral interests (6,964 million US dollars),
unproved mineral interests (15,510 million US
dollars), and a portion of the 23,783 million US dollars
balance of investments and loans in equity affiliates.
The Group performs impairment tests on these assets
as soon as any indication of impairment exists. As
described in Note “Major judgments and accounting
estimates” and Note 3.D “Asset impairment” to the
consolidated financial statements, in 2020, in the
context of the health crisis, the Group decided to
revise the price assumptions used for its assets
impairment tests. In addition, in line with its new
Climate Ambition announced on May 5, 2020, which
aims at carbon neutrality, the Group has reviewed its
oil assets that can be qualified as “stranded”, meaning
with reserves beyond 20 years and high production
costs, whose overall reserves may therefore not be
produced by 2050. In 2020, asset impairments were
We obtained an understanding, evaluated the design,
and tested the operating effectiveness of certain
controls over the Group’s processes to address the risks
of material misstatement relating to the evaluation of
the impairment of the E&P and iGRP segments’ non-
current assets of exploration and production activities.
Our works included testing certain controls over the
determination of the primary assumptions, used by
management, underlying the recoverable amount, such
as the estimates of the future price of hydrocarbons,
the future operational costs, oil and gas reserves, and
the after-tax discount rate.
The procedures we performed on the impairment
testing consisted mainly in:
► considering whether there was an indication of
impairment for these assets, such as a severe
decline of production, a new tax law enacted, the
impact of new price assumptions, or the Group’s
new Climate Ambition announced on May 5, 2020;
► comparing the primary assumptions to those
included in analyses, and to budgets and
forecasts approved by the Executive Committee
and the Board of Directors;

3
recorded for an amount of 8,646 million US dollars in
operating income and 8,157 million US dollars in net
income, Group share.
The testing method is described in Note 3.D to the
consolidated financial statements. The Group assesses
the recoverable amount of the E&P and iGRP segments’
non-current assets of exploration and production
activities based on the cash-generating units (CGU) that
include all the hydrocarbon sites and industrial assets
involved in the production, processing and extraction of
hydrocarbons. The recoverable amount is measured for
each CGU, taking into account the economic business
environment and the Group’s operating plans. The
primary assumptions used by the Group to measure the
recoverable amount include the future price of
hydrocarbons, the future operational costs, oil and gas
reserves, and the after-tax discount rate.
We identified the evaluation of the impairment of the
E&P and iGRP segments’ non-current assets of
exploration and production activities as a key audit
matter because management’s evaluation of
assumptions discussed above involved a high degree of
judgment. Specifically, such management’s evaluation
required the consideration of evidence that corroborates
the Group’s assumptions and evidence that might
contradict the assumptions, such as public industry
information.
► comparing the hydrocarbon pricing scenarios,
used by the Group as prepared by the Strategy
and Climate division, to public industry
information (International Energy Agency,
brokers, and consultants);
► analyzing the future operational costs
assumptions by calculating ratios over production
and comparing them over time or to those of
other similar assets;
► agreeing oil production profiles to the proved and
probable hydrocarbon reserves prepared as part
of the Group’s internal procedures;
► re-calculating, with the assistance of valuation
specialists included in our audit teams, the after-
tax discount rate used by management, which we
compared to the rates calculated by major market
financial analysts;
► assessing the consistency of the tax rates used by
management with the applicable tax schemes and
the oil agreements in force;
► analyzing the information disclosed in Note 3.D
“Asset impairment” to the consolidated financial
statements. In particular, we analyzed the
Company’s sensitivity analysis on operating
income and net income to variations of the
hydrocarbon pricing scenarios, and compared it
to the information disclosed in this Note.
Effect of estimated proved and proved developed hydrocarbon reserves on the depreciation of
oil and gas assets of production activities of the Exploration & Production and Integrated Gas,
Renewables and Power segments (“E&P and iGRP segments”)
Risk identified Our response
As discussed in the Note “Major judgments and
accounting estimates” to the consolidated financial
statements, the estimation of proved and proved
developed hydrocarbon reserves is used by the Group in
the “successful efforts” method to account for its oil
and gas activities. Notes 7.1 and 7.2 to the
consolidated financial statements outline that under
such method, oil and gas assets are depreciated using
the unit-of-production method. The unit-of-production
method is based on either proved hydrocarbon reserves
or proved developed hydrocarbon reserves. Those
reserves are estimated by the Group’s petroleum
engineers in accordance with industry practice and
Securities and Exchange Commission (SEC) regulations.
We obtained an understanding, evaluated the design,
and tested the operating effectiveness of certain
controls over the Group’s processes to address the
risks of material misstatement in the depreciation of
oil and gas assets of production activities of the E&P
and iGRP segments relating to the effect of estimated
proved and proved developed hydrocarbon reserves.
Our works included testing certain controls over
management’s determination and evaluation of
deposit quantities and the modeling of contractual
arrangements that determine the Group’s share of
proved and proved developed hydrocarbon reserves.

4
As described in Note 7.2 “ Property, plant and
equipment” to the consolidated financial statements,
in the event that, due to the price effect on the
hydrocarbon reserves evaluation, the unit-of-
production depreciation method does not reflect
properly the useful life of the asset, an alternative
depreciation method is applied based on the reserves
evaluated using the 12-month average price of the
previous year. This is the case in 2020 where the unit-
of-production depreciation method is applied to all
assets in 2020 based on proved hydrocarbon reserves
or proved developed hydrocarbon reserves measured
using the 12-month average price for 2019.
The primary assumptions used by the Group to
estimate the proved and proved developed
hydrocarbon reserves for purposes of the depreciation
of oil and gas assets of production activities of the
E&P and iGRP segments for the year ended
December 31, 2020 include the following: geoscience
and engineering data used to determine deposit
quantities; contractual arrangements that determine
the Group’s share of the reserves; and the price.
We identified the effect of estimated proved and
proved developed hydrocarbon reserves on the
depreciation of oil and gas assets of production
activities of the E&P and iGRP segments as a key audit
matter because management’s evaluation of the
Group’s aforementioned assumptions involved a high
degree of judgment due to the inherent uncertainty
and nature of such assumptions.
The procedures we performed on the estimation of
reserves by the Group consisted mainly in:
► assessing the qualifications and objectivity of the
Group’s petroleum engineers responsible for
estimating reserves;
► analyzing the main changes in proved and proved
developed hydrocarbon reserves compared to the
prior fiscal year;
► comparing the 2020 forecasted production to
2020 actual production;
► inspecting evidence from contractual
arrangements that determine the Group’s share
of the proved and proved developed hydrocarbon
reserves through the expiration of the contracts;
► and evaluating the Group’s assessment, where
appropriate, of the reasons leading the Group to
believe that the renewal of contractual
arrangements is reasonably certain;
► evaluating the analysis performed by the Group to
determine that using the 12-month average price
of 2020 to estimate the proved and proved
developed hydrocarbon reserves for purposes of
the depreciation of oil and gas assets of
production activities of the E&P and iGRP
segments would not properly reflect the
anticipated useful life of these assets;
► analyzing the Group’s use of the 12-month
average price for 2019 by comparing such
average price to the Group’s average long-term
view of prices;
► assessing the Group’s methodology used to
estimate these proved and proved developed
hydrocarbon reserves, considering SEC’s
regulations and the 12-month average price for
2019.
Specific verifications
We have also performed, in accordance with professional standards applicable in France, the specific
verifications required by laws and regulations of the information relating to the Group given in the
Board of Directors’ management report.
We have no matters to report as to its fair presentation and its consistency with the consolidated
financial statements.

5
We attest that the consolidated non-financial statement required by Article L. 225-102-1 of the French
Commercial Code (Code de commerce) is included in the Group’s management report, it being specified
that, in accordance with the provisions of Article L. 823-10 of this Code, we have verified neither the
fair presentation nor the consistency with the consolidated financial statements of the information
contained therein and this information should be reported by an independent third party.
Report on Other Legal and Regulatory Requirements
Format of presentation of the consolidated financial statements intended to be included in the
annual financial report
In accordance with Article 222-3, III of the AMF General Regulation, the Company’s management
informed us of its decision to postpone the presentation of the consolidated financial statements in
compliance with the European single electronic format as defined in the European Delegated Regulation
No 2019/815 of 17 December 2018 to years beginning on or after January 1, 2021. Therefore, this
report does not include a conclusion on the compliance with this format of the presentation of the
consolidated financial statements intended to be included in the annual financial report mentioned in
Article L. 451-1-2, I of the French Monetary and Financial Code (Code monétaire et financier).
Appointment of the Statutory Auditors
We were appointed as statutory auditors of TOTAL SE by the annual general meeting held on May 13,
1998 for KPMG S.A. (replacing CCAS, appointed in 1986, a firm acquired by KPMG S.A. in 1997) and
on May 14, 2004 for ERNST & YOUNG Audit.
As at December 31, 2020, KPMG S.A. was in its twenty-third year of total uninterrupted engagement
and ERNST & YOUNG Audit in its seventeenth year.
Responsibilities of Management and Those Charged with Governance for the Consolidated Financial Statements
Management is responsible for the preparation and fair presentation of the consolidated financial
statements in accordance with International Financial Reporting Standards as adopted by the European
Union and for such internal control as Management determines is necessary to enable the preparation
of consolidated financial statements that are free from material misstatement, whether due to fraud or
error.
In preparing the consolidated financial statements, Management is responsible for assessing the
Company’s ability to continue as a going concern, disclosing, as applicable, matters related to going
concern and using the going concern basis of accounting unless it is expected to liquidate the Company
or to cease operations.
The Audit Committee is responsible for monitoring the financial reporting process and the effectiveness
of internal control and risks management systems and where applicable, its internal audit, regarding
the accounting and financial reporting procedures.
The consolidated financial statements were approved by the Board of Directors.

6
Statutory Auditors’ Responsibilities for the Audit of the Consolidated Financial Statements
Objectives and audit approach
Our role is to issue a report on the consolidated financial statements. Our objective is to obtain
reasonable assurance about whether the consolidated financial statements as a whole are free from
material misstatement. Reasonable assurance is a high level of assurance, but is not a guarantee that an
audit conducted in accordance with professional standards will always detect a material misstatement
when it exists. Misstatements can arise from fraud or error and are considered material if, individually or
in the aggregate, they could reasonably be expected to influence the economic decisions of users taken
on the basis of these consolidated financial statements.
As specified in Article L. 823-10-1 of the French Commercial Code (Code de commerce), our statutory
audit does not include assurance on the viability of the Company or the quality of management of the
affairs of the Company.
As part of an audit conducted in accordance with professional standards applicable in France, the
statutory auditor exercises professional judgment throughout the audit and furthermore:
► Identifies and assesses the risks of material misstatement of the consolidated financial statements,
whether due to fraud or error, designs and performs audit procedures responsive to those risks,
and obtains audit evidence considered to be sufficient and appropriate to provide a basis for his
opinion. The risk of not detecting a material misstatement resulting from fraud is higher than for
one resulting from error, as fraud may involve collusion, forgery, intentional omissions,
misrepresentations, or the override of internal control.
► Obtains an understanding of internal control relevant to the audit in order to design audit
procedures that are appropriate in the circumstances, but not for the purpose of expressing an
opinion on the effectiveness of the internal control.
► Evaluates the appropriateness of accounting policies used and the reasonableness of accounting
estimates and related disclosures made by Management in the consolidated financial statements.
► Assesses the appropriateness of Management’s use of the going concern basis of accounting and,
based on the audit evidence obtained, whether a material uncertainty exists related to events or
conditions that may cast significant doubt on the Company’s ability to continue as a going concern.
This assessment is based on the audit evidence obtained up to the date of his audit report.
However, future events or conditions may cause the Company to cease to continue as a going
concern. If the statutory auditor concludes that a material uncertainty exists, there is a
requirement to draw attention in the audit report to the related disclosures in the consolidated
financial statements or, if such disclosures are not provided or inadequate, to modify the opinion
expressed therein.
► Evaluates the overall presentation of the consolidated financial statements and assesses whether
these statements represent the underlying transactions and events in a manner that achieves fair
presentation.
► Obtains sufficient appropriate audit evidence regarding the financial information of the entities or
business activities within the Group to express an opinion on the consolidated financial statements.
The statutory auditor is responsible for the direction, supervision and performance of the audit of
the consolidated financial statements and for the opinion expressed on these consolidated financial
statements.

7
Report to the Audit Committee
We submit to the Audit Committee a report which includes in particular a description of the scope of
the audit and the audit program implemented, as well as the results of our audit. We also report, if any,
significant deficiencies in internal control regarding the accounting and financial reporting procedures
that we have identified.
Our report to the Audit Committee includes the risks of material misstatement that, in our professional
judgment, were of most significance in the audit of the consolidated financial statements of the current
period and which are therefore the key audit matters that we are required to describe in this report.
We also provide the Audit Committee with the declaration provided for in Article 6 of Regulation (EU)
No 537/2014, confirming our independence within the meaning of the rules applicable in France such
as they are set in particular by Articles L. 822-10 to L. 822-14 of the French Commercial Code (Code
de commerce) and in the French Code of Ethics (code de déontologie) for statutory auditors. Where
appropriate, we discuss with the Audit Committee the risks that may reasonably be thought to bear on
our independence, and the related safeguards.
Paris-La Défense, March 17, 2021
The Statutory Auditors
French original signed by
KPMG Audit
A Division of KPMG S.A.
ERNST & YOUNG Audit
Jacques-François Lethu Partner
Eric Jacquet Partner
Laurent Vitse Partner
Céline Eydieu-Boutté Partner

Consolidated statement of income
TOTAL
For the year ended December 31,
(M$)(a) 2020 2019 2018
Sales (Notes 3, 4, 5) 140,685 200,316 209,363
Excise taxes (Notes 3 & 5) (20,981) (24,067) (25,257)
Revenues from sales (Notes 3 & 5) 119,704 176,249 184,106
Purchases, net of inventory variation (Note 5) (77,486) (116,221) (125,816)
Other operating expenses (Note 5) (25,538) (27,255) (27,484)
Exploration costs (Note 5) (731) (785) (797)
Depreciation, depletion and impairment of tangible assets and mineral interests
(Note 5) (22,264) (15,731) (13,992)
Other income (Note 6) 2,237 1,163 1,838
Other expense (Note 6) (1,506) (1,192) (1,273)
Financial interest on debt (2,147) (2,333) (1,933)
Financial income and expense from cash & cash equivalents 37 (19) (188)
Cost of net debt (Note 15) (2,110) (2,352) (2,121)
Other financial income (Note 6) 914 792 1,120
Other financial expense (Note 6) (690) (764) (685)
Net income (loss) from equity affiliates (Note 8) 452 3,406 3,170
Income taxes (Note 11) (318) (5,872) (6,516)
Consolidated net income (7,336) 11,438 11,550
Group share (7,242) 11,267 11,446
Non-controlling interests (94) 171 104
Earnings per share ($) (2.90) 4.20 4.27
Fully-diluted earnings per share ($) (2.90) 4.17 4.24
(a) Except for per share amounts.

Consolidated statement of comprehensive income
TOTAL
For the year ended December 31,
(M$) 2020 2019 2018
Consolidated net income (7,336) 11,438 11,550
Other comprehensive income
Actuarial gains and losses (Note 10) (212) (192) (12)
Change in fair value of investments in equity instruments (Note 8) 533 142 -
Tax effect 65 53 13
Currency translation adjustment generated by the parent company (Note 9) 7,541 (1,533) (4,022)
Items not potentially reclassifiable to profit and loss 7,927 (1,530) (4,021)
Currency translation adjustment (Note 9) (4,645) 740 1,113
Cash flow hedge (Notes 15 & 16) (313) (599) 25
Variation of foreign currency basis spread (Note 15) 28 1 (80)
Share of other comprehensive income of equity affiliates, net amount (Note 8) (1,831) 408 (540)
Other (8) (3) (5)
Tax effect 72 202 14
Items potentially reclassifiable to profit and loss (6,697) 749 527
Total other comprehensive income (net amount) 1,230 (781) (3,494)
Comprehensive income (6,106) 10,657 8,056
- Group share (6,312) 10,418 8,021
- Non-controlling interests (Note 9) 206 239 35

Consolidated balance sheet
TOTAL As of December 31, (M$) 2020 2019 2018
ASSETS
Non-current assets
Intangible assets, net (Notes 4 & 7) 33,528 33,178 28,922
Property, plant and equipment, net (Notes 4 & 7) 108,335 116,408 113,324
Equity affiliates: investments and loans (Note 8) 27,976 27,122 23,444
Other investments (Note 8) 2,007 1,778 1,421
Non-current financial assets (Note 15) 4,781 912 680
Deferred income taxes (Note 11) 7,016 6,216 6,663
Other non-current assets (Note 6) 2,810 2,415 2,509
Total non-current assets 186,453 188,029 176,963
Current assets
Inventories, net (Note 5) 14,730 17,132 14,880
Accounts receivable, net (Note 5) 14,068 18,488 17,270
Other current assets (Note 5) 13,428 17,013 14,724
Current financial assets (Note 15) 4,630 3,992 3,654
Cash and cash equivalents (Note 15) 31,268 27,352 27,907
Assets classified as held for sale (Note 2) 1,555 1,288 1,364
Total current assets 79,679 85,265 79,799
Total assets 266,132 273,294 256,762
LIABILITIES & SHAREHOLDERS' EQUITY
Shareholders' equity
Common shares 8,267 8,123 8,227
Paid-in surplus and retained earnings 107,078 121,170 120,569
Currency translation adjustment (10,256) (11,503) (11,313)
Treasury shares (1,387) (1,012) (1,843)
Total shareholders' equity - Group share (Note 9) 103,702 116,778 115,640
Non-controlling interests 2,383 2,527 2,474
Total shareholders' equity 106,085 119,305 118,114
Non-current liabilities
Deferred income taxes (Note 11) 10,326 11,858 11,490
Employee benefits (Note 10) 3,917 3,501 3,363
Provisions and other non-current liabilities (Note 12) 20,925 20,613 21,432
Non-current financial debt (Note 15) 60,203 47,773 40,129
Total non-current liabilities 95,371 83,745 76,414
Current liabilities
Accounts payable 23,574 28,394 26,134
Other creditors and accrued liabilities (Note 5) 22,465 25,749 22,246
Current borrowings (Note 15) 17,099 14,819 13,306
Other current financial liabilities (Note 15) 203 487 478
Liabilities directly associated with the assets classified as held for sale (Note 2) 1,335 795 70
Total current liabilities 64,676 70,244 62,234
Total liabilities & shareholders' equity 266,132 273,294 256,762

Consolidated statement of cash flow
TOTAL
For the year ended December 31, (M$) 2020 2019 2018
CASH FLOW FROM OPERATING ACTIVITIES
Consolidated net income (7,336) 11,438 11,550
Depreciation, depletion, amortization and impairment (Note 5.3) 22,861 16,401 14,584
Non-current liabilities, valuation allowances, and deferred taxes (Note 5.5) (1,782) (58) (887)
(Gains) losses on disposals of assets (909) (614) (930)
Undistributed affiliates' equity earnings 948 (1,083) (826)
(Increase) decrease in working capital (Note 5.5) 1,869 (1,718) 769
Other changes, net (848) 319 443
Cash flow from operating activities 14,803 24,685 24,703
CASH FLOW USED IN INVESTING ACTIVITIES
Intangible assets and property, plant and equipment additions (Note 7) (10,764) (11,810) (17,080)
Acquisitions of subsidiaries, net of cash acquired (966) (4,748) (3,379)
Investments in equity affiliates and other securities (2,120) (1,618) (1,108)
Increase in non-current loans (1,684) (1,061) (618)
Total expenditures (15,534) (19,237) (22,185)
Proceeds from disposals of intangible assets and property, plant and equipment 740 527 3,716
Proceeds from disposals of subsidiaries, net of cash sold 282 158 12
Proceeds from disposals of non-current investments 578 349 1,444
Repayment of non-current loans 855 1,026 2,067
Total divestments 2,455 2,060 7,239
Cash flow used in investing activities (13,079) (17,177) (14,946)
CASH FLOW FROM FINANCING ACTIVITIES
Issuance (repayment) of shares:
- Parent company shareholders 374 452 498
- Treasury shares (611) (2,810) (4,328)
Dividends paid:
- Parent company shareholders (6,688) (6,641) (4,913)
- Non-controlling interests (184) (115) (97)
Net issuance of perpetual subordinated notes (Note 9) 331 - -
Payments on perpetual subordinated notes (Note 9) (315) (371) (325)
Other transactions with non-controlling interests (204) 10 (622)
Net issuance (repayment) of non-current debt (Note 15) 15,800 8,131 649
Increase (decrease) in current borrowings (6,501) (5,829) (3,990)
Increase (decrease) in current financial assets and liabilities (604) (536) (797)
Cash flow from / (used in) financing activities 1,398 (7,709) (13,925)
Net increase (decrease) in cash and cash equivalents 3,122 (201) (4,168)
Effect of exchange rates 794 (354) (1,110)
Cash and cash equivalents at the beginning of the period 27,352 27,907 33,185
Cash and cash equivalents at the end of the period (Note 15) 31,268 27,352 27,907

Consolidated statement of changes in shareholders’ equity
TOTAL
Shareholders' equity - Group
share
Non-controlling
interests
Common shares issued
Paid-in surplus and
retained earnings
Currency translation adjustment Treasury shares
Total shareholders'
equity
(M$) Number Amount
Number Amount
As of January 1, 2018 2,528,989,616 7,882 112,040 (7,908) (8,376,756) (458) 111,556 2,481 114,037
Net income 2018 - - 11,446 - - - 11,446 104 11,550
Other comprehensive income. - - (20) (3,405) - - (3,425) (69) (3,494)
Comprehensive income - - 11,426 (3,405) - - 8,021 35 8,056
Dividend - - (7,881) - - - (7,881) (97) (7,978)
Issuance of common shares. 156,203,090 476 8,366 - - - 8,842 - 8,842
Purchase of treasury shares - - - - (72,766,481) (4,328) (4,328) - (4,328)
Sale of treasury shares(a) - - (240) - 4,079,257 240 - - -
Share-based payments . - - 294 - - - 294 - 294
Share cancellation. (44,590,699) (131) (2,572) - 44,590,699 2,703 - - -
Net issuance (repayment) of perpetual subordinated notes
- - - - - - - - -
Payments on perpetual subordinated notes - - (315) - - - (315) - (315)
Other operations with non-controlling interests
- - (517) - - - (517) (99) (616)
Other items - - (32) - - - (32) 154 122
As of December 31, 2018 2,640,602,007 8,227 120,569 (11,313) (32,473,281) (1,843) 115,640 2,474 118,114
Net income 2019 - - 11,267 - - - 11,267 171 11,438
Other comprehensive income. - - (659) (190) - - (849) 68 (781)
Comprehensive income - - 10,608 (190) - - 10,418 239 10,657
Dividend - - (7,730) - - - (7,730) (115) (7,845)
Issuance of common shares. 26,388,503 74 1,265 - - - 1,339 - 1,339
Purchase of treasury shares - - - - (52,389,336) (2,810) (2,810) - (2,810)
Sale of treasury shares(a) - - (219) - 4,278,948 219 - - -
Share-based payments. - - 207 - - - 207 - 207
Share cancellation. (65,109,435) (178) (3,244) - 65,109,435 3,422 - - -
Net issuance (repayment) of perpetual subordinated notes
- - (4) - - - (4) - (4)
Payments on perpetual subordinated notes - - (353) - - - (353) - (353)
Other operations with non-controlling interests
- - 55 - - - 55 (42) 13
Other items - - 16 - - - 16 (29) (13)
As of December 31, 2019 2,601,881,075 8,123 121,170 (11,503) (15,474,234) (1,012) 116,778 2,527 119,305
Net income 2020 - - (7,242) - - - (7,242) (94) (7,336)
Other comprehensive income. - - (321) 1,251 - - 930 300 1,230
Comprehensive income - - (7,563) 1,251 - - (6,312) 206 (6,106)
Dividend - - (7,899) - - - (7,899) (234) (8,133)
Issuance of common shares. 51,242,950 144 1,470 - - - 1,614 - 1,614
Purchase of treasury shares - - - - (13,236,044) (611) (611) - (611)
Sale of treasury shares(a) - - (236) - 4,317,575 236 - - -
Share-based payments. - - 188 - - - 188 - 188
Share cancellation. - - - - - - - - -
Net issuance (repayment) of perpetual subordinated notes
- - 331 - - - 331 - 331
Payments on perpetual subordinated notes - - (308) - - - (308) - (308)
Other operations with non-controlling interests
- - (61) (4) - - (65) (117) (182)
Other items - - (14) - - - (14) 1 (13)
As of December 31, 2020 2,653,124,025 8,267 107,078 (10,256) (24,392,703) (1,387) 103,702 2,383 106,085
(a) Treasury shares related to the restricted stock grants.
Changes in equity are detailed in Note 9.

TOTAL
Notes to the Consolidated Financial Statements
On February 8, 2021, the Board of Directors established and authorized the publication of the Consolidated Financial Statements of TOTAL SE for the year ended December 31, 2020, which will be submitted for approval to the Shareholders’ Meeting to be held on May 28, 2021.
Basis of preparation of the consolidated financial statements
The Consolidated Financial Statements of TOTAL SE and its subsidiaries (the Group) are presented in U.S. dollars and have been prepared on the basis of IFRS (International Financial Reporting Standards) as adopted by the European Union and IFRS as issued by the IASB (International Accounting Standard Board) as of December 31, 2020.
The accounting principles applied for the consolidated financial statements at December 31, 2020, were the same as those that were used for the financial statements at December 31, 2019, with the exception of new IFRS standards listed below which had not been early adopted by the Group. As of January 1st, 2020, the Group early adopted the amendments to IFRS 7 and IFRS 9 relating to the interest rate benchmark reform phase II. In particular, these amendments allow to maintain the hedge accounting qualification of interest rate derivatives.
As part of this transition, the Group set up a working group in order to cover all aspects relating to the IBOR reform and is currently assessing the future impacts of these index changes.
As of December 31, 2020, except for the index change on the remuneration of cash collateral with clearing houses, whose impact is not material, no modification of the IBOR indices was applied on financial instruments used by the Group.
Major judgments and accounting estimates
The preparation of financial statements in accordance with IFRS for the closing as of December 31, 2020 requires the executive management to make estimates, assumptions and judgments that affect the information reported in the Consolidated Financial Statements and the Notes thereto.
These estimates, assumptions and judgments are based on historical experience and other factors believed to be reasonable at the date of preparation of the financial statements. They are reviewed on an on-going basis by management and therefore could be revised as circumstances change or as a result of new information.
Different estimates, assumptions and judgments could significantly affect the information reported, and actual results may differ from the amounts included in the Consolidated Financial Statements and the Notes thereto.
The following summary provides further information about the key estimates, assumptions and judgments that are involved in preparing, the Consolidated Financial Statements and the Notes thereto. It should be read in conjunction with the sections of the Notes mentioned in the summary.
The consolidated financial statements are impacted by the health and oil crises. The Group has taken into account the impact of this environment, particularly on the depreciation and impairment of oil and gas assets (see Note 3.D “Asset impairment” and Note 7.2 “Tangible assets”).
Estimation of hydrocarbon reserves
The estimation of oil and gas reserves is a key factor in the Successful Efforts method used by the Group to account for its oil and gas activities.
The Group’s oil and gas reserves are estimated by the Group’s petroleum engineers in accordance with industry standards and SEC (U.S. Securities and Exchange Commission) regulations.
Proved oil and gas reserves are those quantities of oil and gas, which, by analysis of geosciences and engineering data, can be determined with reasonable certainty to be recoverable (from a given date forward, from known reservoirs, and

under existing economic conditions, operating methods, and government regulations), prior to the time at which contracts providing the rights to operate expire, unless evidence indicates that renewal is reasonably certain, regardless of whether deterministic or probabilistic methods are used for the estimation.
Proved oil and gas reserves are calculated using a 12-month average price determined as the unweighted arithmetic average of the first-day-of-the-month price for each month of the relevant year unless prices are defined by contractual arrangements, excluding escalations based upon future conditions. The Group reassesses its oil and gas reserves at least once a year on all its properties.
The Successful Efforts method and the mineral interests and property, plant and equipment of exploration and production are presented in Note 7 “Intangible and tangible assets”.
Impairment of property, plant and equipment, intangible assets and goodwill
As part of the determination of the recoverable value of assets for impairment (IAS36), the estimates, assumptions and judgments mainly concern hydrocarbon prices scenarios, operating costs, production volumes and oil and gas proved and probable reserves, refining margins and product marketing conditions (mainly petroleum, petrochemical and chemical products as well as renewable industry products). The estimates and assumptions used by the executive management are determined in specialized internal departments in light of economic conditions and external expert analysis. The discount rate is reviewed annually.
In 2020, the Group decided to revise the price assumptions used for its assets impairment tests. Based on these new assumptions, asset impairments were recorded during the period. In line with its new Climate Ambition announced on May 5, 2020, which aims at carbon neutrality, the Group has reviewed its oil assets that can be qualified as “stranded”, and therefore has decided to impair its oil sands assets in Canada. These impairments and revised assumptions are presented in Note 3.D “Asset impairment”.
Impairment of assets and the method applied are described in Note 3 "Business segment information".
Employee benefits
The benefit obligations and plan assets can be subject to significant volatility due in part to changes in market values and actuarial assumptions. These assumptions vary between different pension plans and thus take into account local conditions. They are determined following a formal process involving expertise and Group internal judgments, in financial and actuarial terms, and also in consultation with actuaries and independent experts.
The assumptions for each plan are reviewed annually and adjusted if necessary to reflect changes from the experience and actuarial advice. The discount rate is reviewed quarterly.
Payroll, staff and employee benefits obligations and the method applied are described in Note 10 “Payroll, staff and employee benefits obligations”.
Asset retirement obligations
Asset retirement obligations, which result from a legal or constructive obligation, are recognized based on a reasonable estimate in the period in which the obligation arises.
This estimate is based on information available in terms of costs and work program. It is regularly reviewed to take into account the changes in laws and regulations, the estimates of reserves and production, the analysis of site conditions and technologies.
The discount rate is reviewed annually.
Asset retirement obligations and the method used are described in Note 12 "Provisions and other non-current liabilities".
Income Taxes
A tax liability is recognized when in application of a tax regulation, a future payment is considered probable and can be reasonably estimated. The exercise of judgment is required to assess the impact of new events on the amount of the liability.
Deferred tax assets are recognized in the accounts to the extent that their recovery is considered probable. The amount of these assets is determined after taking into account deferred tax liabilities with comparable maturity, arising from the same entities and tax regimes. It takes into account existing taxable profits and future taxable profits which estimation is inherently uncertain and subject to change over time. The exercise of judgment is required to assess the impact of

new events on the value of these assets and including changes in estimates of future taxable profits and the deadlines for their use.
In addition, these tax positions may depend on interpretations of tax laws and regulations in the countries where the Group operates. These interpretations may have uncertain nature. Depending on the circumstances, they are final only after negotiations or resolution of disputes with authorities that can last several years.
Incomes taxes and the accounting methods are described in Note 11 “Income taxes”.
Judgments in case of transactions not addressed by any accounting standard or interpretation
Furthermore, when the accounting treatment of a specific transaction is not addressed by any accounting standard or interpretation, the management applies its judgment to define and apply accounting policies that provide information consistent with the general IFRS concepts: faithful representation, relevance and materiality.
1) General accounting policies
1.1) Accounting policies
A) Principles of consolidation
Entities that are directly controlled by the parent company or indirectly controlled by other consolidated entities are fully consolidated.
Investments in joint ventures are consolidated under the equity method. The Group accounts for joint operations by recognizing its share of assets, liabilities, income and expenses.
Investments in associates, in which the Group has significant influence, are accounted for by the equity method. Significant influence is presumed when the Group holds, directly or indirectly (e.g. through subsidiaries), 20% or more of the voting rights. Companies in which ownership interest is less than 20%, but over which the Company is deemed to exercise significant influence, are also accounted for by the equity method.
All internal balances, transactions and income are eliminated.
B) Business combinations
Business combinations are accounted for using the acquisition method. This method requires the recognition of the acquired identifiable assets and assumed liabilities of the companies acquired by the Group at their fair value.
The purchase accounting of the acquisition is finalized up to a maximum of one year from the acquisition date.
The acquirer shall recognize goodwill at the acquisition date, being the excess of:
The consideration transferred, the amount of non-controlling interests and, in business combinations achieved in stages, the fair value at the acquisition date of the investment previously held in the acquired company;
Over the fair value at the acquisition date of acquired identifiable assets and assumed liabilities.
If the consideration transferred is lower than the fair value of acquired identifiable assets and assumed liabilities, an additional analysis is performed on the identification and valuation of the identifiable elements of the assets and liabilities. After having completed such additional analysis, any negative goodwill is recorded as income.
Non-controlling interests are measured either at their proportionate share in the net assets of the acquired company or at fair value.
In transactions with non-controlling interests, the difference between the price paid (received) and the book value of non-controlling interests acquired (sold) is recognized directly in equity.

C) Foreign currency translation
The presentation currency of the Group's Consolidated Financial Statements is the US dollar. However, the functional currency of the parent company is the euro. The resulting currency translation adjustments are presented on the line "currency translation adjustment generated by the parent company" of the consolidated statement of comprehensive income, within "items not potentially reclassifiable to profit and loss". In the balance sheet, they are recorded in "currency translation adjustment".
The financial statements of subsidiaries are prepared in the currency that most clearly reflects their business environment. This is referred to as their functional currency.
Since 1st July 2018, Argentina is considered to be hyperinflationary. IAS 29 “Financial Reporting in Hyperinflationary Economies” is applicable to entities whose functional currency is the Argentine peso. The functional currency of the Argentine Exploration & Production subsidiary is the US dollar, therefore IAS 29 has no incidence on the Group accounts. Net asset of the other business segments is not significant.
(i) Monetary transactions
Transactions denominated in currencies other than the functional currency of the entity are translated at the exchange rate on the transaction date. At each balance sheet date, monetary assets and liabilities are translated at the closing rate and the resulting exchange differences are recognized in the statement of income.
(ii) Translation of financial statements
Assets and liabilities of entities denominated in currencies other than dollar are translated into dollar on the basis of the exchange rates at the end of the period. The income and cash flow statements are translated using the average exchange rates for the period. Foreign exchange differences resulting from such translations are either recorded in shareholders’ equity under “Currency translation adjustments” (for the Group share) or under “Non-controlling interests” (for the share of non-controlling interests) as deemed appropriate. 1.2) Significant accounting policies applicable in the future
The expected impact of the standards or interpretations published respectively by the International Accounting Standards Board (IASB) and the International Financial Reporting Standards Interpretations Committee (IFRS IC) which were not yet in effect at December 31, 2020, is not material.
2) Changes in the Group structure
2.1) Main acquisitions and divestments
In 2020, the main changes in the Group structure were as follows:
Integrated Gas, Renewables & Power
On February 28, 2020, TOTAL finalized the acquisition of a 37.4% interest in Adani Gas Limited, one of the
four main distributors of city gas in India. To acquire 37.4% of equity shares of Adani Gas Limited, TOTAL launched a tender offer to public shareholders on October 14, 2019 that ended on January 14, 2020, and then acquired the remaining shares from Adani on February 27 and 28, 2020.
On December 1, 2020, TOTAL finalized the acquisition from Energías de Portugal of its activity of gas and electricity supply to residential customers in Spain, which represents a portfolio of 2 million customers, as well as two gas-fired combined cycle power plants which represent an electricity generation capacity of nearly 850 megawatts.

Exploration & Production
On March 31, 2020, TOTAL finalized the sale of its subsidiary Total E&P Deep Offshore Borneo BV which
holds an 86.95% interest in Block CA1, located 100 kilometers off the coast of Brunei, to Shell.
On August 6, 2020, TOTAL closed the sale of UK North Sea non-core assets to NEO Energy.
In November, 2020, TOTAL finalized the acquisition of 33.3% interest of Tullow’s interests in the Uganda Lake Albert development project including the East African Crude Oil Pipeline.
2.2) Major business combinations
Accounting policies
In accordance with IFRS 3 “Business combinations”, TOTAL is assessing the fair value of identifiable acquired assets, liabilities and contingent liabilities on the basis of available information. This assessment will be finalised within 12 months following the acquisition date.
Integrated Gas, Renewables & Power
EDP Comercializadora Espagne
On December 1, 2020, TOTAL finalized the acquisition from Energías de Portugal of its activity of gas and electricity supply to residential customers in Spain as well as two gas-fired combined cycle power plants. This transaction was recorded for a purchase price of $578 million and a preliminary goodwill of $345 million was recognized in the consolidated financial statements at December 31, 2020. In the consolidated financial statements as at December 31, 2020, the fair value of the acquired identifiable assets and of the liabilities assumed amounts to $233 million. The preliminary purchase price allocation is shown below:
(M$) At the acquisition date
Goodwill 345
Intangible assets 56
Tangible assets 235
Other assets and liabilities (58)
Debt net of cash acquired -
Fair value of consideration 578
2.3) Divestment projects
Accounting policies
Pursuant to IFRS 5 "Non-current assets held for sale and discontinued operations”, assets and liabilities of affiliates that are held for sale are presented separately on the face of the balance sheet. Depreciation of assets ceases from the date of classification in “Non-current assets held for sale”.
Exploration & Production
On July 30, 2020, TOTAL announced that its 58% owned affiliate Total Gabon has signed an agreement with Perenco to divest its interests in seven mature non-operated offshore fields, along with its interests and operatorship in the Cap Lopez oil terminal. The transaction remains subject to approval by the Gabonese authorities.

As of December 31, 2020, the assets and liabilities have been respectively classified in the consolidated balance sheet as “assets classified as held for sale” for an amount of $391 million and “liabilities classified as held for sale” for an amount of $150 million. These assets mainly include tangible assets.
Refining & Chemicals
On July 27, 2020, TOTAL signed an agreement to sell the Lindsey refinery and its associated logistic assets,
as well as all the related rights and obligations, to the Prax Group. As of December 31, 2020, the assets and liabilities have been respectively classified in the consolidated balance sheet as “assets classified as held for sale” for an amount of $154 million and “liabilities classified as held for sale” for an amount of $238 million.

3) Business segment information
Description of the business segments
Financial information by business segment is reported in accordance with the internal reporting system and shows internal segment information that is used to manage and measure the performance of TOTAL and which is reviewed by the main operational decision-making body of the Group, namely the Executive Committee.
The operational profit and assets are broken down by business segment prior to the consolidation and inter-segment adjustments. Sales prices between business segments approximate market prices.
The profitable growth in the gas and low carbon electricity integrated value chains is one of the key axes of TOTAL’s strategy. In order to give more visibility to these businesses, a new reporting structure for the business segments’ financial information has been put in place, effective January 1, 2019.
The organization of the Group's activities is structured around the four followings segments:
- An Exploration & Production segment;
- An Integrated Gas, Renewables & Power segment comprising integrated gas (including LNG) and low carbon electricity businesses. It includes the upstream and midstream LNG activity that was previously reported in the Exploration & Production segment;
- A Refining & Chemicals segment constituting a major industrial hub comprising the activities of refining, petrochemicals and specialty chemicals. This segment also includes the activities of oil Supply, Trading and marine Shipping;
- A Marketing & Services segment including the global activities of supply and marketing in the field of petroleum products;
In addition, the Corporate segment includes holdings operating and financial activities.
Certain figures for the year 2018 have been restated in order to reflect the new organization.
Definition of the indicators
(i) Operating income (measure used to evaluate operating performance)
Revenue from sales after deducting cost of goods sold and inventory variations, other operating expenses, exploration expenses and depreciation, depletion, and impairment of tangible assets and mineral interests.
Operating income excludes the amortization of intangible assets other than mineral interests, currency translation adjustments and gains or losses on the disposal of assets.
(ii) Net operating income (measure used to evaluate the return on capital employed)
Operating income after taking into account the amortization of intangible assets other than mineral interests, currency translation adjustments, gains or losses on the disposal of assets, as well as all other income and expenses related to capital employed (dividends from non-consolidated companies, income from equity affiliates, capitalized interest expenses…), and after income taxes applicable to the above.
The only income and expense not included in net operating income but included in net income Group share are interest expenses related to net financial debt, after applicable income taxes (net cost of net debt) and non-controlling interests.
(iii) Adjusted income
Operating income, net operating income, or net income excluding the effect of adjustment items described below.
(iv) Capital employed
Non-current assets and working capital, at replacement cost, net of deferred income taxes and non-current liabilities.
(v) ROACE (Return on Average Capital Employed)
Ratio of adjusted net operating income to average capital employed between the beginning and the end of the period.
Performance indicators excluding the adjustment items, such as adjusted incomes and ROACE are meant to facilitate the analysis of the financial performance and the comparison of income between periods.

Adjustment items
Adjustment items include:
(i) Special items
Due to their unusual nature or particular significance, certain transactions qualified as "special items" are excluded from the business segment figures. In general, special items relate to transactions that are significant, infrequent or unusual. However, in certain instances, transactions such as restructuring costs or assets disposals, which are not considered to be representative of the normal course of business, may be qualified as special items although they may have occurred within prior years or are likely to occur again within the coming years.
(ii) The inventory valuation effect
The adjusted results of the Refining & Chemicals and Marketing & Services segments are presented according to the replacement cost method. This method is used to assess the segments’ performance and facilitate the comparability of the segments’ performance with those of its main competitors.
In the replacement cost method, which approximates the LIFO (Last-In, First-Out) method, the variation of inventory values in the statement of income is, depending on the nature of the inventory, determined using either the month-end prices differential between one period and another or the average prices of the period rather than the historical value. The inventory valuation effect is the difference between the results according to the FIFO (First-In, First-Out) and the replacement cost methods.
(iii) Effect of changes in fair value
The effect of changes in fair value presented as adjustment items reflects for certain transactions differences between the internal measure of performance used by TOTAL’s executive committee and the accounting for these transactions under IFRS.
IFRS requires that trading inventories be recorded at their fair value using period end spot prices. In order to best reflect the management of economic exposure through derivative transactions, internal indicators used to measure performance include valuations of trading inventories based on forward prices.
TOTAL, in its trading activities, enters into storage contracts, which future effects are recorded at fair value in the Group’s internal economic performance. IFRS precludes recognition of this fair value effect.
Furthermore, TOTAL enters into derivative instruments to risk manage certain operational contracts or assets. Under IFRS, these derivatives are recorded at fair value while the underlying operational transactions are recorded as they occur. Internal indicators defer the fair value on derivatives to match with the transaction occurrence.
The adjusted results (adjusted operating income, adjusted net operating income, adjusted net income) are defined as replacement cost results, adjusted for special items and the effect of changes in fair value.

A) Information by business segment
For the year ended December 31, 2020 Exploration
& Production
Integrated Gas,
Renewables & Power
Refining &
Chemicals
Marketing &
Services Corporate Intercompany Total (M$)
Non-Group sales 4,973 15,629 56,615 63,451 17 - 140,685
Intersegment sales 18,483 2,003 17,378 357 223 (38,444) -
Excise taxes - - (2,405) (18,576) - - (20,981)
Revenues from sales 23,456 17,632 71,588 45,232 240 (38,444) 119,704
Operating expenses (11,972) (15,847) (70,524) (42,807) (1,049) 38,444 (103,755)
Depreciation, depletion and impairment of tangible assets and mineral interests
(16,998) (2,312) (1,878) (984) (92) - (22,264)
Operating income (5,514) (527) (814) 1,441 (901) - (6,315)
Net income (loss) from equity affiliates and other items
697 794 (393) 37 272 - 1,407
Tax on net operating income (208) 71 59 (515) (67) - (660)
Net operating income (5,025) 338 (1,148) 963 (696) - (5,568)
Net cost of net debt (1,768)
Non-controlling interests 94
Net income - group share (7,242)
For the year ended December 31, 2020 (adjustments)(a)
Exploration &
Production
Integrated Gas,
Renewables & Power
Refining &
Chemicals
Marketing &
Services Corporate Intercompany Total
(M$)
Non-Group sales - 20 - - - - 20
Intersegment sales - - - - - - -
Excise taxes - - - - - - -
Revenues from sales - 20 - - - - 20
Operating expenses (137) (423) (1,552) (330) (60) - (2,502)
Depreciation, depletion and impairment of tangible assets and mineral interests
(7,693) (953) (306) - - - (8,952)
Operating income(b) (7,830) (1,356) (1,858) (330) (60) - (11,434)
Net income (loss) from equity affiliates and other items
54 (382) (677) (24) 107 - (922)
Tax on net operating income 388 298 348 93 (145) - 982
Net operating income(b) (7,388) (1,440) (2,187) (261) (98) - (11,374)
Net cost of net debt (29)
Non-controlling interests 102
Net income - group share (11,301)
(a) Adjustments include special items, inventory valuation effect and the effect of changes in fair value. (b) Of which inventory valuation effect On operating income - - (1,244) (196) - On net operating income - - (1,165) (137) -

For the year ended December 31, 2020 (adjusted)
Exploration &
Production
Integrated Gas,
Renewables & Power
Refining &
Chemicals
Marketing &
Services Corporate Intercompany Total (M$)
Non-Group sales 4,973 15,609 56,615 63,451 17 - 140,665
Intersegment sales 18,483 2,003 17,378 357 223 (38,444) -
Excise taxes - - (2,405) (18,576) - - (20,981)
Revenues from sales 23,456 17,612 71,588 45,232 240 (38,444) 119,684
Operating expenses (11,835) (15,424) (68,972) (42,477) (989) 38,444 (101,253)
Depreciation, depletion and impairment of tangible assets and mineral interests
(9,305) (1,359) (1,572) (984) (92) - (13,312)
Adjusted operating income 2,316 829 1,044 1,771 (841) - 5,119
Net income (loss) from equity affiliates and other items
643 1,176 284 61 165 - 2,329
Tax on net operating income (596) (227) (289) (608) 78 - (1,642)
Adjusted net operating income 2,363 1,778 1,039 1,224 (598) - 5,806
Net cost of net debt (1,739)
Non-controlling interests (8)
Adjusted net income - group share 4,059
For the year ended December 31, 2020 Exploration
& Production
Integrated Gas,
Renewables & Power
Refining &
Chemicals
Marketing &
Services Corporate Intercompany Total (M$)
Total expenditures 6,782 6,230 1,325 1,052 145 15,534
Total divestments 819 1,152 149 158 177 2,455
Cash flow from operating activities 9,922 2,129 2,438 2,101 (1,787) 14,803
Balance sheet as of December 31, 2020
Property, plant and equipment, intangible assets, net
89,207 30,704 12,486 8,734 732 141,863
Investments & loans in equity affiliates 7,328 16,455 3,638 555 - 27,976
Other non-current assets 5,093 3,647 791 1,260 1,042 11,833
Working capital 1,968 (1,004) (264) (43) (4,470) (3,813)
Provisions and other non-current liabilities (24,909) (4,566) (4,658) (1,641) 606 (35,168)
Assets and liabilities classified as held for sale
241 375 (83) - - 533
Capital Employed (Balance sheet) 78,928 45,611 11,910 8,865 (2,090) 143,224
Less inventory valuation effect - - (535) (72) - (607)
Capital Employed (Business segment information)
78,928 45,611 11,375 8,793 (2,090) 142,617
ROACE as a percentage 3% 4% 9% 14% 4%

For the year ended December 31, 2019 Exploration
& Production
Integrated Gas,
Renewables & Power
Refining &
Chemicals
Marketing &
Services Corporate Intercompany Total (M$)
Non-Group sales 7,261 18,167 87,598 87,280 10 - 200,316
Intersegment sales 31,329 2,825 32,390 659 125 (67,328) -
Excise taxes - - (3,015) (21,052) - - (24,067)
Revenues from sales 38,590 20,992 116,973 66,887 135 (67,328) 176,249
Operating expenses (16,389) (18,316) (112,104) (63,855) (925) 67,328 (144,261)
Depreciation, depletion and impairment of tangible assets and mineral interests
(11,659) (1,492) (1,527) (980) (73) - (15,731)
Operating income 10,542 1,184 3,342 2,052 (863) - 16,257
Net income (loss) from equity affiliates and other items
610 2,330 322 101 42 - 3,405
Tax on net operating income (4,572) (741) (470) (598) 155 - (6,226)
Net operating income 6,580 2,773 3,194 1,555 (666) - 13,436
Net cost of net debt (1,998)
Non-controlling interests (171)
Net income - group share 11,267
For the year ended December 31, 2019 (adjustments)(a)
Exploration &
Production
Integrated Gas,
Renewables & Power
Refining & Chemicals
Marketing &
Services Corporate Intercompany Total
(M$)
Non-Group sales - (64) - - - - (64)
Intersegment sales - - - - - - -
Excise taxes - - - - - - -
Revenues from sales - (64) - - - - (64)
Operating expenses (145) (240) 397 (40) (112) - (140)
Depreciation, depletion and impairment of tangible assets and mineral interests
(721) (156) (41) (2) - - (920)
Operating income(b) (866) (460) 356 (42) (112) - (1,124)
Net income (loss) from equity affiliates and other items
(112) 974 (83) (83) - - 696
Tax on net operating income 49 (130) (82) 27 (73) - (209)
Net operating income(b) (929) 384 191 (98) (185) - (637)
Net cost of net debt (15)
Non-controlling interests 91
Net income - group share (561)
(a) Adjustments include special items, inventory valuation effect and the effect of changes in fair value. (b) Of which inventory valuation effect On operating income - - 477 (31) - On net operating income - - 371 (14) -

For the year ended December 31, 2019 (adjusted)
Exploration &
Production
Integrated Gas,
Renewables & Power
Refining &
Chemicals
Marketing &
Services Corporate Intercompany Total
(M$)
Non-Group sales 7,261 18,231 87,598 87,280 10 - 200,380
Intersegment sales 31,329 2,825 32,390 659 125 (67,328) -
Excise taxes - - (3,015) (21,052) - - (24,067)
Revenues from sales 38,590 21,056 116,973 66,887 135 (67,328) 176,313
Operating expenses (16,244) (18,076) (112,501) (63,815) (813) 67,328 (144,121)
Depreciation, depletion and impairment of tangible assets and mineral interests
(10,938) (1,336) (1,486) (978) (73) - (14,811)
Adjusted operating income 11,408 1,644 2,986 2,094 (751) - 17,381
Net income (loss) from equity affiliates and other items
722 1,356 405 184 42 - 2,709
Tax on net operating income (4,621) (611) (388) (625) 228 - (6,017)
Adjusted net operating income 7,509 2,389 3,003 1,653 (481) - 14,073
Net cost of net debt (1,983)
Non-controlling interests (262)
Ajusted net income - group share 11,828
For the year ended December 31, 2019 Exploration
& Production
Integrated Gas,
Renewables & Power
Refining &
Chemicals
Marketing &
Services Corporate Intercompany Total (M$)
Total expenditures 8,992 7,053 1,698 1,374 120 19,237
Total divestments 368 1,108 322 249 13 2,060
Cash flow from operating activities 16,917 3,461 3,837 2,604 (2,134) 24,685
Balance sheet as of December 31, 2019
Property, plant and equipment, intangible assets, net
98,894 29,597 12,196 8,316 583 149,586
Investments & loans in equity affiliates 7,631 15,271 3,787 433 - 27,122
Other non-current assets 4,484 2,993 744 1,179 1,009 10,409
Working capital 2,617 (1,192) 796 178 (3,909) (1,510)
Provisions and other non-current liabilities (25,208) (5,488) (3,898) (1,531) 153 (35,972)
Assets and liabilities classified as held for sale
426 368 - - - 794
Capital Employed (Balance sheet) 88,844 41,549 13,625 8,575 (2,164) 150,429
Less inventory valuation effect - - (1,397) (204) - (1,601)
Capital Employed (Business segment information)
88,844 41,549 12,228 8,371 (2,164) 148,828
ROACE as a percentage 8% 6% 26% 22% 10%

For the year ended December 31, 2018 Exploration
& Production
Integrated Gas,
Renewables & Power
Refining &
Chemicals
Marketing &
Services Corporate Intercompany Total
(M$)
Non-Group sales 9,889 17,236 92,025 90,206 7 - 209,363
Intersegment sales 30,337 2,198 35,462 979 64 (69,040) -
Excise taxes - - (3,359) (21,898) - - (25,257)
Revenues from sales 40,226 19,434 124,128 69,287 71 (69,040) 184,106
Operating expenses (17,532) (17,679) (120,393) (66,737) (796) 69,040 (154,097)
Depreciation, depletion and impairment of tangible assets and mineral interests
(10,192) (1,827) (1,222) (709) (42) - (13,992)
Operating income 12,502 (72) 2,513 1,841 (767) - 16,017
Net income (loss) from equity affiliates and other items
1,365 1,639 782 307 77 - 4,170
Tax on net operating income (5,770) (471) (445) (532) 375 - (6,843)
Net operating income 8,097 1,096 2,850 1,616 (315) - 13,344
Net cost of net debt (1,794)
Non-controlling interests (104)
Net income - group share 11,446
For the year ended December 31, 2018 (adjustments)(a)
Exploration &
Production
Integrated Gas,
Renewables & Power
Refining &
Chemicals
Marketing &
Services Corporate Intercompany Total
(M$)
Non-Group sales - 56 - - - - 56
Intersegment sales - - - - - - -
Excise taxes - - - - - - -
Revenues from sales - 56 - - - - 56
Operating expenses (199) (237) (616) (45) (9) - (1,106)
Depreciation, depletion and impairment of tangible assets and mineral interests
(707) (1,065) (2) - - - (1,774)
Operating income(b) (906) (1,246) (618) (45) (9) - (2,824)
Net income (loss) from equity affiliates and other items
(128) (247) (116) (5) - - (496)
Tax on net operating income 584 170 205 14 - - 973
Net operating income(b) (450) (1,323) (529) (36) (9) - (2,347)
Net cost of net debt (67)
Non-controlling interests 301
Net income - group share (2,113)
(a) Adjustments include special items, inventory valuation effect and the effect of changes in fair value. (b) Of which inventory valuation effect
On operating income - - (589) (6) -
On net operating income - - (413) (5) -

For the year ended December 31, 2018 (adjusted)
Exploration &
Production
Integrated Gas,
Renewables & Power
Refining &
Chemicals
Marketing &
Services Corporate Intercompany Total
(M$)
Non-Group sales 9,889 17,180 92,025 90,206 7 - 209,307
Intersegment sales 30,337 2,198 35,462 979 64 (69,040) -
Excise taxes - - (3,359) (21,898) - - (25,257)
Revenues from sales 40,226 19,378 124,128 69,287 71 (69,040) 184,050
Operating expenses (17,333) (17,442) (119,777) (66,692) (787) 69,040 (152,991)
Depreciation, depletion and impairment of tangible assets and mineral interests
(9,485) (762) (1,220) (709) (42) - (12,218)
Adjusted operating income 13,408 1,174 3,131 1,886 (758) - 18,841
Net income (loss) from equity affiliates and other items
1,493 1,886 898 312 77 - 4,666
Tax on net operating income (6,354) (641) (650) (546) 375 - (7,816)
Adjusted net operating income 8,547 2,419 3,379 1,652 (306) - 15,691
Net cost of net debt (1,727)
Non-controlling interests (405)
Adjusted net income - group share 13,559
For the year ended December 31, 2018 Exploration
& Production
Integrated Gas,
Renewables & Power
Refining &
Chemicals
Marketing &
Services Corporate Intercompany Total
(M$)
Total expenditures 13,789 5,032 1,781 1,458 125 22,185
Total divestments 3,674 2,209 919 428 9 7,239
Cash flow from operating activities 18,537 596 4,308 2,759 (1,497) 24,703
Balance sheet as of December 31, 2018
Property, plant and equipment, intangible assets, net
100,997 24,023 10,493 6,343 390 142,246
Investments & loans in equity affiliates 6,754 12,349 3,910 431 - 23,444
Other non-current assets 4,780 3,114 663 1,155 881 10,593
Working capital 1,911 420 32 194 (4,064) (1,507)
Provisions and other non-current liabilities (25,042) (6,288) (3,615) (1,465) 125 (36,285)
Assets and liabilities classified as held for sale
- 1,128 151 - - 1,279
Capital Employed (Balance sheet) 89,400 34,746 11,634 6,658 (2,668) 139,770
Less inventory valuation effect - - (1,035) (216) - (1,251)
Capital Employed (Business segment information)
89,400 34,746 10,599 6,442 (2,668) 138,519
ROACE as a percentage 10% 7% 31% 25% 12%

B) Reconciliation of the information by business segment with Consolidated Financial Statements
The table below presents the impact of adjustment items on the consolidated statement of income:
Consolidated
For the year ended December 31, 2020 statement of
(M$) Adjusted Adjustments(a) income
Sales 140,665 20 140,685
Excise taxes (20,981) - (20,981)
Revenues from sales 119,684 20 119,704
Purchases, net of inventory variation (75,672) (1,814) (77,486)
Other operating expenses (24,850) (688) (25,538)
Exploration costs (731) - (731)
Depreciation, depletion and impairment of tangible assets and mineral interests (13,312) (8,952) (22,264)
Other income 1,405 832 2,237
Other expense (689) (817) (1,506)
Financial interest on debt (2,140) (7) (2,147)
Financial income and expense from cash & cash equivalents 68 (31) 37
Cost of net debt (2,072) (38) (2,110)
Other financial income 914 - 914
Other financial expense (689) (1) (690)
Net income (loss) from equity affiliates 1,388 (936) 452
Income taxes (1,309) 991 (318)
Consolidated net income 4,067 (11,403) (7,336)
Group share 4,059 (11,301) (7,242)
Non-controlling interests 8 (102) (94)
(a) Adjustments include special items, inventory valuation effect and the effect of changes in fair value.

Consolidated
For the year ended December 31, 2019 statement of
(M$) Adjusted Adjustments(a) income
Sales 200,380 (64) 200,316
Excise taxes (24,067) - (24,067)
Revenues from sales 176,313 (64) 176,249
Purchases, net of inventory variation (116,464) 243 (116,221)
Other operating expenses (26,872) (383) (27,255)
Exploration costs (785) - (785)
Depreciation, depletion and impairment of tangible assets and mineral interests (14,811) (920) (15,731)
Other income 876 287 1,163
Other expense (455) (737) (1,192)
Financial interest on debt (2,318) (15) (2,333)
Financial income and expense from cash & cash equivalents (19) - (19)
Cost of net debt (2,337) (15) (2,352)
Other financial income 792 - 792
Other financial expense (764) - (764)
Net income (loss) from equity affiliates 2,260 1,146 3,406
Income taxes (5,663) (209) (5,872)
Consolidated net income 12,090 (652) 11,438
Group share 11,828 (561) 11,267
Non-controlling interests 262 (91) 171
(a) Adjustments include special items, inventory valuation effect and the effect of changes in fair value.
Consolidated
For the year ended December 31, 2018 statement of
(M$) Adjusted Adjustments(a) income
Sales 209,307 56 209,363
Excise taxes (25,257) - (25,257)
Revenues from sales 184,050 56 184,106
Purchases, net of inventory variation (125,134) (682) (125,816)
Other operating expenses (27,060) (424) (27,484)
Exploration costs (797) - (797)
Depreciation, depletion and impairment of tangible assets and mineral interests (12,218) (1,774) (13,992)
Other income 1,518 320 1,838
Other expense (448) (825) (1,273)
Financial interest on debt (1,866) (67) (1,933)
Financial income and expense from cash & cash equivalents (188) - (188)
Cost of net debt (2,054) (67) (2,121)
Other financial income 1,120 - 1,120
Other financial expense (685) - (685) Net income (loss) from equity affiliates 3,161 9 3,170 Income taxes (7,489) 973 (6,516)
Consolidated net income 13,964 (2,414) 11,550
Group share 13,559 (2,113) 11,446
Non-controlling interests 405 (301) 104
(a) Adjustments include special items, inventory valuation effect and the effect of changes in fair value.

C) Additional information on adjustment items
The main adjustment items for 2020 consist of the "Asset impairment charges" of the non-current assets amounting to $(8,952) million in operating income and $(8,465) million in net income Group share. Impairment testing methodology and asset impairment charges recorded during the year are detailed in the paragraph D of Note 3.
Adjustments to operating income For the year ended December 31, 2020
Exploration &
Production
Integrated Gas,
Renewables & Power
Refining & Chemicals
Marketing & Services Corporate Total
(M$)
Inventory valuation effect - - (1,244) (196) - (1,440) Effect of changes in fair value - 20 - - - 20
Restructuring charges (35) (39) (30) - - (104) Asset impairment charges (7,693) (953) (306) - - (8,952) Other items (102) (384) (278) (134) (60) (958)Total (7,830) (1,356) (1,858) (330) (60) (11,434) Adjustments to net income, Group share For the year ended December 31, 2020
Exploration &
Production
Integrated Gas,
Renewables & Power
Refining & Chemicals
Marketing & Services Corporate Total
(M$)
Inventory valuation effect - - (1,160) (120) - (1,280) Effect of changes in fair value - 23 - - - 23
Restructuring charges (29) (43) (292) - - (364) Asset impairment charges (7,328) (829) (306) (2) - (8,465) Gains (losses) on disposals of assets - - - - 104 104
Other items - (566) (423) (106) (224) (1,319)Total (7,357) (1,415) (2,181) (228) (120) (11,301)
Adjustments to operating income
For the year ended December 31, 2019
Exploration &
Production
Integrated Gas,
Renewables & Power
Refining & Chemicals
Marketing & Services Corporate Total
(M$)
Inventory valuation effect - - 477 (31) - 446
Effect of changes in fair value - (19) - - - (19) Restructuring charges - (4) - - - (4) Asset impairment charges (721) (156) (41) (2) - (920) Other items (145) (281) (80) (9) (112) (627)Total (866) (460) 356 (42) (112) (1,124)
Adjustments to net income, Group share
For the year ended December 31, 2019
Exploration &
Production
Integrated Gas,
Renewables & Power
Refining & Chemicals
Marketing & Services Corporate Total
(M$)
Inventory valuation effect - - 369 (23) - 346
Effect of changes in fair value - (15) - - - (15) Restructuring charges (5) (31) (22) - - (58) Asset impairment charges (530) 105 (39) (1) - (465) Gains (losses) on disposals of assets - - - - - - Other items (405) 422 (119) (82) (185) (369)Total (940) 481 189 (106) (185) (561)

Adjustments to operating income
For the year ended December 31, 2018
Exploration &
Production
Integrated Gas,
Renewables & Power
Refining & Chemicals
Marketing & Services Corporate Total
(M$)
Inventory valuation effect - - (589) (6) - (595) Effect of changes in fair value - 48 - - - 48
Restructuring charges (67) - (3) - - (70) Asset impairment charges (707) (1,065) (2) - - (1,774) Other items (132) (229) (24) (39) (9) (433)Total (906) (1,246) (618) (45) (9) (2,824)
Adjustments to net income, Group share
For the year ended December 31, 2018
Exploration &
Production
Integrated Gas,
Renewables & Power
Refining & Chemicals
Marketing & Services Corporate Total
(M$)
Inventory valuation effect - - (414) (6) - (420) Effect of changes in fair value - 38 - - - 38
Restructuring charges (94) (10) (34) - - (138) Asset impairment charges (651) (896) (48) - - (1,595) Gains (losses) on disposals of assets (14) (2) - - - (16) Other items 252 (112) (34) (47) (41) 18
Total (507) (982) (530) (53) (41) (2,113)
D) Asset impairment
Accounting principles
The recoverable amounts of intangible assets and property, plant and equipment are tested for impairment as soon as any indication of impairment exists. This test is performed at least annually for goodwill.
The recoverable amount is the higher of the fair value (less costs to sell) or the value in use.
Assets are grouped into cash-generating units (or CGUs) and tested. A CGU is a homogeneous set of assets that generates cash inflows that are largely independent of the cash inflows from other groups of assets.
The value in use of a CGU is determined by reference to the discounted expected future cash flows of these assets, based upon Management’s expectation of future economic and operating conditions. When this value is less than the carrying amount of the CGU, an impairment loss is recorded. This loss is allocated first to goodwill with a corresponding amount in "Other expenses". Any further losses are then allocated to property, plant and mineral interests with a corresponding amount in "Depreciation, depletion and impairment of tangible assets and mineral interests" and to other intangible assets with a corresponding amount in "Other expenses".
Impairment losses recognized in prior periods can be reversed up to the original carrying amount, had the impairment loss not been recognized. Impairment losses recognized on goodwill cannot be reversed.
Investments in associates or joint ventures are tested for impairment whenever indication of impairment exists. If any objective evidence of impairment exists, the carrying amount of the investment is compared with its recoverable amount, being the higher of its fair value less costs to sell and value in use. If the carrying amount exceeds the recoverable amount, an impairment loss is recorded in "Net income (loss) from equity affiliates".
For the financial year 2020, asset impairments were recorded for an amount of $(8,952) million in operating income and $(8,465) million in net income, Group share. These impairments were qualified as adjustment items of the operating income and net income, Group share.
Impairments relate to certain cash-generating units (CGUs) for which indicators of impairment have been identified, due to changes in operating conditions or the economic environment of the activities concerned.
The principles applied are as follows:
- The future cash flows were determined using the assumptions included in the 2021 budget and in the long-term plan of the Group approved by the Group Executive Committee and the Board of Directors. These

assumptions, in particular including operational costs, estimation of oil and gas reserves, future volumes produced and marketed, represent the best estimate from the Group management of economic and technical conditions over the remaining life of the assets;
- The Group, notably relying on data on global energy demand from the “World Energy Outlook” issued by the IEA since 2016, and on its own supply assessments, determines oil & gas prices scenarios based on assumptions about the evolution of core indicators of the Upstream activity (demand for oil & gas products in different markets, investment forecasts, decline in production fields, changes in oil & gas reserves and supply by area and by nature of oil & gas products), of the Downstream activity (changes in refining capacity and demand for petroleum products) and by integrating climate challenges.
These price scenarios, first prepared within the Strategy and Climate Division, are also reviewed with the Group segments which bring their own expertise. They also integrate studies issued by international agencies, banks and independent consultants. They are then approved by the Executive Committee and the Board of directors.
- The IEA 2020 World Energy Outlook anticipates four scenarios among which the STEPS (Stated Policies Scenario) for the short/mid term and the SDS (Sustainable Development Scenario) for the mid/long term are important references for the Group.
- The STEPS takes into account the measures already implemented by countries in the energy area as well as the effects of the policies announced by Governments (including the Nationally Determined Contributions – NDCs – of the Paris Agreement). The SDS takes into account necessary measures to achieve a temperature rise of less than 2°C compared to pre-industrial levels, and the energy-related goals set in the “2030 Agenda for Sustainable Development” adopted in 2015 by the UN members. The Group therefore establishes its long-term price trajectory in line with the IEA's SDS scenario, which is compatible with the Paris Agreement, and foresees oil prices converging towards $502020 per barrel by 2040.
The oil and gas price trajectories adopted by the Group are based on the following assumptions:
- Following the deep recession caused by the health crisis in 2020, which strongly impacts the oil demand in 2020 and 2021 before reverting to a pre-crisis level, the oil demand should continue to grow until 2030, in a context of sustained growth in global energy demand, due to population growth and improved living standards, and despite the gradual electrification of transport and efficiency gains in thermal engines.
The Group thus selected the following profile of the Brent price to determine the recoverable value of CGUs: $40/b in 2021, $50/b in 2022, $60/b in 2023.
For the longer term, the Group maintains its analysis, that the weakness of investments in the Oil & Gas upstream since 2015, accentuated by the health and economic crisis of 2020, will result by 2025 in insufficient worldwide production capacities and a rebound in prices, that would then reach $70/b and remain stable for the following five years. Beyond 2030, given technological developments, particularly in the transport sector, the Group anticipates oil demand will have reached its peak and Brent prices should tend toward the long-term price of $50/b in 2040, in line with the IEA’s SDS scenario.
The average Brent prices over the period 2020-2050 thus stands at $572020/b.
- Natural gas demand would for its part be driven by gas substitution for coal in power generation and by its role as an alternative source to mitigate the intermittent use of renewable energies. The abundant global supply and the growth of liquefied natural gas would, however, limit the potential for higher gas prices.
In this context, the gas price level selected to determine the recoverable value of CGUs stabilizes from 2025 around $6.32020/MBTU for the NBP price (Europe) and $2.72020/MBTU for the Henry Hub price (United States).
- The future operational costs were determined by taking into account the existing technologies, the fluctuation of prices for petroleum services in line with market developments and the internal cost reduction programs effectively implemented;
- The future cash flows are estimated over a period consistent with the life of the assets of the CGUs. They are prepared post-tax and take into account specific risks related to the CGUs' assets. They are discounted using a 7% post-tax discount rate, this rate being the weighted-average cost of the Group capital estimated from historical market data. This rate was 7% in 2019 and 2018. The value in use calculated by discounting the above post-tax cash flows using a 7% post-tax discount rate is not materially different from the value in use calculated by discounting pre-tax cash flows using a pre-tax discount rate determined by an iterative computation from the post-tax value in use. These pre-tax discount rates generally ranged from 7% to 14% in 2020.

The CGUs of the Exploration & Production segment are defined as oil and gas fields or groups of oil and gas fields with industrial assets enabling the production, treatment and evacuation of the oil and gas. For the financial year 2020, impairments of assets were recognized over CGUs of the Exploration & Production segment for an impact of $(2,233) million in operating income and $(1,854) million in net income, Group share. Impairments recognized in 2020 mainly relate to Canadian oil sands assets.
The CGUs of the Integrated Gas, Renewables & Power segment are subsidiaries or groups of subsidiaries organized by activity or geographical area, and by fields or groups of fields for upstream LNG activities. For the financial year 2020, the Group recorded impairments on CGUs in the Integrated Gas, Renewables & Power segment for $(953) million in operating income and $(829) million in net income, Group share. Impairments recognized relate to LNG assets located in Australia.
The CGUs of the Refining & Chemicals segment are defined as legal entities with operational activities for refining and petrochemicals activities. Future cash flows are based on the gross contribution margin (calculated on the basis of net sales after purchases of crude oil and refined products, the effect of inventory valuation and variable costs). The other activities of the segment are global divisions, each division gathering a set of businesses or homogeneous products for strategic, commercial and industrial plans. Future cash flows are determined from the specific margins of these activities, unrelated to the price of oil. For the financial year 2020, the Group recorded impairments on CGUs in the Refining & Chemicals segment for $(306) million in operating income and $(306) million in net income, Group share. Impairments recognized mainly relate to refining CGUs located in France and the United Kingdom.
The CGUs of the Marketing & Services segment are subsidiaries or groups of subsidiaries organized by geographical area. For the financial year 2020, no impairment has been recorded for the CGUs of the Marketing & Services segment in operating income and impairments with a non-material impact have been recorded in net income, Group share.
In addition, in line with its new Climate Ambition announced on May 5, 2020, which aims at carbon neutrality, the Group has reviewed its oil assets that can be qualified as stranded, meaning with reserves beyond 20 years and high production costs, whose overall reserves may therefore not be produced by 2050. The only projects identified in this category are the Canadian oil sands projects of Fort Hills and Surmont.
For impairment calculations, the Group has decided to take into account only proven reserves on these two assets – unlike general practice which considers so-called proven and probable reserves. This leads to an additional exceptional asset impairment of $(5,460) million in operating income and $(5,474) million in net income, Group share.
Overall, asset impairments were recorded for the financial year 2020, for an amount of $(8,952) million in operating income and $(8,465) million in net income, Group share, including $(6,988) million on Canadian oil sands assets alone.
These impairments were qualified as adjustment items of the operating income and net income, Group share.
As for sensitivities of Exploration & Production segment:
- a decrease by one point in the discount rate would have an impact close to zero in operating income and in net income, Group share;
- an increase by one point in the discount rate would have an additional negative impact of approximately $0.4 billion in operating income and in net income, Group share;
- a variation of (10) % of the oil and gas prices over the duration of the plan would have an additional negative impact of approximately $1.9 billion in operating income and $1.6 billion in net income, Group share.
The most sensitive assets would be the assets already impaired in 2020 or before (impact of approximately $1.1 billion in operating income and $0.9 billion in net income, Group share), notably assets in Canada.
As for sensitivities of upstream LNG activities and CGUs including a material goodwill:
- a decrease by one point in the discount rate would have an impact close to zero in operating income and in net income, Group share;
- an increase by one point in the discount rate would have an additional negative impact of approximately $1.1 billion in operating income and $1.0 billion in net income, Group share;
- a variation of (10) % of the oil and gas prices over the duration of the plan would have an additional negative impact of approximately $1.5 billion in operating income and $1.2 billion in net income, Group share.

The most sensitive assets would be the assets already impaired in 2020 or before (impact of approximately $1.5 billion in operating income and $1.2 billion in net income, Group share), notably assets in Australia.
For the financial year 2019, the Group recorded impairments in Exploration & Production, Integrated Gas, Renewables & Power, Refining & Chemicals and Marketing & Services segments for an amount of $(920) million in operating income and $(465) million in net income, Group share. These impairments were qualified as adjustments items of the operating income and net income, Group share.
For the financial year 2018, the Group recorded impairments in Exploration & Production, Integrated Gas, Renewables & Power and Refining & Chemicals segments for an amount of $(1,774) million in operating income and $(1,595) million in net income, Group share. These impairments were qualified as adjustment items of the operating income and net income, Group share.

4) Segment Information by geographical area
(M$) France Rest of Europe
North America Africa
Rest of the world Total
For the year ended December 31, 2020 Non-Group sales 32,748 67,292 13,258 16,011 11,376 140,685
Property, plant and equipment, intangible assets, net 14,555 30,932 11,891 43,087 41,398 141,863
Capital expenditures 2,044 3,165 899 3,816 5,610 15,534
For the year ended December 31, 2019 Non-Group sales 43,877 99,176 19,946 21,303 16,014 200,316
Property, plant and equipment, intangible assets, net 13,212 28,765 18,916 45,573 43,120 149,586
Capital expenditures 1,979 3,201 1,748 7,663 4,646 19,237
For the year ended December 31, 2018 Non-Group sales 47,716 99,465 22,243 22,263 17,676 209,363
Property, plant and equipment, intangible assets, net 12,561 25,262 18,903 43,359 42,161 142,246
Capital expenditures 4,502 2,609 2,014 4,838 8,222 22,185
5) Main items related to operating activities
Items related to the statement of income
5.1) Net sales
Accounting policies
IFRS 15 requires identification of the performance obligations for the transfer of goods and services in each contract with customers. Revenue is recognized upon satisfaction of the performance obligations for the amounts that reflect the consideration to which the Group expects to be entitled in exchange for those goods and services.
Sales of goods
Revenues from sales are recognized when the control has been transferred to the buyer and the amount can be reasonably measured. Revenues from sales of crude oil and natural gas are recorded upon transfer of title, according to the terms of the sales contracts.
Revenues from the production of crude oil and natural gas properties, in which the Group has an interest with other producers, are recognized based on actual entitlement volumes sold over the period. Any difference between entitlement volumes and volumes sold, based on the Group net working interest, are recognized in the “Under-lifting” and “Over-lifting” accounts in the balance sheet and in operating expenses in the profit and loss.
Quantities delivered that represent production royalties and taxes, when paid in cash, are included in oil and gas revenues, except for the United States and Canada.
Certain transactions within the trading activities (contracts involving quantities that are purchased from third parties then resold to third parties) are shown at their net value in purchases, net of inventory variation. These transactions relate in particular to crude oil, petroleum products, gas, power and LNG.
Exchanges of crude oil and petroleum products realized within trading activities are shown at their net value in both the statement of income and the balance sheet.
Sales of services
Revenues from services are recognized when the services have been rendered.
Revenues from gas transport are recognized when services are rendered. These revenues are based on the quantities transported and measured according to procedures defined in each service contract.
Shipping revenues and expenses from time-charter activities are recognized on a pro rata basis over a period that commences upon the unloading of the previous voyage and terminates upon the unloading of the current voyage. Shipping revenue recognition starts only when a charter has been agreed to by both the Group and the customer.
Income related to the distribution of electricity and gas is not recognized in revenues in certain countries because the Group acts as an agent in this transaction. In these countries, the Group is not responsible for the delivery and does not set the price of the service, because it can only pass on to the customer the amounts invoiced to it by the distributors.

Excise taxes
Excise taxes are rights or taxes which amount is calculated based on the quantity of oil and gas products put on the market. Excise taxes are determined by the states. They are paid directly to the customs and tax authorities and then invoiced to final customers by being included in the sales price.
The analysis of the criteria set by IFRS 15 led the Group to determine that it was acting as principal in these transactions. Therefore, sales include excise taxes collected by the Group within the course of its oil distribution operations. Excise taxes are deducted from sales in order to obtain the “Revenues from sales” indicator.
5.2) Operating expenses and research and development
Accounting policies
The Group applies IFRS 6 “Exploration for and Evaluation of Mineral Resources”. Oil and gas exploration and production properties and assets are accounted for in accordance with the Successful Efforts method.
Geological and geophysical costs, including seismic surveys for exploration purposes are expensed as incurred in exploration costs.
Costs of dry wells and wells that have not found proved reserves are charged to expense in exploration costs.
5.2.1) Operating expenses
For the year ended December 31, (M$) 2020 2019 2018
Purchases, net of inventory variation(a) (b) (77,486) (116,221) (125,816)
Exploration costs (731) (785) (797)
Other operating expenses(c) (25,538) (27,255) (27,484) of which non-current operating liabilities (allowances) reversals 778 1,152 1,068 of which current operating liabilities (allowances) reversals (77) (157) (202)
Operating expenses (103,755) (144,261) (154,097)
(a) Includes taxes paid on oil and gas production in the Exploration & Production segment, amongst others royalties. (b) The Group values under / over lifting at market value. (c) Principally composed of production and administrative costs (see in particular the payroll costs as detailed in Note 10 to the Consolidated Financial Statements “Payroll, staff and employee benefits obligations").
5.2.2) Research and development costs
Accounting policies
Research costs are charged to expense as incurred.
Development expenses are capitalized when the criteria of IAS38 are met.
Research and development costs incurred by the Group in 2020 and booked in operating expenses amount to $895 million ($968 million in 2019 and $986 million in 2018), corresponding to 0.64% of the sales.
The staff dedicated in 2020 to these research and development activities are estimated at 4,088 people (4,339 in 2019 and 4,288 in 2018).
5.3) Amortization, depreciation and impairment of tangible assets and mineral interests
The amortization, depreciation and impairment of tangible assets and mineral interests are detailed as follows:
For the year ended December 31, 2020 2019 2018(M$)
Depreciation and impairment of tangible assets (21,188) (14,640) (13,364)Amortization and impairment of mineral assets (1,076) (1,091) (628)
Total (22,264) (15,731) (13,992)

Items related to balance sheet
5.4) Working capital
5.4.1) Inventories
Accounting policies
Inventories are measured in the Consolidated Financial Statements at the lower of historical cost or market value. Costs for petroleum and petrochemical products are determined according to the FIFO (First-In, First-Out) method or weighted-average cost method and other inventories are measured using the weighted-average cost method.
In addition stocks held for trading are measured at fair value less cost to sell.
Refining & Chemicals
Petroleum product inventories are mainly comprised of crude oil and refined products. Refined products principally consist of gasoline, distillate and fuel produced by the Group's refineries. The turnover of petroleum products does not exceed two months on average.
Crude oil costs include raw material and receiving costs. Refining costs principally include crude oil costs, production costs (energy, labor, depreciation of producing assets) and an allocation of production overheads (taxes, maintenance, insurance, etc.).
Costs of chemical product inventories consist of raw material costs, direct labor costs and an allocation of production overheads. Start-up costs, general administrative costs and financing costs are excluded from the costs of refined and chemicals products.
Marketing & Services
The costs of products refined by the Group’s entities include mainly raw materials costs, production costs (energy, labor, depreciation of producing assets), primary costs of transport and an allocation of production overheads (taxes, maintenance, insurance, etc.).
General administrative costs and financing costs are excluded from the cost price of refined products.
Product inventories purchased from entities external to the Group are valued at their purchase cost plus primary costs of transport.
Carbon dioxide emission rights generated as part of the EU Emission Trading scheme (EU ETS)
In the absence of a current IFRS standard or interpretation on accounting for emission rights of carbon dioxide generated as part of the EU Emission Trading scheme (EU ETS), the following principles are applied:
- Emission rights are managed as a cost of production and as such are recognized in inventories:
Emission rights allocated for free are booked in inventories with a nil carrying amount;
Purchased emission rights are booked at acquisition cost;
Sales or annual surrender of emission rights result in decreases in inventories valued at weighted average cost;
If the carrying amount of inventories at closing date is higher than the market value, an impairment loss is recorded.
- At each closing, a provision is recorded in order to materialize the obligation to surrender emission rights related to the emissions of the period. This provision is calculated based on estimated emissions of the period, valued at weighted average cost of the inventories at the end of the period. It is reversed when the emission rights are surrendered;
- If emission rights to be surrendered at the end of the compliance period are higher than emission rights recorded in inventories, the shortage is accounted for as a liability at market value;
- Forward transactions are recognized at their fair market value in the balance sheet. Changes in the fair value of such forward transactions are recognized in the statement of income.
Energy savings certificates
In the absence of current IFRS standards or interpretations on accounting for energy savings certificates (ESC), the following principles are applied:

- If the obligations linked to the sales of energy are greater than the number of ESC's held then a liability is recorded. These liabilities are valued based on the price of the last transactions;
- In the event that the number of ESC’s held exceeds the obligation at the balance sheet date this is accounted for as inventory. Otherwise a valuation allowance is recorded ;
- ESC inventories are valued at weighted average cost (acquisition cost for those ESC's acquired or cost incurred for those ESC's generated internally).
If the carrying value of the inventory of certificates at the balance sheet date is higher than the market value, an impairment loss is recorded.
As of December 31, 2020 Gross value
Valuation allowance Net value(M$)
Crude oil and natural gas 1,818 (1) 1,817
Refined products 3,913 (68) 3,845
Chemicals products 1,330 (102) 1,228
Trading inventories 5,130 - 5,130
Other inventories 3,824 (1,114) 2,710
Total 16,015 (1,285) 14,730
As of December 31, 2019
Gross valueValuation
allowance Net value(M$)
Crude oil and natural gas 2,381 (14) 2,367
Refined products 5,326 (45) 5,281
Chemicals products 1,448 (91) 1,357
Trading inventories 5,500 - 5,500
Other inventories 3,651 (1,024) 2,627
Total 18,306 (1,174) 17,132
As of December 31, 2018
Gross valueValuation
allowance Net value(M$)
Crude oil and natural gas 2,382 (110) 2,272
Refined products 5,464 (242) 5,222
Chemicals products 1,087 (54) 1,033
Trading inventories 3,918 - 3,918
Other inventories 3,372 (937) 2,435
Total 16,223 (1,343) 14,880 Changes in the valuation allowance on inventories are as follows:
For the year ended December 31, Valuation
allowance as ofIncrease (net)
Currency translation
adjustment and other variations
Valuation allowance as of
December 31,(M$) January 1,
2020 (1,174) (85) (26) (1,285)
2019 (1,343) 205 (36) (1,174)
2018 (1,007) (359) 23 (1,343)

5.4.2) Accounts receivable and other current assets
As of December 31, 2020
(M$) Gross valueValuation
allowance Net value
Accounts receivable 14,899 (831) 14,068
Recoverable taxes 3,598 (67) 3,531
Other operating receivables 8,251 (208) 8,043
Prepaid expenses 1,801 - 1,801
Other current assets 53 - 53
Other current assets 13,703 (275) 13,428
As of December 31, 2019
(M$) Gross valueValuation
allowance Net value
Accounts receivable 19,162 (674) 18,488
Recoverable taxes 4,209 (95) 4,114
Other operating receivables 11,746 (240) 11,506
Prepaid expenses 1,336 - 1,336
Other current assets 57 - 57
Other current assets 17,348 (335) 17,013
As of December 31, 2018
(M$) Gross valueValuation
allowance Net value
Accounts receivable 17,894 (624) 17,270
Recoverable taxes 4,090 - 4,090
Other operating receivables 10,306 (573) 9,733
Prepaid expenses 837 - 837
Other current assets 64 - 64
Other current assets 15,297 (573) 14,724
Changes in the valuation allowance on “Accounts receivable” and “Other current assets” are as follows:
Currency Valuation translation Valuation
For the year ended December 31, allowance adjustments and allowance as of
(M$) as of January 1, Increase (net) other variations December 31,
Accounts receivable
2020 (674) (107) (50) (831)
2019 (624) (89) 39 (674)
2018 (576) (62) 14 (624)
Other current assets
2020 (335) 37 23 (275)
2019 (573) (46) 284 (335)
2018 (461) (148) 36 (573) As of December 31, 2020, the net portion of the overdue receivables included in “Accounts receivable” and “Other current assets” was $4,197 million, of which $2,140 million was due less than 90 days, $239 million was due between 90 days and 6 months, $553 million was due between 6 and 12 months and $1,265 million was due after 12 months.

As of December 31, 2019, the net portion of the overdue receivables included in “Accounts receivable” and “Other current assets” was $3,760 million, of which $2,089 million was due less than 90 days, $357 million was due between 90 days and 6 months, $402 million was due between 6 and 12 months and $912 million was due after 12 months. As of December 31, 2018, the net portion of the overdue receivables included in “Accounts receivable” and “Other current assets” was $3,767 million, of which $1,993 million was due less than 90 days, $273 million was due between 90 days and 6 months, $450 million was due between 6 and 12 months and $1,051 million was due after 12 months.

5.4.3) Other creditors and accrued liabilities
As of December 31, (M$) 2020 2019 2018
Accruals and deferred income 842 522 546
Payable to States (including taxes and duties) 5,734 7,438 6,861
Payroll 1,587 1,527 1,553
Other operating liabilities 14,302 16,262 13,286
Total 22,465 25,749 22,246 As of December 31, 2020, the heading “Other operating liabilities” notably includes the second quarterly interim dividend for the fiscal year 2020 for $2,129 million, which was paid in January 2021 and the third quarterly interim dividend for the fiscal year 2020 for $2,149 million, which will be paid in April 2021.
As of December 31, 2019, the heading “Other operating liabilities” notably included the second quarterly interim dividend for the fiscal year 2019 for $1,918 million, which was paid in January 2020 and the third quarterly interim dividend for the fiscal year 2019 for $2,038 million, which was paid in April 2020.
As of December 31, 2018, the heading “Other operating liabilities” notably included the second quarterly interim dividend for the fiscal year 2018 for $1,911 million, which was paid in January 2019 and the third quarterly interim dividend for the fiscal year 2018 for $1,912 million, which was paid in April 2019.
Items related to the cash flow statement
5.5) Cash flow from operating activities
Accounting policies
The Consolidated Statement of Cash Flows prepared in currencies other than dollar has been translated into dollars using the exchange rate on the transaction date or the average exchange rate for the period. Currency translation differences arising from the translation of monetary assets and liabilities denominated in foreign currency into dollars using the closing exchange rates are shown in the Consolidated Statement of Cash Flows under “Effect of exchange rates”. Therefore, the Consolidated Statement of Cash Flows will not agree with the figures derived from the Consolidated Balance Sheet.
The following table gives additional information on cash paid or received in the cash flow from operating activities.
Detail of interest, taxes and dividends For the year ended December 31, (M$) 2020 2019 2018
Interests paid (2,145) (2,181) (1,818)
Interests received 197 210 164
Income tax paid(a) (2,858) (5,293) (5,024)
Dividends received 1,444 1,988 2,456
(a) These amounts include taxes paid in kind under production-sharing contracts in exploration and production activities.
Detail of changes in working capital
For the year ended December 31,
(M$) 2020 2019 2018
Inventories 2,274 (2,071) 1,430
Accounts receivable 4,818 (933) (1,461)
Other current assets 3,374 (2,001) (364)
Accounts payable (5,355) 1,998 (822)
Other creditors and accrued liabilities (3,242) 1,289 1,986
Net amount, Decrease (Increase) 1,869 (1,718) 769 Detail of changes in provisions and deferred taxes

As of December 31, 2020 2019 2018(M$)
Accruals 350 403 (432)
Deferred taxes (2,132) (461) (455)
Total (1,782) (58) (887)
6) Other items from operating activities
6.1) Other income and other expense
For the year ended December 31, (M$) 2020 2019 2018Gains on disposal of assets 961 670 1,041Foreign exchange gains 746 238 252
Other 530 255 545
Other income 2,237 1,163 1,838
Losses on disposal of assets (52) (56) (111)
Foreign exchange losses (320) (463) (444)
Amortization of other intangible assets (excl. mineral interests) (343) (266) (225)
Other (791) (407) (493)
Other expense (1,506) (1,192) (1,273)
Other income
In 2020, gains on disposal of assets are mainly related to the sale of non-strategic assets in the British North Sea in the Exploration & Production segment, to the sale of the group’s interest in the Fos Cavaou regasification terminal in France and the sale of infrastructure assets in the Integrated Gas Renewables & Power segment, as well as to the sale of real estate in Belgium in the Holding segment.
In 2019, gains on disposal of assets mainly related to the sale of assets and interests in Norway in the Exploration & Production segment, to the sale of Hazira and SunPower assets in the Integrated Gas Renewables & Power segment and the sale of assets in China in the Refining & Chemicals segment.
In 2018, gains on disposal of assets mainly related to the sale of assets and interests in Norway, Canada and Gabon in the Exploration & Production segment, to the sale of Dunkerque LNG SAS and SunPower assets in the Integrated Gas Renewables & Power segment and the sale of TotalErg and Total Haiti in the Marketing & Services segment.
Other expense
In 2020, the heading “Other” notably consists of restructuring charges in the Exploration & Production, Integrated Gas Renewables & Power and Refining & Chemicals segments for an amount of $312 million, and of the impairment of non-consolidated shares and loans granted to non-consolidated subsidiaries for an amount of $64 million.
In 2019, the heading “Other” notably consisted of restructuring charges in the Exploration & Production, Integrated Gas Renewables & Power and Refining & Chemicals segments for an amount of $96 million, and of the revaluation at fair value of non-consolidated shares for $94 million.
In 2018, the heading “Other” mainly consisted of restructuring charges in the Exploration & Production, Integrated Gas Renewables & Power and Refining & Chemicals segments for an amount of $179 million, and of the impairment of non-consolidated shares and loans granted to non-consolidated subsidiaries and equity affiliates for $77 million.

6.2) Other financial income and expense
As of December 31, (M$) 2020 2019 2018Dividend income on non-consolidated subsidiaries 160 178 171Capitalized financial expenses 110 227 519Other 644 387 430Other financial income 914 792 1,120
Accretion of asset retirement obligations (607) (639) (530)Other (83) (125) (155)Other financial expense (690) (764) (685)
6.3) Other non-current assets
As of December 31, 2020
Gross valueValuation
allowance Net value(M$) Loans and advances(a) 2,731 (273) 2,458
Other non-current financial assets related to operational activities 287 - 287
Other 65 - 65
Total 3,083 (273) 2,810
As of December 31, 2019
Gross valueValuation
allowance Net value(M$) Loans and advances(a) 2,248 (266) 1,982
Other non-current financial assets related to operational activities 332 - 332
Other 101 - 101
Total 2,681 (266) 2,415
As of December 31, 2018
Gross valueValuation
allowance Net value(M$) Loans and advances(a) 2,180 (303) 1,877
Other non-current financial assets related to operational activities 471 - 471
Other 161 - 161
Total 2,812 (303) 2,509
(a) Excluding loans to equity affiliates. Changes in the valuation allowance on loans and advances are detailed as follows:
For the year ended December 31,
Valuation allowance as of
January 1, Increases Decreases
Currency translation
adjustment and other variations
Valuation allowance as of
December 31,(M$)
2020 (266) (30) 15 8 (273)
2019 (303) (7) 43 1 (266)
2018 (359) (5) 35 26 (303)

7) Intangible and tangible assets
7.1) Intangible assets
Accounting policies
Goodwill
Guidance for measuring goodwill is presented in Note 1.1 paragraph B to the Consolidated Financial Statements. Goodwill is not amortized but is tested for impairment at least annually and as soon as there is any indication of impairment.
Mineral interests
Unproved mineral interests are tested for impairment based on the results of the exploratory activity or as part of the impairment tests of the cash-generating units to which they are allocated.
Unproved mineral interests are transferred to proved mineral interests at their net book value as soon as proved reserves are booked.
Proved mineral interests are depreciated using the unit-of-production method based on proved reserves.
The corresponding expense is recorded as depreciation of tangible assets and mineral interests.
Other intangible assets
Other intangible assets include patents, and trademarks.
Intangible assets are carried at cost, after deducting any accumulated amortization and accumulated impairment losses.
Intangible assets (excluding mineral interests) that have a finite useful life are amortized on a straight-line basis over three to twenty years depending on the useful life of the assets. The corresponding depreciation expense is recorded under other expense.
As of December 31, 2020
CostAmortization and
impairment Net(M$) Goodwill 9,738 (931) 8,807
Proved mineral interests 16,559 (9,595) 6,964
Unproved mineral interests 20,300 (4,790) 15,510
Other intangible assets 7,212 (4,965) 2,247
Total intangible assets 53,809 (20,281) 33,528
As of December 31, 2019
CostAmortization and
impairment Net(M$) Goodwill 9,357 (1,011) 8,346
Proved mineral interests 15,966 (8,741) 7,225
Unproved mineral interests 20,138 (4,558) 15,580
Other intangible assets 5,743 (3,716) 2,027
Total intangible assets 51,204 (18,026) 33,178

As of December 31, 2018
CostAmortization and
impairment Net(M$) Goodwill 9,188 (1,014) 8,174
Proved mineral interests 14,775 (7,947) 6,828
Unproved mineral interests 16,712 (4,491) 12,221
Other intangible assets 5,824 (4,125) 1,699
Total intangible assets 46,499 (17,577) 28,922
Change in net intangible assets is analyzed in the following table:
Net amount as of January 1,
Expenditures Disposals Amortization and impairment
Currencytranslationadjustment
Other Net amount as of December 31,
(M$)
2020 33,178 784 (277) (1,430) 305 968 33,528
2019 28,922 1,087 (118) (1,359) (95) 4,741 33,178
2018 14,587 3,745 (28) (852) (351) 11,821 28,922 In 2020, the heading “Amortization and impairment" includes the accounting impact of exceptional asset impairments for an amount of $323 million (see note 3 paragraph D to the Consolidated Financial Statements).
In 2020, the heading “Other” mainly reflects changes in the consolidation scope (including the acquisition of the residential gas and electricity supply business in Spain) for $898 million.
In 2019, the heading “Amortization and impairment" included the accounting impact of exceptional asset impairments for an amount of $251 million (see note 3 paragraph D to the Consolidated Financial Statements).
In 2019, the heading “Other” mainly reflected changes in the consolidation scope (including the assets of Anadarko in Mozambique) for $3,887 million.
In 2018, the heading “Amortization and impairment" included the accounting impact of exceptional asset impairments for an amount of $67 million (see note 3 paragraph D to the Consolidated Financial Statements).
In 2018, the heading “Other” mainly reflected changes in the consolidation scope (including Maersk Oil, Global LNG and Direct Energie) for $12,044 million.
A summary of changes in the carrying amount of goodwill by business segment for the year ended December 31, 2020 is as follows:
Net goodwill as of Net goodwill as of
(M$) January 1, 2020 Increases Impairments Other December 31, 2020
Exploration & Production 2,642 - - (4) 2,638
Integrated Gas, Renewables & Power 4,774 401 - 72 5,247
Refining & Chemicals 523 17 - (6) 534
Marketing & Services 379 - - (22) 357
Corporate 28 - - 3 31
Total 8,346 418 - 43 8,807
The heading “Increases” includes the effect of entries in the consolidation scope, mainly the acquisition in Spain of the gas and electricity residential supply for an amount of $345 million (see Note 2 paragraph 2 to the Consolidated Financial Statements).

7.2) Property, plant and equipment
Accounting policies
Exploration costs
The Group applies IFRS 6 “Exploration for and Evaluation of Mineral Resources”. Oil and gas exploration and production properties and assets are accounted for in accordance with the Successful Efforts method.
Exploratory wells are capitalized and tested for impairment on an individual basis as follows:
- Costs of exploratory wells which result in proved reserves are capitalized and then depreciated using the unit-of-production method based on proved developed reserves;
- Costs of exploratory wells are temporarily capitalized until proved reserves have been found, if both of the following conditions are met:
The well has found a sufficient quantity of reserves to justify, if appropriate, its completion as a producing well, assuming that the required capital expenditures are made;
The Group is making sufficient progress assessing the reserves and the economic and operating viability of the project. This progress is evaluated on the basis of indicators such as whether additional exploratory works are under way or firmly planned (wells, seismic or significant studies), whether costs are being incurred for development studies and whether the Group is waiting for governmental or other third-party authorization on a proposed project, or availability of capacity on an existing transport or processing facility.
Costs of exploratory wells not meeting these conditions are charged to exploration costs.
Oil and Gas production assets of exploration and production activities
Development costs of oil and gas production facilities are capitalized. These costs include borrowing costs incurred during the period of construction and the present value of estimated future costs of asset retirement obligations.
The depletion rate of development wells and of production assets is equal to the ratio of oil and gas production for the period to proved developed reserves (unit-of-production method).
In the event that, due to the price effect on reserves evaluation, the unit-of-production method does not reflect properly the useful life of the asset, an alternative depreciation method is applied based on the reserves evaluated with the price of the previous year. This is the case in 2020 where the method of unit-of-production depreciation is applied to all assets in 2020 based on proven reserves measured with the price used in 2019. This method complies with IAS16.
With respect to phased development projects or projects subject to progressive well production start-up, the fixed assets’ depreciable amount, excluding production or service wells, is adjusted to exclude the portion of development costs attributable to the undeveloped reserves of these projects.
With respect to production sharing contracts, the unit-of-production method is based on the portion of production and reserves assigned to the Group taking into account estimates based on the contractual clauses regarding the reimbursement of exploration, development and production costs (cost oil/gas) as well as the sharing of hydrocarbon rights after deduction of cost oil (profit oil/gas).
Hydrocarbon transportation and processing assets are depreciated using the unit-of-production method based on throughput or by using the straight-line method whichever best reflects the economic life of the asset.
Other property, plant and equipment
Other property, plant and equipment are carried at cost, after deducting any accumulated depreciation and accumulated impairment losses. This cost includes borrowing costs directly attributable to the acquisition or production of a qualifying asset incurred until assets are placed in service. Borrowing costs are capitalized as follows:
if the project benefits from a specific funding, the capitalization of borrowing costs is based on the borrowing rate;
if the project is financed by all the Group’s debt, the capitalization of borrowing costs is based on the weighted average borrowing cost for the period.
Routine maintenance and repairs are charged to expense as incurred. The costs of major turnarounds of refineries and large petrochemical units are capitalized as incurred and depreciated over the period of time between two consecutive major turnarounds.

Other property, plant and equipment are depreciated using the straight-line method over their useful lives, which are as follows:
Furniture, office equipment, machinery and tools 3-12 years
Transportation equipment 5-20 years
Storage tanks and related equipment 10-15 years
Specialized complex installations and pipelines 10-30 years
Buildings 10-50 years
As of December 31, 2020
CostDepreciation and
impairment Net(M$)
Property, plant and equipment of exploration and production activities
Proved properties 215,892 (147,914) 67,978
Unproved properties 2,978 (268) 2,710
Work in progress 13,873 (861) 13,012
Subtotal 232,743 (149,043) 83,700
Other property, plant and equipment
Land 2,999 (905) 2,094
Machinery, plant and equipment (including transportation equipment) 39,506 (27,381) 12,125
Buildings 11,184 (6,858) 4,326
Work in progress 3,063 (1) 3,062
Other 10,983 (7,955) 3,028
Subtotal 67,735 (43,100) 24,635
Total property, plant and equipment 300,478 (192,143) 108,335
As of December 31, 2019
CostDepreciation and
impairment Net(M$)
Property, plant and equipment of exploration and production activities
Proved properties 210,071 (130,134) 79,937
Unproved properties 2,160 (288) 1,872
Work in progress 12,056 (569) 11,487
Subtotal 224,287 (130,991) 93,296
Other property, plant and equipment
Land 2,826 (792) 2,034
Machinery, plant and equipment (including transportation equipment) 36,747 (25,548) 11,199
Buildings 10,519 (6,032) 4,487
Work in progress 2,501 (2) 2,499
Other 10,137 (7,244) 2,893
Subtotal 62,730 (39,618) 23,112
Total property, plant and equipment 287,017 (170,609) 116,408

As of December 31, 2018
CostDepreciation and
impairment Net(M$)
Property, plant and equipment of exploration and production activities
Proved properties 192,272 (120,435) 71,837
Unproved properties 1,673 (152) 1,521
Work in progress 22,553 (1,128) 21,425
Subtotal 216,498 (121,715) 94,783
Other property, plant and equipment
Land 1,775 (648) 1,127
Machinery, plant and equipment (including transportation equipment) 34,564 (25,393) 9,171
Buildings 8,864 (5,640) 3,224
Work in progress 2,540 (2) 2,538
Other 9,171 (6,690) 2,481
Subtotal 56,914 (38,373) 18,541
Total property, plant and equipment 273,412 (160,088) 113,324
Change in net property, plant and equipment is analyzed in the following table:
Net amount as of
January 1,Expenditures Disposals Depreciation and
impairmentCurrency
translationadjustment
Other Net amount as of December 31,
(M$)
2020 116,408 9,980 (611) (21,544) 1,706 2,396 108,335
2019 113,324 11,426 (1,052) (15,097) (270) 8,077 116,408
2018 109,397 13,336 (2,494) (13,732) (1,454) 8,271 113,324
In 2020, the heading “Disposals” mainly includes the sale of non strategic assets in the United Kingdom for $240 million.
In 2020, the heading “Depreciation and impairment” includes the impact of impairments of assets recognized for an amount of $8,629 million (see Note 3 paragraph D to the Consolidated Financial Statements).
In 2020, the heading “Other” includes the impact of changes in the consolidation scope, the impact of the new IFRS 16 contracts of the period (mainly LNG carriers and FPSO vessels) for an amount of $1,815 million, and the reversal of the reclassification under IFRS 5 as at December 31, 2019 for $434 million corresponding to disposals (mainly non strategic assets in the United Kingdom and Total E&P Deep Offshore Borneo BV).
In 2019, the heading “Disposals” mainly included the impact of the 4% sale of Ichthys LNG in Australia.
In 2019, the heading “Depreciation and impairment” included the impact of impairments of assets recognized for an amount of $669 million (see Note 3 paragraph D to the Consolidated Financial Statements).
In 2019, the heading “Other” principally corresponded to the effect of the first application of IFRS 16 for an amount of $5,698 million, the entries in the consolidation scope (including Anadarko assets for $767 million) and the reversal of the reclassification under IFRS 5 as at December 31, 2018 for $812 million corresponding to disposals.
In 2018, the heading “Disposals” mainly included the impact of sales in the Exploration & Production segment (mainly Martin Linge in Norway and Fort Hills in Canada).
In 2018, the heading “Depreciation and impairment” included the impact of impairments of assets recognized for an amount of $1,707 million (see Note 3 paragraph D to the Consolidated Financial Statements).
In 2018, the heading “Other” principally corresponded to the effect of the entries in the consolidation scope (including Maersk, Lapa and Iara in Brazil and Direct Energie) for $6,987 million, to the reclassification of assets in accordance with IFRS 5 "Non-current assets held for sale and discontinued operations” (mainly related to the 4% sale of Ichthys for $(812) million) and the reversal of the reclassification under IFRS 5 as at December 31, 2017 for $2,604 million corresponding to disposals.
Following the application of IFRS 16 "Leases", property, plant and equipment as at December 31, 2020 and 2019 presented above include the following amounts for rights of use of assets:

As of December 31, 2020
Cost Depreciation and
impairment Net (M$)
Property, plant and equipment of exploration and production activities
2,758 (1,297) 1,461
Other property, plant and equipment
Land 1,187 (222) 965Machinery, plant and equipment (including transportation equipment)
4,606 (1,631) 2,975
Buildings 1,778 (385) 1,393
Other 682 (286) 396
Subtotal 8,253 (2,524) 5,729
Total property, plant and equipment 11,011 (3,821) 7,190
As of December 31, 2019
CostDepreciation and
impairment Net(M$)
Property, plant and equipment of exploration and production activities
2,482 (517) 1,965
Other property, plant and equipment
Land 1,031 (104) 927
Machinery, plant and equipment (including transportation equipment)
3,527 (999) 2,528
Buildings 1,545 (201) 1,344
Other 483 (134) 349
Subtotal 6,586 (1,438) 5,148
Total property, plant and equipment 9,068 (1,955) 7,113
Property, plant and equipment as at December 31, 2018 presented above include the following amounts for facilities and equipment under finance leases:
As of December 31, 2018 Cost
Depreciation and impairment Net(M$)
Machinery, plant and equipment 1,778 (605) 1,173
Buildings 121 (56) 65
Other 543 (83) 460
Total 2,442 (744) 1,698

8) Equity affiliates, other investments and related parties
8.1) Equity affiliates: investments and loans
Accounting principles
Under the equity method, the investment in the associate or joint venture is initially recognized at acquisition cost and subsequently adjusted to recognize the Group’s share of the net income and other comprehensive income of the associate or joint venture.
Unrealized gains on transactions between the Group and its equity-accounted entities are eliminated to the extent of the Group’s interest in the equity accounted entity.
In equity affiliates, goodwill is included in investment book value.
In cases where the group holds less than 20% of the voting rights in another entity, the determination of whether the Group exercises significant influence is also based on other facts and circumstances: representation on the board of directors or an equivalent governing body of the entity, participation in policy-making processes, including participation in decisions relating to dividends or other distributions, significant transactions between the investor and the entity, exchange of management personnel, or provision of essential technical information.
The contribution of equity affiliates in the consolidated balance sheet, consolidated statement of income and consolidated statement of comprehensive income is presented below:
Equity value As of December 31, 2020 2019 2018 (M$)
Total Associates 15,745 17,026 13,330
Total Joint ventures 7,102 6,097 5,359
Total 22,847 23,123 18,689
Loans 5,129 3,999 4,755
Total 27,976 27,122 23,444
Profit/(loss)
2020 2019 2018
(M$)
Total Associates 753 2,534 2,329
Total Joint ventures (301) 872 841
Total 452 3,406 3,170
Other comprehensive income
2020 2019 2018
(M$)
Total Associates (1,704) 592 (461)
Total Joint ventures (127) (184) (79)
Total (1,831) 408 (540)

A) Information related to associates
Information (100% gross) related to significant associates is as follows:
Exploration and production activites Novatek(a) Liquefaction entities PetroCedeño(a)
(M$) 2020 2019 2018 2020 2019 2018 2020 2019 2018
Non current assets 23,748 24,081 14,639 34,273 30,578 28,664 4,008 3,994 4,324
Current assets 4,170 6,898 4,545 7,537 9,994 9,358 6,428 7,457 5,580
Total Assets 27,918 30,979 19,184 41,810 40,572 38,022 10,436 11,451 9,904
Shareholder's equity 22,160 24,884 14,163 23,403 23,640 22,615 4,548 4,548 4,581
Non current liabilities 3,164 3,727 3,086 13,608 11,445 9,826 73 76 20
Current liabilities 2,594 2,368 1,935 4,799 5,487 5,581 5,815 6,827 5,303
Total Liabilities 27,918 30,979 19,184 41,810 40,572 38,022 10,436 11,451 9,904
Revenue from sales 9,733 13,227 13,415 15,584 22,684 25,644 66 356 1,629
Net income 1,759 8,260 4,636 2,416 5,692 7,408 - (33) 122
Other comprehensive income (3,206) 1,807 (2,545) - - - - - -
% owned 19.40% 19.40% 19.40% 30.32% 30.32% 30.32%
Revaluation identifiable assets on equity affiliates 1,297 1,641 1,556 1,837 1,714 44 - - -
Equity value 5,596 6,469 4,303 5,534 5,493 3,758 1,379 1,379 1,389
Profit/(loss) 264 1,508 794 237 637 874 - (10) 37
Share of Other Comprehensive Income, net amount (1,409) 634 (540) (122) 23 49 - - -
Dividends paid to the Group 229 266 151 406 752 816 - - 218
(a) Information includes the best Group’s estimates of results at the date of TOTAL's financial statements.
Novatek, listed in Moscow and London, is the 2nd largest producer of natural gas in Russia. The Group share of Novatek's market value amounted to $9,951 million as at December 31, 2020. Novatek is consolidated by the equity method. TOTAL, in fact, exercises significant influence particularly through its representation on the Board of Directors of Novatek and its interest in Yamal LNG and the project Arctic LNG 2.
The Group is not aware of significant restrictions limiting the ability of OAO Novatek to transfer funds to its shareholder, be it under the form of dividends, repayment of advances or loans made.
The Group's interests in associates operating liquefaction plants are combined. The amounts include investments in: Nigeria LNG (15.00%), Angola LNG (13.60%), Yemen LNG (39.62%), Qatar Liquefied Gas Company Limited (Qatargas) (10.00%), Qatar Liquefied Gas Company Limited II (16.70%), Oman LNG (5.54%), and Abu Dhabi Gas Liquefaction Company Limited (5.00%), Arctic LNG 2 (10.00%).
PetroCedeño produces and upgrades extra-heavy crude oil in Venezuela.

Refining & Chemicals activities Saudi Aramco Total
Refining & Petrochemicals Qatar
(M$) 2020 2019 2018 2020 2019 2018
Non current assets 10,698 10,976 11,281 4,105 4,160 3,968
Current assets 1,211 1,793 2,069 1,521 1,571 1,741
Total Assets 11,909 12,769 13,350 5,626 5,731 5,709
Shareholder's equity 1,256 2,113 2,412 2,717 2,676 2,748
Non current liabilities 7,994 8,098 8,398 2,171 2,150 1,914
Current liabilities 2,659 2,558 2,540 738 905 1,047
Total Liabilities 11,909 12,769 13,350 5,626 5,731 5,709
Revenue from sales 6,031 10,522 11,886 5,222 8,225 9,929
Net income (686) (171) 122 91 42 409
Other comprehensive income (171) (124) 16 - 111 (21)
% owned 37.50% 37.50% 37.50%
Revaluation identifiable assets on equity affiliates - - - - - -
Equity value 471 792 905 716 706 740
Profit/(loss) (257) (64) 46 57 91 198
Share of Other Comprehensive Income, net amount (128) (33) 40 (16) 14 6
Dividends paid to the Group - - 56 63 159 271
Saudi Aramco Total Refining & Petrochemicals is an entity including a refinery in Jubail, Saudi Arabia, with a capacity of 460,000 barrels/day with integrated petrochemical units.
The Group's interests in associates of the Refining & Chemicals segment, operating steam crackers and polyethylene lines in Qatar have been combined: Qatar Petrochemical Company Ltd. (20.00%), Qatofin (49.09%), Laffan Refinery (10.00%) and Laffan Refinery II (10.00%).
B) Information related to joint ventures
The information (100% gross) related to significant joint ventures is as follows:

Liquefaction entities Hanwha Total Petrochemicals
(Integrated Gas, Renewables & Power) (Refining & Chemicals)
(M$) 2020 2019 2018 2020 2019 2018
Non current assets 70,425 70,279 68,003 4,664 4,310 4,017
Current assets excluding cash and cash equivalents 1,513 1,866 1,928 1,575 1,842 2,180
Cash and cash equivalents 1,834 1,678 339 303 322 237
Total Assets 73,772 73,823 70,270 6,542 6,474 6,434
Shareholder's equity 4,433 7,151 7,059 3,443 3,319 3,534
Other non current liabilities 8,259 6,864 3,472 167 150 157
Non current financial debts 58,128 56,379 56,841 1,703 1,761 1,418
Other current liabilities 2,952 3,429 2,898 583 756 725
Current financial debts - - - 646 488 600
Total Liabilities 73,772 73,823 70,270 6,542 6,474 6,434
Revenue from sales 8,543 9,240 2,908 5,734 8,437 10,191
Depreciation and depletion of tangible assets and mineral interests
(3,130) (3,040) (1,227) (278) (256) (269)
Interest income 2 5 119 - - 9
Interest expense (2,972) (2,993) (670) (2) (14) (5)
Income taxes 77 (270) (386) (69) (124) (310)
Net income (2,399) 383 2,029 133 302 754
Other comprehensive income (323) (429) 132 194 (116) (169)
% owned 50.00% 50.00% 50.00%
Revaluation identifiable assets on equity affiliates 546 660 683 - - -
Equity value 1,602 2,318 2,404 1,721 1,660 1,767
Profit/(loss) (633) (19) 192 67 150 377
Share of Other Comprehensive Income, net amount (84) (112) 40 87 (68) (67)
Dividends paid to the Group - - - 102 200 332
The Group's interests in joint ventures operating liquefaction plants have been combined. The amounts include investments in Yamal LNG in Russia (20.02% direct holding) and Ichthys LNG in Australia (26.00%).
Hanwha Total Petrochemicals is a South Korean company that operates a petrochemical complex in Daesan (condensate separator, steam cracker, styrene, paraxylene, polyolefins).
Off balance sheet commitments relating to joint ventures are disclosed in Note 13 of the Consolidated Financial Statements.

C) Other equity consolidated affiliates
In Group share, the main aggregated financial items in equity consolidated affiliates including assets held for sale, which have not been presented individually are as follows:

As of December 31, 2020 2019 2018
(M$) Associates
Joint
ventures Associates
Joint
ventures Associates
Joint
ventures
Non Current assets 5,454 7,002 5,435 4,287 4,512 2,487
Current assets 1,299 1,671 1,357 1,276 1,263 752
Total Assets 6,753 8,673 6,792 5,563 5,775 3,239
Shareholder's equity 1,183 1,963 1,405 1,437 1,438 1,108
Non current liabilities 4,881 5,469 4,412 3,091 3,254 1,585
Current liabilities 689 1,241 975 1,035 1,083 546
Total Liabilities 6,753 8,673 6,792 5,563 5,775 3,239
For the year ended December 31, 2020 2019 2018
(M$) Associates
Joint
ventures Associates
Joint
ventures Associates
Joint
ventures
Revenues from sales 2,154 3,116 2,190 3,535 2,542 11,914
Net income 478 202 383 288 380 281
Share of other comprehensive income items
(29) (130)
(46) (4)
(16) (52)
Equity value 2,049 3,779 2,187 2,119 2,235 1,188
Profit/(Loss) 452 265 372 741 380 272
Dividends paid to the Group 409 59 362 50 416 49
8.2) Other investments
Accounting policies
Other investments are equity instruments and are measured according to IFRS 9 at fair value through profit and loss (default option). On initial recognition, the standard allows to make an election to record the changes of fair value in other comprehensive income. For these equity instruments, only dividends can be recognized in profit or loss.
The Group recognizes changes in fair value in equity or in profit or loss according to the option chosen on an instrument by instrument basis.
For quoted shares on active markets, this fair value is equal to the market price.
As of December 31, 2020 As of
January 1, 2020
Increase - Decrease
Change in fair value
As of December 31, 2020
Enphase Energy Inc 173 (251) 691 613
Tellurian Investments Inc. 207 (1) (149) 57
Other shares through fair value OCI (unit value < $50M) 126 (4) (9) 113
Equity instruments recorded through fair value OCI 506 (256) 533 783
BBPP 62 (4) - 58
BTC Limited 28 - (1) 27
Tas Helat Marketing Company (a) 108 (108) - -
Other shares through fair value P&L (unit value < $50M) 1,074 84 (19) 1,139
Equity instruments recorded through fair value P&L 1,272 (28) (20) 1,224
Total equity instruments 1,778 (284) 513 2,007(a) Tas Helat Marketing Company is a joint venture with SAUDI ARAMCO to develop the retail business. It was consolidated in 2020 (using the equity method).

As of December 31, 2019
As of January 1, 2019
Increase - Decrease
Change in fair value
As of December 31, 2019
Enphase Energy Inc 36 (5) 142 173
Tellurian Investments Inc. 207 - - 207
Other shares through fair value OCI (unit value < $50M) 119 7 - 126
Equity instruments recorded through fair value OCI 362 2 142 506
BBPP 62 - - 62
BTC Limited 50 - (22) 28
Tas Helat Marketing Company (a) - 108 - 108
Total Lubrificantes do Brasil(b) 111 (111) - -
Other shares through fair value P&L (unit value < $50M) 836 238 - 1,074
Equity instruments recorded through fair value P&L 1,059 235 (22) 1,272
Total equity instruments 1,421 237 120 1,778(a) Tas Helat Marketing Company is a joint venture with SAUDI ARAMCO to develop the retail business. It will be consolidated in 2020 (using the equity method).
(b) Total Lubrificantes do Brasil was consolidated in 2019.
As of December 31, 2018
As of January 1, 2018
Increase - Decrease
Change in fair value
As of December 31, 2018
Tellurian Investments Inc. 207 - - 207
Other shares through fair value OCI (unit value < $50M) 77 80 (2) 155
Equity instruments recorded through fair value OCI 284 80 (2) 362
BBPP 62 - - 62
BTC Limited 55 - (5) 50
DUNKERQUE LNG SAS 144 (217) 73 -
Total Lubrificantes do Brasil(a) - 111 - 111
Other shares through fair value P&L (unit value < $50M) 1,182 (346) - 836
Equity instruments recorded through fair value P&L 1,443 (452) 68 1,059
Total equity instruments 1,727 (372) 66 1,421
(a) Total Lubrificantes do Brasil will be consolidated in 2019.

8.3) Related parties
The main transactions as well as receivable and payable balances with related parties (principally non-consolidated subsidiaries and equity consolidated affiliates) are detailed as follows:
As of December 31, (M$) 2020 2019 2018
Balance sheet
Receivables
Debtors and other debtors 545 486 496
Loans (excl. loans to equity affiliates) 89 42 57
Payables
Creditors and other creditors 662 968 888
Debts 3 2 2
For the year ended December 31, (M$) 2020 2019 2018
Statement of income
Sales 3,134 4,127 4,192
Purchases (7,183) (10,158) (9,253)
Financial income 1 4 2
Financial expense (6) (4) (5) 8.4) Compensation for the administration and management bodies
The aggregate amount of direct and indirect compensation accounted by the French and foreign affiliates of the Company, for all executive officers of TOTAL as of December 31 and for the members of the Board of Directors who are employees of the Group, is detailed below.
During fiscal year 2020, the Company, taking into account the definition from US regulations applicable to Executive Officers and in the interest of harmonization, has chosen to reduce the list of its Executive Officers to the members of the Executive Committee in order to align this list with the list of “Persons Discharging Managerial Responsibilities" (PDMR) within the sense of Article 19.5 of Regulation (EU) No. 596/2014 on Market Abuse ("Regulation"). For the purposes of this Regulation, PDMRs are defined as the persons referred to in Article L. 621-18-2 (a) of the French Monetary and Financial Code (the "Directors") and the persons referred to in Article L. 621-18-2 (b) of the same code that TOTAL SE has defined as the members of the TOTAL Executive Committee ("COMEX").
As of December 31, 2020, the Group Executive Officers are the members of the Executive Committee, i.e. eight people.
As of December 31, 2019, the Group Executive Officers included the members of the Executive Committee and the four directors of the corporate functions members of the Group Performance Management Committee (Communication, Legal, Health, Safety and Environment, Investor relations), and the Group Treasurer, i.e. thirteen people.
There are three employees members of the Board of Directors on December 31, 2020. They were two on December 31, 2019. The increase in the number of employees members results from the appointment of a second director representing employees on the Board of Directors in accordance with the French “Pacte law” of May 22, 2019.

For the year ended December 31, (M$) 2020 2019 2018
Number of people 11 15 15
Direct or indirect compensation 12.6 15.0 17.7
Pension expenses (a) 1.5 (4.9) 2.5
Share-based payments expense (IFRS 2) (b) 7.2 8.7 12.6
(a) The benefits provided for executive officers of the Group and the members of the Board of Directors, who are employees of the Group, include
severance to be paid upon retirement, supplementary pension schemes and insurance plans, which represent a commitment of $129.0 million as of December 31, 2020 (against $113.3 million as of December 31, 2019 and $117.0 million as of December 31, 2018). Converted into Euros, this commitment amounts to €105.2 million as of December 31, 2020 (against €100.8 million as of December 31, 2019 and €102.2 million as of December 31, 2018).
(b) Share-based payments expense computed for the executive officers and the members of the Board of Directors who are employees of the Group and based on the principles of IFRS 2 “Share-based payments” described in Note 9.
Restating the 2019 and 2018 data, to the scope of the Group of executive officers as defined in 2020, the detail of the compensation is as follows: For the year ended December 31, (M$)
2020 2019 2018
Number of people 11 10 9
Direct or indirect compensation 12.6 12.0 14.0
Pension expenses 1.5 (2.4) 1.4 Share-based payments expense (IFRS2) 7.2 7.7 12.1
The compensation allocated to members of the Board of Directors as directors’ fees totaled $1.44 million in 2020 ($1.57 million in 2019 and $1.65 million in 2018).
9) Shareholders’ equity and share-based payments
9.1) Shareholders’ equity
Number of TOTAL shares and rights attached
As of December 31, 2020, the share capital of TOTAL SE amounts to €6,632,810,062.50, divided into 2,653,124,025 shares, with a par value of €2.50. There is only one category of shares. The shares may be held in either registered or bearer form.
The authorized share capital amounts to 3,668,371,962 shares as of December 31, 2020 compared to 3,593,399,547 shares as of December 31, 2019 and 3,669,077,772 shares as of December 31, 2018.
A double voting right is assigned to shares that are fully-paid and held in registered form in the name of the same shareholder for at least two years, with due consideration for the total portion of the share capital represented. A double voting right is also assigned, in the event of an increase in share capital by incorporation of reserves, profits or premiums, to registered shares granted for free to a shareholder due to shares already held that are entitled to this right.
Pursuant to the Company's bylaws (Statutes), no shareholder may cast a vote at a Shareholders' Meeting, either by himself or through an agent, representing more than 10% of the total voting rights for the Company's shares. This limit applies to the aggregated amount of voting rights held directly, indirectly or through voting proxies. However, in the case of double voting rights, this limit may be extended up to 20% of the total voting rights for the Company's shares.
These restrictions no longer apply if any individual or entity, acting alone or in concert, acquires at least two-thirds of the total share capital of the Company, directly or indirectly, following a public tender offer for all of the Company’s shares.

Share cancellation
The Board of Directors, pursuant to the authorization granted by the Extraordinary Shareholders’ Meeting on May 26, 2017, in the thirteenth resolution to reduce, on one or more occasions, the Company’s share capital by cancelling shares, in accordance with the provisions of Articles L. 225-209 and L. 225-213 of the French Commercial Code, has proceeded with the following cancellation of TOTAL shares:
Fiscal year
Board of Directors’
decision date
Number of shares bought back and
cancelled
Buybacks for the purpose of Percentage of the share
capital cancelled(c)
cancellation of the dilution(a)
the shareholder return policy(b)
2020 n/a(d)
2019 December 11,
2019
65,109,435 shares bought back between October 29, 2018 and September 9, 2019
34,860,133 shares issued as payment for the 1st, 2nd and 3rd 2018 interim dividends
30,249,302 shares
2.44%
2018 December 12,
2018
44,590,699 shares bought back between February 9 and October 11, 2018
28,445,840 shares issued as payment for the 2nd and 3rd interim dividends as well as for the final 2017 dividends
16,144,859 shares
1.66%
(a) Cancellation of the dilution for the shares issued, without discount, for the scrip dividend. (b) Within the framework of the $5 billion share buyback program over the 2018-2020 period. On March 23, 2020, in the context of the COVID-19
pandemic and the fall in the oil prices, TOTAL SE announced the suspension of its buyback programme. The Company had previously announced a $2 billion share buyback target for 2020 in a 60 $/b environment and has bought back $554 million.
(c) Percentage of the share capital that the cancelled shares represented on the operations’ date. (d) TOTAL SE did not cancel any shares in the fiscal year 2020.

Variation of the number of shares composing the share capital
As of December 31, 2017 (a) 2,528,989,616
2018 Capital increase reserved for employees 9,354,889
Capital increase as payment of the scrip dividend (second, third interim and final 2017 dividend, as well as the first 2018 interim dividend)
47,229,037
Exercise of TOTAL share subscription options 2,096,571
Capital increase in consideration for the acquisition of Maersk Olie og Gas A/S
97,522,593
Capital reduction by cancellation of treasury shares (44,590,699)
As of December 31, 2018 (b) 2,640,602,007
2019 Capital increase reserved for employees 10,047,337
Capital increase as payment of the scrip dividend (second and third 2018 interim dividend)
16,076,936
Exercise of TOTAL share subscription options 264,230
Capital reduction by cancellation of treasury shares (65,109,435)
As of December 31, 2019 (c) 2,601,881,075
Deferred contribution pursuant to the 2015 capital increase reserved for employees
18,879
2020 Capital increase reserved for employees 13,160,383
Capital increase as payment of the scrip dividend (final 2019 dividend)
38,063,688
As of December 31, 2020 (d) 2,653,124,025
(a) Including 8,376,756 treasury shares deducted from consolidated shareholders’ equity.
(b) Including 32,473,281 treasury shares deducted from consolidated shareholders’ equity. (c) Including 15,474,234 treasury shares deducted from consolidated shareholders’ equity. (d) Including 24,392,703 treasury shares deducted from consolidated shareholders’ equity. Capital increase reserved for Group employees
The Extraordinary General Meeting (“EGM”) of May 29, 2020, in its twentieth resolution, granted the authority to the Board of Directors to carry out, a capital increase, in one or more occasions within a maximum period of twenty-six months, reserved to members (employees and retirees) of a company or group savings plan of the Company (“ESOP”).
In fiscal year 2020, the Board of Directors of September 16, 2020, by virtue of the twentieth resolution above-mentioned, decided to proceed with a capital increase reserved for Group employees and retirees within the limit of 18 million shares with immediate dividend rights. On this occasion, the Board of Directors has granted all powers to the Chairman and Chief Executive Officer to determine the opening and closing dates of the subscription period and the subscription price. This capital increase is expected to be completed after the General Meeting of May 28, 2021.

During the fiscal years 2018, 2019 and 2020, the Company completed the following ESOP, which terms are set out below:
Fiscal year 2020 2019 2018
Date of the ESOP June 11, 2020 June 6, 2019 May 3, 2018
By virtue of 18th resolution of the EGM of June 1, 2018
18th resolution of the EGM of June 1, 2018
23rd resolution of the EGM of May 24, 2016
Subscriptions
Number of shares subscribed 12,952,925 9,845,111 9,174,817
Subscription price 26.20 euros 40.10 euros 37.20 euros
Free shares
Number of shares granted 207,458 202,226 180,072
By virtue of 19th resolution of the EGM of June 1, 2018
19th resolution of the EGM of June 1, 2018
24th resolution of the EGM of June 24, 2016
Deferred contribution
Number of shares granted 1,380 5,932 6,784
Number of beneficiaries 276 1,187 1,360
End of the acquisition period June 11, 2025 June 6, 2024 May 3, 2023
Treasury shares
Accounting policies
Treasury shares held by TOTAL SE or by its subsidiaries are deducted from consolidated shareholders' equity. Gains or losses on sales of treasury shares are excluded from the determination of net income and are recognized in shareholders’ equity.
TOTAL shares held by TOTAL SE
As of December 31, 2020 2019 2018
Number of treasury shares held by TOTAL SE 24,392,703 15,474,234 32,473,281
Percentage of share capital 0.92% 0.59% 1.23%
Of which shares acquired with the intention to cancel them 23,284,409 11,051,144 27,360,278
Of which shares allocated to TOTAL share performance plans for Group employees 1,055,446 4,357,324 5,044,817
Of which shares intended to be allocated to new share performance or purchase options plans 52,848 65,766 68,186

Paid-in surplus
In accordance with French law, the paid-in surplus corresponds to premiums related to shares issuances, contributions or mergers of the parent company which can be capitalized or used to offset losses if the legal reserve has reached its minimum required level. The amount of the paid-in surplus may also be distributed subject to taxation except when it qualifies as a refund of shareholder contributions.
As of December 31, 2020, paid-in surplus relating to TOTAL SE amounted to €36,722 million (€35,415 million as of December 31, 2019 and €37,276 million as of December 31, 2018).
Reserves
Under French law, 5% of net income must be transferred to the legal reserve until the legal reserve reaches 10% of the nominal value of the share capital. This reserve cannot be distributed to the shareholders other than upon liquidation but can be used to offset losses.
If wholly distributed, the unrestricted reserves of the parent company would be taxed for an approximate amount of $492 million as of December 31, 2020 ($575 million as of December 31, 2019 and $607 million as of December 31, 2018) due to additional corporation tax applied on regulatory reserves so that they become distributable.
Earnings per share
Accounting policies
Earnings per share is calculated by dividing net income (Group share) by the weighted-average number of common shares outstanding during the period, excluding TOTAL shares held by TOTAL SE (Treasury shares) which are deducted from consolidated shareholders’ equity.
Diluted earnings per share is calculated by dividing net income (Group share) by the fully-diluted weighted-average number of common shares outstanding during the period. Treasury shares held by the parent company, TOTAL SE are deducted from consolidated shareholders’ equity. These shares are not considered outstanding for purposes of this calculation which also takes into account the dilutive effect of share subscription or purchase options plans, share grants and capital increases with a subscription period closing after the end of the fiscal year.
The weighted-average number of fully-diluted shares is calculated in accordance with the treasury stock method provided for by IAS 33. The proceeds, which would be recovered in the event of an exercise of rights related to dilutive instruments, are presumed to be a share buyback at the average market price over the period. The number of shares thereby obtained leads to a reduction in the total number of shares that would result from the exercise of rights.
In compliance with IAS 33, earnings per share and diluted earnings per share are based on the net income after deduction of the remuneration due to the holders of deeply subordinated notes.

The variation of both weighted-average number of shares and weighted-average number of diluted shares respectively, as of December 31, respectively used in the calculation of earnings per share and fully-diluted earnings per share is detailed as follows:
2020 2019 2018
Number of shares as of January 1, 2,601,881,075 2,640,602,007 2,528,989,616
TOTAL shares held by TOTAL SE or by its subsidiaries and deducted from shareholders' equity
(15,474,234) (32,473,281) (8,376,756)
Evolution of the number of shares during the financial year (pro-rated)
Exercise of TOTAL share subscription options - 157,153 1,351,465
Final grant of TOTAL performance shares 2,154,064 2,140,576 2,039,729
Capital increase reserved for employees 7,689,476 5,860,947 6,236,593
Capital increase as payment of the scrip dividend 17,445,857 12,360,894 26,352,572
Capital increase in consideration for the acquisition of Maersk Olie og Gas A/S
- - 81,268,828
Buyback of TOTAL treasury shares including: (11,669,489) (27,026,481) (30,405,112)
Shares repurchased in during the fiscal year to cancel the dilution caused by the scrip dividend payment and within the framework of the share buyback program
(10,666,710) (24,818,443) (30,102,242)
Shares repurchased in during the fiscal year to cover for the performance share plans
(1,002,779) (2,208,038) (302,870)
Weighted-average number of shares 2,602,026,749 2,601,621,815 2,607,456,934
Dilutive effect
Grant of TOTAL share subscription or purchase options - 33,636 296,830
Grant of TOTAL performance shares - 14,593,030 13,794,896
Capital increase reserved for employees(a) - 1,759,407 2,167,784
Weighted-average number of diluted shares as of December 31,(b) 2,602,026,749 2,618,007,888 2,623,716,444
(a) Including the capital increase in consideration to the deferred contribution pursuant to the capital increase reserved for employees.
(b) In 2020, the effect generated by the grant of TOTAL performance shares and by the capital increase reserved for employees (19,007,836 shares) is anti-dilutive. In accordance with IAS 33, the weighted-average number of diluted shares is therefore equal to the weighted-average number of shares. Earnings per share in euros
The earnings per share in euros, converted from the earnings per share in dollars, by using the average exchange rate euro/dollar, is €(2.54) per share for 2020 closing (€3.75 for 2019 closing). The fully-diluted earnings per share calculated by using the same method is €(2.54) per share for 2020 closing (€3.72 for 2019 closing).
Dividend
The Board of Directors, on February 8, 2021, after approving the financial statements for the 2020 fiscal year, decided to propose to the Shareholders’ Meeting on May 28, 2021 the payment of a €2.64 dividend per share for the fiscal year 2020. Subject to the Shareholders’ decision, considering the first three interim dividends already decided by the Board of Directors, the final dividend for the fiscal year 2020 will be €0.66 per share.
2020 Dividend First interim Second interim Third interim Final
Amount €0.66 €0.66 €0.66 €0.66
Set date May 4, 2020 July 29, 2020 October 29, 2020 May 28, 2021
Ex-dividend date September 25, 2020 January 4, 2021 March 25, 2021 June 24, 2021
Payment date October 2, 2020 January 11, 2021 April 1, 2021 July 1, 2021

Issuances of perpetual subordinated notes
On 25 January 2021, TOTAL SE issued two tranches of perpetual subordinated notes in euro:
- Deeply subordinated notes 1.625% perpetual maturity callable after 7 years (€1,500 million); and
- Deeply subordinated notes 2.125% perpetual maturity callable after 12 years (€1,500 million).
In 2020, TOTAL SE issued perpetual subordinated notes in euro:
- Deeply subordinated notes 2.000% perpetual maturity callable after 10 years (€1,000 million).
In parallel with this issuance, TOTAL SE partially tendered perpetual 2.250% subordinated notes issued in 2015 (of which the outstanding nominal amount before the operation was €1,000 million following a first partial tender executed in April 2019) for an amount of €703 million. Following this transaction, the new nominal amount of the tendered tranche was €297 million and the Group’s total outstanding amount of perpetual subordinated notes rose temporarily by €297 million. This residual amount was fully repaid in February 2021 on its first call date.
In 2019, TOTAL SE issued perpetual subordinated notes in euro:
- Deeply subordinated notes 1.750% perpetual maturity callable after 5 years (€1,500 million).
In parallel with this issuance, TOTAL SE partially tendered perpetual 2.250% subordinated notes issued in 2015 for an amount of €1,500 million. Following this transaction, the new nominal amount of the tranche tendered was €1,000 million and the Group’s total outstanding amount of perpetual subordinated notes remained unchanged. In 2018 and 2017, TOTAL SE did not issue any perpetual subordinated notes. In 2016, TOTAL SE issued three tranches of perpetual subordinated notes in euro:
- Deeply subordinated notes 3.875% perpetual maturity callable after 6 years (€1,750 million);
- Deeply subordinated notes 2.708% perpetual maturity callable after 6.6 years (€1,000 million); and
- Deeply subordinated notes 3.369% perpetual maturity callable after 10 years (€1,500 million).
In 2015, TOTAL SE issued two tranches of perpetual subordinated notes in euro:
- Deeply subordinated notes 2.250% perpetual maturity callable after 6 years (€2,500 million); and
- Deeply subordinated notes 2.625% perpetual maturity callable after 10 years (€2,500 million).
Based on their characteristics (mainly no mandatory repayment and no obligation to pay a coupon except under certain circumstances specified into the documentation of the notes) and in compliance with IAS 32 standard – Financial instruments - Presentation, these notes were recorded in equity. As of December 31, 2020, the amount of perpetual deeply subordinated notes booked in the Group shareholders' equity is $10,667 million. The coupons attributable to the holders of these securities are recognized as a deduction from the Group shareholders' equity for an amount of $308 million for fiscal year 2020 closing. The tax saving due to these coupons is booked in the statement of income.

Other comprehensive income
Detail of other comprehensive income showing both items potentially reclassifiable and those not potentially reclassifiable from equity to net income is presented in the table below:
For the year ended December 31, (M$) 2020 2019 2018
Actuarial gains and losses (212) (192) (12)
Change in fair value of investments in equity instruments 533 142 -
Tax effect 65 53 13
Currency translation adjustment generated by the parent company 7,541 (1,533) (4,022)
Sub-total items not potentially reclassifiable to profit & loss 7,927 (1,530) (4,021)
Currency translation adjustment (4,645) 740 1,113
- Unrealized gain/(loss) of the period (4,607) 800 1,238
- Less gain/(loss) included in net income 38 60 125
Cash flow hedge (313) (599) 25
- Unrealized gain/(loss) of the period (175) (552) (94)
- Less gain/(loss) included in net income 138 47 (119)
Variation of foreign currency basis spread 28 1 (80)
- Unrealized gain/(loss) of the period (22) (57) (80)
- Less gain/(loss) included in net income (50) (58) -
Share of other comprehensive income of equity affiliates, net amount (1,831) 408 (540)
- Unrealized gain/(loss) of the period (1,841) 421 (495)
- Less gain/(loss) included in net income (10) 13 45
Other (8) (3) (5)
Tax effect 72 202 14
Sub-total items potentially reclassifiable to profit & loss (6,697) 749 527
Total other comprehensive income, net amount 1,230 (781) (3,494)

The currency translation adjustment by currency is detailed in the following table: As of December 31, 2020 Pound Other(M$) Total Euro sterling Ruble currenciesCurrency translation adjustment generated by the parent company 7,541 7,541 - - -Currency translation adjustment (4,645) (4,668) 115 (12) (80)Currency translation adjustment of equity affiliates (1,657) (851) (11) (886) 91Total currency translation adjustment recognized in comprehensive income 1,239 2,022 104 (898) 11 As of December 31, 2019 Pound Other(M$) Total Euro sterling Ruble currenciesCurrency translation adjustment generated by the parent company (1,533) (1,533) - - -Currency translation adjustment 740 636 138 7 (41)Currency translation adjustment of equity affiliates 607 149 (7) 530 (65)Total currency translation adjustment recognized in comprehensive income (186) (748) 131 537 (106) As of December 31, 2018 Pound Other(M$) Total Euro sterling Ruble currenciesCurrency translation adjustment generated by the parent company (4,022) (4,022) - - -Currency translation adjustment 1,113 1,883 (431) (10) (329)Currency translation adjustment of equity affiliates (564) 343 14 (805) (116)Total currency translation adjustment recognized in comprehensive income (3,473) (1,796) (417) (815) (445)

Tax effects relating to each component of other comprehensive income are as follows:
For the year ended December 31, 2020 2019 2018
(M$) Pre-tax amount
Tax effect
Net amount
Pre-tax amount
Tax effect
Net amount
Pre-tax amount
Tax effect
Net amount
Actuarial gains and losses (212) 47 (165) (192) 55 (137) (12) 13 1
Change in fair value of investments in equity instruments 533 18 551 142 (2) 140 - - - Currency translation adjustment generated by the parent company 7,541 - 7,541 (1,533) - (1,533) (4,022) - (4,022)
Sub-total items not potentially reclassifiable to profit & loss 7,862 65 7,927 (1,583) 53 (1,530) (4,034) 13 (4,021)
Currency translation adjustment (4,645) - (4,645) 740 - 740 1,113 - 1,113
Cash flow hedge (313) 79 (234) (599) 202 (397) 25 (6) 19
Variation of foreign currency basis spread 28 (7) 21 1 - 1 (80) 20 (60)
Share of other comprehensive income of equity affiliates, net amount (1,831) - (1,831) 408 - 408 (540) - (540)
Other (8) - (8) (3) - (3) (5) - (5)
Sub-total items potentially reclassifiable to profit & loss (6,769) 72 (6,697) 547 202 749 513 14 527
Total other comprehensive income 1,093 137 1,230 (1,036) 255 (781) (3,521) 27 (3,494) Non-controlling interests
As of December 31, 2020, no subsidiary has non-controlling interests that would be material to the Group financial statements.

9.2) Share-based payments
Accounting policies
TOTAL SE may grant employees share subscription or purchase options plans, restricted share plans and offer its employees the opportunity to subscribe to reserved capital increases. These employee benefits are recognized as expenses with a corresponding credit to shareholders’ equity.
The expense is equal to the fair value of the instruments granted. The expense is recognized on a straight-line basis over the period in which the advantages are acquired.
The fair value of the options is calculated using the Black-Scholes model at the grant date.
For restricted share plans, the fair value is calculated using the market price at the grant date after deducting the expected distribution rate during the vesting period.
The global cost is reduced to take into account the non-transferability over a 2-year holding period of the shares that could be awarded. The number of allocated equity instruments can be revised during the vesting period in cases of non-compliance with performance conditions, with the exception of those related to the market, or according to the rate of turnover of the beneficiaries.
The cost of employee-reserved capital increases is immediately expensed.
The cost of the capital increase reserved for employees consists of the cost related to the discount on the shares subscribed using the classic and/or the leveraged schemes, the cost of the free shares and the opportunity gain for the shares subscribed using the leveraged scheme, as applicable. This opportunity gain corresponds to the benefit of subscribing to the leveraged offer, rather than reproducing the same economic profile through the purchase of options in the market for individual investors.
The global cost is reduced to take into account the non-transferability of the shares that are subscribed by the employees over a period of five years.
A. TOTAL share subscription or purchase option plans
Weighted
average
2010 Plan 2011 Plan Total exercise
priceDate of the shareholders' meeting
5/21/2010 5/21/2010
Award date (a) 9/14/2010 9/14/2011
Strike price 38.20 € 33.00 €
Expiry date 9/14/2018 9/14/2019
Number of options Existing options as of January 1, 2018
1,950,372 490,568 2,440,940 37.15 €
Granted - - - -
Cancelled (b) (79,139) - (79,139) 38.20 €
Exercised (1,871,233) (225,338) (2,096,571) 37.64 €Existing options as of January 1, 2019
- 265,230 265,230 33.00 €
Granted - - - -
Cancelled (b) - (1,000) (1,000) 33.00 €
Exercised - (264,230) (264,230) 33.00 €Existing options as of January 1, 2020
- - - n/a
(a) The grant date is the date of the Board meeting awarding the share subscription or purchase options.
(b) Out of the options canceled in 2018 and 2019, (i) 79,139 options that were not exercised expired on September 14, 2018 due to expiry of 2010 Plan and (ii) 1,000 options that were not exercised expired on September 14, 2019 due to expiry of 2011 Plan.
Options granted as part of 2010 and 2011 Plans were exercisable, subject to a presence condition, after a 2-year period from the date of the Board meeting awarding the options and have expired eight years after this date. The underlying

shares were not transferable during four years from the date of grant. The transfer restriction period did not apply to employees of non-French subsidiaries as of the date of the grant, who may have transferred the underlying shares after a 2-year period from the date of the grant.
The Combined General Meeting of May 29, 2020 authorised the Board of Directors, for a period of thirty-eight months to grant share subscription or purchase options. Since the 2011 Plan, the Board of Directors has not decided any new grant of TOTAL share subscription or purchase option plan. All the option plans have expired.
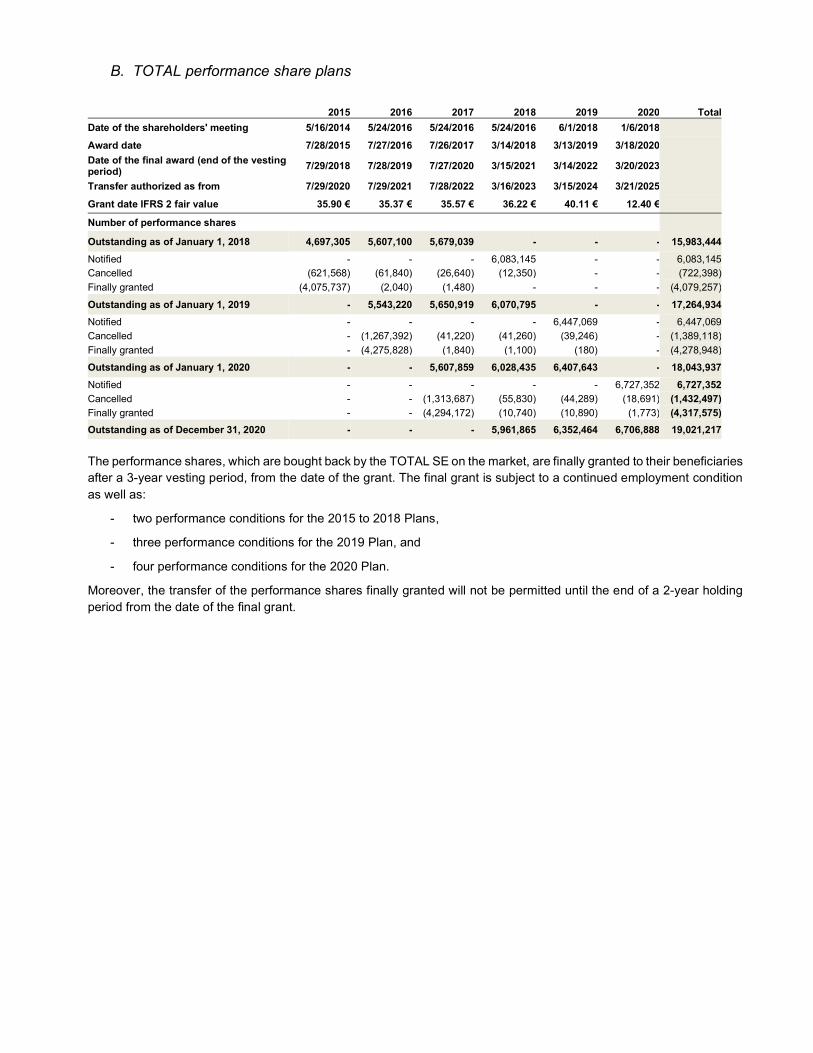
B. TOTAL performance share plans
2015 2016 2017 2018 2019 2020 Total
Date of the shareholders' meeting 5/16/2014 5/24/2016 5/24/2016 5/24/2016 6/1/2018 1/6/2018
Award date 7/28/2015 7/27/2016 7/26/2017 3/14/2018 3/13/2019 3/18/2020
Date of the final award (end of the vesting period)
7/29/2018 7/28/2019 7/27/2020 3/15/2021 3/14/2022 3/20/2023
Transfer authorized as from 7/29/2020 7/29/2021 7/28/2022 3/16/2023 3/15/2024 3/21/2025
Grant date IFRS 2 fair value 35.90 € 35.37 € 35.57 € 36.22 € 40.11 € 12.40 €
Number of performance shares
Outstanding as of January 1, 2018 4,697,305 5,607,100 5,679,039 - - - 15,983,444
Notified - - - 6,083,145 - - 6,083,145Cancelled (621,568) (61,840) (26,640) (12,350) - - (722,398)
Finally granted (4,075,737) (2,040) (1,480) - - - (4,079,257)
Outstanding as of January 1, 2019 - 5,543,220 5,650,919 6,070,795 - - 17,264,934
Notified - - - - 6,447,069 - 6,447,069
Cancelled - (1,267,392) (41,220) (41,260) (39,246) - (1,389,118)
Finally granted - (4,275,828) (1,840) (1,100) (180) - (4,278,948)
Outstanding as of January 1, 2020 - - 5,607,859 6,028,435 6,407,643 - 18,043,937
Notified - - - - - 6,727,352 6,727,352
Cancelled - - (1,313,687) (55,830) (44,289) (18,691) (1,432,497)
Finally granted - - (4,294,172) (10,740) (10,890) (1,773) (4,317,575)
Outstanding as of December 31, 2020 - - - 5,961,865 6,352,464 6,706,888 19,021,217
The performance shares, which are bought back by the TOTAL SE on the market, are finally granted to their beneficiaries after a 3-year vesting period, from the date of the grant. The final grant is subject to a continued employment condition as well as:
- two performance conditions for the 2015 to 2018 Plans,
- three performance conditions for the 2019 Plan, and
- four performance conditions for the 2020 Plan.
Moreover, the transfer of the performance shares finally granted will not be permitted until the end of a 2-year holding period from the date of the final grant.

2020 Plan
On March 18, 2020, the Board of Directors granted performance shares to certain employees and executive directors of the Company or Group companies, subject to the fulfilment of the continued employment condition and four performance conditions.
The presence condition applies to all shares.
The performance conditions apply differently depending of the capacity of the beneficiaries. If all shares granted to senior executives are subject to performance conditions, the grant of the first 150 shares to non-senior executive are not subject to the performance condition abovementioned, which will, nonetheless, apply to any shares granted above this threshold.
The definitive number of granted shares will be based on the TSR (Total Shareholder Return), the annual variation of the net cash flow by share in dollars, the pre-dividend organic cash breakeven, as well as the change in the greenhouse gas emissions (GHG) on operated oil & gas facilities, for fiscal years 2020, 2021 and 2022, applied as follows:
for 1/4 of the shares, the Company will be ranked against its peers (ExxonMobil, Royal Dutch Shell, BP and Chevron) each year during the three vesting years (2020, 2021 and 2022) based on the TSR criterion of the last quarter of the year in question, the dividend being considered reinvested based on the closing price on the ex-dividend date.
for 1/4 of the shares, the Company will be ranked each year against its peers (ExxonMobil, Royal Dutch Shell, BP and Chevron) during the three vesting years (2020, 2021 and 2022) using the annual variation in net cash flow per share criterion expressed in dollar.
Based on the ranking, a grant rate will be determined for each year for these first two criteria:
Ranking Grant rate
1st place 180%
2nd place 130%
3rd place 80%
4th and 5th places 0%
for 1/4 of the shares, the pre-dividend organic cash breakeven criterion will be assessed during the three vesting years (2020, 2021 and 2022) as follows. The pre-dividend organic cash breakeven is defined as the Brent price for which the operating cash flow before working capital changes covers the organic investments. The ability of the Group to resist to the variations of the Brent barrel price is measured by this parameter.
- the maximum grant rate will be reached if the breakeven is less than or equal to $30/b, - the grant rate will be zero if the breakeven is greater than or equal to $40/b, - the interpolations will be linear between these two points of reference.
for 1/4 of the shares, the change in the GHG on operated oil & gas facilities will be assessed each year as
regard to the achievement of the target to reduce the GHG emissions (Scope 1 and Scope 2) set for fiscal years 2020, 2021 and 2022 and corresponding to 43 Mt CO2e for 2020, 42.4 Mt CO2e for 2021 and 41.8 Mt CO2e for 2022.
- the maximum grant rate will be reached if the GHG emissions (Scope 1 and Scope 2) on operated oil & gas facilities target has been achieved,
- the grant rate will be zero if the GHG emissions of the year considered are 1 Mt CO2e above the set target,
- the interpolations will be linear between these points of reference. A grant rate will be determined for each year.
For each of the four criteria, the average of the three grant rates obtained (for each of the three fiscal years for which the performance conditions are assessed) will be rounded to the nearest 0.1 whole percent (0.05% being rounded to 0.1%) and capped at 100%.

Each criterion will have a weight of 1/4 in the definitive grant rate. The definitive grant rate will also be rounded to the nearest 0.1 whole percent (0.05% being rounded to 0.1%). The number of shares definitively granted, after confirmation of the performance conditions, will be rounded up to the nearest whole number of shares in case of a fractional share.
C. SunPower Plans
During fiscal year 2020, SunPower had one stock incentive plan: the SunPower Corporation 2015 Omnibus Incentive Plan ("2015 Plan"). The 2015 Plan was adopted by SunPower’s Board of Directors in February 2015 and approved by shareholders in June 2015. The 2015 Plan allows for the grant of options, as well as grant of stock appreciation rights, restricted stock grants, restricted stock units and other equity rights. The 2015 Plan also allows for tax withholding obligations related to stock option exercises or restricted stock awards to be satisfied through the retention of shares otherwise released upon vesting.
The 2015 Plan includes an automatic annual increase mechanism equal to the lower of three percent of the outstanding shares of all classes of SunPower’s common stock measured on the last day of the immediately preceding fiscal year, 6 million shares, or such other number of shares as determined by SunPower’s Board of Directors. In fiscal year 2015, SunPower’s Board of Directors voted to reduce the stock incentive plan’s automatic increase from 3% to 2% for 2016. As of December 31, 2020, approximately 18.0 million shares were available for grant under the 2015 Plan.
Incentive stock options, nonstatutory stock options, and stock appreciation rights may be granted at no less than the fair value of the common stock on the date of grant. The options and rights become exercisable when and as determined by SunPower’s Board of Directors, although these terms generally do not exceed ten years for stock options. SunPower has not granted stock options since fiscal year 2008. All previously granted stock options have been exercised or expired and accordingly no options remain outstanding. Under the 2015 Plan, the restricted stock grants and restricted stock units typically vest in equal installments annually over three or four years.
The majority of shares issued are net of the minimum statutory withholding requirements that SunPower pays on behalf of its employees. During fiscal years 2020, 2019, and 2018, SunPower withheld 1.3 million, 0.8 million, and 0.7 million shares, respectively, to satisfy the employees' tax obligations. SunPower pays such withholding requirements in cash to the appropriate taxing authorities. Shares withheld are treated as common stock repurchases for accounting and disclosure purposes and reduce the number of shares outstanding upon vesting.
There were no options outstanding and exercisable as of December 31, 2020. The intrinsic value of the options exercised in fiscal years 2020, 2019, and 2018, were zero. There were no stock options granted in fiscal years 2020, 2019, and 2018.

The following table summarizes SunPower’s restricted stock activities:
Restricted Stock Awards and Units
Shares (in thousands) Weighted-Average Grant Date Fair Value Per Share (in
dollars)(a)
Outstanding as of January 1st, 2018 7,293 11.83
Granted 4,449 7.77 Vested (b) (2,266) 14.45 Forfeited (1,816) 10.10
Outstanding as of January 1st, 2019 7,660 9.11
Granted 5,430 6.82 Vested (b) (2,460) 9.65 Forfeited (1,304) 8.28
Outstanding as of January 1st, 2020 9,326 7.75
Granted 12,797 11.10
Vested (b) (3,596) 9.88
Forfeited (11,360) 7.07
Outstanding as of December 31, 2020 7,167 13.75 (a) SunPower estimates the fair value of the restricted stock unit awards as the stock price on the grant date. (b) Restricted stock awards and units vested include shares withheld on behalf of employees to satisfy the minimum statutory tax withholding
requirements.

D. Share-based payment expense
Share-based payment expense before tax was broken down as follows:
As of December 31, (M$) 2020 2019 2018
Total restricted shares plans 176 180 264
SunPower plans 26 26 21
Capital increase reserved for employees 12 27 30
Total 214 233 315 The main assumptions used for the valuation of the cost of the capital increase reserved for employees in 2020 were the following:
For the year ended December 31, 2020
Date of the Board of Directors meeting that decided the issue September 18, 2019
Reference price (€) (a) 32.75
Subscription price (€) (b) 26.20
Number of shares issued (in millions) (c) 13.16
Risk free interest rate over five years (%) (0.392)
Employees loan financing rate (%) (d) 4.73
Non transferability cost (% of the reference's share price) 19.27 (a) Average of the closing prices of the TOTAL shares over the twenty trading sessions preceding April 29th, 2020, being the date of the Chairman and CEO’s decision setting the price and opening date of the subscription period.
(b) Reference price, reduced by a 20% discount and rounded off to the highest tenth of a euro.
(c) Including the free shares issued.
(d) Average of 5 year consumer’s credit rates.
10) Payroll, staff and employee benefits obligations
10.1) Employee benefits obligations
Accounting policies
In accordance with the laws and practices of each country, the Group participates in employee benefit plans offering retirement, death and disability, healthcare and special termination benefits. These plans provide benefits based on various factors such as length of service, salaries, and contributions made to the governmental bodies responsible for the payment of benefits.
These plans can be either defined contribution or defined benefit pension plans and may be entirely or partially funded with investments made in various non-Group instruments such as mutual funds, insurance contracts, and other instruments.
For defined contribution plans, expenses correspond to the contributions paid.
Defined benefit obligations are determined according to the Projected Unit Method. Actuarial gains and losses may arise from differences between actuarial valuation and projected commitments (depending on new calculations or assumptions) and between projected and actual return of plan assets. Such gains and losses are recognized in the statement of comprehensive income, with no possibility to subsequently recycle them to the income statement.
The past service cost is recorded immediately in the statement of income, whether vested or unvested.
The net periodic pension cost is recognized under “Other operating expenses”.

Liabilities for employee benefits obligations consist of the following:
As of December 31, (M$) 2020 2019 2018
Pension benefits liabilities 3,111 2,651 2,545
Other benefits liabilities 700 742 669
Restructuring reserves (early retirement plans) 106 108 149
Total 3,917 3,501 3,363
Net liabilities relating to assets held for sale 1 - - Description of plans and risk management
The Group operates, for the benefit of its current and former employees, both defined benefit plans and defined contribution plans.
The Group recognized a charge of $135 million for defined contribution plans in 2020 ($133 million in 2019 and $130 million in 2018).
The Group’s main defined benefit pension plans are located in France, the United Kingdom, the United States, Belgium and Germany. Their main characteristics, depending on the country-specific regulatory environment, are the following:
the benefits are usually based on the final salary and seniority;
they are usually funded (pension fund or insurer);
they are usually closed to new employees who benefit from defined contribution pension plans;
they are paid in annuity or in lump sum.
The pension benefits include also termination indemnities and early retirement benefits. The other benefits are employer contributions to post-employment medical care.
In order to manage the inherent risks, the Group has implemented a dedicated governance framework to ensure the supervision of the different plans. These governance rules provide for:
the Group’s representation in key governance bodies or monitoring committees;
the principles of the funding policy;
the general investment policy, including for most plans:
- the establishment of a monitoring committee to define and follow the investment strategy and performance, - the principles in respect of investment allocation are respected;
a procedure to approve the establishment of new plans or the amendment of existing plans;
the principles of administration, communication and reporting.

Change in benefit obligations and plan assets
The fair value of the defined benefit obligation and plan assets in the Consolidated Financial Statements is detailed as follows:
As of December 31, Pension benefits Other benefits
(M$) 2020 2019 2018 2020 2019 2018
Change in benefit obligation
Benefit obligation at beginning of year 12,285 11,501 12,872 742 669 705
Current service cost 244 214 236 19 13 14
Interest cost 217 295 296 11 17 17
Past service cost - 4 (1) - - (2)
Settlements (10) (20) (141) (3) (9) -
Plan participants' contributions 10 7 8 - - -
Benefits paid (702) (667) (902) (27) (26) (28)
Actuarial losses / (gains) 818 847 (372) (89) 87 (29)
Foreign currency translation and other 729 104 (495) 47 (9) (8)
Benefit obligation at year-end 13,591 12,285 11,501 700 742 669
Of which plans entirely or partially funded 12,830 11,584 10,864 - - -
Of which plans not funded 761 701 637 700 742 669
Change in fair value of plan assets
Fair value of plan assets at beginning of year (9,769) (9,145) (10,205) - - -
Interest income (191) (255) (261) - - -
Actuarial losses / (gains) (517) (745) 424 - - -
Settlements 2 11 129 - - -
Plan participants' contributions (10) (7) (8) - - -
Employer contributions (229) (172) (417) - - -
Benefits paid 622 573 778 - - -
Foreign currency translation and other (488) (29) 415 - - -
Fair value of plan assets at year-end (10,580) (9,769) (9,145) - - -
Unfunded status 3,011 2,516 2,356 700 742 669
Asset ceiling 36 34 28 - - -
Net recognized amount 3,047 2,550 2,384 700 742 669
Pension benefits and other benefits liabilities 3,111 2,651 2,545 700 742 669
Other non-current assets (65) (101) (161) - - -
Net benefit liabilities relating to assets held for sale 1 - - - - -
As of December 31, 2020, the contribution from the main geographical areas for the net pension liability in the balance sheet is: 69% for the Euro area, 15% for the United Kingdom and 12% for the United States.

The amounts recognized in the consolidated income statement and the consolidated statement of comprehensive income for defined benefit plans are detailed as follows:
For the year ended December 31, Pension benefits Other benefits
(M$) 2020 2019 2018 2020 2019 2018
Current service cost 244 214 236 19 13 14
Past service cost - 4 (1) - - (2)
Settlements (7) (10) (12) (3) (9) -
Net interest cost 25 39 35 11 17 17
Benefit amounts recognized on Profit & Loss 262 247 258 27 21 29
- Actuarial (Gains) / Losses
* Effect of changes in demographic assumptions (12) (166) (1) (3) (2) (21)
* Effect of changes in financial assumptions 773 1,071 (354) (1) 89 (3)
* Effect of experience adjustments 57 (59) (17) (85) - (5)
* Actual return on plan assets (517) (745) 424 - - -
- Effect of asset ceiling - 3 (11) - - -
Benefit amounts recognized on Equity 301 104 41 (89) 87 (29)
Total benefit amounts recognized on comprehensive income 563 351 299 (62) 108 -
Expected future cash outflows
The average duration of accrued benefits is approximately 14 years for defined pension benefits and 17 years for other benefits. The Group expects to pay contributions of $228 million in respect of funded pension plans in 2021.
Estimated future benefits either financed from plan assets or directly paid by the employer are detailed as follows:
Estimated future payments
(M$) Pension benefits Other benefits
2021 874 37
2022 502 29
2023 426 28
2024 405 26
2025 392 26
2026-2030 2,243 130 Type of assets
Asset allocation Pension benefits As of December 31, 2020 2019 2018Equity securities 25% 25% 24%Debt securities 45% 46% 47%Monetary 2% 1% 1%Annuity contracts 20% 20% 20%Real estate 8% 8% 8% Investments on equity and debt markets are quoted on active markets.

Main actuarial assumptions and sensitivity analysis Assumptions used to determine benefits obligations Pension benefits Other benefits
As of December 31, 2020 2019 2018 2020 2019 2018
Discount rate (weighted average for all regions) 1.28% 1.84% 2.68% 1.41% 1.71% 2.56%
Of which Euro zone 0.52% 0.73% 1.72% 0.68% 0.94% 1.87%
Of which United States 2.50% 3.25% 4.00% 2.50% 3.25% 4.00%
Of which United Kingdom 1.50% 2.25% 3.00% - - -
Inflation rate (weighted average for all regions) 2.06% 2.20% 2.44% - - -
Of which Euro zone 1.24% 1.21% 1.50% - - -
Of which United States 2.50% 2.50% 2.50% - - -
Of which United Kingdom 3.00% 3.25% 3.50% - - -
The discount rate retained is determined by reference to the high quality rates for AA-rated corporate bonds for a duration equivalent to that of the obligations. It derives from a benchmark per monetary area of different market data at the closing date.
Sensitivity to inflation in respect of defined benefit pension plans is not material in the United States.
A 0.5% increase or decrease in discount rates – all other things being equal - would have the following approximate impact on the benefit obligation:
(M$) 0.5% Increase 0.5% Decrease
Benefit obligation as of December 31, 2020 (908) 1,001 A 0.5% increase or decrease in inflation rates – all other things being equal - would have the following approximate impact on the benefit obligation:
(M$) 0.5% Increase 0.5% Decrease
Benefit obligation as of December 31, 2020 613 (568)
10.2) Payroll and staff
For the year ended December 31, 2020 2019 2018 Personnel expenses (M$) Wages and salaries (including social charges) 8,908 8,922 9,099 Group employees at December 31, France (DROM COM includ.) • Management 14,016 13,848 13,484 • Other 21,886 22,831 22,929 International • Management 17,102 16,821 16,856 • Other 52,472 54,276 51,191 Total 105,476 107,776 104,460
The number of employees includes only employees of fully consolidated subsidiaries.
2019 and 2018 data were restated to show number of employees of France including DROM COM (overseas departments, regions and communities).

11) Income taxes
Accounting policies
Income taxes disclosed in the statement of income include current tax expenses (or income) and deferred tax expenses (or income).
Current tax expenses (or income) are the estimated amount of the tax due for the taxable income of the period.
Deferred income taxes are recorded based on the temporary differences between the carrying amounts of assets and liabilities recorded in the balance sheet and their tax bases, and on carry-forwards of unused tax losses and other tax credits.
Deferred tax assets and liabilities are measured using the tax rates that have been enacted or substantially enacted at the balance sheet date. The tax rates used depend on the timing of reversals of temporary differences, tax losses and other tax credits. The effect of a change in tax rate is recognized either in the Consolidated Statement of Income or in shareholders’ equity depending on the item it relates to.
Deferred tax resulting from temporary differences between the carrying amounts of equity-method investments and their tax bases are recognized. The deferred tax calculation is based on the expected future tax effect (dividend distribution rate or tax rate on capital gains).
Income taxes are detailed as follows: For the year ended December 31, (M$) 2020 2019 2018
Current income taxes (2,450) (5,469) (6,971)
Deferred income taxes 2,132 (403) 455
Total income taxes (318) (5,872) (6,516) Before netting deferred tax assets and liabilities by fiscal entity, the components of deferred tax balances are as follows:
As of December 31, (M$) 2020 2019 2018Net operating losses and tax carry forwards 5,106 3,752 3,779Employee benefits 1,004 970 995Other temporary non-deductible provisions 9,068 8,660 8,409Differences in depreciations (14,641) (16,029) (15,469)Other temporary tax deductions (3,847) (2,995) (2,541)Net deferred tax liability (3,310) (5,642) (4,827) The reserves of TOTAL subsidiaries that would be taxable if distributed but for which no distribution is planned, and for which no deferred tax liability has therefore been recognized, totaled $10,155 million as of December 31, 2020.
Deferred tax assets not recognized as of December 31, 2020 amount to $4,631 million as their future recovery was not regarded as probable given the expected results of the entities. Particularly in the Exploration & Production segment, when the affiliate or the field concerned is in its exploration phase, the net operating losses created during this phase will be useable only if a final investment and development decision is made. Accordingly, the time limit for the utilization of those net operating losses is not known.
Deferred tax assets not recognized relate notably to Canada for an amount of $1,371 million, to France for an amount of $1,197 million and to United States for an amount of $307 million.

After netting deferred tax assets and liabilities by fiscal entity, deferred taxes are presented on the balance sheet as follows:
As of December 31, (M$) 2020 2019 2018Deferred tax assets 7,016 6,216 6,663Deferred tax liabilities (10,326) (11,858) (11,490)Net amount (3,310) (5,642) (4,827) The net deferred tax variation in the balance sheet is analyzed as follows:
As of December 31, (M$) 2020 2019 2018Opening balance (5,642) (4,827) (5,622)Deferred tax on income 2,132 (403) 455Deferred tax on shareholders' equity (a) 137 255 27Changes in scope of consolidation and others 76 (695) 151Currency translation adjustment (13) 28 162Closing balance (3,310) (5,642) (4,827)
(a) This amount includes mainly deferred taxes on actuarial gains and losses, current income taxes and deferred taxes for changes in fair value of investments inequity instruments, as well as deferred taxes related to the cash flow hedge (see Note 9 to the Consolidated Financial Statements).
Reconciliation between provision for income taxes and pre-tax income: For the year ended December 31, (M$) 2020 2019 2018
Consolidated net income (7,336) 11,438 11,550
Income taxes 318 5,872 6,516
Pre-tax income (7,018) 17,310 18,066
French statutory tax rate 32.02% 34.43% 34.43%
Theoretical tax charge 2,247 (5,960) (6,220)Difference between French and foreign income tax rates (1,109) (2,007) (3,058)
Tax effect of equity in income (loss) of affiliates 145 1,173 1,080
Permanent differences 665 1,422 1,740
Adjustments on prior years income taxes (31) 12 (40)
Adjustments on deferred tax related to changes in tax rates (204) (270) 2
Variation of deferred tax assets not recognized (2,031) (242) (20)
Income taxes in the statement of income (318) (5,872) (6,516) The French statutory tax rate includes the standard corporate tax rate (31.0%), additional and exceptional applicable
taxes that bring the overall tax rate to 32.02% in 2020 (versus 34.43% in 2019 and 34.43% in 2018).
Permanent differences are mainly due to impairment of goodwill and to dividends from non-consolidated companies as well as the specific taxation rules applicable to certain activities.

Net operating losses and carried forward tax credits
Deferred tax assets related to carried forward tax credits on net operating losses expire in the following years:
As of December 31, (M$) 2020 2019 2018
2019 90
2020 71 70
2021 69 48 38
2022 26 27 32
2023(a) 7 19 1,423
2024(b) 2 1,310
2025 and after 1,643
Unlimited 3,359 2,277 2,126
Total 5,106 3,752 3,779
(a) 2023 and after for 2018. (b) 2024 and after for 2019.
As of December 31, 2020 the schedule of deferred tax assets related to carried forward tax credits on net operating losses for the main countries is as follows:
As of December 31, 2020 Tax
(M$) Australia United States Canada France
United Kingdom
2021
2022
2023
2024 17
2025 and after 420 1,084
Unlimited 1,140 536 900 184
Total 1,140 956 1,101 900 184

12) Provisions and other non-current liabilities
12.1) Provisions and other non-current liabilities
Accounting policies
A provision is recognized when the Group has a present obligation, legal or constructive, as a result of a past event for which it is probable that an outflow of resources will be required and when a reliable estimate can be made regarding the amount of the obligation. The amount of the liability corresponds to the best possible estimate.
Provisions and non-current liabilities are comprised of liabilities for which the amount and the timing are uncertain. They arise from environmental risks, legal and tax risks, litigation and other risks.
As of December 31, (M$) 2020 2019 2018 Litigations and accrued penalty claims 320 386 736 Provisions for environmental contingencies 960 742 862 Asset retirement obligations 15,368 14,492 14,286 Other non-current provisions 2,868 2,927 3,144
of which restructuring activities 293 135 134
of which financial risks related to non-consolidated and equity consolidated affiliates 134 130 100
of which contingency reserve on solar panels warranties (SunPower) 82 140 173
Other non-current liabilities 1,409 2,066 2,404 Total 20,925 20,613 21,432
In 2020, litigation reserves amount to $320 million of which $208 million in the Exploration & Production, notably in Brazil and Angola.
In 2019, litigation reserves amounted to $386 million of which $286 million in the Exploration & Production, notably in Brazil, Angola and USA.
In 2018, litigation reserves amounted to $736 million of which $510 million was in the Exploration & Production, notably in Angola, Nigeria and Brazil.
Other non-current liabilities mainly include debts whose maturity is more than one year related to fixed assets acquisitions.
Changes in provisions and other non-current liabilities
Changes in provisions and other non-current liabilities are as follows: As of Allowances Reversals Currency Other As of
(M$) January,
1st translation
adjustment December,
31
2020 20,613 1,756 (1,378) 452 (518) 20,925
of which asset retirement obligations 607 (519)
of which provisions for environmental contingencies 217 (93)
of which provisions for restructuring of activities 271 (135)
2019 21,432 1,248 (2,414) (33) 380 20,613
of which asset retirement obligations 639 (460)
of which provisions for environmental contingencies 30 (92)
of which provisions for restructuring of activities 60 (122)
2018 15,986 2,416 (1,378) (519) 4,927 21,432
of which asset retirement obligations 530 (320)
of which provisions for environmental contingencies 33 (111)
of which provisions for restructuring of activities 149 (106)

Asset retirement obligations
Accounting policies
Asset retirement obligations, which result from a legal or constructive obligation, are recognized based on a reasonable estimate in the period in which the obligation arises.
The associated asset retirement costs are capitalized as part of the carrying amount of the underlying asset and depreciated over the useful life of this asset.
An entity is required to measure changes in the liability for an asset retirement obligation due to the passage of time (accretion) by applying a risk-free discount rate to the amount of the liability. Given the long-term nature of expenditures related to our asset retirement obligations, the rate is determined by reference to the rates of high quality AA-rated corporate bonds on the USD area for a long-term horizon. The increase of the provision due to the passage of time is recognized as “Other financial expense”.
The discount rate used for the valuation of asset retirement obligation is 3% in 2020 and 4.5% in 2019 and 2018 (the expenses are estimated at current currency values with an inflation rate of 1.5% in 2020, and of 2% in 2019 and 2018).
A decrease of 0.5% of this rate would increase the asset retirement obligation by $1,442 million, with a corresponding impact in tangible assets, and with a negative impact of approximately $78 million on the following years net income. Conversely, an increase of 0.5% would have a nearly symmetrical impact compared to the effect of the decrease of 0.5%.
Changes in the asset retirement obligation are as follows: Spending on Currency
As of Revision in New existing translation As of
(M$) January 1, Accretion estimates obligations obligations adjustment Other December 31,
2020 14,492 607 526 87 (519) 284 (109) 15,368
2019 14,286 639 (601) 567 (460) 47 14 14,492
2018 12,240 530 (458) 811 (320) (364) 1,847 14,286
12.2) Other risks and contingent liabilities
TOTAL is not currently aware of any exceptional event, dispute, risks or contingent liabilities that could have a material impact on the assets and liabilities, results, financial position or operations of the Group.

13) Off balance sheet commitments and lease contracts
13.1) Off balance sheet commitments and contractual obligations
Maturity and installment plants
As of December 31, 2020 Total Less than 1 Between 1 More than 5
(M$) year and 5 years yearsNon-current debt obligations net of hedging instruments (Note 15) 48,705 - 22,745 25,960Current portion of non-current debt obligations net of hedging instruments (Note 15) 4,674 4,674 - -Lease obligations (Note 13.2) 8,943 1,207 3,178 4,558Asset retirement obligations (Note 12) 15,368 463 1,840 13,065
Contractual obligations recorded in the balance sheet 77,690 6,344 27,763 43,583Lease obligations for low value assets, short term contracts or not yet commenced
(Note 13.2) 1,745 704 626 415Purchase obligations 143,177 11,719 39,126 92,332
Contractual obligations not recorded in the balance sheet 144,922 12,423 39,752 92,747
Total of contractual obligations 222,612 18,767 67,515 136,330 Guarantees given to customs authorities 2,312 2,189 60 63Guarantees given on borrowings 14,164 746 3,660 9,758Indemnities related to sales of businesses 333 179 - 154Guarantees of current liabilities 147 68 56 23Guarantees to customers / suppliers 19,182 2,603 1,853 14,726Letters of credit 2,432 2,297 135 -Other operating commitments 23,879 3,224 3,002 17,653
Total of other commitments given 62,449 11,306 8,766 42,377
Mortgages and liens received 77 28 24 25Sales obligations 80,521 7,001 29,362 44,158Other commitments received 20,401 15,270 1,474 3,657
Total of commitments received 100,999 22,299 30,860 47,840
Of which commitments given relating to joint ventures 34,920 644 7,288 26,988
Of which commitments given relating to associates 51,795 999 8,664 42,132
Maturity and installment plants
As of December 31, 2019 Total
Less than 1 Between 1 More than 5
(M$) year and 5 years yearsNon-current debt obligations net of hedging instruments (Note 15) 40,931 - 19,888 21,043Current portion of non-current debt obligations net of hedging instruments (Note 15) 5,331 5,331 - -Lease obligations (Note 13.2) 7,465 1,202 2,883 3,380Asset retirement obligations (Note 12) 14,492 617 3,153 10,722Contractual obligations recorded in the balance sheet 68,219 7,150 25,924 35,145Lease obligations for low value assets, short term contracts or not yet commenced
(Note 13.2) 2,077 536 879 662Purchase obligations 147,516 10,763 38,189 98,564Contractual obligations not recorded in the balance sheet 149,593 11,299 39,068 99,226Total of contractual obligations 217,812 18,449 64,992 134,371 Guarantees given to customs authorities 2,012 1,876 17 119Guarantees given on borrowings 14,510 306 7,372 6,832Guarantees related to sales of businesses 331 163 16 152Guarantees of current liabilities 172 79 60 33Guarantees to customers / suppliers 12,318 1,435 2,169 8,714Letters of credit 2,786 2,768 18 -Other operating commitments 22,055 3,240 1,202 17,613Total of other commitments given 54,184 9,867 10,854 33,463 Assets received as collateral (security interests) 85 23 37 25Sales obligations 93,441 7,135 31,330 54,976Other commitments received 22,358 16,845 1,705 3,808Total of commitments received 115,884 24,003 33,072 58,809Of which commitments given relating to joint ventures 39,055 461 11,822 26,772

Of which commitments given relating to associates 31,465 913 8,381 22,171
Maturity and installments As of December 31, 2018
Total Less than 1 Between 1 More than 5
(M$) year and 5 years yearsNon-current debt obligations net of hedging instruments (Note 15) 37,784 - 19,072 18,712Current portion of non-current debt obligations net of hedging instruments (Note 15) 5,027 5,027 - -Finance lease obligations (Note 13.2) 1,878 213 468 1,197Asset retirement obligations (Note 12) 14,286 844 3,388 10,054Contractual obligations recorded in the balance sheet 58,975 6,084 22,928 29,963Operating lease obligations (Note 13.2) 9,130 1,644 3,691 3,795Purchase obligations 121,119 9,708 30,652 80,759Contractual obligations not recorded in the balance sheet 130,249 11,352 34,343 84,554Total of contractual obligations 189,224 17,436 57,271 114,517 Guarantees given to customs authorities 2,043 1,904 12 127Guarantees given on borrowings 18,680 169 68 18,443Indemnities related to sales of businesses 334 165 10 159Guarantees of current liabilities 222 83 74 65Guarantees to customers / suppliers 8,463 1,222 847 6,394Letters of credit 3,515 3,164 160 191Other operating commitments 29,416 2,085 1,046 26,285Total of other commitments given 62,673 8,792 2,217 51,664 Mortgages and liens received 84 23 33 28Sales obligations 91,695 7,989 27,709 55,997Other commitments received 21,565 15,527 1,328 4,710Total of commitments received 113,344 23,539 29,070 60,735
Of which commitments given relating to joint ventures 42,768 162 4,425 38,181
Of which commitments given relating to associates 39,437 773 8,378 30,286
A. Contractual obligations
Debt obligations
“Non-current debt obligations” are included in the items “Non-current financial debt” and “Non-current financial assets” of the Consolidated Balance Sheet. It includes the non-current portion of swaps hedging bonds, and excludes non-current lease obligations of $7,736 million.
The current portion of non-current debt is included in the items “Current borrowings”, “Current financial assets” and “Other current financial liabilities” of the Consolidated Balance Sheet. It includes the current portion of swaps hedging bonds, and excludes the current portion of lease obligations of $1,207 million.
The information regarding contractual obligations linked to indebtedness is presented in Note 15 to the Consolidated Financial Statements.
Lease contracts
The information regarding leases is presented in Note 13.2 to the Consolidated Financial Statements.
Asset retirement obligations
This item represents the discounted present value of Exploration & Production and Integrated Gas, Renewables & Power asset retirement obligations, primarily asset removal costs at the completion date. The information regarding contractual obligations linked to asset retirement obligations is presented in Note 12 to the Consolidated Financial Statements.
Purchase obligations
Purchase obligations are obligations under contractual agreements to purchase goods or services, including capital projects. These obligations are enforceable and legally binding on the company and specify all significant terms, including the amount and the timing of the payments.
These obligations mainly include: unconditional hydrocarbon purchase contracts (except where an active, highly-liquid market exists and when the hydrocarbons are expected to be re-sold shortly after purchase) in the Integrated Gas, Renewables & Power segment, reservation of transport capacities in pipelines, unconditional exploration works and

development works in the Exploration & Production segment, and contracts for capital investment projects in the Refining & Chemicals segment.
B. Other commitments given
Guarantees given to customs authorities
These consist of guarantees given by the Group to customs authorities in order to guarantee the payments of taxes and excise duties on the importation of oil and gas products, mostly in France.
Guarantees given on borrowings
The Group guarantees bank debt and lease obligations of certain non-consolidated subsidiaries and equity affiliates. Maturity dates vary, and guarantees will terminate on payment and/or cancellation of the obligation. A payment would be triggered by failure of the guaranteed party to fulfill its obligation covered by the guarantee, and no assets are held as collateral for these guarantees. As of December 31, 2020, the maturities of these guarantees are up to 2053.
As of December 31, 2020, the guarantees provided by TOTAL SE in connection with the financing of the Ichthys LNG project amount to $4,912 million. As of December 31, 2019, the guarantees amounted to $4,937 million.
As of December 31, 2020, the guarantees provided by TOTAL SE in connection with the financing of the Yamal LNG project for an amount of $3,250 million by TOTAL SE. As of December 31, 2019, the guarantees amounted to $3,688 million.
As of December 31, 2020, TOTAL SE has confirmed guarantees for TOTAL Refining SAUDI ARABIA SAS shareholders' advances for an amount of $1,164 million. As of December 31, 2019, the guarantees amounted to $1,184 million.
As of December 31, 2020, the guarantee given in 2008 by TOTAL SE in connection with the financing of the Yemen LNG project amounts to $509 million as in 2019.
As of December 31, 2020, guarantees provided by TOTAL SE in connection with the financing of the Bayport Polymers LLC project, amount to $1,820 million as in 2019.
Indemnities related to sales of businesses
In the ordinary course of business, the Group executes contracts involving standard indemnities for the oil industry and indemnities specific to transactions such as sales of businesses. These indemnities might include claims against any of the following: environmental, tax and shareholder matters, intellectual property rights, governmental regulations and employment-related matters, and commercial contractual relationships. Performance under these indemnities would generally be triggered by a breach of terms of the contract or by a third party claim. The Group regularly evaluates the probability of having to incur costs associated with these indemnities.
Other guarantees given
Non-consolidated subsidiaries
The Group also guarantees the current liabilities of certain non-consolidated subsidiaries. Performance under these guarantees would be triggered by a financial default of the entity.
Operating agreements
As part of normal ongoing business operations and consistent with generally accepted industry practices, the Group enters into numerous agreements with other parties. These commitments are often entered into for commercial purposes, for regulatory purposes or for other operating agreements.
C. Commitments received
Sales obligations
These amounts represent binding obligations to sell goods, including in particular hydrocarbon sales contracts (except where an active, highly-liquid market exists and when the volumes are expected to be re-sold shortly after purchase).

13.2) Lease contracts
Accounting principles
A lease contract is a contract that grants lessee the right to use an identified asset for a specified period of time in exchange for consideration. At lease inception, an asset corresponding to right of use and a debt are recognized in the lessee’s balance sheet. Carrying value of right of use corresponds to present value of future lease payments plus any direct costs incurred for concluding the contract. Lease debt is recorded as a liability in the balance sheet under financial debts. Rights of use are depreciated over the useful lives applied by the Group.
Leases that are of short duration or that relate to low value assets are not recorded in the balance sheet, in accordance with the exemptions in the standard. They are presented as off-balance sheet commitments.
First-time application of IFRS 16 "Leases"
As part of the first application of IFRS 16 "Leases" as of January 1, 2019, the Group:
- applied the simplified retrospective transition method, accounting for the cumulative effect of the initial application of the standard at the date of first application, without restating the comparative periods;
- used the following simplification measures provided by the standard in the transitional provisions:
o exclusion of contracts that the Group had not previously identified as containing a lease under IAS 17 and IFRIC 4,
o exclusion of leases whose term ends within 12 months of the date of first application;
- recognized each lease component as a separate lease, separately from non-lease components of the lease (services);
- applied the two exemptions of the standard on short-term leases and leases of low-value assets.
The impact of the application of this standard as at January 1, 2019 is $5,698 million on fixed assets, $(5,505) million on net debt and $(193) million on other assets and liabilities. The weighted average incremental borrowing rate of 4.5% at transition date was determined on the basis of the initial duration of the contracts.
In 2019, the impact on fixed assets was broken down as follows:
(in M$)
Right of use of buildings 2,278
Right of use of machinery, plant and equipment (including transportation equipment) 2,632
Other right of use 788
Total 5,698
The Group mainly leases real estate, retail stations, ships, and other equipment (see Note 7 to the Consolidated Financial Statements).
A- Reconciliation between the operating lease commitments disclosed under IAS17 at December 31, 2018 and the additional lease liabilities (IFRS 16) recognized on the balance sheet at January 1, 2019
Reconciliation between the operating lease commitments disclosed under IAS 17 at December 31, 2018 and the additional lease liabilities (IFRS 16) recognized on the balance sheet at January 1, 2019
The reconciliation is as follows:

M$
January 1, 2019
Operating lease commitments at December 31, 2018 9,130 Commitments relating to IFRS 16 exemptions: (417) - Low value assets (90) - Short-term leases (327) Leases not yet commenced at January 1, 2019 (608) Commitments relating to service component of lease contracts (760) Commitments relating to leases of non identified assets or substitute assets (628) Variable lease payments (6) Other impacts 204 Impact of discounting (1,360) Additional lease liability on contracts previously accounted for as operating leases 5,555 Finance lease liability at December 31, 2018 1,878
Total lease liability at January 1, 2019 7,433
Other information required on lease debts, notably their maturity, is presented in Note 15 to the consolidated financial statements.
B- Future minimum lease payments on leases to which the Group is committed
The future minimum lease payments on leases to which the Group is committed are as follows:
For the year ended December 31, 2020
(M$) Exempted contractsLeases recorded in
balance sheet
2021 704 1,659
2022 252 1,366
2023 159 1,117
2024 118 1,022
2025 97 964
2026 and beyond 415 6,325
Total minimum payments 1,745 12,453
Less financial expenses (3,510)
Nominal value of contracts 8,943
Less current portion of lease contracts (1,207)
Non-current lease liabilities 7,736
For the year ended December 31, 2019
(M$) Exempted contractsLeases recorded in
balance sheet
2020 536 1,586
2021 360 1,228
2022 212 1,019
2023 162 835
2024 145 766
2025 and beyond 662 4,757
Total minimum payments 2,077 10,191
Less financial expenses (2,726)
Nominal value of contracts 7,465
Less current portion of lease contracts (1,202)
Non-current lease liabilities 6,263

For the year ended December 31, 2018
(M$) Operating leases Finance leases
2019 1,644 263
2020 1,282 183
2021 967 182
2022 772 179
2023 669 179
2024 and beyond 3,796 1,826
Total minimum payments 9,130 2,812
Less financial expenses (934)
Nominal value of contracts 1,878
Less current portion of finance lease contracts (213)
Non-current finance lease liabilities 1,665
For the year ended December 31, 2020, rental expense recorded in the income statement and incurred under short
term leases or low value assets leases and under variable lease payments is $600million and $162 million, respectively.
For the year ended December 31, 2019, rental expense recorded in the income statement and incurred under short
term leases or low value assets leases and under variable lease payments was $366 million and $132 million, respectively.
Rental expense recorded in the income statement and incurred under operating leases for the year ended December 31, 2018 was $1,304 million.
14) Financial assets and liabilities analysis per instrument class and strategy
The financial assets and liabilities disclosed in the balance sheet are detailed as follows: As of December 31, 2020 (M$)
Assets / (Liabilities)
Amortized cost Fair value through P&L Other Comprehensive
Income
Fair value of hedging
instruments Total
Fair value
Equity affiliates: loans 5,129 - - - 5,129 5,129 Other investments - 1,224 783 - 2,007 2,007 Non-current financial assets 1,019 541 - 3,221 4,781 4,781 Other non-current assets 2,745 - - - 2,745 2,745 Accounts receivable, net(b) 14,068 - - - 14,068 14,068 Other operating receivables 6,615 1,428 - - 8,043 8,043 Current financial assets 4,547 65 - 18 4,630 4,630 Cash and cash equivalents 31,268 - - - 31,268 31,268
Total financial assets 65,391 3,258 783 3,239 72,671 72,671
Total non-financial assets 193,461 -
Total assets 266,132 -
Non-current financial debt(a) (58,470) (118) - (1,615) (60,203) (66,210) Accounts payable(b) (23,574) - - - (23,574) (23,574) Other operating liabilities (10,635) (3,666) - (1) (14,302) (14,302) Current borrowings(a) (17,099) - - - (17,099) (17,121) Other current financial liabilities - (99) - (104) (203) (203)
Total financial liabilities (109,778) (3,883) - (1,720) (115,381) (121,410)
Total non-financial liabilities (150,751) -
Total liabilities (266,132) -
(a) The financial debt is adjusted to the hedged risks value (currency and interest rate) as part of hedge accounting (see Note 15 to the Consolidated
Financial Statements).
The impact of offsetting on accounts receivable, net is $(1,844) million and $1,844 million on accounts payable.

(b)
As of December 31, 2019 (M$)
Assets / (Liabilities)
Amortized cost Fair value through P&L Other Comprehensive
Income
Fair value of hedging
instruments Total Fair value
Equity affiliates: loans 3,999 - - - 3,999 3,999 Other investments - 1,272 506 - 1,778 1,778 Non-current financial assets 164 236 - 512 912 912 Other non-current assets 2,314 - - - 2,314 2,314 Accounts receivable, net(b) 18,488 - - - 18,488 18,488 Other operating receivables 6,713 4,791 - 2 11,506 11,506 Current financial assets 3,870 122 - - 3,992 3,992 Cash and cash equivalents 27,352 - - - 27,352 27,352
Total financial assets 62,900 6,421 506 514 70,341 70,341
Total non-financial assets 202,953 -
Total assets 273,294 -
Non-current financial debt(a) (46,035) (44) - (1,694) (47,773) (50,921) Accounts payable(b) (28,394) - - - (28,394) (28,394) Other operating liabilities (10,927) (5,333) - (2) (16,262) (16,262) Current borrowings(a) (14,819) - - - (14,819) (14,819) Other current financial liabilities - (63) - (424) (487) (487)
Total financial liabilities (100,175) (5,440) - (2,120) (107,735) (110,883)
Total non-financial liabilities (165,559) -
Total liabilities (273,294) -
(a) The financial debt is adjusted to the hedged risks value (currency and interest rate) as part of hedge accounting (see Note 15 to the Consolidated
Financial Statements).
(b) The impact of offsetting on accounts receivable, net is $(2,073) million and $2,073 million on accounts payable.
As of December 31, 2018 (M$)
Assets / (Liabilities)
Amortized cost Fair value through P&L Fair value through OCI - equity instruments
Fair value of instruments hedge
Total Fair value
Equity affiliates: loans 4,755 - - - 4,755 4,755 Other investments - 1,059 362 - 1,421 1,421 Non-current financial assets - 67 - 613 680 680 Other non-current assets 2,348 - - - 2,348 2,348 Accounts receivable, net(b) 17,270 - - - 17,270 17,270 Other operating receivables 6,994 2,731 - 8 9,733 9,733 Current financial assets 3,536 73 - 45 3,654 3,654 Cash and cash equivalents 27,907 - - - 27,907 27,907
Total financial assets 62,810 3,930 362 666 67,768 67,768
Total non-financial assets 188,994
Total assets 256,762
Non-current financial debt(a) (38,220) (29) - (1,880) (40,129) (41,281) Accounts payable(b) (26,134) - - - (26,134) (26,134) Other operating liabilities (9,854) (3,429) - (3) (13,286) (13,286) Current borrowings (13,306) - - - (13,306) (13,306) Other current financial liabilities - (183) - (295) (478) (478)
Total financial liabilities (87,514) (3,641) - (2,178) (93,333) (94,485)
Total non-financial liabilities (163,429)
Total liabilities (256,762)
(a) The financial debt is adjusted to the hedged risks value (currency and interest rate) as part of hedge accounting (see Note 15 to the Consolidated
Financial Statements).
(b) The impact of offsetting on accounts receivable, net is $(2,903) million and $2,903 million on accounts payable.

15) Financial structure and financial costs
15.1) Financial debt and derivative financial instruments
A) Non-current financial debt and derivative financial instruments
As of December 31, 2020 (M$)
(Assets) / Liabilities
Secured Unsecured Total
Non-current financial debt 7,849 52,354 60,203
of which hedging instruments of non-current financial debt (liabilities) - 1,615 1,615 Non-current financial assets (1,019) (3,762) (4,781)
of which hedging instruments of non-current financial debt (assets) - (3,221) (3,221)
Non-current net financial debt and related financial instruments 6,830 48,592 55,422
Variable rate bonds or bonds after fair value hedge - 16,553 16,553
Fixed rate bonds or bonds after cash flow hedge - 28,080 28,080
Other floating rate debt 40 3,944 3,984
Other fixed rate debt 73 438 511
Lease obligations 7,736 - 7,736
Non-current financial assets excluding derivative financial instruments (1,019) (432) (1,451)
Non-current instruments held for trading - 9 9
Non-current net financial debt and related financial instruments 6,830 48,592 55,422
As of December 31, 2019
(M$)
(Assets) / Liabilities
Secured Unsecured Total
Non-current financial debt 6,438 41,335 47,773
of which hedging instruments of non-current financial debt (liabilities) - 1,694 1,694 Non-current financial assets (164) (748) (912)
of which hedging instruments of non-current financial debt (assets) - (512) (512)
Non-current financial debt and related financial instruments 6,274 40,587 46,861
Variable rate bonds or bonds after fair value hedge - 19,340 19,340
Fixed rate bonds or bonds after cash flow hedge - 20,499 20,499
Other floating rate debt 72 618 690
Other fixed rate debt 103 322 425
Lease obligations 6,263 - 6,263
Non-current financial assets excluding derivative financial instruments (164) (169) (333)
Non-current instruments held for trading - (23) (23)
Non-current financial debt and related financial instruments 6,274 40,587 46,861

As of December 31, 2018
(M$)
(Assets) / Liabilities
Secured Unsecured Total
Non-current financial debt 1,870 38,259 40,129
of which hedging instruments of non-current financial debt (liabilities) - 1,880 1,880 Non-current financial assets - (680) (680)
of which hedging instruments of non-current financial debt (assets) - (613) (613)
Non-current financial debt and related financial instruments 1,870 37,579 39,449 - - -
Variable rate bonds or bonds after fair value hedge - 20,570 20,570
Fixed rate bonds or bonds after cash flow hedge - 15,672 15,672
Other floating rate debt 111 621 732
Other fixed rate debt 94 754 848
Financial lease obligations 1,665 - 1,665
Non-current instruments held for trading - (38) (38)
Non-current financial debt and related financial instruments 1,870 37,579 39,449

In April 2020, the Group put in place a new committed syndicated credit line with banking counterparties for an initial amount of USD 6,350 million and with a 12-month tenor (with the option to extend twice by a further 6 months at TOTAL’s hand). As of December 31 2020, the remaining balance of the committed syndicated credit line is USD 3,646 million and is included in line item “Other floating rate debt” (in “Non-current financial debt”).
The bonds, as of December 31, 2020, after taking into account currency and interest rates swaps fair value, is detailed as follows:
Currency of issuance
Amountafter
Amountafter
Amountafter
Range of current
maturities
Range of initial current ratebefore hedging
Bonds after fair value hedge or variable rate bonds hedging as of hedging as of hedging as of instruments
(M$) December 31, December 31, December 31, 2020 2019 2018
Bond USD 6,253 6,276 6,276 2021 - 2028 2.218% - 3.883%
Bond USD - 300 750
Bond CHF 410 410 204 2026 - 2029 0.176% - 0.298%
Bond NZD - 164 252
Bond AUD 377 378 699 2021 - 2025 4.000% - 4.250%
Bond EUR 8,666 9,675 10,212 2021 - 2044 0.250% - 3.125%
Bond EUR - 1,641 1,644
Bond CAD - 92 93
Bond GBP 1,522 2,035 1,536 2022 - 2031 1.405% - 2.250%
Bond GBP - - 472
Bond HKD 129 128 207 2025 2.920%
Current portion (less than one year) (2,699) (3,661) (3,679)
Principal financing entities(a) 14,658 17,438 18,666
TOTAL SE(b) 1,200 1,203 1,203 2022 0.500%
Other consolidated subsidiaries 695 699 701
Total variable rate bonds or bonds after fair value hedge 16,553 19,340 20,570
Bonds after cash flow hedge or fixed rate bonds
Currency of issuance
Amountafter
Amountafter
Amountafter
Range of current
maturities
Range of initial current ratebefore hedging
(M$) hedging as of hedging as of hedging as of instruments
December 31, December 31, December 31, 2020 2019 2018
Bond EUR 15,259 10,246 9,268 2024 - 2044 0.696% - 5.125 %
Bond USD 11,524 8,565 5,040 2021 - 2060 2.829% - 4.250%
Bond HKD 208 202 187 2026 3.088%
Bond CHF 1,134 1,079 1,035 2024 - 2027 0.510% - 1.010%
Bond GBP 998 982 326 2024 - 2026 1.250% - 1.660%
Bond AUD 9 5 - 2025 4.000%
Current portion (less than one year) (1,500) (1,250) (946)
Principal financing entities(a) 27,632 19,829 14,910
Other consolidated subsidiaries 448 670 762
Total bonds after cash flow hedge or fixed rate bonds 28,080 20,499 15,672
(a) All debt securities issued through the following subsidiaries are fully and unconditionally guaranteed by TOTAL SE as to payment of principal, premium, if any, interest and any other amounts due:
- TOTAL CAPITAL is a wholly and directly owned subsidiary of TOTAL SE (except for one share held by each director). It acts as a financing vehicle for the Group. The repayment of its financial debt (capital, premium and interest) is fully and unconditionally guaranteed by TOTAL SE.
- TOTAL CAPITAL CANADA Ltd. is a wholly and directly owned subsidiary of TOTAL SE. It acts as a financing vehicle for the activities of the Group in Canada. The repayment of its financial debt (capital, premium and interest) is fully and unconditionally guaranteed by TOTAL SE.
- TOTAL CAPITAL INTERNATIONAL is a wholly and directly owned subsidiary of TOTAL SE (except for one share held by each director). It acts as a financing vehicle for the Group. The repayment of its financial debt (capital, premium and interest) is fully and unconditionally guaranteed by TOTAL SE.
(b) Debt financing of $1.2 billion through a structure combining the issue of cash-settled convertible bonds with the purchase of cash-settled call options to hedge TOTAL's exposure to the exercise of the conversion rights under the bonds.

Loan repayment schedule (excluding current portion)
As of December 31, 2020 Non-current
of which hedginginstruments of
non-current financial debt Non-current
of which hedginginstruments of
non-current financial debt
Non-current financial debt and related
financial(M$) financial debt (liabilities) financial assets (assets) instruments %2022 9,932 142 (142) (58) 9,790 18%
2023 5,988 59 (268) (218) 5,720 10%
2024 6,340 115 (395) (277) 5,945 11%
2025 4,535 150 (260) (212) 4,275 8%
2026 and beyond 33,408 1,149 (3,716) (2,456) 29,692 53%
Total 60,203 1,615 (4,781) (3,221) 55,422 100%
As of December 31, 2019 Non-current
of which hedginginstruments of
non-current financial debt Non-current
of which hedginginstruments of
non-current financial debt
Non-current financial debt and related
financial(M$) financial debt (liabilities) financial assets (assets) instruments %2021 5,716 204 (101) (9) 5,615 12%
2022 6,226 433 (148) (121) 6,078 13%
2023 5,230 106 (67) (18) 5,163 11%
2024 5,885 139 (87) (83) 5,798 12%
2025 and beyond 24,716 812 (509) (281) 24,207 52%
Total 47,773 1,694 (912) (512) 46,861 100%
As of December 31, 2018 Non-current
of which hedginginstruments of
non-current financial debt Non-current
of which hedginginstruments of
non-current financial debt
Non-current financial debt and related
financial(M$) financial debt (liabilities) financial assets (assets) instruments %2020 5,442 386 (10) - 5,432 14%
2021 4,042 251 (76) (57) 3,966 10%
2022 5,262 448 (104) (104) 5,158 13%
2023 5,020 93 (37) - 4,983 13%
2024 and beyond 20,363 702 (453) (452) 19,910 50%
Total 40,129 1,880 (680) (613) 39,449 100%
Analysis by currency and interest rate
These analyses take into account interest rate and foreign currency swaps to hedge non-current financial debt.
As of December 31, (M$) 2020 % 2019 % 2018 %U.S. Dollar 48,609 88% 43,276 92% 38,120 97%Euro 3,144 6% 2,639 6% 1,103 3%Norwegian krone 72 0% 81 0% 27 0%Other currencies 3,597 6% 865 2% 199 0%Total 55,422 100% 46,861 100% 39,449 100%
As of December 31, (M$) 2020 % 2019 % 2018 %Fixed rate 34,870 63% 26,985 58% 18,139 46%Floating rate 20,552 37% 19,876 42% 21,310 54%Total 55,422 100% 46,861 100% 39,449 100%
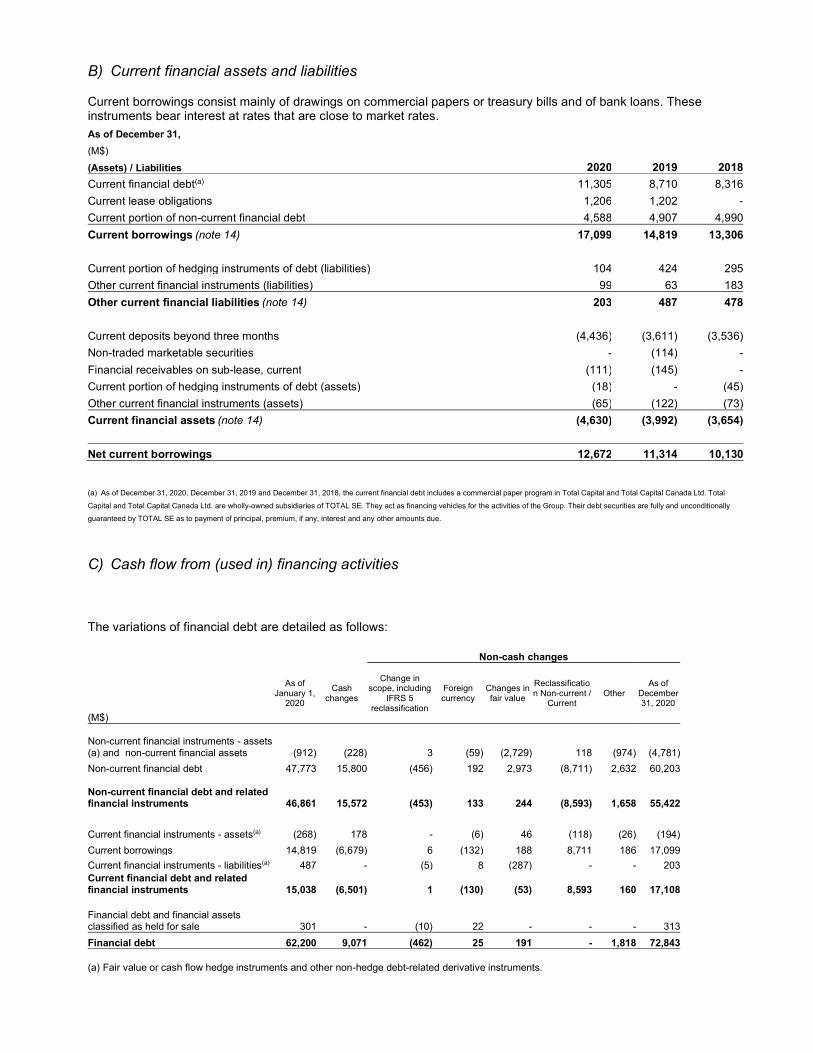
B) Current financial assets and liabilities
Current borrowings consist mainly of drawings on commercial papers or treasury bills and of bank loans. These instruments bear interest at rates that are close to market rates.
As of December 31,
(M$) (Assets) / Liabilities 2020 2019 2018
Current financial debt(a) 11,305 8,710 8,316
Current lease obligations 1,206 1,202 -
Current portion of non-current financial debt 4,588 4,907 4,990
Current borrowings.(note 14) 17,099 14,819 13,306
Current portion of hedging instruments of debt (liabilities) 104 424 295
Other current financial instruments (liabilities) 99 63 183
Other current financial liabilities.(note 14) 203 487 478
Current deposits beyond three months (4,436) (3,611) (3,536)
Non-traded marketable securities - (114) -
Financial receivables on sub-lease, current (111) (145) -
Current portion of hedging instruments of debt (assets) (18) - (45)
Other current financial instruments (assets) (65) (122) (73)
Current financial assets.(note 14) (4,630) (3,992) (3,654)
Net current borrowings 12,672 11,314 10,130
(a) As of December 31, 2020, December 31, 2019 and December 31, 2018, the current financial debt includes a commercial paper program in Total Capital and Total Capital Canada Ltd. Total
Capital and Total Capital Canada Ltd. are wholly-owned subsidiaries of TOTAL SE. They act as financing vehicles for the activities of the Group. Their debt securities are fully and unconditionally
guaranteed by TOTAL SE as to payment of principal, premium, if any, interest and any other amounts due.
C) Cash flow from (used in) financing activities
The variations of financial debt are detailed as follows:
Non-cash changes
(M$)
As of January 1,
2020
Cash changes
Change in scope, including
IFRS 5 reclassification
Foreign currency
Changes in fair value
Reclassification Non-current /
Current Other
As of December 31, 2020
Non-current financial instruments - assets (a) and non-current financial assets (912) (228) 3 (59) (2,729) 118 (974) (4,781)
Non-current financial debt 47,773 15,800 (456) 192 2,973 (8,711) 2,632 60,203
Non-current financial debt and related financial instruments 46,861 15,572 (453) 133 244 (8,593) 1,658 55,422
Current financial instruments - assets(a) (268) 178 - (6) 46 (118) (26) (194)
Current borrowings 14,819 (6,679) 6 (132) 188 8,711 186 17,099
Current financial instruments - liabilities(a) 487 - (5) 8 (287) - - 203Current financial debt and related financial instruments 15,038 (6,501) 1 (130) (53) 8,593 160 17,108 Financial debt and financial assets classified as held for sale 301 - (10) 22 - - - 313
Financial debt 62,200 9,071 (462) 25 191 - 1,818 72,843 (a) Fair value or cash flow hedge instruments and other non-hedge debt-related derivative instruments.

Non-cash changes
(M$)
As of January 1,
2019
Cash changes
Change in scope, including
IFRS 5 reclassification
First application IFRS 16
Foreign currency
Changes in fair value
Reclassification Non-current / Current
Other As of
December 31, 2019
Non-current financial instruments - assets (a) and non-current financial assets (680) 21 12 (50) 4 (71) 144 (292) (912)
Non-current financial debt 40,129 8,110 (731) 4,805 (48) 484 (6,661) 1,685 47,773
Non-current financial debt and related financial instruments 39,449 8,131 (719) 4,755 (44) 413 (6,517) 1,393 46,861
Current financial instruments - assets(a) (118) 125 - - 2 (32) (144) (101) (268)
Current borrowings 13,306 (5,954) (35) 750 184 (26) 6,661 (67) 14,819
Current financial instruments - liabilities(a) 478 - - - (6) 15 - - 487Current financial debt and related financial instruments 13,666 (5,829) (35) 750 180 (43) 6,517 (168) 15,038 Financial debt and financial assets classified as held for sale - - 301 - - - - - 301
Financial debt 53,115 2,302 (453) 5,505 136 370 - 1,225 62,200 (a) Fair value or cash flow hedge instruments and other non-hedge debt-related derivative instruments.
Non-cash changes
(M$)
As of January 1, 2018
Cash changes
Change in scope, including
IFRS 5 reclassification
Foreign currency
Changes in fair value
Reclassification Non-current /
Current Other
As of December 31, 2018
Non-current financial instruments - assets(a) (679) - (72) 12 59 - - (680)
Non-current financial debt 41,340 649 4,708 (59) 62 (6,260) (311) 40,129
Non-current financial debt and related financial instruments 40,661 649 4,636 (47) 121 (6,260) (311) 39,449
Current financial instruments - assets(a) (423) - - 10 295 - - (118)
Current borrowings 11,096 (3,990) 230 270 (514) 6,260 (46) 13,306
Current financial instruments - liabilities(a) 245 - 67 (11) 177 - - 478Current financial debt and related financial instruments 10,918 (3,990) 297 269 (42) 6,260 (46) 13,666
Financial debt classified as held for sale - - - - - - - -
Financial debt 51,579 (3,341) 4,933 222 79 - (357) 53,115 (a) Fair value or cash flow hedge instruments and other non-hedge debt-related derivative instruments.
Monetary changes in non-current financial debt are detailed as follows: For the year ended December 31, (M$) 2020 2019 2018
Issuance of non-current debt 16,075 8,668 3,938
Repayment of non-current debt (275) (538) (3,289)
Net amount 15,800 8,131 649

D) Cash and cash equivalents
Accounting policies
Cash and cash equivalents are comprised of cash on hand and highly liquid short-term investments that are easily convertible into known amounts of cash and are subject to insignificant risks of changes in value.
Investments with maturity greater than three months and less than twelve months are shown under “Current financial assets”.
Changes in current financial assets and liabilities are included in the financing activities section of the Consolidated Statement of Cash Flows.
Cash and cash equivalents are detailed as follows: For the year ended December 31, (M$) 2020 2019 2018
Cash 14,518 16,456 15,186
Cash equivalents 16,750 10,896 12,721
Total 31,268 27,352 27,907 Cash equivalents are mainly composed of deposits less than three months deposited in government institutions or deposit banks selected in accordance with strict criteria.
As of December 31, 2020, the cash and cash equivalents include $2,140 millions subject to restrictions, notably due to regulatory framework or to the fact they are owned by affiliates located in countries with exchange controls.
E) Net-debt-to-capital ratio
For its internal and external communication needs, the Group calculates a debt ratio by dividing its net financial debt excluding leases by its capital.
The ratio is calculated as follows: Net debt excluding leases / (Equity + Net debt excluding leases)
As of December 31, (M$) (Assets) / Liabilities 2020 2019 2018Current borrowings(a) 15,893 13,617 13,093 Other current financial liabilities 203 487 478 Current financial assets(a) (4,519) (3,847) (3,654)Net financial assets and liabilities held for sale or exchange 313 301 (15)Non-current financial debt(a) 52,467 41,510 38,464 Non-current financial assets(a) (3,762) (748) (680)Cash and cash equivalents (31,268) (27,352) (27,907)Net financial debt 29,327 23,968 19,779 Shareholders' equity - Group share 103,702 116,778 115,640 Non-controlling interests 2,383 2,527 2,474 Shareholders' equity 106,085 119,305 118,114 Net-debt-to-capital ratio excluding leases 21.7% 16.7% 14.3%(a) excluding leases receivables & leases debts.

15.2) Fair value of financial instruments (excluding commodity contracts)
Accounting policies
The Group uses derivative instruments to manage its exposure to risks of changes in interest rates, foreign exchange rates and commodity prices. These financial instruments are accounted for in accordance with IFRS 9, changes in fair value of derivative instruments are recognized in the statement of income or in other comprehensive income and are recognized in the balance sheet in the accounts corresponding to their nature, according to the risk management strategy. The derivative instruments used by the Group are the following:
- Cash management
Financial instruments used for cash management purposes are part of a hedging strategy of currency and interest rate risks within global limits set by the Group and are considered to be held for trading. Changes in fair value are systematically recorded in the statement of income. The balance sheet value of those instruments is included in “Current financial assets” or “Other current financial liabilities”.
- Long-term financing
When an external long-term financing is set up, specifically to finance subsidiaries, and when this financing involves currency and interest rate derivatives, these instruments are qualified as:
1) Fair value hedge of the interest rate and currency risks on the external debt financing the loans to subsidiaries. Changes in fair value of derivatives are recognized in the statement of income, as are changes in fair value of underlying financial debts and loans to subsidiaries.
The fair value of those hedging instruments of long-term financing is included in assets under “Non-current financial assets” or in liabilities under “Non-current financial debt “for the non-current portion. The current portion (less than one year) is accounted for in “Current financial assets” or “Other current financial liabilities”.
In case of the anticipated termination of derivative instruments accounted for as fair value hedges, the amount paid or received is recognized in the statement of income and:
If this termination is due to an early cancellation of the hedged items, the adjustment previously recorded as revaluation of those hedged items is also recognized in the statement of income;
If the hedged items remain in the balance sheet, the adjustment previously recorded as a revaluation of those hedged items is spread over the remaining life of those items.
In case of a change in the strategy of the hedge (fair value hedge to cash flow hedge), if the components of the initial aggregated exposure had already been designated in a hedging relationship (FVH), the Group designates the new instrument as a hedging instrument of an aggregated position (CFH) without having to end the initial hedging relationship.
2) Cash flow hedge when the Group implements a strategy of fixing interest rate and/or currency rate on the external debt. Changes in fair value are recorded in Other comprehensive Income for the effective portion of the hedging and in the statement of income for the ineffective portion of the hedging. When the hedged transaction affects profit or loss, the fair value variations of the hedging instrument recorded in equity are also symmetrically recycled to the income statement.
The fair value of those hedging instruments of long-term financing is included in assets under “Non-current financial assets” or in liabilities under “Non-current financial debt” for the non-current portion. The current portion (less than one year) is accounted for in “Current financial assets” or “Other current financial liabilities”.
If the hedging instrument expires, is sold or terminated by anticipation, gains or losses previously recognized in equity remain in equity. Amounts are recycled to the income statement only when the hedged transaction affects profit or loss.
3) In compliance with IFRS9, the Group has decided to recognize in a separate component of the comprehensive income the variation of foreign currency basis spread (Cross Currency Swaps) identified in the hedging relationships qualified as fair value hedges and cash flow hedges.
- Foreign subsidiaries’ equity hedge

Certain financial instruments hedge against risks related to the equity of foreign subsidiaries whose functional currency is not the euro (mainly the dollar). These instruments qualify as “net investment hedges” and changes in fair value are recorded in other comprehensive income under “Currency translation” for the effective portion of the hedging and in the statement of income for the ineffective portion of the hedging. Gains or losses on hedging instruments previously recorded in equity, are reclassified to the statement of income in the same period as the total or partial disposal of the foreign activity.
The fair value of these instruments is recorded under “Current financial assets” and ”Other current financial liabilities”.
- Commitments to purchase shares held by non-controlling interests (put options written on minority interests)
Put options granted to non-controlling-interest shareholders are initially recognized as financial liabilities at the present value of the exercise price of the options with a corresponding reduction in shareholders’ equity. The financial liability is subsequently measured at fair value at each balance sheet date in accordance with contractual clauses and any variation is recorded in the statement of income (cost of debt).
A) Impact on the statement of income per nature of financial instruments
Assets and liabilities from financing activities
The impact on the statement of income of financing assets and liabilities mainly includes:
Financial income on cash, cash equivalents, and current financial assets (notably current deposits beyond three months) classified as “Loans and receivables”;
Financial expense of long term subsidiaries financing, associated hedging instruments (excluding ineffective portion of the hedge detailed below) and financial expense of short term financing classified as “Financing liabilities and associated hedging instruments”;
Ineffective portion of bond hedging;
Financial income and financial expense on lease contracts and,
Financial income, financial expense and fair value of derivative instruments used for cash management purposes classified as “Assets and liabilities held for trading”.
Financial derivative instruments used for cash management purposes (interest rate and foreign exchange) are considered to be held for trading. Based on practical documentation issues, the Group did not elect to set up hedge accounting for such instruments. The impact on income of the derivatives is offset by the impact of loans and current liabilities they are related to. Therefore these transactions taken as a whole do not have a significant impact on the Consolidated Financial Statements.
For the year ended December 31,
(M$) 2020 2019 2018
Loans and receivables 154 200 161
Financing liabilities and associated hedging instruments (1,660) (1,897) (1,927)
Fair value hedge (ineffective portion) 12 (1) (6)
Lease assets and obligations (422) (417) -
Assets and liabilities held for trading (194) (237) (349)
Impact on the cost of net debt (2,110) (2,352) (2,121)
B) Impact of the hedging strategies
Fair value hedge instruments
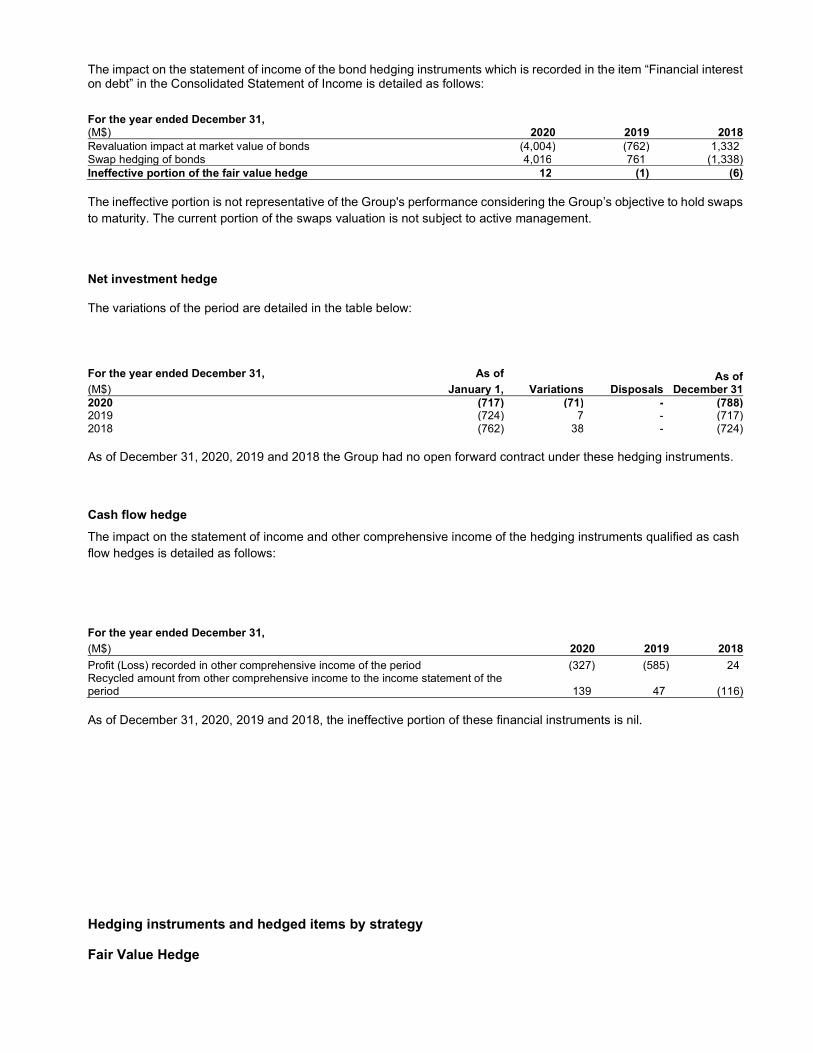
The impact on the statement of income of the bond hedging instruments which is recorded in the item “Financial interest on debt” in the Consolidated Statement of Income is detailed as follows:
For the year ended December 31, 2020 2019 2018(M$)
Revaluation impact at market value of bonds (4,004) (762) 1,332 Swap hedging of bonds 4,016 761 (1,338)Ineffective portion of the fair value hedge 12 (1) (6) The ineffective portion is not representative of the Group's performance considering the Group’s objective to hold swaps to maturity. The current portion of the swaps valuation is not subject to active management.
Net investment hedge
The variations of the period are detailed in the table below:
For the year ended December 31, As of
Variations DisposalsAs of
December 31(M$) January 1, 2020 (717) (71) - (788)2019 (724) 7 - (717)2018 (762) 38 - (724) As of December 31, 2020, 2019 and 2018 the Group had no open forward contract under these hedging instruments.
Cash flow hedge
The impact on the statement of income and other comprehensive income of the hedging instruments qualified as cash flow hedges is detailed as follows:
For the year ended December 31,
2020 2019 2018(M$)
Profit (Loss) recorded in other comprehensive income of the period (327) (585) 24 Recycled amount from other comprehensive income to the income statement of the period 139 47 (116) As of December 31, 2020, 2019 and 2018, the ineffective portion of these financial instruments is nil.
Hedging instruments and hedged items by strategy
Fair Value Hedge

The following charts regarding Fair Value Hedge, disclose by nature of hedging instruments (Interest Rate Swaps and Cross Currency Swaps):
- The nominal amounts and carrying amounts of hedging instruments ;
- The carrying amounts of hedged items and cumulative FVH adjustments included in the carrying amounts of the hedged items;
- The hedged items that have ceased to be adjusted for hedging gains and losses.
For the year ended December 31 2020 $M
Hedged items Hedging instruments
Nominal amount of hedging instruments
Carrying amount of hedging instruments
Carrying amount of hedged items
Cumulative FVH adjustments included in the carrying amount of the hedged items
Line items in the statement of financial position
Assets Liabilities Assets Liabilities Assets Liabilities
Bonds Interest Rate Swaps 8,063 527 (15) - (8,586) - (1,136)
Financial debt / Financial assets
Bonds
Cross Currency Swaps 11,011 836 (211) - (11,109) - (98)
Financial debt / Financial assets
End of hedging (before 2018) - - - - - - (47)
For the year ended December 31 2019 $M
Hedged items Hedging instruments
Nominal amount of hedging instruments
Carrying amount of hedging instruments
Carrying amount of hedged items
Cumulative FVH adjustments included in the carrying amount of the hedged items
Line items in the statement of financial position
Assets Liabilities Assets Liabilities Assets Liabilities
Bonds Interest Rate Swaps 8,012 270 (75) - (7,450) - (795)
Financial debt / Financial assets
Bonds
Cross Currency Swaps 14,357 124 (1,011) - (14,357) - 1,290
Financial debt / Financial assets
End of hedging (before 2018)
- - - - (71)
Cash Flow Hedge
The following charts regarding Cash Flow Hedge disclose the nominal amounts and carrying amounts by nature of hedging instruments (Interest Rate Swaps and Cross Currency Swaps).

According to IFRS 9, there is no accounting entry related to Cash Flow Hedge on hedged items.
For the year ended December 31 2020
Nature of hedging
instruments
Nominal amount of hedging
instruments
Carrying amount of hedging instruments
Line item in the statement of financial
position $M Assets Liabilities
Bonds Interest Rate
Swaps 12,781 - (1,441) Financial debt / Financial
assets
Bonds Cross Currency
Swaps 17,511 1,856 (32) Financial debt / Financial
assets
For the year ended December 31 2019
Nature of hedging
instruments
Nominal amount of hedging
instruments
Carrying amount of hedging instruments
Line item in the statement of financial
position $M Assets Liabilities
Bonds Interest Rate
Swaps 12,782 25 (527) Financial debt / Financial
assets
Bonds Cross Currency
Swaps 12,604 19 (431) Financial debt / Financial
assets
C) Maturity of derivative instruments
The maturity of the notional amounts of derivative instruments, excluding the commodity contracts, is detailed in the following table: Fair Notional Fair Notional value schedule For the year ended December 31, 2020 value value value
(M$) 2021 2022 2022 2023 2024 2025 2026
Assets / (Liabilities) and after and after
Fair value hedge Swaps hedging bonds (assets) 18 1,250 1,365 12,642
Swaps hedging bonds (liabilities) (104) 1,445 (142) 3,737
Total swaps hedging bonds (86) 2,695 1,223 16,379 4,350 3,858 2,087 1,630 4,454
Cash flow hedge Swaps hedging bonds (assets) - - 1,856 16,259
Swaps hedging bonds (liabilities) - - (1,473) 14,033
Total swaps hedgings bonds - - 383 30,292 - 1,000 3,659 4,459 21,174 Forward exchange contracts related to operating activites (assets) 16 262 20 394
Forward exchange contracts related to operating activites (liabilities) - - - -
Total forward exchange contracts related to operating activities 16 262 20 394 276 118 - - - Held for trading Other interest rate swaps (assets) 10 22,011 84 3,214
Other interest rate swaps (liabilities) (51) 7,693 (116) 3,695
Total other interest rate swaps (41) 29,704 (32) 6,909 2,067 764 2,004 1,937 137 Currency swaps and forward exchange contracts (assets) 39 3,323 5 344
Currency swaps and forward exchange contracts (liabilities) (48) 2,580 (2) 54
Total currency swaps and forward exchange contracts (9) 5,903 3 398 189 145 64 - - Notional amounts set the levels of commitment and are indicative nor of a contingent gain or loss neither of a related debt.
Fair Notional Fair Notional value schedule For the year ended December 31, 2019 value value value

(M$) 2020 2021 2021 2022 2023 2024 2025
Assets / (Liabilities) and after and after
Fair value hedge
Swaps hedging bonds (assets) - - 469 10,896
Swaps hedging bonds (liabilities) (423) 3,346 (736) 8,127
Total swaps hedging bonds (423) 3,346 (267) 19,023 2,695 4,298 3,858 2,337 5,835 Cash flow hedge
Swaps hedging bonds (assets) - - 43 4,062 Swaps hedging bonds (liabilities) - - (958) 21,324
Total swaps hedgings bonds - - (915) 25,386 - - 1,000 3,659 20,727
Forward exchange contracts related to operating activites (assets) 1 29 - - Forward exchange contracts related to operating activites (liabilities) - - - -
Total forward exchange contracts related to operating activites 1 29 - - - - - - - Held for trading
Other interest rate swaps (assets) 11 23,522 50 2,225 Other interest rate swaps (liabilities) (24) 16,007 (44) 3,475
Total other interest rate swaps (13) 39,529 6 5,700 2,217 1,463 18 1,820 182
Currency swaps and forward exchange contracts (assets) 111 6,446 17 431 Currency swaps and forward exchange contracts (liabilities) (39) 4,455 - 131
Total currency swaps and forward exchange contracts 72 10,901 17 562 529 33 - - -
Notional amounts set the levels of commitment and are indicative nor of a contingent gain or loss neither of a related debt.
Fair Notional Fair Notional value schedule For the year ended December 31, 2018 value value value
(M$) 2019 2020 2020 2021 2022 2023 2024
Assets / (Liabilities) and after and after
Fair value hedge
Swaps hedging bonds (assets) 45 1,345 235 3,712
Swaps hedging bonds (liabilities) (208) 1,874 (1,281) 16,225 Total swaps hedging bonds (163) 3,219 (1,046) 19,937 3,346 1,945 4,309 3,858 6,479
Cash flow hedge
Swaps hedging bonds (assets) - - 378 10,043 Swaps hedging bonds (liabilities) (87) 969 (599) 11,265
Total swaps hedging bonds (87) 969 (221) 21,308 - - - - 21,308
Forward exchange contracts related to operating activites (assets) 2 39 - 4 Forward exchange contracts related to operating activites (liabilities) - - - - Total forward exchange contracts related to operating activites 2 39 - 4 4 - - - -
Held for trading
Other interest rate swaps (assets) 7 17,001 57 2,515 Other interest rate swaps (liabilities) (79) 20,816 (22) 2,686
Total other interest rate swaps (72) 37,817 35 5,201 2,186 1,004 56 1 1,954
Currency swaps and forward exchange contracts (assets) 66 10,500 11 44 Currency swaps and forward exchange contracts (liabilities) (104) 9,107 (7) 34
Total currency swaps and forward exchange contracts (38) 19,607 4 78 65 12 1 - -
Notional amounts set the levels of commitment and are indicative nor of a contingent gain or loss neither of a related debt.

D) Fair value hierarchy
Accounting policies
Fair values are estimated for the majority of the Group’s financial instruments, with the exception of publicly traded equity securities and marketable securities for which the market price is used.
Estimations of fair value, which are based on principles such as discounting future cash flows to present value, must be weighted by the fact that the value of a financial instrument at a given time may be influenced by the market environment (liquidity especially), and also the fact that subsequent changes in interest rates and exchange rates are not taken into account.
As a consequence, the use of different estimates, methodologies and assumptions could have a material effect on the estimated fair value amounts.
The methods used are as follows:
- Financial debts, swaps
The market value of swaps and of bonds that are hedged by those swaps has been determined on an individual basis by discounting future cash flows with the market curves existing at year-end.
- Other financial instruments
The fair value of the interest rate swaps and of FRA's (Forward Rate Agreements) are calculated by discounting future cash flows on the basis of market curves existing at year-end after adjustment for interest accrued but unpaid. Forward exchange contracts and currency swaps are valued on the basis of a comparison of the negotiated forward rates with the rates in effect on the financial markets at year-end for similar maturities.
Exchange options are valued based on models commonly used by the market.
The fair value hierarchy for financial instruments, excluding commodity contracts, is as follows:
As of December 31, 2020
Quoted prices in active markets
for identical assets
(level 1)
Prices based on observable data
(level 2)
Prices based on non observable
data(level 3) Total(M$)
Fair value hedge instruments - 1,137 - 1,137
Cash flow hedge instruments - 408 - 408
Assets and liabilities held for trading - (68) - (68)
Equity instruments 706 - - 706
Total 706 1,477 - 2,183
As of December 31, 2019
Quoted prices in active markets
for identical assets
(level 1)
Prices based on observable data
(level 2)
Prices based on non observable
data(level 3) Total(M$)
Fair value hedge instruments - (690) - (690)
Cash flow hedge instruments - (915) - (915)
Assets and liabilities held for trading - 82 - 82
Equity instruments 240 - - 240
Total 240 (1,523) - (1,283)

As of December 31, 2018
Quoted prices in active markets
for identical assets
(level 1)
Prices based on observable data
(level 2)
Prices based on non observable
data(level 3) Total(M$)
Fair value hedge instruments - (1,209) - (1,209)
Cash flow hedge instruments - (306) - (306)
Assets and liabilities held for trading - (71) - (71)
Equity instruments 94 - - 94
Total 94 (1,586) - (1,492) 15.3) Financial risks management
Financial markets related risks
As part of its financing and cash management activities, the Group uses derivative instruments to manage its exposure to changes in interest rates and foreign exchange rates. These instruments are mainly interest rate and currency swaps. The Group may also occasionally use futures contracts and options. These operations and their accounting treatment are detailed in Notes 14, 15.1 and 15.2 to the Consolidated Financial Statements.
Risks relative to cash management operations and to interest rate and foreign exchange financial instruments are managed according to rules set by the Group’s senior management, which provide for regular pooling of available cash balances, open positions and management of the financial instruments by the Treasury Department. Excess cash of the Group is deposited mainly in government institutions, deposit banks, or major companies through deposits, reverse repurchase agreements and purchase of commercial paper. Liquidity positions and the management of financial instruments are centralized by the Treasury Department, where they are managed by a team specialized in foreign exchange and interest rate market transactions.
The Cash Monitoring-Management Unit within the Treasury Department monitors limits and positions per bank on a daily basis and results of the Front Office. This unit also prepares marked-to-market valuations of used financial instruments and, when necessary, performs sensitivity analysis.
Counterparty risk
The Group has established standards for market transactions under which any banking counterparty must be approved in advance, based on an assessment of the counterparty’s financial solidity (multi-criteria analysis including notably a review of its Credit Default Swap (CDS) level, credit ratings from Standard & Poor’s and Moody’s, which must be of high standing, and general financial situation).
An overall credit limit is set for each authorised financial counterparty and is allocated amongst the affiliates and the Group’s central treasury entities, according to the Group’s financial needs.
To reduce the market valuation risk on its commitments, in particular relating to derivative instruments, the Treasury Department has entered into margin call agreements with its counterparties, in compliance with applicable regulations. Moreover, since December 21, 2018 and pursuant to Regulation (EU) No. 648/2012 on OTC derivatives, central counterparties and trade repositories (EMIR), any new interest rate hedging swap (excluding cross currency swaps) entered into by a Group’s entity is now subject to central clearing.
Short-term interest rate exposure and cash
Cash balances, which are primarily composed of euros and dollars, are managed according to the guidelines established by the Group’s senior management (to maintain an adequate level of liquidity, optimize revenue from investments considering existing interest rate yield curves, and minimize the cost of borrowing) over a less than twelve-month horizon and on the basis of a daily interest rate benchmark, primarily through short-term interest rate swaps and short-term currency swaps, without modifying currency exposure.
Interest rate risk on non-current debt
The Group’s policy consists in incurring long-term debt at a floating or fixed rate, depending on the Group’s general corporate needs and the interest rate environment at the time of issue, mainly in dollars or euros. Long-term interest rate and currency swaps may be entered into for the purpose of hedging bonds at the time of issuance, synthetically resulting in the incurrence of variable or fixed rate debt. In order to partially alter the interest rate exposure of its long-term indebtedness, TOTAL may also enter into long-term interest rate swaps on an ad-hoc basis.

Currency exposure
The Group generally seeks to minimize the currency exposure of each entity to its functional currency (primarily the dollar, the euro, the pound sterling and the Norwegian krone).
For currency exposure generated by commercial activity, the hedging of revenues and costs in foreign currencies is typically performed using currency operations on the spot market and, in some cases, on the forward market. The Group rarely hedges future cash flows, although it may use options to do so.
With respect to currency exposure linked to non-current assets, the Group has a hedging policy of financing these assets in their functional currency.
Net short-term currency exposure is periodically monitored against limits set by the Group’s senior management.
The non-current debt described in Note 15.1 to the Consolidated Financial Statements is generally raised by the corporate treasury entities either directly in dollars or in euros, or in other currencies which are then exchanged for dollars or euros through swap issues to appropriately match general corporate needs. The proceeds from these debt issuances are loaned to affiliates whose accounts are kept in dollars or in euros. Thus, the net sensitivity of these positions to currency exposure is not significant.
The Group’s short-term currency swaps, the notional value of which appears in Note 15.2 to the Consolidated Financial Statements, are used to attempt to optimize the centralized cash management of the Group. Thus, the sensitivity to currency fluctuations which may be induced is likewise considered negligible.
Sensitivity analysis on interest rate and foreign exchange risk
The tables below present the potential impact of an increase or decrease of 10 basis points on the interest rate yield curves for each of the currencies on the fair value of the current financial instruments as of December 31, 2020, 2019 and 2018.
Assets / (Liabilities)
Carrying amount
Estimated fair value
Change in fair value due to a change in interest rate by
(M$) + 10 basis
points- 10 basis
pointsAs of December 31, 2020 Bonds (non-current portion, before swaps) (46,239) (52,246) 440 (440)
Swaps hedging bonds (liabilities) (1,615) (1,615) - - Swaps hedging bonds (assets) 3,221 3,221 - -
Total swaps hedging bonds (assets and liabilities) 1,606 1,606 (70) 70 Current portion of non-current debt after swaps (excluding lease obligations)
(4,674) (4,696) 2 (2)
Other interest rates swaps (73) (73) 18 (18) Currency swaps and forward exchange contracts (6) (6) - -
As of December 31, 2019 Bonds (non-current portion, before swaps) (38,657) (41,805) 247 (247) Swaps hedging bonds (liabilities) (1,694) (1,694) - - Swaps hedging bonds (assets) 512 512 - -Total swaps hedging bonds (assets and liabilities) (1,182) (1,182) (44) 44 Current portion of non-current debt after swaps (excluding lease obligations)
(5,331) (5,332) 1 (1)
Other interest rates swaps (7) (7) 18 (18) Currency swaps and forward exchange contracts 89 89 - -
As of December 31, 2018 Bonds (non-current portion, before swaps) (34,975) (36,127) 185 (185) Swaps hedging bonds (liabilities) (1,880) (1,880) - - Swaps hedging bonds (assets) 613 613 - -Total swaps hedging bonds (assets and liabilities) (1,267) (1,267) (59) 59 Current portion of non-current debt after swaps (excluding capital lease obligations)
(5,027) (5,027) - -
Other interest rates swaps (37) (37) 12 (12) Currency swaps and forward exchange contracts (34) (34) - -

The impact of changes in interest rates on the cost of debt before tax is as follows: For the year ended December 31, (M$) 2020 2019 2018Cost of net debt (2,110) (2,352) (2,121) Interest rate translation of : + 10 basis points 29 27 29- 10 basis points (29) (27) (29) As a result of the policy for the management of currency exposure previously described, the Group’s sensitivity to currency exposure is primarily influenced by the net equity of the subsidiaries whose functional currency is the euro and the ruble, and to a lesser extent, the pound sterling and the Norwegian krone. This sensitivity is reflected in the historical evolution of the currency translation adjustment recorded in the statement of changes in consolidated shareholders’ equity which, over the course of the last three years, is essentially related to the fluctuation of the euro, the ruble and the pound sterling and is set forth in the table below:
Dollar / Euro exchange rates
Dollar / Pound sterling exchange
rates
Dollar / Rubleexchange rates
December 31, 2020 0.81 0.73 74.54December 31, 2019 0.89 0.76 62.27December 31, 2018 0.87 0.78 69.62 As of December 31, 2020 Pound Other(M$) Total Euro Dollar sterling Ruble currencies
Shareholders' equity at historical exchange rate 113,958 28,893 60,613 4,494 9,913 10,045
Currency translation adjustment before net investment hedge (10,279) (2,448) - (1,726) (4,253) (1,852)
Net investment hedge - open instruments 23 23 - - - -
Shareholders' equity at exchange rate as of December 31, 2020 103,702 26,468 60,613 2,768 5,660 8,193
As of December 31, 2019 Pound Other(M$) Total Euro Dollar sterling Ruble currencies
Shareholders' equity at historical exchange rate 128,281 37,687 66,005 5,635 9,900 9,054
Currency translation adjustment before net investment hedge (11,501) (4,443) - (1,830) (3,355) (1,873)
Net investment hedge - open instruments (2) (2) - - - -
Shareholders' equity at exchange rate as of December 31, 2019 116,778 33,241 66,005 3,805 6,545 7,182
As of December 31, 2018 Pound Other(M$) Total Euro Dollar sterling Ruble currencies
Shareholders' equity at historical exchange rate 126,953 41,518 59,125 9,077 8,248 8,985
Currency translation adjustment before net investment hedge (11,321) (3,706) - (1,960) (3,892) (1,763)
Net investment hedge - open instruments 8 8 - - - -
Shareholders' equity at exchange rate as of December 31, 2018 115,640 37,820 59,125 7,117 4,356 7,222
Based on the 2020 financial statements, a conversion using rates different from + or - 10% for each of the currencies below would have the following impact on shareholders equity and net income (Group share):
As of December 31, 2020 Pound Norwegian(M$) Euro sterling Ruble Crown
Impact of an increase of 10% of exchange rates on :
- shareholders equity 2,647 277 566 -
- net income (Group share) (189) (64) 29 -
Impact of a decrease of (10)% of exchange rates on :
- shareholders equity (2,647) (277) (566) -
- net income (Group share) 189 64 (29) -

Stock market risk
The Group holds interests in a number of publicly-traded companies (see Note 8 to the Consolidated Financial Statements). The market value of these holdings fluctuates due to various factors, including stock market trends, valuations of the sectors in which the companies operate, and the economic and financial condition of each individual company. Liquidity risk
TOTAL SE has committed credit facilities granted by international banks allowing it to benefit from significant liquidity reserves.
As of December 31, 2020, these credit facilities amounted to $14,902 million, of which $11,256 million were unutilized. The agreements underpinning credit facilities granted to TOTAL SE do not contain conditions related to the Company’s financial ratios, to its credit ratings from specialized agencies, or to the occurrence of events that could have a material adverse effect on its financial position.
As of December 31, 2020, the aggregated amount of the main committed credit facilities granted by international banks to the Group’s companies, including TOTAL SE, was $16,282 million, of which $11,808 million were unutilized. Credit facilities granted to the Group’s companies other than TOTAL SE are not intended to fund the Group’s general corporate purposes; they are intended to fund either general corporate purposes of the borrowing affiliate, or a specific project.

The following tables show the maturity of the financial assets and liabilities of the Group as of December 31, 2020, 2019 and 2018 (see Note 15.1 to the Consolidated Financial Statements). As of December 31, 2020 Assets/(Liabilities)
(M$) Less than
one year 1-2 years 2-3 years 3-4 years 4-5 yearsMore than
5 yearsTotal
Non-current financial debt (notional value excluding interests) - (9,849) (5,762) (5,990) (4,321) (30,951) (56,873)
Non-current financial assets excluding derivative financial instruments
- 59 42 45 46 1,259 1,451
Current borrowings (17,099) - - - - - (17,099)
Other current financial liabilities (203) - - - - - (203)
Current financial assets 4,630 - - - - - 4,630
Assets and liabilities available for sale or exchange (313) - - - - - (313)
Cash and cash equivalents 31,268 - - - - - 31,268
Net amount before financial expense 18,283 (9,790) (5,720) (5,945) (4,275) (29,692) (37,139)
Financial expense on non-current financial debt (930) (888) (825) (696) (603) (5,833) (9,775)
Interest differential on swaps (163) (149) (158) (173) (196) (930) (1,769)
Net amount 17,190 (10,827) (6,703) (6,814) (5,074) (36,455) (48,683)
As of December 31, 2019 Assets/(Liabilities)
(M$) Less than
one year 1-2 years 2-3 years 3-4 years 4-5 yearsMore than
5 yearsTotal
Non-current financial debt (notional value excluding interests) - (5,683) (6,102) (5,172) (5,802) (24,435) (47,194)
Non-current financial assets excluding derivative financial instruments
- 68 24 9 4 228 333
Current borrowings (14,819) - - - - - (14,819)
Other current financial liabilities (487) - - - - - (487)
Current financial assets 3,992 - - - - - 3,992
Assets and liabilities available for sale or exchange (301) - - - - - (301)
Cash and cash equivalents 27,352 - - - - - 27,352
Net amount before financial expense 15,737 (5,615) (6,078) (5,163) (5,798) (24,207) (31,124)
Financial expense on non-current financial debt (807) (724) (650) (594) (482) (2,215) (5,472)
Interest differential on swaps (350) (325) (297) (255) (224) (1,046) (2,497)
Net amount 14,580 (6,664) (7,025) (6,012) (6,504) (27,468) (39,093) As of December 31, 2018
Assets/(Liabilities)
(M$) Less than
one year 1-2 years 2-3 years 3-4 years 4-5 yearsMore than
5 yearsTotal
Non-current financial debt (notional value excluding interests) - (5,432) (3,966) (5,158) (4,983) (19,910) (39,449)
Current borrowings (13,306) - - - - - (13,306)
Other current financial liabilities (478) - - - - - (478)
Current financial assets 3,654 - - - - - 3,654
Assets and liabilities available for sale or exchange 15 - - - - - 15
Cash and cash equivalents 27,907 - - - - - 27,907
Net amount before financial expense 17,792 (5,432) (3,966) (5,158) (4,983) (19,910) (21,657)
Financial expense on non-current financial debt (718) (682) (598) (506) (427) (1,037) (3,968)
Interest differential on swaps (484) (412) (369) (309) (234) (869) (2,677)
Net amount 16,590 (6,526) (4,933) (5,973) (5,644) (21,816) (28,302)
The following table sets forth financial assets and liabilities related to operating activities as of December 31, 2020, 2019 and 2018 (see Note 14 of the Notes to the Consolidated Financial Statements). As of December 31, Assets/(Liabilities) (M$) 2020 2019 2018Accounts payable (23,574) (28,394) (26,134)Other operating liabilities (14,302) (16,262) (13,286) including derivative financial instruments related to commodity contracts (liabilities) (3,666) (5,333) (3,429)Accounts receivable, net 14,068 18,488 17,270 Other operating receivables 8,043 11,506 9,733 including derivative financial instruments related to commodity contracts (assets) 1,428 4,791 2,731 Total (15,765) (14,662) (12,417)
These financial assets and liabilities mainly have a maturity date below one year.

Credit risk Credit risk is defined as the risk of the counterparty to a contract failing to perform or pay the amounts due. The Group is exposed to credit risks in its operating and financing activities. The Group's maximum exposure to credit risk is partially related to financial assets recorded on its balance sheet, including energy derivative instruments that have a positive market value. The following table presents the Group's maximum credit risk exposure: As of December 31, Assets/(Liabilities) (M$) 2020 2019 2018
Loans to equity affiliates (note 8) 5,129 3,999 4,755
Loans and advances (note 6) 2,458 1,982 1,877
Other non-current financial assets related to operational activities (note 6) 287 332 471
Non-current financial assets (note 15.1) 4,781 912 680
Accounts receivable (note 5) 14,068 18,488 17,270
Other operating receivables (note 5) 8,043 11,506 9,733
Current financial assets (note 15.1) 4,630 3,992 3,654
Cash and cash equivalents (note 15.1) 31,268 27,352 27,907
Total 70,664 68,563 66,347
The valuation allowance on accounts receivable, other operating receivables and on loans and advances is detailed in Notes 5 and 6 to the Consolidated Financial Statements.
As part of its credit risk management related to operating and financing activities, the Group has developed margining agreements with certain counterparties. As of December 31, 2020, the net margin call paid amounted to $(1,556) million (against $2,486 million paid as of December 31, 2019 and $2,581 million paid as of December 31, 2018).
The Group has established a number of programs for the sale of receivables, without recourse, with various banks, primarily to reduce its exposure to such receivables. As a result of these programs the Group retains no risk of payment default after the sale, but may continue to service the customer accounts as part of a service arrangement on behalf of the buyer and is required to pay to the buyer payments it receives from the customers relating to the receivables sold. As of December 31, 2020, the net value of receivables sold amounted to $6,446 million. The Group has substantially transferred all the risks and rewards related to receivables. No financial asset or liability remains recognized in the consolidated balance sheet after the date of sale.
Furthermore, in 2020 the Group conducted several operations of reverse factoring for a value of $23 million.
Credit risk is managed by the Group’s business segments as follows:
Exploration & Production segment
Risks arising under contracts with government authorities or other oil companies or under long-term supply contracts necessary for the development of projects are evaluated during the project approval process. The long-term aspect of these contracts and the high-quality of the other parties lead to a low level of credit risk.
Risks related to commercial operations, other than those described above (which are, in practice, directly monitored by subsidiaries), are subject to procedures for establishing credit limits and reviewing outstanding balances.

Integrated Gas, Renewables & Power segment
- Gas & Power activities
Trading Gas & Power activities deal with counterparties in the energy, industrial and financial sectors throughout the world. Financial institutions providing credit risk coverage are highly rated international banks and insurance groups.
Potential counterparties are subject to credit assessment and approval before concluding transactions and are thereafter subject to regular review, including re-appraisal and approval of the limits previously granted.
The creditworthiness of counterparties is assessed based on an analysis of quantitative and qualitative data regarding financial standing and business risks, together with the review of any relevant third party and market information, such as data published by rating agencies. On this basis, credit limits are defined for each potential counterparty and, where appropriate, transactions are subject to specific authorizations.
Credit exposure, which is essentially an economic exposure or an expected future physical exposure, is permanently monitored and subject to sensitivity measures.
Credit risk is mitigated by the systematic use of industry standard contractual frameworks that permit netting, enable requiring added security in case of adverse change in the counterparty risk, and allow for termination of the contract upon occurrence of certain events of default. About the Professionals and Retail Gas and Power Sales activities, credit risk management policy is adapted to the type of customer either through the use of procedures of prepayments and appropriate collection, especially for mass customers or through credit insurances and sureties/guarantees obtaining. For the Professionals segment, the segregation of duties between the commercial and financial teams allows an “a priori” control of risks.
- Renewables and Carbon Neutrality Businesses (CNB)
Internal procedures for the Renewables division and the Carbon Neutrality Business division include rules on credit risk management. Procedures to monitor customer risk are defined at the local level, especially for SunPower, Saft and Greenflex (rules for the approval of credit limits, use of guarantees, monitoring and assessment of the receivables portfolio,...).
Refining & Chemicals segment
Refining & Chemicals activities
Credit risk is primarily related to commercial receivables. Internal procedures of Refining & Chemicals include rules for the management of credit describing the fundamentals of internal control in this domain. Each Business Unit implements the procedures of the activity for managing and provisioning credit risk according to the size of the subsidiary and the market in which it operates. The principal elements of these procedures are:
implementation of credit limits with different authorization schemes;
use of insurance policies or specific guarantees (letters of credit);
regular monitoring and assessment of overdue accounts (aging balance), including dunning procedures.
Counterparties are subject to credit assessment and approval prior to any transaction being concluded. Regular reviews are made for all active counterparties including a re-appraisal and renewing of the granted credit limits. The limits of the counterparties are assessed based on quantitative and qualitative data regarding financial standing, together with the review of any relevant third party and market information, such as that provided by rating agencies and insurance companies.
Trading & Shipping activities
Trading & Shipping deals with commercial counterparties and financial institutions located throughout the world. Counterparties to physical and derivative transactions are primarily entities involved in the oil and gas industry or in the trading of energy commodities, or financial institutions. Credit risk coverage is arranged with financial institutions, international banks and insurance groups selected in accordance with strict criteria.
The Trading & Shipping division applies a strict policy of internal delegation of authority in order to set up credit limits by country and counterparty and approval processes for specific transactions. Credit exposures contracted under these limits and approvals are monitored on a daily basis.

Potential counterparties are subject to credit assessment and approval prior to any transaction being concluded and all active counterparties are subject to regular reviews, including re-appraisal and approval of granted limits. The creditworthiness of counterparties is assessed based on an analysis of quantitative and qualitative data regarding financial standing and business risks, together with the review of any relevant third party and market information, such as ratings published by Standard & Poor’s, Moody’s Investors Service and other agencies.
Contractual arrangements are structured so as to maximize the risk mitigation benefits of netting between transactions wherever possible and additional protective terms providing for the provision of security in the event of financial deterioration and the termination of transactions on the occurrence of defined default events are used to the greatest permitted extent.
Credit risks in excess of approved levels are secured by means of letters of credit and other guarantees, cash deposits and insurance arrangements. In respect of derivative transactions, risks are secured by margin call contracts wherever possible.
Marketing & Services segment
Internal procedures for the Marketing & Services division include rules on credit risk that describe the basis of internal control in this domain, including the separation of authority between commercial and financial operations.
Credit policies are defined at the local level and procedures to monitor customer risk are implemented (credit committees at the subsidiary level, the creation of credit limits for corporate customers, etc.). Each entity also implements monitoring of its outstanding receivables. Risks related to credit may be mitigated or limited by subscription of credit insurance and/or requiring security or guarantees.

16) Financial instruments related to commodity contracts
16.1) Financial instruments related to commodity contracts
Accounting policies
Financial instruments related to commodity contracts, including crude oil, petroleum products, gas, and power purchase/sales contracts within the trading activities, together with the commodity contract derivative instruments such as energy contracts and forward freight agreements, are used to adjust the Group's exposure to price fluctuations within global trading limits. According to the industry practice, these instruments are considered as held for trading. Changes in fair value are recorded in the statement of income. The fair value of these instruments is recorded in “Other current assets” or “Other creditors and accrued liabilities” depending on whether they are assets or liabilities.
The valuation methodology is to mark-to-market all open positions for both physical and paper transactions. The valuations are determined on a daily basis using observable market data based on organized and over the counter (OTC) markets. In particular cases when market data is not directly available, the valuations are derived from observable data such as arbitrages, freight or spreads and market corroboration. For valuation of risks which are the result of a calculation, such as options for example, commonly known models are used to compute the fair value.
As of December 31, 2020 (M$)
Assets / (Liabilities)
Gross value before offsetting
- assets
Gross value before offsetting
- liabilities
Amounts offset
- assets(c)
Amountsoffset
- liabilities(c)
Net balance sheet value
presented- assets
Net balance sheet value
presented- liabilities
Other amounts not
offset
Net carrying amount
Fair value(b)
Crude oil, petroleum products and freight rates activities Petroleum products, crude oil and freight rate swaps 302 (443) (207) 207 95 (236) - (141) (141)
Forwards(a) 158 (297) (13) 13 145 (284) - (139) (139)
Options 113 (125) (68) 68 45 (57) - (12) (12)
Futures - - - - - - - - -
Options on futures 117 (135) (117) 117 - (18) - (18) (18)
Other / Collateral - - - - - - 43 43 43Total crude oil, petroleum products and freight rates
690 (1,000) (405) 405 285 (595) 43 (267) (267)
Integrated Gas, Renewables & Power activities
Swaps 10 (71) - - 10 (71) - (61) (61)
Forwards(a) 1,372 (3,113) (186) 186 1,186 (2,927) - (1,741) (1,741)
Options (61) (75) (13) 13 (74) (62) - (136) (136)
Futures 42 (32) (21) 21 21 (11) - 10 10
Other / Collateral - - - - - - 22 22 22Total Integrated Gas, Renewables & Power 1,363 (3,291) (220) 220 1,143 (3,071) 22 (1,906) (1,906)
Total 2,053 (4,291) (625) 625 1,428 (3,666) 65 (2,173) (2,173)Total of fair value non recognized in the balance sheet
(a) Forwards: contracts resulting in physical delivery are accounted for as derivative commodity contracts and included in the amounts shown.
(b) When the fair value of derivatives listed on an organized exchange market (futures, options on futures and swaps) is offset with the margin call received or paid in the balance sheet, this fair value is set to zero. (c) Amounts offset in accordance with IAS 32.

As of December 31, 2019 (M$)
Assets / (Liabilities)
Gross value before offsetting
- assets
Gross value before offsetting
- liabilities
Amounts offset
- assets(c)
Amounts offset
- liabilities(c)
Net balance sheet value
presented- assets
Net balance sheet value
presented- liabilities
Other amounts not
offset
Net carrying amount
Fair value(b)
Crude oil, petroleum products and freight rates activities Petroleum products, crude oil and freight rate swaps 152 (244) (73) 73 79 (171) - (92) (92)
Forwards(a) 300 (297) (3) 3 297 (294) - 3 3
Options 73 (106) - - 73 (106) - (33) (33)
Futures - - - - - - - - -
Options on futures - (160) - - - (160) - (160) (160)
Other / Collateral - - - - - - 147 147 147
Total crude oil, petroleum products and freight rates
525 (807) (76) 76 449 (731) 147 (135) (135)
Integrated Gas, Renewables & Power activities
Swaps 469 9 39 (39) 508 (30) - 478 478
Forwards(a) 4,080 (4,831) (296) 296 3,784 (4,535) - (751) (751)
Options 76 (37) (28) 28 48 (9) - 39 39
Futures 17 (43) (15) 15 2 (28) - (26) (26)
Other / Collateral - - - - - - (772) (772) (772)Total Integrated Gas, Renewables & Power 4,642 (4,902) (300) 300 4,342 (4,602) (772) (1,032) (1,032)
Total 5,167 (5,709) (376) 376 4,791 (5,333) (625) (1,167) (1,167)Total of fair value non recognized in the balance sheet
(a) Forwards: contracts resulting in physical delivery are accounted for as derivative commodity contracts and included in the amounts shown.
(b) When the fair value of derivatives listed on an organized exchange market (futures, options on futures and swaps) is offset with the margin call received or paid in the balance sheet, this fair value is set to zero. (c) Amounts offset in accordance with IAS 32.

As of December 31, 2018 (M$)
Assets / (Liabilities)
Gross value before offsetting
- assets
Gross value before offsetting
- liabilities
Amounts offset
- assets(c)
Amounts offset
- liabilities(c)
Net balance sheet value
presented- assets
Net balance sheet value
presented- liabilities
Other amounts not
offset
Net carrying amount
Fair value(b)
Crude oil, petroleum products and freight rates activities Petroleum products, crude oil and freight rate swaps 389 (272) (140) 140 249 (132) - 117 117
Forwards(a) 243 (373) (59) 59 184 (314) - (130) (130)
Options 243 (363) (156) 156 87 (207) - (120) (120)
Futures 10 - - - 10 - - 10 10
Options on futures 529 (689) (529) 529 - (160) - (160) (160)
Other / Collateral - - - - - - (118) (118) (118)
Total crude oil, petroleum products and freight rates
1,414 (1,697) (884) 884 530 (813) (118) (401) (401)
Integrated Gas, Renewables & Power activities
Swaps 18 (624) (6) 6 12 (618) - (606) (606)
Forwards(a) 2,492 (2,285) (316) 316 2,176 (1,969) - 207 207
Options 3 (20) (18) 18 (15) (2) - (17) (17)
Futures 126 (125) (98) 98 28 (27) - 1 1
Other / Collateral - - - - - - 445 445 445Total Integrated Gas, Renewables & Power 2,639 (3,054) (438) 438 2,201 (2,616) 445 30 30
Total 4,053 (4,751) (1,322) 1,322 2,731 (3,429) 327 (371) (371)Total of fair value non recognized in the balance sheet
(a) Forwards: contracts resulting in physical delivery are accounted for as derivative commodity contracts and included in the amounts shown.
(b) When the fair value of derivatives listed on an organized exchange market (futures, options on futures and swaps) is offset with the margin call received or paid in the balance sheet, this fair value is set to zero. (c) Amounts offset in accordance with IAS 32. Commitments on crude oil and refined products have, for the most part, a short-term maturity (less than one year). The changes in fair value of financial instruments related to commodity contracts are detailed as follows: For the year ended December 31, Fair value
Impact on income
Settled contracts Other
Fair value as of December
31,(M$) as of January 1,
Crude oil, petroleum products and freight rates activities
2020 (282) 3,813 (3,841) - (310)
2019 (283) 4,189 (4,188) - (282)
2018 (223) 2,689 (2,749) - (283)
Integrated Gas, Renewables & Power activities
2020 (260) 676 (2,348) 4 (1,928)
2019 (415) 1,588 (686) (747) (260)
2018 416 1,220 (2,057) 6 (415) In 2019, the Other column mainly included the acquisition of Toshiba’s LNG portfolio, for which financial instruments related to commodity contracts had been recognized for the amount of treasury received.

The fair value hierarchy for financial instruments related to commodity contracts is as follows:
As of December 31, 2020
Quoted prices in active markets for
identical assets (level 1)
Prices based on observable data
(level 2)
Prices based on non observable
data (level 3)
Total
(M$)
Crude oil, petroleum products and freight rates activities 10 (320) - (310)
Integrated Gas, Renewables & Power activities (159) (361) (1,408) (1,928)
Total (149) (681) (1,408) (2,238)
As of December 31, 2019
Quoted prices in active markets for
identical assets (level 1)
Prices based on observable data
(level 2)
Prices based on non observable
data (level 3)
Total
(M$) Crude oil, petroleum products and freight rates activities (182) (172) 72 (282)Integrated Gas, Renewables & Power activities 392 2,054 (2,706) (260)Total 210 1,882 (2,634) (542)
As of December 31, 2018
Quoted prices in active markets for
identical assets (level 1)
Prices based on observable data
(level 2)
Prices based on non observable
data (level 3)
Total
(M$) Crude oil, petroleum products and freight rates activities (303) 20 - (283)Integrated Gas, Renewables & Power activities 424 (638) (201) (415)Total 121 (618) (201) (698) Financial instruments classified as level 3 are mainly composed of long-term liquefied natural gas purchase and sale contracts which relate to the trading activity.
For the purpose of valuation and accounting of LNG contracts, the Group refers to the active management horizon for trading positions which corresponds to 12 months in 2019 and in 2020. The management of positions being carried out on a net value of LNG purchase and sale commitments, the applied valuation method is the contractual portfolio method based mostly on observable market data such as the prices of energy commodities forward contracts.
Concerning the period beyond the management horizon, a sensitivity analysis is carried out to verify that no liability should be recognized. The assumptions used are based on internal assumptions such as the oil and gas price trajectories adopted by the Group, prices renegotiation clauses included in long-term contracts, uncertainties related to contracts execution and flexibilities included in LNG contracts.
This sensitivity analysis highlights that the valuation method of the LNG contracts is sensitive to market risks, and more specifically to the price risk resulting from the volatility of oil and natural gas prices on North American, Asian, and European markets, and to the valuation of flexibilities, and that beyond the active management horizon of 12 months, a 10% change of the spread between gas prices in the US and Asia would have an estimated annual impact of +/- 0.1 B$ on the margin of the contractual portfolio for the following year.
The description of each fair value level is presented in Note 15 to the Consolidated Financial Statements.

Cash Flow hedge
The impact on the statement of income and other comprehensive income of the hedging instruments related to commodity contracts and qualified as cash flow hedges is detailed as follows: As of December 31 (M$) 2020 2019 2018Profit (Loss) recorded in other comprehensive income of the period 14 (14) 3
Recycled amount from other comprehensive income to the income statement of the period (1) - (3) These financial instruments are mainly one year term Henry Hub derivatives and European gas, power and CO2
emission rights derivatives. As of December 31, 2020, the ineffective portion of these financial instruments is nil (in 2019 and in 2018 the ineffective portion of these financial instruments was nil).

16.2) Oil, Gas and Power markets related risks management
Due to the nature of its business, the Group has significant oil and gas trading activities as part of its day-to-day operations in order to optimize revenues from its oil and gas production and to obtain favorable pricing to supply its refineries.
In its international oil trading business, the Group follows a policy of not selling its future production. However, in connection with this trading business, the Group, like most other oil companies, uses energy derivative instruments to adjust its exposure to price fluctuations of crude oil, refined products, natural gas, and power. The Group also uses freight rate derivative contracts in its shipping business to adjust its exposure to freight-rate fluctuations. To hedge against this risk, the Group uses various instruments such as futures, forwards, swaps and options on organized markets or over-the-counter markets. The list of the different derivatives held by the Group in these markets is detailed in Note 16.1 to the Consolidated Financial Statements.
The Trading & Shipping division measures its market risk exposure, i.e. potential loss in fair values, on its crude oil, refined products and freight rates trading activities using a “value-at-risk” technique. This technique is based on an historical model and makes an assessment of the market risk arising from possible future changes in market values over a 24-hour period. The calculation of the range of potential changes in fair values is based on the end-of-day exposures and historical price movements of the last 400 business days for all traded instruments and maturities. Options are systematically re-evaluated using appropriate models.
The “value-at-risk” represents the most unfavorable movement in fair value obtained with a 97.5% confidence level. This means that the Group’s portfolio result is likely to exceed the value-at-risk loss measure once over 40 business days if the portfolio exposures were left unchanged.
Trading & Shipping: "value-at-risk with" a 97.5% probability As of December 31, (M$) High Low Average Year end2020 30 6 15 19 2019 28 9 17 21 2018 21 5 12 7 As part of its gas and power trading activity, the Group also uses derivative instruments such as futures, forwards, swaps and options in both organized and over-the-counter markets. In general, the transactions are settled at maturity date through physical delivery. The Gas division measures its market risk exposure, i.e. potential loss in fair values, on its trading business using a “value-at-risk” technique. This technique is based on an historical model and makes an assessment of the market risk arising from possible future changes in market values over a one-day period. The calculation of the range of potential changes in fair values takes into account a snapshot of the end-of-day exposures and the set of historical price movements for the past two years for all instruments and maturities in the global trading business.
Integrated Gas, Renewables & Power division trading: "value-at-risk" with a 97.5% probability As of December 31, (M$) High Low Average Year end2020 51 6 21 27 2019 83 10 20 64 2018 20 3 10 10 The Group has implemented strict policies and procedures to manage and monitor these market risks. These are based on the separation of control and front-office functions and on an integrated information system that enables real-time monitoring of trading activities.
Limits on trading positions are approved by the Group’s Executive Committee and are monitored daily. To increase flexibility and encourage liquidity, hedging operations are performed with numerous independent operators, including other oil companies, major energy producers or consumers and financial institutions. The Group has established counterparty limits and monitors outstanding amounts with each counterparty on an ongoing basis.

17) Post closing events
There was no post closing event.
18) Consolidation scope
As of December 31, 2020, 1,118 entities are consolidated of which 146 are accounted for under the equity method (E). The table below presents a comprehensive list of the Group consolidated entities:

Business segment Statutory corporate name % Group interest Method Country of incorporation Country of operations
Exploration & Production Abu Dhabi Gas Industries Limited 15,00% E United Arab Emirates United Arab Emirates
Abu Dhabi Marine Areas Limited 33,33% E United Kingdom United Arab Emirates
Angola Block 14 B.V. 50,01% Netherlands Angola
Angola LNG Supply Services, LLC 13,60% E United States United States
Bonny Gas Transport Limited 15,00% E Bermuda Nigeria
Brass Holdings B.V. 100,00% Netherlands Nigeria
Brass LNG Limited 20,48% E Nigeria Nigeria
Deer Creek Pipelines Limited 75,00% Canada Canada
Dolphin Energy Limited 24,50% E United Arab Emirates United Arab Emirates
E.F. Oil And Gas Limited 100,00% United Kingdom United Kingdom
Elf E&P 100,00% France France
Elf Exploration UK Limited 100,00% United Kingdom United Kingdom
Elf Petroleum Iran 100,00% France Iran
Elf Petroleum UK Limited 100,00% United Kingdom United Kingdom
Gas Investment and Services Company Limited 10,00% E Bermuda Oman
Mabruk Oil Operations 49,02% France Libya
Moattama Gas Transportation Company Limited 31,24% E Bermuda Myanmar
Norpipe Oil A/S 34,93% E Norway Norway
Norpipe Petroleum UK Limited 45,22% E United Kingdom Norway
Norpipe Terminal Holdco Limited 45,22% E United Kingdom Norway
Norsea Pipeline Limited 45,22% E United Kingdom Norway
North Oil Company 30,00% E Qatar Qatar
Novatek 19,40% E Russia Russia
Pars LNG Limited 40,00% E Bermuda Iran
Petrocedeno 30,32% E Venezuela Venezuela
Private Oil Holdings Oman Limited 10,00% E United Kingdom Oman
Stogg Eagle Funding B.V. 100,00% Netherlands Nigeria
Tepkri Sarsang A/S 100,00% Denmark Iraq
Termokarstovoye S.A.S. 100,00% France France
Terneftegaz JSC (a) 58,89% E Russia Russia
Total (BTC) B.V. 100,00% Netherlands Azerbaijan
Total Abu Al Bu Khoosh 100,00% France United Arab Emirates
Total Austral 100,00% France Argentina
Total Brazil Services B.V. 100,00% Netherlands Netherlands
Total Danmark Pipelines A/S 100,00% Denmark Denmark
Total Denmark ASW Pipeline ApS 100,00% Denmark Denmark
Total Denmark ASW, Inc. 100,00% United States Denmark
Total Dolphin Midstream 100,00% France France
Total E&P Chissonga 100,00% France Angola
Total E&P Absheron B.V. 100,00% Netherlands Azerbaijan
Total E&P Al Shaheen A/S 100,00% Denmark Qatar
Total E&P Algerie 100,00% France Algeria
Total E&P Algerie Berkine A/S 100,00% Denmark Algeria
Total E&P Americas, LLC 100,00% United States United States
Total E&P Anchor, LLC 100,00% United States United States
Total E&P Angola 100,00% France Angola
Total E&P Angola Block 15/06 100,00% France Angola
Total E&P Angola Block 16 100,00% France Angola
Total E&P Angola Block 16 Holdings 100,00% France Angola
Total E&P Angola Block 17.06 100,00% France Angola
Total E&P Angola Block 25 100,00% France Angola
Total E&P Angola Block 32 100,00% France Angola
Total E&P Angola Block 33 100,00% France Angola
Total E&P Angola Block 39 100,00% France Angola
Total E&P Angola Block 40 100,00% France Angola
Total E&P Angola Block 48 B.V. 100,00% Netherlands Angola
Total E&P Angola Blocks 20-21 100,00% France Angola
Total E&P Aruba B.V. 100,00% Netherlands Aruba
Total E&P Asia Pacific Pte. Limited 100,00% Singapore Singapore
Total E&P Azerbaijan B.V. 100,00% Netherlands Azerbaijan
Total E&P Bolivie 100,00% France Bolivia
Total E&P Borneo B.V. 100,00% Netherlands Brunei
Total E&P Bulgaria B.V. 100,00% Netherlands Bulgaria
Total E&P Cambodge 100,00% France Cambodia
Total E&P Canada Limited 100,00% Canada Canada
Total E&P Chine 100,00% France China
Total E&P Colombie 100,00% France Colombia
Total E&P Congo 85,00% Congo Congo
Total E&P Cote d'Ivoire 100,00% France Côte d'Ivoire
Total E&P Cote d'Ivoire CI - 514 100,00% France Côte d'Ivoire
Total E&P Cote d'Ivoire CI - 515 100,00% France Côte d'Ivoire
Total E&P Cote d'Ivoire B.V. 100,00% Netherlands Côte d'Ivoire
Total E&P Cyprus B.V. 100,00% Netherlands Cyprus
Total E&P Danmark A/S - CPH 100,00% Denmark Denmark
Total E&P Danmark A/S -EBJ 100,00% Denmark Denmark
Total E&P Do Brasil Ltda 100,00% Brazil Brazil
Total E&P Dolphin Upstream 100,00% France Qatar
Total E&P Dunga GmbH 100,00% Germany Kazakhstan
Total E&P East El Burullus Offshore B.V. 100,00% Netherlands Egypt
Total E&P Egypt Block 2 B.V. 100,00% Netherlands Egypt
Total E&P Egypte 100,00% France Egypt
Total E&P Europe and Central Asia Limited 100,00% United Kingdom United Kingdom
Total E&P France 100,00% France France
Total E&P Golfe Limited 100,00% France Qatar
Total E&P Greece B.V. 100,00% Netherlands Greece
Total E&P Guyana B.V. 100,00% Netherlands Guyana
Total E&P Guyane Francaise 100,00% France France
Total E&P Holdings Russia 100,00% France France
Total E&P Holdings UAE B.V. 100,00% Netherlands United Arab Emirates
Total E&P International K1 Limited 100,00% Kenya Kenya
Total E&P International K2 Limited 100,00% Kenya Kenya
Total E&P International K3 Limited 100,00% Kenya Kenya
Total E&P International Limited 100,00% United Kingdom Kenya
Total E&P Iraq 100,00% France Iraq
Total E&P Ireland B.V. 100,00% Netherlands Ireland
Total E&P Italia 100,00% Italy Italy
Total E&P Jack LLC 100,00% United States United States
Total E&P Jutland Denmark B.V. 100,00% Netherlands Denmark
Total E&P Kazakhstan 100,00% France Kazakhstan
Total E&P Kenya B.V. 100,00% Netherlands Kenya
Total E&P Kurdistan Region of Iraq (Harir) B.V. 100,00% Netherlands Iraq
Total E&P Kurdistan Region of Iraq (Safen) B.V. 100,00% Netherlands Iraq
Total E&P Kurdistan Region of Iraq (Taza) B.V. 100,00% Netherlands Iraq
Total E&P Kurdistan Region of Iraq B.V. 100,00% Netherlands Iraq
Total E&P Liban S.A.L. 100,00% Lebanon Lebanon
Total E&P Libye 100,00% France Libya
1/11 2020 Perimeter
#TOTAL Classification: Restricted Distribution TOTAL - All rights reserved

Total E&P Lower Zakum B.V. 100,00% Netherlands United Arab Emirates
Total E&P M2 Holdings Limited 100,00% South Africa South Africa
Total E&P Malaysia 100,00% France Malaysia
Total E&P Mauritania Block C18 B.V. 100,00% Netherlands Mauritania
Total E&P Mauritania Block C9 B.V. 100,00% Netherlands Mauritania
Total E&P Mauritania Blocks DW B.V. 100,00% Netherlands Mauritania
Total E&P Mauritanie 100,00% France Mauritania
Total E&P Mexico S.A. de C.V. 100,00% Mexico Mexico
Total E&P Mozambique B.V. 100,00% Netherlands Mozambique
Total E&P Myanmar 100,00% France Myanmar
Total E&P Namibia B.V. 100,00% Netherlands Namibia
Total E&P Nederland B.V. 100,00% Netherlands Netherlands
Total E&P New Ventures Inc. 100,00% United States United States
Total E&P Nigeria Deepwater A Limited 100,00% Nigeria Nigeria
Total E&P Nigeria Deepwater B Limited 100,00% Nigeria Nigeria
Total E&P Nigeria Deepwater C Limited 100,00% Nigeria Nigeria
Total E&P Nigeria Deepwater D Limited 100,00% Nigeria Nigeria
Total E&P Nigeria Deepwater E Limited 100,00% Nigeria Nigeria
Total E&P Nigeria Deepwater F Limited 100,00% Nigeria Nigeria
Total E&P Nigeria Deepwater G Limited 100,00% Nigeria Nigeria
Total E&P Nigeria Deepwater H Limited 100,00% Nigeria Nigeria
Total E&P Nigeria Limited 100,00% Nigeria Nigeria
Total E&P Nigeria S.A.S. 100,00% France France
Total E&P Norge AS 100,00% Norway Norway
Total E&P North Sea UK Limited 100,00% United Kingdom United Kingdom
Total E&P Oman 100,00% France Oman
Total E&P Participations Petrolieres Congo 100,00% Congo Congo
Total E&P Philippines B.V. 100,00% Netherlands Philippines
Total E&P Qatar 100,00% France Qatar
Total E&P RDC 100,00% Democratic Republic of Congo Democratic Republic of Congo
Total E&P Research & Technology USA LLC 100,00% United States United States
Total E&P Russie 100,00% France Russia
Total E&P Sao Tome and Principe B.V. 100,00% Netherlands Angola
Total E&P Senegal 100,00% France Senegal
Total E&P Services China Company Limited 100,00% China China
Total E&P South Africa B.V. 100,00% Netherlands South Africa
Total E&P South Africa Block 567 (Pty) Ltd 100,00% South Africa South Africa
Total E&P South Pars 100,00% France Iran
Total E&P South Sudan 100,00% France Republic of South Sudan
Total E&P Suriname B.V. 100,00% Netherlands Suriname
Total E&P Syrie 100,00% France Syrian Arab Republic
Total E&P Tajikistan B.V. 100,00% Netherlands Tajikistan
Total E&P Thailand 100,00% France Thailand
Total E&P Three Pl B.V. 100,00% Netherlands Brazil
Total E&P Timan-Pechora LLC 100,00% Russia Russia
Total E&P UAE Unconventional Gas B.V. 100,00% Netherlands United Arab Emirates
Total E&P Uganda B.V. 100,00% Netherlands Uganda
Total E&P UK Limited 100,00% United Kingdom United Kingdom
Total E&P Umm Shaif Nasr B.V. 100,00% Netherlands United Arab Emirates
Total E&P Uruguay B.V. 100,00% Netherlands Uruguay
Total E&P Uruguay Onshore B.V. 100,00% Netherlands Uruguay
Total E&P US Well Containment, LLC 100,00% United States United States
Total E&P USA Inc. 100,00% United States United States
Total E&P USA Oil Shale, LLC 100,00% United States United States
Total E&P Waha Limited 100,00% Cayman Islands Libya
Total E&P Well Response 100,00% France France
Total E&P Yemen 100,00% France Yemen
Total E&P Yemen Block 3 B.V. 100,00% Netherlands Yemen
Total East Africa Midstream B.V. 100,00% Netherlands Uganda
Total Energy (Meuk) Limited 100,00% United Kingdom United Kingdom
Total Exploration M'Bridge 100,00% Netherlands Angola
Total Facilities Management B.V. 100,00% Netherlands Netherlands
Total Gabon 58,28% Gabon Gabon
Total Gass Handel Norge AS 100,00% Norway Norway
Total Gastransport Nederland B.V. 100,00% Netherlands Netherlands
Total Holding Dolphin Amont 100,00% France France
Total Holdings Nederland B.V. 100,00% Netherlands Netherlands
Total Holdings Nederland International B.V. 100,00% Netherlands Netherlands
Total Iran B.V. 100,00% Netherlands Iran
Total LNG Supply Services USA Inc. 100,00% United States United States
Total Oil and Gas South America 100,00% France France
Total Oil and Gas Venezuela B.V. 100,00% Netherlands Venezuela
Total Oil Gb Limited 100,00% United Kingdom United Kingdom
Total Oil UK Limited 100,00% United Kingdom United Kingdom
Total P&G do Brasil Ltda 100,00% Brazil Brazil
Total Pars LNG 100,00% France France
Total Petroleum Angola 100,00% France Angola
Total Profils Petroliers 100,00% France France
Total Qatar 100,00% France Qatar
Total South Pars 100,00% France Iran
Total Upstream Danmark A/S 100,00% Denmark Denmark
Total Upstream Nigeria Limited 100,00% Nigeria Nigeria
Total Upstream UK Limited 100,00% United Kingdom United Kingdom
Total Venezuela 100,00% France France
Uintah Colorado Resources, LLC 66,67% United States United States
Unitah Colorado Resources II, LLC 100,00% United States United States
Ypergas S.A. 37,33% Venezuela Venezuela
Integrated Gas, Renewables & Power Abu Dhabi Gas Liquefaction Company Limited 5,00% E United Arab Emirates United Arab Emirates
Adani Gas Limited AGL 37,40% E India India
Adani Green Energy Twenty Three Limited 50,00% E India India
Adani Total Private Limited (e) 50,00% E India India
Advanced Thermal Batteries Inc. 49,99% E United States United States
Aerospatiale Batteries (ASB) 49,99% E France France
Aerowatt Energies 65,00% E France France
Aerowatt Energies 2 51,00% E France France
Abarloar Solar, S.L.U. 100,00% Spain Spain
Alcad AB 99,99% Sweden Sweden
Alicante 50,00% E France France
Alicante 2 50,00% E France France
Al Kharsaa Solar Holdings B.V. 49,00% E Netherlands Netherlands
Amber Solar Power Cinco, S.L. 65,00% E Spain Spain
Amber Solar Power Cuatro, S.L. 65,00% E Spain Spain
Amber Solar Power Dieciseis, S.L. 65,00% E Spain Spain
Amber Solar Power Diez, S.L. 65,00% E Spain Spain
Amber Solar Power Nueve, S.L. 65,00% E Spain Spain
Amber Solar Power Quince, S.L. 65,00% E Spain Spain
Amber Solar Power Tres, S.L. 65,00% E Spain Spain
2/11 2020 Perimeter
#TOTAL Classification: Restricted Distribution TOTAL - All rights reserved

Amber Solar Power Uno, S.L. 65,00% E Spain Spain
Anayet Solar, S.L.U. 100,00% Spain Spain
Armada Solar, S.L.U. 100,00% Spain Spain
Amura Solar, S.L.U. 100,00% Spain Spain
Angola LNG Limited 13,60% E Bermuda Angola
Arbotante Solar, S.L.U. 100,00% Spain Spain
Arctic LNG 2 LLC (b) 21,64% E Russia Russia
ATJV Offshore 50,00% E Singapore Singapore
Automotive Cells Company, S.E. 49,99% E France France
Baser Comercializadora de Referencia 100,00% Spain Spain
Bassin Du Capiscol 100,00% France France
Beauce Oratorienne 100,00% France France
Biogaz Breuil 100,00% France France
Biogaz Chatillon 100,00% France France
Biogaz Corcelles 100,00% France France
Biogaz Epinay 100,00% France France
Biogaz Libron 100,00% France France
Biogaz Milhac 100,00% France France
Biogaz Soignolles 100,00% France France
Biogaz Torcy 100,00% France France
Biogaz Vert Le Grand 100,00% France France
Biogaz Viriat 100,00% France France
Borrowed Sunshine II Parent, LLC 51,61% United States United States
Borrowed Sunshine II, LLC 51,61% United States United States
BSP Class B Member HoldCo, LLC 51,61% United States United States
BSP Class B Member, LLC 51,61% United States United States
BSP Holding Company, LLC 51,61% United States United States
BSP II Parent, LLC 51,61% United States United States
Cameron LNG Holdings LLC 16,60% E United States United States
Centrale Eolienne Ploumoguer 100,00% France France
Centrale Eolienne De Goulien 100,00% France France
Centrale Eolienne De La Vallee Gentillesse 74,80% France France
Centrale Hydrolique Alas 100,00% France France
Centrale Hydrolique Ardon 90,00% France France
Centrale Hydrolique Arvan 100,00% France France
Centrale Hydrolique Barbaira 100,00% France France
Centrale Hydrolique Bonnant 100,00% France France
Centrale Hydrolique Gavet 100,00% France France
Centrale Hydrolique La Buissiere 100,00% France France
Centrale Hydrolique Miage 100,00% France France
Centrale Hydrolique Previnquieres 100,00% France France
Centrale Photovoltaique De Merle Sud 40,58% E France France
Centrale Photovoltaique Du Seneguier 100,00% France France
Centrale Photovoltaique Le Barou 100,00% France France
Centrale Solaire 2 100,00% France France
Centrale Solaire Autoprod 100,00% France France
Centrale Solaire Base 112 100,00% France France
Centrale Solaire Beauce Val de Loire 100,00% France France
Centrale Solaire Briffaut 100,00% France France
Centrale Solaire Centre Ouest 2 100,00% France France
Centrale Solaire Cet De Hesse 100,00% France France
Centrale Solaire Chauveau 100,00% France France
Centrale Solaire Chemin De Melette 100,00% France France
Centrale Solaire De Cazedarnes 75,00% France France
Centrale Solaire de la Med 100,00% France France
Centrale Solaire Dom 100,00% France France
Centrale Solaire Du Centre Ouest 100,00% France France
Centrale Solaire Du Lavoir 60,00% France France
Centrale Solaire Estarac 35,00% E France France
Centrale Solaire Ficon 100,00% France France
Centrale Solaire Forum Laudun 100,00% France France
Centrale Solaire Gare de Boussens 100,00% France France
Centrale Solaire Golbey 100,00% France France
Centrale Solaire Guinots 100,00% France France
Centrale Solaire Heliovale 59,63% E France France
Centrale Solaire La Fenasse 100,00% France France
Centrale Solaire La Metairie 100,00% France France
Centrale Solaire La Potence 100,00% France France
Centrale Solaire La Sauteirane 100,00% France France
Centrale Solaire La Tastere 100,00% France France
Centrale Solaire Le Castellet 100,00% France France
Centrale Solaire Les Ancizes 100,00% France France
Centrale Solaire Les Aspres 100,00% France France
Centrale Solaire Les Canebieres 100,00% France France
Centrale Solaire Les Cordeliers 83,98% France France
Centrale Solaire Les Cordeliers 2 100,00% France France
Centrale Solaire Les Galliennes 100,00% France France
Centrale Solaire Lodes 50,00% E France France
Centrale Solaire Lyreco 100,00% France France
Centrale Solaire Manosque Ombriere 100,00% France France
Centrale Solaire Mazeran Lr 50,00% E France France
Centrale Solaire Mazeran Paca 100,00% France France
Centrale Solaire Olinoca 10,00% E France France
Centrale Solaire Ombrieres Cap Agathois 83,98% France France
Centrale Solaire Ombrieres De Blyes 100,00% France France
Centrale Solaire Ombrieres P5 100,00% France France
Centrale Solaire Pezenas 100,00% France France
Centrale Solaire Piennes 100,00% France France
Centrale Solaire Plateau De Pouls 51,00% France France
Centrale Solaire Pont Sur Sambre 100,00% France France
Centrale Solaire Quadrao 100,00% France France
Centrale Solaire Quinipily 2 100,00% France France
Centrale Solaire Sainte-Marie La Mare 100,00% France France
Centrale Solaire SPW2 100,00% France France
Centrale Solaire Supdevenergie 100,00% France France
Centrale Solaire Toiture Josse 100,00% France France
Centrale Solaire TQ1 100,00% France France
Centrale Solaire Valorbi 100,00% France France
Centrale Solaire Zabo 100,00% France France
Centrale Solaire Zabo 2 100,00% France France
Cerezo Solar, S.L.U. 100,00% Spain Spain
Cidra Solar, S.L.U. 100,00% Spain Spain
Co Biogaz 26,00% E France France
Cogenra Solar, Inc. 51,61% United States United States
Colón LNG Marketing S. de R. L. 50,00% E Panama Panama
Cote d'Ivoire GNL 34,00% E Côte d'Ivoire Côte d'Ivoire
DAJA 148 100,00% France France
3/11 2020 Perimeter
#TOTAL Classification: Restricted Distribution TOTAL - All rights reserved

DAJA 154 100,00% France France
DAJA 160 100,00% France France
ECA LNG Holdings B.V. 16,60% E Netherlands Netherlands
Eclipse Solar SPA 100,00% Chile Chile
Edelweis Solar, S.L.U. 100,00% Spain Spain
EDP Comercializadora S.A.U. 100,00% Spain Spain
EDP Energia S.A.U. 100,00% Spain Spain
Electricite Solaire De Molleges 100,00% France France
Energie Developpement 50,00% E France France
Eole Boin 100,00% France France
Eole Champagne Conlinoise 66,00% E France France
Eole Cote Du Moulin 100,00% France France
Eole Fonds Caraibes 100,00% France France
Eole Grand Maison 100,00% France France
Eole La Montagne 87,60% France France
Eole La Perriere S.A.R.L. 100,00% France France
Eole Les Buissons 100,00% France France
Eole Morne Carriere 100,00% France France
Eole Morne Constant 100,00% France France
Eole Moulin Tizon 100,00% France France
Eole Pierrefitte Es Bois 100,00% France France
Eole Sorbon II 100,00% France France
Eole Yate 100,00% France France
Eoliennes Arques 3 100,00% France France
Eoliennes Du Champ Chardon 100,00% France France
Eolmed 20,00% E France France
Falla Solar, S.L.U. 100,00% Spain Spain
Fast Jung KB 99,99% Sweden Sweden
Finansol 1 100,00% France France
Finansol 2 100,00% France France
Finansol 3 100,00% France France
Fluxsol 100,00% France France
Frieman & Wolf Batterietechnick GmbH 99,99% Germany Germany
Gas Del Litoral SRLCV 25,00% E Mexico Mexico
Gfs I Holding Company, LLC 51,61% United States United States
Glaciere De Palisse 100,00% France France
Global Energy Armateur SNC 100,00% France France
Global LNG Armateur S.A.S. 100,00% France France
Global LNG Downstream S.A.S. 100,00% France France
Global LNG North America Corporation 100,00% United States United States
Global LNG S.A.S. 100,00% France France
Global LNG UK Limited 100,00% United Kingdom United Kingdom
Go Electric 99,99% United States United States
Golden Fields Solar I, LLC 51,61% United States United States
Goodfellow Solar Construction, LLC 51,61% United States United States
Goodfellow Solar II, LLC 51,61% United States United States
Goodfellow Solar III, LLC 51,61% United States United States
Gray Whale Offshore Wind Power No.1 Co., Ltd 50,00% E South Korea South Korea
Gray Whale Offshore Wind Power No.2 Co., Ltd 50,00% E South Korea South Korea
Greenflex Actirent Group, S.L. 100,00% Spain Spain
Greenflex S.A.S. 99,99% France France
GridVault DR1, LLC 51,61% United States United States
Grillete Solar, S.L.U. 100,00% Spain Spain
Gulf Total Tractebel Power Company PSJC 20,00% E United Arab Emirates United Arab Emirates
Helio 100 Kw 100,00% France France
Helio 21 100,00% France France
Helio 974 Sol 1 100,00% France France
Helio 974 Toitures 100,00% France France
Helio 974 Toiture 2 100,00% France France
Helio Bakia 50,00% E France France
Helio Boulouparis 50,00% E France France
Helio Boulouparis 2 50,00% E France France
Helio Fonds Caraibes 100,00% France France
Helio Koumac 50,00% E France France
Helio L'R 100,00% France France
Helio Moindah 100,00% France France
Helio Piin Patch 50,00% E France France
Helio Plaine des Gaiacs 100,00% France France
Helio Popidery 50,00% E France France
Helio Reunion 100,00% France France
Helio Saint Benoit 100,00% France France
Helio Tamoa 50,00% E France France
Helio Temala 50,00% E France France
Helio Tontouta 100,00% France France
Helio Wabealo 100,00% France France
Helix Project III, LLC 51,61% United States United States
Helix Project V, LLC 51,61% United States United States
HETTY 100,00% France France
Holding Eole 2018 100,00% France France
Hydro Tinee 50,00% E France France
Hydromons 100,00% France France
Ichthys LNG PTY Limited 26,00% E Australia Australia
Institut Photovoltaique D'Ile De France (IPVF) 43,00% France France
Ise Total Nanao Power Plant G.K. 50,00% E Japan Japan
JDA Overseas Holdings, LLC 51,61% United States United States
Jingdan New Energy investment (Shanghai) Co. Ltd 50,00% E China China
Jmcp 50,05% France France
JOBS Tugboat, LLC 51,61% United States United States
Komundo Offshore Wind Power Co., Ltd 50,00% E South Korea South Korea
LA Basin Solar I, LLC 51,61% United States United States
La Compagnie Electrique de Bretagne 100,00% France France
La Metairie Neuve 25,00% E France France
La Seauve 95,01% France France
Lampiris S.A. 100,00% Belgium Belgium
Lanuza Solar, S.L.U. 100,00% Spain Spain
Lemoore Stratford Land Holdings IV, LLC 51,61% United States United States
Les Vents De Nivillac 100,00% France France
Les Vents De Ranes 100,00% France France
Leuret 100,00% France France
Lincoln Solar Star, LLC 51,61% United States United States
Luce Solar SPA 100,00% Chile Chile
Luminora Solar cuatro, S.L. 65,00% E Spain Spain
Luminora Solar Dos, S.L. 65,00% E Spain Spain
Luminora Solar Tres, S.L. 65,00% E Spain Spain
Margeriaz Energie 100,00% France France
Marysville Unified School District Solar, LLC 51,61% United States United States
Mauricio Solar, S.L.U. 100,00% Spain Spain
4/11 2020 Perimeter
#TOTAL Classification: Restricted Distribution TOTAL - All rights reserved

Maxeon Solar Technologies, Pte. Ltd. 36,40% E Singapore Singapore
Messigaz SNC 100,00% France France
Methanergy 100,00% France France
Missiles & Space Batteries Limited 49,99% E United Kingdom United Kingdom
Miyagi Osato Solar Park G.K. 45,00% E Japan Japan
Miyako Kuzakai Solarpark G.K. 50,00% E Japan Japan
Mojave Solar Investment, LLC 51,61% United States United States
Moz LNG1 Financing Company Ltd 26,50% United Arab Emirates United Arab Emirates
Moz LNG1 Holding Company Ltd 26,50% United Arab Emirates United Arab Emirates
Mozambique MOF Company S.A. 26,50% Mozambique Mozambique
Mozambique LNG Marine Terminal Company S.A. 26,50% Mozambique Mozambique
Mulilo Prieska PV (RF) Proprietary Limited 27,00% E South Africa South Africa
National Gas Shipping Company Limited 5,00% E United Arab Emirates United Arab Emirates
NEM Solar Targetco, LLC 51,61% United States United States
Nevada Joint Union High School District Solar, LLC 51,61% United States United States
Nigeria LNG Limited 15,00% E Nigeria Nigeria
NorthStar Energy Management, LLC 51,61% United States United States
NorthStar Energy Management Nevada, LLC 51,61% United States United States
Nouvelle Centrale Eolienne de Lastours 50,00% E France France
Nuza Solar, S.L.U. 100,00% Spain Spain
Nyk Armateur S.A.S. 50,00% E France France
Oman LNG, LLC 5,54% E Oman Oman
Parc Eolien Nordex III 50,00% E France France
Parc Eolien Nordex XXIX 50,00% E France France
Parc Eolien Nordex XXX 50,00% E France France
Parc Solaire De Servian 100,00% France France
Parc Solaire De Servian 2 100,00% France France
Parque Fotovoltaico Alicahue Solar SPA 100,00% Chile Chile
Parque Fotovoltaico Santa Adriana Solar SPA 100,00% Chili Chili
Partrederiet Bw Gas Global LNG 49,00% E Norway Norway
Perpetual Sunhine Solar Program I, LLC 51,61% United States United States
Perpetual Sunshine I, LLC 51,61% United States United States
Pilastra Solar, S.L.U. 100,00% Spain Spain
Portalon Solar, S.L.U. 100,00% Spain Spain
Pos 100,00% France France
Pos Production Ii 60,00% France France
Pos Production Iii 70,00% France France
Pos Production Iv 70,00% France France
Pos Production V 70,00% France France
Postigo Solar, S.L.U. 100,00% Spain Spain
Qatar Liquefied Gas Company Limited 10,00% E Qatar Qatar
Qatar Liquefied Gas Company Limited (II) 16,70% E Qatar Qatar
Quadrica 51,00% E France France
Quilla Solar, S.L.U. 100,00% Spain Spain
RLA Solar SPA 100,00% Chile Chile
Rosamond Raven Holdings, LLC 51,61% United States United States
Saft (Zhuhai FTZ) Batteries Company Limited 99,99% China China
Saft (Zhuhai) Energy Storage Co 99,99% China China
Saft AB 99,99% Sweden Sweden
Saft Acquisition S.A.S. 99,99% France France
Saft America Inc. 99,99% United States United States
Saft AS 99,99% Norway Norway
Saft Australia PTY Limited 99,99% Australia Australia
Saft Batterias SL 99,99% Spain Spain
Saft Batterie Italia S.R.L. 99,99% Italy Italy
Saft Batterien GmbH 99,99% Germany Germany
Saft Batteries Pte Limited 99,99% Singapore Singapore
Saft Batteries PTY Limited 99,99% Australia Australia
Saft Batterijen B.V. 99,99% Netherlands Netherlands
Saft Do Brasil Ltda 99,99% Brazil Brazil
Saft EV S.A.S. 99,99% France France
Saft Ferak AS 99,99% Czech Republic Czech Republic
Saft Groupe S.A. 99,99% France France
Saft Hong Kong Limited 99,99% Hong Kong Hong Kong
Saft India Private Limited 99,99% India India
Saft Japan KK 99,99% Japan Japan
Saft Limited 99,99% United Kingdom United Kingdom
Saft LLC 99,99% Russia Russia
Saft Nife ME Limited 99,99% Cyprus Cyprus
Saft S.A.S. 99,99% France France
Seagreen HoldCo 1 Limited 51,00% E United Kingdom United Kingdom
SGS Antelope Valley Development, LLC 51,61% United States United States
Shams Power Company PJSC 20,00% E United Arab Emirates United Arab Emirates
Societe Champenoise d'Energie 16,00% E France France
Societe d'exploitation de centrales photovoltaiques 1 25,86% France France
Societe Economie Mixte Production Energetique Renouvelable 35,92% E France France
Solar Carport NJ, LLC 51,61% United States United States
Solar Energies 65,00% E France France
Solar Sail, LLC 51,61% United States United States
Solar Sail Commercial DevCo I, LLC 51,61% United States United States
Solar Sail Commercial Holdings, LLC 51,61% United States United States
Solar Sail Commercial MPW DevCo, LLC 51,61% United States United States
Solar Star Always Low Prices Ct, LLC 51,61% United States United States
Solar Star Always Low Prices Hi, LLC 51,61% United States United States
Solar Star Always Low Prices Ma, LLC 51,61% United States United States
Solar Star Arizona HMR-I, LLC 51,61% United States United States
Solar Star Arizona II, LLC 51,61% United States United States
Solar Star Arizona VII, LLC 51,61% United States United States
Solar Star Bay City 2, LLC 51,61% United States United States
Solar Star Bear Creek, LLC 51,61% United States United States
Solar Star Big Apple CDG, LLC 51,61% United States United States
Solar Star Big Apple BTM, LLC 51,61% United States United States
Solar Star California I, LLC 51,61% United States United States
Solar Star California IV, LLC 51,61% United States United States
Solar Star California LXXV, LLC 51,61% United States United States
Solar Star California LXXVI, LLC 51,61% United States United States
Solar Star California XXXV, LLC 51,61% United States United States
Solar Star California XXXVI, LLC 51,61% United States United States
Solar Star California XXXVIII, LLC 51,61% United States United States
Solar Star Co Co 1, LC 51,61% United States United States
Solar Star Co Co 2, LLC 51,61% United States United States
Solar Star Coastal Pirate, LLC 51,61% United States United States
Solar Star Colorado II, LLC 51,61% United States United States
Solar Star CRC Kern Front, LLC 51,61% United States United States
Solar Star CRC Yowlumne 1 North, LLC 51,61% United States United States
Solar Star CRC Yowlumne 2 South, LLC 51,61% United States United States
Solar Star CRC North Shafter, LLC 51,61% United States United States
5/11 2020 Perimeter
#TOTAL Classification: Restricted Distribution TOTAL - All rights reserved

Solar Star CRC Pier A West, LLC 51,61% United States United States
Solar Star CRC Mt. Poso, LLC 51,61% United States United States
Solar Star Deer Island, LLC 51,61% United States United States
Solar Star Energy Center, LLC 51,61% United States United States
Solar Star Golden Empire, LLC 51,61% United States United States
Solar Star Harbor, LLC 51,61% United States United States
Solar Star HD Maryland, LLC 51,61% United States United States
Solar Star HD New Jersey, LLC 51,61% United States United States
Solar Star HD New York, LLC 51,61% United States United States
Solar Star Healthy 1, LLC 51,61% United States United States
Solar Star Healthy Lake, LLC 51,61% United States United States
Solar Star Hernwood, LLC 51,61% United States United States
Solar Star Kale 1, LLC 51,61% United States United States
Solar Star Khsd, LLC 51,61% United States United States
Solar Star LA County High Desert, LLC 51,61% United States United States
Solar Star LCR Culver City, LLC 51,61% United States United States
Solar Star LCR Irvine, LLC 51,61% United States United States
Solar Star LCR LA 1, LLC 51,61% United States United States
Solar Star LCR LA 2, LLC 51,61% United States United States
Solar Star LCR Split 1, LLC 51,61% United States United States
Solar Star LCR Split 2, LLC 51,61% United States United States
Solar Star Lincoln School, LLC 51,61% United States United States
Solar Star MA - Tewksbury, LLC 51,61% United States United States
Solar Star Massachusetts II, LLC 51,61% United States United States
Solar Star Massachusetts III, LLC 51,61% United States United States
Solar Star Maxx 1, LLC 51,61% United States United States
Solar Star Meridian Park West, LLC 51,61% United States United States
Solar Star Parent CRC Kern Front, LLC 51,61% United States United States
Solar Star Parent CRC Mt. Poso, LLC 51,61% United States United States
Solar Star Parent CRC North Shafter, LLC 51,61% United States United States
Solar Star Parent CRC Pier A West, LLC 51,61% United States United States
Solar Star Parent CRC Yowlumne 1 North, LLC 51,61% United States United States
Solar Star Parent CRC Yowlumne 2 South, LLC 51,61% United States United States
Solar Star Parkton, LLC 51,61% United States United States
Solar Star Prairie Holding, LLC 51,61% United States United States
Solar Star Prime 2, LLC 51,61% United States United States
Solar Star Prime 3, LLC 51,61% United States United States
Solar Star Prime 4, LLC 51,61% United States United States
Solar Star Prime SCK3, LLC 51,61% United States United States
Solar Star Rancho CWD I, LLC 51,61% United States United States
Solar Star River, LLC 51,61% United States United States
Solar Star Track, LLC 51,61% United States United States
Solar Star Track Anacostia, LLC 51,61% United States United States
Solar Star Track Cheverly, LLC 51,61% United States United States
Solar Star Track Southern Ave 1, LLC 51,61% United States United States
Solar Star Track Southern Ave 2, LLC 51,61% United States United States
Solar Star Track Southern Ave Bus, LLC 51,61% United States United States
Solar Star Tranquility, LLC 51,61% United States United States
Solar Star Unkety Brook, LLC 51,61% United States United States
Solar Star Urbana Landfill Central, LLC 51,61% United States United States
Solar Star Urbana Landfill East, LLC 51,61% United States United States
Solar Star Vegas 1, LLC 51,61% United States United States
Solar Star Woodlands St Cr, LLC 51,61% United States United States
SolarBridge Technologies Inc. 51,61% United States United States
Solarstar Billerica I, LLC 51,61% United States United States
Solarstar Ma I, LLC 51,61% United States United States
Solarstar Prime I, LLC 51,61% United States United States
SolarStorage Fund A, LLC 51,61% United States United States
SolarStorage Fund B, LLC 51,61% United States United States
SolarStorage Fund C, LLC 51,61% United States United States
SolarStorage Fund D, LLC 51,61% United States United States
South Hook LNG Terminal Company Limited 8,35% E United Kingdom United Kingdom
Spinnaker Solar, S.L.U. 100,00% Spain Spain
SPWR SS 1, LLC 51,61% United States United States
SPWR SunStrong Holdings, LLC 51,61% United States United States
SSCA XLI Holding Company, LLC 51,61% United States United States
SunPower AssetCo, LLC 51,61% United States United States
SunPower Bobcat Solar, LLC 51,61% United States United States
SunPower Capital Services, LLC 51,61% United States United States
SunPower Capital, LLC 51,61% United States United States
SunPower Commercial FTB Construction, LLC 51,61% United States United States
SunPower Commercial Holding Company FTB SLB Parent, LLC 51,61% United States United States
SunPower Commercial Holding Company FTB SLB, LLC 51,61% United States United States
SunPower Corporation 51,61% United States United States
SunPower Corporation, Systems 51,61% United States United States
SunPower DevCo, LLC 51,61% United States United States
SunPower Electrical of New York, LLC 51,61% United States United States
SunPower Energia SPA 51,61% Chile Chile
SunPower Energy Systems Canada Corporation 51,61% Canada Canada
SunPower Equity Holdings, LLC 51,61% United States United States
SunPower Foundation 51,61% United States United States
SunPower Helix I, LLC 51,61% United States United States
SunPower HoldCo, LLC 51,61% United States United States
SunPower Manufacturing Oregon, LLC 51,61% United States United States
SunPower North America, LLC 51,61% United States United States
SunPower NY CDG 1,LLC 51,61% United States United States
SunPower Philippines Limited - Regional Operating Headquarters 51,61% Cayman Islands Cayman Islands
SunPower Revolver HoldCo I Parent, LLC 51,61% United States United States
SunPower Revolver HoldCo I, LLC 51,61% United States United States
SunPower Systems Mexico S. de R.L. de C.V. 51,61% Mexico Mexico
SunPower Technologies Assetco Holdings, LLC 51,61% United States United States
SunStrong Capital Acquisition 3, LLC 51,61% United States United States
Sunstrong Capital Holdings, LLC 51,61% E United States United States
SunStrong Partners, LLC 51,61% E United States United States
Sunzil 50,00% E France France
Swingletree Operations, LLC 51,61% United States United States
Tadiran Batteries GmbH 99,99% Germany Germany
Tadiran Batteries Limited 99,99% Israel Israel
Temasol 51,61% Morocco Morocco
Tenesol SPV 1 100,00% France France
Tianneng Saft Energy Joint Stock Company 39,99% E China China
TIEA Energie 100,00% France France
Total Carbon Neutrality Ventures Europe 100,00% France France
Total Carbon Neutrality Ventures International 100,00% France France
Total Direct Energie - Centrale Electrique Bayet 100,00% France France
Total Direct Energie - Centrale Electrique Marchienne-au-Pont 100,00% Belgium Belgium
Total Direct Energie - Centrale Electrique Saint Avold 100,00% France France
6/11 2020 Perimeter
#TOTAL Classification: Restricted Distribution TOTAL - All rights reserved

Total Direct Energie Belgium 100,00% Belgium Belgium
Total Direct Energie - Centrale Electrique de Toul 100,00% France France
Total Direct Energie Generation 100,00% France France
Total Direct Energie S.A. 100,00% France France
Total Direct Energie Services 100,00% Belgium Belgium
Total Direct Energies Centrale Electrique de Pont Sur Sambres 100,00% France France
Total E&P Angola Developpement Gaz 100,00% France Angola
Total E&P Australia 100,00% France Australia
Total E&P Australia Exploration PTY Limited 100,00% Australia Australia
Total E&P Australia II 100,00% France Australia
Total E&P Australia III 100,00% France Australia
Total E&P Barnett USA, LLC 100,00% United States United States
Total E&P Holding Ichthys 100,00% France France
Total E&P Holdings Australia PTY Limited 100,00% Australia Australia
Total E&P Ichthys B.V. 100,00% Netherlands Australia
Total E&P Indonesia Mentawai B.V. 100,00% Netherlands Indonesia
Total E&P Indonesie 100,00% France Indonesia
Total E&P Mauritius Holding Limited 100,00% Mauritius Island Mauritius Island
Total E&P Mozambique Area 1, Limitada 100,00% Mozambique Mozambique
Total E&P Oman Block 12 B.V. 100,00% Netherlands Oman
Total E&P Oman Dev. B.V 100,00% Netherlands Oman
Total E&P PNG 2 B.V. 100,00% Netherlands Papua New Guinea
Total E&P PNG 5 B.V. 100,00% Netherlands Papua New Guinea
Total E&P PNG Limited 100,00% Papua New Guinea Papua New Guinea
Total E&P Salmanov 100,00% France France
Total E&P Sebuku 100,00% France Indonesia
Total E&P Singapore Pte. Ltd. 100,00% Singapore Singapore
Total E&P Yamal 100,00% France France
Total Energia Italia S.R.L. 100,00% Italy Italy
Total Energie Gas GmbH 100,00% Germany Germany
Total Energy Investments Tianjin 100,00% China China
Total Energy Services 100,00% France France
Total Energy Ventures Emerging Markets 100,00% France France
Total Eren (c) 29,60% E France France
Total Eren Holding 33,86% E France France
Total Gas & Power Actifs Industriels 100,00% France France
Total Gas & Power Asia Private Limited 100,00% Singapore Singapore
Total Gas & Power Brazil 100,00% France France
Total Gas & Power Chartering Limited 100,00% United Kingdom United Kingdom
Total Gas & Power Infrastructure Limited 100,00% United Kingdom United Kingdom
Total Gas & Power Limited 100,00% United Kingdom United Kingdom
Total Gas & Power North America Inc. 100,00% United States United States
Total Gas & Power Services Limited 100,00% United Kingdom United Kingdom
Total Gas and Power Limited, London, Meyrin - Geneva Branch 100,00% Switzerland Switzerland
Total Gas Pipeline USA Inc. 100,00% United States United States
Total Gas Y Electricidad Argentina S.A. 100,00% Argentina Argentina
Total Gasandes 100,00% France France
Total Gaz Electricite Holdings France 100,00% France France
Total GLNG Australia 100,00% France Australia
Total GLNG Australia Holdings 100,00% France Australia
Total Investment Management Tianjin 100,00% China China
Total LNG Angola 100,00% France France
Total Midstream Holdings UK Limited 100,00% United Kingdom United Kingdom
Total Nature Based Solutions 100,00% France France
Total New Energies Limited 100,00% United Kingdom United Kingdom
Total New Energies Ventures USA, Inc. 100,00% United States United States
Total Offshore Wind Korea 100,00% France France
Total Quadran 100,00% France France
Total Quadran Caraibes 100,00% France France
Total Qadran DK Aps 100,00% Denmark Denmark
Total Quadran Nogara 50,00% E France France
Total Quadran Pacific 100,00% France France
Total Renewables 100,00% France France
Total Renewables USA, LLC 100,00% United States United States
Total Solar Assets FZE 100,00% United Arab Emirates United Arab Emirates
Total Solar Iberica, S.A.U. 100,00% Spain Spain
Total Solar International 100,00% France France
Total Solar Intl 100,00% France France
Total Solar Latin America SPA 100,00% Chile Chile
Total Solar Singapore Pte Ltd 100,00% Singapore Singapore
Total Solar (Thailand) Co., Ltd. 100,00% Thailand Thailand
Total Strong, LLC 50,00% E United States United States
Total SunPower Energia S.A. 51,61% Chile Chile
Total Tengah 100,00% France Indonesia
Total Tractebel Emirates O & M Company 50,00% E France United Arab Emirates
Total Tractebel Emirates Power Company 50,00% E France United Arab Emirates
Total USA International, LLC 100,00% United States United States
Total Yemen LNG Company Limited 100,00% Bermuda Bermuda
TQN Hydro 100,00% France France
TQN Solar 100,00% France France
TQN Solar Nogara 50,00% E France France
TQN Wind 100,00% France France
Transportadora de Gas del Mercosur S.A. 32,68% E Argentina Argentina
Trofeo Solar, S.L.U. 100,00% Spain Spain
TSGF SpA 50,00% E Chile Chile
Tugboat Commercial Pledgor, LLC 51,61% United States United States
TW2 Tugboat, LLC 51,61% United States United States
Ultralight 2 Class B Member, LLC 51,61% United States United States
Ultralight 2 Holdco, LLC 51,61% United States United States
Ultralight 2 Mezzanine Borrower, LLC 51,61% United States United States
Ultralight 2 Mezzanine Pledgor, LLC 51,61% United States United States
Ultralight 2 Residential Solar, LL 51,61% United States United States
Ultralight 2 SolarBloom, LLC 51,61% United States United States
Ultralight 2 SolarBloom Pledgor, LLC 51,61% United States United States
Valorene 66,00% France France
Vega Solar 1 S.A.P.I. de C.V. 51,61% Mexico Mexico
Vega Solar 2 S.A.P.I. de C.V. 51,61% Mexico Mexico
Vents D'Oc Energies Renouvelables 100,00% France France
Vents D'Oc Centrale D'Energie Renouvelable 17 100,00% France France
Vents D'Oc Centrale D'Energie Renouvelable 18 100,00% France France
Vertigo 25,00% E France France
Watt Prox 100,00% France France
Winergy 100,00% France France
WP France 21 100,00% France France
WP France 25 100,00% France France
Yamal LNG (d) 29,73% E Russia Russia
Yemen LNG Company Limited 39,62% E Bermuda Yemen
7/11 2020 Perimeter
#TOTAL Classification: Restricted Distribution TOTAL - All rights reserved
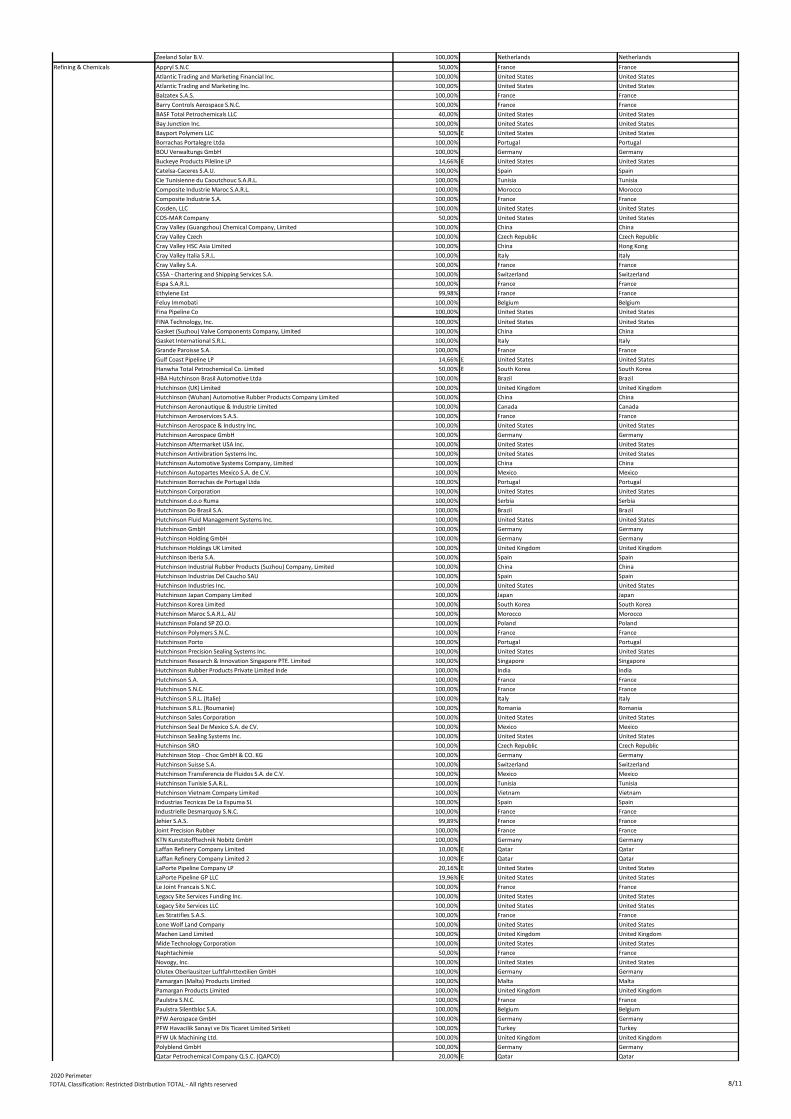
Zeeland Solar B.V. 100,00% Netherlands Netherlands
Refining & Chemicals Appryl S.N.C 50,00% France France
Atlantic Trading and Marketing Financial Inc. 100,00% United States United States
Atlantic Trading and Marketing Inc. 100,00% United States United States
Balzatex S.A.S. 100,00% France France
Barry Controls Aerospace S.N.C. 100,00% France France
BASF Total Petrochemicals LLC 40,00% United States United States
Bay Junction Inc. 100,00% United States United States
Bayport Polymers LLC 50,00% E United States United States
Borrachas Portalegre Ltda 100,00% Portugal Portugal
BOU Verwaltungs GmbH 100,00% Germany Germany
Buckeye Products Pileline LP 14,66% E United States United States
Catelsa-Caceres S.A.U. 100,00% Spain Spain
Cie Tunisienne du Caoutchouc S.A.R.L. 100,00% Tunisia Tunisia
Composite Industrie Maroc S.A.R.L. 100,00% Morocco Morocco
Composite Industrie S.A. 100,00% France France
Cosden, LLC 100,00% United States United States
COS-MAR Company 50,00% United States United States
Cray Valley (Guangzhou) Chemical Company, Limited 100,00% China China
Cray Valley Czech 100,00% Czech Republic Czech Republic
Cray Valley HSC Asia Limited 100,00% China Hong Kong
Cray Valley Italia S.R.L. 100,00% Italy Italy
Cray Valley S.A. 100,00% France France
CSSA - Chartering and Shipping Services S.A. 100,00% Switzerland Switzerland
Espa S.A.R.L. 100,00% France France
Ethylene Est 99,98% France France
Feluy Immobati 100,00% Belgium Belgium
Fina Pipeline Co 100,00% United States United States
FINA Technology, Inc. 100,00% United States United States
Gasket (Suzhou) Valve Components Company, Limited 100,00% China China
Gasket International S.R.L. 100,00% Italy Italy
Grande Paroisse S.A. 100,00% France France
Gulf Coast Pipeline LP 14,66% E United States United States
Hanwha Total Petrochemical Co. Limited 50,00% E South Korea South Korea
HBA Hutchinson Brasil Automotive Ltda 100,00% Brazil Brazil
Hutchinson (UK) Limited 100,00% United Kingdom United Kingdom
Hutchinson (Wuhan) Automotive Rubber Products Company Limited 100,00% China China
Hutchinson Aeronautique & Industrie Limited 100,00% Canada Canada
Hutchinson Aeroservices S.A.S. 100,00% France France
Hutchinson Aerospace & Industry Inc. 100,00% United States United States
Hutchinson Aerospace GmbH 100,00% Germany Germany
Hutchinson Aftermarket USA Inc. 100,00% United States United States
Hutchinson Antivibration Systems Inc. 100,00% United States United States
Hutchinson Automotive Systems Company, Limited 100,00% China China
Hutchinson Autopartes Mexico S.A. de C.V. 100,00% Mexico Mexico
Hutchinson Borrachas de Portugal Ltda 100,00% Portugal Portugal
Hutchinson Corporation 100,00% United States United States
Hutchinson d.o.o Ruma 100,00% Serbia Serbia
Hutchinson Do Brasil S.A. 100,00% Brazil Brazil
Hutchinson Fluid Management Systems Inc. 100,00% United States United States
Hutchinson GmbH 100,00% Germany Germany
Hutchinson Holding GmbH 100,00% Germany Germany
Hutchinson Holdings UK Limited 100,00% United Kingdom United Kingdom
Hutchinson Iberia S.A. 100,00% Spain Spain
Hutchinson Industrial Rubber Products (Suzhou) Company, Limited 100,00% China China
Hutchinson Industrias Del Caucho SAU 100,00% Spain Spain
Hutchinson Industries Inc. 100,00% United States United States
Hutchinson Japan Company Limited 100,00% Japan Japan
Hutchinson Korea Limited 100,00% South Korea South Korea
Hutchinson Maroc S.A.R.L. AU 100,00% Morocco Morocco
Hutchinson Poland SP ZO.O. 100,00% Poland Poland
Hutchinson Polymers S.N.C. 100,00% France France
Hutchinson Porto 100,00% Portugal Portugal
Hutchinson Precision Sealing Systems Inc. 100,00% United States United States
Hutchinson Research & Innovation Singapore PTE. Limited 100,00% Singapore Singapore
Hutchinson Rubber Products Private Limited Inde 100,00% India India
Hutchinson S.A. 100,00% France France
Hutchinson S.N.C. 100,00% France France
Hutchinson S.R.L. (Italie) 100,00% Italy Italy
Hutchinson S.R.L. (Roumanie) 100,00% Romania Romania
Hutchinson Sales Corporation 100,00% United States United States
Hutchinson Seal De Mexico S.A. de CV. 100,00% Mexico Mexico
Hutchinson Sealing Systems Inc. 100,00% United States United States
Hutchinson SRO 100,00% Czech Republic Czech Republic
Hutchinson Stop - Choc GmbH & CO. KG 100,00% Germany Germany
Hutchinson Suisse S.A. 100,00% Switzerland Switzerland
Hutchinson Transferencia de Fluidos S.A. de C.V. 100,00% Mexico Mexico
Hutchinson Tunisie S.A.R.L. 100,00% Tunisia Tunisia
Hutchinson Vietnam Company Limited 100,00% Vietnam Vietnam
Industrias Tecnicas De La Espuma SL 100,00% Spain Spain
Industrielle Desmarquoy S.N.C. 100,00% France France
Jehier S.A.S. 99,89% France France
Joint Precision Rubber 100,00% France France
KTN Kunststofftechnik Nobitz GmbH 100,00% Germany Germany
Laffan Refinery Company Limited 10,00% E Qatar Qatar
Laffan Refinery Company Limited 2 10,00% E Qatar Qatar
LaPorte Pipeline Company LP 20,16% E United States United States
LaPorte Pipeline GP LLC 19,96% E United States United States
Le Joint Francais S.N.C. 100,00% France France
Legacy Site Services Funding Inc. 100,00% United States United States
Legacy Site Services LLC 100,00% United States United States
Les Stratifies S.A.S. 100,00% France France
Lone Wolf Land Company 100,00% United States United States
Machen Land Limited 100,00% United Kingdom United Kingdom
Mide Technology Corporation 100,00% United States United States
Naphtachimie 50,00% France France
Novogy, Inc. 100,00% United States United States
Olutex Oberlausitzer Luftfahrttextilien GmbH 100,00% Germany Germany
Pamargan (Malta) Products Limited 100,00% Malta Malta
Pamargan Products Limited 100,00% United Kingdom United Kingdom
Paulstra S.N.C. 100,00% France France
Paulstra Silentbloc S.A. 100,00% Belgium Belgium
PFW Aerospace GmbH 100,00% Germany Germany
PFW Havacilik Sanayi ve Dis Ticaret Limited Sirtketi 100,00% Turkey Turkey
PFW Uk Machining Ltd. 100,00% United Kingdom United Kingdom
Polyblend GmbH 100,00% Germany Germany
Qatar Petrochemical Company Q.S.C. (QAPCO) 20,00% E Qatar Qatar
8/11 2020 Perimeter
#TOTAL Classification: Restricted Distribution TOTAL - All rights reserved

Qatofin Company Limited 49,09% E Qatar Qatar
Resilium 100,00% Belgium Belgium
Retia 100,00% France France
Retia USA LLC 100,00% United States United States
San Jacinto Rail Limited 17,00% E United States United States
Saudi Aramco Total Refining & Petrochemical Company 37,50% E Saoudia Arabia Saoudia Arabia
SigmaKalon Group B.V. 100,00% Netherlands Netherlands
Societe Bearnaise De Gestion Industrielle 100,00% France France
Societe du Pipeline Sud-Europeen 35,14% E France France
SPA Sonatrach Total Entreprise de Polymères 49,00% E Algeria Algeria
Stillman Seal Corporation 100,00% United States United States
Stop-Choc (UK) Limited 100,00% United Kingdom United Kingdom
Synova 100,00% France France
Techlam S.A.S. 100,00% France France
Thermal Control Systems Automotive Sasu 60,00% France France
Total Activites Maritimes 100,00% France France
Total Atlantic Trading Mexico SA De CV 100,00% Mexico Mexico
Total Corbion PLA B.V. 50,00% E Netherlands Netherlands
Total Country Services Belgium 100,00% Belgium Belgium
Total Deutschland GmbH (e) 100,00% Germany Germany
Total Downstream UK PLC 100,00% United Kingdom United Kingdom
Total Energy Marketing A/S 100,00% Denmark Denmark
Total European Trading 100,00% France France
Total Laffan Refinery 100,00% France France
Total Laffan Refinery II B.V. 100,00% Netherlands Netherlands
Total Lindsey Oil Refinery Limited 100,00% United Kingdom United Kingdom
Total New Energies USA, Inc. 100,00% United States United States
Total Olefins Antwerp 100,00% Belgium Belgium
Total Opslag En Pijpleiding Nederland NV 55,00% Netherlands Netherlands
Total PAR LLC 100,00% United States United States
Total Petrochemicals (Hong Kong) Limited 100,00% Hong Kong Hong Kong
Total Petrochemicals (Shangai) Limited 100,00% China China
Total Petrochemicals Development Feluy 100,00% Belgium Belgium
Total Petrochemicals Ecaussinnes 100,00% Belgium Belgium
Total Petrochemicals Feluy 100,00% Belgium Belgium
Total Petrochemicals France 100,00% France France
Total Petrochemicals Iberica 100,00% Spain Spain
Total Petrochemicals Pipeline USA Inc. 100,00% United States United States
Total Petrochemicals UK Limited 100,00% United Kingdom United Kingdom
Total Polymers Antwerp 100,00% Belgium Belgium
Total Raffinaderij Antwerpen N.V. 100,00% Belgium Belgium
Total Raffinage France 100,00% France France
Total Raffinerie Mitteldeutschland GmbH 100,00% Germany Germany
Total Refining & Chemicals 100,00% France France
Total Refining & Chemicals Saudi Arabia S.A.S. 100,00% France France
Total Research & Technology Feluy 100,00% Belgium Belgium
Total Splitter USA Inc 100,00% United States United States
Total Trading and Marketing Canada LP 100,00% Canada Canada
Total Trading Asia Pte Limited 100,00% Singapore Singapore
Total Trading Canada Limited 100,00% Canada Canada
Total Trading Products S.A. 100,00% Switzerland Switzerland
TOTSA Total Oil Trading S.A. 100,00% Switzerland Switzerland
Totseanergy 49,00% E Belgium Belgium
Transalpes S.N.C. 67,00% France France
Trans-Ethylene 99,98% France France
Tssa Total Storage & Services S.A. 100,00% Switzerland Switzerland
Vibrachoc S.A.U. 100,00% Spain Spain
Zeeland Refinery NV 55,00% Netherlands Netherlands
Marketing & Services Air Total (Suisse) S.A. 100,00% Switzerland Switzerland
Air Total International S.A. 100,00% France France
Alvea 100,00% France France
Antilles Gaz 100,00% France France
Argedis 100,00% France France
Aristea 51,00% E Belgium Belgium
Arteco 49,99% E Belgium Belgium
AS 24 100,00% France France
AS24 Belgie N.V. 100,00% Belgium Belgium
AS24 Espanola S.A. 100,00% Spain Spain
AS24 Fuel Cards Limited 100,00% United Kingdom United Kingdom
AS24 Lithuanie 100,00% Lithunia Lithunia
AS24 Polska SP ZO.O. 100,00% Poland Poland
AS24 Tankservice GmbH 100,00% Germany Germany
Charvet La Mure Bianco 100,00% France France
Clean Energy 25,63% E United States United States
Compagnie Petroliere de l'Ouest - CPO 100,00% France France
Cristal Marketing Egypt 84,62% Egypt Egypt
Total Proxi Energies Nord Est 100,00% France France
Elf Oil UK Aviation Limited 100,00% United Kingdom United Kingdom
Elf Oil UK Properties Limited 100,00% United Kingdom United Kingdom
Fioulmarket.fr 100,00% France France
Gapco Kenya Limited 100,00% Kenya Kenya
Gapco Tanzania Limited 100,00% Tanzania Tanzania
Guangzhou Elf Lubricants Company Limited 77,00% China China
Gulf Africa Petroleum Corporation 100,00% Mauritius Island Mauritius Island
Lubricants Vietnam Holding Limited 100,00% Hong Kong Hong Kong
National Petroleum Refiners Of South Africa (PTY) Limited 18,22% E South Africa South Africa
Progeres S.A.S. 100,00% France France
Quimica Vasca S.A.U. 100,00% Spain Spain
Saudi Total Petroleum Products 51,00% E Saoudia Arabia Saoudia Arabia
Servauto Nederland B.V. 100,00% Netherlands Netherlands
Societe d'exploitation de l'usine de Rouen 98,98% France France
Societe mahoraise de stockage de produits petroliers 100,00% France France
Societe Urbaine des Petroles 100,00% France France
S-Oil Total Lubricants Company Limited 50,00% E South Korea South Korea
South Asia LPG Private Limited 50,00% E India India
Stedis 100,00% France France
Tas'Helat Marketing Company 50,00% E Saoudia Arabia Saoudia Arabia
Total (Africa) Limited 100,00% United Kingdom United Kingdom
Total (Fiji) Limited 100,00% Fiji Islands Fiji Islands
Total Additifs et Carburants Speciaux 100,00% France France
Total Africa S.A. 100,00% France France
Total Aviation & Export Limited 100,00% Zambia Zambia
Total Belgium 100,00% Belgium Belgium
Total Bitumen Deutschland GmbH 100,00% Germany Germany
Total Bitumen UK Limited 100,00% United Kingdom United Kingdom
Total Botswana (PTY) Limited 50,10% Botswana Botswana
Total Brasil Diesel Comercio e Transportes Ltda 100,00% Brazil Brazil
9/11 2020 Perimeter
#TOTAL Classification: Restricted Distribution TOTAL - All rights reserved

Total Brasil Distribuidora Ltda 100,00% Brazil Brazil
Total Burkina 100,00% Burkina Faso Burkina Faso
Total Cambodge 100,00% Cambodia Cambodia
Total Cameroun 67,01% Cameroon Cameroon
Total Caraibes 100,00% France France
Total Ceska Republika S.R.O. 100,00% Czech Republic Czech Republic
Total China Investment Company Limited 100,00% China China
Total Congo 100,00% Congo Congo
Total Corse 100,00% France France
Total Cote D'Ivoire 72,99% Côte d'Ivoire Côte d'Ivoire
Total Denmark A/S 100,00% Denmark Denmark
Total Egypt 84,62% Egypt Egypt
Total Espana S.A. 100,00% Spain Spain
Total Especialidades Argentina 100,00% Argentina Argentina
Total Ethiopia 100,00% Ethiopia Ethiopia
Total Fluides 100,00% France France
Total Freeport Corporation 51,00% E Philippines Philippines
Total Fuels Wuhan Company Limited 100,00% China China
Total Glass Lubricants Europe GmbH 100,00% Germany Germany
Total Guadeloupe 100,00% France Guadeloupe
Total Guinea Ecuatorial 70,00% Equatorial Guinea Equatorial Guinea
Total Guinee 100,00% Guinea Guinea
Total Holding Asie 100,00% France France
Total Holding India 100,00% France France
Total Italia 100,00% Italy Italy
Total Jamaica Limited 100,00% Jamaica Jamaica
Total Jordan PSC 100,00% Jordan Jordan
Total Kenya 93,96% Kenya Kenya
Total Liban 100,00% Lebanon Lebanon
Total Liberia Inc. 100,00% Liberia Liberia
Total Lubricants (China) Company Limited 77,00% China China
Total Lubricants Taiwan Limited 63,00% Taiwan Taiwan
Total Lubrifiants 99,98% France France
Total Lubrifiants Algerie 78,90% Algeria Algeria
Total Lubrifiants Service Automobile 99,98% France France
Total Luxembourg S.A. 100,00% Luxembourg Luxembourg
Total Madagasikara S.A. 79,44% Madagascar Madagascar
Total Malawi Limited 100,00% Malawi Malawi
Total Mali 100,00% Mali Mali
Total Marine Fuels 100,00% Singapore Singapore
Total Marketing Egypt 84,62% Egypt Egypt
Total Marketing et Services Angola S.A. 50,00% E Angola Angola
Total Marketing France 100,00% France France
Total Marketing Gabon 90,00% Gabon Gabon
Total Marketing Middle East Free Zone 100,00% United Arab Emirates United Arab Emirates
Total Marketing Services 100,00% France France
Total Marketing Tchad 100,00% Chad Chad
Total Marketing Uganda 100,00% Uganda Uganda
Total Maroc 55,00% Morocco Morocco
Total Mauritius 55,00% Mauritius Island Mauritius Island
Total Mayotte 100,00% France Mayotte
Total Mexico S.A. de C.V. 100,00% Mexico Mexico
Total Mineraloel und Chemie GmbH 100,00% Germany Germany
Total Mineralol GmbH 100,00% Germany Germany
Total Mozambique 100,00% Mozambique Mozambique
Total Namibia (PTY) Limited 50,10% Namibia Namibia
Total Nederland NV 100,00% Netherlands Netherlands
Total Niger S.A. 100,00% Niger Niger
Total Nigeria PLC 61,72% Nigeria Nigeria
Total Oil Asia-Pacific Pte Limited 100,00% Singapore Singapore
Total Oil India Private Limited 100,00% India India
Total Outre-Mer 100,00% France France
Total Pacifique 100,00% France New Caledonia
Total Paiement Services 100,00% France France
Total Parco Pakistan Limited 50,00% E Pakistan Pakistan
Total Petroleum (Shanghai) Company Limited 100,00% China China
Total Petroleum Ghana Limited 76,74% Ghana Ghana
Total Petroleum Puerto Rico Corp. 100,00% Puerto Rico Puerto Rico
Total Philippines Corporation 51,00% E Philippines Philippines
Total Polska 100,00% Poland Poland
Total Polynesie 100,00% France French Polynesia
Total RDC 60,00% Democratic Republic of Congo Democratic Republic of Congo
Total Reunion 100,00% France Reunion
Total Romania S.A. 100,00% Romania Romania
Total Senegal 69,14% Senegal Senegal
Total Singapore Shared Services Pte Limited 100,00% Singapore Singapore
Total Sinochem Fuels Company Limited 49,00% E China China
Total Sinochem Oil Company Limited 49,00% E China China
Total South Africa (PTY) Limited 50,10% South Africa South Africa
Total Specialties USA Inc. 100,00% United States United States
Total Supply MS S.A. 100,00% Switzerland Switzerland
Total Swaziland (PTY) Limited 50,10% Swaziland Swaziland
Total Tanzania Limited 100,00% Tanzania Tanzania
Total Tianjin Manufacturing Company Limited 77,00% China China
Total Togo 76,72% Togo Togo
Total Tunisie 100,00% Tunisia Tunisia
Total Turkey Pazarlama 100,00% Turkey Turkey
Total UAE LLC 49,00% United Arab Emirates United Arab Emirates
Total Uganda Limited 100,00% Uganda Uganda
Total UK Limited 100,00% United Kingdom United Kingdom
Total Ukraine LLC 100,00% Ukraine Ukraine
Total Vietnam Limited 100,00% Vietnam Vietnam
Total Vostok 100,00% Russia Russia
Total Zambia 100,00% Zambia Zambia
Total Zimbabwe 80,00% Zimbabwe Zimbabwe
Totalgaz Vietnam LLC 100,00% Vietnam Vietnam
Trapil 35,50% E France France
Upbeatprops 100 PTY Limited 50,10% South Africa South Africa
V Energy S.A. 70,00% Dominican Republic Dominican Republic
Corporate Albatros 100,00% France France
Elf Aquitaine Fertilisants 100,00% France France
Elf Aquitaine Inc. 100,00% United States United States
Elf Forest Products LLC 100,00% United States United States
Omnium Reinsurance Company S.A. 100,00% Switzerland Switzerland
Pan Insurance Limited 100,00% Ireland Ireland
Septentrion Participations 100,00% France France
Socap S.A.S. 100,00% France France
10/11 2020 Perimeter
#TOTAL Classification: Restricted Distribution TOTAL - All rights reserved

Societe Civile Immobiliere CB2 100,00% France France
Sofax Banque 100,00% France France
Total American Services Inc. 100,00% United States United States
Total Capital 100,00% France France
Total Capital Canada Limited 100,00% Canada Canada
Total Capital International 100,00% France France
Total Consulting 100,00% France France
Total Corporate Management (Beijing) Company Limited 100,00% China China
Total Delaware Inc. 100,00% United States United States
Total Developpement Regional S.A.S. 100,00% France France
Total Digital Factory 100,00% France France
Total Facilities Management Services (TFMS) 100,00% France France
Total Finance 100,00% France France
Total Finance Corporate Services Limited 100,00% United Kingdom United Kingdom
Total Finance Global Services (TOFIG) 100,00% Belgium Belgium
Total Finance international B.V. 100,00% Netherlands Netherlands
Total Finance Nederland B.V. 100,00% Netherlands Netherlands
Total Finance USA Inc. 100,00% United States United States
Total Funding Nederland B.V. 100,00% Netherlands Netherlands
Total Funding Nederland International B.V. 100,00% Netherlands Netherlands
Total Gestion Filiales 100,00% France France
Total Gestion USA 100,00% France France
Total Global Financial Services 100,00% France France
Total Global Human Ressources Services 100,00% France France
Total Global Information Technology Services Belgium 99,98% Belgium Belgium
Total Global IT Services (TGITS) 100,00% France France
Total Global Procurement (TGP) 100,00% France France
Total Global Procurement Belgium S.A. (TGPB) 100,00% Belgium Belgium
Total Global Services Bucharest 99,01% Romania Romania
Total Global Services Philippines 100,00% Philippines Philippines
Total Holding Allemagne 100,00% France France
Total Holdings Europe 100,00% France France
Total Holdings International B.V. 100,00% Netherlands Netherlands
Total Holdings S.A.S. 100,00% France France
Total Holdings UK Limited 100,00% United Kingdom United Kingdom
Total Holdings USA Inc. 100,00% United States United States
Total International NV 100,00% Netherlands Netherlands
Total Investments 100,00% France France
Total Learning Solutions (TLS) 100,00% France France
Total Operations Canada Limited 100,00% Canada Canada
Total Overseas Holding (PTY) Limited 100,00% South Africa Netherlands
Total Participations 100,00% France France
Total Petrochemicals & Refining S.A./NV (e) 100,00% Belgium Belgium
Total Petrochemicals & Refining USA Inc. (e) 100,00% United States United States
Total Petrochemicals Security USA Inc. 100,00% United States United States
Total Resources (Canada) Limited 100,00% Canada Canada
TOTAL S.E. - France France
Total Treasury 100,00% France France
Total UK Finance Limited 100,00% United Kingdom United Kingdom
(a) % of control different from % of interest : 49%
(b) % of control different from % of interest : 10%
(c) % of control different from % of interest : 5.80%
(d) % of control different from % of interest : 20.02%
(e) Multi-segment entities
11/11 2020 Perimeter
#TOTAL Classification: Restricted Distribution TOTAL - All rights reserved
Copyright © 2022 FDOKUMEN