Knowledge valuation analysis : Applications for organizational intellectual capital
14
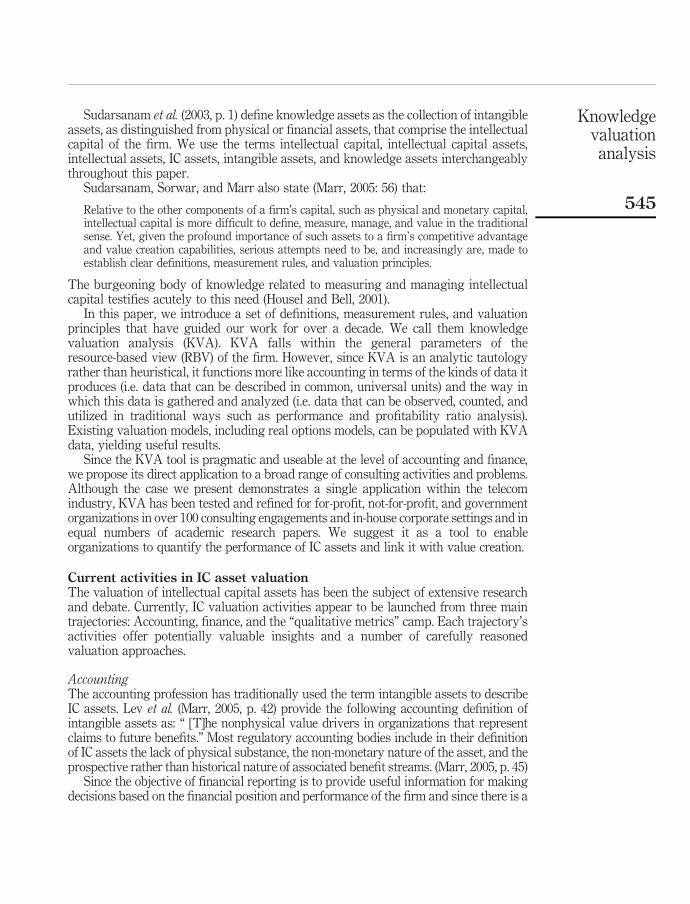
Knowledge valuation analysis Applications for organizational intellectual capital Thomas J. Housel Naval Postgraduate School, Monterey, California, USA, and Sarah K. Nelson Intellectual Capital Ventures, LLC, Chicago, Illinois, USA Abstract Purpose – The purpose of this paper is to provide a review of an analytic methodology (knowledge valuation analysis, i.e. KVA), based on complexity and information theory, that is capable of quantifying value creation by corporate intellectual capital. It aims to use a real-world case to demonstrate this methodology within a consulting context. Design/methodology/approach – The fundamental assumptions and theoretical constructs underlying KVA are summarized. The history of the concept, a case application, limitations, and implications for the methodology are presented. Findings – Although well-known financial analytic tools were used to justify IT investment proposals, none provided a satisfying result because none offered an unambiguous way to tie IT performance to value creation. KVA provided a means to count the amount of corporate knowledge, in equivalent units, required to produce the outputs of client core processes. This enabled stakeholders to assign revenue streams to IT, develop IT ROIs, and decide with clarity where to invest. Practical implications – When stakeholders can assign revenue streams to sub-corporate processes, they have a new context for making IC investment decisions. “Cost centers” and decisions based on cost containment can be replaced. Concepts such as a knowledge market, the knowledge asset pricing model, k-betas, and a sub-corporate equities market can be developed and applied. Some of the limitations related to real options analysis can be resolved. Originality/value – This paper introduces an approach to measuring corporate intellectual capital that solves some long-standing IC valuation problems. Keywords Intellectual capital, Knowledge management, Measurement Paper type General review Introduction The fundamental building material and engine of wealth of the modern corporation is the creation and utilization of knowledge. The real challenge in the Information Age is to understand how to accelerate the conversion of knowledge into money through understanding how to measure knowledge assets (Kanevsky and Housel, 1998, p. 1). According to King and Zeithaml (2003, pp.1-2), current knowledge resource identification and measurement tools (such as patent or citation counts) are “crude and often inadequate.” Yet, knowledge resources are a source of competitive advantage, i.e. valuable, rare, inimitable, and lacking substitutes (Barney, 1991). A knowledge based theory of the firm requires knowledge to be “defined precisely enough to let us see which firm has the more significant knowledge and explain how that leads to competitive advantage” (Spender, 1996a, p. 49). The Emerald Research Register for this journal is available at The current issue and full text archive of this journal is available at www.emeraldinsight.com/researchregister www.emeraldinsight.com/1469-1930.htm JIC 6,4 544 Journal of Intellectual Capital Vol. 6 No. 4, 2005 pp. 544-557 q Emerald Group Publishing Limited 1469-1930 DOI 10.1108/14691930510628816
-
Upload
independent -
Category
Documents
-
view
1 -
download
0
Transcript of Knowledge valuation analysis : Applications for organizational intellectual capital
Knowledge valuation analysisApplications for organizational intellectual
capital
Thomas J. HouselNaval Postgraduate School, Monterey, California, USA, and
Sarah K. NelsonIntellectual Capital Ventures, LLC, Chicago, Illinois, USA
Abstract
Purpose – The purpose of this paper is to provide a review of an analytic methodology (knowledgevaluation analysis, i.e. KVA), based on complexity and information theory, that is capable ofquantifying value creation by corporate intellectual capital. It aims to use a real-world case todemonstrate this methodology within a consulting context.
Design/methodology/approach – The fundamental assumptions and theoretical constructsunderlying KVA are summarized. The history of the concept, a case application, limitations, andimplications for the methodology are presented.
Findings – Although well-known financial analytic tools were used to justify IT investmentproposals, none provided a satisfying result because none offered an unambiguous way to tie ITperformance to value creation. KVA provided a means to count the amount of corporate knowledge, inequivalent units, required to produce the outputs of client core processes. This enabled stakeholders toassign revenue streams to IT, develop IT ROIs, and decide with clarity where to invest.
Practical implications – When stakeholders can assign revenue streams to sub-corporateprocesses, they have a new context for making IC investment decisions. “Cost centers” and decisionsbased on cost containment can be replaced. Concepts such as a knowledge market, the knowledgeasset pricing model, k-betas, and a sub-corporate equities market can be developed and applied. Someof the limitations related to real options analysis can be resolved.
Originality/value – This paper introduces an approach to measuring corporate intellectual capitalthat solves some long-standing IC valuation problems.
Keywords Intellectual capital, Knowledge management, Measurement
Paper type General review
IntroductionThe fundamental building material and engine of wealth of the modern corporation isthe creation and utilization of knowledge. The real challenge in the Information Age isto understand how to accelerate the conversion of knowledge into money throughunderstanding how to measure knowledge assets (Kanevsky and Housel, 1998, p. 1).According to King and Zeithaml (2003, pp.1-2), current knowledge resourceidentification and measurement tools (such as patent or citation counts) are “crudeand often inadequate.” Yet, knowledge resources are a source of competitiveadvantage, i.e. valuable, rare, inimitable, and lacking substitutes (Barney, 1991). Aknowledge based theory of the firm requires knowledge to be “defined preciselyenough to let us see which firm has the more significant knowledge and explain howthat leads to competitive advantage” (Spender, 1996a, p. 49).
The Emerald Research Register for this journal is available at The current issue and full text archive of this journal is available at
www.emeraldinsight.com/researchregister www.emeraldinsight.com/1469-1930.htm
JIC6,4
544
Journal of Intellectual CapitalVol. 6 No. 4, 2005pp. 544-557q Emerald Group Publishing Limited1469-1930DOI 10.1108/14691930510628816
Sudarsanam et al. (2003, p. 1) define knowledge assets as the collection of intangibleassets, as distinguished from physical or financial assets, that comprise the intellectualcapital of the firm. We use the terms intellectual capital, intellectual capital assets,intellectual assets, IC assets, intangible assets, and knowledge assets interchangeablythroughout this paper.
Sudarsanam, Sorwar, and Marr also state (Marr, 2005: 56) that:
Relative to the other components of a firm’s capital, such as physical and monetary capital,intellectual capital is more difficult to define, measure, manage, and value in the traditionalsense. Yet, given the profound importance of such assets to a firm’s competitive advantageand value creation capabilities, serious attempts need to be, and increasingly are, made toestablish clear definitions, measurement rules, and valuation principles.
The burgeoning body of knowledge related to measuring and managing intellectualcapital testifies acutely to this need (Housel and Bell, 2001).
In this paper, we introduce a set of definitions, measurement rules, and valuationprinciples that have guided our work for over a decade. We call them knowledgevaluation analysis (KVA). KVA falls within the general parameters of theresource-based view (RBV) of the firm. However, since KVA is an analytic tautologyrather than heuristical, it functions more like accounting in terms of the kinds of data itproduces (i.e. data that can be described in common, universal units) and the way inwhich this data is gathered and analyzed (i.e. data that can be observed, counted, andutilized in traditional ways such as performance and profitability ratio analysis).Existing valuation models, including real options models, can be populated with KVAdata, yielding useful results.
Since the KVA tool is pragmatic and useable at the level of accounting and finance,we propose its direct application to a broad range of consulting activities and problems.Although the case we present demonstrates a single application within the telecomindustry, KVA has been tested and refined for for-profit, not-for-profit, and governmentorganizations in over 100 consulting engagements and in-house corporate settings and inequal numbers of academic research papers. We suggest it as a tool to enableorganizations to quantify the performance of IC assets and link it with value creation.
Current activities in IC asset valuationThe valuation of intellectual capital assets has been the subject of extensive researchand debate. Currently, IC valuation activities appear to be launched from three maintrajectories: Accounting, finance, and the “qualitative metrics” camp. Each trajectory’sactivities offer potentially valuable insights and a number of carefully reasonedvaluation approaches.
AccountingThe accounting profession has traditionally used the term intangible assets to describeIC assets. Lev et al. (Marr, 2005, p. 42) provide the following accounting definition ofintangible assets as: “ [T]he nonphysical value drivers in organizations that representclaims to future benefits.” Most regulatory accounting bodies include in their definitionof IC assets the lack of physical substance, the non-monetary nature of the asset, and theprospective rather than historical nature of associated benefit streams. (Marr, 2005, p. 45)
Since the objective of financial reporting is to provide useful information for makingdecisions based on the financial position and performance of the firm and since there is a
Knowledgevaluationanalysis
545
high degree of uncertainty associated with future cash flows from intangible assets, theFinancial Accounting Standards Board and the International Accounting StandardsBoard have ruled that intangible assets, especially those developed in-house, cannot beincluded on the balance sheet unless they meet the following criteria (Marr, 2005, p. 43):
. they are identifiable;
. they are controlled by the reporting firm;
. it is probable that their future benefits will flow to the reporting firm; and
. their cost can be reliably measured.
Whether IC assets are recognized on the balance sheet or not, accounting regulatoryauthorities require that the costs related to developing them must be expensedimmediately. This ensures that in some reporting periods the profitability and financialcondition of the company will be understated and, in other periods, overstated. Theresult is a possible loss of relevance of accounting information (Marr, 2005, p. 43).
When IC assets such as patents are acquired in a business combination, standardcosting methods can easily be used to meet recognition and valuation rules. SFAS 141and 142 allow for recognition of an acquired intangible asset at fair market value solong as it either can be identified separately from the acquired firm or has been createdvia contractual or legal rights. All non-identifiable IC assets are grouped under“goodwill”, which can no longer be amortized over an indefinite life and must undergoannual impairment tests for possible value depletion. Marr (2005, pp. 46-48), Lev andZarowin (1999) and Høegh-Krohn and Knivsfla (2000) support this “condition-basedcost capitalization” approach (Marr, 2005, p. 50).
Lev and Zarowin (1999) also propose condition-based cost capitalization for thehistorical costs of developing intangibles that have clearly defined development phasesbut have not yet achieved technical feasibility. Their method includes the carefullyregulated restatement of historical information, where the firm records an asset on itsbalance sheet once benefits start to flow from it and also reverses prior yearexpenditures related to it (Marr, 2005, p. 50).
To increase transparency and information flow, some enterprises have engaged involuntary presentations of information about IC assets using methodologies such asbook-to-market ratios, Tobin’s Q (stock market value of firm 4 replacement cost ofassets), or a variety of qualitative measurement tools. However, firms in the USA andin Europe differ in the way information on IC is published, as do firms withinindustries and across reporting years. “[F]rom an investor’s perspective, there is aserious drawback to these reports or any other voluntary information on intellectualcapital: the lack of harmonization (comparability) among firms, industries, or differentyears for which the data are published. This significantly reduces the usefulness of theinformation” (Marr, 2005, p. 49).
The FASB project on intangibles is currently frozen, and the 2001 SecuritiesExchange Commission task force on intangibles states “the need for developing adisclosure framework for information on intangibles and other measures of operatingperformance” (Marr, 2005, p. 51).
Clearly, the accounting profession is considering various intangible assets valuationapproaches seriously, but must, by its conservative role and nature, be guarded inwhat it accepts. It is also clear that the current inability to attribute a benefit stream (i.e.
JIC6,4
546
revenue, income) to intangibles at the corporate or sub-corporate level, the continuedreliance on historical cost as a measure of value, and the lack of comparability inproposed valuation approach results have created a barrier to further advances withinthe profession.
FinanceAs with the accounting definition already provided, the finance definition ofintellectual assets indicates that: they have no immediate, measurable, or certainpayoffs (income streams); and due to their embedded nature, are not susceptible to thedevelopment of a secondary market by which they could be valued. In addition, thefinance definition states that intellectual assets embody the firm’s growthopportunities, “contributing to both their evolution over time and their realization inthe future” (Marr, 2005, p. 56). So, firm value from a finance perspective can be viewedas: value of assets in place þ value of future growth opportunities from assets in placeþ value of future growth opportunities from new assets. The second and thirdelements of this value proposition are “largely path dependent and derive from thefirm’s accumulation of resources and capabilities from past investments” (Marr, 2005,pp. 57, 60).
Sudarsanam et al. (2003) (in Marr, 2005, pp. 58-62) suggest that financial valuationmodels can be divided into two groups: static (historically based) and dynamic(prospectively based). They provide the following discussion of both groups.
Static models develop an estimate of value as of a specified valuation date. Theassets being valued are generally aggregated at the firm level, although intellectualproperty (IP) such as patents and brands are often valued alone. Static model valuationapproaches include:
. Lev’s (2001) Residual Income Model. Subtract the after-tax earnings attributableto financial and physical assets from the firm’s after-tax earnings to arrive at aresidual, the knowledge earnings that can be capitalized at an appropriatediscount rate. This model is a variant of the traditional financial valuation“Excess Earnings Approach.”
. Brooking’s (1996) Technology Broker Model. Use an audit questionnaire toidentify the firm’s intellectual asset categories. Then apply traditional valuationapproaches (market, income, or cost) to each category. The market approach usesmarket comparables as a benchmark for asset value. The income approachestimates the income-producing capability of the asset. The cost approachestimates value based on the asset’s replacement cost.
. Market- or value-based approach. Take the difference between the stock marketvalue of the firm and the net market value of its assets.
. Tobin’s Q: Take the difference between the market value of the firm and thereplacement cost of its tangible assets.
Dynamic valuation models include:. The Discounted Cash Flow Model. Estimate future asset cash flows and discount
them using a market-determined discount rate. This model requires relativelystable, predictable cash flows and the ability to estimate an appropriate discountrate.
Knowledgevaluationanalysis
547
. Real Options Models. Use financial option pricing models to value intellectualassets, since intellectual assets are, in effect, real options created by the firmthrough such activities, investments, or acquisitions as: Investments in IT andhuman resources, customer relationship arrangements, intellectual property (IP),R&D, and practices and routines.
A review of the literature indicates that all financial valuation models have the samelimitations in one form or another:
. IC assets must be valued as an aggregate with no ability to separately valueindividual assets (other than certain types of IP);
. differences in the national, industry, and firm accounting standards and policiesthat govern the recording of the IC assets create a lack of comparability of valueestimates;
. an inability to define either exactly how much IC assets contribute to firm valueor the process by which they do so;
. difficulty in estimating the replacement cost of IC assets, their future cash flows,or the risk (volatility) and uncertainty (probabilities) associated with these cashflows;
. difficulty in capturing path dependencies and asset synergies in value estimates;and
. lack of historical data to use for benchmarking and forecasting.
Many or most of these problems could be addressed by a method to estimatesub-corporate cash flows, i.e. cash flows for IC assets such as people, processes, andinformation technology.
Qualitative metricsThere is a large universe of qualitative metric approaches: Kaplan and Norton’sBalanced Scorecard, Edvisson and Malone’s Skandia Reporting Model, Prusak andDavenport’s Knowledge Outputs model, and newer models such as those proposed byKing and Zeithaml (2003) and Chen et al. (2004). However, since KVA fits within theaccounting and finance disciplines, rather than the qualitative metric discipline, we willnot provide a review of qualitative metrics approaches in this paper.
MethodologyThe problem we sought to address was seemingly straightforward. “To value any asset,we need to specify an income stream clearly identified with that asset” (Marr, 2005, p. 58).In 1991, while at Pacific Bell, we were asked to make business cases for investments inIT, specifically expert systems. We needed to be able to assign a benefit stream (i.e.revenue) to IT in order to justify IT investment proposals because, without a benefitstream, the IT value equation had no numerator and valuation was impossible.
We attempted to use the discounted cash flow model, NPV, IRR, activity-basedcosting models, and other approaches to develop a proxy for revenue so we could focuson value creation at a sub-corporate level. However, none of these provided a satisfyinganswer because there was no unambiguous, verifiable way to tie revenue to IT at thesub-corporate level. We wanted more than another approach to cost containment.
JIC6,4
548
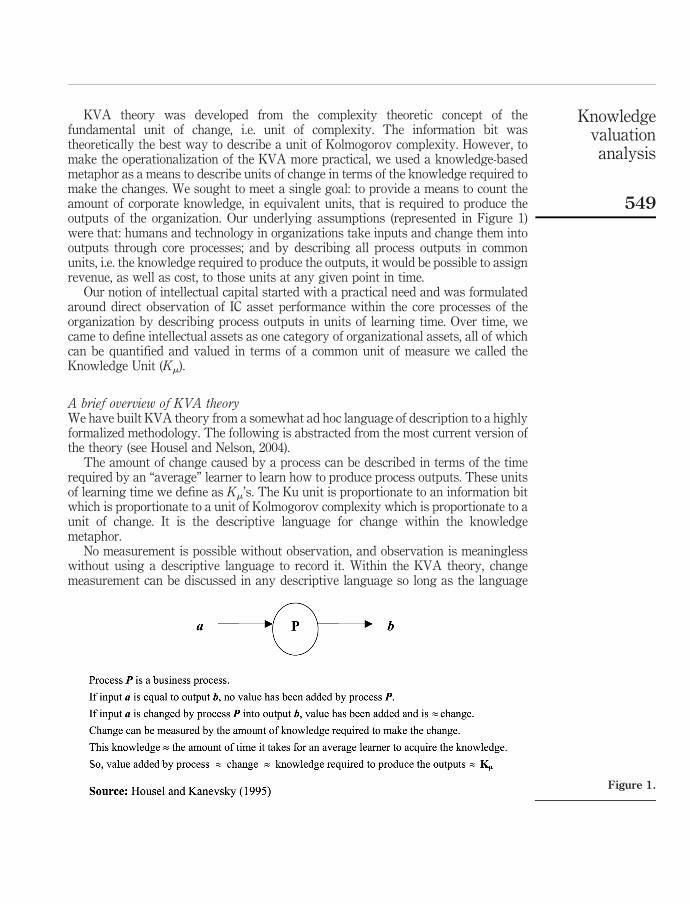
KVA theory was developed from the complexity theoretic concept of thefundamental unit of change, i.e. unit of complexity. The information bit wastheoretically the best way to describe a unit of Kolmogorov complexity. However, tomake the operationalization of the KVA more practical, we used a knowledge-basedmetaphor as a means to describe units of change in terms of the knowledge required tomake the changes. We sought to meet a single goal: to provide a means to count theamount of corporate knowledge, in equivalent units, that is required to produce theoutputs of the organization. Our underlying assumptions (represented in Figure 1)were that: humans and technology in organizations take inputs and change them intooutputs through core processes; and by describing all process outputs in commonunits, i.e. the knowledge required to produce the outputs, it would be possible to assignrevenue, as well as cost, to those units at any given point in time.
Our notion of intellectual capital started with a practical need and was formulatedaround direct observation of IC asset performance within the core processes of theorganization by describing process outputs in units of learning time. Over time, wecame to define intellectual assets as one category of organizational assets, all of whichcan be quantified and valued in terms of a common unit of measure we called theKnowledge Unit (Km).
A brief overview of KVA theoryWe have built KVA theory from a somewhat ad hoc language of description to a highlyformalized methodology. The following is abstracted from the most current version ofthe theory (see Housel and Nelson, 2004).
The amount of change caused by a process can be described in terms of the timerequired by an “average” learner to learn how to produce process outputs. These unitsof learning time we define as Km’s. The Ku unit is proportionate to an information bitwhich is proportionate to a unit of Kolmogorov complexity which is proportionate to aunit of change. It is the descriptive language for change within the knowledgemetaphor.
No measurement is possible without observation, and observation is meaninglesswithout using a descriptive language to record it. Within the KVA theory, changemeasurement can be discussed in any descriptive language so long as the language
Figure 1.
Knowledgevaluationanalysis
549
will provide reliable estimates of value stated in common (equivalent) units. For thisreason, there have been many languages used within the KVA theory to describe unitsof change, e.g. tasks, process instructions, Haye knowledge points, Shannon bits,Jackson structural diagram decision points, units of knowledge.
We have chosen to discuss units of change (complexity) in terms of the knowledgerequired to reproduce them, because the operational metaphor, “knowledge,” is easy tounderstand and rapidly apply to generate estimates of change. Although the term“bits” describes units of complexity (i.e. change) at the most granular level, it iscurrently impractical to count them. The knowledge metaphor, however, allows us todescribe change in terms of the amount of knowledge required to make changes and todiscuss intangible activity (i.e. activity that is not directly observable, as is the casewith many IC activities) more satisfactorily. Knowledge units are less precise (roughercut) than bits, but more practical to estimate.
The outputs of all processes can be standardized by describing them in terms of thenumber of units of change (complexity) required to produce them, given the existingtechnology. Outputs, such as products and services, have value derived from theirinherent characteristics. These characteristics have been predetermined by the products’designers and are embodied in the corporate knowledge needed to produce the products.
If the output will always be the same, given the same input, then we describe theoutput as predetermined. Another definition of a predetermined output is that, once itis produced, it does not vary within reasonably well-defined boundaries. Its inherentcharacteristics are fixed.
Due to the growth of knowledge-based industries, the professional services, and“customized” manufacturing, there are a sizeable and growing number of coreprocesses that produce outputs which belong to predetermined categories but whoseinherent characteristics may differ (be customized) from each other within thecategory. For these processes, we vary our estimation techniques somewhat toproperly measure output Km.
Processes with predetermined outputs are more or less isomorphic with computeralgorithms. Therefore, process changes are virtually identical to computing. Thisfundamental parallelism between the structural change of substances (inputs intooutputs) and information processing allows us to describe the amount of knowledgerequired to produce process outputs and determine the value added by the process(Kanevsky and Housel, 1998).
Knowledge is embedded in process assets such as IT, employees, training manuals, etc.and all processes can be described in terms of knowledge units. A process must executeonce to produce a single unit of output, represented by a given number of knowledge units.Additional levels of detail in process descriptions provide additional levels of accuracy inthe estimation of the number of knowledge units comprising those processes.
Foundation for KVA methodologyKing and Zeithaml (2003) provide the following formal summary of the academicresearch undergirding the actual KVA methodology:
. Organizational knowledge is enacted through the perspective of multiple“knowers” in a firm (Tsoukas, 1996; Glazer, 1998; Orlikowski, 2002). Therefore, itis not appropriate to attempt to measure knowledge from one individual’sviewpoint.
JIC6,4
550
. Knowledge is acquired in two stages (e.g., Anderson, 1976, Singley andAnderson, 1989), the declarative and the procedural. The declarative stageinvolves conscious, general knowledge that can be verbalized. The proceduralstage involves practice, growing recognition of patterns, improved abilities, andlower requirements for cognitive involvement (Newell and Simon, 1972; Simon,1974; Anderson, 1995; Gobet and Simon, 1996). Procedural knowledge is rich,embedded, specific, and embodied in actions and skills (Singley and Anderson,1989, p. 31).
. Organizational knowledge resources are predominantly procedural (Nelson andWinter, 1982). However, to measure organizational knowledge requiresdeclarative knowledge.
. “Managers routinely are required to communicate and transform proceduralknowledge into declarative knowledge as they negotiate organizational prioritiesand make strategic decisions. Although it is impossible to articulate all that oneknows about organizational knowledge (Leonard and Sensiperm, 1998), wesuggest that experienced top- and middle-level managers are particularly adeptat recognizing and articulating organizational knowledge. Tapping theirknowledge about the organization.. can provide a new and valuable way tomeasure organizational knowledge” (King and Zeithaml, 2003, pp. 2-3).
KVA makes extensive use of top and middle manager, as well as subject matter expert,knowledge about the organization.
Components of KVA methodologyThere are at least three measures that can be used to estimate the amount of knowledgerequired to produce process outputs (Housel and Nelson, 2004). They each assumeprocess efficiency maximization as a baseline, that is, the shortest learning time peraverage “learner,” the least number of process instructions, or the shortest sequence ofbinary questions required to obtain the predetermined outputs.
We consult with the top and middle-level managers of the organization, as well assubject matter experts, to obtain estimates of these measures. Ideally, at least twoestimation approaches should be used during any given process analysis to provide areliability check, provided that both estimates reflect the same underlying construct,i.e. common units of change.
. The time required to learn the process. Learning time can be described as theamount of time necessary for an average person (i.e. a common reference point,“learner”) to learn how to complete a process correctly.
. The number of process instructions. The number of process instructions requiredto generate the process output successfully can serve as the proxy for the amountof change produced by a given process. Process instructions must be maderoughly equivalent in terms of the amount of knowledge required to executethem.
. The length of the sequence of binary questions (i.e. bits) required to complete theprocess. Computer code is a reasonable proxy for amount of change and thus canserve as a proxy for the amount of knowledge required to produce processoutputs.
Knowledgevaluationanalysis
551
Case studyTo illustrate the KVA methodology, we have selected a case study taken from aconsulting engagement performed on behalf of SBC Telecom. We chose this casebecause it was rich in detail, had large-scale implications for SBC, and its successcreated several further opportunities for follow-on consulting. The full details of thecase can be found in Cook and Housel (2005).
Statement of SBC case problemThe President of SBC Telecom was faced with a critical deadline. His new Tier Onesubsidiary had to write at least three sales orders and provide service to the customersin three separate market areas on October 8, 2000 or face a $10.1 million fine from theFCC. Given the short time frame for making the company operational, managementdecided that it would be necessary to use the company’s billing, network provisioning,and network maintenance legacy systems. However, top management invited themanagement team to make the case for new information systems to support sales,marketing, finance-accounting, and/or corporate management.
Top management did not want to use standard company procedures to justify suchinvestments based on how much downsizing the IS would enable. Instead, they wantedto focus on how much value new systems would provide, and on growth accompaniedby low marginal costs. They wanted to know where investments in informationtechnology would pay off, what the optimal resource allocation would be for IT. Manyof these benefits had already been projected by a variety of consulting firms andintegrators. However, top management wanted a sanity check on their projections.
The cultural context surrounding SBC decision processes included a low tolerancefor failure, consistent with SBC history as a long product cycle, monopolistic company.In addition, SBC decision makers were deeply rooted in cost-accounting basedapproaches and methods. Based on our experience in the telecommunications industry,and with SBC in particular, we knew that if we did not provide the company decisionmakers with what they viewed as credible data within this highly constrained decisioncontext, they simply would not use it.
Conducting the KVAOur team met with subject matter experts and top management over a period of threemonths, although we only consumed a total of about two weeks of actual work time. Weprimarily used audio conferences and email to gather and verify KVA data. We developedlearning time data estimates based on the relative amount of time it would take for oneaverage learner to learn eight core processes (marketing, ordering, provisioning,maintenance, billing, customer care, corporate management, and sales) within anormalized 100 months. Since we could not observe the actual executions of each process,we assumed that they executed only once per person per sample period. This meant thatwe could use employee head count as our proxy for number of process executions.
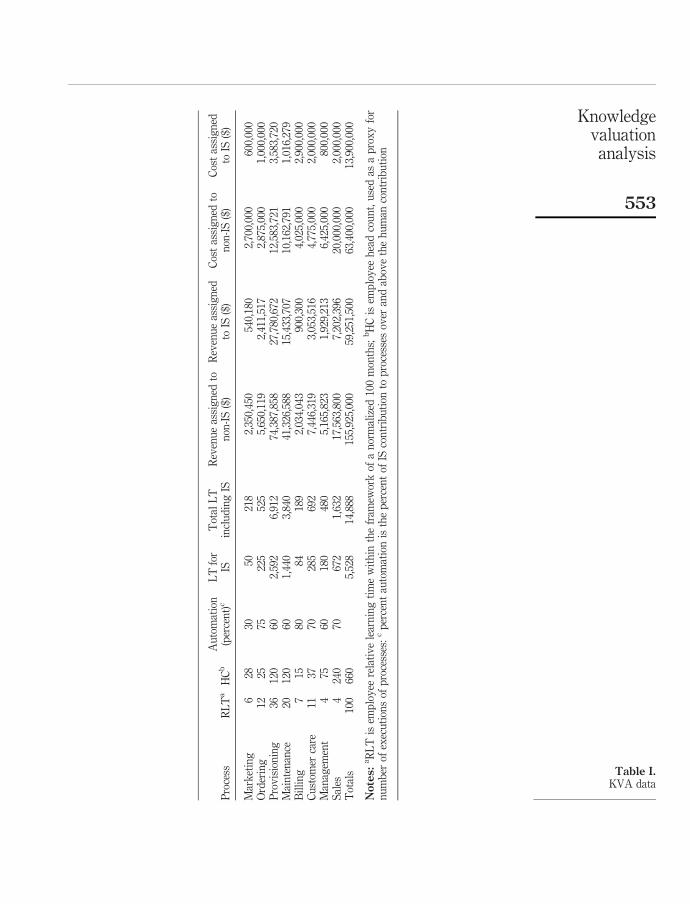
Using the product of the number of process Km generated per employee and thenumber of employees executing each process, we estimated the total Km generated perprocess. From this data and the total annual revenues for the firm, we were able toassign revenues to each process. The next step was to develop return on knowledgeratios (i.e. ROKs, our KVA productivity ratio) for each process. KVA results are shownin Table I. ROKs are shown in Table II.
JIC6,4
552
Pro
cess
RL
Ta
HC
bA
uto
mat
ion
(per
cen
t)c
LT
for
IST
otal
LT
incl
ud
ing
ISR
even
ue
assi
gn
edto
non
-IS
($)
Rev
enu
eas
sig
ned
toIS
($)
Cos
tas
sig
ned
ton
on-I
S($
)C
ost
assi
gn
edto
IS($
)
Mar
ket
ing
628
3050
218
2,35
0,45
054
0,18
02,
700,
000
600,
000
Ord
erin
g12
2575
225
525
5,65
0,11
92,
411,
517
2,87
5,00
01,
000,
000
Pro
vis
ion
ing
3612
060
2,59
26,
912
74,3
87,8
5827
,780
,672
12,5
83,7
213,
583,
720
Mai
nte
nan
ce20
120
601,
440
3,84
041
,326
,588
15,4
33,7
0710
,162
,791
1,01
6,27
9B
illi
ng
715
8084
189
2,03
4,04
390
0,30
04,
025,
000
2,90
0,00
0C
ust
omer
care
1137
7028
569
27,
446,
319
3,05
3,51
64,
775,
000
2,00
0,00
0M
anag
emen
t4
7560
180
480
5,16
5,82
31,
929,
213
6,42
5,00
080
0,00
0S
ales
424
070
672
1,63
217
,563
,800
7,20
2,39
620
,000
,000
2,00
0,00
0T
otal
s10
066
05,
528
14,8
8815
5,92
5,00
059
,251
,500
63,4
00,0
0013
,900
,000
Notes:
aR
LT
isem
plo
yee
rela
tiv
ele
arn
ing
tim
ew
ith
inth
efr
amew
ork
ofa
nor
mal
ized
100
mon
ths;
bH
Cis
emp
loy
eeh
ead
cou
nt,
use
das
ap
rox
yfo
rn
um
ber
ofex
ecu
tion
sof
pro
cess
es:
cp
erce
nt
auto
mat
ion
isth
ep
erce
nt
ofIS
con
trib
uti
onto
pro
cess
esov
eran
dab
ove
the
hu
man
con
trib
uti
on
Table I.KVA data
Knowledgevaluationanalysis
553
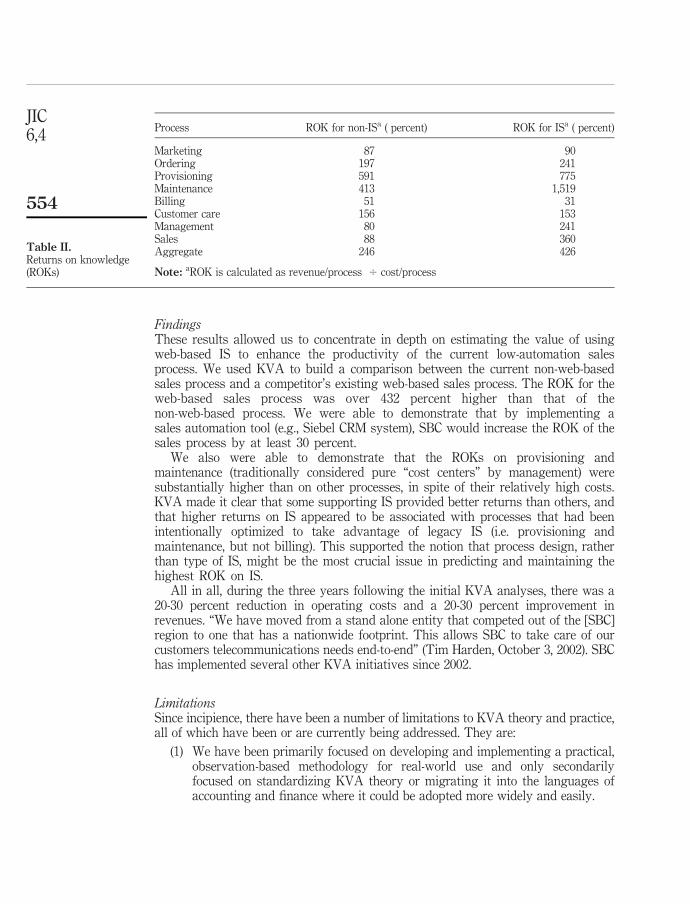
FindingsThese results allowed us to concentrate in depth on estimating the value of usingweb-based IS to enhance the productivity of the current low-automation salesprocess. We used KVA to build a comparison between the current non-web-basedsales process and a competitor’s existing web-based sales process. The ROK for theweb-based sales process was over 432 percent higher than that of thenon-web-based process. We were able to demonstrate that by implementing asales automation tool (e.g., Siebel CRM system), SBC would increase the ROK of thesales process by at least 30 percent.
We also were able to demonstrate that the ROKs on provisioning andmaintenance (traditionally considered pure “cost centers” by management) weresubstantially higher than on other processes, in spite of their relatively high costs.KVA made it clear that some supporting IS provided better returns than others, andthat higher returns on IS appeared to be associated with processes that had beenintentionally optimized to take advantage of legacy IS (i.e. provisioning andmaintenance, but not billing). This supported the notion that process design, ratherthan type of IS, might be the most crucial issue in predicting and maintaining thehighest ROK on IS.
All in all, during the three years following the initial KVA analyses, there was a20-30 percent reduction in operating costs and a 20-30 percent improvement inrevenues. “We have moved from a stand alone entity that competed out of the [SBC]region to one that has a nationwide footprint. This allows SBC to take care of ourcustomers telecommunications needs end-to-end” (Tim Harden, October 3, 2002). SBChas implemented several other KVA initiatives since 2002.
LimitationsSince incipience, there have been a number of limitations to KVA theory and practice,all of which have been or are currently being addressed. They are:
(1) We have been primarily focused on developing and implementing a practical,observation-based methodology for real-world use and only secondarilyfocused on standardizing KVA theory or migrating it into the languages ofaccounting and finance where it could be adopted more widely and easily.
Process ROK for non-ISa ( percent) ROK for ISa ( percent)
Marketing 87 90Ordering 197 241Provisioning 591 775Maintenance 413 1,519Billing 51 31Customer care 156 153Management 80 241Sales 88 360Aggregate 246 426
Note: aROK is calculated as revenue/process 4 cost/process
Table II.Returns on knowledge(ROKs)
JIC6,4
554
(2) Our data-gathering methods have not been fully standardized. So, althoughmuch data has been collected, we do not yet have a database of comparablehistorical KVA information from which to begin to benchmark future work orprovide broader-scale insights for current work.
(3) Due to the non-observable nature of “meta” knowledge, “meta” processes, andmanagement/creative staff processes, KVA theory, until recently, has simplyadded the cost of these components of value into the total cost of overhead.
(4) Finally, we have needed to embed KVA in a solid, useable, flexible softwareproduct that would provide the analytic power and storage capacity toundertake large-scale, complex KVA research and practical applications.
Latest developments and future possibilitiesKVA theory has been tested in a wide variety of practical and academic settings sinceits creation, including in collaboration with several leading management consultingfirms such as Deloitte & Touche, KPMG, and Ernst & Young. We continue to refineand use it as an analytic tool for major IT projects and other organizational initiativeswhere intellectual capital is the focus of concern. Since early 2004, we have focusedheavily on revisiting and addressing the limitations discussed above. By mid-2005,KVA will finally be embedded in software capable of unleashing its full potential. OnceKVA becomes more universally utilized and larger pools of KVA data have beengathered across time and industries, it will supply valuable benchmarking informationthat is both consistent over time within the organization and comparable amongorganizations and industries. At that time, some of the IC asset transparency andcomparability issues that plague accounting and finance can be addressed moresuccessfully.
Currently, we are in the process of exploring and publishing the implications ofKVA theory for fundamental financial theory and for the practice of real optionsanalysis. We have developed and introduced such concepts as an endogenousknowledge market, the knowledge asset pricing model, k-betas, and an exogenoussub-corporate equities market. We are also using KVA data and knowledge markettheory to resolve some of the long-standing limitations faced by practitioners of realoptions analysis (Nelson and Housel, 2005).
Finally, we hope that KVA theory will evoke new avenues of research andapplication within the consulting sector regarding the measurement and managementof IC assets. Perhaps it may provide this sector with one additional key to furtherunlocking Information Age wealth creation on behalf of client companies world-wide.
References
Anderson, J.R. (1976), Memory, Language, and Thought, Erlbaum, Hillsdale, NJ.
Anderson, J.R. (1995), Learning and Memory: An Integrated Approach, Wiley, New York, NY.
Barney, J.B. (1991), “Firm resources and sustained competitive advantage”, Journal ofManagement, Vol. 17 No. 1, pp. 99-120.
Brooking, A. (1996), Intellectual Capital: Core Assets for the Third Millenial Enterprise,Thompson Business Press, London.
Chen, J., Zhu, Z. and Xie, H.Y. (2004), “Measuring intellectual capital: a new model and empiricalstudy”, Journal of Intellectual Capital, Vol. 5 No. 1, pp. 195-212.
Knowledgevaluationanalysis
555
Cook, G. and Housel, T. (2005), “Where to invest in information systems: a CRM case study”,paper presented at the HICS Conference, January.
Glazer, R. (1998), “Measuring the knower: toward a theory of knowledge equity”, CaliforniaManagement Review, Vol. 40 No. 30, pp. 175-94.
Gobet, F. and Simon, H.A. (1996), “Recall of random and distorted chess positions: implicationsfor the theory of expertise”, Memory and Recognition, Vol. 24 No. 4, pp. 493-503.
Høegh-Krohn, N.E. and Knivsfla, K.H. (2000), “Accounting for intangible assets in Scandinavia,the UK, the US and by the IASC: challenges and a solution”, International Journal ofAccounting, Vol. 35 No. 2, pp. 243-65.
Housel, T. and Bell, A. (2001), Measuring and Managing Knowledge, McGraw Hill/Irwin,New York, NY.
Housel, T. and Nelson, S. (2004), Knowledge Valuation and Portfolio Management forCapabilities-Based Planning, Office of Force Transformation, Department of Defense,Washington, DC.
Housel, T. and Kanevsky, V. (1995), “Reengineering business processes: a complexity theoryapproach to value added”, INFOR, Vol. 33 No. 4, p. 251.
Kanevsky, V. and Housel, T. (1998), “The learning-knowledge-value cycle”, in von Krogh, G.,Roos, J. and Kleine, D. (Eds), Knowing in Firms: Understanding, Managing and MeasuringKnowledge, Sage, London.
King, A.W. and Zeithaml, C. (2003), “Research notes and commentaries: measuringorganizational knowledge: a conceptual and methodological framework”, StrategicManagement Journal, Vol. 24 No. 8, pp. 763-72.
Leonard, D. and Sensiperm, S. (1998), “The role of tacit knowledge in group innovation”,California Management Review., Vol. 40 No. 3, pp. 112-32.
Lev, B. (2001), Intangibles: Management, Measurement, and Reporting, The BrookingsInstitution, Washington, DC.
Lev, B. and Zarowin, P. (1999), “The boundaries of financial reporting and how to extend them”,Journal of Accounting Research., Vol. 37 No. 2, pp. 353-85.
Marr, B. (Ed.) (2005), Perspectives on Intellectual Capital: Multidisciplinary Insights intoManagement, Measurement, and Reporting, Elsevier, Boston, MA.
Nelson, R.R. and Winter, S.G. (1982), The Evolutionary Theory of Economic Change, BelknapPress of Harvard University Press, Cambridge, MA.
Nelson, S. and Housel, T. (2005), “Knowledge market theory: methods and implications”, paperpresented at the Real Options Conference, June.
Newell, A. and Simon, H.A. (1972), Human Problem Solving, Prentice-Hall, Englewood Cliffs, NJ.
Orlikowski, W.J. (2002), “Knowing in practice: enacting a collective capability in distributedorganizing”, Organization Science, Vol. 13 No. 3, pp. 249-73.
Simon, H.A. (1974), “How big is a chunk?”, Science, Vol. 183 No. 4124, pp. 482-8.
Singley, M.K. and Anderson, J.R. (1989), The Transfer of Cognitive Skill, Harvard UniversityPress, Cambridge.
Spender, J.-C. (1996), “Making knowledge the basis of a dynamic theory of the firm”, StrategicManagement Journal, Vol. 17, Winter special issue, pp. 45-62.
Sudarsanam, S., Sorwar, G. and Marr, B. (2003), “Valuation of intellectual capital and real optionsmodels”, paper presented at the PMA Intellectual Capital Symposium.
Tsoukas, H. (1996), “The firm as a distributed knowledge system: a constructionist approach”,Strategic Management Journal, Vol. 17, Winter special issue, pp. 11-26.
JIC6,4
556

Further reading
Lev, B., Canibano, L. and Marr, B. (2005), “An accounting perspective on intellectual capital”, inMarr, B. (Ed.), Perspectives on Intellectual Capital: Multidisciplinary Insights intoManagement, Measurement, and Reporting, Elsevier, Boston, MA, pp. 42-55.
Sudarsanam, S., Sorwar, G. and Marr, B. (2005), “A finance perspective on intellectual capital”, inMarr, B. (Ed.), Perspectives on Intellectual Capital: Multidisciplinary Insights intoManagement, Measurement, and Reporting, Elsevier, Boston, MA, pp. 56-68.
Knowledgevaluationanalysis
557