Board diversity and organizational valuation: unravelling the effects of ethnicity and gender
29
Board diversity and organizational valuation: unravelling the effects of ethnicity and gender Collins G. Ntim Ó Springer Science+Business Media New York 2013 Abstract Organizational boards of directors are one of the most important sub- groups within most modern organizations, performing critical advisory, monitoring and resource dependence roles. This paper investigates the crucial question of whether the stock market values ethnic and gender diversity within organizational boards. We find that board diversity is positively associated with market valuation. We distinctively demonstrate further that ethnic diversity is valued more highly by the stock market than gender diversity. By contrast, we do not find any evidence of a significant non-linear link between board diversity and market valuation. Our findings are robust across a number of econometric models that deal with different types of endogeneities and market valuation measures. Overall, our results are consistent with agency and resource dependence theoretical predictions. Keywords Organizational governance Organizational valuation Board diversity Ethnicity and gender Endogeneity JEL Classification G30 G32 G34 G38 1 Introduction Organizational boards of directors are one of the most important subgroups within the top management of most modern organizations (Bilimoria and Piderit 1994; C. G. Ntim (&) Centre for Research in Accounting, Accountability, and Governance, School of Management, University of Southampton, Highfield, Building 2, Southampton SO17 1BJ, UK e-mail: [email protected]; [email protected] C. G. Ntim Accountancy Department, Huddersfield Business School, University of Huddersfield, Huddersfield, UK 123 J Manag Gov DOI 10.1007/s10997-013-9283-4
-
Upload
independent -
Category
Documents
-
view
1 -
download
0
Transcript of Board diversity and organizational valuation: unravelling the effects of ethnicity and gender
Board diversity and organizational valuation:unravelling the effects of ethnicity and gender
Collins G. Ntim
� Springer Science+Business Media New York 2013
Abstract Organizational boards of directors are one of the most important sub-
groups within most modern organizations, performing critical advisory, monitoring
and resource dependence roles. This paper investigates the crucial question of
whether the stock market values ethnic and gender diversity within organizational
boards. We find that board diversity is positively associated with market valuation.
We distinctively demonstrate further that ethnic diversity is valued more highly by
the stock market than gender diversity. By contrast, we do not find any evidence of a
significant non-linear link between board diversity and market valuation. Our
findings are robust across a number of econometric models that deal with different
types of endogeneities and market valuation measures. Overall, our results are
consistent with agency and resource dependence theoretical predictions.
Keywords Organizational governance � Organizational valuation � Board
diversity � Ethnicity and gender � Endogeneity
JEL Classification G30 � G32 � G34 � G38
1 Introduction
Organizational boards of directors are one of the most important subgroups within
the top management of most modern organizations (Bilimoria and Piderit 1994;
C. G. Ntim (&)
Centre for Research in Accounting, Accountability, and Governance, School of Management,
University of Southampton, Highfield, Building 2, Southampton SO17 1BJ, UK
e-mail: [email protected]; [email protected]
C. G. Ntim
Accountancy Department, Huddersfield Business School, University of Huddersfield, Huddersfield,
UK
123
J Manag Gov
DOI 10.1007/s10997-013-9283-4
Roberson and Park 2007; Mahadeo et al. 2012; Arnegger et al. 2013; Bart and
McQueen 2013; Dale-Olsen et al. 2013; Luckerath-Rovers 2013), performing
strategic functions, including advising, monitoring, disciplining, motivating and
compensating managers, as well as providing access to critical resources, such as
business contracts, contacts and finance (Lipton and Lorsch 1992; Jensen 1993;
Welbourne et al. 2007; Lincoln and Adedoyin 2012; Abdullah 2013; Triana et al.
2013; Wellage and Locke 2013). This paper examines the crucial question of
whether the South African (SA) stock market values ethnic and gender diversity
among the boards of publicly listed organizations. Specifically, we exploit a natural
and unique organizational context in SA, where recent regulatory, affirmative
action, and organizational governance (OG) reforms uniquely require listed
organizations to formally compose diverse boards on the basis of ethnicity and
gender to investigate whether board diversity can explain observable variations in
their market value.
Although SA has been widely recognised as one of the most ethnically diverse
countries in the world (Armstrong et al. 2006; West 2009; Ntim and Soobaroyen
2013a, b), long-standing apartheid policy of racial, social, economic and political
segregation resulted in largely homogenous organizational boards (Ho and Williams
2003; Swartz and Firer 2005). As will be discussed further, and following the
collapse of apartheid in 1994, a number of regulatory, affirmative action, and OG
reforms have been pursued aimed at enhancing diversity within SA organizational
boards (Armstrong et al. 2006; West 2009; Ntim and Soobaroyen 2013a). These
reforms include the 1994 and 2002 King Reports on OG, the 1998 Employment
Equity (EE) Act, and the 2003 Black Economic Empowerment (BEE) Act.1
Generally, the reforms, especially the King Reports have focused on improving
governance standards in SA public organizations (King Committee 2002; Rossouw
et al. 2002; Armstrong et al. 2006; Ntim and Soobaroyen 2013a). A more specific
objective of these reforms, however, has been to increase the monitoring power of
SA organizational boards by improving board effectiveness and efficiency (West
2009; Andreasson 2013), and thereby enhancing the overall market value. A key
determinant of organizational boards’ operational and functional effectiveness and
efficiency is the degree of ethnic and gender diversity (Pfeffer 1973; Lipton and
Lorsch 1992; Jensen 1993; Sonnenfeld 2002; Krishman and Park 2005; Kang et al.
2007; Campbell and Minquez-Vera 2008; Bart and McQueen 2013). Arguably,
these unique regulatory and OG reforms provide a significant impetus to investigate
the extent to which board diversity on the basis of ethnicity and gender influence
market valuation in a major emerging economic power.
Apart from the distinctive regulatory and OG reforms pursued, it has been argued
that the association between board diversity and market valuation may not just vary
by organizational-level heterogeneities (Baysinger and Butler 1985; Baysinger and
Hoskisson 1990; Goodstein et al. 1994), but also by variations in country-level
1 As will be discussed further, some of the reforms set specific targets of non-white (i.e., people of Black
African, Chinese, Indian and Mixed Race backgrounds) board representation for organizations to comply
with. For example, the 1998 Employment Equity and 2003 Black Economic Empowerment Acts set
aspirational (not legally enforceable) target of 40 to 50% non-white senior management and/or board
membership.
C. G. Ntim
123
regulatory, OG and institutional features (van der Walt and Ingley 2003; Singh and
Vinnicombe 2004; Singh 2007). In spite of this development, previous studies
investigating the association between board diversity and market valuation are
primarily concentrated in a small number of matured Western economies, such as
US that depict comparatively similar institutional contexts (Gilbert and Stead 1999;
Carter et al. 2003; Catalyst 2007; Adams and Ferreira 2009; Carter et al. 2010). A
further issue of concern is that existing studies that have been mainly conducted in
developed countries have focused largely on the valuation implications of board
diversity on the basis of gender (Shrader et al. 1997; Burges and Tharenou 2002;
Erhardt et al. 2003; Welbourne et al. 2007; Johnston and Malina 2008; Dobbin and
Jung 2011; Lincoln and Adedoyin 2012; Abdullah 2013; Luckerath-Rovers 2013).
With respect to the African context, although a limited number of studies have
analysed the impact of different OG structures, such as the frequency of board
meetings (El Mehdi 2007; Ntim and Osei 2011), ownership structure (Sanda et al.
2010; Ntim 2012, 2013), board size (Ho and Williams 2003; Kyereboah-Coleman
et al. 2006) and board structure (Swartz and Firer 2005; Kyereboah-Coleman and
Biekpe 2006; Sunday 2008; Ntim 2011) on market valuation, studies examining the
valuation implications of ethnic and gender diversity within organizational boards
are rare (Lincoln and Adedoyin 2012; Mahadeo et al. 2012; Ujunwa 2012; Ujunwa
et al. 2012).
However, it is argued that in emerging economies, such as SA with different
regulatory, OG practices, and institutional contexts (as will be explained further),
the effectiveness and efficiency of board diversity may vary, and as such the
association between board diversity on the basis of ethnicity and gender, and market
valuation can be expected to be different from what has been reported for public
organizations operating in developed countries. Hence, an examination of the
impact of board diversity on market value in emerging African markets, where there
is an acute dearth of reliable empirical evidence (Swartz and Firer 2005;
Amankwah-Amoah and Debrah 2010; Mahadeo et al. 2012) will arguably be
important in providing a more holistic understanding of the effect that board
diversity has on market valuation (Dwyer et al. 2003; Brammer et al. 2007; du
Plessis 2008; Lincoln and Adedoyin 2012; Triana et al. 2013
Therefore, and in this paper, we investigate the crucial policy question of whether
the SA stock market values ethnic and gender diversity within the boards of publicly
listed organizations, and thereby making a number of distinctive contributions to the
extant literature. First, using a sample of SA listed organisations, we provide
evidence on the relationship between board diversity and market value. To the best
of our knowledge, this study constitutes one of the first attempts at estimating the
impact of board diversity on organizational valuation within an African context,
with particular focus on SA, and thus crucially extends the literature to that
continent. The study also contributes to the mainly developed countries-based
literature on the association between board diversity and market valuation. Second,
and different from most past studies, we show how both ethnic and gender diversity
affect market value, and thereby shedding new crucial insights on the link between
ethnic diversity and market value. Third, we distinctively provide evidence on the
relative value relevance of ethnic versus gender diversity on market valuation.
Board diversity and organizational valuation
123
Fourth, we uniquely investigate the existence of a non-monotonic association
between board diversity and market valuation. Finally, and distinct from most prior
studies, we apply econometric methods that sufficiently deal with different kinds of
endogeneities, as well as make use of different measures of market valuation.
Our results suggest that the SA stock market values ethnic and gender diversity
within organizational boards as there is a statistically significant and positive
relationship between board diversity and market valuation. Distinct from prior
studies, we show further that ethnic diversity is valued more highly by the SA stock
market than gender diversity. This sheds new important insights on the relative
value relevance of gender versus ethnic diversity on market valuation. By contrast,
we do not find any evidence of a significant non-linear link between board diversity
and market valuation. The central tenor of our findings remains unchanged across a
number of econometric models that deal with different types of endogeneities and
market valuation measures. Overall, our findings are consistent with agency and
resource dependence theories, which suggest that ethnic and gender diversity
enhances board independence, executive monitoring and decision-making, as well
as helps to better link an organization to its external environment that facilitates
securing critical resources, and thereby improving market valuation.
The rest of the paper is structured as follows. The second section provides a brief
overview of the organizational governance and statutory reforms on board diversity
within the South African organizational context. The third section discusses the
extant theoretical and empirical literature on the impact of board diversity on market
valuation. The fourth section presents the research design. The fifth section reports
empirical analyses, whilst the final section contains concluding remarks.
2 Organizational governance and statutory reforms on board diversitywithin the South African organizational context
As previously explained, and although SA is widely perceived as one of the most
ethnically diverse countries in the world (Armstrong et al. 2006; Andreasson 2013),
apartheid policy of racial segregation in every reasonably conceivable aspect of life,
such as education, housing, and economic participation ensured that organizational
boards were dominated mainly by middle class white males (Swartz and Firer 2005;
Ntim and Soobaroyen 2013a). Therefore, and following the collapse of apartheid in
1994, the ruling African National Congress initiated a number of reforms that were
aimed addressing historical socio-economic inequalities between black and white
South Africans (Rossouw et al. 2002; West 2009). Among the reforms pursued so
far, the 1994 and 2002 King Reports on OG, the 1998 EE Act and the 2003 BEE Act
are directly relevant to enhancing diversity within SA organizational boards.2
First, and although OG had implicitly existed in SA in the form of the 1861
Companies Act, the general view is that the introduction of the King Reports
2 As an illustration (and will also be discussed further in Sects. 5, 7), the Appendix contains examples of
annual report disclosures of progress made by some SA companies on complying with the 1998
employment equity and 2003 black economic empowerment acts.
C. G. Ntim
123
explicitly institutionalised OG practices (Mangena and Chamisa 2008; Ntim et al.
2012). The reports focused primarily on improving the way in which SA
organizations are governed (King Committee 2002), coinciding with international
attempts (e.g., the 1992 UK Cadbury Report) at enhancing the efficacy of OG
structures around the world, as well as preceding well-publicised cases of major
organizational failure mainly in a number of developed economies in the 1980s,
especially in the UK and US (King Committee 2002).
Noticeably, the OG proposals contained in the King Reports were largely similar
to those of the UK’s Cadbury Report (Mangena and Chamisa 2008; Andreasson
2013). For example, and similar to the Cadbury Report, the King Reports
recommended an Anglo-American style single-tier independently chaired board of
directors, consisting of executive and independent non-executive directors,
supported by independent committees (e.g., audit, remuneration, and nomination),
and operating within a voluntary (‘comply or explain’) OG compliance regime
(King Committee 2002; Armstrong et al. 2006). With particular respect to board
diversity, the King Reports did not set any specific targets for organizations to
comply with. However, the Reports suggested that every organization should
consider whether its board is diverse enough in terms of demographics (i.e., age,
ethnicity and gender). This is expected to ensure that the composition of SA
organizational boards reflect the naturally diverse SA context, as well as make them
effective.
Second, and unlike the King Reports, the 1998 EE and 2003 BEE Acts focused
directly on enhancing diversity within SA organizational boards (Andreasson 2013;
Ntim and Soobaroyen 2013a). More specifically, the EE Act seeks to identify and
eliminate all previous unfair and discriminatory employment practices on any
grounds, including race and gender, requiring every organization to work towards
achieving a balance between their non-white and white workforce across all levels
of the organisational hierarchy.3 Similarly, the BEE Act focuses on transforming the
SA economy by de-racialising organizational ownership and management by
increasing black ownership and direct participation in business. Specifically, the
BEE Act proposes a number of ways by which economic transformation can be
achieved, including equity ownership and management control with clear cut targets
for organizations to meet. For example, and to address the low participation of
blacks in executive management, the Act encourages organizations to appoint
qualified blacks into senior management positions, including board memberships,
with a target of 40 to 50% non-whites.
Third, and crucially, compliance with these reforms are largely voluntary. The
SA organizational setting is, however, distinctively characterised by high block and
institutional shareholdings, mainly in the form of complex cross-ownerships and tall
pyramids (Barr et al. 1995; Ntim et al. 2012). Also, shareholder activism is
noticeably weak, whilst the ability to implement and enforce organizational laws is
observably poor (Rossouw et al. 2002; Mangena and Chamisa 2008). Together, and
3 This implicitly suggests that the average SA organizations should ideally have a workforce consisting
of about 80% non-whites and 20% whites at all levels of the organizational hierarchy, including the board
of directors in order to reflect the ethnic diversity and composition of the SA populace.
Board diversity and organizational valuation
123
given the SA organizational context, this raises critical concerns as to whether a
voluntary compliance regime, as contained in the King Reports and the BEE Act,
for example, will be effective in achieving meaningful diversity within SA
organizational boards. Consequently, the main objective is to investigate the extent
to which these regulatory, affirmative action, and OG reforms have been able to
enhance diversity within the SA organizational boards, and whether the stock
market values such diversity within SA organizational boards.
3 Board diversity and market value: theory, evidence and hypothesisdevelopment
Organizational boards of directors remain one of the most crucial subgroups within
the upper management of a considerable number of organizations (Lipton and
Lorsch 1992; Bilimoria and Piderit 1994; Sonnenfeld 2002; Lincoln and Adedoyin
2012; Bart and McQueen 2013; Dale-Olsen et al. 2013). As a group, organizational
boards perform a number of strategic functions, including advising, monitoring,
compensating and firing executives, and securing critical organizational resources
(Pfeffer 1973; Jensen 1993; Yermack 1996; Abdullah 2013; Luckerath-Rovers
2013; Wellage and Locke 2013). In fact, and as discussed, one of the most
significant OG issues currently facing SA organizations is board diversity4 and its
impact on market valuation.
However, there are mixed theoretical propositions as to the impact of board
diversity on shareholder value: those who argue for more diversity in boardrooms
and those who are in favour of organizational monoculture and boardroom
uniformity (Bilimoria and Piderit 1994; du Plessis 2008; Kang et al. 2007; Singh
2007; Campbell and Minquez-Vera 2008). Proponents of diversity in organizational
boardrooms usually base their arguments on agency, resource dependence and
stakeholding theories (Goodstein et al. 1994; Burges and Tharenou 2002; Dwyer
et al. 2003; Roberson and Park 2007; Yang and Konrad 2011). Firstly, agency
theory suggests that boards of diverse backgrounds increases board independence
and improves executive monitoring (Kesner 1988; van der Walt and Ingley 2003;
Johnston and Malina 2008; Lincoln and Adedoyin 2012; Abdullah 2013; Triana
et al. 2013), and thereby enhance market value.
Secondly, it brings diversity in ideas, perspectives, experience, and business
knowledge to the decision-making process in boardrooms (Gilbert and Stead 1999;
Watson et al. 1993; Baranchuk and Dybvig 2009; Luckerath-Rovers 2013), which
can facilitate better appreciation of the complexities of the organizational external
environment. It can also increase creativity and innovation in boardrooms due to
diversity in cognitive abilities, which can also facilitate effective decision-making
4 Board diversity has been broadly defined as the various attributes that may be represented among
directors in the boardroom in relation to board process and decision-making, including age, gender,
ethnicity, culture, religion, constituency representation, independence, knowledge, educational and
professional background, technical skills and expertise, commercial and industry experience, career and
life experience (van der Walt and Ingley 2003, p. 219). In this paper, we focus only on ethnic and gender
aspects of the board.
C. G. Ntim
123

(Wiersema and Bantel 1992; Carter et al. 2003; Welbourne et al. 2007; Lincoln and
Adedoyin 2012; Bart and McQueen 2013), and impact positively on market
valuation.
Thirdly, resource dependence theory indicates that board diversity can have a
positive influence on market valuation by linking an organization to its external
environment and secure critical resources, including skills, business contacts,
prestige and legitimacy (Goodstein et al. 1994; Westphal and Bednar 2005;
Arnegger et al. 2013). Finally, it has been suggested that (Shrader et al. 1997; Ryan
and Haslam 2007; Mahadeo et al. 2012; Wellage and Locke 2013) organizational
boards of qualified individuals of diverse backgrounds and constituencies can help
provide a better link with an organization’s stakeholders, such as consumers and
communities, which can improve its opportunities, reputation and value. Carter
et al. (2003) suggest, for example, that by matching the diversity of an
organization’s board to the diversity of its customers and suppliers, it can
significantly increase its ability to penetrate competitive markets.
However, and relying on agency and organization theories, opponents contend
that board diversity can impact negatively on market valuation. Firstly, ethnic and
gender-based board members may be appointed as a sign of tokenism, and as such
their contributions may be marginalised (Hillman et al. 2007; Abdullah 2013).
Secondly, organization theory indicates that greater diversity within boards may
significantly constrain its efforts to take decisive action and initiate strategic
changes, especially in times of poor organizational performance and environmental
turbulence (Goodstein et al. 1994; Krishman and Park 2005). Thirdly, diverse board
members may bring their individual and constituencies’ interests and commitments
to the board (Baysinger and Butler 1985; Wellage and Locke 2013). The greater the
diversity of these interests, the greater the potential for conflicts and factions to
emerge among them as a group (Roberson and Park 2007; Baranchuk and Dybvig
2009), which can inhibit boardroom cohesion and performance (Goodstein et al.
1994; Francoeur et al. 2008; Lincoln and Adedoyin 2012).5
Consistent with the conflicting nature of the theoretical literature on board
diversity, previous evidence regarding the link between board diversity and market
valuation is equally mixed (Zahra and Stanton 1988; Wiersema and Bantel 1992;
Shrader et al. 1997; Carter et al. 2003, 2010; Ujunwa 2012; Dale-Olsen et al. 2013).
One strand of the empirical literature reports that more diverse boards are associated
with higher market valuation (Erhardt et al. 2003; Adams and Ferreira 2009; Adler
2010). For example, and using 25 American listed organizations, Adler (2010) finds
a positive correlation between employing higher percentage of women in top
management and market valuation. Carter et al. (2003) also report a positive link
between board diversity and market value using a 1997 cross-sectional sample of
638 American organizations.
5 This also suggests that the association between board diversity and organizational value can be non-
linear, whereby initial increases in ethnic and gender board representations lead to declines in market
valuation up to a point, beyond which additional increases in diversity improve market valuation
(Roberson and Park 2007). Therefore, we investigate whether there is a curvilinear relationship between
board diversity and market valuation, as part of our robustness analyses.
Board diversity and organizational valuation
123

Consistent with prior evidence (Erhardt et al. 2003; Catalyst 2007; Kang et al.
2007; Campbell and Minquez-Vera 2008; Johnston and Malina 2008; Robertson and
Park 2008), Francoeur et al. (2008) examine whether the participation of women in
an organization’s board improves market valuation in a sample of 230 Canadian
listed organizations from 2001 to 2004. They report positive and significant
abnormal returns in organizations with a higher proportion of women officers.
Further, recent evidence by Mahadeo et al. (2012), Abdullah (2013), Bart and
McQueen (2013), Luckerath-Rovers (2013), Triana et al. (2013), and Wellage and
Locke (2013) provide additional support for the evidence of a positive association
between board diversity and market valuation in Mauritius, Malaysia, Finland,
Netherlands, US, and Sri Lanka, respectively.
By contrast, but consistent with the conflicting nature of prior board diversity
theory, other studies report that board diversity rather impacts negatively on market
valuation (Watson et al. 1993; Shrader et al. 1997; Hillman et al. 2007; Ujunwa
2012; Ujunwa et al. 2012; Dale-Olsen et al. 2013). Goodstein et al. (1994)
investigate the impact of board diversity on an organization’s ability to initiate
strategic changes in a total of 335 American organizations from 1980 to 1985, and
find that organizations with diverse boards are less likely to initiate strategic
changes than those with homogenous boards. Shrader et al. (1997) examine the
association between the percentage of female board members and market valuation
for a 1992 cross-sectional sample of 200 American organizations. Their results
suggest a negative relationship between the percentage of women on the board and
market valuation, implying that while the views of women on the board may be
marginalised, their presence may also have financial costs implications for the
organization, which can impact negatively on market valuation. Recent evidence by
Ujunwa (2012), Ujunwa et al. (2012), and Dale-Olsen et al. (2013) supports the
theoretical prediction that firms that have more women on their boards tend to be
valued lowly.
A third stream of empirical studies (Zahra and Stanton 1988; Farrell and Hersch
2005; Westphal and Bednar 2005; Rose 2007), indicates that board diversity has no
impact on market valuation. For example, and using a sample of 95 American listed
organizations, Zahra and Stanton (1988) find no significant relationship between
board diversity and market valuation. Similarly, Rose (2007) investigates whether
female board representation influence market valuation using a sample of Danish
listed organizations over the period 1998–2001. Consistent with the evidence of
Zahra and Stanton (1988), he finds no significant link between market valuation and
female board representation. Observably, these studies have focused mainly on how
gender diversity within organizational boards impacts on their market valuation,
resulting in limited insights on how ethnic diversity within boards influence their
dynamics, as a top management group and market valuation.
With respect to SA, and as has been discussed, both the 1998 EE and 2003 BEE
Acts directly seek to enhance ethnic and gender diversity within SA organizational
boards. Similarly, the King Reports require organizations to regularly review ethnic
and gender composition of their boards, so as to not only reflect the diverse SA
context, but also enhance effective operations. Together, these regulatory and OG
reforms appear to suggest that board diversity can impact positively on market
C. G. Ntim
123

valuation. However, and given the mixed international evidence, we predict a
statistically significant association between board diversity and market valuation
without being specific about the direction of the sign of the coefficient. Therefore,
our main hypothesis to be tested in this study is that:
H1 There is either a statistically significant negative or positive association
between board diversity on the basis of both ethnicity and gender, and market
valuation.
4 Research design
4.1 Sample and data
As at 31/12/2007, a total of 402 organizations from ten industries, namely: basic
materials; consumer goods; consumer services; financials; health care; industrials;
oil & gas; technology; telecoms; and utilities were listed on the Johannesburg Stock
Exchange. Due to capital structure and regulatory reasons, 111 financials and
utilities were excluded from the sample, leaving us with 291 organizations from
eight non-financial industries to be sampled. We needed data on OG and financial
variables to investigate the association between board diversity and market value.
The OG variables were collected from the sampled organizations’ annual reports,
which were downloaded from the Perfect Information Database. The financial data
were collected from DataStream. The organizations in our final sample had to
satisfy two criteria: the accessibility to an organization’s full five-year annual
reports from 2002 to 2006; and the availability of an organization’s corresponding
financial data from 2003 to 2007.6
Our criteria were motivated by a number of reasons. First, and in line with past
studies (Yermack 1996; Carter et al. 2003), the criteria allowed us to satisfy the
requirements for a balanced panel data analysis. Some of the benefits that can be
derived for using panel data include having both time-series and cross-sectional
observations, more degrees of freedom and less multi-collinearity among the
variables (Gujarati 2003; Wooldridge 2010). Second, an investigation of five-year
data with both cross-sectional and time-series properties may be useful in
determining whether the observed cross-sectional relationship between board
diversity and market valuation holds over-time (Carter et al. 2010; Ntim et al. 2012).
This may help in drawing direct comparisons with the findings of previous studies
(Rose 2007; Francoeur et al. 2008; Robertson and Park 2008). Using our selection
6 Organizational board decisions take time in order to be reflected in market value (Guest 2009; Ntim
et al. 2012). Thus, to circumvent potential endogenous relationship between board diversity and market
valuation, we introduce a one year lag between board diversity and market valuation such that this year’s
organizational value depends on last year’s governance structure similar to Yermack (1996) and Ntim
et al. (2012), as specified in equation (1). The sample also starts from 2002 for two reasons. First, King II
came into operation in 2002, and secondly, data coverage in Perfect Information/DataStream on SA listed
organizations is very limited until 2002. The sample ends in 2007 because it is the year for which data is
available.
Board diversity and organizational valuation
123
criteria, the complete data needed is obtained for a total of 169 organizations over
five years and 8 industries for our empirical investigation.
4.2 Dependent, independent and control variables
In this subsection, we discuss the three main categories of variables that we use in
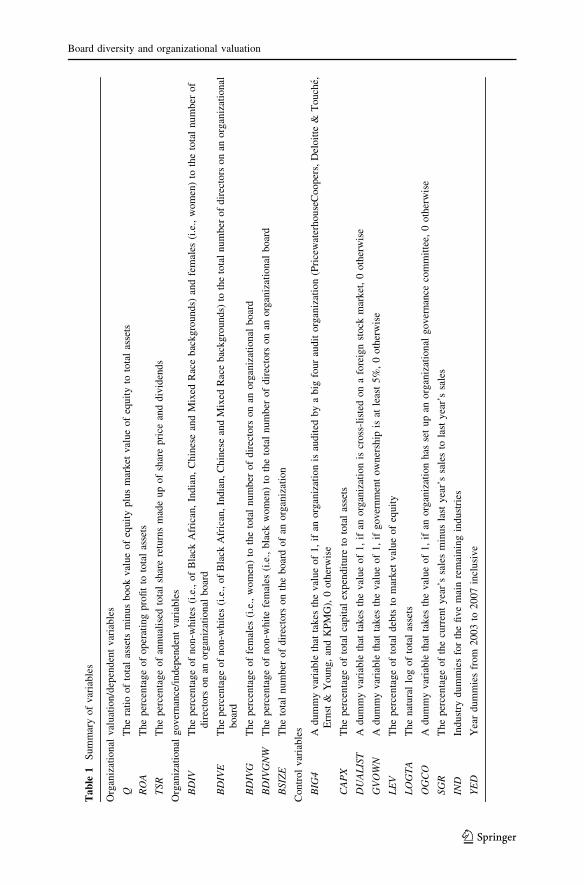
our examination, and Table 1 contains their full definitions. First, we measure our
main independent variable in four ways: board diversity on the basis of ethnicity
(BDIVE); board diversity on the basis of gender (BDIVG); board diversity on the
basis of gender non-whites (i.e., black women) (BDIVGNW); and board diversity on
the basis of both ethnicity and gender (BDIV). Second, the widely used Tobin’s Q
(Q) is our main dependent variable/measure for market valuation. As a robustness
check, however, we use return on assets (ROA) and total share return (TSR), as an
alternative accounting and market-based organizational valuation measures,
respectively.
Finally, and in line with past studies (Carter et al. 2003, 2010; Johnston and
Malina 2008; Dale-Olsen et al. 2013), we include below a number of control
variables to control for potential omitted variables bias. First, organizations with
greater investment opportunities often grow faster (Beiner et al. 2006; Ntim et al.
2012) and hence, such organizations are more likely to be highly valued by the stock
market. Therefore, we conjecture that sales growth (SGR) will correlate positively to
market valuation. Second, organizations that invest heavily in research and
development can obtain knowledge and technological advantages over their
competitors (Shrader et al. 1997; Adams and Ferreira 2009), and as such, may be
highly valued by the stock market. By contrast, the capital intensive nature of the
research and development activity (Baranchuk and Dybvig 2009; Ntim et al. 2012),
can impact negatively on current market valuation.
In a similar vein, and on the one hand, organizations that use more debt can
improve their market valuation by effectively minimising the ability of opportu-
nistic managers to extract ‘free cash flows’ (Jensen 1986; Guest 2009). On the other
hand, high levels of leverage can increase the risk of financial distress and
bankruptcy by impairing the ability of organizations to fully utilise commercial
opportunities (Jensen 1986; Ntim et al. 2012). This can impact negatively on market
valuation. Also, larger organizations may have economy of scale, market power,
and access to resources advantages over their smaller counterparts (Beiner et al.
2006; Roberson and Park 2007) and therefore, may be more highly valued by the
stock market. By contrast, smaller organizations tend to have higher opportunities to
grow than larger ones (Pfeffer 1973; Guest 2009; Kang et al. 2007; Dale-Olsen et al.
2013; Triana et al. 2013) and hence, smaller organizations may be valued higher by
the stock market than larger organizations.
Due to the conflicting theoretical expectations, we predict that leverage (LEV),
capital expenditure (CAPX) and organizational size (LOGTA) will have either a
negative or positive correlation with market valuation. Third, organizations that are
cross-listed on foreign stock markets may be better placed to raise capital at a
cheaper cost to finance growth opportunities than their non-cross-listed counterparts
(Ntim et al. 2012), and thus may be valued more highly by the stock market. Hence,
C. G. Ntim
123
Ta
ble
1S
um
mar
yo
fv
aria
ble
s
Org
aniz
atio
nal
val
uat
ion/d
epen
den
tvar
iable
s
QT
he
rati
oo
fto
tal
asse
tsm
inu
sb
oo
kv
alue
of
equ
ity
plu
sm
ark
etv
alue
of
equ
ity
toto
tal
asse
ts
RO
AT
he
per
cen
tag
eo
fo
per
atin
gp
rofi
tto
tota
las
sets
TS
RT
he
per
centa
ge
of
annual
ised
tota
lsh
are
retu
rns
mad
eu
po
fsh
are
pri
cean
ddiv
iden
ds
Org
aniz
atio
nal
go
ver
nan
ce/i
nd
epen
den
tv
aria
ble
s
BD
IVT
he
per
cen
tag
eo
fn
on
-whit
es(i
.e.,
of
Bla
ckA
fric
an,
Ind
ian,
Ch
ines
ean
dM
ixed
Rac
eb
ack
gro
un
ds)
and
fem
ales
(i.e
.,w
om
en)
toth
eto
tal
nu
mb
ero
f
dir
ecto
rso
nan
org
aniz
atio
nal
bo
ard
BD
IVE
The
per
centa
ge
of
non-w
hit
es(i
.e.,
of
Bla
ckA
fric
an,
India
n,
Chin
ese
and
Mix
edR
ace
bac
kgro
unds)
toth
eto
tal
num
ber
of
dir
ecto
rson
anorg
aniz
atio
nal
bo
ard
BD
IVG
Th
ep
erce
nta
ge
of
fem
ales
(i.e
.,w
om
en)
toth
eto
tal
nu
mb
ero
fd
irec
tors
on
ano
rgan
izat
ion
alb
oar
d
BD
IVG
NW
Th
ep
erce
nta
ge
of
no
n-w
hit
efe
mal
es(i
.e.,
bla
ckw
om
en)
toth
eto
tal
nu
mb
ero
fd
irec
tors
on
ano
rgan
izat
ion
alb
oar
d
BS
IZE
The
tota
lnum
ber
of
dir
ecto
rso
nth
eboar
do
fan
org
aniz
atio
n
Con
tro
lv
aria
ble
s
BIG
4A
du
mm
yv
aria
ble
that
tak
esth
ev
alu
eo
f1
,if
ano
rgan
izat
ion
isau
dit
edb
ya
big
fou
rau
dit
org
aniz
atio
n(P
rice
wat
erh
ou
seC
oo
per
s,D
elo
itte
&T
ou
che,
Ern
st&
Young,
and
KP
MG
),0
oth
erw
ise
CA
PX
Th
ep
erce
nta
ge
of
tota
lca
pit
alex
pen
dit
ure
toto
tal
asse
ts
DU
AL
IST
Adum
my
var
iable
that
takes
the
val
ue
of
1,
ifan
org
aniz
atio
nis
cross
-lis
ted
on
afo
reig
nst
ock
mar
ket
,0
oth
erw
ise
GV
OW
NA
du
mm
yv
aria
ble
that
tak
esth
ev
alu
eo
f1
,if
go
ver
nm
ent
ow
ner
ship
isat
leas
t5
%,
0o
ther
wis
e
LE
VT
he
per
cen
tag
eo
fto
tal
deb
tsto
mar
ket
val
ue
of
equ
ity
LO
GT
AT
he
nat
ura
llo
go
fto
tal
asse
ts
OG
CO
Ad
um
my
var
iab
leth
atta
kes
the
val
ue
of
1,
ifan
org
aniz
atio
nh
asse
tu
pan
org
aniz
atio
nal
go
ver
nan
ceco
mm
itte
e,0
oth
erw
ise
SG
RT
he
per
cen
tag
eo
fth
ecu
rren
ty
ear’
ssa
les
min
us
last
yea
r’s
sale
sto
last
yea
r’s
sale
s
IND
Indust
rydum
mie
sfo
rth
efi
ve
mai
nre
mai
nin
gin
dust
ries
YE
DY
ear
du
mm
ies
from
20
03
to2
00
7in
clu
siv
e
Board diversity and organizational valuation
123
we expect dual-listed organizations (DUALIST) to be positively related to market
valuation. Fourth, DeAngelo (1981) suggests that audit organizational size is
positively related to auditor independence and audit quality, and therefore
organizations audited by large audit organizations may be more highly valued by
the stock market. Thus, we predict that the size and reputation of the audit
organization (BIG4) will impact positively on market valuation.
Fifth, maintaining connections with government in the form of direct government
ownership can provide access to critical resources, such as finance and lucrative
business contracts (Pfeffer 1973; Yang and Konrad 2011). Therefore, we expect
government ownership (GVOWN) to correlate positively with market valuation.
Sixth, organizations that voluntarily set-up OG committee to specifically monitor
OG standards may be in a better position to reduce the ability of self-serving
managers to expropriate organizational resources (Ntim et al. 2012), and as such
may be more highly valued by the stock market. Thus, we expect the presence of an
OG committee (OGCO) to be positively associated with market valuation. Finally,
and in line with past studies (Roberson and Park 2007; Welbourne et al. 2007;
Johnston and Malina 2008), we expect that market valuation will differ across
different industries and financial years. Therefore, we include industry (IND)
dummies for the 5 remaining industries7: basic materials and oil & gas; consumer
goods; consumer services and health care; industrials; and technology and telecoms;
and year (YED) dummies for the financial years 2003–2007.
5 Empirical analyses and discussion
5.1 Descriptive statistics
Table 2 contains detailed descriptive statistics relating to different aspects of board
diversity within SA organizations. Table 2 shows that BDIV has a wide spread,
ranging from a minimum of 0% to a maximum of 100%, and averaging approximately
at 30%. This implies that despite board diversity reforms pursued (BEE, EE and King
Reports), the average SA listed organization’s board remains dominated (70%) by
white males. Our finding is largely consistent with those of past studies (Brammer et al.
2007; Francoeur et al. 2008; Luckerath-Rovers 2013; Triana et al. 2013). For example,
in a sample of 543 UK organizations, Brammer et al. (2007) find that only 23% of the
average board members originate from diverse ethnic and gender backgrounds. Of the
30% diverse board members (BDIV), only 34% are women (BDIVG).
Similarly, and of the approximately 26% non-whites (BDIVE) found on an
average organization’s board, only 23% are women (BDIVGNW). Overall, only
17% of the board members of an average sampled organization are women
(BDIVG), of which 56% are women of colour. The evidence of low representation
7 Due to insufficient number of observations in 3 industries, namely health care, oil and gas, and telecoms
industries with three, one and three listed organizations, respectively, were merged with the closest
remaining five major industries. Consequently, the three health care organizations were included in the
consumer services industry, the one oil and gas organization was added to the basic materials industry,
whilst the three telecoms organizations were also shared out to the technology industry.
C. G. Ntim
123
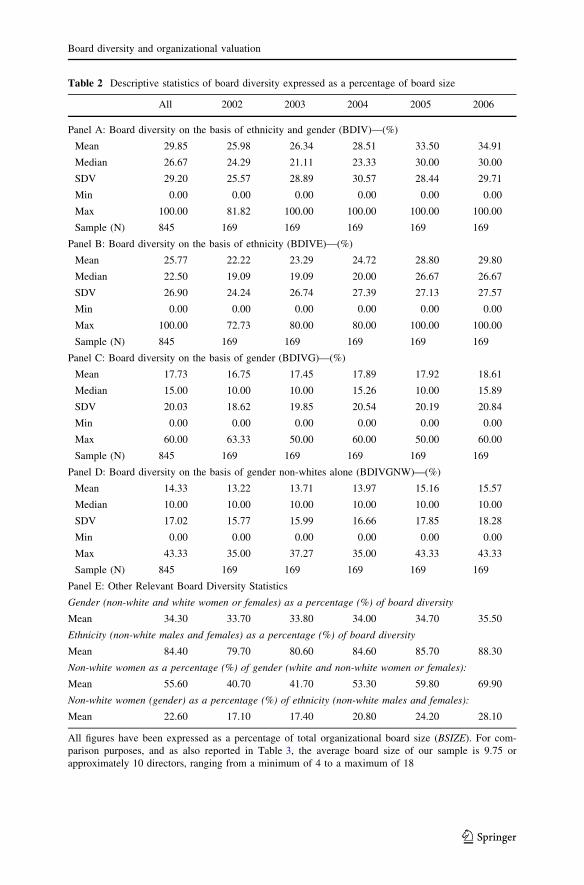
Table 2 Descriptive statistics of board diversity expressed as a percentage of board size
All 2002 2003 2004 2005 2006
Panel A: Board diversity on the basis of ethnicity and gender (BDIV)—(%)
Mean 29.85 25.98 26.34 28.51 33.50 34.91
Median 26.67 24.29 21.11 23.33 30.00 30.00
SDV 29.20 25.57 28.89 30.57 28.44 29.71
Min 0.00 0.00 0.00 0.00 0.00 0.00
Max 100.00 81.82 100.00 100.00 100.00 100.00
Sample (N) 845 169 169 169 169 169
Panel B: Board diversity on the basis of ethnicity (BDIVE)—(%)
Mean 25.77 22.22 23.29 24.72 28.80 29.80
Median 22.50 19.09 19.09 20.00 26.67 26.67
SDV 26.90 24.24 26.74 27.39 27.13 27.57
Min 0.00 0.00 0.00 0.00 0.00 0.00
Max 100.00 72.73 80.00 80.00 100.00 100.00
Sample (N) 845 169 169 169 169 169
Panel C: Board diversity on the basis of gender (BDIVG)—(%)
Mean 17.73 16.75 17.45 17.89 17.92 18.61
Median 15.00 10.00 10.00 15.26 10.00 15.89
SDV 20.03 18.62 19.85 20.54 20.19 20.84
Min 0.00 0.00 0.00 0.00 0.00 0.00
Max 60.00 63.33 50.00 60.00 50.00 60.00
Sample (N) 845 169 169 169 169 169
Panel D: Board diversity on the basis of gender non-whites alone (BDIVGNW)—(%)
Mean 14.33 13.22 13.71 13.97 15.16 15.57
Median 10.00 10.00 10.00 10.00 10.00 10.00
SDV 17.02 15.77 15.99 16.66 17.85 18.28
Min 0.00 0.00 0.00 0.00 0.00 0.00
Max 43.33 35.00 37.27 35.00 43.33 43.33
Sample (N) 845 169 169 169 169 169
Panel E: Other Relevant Board Diversity Statistics
Gender (non-white and white women or females) as a percentage (%) of board diversity
Mean 34.30 33.70 33.80 34.00 34.70 35.50
Ethnicity (non-white males and females) as a percentage (%) of board diversity
Mean 84.40 79.70 80.60 84.60 85.70 88.30
Non-white women as a percentage (%) of gender (white and non-white women or females):
Mean 55.60 40.70 41.70 53.30 59.80 69.90
Non-white women (gender) as a percentage (%) of ethnicity (non-white males and females):
Mean 22.60 17.10 17.40 20.80 24.20 28.10
All figures have been expressed as a percentage of total organizational board size (BSIZE). For com-
parison purposes, and as also reported in Table 3, the average board size of our sample is 9.75 or
approximately 10 directors, ranging from a minimum of 4 to a maximum of 18
Board diversity and organizational valuation
123
of women on SA organizational boards is also consistent with the findings of prior
studies (Carter et al. 2003; Singh and Vinnicombe 2004; Campbell and Minquez-
Vera 2008; Abdullah 2013; Ujunwa 2012; Dale-Olsen et al. 2013; Luckerath-
Rovers 2013). This notwithstanding, however, gender and ethnic diversity within
SA boards are generally increasing. For example, BDIV has increased from 26% in
2002 to 35% in 2006, and similar increases are noticeable in BDIVE, BDIVG and
BDIVGNW, which may be explained by the increasing willingness of the sampled
organizations to comply with the provisions of the 1998 EE and 2003 BEE Acts.
These findings are also consistent with examples of disclosures regarding the
progress made by some SA organizations on complying with the requirements of the
EE and BEE acts that are reported in the ‘‘Appendix’’. For example, AngloGold
Ashanti Group, a large mining company had only 14% (2 out of 14) of its year 2002
board members as non-whites with no (0%) woman. By contrast, a significant 47%
(8 out of 17) of AngloGold Ashanti’s year 2006 board members were non-whites
with 4 (24%) women, representing a substantial 33 percentage point increase over
the 5-year period examined. Similar positive developments and patterns are
observable in the Aspen Pharmacare, Harmony Gold, and Truworths International
Groups (see the ‘‘Appendix’’), as well as across the entire 169 sampled
organizations that were analysed.
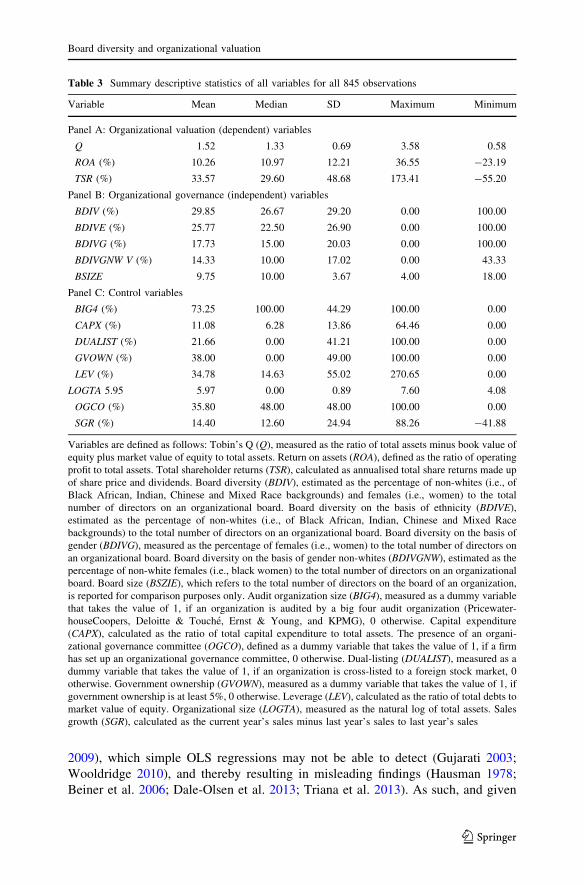
Table 3 reports descriptive statistics relating to the other variables used, although
for purposes of completeness, the summary board diversity measures are also reported.
Generally, all the values show wide variations. For instance, and consistent with the
results of Beiner et al. (2006) and Guest (2009), Q is between a minimum of0.58 and a
maximum of 3.58 with a mean of 1.52, displaying wide spread. The alternative market
valuation proxies (i.e., ROA and TSR), as well as the control variables (i.e., BIG4,
CAPX, DUALIST, GVOWN, LEV, LOGTA, OGCO and SGR) show wide variations,
implying that our sample has been adequately chosen to achieve sufficient variation,
and thus eschews any possibilities of sample selection bias.
We also examined linear regression assumptions of multicollinearity, autocor-
relation, normality, homoscedasticity, and linearity. We investigated the multicol-
linearity assumption by conducting the Spearman non-parametric and Pearson
parametric bivariate correlation tests among the variables. The results, which are not
reported for the sake of brevity, but available upon request, suggested that no
significant non-normality and multicollinearity problems were present among the
variables. In addition, we examined scatter, P–P and Q–Q plots, studentised
residuals, Cook’s distances and Durbin-Watson statistics of the variables, with these
tests indicating no serious violation of the linear regression assumptions of
homoscedasticity, linearity, normality and autocorrelation, and thereby implying
that it is appropriate to carry out multivariate regression analyses.
5.2 Multivariate regression analyses
Organizations tend to differ in the challenges and opportunities that they encounter
over time (Guest 2009; Ntim et al. 2012). This can lead to situation whereby BDIV
and Q are jointly and dynamically determined by organizational-specific differ-
ences, such as organizational culture, complexity and managerial talent (Guest
C. G. Ntim
123
2009), which simple OLS regressions may not be able to detect (Gujarati 2003;
Wooldridge 2010), and thereby resulting in misleading findings (Hausman 1978;
Beiner et al. 2006; Dale-Olsen et al. 2013; Triana et al. 2013). As such, and given
Table 3 Summary descriptive statistics of all variables for all 845 observations
Variable Mean Median SD Maximum Minimum
Panel A: Organizational valuation (dependent) variables
Q 1.52 1.33 0.69 3.58 0.58
ROA (%) 10.26 10.97 12.21 36.55 -23.19
TSR (%) 33.57 29.60 48.68 173.41 -55.20
Panel B: Organizational governance (independent) variables
BDIV (%) 29.85 26.67 29.20 0.00 100.00
BDIVE (%) 25.77 22.50 26.90 0.00 100.00
BDIVG (%) 17.73 15.00 20.03 0.00 100.00
BDIVGNW V (%) 14.33 10.00 17.02 0.00 43.33
BSIZE 9.75 10.00 3.67 4.00 18.00
Panel C: Control variables
BIG4 (%) 73.25 100.00 44.29 100.00 0.00
CAPX (%) 11.08 6.28 13.86 64.46 0.00
DUALIST (%) 21.66 0.00 41.21 100.00 0.00
GVOWN (%) 38.00 0.00 49.00 100.00 0.00
LEV (%) 34.78 14.63 55.02 270.65 0.00
LOGTA 5.95 5.97 0.00 0.89 7.60 4.08
OGCO (%) 35.80 48.00 48.00 100.00 0.00
SGR (%) 14.40 12.60 24.94 88.26 -41.88
Variables are defined as follows: Tobin’s Q (Q), measured as the ratio of total assets minus book value of
equity plus market value of equity to total assets. Return on assets (ROA), defined as the ratio of operating
profit to total assets. Total shareholder returns (TSR), calculated as annualised total share returns made up
of share price and dividends. Board diversity (BDIV), estimated as the percentage of non-whites (i.e., of
Black African, Indian, Chinese and Mixed Race backgrounds) and females (i.e., women) to the total
number of directors on an organizational board. Board diversity on the basis of ethnicity (BDIVE),
estimated as the percentage of non-whites (i.e., of Black African, Indian, Chinese and Mixed Race
backgrounds) to the total number of directors on an organizational board. Board diversity on the basis of
gender (BDIVG), measured as the percentage of females (i.e., women) to the total number of directors on
an organizational board. Board diversity on the basis of gender non-whites (BDIVGNW), estimated as the
percentage of non-white females (i.e., black women) to the total number of directors on an organizational
board. Board size (BSZIE), which refers to the total number of directors on the board of an organization,
is reported for comparison purposes only. Audit organization size (BIG4), measured as a dummy variable
that takes the value of 1, if an organization is audited by a big four audit organization (Pricewater-
houseCoopers, Deloitte & Touche, Ernst & Young, and KPMG), 0 otherwise. Capital expenditure
(CAPX), calculated as the ratio of total capital expenditure to total assets. The presence of an organi-
zational governance committee (OGCO), defined as a dummy variable that takes the value of 1, if a firm
has set up an organizational governance committee, 0 otherwise. Dual-listing (DUALIST), measured as a
dummy variable that takes the value of 1, if an organization is cross-listed to a foreign stock market, 0
otherwise. Government ownership (GVOWN), measured as a dummy variable that takes the value of 1, if
government ownership is at least 5%, 0 otherwise. Leverage (LEV), calculated as the ratio of total debts to
market value of equity. Organizational size (LOGTA), measured as the natural log of total assets. Sales
growth (SGR), calculated as the current year’s sales minus last year’s sales to last year’s sales
Board diversity and organizational valuation
123
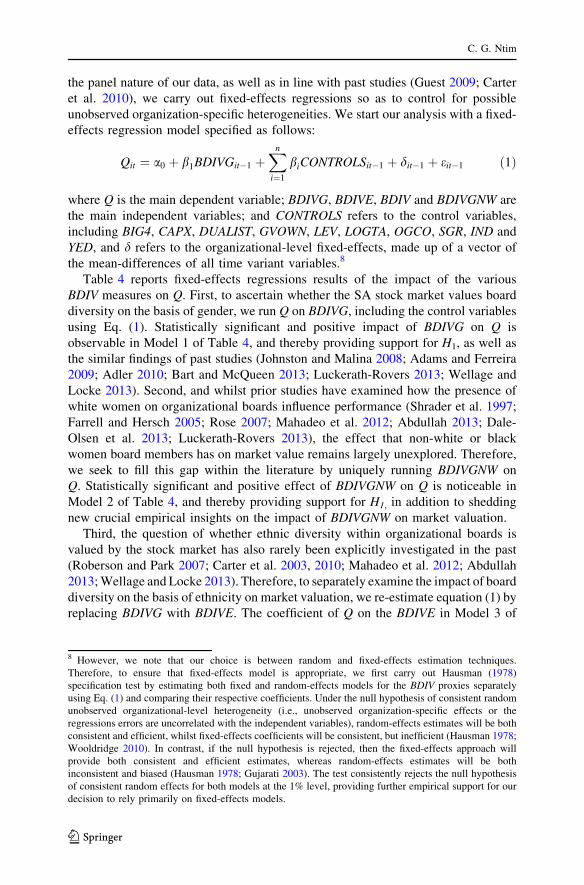
the panel nature of our data, as well as in line with past studies (Guest 2009; Carter
et al. 2010), we carry out fixed-effects regressions so as to control for possible
unobserved organization-specific heterogeneities. We start our analysis with a fixed-
effects regression model specified as follows:
Qit ¼ a0 þ b1BDIVGit�1 þXn
i¼1
biCONTROLSit�1 þ dit�1 þ eit�1 ð1Þ
where Q is the main dependent variable; BDIVG, BDIVE, BDIV and BDIVGNW are
the main independent variables; and CONTROLS refers to the control variables,
including BIG4, CAPX, DUALIST, GVOWN, LEV, LOGTA, OGCO, SGR, IND and
YED, and d refers to the organizational-level fixed-effects, made up of a vector of
the mean-differences of all time variant variables.8
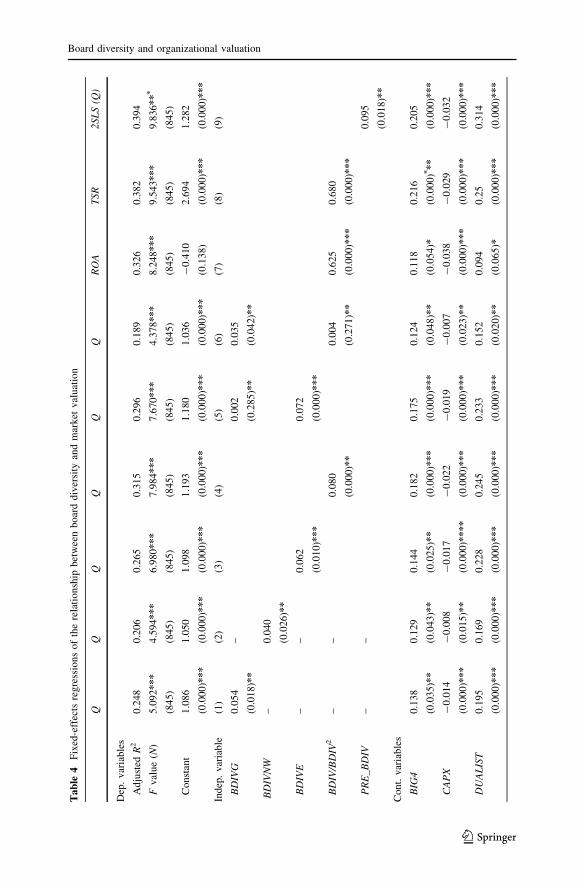
Table 4 reports fixed-effects regressions results of the impact of the various
BDIV measures on Q. First, to ascertain whether the SA stock market values board
diversity on the basis of gender, we run Q on BDIVG, including the control variables
using Eq. (1). Statistically significant and positive impact of BDIVG on Q is
observable in Model 1 of Table 4, and thereby providing support for H1, as well as
the similar findings of past studies (Johnston and Malina 2008; Adams and Ferreira
2009; Adler 2010; Bart and McQueen 2013; Luckerath-Rovers 2013; Wellage and
Locke 2013). Second, and whilst prior studies have examined how the presence of
white women on organizational boards influence performance (Shrader et al. 1997;
Farrell and Hersch 2005; Rose 2007; Mahadeo et al. 2012; Abdullah 2013; Dale-
Olsen et al. 2013; Luckerath-Rovers 2013), the effect that non-white or black
women board members has on market value remains largely unexplored. Therefore,
we seek to fill this gap within the literature by uniquely running BDIVGNW on
Q. Statistically significant and positive effect of BDIVGNW on Q is noticeable in
Model 2 of Table 4, and thereby providing support for H1, in addition to shedding
new crucial empirical insights on the impact of BDIVGNW on market valuation.
Third, the question of whether ethnic diversity within organizational boards is
valued by the stock market has also rarely been explicitly investigated in the past
(Roberson and Park 2007; Carter et al. 2003, 2010; Mahadeo et al. 2012; Abdullah
2013; Wellage and Locke 2013). Therefore, to separately examine the impact of board
diversity on the basis of ethnicity on market valuation, we re-estimate equation (1) by
replacing BDIVG with BDIVE. The coefficient of Q on the BDIVE in Model 3 of
8 However, we note that our choice is between random and fixed-effects estimation techniques.
Therefore, to ensure that fixed-effects model is appropriate, we first carry out Hausman (1978)
specification test by estimating both fixed and random-effects models for the BDIV proxies separately
using Eq. (1) and comparing their respective coefficients. Under the null hypothesis of consistent random
unobserved organizational-level heterogeneity (i.e., unobserved organization-specific effects or the
regressions errors are uncorrelated with the independent variables), random-effects estimates will be both
consistent and efficient, whilst fixed-effects coefficients will be consistent, but inefficient (Hausman 1978;
Wooldridge 2010). In contrast, if the null hypothesis is rejected, then the fixed-effects approach will
provide both consistent and efficient estimates, whereas random-effects estimates will be both
inconsistent and biased (Hausman 1978; Gujarati 2003). The test consistently rejects the null hypothesis
of consistent random effects for both models at the 1% level, providing further empirical support for our
decision to rely primarily on fixed-effects models.
C. G. Ntim
123
Ta
ble
4F
ixed
-eff
ects
regre
ssio
ns
of
the
rela
tionsh
ipbet
wee
nboar
ddiv
ersi
tyan
dm
arket
val
uat
ion
RO
AT
SR
2S
LS
(Q)
Dep
.v
aria
ble
s
Ad
just
edR
20
.24
80
.206
0.2
65
0.3
15
0.2
96
0.1
89
0.3
26
0.3
82
0.3
94
Fv
alu
e(N
)5
.09
2*
**
(84
5)
4.5
94*
**
(84
5)
6.9
80*
**
(84
5)
7.9
84*
**
(84
5)
7.6
70*
**
(84
5)
4.3
78*
**
(84
5)
8.2
48*
**
(84
5)
9.5
43*
**
(84
5)
9.8
36*
**
(84
5)
Co
nst
ant
1.0
86
(0.0
00
)**
*
1.0
50
(0.0
00)*
**
1.0
98
(0.0
00)*
**
1.1
93
(0.0
00)*
**
1.1
80
(0.0
00
)**
*
1.0
36
(0.0
00)*
**
-0
.410
(0.1
38)
2.6
94
(0.0
00
)**
*
1.2
82
(0.0
00)*
**
Ind
ep.
var
iab
le(1
)(2
)(3
)(4
)(5
)(6
)(7
)(8
)(9
)
BD
IVG
0.0
54
(0.0
18
)**
–0
.002
(0.2
85
)**
0.0
35
(0.0
42)*
*
BD
IVN
W–
0.0
40
(0.0
26)*
*
BD
IVE
––
0.0
62
(0.0
10)*
**
0.0
72
(0.0
00
)**
*
BD
IV/B
DIV
2–
–0
.08
0
(0.0
00)*
*
0.0
04
(0.2
71)*
*
0.6
25
(0.0
00)*
**
0.6
80
(0.0
00
)**
*
PR
E_
BD
IV–
–0
.095
(0.0
18)*
*
Con
t.v
aria
ble
s
BIG
40
.13
8
(0.0
35
)**
0.1
29
(0.0
43)*
*
0.1
44
(0.0
25)*
*
0.1
82
(0.0
00)*
**
0.1
75
(0.0
00
)**
*
0.1
24
(0.0
48)*
*
0.1
18
(0.0
54)*
0.2
16
(0.0
00
)**
*
0.2
05
(0.0
00)*
**
CA
PX
-0
.014
(0.0
00
)**
*
-0
.00
8
(0.0
15)*
*
-0
.01
7
(0.0
00)*
**
*
-0
.022
(0.0
00)*
**
-0
.019
(0.0
00
)**
*
-0
.00
7
(0.0
23)*
*
-0
.038
(0.0
00)*
**
-0
.029
(0.0
00
)**
*
-0
.03
2
(0.0
00)*
**
DU
AL
IST
0.1
95
(0.0
00
)**
*
0.1
69
(0.0
00)*
**
0.2
28
(0.0
00)*
**
0.2
45
(0.0
00)*
**
0.2
33
(0.0
00
)**
*
0.1
52
(0.0
20)*
*
0.0
94
(0.0
65)*
0.2
5
(0.0
00
)**
*
0.3
14
(0.0
00)*
**
Board diversity and organizational valuation
123
Ta
ble
4co
nti
nu
ed
RO
AT
SR
2S
LS
(Q)
GV
OW
N0
.11
5
(0.0
68
)*
0.1
18
(0.0
53)*
0.1
26
(0.0
30)*
*
0.2
96
(0.0
00)*
**
0.2
59
(0.0
00
)**
*
0.1
03
(0.0
77)*
0.7
49
(0.0
00)*
**
0.8
62
(0.0
00
)**
*
0.2
92
(0.0
00)*
**
*
LE
V-
0.0
16
(0.0
73
)*
-0
.01
8
(0.0
69)*
-0
.02
(0.0
66)*
-0
.028
(0.0
34)*
**
-0
.023
(0.0
39
)**
-0
.01
2
(0.0
86)*
-0
.428
(0.0
00)*
**
-0
.475
(0.0
00
)**
*
-0
.03
6
(0.0
00)*
**
LO
GT
A-
0.1
39
(0.0
30
)**
-0
.12
9
(0.0
37)*
*
-0
.14
7
(0.0
26)*
**
*
-0
.286
(0.0
00)*
**
*
-0
.273
(0.0
00
)**
**
-0
.12
8
(0.0
44)*
*
-0
.56
(0.0
00)*
**
-0
.614
(0.0
00
)**
**
-0
.31
8
(0.0
00)*
**
*
OG
CO
0.1
86
(0.0
20
)**
0.1
65
(0.0
28)*
*
0.1
94
(0.0
13)*
*
0.2
49
(0.0
00)*
**
0.2
35
(0.0
00
)**
*
0.1
46
(0.0
37)*
*
0.4
54
(0.0
00)*
**
0.4
76
(0.0
00
)**
*
0.2
6
(0.0
00)*
**
SG
R0
.01
9
(0.0
60
)*
0.0
14
(0.0
67)*
0.0
22
(0.0
54)*
0.1
28
(0.0
30)*
**
0.1
4
(0.0
25
)**
0.0
11
(0.0
76)*
0.3
85
(0.0
00)*
**
0.4
02
(0.0
00
)**
*
0.1
35
(0.0
20)*
*
IND
Incl
ud
edIn
clu
ded
Incl
uded
Incl
ud
edIn
clu
ded
Incl
uded
Incl
uded
Incl
ud
edIn
clu
ded
YE
DIn
clu
ded
Incl
ud
edIn
clu
ded
Incl
ud
edIn
clu
ded
Incl
uded
Incl
uded
Incl
ud
edIn
clu
ded
P-v
alu
esar
ein
the
par
enth
esis
.*
**
,*
*an
d*
ind
icat
ep-v
alu
esi
gn
ifica
nce
atth
e1
,5
and
10
%le
vel
,re
spec
tiv
ely
.F
oll
ow
ing
Pet
erse
n(2
00
9),
coef
fici
ents
are
esti
mat
edb
y
usi
ng
the
rob
ust
clu
ster
edst
and
ard
erro
rste
chniq
ue
alo
ng
bo
thin
du
stry
and
yea
rd
imen
sio
ns.
Var
iab
les
are
defi
ned
asfo
llo
ws:
To
bin
’s(Q
),re
turn
on
asse
ts(R
OA
),to
tal
shar
ere
turn
(TS
R),
bo
ard
div
ersi
tyo
nth
eb
asis
of
eth
nic
ity
(BD
IVE
),b
oar
dd
iver
sity
on
the
bas
iso
fg
end
er,
incl
ud
ing
(BD
IVG
)an
dex
clud
ing
(BD
IVG
NW
)w
hit
es,
bo
ard
div
ersi
tyo
nth
eb
asis
of
eth
nic
ity
and
gen
der
(BD
IV)/
squar
ed(B
DIV
2),
pre
dic
ted
BD
IV(P
RE
_B
DIV
)—o
bta
ined
by
reg
ress
ing
BD
IVo
nth
eco
ntr
ol
var
iab
les
and
use
das
an
inst
rum
ent
for
BD
IVin
mo
del
9,
aud
ito
rgan
izat
ion
size
(BIG
4),
cap
ital
exp
end
itu
re(C
AP
X),
du
al-l
isti
ng
(DU
AL
IST
),g
ov
ern
men
to
wn
ersh
ip(G
VO
WN
),le
ver
age
(LE
V),
org
aniz
atio
nal
size
(LO
GT
A),
the
pre
sence
of
anorg
aniz
atio
nal
gover
nan
ceco
mm
itte
e(O
GC
O),
sale
sg
row
th(S
GR
),in
du
stry
du
mm
ies
(IN
D),
and
yea
rd
um
mie
s(Y
ED
).
Tab
le1
full
yd
efin
esal
lth
ev
aria
ble
su
sed
C. G. Ntim
123
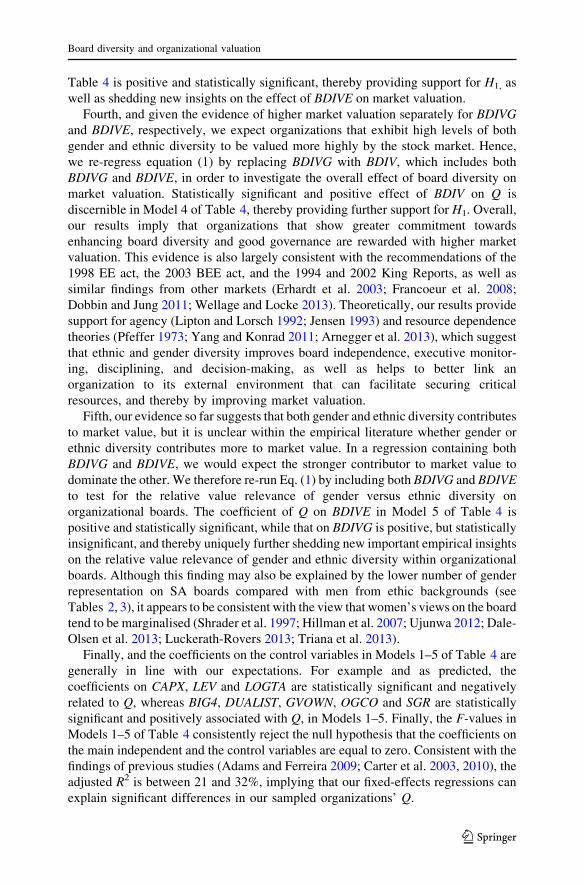
Table 4 is positive and statistically significant, thereby providing support for H1, as
well as shedding new insights on the effect of BDIVE on market valuation.
Fourth, and given the evidence of higher market valuation separately for BDIVG
and BDIVE, respectively, we expect organizations that exhibit high levels of both
gender and ethnic diversity to be valued more highly by the stock market. Hence,
we re-regress equation (1) by replacing BDIVG with BDIV, which includes both
BDIVG and BDIVE, in order to investigate the overall effect of board diversity on
market valuation. Statistically significant and positive effect of BDIV on Q is
discernible in Model 4 of Table 4, thereby providing further support for H1. Overall,
our results imply that organizations that show greater commitment towards
enhancing board diversity and good governance are rewarded with higher market
valuation. This evidence is also largely consistent with the recommendations of the
1998 EE act, the 2003 BEE act, and the 1994 and 2002 King Reports, as well as
similar findings from other markets (Erhardt et al. 2003; Francoeur et al. 2008;
Dobbin and Jung 2011; Wellage and Locke 2013). Theoretically, our results provide
support for agency (Lipton and Lorsch 1992; Jensen 1993) and resource dependence
theories (Pfeffer 1973; Yang and Konrad 2011; Arnegger et al. 2013), which suggest
that ethnic and gender diversity improves board independence, executive monitor-
ing, disciplining, and decision-making, as well as helps to better link an
organization to its external environment that can facilitate securing critical
resources, and thereby by improving market valuation.
Fifth, our evidence so far suggests that both gender and ethnic diversity contributes
to market value, but it is unclear within the empirical literature whether gender or
ethnic diversity contributes more to market value. In a regression containing both
BDIVG and BDIVE, we would expect the stronger contributor to market value to
dominate the other. We therefore re-run Eq. (1) by including both BDIVG and BDIVE
to test for the relative value relevance of gender versus ethnic diversity on
organizational boards. The coefficient of Q on BDIVE in Model 5 of Table 4 is
positive and statistically significant, while that on BDIVG is positive, but statistically
insignificant, and thereby uniquely further shedding new important empirical insights
on the relative value relevance of gender and ethnic diversity within organizational
boards. Although this finding may also be explained by the lower number of gender
representation on SA boards compared with men from ethic backgrounds (see
Tables 2, 3), it appears to be consistent with the view that women’s views on the board
tend to be marginalised (Shrader et al. 1997; Hillman et al. 2007; Ujunwa 2012; Dale-
Olsen et al. 2013; Luckerath-Rovers 2013; Triana et al. 2013).
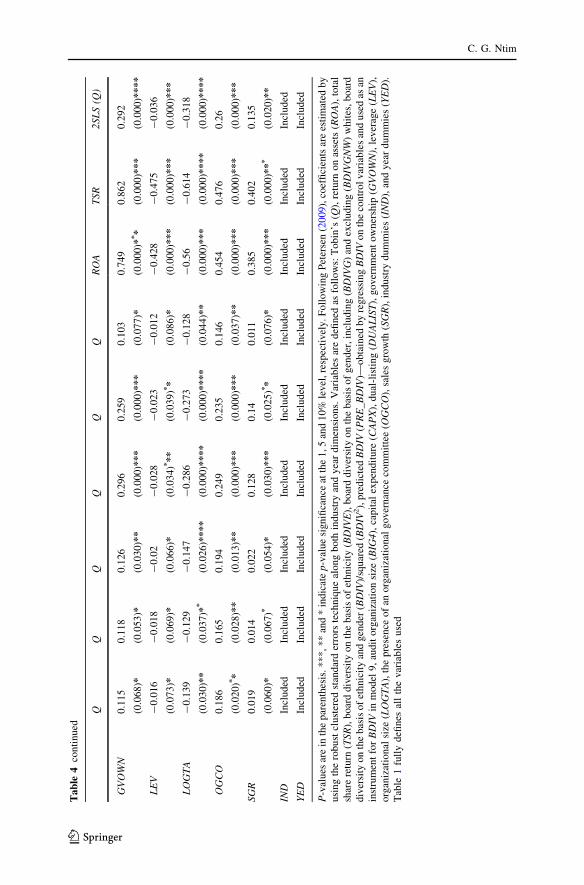
Finally, and the coefficients on the control variables in Models 1–5 of Table 4 are
generally in line with our expectations. For example and as predicted, the
coefficients on CAPX, LEV and LOGTA are statistically significant and negatively
related to Q, whereas BIG4, DUALIST, GVOWN, OGCO and SGR are statistically
significant and positively associated with Q, in Models 1–5. Finally, the F-values in
Models 1–5 of Table 4 consistently reject the null hypothesis that the coefficients on
the main independent and the control variables are equal to zero. Consistent with the
findings of previous studies (Adams and Ferreira 2009; Carter et al. 2003, 2010), the
adjusted R2 is between 21 and 32%, implying that our fixed-effects regressions can
explain significant differences in our sampled organizations’ Q.
Board diversity and organizational valuation
123
5.3 Robustness analyses
Our fixed-effects regressions so far do not take into account the presence of possible
non-monotonic associations and alternative market valuation measures, as well as
other potential endogeneities. This indicates that the evidence of a significant
positive effect of BDIV on Q, for instance, may be misleading. In this subsection, we
investigate how robust our findings are to the existence of potential non-linear
relationships, alternative market valuation proxies, and other endogeneity problems.
First, to examine whether there is a non-monotonic link between board diversity
and market valuation, such that initial increases in ethnic and gender board
representations lead to declines in market valuation up to a point, beyond which
additional increases in diversity improve market valuation, as predicted by Roberson
and Park (2007), we re-estimate equation (1) using squared board diversity (BDIV2) in
addition to BDIV.9 Positive, but statistically insignificant impact of BDIV2 on Q is
discernible in Model 6 of Table 4, and thereby indicating that our evidence of a
positive impact of BDIV on Q is not sensitive to this specification.
Second and as previously noted, we investigate the robustness of our findings to
two alternative market valuation measures: return on assets (ROA—an accounting
based measure) and total share returns (TSR—a market based proxy). Models 7 and
8 of Table 4 report results obtained by making use of ROA and TSR, respectively,
instead of Q. Statistically significant and positive impact of BDIV on ROA and TSR
in models 7 and 8 of Table 4, respectively, is observable, and thereby implying that
our results are fairly robust to the use of either an accounting (ROA) or a market
(TSR) based market valuation measure, instead of Q.
Third, to account for potential additional endogeneity problems that may be
caused by omitted variable bias, we apply the widely used two-stage least squares
(2SLS) technique (Beiner et al. 2006; Carter et al. 2003, 2010). However, to make
sure that the 2SLS research design is appropriate, and in line with Beiner et al.
(2006), we first carry out Durbin-Wu-Hausman exogeneity test (see Beiner et al.
2006, p. 267) to determine whether BDIV is endogenously associated with Q.
Applied to Eq. (1), the test rejects the null hypothesis of exogeneity, and therefore
we conclude that the 2SLS technique may be appropriate and that our earlier results
based on the fixed-effects regressions may be misleading. In the first stage, we
conjecture that BDIV will be determined by all the control (exogenous) variables
specified in equation (1). In the second stage, we utilise the predicted portion of the
BDIV (PRE_BDIV) as an instrument for the BDIV and re-estimate Eq. (1) as
specified below:
Qit ¼ a0 þ b1BDIVit þXn
i¼1
biCONTROLSit þ dit þ eit ð2Þ
9 We carried out similar non-monotonic examination for the BDIVE, BDIVG and BDIVGNW measures
and found statistically insignificant non-linear association between board diversity and market valuation.
We further investigate other forms of non-linear transformations, such as cubing the variables (i.e.,
BDIVE, BDIVG, BDIVGNW and BDIV), but we found statistically insignificant link between board
diversity and market valuation.
C. G. Ntim
123
whereby everything remains unchanged as specified in Eq. (1)10 except that we use
the predicted BDIV (PRE_BDIV) from the first-stage regression as an instrument for
the BDIV. Statistically significant and positive effect of the PRE_BDIV on Q is
noticeably in Model 9 of Table 4, and thereby indicating that our evidence of a
positive effect of BDIV on Q is not sensitive to endogeneity problems that may be
caused by potential omitted variables. Overall, the robustness analyses indicate that
our results are fairly robust to potential endogeneity problems, non-linear associa-
tions, and alternative market valuation proxies.
6 Summary and conclusions
Organizational boards of directors are one of the most important subgroups within
most modern organizations, performing a number of critical roles, such as advising,
monitoring, disciplining, motivating, and compensating managers, as well as
providing access to critical resources, such as contracts and finance. This paper has
attempted to determine whether the South African (SA) stock market values ethnic
and gender diversity within organizational boards using a sample of 169 publicly
listed organizations from 2002 to 2007. This coincides with a period during which the
SA authorities embarked upon regulatory, affirmative action and OG reforms,
noticeably including the 1998 EE Act, 2003 BEE Act, and the 1994 and 2002 King
Reports. These reforms have focused primarily on enhancing ethnic and gender
diversity within organizational boards in order to improve their independence and
monitoring power, and thereby enhancing overall market valuation.
Our results contribute to the literature in a number of ways. First, our summary
descriptive statistics suggest a wide spread in the distribution of board diversity on
the basis of ethnicity and gender, ranging from a minimum of 0% to a maximum of
100%, and averaging approximately at 30%. This implies that despite board
diversity reforms pursued (e.g., BEE, EE and King Reports), the average SA listed
organization’s board remains dominated (70%) by white males. This notwithstand-
ing, however, the evidence also suggests that gender and ethnic diversity within SA
boards are generally increasing. For example, general board diversity has increased
from 26% in 2002 to 35% in 2006, and similar increases are noticeable in ethnicity
and gender, which may be explained by the increasing willingness of the sampled
organizations to comply with the provisions of the 1998 EE and 2003 BEE Acts.
These findings are also in line with examples of disclosures regarding the progress
made by some SA organizations on complying with the requirements of the EE and
BEE acts that are presented in the ‘‘Appendix’’.
Second, we find a statistically significant and positive relationship between board
diversity and market valuation, implying that the SA stock market values ethnic and
gender diversity within organizational boards. Third and distinct from prior studies,
we show further that ethnic diversity is valued more highly by the SA stock market
10 As estimating a lagged structure will jeopardise the validity of the Durbin-Wu-Hausman test (Gujarati
2003; Wooldridge 2010), we estimate Eq. (2)) as un-lagged structure. An additional advantage is that it
allows us to ascertain the robustness of our results against estimating an un-lagged structure.
Board diversity and organizational valuation
123

than gender diversity. This sheds new crucial insights on the relative value
relevance of gender versus ethnic diversity on market valuation. Fourth and by
contrast, we do not find any evidence of a significant non-linear link between board
diversity and market valuation. Our findings are consistent across a raft of
econometric models that take into consideration different types of endogeneity
problems and market valuation measures.
Overall, our results provide support for agency and resource dependence theories,
which suggest that ethnic and gender diversity improves board independence,
executive monitoring and decision-making, as well as helps to better link an
organization to its external environment that can facilitate securing critical resources,
and thereby enhancing market valuation. Resource dependence may be particularly
powerful in explaining our evidence of a positive effect of board diversity on market
value in SA. This is because securing and renewing profitable government contracts
and mining licenses in SA are usually linked to complying with affirmative action
policies, such as those contained in the 1998 EE and 2003 BEE acts (Rossouw et al.
2002; West 2009; Andreasson 2013; Ntim and Soobaroyen 2013a). This means that
by appointing more board members from diverse ethnic and gender backgrounds, SA
organizations may be inherently complying with the EE and BEE acts. As the EE and
BEE acts are backed by the government, this may be a major way by which SA
organizations can win government support and gain access to critical resources, such
as government contracts and contacts, finance, and tax concessions that can facilitate
growth and improve long-term financial performance.
Our evidence also has important implications for governments, policy-makers, and
regulatory authorities. Whereas our evidence of a positive effect of board diversity on
market valuation provides support for the recommendations of the EE and BEE Acts,
as well as those of the King Reports, the relatively low levels of ethnic and gender
diversity within SA organizational boards appear to suggest that there is the need to
strengthen enforcement and compliance with the provisions of the reforms. In this
case, setting up a ‘‘compliance and enforcement committee’’ to regularly check the
levels of compliance among listed organizations may help in improving board
diversity specifically, but OG standards more generally. Our SA findings will also
have particular implications for countries that are currently and/or contemplating
pursuing board diversity reforms. Specifically, our findings will be of specific
interests and added impetus to regulators, policy-makers and governments in
Australia, Brazil, Canada, the European Union, India, Malaysia, Norway, Mozam-
bique, New Zealand, and the USA, amongst others, where different variants of
affirmative action policies are being pursed with the aim of improving racial, ethnic
minority and/or gender representation in top corporate management.
Acknowledgement The author gratefully acknowledges the insightful and timely suggestions by the
Editor-in-Chief, Professor Roberto Di Pietra, and two anonymous reviewers. However, I am solely
responsible for any remaining omissions and commissions.
Appendix
See Table 5.
C. G. Ntim
123
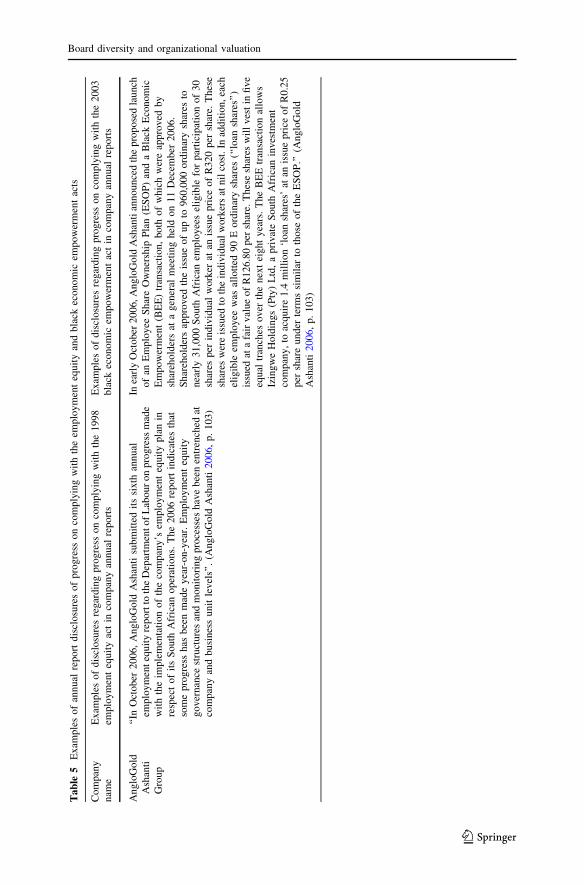
Ta
ble
5E
xam
ple
so
fan
nu
alre
po
rtd
iscl
osu
res
of
pro
gre
sso
nco
mp
lyin
gw
ith
the
emplo
ym
ent
equ
ity
and
bla
ckec
on
om
icem
po
wer
men
tac
ts
Co
mpan
y
nam
e
Exam
ple
sof
dis
closu
res
regar
din
gpro
gre
sson
com
ply
ing
wit
hth
e1998
emplo
ym
ent
equ
ity
act
inco
mp
any
ann
ual
repo
rts
Exam
ple
sof
dis
closu
res
regar
din
gpro
gre
sson
com
ply
ing
wit
hth
e2003
bla
ckec
on
om
icem
po
wer
men
tac
tin
com
pan
yan
nu
alre
po
rts
An
glo
Go
ld
Ash
anti
Gro
up
‘‘In
Oct
ober
20
06,
An
glo
Go
ldA
shan
tisu
bm
itte
dit
ssi
xth
ann
ual
emplo
ym
ent
equ
ity
rep
ort
toth
eD
epar
tmen
to
fL
abo
ur
on
pro
gre
ssm
ade
wit
hth
eim
ple
men
tati
on
of
the
com
pan
y’s
emplo
ym
ent
equ
ity
pla
nin
resp
ect
of
its
So
uth
Afr
ican
op
erat
ion
s.T
he
20
06
rep
ort
ind
icat
esth
at
som
ep
rog
ress
has
bee
nm
ade
yea
r-o
n-y
ear.
Em
plo
ym
ent
equ
ity
go
ver
nan
cest
ruct
ure
san
dm
on
ito
rin
gp
roce
sses
hav
eb
een
entr
ench
edat
com
pan
yan
db
usi
nes
su
nit
lev
els’
’.(A
ng
loG
old
Ash
anti
20
06,
p.
10
3)
Inea
rly
Oct
ober
20
06,
An
glo
Go
ldA
shan
tian
no
un
ced
the
pro
po
sed
lau
nch
of
anE
mp
loy
eeS
har
eO
wn
ersh
ipP
lan
(ES
OP
)an
da
Bla
ckE
con
om
ic
Em
po
wer
men
t(B
EE
)tr
ansa
ctio
n,
bo
tho
fw
hic
hw
ere
app
roved
by
shar
ehold
ers
ata
gen
eral
mee
ting
hel
don
11
Dec
ember
2006.
Shar
ehold
ers
appro
ved
the
issu
eo
fu
pto
960,0
00
ord
inar
ysh
ares
to
nea
rly
31
,00
0S
ou
thA
fric
anem
plo
yee
sel
igib
lefo
rp
arti
cip
atio
no
f3
0
shar
esp
erin
div
idual
wo
rker
atan
issu
ep
rice
of
R3
20
per
shar
e.T
hes
e
shar
esw
ere
issu
edto
the
ind
ivid
ual
wo
rker
sat
nil
cost
.In
add
itio
n,
each
elig
ible
emp
loyee
was
allo
tted
90
Eo
rdin
ary
shar
es(‘
‘lo
ansh
ares
’’)
issu
edat
afa
irv
alu
eo
fR
12
6.8
0p
ersh
are.
Th
ese
shar
esw
ill
ves
tin
fiv
e
equ
altr
anch
eso
ver
the
nex
tei
gh
ty
ears
.T
he
BE
Etr
ansa
ctio
nal
low
s
Izin
gw
eH
old
ings
(Pty
)L
td,
ap
rivat
eS
outh
Afr
ican
inves
tmen
t
com
pan
y,
toac
qu
ire
1.4
mil
lio
n‘l
oan
shar
es’
atan
issu
ep
rice
of
R0
.25
per
shar
eu
nd
erte
rms
sim
ilar
toth
ose
of
the
ES
OP
.’’(A
ng
loG
old
Ash
anti
20
06,
p.
10
3)
Board diversity and organizational valuation
123
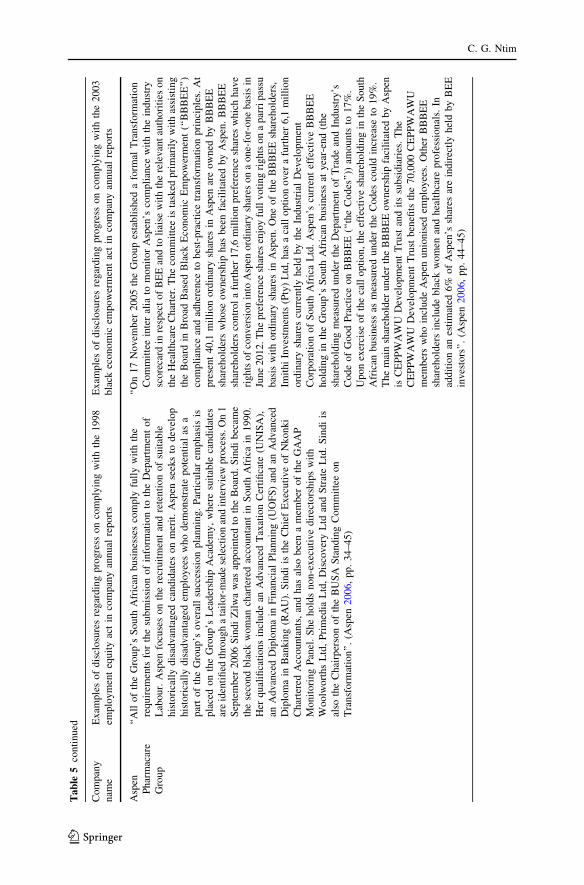
Ta
ble
5co
nti
nu
ed
Co
mpan
y
nam
e
Exam
ple
sof
dis
closu
res
regar
din
gpro
gre
sson
com
ply
ing
wit
hth
e1998
emplo
ym
ent
equ
ity
act
inco
mp
any
ann
ual
repo
rts
Exam
ple
sof
dis
closu
res
regar
din
gpro
gre
sson
com
ply
ing
wit
hth
e2003
bla
ckec
on
om
icem
po
wer
men
tac
tin
com
pan
yan
nu
alre
po
rts
Asp
en
Ph
arm
acar
e
Gro
up
‘‘A
llo
fth
eG
rou
p’s
So
uth
Afr
ican
bu
sin
esse
sco
mp
lyfu
lly
wit
hth
e
requ
irem
ents
for
the
sub
mis
sio
no
fin
form
atio
nto
the
Dep
artm
ent
of
Lab
our.
Asp
enfo
cuse
so
nth
ere
cru
itm
ent
and
rete
nti
on
of
suit
able
his
tori
call
yd
isad
van
tag
edca
nd
idat
eso
nm
erit
.A
spen
seek
sto
dev
elo
p
his
tori
call
yd
isad
van
tag
edem
plo
yee
sw
ho
dem
on
stra
tep
ote
nti
alas
a
par
to
fth
eG
roup’s
over
all
succ
essi
on
pla
nnin
g.
Par
ticu
lar
emphas
isis
pla
ced
on
the
Gro
up
’sL
ead
ersh
ipA
cad
emy
,w
her
esu
itab
leca
nd
idat
es
are
iden
tifi
edth
rough
ata
ilor-
mad
ese
lect
ion
and
inte
rvie
wpro
cess
.O
n1
Sep
tem
ber
2006
Sin
di
Zil
wa
was
appoin
ted
toth
eB
oar
d.
Sin
di
bec
ame
the
seco
nd
bla
ckw
om
anch
arte
red
acco
un
tan
tin
So
uth
Afr
ica
in1
99
0.
Her
qu
alifi
cati
on
sin
clu
de
anA
dv
ance
dT
axat
ion
Cer
tifi
cate
(UN
ISA
),
anA
dv
ance
dD
iplo
ma
inF
inan
cial
Pla
nn
ing
(UO
FS
)an
dan
Ad
van
ced
Dip
lom
ain
Ban
kin
g(R
AU
).S
indi
isth
eC
hie
fE
xec
uti
ve
of
Nkonki
Char
tere
dA
cco
un
tan
ts,
and
has
also
bee
na
mem
ber
of
the
GA
AP
Mo
nit
ori
ng
Pan
el.
Sh
eh
old
sn
on
-exec
uti
ve
dir
ecto
rsh
ips
wit
h
Woolw
ort
hs
Ltd
,P
rim
edia
Ltd
,D
isco
ver
yL
tdan
dS
trat
eL
td.
Sin
di
is
also
the
Ch
airp
erso
no
fth
eB
US
AS
tan
din
gC
om
mit
tee
on
Tra
nsf
orm
atio
n’’
.(A
spen
20
06,
pp
.3
4–
45
)
‘‘O
n17
Novem
ber
2005
the
Gro
up
esta
bli
shed
afo
rmal
Tra
nsf
orm
atio
n
Com
mit
tee
inte
ral
iato
mo
nit
or
Asp
en’s
com
pli
ance
wit
hth
ein
du
stry
sco
reca
rdin
resp
ect
of
BE
Ean
dto
liai
sew
ith
the
rele
van
tau
tho
riti
eso
n
the
Hea
lthca
reC
har
ter.
The
com
mit
tee
ista
sked
pri
mar
ily
wit
has
sist
ing
the
Bo
ard
inB
road
Bas
edB
lack
Eco
nom
icE
mp
ow
erm
ent
(‘‘B
BB
EE
’’)
com
pli
ance
and
adher
ence
tobes
t-pra
ctic
etr
ansf
orm
atio
npri
nci
ple
s.A
t
pre
sen
t4
0,1
mil
lion
ord
inar
ysh
ares
inA
spen
are
ow
ned
by
BB
BE
E
shar
ehold
ers
whose
ow
ner
ship
has
bee
nfa
cili
tate
db
yA
spen
.B
BB
EE
shar
ehold
ers
contr
ol
afu
rther
17,6
mil
lion
pre
fere
nce
shar
esw
hic
hhav
e
rig
hts
of
con
ver
sio
nin
toA
spen
ord
inar
ysh
ares
on
ao
ne-
for-
on
eb
asis
in
June
2012.T
he
pre
fere
nce
shar
esen
joy
full
voti
ng
rights
on
apar
ripas
su
bas
isw
ith
ord
inar
ysh
ares
inA
spen
.O
ne
of
the
BB
BE
Esh
areh
old
ers,
Imit
hi
Inv
estm
ents
(Pty
)L
td,
has
aca
llo
pti
on
ov
era
furt
her
6,1
mil
lio
n
ord
inar
ysh
ares
curr
entl
yh
eld
by
the
Ind
ust
rial
Dev
elop
men
t
Corp
ora
tion
of
South
Afr
ica
Ltd
.A
spen
’scu
rren
tef
fect
ive
BB
BE
E
ho
ldin
gin
the
Gro
up
’sS
outh
Afr
ican
bu
sin
ess
aty
ear-
end
(th
e
shar
eho
ldin
gm
easu
red
un
der
the
Dep
artm
ent
of
Tra
de
and
Ind
ust
ry’s
Cod
eo
fG
oo
dP
ract
ice
on
BB
BE
E(‘
‘th
eC
od
es’’
))am
ou
nts
to1
7%
.
Upon
exer
cise
of
the
call
opti
on,
the
effe
ctiv
esh
areh
old
ing
inth
eS
outh
Afr
ican
bu
sin
ess
asm
easu
red
un
der
the
Cod
esco
uld
incr
ease
to1
9%
.
The
mai
nsh
areh
old
erunder
the
BB
BE
Eow
ner
ship
faci
lita
ted
by
Asp
en
isC
EP
PW
AW
UD
evel
op
men
tT
rust
and
its
sub
sid
iari
es.
Th
e
CE
PP
WA
WU
Dev
elop
men
tT
rust
ben
efits
the
70
,00
0C
EP
PW
AW
U
mem
ber
sw
ho
incl
ud
eA
spen
un
ion
ised
emp
loyee
s.O
ther
BB
BE
E
shar
eho
lder
sin
clu
de
bla
ckw
om
enan
dh
ealt
hca
rep
rofe
ssio
nal
s.In
addit
ion
anes
tim
ated
6%
of
Asp
en’s
shar
esar
ein
dir
ectl
yhel
dby
BE
E
inves
tors
’’.
(Asp
en2
00
6,
pp
.4
4–
45
)
C. G. Ntim
123
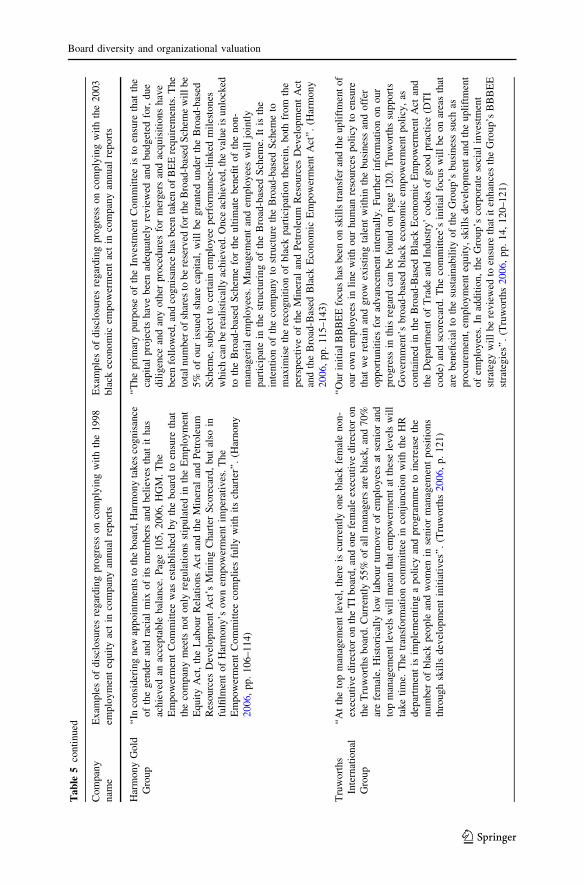
Ta
ble
5co
nti
nu
ed
Co
mpan
y
nam
e
Exam
ple
sof
dis
closu
res
regar
din
gpro
gre
sson
com
ply
ing
wit
hth
e1998
emplo
ym
ent
equ
ity
act
inco
mp
any
ann
ual
repo
rts
Exam
ple
sof
dis
closu
res
regar
din
gpro
gre
sson
com
ply
ing
wit
hth
e2003
bla
ckec
on
om
icem
po
wer
men
tac
tin
com
pan
yan
nu
alre
po
rts
Har
mo
ny
Go
ld
Gro
up
‘‘In
consi
der
ing
new
appoin
tmen
tsto
the
boar
d,H
arm
ony
takes
cognis
ance
of
the
gen
der
and
raci
alm
ixo
fit
sm
emb
ers
and
bel
iev
esth
atit
has
achie
ved
anac
cepta
ble
bal
ance
.P
age
105,
2006,
HG
M.
The
Em
pow
erm
ent
Com
mit
tee
was
esta
bli
shed
by
the
boar
dto
ensu
reth
at
the
com
pan
ym
eets
no
to
nly
regu
lati
on
sst
ipu
late
din
the
Em
plo
ym
ent
Eq
uit
yA
ct,
the
Lab
our
Rel
atio
ns
Act
and
the
Min
eral
and
Pet
role
um
Res
ou
rces
Dev
elop
men
tA
ct’s
Min
ing
Char
ter
Sco
reca
rd,
bu
tal
soin
fulfi
lmen
tof
Har
mony’s
ow
nem
pow
erm
ent
imper
ativ
es.
The
Em
pow
erm
ent
Com
mit
tee
com
pli
esfu
lly
wit
hit
sch
arte
r’’.
(Har
nony
20
06,
pp
.1
06
–1
14
)
‘‘T
he
pri
mar
yp
urp
ose
of
the
Inv
estm
ent
Co
mm
itte
eis
toen
sure
that
the
cap
ital
pro
ject
sh
ave
bee
nad
equ
atel
yre
vie
wed
and
bu
dg
eted
for,
du
e
dil
igen
cean
dan
yo
ther
pro
ced
ure
sfo
rm
erg
ers
and
acq
uis
itio
ns
hav
e
bee
nfo
llo
wed
,an
dco
gn
isan
ceh
asb
een
tak
eno
fB
EE
requ
irem
ents
.T
he
tota
ln
um
ber
of
shar
esto
be
rese
rved
for
the
Bro
ad-b
ased
Sch
eme
wil
lb
e
5%
of
ou
ris
sued
shar
eca
pit
al,
wil
lb
eg
ran
ted
un
der
the
Bro
ad-b
ased
Sch
eme,
subje
ctto
cert
ain
emplo
yee
per
form
ance
-lin
ked
mil
esto
nes
whic
hca
nbe
real
isti
call
yac
hie
ved
.O
nce
achie
ved
,th
eval
ue
isunlo
cked
toth
eB
road
-bas
edS
chem
efo
rth
eult
imat
eben
efit
of
the
non-
man
ager
ial
emp
loyee
s.M
anag
emen
tan
dem
plo
yee
sw
ill
join
tly
par
tici
pat
ein
the
stru
ctu
rin
go
fth
eB
road
-bas
edS
chem
e.It
isth
e
inte
nti
on
of
the
com
pan
yto
stru
ctu
reth
eB
road
-bas
edS
chem
eto
max
imis
eth
ere
cog
nit
ion
of
bla
ckp
arti
cip
atio
nth
erei
n,
bo
thfr
om
the
per
spec
tiv
eo
fth
eM
iner
alan
dP
etro
leu
mR
esou
rces
Dev
elop
men
tA
ct
and
the
Bro
ad-B
ased
Bla
ckE
con
om
icE
mp
ow
erm
ent
Act
’’.
(Har
mo
ny
20
06,
pp
.1
15
–1
43)
Tru
wo
rth
s
Inte
rnat
ion
al
Gro
up
‘‘A
tth
eto
pm
anag
emen
tle
vel
,th
ere
iscu
rren
tly
on
eb
lack
fem
ale
no
n-
exec
uti
ve
dir
ecto
ro
nth
eT
Ib
oar
d,
and
on
efe
mal
eex
ecu
tiv
ed
irec
tor
on
the
Tru
wo
rth
sb
oar
d.
Curr
entl
y5
5%
of
all
man
ager
sar
eb
lack
,an
d7
0%
are
fem
ale.
His
tori
call
ylo
wla
bou
rtu
rnov
ero
fem
plo
yee
sat
sen
ior
and
top
man
agem
ent
lev
els
wil
lm
ean
that
emp
ow
erm
ent
atth
ese
lev
els
wil
l
tak
eti
me.
Th
etr
ansf
orm
atio
nco
mm
itte
ein
con
jun
ctio
nw
ith
the
HR
dep
artm
ent
isim
ple
men
tin
ga
po
licy
and
pro
gra
mm
eto
incr
ease
the
num
ber
of
bla
ckpeo
ple
and
wom
enin
senio
rm
anag
emen
tposi
tions
thro
ug
hsk
ills
dev
elo
pm
ent
init
iati
ves
’’.
(Tru
wo
rth
s2
00
6,
p.
12
1)
‘‘O
ur
init
ial
BB
BE
Efo
cus
has
bee
no
nsk
ills
tran
sfer
and
the
up
lift
men
to
f
ou
ro
wn
emp
loyee
sin
lin
ew
ith
ou
rh
um
anre
sou
rces
po
licy
toen
sure
that
we
reta
inan
dg
row
exis
tin
gta
len
tw
ith
inth
eb
usi
nes
san
do
ffer
op
port
un
itie
sfo
rad
van
cem
ent
inte
rnal
ly.
Fu
rth
erin
form
atio
no
no
ur
pro
gre
ssin
this
reg
ard
can
be
fou
nd
on
pag
e1
20
.T
ruw
ort
hs
sup
po
rts
Go
ver
nm
ent’
sb
road
-bas
edb
lack
eco
no
mic
emp
ow
erm
ent
po
licy
,as
con
tain
edin
the
Bro
ad-B
ased
Bla
ckE
con
om
icE
mp
ow
erm
ent
Act
and
the
Dep
artm
ent
of
Tra
de
and
Ind
ust
ry’
cod
eso
fg
oo
dp
ract
ice
(DT
I
cod
e)an
dsc
ore
card
.T
he
com
mit
tee’
sin
itia
lfo
cus
wil
lb
eo
nar
eas
that
are
ben
efici
alto
the
sust
ain
abil
ity
of
the
Gro
up
’sb
usi
nes
ssu
chas
pro
cure
men
t,em
plo
ym
ent
equ
ity
,sk
ills
dev
elo
pm
ent
and
the
up
lift
men
t
of
emplo
yee
s.In
add
itio
n,
the
Gro
up
’sco
rpo
rate
soci
alin
ves
tmen
t
stra
teg
yw
ill
be
rev
iew
edto
ensu
reth
atit
enh
ance
sth
eG
rou
p’s
BB
BE
E
stra
teg
ies’
’.(T
ruw
ort
hs
20
06,
pp
.1
4,
12
0–1
21
)
Board diversity and organizational valuation
123

References
Abdullah, S. N. (2013). Causes of gender diversity in Malaysian firms. Journal of Management and
Governance. (Forthcoming).
Adams, R. B., & Ferreira, D. (2009). Women in the boardroom and their impact on governance and
performance. Journal of Financial Economics, 94, 291–309.
Adler, R. D. (2010). Women in the executive suite correlate to high profits. Glass Ceiling Research.
Available at: http://www.women2top.net/download/home/adler_web.pdf. Accessed 30 December
2011.
Amankwah-Amoah, J., & Debrah, Y. A. (2010). The protracted collapse of Ghana Airways: Lessons in
organizational failure. Group and Organizational Management, 35, 635–665.
Andreasson, S. (2013). Understanding corporate governance reforms in South Africa: Anglo American
divergence, the King reports and hybridization. Business & Society. (Forthcoming).
Ashant, A. G. (2006). Annual report. Johannesburg: AngloGold Ashanti Group Ltd.
Armstrong, P., Segal, N., & Davis, B. (2006). Corporate governance in South Africa’. In C. A. Mallin
(Ed.), Handbook on international corporate governance. Cheltenham: Edward Elgar Publishing.
Arnegger, M., Hofmann, C., Pull, K., & Vetter, K. (2013). Firm size and board diversity. Journal of
Management and Governance. (Forthcoming).
Aspen Pharmacare Holdings. (2006). Annual report. Johannesburg: Aspen Pharmacare Holdings Group
Ltd.
Baranchuk, N., & Dybvig, P. (2009). Consensus in diverse corporate boards. Review of Financial Studies,
22, 715–747.
Barr, G., Gerson, J., & Kanto, B. (1995). Shareholders as agents and principals: The case for South
Africa’s corporate governance system. Journal of Applied Corporate Finance, 8, 18–31.
Bart, C., & McQueen, G. (2013). Why women make better directors? International Journal of Business
Governance and Ethics, 8, 93–99.
Baysinger, B., & Hoskisson, R. E. (1990). The composition of boards of directors and strategic control:
Effects on corporate strategy. Academy of Management Review, 15, 72–87.
Baysinger, B. D., & Butler, H. N. (1985). Corporate governance and the board of directors: Performance
effects of changes in board composition. Journal of Law, Economics and Organization, 1, 101–124.
Beiner, S., Drobetz, W., Markus, M., & Zimmermann, H. (2006). An integrated framework of corporate
governance and firm valuation. European Financial Management, 12, 249–283.
Bilimoria, D., & Piderit, S. K. (1994). Qualifications of corporate board committee members. Group and
Organization Management, 19, 334–362.
Brammer, S., Millington, A., & Pavelin, S. (2007). Gender and ethnic diversity among UK corporate
boards. Corporate Governance: An International Review, 15, 393–403.
Burges, Z., & Tharenou, P. (2002). Women board of directors: Characteristics of the few. Journal of
Business Ethics, 37, 39–49.
Campbell, K., & Minquez-Vera, A. (2008). Gender diversity in the boardroom and firm financial
performance. Journal of Business Ethics, 83, 435–451.
Carter, D. A., D’souza, F., Simkins, B. J., & Simpson, W. G. (2010). The diversity of corporate board
committees and firm financial performance. Corporate Governance: An International Review, 18,
396–414.
Carter, D. A., Simkins, B. J., & Simpson, W. G. (2003). Corporate governance, board diversity, and firm
value. Financial Review, 38, 33–53.
Catalyst. (2007). The bottom line: corporate performance and women’s representation on boards. New
York, US: Catalyst.
Dale-Olsen, H., Schone, P., & Verner, M. (2013). Diversity among Norwegian boards of directors: Does a
quota for women improve performance. Feminist Economics. (Forthcoming).
Dobbin, F., & Jung, J. (2011). Corporate board gender diversity and stock performance: The competence
gap or institutional investor bias? North Carolina Law Review, 89, 809–838.
Du Plessis, J. A. (2008). Ethical failure under the agency logic: Grounding governance reform in a logic
of value. Group and Organization, 33, 781–804.
Dwyer, S., Richard, O. C., & Chadwick, K. (2003). Gender diversity in management and firm financial
performance. Journal Business Research, 56, 1009–1019.
El Mehdi, I. K. (2007). Empirical evidence on corporate governance and corporate performance in
Tunisia. Corporate Governance: An International Review, 15, 1429–1441.
C. G. Ntim
123

Erhardt, N. L., Werbel, J. D., & Shrader, C. B. (2003). Board of director diversity and firm financial
performance. Corporate Governance: An International Review, 11, 102–111.
Farrell, K. A., & Hersch, P. L. (2005). Additions to corporate boards: The effect of gender. Journal of
Corporate Finance, 11, 85–106.
Francoeur, C., Labelle, R., & Sinclair-Desgagne, B. (2008). Gender diversity in corporate governance and
top management. Journal of Business Ethics, 81, 83–95.
Gilbert, J. A., & Stead, B. A. (1999). Stigmatization revisited: Does diversity management make a
difference in applicant success? Group and Organization Management, 24, 239–256.
Goodstein, J., Gautum, M. E., & Boeker, W. (1994). The effect of board size and diversity on strategic
change. Strategic Management Journal, 15, 241–250.
Guest, P. M. (2009). The impact of board size on firm performance: evidence from the UK. European
Journal of Finance, 15, 385–404.
Gujarati, D. N. (2003). Basic econometrics. New York, USA: McGraw-Hill.
Hausman, J. A. (1978). Specification tests in econometrics. Econometrica, 46, 1251–1271.
Hillman, A. J., Shropshire, C., & Cannella, A. A. (2007). Organizational predictors of women of
corporate boards. Academy of Management Journal, 50, 941–952.
Ho, C.-A., & Williams, S. M. (2003). International comparative analysis of the association between board
structure and the efficiency of value added by a firm from its physical capital and intellectual capital
resources. International Journal of Accounting, 38, 465–491.
Gold, Harmony. (2006). Annual report. Johannesburg: Harmony Gold Group Ltd.
Jensen, M. C. (1993). The modern industrial revolution, exit, and the failure of internal control systems.
Journal of Finance, 48, 831–880.
Johnston, D., & Malina, M. A. (2008). Managing sexual orientation diversity: The impact on firm value.
Group and Organisation Management, 33, 602–625.
Kang, H., Cheng, M., & Gray, S. J. (2007). Corporate governance and board composition: Diversity and
independence of Australian boards. Corporate Governance: An International Review, 15, 194–207.
Kesner, I. F. (1988). Directors’ characteristics and committee membership: An investigation of type,
occupation, tenure, and gender. Academy of Management Journal, 31, 66–84.
King Committee. (1994). King reports on corporate governance for South Africa. Johannesburg, South
Africa: Institute of Directors.
King Committee. (2002). King reports on corporate governance for South Africa. Johannesburg, South
Africa: Institute of Directors.
Krishman, H. A., & Park, D. (2005). A few good women: On top management teams. Journal of Business
Research, 58, 1712–1720.
Kyereboah-Coleman, A., & Biekpe, N. (2006). The relationship between board size, board composition,
CEO duality and firm performance: Experience from Ghana. Corporate Ownership and Control, 4,
114–122.
Kyereboah-Coleman, A., Adjasi, C., & Abor, J. (2006). Corporate governance and performance of
Ghanaian listed firms. Corporate Ownership and Control, 4, 123–132.
Lincoln, A., & Adedoyin, O. (2012). Corporate governance and gender diversity in Nigerian boardrooms.
World Academy of Science, Engineering and Technology, 71, 1853–1859.
Lipton, M., & Lorsch, J. (1992). A modest proposal for improved corporate governance. Business Lawyer,
48, 59–77.
Luckerath-Rovers, M. (2013). Women on boards and firm performance. Journal of Management and
Governance, 17, 491–508.
Mahadeo, J. D., Soobaroyen, T., & Oogarah-Hanuman, V. (2012). Board composition and financial
performance: Uncovering the effects of board diversity in an emerging market. Journal of Business
Ethics, 105, 375–388.
Mangena, M., & Chamisa, E. (2008). Corporate governance and incidences of listings suspension by the
JSE Securities Exchange of South Africa: an empirical analysis. International Journal of
Accounting, 43, 28–44.
Ntim, C. G. (2011). The King Reports, independent non-executive directors and firm valuation on the
Johannesburg Stock Exchange. Corporate Ownership and Control, 9, 428–440.
Ntim, C. G. (2012). Director shareownership and corporate performance in South Africa. African Journal
of Accounting, Auditing and Finance, 1, 359–373.
Ntim, C.G. (2013). Corporate ownership and market valuation in South Africa: Uncovering the effects of
shareholdings by different groups of corporate insiders and outsiders. International Journal of
Business Governance and Ethics. (Forthcoming).
Board diversity and organizational valuation
123
Ntim, C. G., & Osei, K. A. (2011). The impact of corporate board meetings on corporate performance in
South Africa. African Review of Economics and Finance, 2, 83–103.
Ntim, C. G., & Soobaroyen, T. (2013a). Black economic empowerment disclosures by South African
listed corporations: The influence of ownership and board characteristics. Journal of Business
Ethics, 116, 121–138.
Ntim, C. G., & Soobaroyen, T. (2013b). Corporate governance and performance in socially responsible
corporations: New empirical insights from a neo-institutional framework. Corporate Governance:
An International Review, 21, 468–494.
Ntim, C. G., Opong, K. K., & Danbolt, J. (2012). The value relevance of shareholder versus stakeholder
corporate governance disclosure policy reforms in South Africa. Corporate Governance: An
International Review, 20, 84–105.
Petersen, M. A. (2009). Estimating standard errors in finance panel data sets: Comparing approaches.
Review of Financial Studies, 22, 435–480.
Pfeffer, J. (1973). Size, composition, and function of hospital boards of directors: A study of
organization-environmental linkage. Administrative Science Quarterly, 18, 349–364.
Roberson, Q. M., & Park, H. J. (2007). Examining the link between diversity and firm performance: The
effects of diversity reputation and leader racial diversity. Group and Organization Management, 32,
548–568.
Rose, C. (2007). Does female board representation influence firm performance? The Danish evidence.
Corporate Governance: An International Review, 15, 404–413.
Rossouw, G. J., Watt, A. V., & Malan, D. P. (2002). Corporate governance in South Africa. Journal of
Business Ethics, 37, 289–302.
Ryan, M. K., & Haslam, S. A. (2007). The glass cliff: Exploring the dynamics surrounding women’s
appointment to precarious leadership positions. Academy of Management Review, 32, 549–572.
Sanda, A., Mikailu, A. S., & Garba, T. (2010). Corporate governance mechanisms and firm financial
performance in Nigeria. Afro-Asian Journal of Finance and Accounting, 2, 22–39.
Shrader, C., Blackburn, V., & Iles, P. (1997). Women in management and firm financial performance: An
exploratory study. Journal of Managerial Issues, 9, 355–372.
Singh, V., & Vinnicombe, S. (2004). Why so few women directors in top UK boardrooms? Evidence and
theoretical explanations. Corporate Governance: An International Review, 12, 479–488.
Singh, V. (2007). Ethnic diversity on top corporate board: A resource dependency perspective.
International Journal of Human Resource Management, 18, 2128–2146.
Sonnenfeld, J. A. (2002). What makes great boards. Harvard Business Review, 80, 106–113.
Sunday, K. O. (2008). Corporate governance and firm performance: The case of Nigerian listed firms.
European Journal of Economics, Finance and Administrative Sciences, 14, 16–28.
Swartz, N.-P., & Firer, S. (2005). Board structure and intellectual capital performance in South Africa.
Meditari Accountancy Research, 13, 145–166.
Triana, M. C., Miller, T. L., & Trezebiatowski, T. M. (2013). The double-edged nature of board gender
diversity: Diversity, firm performance, and the power of women directors as predictors of strategic
change. Organization Science. (Forthcoming).
Truworths International. (2006). Annual report. Johannesburg: Truworths International Group Ltd.
Ujunwa, A. (2012). Board characteristics and the financial performance of Nigerian quoted firms.
Corporate Governance, 12, 656–674.
Ujunwa, A., Okoyenzu, C., & Nwakoby, I. (2012). Corporate board diversity and firm performance:
Evidence from Nigeria. Review of International Comparative Management, 13, 605–620.
Van Der Walt, N., & Ingley, C. (2003). Board dynamics and the influence of professional background,
gender and ethnic diversity of directors. Corporate Governance: An International Review, 11,
218–234.
Watson, W. E., Kumar, K., & Michaelsen, L. K. (1993). Cultural diversity’s impact on interaction process
and performance: Comparing homogeneous and diverse task groups. Academy of Management
Journal, 36, 590–602.
Welbourne, T. M., Cycyota, C. S., & Ferrante, C. J. (2007). Wall Street reaction to women in IPOs: An
examination of gender diversity in top management teams. Group and Organization Management,
32, 524–547.
Wellage, N. H., & Locke, S. (2013). Corporate governance, board diversity and firm financial
performance: New evidence from Sri Lanka. International Journal of Business Governance and
Ethics, 8, 116–136.
C. G. Ntim
123
West, A. (2009). The ethics of corporate governance: A South African perspective. International Journal
of Law and Management, 51, 10–16.
Westphal, J. D., & Bednar, M. K. (2005). Pluralistic ignorance in corporate boards and firms’ strategic
persistence in response to low firm performance. Administrative Science Quarterly, 50, 262–298.
Wiersema, M. F., & Bantel, K. (1992). Top management demography and corporate strategic change.
Academy of Management Journal, 35, 91–121.
Wooldridge, J. M. (2010). Econometric analysis of cross section and panel data. Cambridge, MA: MIT
Press.
Yang, Y., & Konrad, A. M. (2011). Understanding diversity management practices: Implications of
institutional theory and resource-based theory. Group and Organization Management, 36, 6–38.
Yermack, D. (1996). Higher market valuation of companies with a small board of directors. Journal of
Financial Economics, 40, 185–211.
Zahra, S. A., & Stanton, W. W. (1988). The implication of board of directors’ composition for corporate
strategy and value. International Journal of Management, 5, 229–236.
Author Biography
Collins G. Ntim is currently a Senior Lecturer in accounting at the School of Management, University of
Southampton, and will join the University of Huddersfield Business School as a Professor of Accounting
and Finance in 2014. He was previously a Lecturer and Senior Lecturer at Aberystwyth University and
University of Glasgow, respectively. He holds a PhD in accountancy from the University of Glasgow. His
research focuses on three main themes: accounting and corporate governance; accountability and ethics;
and corporate finance and market-based research. He has published widely in internationally recognised
journals, including the Accounting Forum, Corporate Governance: An International Review, Interna-
tional Review of Financial Analysis, and the Journal of Business Ethics, amongst others.
Board diversity and organizational valuation
123