Journal of AOAC International 1981 Volume.64 No.6
262
ISSN 00Ü4-5756 ASSOCIATION OF OFFICIAL ANALYTICAL CHEMISTS T W Í _ I ^ JANCA2 64(6) 1275-1515 (1981)
-
Upload
khangminh22 -
Category
Documents
-
view
1 -
download
0
Transcript of Journal of AOAC International 1981 Volume.64 No.6
ISSN 0 0 Ü 4 -5 7 5 6
ASSOCIATION OFOFFICIAL
ANALYTICALCHEMISTS
T W Í _ I ^
JA NCA 2 6 4 (6 ) 1 2 7 5 - 1 5 1 5 (1 9 8 1 )

HIGH PURITY WATER
FOR HPLCSpecially purified to B&J's high standards:
4 for reverse phase gradient separations4 for those applications that require purity
greater than conventional lab water suppliesNegligible UV absorbance and extremely low organic carbon and particulates make it the best choice for your critical requirements.Call us today for a copy of the new high purity
water data sheet. (616) 726-3171£ W. <s0 .O ) *. A />0 A f • * ^ A* • *> • 4 4 9
* * <• r-. CP ' 4 ? fl * a
BURDICK $ JACKSON LABORATORIES, INC.1953 SOUTH HARVB'ÌSTRSÈÙ MUSKEQoC MICHIGAN,49442
» w* « • ■» « f. / r * * ^ - r * ? „g J J * ^

Our new multi-media, patented' fiber optic scanner is designed to detect the optical properties of a wide variety of media. Applications are virtually unlimited.
Scannable media includes autoradiograms, TLC plates, paper, glass, textiles, metals, gels, powders, films and others. Qualitative internal and external strain analysis scans are also possible using dual polarizing filters.
A wide range of operating modes, scan head configurations and spectral parameters provide a unique combination of sensitivity and flexibility. Spectrally & thermally stabilized detectors and electronics provide an overall reproducibility of ± 1% or better.
We could go on about our patented optics, compact size, ease of operation, low power consumption, and more —and we do in our scanner brochure with detailed specifications. 'Pat. n o . 3,562,539 - 3.924,946
Q casjiNmY o u C a n ’t B u y B e t t e r L a b o r a t o r y P r o d u c t s .
Vineland, NJ 08360 (609) 692-8500
Exclusive D istributors: K O N T E S O F I L L I N O I S , Evanston, Illinois
K O N T E S O F C A L I F O R N I A , San Leandro, California
• u ivm ifn iW ’JinT!
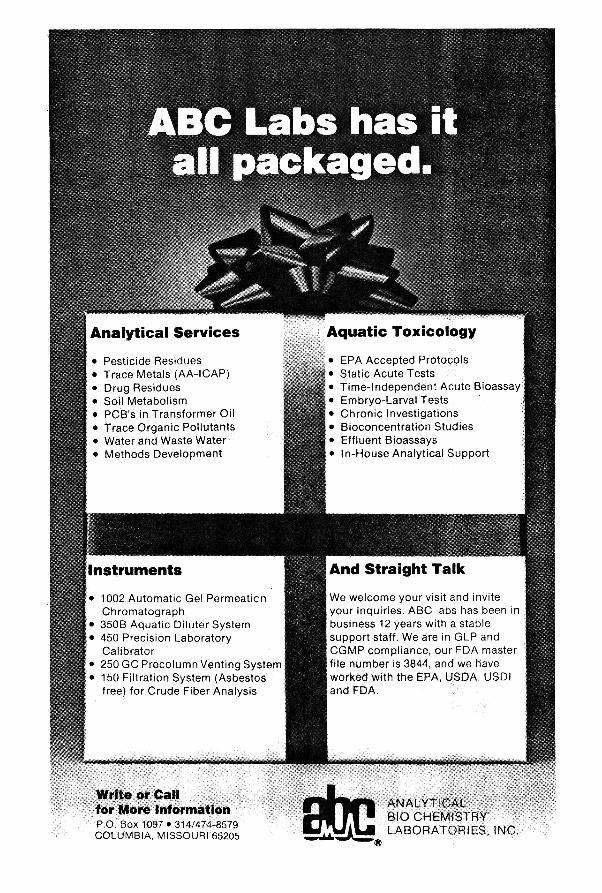
And Straight TalkInstrumentsWe welcome your visit and invite your inquiries. ABC abs has been in business 12 years with a stable support staff. We are in GLP and CGMP compliance, our FDA master file number is 3844, and we have worked with the EPA, USDA, USDI and FDA.
• 1002 Automatic Gel Permeation Chromatograph
• 350B Aquatic Diluter System• 450 Precision Laboratory
Calibrator• 250 GC Precolumn Venting System• 150 Filtration System (Asbestos
free) for Crude Fiber Analysis
Write or Callfor More Information A N A LYT IC A L
BIO C H EM ISTR Y LA B O R A T O R IES , INC
Analytical Services Aquatic Toxicology• Pesticide Residues • EPA Accepted Protocols• Trace Metals (AA-ICAP) • Static Acute Tests• Drug Residues tv • Time-Independent Acute Bioassay• Soil Metabolism j1 III ■ ' • Embryo-Larval Tests• PCB's in Transformer Oil • Chronic Investigations• Trace Organic Pollutants j • Bioconcentration Studies• Water and Waste Water • Effluent Bioassays• Methods Development I
H• In-House Analytical Support
_____________________________■
P.O. Box 1097 • 314/474-8579 COLUMBIA, MISSOURI 65205
l u F U f Í e D S O L V E N T S
S h M B T S S
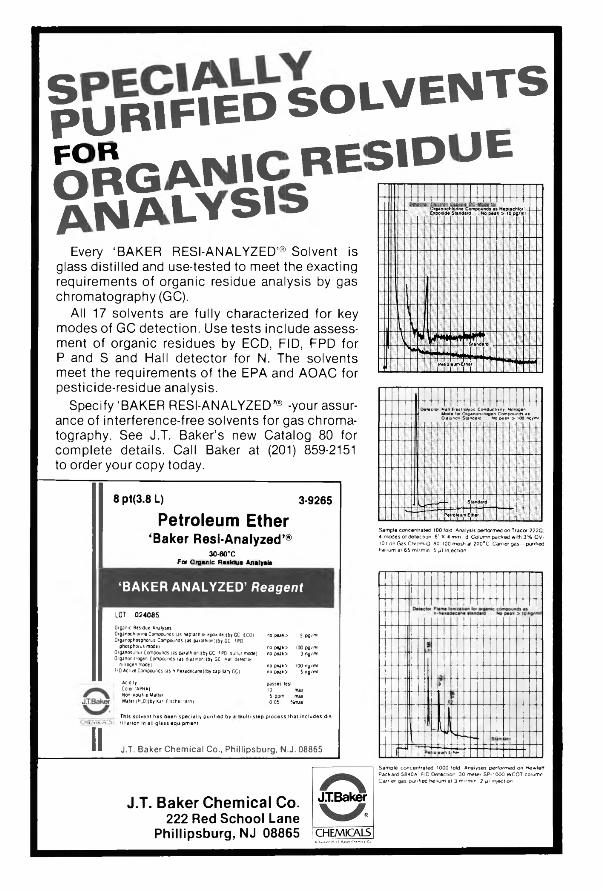
Every ‘BAKER RESI-ANALYZED’® Solvent is glass distilled and use-tested to meet the exacting requirements of organic residue analysis by gas chromatography (GC).
All 17 solvents are fully characterized for key modes of GC detection. Use tests include assessment of organic residues by ECD, FID, FPD for P and S and Hall detector for N. The solvents meet the requirements of the EPA and AOAC for pesticide-residue analysis.
Specify‘BAKER RESI-ANALYZED’® -your assurance of interference-free solvents for gas chromatography. See J.T. Baker’s new Catalog 80 for complete details. Call Baker at (201) 859-2151 to order your copy today.
8 pt(3.8 L)Petroleum Ether‘Baker Resi-Analyzed’®
3-9265
3 0 -8 0 °CFor Organic Residua Analysis
‘B A K ER A N A LY Z ED ’ Reagent
LOT 0 2 4 0 8 5
Organic Residue AnalysesOrganochlorme Compounds (as haptachlor epoxide)(by GC. ECO) no peak> 5 pg/miOrganophosphorus Compounds (as paralhion)(by GC. FPD.
phosphorus mode) no peak> 100 pg/miOrganosultur Compounds (as parathion)(by GC. FP0. sulfur mode) no peak> 3 ng/mlOrganomtrogen Compounds (as dia*mon)(by GC. Hall detector.
nitrogen mode) no peak> 100 ng/mlFIO Active Compounds (as n-hexadecane)(by capillary GC) no peak> 5 ng/ml
Acidity passes lestColor (APHA) 10 maxNon-Volatile Matter 5 ppm max
! Water (H,0)(by Karl Fischer tilrn) o ,05 '/«max
lCjvuwM
IIThis solvent has been specially purilied by a filiation In all-glass equipment.
iu lti-step process that includes dis-
J.T. Baker Chemical Co., Phillipsburg, N.J. 08865
J.T. B aker C hem ical Co. 222 Red Scho o l Lane
Phillipsburg, NJ 08865
Detector Hall Electrolytic Conductivity. Nitrogen Mode lor Organom trogen Compounds as Diazrnon Standard No peak > tOO ng/ml
Sample concentrated 100 fold. Analysis performed on Tracor 222Q. 4-modes of detection. 6 ' X 4 mm i.d. Column packed with 3% OV- 101 on Gas Chrom-Q. 80-100 mesh at 200°C Carrier gas— purified helium at 65 ml/min. 5 / it injection.
rd i
•oleum Ether
Sample concentrated 1000 fold. Analyses performed on Hewlett Packard 5840A: FID Detection 30 meter SP-1000 WCOT column Carrier gas-purified helium at 3 ml/min 2 j i l injection.

L . G . N E S T E R C O M P A N Ya subsidiary of Leeds & Northrup Box 666, Millville, N.J. 08332 Telephone 609/825-0254
We’ve added Portable D.O. to our lineand we’re
Q hooked on it.
You will be too.Use it in the field for Dissolved ^ |§ r OxygenMonitoring or in the lab for B.O.D. analysis. The unique features built into this field proven and reliable instrument plus two styles of patented, no-maintenance probes give you all the advantages of on-line D.O. Meters or B.O.D. systems in a lightweight, portable instrument.
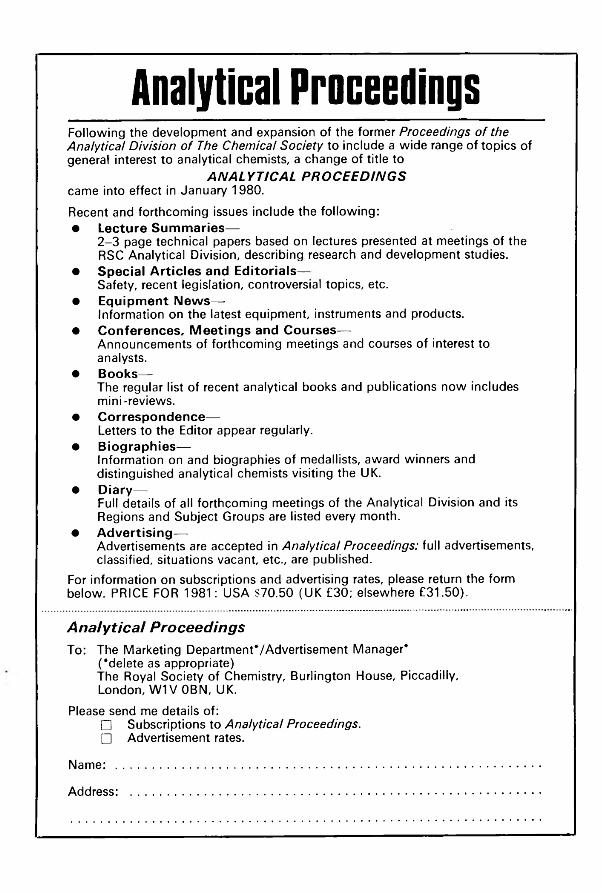
Analytical ProceedingsFollowing the development and expansion of the former Proceedings o f the Analytical Division o f The Chemical Society to include a wide range of topics of general interest to analytical chemists, a change of title to
ANALYTICAL PROCEEDINGScame into effect in January 1980.Recent and forthcoming issues include the following:• Lecture Su m m aries—
2-3 page technical papers based on lectures presented at meetings of the RSC Analytical Division, describing research and development studies.
• S p e c ia l A rt ic le s and Ed ito ria ls—Safety, recent legislation, controversial topics, etc.
• Equ ipm ent N ew s—-Information on the latest equipment, instruments and products.
• C o n fe re n ce s, M eetin g s and C o u rse s—Announcements of forthcoming meetings and courses of interest to analysts.
• B ooks—The regular list of recent analytical books and publications now includes mini-reviews.
• C o rresp o n d en ce—Letters to the Editor appear regularly.
• B io g rap h ies—Information on and biographies of medallists, award winners and distinguished analytical chemists visiting the UK.
• D iary—Full details of all forthcoming meetings of the Analytical Division and its Regions and Subject Groups are listed every month.
• A d vertis in g —Advertisements are accepted in Analytical Proceedings: full advertisements, classified, situations vacant, etc., are published.
For information on subscriptions and advertising rates, please return the form below. PRICE FOR 1981: USA $70.50 (UK £30; elsewhere £31.50).
Analytical ProceedingsTo: The Marketing Department'/Advertisement Manager*
(‘ delete as appropriate)The Royal Society of Chemistry, Burlington House, Piccadilly, London, W1V0BN, UK.
Please send me details of:□ Subscriptions to Analytical Proceedings.□ Advertisement rates.
Name: .............................................................................................
Address: .........................................................................................

IS YOUR AO AC LIBRARY COMPLETE?
Optimizing Laboratory PerformanceThrough the Application of Quality Assurance Principles—Proceedings of a Symposium. 1981. 160 pp. Softbound . $25 + $3 book post and handling in U .S ., $25 + $6 outside U .S . ISBN 0-935584-19-6.
Eleven papers covering settin g up and operating a quality assurance program.
FDA Training Manual for Analytical Entomology in the Food Industry. 1978.184 pp. Looseleaf. $12.50 + $2 book post and han dling in U .S ., $12.50 + $3 outside U .S . ISBN 0-935584-11-0.
With the aid of this text, organizations can set up their ow n in -h ou se training.
Infrared and Ultraviolet Spectra of Some Compounds of Pharmaceutical Interest.1972. 278 pp. Softbound. $12 + $2 book post and handling in U .S ., $12 + $3 outside U .S . ISBN 0-935584-04-8.
An expansion of an earlier com pilation, with supplem ents. M ore than 800 spectra.
Mycotoxins M ethodology. 1980. 22 pp. Soft- bound. $11 + $1 book post and handling inU .S ., $11 + $2 outside U .S . ISBN 0-935584-16-1.
Chapter 26 reprinted from Official M ethods of A nalysis, 13th Edition. A pproved m eth ods for natural toxins in m any com m odities.
Micro-Analytical Entomology for Food Sanitation Control. 1962. 576 pp. Hardbound $30 + $3 book post and handling in U .S ., $30 + $6 outside U .S . ISBN 0-935584-00-5.
A training and reference m anual for identification of insect debris extracted from foods.
Test Protocols for the Environmental Fate and Movement of Toxicants—Symposium Proceedings. 1981. 336 pp. Softbound. $27 + $3 book post and handling in U .S ., $27 + $6 outside U .S . ISBN 0-935584-20-X.
Chem ical and biological tests p lus m ethods for interpreting or predicting results through mathem atical m odels.
FDA Bacteriological Analytical Manual (BAM) 5th Ed. 1978. 448 pp. Looseleaf. $25 + $ 2 b o o k p o sta n d h a n d lin g in U .S ., $25 + $5 outside U .S. ISBN 0-935584-12-9.
Provides regulatory and industry laboratories with m ethods for detection of microorganism s. U pdated by supplem ents.
Mycotoxins Mass Spectral Data Bank. 1978. 60 pp. Softbound. $12 + $2 book post and handling in U .S . and outside U .S . ISBN 0-935584-13-7.
A com puter-based com pilation of 104 m ass spectra with alphabetic and m olecular w eight listings.
Newburger's Manual of Cosmetic Analysis2nd Ed. 1977. 150 pp. Softbound. $13 + $2 book post and handling in U .S ., $13 + $3 outside U .S . ISBN 0-935584-09-9.
Chrom atographic techniques and spectroscopy w ith analyses for various specific cosmetics.
Statistical Manual of the AOAC. 1975. 96 pp. Softbound. $12.50 + $1 book post and handling in U .S ., $12.50 + $2 outside U .S . ISBN 0-935584-15-3.
A do-it-yourself m anual for statistical analysis of interlaboratory collaborative tests.
Send check to AOAC, Suite 210-J, 1111 N 19th St., Arlington, VA 22209, 703/522-3032.
JOURNAL of the
ASSOCIATION O F O FFICIAL
ANALYTICAL CHEMISTS
Basic and Applied Research in the Analytical Sciences Related to Agriculture and the Public Health
E d ito ria l Board The Jo u rn alRobert C. Rund Chairman
Charles W. Gehrke Alan R. Hanks
Kenneth R. H ill M ilan Ihnat
Charles H.
Charles F. Jelinek James P. M inyard, J r.
Irwin H. Pomerantz Helen L. Reynolds
Van M iddelem
Helen L. Reynolds, Editor Nancy Palmer, Managing Editor
Norma Yess, Associate Editor Betty Johnson, Assistant Editor Marilyn Taub, Editorial Assistant
Thomas Alexander, Book Reviews
Vol. 64 NOVEMBER 1981 No. 6
CONTENTS
C ra d d ick , R ich a rd C ., & H a t fie ld , L in da: Exam ination of the U se o f Glass Filter Paperin A sbestos-Free Fiber D eterm ination ....................................................................................... 1275-1276
Jo n es , F ran k E ., & B ricken kam p, C arroll S.: Automatic Karl Fischer Titration o f Moisturein Grain .................................................................................................................................................. 1277-1283
B la k e m o re , W illiam M ., & B illed ea u , S tan ley M .: A nalysis o f Laboratory A nim al Feed for Toxic and Essential E lem ents by A tom ic A bsorption and Inductivity C oupled A rgon Plasma Em ission S p e c tro m etry ...................................................................................... 1284-1290
Drugs in FeedsG o ra s , Jo h n T.: H ig h Perform ance Liquid Chrom atographic M ethod for Pyrantel ^
Tartrate in S w in e Feeds and Supp lem ents .......................................................................... 1291-1296Metals and Other Elements
D a b ek a , R obert W .,& M cK en z ie , A rth u r D .: A tom ic A bsorption Spectrom etric D eterm ination o f Tin in Canned Foods U sing Nitric A cid-H ydrochloric Acid D igestion and N itrous O xid e-A cety len e Flam e ......................................................................................
Y u ' ■ ffSlfln l ini t
1297-1300
Pram eela D ev i, Y a la va rlh y , b N anda K um ar, N anguneri V.: S im p le P ap er a n d M icro T h in L ayer C h ro m a to g r a p h ic M e th o d fo r S ep a ra tio n a n d D e te c t io n o f M ercu ric C h lo r id e , C o p p er S u lfa te , C a d m iu m S u lfa te , a n d S ilv e r N itr a te in F resh W ater . 1 3 0 1 -1 3 0 4
Pesticide ResiduesK an, Gordon Y. P., M ah, Fred T. S., W ade, N orm an L , b Bothivell, M ax L.: D eterm in ation
o f 2 ,4 -D B u to x y e th a n o l E th er E ster a n d Its D e g r a d a tio n P ro d u cts 2 ,4 -D ic h lo r o -p h e n o x y a c e t ic A c id a n d 2 ,4 -D ic h lo r o p h e n o l in S e d im e n t ............................................... 1 3 0 5 -1 3 0 8
W in kler, V ic tor W ., P a tel, Jayanti R ., Januszanis, M a r y , b Colarusso, M arjorie: D e te r m in a t io n o f N o r flu r a z o n R e sid u e s in M ix ed C rop M a tr ices ............................................ 1 3 0 9 -1 3 1 1
U daya Bhaskar, Sana, b N anda K um ar, N anguneri V.: T h in L ayer C h ro m a to g r a p h ic D e te r m in a t io n o f M e th y l P a ra th io n as P a ra o x o n b y C h o lin e s te r a s e I n h ib it io n . 1 3 1 2 -1 3 1 4
Pesticide FormulationsB land, P eter D.: G as-L iq u id C h r o m a to g r a p h ic D e te r m in a t io n o f P ir im ica rb in For- /
m u la tio n s: C o lla b o ra tiv e S t u d y .......................................................................................................... 1 3 1 5 -1 3 1 8Fertilizers
M elto n , James R ., b H oover, W illiam L.: M ic r o w a v e O v e n D r y in g in th e G rav im etr icP h o sp h o r u s M e th o d .................................................................................................................................... 1 3 1 9 -1 3 2 1
K an e, P eter F., B ennett, Brian R ., b G ulik, Stefan: D ata H a n d le r /C o n tr o lle r S y stemw ith A p p lic a t io n to P 2 O 5 a n d K 2 O in F er tilize rs .................................................................... 1 3 2 2 -1 3 2 8
Oils and FatsW altking, A rthur E., b W essels, H.: C h rom atograp h ic S ep aration o f P olar a n d N o n p o la r
C o m p o n e n ts o f F ry in g Fats ..................................................................................................................... 1 3 2 9 -1 3 3 0Van P eteghem , Carlos H ., b D ekeyser, Diana A .: S y stem a tic Id e n t if ic a t io n o f A n tio x i
d a n ts in L ards, S h o r te n in g s , a n d V e g e ta b le O ils b y T h in L ayer C h ro m a to g r a p h y 1 3 3 1 -1 3 3 5
Vitamins and Other NutrientsEllefson , W ayn e G , R ichter, Earl, A d a m s, M a rk , b Baillies, N . Thomas: E v a lu a tio n o f
Io n E x ch a n g e R e s in s a n d V a rio u s E n z y m e s in T h ia m in e A n a ly s is ............................. 1 3 3 6 -1 3 3 8H eckm an, M a ry M ., b Lane, Susan A .: C o m p a r iso n o f D ie ta ry F ib er M e th o d s for
F o o d s .................................................................................................................................................................. 1 3 3 9 -1 3 4 3
Statistical TechniquesK e lly , P atrick C.; C o rrectio n o f B ias in C o lla b o ra tiv e C h eck S a m p le s S er ies R ep ort
in g ........................................................................................................................................................................ 1 3 4 4 -1 3 5 5Mycotoxins
H o w ell, M a ry V ., b T aylor, Philip W.: D e te r m in a tio n o f A fla to x in s , O c h ra to x in A , a n d Z ea ra len o n e in M ix ed F eed s, w ith D e te c t io n b y T h in L ayer C h rom atograp h yo r H ig h P er fo r m a n ce L iq u id C h ro m a to g r a p h y ...................................................................... 1 3 5 6 -1 3 6 3
S co tt, P eter M ., Lau, P u i-Y an , b K anhere, Shriniwas R.: G as C h ro m a to g r a p h y w ith E lectro n C a p tu re a n d M ass S p ectro m etr ic D e te c t io n o f D e o x y n iv a le n o l in W h eata n d O th e r G rain s ...................................................................................................................................... 1 3 6 4 -1 3 7 1
C ohen, H u gu ette , b LaPointe, M ichel: H ig h P ressu re L iq u id C h ro m a to g r a p h ic D e te r m in a tio n a n d F lu o r e sc e n c e D e te c t io n o f A f la to x in s in C orn a n d D a iry F eed s 1 3 7 2 -1 3 7 6
A w e , M ichael b Schranz, John L.: H ig h P ressu re L iq u id C h ro m a to g r a p h ic D e te r m in a t io n o f A fla to x in s in S p i c e s ........................................................................................................ 1 3 7 7 -1 3 8 2
P rice, Ralph L., Jorgensen, Karen V ., b B illo tte , M ichael: C itru s A rtifact In ter fere n cein A fla to x in M i D e te r m in a tio n in M i l k ........................................................................................ 1 3 8 3 -1 3 8 5
Drug Residues in Animal TissuesM alan osk i, A n th o n y Barnes, Charlie b Fazio, Thomas: C o m p a r iso n o f T h ree
M e th o d s for D e te r m in a tio n o f S u lfa m e th a z in e in S w in e T issu es: C o lla b o ra tiv e S t u d y ................................................................................................................................................................... 1 3 8 6 -1 3 9 1
11

M e a t a n d M e a t P r o d u c t sBjarnQ, Ole-Christian: M ulticom ponent A nalysis o f M eat P ro d u c ts ............................... 1392-1396Fox, Jay B., Zell, Tatiana E., & Wasserman, Aaron £.: Interaction B etw een Sam ple
Preparation T echniques and Colorim etric Reagents in N itrite A n alysis in M eat ...................................................................................................................................................... 1397-1402
I n d u s t r i a l C h e m i c a l sPayne, William R .,Jr ,& Benner, Jacquelyn E.: Liquid and Gas Chromatographic Analysis
o f D ieth y l Phthalate in Water and Sed im ent ................................. ................................... 1403-1407E x t r a n e o u s M a t e r i a l s i n F o o d s a n d D r u g s
Trauba, Richard L.: D eterm ination o f Internal Insect Infestation o f Wheat: C ollaborative Study ...................................................................................................................................... 1408-1410
F l a v o r s a n d N o n a l c o h o l i c B e v e r a g e sH urst, William ]., M cK im , James M ., & M artin , Robert A ., Jr: Ion Pairing H igh Pressure
Liquid Chrom atographic D eterm ination o f Am aranth in Licorice Products . . . . 1411-1413D a i r y P r o d u c t s
Chen, Shih-Ling Yeh , Frank, Joseph F., & Loewenstein, Morrison: Estim ation o f Lactose H ydrolysis by Freezing Point M easurem ent in M ilk and W hey Substrates Treated w ith Lactases from Various M icroorganism s ................................... 1414-1419
A l c o h o l i c B e v e r a g e sAlvarez-Nazario, Fabian: Westphal Plummet Determination of Alcohol in Distillates . . . . 1420-1423Kovár, Jan: O scillating U-Tube D ensity M eter D eterm ination o f A lcoholic Strength:
A n alysis o f Parameter E rro r s ...................................................................................................... 1424-1430
D r u g sW all, George M ., & Clark, C. Randall: L iquid Chrom atographic Separation o f Som e
A lkylam inocyclohexanecarb onitriles from P henylcycloh exylam in es Relatedto P h e n c y c lid in e .............................................................................................................................. 1431-1434
M a y, Joan C., & Sih, Jenny T. C.: Protein N itrogen U nit Precipitation Procedure forA llergen ic Extracts: Collaborative S t u d y ............................................................................ 1435-1438
Ellaithy, M oustafa M ., El-Tarras, M . Fayez, & A m er, Sawsan M.: Polarographic A nalytical Study o f O x y p h e n b u ta z o n e ........................................................................................... 1439-1441
Hassan, Sayed M ., Walash, M ohammed I., El-Sayed, Sanaa M ., & Abou O uf, Abdel Malek:Colorim etric D eterm ination o f Certain P hen o l D erivatives in Pharm aceuticalP rep a ra tio n s........................................................................................................................................ 1442-1445
Ferren, William, & M altese, Leonard: C hloridom eter D eterm ination o f A lien H alideC on ten t o f Iod ine ............................................................................................................................ 1446-1447
F o o d A d d i t i v e sIto, Yoshio, Tonogai, Yasuhide, Suzuki, Hideyo, Ogawa, Shunjiro, Yokoyama, Tsuyoshi,
Hashizum e, Takashi, Santo, H ideyuki, Tanaka, Kei-ichi, Nishigaki, Kikuyo, & Iwaida,Masahiro: Im proved 4-A m inoantipyrine Colorim etry for D etection o f ResidualH yd rogen Peroxide in N ood les, F ish Paste, D ried Fish, and H erring R oe............... 1448-1452
Perfetti, Gracia A ., W arner, Charles R ., & Fazio, Thomas: H igh Pressure Liquid Chrom atographic D eterm ination o f Ethoxyquin in Paprika and C hili P ow der ............ 1453-1456
Andrzejew ski, Denis, H avery, Donald C., & Fazio, Thomas: D eterm ination and C onfirm ation o f N -N itroso d im eth ylam in e in B e e r ....................................................................... 1457-1461
Lawrence, Jamgs F., Iyengar, Jagannath R ., & Conacher, Harry B. S.: Gravim etric Determ ination o f Ethoxylated M ono- and D ig lycerides in Bread ......................................... 1462-1464
A n a l y t i c a l M y c o l o g y o f F o o d s a n d D r u g sZipkes, M arilyn R., Gilchrist, James E., & Peeler, James T.: Comparison o f Yeast and M old
Counts by Spiral, Pour, and Streak Plate M e th o d s ............................................................ 1465-1469i i i
T e c h n i c a l C o m m u n i c a t i o n sHache, Patrick, M arquette, René, Volpe, Gilles, & M allet, Victorin N: Fast C leanup of
D ifficu lt Substrates for D eterm ination o f F enitrothion and Som e D erivatives . . 1470-1473Black, Donald B., Lawrence, Robert C., Lovering, Edward G., & W atson, James R.: Gas-
Liquid Chrom atographic Therm al Energy A nalyzer M ethod for N -N itrosod i- ethan olam ine in C osm etics ......................................................................................................... 1474-1478
For Your In form ation ............................................................................................................................ 1479-1480N e w P u b lic a t io n s ..................................................................................................................................... 1481-1482C orrection ...................................................................................................................................................... 1482In d ex to A u thors ...................................................................................................................................... 1483-1494Index to Subjects ...................................................................................................................................... 1495-1515
Board of DirectorsPresident: Helen L. Reynolds, Food and Drug Administration, Bureau of Foods, Washington, DC 20204 President-Elect: James P. Minyard, Jr, State Chemical Laboratory, Mississippi State, MS 39762 Treasurer: Bernhard Larsen, U.S. Department of Agriculture, Food Safety and Quality Service, Washington,
DC 20250 Other Members:Warren R. Bontoyan, Environmental Protection Agency, Office of Pesticide Programs, Beltsville, MD 20705 James B. Kottemann, Food and Drug Administration, Division of Drug Chemistry, Washington, DC 20204 Charles W. Gehrke, University of Missouri, Columbia, MO 65211W. Perce McKinley, Health and Welfare Canada, Tunney's Pasture, Ottawa, Ontario, Canada K1A 0L2 Executive Director: David B. MacLean, AOAC, 1111 N 19th St, Suite 210, Arlington, VA 22209
INQUIRIESDirect inquiries concerning manuscripts being considered for publication to the Office of the Editor (Helen
L. Reynolds, 202/245-1526).Direct all other inquiries to the AOAC, 1111 N 19th St, Suite 210, Arlington, VA 22209 (703/522-3032) as in
dicated:Accepted manuscripts and manuscripts in press: Nancy Palmer, Managing EditorSubscriptions and reprints, Journal: Marjorie D. Fuller, Assistant Business ManagerPublications other than the Journal: Catherine A. Shiflett, Assistant Business Manager, PublicationsOfficial Methods of Analysis: Sidney Williams, EditorSpring and Fall Meetings: Kathleen Fominaya, Program Manager
THE ASSOCIATION OF OFFICIAL ANALYTICAL CHEMISTS, INC.Printed: The Mack Printing Company, Easton, PA 18042
Published: 1111 N 19th St, Arlington, VA 22209Copyright, 1981, by the Association of Official Analytical Chemists, Inc. Published six times a year—January, March, May, July, September, November. Second class postage paid at Arlington, VA, and additional mailing offices.
IV
IN F O R M A T IO N F O R SU B SC R IB ER S A N D C O N T R IB U T O R SThe Journal of the Association of Official Analytical Chemists is published by the Association of Official
Analytical Chemists, 1111 N 19th St, Arlington, VA 22209. The Journal is issued six times a year in January, March, May, July, September, and November. Each volume will contain approximately 1500 pages. Subscriptions are taken by the volume, at $62.00 prepaid in North America and U.S. possessions, and $70.00 to all other countries. Single copies of current issues are $13.00 each. The Journal publishes research articles and reports of the development, validation, and interpretation of analytical methods for agricultural commodities (feeds, fertilizers, pesticides), food (including alcoholic beverages), drugs, cosmetics, colors, the environment, and other areas that affect public health and welfare and are subject to government regulation and control. A limited number of invited reviews on selected subjects are also published.
Manuscripts should be typewritten, double-spaced, and carefully revised before submission; the original and two copies should be submitted to AOAC, 1111 N 19th St, Suite 210, Arlington, VA 22209. “Instructions to Authors" are available on request from the Editorial Office.
Reprints will be furnished at cost to contributors of articles printed in the Journal. A table showing costs, with an order slip, will be sent with galley proof.
Claim for copies lost in the mails will not be allowed unless received within thirty days of the date of issue for domestic subscriptions or ninety days for foreign subscriptions. Claimants must state that the publication was not delivered at their recorded address. Address requests for replacement copies to AOAC, 1111 N 19th St, Suite 210, Arlington, VA 22209. For foreign subscribers, replacement of copies of the Journal lost in transit cannot be made without charge because of uncertain mailing conditions abroad.
Change of Address notification should include both old and new addresses, with ZIP numbers, and be accompanied by a mailing label from a recent issue. Allow four weeks for change to become effective. Foreign subscribers should use air mail for notification.
Volumes on microfilm are available from Princeton Microfilm Corp., PO Box 2073, Princeton, NJ 08540.Postmaster: Forward Changes of Address to AOAC, 1111 N 19th St, Suite 210, Arlington, VA 22209.
NOTICE TO READERS ABOUT COPYINGPersons requiring copies of J. Assoc. Off. Anal. Chem. articles beyond the number allowed by the fair use
provisions of the 1978 copyright law may request permission to copy directly from the AOAC, or make the required copies and pay $1.00 per copy through the Copyright Clearance Center, Inc., PO Box 8891, Boston, MA 02114. Articles which are copied and royalties paid through the Copyright Clearance Center must be identified by the following code: 0004-5756/XX/XXXX-XXXX-XX$01.00. The first 8 digits are the International Standard Serial Number assigned to J. Assoc. Off. Anal. Chem.; the next 2 digits are the year; the next 6 digits are the issue and page number; the next 2 digits are the total number of pages copied to capture the article; the last 4 digits are the copying fee for that article. For example, an article in the 1979 May issue (issue 3) beginning on p. 956 and ending on p. 960 would have following code: 0004-5756/79/6203-0956- 05$01.00. Information on the use of the Copyright Clearance Center is available from the Center.
Reprints for personal use may still be obtained from the author(s).
v

IN S T R U C T IO N S T O A U T H O R SS c o p e o f A r t i c l e s
The Journal of the AOAC will publish articles that present, within the fields of interest of the Association (a) unpublished original research; (b) new methods; (c) further studies of previously published methods; (d) background work leading to development of methods; (e) compilations of authentic data; (/) technical communications, cautionary notes, and comments on techniques, apparatus, and reagents; (y) invited reviews of methodology in special fields. All articles are reviewed for scientific content and appropriateness to the journal.P r e p a r a t i o n o f M a n u s c r i p t
Authors are required to submit three copies of the complete manuscript, including all tables and all illustrations. The manuscript is to be typewritten on one side only of white bond paper, 8 V2 X 11 inches, with minimum page margins of 1 inch, and must be double-spaced throughout (including title, authors' names and addresses, footnotes, tables, references, and captions for illustrations, as well as the text itself). Tables are to be typed on separate sheets, not interspersed through the manuscript. Drawings and photographs should be mounted apart from the text or submitted as separate items, not interspersed through the text.S t y l e a n d F o r m a t
The text should be written in clear, concise, grammatical English. Unusual abbreviations should be employed as little as possible and must always be defined the first time they appear. Titles of articles should be specific and descriptive. Full first names, middle initial (if any), and last names of authors should be given. The address of the institution (including zip code) from which the paper is submitted should be given and should be in a form to which inquiries, proofs, and requests for reprints can be sent. Information supplementing the title and authors' names and addresses should be given in footnote form.
Methods, Results and/or Discussion, Acknowledgments, and Recommendations (applicable to reports of General and Associate Referees) should be placed in separate sections under appropriate headings typed in capitals and lower case letters, centered on the page, not underscored.
Abstracts: Each manuscript should be accompanied by a concise abstract (not more than 200 words). The abstract should provide specific information rather than generalized statements.
Introduction: Each article should include a statement on why the work was done, the previous work done, and the use of the compound being studied.
Methods: Methods should be written in imperative style, i.e., "Add 10 mL . . . Heat to boiling . . . Read in spectrophotometer." Special reagents and apparatus should be separated from the details of the procedure and placed in sections with appropriate headings;
however, common reagents and apparatus (e g., concentrated HC1, chloroform, ordinary glassware, ovens, etc.), or those which require no special preparation or assembly, need not be listed separately. Hazardous and/or carcinogenic chemicals should be noted. The steps of the procedure should not be numbered, but should be grouped together to form a logical sequence of two, three, or four operations. Any very long, detailed operation can be given in a separate section with an appropriate heading (e.g., Preparation of Sample; Extraction and Cleanup; Preparation of Standard Curve). Any necessary calculations should be included. Care should be taken that the number of significant figures truly reflects the accuracy of the method. Equations should be typed in one-line form. Wherever possible, metric units should be used for measurements or quantities.
Tables: All tables must be cited in the text consecutively. Tables are numbered by arabic numbers, and every table must have a descriptive title, sufficient so that the table can stand by itself without reference to the text. This title should be typed in lower case letters, not capitals, with the exception of the word "Table" and the first word of the descriptive portion of the title, of which the first letter is capitalized. Every vertical column in the table should have a heading; abbreviations may be used freely in the headings to save space, but should be self-evident or must be explained in footnotes. Footnotes to both the headings and the body of the table are indicated by lower case letters in alphabetical order; these letters should be underscored and raised above the line of type. Horizontal rules should be used sparingly; however, they are used to bound the table at top and bottom and to divide the heads from the columns. Authors should refer to recent issues of the Journal for acceptable format of tables; tables should not exceed the normal page width of the Journal, and authors should attempt to revise or rearrange data to fit this pattern.
Illustrations: Illustrations, or figures, may be submitted as original drawings or photographs; photocopies are acceptable for the two review copies but not for the printer's copy. All figures must be cited in the text consecutively. Figures are numbered by arabic numbers, and all figures must be accompanied by descriptive captions, typed on one (or more) separate sheets, not on the figure itself. The figure should be identified by number on the back by a soft pencil or (preferably) a gummed label.
Drawings should be submitted either as the original drawing or a good glossy photograph; photocopies, multiliths, Verifax copies, Xerox copies, etc. are not acceptable. Drawings should be done in black India ink (ordinary blue or blue-black ink is not acceptable) or with drafting tape on white tracing paper or tracing cloth or on "fade-out" graph paper (ordinary graph paper ruled with green or dark blue ink is not acceptable). Lettering should be done with a Leroy lettering set, press-on lettering, or a similar device; freehand or

typewritten lettering is not acceptable. Values for ordinate and abscissa should be given, with proper identification conforming to journal style (example: wavelength, nm), at the sides and bottom of the figure. Lettering or numbering on the face of the figure itself should be kept at a minimum; supplementary information should be given in the caption. Several curves on the same figure should be identified by simple symbols, such as letters or numbers, and the proper identification or explanation given in the caption. Letters and numbers should be large enough to allow reduction to journal page or column size. JAOAC does not publish straight line calibration curves; this information can be stated in the text. The same data should not be presented in both tables and figures.
Footnotes: Footnotes are a distraction to the reader and should be kept to a minimum. Footnotes to the text are identified by arabic numbers set above the line of type (not asterisks or similar symbols). Each footnote must be indicated by its number within the text.
Acknowledgments: Essential credits may be included at the end of the text but should be kept to a minimum, omitting social and academic titles. Information on meeting presentation, financial assistance, and disclaimers should be unnumbered footnotes and appear after the References section.
References: References to previously published work should be collected at the end of the article under the heading "References." Each item in the list is preceded by an arabic number in parentheses. Every reference must be cited somewhere in the text in numerical order (rather than alphabetical or chronological). (Note: If an article contains only one reference, this reference may be inserted directly in the text, rather than placed at the end.) It is the author's responsibility to verify all information given in the references.
References to journal articles must include the following information: last names and at least one initial of all authors (not just the senior author); year of publication, enclosed in parentheses; title of journal, abbreviated according to accepted Chemical Abstracts style; volume number; numbers of first and last pages. References to books, bulletins, pamphlets, etc. must include the following information: last names and initials of authors or editors; year of publication, enclosed in parentheses; full title of book; volume number or edition (unless it is the first edition); publisher; city of publication; numbers of pertinent pages, chapter, or section. Citation to private communications or unpublished data should be included in the text, not in the list of references, in the following form: author's name and affiliation, and year.
The abbreviation for the journal title should be repeated for each reference; do not use ibid. This Journal will be referred to as J. Assoc. Off. Anal. Chem.
The compendium of methods of the Association should be listed as follows: Official Methods of Analysis (1980) 13th Ed., AOAC, Arlington, VA, with appropriate section numbers; the edition and year are, of course, subject to change.Symbols and AbbreviationskS kilogram(s)g gram(s)mg milligram(s)Mg microgram(s)ng nanogram(s)L liter(s)mL milliliter(s)pL microliter(s)m meter(s)cm centimeter(s)mm millimeter(s)fim micrometer(s) (not micron)nm nanometer(s) (not millimicron)A ampere(s)V volt(s)dc direct currentft foot (feet)in. inch(es)cu.in. cubic inch(es)gal. gallon(s)Ib pound(s)oz ounce(s)ppm parts per millionppb parts per billionpsi pounds per square inchSP gr specific gravitybp boiling pointmp melting pointid inside diameterod outside diameterh hour(s)min minute(s)s second(s)% percentJ standard taperN normalM molarmM millimolar
(Note: Spectrophotometric nomenclature shouldfollow the rules contained in Official Methods of Analysis, "Definitions of Terms and Explanatory Notes.")
R ev.1/81

P a r t ic ip a t io n in th e C o p y r ig h t C le a ra n c e C e n te r ( C C C ) a s s u re s y o u o f le g a l p h o to c o p y in g a t th e m o m e n t o f n e e d .
Libraries everywhere have found the easy way to fill photocopy requests legally and instantly, without the need to seek permissions, from more than 3000 key publications in business, science, humanities, and social science. You can.F i l l r e q u e s ts f o r m u lt ip le c o p ie s in t e r l ib r a r y lo a n ( b e y o n d th e C O N T U g u id e l in e s ) , a n d re s e rv e d e s k w i t h o u t fe a r o f c o p y r ig h t in f r in g e m e n t .
Supply copies from CCC-registered publications simply and easily.The Copyright Clearance Center is your one-stop place for on-the-spot clearance to photocopy for internal use.Its flexible reporting system accepts photocopying reports and returns an itemized invoice. You send only one convenient payment. CCC distributes it to the many publishers whose works you need.
A n d , y o u n e e d n o t k e e p a n y r e c o r d s , the CCC computer will do it for you. Register now with the CCC and you will never again have to decline a photocopy request or wonder about compliance with the law for any publication participating in the CCC.To register or for more information, just contact:
Copyright C learance C enter21 Congress Street Salem, Massachusetts 01970 (617) 744-3350a not-for-protit corporation
NAME TITLE
ORGANIZATION
ADDRESS
CITY STATE ZIP
COUNTRY TELEPHONE
F E E D S
E x a m i n a t i o n o f t h e U s e o f C l a s s F i l t e r P a p e r i n A s b e s t o s - F r e e F i b e r D e t e r m i n a t i o n
RICHARD C. CRADDICK and LINDA HATFIELDK e n t F eeds, In c ., Q u a lity C on tro l L abora tory , M u s c a tin e , IA 52761
A modification is presented of asbestos-free method 7.066 for the determination of crude fiber in feeds. In the final filtering step, the fritted glass crucible is replaced with a 7.5 cm disc of glass filter paper in a California Buchner funnel. The data supporting the use of filter paper indicate that good precision and accuracy can be achieved.
W ith the increasing concern over the carcinogenic nature o f asbestos and its use, as w e ll as the inability to purchase the material for crude fiber analysis, w e review ed the asbestos-free m ethod, 7.066, Offical M ethods o f Analysis, 13th ed ition . T w o areas o f d ifficu lty in the procedure w ere recogn ized , both related to th e use o f th e fritted glass crucible. The crucible is su sceptib le to stress and breakage w h en subjected to 600°C tem peratures. S low co o lin g o f th e crucible to 250°C before rem oval from the furnace, or ashin g for 3 h at a low er tem perature o f 500 °C, are th e suggested alternatives, but both increase analysis tim e. In addition , the fritted glass filter m ust be cleaned frequ ently to avoid s lo w filtration.
Substitu ting glass fiber filter paper for the crucible circum vents these d ifficu lties.
M ETH O DP r i n c i p l e
See 7.061.
A p p a r a t u s a n d R e a g e n t sSee reagents 7.062(a, b , d , e, f); apparatus
7.063(a, b , c, d , e , f) and 14.088; and in addition:
Glass fiber filter paper.— 7.5 cm diam eter (Schleicher & Sch uell Inc., or equ ivalent).
Received April 3, 1981. Accepted May 28, 1981.
D e t e r m i n a t i o nExtract 2 g ground material w ith ethyl ether or
petroleum ether, 14.088. If fat is <1%, extraction m ay be om itted. Transfer to 600 mL reflux beaker, avoid ing fiber contam ination from paper or brush. A dd 0 .25-0.5 g bu m p in g granules, fo llow ed by 200 mL near-boiling 1.25% H 2SO4 so lu tion . Place beakers on d igestion apparatus at 5 m in intervals and boil exactly 30 m in , rotating beakers periodically to keep solids from adhering to sides. Near end o f refluxing, place California Buchner, 7.063(d), p rev iou sly fitted w ith N o . 9 rubber stopper to provide vacuum seal, in to f iltration apparatus, and adjust vacuum to about 25 m m H g (735 m m pressure). A t the en d o f reflu x in g , decant liq u id throu gh fu n n el, w a sh in g so lid s in to fu n n el w ith m inim um am ou nt o f n ear-boiling water. Filter to dryness, u sin g 25 m m vacuum , and w ash residue w ith four 40-50 mL portions o f near-boiling water, filtering after each washing. Do not add wash to funnel under vacuum .
W ash residue from fu n n el in to reflux beaker w ith near-boiling 1.25% N aO H so lu tion . A dd additional hot 1.25% N aO H to provide vo lu m e of 200 mL in beaker. Place glass fiber filter paper on the California Buchner funnel screen. At end o f refluxing, decant liq u id throu gh Buchner fu n n el and w ash so lid s in to fu n n el w ith nearb o ilin g water. Increase vacuum as n eed ed to maintain filtration rate. Wash residue once w ith 25-30 mL near-boiling 1.25% H 2SO4 solution and then w ith two 25-30 mL portions o f near-boiling water, filterin g after each w a sh in g . W ash w ith 25 mL m ethanol. Break suction, and rem ove mat by b lo w in g back through filter screen in to ashin g dish.
Dry crucible w ith residue 2 h at 130 ± 2°C or overn igh t, cool in desiccator, and w e ig h . A sh 30 m in at 600°C , cool in desiccator, a n d w e ig h .
% Crude fiber = loss in w t on ig n ition X 1 0 0 /w t sam ple
0004-5756/81 /6406-1275-02$01.00© Association of Official Analytical Chemists, Inc.
1 2 7 6 C R A D D IC K & H A TFIELD : J. A SSO C. OFF. A N A L . C H E M . (VO L. 64, N O . 6, 1981)
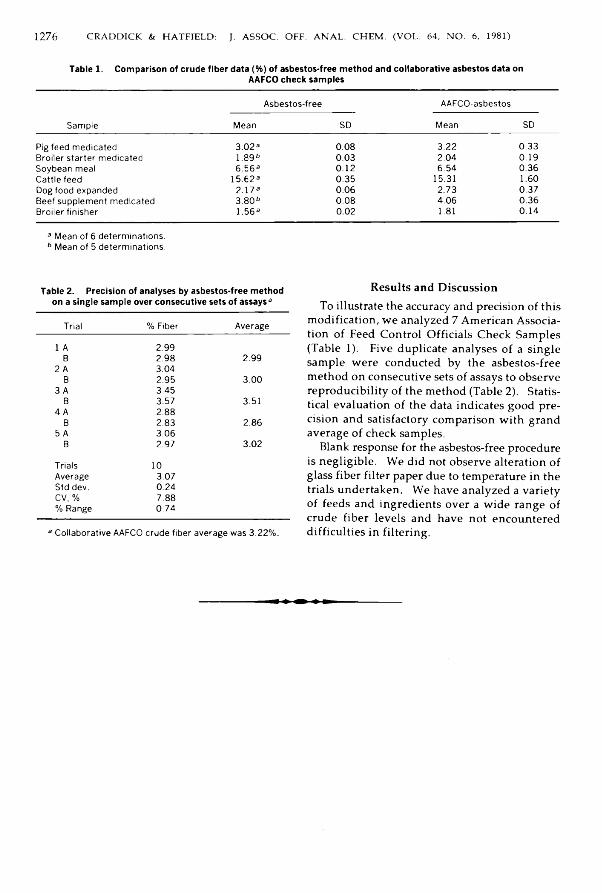
Table 1. Comparison of crude fiber data (%) of asbestos-free method and collaborative asbestos data onAAFCO check samples
SampleAsbestos-free AAFCO-asbestos
Mean SD Mean SDPig feed medicated 3.02a 0.08 3.22 0.33Broiler starter medicated 1.89b 0.03 2.04 0.19Soybean meal 6.56a 0.12 6.54 0.36Cattle feed 15.623 0.35 15.31 1.60Dog food expanded 2.17a 0.06 2.73 0.37Beef supplement medicated 3.80b 0.08 4.06 0.36Broiler finisher 1.56a 0.02 1.81 0.14
a Mean of 6 determinations. 6 Mean of 5 determinations.
Table 2. Precision of analyses by asbestos-free method on a single sample over consecutive sets of assays9
Trial % Fiber Average1 A 2.99B 2.98 2.992 A 3.04
B 2.95 3.003 A 3.45
B 3.57 3.514 A 2.88
B 2.83 2.865 A 3.06B 2.97 3.02Trials 10Average 3.07Std dev. 0.24CV, % 7.88% Range 0.74
a Collaborative AAFCO crude fiber average was 3.22%.
R esu lts and D iscu ssionTo illustrate the accuracy and precision o f this
m odification , w e analyzed 7 Am erican A ssociation o f Feed Control O fficials Check Sam ples (Table 1). F ive duplicate analyses o f a s in g le sam ple w ere conducted by th e asbestos-free m ethod on co nsecutive sets o f assays to observe reproducibility o f the m ethod (Table 2). Statistical evaluation o f the data indicates goo d precision and satisfactory com parison w ith grand average o f check sam ples.
Blank response for the asbestos-free procedure is n eg lig ib le . We did not observe alteration o f glass fiber filter paper due to temperature in the trials undertaken. W e have analyzed a variety of feeds and ingred ien ts over a w id e range of crude fiber lev e ls and have not encountered difficu lties in filtering.

JO N ES & BRICK EN K A M P: J. A SSO C. OFF. A N A L . C H E M . (VO L. 64, N O . 6, 1981) 1 2 7 7
A u t o m a t i c K a r l F i s c h e r T i t r a t i o n o f M o i s t u r e i n G r a i n
FRANK E. JONES and CARROLL S. BRICKENKAMP* 1N a tio n a l B ureau o f S ta n d a rd s , N a tio n a l E ngineering L ab ora tory, W a sh in g to n , D C 20234
Automatic Karl Fischer titrators of the motor-driven buret type and the coulometric generation type were applied to the determination of moisture in grain. Techniques were developed to optimize the performance of the Karl Fischer titration method and to overcome disadvantages attributed to it. The imprecision (1 standard deviation) of a determination is typically 0.06% moisture content at a moisture content of 15%; the systematic uncertainty from known sources is estimated to be ±0.05% moisture content at a moisture content level of 15%. It is suggested that the method be designated as the primary reference method for grain in general and for corn and soybeans in particular.
The Karl Fischer titration m ethod (1) for the d eterm ination o f w ater w as used by Fosnot and Ham an (2) in a prelim inary investigation o f its application to the determ ination o f m oisture in cereal grains (w heat and barley) and cereal products. Hart and N eustadt (3) proposed the use o f the m ethod for grain to avoid som e o f the disadvantages of oven m ethods and adapted it to test the accuracy o f official oven m ethods. U. S. D epartm ent o f Agriculture (USDA) oven m ethods have been d esign ed to g iv e results w h ich agree w ith those obtained by the Karl Fischer (KF) m ethod (4) a lthough a satisfactory oven m ethod has not been developed for soybeans (5). It has been reported (6 ) that the official USDA oven m ethod for w h o le corn, 103°C for 72 h, g ives valu es about 1 % m oisture content too low for the very hard corn grow n in France (sim ilar to flin t corn grow n in the U n ited States).
In spite o f the advantages o f the KF m ethod, particularly its specificity for w ater and its dem onstrated applicability to the determ ination of m oisture in grain, it has not been designated as the primary reference m ethod. Presum ably this is due in part to observations that the m ethod is len g th y and requires considerable technical sk ill and experience for accurate, reliable results.
H ow ever, several sign ifican t d evelop m en ts w h ich have overcom e d isadvantages attributed to the m ethod, particularly w ith respect to the technical training and requisite skill of operators, are electrom etric end -p o in t detection (7) w h ich elim inates the d ifficu lt visual detection o f the
Received April 1,1981. Accepted June 2, 1981.1 National Measurement Laboratory.
end-point; autom atic d isp en sin g o f KF reagent from a buret (8 ); and coulom etric generation of iod in e (9, 10) w h ich elim inates the buret. As a result o f these develop m en ts, 2 types o f automatic KF titrators are com m ercially available, both w ith electrom etric en d -p o in t detection: titrators w ith m otor-driven burets, and titrators w ith coulom etric generation o f iod in e .
In the present study, techn iques have been d eveloped to apply automatic KF titration to the determ ination of the m oisture con ten t o f grain and to overcom e disadvantages attributed to the KF m ethod. Also, the estim ated uncertainties in the determ ination have been analyzed , and the results of the analysis have been com pared w ith results for experim ental determ inations.
M ETH O DA p p a r a t u s
(a) Autom atic Karl Fischer titrator.—C oulom etric Aquatest II (Photovolt Corp., N e w York, NY 10010), or equivalent; or m otorized Beckman M odel KF-4B (Beckman Instrum ents, Inc., Fullerton, CA 92634), or equ ivalent.
(b) M ill.—M odel 8000 M ixer/M ill w ith 65 mL capacity hardened steel vessel and a supply o f 0.5 in. diam eter steel balls (Spex Industries, M et- uch en, NJ 08840), or equ ivalent; and, if desired, m ill w ith a larger capacity vessel to accommodate larger sam ples.
(c) Analytical balances.— M odel B6 sem im icrobalance (M ettler Instrum ent Corp., H igh ts- tow n, NJ 08520), or equivalent; and M odel M5 m icrobalance (M ettler Instrum ent Corp.).
(d) Syringes.— 1 mL, 2.5 mL, and 10 mL gas- tigh t syringes, and 10 pL syringe w ith 12.7 cm n eed le (H am ilton Co., Reno, N V 89510), or equivalent.
(e) Test tubes.—Vacutainer BD-6440, partially evacuated, no additive, no interior coating, pink stopper (Becton, D ickinson and Co., Rutherford, NJ 07070).
(f) Telescopic viewer.— M ade for reading ther-
Certain commercial equipment, instruments, or materials are identified in this paper in order to adequately specify the experimental procedure. In no case does such identification imply recommendation or endorsement by the National Bureau of Standards, nor does it imply that the material or equipm ent identified is necessarily the best available for the purpose.
0004-5756/81 /6406-1277-07$01.00© Association of Official Analytical Chemists, Inc.

1 2 7 8 JO N ES & BRICK EN K A M P: J. ASSO C. OFF. A N A L . C H E M . (VOL. 64, N O . 6, 1981)
m om eters (Parr Instrum ent Co., M clin e, IL 61265).
(g) Pipet.— 50 mL Class A.R e a g e n t s
(a) Karl Fischer reagent.—Stabilized (J. T. Baker Chem ical Co., P hillipsburg, NJ 08865).
(b) Karl Fischer reagent diluent.—Stabilized (J.T. Baker Chem ical Co.).
(c) Vessel solution for Aquatest I I .—Ir. 2 parts (P hotovolt Corp.); see revision o f ASTM D1533 for preparation.
(d) Generator solution for Aquatest II .—Karl Fischer reagent in m ethanol (Ph otovolt Corp.).
(e) M ethanol.—D istilled in glass (Burdick and Jackson Laboratories, Inc., M u sk egon , MI 49442).S a m p l e P r e p a r a t i o n a n d E x t r a c t i o n o f W a t e r
Accurately w eigh ca 5 g w h ole grain in capped w eigh in g bottle on analytical balance. A pply air buoyancy correction (11). Put grain and m illing balls in to m illin g vessel and p ipet 50 mL m ethanol into vessel. Seal lid to vessel, and m ill for predeterm ined tim e. M illin g tim e for Spex M ixer/M ill is 15 m in, during w h ich tim e m ethanol-extracted water mixture is heated by m illing to just b elo w b o ilin g point o f m ethanol. Set m illin g vessel aside to a llow solid residue from grain to settle. A llo w 1 '/2-2 h if vessel is not centrifuged; centrifuging w ill greatly reduce settling tim e. After settling or centrifuging, use 10 mL syringe to rem ove 10 mL portions of m ethanol-extracted w ater m ixture from vessel and im m ediately inject through rubber stoppers of Vacutainers. Dip stoppered end of Vacutainer into m elted paraffin to im m ob ilize the stopper and, as a precautionary m easure, to further seal h ole made in stopper by syringe needle. Repeat above procedure for 50 mL m ethanol w ith ou t grain to prepare m ethanol blank. M in im ize exposure of m ethanol and m ixture to air to preven t contam ination by m oisture in the air.
Before use, rinse m illin g vessel, lid , and balls w ith m ethanol, heat in 80 °C air oven for 1 h, and let cool.T i t r a t i o n
D ism antle calibrated syringe (see section on calibration o f syringes) and 1 0 p L syringe, heat in 80°C air oven for 1 h, let cool. Prepare titrator for titration according to m anufacturer's in structions. W ithdraw specim en of desired quantity o f m ethanol-extracted w ater m ixture (that w h ich contains about 3 m g water) from Vacutainer into calibrated syringe. Expel this
specim en as waste and then w ithdraw another specim en from Vacutainer, usin g telescopic v iew er to set p lu n ger on desired lin e on barrel(12). Just before exp ellin g second and succeedin g specim ens into titration vessel, slosh vessel solu tion (pretitrated m ethanol in the case o f the m otorized-buret type titrator) to flush vessel walls and then let titrator titrate any water picked up from vessel.
Expel specim en into titration vesse l and start titration. After en d -p o in t has been reached, record titration value (mL of KF reagent used in the case of the m otorized-buret type titrator, or indicated mass o f water in p g titrated in the case of the coulometric type titrator). For best results, space above vessel so lu tion shou ld be flu sh ed w ith dry gas. Beckman KF-4B titrator has prov ision for passing dried air through space con tinuously. Aquatest II coulom etric titrator has no such provision; how ever, introducing flow of dry n itrogen or dry air through sam ple port 3 -4 s just after slo sh in g solu tion is effective.
Repeat titration procedure (except for in itial expulsion of specim en as waste) for 2 m ore specim ens. Com pute m ean of 3 titration values. Then make 3 standardizations as specified in the section on standardization o f titrators and com pute mean. Then make 3 titrations of m ethanol blank, and com pute mean.
In making a series o f titrations in a coulometric titrator, it is necessary to consider the lim its on the quantity o f water that can be titrated. The m anufacturer o f the Aquatest II titrator recom m ends that titration be lim ited to 1 g in a 2 -w eek period. We found a practical lim it of a maximum of about 0.07 g per day. The fo llo w in g is a su ggested sequence o f titrations for 3 sets o f specim ens each containing about 3200 p g water, 3 sets of standardizations u sin g about 3200 p g water, and 3 sets o f blank determ inations: 3 specim en titrations (3S), 3 standardizations (3T), 3S, 3T, 3S, 3T, 3 sets o f blank titrations.C a l c u l a t i o n s
Calculate moisture content (m.c.), on w et basis, of grain sam ple, usin g the fo llo w in g equations:
m .c., % = (V C /106mg) X \[Z(As/ v s) - ( A b/ ub)] /[ l - (Z C /106p)(As/u s)]| X 100
Z = 1 - 1.985 X 10~ 7 X C X [(As/i>s) - ( A b/ Vb)]
V = vo lu m e of m ethanol used for extraction (mL)
C = standardization factor for the titrator (pg I p g , or jtg /m L ), m ean of 3 values
m g = mass o f grain sam ple in g
JO N E S & B RICK EN K A M P: J. A SSO C . O FF. A N A L . C H E M . (VO L. 64, N O . 6, 1981) 1 2 7 9
Z = factor w h ich takes account o f the fact that the vo lu m e o f a m eth an ol-w ater m ixture is less than the sum of the vo lu m es the com p onents w o u ld occupy separately (d im ension less)
As = titration va lu e (jig w ater for coulom etric titrator, or mL KF reagent for m otorized-buret titrator) for specim en o f m ethanol-extracted w ater m ixture, m ean o f 3 values
v s - vo lu m e o f specim en (mL)A b = titration valu e (jig water or mL KF re
agent) for m ethanol blank, m ean o f 3 values Vb = vo lu m e of m ethanol blank (mL) p = d en sity o f w ater at the tem perature at
w h ich the m easurem ents are m ade (g /cc)For grains w ith significant oil content, such as
corn and soybeans, m u ltip ly m.c. calculated above by:
1 + (p 0 /V )/[1 - (A hl v b) l ( A sl v s)]w h ere v a is the vo lu m e of o il in the m ethanol- extracted w ater m ixture, estim ated as specified in the section on estim ation o f vo lu m e o f o il in m ethanol-extracted w ater m ixture.
E xperim ental C a l i b r a t i o n o f S y r i n g e s
To determ ine the vo lu m e o f liquid d ispensed by a syringe, calibrate syrin ge by fillin g w ith d istilled w ater to appropriate mark on barrel, w eig h syringe on analytical balance, then d isp en se water, and rew eigh . For best results, use telescopic v iew er to set p lu n ger on appropriate mark (12). A p ply air buoyancy corrections for w eig h in g s (11). Convert d ifference in mass to volu m e by d iv id in g by d en sity o f w ater (13). M ake at least 15 determ inations and use m ean as calibration value.S t a n d a r d i z a t i o n o f T i t r a t o r s
Fill syringe o f 10 jtL capacity to lev e l corresponding to approximate quantity of w ater to be titrated in specim en and w eigh on microbalance. Insert tip o f n eed le beneath surface o f so lu tion in titration vessel, expel water, and start titration. Carefully w ip e n eed le clean of so lu tion and rew eigh m icrosyringe. A pply air buoyancy corrections for w e igh in g s (11). Mass d ifference b etw een w e ig h in g s is mass o f water titrated. Standardization factor, C, is the mass (in jtg) of w ater titrated d iv id ed by d ifference in titrator readings, before and after titration.E s t i m a t i o n o f V o l u m e o f O i l i n M e t h a n o l - E x t r a c t e d W a t e r M i x t u r e
To estim ate vo lu m e, v 0, o f o il extracted into m ethanol-extracted w ater m ixture from grain
w ith sign ificant oil content, heat 10 mL m ixture in w eigh in g bottle in 60°C air oven until residue is apparently dry. M ass o f residue, mr, is mass difference betw een w e ig h t o f w e ig h in g bottle w ith residue and w e ig h t o f em pty bottle. Estimate d en sity o f residue, pr, from handbook values o f den sities of relevant o ils for particular grain; close estim ate is not necessary. Calculate v Q u sin g equation:
v 0 = (V /10) X (;mT/ p r)w h ere V is vo lu m e o f m ethanol used for extraction o f w ater from grain sam ple.D e r i v a t i o n o f t h e M o i s t u r e C o n t e n t C a l c u l a t i o n E q u a t i o n
M oisture content (m.c.) on a w et basis o f a grain sam ple is d efin ed as the ratio o f th e mass of water in the sam ple to the mass o f the sam ple, expressed as percentage. M ass o f w ater in a sam ple o f mass m g is equal to mg X (m .c ./100). Mass o f water in m ethanol used for extraction is equal to VC X (A b lvb ), w h ere V is vo lu m e of m ethanol used for extraction, C is standardization factor for titrator, A b is blank titration value read from titrator, and ub is volu m e o f m ethanol used for blank determ ination. V olum e o f water in mixture o f m ethanol and water extracted from the grain sam ple is equal to
(V C /106p) X (A b/ v b) + (mg/p ) X (m.c./lOO),w h ere m g is in g, p is d en sity o f w ater in g / cc at tem perature at w h ich m easurem ents are made(13), and C A b is in pg. Total vo lu m e o f m ixture is equal to
Z X [V + (Wg/p) X (m .c./100)]w here Z is a factor w h ich takes account of the fact that the vo lu m e o f a m eth an o l-w ater m ixture is less than the sum of the volum es the com ponents w ou ld occupy separately (14); in reference 14, Z is designated Z'. Ratio o f vo lu m e o f w ater in m ixture to total vo lu m e o f m ixture is thus:[(V C /106) X (A b/ v b) + m g
X (m .c ./100)]/|Z X [pV + m % X (m .c./100)])This ratio is also equal to the ratio o f vo lu m e of w ater in specim en o f m ixture to vo lu m e of specim en: (C /106p) X (A s/ v s), w h ere A s is titration value for specim en o f vo lu m e v s.
By com b in ing the last 2 expressions and rearranging, the fo llo w in g equation results:m.c.,% = (V C /106mg) X j[Z(As/i>s) - ( A b/F b) ] / [ l - ( Z C / 1 0 6p)(A5 /u s)]f X 1 0 0 ( 1 )

1 2 8 0 JO N E S & BRICK EN K A M P: J. A SSO C. OFF. A N A L. C H E M . (VO L. 54, N O . 6, 1981)
In the present work, (CAs/ v s) < 30 000 pg/m L , (CAh/ v b) < 500 p g /m L , and Z > 0.9940. Z /p is near un ity in the tem perature range 20-25°C . Therefore, Z /p can be set equal to u n ity in the denom inator o f Equation 1 w ith an error o f less than 0.00013 o f the m oisture content.
Z can be calculated in the tem perature range 20-25°C , usin g the equation:Z = 1 - 1.985 X 10“ 7 X C
X H A J v J - (A b/ v b)] (2)For grains w ith significant o il content, such as
soybeans and corn, correction m ust be m ade to Equation 1 to account for the effect o f the volum e of o il, v 0, inadvertently extracted into the m eth an ol-w ater m ixture. The total vo lu m e of the m ixture then becom es approxim ately
Z X [V + (mg/p ) X (m .c./100)] + v aresulting in addition of the fo llow ing term to the right hand side of Equation 2:1 0 0 X ( v oC /1 0 6p m g)(A s/ v s)/
X [1 - (ZC /106p)(As/i>s)]The ratio o f this term to the right hand side of Equation 1 (RHS1) is
( v J V ) / \p [ Z - (A b/ v b) / ( A s/ v s)]\w h ich can be approxim ated by
(v0/ V ) / [ l - ( A b/ v b) / ( A J v s)]w ith an error that is n eg lig ib le com pared w ith the error in the estim ation o f i>0. Therefore,m .c., % = RHS1
X jl + (v0/V ) /[ 1 - ( / lb/n b)/G4s/p 5>]| (3)U n c e r t a i n t y i n C a l c u l a t i o n o f M o i s t u r e C o n t e n t
To estim ate the uncertainty in the calculation of m oisture content, the uncertainty in each of the parameters in Equation 2 w as estim ated and the uncertainties w ere com bined. The measure of random uncertainty used in this work is the estim ate o f the relative standard deviation o f the m ean (i.e ., the standard deviation o f the m ean d iv id ed by the m ean). The m easure o f system atic uncertainty is the estim ate o f relative bias. Each o f these m easures w ill be referred to as relative uncertainty.
The uncertainty in V , the volum e o f m ethanol dispensed from the pipet, consists o f a systematic com p onent and a random com ponent. The estim ate o f the system atic com p onent o f th e u n certainty in V is the tolerance assigned to the
Class A pipet, ±0 .05 mL for a 50 mL pipet, for exam ple. The relative system atic uncertainty is ±0.001. The relative random uncertainty is estimated to be 0.0005 from com m on experience in the use o f pipets.
In this w ork, the typical valu e o f the relative random uncertainty in A s, the titration value for the specim en of the m ixture of m ethanol and extracted water, determ ined from 3 replicate titrations, is 0.0028. The relative random uncertainty in A b, the titration value for the m ethanol blank, also determ ined from 3 replicate titrations, is 0.01. The relative uncertainty in v s, the v o lum e o f the specim en o f the mixture, determ ined from 15 determ inations of the volu m e o f the sy ringe filled to a particular graduation on the barrel, is 0.0001 (12). The relative uncertainty in v b, the volu m e of the m ethanol blank, is also 0.0001. These uncertainties in syringe volu m e are estim ates o f the relative standard deviation o f the mean and are, therefore, random. In use in the determ ination of m oisture content, h o w ever, they act as system atic (this treatm ent is sim ilar to Youden's (15) treatm ent o f random titration error in determ in ing the titer o f a v o lu m etric reagent); they have, co nsequently , been m ultiplied by 3 and treated as relative systematic uncertainties.
The relative random uncertainty in C, the standardization factor, determ ined from 3 replicate standardizations, is 0.0031. The standard deviation for the microbalance used to determ ine the mass o f water used in the standardizations is estim ated to be 2 pg (R. M. Schoonover, private com m unication). The resulting uncertainty in the mass o f water, considered to be system atic, is 5 pg. The im precision o f the balance used for determ in ing m %, the mass o f the grain sam ple, corresponds to an uncertainty in mg o f 0.000006 and can, therefore, be neglected . H ow ever, if the den sity o f the grain w ere uncertain by ± 0 .1 g /c c , the buoyancy correction ( 1 1 ) w o u ld be uncertain by approxim ately ± 0 .0 0 0 1 m e; therefore a relative system atic uncertainty o f ± 0 .0 0 0 1 w ill be attributed to w g. The relative uncertainty in the calculated value o f Z is ±0.0005 (14) and is treated here as system atic.
The uncertainty in p is that due to the uncertainty in the m easurem ent o f the tem perature. Because the change in p w ith tem perature is about —0.0002 g /c c per °C, the tem perature is easily m easured suffic ien tly w e ll to m ake the uncertainty in p n eg lig ib le .
It sh ou ld be possible to easily estim ate v 0 to ± 1 0 % relative, the dom inant uncertainty b ein g that in the d en sity o f the residue.
JO N E S & B RICK EN K A M P: J. A SSO C . OFF. A N A L . C H E M . (VO L. 64, N O . 6, 1981) 1 2 8 1
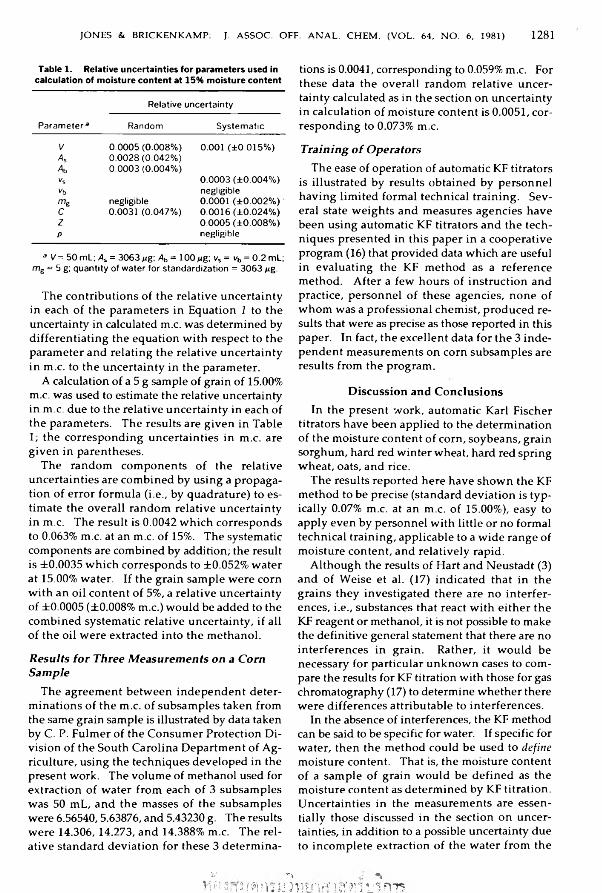
Table 1. Relative uncertainties for parameters used in calculation of moisture content at 15% moisture content
Parameter3Relative uncertainty
Random SystematicV 0.0005 (0.008%) 0.001 (±0.015%)As 0.0028 (0.042%)Ab 0.0003 (0.004%)Vs 0.0003 (±0.004%)Vb negligiblem g negligible 0.0001 (±0.002%)C 0.0031 (0.047%) 0.0016 (±0.024%)Z 0.0005 (±0.008%)P negligible
a 17= 50 mL; As = 3063M g : Ab = 100M g ; vs = vb = 0.2 mL; mg = 5 g; quantity of water for standardization = 3063 Mg.
The contributions o f the relative uncertainty in each o f the param eters in Equation 1 to the uncertainty in calculated m.c. was determ ined by differentia ting the equation w ith respect to the param eter and relating the relative uncertainty in m.c. to the uncertainty in the parameter.
A calculation o f a 5 g sam ple of grain o f 15.00% m.c. was used to estimate the relative uncertainty in m.c. due to the relative uncertainty in each of the parameters. The results are g iv en in Table 1 ; the correspon ding uncertainties in m.c. are g iv en in parentheses.
The random com p onents o f th e relative uncertainties are com b ined by usin g a propagation o f error form ula (i.e., by quadrature) to estim ate th e overall random relative uncertainty in m.c. The result is 0.0042 w h ich corresponds to 0.063% m.c. at an m.c. o f 15%. The system atic com ponents are com bined by addition; the result is ±0.0035 w h ich corresponds to ±0.052% water at 15.00% water. If th e grain sam ple w ere corn w ith an o il con ten t o f 5%, a relative uncertainty o f ±0.0005 (±0.008% m.c.) w o u ld be added to the com b ined system atic relative uncertainty, if all o f the o il w ere extracted in to the m ethanol.R e s u l t s f o r T h r e e M e a s u r e m e n t s o n a C o r n S a m p l e
The agreem ent b etw een in d ep en d en t determ inations o f the m.c. o f subsam ples taken from the same grain sam ple is illustrated by data taken by C. P. Fulm er o f the C onsum er Protection D iv isio n o f th e South Carolina D epartm ent o f A griculture, using the techniques develop ed in the present work. The volum e o f m ethanol used for extraction o f w ater from each o f 3 subsam ples w as 50 mL, and the m asses o f the subsam ples w ere 6.56540,5.63876, and 5.43230 g. The results w ere 14.306, 14.273, and 14.388% m.c. The relative standard d ev iation for these 3 determ ina
tions is 0.0041, corresponding to 0.059% m.c. For these data the overall random relative uncertainty calculated as in the section on uncertainty in calculation o f m oisture content is 0.0051, corresp on d in g to 0.073% m.c.T r a i n i n g o f O p e r a t o r s
The ease of operation of automatic KF titrators is illustrated by results obtained by p ersonnel h av in g lim ited form al technical training. Several state w e ig h ts and m easures agen cies have been u sin g autom atic KF titrators and the techn iques presented in th is paper in a cooperative program (16) that provided data w h ich are useful in evaluating the KF m ethod as a reference m ethod. A fter a few hours o f instruction and practice, person n el o f these agencies, n o n e of w h om was a professional chem ist, produced results that were as precise as those reported in this paper. In fact, the excellen t data for th e 3 in d ep en d en t m easurem ents on corn subsam ples are results from the program.
D iscu ssion and C o n clu sion sIn the present w ork, autom atic Karl Fischer
titrators have been applied to the determ ination o f the m oisture con ten t o f corn, soybeans, grain sorghum , hard red w inter wheat, hard red spring w h eat, oats, and rice.
The results reported here have sh ow n the KF m ethod to be precise (standard deviation is typica lly 0.07% m.c. at an m.c. o f 15.00%), easy to apply even by personnel w ith little or no formal technical training, applicable to a w id e range o f m oisture content, and relatively rapid.
A lthou gh the results o f Hart and N eustadt (3) and o f W eise et al. (17) indicated that in the grains th ey investigated there are n o interferences, i.e ., substances that react w ith eith er the KF reagent or m ethanol, it is not possible to make the defin itive general statem ent that there are no in terferences in grain. Rather, it w o u ld be necessary for particular u n k n ow n cases to com pare the results for KF titration w ith those for gas chromatography (17) to determ ine w h ether there w ere d ifferen ces attributable to interferences.
In the absence o f interferences, the KF m ethod can be said to be specific for water. If specific for water, th en the m ethod could be used to define m oisture content. That is, the m oisture content of a sam ple o f grain w o u ld be d efin ed as the m oisture content as determ ined by KF titration. U ncertain ties in the m easurem ents are essen tially those d iscussed in the section on uncertainties, in addition to a possible uncertainty due to in com p lete extraction o f the w ater from the
S' -X ^V! i i (i n i l n ? ì j } j)> i w ■ I a i çf >?] 7 u 7 r r n

1 2 8 2 JO N ES & BRICK EN K A M P: J. A SSO C. O FF. A N A L . C H E M . (VO L. 64, N O . 6, 1981)
grain. The results of experim ents conducted in the present work indicated that the extraction procedures rem oved effectively all of the w ater that could be extracted by m ethanol. The technique o f extraction o f water usin g a sealed vessel on a ball m ill is superior to other m ethods of w h ich the authors are aware.
The tim e required for the titration o f a specim en in the coulom etric titrator is approxim ately5-10 m in d ep en d in g on the am ount o f w ater in the specim en; the tim e required for the titration in the buret-type titrator can be less than in the coulom etric titrator. The tim e required for the titration o f the blank can be sign ifican tly less, particularly for the coulom etric titrator. The preparation of the sam ple inclu d ing m illin g and settlin g requires about 2 h, or about 45 m in if a centrifuge is used for the settlin g . W ith p lan ning, taking advantage o f the fact that specim ens can be stored in sealed test tubes, the num ber o f specim ens titrated per day can be optim ized . H ow ever, the am ount o f w ater that can be titrated in the coulom etric titrator used in the present work is lim ited, as noted above. The use of m ore than one reaction vessel in clu d in g g en erator and potentiom etric electrodes w o u ld in crease the num ber of titrations that could be m ade per day. The tim e required for sam ple preparation and titration is not considered to be restrictive on the use o f the KF m ethod as the prim ary reference m ethod.
The disadvantages o f oven-drying m ethods as primary reference methods for the determ ination of the m oisture content o f grain are w e ll know n (1 ,3 ,18 ,19); they include the fact that they are not specific for water and that the results are affected by vaporization o f substances other than water and by chem ical reactions. As noted earlier, a satisfactory oven-drying m ethod has not been d ev elop ed for the determ ination o f m oisture in soybeans (5, 17). Proposed primary reference m ethods in vo lv in g vacuum desiccation over phosphorus p en toxide (2 0 ) at m oderate tem peratures are s low and it is uncertain w h eth er equilibrium is attained. Gas chrom atography is an excellen t m ethod for the determ ination of m oisture; h ow ever, at present, th is m ethod is at a practical disadvantage com pared w ith automatic KF titration because o f the h igh er cost of the gas chrom atographic equ ipm ent and the requisite sk ill o f operators.
The application of automatic KF titrators to the determ ination o f the m oisture content o f grain by u sin g the techn iques described in th is paper has overcom e disadvantages attributed to the KF m ethod and has dem onstrated its superiority
over other m ethods used as, or proposed as, primary reference m ethods. T herefore, it is proposed that the Karl Fischer m ethod as applied in th is paper be designated the primary reference m ethod for the determ ination o f m oisture in grain.
A ck n ow led g m en tsThe authors are grateful for h elp fu l d iscus
sions w ith J. K. Taylor and R. M. Schoonover; and for the contributions o f R. J. Sm ith, form erly of Corn Products, Inc., w h o m ade a major contribution by su ggestin g the use o f th e M ixer /M ill, C. P. Fulm er, of the Consum er Protection D iv ision o f the South Carolina D epartm ent o f A griculture, personnel o f state w eigh ts and measures agencies w h o contributed data used in the ev a luation o f autom atic KF titration, and P auline H. G urew itz w h o typed the m anuscript. The first author is especially grateful for the inspiration and su ggestion s o f V. B. Jones.
References(1) Fischer, K. (1935) A n g e w . C h e m . 48, 394-396(2) Fosnot, R. FI., & Haman, R. W. (1945) C e re a l C h e m .
22,41-49(3) Hart, ]. R., & Neustadt, M. H. (1957) C e r e a l C h e m .
34, 26-37(4) Hunt, W. H., & Pixton, S. W. (1974) in S to r a g e o f
C e re a l G r a in s a n d T h e ir P r o d u c ts , C. M. Christensen (Ed.), American Association of Cereal Chemists, St. Paul, MN, p. 35
(5) Hunt, W. H., & Pixton, S. W. (1974) in S to r a g e o f C e re a l G r a in s a n d T h e ir P r o d u c ts , C. M. Christensen (Ed.), American Association of Cereal Chemists, St. Paul, MN, pp. 29-30
(6) Hunt, W. H„ & Pixton, S. W. (1974) in S to r a g e o f C e re a l G r a in s a n d T h e ir P r o d u c ts , C . M. Christensen (Ed.), American Association of Cereal Chemists, St. Paul, MN, p. 29
(7) Foulk, C. W„ & Bawden, A. T. (1926) J. A m . C h e m . S o c . 48, 2045-2051
(8) Phillips, J. P. (1959) A u to m a t i c T i tr a to r s , Academic Press, New York, NY, Chapter II
(9) Szebelledy, L., & Somogyi, Z. (1938) A n a l . C h e m . 12, 285
(10) Meyer, A. S„ Jr, & Boyd, C. M. (1959) A n a l . C h e m . 31,215-219
(11) Schoonover, R. M„ & Jones, F. E. (1981) A n a l . C h e m . 53,900-902
(12) Jones, F. E. (1980) A n a l . C h e m . 52, 364(13) Wagenbreth, H., & Blanke, W. (1975) P T B M i t t . 81,
S .412-415(14) Jones, F. E„ & Brickenkamp, C. S. (1981) A n a l . -
C h e m . 53,362-363(15) Youden, W. J. (1969) in S ta t i s t i c a l T e c h n iq u e s f o r
C o lla b o r a tiv e T e s t s , AOAC, Arlington, VA, p. 2(16) Brickenkamp, C. S. (1980) C e r e a l F o o d s W o r ld 24,
57-60(17) Weise, E. L„ Burke, R. W., & Taylor, J. K. (1962) in

JO N E S & B RICK EN K A M P: J. A SSO C . O FF. A N A L . C H E M . (V O L. 64, N O . 6, 1981) 1 2 8 3
Humidity and Moisture, Vol. 4, A. Wexler (Editor- in-Chief), P. N. W inn (Ed.), Reinhold Publishing Corp., New York, NY, pp. 3-6
(18) H unt, W. H„ & Pixton, S. W. (1974) in Storage of Cereal Grains and Their Products, C. M. Christensen (Ed.), American Association of Cereal Chemists,
St. Paul, MN, pp. 1-54(19) Mitchell, ] . , Jr, & Smith, D. M. (1977) Aquametry,
2nd Ed., John Wiley and Sons, New York, NY, Part I, Chapter III
(20) Multon, J. L., & Martin, G. (1975) Bull. Anc. Eleves Ec. Fr. Meun. No. 269, Sept.-Oct., pp. 1-15
5 p f
c W o r l ^ s h o p
1 9 8 2 April 13 -1 5
N E W O R L E A N S , L O U IS IA N APlan now to attend. Contact
NICOLE F. HARDIN U.S. Food & Drug Administration
4298 Elysian Fields Ave New Orleans, LA 70122
(504/589-2471)
HERSHEL MORRIS Louisiana Dept of Agriculture
PO Box 16390-A, University Station Baton Rouge, LA 70893
(504/388-2755)
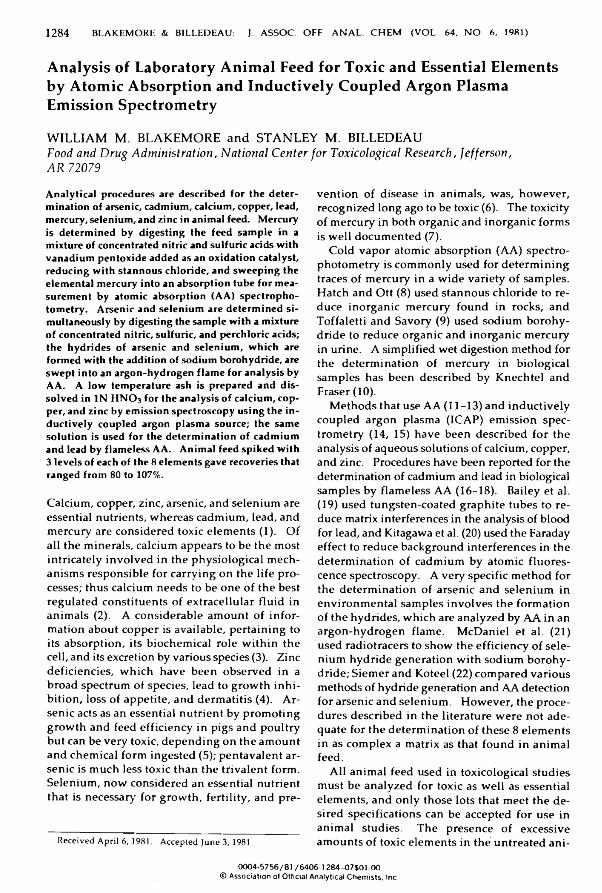
Analysis of Laboratory Animal Feed for Toxic and Essential Elements by Atomic Absorption and Inductively Coupled Argon Plasma Emission SpectrometryWILLIAM M. BLAKEMORE and STANLEY M. BILLEDEAUFood and D ru g A d m in is tra tio n , N a tio n a l C en ter fo r Toxicolog ical R esearch , Je fferson ,A R 72079
1 2 8 4 BLAKEM O RE & B1LLEDEAU: J. A SSO C. O FF. A N A L . C H E M . (VOL. 64, N O . 6, 1981)
Analytical procedures are described for the determination of arsenic, cadmium, calcium, copper, lead, mercury, selenium, and zinc in animal feed. Mercury is determined by digesting the feed sample in a mixture of concentrated nitric and sulfuric acids with vanadium pentoxide added as an oxidation catalyst, reducing with stannous chloride, and sweeping the elemental mercury into an absorption tube for measurement by atomic absorption (AA) spectrophotometry. Arsenic and selenium are determined simultaneously by digesting the sample with a mixture of concentrated nitric, sulfuric, and perchloric acids; the hydrides of arsenic and selenium, which are formed with the addition of sodium borohydride, are swept into an argon-hydrogen flame for analysis byAA. A low temperature ash is prepared and dissolved in IN H N O 3 for the analysis of calcium, copper, and zinc by emission spectroscopy using the inductively coupled argon plasma source; the same solution is used for the determination of cadmium and lead by flameless AA. Animal feed spiked with 3 levels of each of the 8 elements gave recoveries that ranged from 80 to 107%.
Calcium, copper, zinc, arsenic, and selen iu m are essential nutrients, w hereas cadm ium , lead, and mercury are considered toxic e lem en ts (1). Of all the m inerals, calcium appears to be the m ost intricately in vo lv ed in the p h ysio log ica l m echanism s responsib le for carrying on the life processes; thus calcium needs to be on e o f the best regulated constituents o f extracellular flu id in anim als (2). A considerable am ount o f inform ation about copper is available, pertain ing to its absorption, its b iochem ical role w ith in the cell, and its excretion by various species (3). Zinc deficien cies, w h ich have b een observed in a broad spectrum of species, lead to grow th in h ib ition , loss o f appetite, and derm atitis (4). Arsen ic acts as an essential nutrient by prom oting grow th and feed effic ien cy in pigs and poultry but can be very toxic, d ep en d in g on the am ount and chem ical form in gested (5); pen tavalent arsen ic is m uch less toxic than the trivalent form. Selenium , n ow considered an essential nutrient that is necessary for grow th, fertility , and pre-
Received April 6,1981. Accepted June 3, 1981.
ven tio n o f disease in anim als, w as, h ow ever, recognized lon g ago to be toxic (6 ). The toxicity of m ercury in both organic and inorganic form s is w e ll docum ented (7).
Cold vapor atom ic absorption (AA) spectrophotom etry is com m only used for determ in ing traces o f m ercury in a w id e variety o f sam ples. H atch and Ott (8 ) used stannous ch loride to reduce inorganic mercury found in rocks, and Toffaletti and Savory (9) used sodium b orohydride to reduce organic and inorganic m ercury in urine. A sim plified w et digestion m ethod for the determ ination o f m ercury in b iological sam ples has been described by K nechtel and Fraser (10).
M ethods that use AA (11-13) and in d u ctiv ely coupled argon plasma (ICAP) em ission sp ectrometry (14, 15) have been described for the analysis o f aqueous solutions o f calcium , copper, and zinc. Procedures have been reported for the determ ination o f cadmium and lead in biological sam ples by flam eless AA (16-18). Bailey et al. (19) used tungsten-coated graphite tubes to reduce matrix interferences in the analysis of blood for lead, and Kitagawa et al. (20) used the Faraday effect to reduce background interferences in the determ ination o f cadm ium by atom ic fluorescence spectroscopy. A very specific m ethod for the determ ination o f arsenic and selen iu m in environm ental sam ples in v o lv es the form ation of the hydrides, w h ich are analyzed by AA in an argon-hydrogen flam e. M cD aniel et al. (21) used radiotracers to sh ow the effic ien cy o f se le nium hydride generation w ith sodium borohydride; Siem er and K oteel (22) com pared various m ethods o f hydride generation and AA detection for arsenic and selen iu m . H ow ever, the procedures described in the literature w ere not adequate for the determ ination o f these 8 e lem en ts in as com plex a matrix as that found in anim al feed.
A ll anim al feed used in toxicological studies m ust be analyzed for toxic as w e ll as essential elem ents, and on ly those lots that m eet th e d esired specifications can be accepted for use in anim al studies. The presence o f excessive am ounts o f toxic elem ents in the untreated an i
0004-5756/81 / 6406-1284-07$01.00© Association of Official Analytical Chemists. Inc.
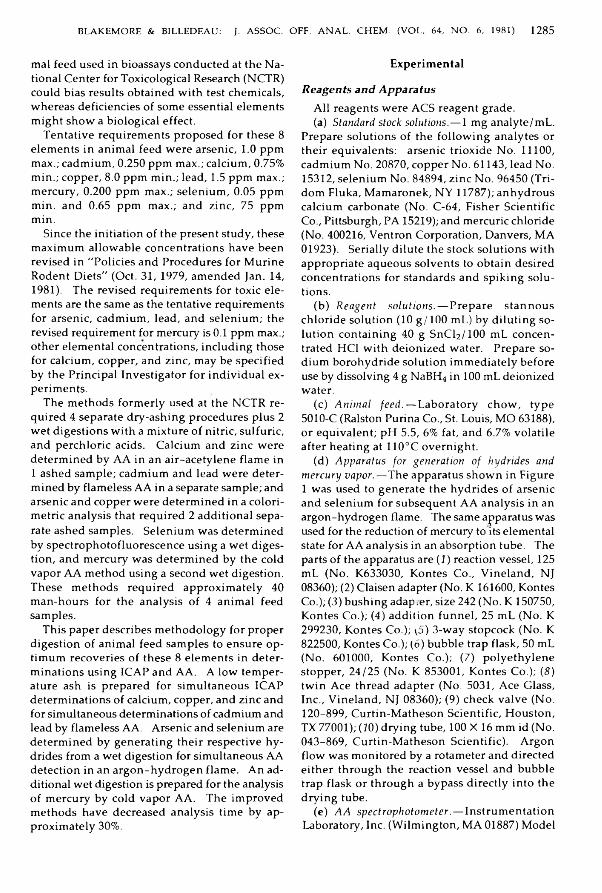
BLAKEM O RE & BILLEDEAU: J. A SSO C. OFF. A N A L . C H E M . (VO L. 64, N O . 6, 1981) 1 2 8 5
mal feed used in bioassays conducted at the N ational Center for Toxicological Research (NCTR) could bias results obtained w ith test chem icals, whereas deficiencies o f som e essential elem ents m igh t sh ow a biological effect.
T entative requirem ents proposed for these 8 elem en ts in anim al feed w ere arsenic, 1 .0 ppm max.; cadm ium , 0.250 ppm max.; calcium , 0.75% m in.; copper, 8.0 ppm m in.; lead, 1.5 ppm max.; mercury, 0.200 ppm max.; selen iu m , 0.05 ppm m in. and 0.65 ppm max.; and zin c, 75 ppm m in.
Since the initiation o f the present study, these m axim um allow able concentrations have been revised in “P olicies and Procedures for M urine R odent Diets" (Oct. 31, 1979, am ended Jan. 14, 1981). The revised requirem ents for toxic e le m ents are the same as the tentative requirements for arsenic, cadm ium , lead, and selen iu m ; the revised requirement for mercury is 0 .1 ppm max.; other elem ental concentrations, inclu d ing those for calcium , copper, and zinc, m ay be specified by the Principal Investigator for in d iv id u al experim ents.
The m ethods form erly used at the NCTR required 4 separate dry-ashing procedures p lu s 2 w et d igestion s w ith a m ixture o f nitric, sulfuric, and perchloric acids. Calcium and z in c w ere determ ined by AA in an air-acety len e flam e in 1 ashed sam ple; cadm ium and lead w ere determ ined by flam eless AA in a separate sample; and arsenic and copper w ere determ ined in a colorim etric analysis that required 2 addition al separate ashed sam ples. S elen ium w as determ ined by spectrophotofluorescence usin g a w et d igestion , and m ercury w as determ ined by the cold vapor AA m ethod using a second w et digestion. T hese m eth od s required approxim ately 40 m an-hours for the analysis o f 4 anim al feed sam ples.
This paper describes m eth od ology for proper d igestion o f anim al feed sam ples to ensure op tim um recoveries o f these 8 e lem en ts in determ inations using ICAP and AA. A low tem perature ash is prepared for sim ultaneous ICAP determ inations o f calcium , copper, and zinc and for sim ultaneous determ inations o f cadmium and lead by flam eless AA. A rsenic and selen iu m are determ ined by generating their respective h y drides from a w et digestion for sim ultaneous AA d etection in an argon -h yd rogen flam e. A n additional w et digestion is prepared for the analysis o f m ercury by co ld vapor AA. The im proved m ethods have decreased analysis tim e by approxim ately 30%.
E xperim entalR e a g e n t s a n d A p p a r a t u s
A ll reagents w ere ACS reagent grade.(a) Standard stock solutions.— 1 m g analyte/m L.
Prepare so lu tion s o f the fo llo w in g analytes or their equivalents: arsenic trioxide N o . 11100, cadm ium N o. 20870, copper N o. 61143, lead No. 15312, selen iu m N o. 84894, z in c N o. 96450 (Tri- dom Fluka, M am aronek, NY 11787); anhydrous calcium carbonate (N o. C-64, Fisher Scientific Co., Pittsburgh, PA 15219); and mercuric chloride (No. 400216, Ventron Corporation, Danvers, MA 01923). Serially d ilu te the stock so lu tion s w ith appropriate aqueous so lven ts to obtain desired concentrations for standards and sp ik in g so lu tions.
(b) Reagent solutions .— Prepare sta n n ou s chloride solu tion ( 1 0 g / 1 0 0 m l) by d ilu tin g so lu tion conta in ing 40 g SnC l2/10 0 mL con cen trated HC1 w ith d eio n ized water. Prepare sodium borohydride so lu tion im m ediately before use by dissolving 4 g NaBH4 in 100 mL deionized water.
(c) A nim al feed .— Laboratory ch o w , type 5010-C (Ralston Purina Co., St. Louis, MO 63188), or equivalent; pH 5.5, 6 % fat, and 6.7% vola tile after heating at 110°C overn igh t.
(d) Apparatus for generation o f hydrides and mercury vapor.—The apparatus sh ow n in Figure 1 was used to generate the hydrides o f arsenic and selen iu m for subsequent AA analysis in an argon-hydrogen flame. The same apparatus was used for the reduction of mercury to its elem ental state for AA analysis in an absorption tube. The parts o f the apparatus are (1) reaction vessel, 125 mL (N o. K633030, K ontes Co., V in eland , NJ 08360); (2) Claisen adapter (No. K 161600, Kontes Co.); (3) bushing adapter, size 242 (N o. K 150750, K ontes Co.); (4) addition fu n n el, 25 mL (N o. K 299230, K ontes Co.); \5 ) 3-w ay stopcock (N o. K 822500, K ontes Co.); (6 ) bubble trap flask, 50 mL (N o. 601000, K ontes Co.); (7) p o ly eth y len e stopper, 24 /2 5 (N o. K 853001, K ontes Co.); (8 ) tw in Ace thread adapter (N o. 5031, Ace Glass, Inc., V ineland, NJ 08360); (9) check va lve (N o. 120-899, Curtin-M atheson Scientific , H ouston , TX 77001); (10) drying tube, 100 X 16 mm id (No. 043-869, Curtin-M atheson Scientific). Argon flow was m onitored by a rotameter and directed either through the reaction v esse l and bubble trap flask or through a bypass d irectly in to the d rying tube.
(e) A A spectrophotom eter.—Instru m entation Laboratory, Inc. (W ilm ington, MA 01887) M odel

1 2 8 6 BLAKEM ORE & BILLEDEAU: J. A SSO C. OFF. A N A L . C H E M . (VOL. 64, N O . 6, 1981)
Figure 1. Diagram of apparatus for generation of hydrides and mercury vapor: (1) reaction vessel, (2 ) Claisen adapter, (3) bushing adapter, (4) addition funnel, (5) 3-way stopcock, (6 ) bubble trap flask, (7) polyethylene stopper, (8) twin Ace thread adapter, (9) check valve; (10) drying tube 16 mm id X 100 mm
long.
751, or equivalent, equipped w ith 2 double beam channels usin g tw o 330 mm Ebert m onochromators, deuterium -arc background correction, M odel 1L555 controlled-tem perature furnace atom izer (Instrum entation Laboratory, Inc.), M odel 1L254 autom atic sam pler (Instrum entation Laboratory, Inc.), and M odel 95-8290 dualpen, flat-bed recorder, or equivalent (H oneyw ell, Inc., Fort W ashington, PA 19034).
(f) Absorption tube.— 100 X 25 mm id, w ith quartz w in d ow s.
(g) /CAP emission spectrometer.— Mark III, or equivalent (Jarrell Ash Div., Fisher Scientific Co., W altham , M A 02154), equ ipped w ith D igital Equipm ent Corp. (DEC) (Marlboro, MA 01752) central processing un it P D P -11/34, 124K MOS m em ory, dual RL01 cartridge disks (5.2 m egaw ord), and Jarrell A sh Mark III Sail software.
(h) Low temperature asher.— M odel PM 248, or equivalent (D ionex Corp., Hayward, CA 94544), eq u ipped w ith a program controller for autom atic operation.D e t e r m i n a t i o n o f C a l c i u m , C o p p e r , a n d Z i n c
A ccurately w e ig h 1 g sam ple into 60 mm d iameter petri dish, place dish in reaction chamber
o f low temperature asher, and set program for 24 h at 50 watts radio frequency p ow er w ith gas flow s o f 80 m L /m in for oxygen and 2 0 m L /m in for Freon 14 (CF4). W hen degradation is com p lete , d isso lve residue in 10 mL IN H N O 3 w ith g en tle heatin g, transfer to 25 mL volum etric flask, and dilute to volum e w ith deionized water. Standardize ICAP instrum ent w ith aqueous standard conta in ing 2 0 0 ppm calcium , 1 ppm copper, and 2 ppm zinc. Adjust acid con cen tration o f standard to that o f d igested feed sam p le, and use reagent blank for zero concentrations. Aspirate sam ple and read concentrations of calcium , copper, and zinc directly, after ap p ly in g a d ilu tion factor of 25.D e t e r m i n a t i o n o f C a d m i u m a n d L e a d
U se so lu tion s rem aining from determ ination of calcium , copper, and zinc for sim ultaneous determ ination of cadmium and lead by flam eless AA spectrophotom etry w ith furnace atom izer and autosam pler accessories. Aspirate sam ple so lu tion in to graphite tube 20 s at 150°C (aspiration rate 1 q L /s), dry additional 10 s at 150°C, char 20 s at 300°C, and atom ize 10 s at 2250°C. Integrate peak h eigh ts for 1 s. D eterm ine lead on channel A at X = 283.3 nm , slit w idth 320 qm, lam p current 5 mA, w ith deuterium -arc background correction; determ ine cadm ium on ch an n el B at X = 228.8 nm , slit w id th 320 qm, lam p current 7 mA, w ith deuterium -arc background correction. D eterm ine aqueous standards and reagent blank, and enter valu es into microcomputer so that concentrations of samples are sh ow n on d igital readout for each determ ination.D e t e r m i n a t i o n o f A r s e n i c a n d S e l e n i u m
Accurately w eigh 2 g animal feed into 100 mL micro Kjeldahl flask and add 12 mL concentrated H N O 3 . After foam ing subsides, add 4 mL concentrated H 2SO4 and 2 mL HCIO4 (70%), and let stand at am bient tem perature until reaction ceases. Use micro Kjeldahl digestion unit to heat m ixture gen tly in initial stages to avoid any loss, and slo w ly increase heat to v igorous boil. Add sm all am ounts o f concentrated H N O 3 at first signs o f charring. (The solution w ill turn yellow and then becom e clear.) Remove flask and swirl contents so they contact bulb area and lower neck of flask. (The y e llo w color may reappear.) C ontinue heatin g until contents are clear, and w h ite fum es appear. (In som e instances the solution may rem ain pale yellow ; how ever, do not continue heating after the w h ite fum es of HCIO4 appear.) Remove flask, add 2 mL 30% H 2C>2, and

BLAKEM O RE & BILLEDEAU: J. A SSO C. O FF. A N A L . C H E M . (V O L. 64, N O . 6 , 1981) 1 2 8 7
sw irl contents; after all action ceases, contin ue h eatin g u n til con ten ts are b o ilin g briskly and w h ite fum es appear. Repeat procedure w ith 2 additional 2 mL portions o f 30% H 2O 2 to ensure that all traces of H N O 3 are rem oved. Cool flask and carefully transfer contents to h yd rid e-gen eration apparatus (Figure 1), w ashing w ith 45 mL 4N HC1. Turn 3-w ay va lve to let argon at flow rate o f 100 m L /m in pass through so lu tion , bubb le trap flask, and drying tube filled w ith an h ydrous CaCl2 (4-m esh), and into hydrogen-argon flam e in AA spectrophotom eter. Add 10 mL 4% NaBH 4 so lu tion through 25 mL addition fu n n el to produce the respective hydrides and record absorptions. D eterm ine selen iu m on channel A at X = 196.0 nm , s lit w id th 320 n m, lam p current 8 m A, and deuterium -arc background correction. D eterm ine arsenic on channel B at X =193.7 nm , slit w id th 320 n m , lamp current 8 mA, w ith deuterium -arc background correction. Turn 3-w ay valve to d ivert argon flow around reaction flask so the sam ple solu tion can be drained and the flask rinsed for the next determ ination. D eterm ine concentrations by com paring peak h eights to those for know n am ounts of standards, and use reagent blank for zero concentrations. Adjust acid concentrations o f standards to make them identical to those o f d igested sam ples.D e t e r m i n a t i o n o f M e r c u r y
Accurately w e igh 2 g anim al feed into 100 mL micro Kjeldahl flask, and add 80-100 m g m ercury-free V2O 5, fo llow ed by 10 mL concentrated H N O 3 and 15 m l concentrated H 2SO4 . After foam ing has subsided, use micro Kjeldahl unit to heat gently in in itial stages; slow ly increase heat to v igorous boil. W hen uniform so lu tion is obtained, rem ove from heat and let cool. Transfer contents to reaction flask o f vapor-generation apparatus (Figure 1), u sin g d eio n ized w ater to w ash flask and d ilu te vo lu m e to 100 mL. Turn3-way valve to let argon at flow rate o f 100 m L /m in pass through solution, bubble trap flask, and d ry in g tube f i l le d w ith an h yd rou s M g(C1 0 4)2, and into absorption tube, w h ich is a lign ed w ith the ligh t path in the AA spectrophotom eter. A dd 10 mL 10% SnC l2 so lu tion from 25 mL addition fu n n el, and record absorption o f mercury vapor at X = 253.7 nm , slit w idth 320 n m , lam p current 4 mA, w ith no background correction. Turn 3-w ay va lve to divert argon flow around reaction flask so the sam ple solution can be drained and the flask rinsed for the next determ ination . D eterm ine concentrations by com paring peak h eig h ts to those for know n
am ounts o f standards, and use reagent blank for zero concentrations. Adjust acid concentrations o f standards to m ake them identical to those of d igested sam ples.R e c o v e r y S t u d i e s
(a) Cadmium, calcium, copper, lead, and zinc .— Triplicate 1 g sam ples o f anim al feed w ere fortified w ith 0.1, 0.2, and 0.3 ppm cadm ium ; 500, 1 0 0 0 , and 1500 ppm calcium; 2 .0 ,4 .0 , and 6 .0 ppm copper; 0.5,1.0 , and 1.5 ppm lead; and 10,20, and 30 ppm zinc. A so lu tion w as prepared in d eion ized water w ith the appropriate am ount of each elem en t in adm ixture so that the addition of 1 mL to the feed sam ple resulted in th e fortification o f each e lem en t at the lo w est level. Solution s for the 2 h igh er lev e ls w ere prepared in lik e m anner. The sam ples w ere air-dried at am bient conditions before ash ing and analyzing as described above.
(b) Arsenic and selenium .—Triplicate 2 g sam p les o f anim al feed w ere fortified w ith 0 .1 , 0 .2 , and 0.5 ppm of each elem en t by ad d in g the appropriate am ounts o f both chem icals for each concentration lev e l in a s in g le 1 mL portion o f deion ized water. The sam ples w ere air-dried at am bient conditions before digestion and analysis as described above.
(c) Mercuri/ .—Triplicate 2 g sam ples o f animal feed w ere fortified w ith 0.05, 0.1, and 0.2 ppm mercury by adding the appropriate am ount of chem ical in 1 mL deion ized water. The sam ples w ere air-dried at am bient con d ition s before d igestion and analysis as described above.
R esu lts and D iscu ssio nDigestion procedures must be carefully chosen
to prevent the loss o f vo la tile analytes and the form ation o f in so lu b le com plexes. In h igh - temperature ashing m ethods, calcium m ay form silicate com plexes that are insolub le in acids and require additional d igestion for va lid analyses. Losses o f cadm ium and lead m ay occur in som e matrices at tem peratures as lo w as 400°C , esp ecia lly w h en chlorides are present. For these reasons, a low-temperature ashing procedure was selected to d igest the sam ples o f anim al feed for the determ ination o f cadmium, calcium , copper, lead, and zinc.
The ICAP instrum ent w ith m ultip le-elem en t detection and a clean background spectrum is preferred w h en the concentration o f the analyte is w ith in its range of detection. Calcium, copper, and z in c in anim al feed w ere determ ined sim ultaneously by ICAP w ith good precision and specificity . Cadm ium and lead w ere fou n d in
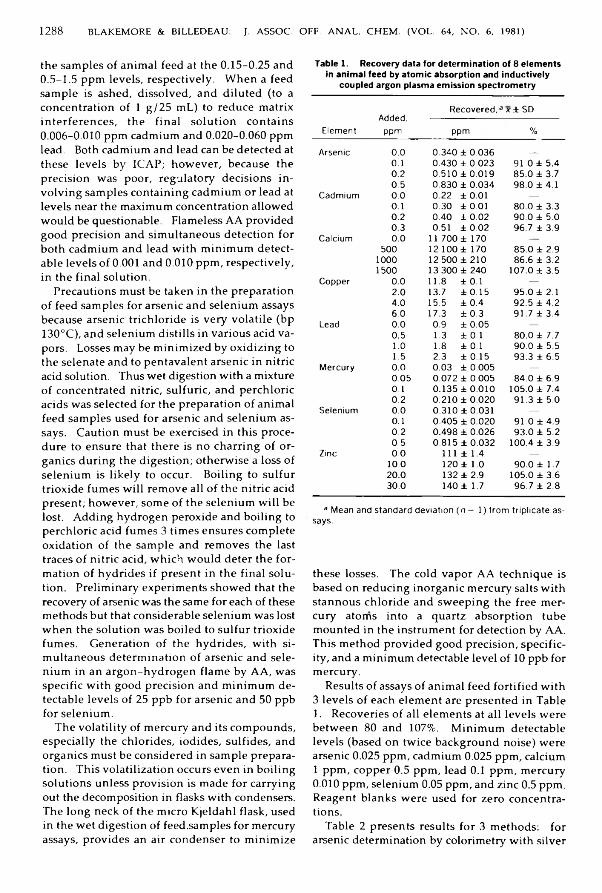
1 2 8 8 BLAKEM O RE & BILLEDEAU: J. A SSO C . OFF. A N A L . C H E M . (VO L. 64, N O . 6, 1981)
the sam ples o f anim al feed at the 0.15-0 .25 and 0.5-1 .5 ppm levels, respectively . W hen a feed sam ple is ashed, d isso lved , and d ilu ted (to a concentration o f 1 g /2 5 mL) to reduce matrix in terferen ces , th e fin a l so lu tio n con ta in s 0.006-0.010 ppm cadmium and 0.020-0.060 ppm lead. Both cadm ium and lead can be detected at these lev els by ICAP; how ever, because the precision was poor, regulatory d ecisions in v o lv in g sam ples conta in ing cadm ium or lead at lev els near the m aximum concentration allow ed w ou ld be questionable. Flam eless AA provided good precision and sim ultaneous detection for both cadm ium and lead w ith m inim um detectable lev els of 0 .0 0 1 and 0 .0 1 0 ppm , respectively , in the final solution .
Precautions m ust be taken in the preparation of feed sam ples for arsenic and selen iu m assays because arsenic trichloride is very vo la tile (bp 130°C), and selen iu m d istills in various acid vapors. Losses may be m in im ized by ox id iz in g to the selenate and to pentavalent arsenic in nitric acid solution. Thus w et digestion w ith a mixture of concentrated nitric, sulfuric, and perchloric acids w as selected for the preparation o f anim al feed sam ples used for arsenic and selen iu m assays. Caution m ust be exercised in th is procedure to ensure that there is no charring o f organics during the digestion; otherw ise a loss of selen iu m is lik ely to occur. B oiling to sulfur trioxide fum es w ill rem ove all o f the nitric acid present; how ever, som e o f the selen iu m w ill be lost. A dding hydrogen peroxide and b oiling to perchloric acid fum es 3 tim es ensures com plete oxidation o f the sam ple and rem oves the last traces o f nitric acid, w h ich w ou ld deter the form ation o f hydrides if present in the final so lu tion. Prelim inary experim ents show ed that the recovery of arsenic was the same for each of these m ethods but that considerable selen ium was lost w h en the so lu tion w as b oiled to sulfur trioxide fum es. G eneration o f the hydrides, w ith sim ultaneous determ ination o f arsenic and se le nium in an argon -h yd rogen flam e by AA, w as specific w ith good precision and m inim um d etectable lev els o f 25 ppb for arsenic and 50 ppb for selen iu m .
The vola tility of mercury and its com pounds, especially the ch lorides, iod ides, su lfides, and organics must be considered in sam ple preparation. This volatilization occurs ev en in b o ilin g so lu tion s u n less provision is m ade for carrying out the decom position in flasks w ith condensers. The lon g neck o f the micro Kjeldahl flask, used in the w et d igestion of feed.sam ples for mercury assays, provides an air condenser to m in im ize
Table 1. Recovery data for determination of 8 elements In animal feed by atomic absorption and inductively
coupled argon plasma emission spectrometry
ElementAdded,ppm
Recovered,3 x±SDppm %
Arsenic 0.0 0.340 ± 0.036 _0.1 0.430 ± 0.023 91.0 ± 5.40.2 0.510 ± 0.019 85.0 ±3.70.5 0.830 ± 0.034 98.0 ± 4.1Cadmium 0.0 0.22 ±0.01 —0.1 0.30 ±0.01 80.0 ± 3.30.2 0.40 ±0.02 90.0 ± 5.00.3 0.51 ±0.02 96.7 ± 3.9
Calcium 0.0 11 700 ± 170 —500 12 100 ± 170 85.0 ± 2.9
1000 12 500 ± 210 86.6 ± 3.21500 13 300 ±240 107.0 ±3.5
Copper 0.0 11.8 ±0.1 —2.0 13.7 ±0.15 95.0 ± 2.14.0 15.5 ±0.4 92.5 ±4.26.0 17.3 ±0.3 91.7 ± 3.4
Lead 0.0 0.9 ±0.05 —0.5 1.3 ±0.1 80.0 ± 7.71.0 1.8 ±0.1 90.0 ± 5.51.5 2.3 ±0.15 93.3 ± 6.5Mercury 0.0 0.03 ± 0.005 —0.05 0.072 ± 0.005 84.0 ± 6.90.1 0.135 ± 0.010 105.0 ± 7.40.2 0.210 ± 0.020 91.3 ± 5.0Selenium 0.0 0.310 ± 0.031 —0.1 0.405 ± 0.020 91.0 ±4.90.2 0.498 ± 0.026 93.0 ± 5.20.5 0.815 ± 0.032 100.4 ± 3.9
Zinc 0.0 111 ± 1.4 —10.0 120 ± 1.0 90.0 ± 1.720.0 132 ± 2.9 105.0 ± 3.630.0 140 ± 1.7 96.7 ± 2.8
3 Mean and standard deviation (n - 1) from triplicate assays.
these losses. The cold vapor AA techn ique is based on reducing inorganic mercury salts w ith stannous ch loride and sw eep in g the free m ercury atom s in to a quartz absorption tube m ounted in the instrum ent for detection by AA. This m ethod provided good precision, sp ecificity, and a m inim um detectable level o f 1 0 ppb for mercury.
Results o f assays o f anim al feed fortified w ith 3 levels o f each elem en t are presented in Table 1. Recoveries o f all e lem en ts at all lev e ls w ere b etw een 80 and 107%. M inim um detectable levels (based on tw ice background noise) w ere arsenic 0.025 ppm , cadm ium 0.025 ppm , calcium 1 ppm , copper 0.5 ppm , lead 0.1 ppm , mercury 0.010 ppm, selenium 0.05 ppm, and zinc 0.5 ppm. Reagent blanks w ere used for zero concentrations.
Table 2 presents results for 3 m ethods: for arsenic determ ination by colorimetry w ith silver
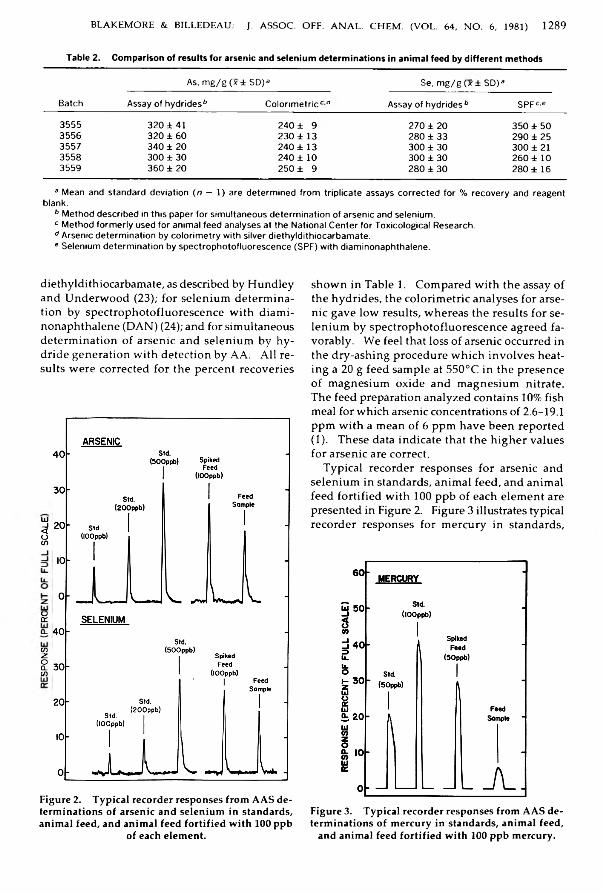
BLAKEM O RE & BILLEDEAU: J. A SSO C. OFF. A N A L . C H E M . (V O L. 64, N O . 6, 1981) 1 2 8 9
Table 2. Comparison of results for arsenic and selenium determinations in animal feed by different methods
BatchAs, mg/g (x± SD)a Se, mg/g (x± SD)a
Assay of hydrides b Colorimetriccd Assay of hydrides 6 SPFc*e3555 320 ± 41 240 ± 9 270 ± 20 350 ± 503556 320 ± 60 230 ± 13 280 ± 33 290 ± 253557 340 ± 20 240 ± 13 300 ± 30 300 ± 213558 300 ± 30 240 ± 10 300 ± 30 260 ± 103559 360 ± 20 250 ± 9 280 ± 30 280 ± 16
a Mean and standard deviation ( n — 1) are determined from triplicate assays corrected for % recovery and reagent blank.b Method described in this paper for simultaneous determination of arsenic and selenium. c Method formerly used for animal feed analyses at the National Center for Toxicological Research. d Arsenic determination by colorimetry with silver diethyldithiocarbamate. e Selenium determination by spectrophotofluorescence (SPF) with diaminonaphthalene.
diethyldithiocarbamate, as described by H undley and U n d erw ood (23); for selen iu m determ ination by spectrophotofluorescence w ith d iam inonaphthalene (DAN) (24); and for sim ultaneous determ ination o f arsenic and selen iu m by h ydride generation w ith d etection by AA. A ll results w ere corrected for the percent recoveries
tu_i<otn
oo:
tnzo0.tn
Figure 2. Typical recorder responses from AAS determinations of arsenic and selenium in standards, animal feed, and animal feed fortified with 1 0 0 ppb
of each element.
sh ow n in Table 1. Com pared w ith the assay o f the hydrides, the colorim etric analyses for arsen ic gave lo w results, w hereas the results for selen iu m by spectrophotofluorescence agreed favorably. We feel that loss o f arsenic occurred in the dry-ashing procedure w h ich in v o lv es heatin g a 20 g feed sam ple at 550°C in the presence o f m agnesium oxide and m agnesium nitrate. The feed preparation analyzed contains 10% fish meal for w h ich arsenic concentrations of 2.6-19.1 ppm w ith a m ean o f 6 ppm have b een reported (1). These data indicate that the h igh er values for arsenic are correct.
Typical recorder responses for arsenic and selen iu m in standards, anim al feed , and anim al feed fortified w ith 1 0 0 ppb o f each e lem en t are presented in Figure 2. Figure 3 illustrates typical recorder responses for m ercury in standards,
Figure 3. Typical recorder responses from AAS determinations of mercury in standards, animal feed,
and animal feed fortified with 10 0 ppb mercury.
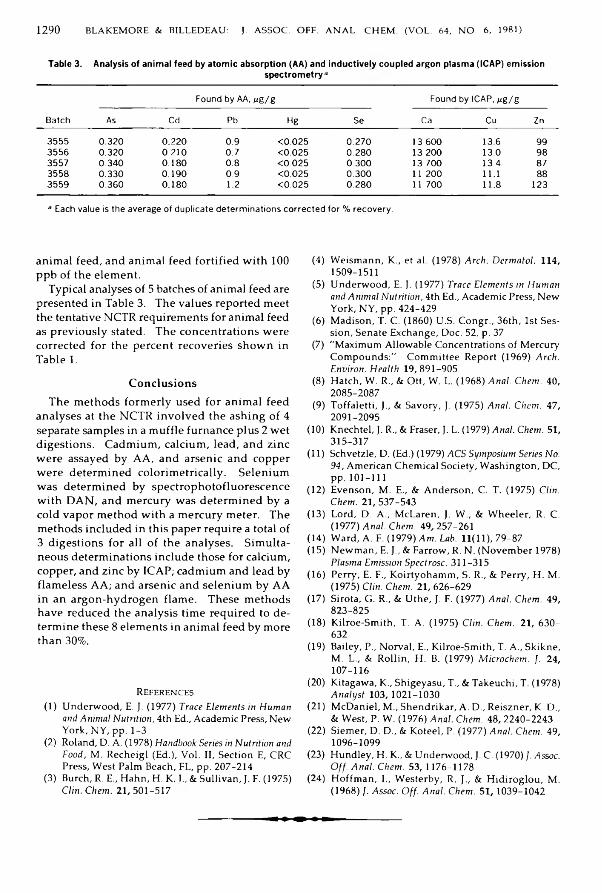
1 2 9 0 BLAKEM O RE & BILLEDEAU: J. A SSO C. OFF. A N A L . C H E M . (VO L. 64, N O . 6, 1981)
Table 3. Analysis of animal feed by atomic absorption (AA) and inductively coupled argon plasma (ICAP) emissionspectrometry3
BatchFound by AA,jtg/g Found by ICAP, jrg/g
As Cd Pb Hg Se Ca Cu Zn3555 0.320 0.220 0.9 <0.025 0.270 13 600 13.6 993556 0.320 0.210 0.7 <0.025 0.280 13 200 13.0 983557 0.340 0.180 0.8 <0.025 0.300 13 700 13.4 873558 0.330 0.190 0.9 <0.025 0.300 11 200 11.1 883559 0.360 0.180 1.2 <0.025 0.280 11 700 11.8 1233 Each value is the average of duplicate determinations corrected for % recovery.
anim al feed , and anim al feed fortified w ith 1 0 0 ppb of the elem ent.
Typical analyses of 5 batches of animal feed are presented in Table 3. The values reported m eet the tentative NCTR requirements for animal feed as previously stated. The concentrations w ere corrected for the percent recoveries sh ow n in Table 1.
C on clu sion sThe m ethods form erly used for anim al feed
analyses at the NCTR in vo lved the ash ing o f 4 separate sam ples in a m uffle furnance plus 2 w et digestion s. Cadm ium , calcium , lead, and zinc w ere assayed by AA, and arsenic and copper w ere determ ined colorim etrically. Selen ium w as determ ined by spectrophotofluorescence w ith D A N , and m ercury was d eterm ined by a cold vapor m ethod w ith a m ercury meter. The m ethods included in this paper require a total of 3 d igestion s for all o f the analyses. Sim ultaneous determ inations include those for calcium , copper, and zinc by ICAP; cadm ium and lead by flam eless AA; and arsenic and selen iu m by AA in an argon-hydrogen flam e. T hese m ethods have reduced the analysis tim e required to d eterm ine these 8 elem ents in anim al feed by more than 30%.
References(1) Underwood, E. J. (1977) Trace Elements in Human
and Animal Nutrition, 4th Ed., Academic Press, New York, NY, pp. 1-3
(2) Roland, D. A. (1978) Handbook Series in Nutrition and Food, M. Recheigl (Ed.), Vol. II, Section E, CRC Press, West Palm Beach, FL, pp. 207-214
(3) Burch, R. E., Hahn, H. K. T„ & Sullivan, J. F. (1975) Clin. Chem. 21,501-517
(4) Weismann, K., et al. (1978) Arch. Dermatol. 114, 1509-1511
(5) Underwood, E. J. (1977) Trace Elements in Human and Animal Nutrition, 4th Ed., Academic Press, New York, NY, pp. 424-429
(6 ) Madison, T. C. (1860) U.S. Congr., 36th, 1st Session, Senate Exchange, Doc. 52, p. 37
(7) "Maximum Allowable Concentrations of Mercury Compounds:" Committee Report (1969) Arch. Environ. Health 19, 891-905
(8 ) Hatch, W. R„ & Ott, W. L. (1968) Anal. Chem. 40, 2085-2087
(9) Toffaletti, J„ & Savory, J. (1975) Anal. Chem. 47, 2091-2095
(10) Knechtel, J. R„ & Fraser, J. L. (1979) Anal. Chem. 51, 315-317
(11) Schvetzle, D. (Ed.) (1979) ACS Symposium Series No. 94, American Chemical Society, Washington, DC,p p .1 0 1 -1 1 1
(12) Evenson, M. E., & Anderson, C. T. (1975) Clin. Chem. 21, 537-543
(13) Lord, D. A., McLaren, J. W„ & Wheeler, R. C. (1977) Anal. Chem. 49, 257-261
(14) Ward, A. F. (1979) Am. Lab. 11(11), 79-87(15) Newman, E. J., & Farrow, R. N. (November 1978)
Plasma Emission Spectrosc. 311-315(16) Perry, E. F., Koirtyohamm, S. R., & Perry, H. M.
(1975) Clin. Chem. 21, 626-629(17) Sirota, G. R., & Uthe, J. F. (1977) Anal. Chem. 49,
823-825(18) Kilroe-Smith, T. A. (1975) Clin. Chem. 21, 630-
632(19) Bailey, P„ Norval, E„ Kilroe-Smith, T. A., Skikne,
M. L., & Rollin, H. B. (1979) Microchcm. J. 24, 107-116
(20) Kitagawa, K., Shigeyasu, T., & Takeuchi, T. (1978) Analyst 103, 1021-1030
(21) McDaniel, M., Shendrikar, A. D., Reiszner, K. D„ & West, P. W. (1976) Anal. Chem. 48, 2240-2243
(22) Siemer, D. D„ & Koteel, P. (1977) Anal. Chem. 49, 1096-1099
(23) Hundley, H. K., & Underwood, J. C. (1970) /. Assoc. Off. Anal. Chem. 53,1176-1178
(24) Hoffman, L, Westerby, R. J., & Hidiroglou, M. (1968) /. Assoc. Off. Anal. Chem. 51,1039-1042
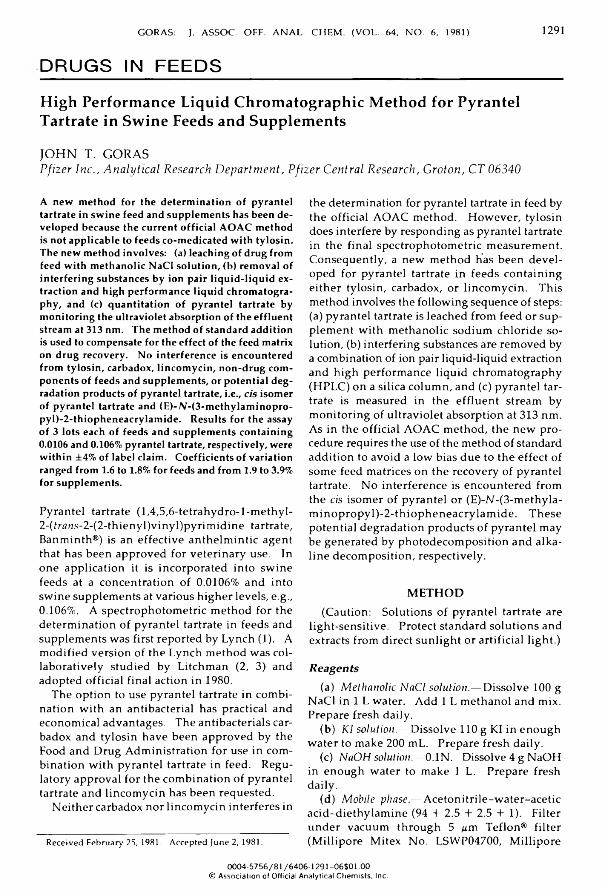
G O RAS: J. A SSO C. O FF. A N A L. C H E M . (VO L. 64, N O . 6, 1981) 12 9 1
D R U G S IN F E E D S
High Performance Liquid Chromatographic Method for Pyrantel Tartrate in Swine Feeds and SupplementsJOHN T. GORASP fize r In c ., A n a ly tic a l R esearch D e p a r tm e n t, P fize r C en tra l R esearch , G ro ton , C T 06340
A new method for the determination of pyrantel tartrate in swine feed and supplements has been developed because the current official AOAC method is not applicable to feeds co-medicated with tylosin. The new method involves: (a) leaching of drug from feed with methanolic NaCl solution, (b) removal of interfering substances by ion pair liquid-liquid extraction and high performance liquid chromatography, and (c) quantitation of pyrantel tartrate by monitoring the ultraviolet absorption of the effluent stream at 313 nm. The method of standard addition is used to compensate for the effect of the feed matrix on drug recovery. No interference is encountered from tylosin, carbadox, lincomycin, non-drug components of feeds and supplements, or potential degradation products of pyrantel tartrate, i.e., cis isomer of pyrantel tartrate and (E)-N-(3-methylaminopro- pyl)-2-thiopheneacrylamide. Results for the assay of 3 lots each of feeds and supplements containing0.0106 and 0.106% pyrantel tartrate, respectively, were within ±4% of label claim. Coefficients of variation ranged from 1.6 to 1.8% for feeds and from 1.9 to 3.9% for supplements.
Pyrantel tartrate (1 ,4,5 ,6-tetrahydro-l-m ethyl- 2-(frfltts-2-(2-th ienyl)vinyl)pyrim idine tartrate, Banminth®) is an effective anthelm in tic agent that has b een approved for veterinary use. In on e application it is incorporated into sw in e feeds at a concentration o f 0.0106% and into sw in e supplem ents at various h igher levels, e.g., 0.106%. A spectrophotom etric m ethod for the determ ination o f pyrantel tartrate in feeds and supplem ents was first reported by Lynch (1). A m odified version of the Lynch m ethod w as col- laboratively studied by Litchm an (2, 3) and adopted official final action in 1980.
The op tion to use pyrantel tartrate in com bination w ith an antibacterial has practical and econom ical advantages. The antibacterials carbadox and tylosin have been approved by the Food and Drug A dm inistration for use in com bination w ith pyrantel tartrate in feed. R egulatory approval for the com bination o f pyrantel tartrate and lincom ycin has b een requested.
N either carbadox nor lincom ycin interferes in
Received February 25,1981. Accepted June 2, 1981.
the determ ination for pyrantel tartrate in feed by the official AOAC m ethod. H ow ever, ty losin does interfere by responding as pyrantel tartrate in the final spectrophotom etric m easurem ent. C onsequently, a n ew m ethod has been d ev e loped for pyrantel tartrate in feeds conta in ing either ty losin , carbadox, or lincom ycin . This m ethod involves the fo llow ing sequence of steps:(a) pyrantel tartrate is leached from feed or supp lem en t w ith m ethanolic sodium ch lorid e so lution, (b) interfering substances are rem oved by a combination of ion pair liquid-liquid extraction and h igh perform ance liquid chrom atography (HPLC) on a silica colum n, and (c) pyrantel tartrate is m easured in the e fflu en t stream by m onitoring o f u ltraviolet absorption at 313 nm . As in the official AOAC m ethod, the n ew procedure requires the use of the m ethod of standard addition to avoid a low bias due to th e effect of som e feed matrices on the recovery of pyrantel tartrate. N o interference is encountered from the cis isom er o f pyrantel or (E)-N-(3-m ethyla- m in op ro p y l)-2 -th io p h en eacry lam id e . T h ese potential degradation products o f pyrantel may be generated by p hotod ecom position and alkalin e decom position , respectively .
M ETH O D(Caution: Solutions o f pyrantel tartrate are
ligh t-sen sitiv e. Protect standard so lu tion s and extracts from direct su n ligh t or artificial light.)R e a g e n t s
(a) M ethanolic NaCI solution.— D isso lve 100 g NaCl in 1 L water. A dd 1 L m ethanol and mix. Prepare fresh daily.(b) KI solution.— D isso lve 110 g KI in en o u gh w ater to make 200 mL. Prepare fresh daily.
(c) NaOH solution.— 0.1N. D issolve 4 g NaOH in en ou gh w ater to make 1 L. Prepare fresh daily.(d) Mobile phase.— A ceton itrile-w ater-acetic acid -d ieth y lam in e (94 + 2.5 + 2.5 + 1). Filter under vacuum through 5 u m Teflon® filter (M illipore M itex N o. LSWP04700, M illipore
0004-5756/81 /6406-1291-06$01.00 © Association of Official Analytical Chemists, Inc.

12 92 GORAS: J. ASSOC. OFF. ANAL. CHEM . (VOL. 64, N O . 6, 1981)
Corp., Bedford, M A 01730). Degas by stirring 10 m in under vacuum. Prepare fresh daily .
(e) P y ra n te l ta r tra te s ta n d a rd so lu tio n s .— Prepare fresh daily using pyrantel tartrate reference standard (available from P fizer, Inc ., Lee's Sum m it, M O 64063). Use an ultrasonic bath to hasten dissolution. Standard solution A for 0.0106% pyrantel tartrate feeds: D issolve 21.2 mg reference standard in enough methanolic N aC l solution to make 100.0 m L. Standard solution B for 0.106% pyrantel tartrate supplements: D issolve 26.5 mg reference standard in enough methanolic N aC l solution to make 25.0 m L.
A p p a r a t u s(a) H ig h p e r fo r m a n c e liq u id c h r o m a to g r a p h .—
Model 98750, 3000 psi pump, and Model 440 spectrophotometric detector (Waters Associates, M ilfo rd , M A 01757), or equivalent, operated at flow rate of 1.6 m L/m in and detector wavelength at 313 nm, 0.2 AU FS. Model 385 recorder (Linear Instrum ents Corp ., Irv in e , C A 92714), or equivalent, operated at 5 m V (sample) and 10 mV (spiked sample) and 12 cm /h chart speed. Model CV-6-UHPa-N60 injection va lve w ith 25 pL injection loop (Valeo Instrum ents Co ., Inc ., Houston, T X 77055), or equivalent.
(b) C h r o m a to g ra p h ic c o lu m n .— 4.6 mm id X 25 cm Zorbax® S il, Part No. 850952701 (DuPont Co., W ilm ington, D E 19898) w ith Model 84550 guard column containing 400 mg Corasil I I (Waters Associates).
(c) U ltra so n ic b a th .— Model 52, 2 gal., 200 watts (Branson C leaning Equipm ent Co., Shelton, C T 06484), or equivalent.
(d) R o ta r y e v a p o r a to r .— Model PFE-1BN (Bu- chler Instrum ents, Inc ., Fort Lee, NJ 07024), or equivalent, w ith vacuum pump, solvent trap, and 45°C water bath.
P r e p a r a t i o n o f S a m p l e sG rind about 40 g feed or supplement 30 s in a
high-speed blender. W eigh duplicate portions of ground sample into 125 m L Erlenmeyer flasks:10.00 g for 0.0106% pyrantel tartrate and 5.00 g for 0.106% pyrantel tartrate. Add 100 m L methanolic N aC l solution to one flask. Prepare spiked sample by adding 95 m L methanolic NaCl solution and 5.00 m L standard solution A (for 0.0106% pyrantel tartrate) or B (for 0.106% pyrantel tartrate) to other flask. Insert po lyethy lene stopper, place in ultrasonic bath 1 h , and
- then cool to room temperature (bath temperature increases to 55-75°C). Using three 20 m L w ash ings w ith m ethanolic N aC l so lu tion ,
quantitatively transfer m ixture to Buchner funnel conta in ing p re filte r pad (M illip o re AP2504700) covered w ith 1.5 g glass wool pad. Collect filtrate under vacuum in 200 m L vo lu metric flask. Let filtrate reach room temperature, f i l l to mark w ith methanolic N aC l solution, and m ix.
Pipet 25.0 m L filtrate for 0.0106% pyrantel tartrate or 5.00 m L filtrate plus 20 m L water for 0.106% pyrantel tartrate into 125 m L separatory funnel containing 10 m L K I solution. S w ir l gently to m ix. Add 50 m L C H C I3 to the separatory funnel and shake vigorously 10 s. D rain lower C H C I3 layer into 250 m L separatory funnel containing 25 m L 0.1N N aO H solution. Reextract aqueous K I layer w ith second 50 m L portion of C H C I3. After separation, drain C H C I3 layer into separatory funnel containing first C H C I3 extract and N aO H solution. Shake separatory funnel vigorously 10 s and let layers separate. D rain lower C H C I3 layer into 500 m L round-bottom flask and evaporate just to dryness w ith rotary evaporator. Reconstitute residue in flask w ith 10.0 m L mobile phase solution. Stopper tightly until ready to use.
D e t e r m i n a t i o nInject sample and spiked sample solutions into
H P L C system. Determ ine response of sample (R ) and sample spiked w ith appropriate standard (R ') from height or area of pyrantel peak (retention time = ca 7.3 m in). I f manual syringe in jection is used, make m ultiple injections of 25 pL in sequence of R 'R R R ' and calculate average values for R and R ', respectively. Calculate pyrantel tartrate content of feed from fo llow ing equation:
% Pyrantel tartrate = [R X (g pyrantel tar- trate/m L std soln) X 5 m L std soln X 100]/[(nR' — R) X g feed]
Note: n = recorder input voltage for samplespiked w ith standard/recorder input voltage for sample.
Resu lts and D iscussionW hen pyrantel tartrate standard solution is
taken through the assay procedure in the absence of feed, a single sharp peak w ith a retention time of about 7.3 min is obtained (see Figure 1). Assay conditions provide 50% fu ll scale deflection (5 m V recorder input) for 0.32 pg pyrantel tartrate standard. Evidence that pyrante l carries through the assay procedure and elutes from the H PLC column as the intact drug was obtained by collecting and identifying the fraction associated w ith this peak. The isolated fraction exhibited
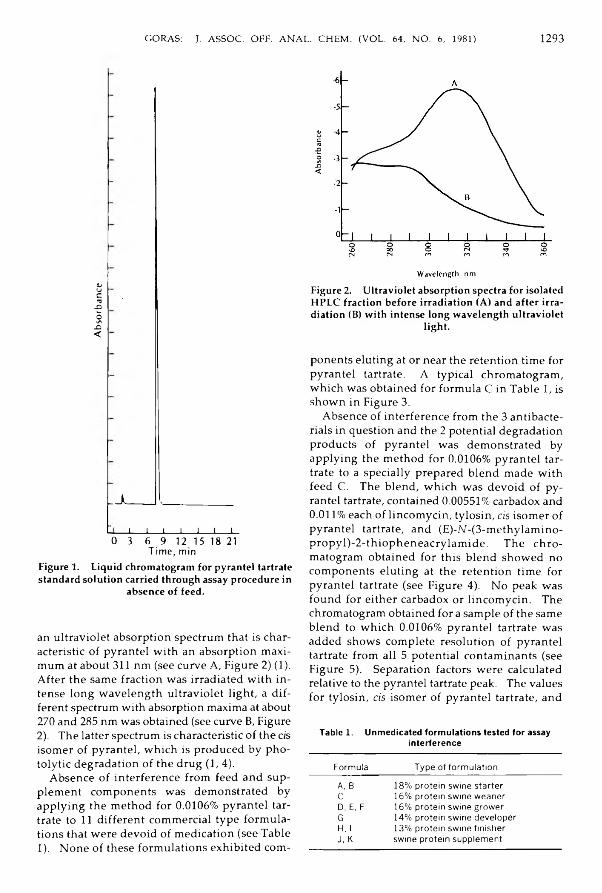
GORAS: J. ASSOC. OFF. ANAL. CHEM . (VOL. 64, N O . 6, 1981) 12 93
Absor
bance
Lj ____ L___
___1___ 1___ 1___ 1___ 1___L__ 1_0 3 6 9 12 15 18 21Tim e, min
Figure 1. L iquid ch rom atogram for p y ran te l ta rtra te s ta n d a rd so lu tio n ca rried th ro u g h assay p ro ced u re in
absence of feed .
an u ltravio let absorption spectrum that is characteristic of pyrantel w ith an absorption m aximum at about 311 nm (see curve A , Figure 2) (1). A fter the same fraction was irradiated w ith in tense long wavelength u ltravio let light, a d ifferent spectrum w ith absorption maxima at about 270 and 285 nm was obtained (see curve B, Figure 2). The latter spectrum is characteristic of the cis isomer of pyrantel, w h ich is produced by pho- to lytic degradation of the drug (1, 4).
Absence of interference from feed and supplement components was demonstrated by applying the method for 0.0106% pyrantel tartrate to 11 d ifferent commercial type form ulations that were devoid of medication (see Table 1). None of these form ulations exhibited com-
F igure 2. U ltrav io le t ab so rp tio n spectra fo r iso la ted H PLC frac tio n b e fo re ir ra d ia tio n (A) a n d a f te r i r ra d ia tio n (B) w ith in ten se lo n g w av elen g th u ltrav io le t
lig h t.
ponents eluting at or near the retention time for pyrantel tartrate. A typical chromatogram, w h ich was obtained for form ula C in Table 1, is shown in Figure 3.
Absence of interference from the 3 antibacterials in question and the 2 potential degradation products of pyrantel was demonstrated by applying the method for 0.0106% pyrantel tartrate to a specially prepared blend made w ith feed C . The blend, w h ich was devoid of pyrantel tartrate, contained 0.00551% carbadox and 0 .0 1 1 % each of lincom ycin , ty losin , cis isomer of pyrantel tartrate, and (E)-N-(3-methylamino- p ropyl)-2-th iopheneacrylam ide. The chromatogram obtained for this blend showed no components eluting at the retention time for pyrantel tartrate (see Figure 4). No peak was found for either carbadox or lincom ycin . The chromatogram obtained for a sample of the same blend to w h ich 0.0106% pyrantel tartrate was added shows complete resolution of pyrantel tartrate from a ll 5 potential contaminants (see Figure 5). Separation factors were calculated relative to the pyrantel tartrate peak. The values for ty losin , cis isomer of pyrantel tartrate, and
Table 1. Unmedicated formulations tested for assay interference
Formula Type of formulationA, B 18% protein swine starterC 16% protein swine weanerD, E, F 16% protein swine growerG 14% protein swine developerH, I 13% protein swine finisherJ, K swine protein supplement
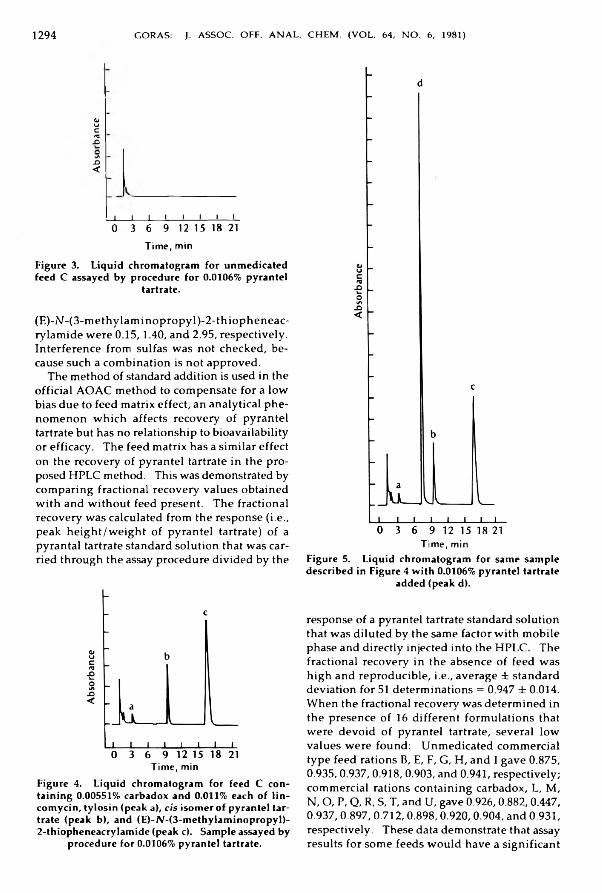
1 2 9 4 GORAS: J. ASSOC. OFF. ANAL. CHEM . (VOL. 64, NO. 6, 1981)
VUCrv.OOi/i.O<
i i i i i i i i0 3 6 9 12 15 18 21
Tim e, min
F igure 3. L iq u id ch ro m ato g ram fo r u n m ed ic a te d feed C assayed b y p ro ced u re fo r 0.0106% p y ra n te l
ta rtra te .
(E)-N -(3-m ethylam inopropyl)-2-thiopheneac- rylam ide were 0.15,1.40, and 2.95, respectively. Interference from sulfas was not checked, because such a combination is not approved.
The method of standard addition is used in the o ffic ia l A O A C method to compensate for a low bias due to feed m atrix effect, an analytica l phenomenon w h ich affects recovery of pyrantel tartrate but has no relationship to bioavailability or efficacy. The feed m atrix has a sim ilar effect on the recovery of pyrantel tartrate in the proposed H P LC method. Th is was demonstrated by comparing fractional recovery values obtained w ith and w ithout feed present. The fractional recovery was calculated from the response (i.e ., peak height/w eight of pyrantel tartrate) of a pyrantal tartrate standard solution that was carried through the assay procedure divided by the
Tim e, minF igure 4. L iq u id ch ro m ato g ram for feed C co n ta in in g 0.00551% carbadox a n d 0.011% each o f lin - com ycin , ty lo s in (peak a), cis iso m er o f p y ra n te l ta r tra te (p eak b), an d (E )-N -(3 -m e th y lam in o p ro p y l)- 2 -th io p h en eacry lam id e (peak c). S am ple assayed by
p ro c ed u re fo r 0.0106% p y ra n te l ta rtra te .
Tim e, minF igure 5. L iq u id ch ro m ato g ram fo r sam e sam p le d esc rib ed in F igure 4 w ith 0.0106% p y ra n te l ta r tra te
ad d e d (peak d).
response of a pyrantel tartrate standard solution that was diluted by the same factor w ith mobile phase and directly injected into the H P LC . The fractional recovery in the absence of feed was h igh and reproducible, i.e ., average ± standard deviation for 51 determinations = 0.947 ± 0.014. When the fractional recovery was determined in the presence of 16 d ifferent form ulations that were devoid of pyrantel tartrate, several low values were found: Unmedicated commercial type feed rations B, E , F , G , H , and I gave 0.875, 0.935,0.937, 0.918, 0.903, and 0.941, respectively; commercial rations containing carbadox, L , M ,N . O , P, Q, R, S, T , and U , gave 0.926,0.882,0.447,O. 937,0.897, 0 .712,0 .898,0.920,0.904, and 0.931, respectively. These data demonstrate that assay results for some feeds w ould have a significant
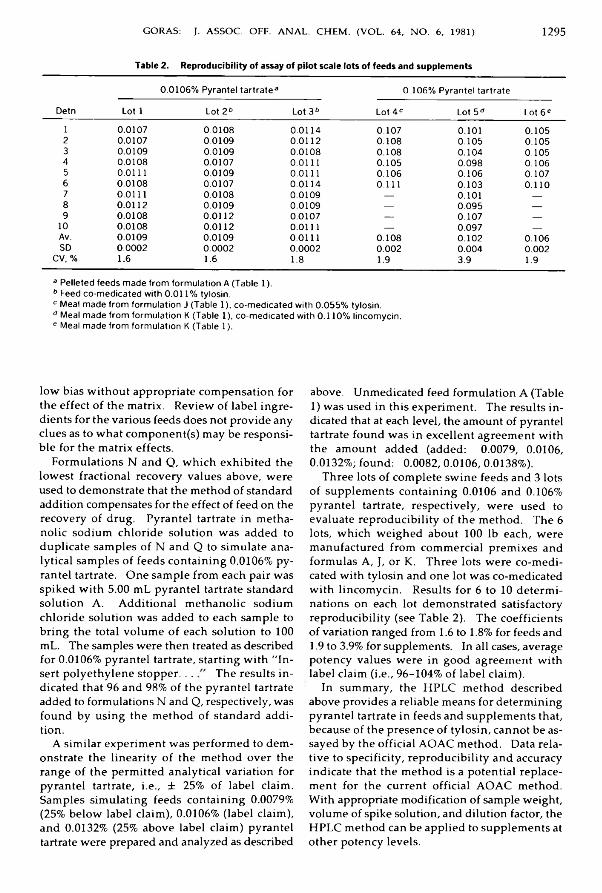
GORAS: J. ASSOC. OFF. ANAL. CHEM . (VOL. 64, N O . 6, 1981) 1 2 9 5
Table 2. Reproducibility of assay of pilot scale lots of feeds and supplements
Detn0.0106% Pyrantel tartrate 3 0.106% Pyrantel tartrate
Lot 1 Lot 2 6 Lot 3 » Lot 4 C Lot 5 d Lot 6 e1 0.0107 0.0108 0.0114 0.107 0 . 1 0 1 0.1052 0.0107 0.0109 0 . 0 1 1 2 0.108 0.105 0.1053 0.0109 0.0109 0.0108 0.108 0.104 0.1054 0.0108 0.0107 0 . 0 1 1 1 0.105 0.098 0.1065 0 . 0 1 1 1 0.0109 0 . 0 1 1 1 0.106 0.106 0.1076 0.0108 0.0107 0.0114 0 . 1 1 1 0.103 0 . 1 1 07 0 . 0 1 1 1 0.0108 0.0109 — 0 . 1 0 1 —8 0 . 0 1 1 2 0.0109 0.0109 — 0.095 —9 0.0108 0 . 0 1 1 2 0.0107 — 0.107 —
1 0 0.0108 0 . 0 1 1 2 0 . 0 1 1 1 — 0.097 __Av. 0.0109 0.0109 0 . 0 1 1 1 0.108 0 . 1 0 2 0.106SD 0 . 0 0 0 2 0 . 0 0 0 2 0 . 0 0 0 2 0 . 0 0 2 0.004 0 . 0 0 2
C M , % 1 .6 1. 6 1 .8 1.9 3.9 1.9a Pelleted feeds made from formulation A (Table 1). b Feed co-medicated with 0.011% tylosin.c Meal made from formulation J (Table 1), co-medicated with 0.055% tylosin. d Meal made from formulation K (Table 1), co-medicated with 0.110% lincomycin. e Meal made from formulation K (Table 1).
low bias w ithout appropriate compensation for the effect of the m atrix. Review of label ingredients for the various feeds does not provide any clues as to w hat component(s) may be responsible for the m atrix effects.
Form ulations N and Q , w h ich exhibited the lowest fractional recovery values above, were used to demonstrate that the method of standard addition compensates for the effect of feed on the recovery of drug. Pyrantel tartrate in metha- nolic sodium chloride solution was added to duplicate samples of N and Q to simulate analytica l samples of feeds containing 0.0106% pyrantel tartrate. One sample from each pair was spiked w ith 5.00 m L pyrantel tartrate standard solution A . Add itional m ethanolic sodium chloride solution was added to each sample to bring the total volum e of each solution to 100 m L. The samples were then treated as described for 0.0106% pyrantel tartrate, starting w ith " In sert polyethylene stopper. . . The results in dicated that 96 and 98% of the pyrantel tartrate added to formulations N and Q, respectively, was found by using the method of standard addition.
A sim ilar experim ent was performed to demonstrate the linearity of the method over the range of the permitted analytica l variation for pyrantel tartrate, i.e ., ± 25% of label claim . Samples sim ulating feeds containing 0.0079% (25% below label claim ), 0.0106% (label claim ), and 0.0132% (25% above label claim ) pyrantel tartrate were prepared and analyzed as described
above. Unmedicated feed formulation A (Table 1 ) was used in this experim ent. The results in dicated that at each level, the amount of pyrantel tartrate found was in excellent agreement w ith the amount added (added: 0.0079, 0.0106,0.0132%; found: 0.0082, 0.0106, 0.0138%).
Three lots of complete sw ine feeds and 3 lots of supplements containing 0.0106 and 0.106% pyrantel tartrate, respectively, were used to evaluate reproducib ility of the method. The 6 lots, w h ich weighed about 100 lb each, were manufactured from commercial prem ixes and formulas A , J, or K . Three lots were co-medicated w ith tylosin and one lot was co-medicated w ith lincom ycin. Results for 6 to 10 determ inations on each lot demonstrated satisfactory reproducib ility (see Table 2). The coefficients of variation ranged from 1.6 to 1 .8% for feeds and1.9 to 3.9% for supplements. In a ll cases, average potency values were in good agreement w ith label claim (i.e ., 96-104% of label claim ).
In sum m ary, the H P L C method described above provides a reliable means for determining pyrantel tartrate in feeds and supplements that, because of the presence of ty losin , cannot be assayed by the o ffic ia l A O A C method. Data relative to specific ity, reproducib ility and accuracy indicate that the method is a potential replacement for the current o ffic ia l A O A C method. W ith appropriate modification of sample weight, volume of spike solution, and dilution factor, the H P L C method can be applied to supplements at other potency levels.

12 96 GORAS: J. ASSOC. OFF. ANAL. CHEM . (VOL. 64, N O . 6, 1981)
Acknow ledgm ents
The author thanks W illiam R. LaCourse and A llen R. Gauthier, who are responsible for the data in this study and offered many helpfu l suggestions, and Paul R . Lem ke for sharing his expertise on H P L C separations of pyrantel tartrate.
References(1) L ynch, M. J. (1972) /. Assoc. Off. Anal. Chem. 55,
481-484(2) L itchm an, M. A. (1977) J. Assoc. Off. Anal. Chem. 60,
1051-1053(3) L itchm an, M. A. (1978) J. Assoc. Off. Anal. Chem. 61,
296-298(4) M acFarland, J. W„ e t al. (1969) /. Med. Chem. 12,
1066-1079

DABEKA & McKENZIE: J. ASSOC. OFF. ANAL. CHEM . (VOL. 64, N O . 6, 1981) 1 2 9 7
M E T A L S A N D O T H E R E L E M E N T S
A t o m i c A b s o r p t i o n S p e c t r o m e t r i c D e t e r m i n a t i o n o f T i n i n C a n n e d F o o d s U s i n g N i t r i c A c i d - H y d r o c h l o r i c A c i d D i g e s t i o n a n d N i t r o u s O x i d e - A c e t y l e n e F l a m e
R O B E R T W . D A B E K A an d A R T H U R D . M c K E N Z IEHealth and Welfare Canada, Food Directorate, Food Research Division, Health Protection Branch, Ottawa, Ontario, Canada K1A OL2
Foods (5-40 g) are d ig es ted se q u e n tia lly w ith H N O 3
an d HC1, d ilu te d to 100 m L, an d f ilte re d , a n d t in is d e te rm in ed by atom ic abso rp tio n using an N 2O -C 2H 2
flam e. S y n th e tic s ta n d a rd s in 10% HC1 are used . A p o s itiv e in te rfe re n c e b y p o ta ss iu m is co m p en sa ted b y ad d in g 100 /ig p o ta s s iu m /m L to b o th s ta n d a rd s and sam ples. R ecoveries for 17 foods sp ik ed w ith tin a t leve ls b e tw e e n 40 a n d 500 jig /g ran g ed fro m 85 to 110% w ith a m ean of 101%. R esu lts agreed w ell w ith a so lv e n t ex trac tio n a tom ic a b so rp tio n m e th o d an d a d irec t X -ray flu o rescen ce m eth o d .
Regulatory and m onitoring agencies usually require the determination of tin in canned foods at levels between 5 and 500 ppm. A lthough flame atomic absorption spectrometry is rapid and appears to be the most convenient instrumentation for determ ining tin at such levels, it is s t ill beset by problems, among w h ich are in terferences due to su lfu ric and perchloric acids, organic constituents, and various cations. As a result, w e ll studied general methods still re ly on the complete destruction of organic matter (1-3), and standard additions (2) or separation steps (3) must be used. These often increase analytical time, increase hazards associated w ith use of strong oxidants such as perchloric acid for complete digestions, and preclude convenient use of the methods for routine applications.
In this paper a convenient routine method, w h ich has the advantages of a less rigorous d igestion, and the use of synthetic standards rather than standard additions is described.
M E T H O D S
A p p a r a t u s(a) A to m ic a b so rp tio n s p e c tr o m e te r .— Equipped
w ith N 2O -C 2H 2 burner and simultaneous background correction (Varian AA-775, Varian A ssociates of Canada Ltd , Ottawa, Ontario).
(b) X - r a y f lu o r e s c e n c e (X R F ) s p e c tr o m e te r .— W avelength dispersive. Ph ilip s universal vac-
Received April 20, 1981. Accepted June 30, 1981.
uum X-ray spectrometer w ith W target, L iF crystal (2 d = 4028 A ), and N a l(T l) scintillation detector, Model PW-1410 (P h ilip s Electronic Equipm ent Ltd , Toronto, Ontario).
R e a g e n t s(a) A ll reagents were reagent grade, except
h igh-purity HC1 w h ich was prepared by subboiling d istillation and used on ly for XR F method. Deionized water was used throughout study.
(b) T in s to c k s o lu t io n .— 1000 /ug/mL. Prepare according to ref. 2 .
(c) P o ta s s iu m s to c k s o lu t io n .— 10 000 pg/m L. Dissolve 19.1 g K I in water and dilute to 1 L w ith water.
P r e p a r a t i o n o f S a m p l e sI f necessary for homogeneity, d ilute samples
(1 + 1 by weight) w ith water and shake or blend. Accurately weigh food into 250 m L Erlenm eyer flask: 30-40 g for juices or drinks, 20 g for foods containing 50-75% water, and 5-10 g for solids or semisolids. L im it fat or o il content to 2-4 g. D ry food in oven at ca 120-140°C. (Charring , w h ich may occur during overnight d rying , is perm issible.)
Add 30 m L H N O 3 to flask and heat gently to in itiate digestion, avoiding excessive frothing. W hen frothing has subsided, heat at moderate temperature (gentle boil) until 3-6 m L digest remains. In it ia l stages of sample d rying on bottom of the flask w ill not affect recovery; however, charring or spattering of sample Should be avoided. Remove flasks from heat.
Starting w ith next steps, carry 2 sample blanks through entire procedure. Add 25 m L HC1 to flask , and gently boil solution until 10-15 m L digest remains. Remove from heat. Complete H N O 3-H C I digestion requires ca 4 h.
Pipet 1.0 m L potassium stock solution into 100 m L volum etric flasks for samples and blanks. Transfer warm digest to volum etric flask , thor
0004-5756/81 /6406-1297-04J01.00© Association of Official Analytical Chemists, Inc.
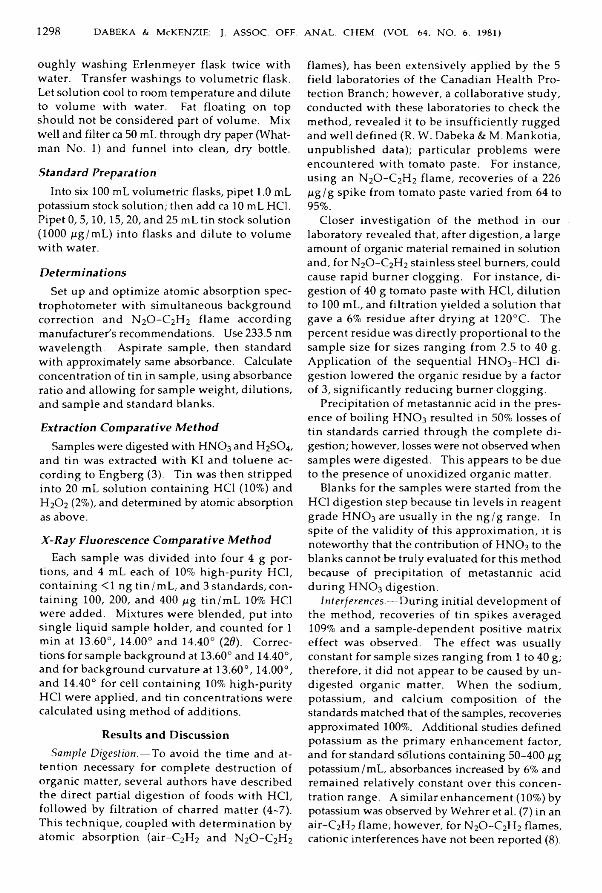
1 2 9 8 DABEKA & McKENZIE: J. ASSOC. OFF. ANAL. CHEM . (VOL. 64, N O . 6, 1981)
oughly washing Erlenm eyer flask tw ice w ith water. Transfer washings to volum etric flask. Let solution cool to room temperature and dilute to volume w ith water. Fat floating on top should not be considered part of volum e. M ix w ell and filter ca 50 m L through dry paper (Whatman No. 1) and funnel into clean, dry bottle.
S t a n d a r d P r e p a r a t i o nInto six 100 m L volumetric flasks, pipet 1.0 m L
potassium stock solution; then add ca 10 m L HC1. Pipet 0, 5 ,10 ,15 ,20 , and 25 m L tin stock solution (1000 jag/m L) into flasks and dilute to volum e w ith water.
D e t e r m i n a t i o n sSet up and optim ize atomic absorption spec
trophotometer w ith simultaneous background correction and N 2O -C 2H 2 flam e according manufacturer's recommendations. Use 233.5 nm wavelength. Aspirate sample, then standard w ith approximately same absorbance. Calculate concentration of tin in sample, using absorbance ratio and allow ing for sample weight, dilutions, and sample and standard blanks.
E x t r a c t i o n C o m p a r a t i v e M e t h o dSamples were digested w ith H N O 3 and H 2SO4,
and tin was extracted w ith K I and toluene according to Engberg (3). T in was then stripped into 20 m L solution containing HC1 (10%) and H 2O2 (2%), and determined by atomic absorption as above.
X - R a y F l u o r e s c e n c e C o m p a r a t i v e M e t h o dEach sample was d ivided into four 4 g por
tions, and 4 m L each of 10% h igh-purity HC1, containing <1 ng tin /m L , and 3 standards, containing 100, 200, and 400 pg tin /m L 10% HC1 were added. M ixtures were blended, put into single liqu id sample holder, and counted for 1 m in at 13.60°, 14.00° and 14.40° (2 6 ) . Corrections for sample background at 13.60° and 14.40°, and for background curvature at 13.60°, 14.00°, and 14.40° for cell containing 10% h igh-purity HC1 were applied, and tin concentrations were calculated using method of additions.
Resu lts and D iscussionS a m p le D ig e s t io n .—To avoid the time and at
tention necessary for complete destruction of organic matter, several authors have described the direct partial digestion of foods w ith HC1, followed by filtration of charred matter (4-7). Th is technique, coupled w ith determ ination by atomic absorption (a ir-C 2H 2 and N 2O -C 2H 2
flam es), has been extensively applied by the 5 fie ld laboratories of the Canadian H ealth Protection Branch; however, a collaborative study, conducted w ith these laboratories to check the method, revealed it to be insu ffic ien tly rugged and w e ll defined (R . W . Dabeka & M. M ankotia, unpublished data); particular problems were encountered w ith tomato paste. For instance, using an N 2O -C 2H 2 flam e, recoveries of a 226 pg/g spike from tomato paste varied from 64 to 95%.
C loser investigation of the method in our laboratory revealed that, after digestion, a large amount of organic material remained in solution and, for N 2O -C 2H 2 stainless steel burners, could cause rapid burner clogging. For instance, d igestion of 40 g tomato paste w ith HC1, d ilution to 100 m L, and filtration yielded a solution that gave a 6 % residue after d rying at 120°C. The percent residue was directly proportional to the sample size for sizes ranging from 2.5 to 40 g. Application of the sequential H N O 3-H C I d igestion lowered the organic residue by a factor of 3, sign ifican tly reducing burner clogging.
Precipitation of metastannic acid in the presence of boiling H N O 3 resulted in 50% losses of tin standards carried through the complete d igestion; however, losses were not observed when samples were digested. Th is appears to be due to the presence of unoxidized organic matter.
Blanks for the samples were started from the HC1 digestion step because tin levels in reagent grade H N O 3 are usually in the ng/g range. In spite of the va lid ity of this approxim ation, it is noteworthy that the contribution of H N O 3 to the blanks cannot be tru ly evaluated for this method because of precipitation of metastannic acid during H N O 3 digestion.
In te r fe r e n c e s .— D uring in itia l development of the method, recoveries of tin spikes averaged 109% and a sample-dependent positive m atrix effect was observed. The effect was usually constant for sample sizes ranging from 1 to 40 g; therefore, it did not appear to be caused by undigested organic matter. W hen the sodium, potassium, and calcium composition of the standards matched that of the samples, recoveries approximated 100%. Additional studies defined potassium as the prim ary enhancement factor, and for standard solutions containing 50-400 pg potassium/mL, absorbances increased by 6% and remained re lative ly constant over th is concentration range. A sim ilar enhancement (10%) by potassium was observed by Wehrer et al. (7) in an a ir-C 2H 2 flame; however, for N 2O -C 2H 2 flames, cationic interferences have not been reported (8 ).
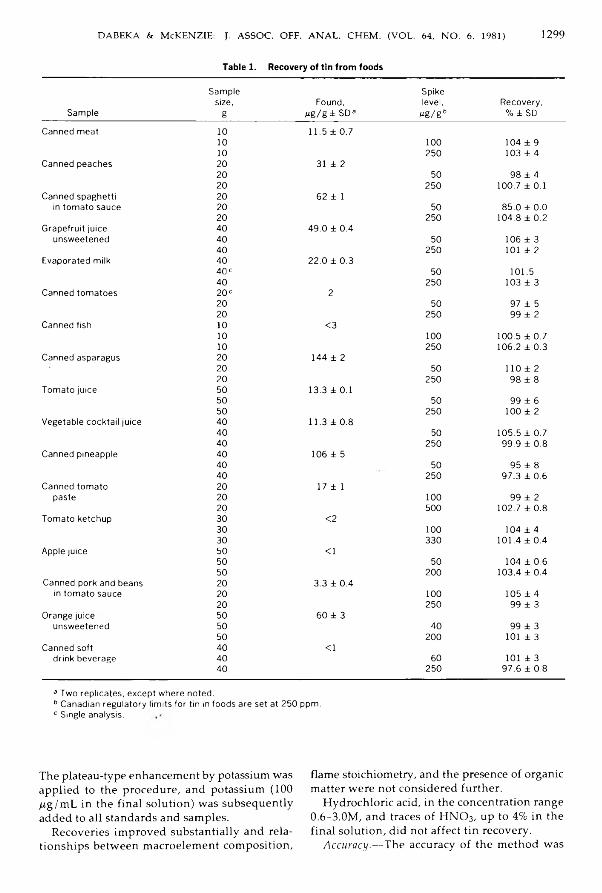
DABEKA & McKENZIE: J. ASSOC. OFF. ANAL. CHEM . (VOL. 64, N O . 6. 1981) 1 2 9 9
Table 1. Recovery of tin from foods
SampleSample
size,g
Found, M g/g± SDa
Spikelevel,
Fg /g bRecovery,
% ± SDCanned meat 1 0 11.5 ± 0.7
1 0 1 0 0 104 ± 91 0 250 103 ± 4
Canned peaches 2 0 31 ± 22 0 50 98 ± 42 0 250 100.7 ± 0.1
Canned spaghetti 2 0 62 ± 1In tomato sauce 2 0 50 85.0 ± 0.0
2 0 250 104.8 ± 0.2Grapefruit juice 40 49.0 ± 0.4
unsweetened 40 50 106 ± 340 250 1 0 1 ± 2
Evaporated milk 40 22.0 ± 0.340 c 50 101.540 250 103 ± 3
Canned tomatoes 2 0 c 22 0 50 97 ± 52 0 250 99 ± 2
Canned fish 1 0 <31 0 1 0 0 100.5 ±0 .71 0 250 106.2 ± 0 .3
Canned asparagus 2 0 144 ± 22 0 50 1 1 0 ± 22 0 250 98 ± 8
Tomato juice 50 13.3 ± 0.150 50 99 ± 650 250 1 0 0 ± 2
Vegetable cocktail juice 40 11.3 ± 0.840 50 105.5 ± 0.740 250 99.9 ± 0.8
Canned pineapple 40 106 ± 540 50 95 ± 840 250 97.3 ± 0 .6
Canned tomato 2 0 17 ± 1paste 2 0 1 0 0 99 ± 2
2 0 500 102.7 ± 0.8Tomato ketchup 30 < 2
30 1 0 0 104 ± 430 330 101.4 ± 0.4
Apple juice 50 < 150 50 104 ± 0 .650 2 0 0 103.4 ± 0.4
Canned pork and beans 2 0 3.3 ± 0.4in tomato sauce 2 0 1 0 0 105 ± 4
2 0 250 99 ± 3Orange juice 50 60 ± 3
unsweetened 50 40 99 ± 350 2 0 0 101 ± 3
Canned soft 40 < 1drink beverage 40 60 101 ± 3
40 250 97.6 ± 0.8
a Two replicates, except where noted.6 Canadian regulatory limits for tin in foods are set at 250 ppm. c Single analysis.
The plateau-type enhancement by potassium was applied to the procedure, and potassium (100 /ug/mL in the fina l solution) was subsequently added to a ll standards and samples.
Recoveries im proved substantially and relationships between macroelement composition,
flame stoichiometry, and the presence of organic matter were not considered further.
Hydrochloric acid, in the concentration range 0.6-3.0M , and traces of H N O 3, up to 4% in the fina l solution, did not affect tin recovery.
A c c u r a c y .— The accuracy of the method was

1 3 0 0 DABEKA & McKENZIE: J. ASSOC. OFF. ANAL. CHEM . (VOL. 64, N O . 6, 1981)
Table 2. Comparison of proposed method for tin determination with other techniques
Sn found Oxg/g ± SO)Solvent
Sample This method3 extn3 XRFPineapple juice 94 ± 6 92 ± 5 84Evaporated milk 17 ± 3 11.9 ± 0 . 8 2 0Canned asparagus 146 ± 1 135 17 142Orange juice 49.9 ± 0.9 48.1 ± 0 . 6 1 6 6 bCanned spaghetti 75 ± 4 80 ± 1 0 70Tomato paste 140 ± 2 137 ± 2 164
3 Three replicates per food.b Sample had been stored in Its can for 2 weeks after the
first 2 methods were used and the high level may be due to leaching of tin.
tested by recovery studies and by comparing the method w ith solvent extraction fo llowed by flame atomic absorption and w ith X-ray fluorescence of undigested foods by using standard additions.
Recovery of tin spiked at 2 levels in 17 foods ranged from 85 to 110%, w ith a mean of 101% (Table 1). Recovery at lower sp iking levels (40-100 Mg/g) was more erratic (5.6% RSD) due to measurement im precision, but improved considerably (2.5% RSD) for the h igher spikes (200-500 Mg/g).
Results obtained by the present method and those obtained using solvent extraction atomic absorption and XR F methods compared favorably (Table 2).
ConclusionsBy using an N 2O-C2H 2 flame rather than any
of the cooler flames, interferences due to organic matter (9) and various cations (10) are reduced s ign ificantly . The potassium interference, still
present in this flame, is compensated by addition of potassium to standards and samples. By using a sequential H N O 3-H CI digestion, organic matter, which can cause rapid clogging of the burner head, is reduced to a manageable level. In te rference in the flame caused by su lfu ric acid, frequently used in complete digestion methods, is avoided.
As a result of the above approach, the method is lengthier than direct HC1 digestion methods, but is more reliable. The digestion step for the method does not require as much analytica l attention as do existing methods in w h ich complete destruction of organic matter is effected and, un like such methods, the method does not require separation steps ( 1,3 ) or the use of standard additions (2 ) to compensate for interferences. Thus, the method is suitable for routine determ inations. Collaborative study of the method is being planned.
R e f e r e n c e s
(1) H orw itz , W. (1979) ]. Assoc. O ff. Anal. Chem. 62, 1251-1264
(2) E lkins, E. R„ & Sulek, A. (1979) /. Assoc. O ff. Anal. Chem. 62 ,1050-1053
(3) Engberg , A. (1973) Analyst 98 ,137-145(4) S im pson, G. R., & Blay, R. A. (A ugust 1966) Food
Trade Rev. pp. 35-37(5) D uran , L„ & Soto, L. (1973) Rev. Agroquim. Tecnol.
Aliment. 13, 476-482(6 ) C am eron, A. G„ & B rittain, J. E. (1971) /. Food
Technol. 6, 187-192(7) W ehrer, C., T h iersalt, J., & Laugel, P. (1976) Ind.
Aliment. Agric. 1439-1446(8) "A naly tical M ethods for Flam e Spectroscopy"
(June 1978) V arian T ech tron Pty Ltd, Pub. No. 85-100009-00, p. 52
(9) Shiraishi,.Y ., K uzuhara, Y., & Suenaga, S. (1972) Shokuhin Elseigaku Zasshi 13, 97-100
(10) Ju liano , P. O., & H arrison , W. W. (1970) Anal. Chem. 42, 84-89
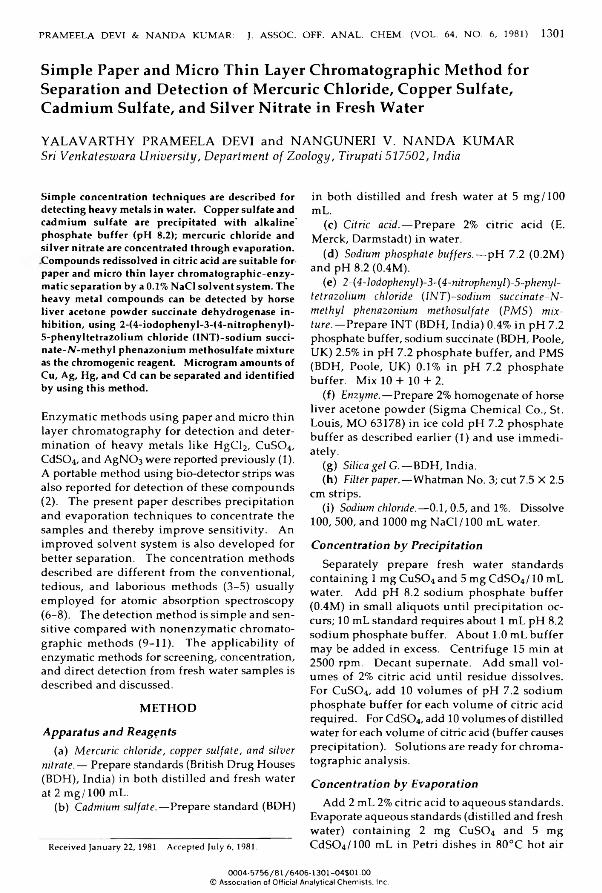
Simple Paper and Micro Thin Layer Chromatographic Method for Separation and Detection of Mercuric Chloride, Copper Sulfate, Cadmium Sulfate, and Silver Nitrate in Fresh WaterY A L A V A R T H Y P R A M E E L A D E V I an d N A N G U N E R I V . N A N D A K U M A RSri Venkateswara University, Department of Zoology, Tirupati 517502, India
PRAMEELA DEVI & N A N D A KUMAR: J. ASSOC. OFF. ANAL. CHEM . (VOL. 64, N O . 6, 1981) 1301
S im p le co n c e n tra tio n te c h n iq u e s are d esc rib ed fo r d e tec tin g h eavy m eta ls in w ate r. C o p p er su lfa te an d cad m iu m su lfa te a re p re c ip ita te d w ith a lk a lin e ' p h o sp h a te b u ffe r (pH 8.2); m ercu ric c h lo r id e an d s ilv e r n itra te are co n c en tra te d th ro u g h e v a p o ra tio n . C o m p o u n d s red isso lved in c itric acid are su ita b le fo r p a p e r a n d m icro th in la y e r ch ro m a to g ra p h ic -e n z y m atic sep a ra tio n b y a 0.1% N aC l so lv e n t sy stem . T he h eav y m eta l co m p o u n d s can be d e te c te d b y h o rse liv e r ac e to n e p o w d e r su cc in a te d eh y d ro g e n ase in h ib itio n , u s in g 2 -(4 -io d o p h e n y l-3 -(4 -n itro p h e n y l)- 5 -p h e n y lte tra z o liu m c h lo r id e (IN T )-so d iu m succi- n a te -N -m e th y l p h e n a z o n iu m m e th o su lfa te m ix tu re as th e ch ro m o g en ic reagen t. M icrogram a m o u n ts of C u, Ag, H g, a n d C d can be sep a ra ted a n d id e n tif ie d b y u s in g th is m eth od .
Enzym atic methods using paper and micro th in layer chromatography for detection and determ ination of heavy metals like H g C l2, C u S 0 4, C d S 0 4, and AgNC>3 were reported previously (1). A portable method using bio-detector strips was also reported for detection of these compounds (2). The present paper describes precipitation and evaporation techniques to concentrate the samples and thereby im prove sensitiv ity . An improved solvent system is also developed for better separation. The concentration methods described are d ifferent from the conventional, tedious, and laborious methods (3-5) usually employed for atomic absorption spectroscopy (6 - 8 ). The detection method is sim ple and sensitive compared w ith nonenzym atic chromatographic methods (9-11). The applicability of enzymatic methods for screening, concentration, and direct detection from fresh water samples is described and discussed.
M E T H O D
A p p a r a t u s a n d R e a g e n t s(a) M e r c u r ic c h lo r id e , c o p p e r s u l fa te , a n d s i lv e r
n itr a te .— Prepare standards (British Drug Houses (B D H ), Ind ia) in both d istilled and fresh water at 2 m g/100 m L.
(b) C a d m iu m s u l fa te .—Prepare standard (BDH)
Received January 22, 1981. Accepted July 6, 1981.
in both d istilled and fresh water at 5 m g/100 m L.
(c) C itr ic a c id .— Prepare 2% c itric acid (E . M erck, Darmstadt) in water.
(d) S o d iu m p h o s p h a te b u f f e r s .—pH 7.2 (0.2M ) and pH 8.2 (0.4M).
(e) 2 - ( 4 - Io d o p h e n y l) -3 - ( 4 -n i tr o p h e n y l) -5 -p h e n y l- t e t r a z o l iu m c h lo r id e ( I N T ) - s o d iu m s u c c in a t e - N - m e th y l p h e n a z o n iu m m e th o s u l fa te ( P M S ) m ix t u r e .—Prepare IN T (B D H , Ind ia) 0.4% in pH 7.2 phosphate buffer, sodium succinate (BD H , Poole, U K ) 2.5% in pH 7.2 phosphate buffer, and PM S (BD H , Poole, U K ) 0.1% in pH 7.2 phosphate buffer. M ix 10 + 10 + 2.
(f) E n z y m e .—Prepare 2% homogenate of horse live r acetone powder (Sigma Chem ical Co ., St. Lou is, MO 63178) in ice cold pH 7.2 phosphate buffer as described earlier (1) and use im m ediately.
(g) S ilica g e l G .— B D H , India .(h) F ilte r p a p e r .— Whatman No. 3; cut 7.5 X 2.5
cm strips.(i) S o d iu m c h lo r id e .—0.1, 0.5, and 1%. Dissolve
100, 500, and 1000 mg N a C l/100 m L water.
C o n c e n t r a t i o n b y P r e c i p i t a t i o nSeparately prepare fresh water standards
containing 1 mg C u S 0 4 and 5 mg C d S 0 4/ 10 m L water. Add pH 8.2 sodium phosphate buffer (0.4M ) in sm all aliquots until precipitation occurs; 10 m L standard requires about 1 m L pH 8.2 sodium phosphate buffer. About 1.0 m L buffer may be added in excess. Centrifuge 15 m in at 2500 rpm. Decant supernate. Add sm all vo lumes of 2% citric acid until residue dissolves. For C u S 0 4, add 10 volum es of pH 7.2 sodium phosphate buffer for each volum e of c itric acid required. For C d S04, add 10 volumes of distilled water for each volume of citric acid (buffer causes precipitation). Solutions are ready for chromatographic analysis.
C o n c e n t r a t i o n b y E v a p o r a t i o nAdd 2 m L 2% citric acid to aqueous standards.
Evaporate aqueous standards (d istilled and fresh water) containing 2 mg C u S 0 4 and 5 mg CdSO 4/100 m L in Petri dishes in 80 °C hot air
0004-5756/81/6406-1301-04$01.00© Association of Official Analytical Chemists, Inc.
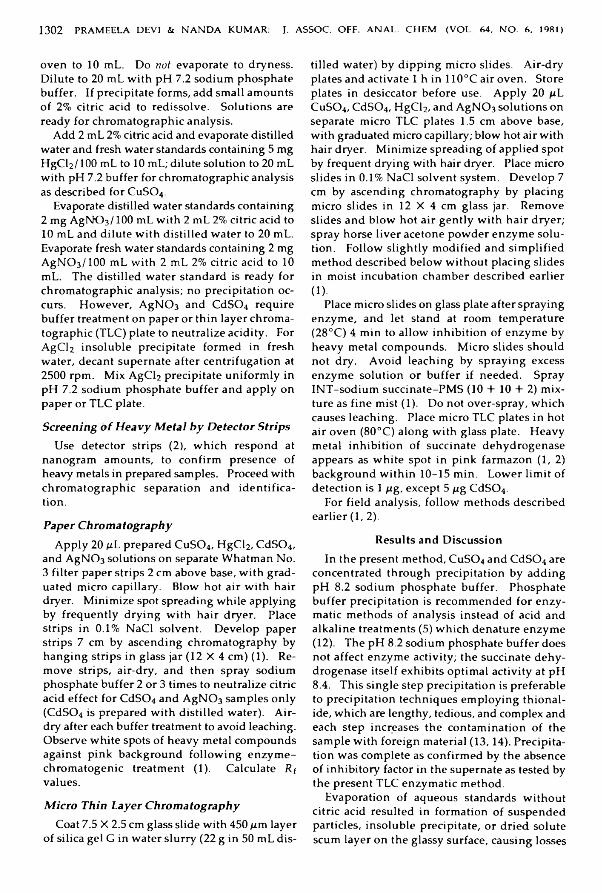
1 3 0 2 PRAMEELA DEVI & N A N D A KUMAR: J. ASSOC. OFF. ANAL. CHEM . (VOL. 64, N O . 6, 1981)
oven to 10 m L. Do n o t evaporate to dryness. D ilute to 20 m L w ith pH 7.2 sodium phosphate buffer. I f precipitate forms, add sm all amounts of 2% citric acid to redissolve. Solutions are ready for chromatographic analysis.
Add 2 m L 2% citric acid and evaporate distilled water and fresh water standards containing 5 mg HgCh/lOO m L to 10 m L; dilute solution to 20 m L w ith pH 7.2 buffer for chromatographic analysis as described for C u S 0 4.
Evaporate distilled water standards containing2 mg AgNC>3/ 100 m L w ith 2 m L 2% citric acid to 10 m L and dilute w ith d istilled water to 20 m L. Evaporate fresh water standards containing 2 mg AgNC>3 /1 0 0 m L w ith 2 m L 2% citric acid to 10 m L. The d istilled water standard is ready for chromatographic analysis; no precipitation occurs. H ow ever, AgNC>3 and C d S 0 4 require buffer treatment on paper or th in layer chromatographic (T LC ) plate to neutralize acidity. For A g C l2 insoluble precipitate formed in fresh water, decant supernate after centrifugation at 2500 rpm. M ix AgCU precipitate un ifo rm ly in pH 7.2 sodium phosphate buffer and apply on paper or T L C plate.
S c r e e n i n g o f H e a v y M e t a l b y D e t e c t o r S t r i p sUse detector strips (2), w h ich respond at
nanogram amounts, to confirm presence of heavy metals in prepared samples. Proceed w ith chrom atographic separation and identification.
P a p e r C h r o m a t o g r a p h yA pp ly 20 g L prepared C u S 0 4, H g C l2, C d S 0 4,
and AgNC>3 solutions on separate Whatman No.3 filte r paper strips 2 cm above base, w ith graduated micro cap illary . B low hot a ir w ith hair dryer. M inim ize spot spreading w hile applying by frequently drying w ith ha ir dryer. Place strips in 0.1% N aC l solvent. Develop paper strips 7 cm by ascending chromatography by hanging strips in glass jar (12 X 4 cm) (1). Remove strips, a ir-dry, and then spray sodium phosphate buffer 2 or 3 times to neutralize citric acid effect for C d S 0 4 and AgNC>3 samples only (C d S 0 4 is prepared w ith d istilled water). A ir- dry after each buffer treatment to avoid leaching. Observe w hite spots of heavy metal compounds against p ink background fo llow ing enzym e- chromatogenic treatment (1). Calculate R ( values.
M i c r o T h i n L a y e r C h r o m a t o g r a p h yCoat 7.5 X 2.5 cm glass slide w ith 450 p m layer
of silica gel G in water s lu rry (22 g in 50 m L dis
tilled water) by d ipping micro slides. A ir-d ry plates and activate 1 h in 110°C air oven. Store plates in desiccator before use. A pp ly 20 p L C u S 0 4, C d S 0 4, H g C l2, and A gN 0 3 solutions on separate micro T L C plates 1.5 cm above base, w ith graduated micro capillary; blow hot air w ith hair dryer. M inim ize spreading of applied spot by frequent drying w ith hair dryer. Place micro slides in 0.1% N aC l solvent system. Develop 7 cm by ascending chromatography by placing micro slides in 12 X 4 cm glass jar. Remove slides and blow hot a ir gently w ith ha ir dryer; spray horse live r acetone powder enzym e solution. Fo llow slig h tly modified and sim plified method described below w ithout placing slides in moist incubation chamber described earlier(1).
Place micro slides on glass plate after spraying enzym e, and let stand at room temperature (28°C ) 4 m in to a llow inh ib ition of enzyme by heavy metal compounds. M icro slides should not d ry. Avoid leaching by spraying excess enzyme solution or buffer if needed. Spray IN T-sod ium succinate-PM S (10 + 10 + 2) m ixture as fine mist (1). Do not over-spray, w h ich causes leaching. Place micro T L C plates in hot a ir oven (80°C ) along w ith glass plate. H eavy metal inh ib ition of succinate dehydrogenase appears as w hite spot in p ink farmazon (1 , 2 ) background w ith in 10-15 m in. Low er lim it of detection is 1 p g , except 5 p g C d S 0 4.
For fie ld analysis, fo llow methods described earlier ( 1, 2 ).
Resu lts and D iscussionIn the present method, C u S 0 4 and C d S 0 4 are
concentrated through precipitation by adding pH 8.2 sodium phosphate buffer. Phosphate buffer precipitation is recommended for enzymatic methods of analysis instead of acid and alkaline treatments (5) w h ich denature enzyme (12). The pH 8.2 sodium phosphate buffer does not affect enzyme activ ity ; the succinate dehydrogenase itse lf exhib its optimal activ ity at pH 8.4. T h is single step precipitation is preferable to precipitation techniques employing thional- ide, which are lengthy, tedious, and complex and each step increases the contamination of the sample w ith foreign material (13 ,14). Precipitation was complete as confirmed by the absence of inh ib itory factor in the supernate as tested by the present T L C enzym atic method.
Evaporation of aqueous standards w ithout citric acid resulted in formation of suspended particles, insoluble precipitate, or dried solute scum layer on the glassy surface, causing losses
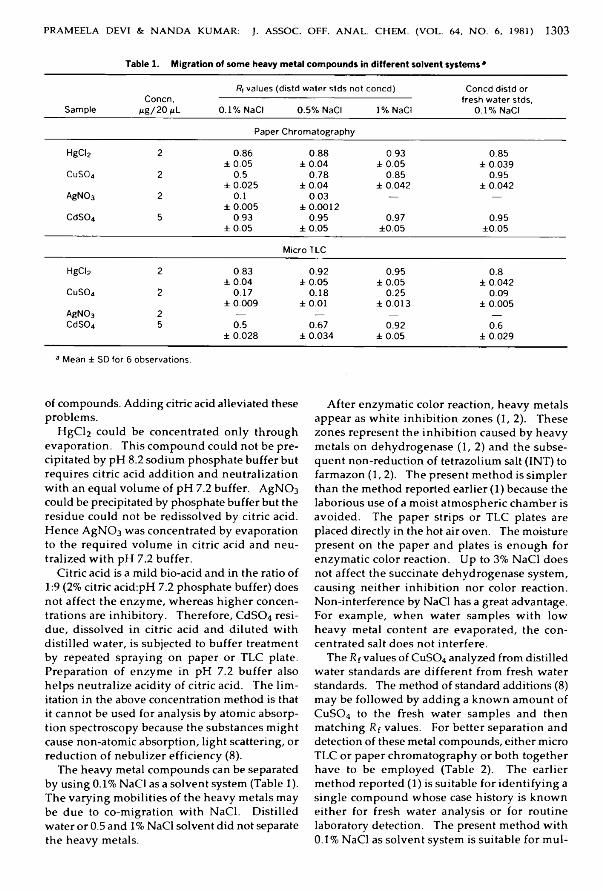
PRAMEELA DEVI & N A N D A KUMAR: J. ASSOC. OFF. ANAL. CHEM . (VOL. 64, N O . 6, 1981) 1303
Table 1. Migration of some heavy metal compounds in different solvent systems *
Concn,Rf values (distd water stds not coned) Coned distd or
fresh water stds,Sample Mg/2 0 Ml 0.1% NaCl 0.5% NaCl l%NaCI 0.1% NaCl
Paper ChromatographyHgCI2 2 0 . 8 6 0 . 8 8 0.93 0.85
± 0.05 ± 0.04 ±0 .05 ± 0.039CUSO4 2 0.5 0.78 0.85 0.95± 0.025 ± 0.04 ± 0.042 ± 0.042
AgN03 2 0.1 0.03 — —± 0.005 ± 0 . 0 0 1 2
CdS04 5 0.93 0.95 0.97 0.95±0 .05 ±0 .05 ±0.05 ±0.05
Micro TLCHgCI2 2 0.83 0.92 0.95 0 . 8
±0 .04 ±0 .05 ± 0.05 ± 0.042CUSO4 2 0.17 0.18 0.25 0.09±0.009 ± 0 . 0 1 ±0.013 ± 0.005AgN03 2 — — — —
CdS04 5 0.5 0.67 0.92 0 . 6± 0.028 ± 0.034 ± 0.05 ± 0.029
3 Mean ± SD for 6 observations.
of compounds. Adding citric acid alleviated these problems.
H g C l2 could be concentrated on ly through evaporation. Th is compound could not be precipitated by pH 8.2 sodium phosphate buffer but requires citric acid addition and neutralization w ith an equal volume of pH 7.2 buffer. AgNC>3 could be precipitated by phosphate buffer but the residue could not be redissolved by citric acid. Hence AgNC>3 was concentrated by evaporation to the required volum e in citric acid and neutralized w ith pH 7.2 buffer.
C itric acid is a m ild bio-acid and in the ratio of 1:9 (2% citric acid:pH 7.2 phosphate buffer) does not affect the enzym e, whereas h igher concentrations are inh ib ito ry . Therefore, CdSC>4 residue, dissolved in citric acid and diluted w ith d istilled w ater, is subjected to buffer treatment by repeated spraying on paper or T L C plate. Preparation of enzym e in pH 7.2 buffer also helps neutralize acid ity of c itric acid. The lim itation in the above concentration method is that it cannot be used for analysis by atomic absorption spectroscopy because the substances m ight cause non-atomic absorption, light scattering, or reduction of nebulizer efficiency (8 ).
The heavy metal compounds can be separated by using 0.1% NaCl as a solvent system (Table 1). The varying m obilities of the heavy metals may be due to co-migration w ith N aC l. D istilled water or 0.5 and 1% NaCl solvent did not separate the heavy metals.
A fter enzym atic color reaction, heavy metals appear as w hite inh ib ition zones (1, 2). These zones represent the inh ib ition caused by heavy metals on dehydrogenase ( 1, 2 ) and the subsequent non-reduction of tetrazolium salt (IN T ) to farmazon (1 ,2 ). The present method is sim pler than the method reported earlier (1) because the laborious use of a moist atmospheric chamber is avoided. The paper strips or T L C plates are placed directly in the hot air oven. The moisture present on the paper and plates is enough for enzym atic color reaction. Up to 3% N aC l does not affect the succinate dehydrogenase system, causing neither inh ib ition nor color reaction. Non-interference by N aCl has a great advantage. For example, w hen water samples w ith low heavy metal content are evaporated, the concentrated salt does not interfere.
The R f values of C u S 0 4 analyzed from distilled water standards are d ifferent from fresh water standards. The method of standard additions (8 ) may be followed by adding a know n amount of C u S 0 4 to the fresh water samples and then matching R f values. For better separation and detection of these metal compounds, either micro T L C or paper chromatography or both together have to be employed (Table 2). The earlier method reported (1 ) is suitable for identify ing a single compound whose case h istory is known either for fresh water analysis or for routine laboratory detection. The present method w ith 0.1% N aC l as solvent system is suitable for mul-

1 3 0 4 PRAMEELA DEVI & N A N D A KUMAR: J. ASSOC. OFF. ANAL. CHEM . (VOL. 64, NO. 6, 1981)
Table 2. Recommended chromatographic methods for separation and detection of some heavy metals, 0.1%
NaCi solvent system
Compound Chromatographic method recommendedCUSO4 micro TLCCdS04 paper chromatographyHgCI2 paper or micro TLCAgN03 paper or micro TLCCUSO4—CdS0 4
mixture TLCAgN03 -HgCI2
mixture paper or micro TLCCuS04 -HgCI2
mixture paper chromatographyCdS04 -HgCI2
mixture paper chromatography
timetal identification and separation at 40 ppm (cadmium is detectable at 500 ppm). Screening can be made on a detector strip (2 ) or on a micro T L C plate (1) at nanogram concentrations. Preferred methods are listed in Table 2.
The method is suitable for identification only of ionized free metal compounds w h ich fa ll w ith in the detection lim its , not for metal complexes or colloidal forms. The metal compounds stannous chloride, ammonium arsenite, a lum inum chloride, chromium sulfate, ihagnesium chloride, selenium chloride, cobalt n itrate, barium chloride, lead nitrate, z inc chloride, strontium chloride, and ammonium molybdate have no effect. Barium and zinc chloride cause in h ibition at very h igh amounts (200 pg) but interference is overcome through sim ultaneous matching w ith known standards.
Acknow ledgm entsThe authors thank K . S. Sw am i, Head of the
Department of Zoology, for providing facilities.Y . Prameela D evi thanks the Department ofScience and Technology, Governm ent of Ind ia ,for financia l help.
References(1) N anda K um ar, N. V., & P ram eela D evi, Y. (1981)
J. Assoc. Off. Anal. Chem. 64, 729-732(2) N anda K um ar, N. V., & Pram eela D evi, Y. (1981)
/. Assoc. Off. Anal. Chem. 64, 841-843(3) Galle, O. K., & A nginus, E. E. (1968) Kans. State
Geol. Surv. Bull. P t 1, 191-194(4) S inha, R. C. P„ S inghal, K. C„ & Benerji, A. C.
(1968) Technology Coimbatore India 5 ,121-126(5) B iechler, D. G. (1965) Anal. Chem. 37, 1054-1057(6 ) G uedes da Mota, M. M „ Rom er, P. G., & G riepink,
B. (1977) Fresenius Z. Anal. Chem. 287 ,17-22(7) H enryke , Z„ D anuta, B., & H anna, E. (1978) Chem.
Anal. 2 2 , 913-917; Anal. Abstr. (1978) 34, 5 H 32(8 ) Parker, C. R. (1976) "W ater A nalysis by A tom ic
A bsorp tion Spectroscopy," V arian T ech tron M anual, W aln u t C reek, CA, pp. 1-26
(9) A n derso n , J. R. A., & M artin , E. C. (1955) Anal. Chim. Acta 13, 253-257
(10) S ingh , N. J., & T andon , S. N . (1977) Chromatogra- phia 10, 309-311
(11) Quresha, M., V arshney, K. G., & Fathima, N. (1977) Sep. Sci. 12, 321-328
(12) R odw ell, V. (1969) in Review of Physiological Chemistry, H. A. H arpe r, (Ed.), L ange M edical P ublications M uaruzin Co., Ltd, A sian E dition, Japan, pp . 128-172
(13) D ehn , R. L„ D u nn , W. G„ & Lober, E. G. (1961) Anal. Chem. 33, 607-610
(14) Lai, M. G„ & W eiss, H. V. (1962) Anal. Chem. 34, 1012-1016
KAN ET AL.: J. ASSOC. OFF. ANAL. CHEM . (VOL. 64, N O . 6, 1981) 1 3 0 5
PESTICIDE RESID U ESD e t e r m i n a t i o n o f 2 ,4 - D B u t o x y e t h a n o l E t h e r E s t e r a n d I t s D e g r a d a t io n P r o d u c t s 2 , 4 - D i c h l o r o p h e n o x y a c e t i c A c i d a n d 2 ,4 - D i c h l o r o p h e n o l i n S e d i m e n t
GORDON Y. P. KAN, FRED T. S. MAH, NORMAN L. WADE, and MAX L. BOTHWELL* 1Environment Canada, Inland Waters Directorate, Water Quality Branch, 1305 Welch St,North Vancouver, British Columbia, Canada V7P 1B3
2.4- D b u to x y e th a n o l e th e r e s te r (2,4-D BEE) w as iso la ted fro m se d im e n t b y ex trac tio n w ith ace to n e - hexane a t n eu tra l cond itions; from th e sam e sed im en t sam p le , 2 ,4 -d ich lo ro p h en o x y ace tic ac id (2,4-D) w as iso la ted w ith m e th a n o l a f te r th e s e d im e n t h ad b een ac id if ied to < p H 2. 2 ,4 -D ich lo ro p h en o l in th e se d im e n t w as ex trac ted w ith iso o ctan e b y steam d is ti lla tio n . M ean recoveries f rom 4 sp ik ed sam ples ran g ed fro m 99 to 108%, 94 to 102%, an d 74 to 76% for2 .4- D BEE, 2,4-D , a n d 2 ,4 -d ic h lo ro p h en o l, resp ectiv e ly . T hese p rocedures w ere developed fo r rou tin e a n a ly ses o f la k e sed im e n ts in th e O k an ag a n reg io n o f B ritish C o lu m b ia .
Chlorophenoxy herbicides have been used across Canada for over 25 years to control terrestrial broad-leaved weeds (1). Recently, the appearance of the nuisance weed, Eurasian m ilfo il ( M y r io p h y l l u m s p ic a tu m ) , in the Okanagan lakes of B ritish Colum bia prompted the use of 2,4-D butoxyethanol ether ester (2,4-D BEE). To m onitor the possible persistence of herbicide residues in the environment, it became necessary to develop sensitive and reliable methods for determ ining 2,4-D BEE and its degradation products, 2,4-D and 2,4-dichlorophenol. A lthough analytica l methods for a w ide range of chlorophenoxy herbicides have been reported for so il, w ater, and tissue samples (2- 11 ), no single publication has been found that provides procedures for the coordinated determination of2.4- D B EE and its degradation products in wet sediment. Most published methods sim p ly report on the hydro lysis of the 2,4-D esters to the corresponding acids or salts, or extraction of samples w ith various solvents, or chemical der- ivatization and gas chromatographic identification and quantitation (12-14).
Because 2,4-dichlorophenol is h igh ly volatile,
Received February 10,1981. Accepted May 28,1981.1 National Water Research Institute, Pacific and Yukon Branch, Inland Waters Directorate, Environment Canada, 4160 Marine Dr, West Vancouver, British Columbia, Canada V7V 1N6.
so lvent extraction becomes impractical due to losses by co-distillation when raw extracts are subjected to concentration on a rotary evaporator both before and after derivatization (G. Y . P. Kan & R. So (1980) unpublished results). Continuous liqu id-liqu id extraction is also not accurate because of solute loss during concentration (15). Furtherm ore, exhaustive so lvent extraction procedures co-extract lip ids, waxes, pigments, and other h igh m olecular w eight organics, so extensive chromatographic cleanup of the raw extracts is often necessary before injection into a gas chromatograph for trace analysis. O n the other hand, steam distillation, a classical method of separating chemicals on the basis of d iffe rences in vapor pressures over water (16), may provide a sim ple and convenient procedure for the extraction of 2,4-dichlorophenol from wet sediment. For th is reason, we have adapted a m odified N ie lsen-Kryger steam d istilla tion apparatus (17) for the extraction of 2,4-dichlorophenol from sediment.
Because of rapid hydro lysis, it is not possible to isolate 2,4-D BEE by steam d istillation . H ow ever, 2,4-D BEE can be satisfactorily extracted from sediment at neutral conditions by using a m ixture of acetone and hexane. When the extraction of 2,4-D B EE is completed, the sediment can be acidified and 2,4-D can be extracted quantitatively w ith methanol.
Experim ental
A p p a r a t u s(a) G as c h r o m a to g r a p h s .— (1) MT-220 equipped
w ith linearized 63N i electron capture detector; 1.8 m X 4 mm id glass column packed w ith 3% OV-101 on 80-100 mesh Chromosorb W (Chromatographic Specialties Ltd , Brockville , Ontario).
Funding for this work was provided by the National Aquatic Weeds Program, National Water Research Institute, Burlington, Ontario.
0004-5756/81/6406-1305-04$01.00© Association of Official Analytical Chemists, Inc.
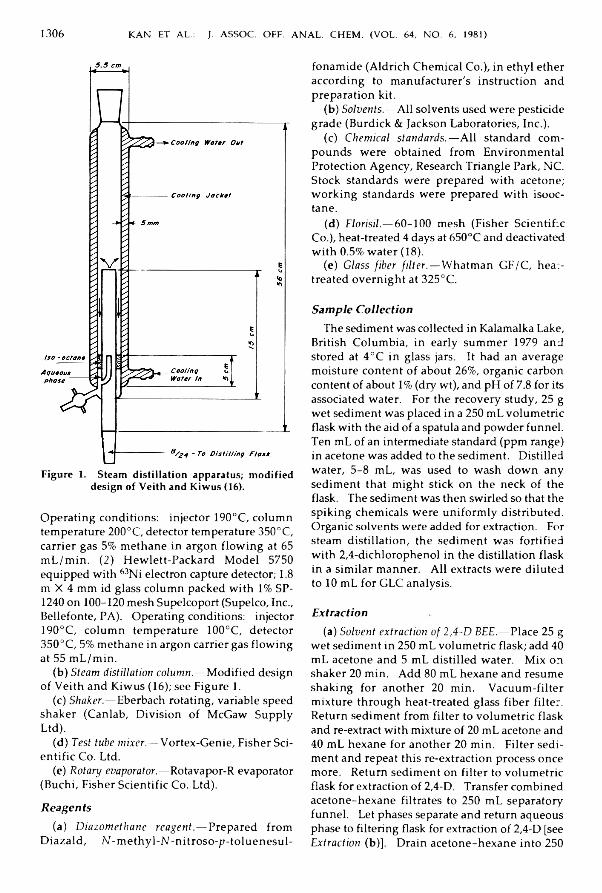
1 3 06 KAN ET AL.: J. ASSOC. OFF. ANAL. CHEM. (VOL. 64, N O . 6, 1981)
F ig u re 1. S team d is ti l la tio n ap p a ra tu s ; m o d ified d esign of V e ith an d K iw u s (16).
Operating conditions: injector 190°C, column temperature 200 °C , detector temperature 350°C , carrier gas 5% methane in argon flow ing at 65 m L/m in . (2) H ew lett-Packard Model 5750 equipped w ith 63N i electron capture detector; 1.8 m X 4 mm id glass column packed w ith 1% SP- 1240 on 100-120 mesh Supelcoport (Supelco, Inc., Bellefonte, PA ). Operating conditions: injector 190°C, column temperature 100°C, detector 350°C , 5% methane in argon carrier gas flow ing at 55 m L/m in .
(b) S te a m d is tilla tio n c o lu m n .— Modified design of Veith and K iw u s (16); see Figure 1.
(c) S h a k e r .— Eberbach rotating, variable speed shaker (Canlab, D iv is ion of M cGaw Supply Ltd).
(d) T e s t tu b e m ix e r .— Vortex-Genie, F isher Scientific Co. Ltd .
(e) R o ta r y e va p o ra to r .— Rotavapor-R evaporator (Buch i, F isher Scientific Co. Ltd).
R e a g e n t s(a) D ia z o m e th a n e r e a g e n t .— Prepared from
D iaza ld , N-m ethyl-N -nitroso-p-toluenesul-
fonamide (A ld rich Chemical Co.), in ethyl ether according to manufacturer's instruction and preparation kit.
(b) S o lv e n ts .—A ll solvents used were pesticide grade (Burd ick & Jackson Laboratories, Inc .).
(c) C h e m ic a l s ta n d a r d s .—A ll standard compounds were obtained from Environm ental Protection Agency, Research Triangle Park, N C. Stock standards were prepared w ith acetone; w ork ing standards were prepared w ith isooctane.
(d) F lo r is il .— 60-100 mesh (F isher Scientific Co.), heat-treated 4 days at 650°C and deactivated w ith 0.5% water (18).
(e) G la ss f ib e r f i l t e r .—Whatman G F/C , heat- treated overnight at 325°C.
S a m p l e C o l l e c t i o nThe sediment was collected in Kalamalka Lake,
B ritish Colum bia, in early summer 1979 and stored at 4°C in glass jars. It had an average moisture content of about 26%, organic carbon content of about 1% (dry w t), and pH of 7.8 for its associated water. For the recovery study, 25 g wet sediment was placed in a 250 m L volum etric flask w ith the aid of a spatula and powder funnel. Ten m L of an intermediate standard (ppm range) in acetone was added to the sediment. D istilled water, 5-8 m L, was used to wash down any sediment that m ight stick on the neck of the flask. The sediment was then sw irled so that the sp iking chemicals were un ifo rm ly distributed. Organic solvents were added for extraction. For steam d istilla tion , the sediment was fortified w ith 2,4-dichlorophenol in the d istillation flask in a sim ilar manner. A ll extracts were diluted to 10 m L for G LC analysis.
E x t r a c t i o n(a) S o lv e n t e x tr a c t io n o f 2 A - D B E E .— Place 25 g
wet sediment in 250 m L volum etric flask; add 40 m L acetone and 5 m L d istilled water. M ix on shaker 20 m in. Add 80 m L hexane and resume shaking for another 20 m in. Vacuum -filter m ixture through heat-treated glass fiber filte r. Return sediment from filte r to volum etric flask and re-extract w ith mixture of 20 m L acetone and 40 m L hexane for another 20 m in. F ilte r sediment and repeat this re-extraction process once more. Return sediment on filte r to volum etric flask for extraction of 2,4-D. Transfer combined acetone-hexane filtrates to 250 m L separatory funnel. Let phases separate and return aqueous phase to filtering flask for extraction of 2,4-D [see E x tr a c tio n (b)]. D rain acetone-hexane into 250
KAN ET AL.: J. ASSOC. OFF. ANAL. CHEM . (VOL. 64, N O . 6, 1981) 1 3 0 7
m L round-bottom flask; then add 5 m L isooctane. Strip acetone-hexane from extract on rotary evaporator and reduce volum e to ca 0.5 m L. Transfer concentrated extract to 15 m L graduated centrifuge tube w ith the aid of isooctane and dilute to 10 m L for G LC analysis on 3% OV-101 column.
(b) S o lv e n t e x tr a c t io n o f 2 ,4 - D .— Add 5 m L distilled water, 8 m L sulfu ric acid (50%), and 50 m L methanol to sediment derived from previous extraction (a). Check pH of slurry w hich should be below 2. Shake m ixture 20 m in on shaker. F ilte r m ixture and pour filtrate into flask that contains aqueous phase saved from previous extraction (a). Re-extract sediment w ith 50 m L methanol for another 20 m in. Transfer combined filtrate to 250 m L round-bottom flask and flash-evaporate until only aqueous fraction remains. Then add 50 m L methylene chloride and shake b rie fly . Em pty m ixture into 250 m L separatory funnel and shake vigorously ca 1 m in. When phases separate, drain methylene chloride into Erlenmeyer flask. Re-extract aqueous phase w ith another 25 m L m ethylene chloride. D ry combined organic extract over anhydrous sodium sulfate. Carefully decant extract into 150 m L round-bottom flask ; rinse sodium sulfate w ith 5 m L isooctane. Concentrate extract and isooctane wash to ca 0.5 m L. Cool flask under cold water tap or in ice bath. Add diazomethane dropwise until ye llow color persists; generally 0.5 m L w ill suffice. Do n o t transfer extract to sm aller container such as 15 m L centrifuge tube for deriva- tization. Perform derivatization in same round- bottom flask to prevent any unpredictable loss of 2,4-D due to adsorption on flask (G . Y . P. Kan et al., manuscript in preparation). A fter addition of diazomethane, let m ixture stand 5-10 m in at room temperature. Remove excess diazomethane by b low ing w ith nitrogen. Transfer product w ith isooctane to 15 m L graduated centrifuge tube and dilute to 10 m L for G LC analysis on a 3% OV-101 colum n.
(c) E x tr a c t io n o f 2 ,4 -d ic h lo r o p h e n o l b y s te a m d is t i l la t io n .—Introduce 25 g wet sediment into 500 m L round-bottom flask ; add 100 m L d istilled water and 15 m L isooctane. Attach d istillation colum n to flask (Figure 1) and gently reflux m ixture 2 h. Cool flask , drain aqueous phase trapped in d istilla tion colum n, and collect isooctane d istillate in 15 m L graduated centrifuge tube. R inse d istilla tion colum n w ith some isooctane. Pool rinses and dilute to 15 m L; then vortex-m ix w ith 2-5 drops of m etallic m ercury to remove sulfurous materials before G LC analysis on 1% SP-1240 colum n.
C l e a n u p o f 2 , 4 - D a n d 2 , 4 - D B E ERaw extracts of sediment samples usually
contain numerous co-extractives and artifacts w h ich have G LC responses s im ilar to the herbicides in question. These interferences, however, may be conveniently removed by means of a F lo ris il column.
F lo ris il c le a n u p c o lu m n .— Place plug of glass wool into 23 cm disposable pipet. Pack pipet w ith ca 3 g F lo ris il. Place 2-4 mm anhydrous sodium sulfate on top of F lo ris il. Wet column w ith petroleum ether (30-60°C). Place 15 m L graduated centrifuge tube under pipet as receiver. Transfer derivatized raw extract quantita tive ly onto column w ith some petroleum ether. Elute column w ith 15 m L petroleum ether; discard this eluate. Next elute column w ith 10 m L ethyl ether-petroleum ether (1 + 1) in to 1 15 m L graduated centrifuge tube. Concentrate eluate w ith dry nitrogen to near dryness and dilute to 10 m L w ith isooctane for G LC analysis. Recoveries of 2,4-D m ethyl ester and 2,4-D BEE range from 95 to 100%.
Resu lts and D iscussionMean recoveries from wet sediment samples
spiked w ith low and high doses of 2,4-D BEE,2,4-D, and 2,4-dichlorophenol ranged from 99 to 108%, 94 to 102%, and 74 to 76%, respectively (Table 1). W h ile 2,4-D BEE could be isolated satisfactorily by solvent extraction using a m ixture of acetone and hexane, 2,4-D was not extractable from sediment unless the medium was acidified to pH < 2 w ith sulfuric acid. Methanol was used in the extraction of 2,4-D because it was a polar solvent and would readily wet the surface of the sediment particles in the presence of aqueous acid. For derivatization, it was necessary to back-extract the 2,4-D from the aqueous methanol fraction w ith m ethylene chloride. It is essential to remove the methanol from the aqueous phase before addition of m ethylene chloride because methanol is soluble in both methylene chloride and water and thus it would interfere w ith the partitioning of 2,4-D into m ethylene chloride.
Methylene chloride in the extract, in turn, had to be displaced w ith isooctane before derivatization because it w ould saturate the electron capture detector of the gas chromatograph. Derivatization w ith diazomethane was performed in the same round-bottom flask that was used to concentrate the isooctane extract to prevent losses of 2,4-D due to adsorption on the glass (G . Y . P. Kan et a l., m anuscript in preparation).

13 08 KAN ET AL.: J. ASSOC. OFF. ANAL. CHEM . (VOL. 64, NO. 6, 1981)
Table 1. Recovery (%) of 2,4-dichlorophenol, 2,4-0 BEE, and 2,4-D from 25 g wet sediment
Sample
2,4-Dichloro- phenol added, p g
2,4-D added, p g
2,4-D BEE added, p g
0.4 2.5 0 . 2 2 . 0 0.4 4.01 72 75 83 104 1 1 1 912 72 78 1 0 0 103 1 1 1 1 0 03 78 75 1 0 0 1 0 0 104 1084 75 75 94 1 0 2 106 97
Mean 74.3 75.8 94.3 1 0 2 108 99.0SD 2.87 1.50 8 . 0 1 1.29 3.56 7.07CV. % 3.87 1.98 8.50 1.25 3.29 7.14
From recovery data, it appeared that steam d istilla tion offered a sim ple procedure for the quantitative determ ination of 2,4-dichlorophenol in sediment. Because only a sm all amount of solvent was required during steam distillation, this procedure elim inated any uncontrollable loss of volatile 2,4-dichlorophenol on the rotary evaporator. During steam d istilla tion , a great deal of sulfurous material was co-distilled, w hich interfered w ith 2,4-dichlorophenol analysis on the 1% SP-1240 column (19). H ow ever, these interferences could be conveniently removed by vortexing the distillate w ith a few drops of meta llic m ercury. One advantage of using 1% SP-1240 over 3% OV-101 is that no derivatization of the 2,4-dichlorophenol is necessary. D is t illation for 1 h gave only 45-57% recovery, w h ile d istillation over a period of 2 h gave 74-75% recovery. Further distillation of the sediment for1.5 h did not produce additional yie ld .
To show that 2,4-D BEE and 2,4-D did not contribute to the recovery of 2,4- dichlorophenol during steam d istilla tion , a duplicate sediment sample (25 g) was spiked w ith 2,4-D BEE (4 jig) and 2,4-D (2 p tg ) and steam d istilled 2 h. H ow ever, no trace of 2,4-dichlorophenol was observed from the steam distillate.
O ur attempts to isolate 2,4-D B EE by steam distillation failed because this compound rapidly hydrolyzed to 2,4-D once the temperature of the sediment was increased. In fact, the hydro lysis of 2,4-D B EE to 2,4-D under basic or acidic conditions has been w ell documented (5). Attempts to extract this compound by using methylene chloride failed because of formation of emulsion w h ich presented great d ifficu lties in the subsequent filtration process.
Acknow ledgm entsThe authors are indebted to A . P. Gaunce of
Agricu lture Canada, Sum m erland, B ritish Co
lum bia, and A . S. Y . Chau, National W ater Research Institute, Burlington , Ontario , fo r their helpfu l suggestions that made the paper more readable and inform ative.
Rf.ferences(1) Phcnoxy Herbicides- Their Effects on Environmental
Qualitf (1978) N ational R esearch C ouncil of C anada Publication No. 16075
(2) R enberg , L. (1974) Anal. Chern. 46 ,459-461(3) K han, S. U. (1975) /. Assoc. Off. Anal. Chem. 58,
1027-1031(4) Sm ith , A. E. (1976) /. Chromatogr. 129, 309-314(5) Cochrane, W. P„ & Russell, J. B. (1975) Can. J. Plant
Sci. 55 ,323-325(6 ) Z epp , R. G„ W olfe, N. L., G ordon, J. A., & Baug-
ham n , G. L. (1975) Environ. Sci. Technol. 9, 1144- 1150
(7) A gem ian, H „ & C hau, A. S. Y. (1977) J. Assoc. Off. Anal. Chem. 60,1070-1076
(8 ) O sadchuk , M., Salahub, E., & R obinson, P. (1977) J. Assoc. Off. Anal. Chern. 60,1324-1327
(9) Sm ith , A. E. (1978) Pestic. Sci. 9 ,7(10) O lson, B. A., Sneath , T. C„ & Jain , N. C. (1978) J.
Agric. Food Chem. 26, 640-643(11) M ierzw a, S., & W itek, S. (1977) /. Chromatogr. 136,
105(12) Sm ith , A. E. (1976) Weed Res. 16 ,19(13) C ochrane, W. P„ G reenhalgh , R., & Looney, N. E.
(1976) Can. J. Plant Sci. 56, 207(14) D ebeer, J., Van P eteghem , C. H „ & H eyndrickx ,
A. (1978) /. Chromatogr. 157, 97(15) Goldberg, M. C., & W einer, E. R. (1980) Anal. Chim.
Ada 115,373-378(16) V eith , G. D., & Kiwus, L. M. (1977) Bull. Environ.
Contam. Toxicol. 17, 631-636(17) Peters, T. L. (1980) Anal. Chem. 52 ,211-213(18) M cK inley, J., & Kuechler, A. (1977) Proc. 12th Ann.
Workshop Pestic. Anal. 5th Ann. Workshop Chem. Biochem. Pestic., W in n ip eg , M anitoba , pp . 34-41
(19) Sampling and Analysis Procedures for Screening of Industrial Effluent for Priority Pollutants (1977), U.S. E nv ironm ental P ro tec tion A gency, W ashing ton , DC

WINKLER ET AL.: J. ASSOC. OFF. ANAL. CHEM . (VOL. 64, N O . 6, 1981) 1 3 0 9
D e t e r m i n a t i o n o f N o r f l u r a z o n R e s i d u e s i n M i x e d C r o p M a t r i c e s
VICTOR W. WINKLER, JAYANTI R. PATEL, MARY JANUSZANIS,and MARJORIE COLARUSSOSandoz, Inc., Crop Protection, East Hanover, NJ 07936A m e th o d fo r d e te rm in in g n o rf lu ra z o n re s id u es in m ix ed cro p m atric es is d esc rib ed . T h e m e th o d in c lu d e s m e th a n o l S o x h le t ex trac tio n , h ex an e w ash , ad d itio n of 10% saline, m eth y len e ch lo ride extraction , c o n c e n tra tio n , p re p a ra tiv e th in la y e r ch ro m ato g ra p h y o f 10% sam p le a l iq u o t, a n d resu sp en sio n of sam ple zo n e fo r g as-liq u id ch rom atograph ic analysis. T h e lo w e r leve l o f e lec tro n c a p tu re d e te c tio n is 0.01 p p m . R ecoveries fo r 0.08 p p m sp ik e d sam p les o f co tto n seed ; so y b ea n seed a n d fo liag e; p e a n u t seed p lu s h u lls a n d fo liag e; o ran g e a n d ta n g e rin e ; lem o n ; a p p le a n d peach ; an d so il a re g e n e ra lly g re a te r th a n 80%.
N o rflu razo n , 4-ch lo ro-5-(m ethylam ine)-2- (a ,a ,a-trifluo ro-m -to ly l)-3-(2H )-pyridazinone , is a pre-emergence herbicide for cotton, cranberries, fru its , and nuts. Crop residues consist of norflurazon and its desmethyl metabolite. A combination of several methods developed for residue analysis o f several ind iv idua l crop substrates is described by Brady et al. ( 1 ). However, proposed label expansion for use on other crops such as soybeans, peanuts, and citrus requires the developm ent of a norflurazon residue method applicable for a ll substrate matrices.
M E T H O D
R e a g e n t sSolvents must be pesticide grade or equivalent.
Suitable products are available from Burdick & Jackson Laboratories, Inc ., and other manufacturers. See O ffic ia l M e th o d s o f A n a ly s i s (2) for so lvent p u rity tests.
(a) D e s m e th y l n o r f lu r a z o n s ta n d a r d .— 99+% pure (Sandoz, Inc.)
(b) N o r flu r a z o n s ta n d a r d .— 99+% pure (Sandoz, Inc .)
(c) P h o s p h o r ic a c id s o lu t io n .—0.01% in methanol.
(d) S o d iu m ch lo ride s o lu tio n .— 10% in deionized water.
(e) T L C p la te s .—20 X 20 cm, silica gel G F 254, 250 pm (Analtech).
Received October 24,1980. Accepted June 30,1981.This paper was presented in part at the 94th Annual Meeting of the AOAC, Oct. 20-23,1980, at Washington, DC.
A p p a r a t u s(a) G a s c h r o m a to g r a p h .— H ew lett-Packard
M odel 5700, or equivalent, w ith 63N i electron capture detector and 1 m X 2 mm id glass column packed w ith 0.15% Po ly A 103 plus 3% SE-30 m ixed phase on Chromosorb W (H P) (Applied Science Laboratories). Operating conditions: temperatures (°C )—column 200, injection port 250, detection block 350; carrier gas 5% argon- methane; flow rate 30 m L/m in .
(b) S o x h le t e x tra c to r .—Equipped w ith hot plate and 35 X 94 mm extraction thimbles or equivalent.
P r e p a r a t i o n o f S t a n d a r d s(a) N o r f lu r a z o n s to c k s o lu t io n .— 1 m g/m L.
D issolve 100 mg norflurazon in methanol and dilute to 100 m L w ith same solvent.
(b) D e s m e th y l n o r f lu r a z o n s to c k s o lu t io n . — 1 m g/m L. D issolve 100 mg desmethyl norflurazon in methanol and dilute to 100 m L w ith same solvent.
(c) N o r f l u r a z o n p l u s d e s m e t h y l n o r f l u r a z o n w o r k in g so lu tio n A .— 10 pg/m L admixture. Dilute 1 m L each of norflurazon and desmethyl norflurazon, 1 m g/m L stock solution, to 100 m L w ith methanol.
(d ) N o r f l u r a z o n p l u s d e s m e t h y l n o r f l u r a z o n w o r k in g s o lu tio n B . -1 pg/m L admixture. D ilute 10 m L w ork ing solution A to 100 m L w ith m ethanol.
(e ) N o r f l u r a z o n p lu s d e s m e t h y l n o r f l u r a z o n s ta n d a r d c u r v e s o lu t io n s .— 0.1,0.08, 0.06,0.04, and0.02 p g/m L adm ixture in 0.01% methanolic H 3PO 4. D ilu te the 1 pg/m L w ork ing solution B w ith 0.01% m ethanolic H 3PO4 as shown below:
C o n c n , W o r k in g0 .0 1 %
H 3PO 4 inp g l m l S o in B M e th a n o l
0 .1 0 10 900.08 8 920.06 6 940.04 4 960 .0 2 2 98
0004-5756/81/6406-1309-03Í01.00© Association of Official Analytical Chemists. Inc.
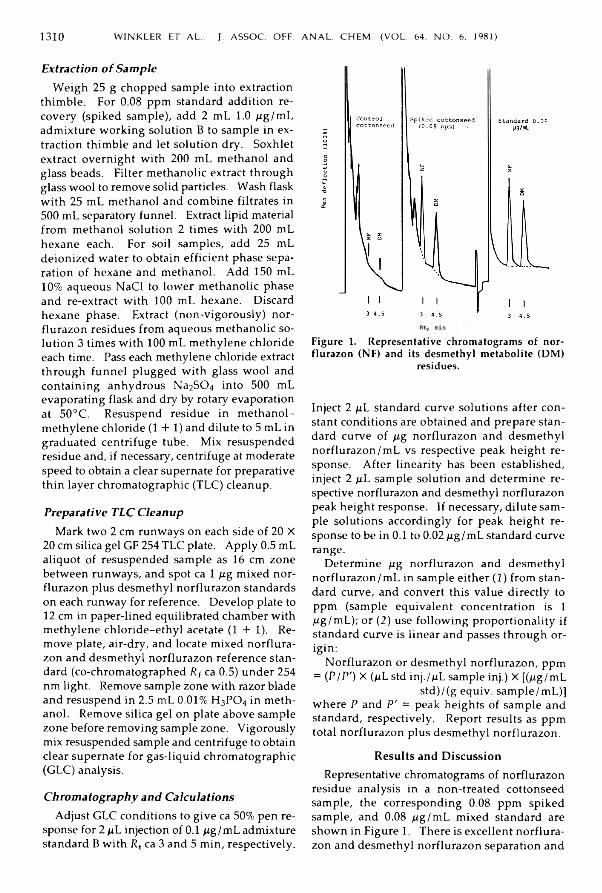
1 3 1 0 WINKLER ET AL.: J. ASSOC. OFF. ANAL. CHEM . (VOL. 64, N O . 6, 1981)
E x t r a c t i o n o f S a m p l eW eigh 25 g chopped sample into extraction
th im ble. For 0.08 ppm standard addition recovery (spiked sample), add 2 m L 1.0 p g / m L adm ixture w ork ing solution B to sample in extraction thim ble and let solution dry. Soxhlet extract overnight w ith 200 m L methanol and glass beads. F ilte r methanolic extract through glass wool to remove solid particles. Wash flask w ith 25 m L methanol and combine filtrates in 500 m L separatory funnel. Extract lip id material from methanol solution 2 times w ith 200 m L hexane each. For soil samples, add 25 m L deionized water to obtain efficient phase separation of hexane and methanol. Add 150 m L 10% aqueous N aC l to lower methanolic phase and re-extract w ith 100 m L hexane. Discard hexane phase. Extract (non-vigorously) nor- flurazon residues from aqueous methanolic solution 3 times w ith 100 m L m ethylene chloride each time. Pass each methylene chloride extract through funnel plugged w ith glass wool and containing anhydrous Na2SC>4 into 500 m L evaporating flask and dry by rotary evaporation at 50°C . Resuspend residue in methanol- m ethylene chloride (1 + 1) and dilute to 5 m L in graduated centrifuge tube. M ix resuspended residue and, if necessary, centrifuge at moderate speed to obtain a clear supernate for preparative th in layer chromatographic (T LC ) cleanup.
P r e p a r a t i v e T L C C l e a n u pM ark two 2 cm runways on each side of 20 X
20 cm silica gel GF 254 T L C plate. A pp ly 0.5 m L aliquot of resuspended sample as 16 cm zone between runw ays, and spot ca 1 p g m ixed nor- flurazon plus desmethyl norflurazon standards on each runway for reference. Develop plate to 12 cm in paper-lined equilibrated chamber w ith m ethylene ch lo ride-ethyl acetate (1 + 1). Remove plate, air-dry, and locate mixed norflurazon and desmethyl norflurazon reference standard (co-chromatographed R f ca 0.5) under 254 nm light. Remove sample zone w ith razor blade and resuspend in 2.5 m L 0.01% H 3PO 4 in methanol. Remove silica gel on plate above sample zone before removing sample zone. Vigorously m ix resuspended sample and centrifuge to obtain clear supernate for gas-liquid chromatographic (G LC ) analysis.
C h r o m a t o g r a p h y a n d C a l c u l a t i o n sAdjust G LC conditions to give ca 50% pen re
sponse for 2 p L injection of 0.1 p g / m L admixture standard B w ith R t ca 3 and 5 m in , respectively.
Figure 1. Representative chromatograms of norflurazon (NF) and its desmethyl metabolite (DM)
residues.
Inject 2 p L standard curve solutions after constant conditions are obtained and prepare standard curve of p g norflurazon and desmethyl norflurazon/m L vs respective peak height response. A fter linearity has been established, inject 2 p L sample solution and determ ine respective norflurazon and desmethyl norflurazon peak height response. I f necessary, d ilute sample solutions accordingly for peak height response to be in 0.1 to 0.02 p g / m L standard curve range.
Determ ine p g norflurazon and desmethyl norflurazon/m L in sample either (1) from standard curve, and convert th is value d irectly to ppm (sample equivalent concentration is 1 qg/m L); or (2) use fo llow ing proportionality if standard curve is linear and passes through orig in :
N orflurazon or desmethyl norflurazon , ppm = ( P /P ' ) X ( p L std in j./p L sample inj.) X [(qg/m L
std)/(g equiv. sam ple/m L)] w here P and P ' = peak heights of sample and standard, respectively. Report results as ppm total norflurazon plus desmethyl norflurazon.
Resu lts and D iscussionRepresentative chromatograms of norflurazon
residue analysis in a non-treated cottonseed sample, the corresponding 0.08 ppm spiked sample, and 0.08 p g / m L m ixed standard are shown in Figure 1. There is excellent norflu razon and desmethyl norflurazon separation and
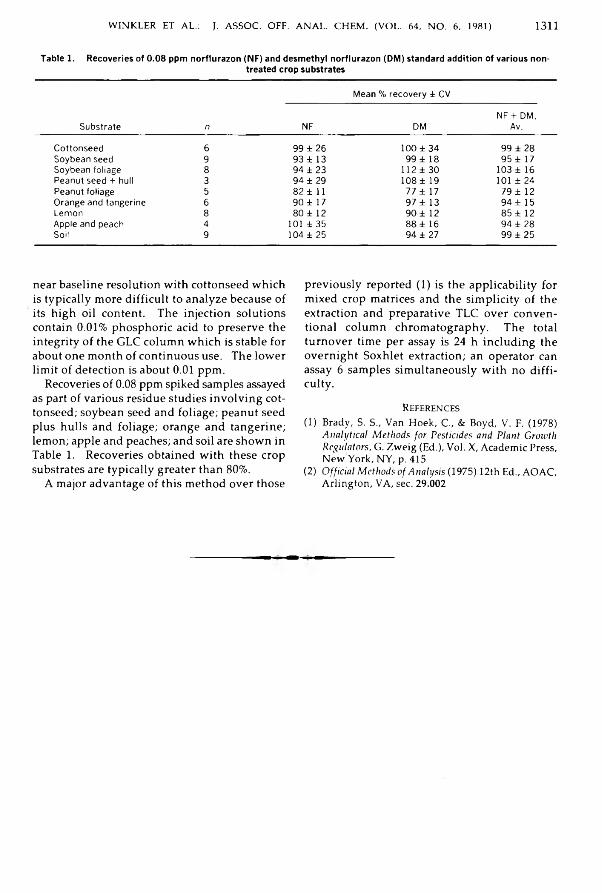
WINKLER ET AL.: J. ASSOC. OFF. ANAL. CHEM . (VOL. 64, NO. 6, 1981) 1311
Table 1. Recoveries of 0.08 ppm norflurazon (NF) and desmethyl norflurazon (DM) standard addition of various non-treated crop substrates
Substrate n NF
Mean % recovery ± CV
DMNF + DM,
Av.Cottonseed 6 99 ±2 6 100 ± 34 99 ± 28Soybean seed 9 93 ± 13 99 ± 18 95 ± 17Soybean foliage 8 94 ±2 3 112 ± 30 103 ± 16Peanut seed + hull 3 94 ± 29 108 ± 19 101 ± 2 4Peanut foliage 5 82 ± 11 77 ± 17 79 ± 12Orange and tangerine 6 90 ± 17 97 ± 13 94 ± 15Lemon 8 80 ± 1 2 90 ± 12 85 ± 12Apple and peach 4 101 ± 35 8 8 ± 16 94 ± 28Soil 9 104 ± 25 94 ± 27 99 ± 2 5
near baseline resolution w ith cottonseed w h ich is typ ica lly more d ifficu lt to analyze because of its high oil content. The injection solutions contain 0 .0 1 % phosphoric acid to preserve the integrity of the G LC column w h ich is stable for about one month of continuous use. The lower lim it of detection is about 0.01 ppm.
Recoveries of 0.08 ppm spiked samples assayed as part of various residue studies in vo lv ing cottonseed; soybean seed and foliage; peanut seed plus hu lls and foliage; orange and tangerine; lemon; apple and peaches; and soil are shown in Table 1. Recoveries obtained w ith these crop substrates are typ ica lly greater than 80%.
A major advantage of th is method over those
previously reported ( 1) is the app licab ility for mixed crop matrices and the s im p lic ity of the extraction and preparative T L C over conventional colum n chrom atography. The total turnover time per assay is 24 h includ ing the overnight Soxhlet extraction; an operator can assay 6 samples sim ultaneously w ith no d iff icu lty .
References(1) Brady, S. S„ V an H oek, C., & Boyd, V. F. (1978)
Analytical Methods for Pesticides and Plant Growth Regulators, G. Z w eig (Ed.), Vol. X, A cadem ic Press, N ew York, NY, p. 415
(2) Official Methods of Analysis (1975) 12th Ed., AOAC, A rlin g to n , VA, sec. 29.002

1 3 1 2 UDAYA BHASKAR & N A N D A KUMAR: J. ASSOC. OFF. ANAL. CHEM . (VOL. 64, NO. 6, 1981)
T h i n L a y e r C h r o m a t o g r a p h i c D e t e r m i n a t i o n o f M e t h y l P a r a t h i o n a s P a r a o x o n b y C h o l i n e s t e r a s e I n h i b i t i o n
SANA UDAYA BHASKAR and NANGUNERI V. NANDA KUMARS r i V e n k a t e s w a r a U n i v e r s i t y , D e p a r t m e n t o f Z o o l o g y , T i r u p a t i - 5 1 7 5 0 2 , I n d ia
A sim ple , sensitive, an d rap id m eth od is described for th e q u a n tita tiv e e s tim atio n o f nan o g ram am o u n ts o f m e th y l p a ra th io n ( 0 ,0 - d im e t h y l O -p -n itro p h e n y l p h o sp h o ro th io a te ) as m e th y l p arao x o n ( 0 ,0 - d i - m e th y l O -p -n itro p h e n y l p h o sp h a te ) o n th in la y e r ch rom atogram s. M ethy l paraoxon is d e tec ted b y p ig liv e r acetone p o w d er cho linesterase in h ib itio n , using p -n itro b e n z e n e d ia z o n iu m flu o ro b o ra te as th e ch ro - m o g en ic reag en t. C om m erc ial p ig liv e r ace to n e p o w d e r is m ore ad v an tag eo u s th an raw liv e r sources because i t is re a d ily av a ilab le an d can be p re se rv ed in d e f in ite ly . A b o u t 0.1 n g m e th y l p a ra th io n can be d e tec ted , a n d a m o u n ts fro m 5 to 50 n g can be q u a n tita tiv e ly estim ated .
T h in layer chromatographic (TLC )-enzym atic methods using cholinesterase (C h E ) inh ib ition techniques for detection (1, 2 ) and determination (3, 4) specify live anim al tissue sources for enzyme. O btaining and preparing the enzyme reagent is cumbersome and time consuming. Recently, sensitive and sim ple colorimetric methods using pig live r acetone powder as the enzym e source have been reported (5, 6 ) fo r estimating methyl parathion and dimethoate. We report on advantages of pig live r acetone powder compared w ith other sources, especially raw live r, the detection lim its, and the suitability for detecting m ethyl parathion as m ethyl paraoxon on T L C plates. Paddy grain samples were fortified w ith methyl parathion and analyzed by the TLC -enzym atic method described.
M E T H O D
A p p a r a t u s a n d R e a g e n t sUse analytical grade reagents.(a) G a s - l iq u id c h r o m a to g r a p h .—Varian Aero
graph series 1400 equipped w ith 6 ft X Vs in . id Pyrex glass column packed w ith 5% OV-17 on 60-80 mesh Chromosorb W. Nitrogen carrier gas (24 m L/m in ). A lk a li flame ionization detector w ith hydrogen flow 45 m L/m in and a ir flow 260 m L/m in . Temperatures (°C )—injector 150, column 190, and detector 200. Range 32 Xio-12.
(b ) M e t h y l p a r a th io n .— Prepare d iffe ren t concentrations of 99% pure m ethyl parathion
Received December 2,1980. Accepted March 12, 1981.
(Ciba-Geigy Ltd , Basel, Sw itzerland) in acetone.
(c) 1 - N a p h th y l a c e ta te s u b s tr a te s o lu t io n .—D issolve 20 mg 1-naphthyl acetate (Sigma Chemical Co., St. Lou is, M O 63178) in 4 m L acetone.
(d) p - N i tr o b e n z e n e d ia z o n iu m flu o r o b o r a te . — Reidel, Budapest, H ungary. Prepare 0.4% in acetone.
(e) S ilica g e l G .— BD H Laboratories, Bombay, India .
P r e p a r a t i o n o f E n z y m e f r o m L i v e r A c e t o n e P o w d e r s
Prepare separate 1% enzyme suspensions of live r acetone powders of pig, beef, and horse (Sigma Chem ical Co.) in d istilled water (0 -5°C ) w ith the help of electrical homogenizer. F ilte r through 4 layers of cheesecloth.
P r e p a r a t i o n o f E n z y m e f r o m S h e e p a n d R a t L i v e r s
Prepare separate 10% homogenates of fresh sheep and albino W istar rat live rs in d istilled water (0 -5°C ). F ilte r through 4 layers of cheesecloth and preserve suspension in refrigerator at 5°C before use.
T h i n L a y e r C h r o m a t o g r a p h yCoat 20 X 10.5 cm glass plates w ith 450 p m
layer of silica gel G in water s lu rry . A ir dry plates and activate 1 h in 110°C oven. Store plates in desiccator before use.
Clean up m ethyl parathion residues in fo rtified and fie ld samples of paddy grain by procedure of Mendoza and Sh ields (7). Concentrate aliquots to obtain equivalent amounts of residues in each extract. A pp ly different concentrations of m ethyl parathion standards (5-50 ng) and sample extracts w ith m icropipet, and oxidize methyl parathion to methyl paraoxon as reported previously (3).
Develop plate 15 cm in acetone-hexane (1 +4). A ir dry plate 5 m in. U n ifo rm ly spray live r acetone powder suspensions or raw live r suspensions over plate as fine m ist, thoroughly wetting gel. Keep plate 20 m in in moist atmosphere at 37°C . Spray plate w ith 1-naphthyl acetate substrate solution. Replace plate 2 m in in moist atmosphere at 37 °C . U n ifo rm ly spray
0004-5756/81/6406-1312-03$01.00© Association of Official Analytical Chemists, Inc.
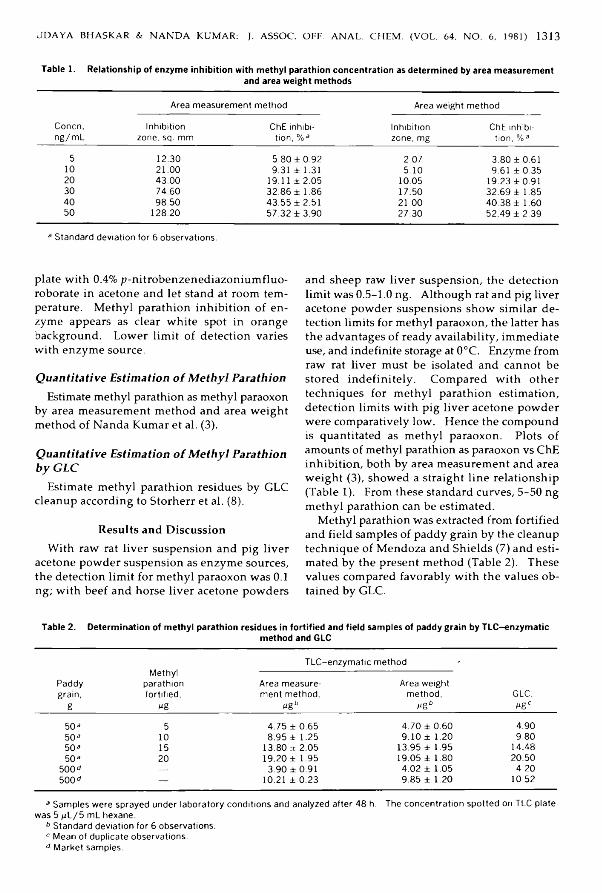
JD A Y A BHASKAR & N A N D A KUMAR: J. ASSOC. OFF. ANAL. CHEM . (VOL. 64, N O . 6, 1981) 1 3 13
Table 1. Relationship of enzyme inhibition with methyl parathion concentration as determined by area measurementand area weight methods
Area measurement method Area weight methodConcn, Inhibition ChE inhibi- Inhibition ChE inhibi-ng/mL zone, sq. mm tion, %a zone, mg tion, %a
5 12.30 5.80 ±0.92 2.07 3.80 ±0.611 0 2 1 . 0 0 9.31 ± 1.31 5.10 9.61 ±0.352 0 43.00 19.11 ±2.05 10.05 19.23 ±0.9130 74.60 32.86 ± 1.86 17.50 32.69 ± 1.8540 98.50 43.55 ±2.51 2 1 . 0 0 40.38 ± 1.6050 128.20 57.32 ±3.90 27.30 52.49 ± 2.39
a Standard deviation for 6 observations.
plate w ith 0.4% p-nitrobenzenediazonium fluo- roborate in acetone and let stand at room temperature. M ethyl parathion inh ib ition of enzyme appears as clear w hite spot in orange background. Low er lim it of detection varies w ith enzyme source.
Q u a n t i t a t i v e E s t i m a t i o n o f M e t h y l P a r a t h i o nEstimate methyl parathion as methyl paraoxon
by area measurement method and area w eight method of Nanda Kum ar et al. (3).
Q u a n t i t a t i v e E s t i m a t i o n o f M e t h y l P a r a t h i o n b y G L C
Estimate m ethyl parathion residues by G LC cleanup according to Storherr et al. (8).
Resu lts and D iscussionW ith raw rat live r suspension and pig live r
acetone powder suspension as enzym e sources, the detection lim it for m ethyl paraoxon was 0.1 ng ; w ith beef and horse live r acetone powders
and sheep raw live r suspension, the detection lim it was 0.5-1.0 ng. Although rat and pig live r acetone powder suspensions show s im ila r detection lim its for methyl paraoxon, the latter has the advantages of ready ava ilab ility , immediate use, and indefinite storage at 0°C . Enzym e from raw rat live r must be isolated and cannot be stored ind e fin ite ly . Compared w ith other techniques for m ethyl parathion estimation, detection lim its w ith pig live r acetone powder were comparatively low . Hence the compound is quantitated as m ethyl paraoxon. Plots of amounts of methyl parathion as paraoxon vs ChE inh ib itio n , both by area measurement and area w eight (3), showed a straight line relationship (Table 1). From these standard curves, 5-50 ng m ethyl parathion can be estimated.
M ethyl parathion was extracted from fortified and fie ld samples of paddy grain by the cleanup technique of Mendoza and Sh ields (7) and estimated by the present method (Table 2). These values compared favorably w ith the values obtained by G LC .
Table 2. Determination of methyl parathion residues in fortified and field samples of paddy grain by TLC-enzymaticmethod and GLC
TLC-enzymatic method -Methyl
Paddy parathion Area measure- Area weightgrain, fortified, ment method, method, GLC,
g Mg MS b Mg6 Mgc50 a 5 4.75 ± 0.65 4.70 ± 0.60 4.9050 a 1 0 8.95 ± 1.25 9.10 ± 1 . 2 0 9.8050 a 15 13.80 db 2.05 13.95 ± 1.95 14.4850 a 2 0 19.20 ± 1.95 19.05 ± 1.80 20.50
500 d — 3.90 ± 0.91 4.02 ± 1.05 4.20500 o — 1 0 . 2 1 ± 0.23 9.85 ± 1 . 2 0 10.52
3 Samples were sprayed under laboratory conditions and analyzed after 48 h. The concentration spotted on TLC plate was 5 mL / 5 mL hexane.
b Standard deviation for 6 observations. c Mean of duplicate observations. d Market samples.
1 3 1 4 UDAYA BHASKAR & N A N D A KUMAR: J ASSOC. OFF. ANAL. CHEM . (VOL. 64, N O . 6, 1981)
A c k n o w l e d g m e n tsThe authors thank S. K . Majumder, Deputy
D irector, Central Food Technological Research Institute, Mysore, for providing facilities for G LC analysis, and K . Visweswaraiah and G. S. Raju for their technical help. One of the authors (SUB) is grateful to C S IR , N ew D e lh i, for financia l assistance.
References(1) M endoza, C. E. (1972) Residue Rev. 43 ,105-142(2) M endoza, C. E. (1974) Residue Rev. 50 ,4 3 -7 2
(3) N anda K um ar, N. V., V isw esw araiah , K., & M ajum der, S. K. (1976) /. Assoc. Off. Anal. Chem. 59, 641-643
(4) N anda K um ar, N. V., V isw esw araiah , K., & M ajum der, S. K. (1976) /. Agric. Biol. Chem. 40, 431- 432
(5) N anda K um ar, N. V., & R am asundari, M. (1980) /. Assoc. Off. Anal. Chem. 63, 536-538
(6 ) U daya Bhaskar, S., & N an d a K um ar, N. V. (1980) Talanta, 27, 757-758
(7) M endoza, C. E„ & Shields, J. B. (1971) ]. Assoc. Off. Anal. Chem. 54, 507-512
(8 ) S to rh err, R. W „ O tt, P. J., & W atts, R. R. (1971) /. Assoc. Off. Anal. Chem. 54, 513-516
BLAND: J. ASSOC. OFF. ANAL. CHHM. (VOL. 64, NO. 6, 1981) 1315
P E S T IC ID E FO R M U LA TIO N S
G a s - L i q u i d C h r o m a t o g r a p h i c D e t e r m i n a t i o n o f P i r i m i c a r b i n F o r m u l a t i o n s : C o l l a b o r a t i v e S t u d y
PETER D . B L A N DIC1 Americas Inc., PO Box 208, Goldsboro, NC 27530C o lla b o ra to rs: J. B a g n ess; W . B lack; L. B ro w n ; M . G en try ; B. G in th e r ; E. H a y es;P. H o lla n d ; S. Ja ck lin g ; J. P a d m o re; L. T orm a; G. W in ste a d
A method is described for the determination of pirimicarb (2-(dimethylamino)-5,6-dimethyl-4-pyrim- idinyl dimethylcarbamate) in formulated products by gas-liquid chromatography (GLC). Samples are dissolved in a chloroform solution of an internal standard and injected into a gas chromatograph equipped with a flame ionization detector. Quantitative data are obtained by comparing peak areas of the compound and internal standard with those obtained by injecting a standard solution. Eleven collaborators made replicate determinations on 6 samples including a technical product, a granular product, and 4 powder products. The average coefficient of variation was 1.14% for the technical product, 1.82% for the granular product, and 0.73% for the powder products.Pirim icarb (2 -(d im eth ylam in o)-5 ,6-d im eth yl-4-pyrim id inyl dim ethylcarbam ate) is a fast-actin g se lective aphicide o f m oderate m am m alian toxicity. It is the active in gred ien t o f the products Pirimor® and Aphox® (registered trademarks of Imperial Chem ical Industries Ltd, L ondon, UK). Pirimor and A phox have proved effective against organophosphorus-resistant aphids. In addition to contact action , Pirim or spray has a fum igant effect and its persistence in treated crops is short ( 1).
M ethods o f analysis for pirim icarb in v o lv in g titrim etry, colorim etry, and gas-liquid chrom atography are described in the literature (2, 3). This collaborative stu dy is based on a gas-liquid chrom atographic m ethod described by Bagness and Sharpies (3).
P irim icarb — G as-L iquid C hrom atographic M eth od — O ffic ia l First A ction
PrinciplePirimicarb is detd by gas-liq. chromatgy, using
nonadecane as internal std and flam e ionization detection. Peak areas are compared w ith that of std o f k n ow n purity.
Apparatus(a) Gas chrom atograph.—W ith heated, glass-
lin ed , injection port and flam e ion ization d etector. C onditions g iv en are for H ew lett Packard M odel 5710A. O ther instrum ents may require chan gin g operating parameters to obtain good resolu tion and response. Tem ps (° )— colum n 210, injection port 240, detector 250; gas f lo w rates (m L /m in )— N carrier gas 40, H 60, air 240; attenuation 32 X 10; sam ple s ize 1.0 pL ; retention tim es (m in)— pirimicarb 6 .8 , internal std 8.9. Adjust parameters to assure com p lete sepn o f peaks, and peak hts ca 60-80% fu ll scale on chart at quoted retention tim es.
(b) C olum n.— 1.8 m (6 ft) X 0.25 in. (od) X 2 m m (id) glass colum n packed w ith 10% silicone SE-30 on 100-120 m esh Chrom osorb W(HP) (A pplied Science Laboratories, Inc.). S ilan ize w ith 30 p L S ily l 8 (Pierce Chem ical Co., PO Box 117, Rockford, IL 61105) and heat to 300° for 16 h before use.
Reagents(a) N onadecane in ternal s td so ln .—Accurately
w eigh ca 1 g nonadecane (Aldrich Chem ical Co., Cat. No. N2890-6) and dissolve in 100 mL CHCI3. Store in tigh tly capped bottle to avoid evapn. Check internal std soln for in terfering com ponen ts by injecting 1 p h in to chrom atograph.
(b) Pirimicarb s td so ln .—A ccurately w e ig h ca 150 m g pirim icarb std o f k n ow n purity (ICI Americas Inc., PO Box 208, Goldsboro, NC 27530) in to vial. P ipet 10.0 mL internal std so ln into vial, cap, and shake to dissolve pirimicarb. Store tigh tly capped to avoid evapn.
Received January 23,1981. Accepted June 2, 1981.The recommendation of the Associate Referee was approved by the General Referee and Committee A and adopted by the Association. See J. Assoc. Off. Anal. Chem. 65, March issue (1982) for detailed reports.This report of the Associate Referee was presented at the 95th Annual Meeting of the AOAC, Oct. 19-22,1981, at Washington, DC.
0004-5756/81 /6406-1315-04$01.00© Association of Official Analytical Chemists, Inc.

1316 BLAND: J. ASSOC. OFF. ANAL. CHEM . (VOL. 64, N O . 6, 1981)
Table 1. Collaborative results for GLC determination of pirimicarb (% active ingredient)
Sample 1 Sample 2 Sample 3 Sample 4 Sample 5 Sample 6technical powder powder powder powder granule * *
Coll. Day 1 Day 2 Day 1 Day 2 Day 1 Day 2 Day 1 Day 2 Day 1 Day 2 Day 1 Day 2
1 97.67 96.75 50.00 50.05 49.83 49.83 47.56 47.48 45.66 45.58 48.75 48.5096.96 97.45 50.05 49.97 49.90 49.85 47.47 47.51 45.59 45.58 48.77 48.54
Mean 97.32 97.10 50.03 50.01 49.87 49.84 47.52 47.50 45.63 48.58 48.76 48.52
2 s 99.44 98.56 50.83 49.27 50.56 50.05 48.96 48.94 48.69 46.94 50.89 50.01100.72 96.97 50.89 49.53 51.34 49.95 49.29 47.75 47.86 47.80 51.16 50.46
Mean 100.08 97.76 50.86 49.40 50.95 50.00 49.13 48.34 48.28 47.37 51.03 50.24
3 b 97.88 97.43 50.06 49.18 49.43 49.12 47.00 46.77 45.68 45.36 49.07 49.2597.88 96.75 50.25 50.15 49.38 49.59 47.65 47.12 45.11 45.31 49.07 50.16
Mean 97.88 97.09 50.16 49.67 49.41 49.36 47.33 46.95 45.40 45.34 49.07 49.71
4 C 97.98 97.84 50.34 50.31 50.11 49.91 47.79 47.52 45.67 45.56 48.35 48.0397.98 97.87 50.35 50.29 50.12 49.88 47.79 47.50 45.65 45.56 48.35 48.03
Mean 97.98 97.85 50.34 50.30 50.11 49.90 47.79 47.51 45.66 45.56 48.35 48.03
5 96.01 98.51 50.13 49.91 49.74 49.55 47.34 47.98 45.56 46.00 48.72 47.9295.93 98.43 50.08 49.87 49.72 49.61 47.41 48.07 45.54 45.99 48.77 47.92
Mean 95.97 98.47 50.11 49.89 49.73 49.58 47.38 48.03 45.55 46.00 48.75 47.92
6 d 95.03 98.07 50.19 50.19 50.11 49.81 47.45 47.55 45.29 45.57 48.23 48.4295.60 98.13 50.32 50.24 50.14 49.87 47.44 47.54 45.30 45.61 48.24 48.41
Mean 95.32 98.10 50.26 50.22 50.13 49.84 47.45 47.55 45.30 45.59 48.24 48.42
7 98.85 98.09 50.57 49.88 49.95 49.80 48.49 47.63 45.89 45.59 47.68 47.9197.93 98.36 50 56 49.95 50.56 50.02 48.06 47.41 45.71 45.99 47.89 48.52
Mean 98.39 98.22 50.57 49.91 50.25 49.91 48.27 47.52 45.80 45.79 47.78 48.22
8 C 98.02 98.69 50.44 50.01 49.97 49.67 47.76 47.23 46.07 45.76 49.96 49.7298.01 98.23 49.80 49.78 49.79 49.67 47.56 47.45 45.89 45.85 49.93 49.36
Mean 98.01 98.46 50.12 49.90 49.88 49.67 47.66 47.34 45.98 45.81 49.94 49.54
9 ' 97.93 97.73 49.93 50.28 49.63 49.65 47.48 47.66 45.33 45.53 48.91 47.8097.95 97.96 49.91 50.09 49.78 49.63 47.54 47.43 45.52 45.69 48.90 48.04
Mean 97.94 97.84 49.92 50.19 49.71 49.64 47.51 47.54 45.42 45.61 48.91 47.92
10« 95.41 95.50 51.30 50.91 50.54 50.42 48.44 48.46 46.47 46.52 50.51 50.4494.95 94.48 50.95 50.79 50.79 50.60 48.72 48.23 46.76 46.16 49.96 50.72
Mean 95.18 94.99 51.12 50.85 50.67 50.51 48.58 48.35 46.62 46.34 50.23 50.58
l l h 97.63 97.59 49.86 49.74 49.96 49.50 47.45 47.23 45.84 45.54 50.00 50.1297.70 97.49 50.00 50.26 49.86 49.32 47.44 47.50 45.74 45.31 50.02 50.18
Mean 97.67 97.54 49.93 50.00 49.91 49.41 47.45 47.37 45.79 45.43 50.01 50.15
7 'Mean 97.11 98.29 49 90 50.33 50.13 49.97 48.36 47.91 45.62 46.08 50.25 49.59
a Not included in mean. Detector temp. 225°C; incomplete resolution. b Oven 180°C, injector 236°C, detector 240°C, 4 ft column. c Oven 215°C, injector 230°C.d Injector 220°C, detector 255°C. Sample 1, day 1: half weight used; Sample 6: methanol pretreatment omitted. e Injector and detector 240°C. Peak height data used.'Column 5ft.* Peak height data used.^Oven 240°C, injector 250°C, detector 275°C.' 3% OV-1 column, untreated No supporting data supplied; not included in mean.
D eterm ination(a) P ow der and technical m aterial sam ples .—
Accurately w e ig h amt sam ple contg ca 150 m g pirim icarb in to vial. P ipet 10.0 mL internal std so ln into v ial, cap, and shake to d isso lve p irim i
carb. Keep tigh tly capped to avoid evapn. A llo w in so lu b le inerts to settle before use.
(b) G ranular form ulations.— Grind sam ple in mortar and p estle or m ech. m ill. A ccurately w eig h am t sam ple contg ca 150 m g pirim icarb

BLAND: J. ASSOC. OFF. ANAL. CHHM. (VOL. 64, N O . 6, 1981) 1317Table 2. Summary of statistics on GLC determination of pirimicarb3
Sample
Statistic 1 2 3 4 5 6
SD, indiv. meas. made in succession (within-lab. effect) 0.3260 0.2203 0.1459 0.1696 0.1504 0.2134SD, mean val. from 2 meas. made in succession b 0.2305 0.1558 0.1032 0.1199 0.1063 0.1509SD, mean val. from diff. days (day-to-day effect within lab.) 0.8649 0.2153 0.1724 0.2628 0.1697 0.3719SD, mean val. by diff. labs repeat, meas. on diff. days
(total effect)1.1099 0.3442 0.3426 0.3929 0.3305 0.8902
Sample mean, % pirimicarb 97.37 50.18 49.87 47.63 45.71 48.95CV, % 1.140 0.686 0.687 0.825 0.723 1.819
a Based on 10 labs injecting 2 aliquots in succession on 2 different days. b SD of mean = SD of individual/\/N.
in to vial. Add 5.0 mL M eOH and mix to release pirimicarb. A dd 10.0 mL internal std so ln , cap, and shake to d isso lve pirimicarb. Store tightly stoppered to avoid evapn. A llo w in so lu b le in erts to settle before use.
Inject 2 or m ore aliquots o f std so ln to set in tegration param eters and stabilize instrum ent. M onitor response factor u n til results agree w ith in 2%. Inject 4 aliquots o f std so ln and 2 aliquots o f sam ple so ln in succession. Calc, response factor, R, for each:
R = area pirim icarb peak/area internal std peak
Pirimicarb, % = (R /R ') X (W '/W ) X P w h ere R and R ' = av. response factor for sam ple and std solns; W and W ' = m g sam ple and std; and P = purity (%) o f std.
R esu lts and D iscu ssionE leven collaborators analyzed 6 sam ples.
T hese inclu d ed on e technical sam ple, on e granular sam ple, and 4 w ettab le pow der sam ples. Sam ple 4 was an exact d ilution o f Sam ple 3 w ith inert filler, 96:4. Sam ple 5 was an exact dilution of Sam ple 4 w ith inert filler, 96:4. Collaborators w ere su p p lied w ith colum n packing, S ily l 8 , nonadecane, and pirim icarb standard. They w ere requested to pack a colum n, s ilan ize and condition it, and analyze each of 6 samples, using duplicate injections. T hey w ere requested to repeat the w h o le operation on a subsequent day and subm it all data to the Associate Referee.
A ll laboratories except 2 w ere equ ipped w ith electronic integration equ ipm ent and subm itted area data. Two laboratories subm itted peak- h eig h t data. The data from all laboratories was recalculated from raw data to check for arithm etical errors and to standardize on rounding. A ll laboratories follow ed the instructions closely. Som e laboratories used different colum n lengths and different temperatures to suit their particular
in stru m en ts. O n e laboratory o m itted th e m ethanol pretreatm ent of the granular product. O ne laboratory su p p lied addition al data on an alternative colum n packing 3% OV-1. Results w ere not inclu d ed in the standard deviation ca lcu la tion s but sh o w e d g oo d agreem en t, su ggestin g that th is packing can be used as an alternative.
Results are tabulated in Table 1. The data w ere analyzed statistically, and 98% con fid en ce lim its w ere calculated for each sam ple. Collaborator 2 had several ou tly in g results, m ostly on day 1, su ggestin g a problem on that day. Standard deviations w ere recalculated om itting data from Collaborator 2 and are listed in Table 2. Standard d eviations w ere calculated from pairs to determ ine w ithin-laboratory effect and day- to-day effect by using the m ethod in reference 4 (p. 18, form ula 3).Recom m endations
It is recom m ended that the gas-liqu id chrom atography m ethod for the determ ination o f pirimicarb in technical and form ulated material be adopted official first action. The low est concentration tested was 50% ai. O nly solid form ulations w ere considered. L iquid form ulations o f pirim icarb in agriculture are rarely used and are uneconom ical because o n ly lo w strength products are feasible.
Test sam ples o f form ulations w ithou t internal standard added should be checked by users for in terfering com ponents.
A ck n ow led gm en tsThe Associate Referee thanks Edwin Glocker,
Statistician, and the fo llo w in g collaborators for their cooperation in the study:
John Bagness, ICI P lant Protection, Ltd, Yald- in g , UK
1318 BLAND: J. ASSOC. OFF. ANAL. CHEM . (VOL. 64, N O . 6, 1981)
W alter Black, I llin o is Dept, o f Agriculture, Springfield , IL
Linda Brown, ICI Am ericas Inc., G oldsboro, NC
M arshall Gentry, Florida Dept, o f Agriculture and Consum er Services, Tallahassee, FL
Burton G inther, W ashington State Dept, of Agriculture, Yakima, WA
Elm er H ayes, E n v iron m en ta l P rotection A gency , B eltsv ille, MD
Paul H olland, N evada State Dept, of A griculture, Reno, NV
Sam Jackling, N e w York State Dept, o f Environm ental C onservation , G loversville, NY
Joel Padm ore, South Dakota State Chem ical Laboratory, V erm illion , SD
Lazio Torma, M ontana Dept, of Agriculture, Bozem an, MT
G eorge W instead, State o f N orth Carolina, C onstable Laboratory, Raleigh, NC
The A ssociate R eferee also thanks Linda C. Brown and Karen H. Ferrand for th e assistance th ey provided in preparing sam ples and collatin g results.
References(1) Technical data sheet on Pirimor insecticide, ICI Americas Inc., PO Box 208, Goldsboro, NC(2) Zweig, G. (1972) Analytical Methods for Pesticides and
Plant Growth Regulators, Vol. 7, "Thin Layer ar.d Liquid Chromatography and Analysis of Pesticides of International Importance," Academic Press, Inc., New York, NY, p. 400(3) Bagness, J. E., & Sharpies, W. G. (1974) Analyst (London) 99, 225
(4) Youden, W. J„ & Steiner, E. H. (1975) Statistical Manual of the AOAC, AO AC, Arlington, VA
MELTON & HOOVER: J. ASSOC. OFF. ANAL. CHEM. (VOL. 64, NO. 6, 1981) 1319
F E R T IL IZ E R S
M i c r o w a v e O v e n D r y i n g i n t h e G r a v i m e t r i c P h o s p h o r u s M e t h o d
JA M ES R. M E L T O N a n d W IL L IA M L. H O O V E R Texas Agricultural Experiment Station, College Station, TX 77843The gravimetric quinolinium molybdophosphate method for determining P2 O5 in fertilizers, AOAC2.026-2.028, has been modified to permit the precipitate to be dried in a microwave oven rather than a conventional drying oven. After the yellow quinolinium molybdophosphate precipitate is formed, cleaned up, and washed, it is placed in a microwave oven at 600 watts until dry. The quantity of precipitate remaining after microwave drying was equal to that obtained by drying according to AOAC 2.028 for several fertilizer samples. A distinct advantage of the described method is that the yellow precipitate will not char with reasonably excessive drying. Also, much less energy is expended with the microwave oven than with the drying oven.Since its introduction in 1951, the volum etric m ethod of W ilson (1, 2), in w h ich phosphorus is determ ined after isolation as qu in o lin iu m m olybdophosphate, has u ndergon e m any m od ifications. W ilson's precipitating so lu tion s in clud ed a citric-m olyb d ic acid reagent and q u in o lin e solu tion . Fernlund and Z echner (3) elim inated the use of citric acid and prepared one so lu tion w h ich com bined sodium m olybdate, q u in o lin e , and HC1.
The volum etric q u in o lin e m olybdate m ethod was adapted to a gravimetric technique by Perrin (4, 5) for determ in ing total and available p h osphorus. D ahlgren (6 ) m odified the procedure by replacing HC1 w ith H N O 3 and by adding citric acid and acetone. H e nam ed the solu tion quim ociac. In 1963, H offm an and W iles (7) successfu lly used this n ew acetone-bearing qu im ociac reagent for determ in ing total and available phosphorus by the gravim etric procedure. The m ethod, AO AC 2.026-2.028 (8 ), adopted as official final action in 1965 (9), has becom e one of the m ost popular m ethods for phosphorus determ ination. H ow ever, because of the amount of energy exp en d ed in d rying ovens, an in vestigation w as undertaken to determ ine the feasib ility o f usin g a m icrow ave oven for dry ing the y e llo w q u in o lin iu m m olyb dophosphate precipitate. Subsequent research resulted in the m odification described below .
Received April 24,1981. Accepted June 2, 1981.
M ETH O DApparatus and Reagents
(a) M icrow ave oven .— Pow er settin gs that in clud e 600 watts.
(b) D rying oven .— Capability o f drying 30 m in at 250°C.
(c) Gooch crucible.— 50 mL, stem m ed, h igh form , w ith m edium porosity fritted disc.
(d) Quimociac reagen t.— See 2.026(c) (8 ).Sam ple Preparation and D eterm ination
According to 2.027, w eigh 1 g fertilizer sample into 200 mL volum etric flask (or Kjeldahl flask for sam ples h igh in organic matter). Add 20-30 mL H N O 3 and boil gen tly 30-45 m in. Add 10-20 mL of 70-72% HCIO4 and boil very gently until solution is colorless or nearly so and dense w h ite fum es appear in flask. C ool s ligh tly , add 50 mL water and boil 3 -4 min. Cool solution, fill to volum e, mix, and let settle overnight (or filter through dry filter). A ccording to 2.028, p ipet aliquot conta in ing m axim um 25 m g P2O 5 in to 500 mL Erlenm eyer flask and dilute to ca 100 mL w ith water. A dd 50 mL quim ociac reagent, cover w ith watch glass, place on hot plate in w ell ventila ted hood, and boil 1 m in. Cool to room tem perature (sw irl carefully 3 -4 tim es during coolin g) and filter into p reviously dried and w eigh ed gooch crucible. Wash w ith five 25 mL portions o f water. Place in plastic or other suitable rack and transfer to m icrow ave oven . D o not put m etal in m icrow ave oven! Dry crucib le and contents at 600 watts until w e ig h t loss is n eg lig ib le (ca 30 m in for set o f 12). C ool in desiccator to room tem perature and w eigh . M ultip ly by 0.03207 to obtain w e ig h t o f P2O 5.
% P2O5 = (g y e llo w ppt X 200 mL X 0.03207 X 100)/(g sam ple X mL aliquot).
R esu lts and D iscu ssionA study was conducted to determ ine the tim e
required to dry the q u in o lin iu m m olyb dophosphate precipitate w ith a m icrow ave oven at 600 watts pow er. As expected, the tim e varied according to quantity of precipitate in each gooch crucible and total num ber of crucibles w ith precipitate. In general, ca 30 m in w as required to
0004-5756/81 /6406-1319-03$01.00© Association of Official Analytical Chemists, Inc.

1320 MELTON & HOOVER: J. ASSOC. OFF. ANAL. CHEM . (VOL. 64, N O . 6, 1981)
Table 1. Comparison of 2.026-2.028 and microwave drying methods for determining P20 5 in collaborative fertilizersamples from Magruder
Sam ple% P2O5,
m icrow ave3
% P205, A O A C3
Mean SD No. labs
7904 4.31 4.33 0.33 278007 7.58 7.47 0.06 347912 8.18 8.18 0.07 247908 10.06 10.11 0.07 298004 10.13 10.15 0.06 307903 10.79 10.77 0.14 318002 11.05 11.01 0.09 278005 14.14 14.13 0.21 307901 15.05 15.19 0.15 257902 17.20 17.07 0.11 277910B 17.72 17.79 0.08 307911 19.97 19.83 0.13 257905 27.64 27.62 0.21 257909 28.86 28.85 0.14 257907 34.09 34.17 0.32 298008 46.31 46.36 0.35 338003B 54.51 54.53 0.22 29
a Average of duplicates. b From Magruder reports.
dry 12 crucibles w ith each conta in ing 0.5 g precipitate. If there is any doubt concern ing dryness after m icrow ave drying, rem ove a representative gooch crucible and w eigh im m ediately (may use 3-place top load ing balance): dry 5 additional m in and w e ig h again. If there is no w eight loss after additional drying, crucibles and contents may be placed in desiccator according to described m ethod. If y e llo w precipitate is thoroughly dry, the gooch crucible w ill be quite hot because there is little w ater to absorb the m icrow ave energy.
In another study, reagent grade KH2PO4 con tain ing 52.2% P2O 5 was analyzed 33 tim es by the described procedure. The m ean calculated for the 33 determ inations w as 52.2% P2O 5 w ith a standard deviation o f 0 .2 and a coeffic ien t of variation of 0.4%. These statistical results w ere sim ilar to those fou n d for KH2PO4 by 2.026- 2.028.
S ev en teen M agruder check fertilizer sam ples were analyzed for P2O5 by the described m ethod, and results w ere com pared against m eans com p iled from reports o f participating laboratories (Table 1). There w ere no significant differences (P < 0.05, Student's f-test (10)) in P20 5 determ ined by the 2 m ethods.
To com pare the 2 drying techn iques in our laboratory, 8 fertilizer sam ples from the State control service w ere digested; equal aliquots w ere taken for precipitate form ation and d ry in g— one by m icrow ave and the other by conven tion a l d rying oven . N o sign ificant d if
ferences (P < 0.05 (10)) for P2O 5 w ere fou n d by the 2 m ethods (Table 2). O ver 4000 sam ples have been dried by m icrow ave since th is in itial investigation; about 400 w ere re-analyzed by2.026-2.028. N o practical differences have been found to negate the valid ity o f the in itia l fin d ings.
A distinct advantage o f the described m ethod of drying over 2.028 is that the yellow precipitate w ill not char w ith reasonably excessive drying. M any hours have been lost w ith the AOAC m ethod due to charring; how ever, w e have excessively dried for up to 15 m in by the described m ethod w ith ou t sign ifican tly ch a n gin g w e ig h : of the precipitate.
M uch less energy is expended w ith the m icrow ave o ven than w ith the drying oven; w ith m ost laboratories having lim ited budgets, the monetary savings is welcom ed. There is little or
Table 2. Comparison of 2.026-2.028 and microwave drying methods for determining P20 5 (%) in fertilizers
received through State control service
Guar. Microwave AOAC5.0 3.4 3.55.0 5.6 5.5
10.0 6.9 6.810.0 8.3 8.212.0 24.0 24.125.0 27.3 27.232.0 34.6 34.746.0 45.9 45.9
MELTON & HOOVER: J. ASSOC. OFF. ANAL. CHEM . (VOL. 64, N O . 6, 1981) 1321n o savin gs in tim e o f actual drying; h ow ever, in the d rying oven , tim e m ust be a llow ed to attain the 250°C that 2.028 requires. N o warm up tim e is required for m icrowave drying. A lso, cost for the 2 instrum ents is com parable. For exam ple, a $450 m icrow ave o ven has been used in our laboratory for ca 700 h w ith n o major repairs required.
In addition to d rying the q u in o lin iu m m o- lybdophosphate precipitate for P2O 5 determ ination in fertilizers, w e are d iscovering additional uses for the m icrow ave oven in our laboratory. These fin d in gs w ill be related as soon as the data have b een com p iled and tabulated.
A ck n o w led gm en tsThe authors express gratitude to Jan Koska,
Kay L everette, Tanjala Sm itheal, Ana K yle, Pat
C haffin , and Vicki Rhea for their h e lp w ith this project.
References(1) Wilson, H. N. (1951) Analyst 76, 65-76(2) Wilson, H. N. (1954) Analyst 79, 535-546(3) Fernlund, U., & Zechner, S. (1955) Z. Anal. Chem.
146,111-114(4) Perrin, C. H. (1958) J. Assoc. Off. Agric. Chem. 41, 758-763(5) Perrin, C. H. (1959) /. Assoc. Off. Agric. Chem. 42, 567-568(6 ) Dahlgren, S. E. (1962) Z. Anal. Chem. 189, 243- 256(7) Hoffman, W. M„ & Wiles, C. C. (1963) J. Assoc. Off. Agric. Chem. 46, 579-582(8 ) Official Methods of Analysis (1980) 13th Ed., AO AC, Arlington, VA, secs. 2.026-2.028(9) "Changes in Methods" (1966) ]. Assoc. Off. Anal. Chem. 49,222(10) Snedecor, G. W. (1956) Statistical Methods, The Iowa State College Press, Ames, IA, p. 45.

1322 KANE ET AL.: J. ASSOC. OFF. ANAL. CHEM. (VOL. 64, N O . 6, 1981)
D a t a H a n d l e r / C o n t r o l l e r S y s t e m w i t h A p p l i c a t i o n to P 20 5 a n d K 20 i n F e r t i l i z e r s
PETER F. K A N E , B R IA N R. B E N N E T T , a n d S T E F A N G U LIK Purdue University, Department of Biochemistry, West Lafayette, IN 47907An automated data handler/controller system performs 2 main functions: As a data handler, it finds peak maxima, does standard curve fitting, performs peak height correction for drift, gain, and carryover, and does limited calculation of results with a printed record. It may also control modules of an analyzer system to allow both manual operation and completely automatic, unattended startup, operation, and shutdown. Such a system has 2 main advantages, and one disadvantage. The automatic control features extend the useful operational hours, and the data handling features make possible a level of sophistication above manual treatment of the data, with no computer expertise required. To achieve these ends, however, the flexibility that comes with control over software modification has been sacrificed. The ability to correct peak heights for drift, gain, and, particularly, carryover, allows a wider range of standards and/or faster sampling rates. In the phosphorus method, it was possible to eliminate much labor-intensive aliquoting of extracted samples by using a broader range of standards. Alternatively, if desired, the sampling rate could be increased from 40 to 60 per hour. With computer-corrected peak heights, either alternative is still more precise than the usual method without correction. For the potassium method, the maximum concentration is limited by the detector of the flame photometer and therefore the standard range cannot be significantly expanded. However, dramatic increases in sampling rate are possible with peak height correction. Data indicate that sampling rates can be increased from the usual 40-50 per hour up to 90 or possibly 120 per hour, with equivalent precision.The Indiana State C hem ist Laboratory recently had the opportunity to evaluate a Technicon AAIIC data h an d ler/con tro ller system made available to us from T echnicon. The AAIIC is d esign ed to operate w ith A utoA nalyzer II System s. It perform s 2 main functions: data man ip u la tion and autom atic instrum ent control. T hese 2 functions w ill be exam ined first, and then specific application to the AOAC automated P2O 5 and K20 m ethods for fertilizers w ill be discussed.Data H andler
The data han d lin g features fall betw een m anipulating autom ated analyzer chart output w ith a program m able calculator, and having analyzers on -lin e to a large com puter system .
The data han d lin g capabilities inclu de fin d in g peak maxima, standard curve fitting, peak height adjustm ent features such as carryover, drift, and gain correction, and final calculation w ith production o f a printed record of results.
Curve fitting options inclu de linear, second d egree, and p iecew ise linear. Baseline is autom atically inclu d ed as one of the points on the curve to be fitted. Calculations can be redone on the sam e data w ith any of the curve fittin g op tions.
Peak heigh t correction capability is one o f the m ore attractive features. Drift is detected by m onitoring the baseline for stability before a run is started. A stable value is stored. W hen sam p lin g is com pleted , the baseline is again m on itored and peak h eigh ts are in crem entally corrected for any drift.
A ny change in gain is detected by p lacing a d esignated h igh standard near the b eg in n in g and ending o f a run. The effect o f this correction is to increm entally rotate the standard curve best fitted lin e as it is compared w ith each sam ple peak h e ig h t for calculation.
The last peak correction feature is carryover. M any automated m ethods have a carryover effect from on e sam ple to the next. O ften this is an im portant lim itin g factor, restricting the m axim um sam pling rate and the standard range for a m ethod. For a g iv en chem istry and a specific m anifold , the carryover factor is relatively constant and easy to determ ine, but the arithm etic required for manual carryover correction of peak h eig h ts is quite tedious and tim e-consum ing. Traditionally, the w ay of dealing w ith carryover has been to slow the sam pling rate and narrow the standard range until any rem aining carryover is in sign ifican t relative to the d egree of precision required of the m ethod. The data handler allow s computer-calculated peak h eight correction for carryover. Data w ill be presented illustrating the im provem ent in precision and/or speed w h ich can be attained in the specific in stances o f the P2O 5 and K20 m ethods.
A s a test o f h ow w e ll the data h and ler finds accurate peak heights, it was connected to a Flam e IV system used for fertilizer K20 . This system is inheren tly m ore n oisy than colori-
0004-5756/81/6406-1322-07$01.00© Association of Official Analytical Chemists. Inc.

KANE ET AL.: J. ASSOC. OFF. ANAL. CHEM . (VOL. 64, N O . 6, 1981) 1323Table 1. Determination of peak maxima, K2O oxalate
standards3
AAIICpeak
maxima
Computerpeak
maxima
Normalizedcomputer
peaks
AAIIC minus computer
normalized
5.22 5.225 5.231 - 0.01120.2 20.075 20.098 0.10235.1 35.125 35.165 -0.06550.1 50.04 50.097 0.00365.8 65.75 65.825 -0.02581.6 81.55 81.644 -0 .04489.6 89.705 89.808 -0 .208
5.25 5.12 5.126 0.1244.99 4.90 4.906 0.084
20.1 19.96 19.983 0.11720.1 19.96 19.983 0.11735.2 35.125 35.165 0.03535.4 35.295 35.335 0.06550.3 50.225 50.283 0.01750.3 50.245 50.301 -0.00365.8 65.75 65.825 -0.02565.9 65.865 65.941 -0.04181.8 81.75 81.844 -0 .04481.6 81.72 81.814 -0 .21489.4 89.415 89.518 -0 .11889.6 89.365 89.467 0.133
X = 49.6838 X =49.6269
X = 49.6838 X = 0.0000 SD = 0.099
3 Peak heights in chart divisions.
m etric system s, and therefore is a good test for fin d in g peak maxima.
Peak h eig h ts are not d isp layed directly, on ly calculated concentrations relative to standard concentrations. H ow ever, it is possible to input a standard's peak h eig h t rather than its con cen tration, thus forcing a display of sam ple peak h eig h ts instead o f concentrations.
Table 1 com pares the AAIIC peak h eig h ts for a series of K2O standards w ith peak h eights from the same run determ ined by an on-line computer system routin ely used by this laboratory. This latter system consists o f an A to D converter, a D igita l PDP 11/15 w ith softw are to determ ine and store peak h eigh ts, and a PDP 11/45 w h ich receives peak h eigh t files from the PDP 11/15 and perform s all additional calculations. Com puter-plotted graphs of peak heights vs standard concentrations w ere virtually identical for the 2 sets o f peak h eig h t data.
T echnically, the data handler peak heights are all determ in ed relative to one PDP 11/15 peak height; therefore, it is reasonable to norm alize o n e entire set o f peaks to the other, based on overall m eans. Arbitrarily n orm alizing the com puter-plotted peaks to the data handler peaks so that the d ifference o f the m eans of the 2 sets is reduced to zero chart d iv ision s, the question then is, h ow consistently small are the individual
differences? The standard d ev iation o f th e d ifferences is ±0.099 chart d iv ision . In o n ly 2 in stances does a d ifference exceed 2 standard d eviations. This surely exceeds the precision to be expected from m anually determ in in g peak heights.
The data handler has a lim ited calculating function. K now ing the standard and sam ple peaks heights, it automatically produces a sample concentration as analyzed by the analyzer. This concentration can be recalculated by any com bination o f the curve fittin g and data m anipu lation options. H ow ever, the data handler has no capability to store factors for aliquots, sam ple w eigh ts, sto ichiom etry, etc. It is necessary to type in a sin g le overall factor for each sam ple in turn for the system to calculate final results.
In addition to producing a p rin ted record o f final results, several other features that m ay be useful in various applications are error m essages w ith peak heights, user specification o f baseline n oise tolerance, ab ility to flag upper and low er tolerance lim its, and statistical routine for sam ples and intersam ple standards. The m axim um number of standards in a run is 8 . The maximum num ber o f total cups in a run varies from 160 for a sin gle-ch an n el operation to 40 for 4-channel operation. Calculations on a run m ust be com p leted before another run is begun.Instrum ent Controller
In addition to m anipu lating data, the system serves as an instrum ent controller. In either program m ed or m anual m odes, it w ill control a sam pler, a pum p, an A uto Valve® sw itch in g b etw een reagent and w ash solu tion s, and several auxiliary electrical outlets. The sam p lin g rate and sam ple-to-w ash ratio, no lon g er controlled by a m echanical cam, m ay be set to any desired rate and ratio.
To determ ine if com puter-controlled sam pler tim ing is significantly m ore precise than tim ing by m echanical cam, m ultip le cups o f h ig h standard were analyzed 40 tim es by both instrum ents on the P2O 5 analyzer. Peak h eigh ts vs peak p ositions were fitted to a least squares straight line to correct for drift. For the com puter tim ed run, the mean corrected peak height w as 88.3188 chart divisions w ith a standard deviation of 0.119. For the cam -controlled run, the m ean corrected peak h eig h t w as 86.5315 chart d iv ision s, w ith a standard deviation o f 0.121. The standard deviations are virtually identical, ind icating sim ilar precision betw een m ethods of tim ing, at least w ith the particular cam used, and for the P2O5 m ethod. It m ay be that other m ethods, operating farther
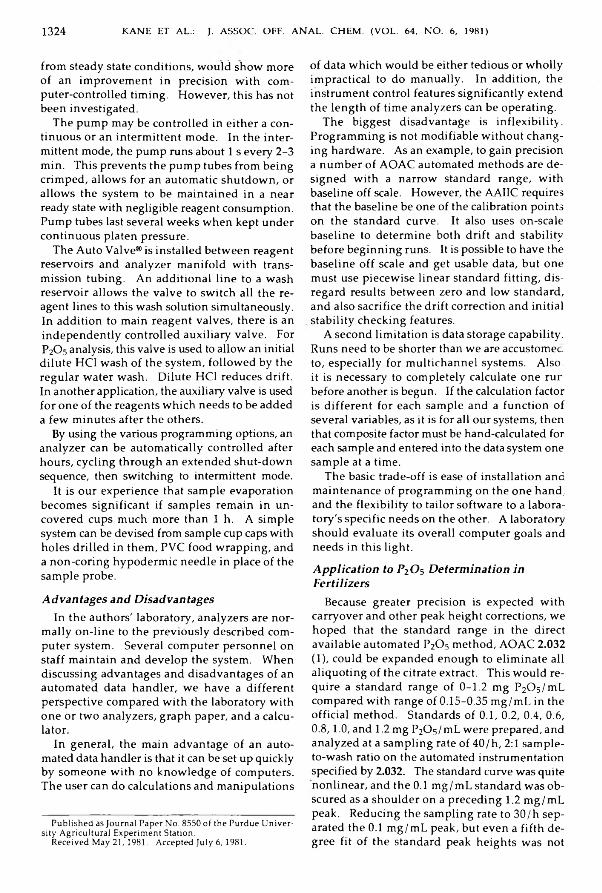
1324 KANE ET AL.: J. ASSOC. OFF. ANAL. CHEM . (VOL. 64, N O . 6, 1981)
from steady state conditions, w ou ld sh ow m ore o f an im provem en t in precision w ith com puter-controlled tim ing. H ow ever, this has not b een investigated.
The pum p may be controlled in either a con tinuous or an interm ittent m ode. In the in term ittent mode, the pum p runs about 1 s every 2 -3 m in. This prevents the pum p tubes from b ein g crim ped, a llow s for an autom atic sh u td ow n , or allow s the system to be m aintained in a near ready state w ith neglig ib le reagent consum ption. Pum p tubes last several w eeks w h en kept under contin uous platen pressure.
The A uto Valve® is installed b etw een reagent reservoirs and analyzer m anifold w ith transm ission tubing. A n additional lin e to a w ash reservoir a llow s the va lve to sw itch all the reagent lines to this wash solution sim ultaneously. In addition to m ain reagent valves, there is an in d ep en d en tly controlled auxiliary valve. For P2O 5 analysis, this valve is used to allow an initial d ilu te HC1 w ash o f the system , fo llow ed by the regular w ater wash. D ilu te HC1 reduces drift. In another application, the auxiliary valve is used for on e o f the reagents w h ich n eeds to be added a few m inutes after the others.
By using the various programming options, an analyzer can be autom atically controlled after hours, cycling through an extended shut-dow n sequence, then switching to intermittent mode.
It is our experience that sam ple evaporation becom es sign ifican t if sam ples rem ain in uncovered cups m uch m ore than 1 h. A sim ple system can be devised from sample cup caps w ith h o les drilled in them , PVC food w rapping, and a n on-coring hypoderm ic n eed le in place o f the sam ple probe.Advantages and Disadvantages
In the authors' laboratory, analyzers are norm ally on -lin e to the previously described com puter system . Several com puter p ersonnel on staff m aintain and d evelop the system . W hen discu ssin g advantages and d isadvantages o f an autom ated data handler, w e have a d ifferent p ersp ective com pared w ith the laboratory w ith on e or tw o analyzers, graph paper, and a calculator.
In general, the m ain advantage o f an automated data handler is that it can be set up quickly by som eon e w ith no k n ow led ge o f com puters. The user can do calculations and m anipulations
Published as Journal Paper No. 8550 of the Purdue University Agricultural Experiment Station.Received May 21,1981. Accepted July 6,1981.
o f data w h ich w ould be either tedious or w h olly im practical to do m anually. In addition , the instrum ent control features significantly extend the len g th o f tim e analyzers can be operating.
The b iggest d isadvantage is in flexib ility . Program m ing is not m odifiable w ith ou t changin g hardware. As an exam ple, to gain precision a num ber o f AOAC autom ated m ethods are des ig n ed w ith a narrow standard range, w ith baseline off scale. H ow ever, the AAIIC requires that the baseline be one of the calibration points on the standard curve. It also uses on-scale baselin e to determ ine both drift and stability before b eg in n in g runs. It is possible to have the b aselin e o ff scale and get usable data, but one m ust use p iecew ise linear standard fittin g , d isregard results b etw een zero and low standard, and also sacrifice the drift correction and initial stability check ing features.
A secon d lim itation is data storage capability. Runs need to be shorter than w e are accustom ec to, esp ecia lly for m ultichannel system s. A lso, it is necessary to com p letely calculate on e rur before another is begun. If the calculation factor is d ifferent for each sam ple and a function o f several variables, as it is for all our system s, then that com posite factor must be hand-calculated for each sam ple and entered into the data system one sam ple at a time.
The basic trade-off is ease o f installation and m aintenance of program m ing on the o n e hand, and the flex ib ility to tailor softw are to a laboratory's specific n eeds on the other. A laboratory should evaluate its overall com puter goals and n eed s in th is light.A pplication to P2 O 5 D eterm ination in Fertilizers
Because greater precision is expected w ith carryover and other peak heigh t corrections, w e h op ed that the standard range in the direct available autom ated P2O 5 m ethod, AOAC 2.032 (1), could be expanded en o u gh to elim in ate all aliquotin g o f the citrate extract. This w ou ld require a standard range o f 0 -1 .2 m g P2O s/m L compared w ith range of 0.15-0.35 m g/m L in the official m ethod. Standards o f 0.1, 0.2, 0.4, 0.6, 0 .8 , 1 .0 , and 1.2 m g PjO s/m L were prepared, and analyzed at a sam pling rate o f 4 0 /h , 2:1 sam ple- to-wash ratio on the autom ated instrum entation specified by 2.032. The standard curve was quite nonlinear, and the 0.1 m g/m L standard w as obscured as a shou lder on a preced ing 1.2 m g/m L peak. Reducing the sam pling rate to 3 0 /h separated the 0.1 m g/m L peak, but ev en a fifth d egree fit o f the standard peak h eigh ts w as not

KANE ET AL.: J. ASSOC. OFF. ANAL. CHEM . (VOL. 64, N O . 6, 1981) 1325Table 2. P20 5 results (%) calculated by data handler and
by computer
Magrudergrand
Material AAIICa Computed avsc
NBS NH4H2PO4 61.8 62.15 61.68461.7 61.73 —
61.9 61.81 —NBS KH2PO4 52.3 52.24 52.105
52.2 52.20 —
52.2 52.14 —Mag. 7901B 14.7 14.70 14.597
7902 17.0 17.04 17.2017903 10 .1 10 .22 10.7357904 4.35 4.41 4.5747905A 26.7 26.83 26.8197907B 33.9 33.97 34.0797908 9.78 9.67 9.8567910B 17.1 17.16 17.319
Av. bias, Magruder G. A. minus AAIIC = +0.07Av. bias, Magruder G. A. minus computer == +0.02SD of diffs, Magruder G. A. minus AAIIC = 0.232
SD of diffs, Magruder G. A. minus computer = 0.225
a Nonlinear, drift, gain, and carryover corrected. b Third degree, drift, gain, and carryover corrected. c From Magruder reports.
good. (This laboratory can com puter-generate any degree fit o f a data set, and computer-plot the results. Various degree fits can be superim posed and v isu ally com pared.)
W e decided to reduce the standard range to 0 - 0.8 m g P2 0 s/m L w h ich w o u ld elim in ate p ip ettin g for fertilizers w ith 40% P2O 5 or less, the bulk o f this laboratory's sam ple load. A ll h igher guarantees w o u ld be d ilu ted 50 mL to 100 mL. Standards o f 0.1, 0.2, 0.3, 0.4, 0.5, 0.6, 0.7, and 0.8 m g P2 0 s/m L w ere run at a sam pling rate o f 30 /h . A third d egree curve adequately fit the peak h eig h t vs concentration data, w h ile a second degree fit w as less desirable. It is possib le to reduce the num ber o f calibration p oin ts by 4, recalculate another third degree fit o f the rem ain ing points, and have this lin e be virtually superimposable on the third degree lin e from the com plete set of points. Thus 8 calibration points are m ore than adequate to d efin e the curve.
The analytical test cartridge w as m od ified to reduce the PO 4-3 concentration at the flow cell, straighten in g the standard curve som ew hat. The sam ple pum p tube w as ch anged to 0.16 m L /m in , the resam ple w as ch anged to 0.16 m L /m in , the HCIO4 pum p tube w as ch anged to 0.8 m L /m in , and the sam pling rate w as 3 0 /h , 2:1 sam ple-to-wash ratio. A ll other parameters were the sam e as specified in the official AOAC m ethod. A n y sm aller sam ple-to-reagent ratio led to excessive noise. W ith these param eters,
the standard peak heights still w ere fitted better by a third degree rather than secon d degree equation. A flow cell w ith a shorter path length, if available, w ould probably lessen the degree o f curvature further.
A set of NBS Standard Materials and Magruder sam ples w ere analyzed usin g the above parameters. Results w ere calculated u sin g the AAIIC and this laboratory's PDP 1 1 /1 5 -P D P 11/45. The AAIIC calculation used n on lin ear (second degree) curve fitting w ith carryover, drift, and gain corrections. The PDP calculation used third degree curve fitting. The PDP software includes programming w h ich also allow s carryover, drift, and gain corrections. T hese calculations are analogous to the corresponding calculations perform ed by the AAIIC, but s ligh tly m ore e le gant.
Table 2 g ives the results for a sim ultaneous calculation o f the sam e analyzer run by both system s. The M agruder grand averages for d irect available P20 5 by the AO AC autom ated m ethod and the NBS theoretical values are given for com parison. Bias and standard d ev iation o f differences are all acceptable. Results indicate that a m odified P2O 5 m ethod w ith expanded standard range and m uch reduced aliq u otin g is feasible w ith com puter peak h e ig h t correction. A lso, there is basic agreem ent b etw een AAIIC and PDP com puter calculations. The m odified m ethod w ou ld m ean a sign ifican t sav in gs in analyst time, elim ination o f som e repeat analyses d u e to w rong aliquot prediction and off-scale peaks, and elim in ation o f som e hum an error associated w ith the a liquotin g process.
This laboratory is prim arily interested in precision and reduction of aliquoting. Sam pling rate is less o f a consideration, especially w h en the capability exists to autom atically control analyzers after hours. H ow ever, carryover, drift, and gain correction o f peak h eigh t data can be used to increase the sam pling rate o f an analyzer, if that is the m ain priority.
The six standards o f the AOAC official m eth od, 0 .15-0 .35 m g P2 0 5 /m L, w ere analyzed in random order in a set o f 40. The same order of analysis was repeated at rates o f 4 0 /h , 5 0 /h , and 6 0 /h . The raw peak h eigh ts w ere corrected for drift, gain , and carryover w ith the com puter system . The m eans and standard d eviations of the peak h eigh ts o f each standard, w ith and w ith ou t corrections, are g iv en in Table 3.
In every instance except standard N o. 5 at 5 0 /h , the standard deviations are im proved w ith correction. The m ost dramatic im provem ents are seen at the low er 3 standard lev els. At 6 0 /h
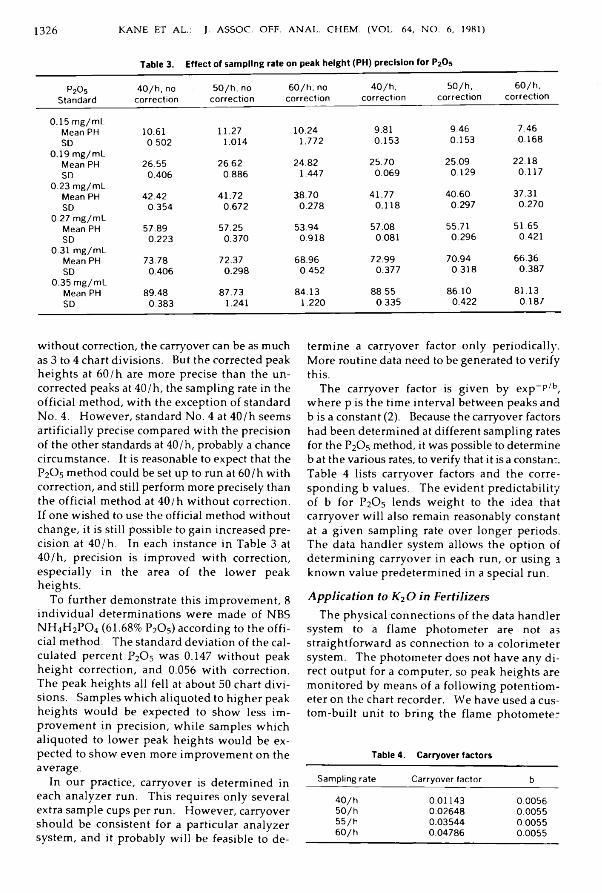
1326 KANE ET AL.: J. ASSOC. OFF. ANAL. CHEM . (VOL. 64, N O . 6, 1981)
Table 3. Effect of sampling rate on peak height (PH) precision for P20 5
P205Standard
40/h , no correction
50/h, no correction
60/h , no correction
40/h ,correction
50/h,correction
60/h ,correction
0.15 mg/mL Mean PH SD
10.610.502
11.271.014
10.241.772
9.810.153
9.460.153
7.460.168
0.19 mg/mL Mean PH SD
26.550.406
26.620.886
24.821.447
25.700.069
25.090.129
22.180.117
0.23 mg/mL Mean PH SD
42.420.354
41.720.672
38.700.278
41.770.118
40.600.297
37.310.270
0.27 mg/mL Mean PH SD
57.890.223
57.250.370
53.940.918
57.080.081
55.710.296
51.650.421
0.31 mg/mL Mean PH SD
73.780.406
72.370.298
68.960.452
72.990.377
70.940.318
66.360.387
0.35 mg/mL Mean PH SD
89.480.383
87.731.241
84.131.220
88.550.335
86.100.422
81.130.187
w ithou t correction, the carryover can be as much as 3 to 4 chart d iv ision s. But the corrected peak h eig h ts at 6 0 /h are m ore precise than the u n corrected peaks at 4 0 /h , the sam pling rate in the officia l m ethod, w ith the exception o f standard N o. 4. H ow ever, standard N o. 4 at 4 0 /h seem s artificially precise com pared w ith the precision of the other standards at 40 /h , probably a chance circum stance. It is reasonable to expect that the P2O 5 m ethod could be set up to run at 6 0 /h w ith correction, and still perform m ore precisely than the official m ethod at 4 0 /h w ith ou t correction. If one w ish ed to use the official m ethod w ithout ch ange, it is still possib le to gain increased precision at 4 0 /h . In each instance in Table 3 at 4 0 /h , precision is im proved w ith correction, esp ec ia lly in the area o f the low er peak h eigh ts.
To further dem onstrate this im provem ent, 8 in d iv id u a l determ inations w ere m ade o f NBS N H 4H 2PO 4 (61.68% P2O 5) according to the o fficial m ethod. The standard deviation o f the calculated percent P2O 5 w as 0.147 w ithou t peak h eig h t correction, and 0.056 w ith correction. The peak h eigh ts all fe ll at about 50 chart d iv isions. Sam ples w h ich aliquoted to h igher peak h eig h ts w o u ld be expected to sh ow less im p rovem en t in precision , w h ile sam ples w h ich aliquoted to low er peak h eigh ts w ou ld be expected to sh ow even m ore im provem ent on the average.
In our practice, carryover is determ ined in each analyzer run. This requires on ly several extra sam ple cups per run. H ow ever, carryover sh ou ld be consistent for a particular analyzer system , and it probably w ill be feasible to de
term ine a carryover factor o n ly periodically. M ore routine data need to be generated to verify this.
The carryover factor is g iv en by exp~P/b, w h ere p is the tim e interval b etw een peaks and b is a constant (2). Because the carryover factors had been determ ined at d ifferent sam pling rates for the P2O5 m ethod, it was possible to determ ine b at the various rates, to verify that it is a cons tan:. Table 4 lists carryover factors and the corresp on d in g b values. The ev id en t predictability of b for P2O 5 len d s w e ig h t to the idea that carryover w ill also rem ain reasonably constant at a g iv en sam pling rate over longer periods. The data hand ler system a llow s the op tion of d eterm in in g carryover in each run, or u sin g a k n ow n valu e predeterm ined in a special run.A pplication to K 20 in Fertilizers
The physical con n ection s o f the data handler system to a flam e photom eter are not as straightforw ard as connection to a colorim eter system . The photom eter d oes not have any d irect output for a com puter, so peak h eigh ts are m onitored by m eans o f a fo llo w in g p oten tiom eter on the chart recorder. W e have used a custom -built un it to bring the flam e photom eter
Table 4. Carryover factors
Sampling rate Carryover factor b
40/h 0.01143 0.005650/h 0.02648 0.005555/h 0.03544 0.005560/h 0.04786 0.0055

KANE ET AL.: J. ASSOC. OFF. ANAL. CHEM . (VOL. 64, N O . 6, 1981) 1327Table 5. Effect of sampling rate on peak height precision for K2O
Rate
10/ig K20/m LStd 20 Mg K20 /m L Std
No carryover Carryover No carryover Carryover
40/h , Mean PH 18.04 17.84 35.80 35.60SD 0.151 0.089 0.141 0.163
50/h, Mean PH 18.10 17.92 37.75 35.53SD 0.158 0.084 0.129 0.150
60/h , Mean PH 17.78 17.42 35.08 34.68SD 0.311 0.084 0.150 0.126
72/h , Mean PH 18.06 17.52 35.28 34.75SD 0.422 0.045 0.206 0.058
90/h . Mean PH 18.28 17.50 35.50 34.68SD 0.669 0.071 0.216 0.096
120/h, Mean PH 18.74 17.42 36.10 34.80SD 1.050 0.084 0.829 0.566
30 Mg K20 /m L Std 40 Mg K20 /m L Std
40/h , Mean PH 53.33 53.33 71.97 72.41SD 0.379 0.351 0.058 0.140
50/h, Mean PH 53.23 53.23 71.77 70.76SD 0.252 0.116 0.322 0.191
60/h, Mean PH 51.90 51.90 70.10 70.09SD 0.265 0.000 0.173 0.078
72/h , Mean PH 51.90 51.87 69.73 69.69SD 0.361 0.058 0.503 0.044
90/h , Mean PH 51.80 51.70 69.53 67.74SD 0.557 0.100 0.862 0.363
120 h. Mean PH 51.57 52.43 68.70 60.66SD 1.172 0.153 1.179 0.119
50 Mg K20 /m L Std 55 Mg K20 /m L Std
40/h , Mean PH 90.30 90.43 99.40 99.54SD 0.337 0.330 0.255 0.219
50/h, Mean PK 89.93 90.03 99.18 99.32SD 0.532 0.479 0.545 0.554
60/h . Mean PH 87.83 88.00 96.72 96.96SD 0.435 0.383 0.259 0.152
72/h, Mean PH 87.83 88.10 96.68 97.00SD 0.150 0.216 0.327 0.173
90/h , Mean PH 87.33 87.68 96.14 96.58SD 0.263 0.096 0.434 0.228
120/h, Mean PH 86.45 87.13 96.86 96.64SD 0.507 0.236 1.293 0.573
on-line to the computer. The same unit was used for connection to the AAIIC, although follow ing potentiom eters are available com m ercially.
There is a secon d problem in con n ectin g to a flam e photom eter if autom atic sh u td ow n is d esired. O ne o f the auxiliary electrical outlets of the Auto Valve could be used to shut off electrical p ow er to the photom eter. This w ou ld shut off the m ethane supply at the instrum ent, but w ould leave gas pressure in the supply lines. For safety reasons, an electrical so len o id shutoff at the m ethane tank valve w ou ld be desirable. A secon d such so len o id at the air su p p ly va lve m ight also be desired.
As w ith P2O 5, w e h oped that the standard range in the official autom ated flam e p h otom etric m ethod for K2O fertilizers, AO AC 2.097
( 1), could be expanded su ffic ien tly to elim inate aliquoting. This was not feasible. The potassium concentrations required by the sp ecified 1 g sam ple w e igh t badly saturated the potassium detector. A ttem pts at reducing sam pling rate and increasing d iluents on the m anifold , an d /o r including a dilution loop in the m anifold design, resulted in excessive noise w e ll before the d esired reduction in potassium concentration was reached. W hile it is possib le to expand the standard range som ew hat, this increase w ou ld have no effect on reducing the analyst workload w h en aliquoting the original sam ple extract.
Our photom eter required slight adjustment of som e of the m anifold parameters specified in the AOAC m ethod. Data presented refer to this adjusted procedure. Because expanded range

1328 KANE ET AL.: J. ASSOC. OFF. ANAL. CH EM . (VOL. 64, N O . 6, 1981)
and reduced aliquotin g did not prove feasible, attention w as directed towards im proving sam p lin g rate and precision.
To bring the b aseline on scale so that the data handler could be fully utilized, the low and high standards w ere adjusted to about 18 and 98 chart d iv ision s, respectively , rather than the usual 10 and 90 chart d iv isions. W ith all other param eters rem aining the same, a random ly ordered set of 40 standards w as analyzed at sam pling rates of 4 0 /h to 120 /h . Table 5 tabulates peak heigh t m eans and standard deviations for each standard concentration. Our com puter system g ives sim ilar results.
In analyzin g the data in Table 5 it sh ou ld be rem em bered that, because it is a flam e rather than a colorim etric m ethod, th e chart tracing is m ore noisy . This w ou ld make it desirable to have m u ltip le sets o f carryover peaks so that a m ore accurate carryover factor could be calculated. At the tim e th is work w as d one, the data handler program m ing lim ited m u ltip le carryover determ inations, but a n ew er version allow s carryover determ inations to be run separately before actual sam ple determ inations. At 4 0 /h the system operates w ith virtually n o carryover. H ow ever, at 4 0 /h the system calculated a carryover factor larger than that at 50 /h , no doubt due to system n oise on the carryover peaks. This w o u ld explain w h y at 4 0 /h there are several in stances w h ere the precision is s ligh tly greater w ith ou t carryover correction than w ith correction.
A second factor to rem em ber is that, because of n o ise , there are instances w h ere precision seem s w orse at a low sam pling rate, and better at a m uch h igh er sam pling rate for the sam e standard. But w hat must be looked at are the general trends.
W ithout carryover correction, precision is about equ ivalent at sam pling rates of 40, 50, and probably 6 0 /h . A bove 6 0 /h , precision rapidly deteriorates. W ith carryover correction, precision is about as good even at 120 /h as it is at 40 /h , w ith the possib le exceptions o f standards N o. 2 and 6 . A larger volum e o f data w ould need to be generated to determ ine if these effects at 1 2 0 /h w ere due to real loss of precision , or just the random effect o f noise.
At 120/h , the system is operating 5 to 10 chart d iv ision s away from steady state. A low peak is alm ost obscured as a shou lder on a preced ing h igh peak. Table 5 dem onstrates that there is considerable leew ay for mathematically cleaning up such poor quality data, w h ich w ould be totally unacceptable w ith ou t correction.Conclusion
Data calculation and instrum ent control prov id e a m uch n eed ed link b etw een analyzer and com puter, expanding their capabilities. In com parison w ith a large, m ultipurpose laboratory computer system w hich com bines a number o f on -lin e instrum entation elem ents, adm in istrative reporting elem ents, and p erson n el to m aintain and m odify software, the data handler d oes sacrifice flexib ility . O n the other hand, it requries no com puter expertise to make it operational, it is available for im m ediate use, and the exp en se is in the range o f the annual salary o f on e com puter person. A laboratory w o u ld do w e ll to evaluate these features in the context o f its ow n long-range com puter goals.
References(1) Official Methods of Analysis (1980) 13th Ed., AOAC,
Arlington, VA(2) Furman, W. B. (1976) Continuous Flow Analysis,
Marcel Dekker Inc., New York, NY, p. 219

W ALTKING & WESSELS: J. ASSOC. OFF. ANAL. CHEM . (VOL. 64, N O . 6, 1981) 1329
O ILS AND F A T S
Chromatographic Separation of Polar and Nonpolar Components of Frying FatsARTHUR E. WALTKING1 and H. WESSELS2Best Foods, Research and Engineering Center, CPC International, Inc., Union, NJ 07083A method is proposed to assess deterioration of frying fats by measuring polar and nonpolar components separated on a silica gel column. Means for polar components measured in duplicate samples by 19 collaborators ranged from 8.0 ± 0.34 to 25.8 ± 0.90%. Coefficients of variation ranged from 3.5 to 4.9%. The method has been adopted as official first action.In a short report by th e Associate R eferee on O xid ized O ils at the 94th A n nual M eetin g of AO AC, W ashington, DC, October 22,1980, it was proposed that the m ethod o f Guhr and W aibel (G. Guhr & J. W aibel (1978) F ette Seifen A nstrichm . 80,106-113) as proposed by Sen Gupta and Guhr be adopted official first action. This m ethod has b een ex ten siv ely collaboratively studied by the IUPAC Com m ission o f Oils, Fats and Derivatives W orking Group N o. 7. O n the basis o f their collaborative study (in w h ich the AOAC A ssociate R eferee participated), the IUPAC C om m ission has recom m ended the fo llo w in g procedure for adoption as an official IUPAC procedure:
Polar C om p on en ts in Frying Fats —O ffic ia l First A ction
IU P A C -A O A C M eth odPrinciple
M ethod assesses deterioration o f used frying fats, and is applicable to all fats and oils. Polar com ponents are those com ponents of fats detd by colum n chrom atgy under conditions sp ecified , and in clu d e polar substances such as m on o gly cerides, d ig lycerides, free fatty acids that occur in u nused fats, as w e ll as polar transform ation products form ed during frying o f foodstuffs
1 A. E. Waltking is Associate Referee on Oxidized Oils.2 Chairman, IUPAC Commission of Oils, Fats, and Derivatives Working Group No. 7. Federal Center for Lipid Research, D-4400, Munster, Federal Republic of Germany.-The recommendation of the Associate Referee was approved by the General Referee and Committee C and was adopted by the Association. See /. Assoc. Off. Anal. Chem. 65, March issue (1982).Received June 10,1981. Accepted June 19,1981.
a n d /o r during heating. N onpolar com p onents are m ostly unaltered triglycerides. Frying fats are sepd by colum n chrom atgy on silica g e l in to non p olar and polar com ponents. Polar com pon en ts are detd indirectly by subtracting concn of nonpolar com ponents. Quality of sepn can be checked by th in layer chrom atgy.
Apparatus(a) C olum n.—Glass, 2.1 cm id X 45 cm, w ith
T eflon stopcock and ground-glass joint.(b) TLC p la tes.—Pre-coated silica g e l (w ithout fluorescence indicator), 20 X 20 cm , layer th ickness = 0.25 mm.
Reagents(a) A dsorben t.—Silica ge l 60, particle size
0.063-0.200 m m (70-230 m esh ASTM ), Merck N o. 7734, or equ iv., adjust to H 2O co n ten t o f 5% as follow s: Dry silica ge l > 4 h in porcelain dish in 160° oven; cool in desiccator to room tem p. Adjust H 2O content to 5%, e.g., w eigh 152 g silica g e l and 8 g H 2O in 500 mL r-b flask w ith ground-glass stopper and m ech. shake 1 h.(b) Eluting so lven t m ix tu re.—L ight petroleum (bp 4 0 -6 0 °)-e th y l ether (87 + 13).
(c) S ea-san d .—Anal, reagent grade; purified by acid and calcined.
(d) Spray reagent.—M olybdophosphoric acid, 10% in alcohol.
Preparation o f Sam pleWarm sem i-liq . and so lid sam ples to tem p,
s ligh tly above m p and m ix thoroly; avo id overheating. Rem ove visible im purities by filtration; if H 2O is present, use hydrophobic filter.
Preparation o f Colum nFill colum n w ith ca 30 mL lig h t p etro leu m -
eth y l ether (87 + 13). Place w ad o f cotton w o o l in bottom of colum n and rem ove air by pressing w ith glass rod.
In 100 mL glass beaker, prep, slurry o f 25 g silica g e l and ca 80 m L lig h t p etro leu m -eth y l ether (87 + 13) and pour slurry into colum n thru 8 cm glass fu n n el. R inse beaker, fu n n el, and
0004-5756/ 8 1 / 6406-1329-02$01.00© Association of Official Analytical Chemists, Inc.

1330 W ALTKING & WESSELS: J. ASSOC. OFF. ANAL. CHEM . (VOL. 64, N O . 6, 1981)
1 2 1 2 1 2FRACTION
Figure 1. Evaluation of efficiency of fractionation by TLC separation of polar and nonpolar fraction; Fraction 1 contains nonpolar components, Fraction
2 contains polar components.
sides o f colum n w ith sam e solv. O pen stopcock and drain solv . to 10 cm above silica ge l. Level silica ge l by tapping colum n.
A dd ca 4 g sea-sand thru fu n n el in to colum n. Drain solv . to sand layer.
Chroma tographyTo det. polar com p onents by d iff., o n ly n o n
polar fraction is used. H ow ever, i f sep n is controlled by TLC, both polar and nonpolar fractions are required. Sepn may also be controlled by ch eck ing recovery o f sam ple, but for sam ples contg substantial amts o f polar material, recovery may be incom plete because sm all amts o f h igh ly polar m aterial, gen era lly 1- 2%, are not elu ted under con d ition s specified .
Accurately w e ig h 2.5 ± 0.1 g (to 0.001 g) sam p le into 50 mL vol. flask, and dissolve in ca 20 mL lig h t p etro leu m -eth y l ether (87 + 13) w h ile w arm ing sligh tly . Let cool to room tem p, and dil. to vo l. w ith sam e solv . U sin g vo l. pipet, transfer 20 mL sam ple to colum n, w ith ou t d isturbing surface.
Dry tw o 250 mL r-b flasks in 103 ± 2° oven , cool to room temp., and accurately w eigh to 0.001g. Place one flask under colum n, open stopcock, and let sam ple so ln drain to lev el o f sand layer. Elute nonpolar com p onents w ith 150 mL ligh t petroleum -ethyl ether (87 + 1 3 ) contained in 250 mL dropping fu n n el. Adjust f lo w rate so that 150 mL passes thru co lum n w ith in 60 -7 0 m in. A fter e lu tion , w ash any substance ad h erin g to ou tlet o f co lum n in to r-b flask w ith lig h t petro-
Table 1. Statistical results of IUPAC collaborative study of polar components In frying fats
SampleMean3, % polar
components SDCV,%
1 8.0 0.34 4.32 7.3 0.36 4.93 11.5 0.55 4.84 25.8 0.90 3.5
3 Samples analyzed in duplicate, 19 collaborators.
leu m -eth y l ether (87 + 13).Elute polar com ponents into second 250 mL i-b
flask w ith 150 mL sam e solv . D iscard silica gel.
Rem ove solv. from both fractions w ith a rotary evaporator and 60° w ater bath or w ith N stream in 250 mL beaker on steam plate. A v oid losses due to foam ing. If rotary evaporator is used, shortly before en d o f evapn, introduce N into system from rubber bulb. Cool residue to am bient tem p, and introduce N in to flask. W eigh flasks.
CalculationsCalc, polar com p onents, as % (w /w ) by formula:
Polar com p onents, % = [(E — A) I E] X 100w h ere A = g nonpolar fraction; E = g sam ple disso lved in 20 mL. Report result to 1 decim al place.
Control b y Thin Layer Chrom atographyD il. polar and nonpolar fraction (1 + 9) in
CHCI3. A p ply 2 /tL spots u sin g capillary d isp en sin g pipet. D evelop p late w ith lig h t petroleum -ethyl ether-acetic acid (70 + 30 + 2) in tank lined w ith filter paper. D evelop plate ca 35 m in (ca 17 cm). Rem ove plate and let so lv . evap.
Spray plate w ith 10% m olybdophosphoric acid. A fter evapn o f a lcohol, heat plate in 120-130° d rying oven .
R esultsFigure 1 show s a chromatogram obtained after
fractionation o f a frying fat.Key statistical elem ents from the IUPAC co l
laborative studies supporting the valid ity o f this procedure are sh ow n in Table 1. C om plete d etails o f the collaborative stu d ies in v o lv in g this m ethodology w ill be available in a future IUPAC publication. It is recom m ended that the m ethod be adopted official first action.
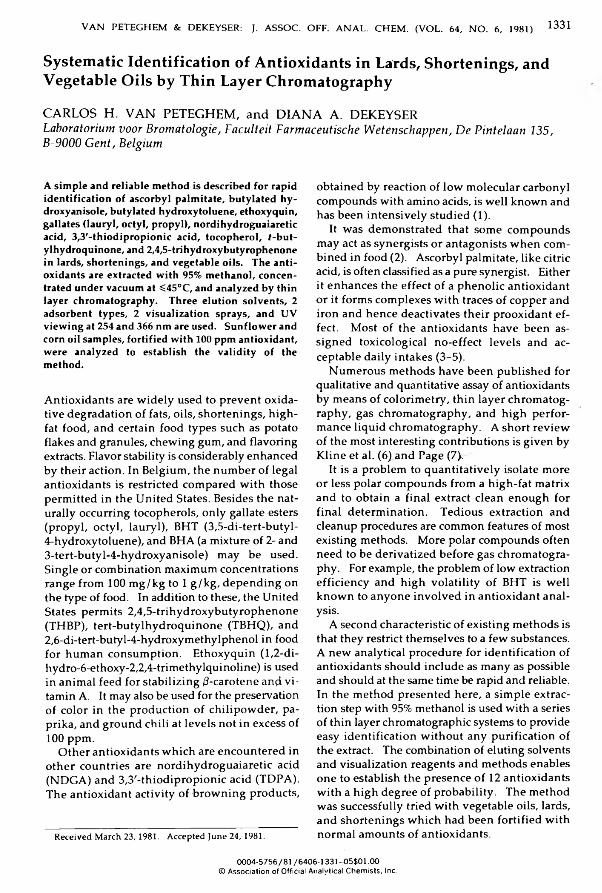
VAN PETEGHEM & DEKEYSER: J. ASSOC. OFF. ANAL. CHEM . (VOL. 64, N O . 6, 1981) 1331
Systematic Identification of Antioxidants in Lards, Shortenings, and Vegetable Oils by Thin Layer ChromatographyCARLOS H. VAN PETEGHEM, and DIANA A. DEKEYSERLaboratorium voor Bromatologie, Faculteit Farmaceutische Wetenschappen, De Pintelaan 135, B-9000 Gent, Belgium
A simple and reliable method is described for rapid identification of ascorbyl palmitate, butylated hy- droxyanisole, butylated hydroxytoluene, ethoxyquin, gallates (lauryl, octyl, propyl), nordihydroguaiaretic acid, 3,3'-thiodipropionic acid, tocopherol, f-but- ylhydroquinone, and 2,4,5-trihydroxybutyrophenone in lards, shortenings, and vegetable oils. The antioxidants are extracted with 95% methanol, concentrated under vacuum at <45°C, and analyzed by thin layer chromatography. Three elution solvents, 2 adsorbent types, 2 visualization sprays, and UV viewing at 254 and 366 nm are used. Sunflower and corn oil samples, fortified with 100 ppm antioxidant, were analyzed to establish the validity of the method.
A ntioxidants are w id e ly used to prevent oxidative degradation o f fats, o ils, shorten in gs, h igh - fat food , and certain food types such as potato flakes and granules, chew ing gum , and flavoring extracts. Flavor stability is considerably enhanced by their action. In B elgium , the num ber o f legal antioxidants is restricted com pared w ith those perm itted in the U n ited States. Besides the naturally occurring tocopherols, on ly gallate esters (propyl, octyl, lauryl), BHT (3,5-di-tert-butyl-4-hydroxytoluene), and BHA (a mixture of 2- and3-tert-butyl-4-hydroxyanisole) m ay be used. S in gle or com bination m axim um concentrations range from 100 m g /k g to 1 g /k g , d ep en d in g on the type o f food. In addition to these, the United States perm its 2 ,4 ,5-trihydroxybutyrophenone (THBP), tert-butylhyd roquinone (TBHQ), and2,6-di-tert-butyl-4-hydroxym ethylphenol in food for hum an consum ption . E thoxyquin (1,2-di- hydro-6-ethoxy-2,2,4-trim ethylquinoline) is used in anim al feed for stab iliz in g /3-carotene and v itamin A. It may also be used for the preservation of color in the production o f ch ilip ow d er, paprika, and ground ch ili at lev e ls not in excess of 100 ppm .
O ther antioxidants w h ich are encountered in other countries are nordihydroguaiaretic acid (NDG A) and 3 ,3 '-th iodipropionic acid (TDPA). The antioxidant activity o f brow n in g products,
Received March 23, 1981. Accepted June 24, 1981.
obtained by reaction o f lo w m olecular carbonyl com pounds w ith am ino acids, is w ell know n and has been in ten siv e ly studied (1).
It w as dem onstrated that som e com pounds m ay act as synergists or antagonists w h en com bined in food (2). Ascorbyl palm itate, like citric acid, is often classified as a pure synergist. Either it enh an ces the effect o f a p h en o lic antioxidant or it form s com p lexes w ith traces o f copper and iron and h en ce deactivates their prooxidant e ffect. M ost o f the antioxidants have b een assign ed toxicological n o-effect lev e ls and acceptable daily intakes (3-5).
N um erous m ethods have b een p u b lish ed for qualitative and quantitative assay o f antioxidants by m eans o f colorim etry, th in layer chrom atography, gas chrom atography, and h ig h perform ance liquid chrom atography. A short rev iew o f the m ost interesting contributions is g iven by K line et al. (6) and Page (7),
It is a problem to quantitatively isolate m ore or less polar com pounds from a h igh-fat matrix and to obtain a final extract clean en o u gh for final determ ination. T edious extraction and cleanup procedures are com m on features o f most existing m ethods. More polar com pounds often n eed to be derivatized before gas chrom atography. For example, the problem of low extraction efficien cy and h ig h vo la tility o f BHT is w e ll k n ow n to an y on e in vo lved in antiox idant analysis.
A second characteristic o f ex istin g m ethods is that they restrict them selves to a few substances. A n ew analytical procedure for identification o f antioxidants shou ld include as m any as possible and should at the same tim e be rapid and reliable. In the m ethod presented here, a sim ple extraction step w ith 95% m ethanol is used w ith a series of thin layer chromatographic system s to provide easy id en tification w ith ou t any purification o f the extract. The combination of eluting solvents and visualization reagents and m ethods enables on e to establish the presence o f 12 antioxidants w ith a h ig h degree o f probability. The m ethod w as successfully tried w ith vegetable oils, lards, and shorten in gs w h ich had b een fortified w ith norm al am ounts o f antioxidants.
0004-5756/81/6406-1331-05$01.00© Association of Official Analytical Chemists, Inc.
1332 VAN PETEGHEM & DEKEYSER: J. ASSOC. OFF. ANAL. CHEM . (VOL. 64, NO. 6, 1981)
M E T H O DApparatus
(a) R o ta ry vacuum eva p o ra to r .—Glass con struction, spiral condenser, tem perature-controlled w ater bath (Tokyo Rikakikai Co., Ltd.), or equivalent.
(b) TLC p la te s .—Silica gel plates, 20 X 20 cm, layer th ickness 0.25 m m , w ith 254 nm fluorescence indicator (Merck N o. 5715); polyam ide plates, 20 X 20 cm, layer thickness 0.15 mm, w ith 254 nm fluorescence indicator (Merck N o. 5557).
(c) S pottin g p ipets. — 10 p L capacity w ith 1 pL graduations (Haak, or equ ivalent).
(d) U V lam p.—Excitation w avelengths 254 and 366 nm.Reagents
A ll reagents used w ere analytical grade.(a) M eth a n o l.—95%.(b) E thanol.— 96 proof, freshly d istilled .(c) A n tio x id a n ts .— Ascorbyl palm itate (AP),
BHA, BHT, lauryl gallate (LG), octyl gallate (OG), propyl gallate (PG) from Fluka, Sw itzerland; ethoxyquin from J. Dekker, Naarden, The N etherlands; NDG A, TDPA, and TBHQ from Aldrich Europe, Belgium; DL-a-tocopherol from M erck, Germany; THBP from Sigm a C hem ical Co., St. Louis, MO.
(d) Reference stan dard solutions for TLC .—Accurately w e ig h and transfer 50 m g o f each antioxidant (except 100 m g BHT and TDPA) into 10 mL volum etric flask, d isso lve in 96° ethanol and dilute to volum e. If screened from daylight and stored at 4°C, solutions are stable at least 4 weeks, except AP w h ich has to be prepared every other day. Several reference standards may be com bined in on e so lu tion to decrease num ber o f solutions.
(e) Standard solu tions fo r control sam ples .— Accurately w e ig h and transfer 0.500 g o f each antioxidant into 100 mL volu m etric flask, d issolve in acetone, and dilute to volum e. Keep cool and screened from su n ligh t (see d).
(f) Elution so lv en ts .—S olven t A: petroleum eth er -b en zen e-ace tic acid (40 + 40 + 20). Solv en t B: «-h exan e-aceton e-acetic acid (55 + 40 + 15). Solvent C; m ethanol-acetone-w ater (60 + 20 + 20).
(g) Reagent 1 (Emmerie-Engel rea g en t).— Ferric ch loride solution: D isso lve 100 m g ferric ch lo ride in 100 mL d istilled water. 2,2'-Bipyridin solution: D isso lve 500 m g 2,2'-bipyridin in 100 mL 96° ethanol.
(h) Reagent 2 .— D isso lve 100 m g 2,6-dibro-
m oquin one-4-ch lorim ide in 100 mL 96° e th anol.
(i) C ontrol sam ples. — 100 ppm . Accurately w eigh 100 g su n flow er oil con ta in in g no antioxidant except naturally occurring tocopherol in vacuum evaporator flask, add 2 mL standard solu tion for control sam ples, and mix thoroughly Evaporate so lven t at < 45°C at reduced pressure u n til no acetone odor is perceptible. Prepare control sam ples of same concentration in corn oil in sam e w ay. Keep screened from daylight.
Extraction ProcedureW eigh 10 g o il in 50 mL glass-stopper tube.
Add 25 mL 95% m ethanol and shake v igo rou sly > 5 m in. C entrifuge 10 m in and decant alcohol layer. Repeat extraction with another 25 mL 95% m ethanol. C om bine alcohol layers. Evaporate to 3 -4 mL in rotary vacuum evaporator at <45°C. Transfer quantitatively to conical test tube and con cen tra te in n itro g en stream , carefu lly avoiding b low ing extract dry. Reconstitute w ith 1 mL 96° ethanol.
W eigh 10 g lard or shorten in g , add 50 mL 96° ethanol, and reflux on boiling water bath 30 min. Cool and filter. Evaporate filtrate to 3 -4 mL and contin u e as for liquid sam ples.
Thin Layer Chrom atographyA p ply 2 cm from the bottom and 1 cm apart 2
p L o f each reference standard so lu tion together w ith aliquot (2 -8 p L ) o f sam ple extract on 2 silica gel plates. Dry spots in cold air stream. D eve lop on e plate in elu tion so lven t A, and the other in elu tion so lv en t B, both to 15 cm. Dry plates in co ld air stream and observe under UV light. T horoughly spray plate d ev elop ed in so lven t A w ith 2,6-d ibrom obenzoquinone-4- chlorim ide reagent and heat 5 m in at 105°C. W hile still hot, place plate in tank saturated w ith am m onia vapor. Spray the other plate thorou gh ly w ith ferric chloride solution, dry in cold air stream , and spray im m ediately w ith 2 ,2 '- bipyrid in reagent. After each step, carefully compare spot colors. Finally, observe under UV light.
If any doubt rem ains after exam ination o f e ither plate, apply standards and u n k n ow n on polyam ide plate and develop in solvent C. After elution, dry in cold air stream and visualize as for plate for so lven t A.
R esu lts and D iscu ssionSpiking o f blank o il sam ples w as m ore com
plicated than generally presum ed. N ot all an-

VAN PETEGHEM & DEKEYSER: J. ASSOC. OFF. ANAL. CHEM . (VOL. 64, N O . 6, 1981) 1333Table 1. Approximate /?, value of antioxidants separated with various thin layer chromatographic systems
Antioxidant System Aa System B ö System C c
Ascorbyl palmltate 0.12 0.38 0.04Butylated hydroxyanisole (BHA) 0.48 0.50 0.44Butylated hydroxytoluene (BHT) 0.79 0.75 0.36Ethoxyquin 0.22 0.60 0.59Lauryl gallate (LG) 0.21 0.43 0.13Nordihydroguaiaretic acid (NDGA) 0.06 0.34 0.25Octyl gallate (OG) 0.17 0.41 0.25Propyl gallate (PG) 0.09 0.32 0.453,3'-Thiodlpropionlc acid (TDPA) 0.25 0.26 __d«-Tocopherol 0.61 0.70 0.03f-Butylhydroquinone (TBHQ) 0.30 0.45 0.482,4,5-Trlhydroxybutyrophenone (THBP) 0.19 0.41 0.37
8 Silica gel plates; benzene-petroleum ether-glacial acetic acid (40 + 40 + 20). b Silica gel plates; hexane-acetone-glacial acetic acid (55 + 40 + 5). c Polyamide plates; methanol-acetone-water (60 + 20 + 20). d Not detectable.
tioxidants w ere so lu b le en o u gh in su n flow er or corn oil to be d isso lved by sim ple addition of the pure com p ound and subsequen t thorough m ixin g . A d d ition o f a concentrated ethan olic solu tion o f the standards gave erroneous positive results u pon extraction. W hen 2 mL ethanolic so lu tion o f any antioxidant w as added to 100 g vegetab le o il and the w h o le w as thorou gh ly m ixed, the com p ound cou ld be recovered by sim ple m ixing for 5 s w ith a sm all vo lu m e of 95% m ethanol, apparently because it had not been d isso lved in the oil.
T herefore standard so lu tion s w ere prepared in acetone, w h ich is m iscib le w ith m ost oils. A fter careful m ix in g o f 100 g o il and 2 mL standard solu tion , the so lven t w as evaporated in a rotary vacuum evaporator at < 45°C un til the pungent acetone odor was no longer perceptible. This usually took more than 30 min. Com pletely
Table 2. Color differentiation of antioxidants on thin layer chromatographic plates
Antioxidant Reagent 1a Reagent 2 bAscorbyl palmltate red orangeButylated hydroxyanisole yellow lilacButylated hydroxytoluene red yellow0Ethoxyquin red yellow greenLauryl gallate bluish grey light brownNordihydroguaiaretic acid bluish grey brownOctyl gallate bluish grey light brownPropyl gallate bluish grey light brown3,3'-Thlodlproplonic acid __d pale bluea-Tocopherol red yellowf-Butylhydroquinone pink violet2,4,5-Trlhydroxybutyrophenone brown green brown
3 Ferric chloride-2,2'-blpyridin.6 2,6-Dlbromoqulnone-6-chlorimide and ammonia. c With blue fringe. d Not detectable.
translucent o ils w ere obtained w ith no v isib le particles in contrast to the presence o f particles w h en the antioxidants w ere added as such to the oils.
Particular em phasis sh ou ld be g iv e n to the extraction duration. A n acceptable recovery w as ach ieved w h en the so lv en t-o il m ixture w as vigorously shaken at least 5 m in. The extraction precision w as not determ ined because our purp ose w as iden tification only; evaluation w as based on detectability o f norm ally en countered or reasonable antioxidant concentrations (about 100 ppm ). The chrom atographic separation usually in clu d ed silica g e l p lates, 2 e lu tion system s, and 2 visualization m ethods. A ddition of acetic acid m in im ized spot tailing. The com bination of R f values (Table 1) and spot color (Table2 ) w as a satisfactory m eans o f iden tifica tion for
Table 3. Color differentiation of antioxidants after separation on polyamide layer and vaporization of reagent
2 (2,6-dibromoquinone-6-chlorimide and ammonia vapors)
Antioxidant Reagent 2Fluorescence,
366 nm
Ascorbyl palmltate white8 yellowButylated hydroxyanisole blue __bButylated hydroxytoluene white3 __ _ bEthoxyquin violet blueLauryl gallate yellow yellowNordihydroguaiaretic acid blue orangeOctyl gallate yellow yellowPropyl gallate yellow yellow3,3'-Thiodiproplonic acid ___ C __ba-Tocopherol white8 __bf-Butylhydroquinone pink __ b2,4,5-Trihydroxybutyrophenone yellow __ b
a Easily perceptible on a light brown background. 6 Absorption. c Not detectable.

1334 VAN PETEGHEM & DEKEYSER: J. ASSOC. OFF. ANAL. CH EM . (VOL. 64, N O . 6, 1981)
Figure 1. Tracing of typical TLC separations of antioxidants.A, benzene/petroleum ether/glacial acetic acid (40/40/20) on silica gel plates; B, hexane/acetone/glacial acetic
acid (55/40/5) on silica gel plates; C, m ethanol/acetone/w ater (60/20/20) on polyamide plates; 1, propyl gallate; 2, ethoxyquin; 3, a-tocopherol; 4, lauryl gallate; 5, butylated hydroxyanisole; 6, butylated hydroxytoluene; 7, ascorbyl palmitate; 8, octyl gallate; 9, f-butylhydroquinone; 10, nordihydroguaiaretic acid; 11, 2,4,5-trihydroxy-
butyrophenone; 12, 3,3'-thiodipropionic acid.
m ost antioxidants in most sam ples. Separations are illustrated on Figure 1.
If resolu tion w as incom plete and color d ifferentiation did not provide an unequivocal result, a third chromatogram on a polyam ide layer w as run. It w as v isu alized w ith reagent 2 and UV v ie w in g (Table 3). Several antioxidants sh ow ed a pronounced fluorescence on th is type o f adsorbent, esp ecia lly ethoxyquin w h en irradiated w ith UV ligh t of 366 nm. This fluorescence w as m uch less on silica ge l p lates and of alm ost n o practical value. AP, PG, and NDG A w h ich w ere poorly resolved on silica ge l w ith either eluant could easily be separated on the p olyam ide layer.
OG, THBP, LG, and ethoxyquin could not be differentiated w ith elu tion system A, nor, except for the latter, w ith elu tion system B, but elu tion system C provided a decisive answer. The same ap p lied to PG and ND G A.
The presence o f TDPA had to be ascertained after spraying the 2,6-d ibrom oquinone-4-chlo- rim ide reagent and before saturation w ith am m onia vapors. W hen TDPA was presum ed, another silica ge l plate had to be d ev e lop ed but w ith elu tion system B, because p olyam ide adsorbent w as unable to resolve the com pound. M ost lik ely TDPA m oved w ith the so lven t front on the polyam ide. THBP as such sh o w ed an orange fluorescence w h en irradiated w ith UV lig h t at 366 nm.
The in ten se b lu e fluorescence o f ethoxyquin
on polyam ide plates w as not affected by the app lication o f spray reagent 1 .
Color d ev elop m en t of BHA and BHT spots w ith ferric ch lo r id e -2 ,2 '-b ipyridin reagent w as rather slow . Sufficient tim e should therefore be allotted for the reaction to take place. Tocoph- erols and tocotrienols w ere not separable by the techn ique described; the com p ound DL-a-to- copherol was used as representative of that group of com pounds, although y - or 5-tocopherol may have been m ore appropriate w ith respect to re lative antioxidant activity. T hese com p ounds m ay, how ever, be differentiated by other m eth ods w h en ever required (8 - 10 ).
The detection o f a-tocop h ero l on silica gel plates after elu tion w ith so lven t system B was som etim es seriously im peded by the presence o f interfering substances co-extracted from the fatty m edium . T hey y ie ld ed ligh t brow n to y e llo w spots w ith either visualization reagent and w ere easily loca lized under 366 nm UV light. H ere, too, the polyam ide plate w as able to provide a d ecisiv e answ er if there w as any doubt.
The techn ique o f spraying w as quite im portant. Because not all antioxidants sh ow ed the sam e h ig h reactivity toward the color reagents, extrem e attention had to be paid to an ev en app lica tion o f so lutions. Before v isualization acetic acid from elu tion system s A and B had tc be com pletely rem oved in a cold air stream so as not to disturb the color developm ent. Residues in flu en ced not on ly color d ev elop m en t but also
V A N PETEGHEM & DEKEYSER: J. ASSOC. OFF. ANAL. CHEM . (VOL. 64, N O . 6, 1981) 1335
color shade. Therefore, on e shou ld not attach a great im portance to the shades m en tion ed in Tables 2 and 3.
Shades w ere not entire ly reproducible, so colors sh ou ld be com pared w ith reference standards. Spraying reagents w ere prepared fresh before use, and the concentrated am m onia solu tion had to be ren ew ed after each application.
The lim its o f m easurem ents, under the con d itions described, w ere in the ppm range, except for AP, BHT, TDPA, and a-tocop hero l w h ich w ere about 50 ppm .
R e f e r e n c e s
(1) Kawashima, K„ Itoh, H., & Chibata, 1. (1977) J.Agric. Food Chem. 25,202-204
(2) Chipault, J. R. (1961) Autooxidation and Antioxidants, Vol. II, W. O. Lundberg (Ed.), Interscience Publishers, New York, NY, pp. 503-518
(3) WHO Food Additives Series (1974) No. 5, WHO, Geneva, Switzerland, pp. 143-208
(4) WHO Food Additives Series (1975) No. 8, WHO, Geneva, Switzerland, pp. 65-79
(5) Seventeenth Report of the Joint F AO I WHO Expert Committee on Food Additives (1974) WHO, Geneva, Switzerland, pp. 18-19
(6) Kline, D. A., Joe, F. L„ & Fazio, T. (1978) /. Assoc. Off. Anal. Chem. 61, 513-519
/(7 ) Page, B. D. (1979) J. Assoc. Off. Anal. Chem. 62, 1239-1246
(8) Govind Rao, M. K., & Perkins, E. G. (1972) J. Agric. Food Chem. 20, 240-245
(9) Cavins, J. F., & Inglett, G. E. (1974) Cereal Chem. 51, 605-609
(10) Abe, K., Yuguchi, Y., & Katsui, G. (1975) J. Nutr. Sci. Vitaminol. 21,183-188
1336 ELLEFSON ET AL.: J. ASSOC. OFF. ANAL. CHEM . (VOL. 64, NO. 6, 1981)
VITAM IN S AND O TH ER N U TR IEN TS
E v a l u a t i o n o f I o n E x c h a n g e R e s i n s a n d V a r i o u s E n z y m e s i n T h i a m i n e A n a l y s i s
WAYNE C. ELLEFSON, EARL RICHTER, MARK ADAMS, and N. THOMAS BAILLIESR a lte c h S c ie n tif ic S e r v ic e s , 3 3 0 1 K in sm a n B lv d , M a d is o n , W / 5 3 7 0 7
Four ion exchange resins and 9 enzyme preparations are evaluated for use in the official AOAC thiamine method because Decalso and Clarase or Mylase P either are no longer available or are available in a form that is not suitable for use in the assay. The enzymes are prepared in the same manner described for Clarase or Mylase P in the AOAC method and are compared with Clarase T300 for their effectiveness in releasing thiamine from thiamine phosphate, and their ability to produce similar results on samples. Rhozyme S is 90 100% as effective as Clarase T300 in both of these respects. The other enzymes tested were not satisfactory. Further study is necessary because Rhozyme S also is no longer manufactured. The ion exchange resins are prepared for use in the manner described for Decalso in the AOAC method. Recoveries of thiamine range from 95 to 100%, using Bio-Rex 70 (hydrogen form) ion exchange resin. The other resins tested were not satisfactory.The determ ination o f total th iam ine in m any products requires treatm ent o f the acid extract w ith an en zym e preparation and subsequent purification by ion exchange chromatography (1, 2). An enzym e preparation m ust hydrolyze the starch present in m ost food sam ples, and release th iam ine from its p hosphate esters (1-3). The secon d function is vital because th iam ine p h osphates, a lthough they are converted to thio- chrome phosphates, are not extracted by isobutyl alcohol, and thus are not detected by the assay(3). A lth ou gh M ylase P and Clarase T300 en zym e preparations have fu lfilled th is function in the past (1), th ey are no lon ger available. To fin d a suitable replacem ent, w e d ev ised a procedure for evaluating the effectiven ess o f an en zym e preparation in releasing th iam ine from th iam ine m onophosphate. A ll en zym e preparations tested w ere effective in h yd ro lyz in g the starch in the acid extracts o f food sam ples.
This report of the Associate Referee, W. C. EUefson, was presented at the 94th Annual M eeting of the AOAC, Oct. 20-23, 1980, at W ashington, DC.
The recom m endtion of the Associate Referee was approved by the General Referee and Committee D and was accepted by the Association. See /. Assoc. O ff. Anal. Chem. 64, 432 (1981).
Received N ovem ber 6,1980. Accepted June 15, 1981.
After the acid extract of the product has been treated w ith an effective enzym e preparation, the extract frequently requires purification by ion exchange chrom atography (1, 2). D ecalso, w h ich traditionally has been used for this purpose, is no lon ger available. A fter evaluating a num ber o f ion exchange resins, w e fou n d an appropriate substitute.
M ETH O DM aterials
For the purpose o f this report, revise 43.024 of the official m ethod to include the fo llow ing:
(a) Ion exchange resins.—(Î) Bio-Rex 70 (hydrogen fo rm ) .—A dd 300 mL
2N HC1 to 50 g Bio-Rex 70® (Bio-Rad Laboratories, R ichm ond, CA), stir 15 m in, decant, and repeat. Add 300 mL water, stir 1 m in, decant, and repeat until pH of w ater is 4 .5-7.0. Water should be free o f suspended resin w h en allow ed to settle 15 s. If not, repeat water w a sh in g until clear.
(2) 4G® 50 W -X 8 .— Prepare as in 43.024(f) (Bio-Rad Laboratories).
(3) lonac C-302®.—Prepare as in 43.024(f) (MCB C hem ial Co.).
(b) E n zym es.— (1) R h ozym e S .— Rohm & Haas Co. (2) A cid phosphatase.—ICN Pharmaceuticals.(3) A cid phosph atase.—Sigm a Chem ical Co. (4) a -A m y la se .— N o. 6630, Sigm a Chem ical Co. (5) a -A m y la s e .—N o. 6880, Sigm a Chem ical Co. (6 ) fi-A m yla se .—Sigm a Chem ical Co. (7) Pancreatin IX .— ICN Pharm aceuticals. (8 ) P epsin 1 - 1 0 ,0 0 0 .—ICN Pharm aceuticals. (9) C larase® T 3 0 0 .—M iles Laboratories.
(c) Thiamine m onophosphate (T M P ).— Prepare as in 43.024(o) (ICN Pharm aceuticals).Evaluation o f Enzym e Preparations
A fresh 6% solution o f each enzym e w as prepared in 2.5M sodium acetate. Two w orking so lu tion s, on e conta in ing 1.0 pg th iam in e/m L from thiam ine HC1 and the other containing 1.0
0004-5756/81/6406-1336-03$01.00© Association of Official Analytical Chemists, Inc.
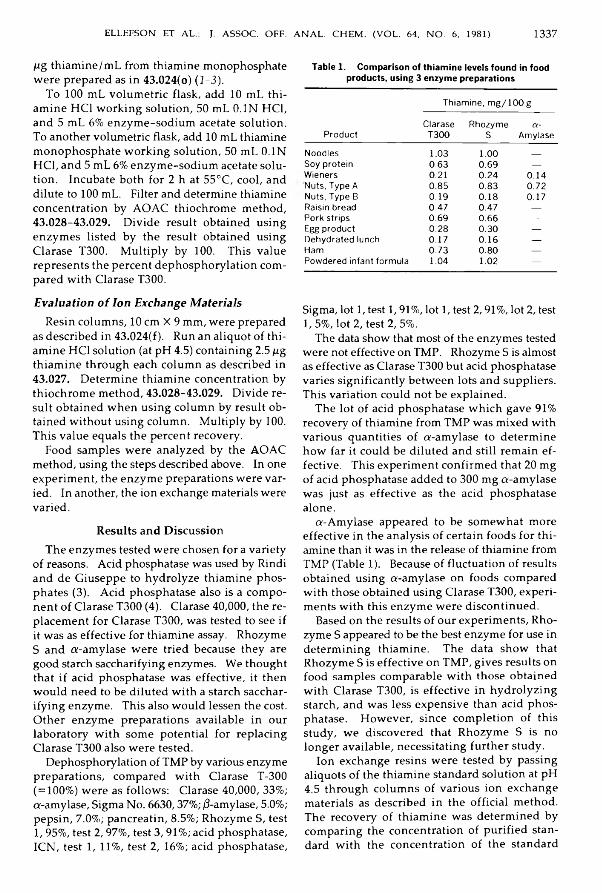
ELLEFSON ET AL.: J. ASSOC. OFF. ANAL. CHEM . (VOL. 64, N O . 6, 1981) 1337Mg thiam ine /m L from thiam ine m onophosphate w ere prepared as in 43.024(o) (1-3).
To 100 mL volu m etric flask, add 10 mL th iam in e HC1 w ork in g solu tion , 50 mL 0.1N HC1, and 5 mL 6% en zym e-sod iu m acetate solution . To another volum etric flask, add 10 mL thiam ine m onop h osp h ate w ork in g solu tion , 50 mL 0.1N HC1, and 5 mL 6% en zym e-sod iu m acetate so lu tion. Incubate both for 2 h at 55°C, cool, and dilute to 100 mL. Filter and determ ine thiam ine concentration by AOAC thiochrom e m ethod, 43.028-43.029. D iv id e result obtained usin g en zym es listed by the result obtained using Clarase T300. M ultip ly by 100. This value represents the percent dephosphorylation com pared w ith Clarase T300.Evaluation o f Ion Exchange M aterials
Resin colum ns, 10 cm X 9 m m , w ere prepared as described in 43.024(f). Run an aliquot of th iam ine HC1 solution (at pH 4.5) containing 2.5 pg th iam in e through each colum n as described in 43.027. D eterm ine th iam ine concentration by th ioch rom e m ethod, 43.028-43.029. D iv id e resu lt obtained w h en usin g colum n by result obtained w ithou t using colum n. M ultiply by 100. T his va lu e equals the percent recovery.
Food sam ples w ere analyzed by the AOAC m ethod, using the steps described above. In one experim ent, the en zym e preparations w ere varied. In another, the ion exchange materials were varied.
R esu lts and D iscu ssionThe en zym es tested w ere chosen for a variety
of reasons. Acid phosphatase was used by Rindi and de G iuseppe to hyd rolyze th iam ine p h osphates (3). A cid phosphatase also is a com pon en t o f Clarase T300 (4). Clarase 40,000, the rep lacem ent for Clarase T300, w as tested to see if it w as as effective for thiam ine assay. Rhozym e S and a-am ylase w ere tried because th ey are good starch saccharifying enzym es. We thought that if acid phosphatase w as effective , it then w o u ld n eed to be d ilu ted w ith a starch saccharify in g enzym e. This also w ou ld lessen the cost. O ther en zym e preparations available in our laboratory w ith som e p oten tia l for replacing Clarase T300 also w ere tested.
D ephosphorylation o f TMP by various enzym e preparations, com pared w ith Clarase T-300 (=100%) w ere as fo llow s: Clarase 40,000, 33%; a-am ylase, Sigm a N o. 6630,37%; /3-amylase, 5.0%; p ep sin , 7.0%; pancreatin, 8.5%; R hozym e S, test 1,95%, test 2,97% , test 3,91%; acid phosphatase, ICN, test 1, 11%, test 2, 16%; acid phosphatase,
Table 1. Comparison of thiamine levels found in food products, using 3 enzyme preparations
Thiamine, mg/100g
ProductClaraseT300
RhozymeS
a-Amylase
Noodles 1.03 1.00 _Soy protein 0.63 0.69 —
Wieners 0.21 0.24 0.14Nuts, Type A 0.85 0.83 0.72Nuts, Type B 0.19 0.18 0.17Raisin bread 0.47 0.47 —
Pork strips 0.69 0.66 —
Egg product 0.28 0.30 —
Dehydrated lunch 0.17 0.16 —
Ham 0.73 0.80 —
Powdered infant formula 1.04 1.02 —
Sigma, lot 1, test 1,91%, lot 1, test 2,91%, lot 2, test 1, 5%, lot 2, test 2, 5%.
The data show that most of the enzym es tested w ere not effective on TMP. Rhozym e S is almost as effective as Clarase T300 but acid phosphatase varies sign ifican tly b etw een lots and suppliers. This variation could not be explained .
The lot of acid phosphatase w h ich gave 91% recovery o f thiam ine from TMP w as m ixed w ith various quantities o f a-am ylase to determ ine h o w far it could be d ilu ted and still rem ain effective. This experim ent confirm ed that 20 m g of acid phosphatase added to 300 m g a-am ylase w as just as effective as the acid phosphatase alone.
a-A m ylase appeared to be som ew h at m ore effective in the analysis o f certain food s for th iam ine than it was in the release of thiam ine from TMP (Table 1). Because o f fluctuation o f results obtained u sin g a-am ylase on foods com pared w ith those obtained u sin g Clarase T300, experim ents w ith th is en zym e w ere d iscontinued .
Based on the results o f our experim ents, Rhozym e S appeared to be the best enzym e for use in determ in in g th iam ine. The data sh ow that R hozym e S is effective on TMP, g iv es results on food sam ples com parable w ith th ose obtained w ith Clarase T300, is effective in h yd ro lyz in g starch, and w as less ex p en sive than acid p h osphatase. H ow ever, since com p letion o f this study, w e d iscovered that R h ozym e S is no lon ger available, n ecessitating further study.
Ion exchange resins w ere tested by passing aliquots o f the thiam ine standard solution at pH4.5 through co lum ns o f various ion exchange m aterials as described in th e officia l m ethod. The recovery o f th iam ine w as d eterm ined by com paring the concentration o f purified standard w ith the concentration o f th e standard

1338 ELLEFSON ET AL.: J. ASSOC. OFF. ANAL. CHEM . (VOL. 64, N O . 6, 1981)
Table 2. Comparison of thiamine levels found in food products, using 2 different ion exchange columns
Sample
Thiamine, mg/100 g Bio-Rex 70
(hydrogen form) DecalsoWieners 0.19 0.19Cheese 0.04 0.04Ham 1.00 1.03Noodles 0.62 0.62Yeast 0.59 0.26Animal feed 5.56 5.29Beef 0.02 0.03TV Dinner 0.02 0.02Chinese style vegetables 0.02 0.02Mustard 0.20 0.12Candy bar 0.08 0.08Bean sprouts 0.07 0.06Egg product 0.29 0.26Bacon 0.68 0.65Powdered infant formula 1.04 1.04
w hich had not been passed through the ion exchange column. The comparative recoveries of2.5 f i g th iam ine passed through 4 ion exchange resins are as follows: Decalso, 95; Ionac C-102, 89; A G 50W-X8, 25; Bio-Rex 70 (sodium form ), 38; Bio-Rex 70 (hydrogen form ), 98%.
The recovery of thiam ine from Ionac C-102, a material sim ilar to Decalso, was 89%. H owever, this material is no longer commercially available, and it was not considered further. The low recovery of thiam ine from A G 50W-X8 appeared to be due to incomplete rem oval of thiam ine from the colum n. A n additional 60 m L eluant increased the recovery of thiam ine to 85%. The need for eluant volum es of th is magnitude render this resin impractical for use w ithout further study. The low recoveries of thiam ine from Bio-Rex 70 (sodium form ) resulted from the in stab ility of thiam ine to the a lkaline pH (10.8)
w h ich results when Bio-Rex 70 (sodium form) is suspended in water. Data indicate that the recovery of thiam ine, as determined in 12 separate analyses by various analysts on d ifferent days, from Bio-Rex 70 (hydrogen form) is 95-100%, whereas the recovery of thiam ine from Decalso is 90-100%.
The capacity of Bio-Rex 70 (hydrogen form) was tested by passing 5 and 25 f i g thiam ine through the columns. Recoveries were 100 and 99%, respectively. Fractionation tests showed the thiam ine to be in the first 15 m L eluate.
Samples were analyzed for th iam ine, using Decalso and Bio-Rex 70 (hydrogen form). Table 2 shows that results compare favorably. Recoveries of added thiam ine from samples range from 95 to 100% for Bio-Rex 70 (hydrogen form ) and for Decalso. The low results obtained using a Decalso column for yeast and mustard were due to high blanks. These low results re-occurred when these products were retested.
R e c o m m e n d a t i o n sFurther study of enzyme preparations is rec
ommended.A collaborative study is recommended using
Bio-Rex 70 (hydrogen form ) in place of Decalso in the officia l A O A C method (1).
References(1) Official Methods of Analysis (1980) 13th Ed., AOAC,
A rlin g to n , VA, secs. 43.024-43.030(2) A ssociation of V itam in C hem ists, Inc. (1956)
Methods of Vitamin Assay, 3rd Ed., In terscience Pub lishers, Inc., N ew York, NY, pp. 123-144
(3) R ind i, G., & de G iuseppe, L. (1960) Biochem. J. 78, 602-606
(4) Enzyme Products for Food and Industrial Processing, M arschall D iv ision , M iles L aboratories, E lkhart, IN

HECKM A N & LANE: J. ASSOC. OFF. ANAL. CH EM . (VOL. 64, N O . 6, 1981) 1339
Comparison of Dietary Fiber Methods for FoodsMARY M. HECKMAN and SUSAN A. LANER a ls to n P urina C o., C heckerboard Sq u are , S t. L ou is, M O 63188
In o rd e r to e v a lu a te sev e ra l p ro p o se d d ie ta ry f ib e r m e th o d s , 12 fo o d sam p les , re p re se n tin g d if fe re n t fo o d classes, w ere an a ly ze d b y (1) n e u tra l a n d acid d e te rg e n t f ib e r m e th o d s (N D F, A DF); (2) N D F w ith enzym e m o d ifica tio n (ENDF); (5) a 2 -fraction enzym e m eth od fo r so lub le , in so lu b le , an d to ta l d ie ta ry f ib er, p ro p o se d b y F u rd a (SD F, ID F , TDF); (4) a 1 -frac tio n en z y m e m e th o d fo r to ta l d ie ta ry f ib e r p ro p o se d b y H e lle n d o o m (TDF). F oods in c lu d e d cereals, f ru its , v eg e tab le s , p e c tin , lo c u s t b ea n g u m , a n d so y b ea n p o ly sacch arid es . R esu lts sh o w th a t T D F b y F u rd a a n d H e lle n d o o m m eth od s agree reasonab ly w ell w ith lite ra tu re va lues b y th e Sou thgate m eth o d , b u t ENDF is c o n s is te n tly lo w er; th a t EN D F a n d ID F (F urda m eth o d ) ag ree rea so n a b ly w e ll; th a t excep t fo r corn b ran f ib er (inso lub le) a n d pec tin an d locust bean fib er (so lu b le ), a ll m a te r ia ls h av e s ig n if ic a n t f ra c tio n s o f b o th so lu b le a n d in so lu b le f ib er. T h e Furda m e th o d w as u sed o n n u m e ro u s fo o d a n d in g re d ie n t sam p les a n d w as fo u n d to be p rac tica l an d in fo rm a tiv e a n d to hav e acceptable p recision (RSD v alues o f 2.65-7.05%). I t is su g g es te d th a t th e F u rd a (o r s im ila r) m e th o d b e g iv e n co n sid e ra tio n fo r th e a n a ly s is o f fo o d s fo r d i e ta ry f ib e r.
Current interest in the nutritional aspects of d ietary fiber has emphasized the need for a satisfactory analytica l method; our laboratory, in common w ith many others, has been concerned w ith the problem. Idea lly , the method should be simple enough to be performed routinely and should measure a ll or most of the constituents of dietary fiber.
Methods for measuring insoluble fiber (cellulose, insoluble hem icelluloses, and the nonpolysaccharide lig n in ) have been greatly im proved w ith the use, first , of detergent methods by Van Soest (1) in the 1960s, and then, in the 1970s, of enzym e-m odified detergent methods by Schaller (2), Robertson and Van Soest (3), Mongeau (4), and others. H ow ever, the more soluble or hyd ro p h ilic polysaccharides are measured less frequently or not at a ll. M any literature references, of w h ich on ly a few are cited here (5-8), m ention the beneficial effects of the hydroph ilic polysaccharides (soluble hem icelluloses, soluble pectins, gums) on, for example, carbohydrate and lip id metabolism. It may be that, when the physiology of dietary fiber is more completely understood, it w il l be possible to suggest a recommended d a ily allowance
Received March 16,1981. Accepted June 18,1981.
of dietary fiber comprised of more or less specific proportions of insoluble and soluble fractions.
O ur p rincipal considerations in the selection of a method w ere, first, measurement w h ich w ould include the more soluble polysaccharides, preferably differentiated from the less soluble, and second, speed and convenience of analytical method.
We of course considered the Southgate method(9), w h ich is intended for hum an foods. It quantitates cellulose, lign in , and water-insoluble and water-soluble non-cellulosic polysaccharides. D efin ing , as it does, the fiber pattern, it provides valuable inform ation and is considered by m any workers to be the most nearly ideal method. It is , how ever, quite time-consuming and demands sk illed technique. These factors seemed to ru le it out as a practical routine method.
We then considered the enzyme methods used by a number of European w orkers. The first of these was reported by W illiam s and Olm sted in 1935 (10). More recent w ork has included methods by H ellendoom et al. (11), Schw eizer and W ürsch (12), Asp and Johansson (13), Theander and Am en (14). These methods represent a biochemical approach, using (except for Theander) physiological enzymes w h ich are thought to sim ulate anim al digestion and thereby give results w h ich correlate w ith the actual fate of foods in the digestive tract. They vary in details of procedure and in fractions obtained: Some methods obtain inso luble andsoluble dietary fiber as separate fractions, some obtain one total amount, and some obtain inso luble dietary fiber only.
It was decided that in evaluating the methods, they w ou ld be compared w ith the conventional neutral and acid detergent methods ( 1) and w ith an enzyme-modified neutral detergent fiber method, w h ich is more applicable to starchy hum an foods.
M E T H O D SMethods chosen for evaluation and compari
son are g iven below:( 1 ) N e u tr a l a n d a c id d e te r g e n t f ib e r (N D F , A D F ).
—These are the conventional Goering-Van Soest methods as published in U .S . Departm ent of Agriculture Handbook No. 379 (1). They consist
0004-5756/81 /6406-1339-05$01.00© Association of Official Analytical Chemists, Inc.

1340 HECKM A N & LANE: J. ASSOC. OFF. ANAL. CH EM . (VOL. 64, N O . 6, 1981)
8070 .
Wheat Bran Whole Wheat Wheat Bran Com Bran Rice Cereal Soy(AACC) Bread Cereal-Sweetened Polysacch.
ggCNDF; □ tdF. Furda; Hellendoorn; ■ lO F , Southgate (Literature)
F igure 1. T o ta l d ie ta ry f ib e r in cereal an d legu m e p ro d u c ts .
of one-stage digestions w ith either a neutral or an acid detergent solution. The insoluble residue from the digestion consists, theoretically, of cellulose, hem icellulose, and lig n in in the N D F method, cellulose and lig n in in the A D F method.
(2) E n z y m e -m o d if ie d n e u tr a l d e te r g e n t f ib e r (EN D F ) .—This is the method, presented by Robertson and Van Soest at the 1977 meeting of the Am erican Society of A n im a l Science (3), specifying bacterial amylase (Type III-A , from B a cillu s su b til is , Sigma Chem ical Co. No. 6505). Am ylase is used to digest the starch w h ich remains undissolved w hen the routine N D F d igestion is applied. Note: Th is particu lar modification was chosen because of its practicality. The interfering starch is removed by enzyme action before filtration , w h ich speeds filtration considerably.
(3) E n zy m e d ig e s tio n — tw o f r a c tio n s (F u rd a ). —T h is method was presented at the 1979 meeting of the A O A C (Abstr. No. 87) (15). B rie fly , it is a digestion w ith 0.01N HC1, pepsin, and pan- creatin (Sigma No. P7012, No. P1750; both porcine). The residue from this treatment is measured as insoluble dietary fiber (ID F ); the materia l in the filtrate is precipitated w ith 4 volum es of ethanol and measured as soluble dietary fiber (SDF). Sum of ID F and SD F is total dietary fiber (TD F). It was chosen for evaluation because it seemed to meet the qualifications that had been set.
Note: Furda's method, as presented at the A O A C meeting, describes conditions for digestion w ith either physiological or bacterial enzymes. He shows sim ilar results w ith either. Because the majority of workers specify physiological enzymes, we elected to use them.
(4) E n z y m e d ig e s t io n — o n e f r a c tio n (H e l le n d o o r n ) .—This was published in 1975(11). It in vo lves digestion w ith 0.1N HC1, pepsin, and
F igure 2. T o ta l d ie ta ry f ib e r in f ru i ts a n d v eg e tab les.
pancreatin (Sigma No. P7012, No. P1750). The residue is measured as TD F. It was chosen for _ts s im p lic ity and convenience.
(5) Literature values by the Southgate method (16, 17), where available, are included in the data.
Samples surveyed are given below.Wheat bran
Wholewheat bread
Pre-sweetened wheat bran cereal
Corn bran
Rice cereal
Soy polysaccharides
Apples(unpeeled)
Oranges (peeled)
Lettuce Carrots C itrus pectin
A A C C Check Sample, 87.3% soft w hite and 12.7% club w h ite wheat
100% w hole wheat, Earth G rains brand
"H oney B ran ," Ralston Purina Co.
From 1977 A A C C collaborative study of Schaller enzyme m odification of N D F
"R ice C h ex ," Ralston Purina Co.
Soy cotyledon ce ll w a ll carbohydrates
N F Lem on Pectin No 3442, Sunkist Growers
Sigma No. G-0753Locust bean gum
Bran and rice cereals were ground to 1 mm size before analysis. Whole wheat bread (4 slices); apples (4, cored, unpeeled); oranges (9, peeled); lettuce (iceberg, 1/4 head); carrots (6 , tops and tails removed, unscraped) were freeze-dried, and then ground. Rem ainder of samples did not require preparation.
Results and DiscussionResults of the various measurements of dietary
fiber are summarized in Table 1.

Table 1. Percent dietary fiber by several methods *
Goering- Van Soest (1)
Robertson- Van Soest (3) Furda (15) Hellendoorn (11)
Southgate (9) lit. values
Sample NDF ADF ENDF IDF SDF TDF TDF TDFWheat bran (AACC) 39.2 ± 0.23 10.7 ± 0.04 33.9 ± 0.24 27.0 ± 0.36 13.1 ±0 .1 4 40.1 ± 0.22 42.2 ± 0.02 44.0(16)Whole wheat bread 11.9 ±0 .28 2.1 ± 0.08 5,0 ± 0.02 10.5 ± 0.26 4.1 ± 0.14 14.6 ± 0.40 10.9 ± 0.08 8.5(16)Pre-sweetened
wheat bran cereal11.0 ±0 .04 5.4 ±0 .09 9.4 ± 0.14 10.3 ± 0.54 4.7 ± 0.06 15.0 ±0.61 14.9 ± 0.28
Corn bran 72.1 ±0 .12 15.4 ±0 .1 0 60.8 ±0 .16 52.8 ±0 .08 3.2 ±0 .1 0 56.0 ±0 .1 8 68.4 ± 1.08 __Rice cereal 6.9 ± 0.08 0.5 ± 0.01 0.6 ± 0.06 1.4 ± 0.10 2.9 ±0 .1 4 4.3 ± 0.04 7.3 ±0.21 4.5(16)“’Soy polysaccharides 30.7 ± 0.42 15.3 ± 0.03 25.3 ± 0.08 30.3 ± 0.42 29.7 ±0 .19 60.0 ± 0.62 52.6 ± 1.36Apples (with peel) 1.2 ±0.01 1.0 ±0 .03 1.1 ± 0.06 1.3 ±0 .02 0.6 ± 0.02 1.9 ± 0.01 1.4 ±0 .01 1.8(17)=Oranges (peeled) 0.7 ± 0.04 0.7 ± 0.01 0.6 ± 0.04 0.9 ± 0.00 1.2 ± 0.08 2.0 ± 0.08 1.2 ± 0.04 2.5(17) =Lettuce 0.7 ±0.01 0.7 ±0.01 0.5 ± 0.02 0.8 ± 0.00 0.4 ± 0.00 1.2 ± 0.00 1.4 ± 0.01 1.5(16)Carrots 1.2 ±0 .02 1.2 ±0 .0 4 1.0 ±0 .02 1.6 ± 0.01 1.2 ±0 .01 2.9 ± 0.01 2.8 ± 0.04 3.7(16)Citrus pectin 1.0 ±0 .10 0.6 ±0.11 none 1.6 ± 0.05 86.6 ± 0.60 88.1 ± 0.65 (U) __Locust bean gum (U) 1.0 ± 0.05 (U) 4.6 ± 0.13 77.3 ±0 .6 8 82.0 ± 0.54 (U) —
* Original weight basis; mean of duplicate analyses.NDF = neutral detergent fiberADF - acid detergent fiberENDF = enzyme modified NDFIDF - insoluble dietary fiberSDF - soluble dietary fiberTDF = total dietary fiber(U) - Urifllterable6 Rice Krispies.r Pectin included.
u>
HECKMAN & LANE: J. ASSOC. OFF. ANAL. CHEM. (VOL. 64, NO. 6, 1981)

1342 HECKM AN & LANE: J. ASSOC. OFF. ANAL. CHEM . (VOL. 64, N O . 6, 1981)
Table 2. Distribution of insoluble and soluble dietary fiber—Furda method
Material Insoluble, % Soluble, %Wheat bran (AACC) 67 33Whole wheat bread 72 28Pre-sweetened 69 31
wheat bran cerealCorn bran 94 6Rice cereal 33 67Soy polysaccharides 50.5 49.5Apples (unpeeled) 69 31Oranges (peeled) 43 57Lettuce 68 32Carrots 57 43Citrus pectin 1.8 98.2Locust bean gum 5.7 94.3
Inspection of the data indicates, as have many other studies, that N D F is almost invariab ly h igher than EN D F , particu larly in the high starch materials such as whole wheat bread and rice cereal. W hen the N D F method, w h ich had been devised for forages, was applied to human foods, it was soon recognized that the N D F residue contained considerable amounts of starch, and the m odifications referred to previously (2-4) are among many w h ich have been proposed to correct the problem.
Figures 1 and 2 show the end results of a ll methods used in the survey except N D F and A D F . Exam ination reveals that total dietary fiber, as obtained by the Furda and Hellendoorn methods and by the Southgate method where available, are in reasonably good agreement. Enzyme-modified N DF gives lower values on all except one of the samples surveyed. It is genera lly accepted that the more soluble fiber components are lost w ith this method. Pectins are known to be solubilized by the detergent solutions used, and support of the assumption that some hemicelluloses are also solubilized is given by Baker (18).
The hydrophilic polysaccharides, pectin and locust bean gum, were measurable by the Furda method only. Pectin gave little or no residue in the detergent methods and an unfilterable residue in the Hellendoorn method; locust bean gum gave unfilterable residues by both methods. These problems could no doubt have been resolved, but no attempt was made.
Inspection of the data reveals that insoluble dietary fiber values, as measured by EN D F and the Furda method, are in reasonably good agreement. In some instances, or in some materials, the insoluble component may be the only one of interest.
Breakdown into soluble and insoluble dietary
Table 3. Percent relative standard deviations— Furda method *
Fraction
Mixtures (27 samples)
Ingredients (8 samples)
RSD,%
Range,%
RSD,%
Range,%
Soluble dietary fiber 4.53 2-14 3.33 2.5-30Insoluble dietary fiber 7.05 1-15 4.24 4-30Total dietary fiber 4.69 4-29 2.65 8-60
a Based on duplicate samples, using one-way analysis of variance.
fiber was possible by the Furda method only. Table 2 shows the distribution of fractions. It w il l be noted that the fiber in corn bran is almost entire ly in the insoluble fraction; the other materials have significant fractions of both insoluble and soluble dietary fiber.
Fo llow ing is a sum m ary of the conclusions reached as a result of the survey: (2) Both the Furda and Hellendoorn enzyme methods give total dietary fiber values that are in reasonably good agreement w ith values by the Southgate method. (2) Enzyme-modified N D F gives (w ith a single exception) lower values than either the Furda or H ellendoorn methods. (3) Insoluble dietary fiber values, as measured by EN D F and the Furda method, are in reasonably good agreement. (4) The Furda method, alone of those tested, measures both soluble and insoluble dietary fiber.
Taking all of the above into consideration, we decided to put the Furda method into use. W ith it, we have successfully analyzed a num ber of ingredients and foods, many of w h ich contain hydrophilic polysaccharides. We have found that it has acceptable precision. Relative deviations are shown in Table 3.
We have found the method practical, as w e ll as inform ative. In a research environm ent, we have been able to run 6 samples w ith 4 V2 h of operator attention. I f insoluble dietary fiber should be all that is desired, 6 samples can be run w ith 3 h of operator attention. These times could undoubtedly be shortened in a control laboratory environm ent.
M uch w ork rem ains to be done before a d ietary fiber method can be considered for acceptance. In the further investigation of this method, we are analyzing more samples and w ill analyze the soluble and insoluble fractions for residual protein and starch as w e ll as component monosaccharides and uronic acids. O ur expe
HECKM A N & LANE: J. ASSOC. OFF. ANAL. CHEM . (VOL. 64, N O . 6, 1981) 1343
rience to date, however, has been encouraging and we w ould like to suggest that th is, or a sim ila r , method be g iven consideration for the analysis of foods for dietary fiber.
References(1) G oering, H. K., & Van Soest, P. J. (1970) Forage Fiber
Analysis, A g ricu ltu re H andbook N o. 379, U.S. D ept, o f A gricu ltu re , W ash in g to n , DC
(2) Schaller, D. (1976) AACC M eeting, N ew O rleans, LA; AACC M ethod 32-20, F irst A pproval 10/ 26/77, Methods of the American Association of Cereal Chemists, M in n eap o lis , M N
(3) R obertson, J. B., & Van Soest, P. J. (1977) A m erican Society o f A nim al Science M eeting , M adison, WI
(4) M ongeau, R., & Brassard, R., Getreide Mehl Brot (in press)
(5) B urkitt, D. P„ & T row ell, H . C. (1975) Refined Carbohydrate Foods and Disease. Some Implications of Dietary Fiber, A cadem ic Press, N ew York, NY
(6 ) Spiller, G. A., & A m en, R. J. (Nov. 1975) Crit. Rev. Food Sei. Nutr. 39-70
(7) A n derso n J. W „ & C h en , W. L. (1979) Am. J. Clin. Nutr. 346-363(8) S p iller, G. A., & A m en, R. J. (1976) Fiber in Human
Nutrition, P len u m Press, N ew York, NY(9) S outhgate , D. A. T. (1969) ]. Sci. Food Agric. 20,
331-335(10) W illiam s, R. D., & O lm sted , W. H . (1935) J. Biol.
Chem. 108,653(11) H ellendoorn , E. N ., N oordhoff, M. G„ & Slagman,
J. (1975) J. Sci. Food Agric. 26,1461-1468(12) Schw eizer, T. F„ & W ürsch, P. (1979) /. Sci. Food Agric. 30 ,613-619(13) Asp, N . G., & Johansson, C. G. (1978) EEC W orking
Party o n D ietary F ibre, C am bridge , UK(14) T h ean d er, O ., & A m en, P. (1979) Swedish J. Agric.
Res. 9(3), 97-106(15) Furda, I., Gengier, S. C , Johnson, R. R., M agnuson,
J. S., & Sm ith, D. E. (1979) AOAC A nnual M eeting, W ash ing ton , DC
(16) Southgate, D. A. T., e t al. (1976) ]. Human Nutr. 30, 303-313
(17) S outhgate , D. A. T. (1976) Determination of Food Carbohydrates, A p p lied Science P u b lish ers , Ltd, L ondon , UK
(18) Baker, D. (1978) Cereal Foods World 23, 557-558
1344 KELLY: J. ASSOC. OFF. ANAL. CHF.M. (VOL. 64, N O . 6, 1981)
S T A T IS T IC A L T E C H N IQ U E S
Correction of Bias in Collaborative Check Sample Series ReportingPATRICK C. KELLYC a n a d a P a c k e r s I n c . , R e s e a r c h C e n t r e , 2 2 1 1 S t . C l a i r A v e W , T o r o n t o , O n t a r i o ,C a n a d a M 6 N 1 K 4
Scores o r accuracy indices used in co llabora tive check se rie s to ev a lu a te la b o ra to ry p erfo rm an c e are in f lu en ce d b y fac to rs th a t hav e n o th in g to do w ith perform ance. Scores based on norm alized dev ia tions are a ffec ted b y th e n u m b e r of resu lts rep o rte d on a g iv en m eth od . T he average score o r overall accuracy in d ex o b ta in e d by a g iv en la b o ra to ry is affec ted also b y th e n u m b er o f resu lts rep o rted by th a t laborato ry . By ju d ic io u s choice o f m e th o d s on w h ich to rep o rt, a la b o ra to ry can im p ro v e its score w ith o u t m ak in g a co rre sp o n d in g im p ro v e m e n t in ana ly tica l p e rfo rm ance. T hese effects are revealed in an exam ination of th e s ta tis tic a l d is tr ib u tio n of n o rm a liz ed d ev ia tio n s . T he m a g n itu d e of these effec ts on la b o ra to ry ra n k in g s is o b ta in e d from m o d e lin g ex p e rim en ts w ith co m p u te r-g en e ra ted ran d o m n u m b ers . T he in h e re n t u n fa irn e ss of th e c o n v e n tio n a l m eth o d of ca lcu la ting perform ance indices can be e lim inated by co nverting norm alized dev ia tions to num bers hav ing a n o rm al sta tistical d is trib u tio n . T h is transfo rm ation is m athem atica lly com plicated, b u t is no t too d ifficu lt fo r a com pute r. T he resu ltin g p aram eters accurately reflec t lab o ra to ry perfo rm ance, are re la tiv e ly easy to in te rp re t, and p erm it th e es tab lishm en t of confidence in te rv a ls fo r la b o ra to ry ran k in g s .
In a collaborative check series, homogeneous samples are sent to a number of participating laboratories for the determination of several components. Analytical results are collected and compared, and a report is issued g iv ing a score for each analysis and an overall score and rank for each laboratory. U n like a collaborative study, the objective of a check series is the measurement of laboratory rather than method performance. Results for many large scale check series programs are analyzed by a procedure developed by Perrin and Glocker (1), w hich w ill be referred to here as the conventional method. F irst, let us define the details of this procedure.
Let x im represent the result obtained by Lab. / using method m on a particular sample (/ = 1, 2 , . . . L; m = 1 ,2 . . . M ) . Usually, some laboratories w il l not be able to report on all methods. Let M i represent the number of methods reported by
Received May 4,1981. Accepted July 6, 1981.
Lab. /, and L,„ the number of results reported for Method m .
The normalized deviation for Lab. / on Methodm is
2/m d i,„ j S,n (1)
where di„, = X/,,, — if,,,; if,,, is the mean; and s,„ is the standard deviation for Method m . The mean and standard deviation usually are censored in some manner, that is, results that are obviously in error are left out of the calculations. If some results are rejected, L refers to the number of results used in calculating the mean and standard deviation.
The deviation from the mean, d/,,,, is a measure of how closely a result agrees w ith the consensus value. Th is is divided by the standard deviation so that performances among methods having d ifferent standard deviations can be compared. The norm alized deviation, in theory, places scores of all methods on an equal basis.
The square of a normalized deviation is called a score. An average of the scores for a ll the results reported by a laboratory, which is called the accuracy index, l c , provides a measure of overall laboratory performance. In the conventional procedure, laboratories are ranked according to Ic. The laboratory in first place w il l have the sm allest accuracy index. In actual practice the square root of Ic may be used for ranking , but taking the square root has no effect on the order of ranks. We w ill use the square form because this makes the statistics somewhat sim pler.
Variations on this procedure are common. The accuracy index may be averaged over several samples to give a statistically stable indication of performance. The accuracy index may be calculated as a weighted average, the weight reflecting the relative importance of d ifferent determ inations. Duplicate results may be requested for each method. From the w ay Ic is calculated, having duplicate results is equivalent to doubling the number of laboratories reporting on each method and doubling the number of methods reported by each laboratory. That is, Li,, is twice the number of laboratories reporting
0000-5756/81/6406-1344-12$01.00© Association of Official Analytical Chemists, Inc.

KELLY: J. ASSOC. OFF. ANAL. CHEM . (VOL. 64, N O . 6, 1981) 1345
and M ; is tw ice the number of methods reported.
The objective of th is paper is to come to grips w ith the statistical properties of norm alized deviations, scores, and accuracy indices so that they can be fu lly understood. There are 3 areas of concern. The first invo lves the number of results reported on each method. If the L,„ values are d ifferent, are the scores rea lly comparable between methods? Second, what is the effect of d ifferent M ; values? That is, is it fa ir to rank laboratories reporting on only 4 methods, say, w ith others reporting on 10 methods? Th ird , w hat is the role of chance in ranking? A laboratory dropping from first to fiftieth place out of a hundred laboratories, say, might consider itself in trouble. I f the top 50 laboratories were in fact perform ing equally w e ll, such a temporary shift could occur entire ly by chance.
It w il l be shown that the conventional procedure can be subject to substantial error when the num ber of laboratories reporting on any part of a program is small. Fortunately, the large check series programs protect themselves against serious error by not evaluating methods or laboratories i f the number of results reported is less than a certain m inim um .
B i a s i n S c o r e sA score, Z j m, is the square of a norm alized de
viation as defined by Equation 1 . The objective of this section is to examine the statistical d istribution of a score for its dependence on the number of laboratories reporting, L,„. The subscripts / and m w il l be dropped in w hat fo llow s to sim p lify the symbology. It w il l be clear from the context that the subject is either a particu lar laboratory, a particu lar method, or both.
A critical sim p lify ing assumption w il l be that the data have a normal or Gaussian distribution. It is not clear what w il l happen w hen the data have a non-normal d istribution. H ow ever, because most methods are subject to a number of independent sources of error, none of w hich w ill be dominant if the method has been designed carefully, the Central L im it Theorem comes into p lay (2). T h is means that the data w il l have a distribution not greatly d ifferent from norm al. In any event, non-normal data should be converted to norm al by means of a mathematical transformation. For example, taking the logarithm of log-normal data w il l provide data w ith a norm al distribution.
It w il l be assumed for now that a ll laboratories perform equally w ell. The population of results
w il l have a common mean f i and standard deviation <r.
The distribution of a deviation from a mean, d , w il l be normal and have a mean equal to zero. On first thought, one m ight expect that the variance of d would be o z . Recall, however, that dim uses datum x /m in 2 ways: once as x/,„ directly and once again in x m . Since x /m and x„, are correlated, the correlation depending on L ,„ , the variance of d/,„ w il l be less than tr2. A little a lgebra w il l show that variance of d , w h ich is also the mean of d 2, is o 2 (L — 1 ) / L . The distribution of d 2 divided by its mean w ill be Chi-square w ith one degree of freedom. A lready, we see here an insidious effect of the number of laboratories reporting.
Because the estimated variance, s 2, is made up of the sum of squares of norm al random va riables, the distribution of (L — l ) s 2 w il l be Chi- square w ith L — 1 degrees of freedom.
A score, Z 2, being the ratio of 2 Chi-square variables, should have a Fisher's F distribution w ith 1 and L — 1 degrees of freedom. Th is is not so, how ever, because d 2 and s 2 are not independent. Recall that s2 is the sum of squared deviations, one of w h ich is d 2 itself. A score, Z 2, say, may be w ritten as fo llows.
Z 2 = ( L — l ) d 2/ ( d f + d 22 + d i . . . )= ( L - l ) / [ l + ( d i + d 23 . . . ) / d f ] (2 )
The numerator of the ratio of d 2 values in Equation 2 is related to a standard deviation calculated from the sum of squared deviations leaving out d 2. Th is observation provides a clue to handling the statistics of a score.
Define a new score as fo llows:
F, = < ^ WI s - 2where d'j = Xj — x'f, and x , and s, are calculated from the data excluding Xj. C lea rly , d 2 and s 2 are independent. Th e ir ratio, therefore, times a factor invo lv ing L that accounts for the standard deviation of d'j not being equal to o , has a Fisher's F distribution w ith 1 and L — 2 degrees of freedom.
A fter a considerable amount of arithm etic, it can be shown that
r a - 2 ) d 2' a s 2 — d f
or, on dropping the subscript and rearranging
F = (L — 2 ) h / (1 — //) (4)
where h = Z 2/«, and a = (L — 1)2/L. Equation 4

1346 KELLY: J. ASSOC. OFF. ANAL. CHEM . (VOL. 64, NO. 6, 1981)
F igure 1. D is tr ib u tio n o f co n v e n tio n a l scores.
can be solved for Z 2, g iving
Z 2 = a F / ( F + L - 2) (5)
David et al. (3) give a sim ilar formula for the ratio of a range to a standard deviation.
It would seem that by dropping one of the data points in the calculation of F via Equation 3, we are throw ing data away. Th is is not so. Recall that d and s are not independent. The transformation defined by Equation 4 gives a one-to-one correspondence between Z 2 and F ; no inform ation is lost. The transformation is m erely a change from an as yet undefined distribution to a more fam iliar ratio of variances— Fisher's F distribution.
The probability-density function of F is„»I 2 p - l l 2
Pp(F) " B (1/2 , f /2)(F + i/)<-+1» 2 (6)where B is the beta function w ith parameters 1/2 and v / 2 , and u is the degrees of freedom, L — 2 (2 )-
The distribution of a score, Z 2, can be obtained from Equations 5 and 6 and the formula for the transformation of variables (2 ).
P z2(Z 2) = p F{ F ( Z 2) ) d F I d Z 2 (7)h - 1' 2(1 - h )d—4)/2
= ------ ------- ------- - (8 )a B ( l/ 2 , (L — 2 ) / 2 )
w here h = Z 2/a; a = (L - 1 )2/L ; and L is the number of results reported for a particular method after censoring. Th is is a beta d istribution of the first kind. It is not often encountered in analytica l chem istry, but it w il l arise in the
estimation of success rates in data having a b inom ial distribution (cure rate of drugs, k il l rate of insecticides, etc.).
The distribution of Z 2 is illustrated in Figure1. M any of its properties are rather remarkable and not at a ll in accordance w ith intu ition . An unexpected property is that Z 2 has an abrupt upper lim it, (L - 1)2/L . The lim it is a mathematical property of Z 2 that is not influenced by the assumption of norm ality in the raw data. The lim it is reached when a ll but one of the results for a method are equal.
The distribution has a pole at the origin for a ll values of L . The shape of the distribution changes abruptly as L goes from 3 to 5. Above L = 5 the changes are more gradual. For values of L above about 2 0 , the distribution is approxim ately Chi-square.
The mean of Z 2 is (L — 1 )/ L . Note that the mean increases w ith L . The standard deviation of Z 2 is [2a(L - 2 )/ (L (L + 1))]1/2, w h ich also in creases w ith L . For L = 3 ,10 , and 20, the standard deviations are 0.47, 1.09, and 1.24, respective ly .
These properties show that, on the average, lowest and hence best scores are obtained on methods having the least number of reported results. A canny laboratory manager can ensure a favorable score by choosing to report on ly the least popular methods. Th is w ill be unfa ir to laboratories not adopting the same strategy. C lea rly , Z 2 is a biased indicator of laboratory performance.
B i a s i n N o r m a l i z e d D e v i a t i o n sSince |Z | = y / z 2, the distribution of a nor
malized deviation can be obtained from Equation 8 and the formula for transformation of va riables,
(1 - i;)« --» )/2P z ( Z ) ~ V a B ( l / 2 , ( L - 2 ) / 2 ) (9)
where h , a , and B are defined previously. The right ha lf of the distribution is illustrated in Figure 2. It is a sym m etrical bell- shaped curve that slow ly approaches the norm al form as L increases. It has lim its ± y f a , a mean equal to zero, and a standard deviation equal to [(L — 1)/ L ]1/2.
Unfairness in the use of normalized deviations can arise in procedures for rejection of im probable data. One such procedure is to reject i f | Z | > 3 . I f Z had a normal d istribution, this would correspond to rejecting data outside a confidence interval having a 99.7% probability. H ow ever, Z is not norm al. The fact that it has bounds
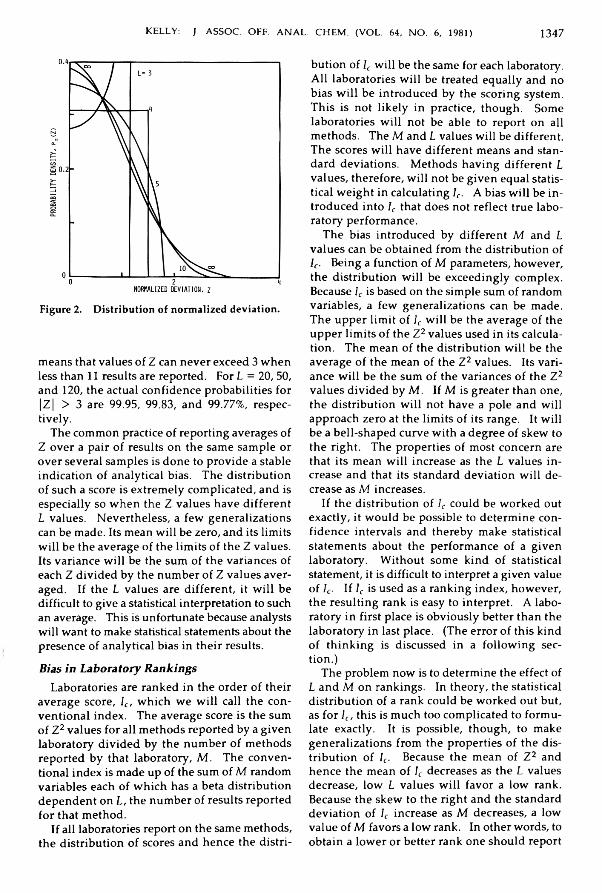
KELLY: J. ASSOC. OFF. ANAL. CHEM . (VOL. 64, N O . 6, 1981) 1347
F igure 2. D is tr ib u tio n of n o rm a liz ed d ev ia tio n .
means that values of Z can never exceed 3 when less than 11 results are reported. For L = 20,50, and 120 , the actual confidence probabilities for | Z | > 3 are 99.95, 99.83, and 99.77%, respective ly .
The common practice of reporting averages of Z over a pair of results on the same sample or over several samples is done to provide a stable indication of analytical bias. The distribution of such a score is extremely complicated, and is especially so w hen the Z values have d ifferent L values. Nevertheless, a few generalizations can be made. Its mean w ill be zero, and its lim its w ill be the average of the lim its of the Z values. Its variance w il l be the sum of the variances of each Z d ivided by the number of Z values averaged. I f the L values are d ifferent, it w il l be difficult to give a statistical interpretation to such an average. Th is is unfortunate because analysts w ill want to make statistical statements about the presence of analytical bias in their results.
B i a s i n L a b o r a t o r y R a n k i n g sLaboratories are ranked in the order of their
average score, l c , w h ich we w il l call the conventional index. The average score is the sum of Z 2 values for a ll methods reported by a given laboratory d iv ided by the number of methods reported by that laboratory, M . The conventional index is made up of the sum of M random variab les each of w h ich has a beta distribution dependent on L , the number of results reported for that method.
I f a ll laboratories report on the same methods, the d istribution of scores and hence the d istri
bution of Ic w il l be the same for each laboratory. A l l laboratories w il l be treated equally and no bias w il l be introduced by the scoring system. T h is is not like ly in practice, though. Some laboratories w ill not be able to report on a ll methods. The M and L values w ill be different. The scores w ill have d ifferent means and standard deviations. Methods having d ifferent L values, therefore, w il l not be g iven equal statistical weight in calculating l c. A bias w il l be in troduced into Ic that does not reflect true laboratory7 performance.
The bias introduced by d ifferent M and L values can be obtained from the distribution of I c. Being a function of M parameters, however, the d istribution w il l be exceedingly complex. Because Ic is based on the simple sum of random variab les, a few generalizations can be made. The upper lim it of Ic w il l be the average of the upper lim its of the Z 2 values used in its calculation. The mean of the distribution w il l be the average of the mean of the Z 2 values. Its variance w il l be the sum of the variances of the Z 2 values d ivided by M . I f M is greater than one, the distribution w il l not have a pole and w ill approach zero at the lim its of its range. It w il l be a bell-shaped curve w ith a degree of skew to the right. The properties of most concern are that its mean w il l increase as the L values in crease and that its standard deviation w il l decrease as M increases.
I f the distribution of l c could be worked out exactly, it would be possible to determine confidence intervals and thereby make statistical statements about the performance of a given laboratory. W ithout some k ind of statistical statement, it is difficult to interpret a given value of Ic- I f Ic is used as a ranking index, however, the resulting rank is easy to interpret. A laboratory in first place is obviously better than the laboratory in last place. (The error of this kind of th ink ing is discussed in a fo llow ing section.)
The problem now is to determine the effect of L and M on rankings. In theory, the statistical d istribution of a rank could be worked out but, as for Ic , th is is much too complicated to form ulate exactly. It is possible, though, to make generalizations from the properties of the d istribution of Ic- Because the mean of Z 2 and hence the mean of Ic decreases as the L values decrease, low L values w il l favor a low rank. Because the skew to the right and the standard deviation of l c increase as M decreases, a low value of M favors a low rank. In other words, to obtain a low er or better rank one should report
1348 KELLY: J. ASSOC. OFF. ANAL. CHEM . (VOL. 64, NO. 6, 1981)
o n ly on the least popular methods and report as few methods as possible. C learly , ranks based on if do not entire ly reflect laboratory performance.
E x p e r i m e n t a l .—To obtain estimates of the bias in ranking caused by the use of Ic , experiments were run using pseudo-random data generated by a Hewlett-Packard Model 9825 calculator. The calculator's built-in random number generator w il l produce independent random num bers having a uniform distribution ranging between zero and one, if the seed or in itia l value is chosen appropriately. To m inim ize the effect of choosing a bad seed, w h ich w ould result in correlated numbers, a different seed was chosen for each experim ent.
Random data having a normal distribution w ith zero mean and unit standard deviation were calculated by means of the polar method de- scribed by Box and M uller (4). Let c = V —21na and / = s in (2 irb) where a and b are a pair of computer-generated uniform random numbers. A pair of simulated results were calculated from the form ula: Y] = cf, x i = C \/1 — f 2.
A n experim ent consisted of obtaining a set of random numbers, assigning these to im aginary methods and laboratories, and then calculating means, standard deviations, scores, and ranks as described in the previous sections. The experiments were repeated a large number of times to obtain stable estimates of average scores and ranks. A n experiment invo lv ing 10 laboratories and 10 methods repeated 5 thousand times w ould require about 12 h of computation time.
For L laboratories and K repetitions, an average rank , assuming no bias, w il l have an approxim ately normal distribution w ith population mean (L + l) / 2 and standard error [(L2 — 1)/ (12K )]1/2. Th is can be derived from formulas g iven by Youden (5). In experiments to detect bias, K was chosen large enough so that the deviation of a given rank from the expected rank was at least 4 standard errors.
R e s u l t s a n d Discuss ion. —Consider first the effect of L w hen M is the same for a ll laboratories. Th is can be done by fillin g out the matrix of data in blocks; represented in practice by a block of laboratories reporting on one set of methods (moisture at 125°C and fat by indirect extraction, for example) and the rem ainder reporting on another set (moisture by vacuum oven and fat by direct extraction). Suppose 20 laboratories report on a total of 20 methods. Labs 1, 2, and 3 (Group A ) report on Methods 1 to 10 o n ly , and the remaining laboratories report on Methods 11 to 20 only. For both groups, M = 10; for each
method reported by Group A , L = 3; and for Group B, L = 17. The experimental means and standard deviations of averaged 0.67 (0.67 expected) and 0.15 (0.15) for each laboratory in Group A and 0.94 (0.94) and 0.38 (0.38) for GroupB. The agreement between experim ental and theoretical values was excellent. The average rank was 6.5 for the laboratories in Group A and11.2 for Group B. Compare these to an average of 10.5 if /f were a fa ir index for ranking . The bias in ranking, A R , for Group A was —4.0 ranks or —20% relative to all 20 laboratories. The error in this case was rather severe. I f Group A in creases to 5 members and Group B decreases to 15 members, increasing the sim ila rity between groups, A R decreases to —1.5 ranks or —7.5% for Group A . When both groups have the same number of laboratories, the bias becomes ind istinguishable from zero as expected.
A patently artific ia l pattern of data w il l have to be used to demonstrate the effect of M when L is the same for all methods. Th is can be done by fillin g in the data in a diagonal pattern. Lab. 1 reports on Method 1 on ly , Lab. 2 on Methods 1 and 2, and so on up to Lab. 6 . Lab. 7 reports on all but Method 1, Lab. 8 on all but Methods 1 and 2, and so on up to Lab. 11, w h ich reports on Method 6 only . The mean of l c is 0.83 for each laboratory since L = 6 for each method. The standard deviation varied from 0.89 for Labs 1 and 11 (M = 1) to 0.36 for Lab. 6 (M = 6 ). The experimental and theoretical results were again identical to 2 decimal places. Since the mean of l c is the same for each laboratory, one w ould expect that the average rank would be the same for each laboratory. Bear in mind, however, that the distribution of l c is skewed to the right and that the skew is greater for low er values of L . The distribution of l c for Labs 1 and 11 w ill be sim ilar to that for Z 2 shown in Figure 1. These laboratories are like ly to be ranked either first or last in each tria l, but more often first because very low values of /, are h ig h ly probable. The d istribution of /<• for Lab. 6 , on the other hand, w ill be peaked near the mean and extreme values w ill be u n like ly . Lab. 6 should be ranked near the m iddle most of the time. The experim ental results confirmed these predictions. Labs 1 and 11 received A R of —0.7. As M increased, the bias increased gradually to +0.4 for Lab. 6 . E v idently, one can obtain a favorable rank by reporting as few results as possible.
Th is observation breaks down, however, when L is not the same for a ll methods. For example, when 10 laboratories reported on 5 methods and 3 of these laboratories reported on 5 additional
KELLY: J. ASSOC. OFF. ANAL. CHEM . (VOL. 64, N O . 6, 1981) 1349
methods, the A R for these 3 laboratories was —0.3. Recall that as L increases, both the mean and standard deviation of l c increase; whereas as M increases, the mean is not directly affected and the standard deviation decreases. The best overall strategy is to choose methods having a low average score (low L ) and report as m any of these as possible so that the distribution of Ic w ill be concentrated around its mean.
There can be no doubt that ranks based on the conventional accuracy index do not reflect laboratory performance alone when the number of results reported d iffe r from method to method and from laboratory to laboratory. When M and L are large and the differences sm all, bias introduced by the use of Ic w il l be sm all. N evertheless, bias, no matter how small, is an anathema to analytical chemists, especially when it is correctable.
C o r r e c t i o n o f B ia sThe correction procedure is based on trans
formations of variables so that the new variables w il l be independent of L or M . The transformation of raw data into norm alized deviations is a sim ilar type of transformation in that d iv id ing a deviation from a mean by a standard deviation makes the resulting variable independent of differences in precision between methods.
S c o r e s . —Using F defined by Equation 4, the probability of obtaining a score between zero and F may be obtained as fo llows.
P f ( F ) = f g r p F( v ) d v ( 1 0 )
w here P F( v ) is the probability density function for Fisher's F distribution w ith Vi = 1 and v 2 = L — 2 degrees of freedom (Equation 6 ). A s im ilar probability for a norm al random variable is defined by Equation 12.
px (g) = f * ( J } )%J — co
w here p g( g ) is the probability density function of a norm al random variable, g .
pg ( g ) = ( l / V 2 ^ ) e - * Zl2 ( 1 2 )having , for the sake of convenience, zero mean and un it standard deviation.
I f Pg ( g ) is set equal to Pp(F) and Equation 22 is solved for g , the resulting value w ill be a normal random variable corresponding to F . That is, having obtained F from the data, we calculate the probability of obtaining a value as high as F , and then calculate the value of a norm al variable having th is same probability. For any pair of
values of F and L , there w ill be one and only one value of g . Because g is independent of L , g is precisely the variable we need as an unbiased ind icator of laboratory performance.
By this roundabout w ay, an exact transformation of F to g may be effected. Several approximate direct transformations were tried (Equations 26.6.14 and 26.6.15 in reference 6 and the Peizer-Pratt approximation in reference 7) but w ithout success. Bias in ranking using these approximations was often worse than that of the conventional index. H aving i>\ = 1 is a severe test of approximations that are designed to be accurate for large degrees of freedom. Fortunate ly, the exact formulas for Pf-(F) are not d ifficu lt for a modern computer and reasonably accurate approximations to the solution of Equation 2 2 are available.
Exact formulas for P f (F ) may be obtained from Equations 26.6.2, 26.6.4, and 26.6.8 by Abram- ow itz and Stegun (6 ). Note that L must be greater than 2. For even L ,
x = 1/(1 + (L — 2 )/F )
B i = 1By = 1 + (1 - x )B n l (L - 2j - 1 ) I ( L - 2 j )
w here j = 2, 3 . . . , K = (L — 2)/2
Pf (F ) = V x Bk
For odd L ,
y = F / ( L — 2), x = 1/(1 + y ) , 6 = arctan y f yB i = 0
By = 1 + x B j - l ( L - 2 ) + 1 ) 1 ( 1 - 2y + 2)
where j = 2, 3 . . . K = (L - l ) / 2
Pf (F ) = (6 + v ^ X B K)2/7r (23)The normal variate corresponding to a proba
b ility Pg (g ) is g iven approxim ately by Equation 26.2.23 in Abram owitz and Stegun (6 ).
I f Ps (g ) < 0.5, let p = P g ( g ) , otherw ise, let p =1 - w -
A = c0 + r ( c i + r c 2), r = \ / l n ( l l p 2)
B = 1 + r(di + r(d2 + rd3)) c0 = 2.515517 di = 1.432788
d = 0.802853 d2 = 0.189269
c 2 = 0.010328 d3 = 0.001308
g = —r + A/B, i f Pg ( g ) < 0.5
g = r — A/B, otherwise (24)
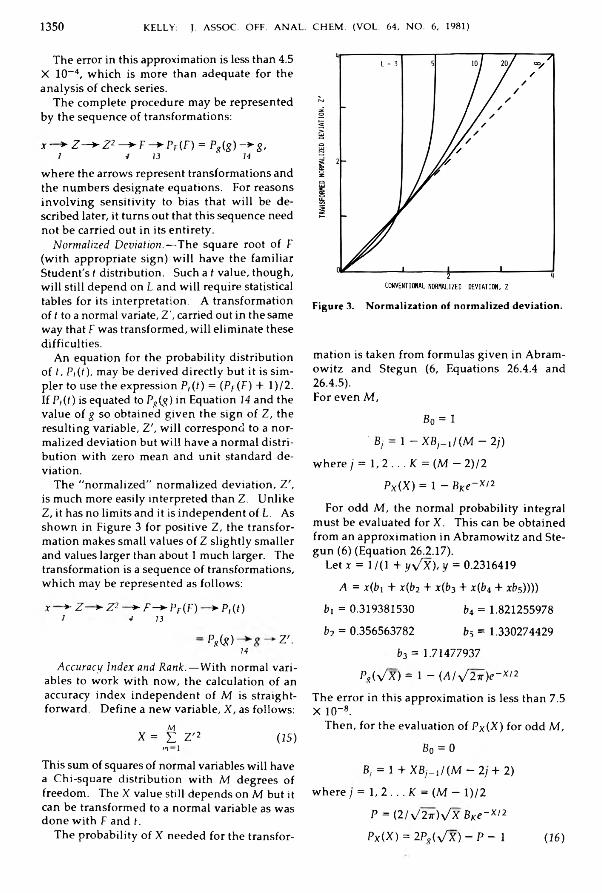
1350 KELLY: J. ASSOC. OFF. ANAL. CHEM . (VOL. 64, N O . 6, 1981)
The error in this approximation is less than 4.5 X 10~4, w h ich is more than adequate for the analysis of check series.
The complete procedure may be represented by the sequence of transformations:
-r - > Z - > Z 1 —► F —► Pf (F ) = P ,(g ) -► g ,1 4 1 3 74
where the arrows represent transformations and the numbers designate equations. For reasons in vo lv in g sensitiv ity to bias that w ill be described later, it turns out that this sequence need not be carried out in its entirety.
N o r m a l i z e d D e v i a t i o n .—The square root of F (w ith appropriate sign) w il l have the fam iliar Student's t distribution. Such a t value, though, w ill still depend on L and w ill require statistical tables for its interpretation. A transformation of f to a normal variate, Z ', carried out in the same way that F was transformed, w ill elim inate these difficu lties.
A n equation for the probability distribution of f, P ,( f ), may be derived d irectly but it is sim pler to use the expression P ,(f) = ( P f ( F ) + l)/2 . I f P ,(f) is equated to Pg (g ) in Equation 14 and the value of g so obtained given the sign of Z , the resulting variable, Z ', w il l correspond to a normalized deviation but w ill have a normal d istribution w ith zero mean and unit standard deviation.
The "norm alized" norm alized deviation, Z ', is much more easily interpreted than Z . U n like Z , it has no lim its and it is independent of L. As shown in Figure 3 for positive Z , the transformation makes sm all values of Z s lig h tly sm aller and values larger than about 1 much larger. The transformation is a sequence of transformations, w hich may be represented as fo llows:
x *■ Z >■ Z 2 *■ F - * - P f (F ) *-P((f)1 4 1 3
~ P g ( s ) z ' .1 4
A c c u r a c y I n d e x a n d R a n k .—W ith normal va riables to w ork w ith now , the calculation of an accuracy index independent of M is straightforward. Define a new variable, X , as follows:
MX = £ Z ' 2 (15)
m — 1Th is sum of squares of normal variables w ill have a Chi-square distribution w ith M degrees of freedom. The X value still depends on M but it can be transformed to a normal variable as was done w ith F and t.
The probability of X needed for the transfor-
F igure 3. N o rm a liz a tio n of n o rm a liz ed d e v ia tio n .
mation is taken from formulas given in Abram- ow itz and Stegun (6 , Equations 26.4.4 and26.4.5).For even M ,
B o - 1■ B; = 1 — X B j - 1/ ( M — 2 j )
w here j = 1, 2 . . . K = (M - 2 ) 1 2
P x (X ) = 1 — B Ke ~ X12For odd M , the norm al probability integral
must be evaluated for X . Th is can be obtained from an approximation in Abram owitz and Stegun (6 ) (Equation 26.2.17).
Let r = 1 / ( I + y y / x ) , y = 0.2316419
A = x ( b i + x { b 2 + x ( b 3 + x ( b 4 + x b s ) ) ) )b i = 0.319381530 b4 = 1.821255978
b 2 = 0.356563782 b 5 = 1.330274429
b 3 = 1.71477937
P g ( V X ) = 1 - (A / x / 2 i )e - x /2The error in this approximation is less than 7.5 X 10~8.
Then , for the evaluation of P x (X ) for odd M ,
B0 = 0By = 1 + X B y_i/(M - 2/ + 2)
where ; = 1, 2 . . . K = (M - l) / 2
P = (2 /\/2x)-\/X B Ke ~ x l 2 P x (X ) = 2 Pg ( V x ) - P - 1 (16)

KELLY: J. ASSOC. OFF. ANAL. CHEM . (VOL. 64, N O . 6, 1981) 1351
Th is is then set equal to Pg ( Ip ) and solved for l p v ia Equation 14. The resulting value, l p , called the performance index, corresponds to the conventional index, Ic, but has a normal distribution w ith zero mean and u n it standard deviation when the performances of all laboratories are the same on the average. The sequence of operations required to calculate I c may seem com plicated, but, w hen considered one step at a time, the procedure is more comprehensible:
Z —>-Z2 —>’~ E - * ~ P f (F ) —*-P t( t)4 13
= Pg{g)-+i *~Z ' —► X —► P x ( X )14 15 16
= P g U p )
The performance index is independent of M and the L values for each method w hen a ll laboratories have the same performance. W hen performances are not the same, that is, w hen the population mean or standard deviation for results on any method by any laboratory are d ifferent from those of the other laboratories, values of I p less than one denote better than average performance. There w il l be a dependence on L when one or more laboratories have an analytical bias. More w il l be said about this in the next section.
There was no detectable bias in ranking according to l p in the modeling experiments reported above and in many other experiments that are not presented here. For example, in the experiment where L = 6 for each laboratory and M varied from 1 for Lab. 1 to 6 for Lab. 6 , the errors in rank for Labs 1 and 6 were +0.032 and —0.029 ranks (10 000 tria ls). Compare th is w ith errors of —0.7 and +0.4 w hen the conventional index was used for ranking .
I f the number of trials in an experim ent becomes large enough, statistically significant bias probably would be detected due to the numerical approximations used in Equations 14 and 16 . The magnitude of the bias, however, has no practical significance. The performance index, therefore, reflects laboratory performance only and is not sensitive to the number of laboratories or to the number of methods reported in a check series.
I f results are to be weighted in Equation 15 according to the importance of a method, the above procedure cannot be used because the resulting X value w il l not be Chi-square. A sum of weighted g values (Equation 1 4 ) d ivided by the square root of the sum of the weights can be used as an accuracy index.
D u p l i c a t e D a t a .— In the conventional system, duplicate data are treated in a w ay that is equivalent to L being twice the number of laboratories reporting and M being tw ice the num ber of methods reported. That is, for a pair of results Xj, and Xj reported by a particular laboratory for a particular method, 2 normalized deviations are calculated, Z, and Z j . In calculating l c , the squares of these 2 values are treated exactly as if they were singlet data from 2 methods.
In the procedure proposed here, 2 values of F could be calculated, F, and F'r These cannot be treated as being from 2 independent methods, however. The standard deviation, s is common to both; F, is a function of Xj and F;- of x, . They can be made statistically independent by dropping both Xj and jq in the calculation of the mean and standard deviation. We define a different F for duplicate data as fo llows:
f ( L ~ 2 ) d ? ' ( L - l ) s ?
( 1 7 )
w here d , = x , — x ’k , and x ’k and s i are the mean and standard deviation obtained w hen both components of a pair x , and Xj are excluded. A sim ilar equation may be written for F'r Note that x k and s k are the same for both F; and F'j. Equation 18 may be used for calculation purposes.
F[ = !(L - 3)[(L - 1)Z, + Z , m\(L - 2)[(L - 1)(L - 2)
— (E — 1)(Z? + Z j ) — 2Z,-Zy]| ( 1 8 )In view of the complexity of Equation 18 , we w ill forego the development of the jo int probability distribution of Z f and Z j needed to evaluate their effect on the conventional index, I c.
Equation 18 provides a variable w ith a Fisher's F distribution w ith one and L — 3 degrees of freedom. We can proceed in the now fam iliar manner to convert F ' to a probability and then to a "n o rm a lized " norm alized dev ia tion , Z '. Equation 13 may be used for this purpose i f L — 1 is substituted for L . The pair of values Z , and Z j may be used in the calculation of the performance index, Ip , as if they were obtained from 2 different methods.
E f f e c t o f A n a l y t i c a l B ia sSo far it has been assumed that all laboratories
perform equally w e ll. Suppose now that one laboratory has an analytical bias. I f Lab. 1 has this d istinction , then x k = p. + o b where b is the bias. In the presence of bias, the distribution of Z w il l not have the form of Equation 9 . Consequently, Z ' w il l not have a normal d istribution.

1352 KELLY: J. ASSOC. OFF. ANAL. CHEM . (VOL. 64. NO. 6, 1981)
Table 1. Effect of analytical bias on normalized deviation
Z T
Bias L Z,3 Av. SD Av. SD
0 3 0 0 0.82 0 11 3 0.67 0.59 0.64 0.67 0.842 3 1.33 0.93 0.34 1.17 0.670 5 0 0 0.89 0 11 5 0.80 0.77 0.67 0.85 0.822 5 1.60 1.24 0.43 1.50 0.690 10 0 0 0.95 0 11 10 0.90 0.84 0.86 0.90 0.952 10 1.80 1.51 0.66 1.69 0.850 20 0 0 0.97 0 11 20 0.95 0.93 0.90 0.96 0.962 20 1.90 1.72 0.79 1.84 0.91
a Z ,= (x -x ) /< r .
It w il l be d ifficu lt to predict the effect of bias on either Z or Z '.
The results of modeling experiments for Lab. 1 w ith bias in the data of Lab. 1 only are given in Table 1. Since the average of results for a given method, x , w il l be influenced by the biased result, the average deviation from the mean d ivided by c rw illn o tb e b ,b u tfc (L — 1)/L. Th is is g iven in Colum n 3 of Table 1 as Z t for comparison purposes. The averages of Z and Z ' increase as bias increases, but Z ' is closer to Z ,. The standard deviations decrease w ith increasing bias. Th is is a consequence of the existence of lim its for Z . As bias increases, norm alized deviations are crowded more and more toward the upper lim it. The rate of decrease of standard deviation is greatest for L = 3, since the effect of the upper lim it on the distribution of Z is greatest for low L. The standard deviations of Z ' are not affected by bias as much as those of Z .
Table 2 presents the results of modeling experiments for bias in Z 2. These are compared to
I f, ( M = 1) rather than Z '2, since it is Ip that is used for ranking purposes. As one would expect and desire, averages of Z 2 and Ip increase as the magnitude of bias increases. For the larger va lues of L , the increase is greater for Z 2 than for Jp . Since we would want to downgrade biased results as much as possible, it appears that Z 2 would be a better index for ranking than the performance index, l p . Averages, though, do not tell the whole story. Standard deviations play a part also. Unlike the standard deviations of Z , w hich steadily decreased as bias increased for all values of L , those for Z 2 decrease for L = 3 but increase w ith increasing bias for larger values of L . The standard deviations for l p , on the other hand, are re lative ly constant w ith changes in bias and L .
In Table 2, Q is a measure of sensitivity to bias, combining the effects of both average and standard deviation. According to this measure, l p is s lig h tly less sensitive to bias than Z 2 for L = 3, s lig h tly more sensitive for L = 5, and defin ite ly more sensitive for larger L.
Table 2. Effect of analytical bias on score
Bias L
Z2 IpAv. SD Q* Av. SD Q
0 3 0.67 0.47 0 0 1.00 01 3 0.75 0.46 0.18 0.16 0.97 0.172 3 0.97 0.39 0.77 0.61 0.85 0.720 5 0.80 0.80 0 0 1.00 01 5 1.09 0.90 0.32 0.33 1.05 0.322 5 1.70 0.90 1.00 0.99 0.95 1.040 10 090 1.08 0 0 1.00 01 10 1.46 1.45 0.38 0.43 1.10 0.392 10 2.76 1.73 1.08 1.31 1.03 1.270 20 0.95 1.24 0 0 1.00 01 20 1.73 1.87 0.42 0.50 1.13 0.442 20 3.62 2.58 1.03 1.46 1.10 1.33
3 Q(y) (Ybias Yo)/Sbias-
KELLY: J. ASSOC. OFF. ANAL. CHEM . (VOL. 64, N O . 6, 1981) 1353
The sensitiv ity factor, Q , should reflect the performances of l c and Ip as ranking indices and this was found to be so. W ith b = 2 in the results of Lab. 1 for Method 1 on ly , and w hen 3 laboratories report on 5 methods, Jc gave an average rank 2.19 for Lab. 1 and Ip gave a rank of 2.18. In th is case, Ic was s lig h tly more sensitive to bias than l p . W hen the number of laboratories was increased to 10, the average ranks for Lab. 1 were 7.31 using Ic and 7.34 w ith Ip . For 20 laboratories, these were 15.07 and 15.15. For large L , Ic is less sensitive to bias than l p . The differences are too sm all, though, to have a noticeable effect in practice.
Ev id en tly , then, the conventional index and the performance index are almost equally sensitive to bias.
A n average of the norm alized form of F obtained by use of Equations 13 and 14 can be used for ranking purposes. Although this index gave no evidence of bias in ranking when L values and M varied among methods and laboratories, it was slig h tly less sensitive to bias than l c .
P r a c t i c a l C o n s e q u e n c e s o f t h e U s e o f t h e N o r m a l i z a t i o n S c h e m e
D e te c t i o n o f O u t l i e r s .— The use of a sim ple statistical test, such as |Z '| > 3 , to detect erroneous results can be applied un ifo rm ly to a ll results. The confidence interval for such a test w ill have a probability that does not depend on the num ber of results reported. Th is cannot be said of the use of the norm alized deviation, Z .
The Z ' value for a rejected result, x r , may be calculated as fo llows.
Fr =L d f L
(L + l ) s 2 _ (L + 1) Zr2 (19)
Apart from a factor invo lv ing L , a conventional score for a rejected result is autom atically an F value. The calculation of Z 'r may then proceed as for a non-rejected result except that L in Equation 13 should be replaced by (L + 1).
M o v i n g A v e r a g e s . — Averages of Z ' over several samples are more easily interpreted than sim ilar averages of normalized deviations. An average over S results, Z 's, w il l have a normal distribution w ith standard deviation 1 l y / S .
There may be some m erit in reporting Z ' = Z'sy / S , that is, in standardizing an average to unit standard deviation. In the presence of bias, Z ' w il l increase w ith S. S ign ificant analytical bias w il l then be easier to detect. For example, suppose that Z ' was 2 in each of 3 successive samples. We get Z = 2 for S = 1,2, and 3. Itisno tobvious
that the average over 3 samples is s ign ificantly d ifferent from zero. For Z ', on the other hand, the corresponding values are 2.0, 2.8, and 3.5. Because the standard deviation is 1 for each of these values, it is read ily apparent that the average over 3 samples shows significant analytical bias.
An arithmetic average of l p could be used as an index of performance over several samples. I f the number of methods reported by a given laboratory is d ifferent for each sample, a sim ple arithm etic average w il l not give the correct weight to each sample. Moreover, the standard deviation of such an average w il l change w ith the number of samples averaged and, as w ith the average of Z ', analytical bias w il l not be read ily apparent. A better procedure w ould be to use the sum of Z ' 2 for each method over each sample. The value of M to be used in Equation 16 for the calculation of this cum ulative probability index is the sum of the M values for each sample. In other words, the cumulative performance index is obtained by treating the samples as i f they were one sample w ith additional methods.
The cumulative performance index calculated in this w ay w il l continue to have un it standard deviation, and, as w ith Z ', the effects of analytical bias w ill accumulate. Another advantage of this system is that the number of samples accumulated need not be the same for each laboratory. Beginning laboratories can be ranked alongside veteran laboratories that have reported on 3 or more samples.
In reporting cumulative performance indices, it would be advisable to report the sum of M values as w e ll so that the power of a test for bias could be calculated i f desired. The power of a test is a statistical term for the probability that a laboratory is biased w hen in fact it is not. A lthough beyond the scope of this w ork, the power of a test is discussed in many statistical texts. One such is Kendall and Stuart (8 ).
C o n f id e n c e I n t e r v a l s f o r R a n k s . —It is m eaningless to make any but statistical statements about the results of a check series. We cannot state that the performance of a given laboratory is better than those of the other laboratories. We can state, however, that a given laboratory has or has not a performance index that is sign ifican tly better than those of the others at some probab ility level, 95%, say. A performance index and M w il l provide a ll the inform ation needed to make such statistical statements.
U nfortunately , analysts have to report to superiors who may not understand the niceties of statistical expression. Ranks are more easily
1354 KELLY: J. ASSOC. OFF. ANAL. CHEM . (VOL. 64, N O . 6, 1981)
Table 3. Conventional and performance Indices compared in an actual check series
Lab. M a
Conventionalsystem Proposed system
lc Rank Rank Probable rank
1 6 1.20 10 0.97 10 4-102 6 0.64 2 -1.21 2 1-93 7 0.99 8 0.25 8 1-104 b 6 1.25 — 1.25 — —5 7 0.93 7 0.03 6 1-106 6 0.63 1 -1.18 3 1-97 6 0.76 5 -0.68 5 1-108 5 1.02 9 0.42 9 1-109 b 6 1.39 — 1.64 — —
10 7 0.64 3 -1.28 1 1-911 6 0.69 4 -0.92 4 1-1012 5 0.93 6 0.07 7 1-10
3 L = 12, 12. 12. 11, 10. 9. and 7 for 7 methods.6 Laboratories with rejected result not included in calculation of indices.
understood than performance indices. But it is too easy to come to the conclusion that the laboratory in first place, say, is better than the other laboratories. Its performance index may in fact be better than those of a ll, 10, or even none of the other laboratories. Ranks by themselves cannot be used to answer m eaningful statistical questions.
It w ould be desirable to report along w ith a rank some k ind of parameter that expresses the effect of chance. Since l p has a standard normal d istribution, a confidence interva l for ranks can be established re lative ly easily . It was shown above that the standard deviation of \ p is slightly dependent on the magnitude of analytical bias. Th is effect is sm all enough to be ignored. The 95% confidence interval for a performance index then w ill be Ip ± 1.96. Laboratories having a performance index outside this range perform sign ifican tly better or poorer than the given laboratory. The rank of laboratories ly ing next to and inside this interval may be said to form the 95% (at most) confidence interval for the rank of the given laboratory. For the sake of brevity, we w il l call th is in terva l the probable rank.
I f a ll the laboratories in a series perform equally w e ll, the probable rank for each laboratory w ill include all of the laboratories 95% of the time. When 50 laboratories out of 100 have Ip values clustering around —1 , say, the probable rank for each, including the laboratories in first and fiftieth place, w il l be nearly the same. The use of probable rank in this w ay should m in im ize unjustified anxiety caused by the sh ifting of ranks from sample to sample due to chance.
C o m p u t a t i o n s .—The norm alization system of reporting w ill require more computer time than
the conventional system. Computer costs may be m inim ized in large check series by noting that, for L greater than 20, normalized deviations are approxim ately norm al, that is, Z ' ^ Z . The Peizer-Pratt approximation for a Chi-square distribution, given by Ling (7, Equation 3.6), may be used to calculate Ip d irectly from X as defined by Equation 15.I f X = M - 1
Ip ~ - (1 /3 + 0 .08/M )/(2M - 2)1/2 otherwise,
Ip =* d [ ( M - 1) In ((M - 1 )/X )+ X — (M — l)]1/2/|X — (M — 1)|
where d = X — M + 2/3 — 0.08/M .The maximum error in calculating P x (X ) w ith this form ula (not Ip ) is stated to be less than 5 X 10“ 4 for M = 5.
C o n c l u s i o nThe many advantages of the proposed re
porting system are best visualized w hen it is applied to an actual check series. Table 3 gives the results of a recent sample for a modest intracompany check series on meat products. The complete report includes Z ' values for each result reported, and means and standard deviations for each method. The ranks obtained by use of the conventional and proposed systems are different because the L values vary among the methods. The probable ranks show that the laboratory in first place has a performance index significantly better than only one other laboratory. O n the other hand, the laboratory in tenth place could have obtained a rank as high as fourth place.
KELLY: J. ASSOC. OFF. ANAL. CHEM . (VOL. 64, NO. 6, 1981) 1355
In this series, laboratories w ith rejected results are not ranked. The performance index (not includ ing the rejected result) is s till reported so that the laboratory can compare its performance w ith those obtained on previous samples. The reasoning behind this w ay of handling rejected results is that, i f performance indices were accumulated over several samples, it would rapidly reward a laboratory for diligent effort in find ing and elim inating the cause of the apparent gross error.
Acknow ledgm entsEncouragement and advice from C. H . Perrin ,
E . M . G locker, and P. C aud ill are gratefu lly acknowledged.
References(1) P e rrin , C. H „ & Glocker, E. M. (1968) ]. Am. Oil
Chem. Soc. 4 5 ,596A(2) K endall, M. G., & S tuart, A. (1969) The Advanced
Theory of Statistics, 3 rd Ed„ Vol. 1, H afne r, N ew York, NY
(3) David, H . A„ H artley , H . O., & Pearson, E. S. (1954) Biometrika 41 ,482-493
(4) Box, G. E. P„ & M uller, M. E. (1958) Ann. Math. Stat. 29,610-611
(5) Y ouden, W. J. (1963) Mater. Res. Stand. 3 ,9 -1 3(6 ) A bram ow itz , M ., & S tegun , I. A. (Ed.) (1972)
Handbook of Mathematical Functions, N atl. Bur. Stds. A ppl. M ath. Ser. 55, U.S. G o ve rn m en t P r in tin g O ffice, W ash ing ton , DC
(7) L ing, R. F. (1978) J. Am. Stat. Assoc. 73 ,274-283(8) K endall, M. G „ & S tuart, A. (1973) The Advanced
Theory of Statistics, 3 rd Ed., Vol. 2, H afner, N ew York,'NY

1356 HOW ELL & TAYLOR: J. ASSOC. OFF. ANAL. CHEM . (VOL. 64, NO. 6, 1981)
M Y C O T O X I N S
Determ ination of Aflatoxins, Ochratoxin A, and Zearalenone in Mixed Feeds, w ith Detection by Thin Layer Chromatography or Fiigh Performance Liquid ChromatographyMARY V. HOWELL and PHILIP W. TAYLORR .H .M . R esearch, Lord R a n k Research C en tre , L incoln R oad , H igh W ycom be, B uck ingham sh ire , U n ited K ingdom H P 12 3Q R
A sen s itiv e , re lia b le , an d econom ical m eth o d for th e d e te rm in a tio n of 6 m y co to x in s in m ixed feeds is d e scribed . T he feed is extracted w ith ch lo ro fo rm -w ater a n d th e ex trac t is c leaned u p by u s in g a d isp o sab le S ep-P ak silica cartridge. T he procedure requ ires less t im e (15 m in fro m sam p le ex trac tio n to ex trac t p re p a ra tio n ) a n d less so lv en t (ap p ro x im a te ly o n e -ten th ) com pared w ith co n v en tio n al m eth od s an d is su itab le fo r a fast, econom ical screen . A d d itio n a l c lean u p procedures, in v o lv in g d ialysis o r extraction in to base, a re d esc rib ed fo r sam ples c o n ta in in g h ig h leve ls o f in te rfe rin g com pounds. T h in layer chrom atography (TLC) an d h ig h p erfo rm ance liq u id ch ro m ato g rap h y (HPLC ) w ith fluorescence d e tec tion a re described for id e n tif ic a tio n an d e s tim a tio n of m yco tox ins. T he m e th o d has been ap p lie d to a w id e range of m ixed feed s, in c lu d in g la b o ra to ry an im a l d ie ts , a n d raw m a te ria ls . T h e lim it o f d e te c tio n is 1 / ig /k g fo r ail m y co to x in s m easu red by HPLC.
M ultim ycotoxin screening methods for mixed feeds, w ith detection by th in layer chromatography ( 1, 2 ), have been reported, together w ith methods for the detection of mycotoxins by high performance liquid chromatography (H P LC ) in raw materials (3-6) and to a lesser extent in mixed feeds (7, 8 ). H owever, a rapid m ultimycotoxin preparation method w ith the choice of sensitive T L C or H P LC end detection has not been described for raw materials or mixed feeds.
There are 2 main objectives in the determ ination of mycotoxins in raw materials and mixed feeds: first, to confidently establish the absence of mycotoxins to very low leve ls in laboratory animal diets, as specified by agencies such as theU .S . Food and Drug Adm inistration or the U .S. Environm ental Protection Agency (both specify less than 5 pg total aflatoxins/kg); second, if m ycotoxins are present, for example in animal feed, to accurately and quantitatively confirm their identity. With these objectives in mind, an economical, sensitive, and reliable method suitable for screening a wide variety of commodities by T L C w ith the choice of using H P LC for im-
Received February 9, 1981. Accepted May 28, 1981. 0004
proved sensitiv ity and confirmation has been developed for aflatoxins, ochratoxin A , and zearalenone.
In itia l sample extraction w ith good recovery for a ll mycotoxins is achieved w ith chloroform -w ater. The 3 groups of mycotoxins can then be quickly separated and the extracts can be cleaned up in on ly 15 min w ith low volum es of so lvent, by using a disposable Sep-Pak silica cartridge. A further purification step for zearalenone invo lv ing extraction into a lka li (3, 9) im proves its detection by T L C from 200 to 10 Mg/kg in m ixed feeds. S im ila rly , the determ ination of aflatoxin in laboratory animal diets containing grassmeal is improved if the dialysis cleanup described by Patterson and Roberts (1) is carried out on the aflatoxin fraction from the Sep-Pak cartridge. The determination of ochratoxin A by T LC is improved by using 2 solvent systems running in the same direction.
H P LC analysis of a ll the mycotoxins is performed on the extracts prepared for T LC . Zearalenone is determined by H P LC by using a reverse phase column w ith a mobile phase of ace to n itrile -0 .1% orthophosphoric acid and fluorescence detection. The aflatoxins are separated by H P L C using a silica column w ith a mobile phase of toluene-ethyl acetate-formic acid and fluorescence detection. Ochratoxin A is measured by fluorescence detection after separation on a reverse phase column w ith H P LC conditions sim ilar to those described by Osborne( 10) for the analysis of flour and bakery products. L im it of detection of the method is 1 ¿ig/kg for each of the 6 mycotoxins in a mixed feed sample.
M E T H O D
A p p a r a t u s(a) W r i s t - a c t i o n s h a k e r . — G riff in flask shaker
(G riff in and George Ltd , London, U K ).(b ) C h r o m a to g r a p h ic c o lu m n s .—400 X 22 mm id
w ith sintered glass base and P TFE stopcock.
0004 5 756/81/6406-1356-08$01.00 © Association of Official Analytical Chemists, Inc.
HOW ELL & TAYLOR: J. ASSOC. OFF. ANAL. CHEM . (VOL. 64, N O . 6, 1981) 1357
(c) S h a k e r f o r tu b e s .—W h irlim ixe r (Fisons Scientific Apparatus, Loughborough, L E U ORG, U K ).
(d) U V illu m in a tio n e q u ip m e n t .—365 and 254 nm . C-70 Chromato-Vue Cabinet (U ltra-V io let Products Inc ., San Gabriel, C A 91778).
(e) L iq u id c h r o m a to g r a p h .— M odel 750/03 pump (A .C .S . Ltd , Concorde St, Luton, U K ), Rheodyne 7120 injector w ith 40 /uL loop ( f i l l by injection of 50 p L sample), and Model 3000 flu orescence spectrometer fitted w ith 25 p L LC flow cell (Perk in-E lm er Ltd , Beaconsfield, H P9 1QA, U K ). O ther suitable equipment can be substituted.
(f) H P L C c o lu m n s .— Stainless steel, 250 X 4.6 mm id , packed w ith 5 p m Partis il 5 (Whatman Ltd, Springfield M ill, Maidstone, ME14 2LE , U K ), or 5 p m Spherisorb ODS (Phase Separations Ltd, Q ueensferry, CH 5 2LR , U K ).
(g) S ilica c a r tr id g e s .—Sep-Pak silica cartridge (W aters Associates, Inc ., M ilfo rd , M A 01757).
(h ) T L C P la te s .— 20 X 20 cm plastic sheets pre-coated w ith silica gel G w ithout fluorescent indicator (Polygram S L 9, Camlab, Cambridge, U K ).
( i ) D ia ly s is tu b in g .— V isk in g size 1-8/32 (M edicell International Ltd , 49 Queen V ictoria St, London, EC4N 4SA , U K ).
R e a g e n t sUse A n a lA r grade chem icals. Caution :
Chloroform is a possible carcinogen.(a) S o l v e n t s .— E th y l ether (sodium -dried).
H P L C grade ethyl acetate and acetonitrile. G lass-distilled grade toluene (Rathburn Chem icals).
(b) O rth o p h o sp h o r ic a c id .—0.1%.— Dilute 1 m L orthophosphoric acid (sp. gr. 1.75) to 1 L w ith distilled water and pass solution through 0.45 p m filter.
(c) Silica g e l f o r co lu m n c h ro m a to g r a p h y .—Silica gel 60, 0.063-0.2 mm (E. Merck, Darmstadt, GFR), 1% moisture.'
(d) M y c o to x in s ta n d a r d s .— M akor Chem icals Ltd , Jerusalem, Israel. A f la to x in .— 5 p g B j, G i /m L; 1.5 p g B2, G 2/m L. Availab le in solution in benzene-acetonitrile (98 + 2). O c h r a t o x i nA . — 10 p g / m L . Dissolve solid in benzene-acetonitrile (98 + 2). Z e a r a le n o n e .— Prepare 2 standards by dissolving solid in methanol to give( 1) 10 p g l m L , and (2 ) 100 p g l m L .E x t r a c t i o n
W eigh 50 g fine ly ground feed into 500 m L round-bottom flask and add 250 m L C H C I3 fo llowed by 25 m L d istilled water. Secure flask
w ith polyethylene stopper and shake 30 m in w ith wrist-action shaker. F ilte r extract through 10 g Celite 545 filter aid in folded G F/A paper (15 cm diameter) in conical funnel. Collect two 50 m L portions of filtrate. Spike one portion w ith 10 p L aflatoxin standard (5 p g B i, G i /m L ; 1.5 p g B2, G 2/m L), 2 0 p L zearalenone standard (10 p g l m L ) , and 10 p L ochratoxin A standard (10 p g / m L ) , giving an effective concentration of 5 p g B j/kg , 20 p g zearalenone/kg, and 10 p g ochratoxin A /kg in the original feed. Evaporate both fractions to near dryness by using rotary evaporator.
C o l u m n C h r o m a t o g r a p h i c C l e a n u pUsing 2 cm id column w ith sintered glass base
and P TFE stopcock, prepare column by layering 5 g Na^SOi, 10 g silica gel 60, and 15 g Na2S0 4 in C H C I3. Draw off solvent to top of Na2S0 4. Add sample to column w ith three 1 m L portions of toluene, washing out flask w ith toluene and draw ing sample onto column.
Wash column w ith 150 m L toluene and elute zearalenone w ith 250 m L toluene-acetone (95 +5) (fraction I). W'ash column w ith 150 m L ethyl ether-hexane (3 + 1). Elute aflatoxins w ith 150 m L CHCh-m ethanol (97 + 3) (fraction II) . Elute ochratoxin A w ith 200 m L toluene-acetic acid (9 + 1) (fraction I II ) . Evaporate fractions I , I I , and I I I from column to near dryness and transfer to sm all v ia ls w ith C H C I3.
S e p - P a k C l e a n u pA lte rnative ly , use Sep-Pak silica cartridge in
place of column cleanup. These cartridges are inexpensive, are disposable, and greatly reduce volume of solvent needed to perform cleanup w ith conventional column.
Following manufacturer's instructions for use, add sample to cartridge by using two 0.5 m L portions of toluene. Wash w ith 10 m L toluene. Elute zearalenone w ith 10 m L toluene-acetone (95 + 5) (fraction I) and wash w ith 6 m L ethyl ether-hexane (3 + 1). Elute aflatoxins w ith 10 m L C H C l3-methanol (97 + 3) (fraction II) . Elute ochratoxin A w ith 10 m L toluene-acetic acid (9 + 1) (fraction I II ) . Evaporate fractions I , I I , and I I I to near dryness, and transfer to sm all v ia ls w ith C H C I3.
B a s e C l e a n u p f o r Z e a r a l e n o n e F r a c t i o nDepending on sensitiv ity required, zearalen
one fraction may be either analyzed d irectly or subjected to fu rther cleanup to increase sensitiv ity of detection.
For additional cleanup, transfer fraction I to 15

1358 HOW ELL & TAYLOR: J. ASSOC. OFF. ANAL. CHEM . (VOL. 64, N O . 6, 1981)
m L graduated centrifuge tube w ith C H C I3, and carry out a lka li extraction cleanup described by M oller and Josefsson (3). Transfer fina l extract in C H C I3 to sm all v ia l for T L C or H P LC .
D i a l y s i s C l e a n u p f o r A f l a t o x i n F r a c t i o nT L C or H P LC may be performed on fraction II
from most samples. H ow ever, analysis of samples that contain significant amount of in terfering compounds, such as laboratory anim al diets containing grassmeal, is improved if dialysis step is included.
Transfer fraction I I to 30 cm 1-8/32 V isk ing d ia lysis tubing w ith two 1 m L portions of aceton itrile as described by Patterson and Roberts (1), but use 40 m L 30% acetone instead of 25 m L in 50 m L stoppered flask. Wash Na2SC>4 column f in a lly w ith 30 m L C H C l3-methanol (97 + 3) and add wash to C H C I3 already collected. Evaporate extract to near dryness and transfer in C H C I3 to sm all v ia l for T L C or H PLC .
T h i n L a y e r C h r o m a t o g r a p h yActivate T L C plates by heating 1 h at 110°C
and allowing to cool in desiccator. Cut into four 10 X 10 cm plates.
(a) Z e a r a l e n o n e .—Evaporate fraction I extracts to dryness and dissolve in 20 p L C H C I3. Spot 2, 6 , and 10 p L of both sample and spiked extract. Co-spot the 2 p L spiked extract spot w ith 1 p L standard (100 p g / m L ) . Spot range of zearalenone standards for estimation purposes, e.g., 2.5,3.5, 4.5, 6 , 7.5, and 9 p L of 10 ¿ig/m L standard and 1, 1.5, 2, 2.5 p L of 100 p g / m L standard. Th is covers range of graduated brightness and permits theoretical range of quantification from 5 to 250 p g / k g in original sample. Develop plate in C H C l3-methanol (97 + 3) in lined equilibrated tank. A ir-d ry and observe plate under shortwave (250 nm) U V light. Zearalenone fluoresces bright blue at R f 0.5. Compare spots from sample w ith spike and standards.
(b) A f l a t o x i n .—Evaporate fraction I I extracts to dryness and dissolve in 250 p L benzene-aceton itrile (98 + 2). Spot two 2.5 p L and one 5 p L aliquots of sample and spiked extract. Co-spot one 2.5 p L spiked extract spot w ith 1 p L standard (5 p g B j, G i/m L ; 1.5 p g B2, G 2/m L). Spot 1 p L standard next to sample extract spots. Develop plate in C H C l3-acetone (9 + 1) in unlined unequilibrated tank. A ir-d ry and observe plate under longwave (365 nm) U V light. Aflatoxins appear as 4 spots in order of chromatographic m obility B i, B2 (blue), G i, G2 (green) from Rf 0.4 to 0.5. Compare spots from sample w ith spike and standards.
(c) O c h r a t o x in A .—Evaporate fraction I I I extracts to dryness and dissolve in 1 m L benzene- acetonitrile (98 4- 2). Spot two 10 p L aliquots of sample and spiked extract and co-spot one 10 p L spiked extract spot w ith 1 p L standard (10 p g / m L ) . Spot 1, 2 , 3, 4, and 5 p L standard (10 p g / m L ) for quantification. Develop plate in C H Cb-m ethano l (97 + 3), a ir-dry, and then develop plate in same dimension in toluene-acetic acid (9 + 1), both in unlined , unequilibrated tanks. A ir-d ry and observe plate under longwave (365 nm) U V light. Ochratoxin A appears as bright blue-green spot at Rf 0.4. Compare spots from sample w ith spike and standards.
H i g h P e r f o r m a n c e L i q u i d C h r o m a t o g r a p h y(a) Z e a r a l e n o n e .—Prepare mobile phase of
acetonitrile-0.1% orthophosphoric acid (50 + 50). Set fluorescence detector to excitation 274 nm (15 nm slit), emission 440 nm (20 nm slit). Stabilize system at flow rate of 1.0 m L/m in . D ilute 100 p g zearalenone/m L standard w ith mobile phase to give 2 p g / m L solution, and inject 50 p L . Adjust sensitiv ity of fluorescence detector to give ca 60-80% fu ll scale recorder deflection. Evaporate fraction I extracts to dryness, dissolve in 0.1 m L mobile phase and inject 50 p L into system. Compare peak heights from sample and spiked extracts to calculate concentration of zearalenone in sample.
To confirm positive result, change fluorescence excitation wavelength to 316 nm and sequentially inject 50 p L of 2 p g zearalenone/m L standard followed by 50 p L sample extract. Peak height ratio 274/316 nm obtained for sample should agree w ith in 10% of that obtained for standard zearalenone. Flush pump and column w ith methanol after all samples have been run.
(b) A f l a t o x i n .— Prepare m obile phase of water-saturated to luene-ethyl acetate-formic acid (85 + 25 + 5). Set fluorescence detector to excitation 365 nm (15 nm s lit), emission 425 nm (20 nm slit). Stabilize system at flo w rate of 2.5 m L/m in . D ilute aflatoxin standard w ith toluene-acetonitrile (98 + 2) to give solution containing 0.2 p g B j, G j/m L ; 0.06 p g B2, G2/m L. Inject 50 p L and adjust sensitivity of fluorescence detector to give ca 63-80% fu ll scale recorder deflection for B] peak. Evaporate fraction I I extracts to dryness, dissolve in 0.5 m L toluene- acetonitrile (98 + 2), and inject 50 p L . Compare peak heights from sample and spiked extracts to calculate concentration of aflatoxin in sample.
To confirm positive result, change fluorescence excitation wavelength to 330 nm and sequentially inject 50 p L 0.2 p g B1# G i /m L; 0.06 p g

HOW ELL & TAYLOR: J. ASSOC. OFF. ANAL. CHEM . (VOL. 64, N O . 6, 1981) 1359
B2, G 2/111L standard, followed by 50 ¡xL sample extract. Peak height ratio 365/330 nm obtained for sample should agree w ith in 10% of that obtained for standard aflatoxin . F lush pump and column w ith ethyl acetate after a ll samples have been run.
(c) O c h r a t o x i n A . —Prepare mobile phase of acetonitrile-0.1% orthophosphoric acid (55 + 45). Set fluorescence detector to excitation 333 nm (15 nm slit), emission 470 nm (20 nm slit). Stabilize system at flow rate of 1.0 m L/m in . Evaporate 0.2 m L of 10 jug ochratoxin A /m L standard to d ryness and dissolve in 20 m L mobile phase to give 0.1 /xg/mL solution. Inject 50 / iL and adjust sensitiv ity of fluorescence detector to give ca 60-80% fu ll scale recorder deflection. Evaporate fraction I I I extract to dryness, dissolve in 1 m L mobile phase, and inject 50 [ iL . Compare peak heights from sample and spiked extracts to calculate concentration of ochratoxin A in sample.
To confirm positive result, change fluorescence excitation wavelength to 280 nm and sequentially inject 50 /xL of 0.1 /xg ochratoxin A /m L standard followed by 50 |xL sample extract. Peak height ratio 333/280 nm obtained for sample should agree w ith in 10% of that obtained for standard ochratoxin A . Flush pump and column w ith methanol after all samples have been run.
Results and DiscussionIn itia l w ork on the cleanup procedure was
carried out using a norm al silica colum n, as described in the method, before the introduction of the Sep-Pak cartridge. The cartridge has the advantage of being convenient, quicker, and requires low volum es of solvent, w h ich is both desirable and economical. It is necessary to d ialyze diets containing grassmeal because they contain high levels of fluorescent material w hich chromatographs around the aflatoxin spots on the T L C plates and obscures the peaks on the H P L C chromatogram. H ow ever, the recovery of aflatoxin is somewhat reduced, and so the detection lim its are twice as large by T L C or H P L C for d ialyzed samples compared w ith non-dialyzed samples. D ia lysis can be perform ed before the cleanup but the recovery of zearalenone and ochratoxin A is poor. Zear- alenone recovery can be improved if the aqueous acetone is reduced to near dryness rather than extracted w ith chloroform . H ow ever, d ialysis still raises the detection lim its of zearalenone and ochratoxin A and it is, therefore, preferable to perform d ia lysis only on the aflatoxin fraction from diets containing grassmeal.
Ea rly w ork on the preparation of an extract containing zearalenone invo lved the a lkali cleanup method of M irocha et al. (9) applied to a fraction from the silica column. H owever, we experienced problems w ith em ulsions, low recovery, and time-consuming handling . Later w ork on base cleanup as described by M oller and Josefsson (3) resulted in a faster, sim p ler procedure w h ich gave excellent zearalenone recovery at the optimum pH of 8.0.
Separate T L C developing solvents, the optimum for each group of m ycotoxins, are recommended. I f only one sample is being analyzed at a time, the plastic plates may be cut into strips and sm aller receptacles and less developing so lvent may be used.
In the development of a method to separate and detect zearalenone by H P L C , the use of a reverse phase column w ith a m ethanol-water phase, as described by Ware and Thorpe (4), gave a poor zearalenone peak shape. H ow ever, add ition of orthophosphoric acid to the mobile phase improved the measured column efficiency by a factor of nearly 2. Use of methanol-0.1% orthophosphoric acid (65 + 35) and acetonitrile-0.1% orthophosphoric acid (50 + 50) gave sim ilar zearalenone retention times, but the latter produced a better separation of zearalenone from the other fluorescent components of m ixed feed.
U nder the H P L C conditions described, m in imum detectable amounts (signal peak height tw ice baseline noise) of zearalenone injected were 5.0, 2.4, and 2.0 ng at excitation w avelengths of 236,274, and 316 nm, respectively. A t these wavelengths, molar absorptivities were 29 700,13 909, and 6020, respectively. The optim um excitation wavelength depends on the energy profile of the light source in the fluorescence detector. The Perkin-Elm er 3000 spectrometer has a pulsed xenon source w h ich has a re la tive ly low output below 250 nm. Thus, the w avelength of the most intense peak in the zearalenone U V absorption spectrum (236 nm) was the least sensitive for fluorescence excitation. A n excitation wavelength of 274 nm gave good se lectiv ity for determ ining zearalenone in the m ajority of samples. I f a fluorescence detector w ith a deuterium lamp light source is used, then 236 nm may be a better choice as excitation w avelength.
Figure 1 shows the H P L C chromatogram obtained from the analysis of a laboratory anim al diet for zearalenone after the additional cleanup. The diet, when analyzed by T LC , gave a positive resu lt of 10 jig /kg. From the H P L C chromato-

1360 HOWELL & TAYLOR: J. ASSOC. OFF. ANAL. CHEM. (VOL. 64, N O . 6, 1981)
F igure 1. C h ro m ato g ram of m ixed feed c o n ta in in g 11 /ig ze a ra le n o n e /k g : co lu m n , S p h e riso rb O D S 5 /xm; m obile phase, acetonitrile-0.1% orth op h o sp h o ric acid (50 + 50); flow ra te , 1 m L /m in ; flu o rescen ce d e
tec to r, ex c ita tio n 274 n m , em issio n 440 nm .
gram, a zearalenone concentration of 11 /tg/kg was calculated. The diet contained wheat, corn, soya, barley, fishmeal, and oatfeed. Analysis of the raw materials showed that the corn was the source of contamination. In our laboratory, routine screening of laboratory anim al diets and corn plus investigatory screening of animal feeds for zearalenone is performed by T LC . Using the additional cleanup, m ixed feeds containing a wide variety of ingredients, including grassmeal, have been successfully analyzed by H P LC . A nalysis time was approxim ately 15 m in per sample w ith a detection lim it of 1 /xg zearalenone/kg.
The H P L C system described by Manabe et al.(7), w ith a silica column and a mobile phase of toluene-ethyl acetate-formic acid-methanol (89 + 7.5 + 2 + 1.5), was evaluated for determ ining aflatoxin in a range of mixed feeds. Laboratory diets containing grassmeal produced chromatograms w ith a large broad peak w h ich , although reduced after d ialysis of the extract, s till completely obscured aflatoxin G j. Therefore, the composition of the phase was modified to water-saturated toluene-ethyl acetate-formic acid (85 + 25 + 5). The interference from grassmeal in dialyzed extracts was now eluted in
the space between the peaks from aflatoxins G j and G 2. The modified phase also gives a better fluorescence response for aflatoxin B] and has the additional advantage of still being usable after storage.
A flatoxin retention times depend on the surface area per gram of the silica column packing. It may be necessary to change the amount of toluene in the mobile phase to allow for col- umn-to-column variations. A retention time of approxim ately 20-25 m in for the fin a l aflatoxin peak on the chromatogram (G 2) provides a good compromise between separation and analysis time for m ixed feed. The se lectivity of the mobile phase may be modified to alter the separation of a co-extractive from an aflatoxin by changing the ratio of ethyl acetate to formic acid. For instance, water-saturated to luene-ethyl acetate-formic acid in the ratio 85 + 30 + 4 w il l give s im ilar retention times but a s lig h tly d ifferent selectivity than an 85 + 25 + 5 m ixture.
One factor that affects the sensitiv ity of fluorescence detection is the background fluorescence from the mobile phase. The fluorescence from toluene of various grades and from several suppliers was measured. The level from Rath- burn's d istilled grade was the lowest by a considerable m argin, and was comparable to that measured for the ethyl acetate and form ic acid used. The m inim um detectable amounts of aflatoxin injected onto the liqu id chromatograph were 0.26 ng B j, 0.16 ng B2, 0.28 ng G ], and 0.12 ng G 2.
In our laboratory, routine screening of laboratory diets and corn, plus investigatory screening of animal feed for aflatoxin, is performed by H PLC . Figure 2 shows the chromatograms from(a) a laboratory animal diet, and (b) the same diet spiked before extraction w ith 5 /xg B j, 5 /xg G ;, 1.5 /xg B2, and 1.5 /xg G2/kg. The diet was shown to contain less than 0.4 /xg B! and G i/kg and less than 0.2 /xg B2 and G 2/kg; these figures were typical of the detection lim its obtained.
A set of conditions sim ilar to that described by Osborne (10) was used to determine ochratoxin A by H P LC , except that a column packed w ith 5 /xm Spherisorb ODS (Qg) was used instead of one packed w ith 10 /xm LiChrosorb R P 8 (Cs). A s a result, the capacity factor (3.6) and column e fficiency (3910) measured for ochratoxin A at 1.0 m L/m in were higher. The minimum detectable amount of ochratoxin A under these conditions was 0.05 ng. Column efficiency at a flow rate of2.0 m L/m in (2390) was adequate for the analysis of most samples.
A range of mixed feeds containing a variety of

HOWELL & TAYLOR: J. ASSOC. OFF. ANAL. CHEM. (VOL. 64, NO. 6, 1981) 1361
F igure 2. C hrom atogram s o f (a) laboratory a n im al d ie t, and (b) laboratory a n im al d ie t sp ik e d w ith 5 fig Bi, 5 fig G i/k g , 1.5 fig B2, and 1.5 fig G2/k g . C olu m n, Partisil 5 fim ; m o b ile p hase, w ater-saturated to lu e n e -e th y l a ce ta te -fo rm ic acid (85 + 25 + 5); f lo w rate, 2.5 m L /m in ; f lu o rescen ce d etector , ex c ita tio n 365 n m , em iss io n
425 nm .
in gred ien ts has b een successfu lly analyzed for ochratoxin A, usin g a final determ ination by HPLC. Figure 3 sh ow s the chrom atogram obtained from the analysis o f a m old-spoiled cow feed w h ich w as found to be positive by TLC and quantitated at 50 f ig /k g . From the HPLC chrom atogram , an ochratoxin A concentration o f 45 f ig /k g w as calculated. The presence on the chrom atogram of peaks w ith retention tim es sign ifican tly lon ger than that o f ochratoxin A w as unusual. A nalysis time, using a flow rate of 2 m L /m in , w as norm ally less than 10 m in and the detection lim it o f the m ethod, w ith the final determ ination by HPLC, was approximately 1 fig ochratoxin A /k g .
Experim ents adding m ycotoxin standards to the sam ple before extraction sh ow ed that the recovery in to the extractant from anim al feed is 1 0 0%, and toxin is on ly lost during the cleanup procedure. This w ou ld not necessarily apply to naturally contam inated m aterial, w here initial m ycotoxin concentration and hence the recovery by the extractant can on ly truly be estim ated by d eterm in in g the biological activity o f the toxin in th e sam ple.
The m ethod specifies spiking the initial extract because this saves tim e and solven t and provides
F igure 3. C hrom atogram o f m ixed feed c o n ta in in g 45 fig och ratoxin A /k g : co lu m n , S p herisorb O D S 5 fim ; m o b ile phase, acetonitrile-0.1% orthophosphoric acid (55 + 45); f lo w rate, 2 m l/m in ; f lu o rescen ce d e
tector, ex c ita tio n 333 n m , e m iss io n 470 nm .

1362 HOWELL & TAYLOR: J. ASSOC. OFF. ANAL. CHEM. (VOL. 64, NO. 6, 1981)
Table 1. Typical recoveries, after cleanup, of mycotoxins added to mixed feed 3
Mycotoxin Added, Mg/kgAv. rec. and range, %
Sep-Pakb Sep-Pak + dialysis0 Sep-Pak + baseAflatoxin Bi 5 70 33 —
(52-104) (25-44)Aflatoxin B2 1.5 83 47 —
(59-107) (39-57)Aflatoxin Gi 5 69 35 —
(45-86) (26-48)Aflatoxin G2 1.5 79 43 —
(55-103) (34-57)Zearalenone 20 — — 90Ochratoxin A 10 90 — —
3 Includes laboratory animal diets plus cattle, horse, pig, chicken, and turkey rations.b Means and ranges are for aflatoxin recovery from 13 different samples of laboratory diet.c Means and ranges are for aflatoxin recovery from 6 different samples of laboratory diet containing grassmeal.
2 uniform extracts for com parison. If com m odities other than anim al feed ingredients are to be extracted, then sp ik ing the original dry sam ple is recom m ended, until the percentage recovery into the extractant is established.
Table 1 g ives the percentage recovery o f the m ycotoxins after the described cleanup, as m easured by HPLC. The recoveries quoted for the aflatoxins w ere an average o f 13 d ifferent sam p les of laboratory diet w ith the Sep-Pak cleanup and 6 d ifferent sam ples o f laboratory d iet contain ing grassmeal w ith the Sep-Pak plus dialysis cleanup. The sam ples w ere analyzed over a period o f 4 w eeks. N ote the spread o f recovery figures at the low spiking levels em ployed (5 qg Bi, G i/k g ; 1.5 /xg B2, G2 /k g). W hen sam ples w ere sp iked at h igh er aflatoxin levels, m ore con sisten t recovery data w ere obtained. The variable recovery experienced w ith the Sep-Pak procedure is obviously a problem , how ever, the preparation o f sam ple and sp iked extracts at the sam e tim e, fo llow ed by calculation of the myco-
toxin concentration by com parison o f the 2 chrom atogram s (as described in the m ethod), m in im izes the effect of recovery variations on the final result. This, together w ith the speed and econom y of the Sep-Pak cartridge, makes its use advantageous w h en screening large numbers of sam ples. If a specific analysis o f a sam ple con ta in in g a low lev el o f aflatoxin is required, colum n chrom atography is recom m ended. The lim its o f detection for all m ycotoxins by HPLC and by TLC are g iven in Table 2.
The m ethod described has been applied to the routine screening of raw materials and laboratory anim al d iets and investigatory screen ing of m ixed feeds. O ver 300 sam ples have been analyzed and som e have been contam inated. A flatoxin w as m ainly found in m ixed feeds con tain ing groundnut or m aize. Z earalenone w as iden tified in 15 o f 20 batches of m aize analyzed, and in feeds conta in ing m aize. Ochratoxin A w as id en tified in m ixed feeds v isib ly sp oiled by m old due to bad storage.
Table 2. Detection limits, pg/kg, of method applied to mixed feedsAflatoxin B! Aflatoxin B2 Aflatoxin Gi Aflatoxin G2 Zearalenone Ochratoxin A
Sample TLC HPLC TLC HPLC TLC HPLC TLC HPLC TLC HPLC TLC HPLCMixed feedsa 3 0.4 0.9 0.2 3 0.4 0.9 0.2 200 10 1Mixed feeds with grassmeal 15 — 5 — 15 — 5 __ 600 __ 10 1Mixed feeds with grassmeal,
after dialysis cleanup 10 0.8 3 0.4 10 0.8 3 0.4 __ __ __ __Mixed feeds, after base
cleanup 10 1 __ __Mixed feeds with grassmeal,
after base cleanup 30 1 — —a Includes laboratory animal diets plus cattle, horse, pig, chicken, and turkey rations.

HOWELL & TAYLOR: J. ASSOC. OFF. ANAL. CHEM. (VOL. 64, NO. 6, 1981) 1363
AddendumSince preparing the m anuscript, the authors
have investigated an addition al m ethod o f confirm ing positive results for aflatoxins Bi and Gi. The addition o f 50 ¿¿L trifluoroacetic acid to the sam ple extract (evaporated to dryness or d issolved in to luen e-aceton itrile (98 + 2)) converts aflatoxin Bj to the hydrated derivative B2a and Gj to G2a (11). The derivatives B2a and G2a have lon ger retention tim es under the HPLC con d itions described than do Bi and Gj, respectively . The elu tion order observed after derivatization is B2a, B2, G2a, G2. Com parison o f the HPLC chrom atogram s from a contam inated sam ple extract, before and after th e addition o f trifluoroacetic acid, w ill sh ow the disappearance o f the Bi and Gi peaks and th e appearance o f B2a and G2a peaks.
AcknowledgmentsThe authors thank A. R. Law for usefu l d is
cussions and critical rev iew o f the m anuscript,M. Baker for valuable technical assistance, and
J. Edelm an, Director o f Research, for perm ission to publish th is paper.
References(1) Patterson, D. S. P., & Roberts, B. A. (1979) /. Assoc.
O f f . A n a l . C h e m . 62, 1265-1267(2) Balzer, I„ B ogdanic, C., & Pepeljnjak, S. (1978) ].
A s s o c . O f f . A n a l . C h e m . 6 1 ,5 8 4 -5 8 5(3) M oller, T. E., & Josefsson , E. (1978) /. Assoc. O f f .
A n a l . C h e m . 6 1 ,7 8 9 -7 9 2(4) Ware, G. M., & Thorpe, C. W. (1978) J. A s s o c . O f f .
A n a l . C h e m . 6 1 ,1 0 5 8 -1 0 6 2(5) Josefsson , E. & M oller, T. E. (1979) /. Assoc. O f f .
A n a l . C h e m . 6 2 ,11 65 -1 1 68(6) Beebe, R. M. (1978) J. Assoc. O f f . A n a l . C h e m . 61,
1347-1352(7) M anabe, M., Goto, T„ & Matsuura, S. (1978) A g r ic .
B io l. C h e m . 4 2 ,20 03 -2 0 07(8) Goto, T., M anabe, M„ & M atsuura, S. (1979) A g r ic .
B io l. C h e m . 4 3 ,2 5 9 1 -2 5 9 2(9) M irocha, C. J., Schauerham er, B., & Pathre, S. V.
(1974) J. A s s o c . O f f . A n a l . C h e m . 5 7 ,1 1 0 4 -1 1 1 0(10) O sborne, B. G. (1979) J. S c i. F o o d A g r i c . 3 0 ,1 0 6 5 -
1070(11) Takahashi, D. M. (1977) J. C h r o m a to g r . 131, 147-
156

1364 SCOTT ET AL.: J. ASSOC. OFF. ANAL. CHEM. (VOL. 64, NO. 6, 1981)
Gas Chromatography with Electron Capture and Mass Spectrométrie Detection of Deoxynivalenol in Wheat and Other GrainsPETER M. SCOTT, PUI-YAN LAU, and SHRINIWAS R. KANHEREH e a l t h a n d W e l f a r e C a n a d a , H e a l t h P r o t e c t i o n B r a n c h , F o o d D i r e c t o r a t e , O t t a w a , O n t a r i o ,C a n a d a K 1 A 0L2A m eth od for d eterm in in g d eo x y n iv a len o l (D O N ) in w h e a t has b een d ev e lo p ed in co n ju n ctio n w ith an assessm en t o f contam ination in Canada. T he sam ple is extracted w ith m eth a n o l-w a ter ; th e extract is treated w ith 30% aqueous am m onium su lfate so lu tion and extracted w ith 4 p ortion s o f e th y l acetate. A fter fu r th er c lea n u p b y co lu m n ch rom atograph y , the sa m p le extract is d er iv a tized w ith A f-heptafluo- ro b u ty ry lim id a zo le , and th e D O N tr is-h ep ta flu o ro - butyrate is determ ined by gas-liquid chrom atography w ith electron capture d etection . M ass spectrom etric s in g le io n m o n ito r in g at m /z 884 is u sed fo r co n fir m a tio n . D etec tio n lim its are < 0.01 ug D O N /g and reco v er ies from w h ea t, u sin g th e p rop osed m eth od , averaged 72 and 80% in 2 d ifferen t laboratories, w ith c o e ff ic ie n ts o f varia tion o f 10.2 and 10.0%, resp ectiv e ly . T he m ethod is also applicable to d eterm in ing D O N in b arley and corn and T -2 to x in in w h eat. V ir tu a lly 100% co n ta m in a tio n b y D O N o f th e 1980 O n ta rio w h ite w in te r w h eat and Q u eb ec red sp r in g w h ea t crops w as fo u n d , based on 72 ana lyses m ade in th is lab oratory , bu t w estern C anadian w h ea t co n ta in e d l i t t le or n o D O N .
In th e sum m er of 1980, the Ontario w h ite w inter w h eat crop w as ex ten sively contam inated w ith p in k kernels, later sh ow n to be associated w ith th e presence o f Fusarium gram inearum (G. A. N e ish and H. C ohen, Agriculture Canada). A n alysis o f an in itial 25 sam ples o f the w h eat in th is laboratory for trichothecenes revealed the presen ce o f d eoxyn iva len ol (DO N; vom itoxin) in all sam ples; T-2 toxin, HT-2 toxin, and diace- toxyscirpenol d id not appear to be present.
D O N was first isolated in Japan and the United States from barley and corn infected in the field w ith F. gram inearum (F. roseum) (1-3). The alternative nam e vom itoxin refers to its property of causing vom itin g (em esis) in sw in e (3, 4). Feed refusal and associated decreased gain or even w eigh t loss are additional effects produced by D O N in anim als (4-7). D O N has been found in corn in several countries, often associated w ith em esis a n d /o r refusal in sw in e, and in clu d in g corn eaten by hum ans (3, 8-16). It has also been d etected in norm al-appearing sam ples o f Japan ese barley and w heat (17). Faced w ith this
Received February 25, 1981. Accepted June 3, 1981.
considerable evidence for the natural occurrence of DO N in grains and w ith concern for potential contam ination by trichoth ecenes in general, m ethod d ev elop m en t for these m ycotoxins has been an active field . The favored m eans o f d eterm in in g trichothecenes, in clu d in g D O N , has been gas-liquid chrom atography (GLC), w ith trim ethylsilylation for derivative form ation and w ith flam e ion ization detection (13, 18-21). Kuroda et al. (17) show ed that sensitiv ity for the trim eth ylsily l derivatives o f D O N and related com pounds was about 2500 tim es better w ith an electron capture (EC) detector and, in fact, as little as 2 pg D O N could be detected. R ecently, hep- tafluorobutyrylation has been combined w ith EC determ ination o f T-2 toxin and diacetoxyscir- p en ol in grains (22,23). W e have extended this reaction to D O N and several other trichothecen es (P. M. Scott, S. R. Kanhere, and P.-Y. Lau, u n p u b lish ed results) and, as presented in this paper, have d ev elop ed an overall m ethod for determ ining DO N in wheat, w hich is being used to assess the extent o f contam ination in Canada and elsew here.
The m ethod incorporates essentially the same extraction procedure for D O N as that presented by Romer and B oling (24), fo llow ed by a sim ple silica ge l colum n cleanup before derivatization. T hroughout the m ethod d evelop m en t and application to actual sam ples, w e frequently checked GLC results obtained by EC detection w ith mass spectrom etric s in g le ion m onitoring (MS(SIM)) at m /z 884, the molecular ion o f DO N tris-heptafluorobutyrate.
M ETH O DApparatus
(a ) Gas ch rom atograph .— Varian A erograph M odel 2100, or equ ivalent, equ ipped w ith a llglass injector, 183 cm X 2 mm id glass U-colum n filled w ith 3% OV-3 on 80-100 mesh Chromosorb W (HP), and electron capture detector (3H /S c foil).(b) H igh-speed blender.— W aring, exp losion- proof, w ith 1 L jar.
(c) C entrifuge .— International 3/4 HP, Sorvall SS-3 autom atic, or equ ivalent, w ith 250 mL bot-
0004-5756/81 /6406-1364-08$01.00 © Association of Official Analytical Chemists. Inc.

SCOTT ET AL.: J. ASSOC. OFF. ANAL. CHEM. (VOL. 64, NO. 6, 1981) 1365
ties (use plastic bottles w ith Sorvall), and 5 mL glass-stopper centrifuge tubes.
(d) Tube-shaking machine.— T herm olyne Maxi M ix, or equ ivalent.
(e) C hrom atographic colum n.— Glass, 27 X 1.3 cm od, w ith 250 mL reservoir (if preferred) and T eflon stopcock.Reagents
(a) Deoxynivalenol.—Available from Myco-Lab. Co., PO Box 321, C hesterfield , MO 63107. Prepare stock solution 1 m g/m L CHCI3 by warming; store in freezer. M ix w e ll to redissolve. Evaporate 20 p L aliquot o f stock solu tion and add 10 mL toluene-acetonitrile (95 + 5) to g ive 2 p g /m L w ork in g standard.
(b) N -H ep ta flu o ro b u tyry lim id a zo le (HFB1).— Pierce Chem ical Co., Rockford, IL 61105.
(c) A m m onium su lfa te .— 30% solution.(d) D iatom aceou s ea r th .— H y flo Super-C el
(Fisher Scientific Co.).(e) Silica g e l.— For colum n chrom atography.
E. Merck silica ge l 60, 0.063-0.200 mm particle size.
(f) S o lv e n ts .— D istilled -in -g la ss m eth an o l, eth y l acetate, m eth y len e ch loride, to lu en e, acetone, acetonitrile, «-hexane.
(g) Laboratory film .— Parafilm 'M' (Am erican Can Co., G reenw ich , CT 06830).(h) S ily l-8 .— Pierce C hem ical Co.Sample Preparation
Grind 5 -10 lb sam ple 4 -5 m in in Hobart vertical cutter m ixer M odel 40 (or equ ivalent).Extraction and Cleanup
Blend 50 g sam ple 5 m in at h igh sp eed w ith 250 mL m eth an ol-w ater (1 + 1). Transfer m ixture to 250 mL centrifuge bottles and centrifuge 5 m in at 3500 rpm. D ecant centrifugate and transfer 60 mL portion to 500 mL beaker. Add 240 mL 30% aqueous am m onium sulfate, mix, add 100 mL diatomaceous earth, and stir 2 m in on m agnetic stirrer. Filter through W hatm an N o. 4 flu ted paper or through sintered-glass fu n n el (w ith suction). Collect 200 mL filtrate and transfer to 500 mL separatory fun n el. Extract w ith four 100 mL portions o f eth y l acetate and dry com bined extracts by stirring 10 m in on magnetic stirrer w ith 35-40 g anhydrous N a2S 0 4 for ca 10 m in. Add 10-20 g m ore N a2S 0 4 until last portion does not form lum ps. Decant through glass w oo l p lug into 500 mL pear- shaped flask and evaporate to dryness on rotary evaporator at water bath temperature of ca 55°C. Rinse N a2S 0 4 w ith tw o 50 mL portions o f eth y l
acetate, add rinses to evaporating flask, and evaporate to dryness. Transfer residue to 4 mL T eflon-lined screw-cap via l w ith eth y l acetate and evaporate to dryness under gen tle stream of nitrogen on alum inum block heated to ca 50°C.Column Chromatography
Prepare silica ge l colum n by add in g 1 g anhydrous N a2S 0 4 onto glass w o o l p lu g at bottom of colum n filled w ith to luen e. S low ly add 2 g silica gel and cap w ith 1 g anhydrous N a2S 0 4. Drain so lven t to top o f upper N a2S 0 4 layer. D isso lve sam ple extract in 0.5 mL m eth ylen e chloride, using tube-shaking m achine, and transfer to top o f colum n w ith Pasteur pipet. Rinse v ia l w ith further 0.5 mL m eth y len e ch lo ride and add rinse to colum n. Drain to top of upper N a2S 0 4 layer. W ash co lum n w ith 30 mL to lu en e-aceton e (95 + 5), ca 2 mL of w h ich is used to rinse vial, and discard eluate. Elute tri- choth ecen es w ith 50 mL m eth y len e ch lo rid e- m ethanol (95 + 5) into 250 mL round-bottom flask and evaporate eluate to dryness on rotary evaporator at water bath tem perature o f <60°C . Transfer residue to 4 mL v ia l w ith m eth y len e chloride, evaporate solven t under nitrogen, and add 4 mL to lu en e-aceton itr ile (95 + 5). This so lu tion contains 2 g sam ple eq u ivalen t/m L .Deri va tiza tion
Rem ove suffic ient HFBI for derivatizations and place 50 p L in each 5 mL glass-stopper cen trifuge tube. Reseal bottle o f HFBI w ith Parafilm . To the 50 p L HFBI, add 500 p L sam ple or standard solu tion (2 p g /m L ) in to lu en e-aceto n itrile (95 + 5). Seal stopper w ith Parafilm and mix w e ll 1 m in on tube shaker. H eat tubes 1 h in sand bath m aintained at 60°C. Cool to room tem perature and mix again ca 1 m in. A dd 1 mL 5% aqueous sodium bicarbonate so lu tion , mix 2 m in on tube shaker, and let stand to separate layers. Transfer 50 p L (= 0.1 g) organic layer w ith syringe to 2 mL vial con ta in in g 950 p L n- hexane. Prepare standard solu tion conta in ing0.025 p g d eoxyn iva len o l/m L by d ilu tion w ith «-hexane.Gas Chromatography
If possib le, carry out analysis on sam e day as d erivatization , u sin g fo llo w in g conditions; co lu m n 170°C; injector and detector 225°C; n itrogen carrier gas at 52 m L /m in; attenuation 8 X 10⁻¹⁰ am p /m V (32 X 10- I ° am p /m V w ith co lum n tem perature o f 200°C used in d ev elop m ental work); chart speed 0.25 in ./m in .
1 366 SCOTT ET AL.: J. ASSOC. OFF. ANAL. CHEM. (VOL. 64, NO. 6, 1981)
D ep en d in g on detector sen sitiv ity , inject su itable am ounts o f standard d irectly onto colum n to obtain standard curve (5-50 pg should be attainable). Detector response (peak height) varies linearly w ith am ount injected. Standard curve must be prepared each day. Initially inject1 -2 p L sam ple solu tion and adjust vo lu m e in jected or d ilu te sam ple solu tion , if necessary, w ith «-hexane. Retention tim e for DO N is 5-6.5 m in. A llo w at least 20 m in b etw een injections, m ade in duplicate for each sam ple.
Calculate D O N concentration (jug/g) in sample and correct for m ethod recovery. M ake determ inations on ly for sam ple peaks w ith sam e peak w id th (at h a lf height) as standard.Other Trichothecenes (Recovery Experiments)
For determ ination o f diacetoxyscirpenol and T-2 toxin and detection of HT-2 toxin by GLC-EC, proceed as above except final derivatized standard so lu tion s contain 0.25 p g toxin /m L . Use GLC colum n tem perature o f 220°C and attenuations o f 32 X 1(T 10, 8 X 10“ 10, and 64 X 10" 10 am p /m V , respectively . Standard curves then range from 150 to 1000 pg and retention tim es are3 .5 ,1 2 .2 , and 5.7 m in , respectively .Gas Chromatography-Mass Spectrometric Single Ion Monitoring
D O N .— Initially inject 5 p L sam ple solu tion in to Varian Aerograph M odel 1400 gas chrom atograph equipped w ith 183 cm X 2 mm id glass colum n packed w ith 3% OV-3 on 80-100 m esh Chromosorb W (HP) and coupled via a dual stage all glass W atson-Biem ann separator to Varian M AT M odel 311A mass spectrom eter. Adjust h eliu m flo w rate (45-60 m L /m in ) to g iv e ion source pressure o f ca 10- 6 torr. U se injector tem perature 215-235°C , colum n tem perature 180°C, separator tem perature 210-240°C , transfer lin e tem perature 2 0 5 -2 40°C, and the fo llo w in g mass spectrom eter settings: ion source tem perature 215-245°C , electron energy 70 eV, em ission current 2000 p A , electron m ultip lier voltage 2.25 kV. Operate mass spectrom eter in sp ecific ion m onitoring m ode for m /z 884 (m olecular ion o f D O N tris-heptafluorobutyrate) at resolu tion o f 950-1000 (10% valley). U se output range 0.03 V (0.01 V, if necessary) and chart speed 1 cm /m in . Q uantitate observed peak at retention tim e of D O N standard (3.2-3.6 m in) by peak h e ig h t m easurem ent w ith reference to linear standard curve (25-150 pg at range 0.03 V; 10-75 pg at 0.01 V).
O th er trichothecenes.— U se GLC colum n tem
peratures o f 210, 220, and 240°C for diacetoxyscirpenol, HT-2 toxin, and T-2 toxin, respectively, w ith single ion m onitoring at m / z 502 (molecular ion o f d iacetoxyscirpenol h ep tafluorobuty- rate— H O Ac), 654 (HT-2 toxin b is-heptafluoro- b u ty r a te -H O A c -(C H 3)2CH CH 2COOH), and 602 (T-2 toxin heptafluorobutyrate— HOAc). R etention tim es are ca 4.4 m in. At 0.03 V range setting, am ounts o f standard injected are 50-150 pg, 500-2000 pg, and >1 n g diacetoxyscirpenol, HT-2 toxin , and T-2 toxin , respectively .
R esu lts and D iscu ssionThe proposed m ethod for determ in ing D O N
in w h eat w as d ev elop ed and tested during in vestigations on Canadian w heat in 1980. During this tim e, 3 variations in the partition steps were studied usin g a GLC colum n tem perature of 200°C: M ethod A included an additional 50 mL «-hexane wash of the 200 mL m ethanol-aqueous am m onium sulfate filtrate and the use of four 100 mL portions of ethyl acetate-m ethylene chloride (1 + 1) to extract this filtrate; m ethod B w as the proposed m ethod, i.e., no hexane wash and ethyl acetate for extraction; and m eth od AB w as the sam e as m ethod A w ith om ission o f the hexane wash. A lthough m ethod A performed w e ll w ith w heat sam ples from Ontario and Q uebec (Table1 ), neither the hexane w ash nor the use o f the low er polarity extraction so lven t, steps w h ich greatly increased m ethod tim e because o f em u lsions, w as o f any value in rem oving an interference found in western Canadian w h eat (Table 1) and it w as necessary to low er the GLC colum n tem perature to 170°C to effect separation. H ow ever, because m uch o f the earlier w ork on Ontario and Q uebec sam ples w as carried out w ith m ethod variation A and a GLC colum n tem perature o f 200°C, GLC-EC and GLC- MS(SIM) analyses on extracts obtained using this m ethod variation are inclu d ed in Table 1 to i l lustrate that in nearly all these cases good agreem ent could be obtained u sin g the 2 m eans of quantitation. It is lik ely that the proposed m ethod as w ritten (colum n tem perature 170°C) w ou ld also have produced sim ilar agreem ent, as seen w ith som e sam ples in Table 1 and dep icted in Figures 1 and 2.
Filtration o f the initial m ethanol-w ater extract after centrifugation w as or ig in ally in clu d ed in the m ethod. This step w as unnecessary and did not affect recoveries of D O N from w h eat, w h ich ranged from 54 to 83% as m easured by GLC-EC (colum n temperature 170°C) and from 55 to 94% by GLC-MS(SIM) (Table 2). The m ean recovery of D O N from ground w h eat determ ined in this

SCOTT ET AL.: J. ASSOC. OFF. ANAL. CHEM. (VOL. 64, NO. 6, 1981) 1367
Table 1. Comparison of DON found in naturally contaminated wheat samples by GLC-EC and GLC-
MS(SIM), using the proposed method with minor variations
Origin ofDON,3A g /g
GLC-EC* GLC-MS(SIM)sampleMETHOD Ac
Western Canada (flour) ND(<0.01) ND (<0.007)Ontario 0.33 d 0.28
0.31 0.360.81 0.892.63d 2.240 .35d 0.140.77d 0.800 .61d 0.600.33 0.310.16 0.140.072 0.0500.92 0.66
Quebec 0.19 0.170.41 0.450.27 0.210.15 0.040
Ontario (1979) 0.007 0.015ND (<0.004) 0.0040.064 0.0930.044 0.060
Quebec 0.83 0.830.29 0.33d0.89 0.92 30.28 0.310.31 0.28 30.44 0 .4430.065 0.063 3
METHOD BcOntario 3.25 2.65
0.95 0.75Alberta 0.071 0.018
0.14 ND (<0.003)0.006 ND (<0.003)
Saskatchewan 0.049 ND (<0.003)Saskatchewan
Detn 1 0.15Detn 2 ND (< 0 .01)' 0.004
Saskatchewan 0.063 ND (<0.003)0.091 0.003trace 0.004
Manitoba 0.073 ND (<0.003)0.004 ND (<0.003)
Ontario 0 .7 5 ' 0.620.063 '* 0.039
Quebec 0 .92 ' 0.845.28 ' 5.27
Quebec* 2 .38 ' 2.45Western Canada* 0 .027 ' 0.026
3 Without correction for recoveries.
* Column temperature 200°C except where noted. c See text for method variations. d Single standard injection only.3 Analysis of 6-day-old diluted derivative solution. 'Column temperature 170°C.« Wide peak.h Extract supplied by J.-P. Hanchay, Health Protection
Branch, Quebec Region, who found 2.0 and 0.03 f ig DON/g, respectively, in the Quebec and western Canadian samples.
laboratory over a period o f 2 m onths, u sin g the proposed m ethod, was 72% ( n = 14, CV 10.2%) by GLC-EC and 74% by GLC-M S(SIM ) (n = 12, CV 15.3%) at sp ik ing lev e ls o f 0 .1 -1 .0 f i g /g . Recoveries carried out in d ep en d en tly in a second laboratory over a 3 day period (E. Tarter, H ealth Protection Branch, Ontario Region, unpublished results) at a spiking level of 0.2 f ig D O N / g w heat averaged 80% (n = 10, CV = 10.0%); th e GLC colum n temperature w as 175°C and attenuation w as 16 X 10-10 am p/m V . T w o factors affecting recoveries w ere studied: (1) Re-extraction w ith m eth an ol-w ater of ground w h eat sp iked w ith 1
RETENTION TIME (min)
Figure 1. Gas chromatograms of extracts of naturally contaminated (a) Ontario white winter wheat and (b)
western Canadian wheat.Column temperature 170°C, attenuation 8 X 10_1°
amp/mV. Arrows indicate retention time of DON tris-heptafluorobutyrate: (a) 2 fih 0.01 g equivalent wheat/mL injected and estimated to contain 15 pg DON corresponding to 0.75 fig DO N/g wheat; (b) 2 fiL 0.1 g equivalent wheat/mL injected; 5 pg DON, 0.025 fig DO N/g wheat.

1368 SCOTT ET AL.: J. ASSOC. OFF. ANAL. CHEM. (VOL. 64, NO. 6, 1981)
i---1---1--- 1--- 1--- 1 i--- 1--- 1--- 1 r~0 1 2 3 4 5 0 1 2 3 4
RETENTION TIME (min)F igure 2. G L C -M S(SIM ) at m /z 884 o f extracts o f naturally contam inated O ntario w in ter w heat (a) and
w estern C anadian w h ea t (b) from Figure 1.(a) 5 nL 0.01 g equivalent wheat/mL injected and
estimated to contain 32 pg DON corresponding to 0.64 jig/g wheat; (b) 5 nL injected, 0.1 g equivalent wheat/ mL, 13 pg DON, 0.026 f ig lg wheat. Column temperature 180°C, range 0.03 V.
;ig D O N /g y ie ld ed on ly an additional 5 and 7% D O N com pared w ith 70 and 6 8% recovery d eterm ined by GLC-EC and GLC-M S(SIM ), respectively; and (2 ) the colum n chrom atographic step w as tested w ith 2 naturally contam inated
wheat sam ples and yielded virtually all the D O N in the second fraction (Table 3).
The use o f either the electron capture detector or sin g le ion m onitoring of the m olecular ion o f D O N tris-heptafluorobutyrate permits detection and determ ination o f very low concentrations (<0.01 p g /g ) o f D O N in w heat (Table 1). D etector responses for standard D O N varied from 2 to 6 p g /cm by GLC-EC and from 5 to 12 p g /cm by GLC-MS(SIM) at the colum n tem peratures (170-200°C ) and norm al attenuations used. It should be em phasized that responses did vary, and standard curves shou ld be m ade daily.
Romer et al. (22) found that T-2 toxin and di- acetoxyscirpenol could be derivatized w ith HFBI after on ly 15 s at room tem perature. W e found that D O N requires heating 1 h at 60°C. The concentrated reaction m ixture w as stable for at least 3 h at room temperature; how ever, about 40% deterioration was noted after 2 days storage, ev en over N a2S0 4, by com parison w ith hepta- chlor internal standard. On the other hand, the d ilu ted so lu tion (0.025 /ug/mL) w as stable for at least 2 days. Thus, it is recom m ended that d erivative so lu tion s be diluted if GLC analysis on the sam e day is not possible.
Based on com parison o f GLC-EC and GLC- MS(SIM) determ inations on actual sam ples, the m eth od o f analysis used for determ in ing D O N in w h eat is also applicable to corn, barley, and
Table 2. Recovery of DON added to wheat flour, ground wheat, barley, and corn
SampleDON added,
Mg/g
Method variation3
and column temp, for GLC-EC.
°CRecovery,6 %
GLC-EC GLC-MS(SIM)1 (wheat flour) 0.1 A 200 72. 73 58L 7 4 c
1.0 A 200 85, 59 62 59 60.1 B 200 86, 70 68 c, 58 61.0 B 200 78.68 67 L 45 6
2 (wheat) 0.5 B 200 84, 80170 78c, 76c —
3 (wheat) 0.1 B 200 101, 102170 83 c. 79 6 80, 810.5 B 200 77,88170 65c, 71 c 64, 70
1.0 B 200 78, 86170 6 7 c, 74c 66, 694 (wheat) 0.1 B 170 74. 74 92,94
0.5 B 170 70, 75 75,771.0 B 170 66, 54 67,555 (wheat) 0.2 B 175 80 d —6 (barley) 0.5 B 170 82. 91 —7 (corn) 0.5 B 170 76, 79 —
a Method variations described in text; for Samples 3, 4, 5, 6. and 7, filtration of methanol-water extract was omitted. 6 Duplicate recovery experiments except for Sample 5. Corrections were made for blank sample contribution, if any. c Final determination on 1-2-day-old diluted derivative solution.d Results from E. Tarter, Health Protection Branch, Ontario Region, n = 10, CV = 10.0%.
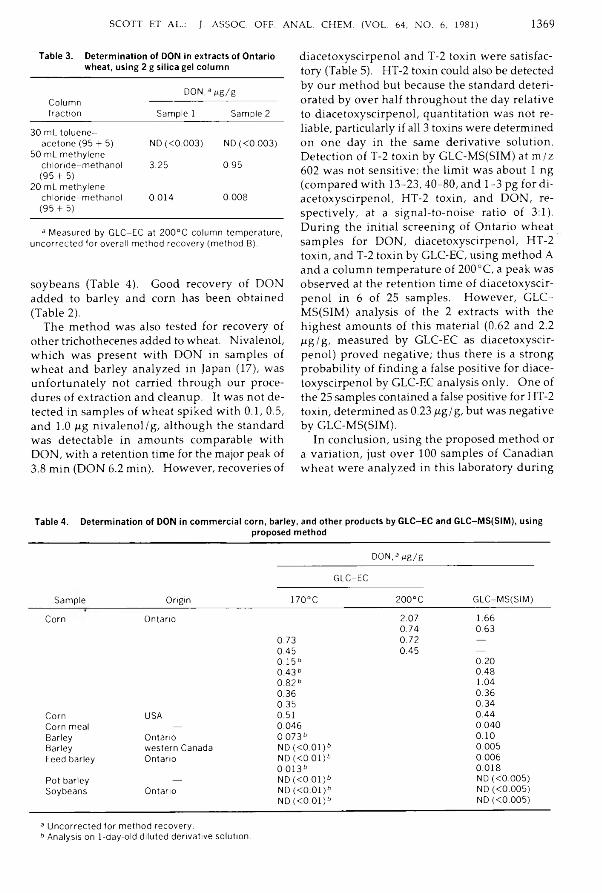
SCOTT ET AL.: J. ASSOC. OFF. ANAL. CHEM. (VOL. 64, NO. 6, 1981) 1369
Table 3. Determination of DON in extracts of Ontario wheat, using 2 g silica gel column
Columnfraction
DON, 3 Mg/gSample 1 Sample 2
30 mL toluene- acetone (95 + 5) ND (<0.003) ND (<0.003)
50 mL methylene chloride-methanol 3.25 0.95(95 + 5)
20 mL methylene chloride-methanol 0.014 0.008(95 + 5)a Measured by GLC-EC at 200°C column temperature,
uncorrected for overall method recovery (method B).
soybeans (Table 4). G ood recovery of D O N added to barley and corn has been obtained (Table 2).
The m ethod w as also tested for recovery of other trichothecenes added to wheat. N ivalenol, w h ich w as present w ith D O N in sam ples of w h eat and barley analyzed in Japan (17), was unfortun ately not carried through our procedures o f extraction and cleanup. It was not d e tected in sam ples of w h eat sp iked w ith 0.1, 0.5, and 1.0 f ig n iv a le n o l/g , a lthough the standard w as detectable in am ounts com parable w ith D O N , w ith a retention time for the major peak of3.8 m in (D O N 6.2 m in). H ow ever, recoveries of
diacetoxyscirpenol and T-2 toxin w ere satisfactory (Table 5). HT-2 toxin could also be detected by our m ethod but because the standard deteriorated by over half throughout the day relative to diacetoxyscirpenol, quantitation w as not reliable, particularly if all 3 toxins w ere determ ined on on e day in the same derivative solution . D etection o f T-2 toxin by GLC-MS(SIM) at m /z 602 w as not sensitive; the lim it w as about 1 ng (com pared w ith 13-23, 40-80 , and 1-3 pg for d iacetoxyscirpenol, HT-2 toxin, and D O N , resp ective ly , at a signal-to-noise ratio o f 3:1). D u ring the in itial screen ing of Ontario w heat sam ples for D O N , diacetoxyscirpenol, HT-2 toxin, and T-2 toxin by GLC-EC, using m ethod A and a colum n tem perature o f 200°C, a peak was observed at the retention tim e o f diacetoxyscirp en o l in 6 of 25 sam ples. H ow ever, GLC- MS(SIM) analysis of the 2 extracts w ith the h ig h est am ounts of th is material (0.62 and 2.2 p g /g , m easured by GLC-EC as diacetoxyscirp en o l) proved negative; thus there is a strong probability of fin d in g a false p ositive for d iacetoxyscirpenol by GLC-EC analysis only. O ne of the 25 samples contained a false positive for HT-2 toxin, determ ined as 0.23 ¿tg/g, but was negative by GLC-MS(SIM).
In conclusion , usin g the proposed m ethod or a variation, just over 100 sam ples o f Canadian w h eat w ere analyzed in this laboratory during
Table 4. Determination of DON in commercial corn, barley, and other products by GLC-EC and GLC-MS(SIM), usingproposed method
DON,a /ig /gGLC-EC
Sample Origin 170°C 200 °C GLC-MS(SIM)Corn Ontario 2.07 1.66
0.74 0.630.73 0.72 —0.45 0.45 —0.15" 0.200.43 b 0.480 . 8 2 b 1.040.36 0.360.35 0.34
Corn USA 0.51 0.44Corn meal — 0.046 0.040Barley Ontario 0 . 0 7 3 b 0.10Barley western Canada ND(<0.01)b 0.005Feed barley Ontario ND (<0.01 ) b 0.006
0.013b 0.018Pot barley — ND (<0.01)b ND (<0.005)Soybeans Ontario ND (<0.01)b ND (<0.005)
ND (<0.01)0 ND (<0.005)
a Uncorrected for method recovery, o Analysis on 1-day-old diluted derivative solution.

1370 SCOTT ET AL.: J. ASSOC. OFF. ANAL. CHEM. (VOL. 64, NO. 6, 1981)
Table 5. Recovery of T-2 toxin, HT-2 toxin, and diacetoxyscirpenol from ground wheat
Trichothecene Added, n g /gRecovery,3 %
GLC-EC GLC-MC (SIM)Diacetoxyscir
penol 0.5 89 b . 78 3 88. 891.0 786, 7 4 b 88, 82
T-2 toxin 0.5 85.89 NDC1.0 77, 76 ca 50 d
HT-2 toxin 0.5 — 100. 991.0 — 94,75
3 Duplicate recovery experiments. b Corrected for small contribution from blank (ca. 0.08
Pg/g)-c ND = not detected; detection limit 0.5 pg/g. d Final determination on 1-day-old diluted derivative solu
tion.
1980. Forty-four of 45 samples of the Ontario 1980 white w inter wheat crop contained DON in concentrations of 0.01-4.3 pg/g as determined by G LC -EC and corrected for method recovery; 15 positive samples were confirmed by G LC - M S(SIM ) (Table 1). There appeared to be higher levels of D O N in feed-grade wheat (grade 6) compared w ith wheat graded 1-5: 73 and 14%, respectively, of these samples contained >0.3 Mg / g. DON was also found in a ll of 7 samples of O ntario w hite w in ter wheat from the 1979 crop (grades 1-4) at levels of 0.01-0.13 Mg/g (corrected for recovery) and in a single sample from 1973 (0.62 Mg/g)- In the Quebec red spring wheat crop, 100% contamination by DO N was found, based on analysis of 27 samples, of which 13 were determ ined by G LC -M S (S IM ) (Table 1). E ighty-five percent of these Quebec samples contained >0.3 Mg D O N /g and there was little difference in the pattern of distribution in DON leve ls between wheat intended (but not permitted to be used) for human consumption (0.09-1.1 Mg/g, corrected) and that intended for anim al consumption (0.06-7.0 Mg/g, corrected). Western Canadian wheat was fortunately not a problem and of 25 samples analyzed in this laboratory none contained more than 0.08 Mg/g of material measured as DO N by G LC-EC , w h ile 10 of the samples analyzed by G LC -M S(S IM ) all contained <0.03 Mg/g (Table 1). In addition, the proposed method has demonstrated the presence of DO N in barley and food-grade corn, confirm ed by G LC -M S(S IM ) in most cases (Table 4). Contamination of certain Canadian grains by this trichothecene is a problem that requires further research from the view point of potential harm to human health.
AcknowledgmentsWe thank Y . Ueno for samples of H T-2 toxin
and n ivaleno l, and the fo llow ing for contributions to procurement and analysis of grain samples: B. C . W illiam s, W . P . Cochrane, R . Y .Hodgson, V . Duke, H . B. S. Conacher, E . Tarter, Y . Lew anski, J.-P. Hanchay, J. F. Lawrence, G . A . Lawrence, N . P. Sen, R . Chadha, J. Iyengar, C . Charbonneau, G. Lacro ix, and D . Lew is.
Rf.ferences(1) M orooka, N ., Uratsuji, N ., Y oshizaw a, T., & Ya
m am oto, H. (1972) J. Food Hyg. Soc. ]pn 13, 3 6 8 - 375
(2) Y oshizaw a, T„ & M orooka, N . (1973) Agric. Biol. Chem. 3 7 ,29 33 -2 9 34(3) Vesonder, R. F„ C iegler, A., & Jensen, A. H . (1973) Appl. Microbiol. 2 6 ,1 0 0 8 -1 0 1 0(4) Forsyth, D. M„ Y oshizaw a, T„ M orooka, N „ &
Tuite, J. (1977) Appl. Environ. Microbiol. 34, 5 47 - 552
(5) Y oshizaw a, T., Shirota, T., & M orooka, N . (1978) /. Food Hyg. Soc. ]pn 1 9 ,1 7 8 -1 8 4
(6) V esonder, R. F., C iegler, A„ Burm eister, H . R., & Jensen, A. H. (1979) Appl. Environ. Microbiol. 38, 344-346
(7) Burm eister, H. R„ V esonder, R. F„ & K w olek , W.F. (1980) Appl. Environ. Microbiol. 3 9 ,9 5 7 -9 6 1
(8) Lew, H., M üllner, E„ H ager, R., & G regor, M. (1979) Bodenkultur 30, 309 -316
(9) V esonder, R. F., & C iegler, A. (1979) Eur. J. Appl. Microbiol. Biotechnol. 8 ,2 3 7 -2 4 0(10) Jem m ali, M ., U en o , Y„ Ish ii, K., Frayssinet, C , &
E tienne, M. (1978) Experienlia 3 4 ,1 3 3 3 -1 3 3 4(11) M irocha, C. J., Pathre, S. V ., Schauerham er, B„ &
C hristensen, C. M. (1976) Appl. Environ. Microbiol. 3 2 ,5 5 3 -5 5 6
(12) Marasas, W. F. O., van R ensburg, S. J., & M irocha,C. J. (1979) J. Agric. Food Cliem. 2 7 ,1 1 0 8 -1 1 1 2
(13) V esonder, R. F., C iegler, A ., Rogers, R. F„ Bur- bridge, K. A„ Bothast, R. J., & Jensen, A. H. (1978) Appl. Environ. Microbiol. 36, 885-888
(14) Vesonder, R. F„ C iegler, A ., R ohw edder, W. K., & Eppley, R. (1979) Toxicon 17, 658-660
(15) M irocha, C. J., Schauerham er, B., C hristensen , C.M., & K om m edahl, T. (1979) Appl. Environ. Microbiol. 38, 557-558
(16) Pathre, S. V., & M irocha, C. J. (1979) J. Am. Oil Chem. Soc. 5 6 ,8 2 0 -8 2 3(17) Kuroda, H., M ori, T., N ish ioka, C , Okasaki, H„ &
Takagi, M. (1979) /. Food Hyg. Soc. Jpn 20, 137- 142
(18) Eppley, R. M. (1979) ]. Am. Oil Chem. Soc. 56, 824-829
(19) Kamimura, H., Nishijim a, M., Saito, K., Takahashi, S„ Ibe, A., Ochiai, S„ & N aoi, Y. (1978) /. Food Hyg. Soc. Jpn 1 9 ,4 4 3 -4 4 8
(20) Tanaka, K„ A m ano, R„ Kawada, K„ & Tanabe, H. (1974) J. Food Hyg. Soc. ]pn 1 5 ,1 9 5 -2 0 0
(21) Szathm ary, C„ Galacz, J., V ida, L., & A lexander,
SCOTT ET AL.: J. ASSOC. OFF. ANAL. CHEM. (VOL. 64, NO. 6, 1981) 1371
G. (1980) /. Chromatogr. 191, 327-331(22) Rom er, T. R., B oling, T. M., & M cD onald , J. L.
(1978) ]. Assoc. Off. Anal. Chem. 6 1 ,8 0 1 -8 0 8(23) M ilam a, N ., & L elièvre, H . (1979) Analusis 7,
232-235(24) Rom er, T. R., & B olin g , T. M. (1979) 93rd Annu. Mlg. Assoc. Off. Anal. Chem., O ct., 15-18 , W ash
in g to n , DC, Abstract 179
5 pr~ing ‘W o r k s h o p
1 9 8 2 April 13-15
NEW ORLEANS, LOUISIANAPlan now to attend. Contact
NICOLE F. HARDIN U.S. Food & Drug Administration
4298 Elysian Fields Ave New Orleans, LA 70122
(504/589-2471)
HERSHEL MORRIS Louisiana Dept of Agriculture
PO Box 16390-A, University Station Baton Rouge, LA 70893
(504/388-2755)
A

High Pressure Liquid Chromatographic Determination and Fluorescence Detection of Aflatoxins in Corn and Dairy FeedsHUGUETTE COHEN and MICHEL LAPOINTEAgriculture Canada, Food Production and Inspection Branch, Laboratory Services Division, Ottawa, Ontario, Canada K1A 0C5
1372 COHEN & LAPOINTE: J ASSOC. OFF. ANAL. CHEM. (VOL. 64, NO. 6, 1981)
A h ig h pressure liq u id chrom atograph ic (HPLC) m eth o d is described for the d eterm in ation o f a fla to x in s B i, B2, G i, and G 2 in a n im al feed s at le v e ls as lo w as 2.5 ppb. S am p les are extracted w ith a ce to n itr ile -w a te r and in it ia lly p u rified b y u sin g a Sep-Pak s ilica cartridge. T he a fla tox in s are then reacted w ith tr iflu oroa cetic acid and a ce to n itr ile -w a ter (1 + 1). A fter filtr a t io n , th e a fla to x in s are co m p le te ly res o lv e d on a 10 p m C2s co lu m n u s in g a radial co m pression separation system w ith an aceton itrile-w ater so lv e n t sy stem . A fla to x in s G2a, B2a, G2, and B2 w ere reported in le ss than 30 m in , u sin g flu o rescen ce d e tectio n . T he m eth od w as su c ce ss fu lly a p p lied to sam p les at le v e ls o f 20-2 .5 ppb added a fla tox in s w ith recoveries in th e range o f 8 2 -997c.
A flatoxins are secondary toxic m etabolites produced by certain strains o f fungi such as A spergillu s parasiticus and A . flavu s w h ich d evelop on num erous agricultural substrates, i.e., cereal grains and oil seed, under critical environm ental conditions o f hum idity and temperature. These m etabolites are also found as contam inants in food and feed derived from the m eals o f these seed s (1-6). Interrelations exist b etw een man, anim als, and m ycotoxin-contam inated products. The toxin can be ingested by man or can be transferred in material used to feed anim als w h ich can convert aflatoxin B! to a toxic and carcinogenic m etabolite, aflatoxin Mi (7). This m etabolite can be found in m eat and eggs (8 ).
N u m erous m ethods have been published for determ in in g aflatoxins in food or feeds. Thin layer chrom atographic procedu res, b esid es lacking accuracy, are susceptib le to degradation of the aflatoxins by ligh t and reactive vapors in air during the analysis. With the advent of high pressure liqu id chrom atography (HPLC) as a technique, the accuracy and precision of analysis has been trem endously im proved. Initially, HPLC m ethods used norm al phase silica gel (5 -10 pm ) adsorption system s to resolve in d ividual aflatoxins (7-10). H ow ever, background interferences are h igh and subsequent injections are delayed because o f the p ossib ility o f later
Received March 11,1981. Accepted June 3, 1981.
eluting peaks. On the other hand, the reverse phase system, when combined w ith the conversion of aflatoxins to their hemiacetals by tr if lu oroacetic acid (TFA)-catalyzed hydration of the term inal furan ring double bond (11, 12), provided a lower detection lim it for fluorescence detection (11, 13-21).
The method described here involves a fast and sim ple purification before H P L C analysis by reverse phase chromatography. Separations are performed by using a radial compression module w ith a 10 pm Q s column w ith acetonitrile-water as the mobile phase.
M E T H O D
Apparatus(a) W rist-action shaker.— Burre ll Corp ., P itts
burgh, P A 15219.(b) Liquid ch rom atograph .— Equipped w ith
M6000 pump, and U 6K septumless injector (Waters Associates Inc., M ilfo rd , M A 01757).
(c) Fluorescence d e tec to r .—Model 970 w ith variable wavelength excitation and 418 nm cutoff filter (Schoeffel Instrument Corp., Westwood, NJ 07675), or equivalent.
(d) Liquid chrom atographic column. — 10 cm X 8 mm Radial-Pak 10 pm Cjg cartridge used in conjunction w ith radial compression separation system (Waters Associates Inc.).
(e) L aboratory da ta s y s te m .— M odel 3354 (Hewlett-Packard Co., Avondale, P A 19311).
(f) M ix er .—Therm olyne M axi M ix.(g) Filter p a p er.— 7.0 cm, Whatman No. 2.
Reagents(a) S o lven ts .—A ll solvents were d istilled in
glass (Caledon, Georgetown, Ontario).(b) A dsorben ts.—Sep-Pak silica gel cartridge
(W aters Associates Inc.).(c) M obile phases.—Sep-Pak, benzene and
chloroform -ethanol (98 + 2); Radial-Pak Q s colum n, water-acetonitrile (1.5 + 0.5).
(d) Trifluoroacetic acid (T F A ).— PCR Research Chem icals Inc ., G ainesville , F L 32602.
(e) A flatoxin standards.— Dissolve aflatoxins to concentration of 50 pg/pL.
0004-5756/81/6406-1372-05$01.00 © Association of Official Analytical Chemists, Inc.
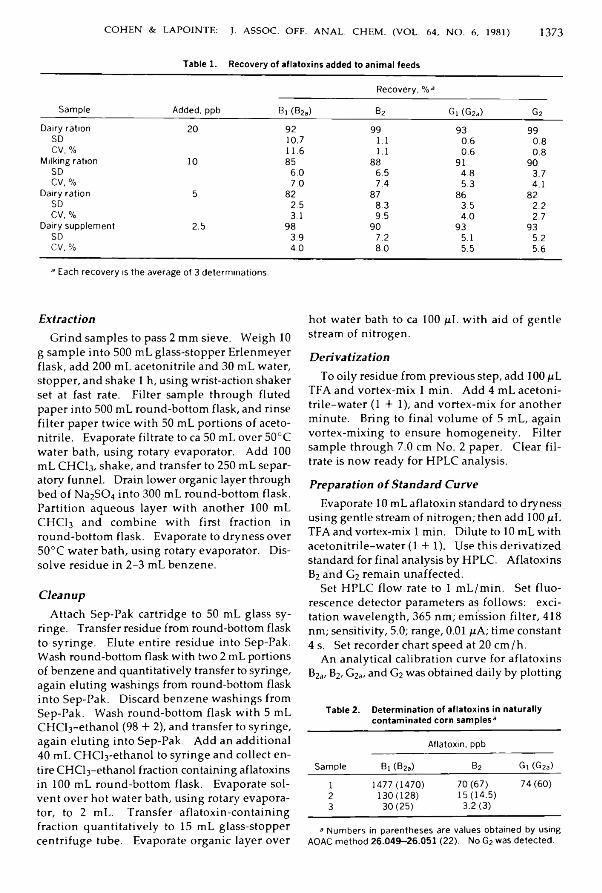
COHEN & LAPOINTE: J. ASSOC. OFF. ANAL. CHEM. (VOL. 64, NO. 6, 1981) 1373
Table 1. Recovery of aflatoxins added to animal feeds
Sample Added, ppbRecovery, %3
Bi (B2a) b2 Gi (G2a) G2
Dairy ration 20 92 99 93 99SD 10.7 1.1 0.6 0.8CV, % 11.6 1.1 0.6 0.8Milking ration 10 85 88 91 90SD 6.0 6.5 4.8 3.7CV, % 7.0 7.4 5.3 4.1Dairy ration 5 82 87 86 82SD 2.5 8.3 3.5 2.2CV. % 3.1 9.5 4.0 2.7Dairy supplement 2.5 98 90 93 93SD 3.9 7.2 5.1 5.2CV, % 4.0 8.0 5.5 5.63 Each recovery is the average of 3 determinations.
ExtractionG rind sam ples to pass 2 mm sieve. W eigh 10
g sam ple in to 500 mL glass-stopper Erlenm eyer flask, add 200 mL acetonitrile and 30 mL water, stopper, and shake 1 h, using wrist-action shaker set at fast rate. Filter sam ple through fluted paper into 500 mL round-bottom flask, and rinse filter paper tw ice w ith 50 mL portions o f acetonitrile. Evaporate filtrate to ca 50 mL over 50°C w ater bath, usin g rotary evaporator. A dd 100 mL CHCI3, shake, and transfer to 250 mL separatory funnel. Drain low er organic layer through bed o f N a2SC>4 in to 300 mL round-bottom flask. Partition aqueous layer w ith another 100 mL CHCI3 and com bine w ith first fraction in round-bottom flask. Evaporate to dryness over 50°C w ater bath, usin g rotary evaporator. D isso lv e residue in 2 -3 mL ben zene.
CleanupAttach Sep-Pak cartridge to 50 mL glass sy
ringe. Transfer residue from round-bottom flask to syringe. Elute entire residue into Sep-Pak. Wash round-bottom flask w ith two 2 mL portions of ben zene and quantitatively transfer to syringe, again eluting w ashings from round-bottom flask in to Sep-Pak. Discard b en zen e w ash in gs from Sep-Pak. W ash round-bottom flask w ith 5 mL CH Cl3-eth an o l (98 + 2), and transfer to syringe, again e lu tin g into Sep-Pak. Add an additional 40 mL CH Cl3-ethanol to syringe and collect en tire CHCl3-ethanol fraction containing aflatoxins in 100 mL round-bottom flask. Evaporate so lven t over hot water bath, u sin g rotary evaporator, to 2 mL. Transfer aflatoxin-contain ing fraction quantitatively to 15 mL glass-stopper centrifuge tube. Evaporate organic layer over
hot w ater bath to ca 100 p L w ith aid o f gen tle stream of n itrogen.Deri va tiza tion
To o ily residue from previous step, add 100 p L TFA and vortex-m ix 1 m in. A dd 4 mL aceton itrile-w ater (1 + 1), and vortex-m ix for another m inute. Bring to final vo lu m e o f 5 mL, again vortex-m ixing to ensure h om o gen eity . Filter sam ple through 7.0 cm N o. 2 paper. Clear filtrate is n ow ready for HPLC analysis.Preparation of Standard Curve
Evaporate 10 mL aflatoxin standard to dryness using gentle stream of nitrogen; then add 100 p L TFA and vortex-mix 1 min. Dilute to 10 mL w ith aceton itrile-w ater (1 + 1). U se th is derivatized standard for final analysis by HPLC. Aflatoxins B2 and G2 rem ain unaffected.
Set HPLC flo w rate to 1 m L /m in . Set flu o rescence detector parameters as follow s: excitation w a velen gth , 365 nm; em ission filter, 418 nm; sensitivity, 5.0; range, 0.01 pA; tim e constant 4 s. Set recorder chart sp eed at 20 cm /h .
A n analytical calibration curve for aflatoxins 62a/ B2, G2a/ and G2 was obtained daily by plotting
Table 2. Determination of aflatoxins in naturally contaminated corn samples3
SampleAflatoxin, ppb
Bi (B2a) b2 Gl (G2a)1 1477(1470) 70 (67) 74 (60)2 130(128) 15(14.5)3 30(25) 3.2 (3)
3 Numbers in parentheses are values obtained by using AOAC method 26.049-26.051 (22). No G2 was detected.
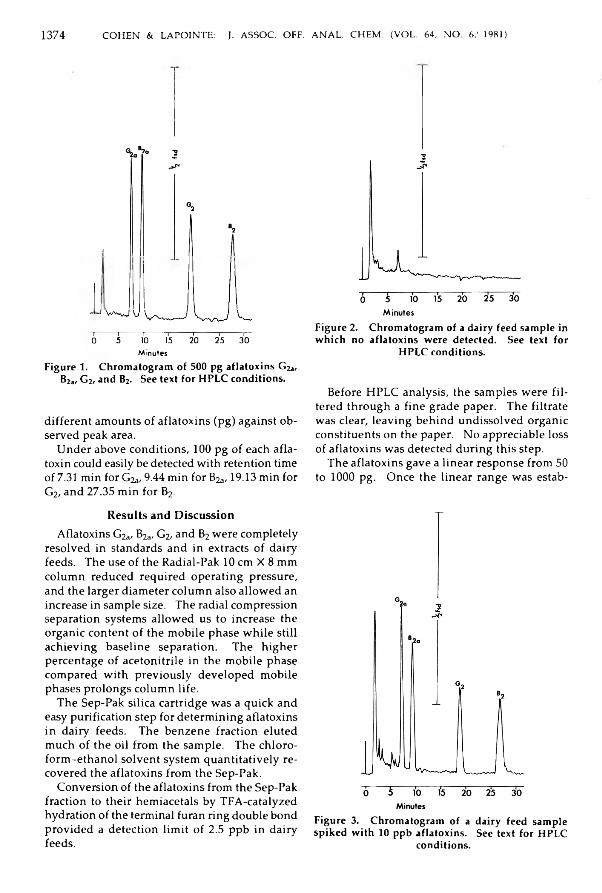
1374 COHEN & LAPOINTE: J. ASSOC. OFF. ANAL. CHEM. (VOL. 64, NO. 6,' 1981)
"1 l I I I I I0 5 10 15 20 25 30M in u t e s
F igure 1. C hrom atogram o f 500 p g a fla to x in s G2a, B2a, G 2, and B2. See text for HPLC co n d itio n s .
different am ounts o f aflatoxins (pg) against observed peak area.
U nder above conditions, 100 pg o f each afla- toxin could easily be detected w ith retention time of 7.31 m in for G2a, 9.44 m in for B2,a, 19.13 min for G2, and 27.35 m in for B2-
Results and D iscussionAflatoxins G2a, B2a, G2, and B2 were com pletely
resolved in standards and in extracts of dairy feeds. The use o f the Radial-Pak 10 cm X 8 mm colum n reduced required operating pressure, and the larger diam eter colum n also a llow ed an increase in sam ple size. The radial com pression separation system s a llow ed us to increase the organic content o f the m obile phase w h ile still ach ieving baseline separation. The h igher percentage o f acetonitrile in the m obile phase com pared w ith p reviously d evelop ed m obile phases prolongs colum n life.
The Sep-Pak silica cartridge w as a quick and easy purification step for determ ining aflatoxins in dairy feeds. The b en zen e fraction elu ted m uch o f the oil from the sam ple. The chloroform -eth an o l so lven t system quantitatively recovered the aflatoxins from the Sep-Pak.
C onversion of the aflatoxins from the Sep-Pak fraction to their hem iacetals by TFA-catalyzed hydration o f the terminal furan ring double bond provided a detection lim it o f 2.5 ppb in dairy feeds.
F igure 2. C hrom atogram o f a dairy feed sam p le in w h ic h n o a fla to x in s w ere d etected . See text for
HPLC co n d itio n s .
Before HPLC analysis, the sam ples w ere f iltered through a fin e grade paper. The filtrate was clear, leav in g b eh in d u n d isso lved organic constituents on the paper. N o appreciable loss of aflatoxins was detected during this step.
The aflatoxins gave a linear response from 50 to 1000 pg. O nce the linear range w as estab-
F igure 3. C hrom atogram o f a dairy feed sam p le sp ik e d w ith 10 pp b a fla to x in s. S ee text for HPLC
co n d itio n s .

COHEN & LAPOINTE: J. ASSOC. OFF. ANAL. CHEM. (VOL. 64, NO. 6, 1981) 1375
Figure 4. C hrom atogram o f a dairy feed sam p le sp ik ed w ith 2.5 ppb a fla to x in s. S ee text fo r HPLC
co n d itio n s .
lished, aflatoxin levels in sam ples over the range of the calibration curve could be easily estimated.
Representative recoveries o f aflatoxins added to dairy feeds at lev els o f 20 -2 .5 ppb are sh ow n in Table 1. A ll sam ples w ere don e in triplicate along w ith a separate blank. Recoveries ranged from 82 to 99%.
Table 2 g ives results obtained on naturally contam inated field sam ples, sh ow in g the presen ce o f aflatoxins in the range o f 3 .2-1477 ppb. Data in parentheses are results for the sam e sam ples, but obtained by using the AO AC official first action m ethod for corn, 26.049-26.051 (22).
Figure 1 show s a typical chromatogram of 500 pg each o f aflatoxins G2a, B2a, G2, B2. Figure 2 is a chrom atogram of a dairy feed sam ple before b ein g sp iked w ith aflatoxins, Figure 3 is a chromatogram of dairy feed sam ple spiked at 10 ppb, Figure 4 is a chromatogram of dairy feed sam ple sp iked at 2.5 ppb aflatoxins. Figure 5 is a chrom atogram of a corn sam ple sh ow in g 1477 ppb B, (B2a), 70 ppb B2, and 74 ppb Gj (G2a).
F igure 5. C hrom atogram o f a corn sa m p le sh o w in g 1477 ppb Bi (B2a), 70 ppb B2, and 74 p pb G i (G ^ ). See
text for HPLC co n d itio n s .
In conclusion , the m ethod described a llow ed detection o f aflatoxin in dairy feeds at lev els as lo w as 2.5 ppb. There w ere n o d iscernib le in terferences in the final analysis by HPLC. The radial com pression separation system operated in a reproducible m anner w ith lo n g colum n life.
References(1) A rd illo , M. (1978) L a R e v is ta I t a l . D e l le S o s ta u g e
G ro s s e LV, 98-102(2) Patterson, D. S. P., Roberts, B. A ., S h reeve, B. J.,
W rathal, A. E„ & Gitter, M. (1977) A n n . N u t r . A l im .
3 1 ,6 4 3 -6 5 0(3) Patterson, D. S. P. (1977) P u re A p p l . C h e m . 49,
1723-1731(4) H ayes, A. W. (1980) C l in . T o x ic o l. 17, 4 5 -83(5) N ew b ern e, M. P. (1974) E n v ir o n . H e a l t h P e rs p e c t.
9 ,1 -3 2(6) Rodricks, J. V., & Sto loff, L. (1977) in M y c o to x in s
in H u m a n a n d A n im a l H e a l t h , J. V. Rodricks, C. V. H esse ltin e , & M. A. M ehlm an (Eds) Pathotox P ublishers, Inc., Park Forest South, IL, pp. 63-79
(7) International Dairy Federation (1977) D oc. 98, 25-43

1376 COHEN & LAPOINTE: J. ASSOC. OFF. ANAL. CHEM. (VOL. 64, NO. 6, 1981)
(8 ) Trucksess, M. W., & Stoloff, L. (1979) J. Assoc. Off. Anal. Chem. 63,1080-1082
(9) Buchanan, J. R., Sommer, N. F., & Fortlaye, R. J. (1975) Appl. Microbiol. 30, 238-241
(10) Stubblefield, R. D„ & Shotwell, O. L. (1977) J. Assoc. Off. Anal. Chem. 60, 784-790
(11) Pons, W. A., Jr, & Franz, A. O., Jr. (1977) /. Assoc. Off. Anal. Chem. 60, 89-95
(12) Takahashi, D. M. (1977) /. Assoc. Off. Anal. Chem. 60,799-804
(13) Manabe, M., Goto, T., & Matsuura, S. (1978) Agric. Biol. Chem. 42, 2003-2007
(14) Hurst, W. J., & Toomey, P. B. (1978) J. Chromatogr. Sci. 16, 372-376
(15) Hunt, D. C , Bourdon, A. T., Wild, P. J., & Crosby,
N. T. (1978) /. Sci. Food Agric. 29, 234-238(16) Pons, W. A., Jr. (1976) J. Assoc. Off. Anal. Chem. 59,
101-105(17) Uwaifo, O. A., Emerole, O. G., & Bassir, O. (1977)
/. Agric. Food Chem. 25, 1218-1220(18) Colley, P. J., & Neal, G. E. (1979) Anal. Biochem. 93,
409-418(19) Beebe, R. M. (1978) /. Assoc. Off. Anal. Chem. 61,
1347-1352(20) Pons, W. A., Jr, & Franz, A. O., Jr. (1978) /. Assoc.
Off. Anal. Chem. 61,793-800(21) Guyon, F., Cande, M„ & Rosset, R. (1979) Rev. Fr.
Corps Gras 26(5), 217-223(22) Official Methods of Analysis (1980) 13th Ed., AOAC,
Arlington, VA

High Pressure Liquid Chromatographic Determination of Aflatoxins in SpicesMICHAEL J. AWE and JOHN L. SCHRANZStange Co., 342 N Western Ave, Chicago, 1L 60612
AWE & SCHRANZ: J. ASSOC. OFF. ANAL. CHEM. (VOL. 64, NO. 6, 1981) 1377
H ig h p ressure liq u id ch rom atograph y w ith flu o r escen ce d e tec t io n is used to d eterm in e a fla to x in in 5 co m m o n sp ices. A 10 pm m icrop articu la te s ilica g e l co lu m n is u sed w ith a d ic h lo r o m e th a n e -c y c lo h e x - a n e -a ce to n itr ile so lv e n t system to reso lve a fla tox in s Bj, G j, Bz, and G 2. T h e flu o rescen ce d etector co n ta ined a silica gel-packed flow cell. Sam ples o f black, w h ite , and red pep p er, g in g er , and n u tm eg w ere ex tracted accord in g to a p re v io u s ly p u b lish e d m eth od . R ecov er ies from a fla to x in -fr ee sam p les o f w h ite p ep p er , g in g e r , and red p ep p er sp ik e d w ith 1 -5 0 pg a f la to x in /k g ranged from 64 to 92%.
D uring the last decade, the search for aflatoxins in agricultural products has expanded to spices (1-6). The analytical methods employed have included 2-dimensional th in layer chromatography (T LC ) and m inicolum n detection. Both techniques allow for sensitive analysis; however, recent advances in high pressure liquid chromatography (H P LC ) w ith fluorescence detection have shown that better separation and quantitation can be obtained w ith this technique (7-9). Pons and Franz (7, 10, 11) reported that near baseline resolution of aflatoxins B j, B2, G j, and G 2 was obtained by using a microparticulate silica gel colum n w ith a chloroform- or dichloro- methane-based solvent system. Sensitive fluorescence detection was achieved w ithout the formation of hemiacetal derivatives (8) by using a detector w ith the silica gel-packed flowcell first introduced by Panalaks and Scott (9).
A method of analysis for aflatoxin designed especially for spices was lacking until Suzuki et a l. (1) developed one based in part on the work of Pons et al. w ith mixed feed (12). The method invo lved extraction of the ground spice w ith dichlorom ethane and both column chromatographic cleanup and lead acetate treatment of the extract. Recently, Stoloff and Trucksess (4) in troduced an im proved version of this method designed specifically for ginger root and ginger oleoresin. Th is version added 2 cleanup steps using hexane and carbon tetrachloride, performed before the column chromatographic step. T h is resulted in a much cleaner fina l extract that
Received May 13,1981. Accepted June 16,1981.
fo r the first time allowed for 1-dimensional T L C .
The purpose of this investigation is to determ ine if the extraction and cleanup procedure of Sto loff and Trucksess (4), combined w ith the H P LC separation and detection system described by Pons (11), is applicable to the determination of aflatoxins in ginger and 4 other spices. The spices analyzed were those in w h ich a large in terest has been reported and w hich have an in cidence of aflatoxin. Flannigan and H u i (5) tested 23 different spices for the presence of af- latoxin-producing strains of A sp e rg il lu s f la v u s and found them only in ginger, w hite and red pepper, and Jamaican pepper. Scott and Kennedy(2) analyzed 24 samples of black and w hite pepper and did not find any aflatoxin; however, they d id detect B i and traces of B2 and G] in one third of the cayenne pepper and in a ll of the Indian ch ili powder analyzed. Suzuki et al. (1) analyzed 13 d ifferent spices and found aflatoxins G i and G 2 in 3 of 7 samples o f black pepper, and Bi and B2 in 3 of 5 samples of nutmeg. One sample of ce lery seed contained 3.7 p g G i /kg. Beljaars et al. (3) detected aflatoxin in 30 of 40 commercial nutmeg samples in concentrations of 1.0-23.2 p g B j/kg . A flatoxin was detected in the majority of 1978 Cochin ginger root lots analyzed by members of the Am erican Spice Trade Association (4). Therefore, we decided to test our procedure on samples of black, w h ite , and red pepper, g inger, and nutmeg.
The extraction and cleanup procedures are identical to those described by Stoloff and Trucksess (4), except for a slight modification of the colum n chromatographic step.
M E T H O D
ApparatusEquipm ent specified is not restrictive ; c iher
suitable equipment can be substituted.(a) L iq u id c h r o m a to g r a p h .— Nester-Faust Model
1210 w ith screw-driven constant displacement pump, septum-sealed injector, and Varian Fluo- richrom fluorescence detector equipped w ith7-54 and 7-60 excitation filters (360 nm) and 430 nm interference emission filte r . Detector
0004-5756/81/6406-1377-06*01.00 © A s s o c i a t io n o f O f f i c ia l A n a l y t i c a l C h e m i s t s , I n c .

1378 AWE & SCHRANZ: J. ASSOC. OFF. ANAL. CHEM. (VOL. 64, NO. 6, 1981)
flo w ce ll w as purchased prepacked by m anufacturer w ith LiChrosorb 60 silica gel (30 pm , E. M erck, Darmstadt, Germany).
(b) C olum n.— Waters A ssociates Porasil silica gel (10 pm ), 3.9 mm id X 30 cm; 2.1 mm id X 5 cm guard colum n packed w ith LiChrosorb 60 silica g e l (30 pm ) w as fitted b etw een injector and analytical colum n.
(c) Recorder.— Hewlett-Packard M odel 7123A, 0.32 cm /m in chart speed.
(d) In teg ra to r .— H ew lett-P ackard M odel 3370B.
(e) Cleanup colum ns.— 10 mm id X 300 m m , T eflon stopcock, 100 mL reservoir (055-723, Curtin M atheson Scientific, Elk Grove V illage, IL 60007).
(f) Concentrator tube.— 4 mL (K570050, Kontes, V in elan d , NJ 08630).
(g) Septum -sealed reaction v ia l.— 5 mL (6604, A lltech A ssociates, D eerfield , IL 60015).
Reagents(a) Solvents.— Reagent grade dichlorom ethane,
cyclohexane, acetonitrile, m ethanol, hexane, carbon tetrachloride, ben zen e , anhydrous ethyl ether, absolute ethanol, chloroform , and spec- tro-quality m ethanol.
(b) H PLC elu tion so lv e n t.— Prepare from w ater-saturated d ich lo ro m eth a n e-cy c lo h ex - ane-acetonitrile (25 + 7.5 + 1.0) w ith 0.5% added absolute ethanol (7). Am ount o f ethanol needed to obtain optim um resolu tion can be varied to com pensate for differences am ong silica gel colum ns (11 ).
(c) S ilica g e l.— E. Merck 7734, 70-230 m esh. Dry 1 h at 130°C.
(d) A flatoxin stan dards.— Prepare from in d ividual crystalline aflatoxins (Supelco, Inc., Bel- lefonte, PA 16823). D isso lve ca 5 m g crystals in 4 separate 1 L flasks containing 1 L spectro-grade m ethanol. D eterm ine actual concentration by m easuring specific absorbance m axima for each aflatoxin b etw een 420 and 210 nm usin g m olar absorptivities g iven in secs 26.006 and 26.007(13). Prepare HPLC standard solution by using a microliter syringe to transfer sufficient quantity of aflatoxin solutions prepared above to reaction vial to produce aflatoxin standard containing 100 ng Bi, 200 n g G i, 20 n g B2, and 40 n g G2 /m L. C om pletely evaporate m ethanol in hot water bath under stream of nitrogen . D isso lve aflatoxin in 2.0 mL HPLC m obile phase, and seal vial.
(e) M eth a n o C N a C l so lu tion .— Add 100 mL reagent grade m ethanol to 100 mL 5% NaCl in
d istilled water. Store in stoppered Erlenm eyer flask.
(f) Sodium sulfate.— Anhydrous, granular (MCB SX760).Extraction
Extraction and cleanup steps are derived from ref. 4.
W eigh 25 g sp ice (ground to pass U.S. N o . 20 m esh sieve) into 500 mL Erlenm eyer flask, add12.5 mL saturated NaCl solu tion and 125 mL d ich lorom ethane (CH2CI2), secure flask stopper w ith m asking tape, and shake 30 m in on m echanical shaker. G ravity-filter 10 mL of th is solution through Whatman No. 4 paper. Recycle the 10 mL filtrate through the filter and then filter 50 mL of so lu tion and co llect filtrate in graduated cylinder. Transfer filtrate to 250 mL glass-stopper Erylenmeyer flask. (This recycling pretreats filter paper and produces cleaner extract.) Add b oiling chips to flask and evaporate extract to near dryness in hot w ater bath.Cleanup
Add 100 mL m eth an ol-N aC l so lu tion and 50 mL hexane to Erlenm eyer flask con ta in in g residue, secure stopper w ith masking tape, and shake 10 m in on m echanical shaker. Transfer m ixture to 250 mL separatory funnel and let stand 5 m in. Drain low er layer into another 250 mL separatory funnel. Add 50 mL CCI4 to th is secon d fu n n el and shake v igorou sly ca 1 m in. Discard low er layer. Repeat partition w ith 25 ml CCI4. Add 50 mL CH 2CI2 to retained layer and shake ca 1 m in. Drain CH2CI2 layer into 125 mL Erlenmeyer flask and repeat extraction w ith another 25 mL CH2CI2. C om bine CH 2CI2 extracts, add b o ilin g chips to flask, and evaporate to near dryness in hot water bath.Column Chromatography
Place ball o f glass w oo l in bottom o f chrom atographic colum n, and add ca 1 cm anhydrous N a2S0 4. Add CH 2CI2 until colum n is one-third full. W eigh 2.0 g 70-230 m esh silica g e l in to 30 mL beaker. Slurry gel w ith ca 15 mL CH2C12 and com pletely transfer to colum n. After gel settles, tap in ca 2 cm layer of anhydrous Na2S 0 4. Drain CH2CI2 to top of N a2SC>4 and inspect gel layer for air bubbles. If any are present, rem ove by filling reservoir halfw ay w ith CH2CI2 and forcing bubbles out w ith com pressed air. Drain CH2CI2 to top o f N a2S 0 4.
D isso lve extract in 5 mL CH2CI2 and add extract so lu tion to colum n. W ash sides o f flask w ith tw o 5 mL portions o f CH2C12 and add
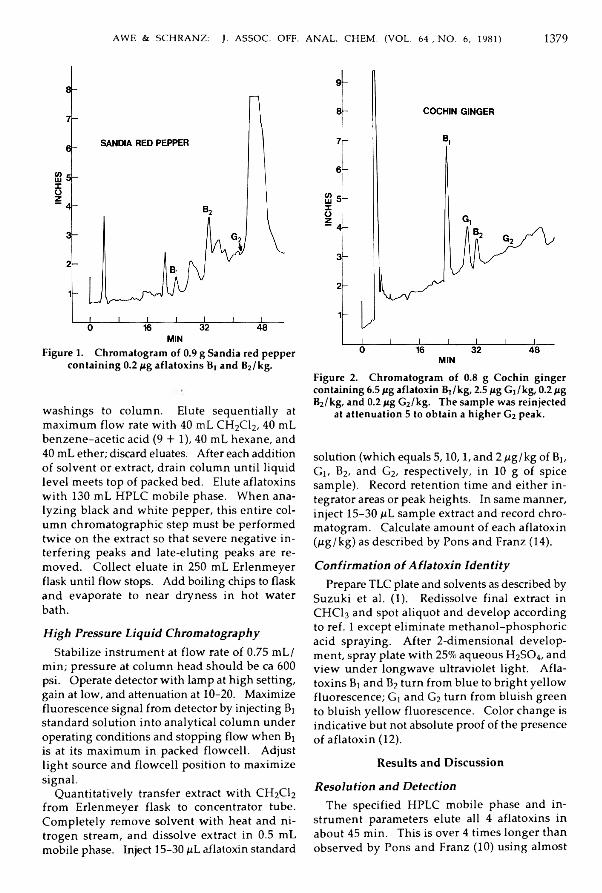
AWE & SCHRANZ: J. ASSOC. OFF. ANAL. CHEM. (VOL. 64 , NO. 6, 1981) 1379
Figure 1. C hrom atogram o f 0.9 g Sandia red pepper co n ta in in g 0.2 fig a fla to x in s Bj and B2/k g .
w a sh in g s to colum n. Elute sequentia lly at m axim um flo w rate w ith 40 mL CH2CI2, 40 mL b en zen e-a cetic acid (9 + 1), 40 mL hexane, and 40 mL ether; discard eluates. After each addition o f so lv en t or extract, drain co lum n u n til liquid lev e l m eets top o f packed bed. Elute aflatoxins w ith 130 mL HPLC m obile phase. W hen analy z in g black and w h ite pepper, th is entire co lum n chrom atographic step m ust be perform ed tw ice on the extract so that severe n egative in terfering peaks and late-elu ting peaks are rem oved . C ollect eluate in 250 mL Erlenm eyer flask until flow stops. Add boiling chips to flask an d evaporate to near dryness in hot w ater bath.High Pressure Liquid Chromatography
Stabilize instrum ent at f lo w rate o f 0.75 m L/ m in; pressure at co lum n head sh ou ld be ca 600 psi. Operate detector w ith lamp at h igh setting, gain at low , and attenuation at 10-20. Maximize fluorescence signal from detector by injecting Bj standard so lu tion in to analytical colum n under operating conditions and stopping flow w h en Bi is at its m axim um in packed flow cell. Adjust lig h t source and flo w cell position to m axim ize signal.
Q uantitatively transfer extract w ith CH2CI2 from Erlenm eyer flask to concentrator tube. C om p letely rem ove so lven t w ith heat and n itrogen stream , and d isso lve extract in 0.5 mL m obile phase. Inject 15-30 pL aflatoxin standard
F igure 2. C hrom atogram o f 0.8 g C och in g in g er con ta in in g 6.5 fig aflatoxin B j/k g , 2.5 fig G j/k g , 0.2 fig B2/k g , and 0.2 fig G2/k g . T h e sam p le w as reinjected
at a tten u a tion 5 to o b ta in a h ig h er G2 peak.
solution (w hich equals 5 ,1 0 ,1 , and 2 f ig /k g of Bi, G i, B2, and G2, respectively , in 10 g o f spice sam ple). Record retention tim e and either in tegrator areas or peak heights. In sam e m anner, inject 15-30 fiL sam ple extract and record chrom atogram . Calculate am ount o f each aflatoxin ( f ig /k g ) as described by Pons and Franz (14).Confirmation of Aflatoxin Identity
Prepare TLC plate and solvents as described by Suzuki et al. (1). R edissolve final extract in CHCI3 and spot aliquot and d ev elop according to ref. 1 except elim inate m eth an ol-p h osp h oric acid spraying. After 2-d im ensional d ev elop m ent, spray plate w ith 25% aqueous H 2SO4, and v ie w under lon g w ave u ltraviolet ligh t. A flatoxins Bi and B2 turn from blu e to bright y e llo w fluorescence; Gi and G2 turn from b lu ish green to b lu ish y e llo w fluorescence. Color change is indicative but not absolute proof of the presence o f aflatoxin (12 ).
Results and D iscussion
Resolution and DetectionThe specified HPLC m obile phase and in
strum ent param eters elu te all 4 aflatoxins in about 45 m in. This is over 4 tim es lon g er than observed by Pons and Franz (10) u sin g alm ost
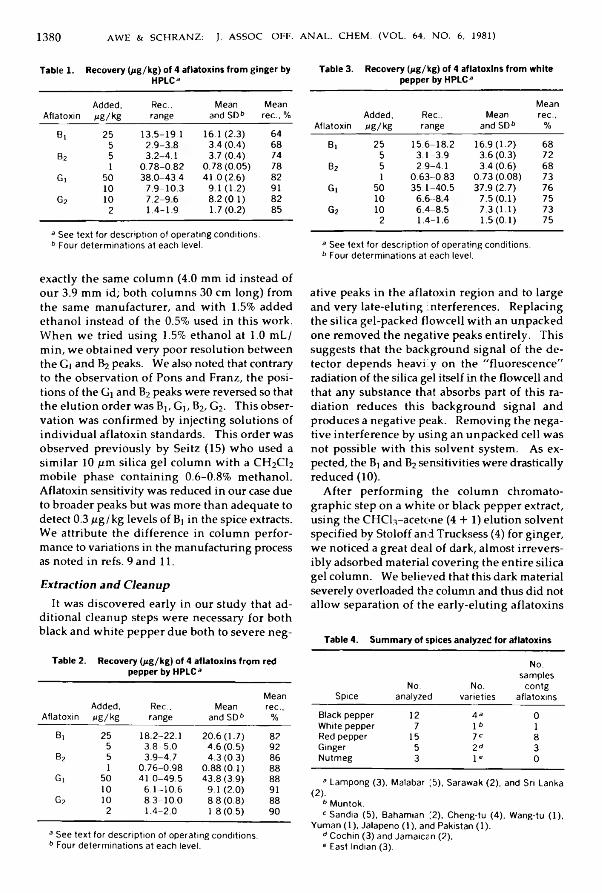
1380 AWE & SCHRANZ: J. ASSOC. OFF. ANAL. CHEM. (VOL. 64, NO. 6, 1981)
Table 1. Recovery ( p g / k g ) of 4 aflatoxins from ginger by Table 3. Recovery { p g / k g ) of 4 aflatoxins from white HPLC 3 pepper by HPLC a
AflatoxinAdded,A g /kg
Ree.,range
Mean and SD6
Meanree., %
Bj 25 13.5-19.1 16.1 (2.3) 645 2 .9 -3 8 3.4 (0.4) 68
b2 5 3.2-4.1 3.7 (0.4) 741 0.78-0.82 0.78(0.05) 78
Gi 50 38.0-43.4 41.0 (2.6) 8210 7.9-10.3 9.1 (1.2) 91
G2 10 7 .2 -9 6 8.2 (0.1) 822 1.4-1.9 1.7 (0.2) 85
a See text for description of operating conditions. b Four determinations at each level.
AflatoxinAdded,A g /kg
Ree.,range
Mean and SD6
Meanree.,
%Bi 25 15.6-18.2 16.9(1.2) 68
5 3.1-3.9 3.6 (0.3) 72b2 5 2.9-4.1 3.4(0.6) 68
1 0.63-0.83 0.73 (0.08) 73Gi 50 35.1-40.5 37.9 (2.7) 76
10 6 .6 -8 4 7.5 (0.1) 75G2 10 6.4-8.5 7.3(1.1) 73
2 1.4-1.6 1.5 (0.1) 753 See text for description of operating conditions. b Four determinations at each level.
exactly th e sam e colum n (4.0 m m id instead of our 3.9 mm id; both co lum ns 30 cm lon g) from th e sam e m anufacturer, and w ith 1.5% added eth an ol instead o f the 0.5% used in th is work. W hen w e tried u sin g 1.5% ethan ol at 1.0 m L/ m in, w e obtained very poor resolu tion betw een the Gi and B2 peaks. We also noted that contrary to the observation o f Pons and Franz, the positions o f the Gi and B2 peaks were reversed so that th e elu tion order w as Bj, Gi, B2, G2. This observation w as confirm ed by injecting so lu tion s of in d iv id u a l aflatoxin standards. This order w as ob served p reviously by Seitz (15) w h o used a sim ilar 10 pm silica ge l colum n w ith a CH2C12 m obile phase conta in ing 0 .6 - 0 .8 % m ethanol. Aflatoxin sensitivity w as reduced in our case due to broader peaks but w as m ore than adequate to detect 0.3 p g /k g levels o f Bj in the spice extracts. W e attribute the d ifference in colum n perform ance to variations in the manufacturing process as noted in refs. 9 and 11.Extraction and Cleanup
It w as discovered early in our study that additional cleanup steps w ere necessary for both black and w h ite pepper due both to severe n eg
Table 2. Recovery (pg/kg) of 4 aflatoxins from red pepper by HPLC3
MeanAflatoxin
Added,A g /kg
Ree.,range
Mean and SDb
ree.,%
Bi 25 18.2-22.1 20.6(1.7) 825 3.8-5.0 4.6 (0.5) 92
b2 5 3.9-4.7 4.3 (0.3) 861 0.76-0.98 0.88 (0.1) 88Gi 50 41.0-49.5 43.8(3.9) 88
10 6.1-10.6 9.1 (2.0) 91G2 10 8.3-10.0 8.8 (0.8) 88
2 1.4-2.0 1.8 (0.5) 903 See text for description of operating conditions. b Four determinations at each level.
ative peaks in the aflatoxin region and to large and very late-elu ting interferences. R eplacing the silica gel-packed flo w cell w ith an unpacked one rem oved the negative peaks entirely . This suggests that the background signal o f the d e tector d ep en d s h eavily on the "fluorescence" radiation o f the silica gel itself in the flow cell and that any substance that absorbs part o f th is rad iation reduces this background sign al and produces a negative peak. R em oving the n eg ative interference by usin g an unpacked ce ll w as not possib le w ith th is so lven t system . A s expected, the Bi and B2 sensitivities were drastically reduced ( 10 ).
A fter p erform ing th e co lu m n chrom atographic step on a w h ite or black pepper extract, using the CHCl^-acetone (4 + 1) elu tion solven t specified by Stoloff and Trucksess (4) for ginger, w e noticed a great deal o f dark, alm ost irreversib ly adsorbed material coverin g the entire silica gel colum n. We believed that this dark material severely overloaded the colum n and thus did not allow separation o f the early-elu ting aflatoxins
Table 4. Summary of spices analyzed for aflatoxins
SpiceNo.
analyzedNo.
varieties
No.samples
contgaflatoxins
Black pepper 12 4 3 0White pepper 7 1« 1Red pepper 15 7 C 8Ginger 5 2 d 3Nutmeg 3 I e 03 Lampong (3). Malabar (5), Sarawak (2), and Sri Lanka (2).b Muntok.c Sandia (5), Bahamian (2), Cheng-tu (4). Wang-tu (1),
Yuman (1), Jalapeno (1). and Pakistan (1). d Cochin (3) and Jamaican (2). e East Indian (3).
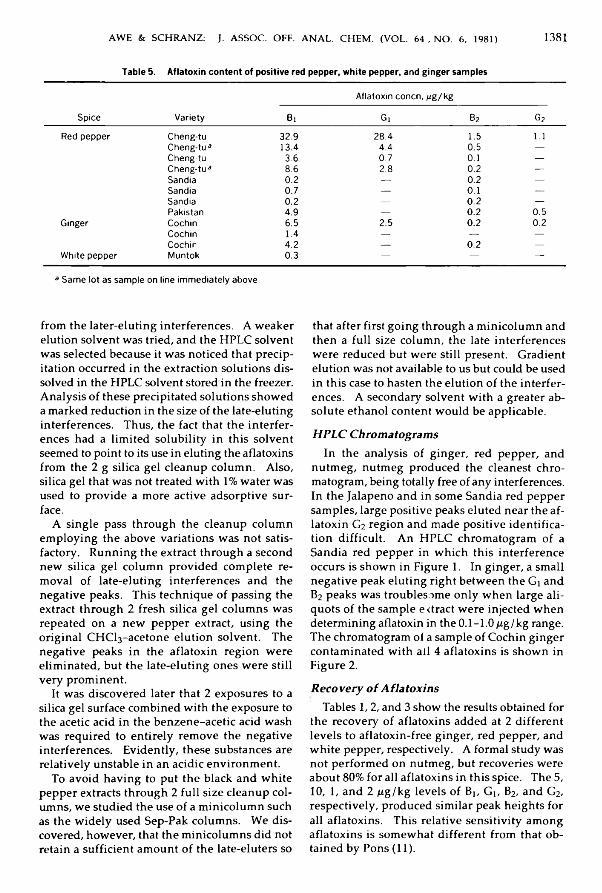
AWE & SCHRANZ: J. ASSOC. OFF. ANAL. CHEM. (VOL. 64 , NO. 6, 1981) 1381
Table 5. Aflatoxin content of positive red pepper, white pepper, and ginger samples
Spice VarietyAflatoxin concn, pg/kg
Bi Gi b2 G2
Red pepper Cheng-tu 32.9 28.4 1.5 1.1Cheng-tu3 13.4 4.4 0.5 —Cheng-tu 3.6 0.7 0.1 —Cheng-tu3 8.6 2.8 0.2 —Sandia 0.2 — 0.2 —Sandia 0.7 — 0.1 —Sandia 0.2 — 0.2 —Pakistan 4.9 — 0.2 0.5
Ginger Cochin 6.5 2.5 0.2 0.2Cochin 1.4 — — —Cochin 4.2 — 0.2 —
White pepper Muntok 0.3 — — —3 Same lot as sample on line immediately above.
from the later-eluting interferences. A w eaker elution solven t was tried, and the HPLC solven t w as selected because it w as noticed that precipitation occurred in the extraction so lu tion s d issolved in the HPLC solven t stored in the freezer. A n alysis o f these precipitated so lu tion s sh ow ed a marked reduction in the size of the late-eluting interferences. Thus, the fact that th e interferen ces had a lim ited so lu b ility in th is so lven t seem ed to point to its use in eluting the aflatoxins from the 2 g silica ge l cleanup co lum n. A lso, silica ge l that was not treated w ith 1% w ater was used to provide a m ore active adsorptive surface.
A s in g le pass through the cleanup colum n em p lo y in g the above variations w as not satisfactory. R u nning th e extract through a second n ew silica ge l colum n provided com p lete rem oval o f late-elu tin g interferences and the n egative peaks. T his techn ique o f passing the extract through 2 fresh silica ge l co lum ns was repeated on a n ew pep per extract, u sin g the original CH Cl3-aceton e elu tion so lven t. The n egative peaks in the aflatoxin reg ion w ere elim inated , but the la te-elu tin g on es w ere still very prom inent.
It w as d iscovered later that 2 exposures to a silica ge l surface com bined w ith the exposure to the acetic acid in the b en zen e-a cetic acid w ash w as required to en tire ly rem ove the n egative interferences. E vidently, th ese substances are relatively unstable in an acidic environm ent.
To avoid h av in g to put th e black and w h ite pep per extracts through 2 fu ll s iz e cleanup co lum ns, w e studied th e use o f a m in ico lu m n such as th e w id e ly used Sep-Pak colum ns. W e d iscovered, how ever, that the m inicolum ns did not retain a su ffic ien t am ount o f th e late-eluters so
that after first g o in g through a m in ico lu m n and then a fu ll s ize colum n, the late interferences w ere reduced but w ere still present. G radient elu tion w as not available to us but could be used in th is case to hasten the elu tion o f the interferences. A secondary so lven t w ith a greater abso lu te ethan ol content w ou ld be applicable.HPLC Chromatograms
In the analysis o f g in ger, red pepper, and n u tm eg, nutm eg produced the cleanest chromatogram, being totally free o f any interferences. In th e Jalapeno and in som e Sandia red pepper sam ples, large positive peaks elu ted near the aflatoxin G2 region and m ade p ositive iden tification d ifficu lt. A n HPLC chrom atogram o f a Sandia red pepper in w h ich th is interference occurs is sh ow n in Figure 1. In g in ger, a sm all n eg ative peak elu tin g right b etw een the Gi and B2 peaks w as troublesom e o n ly w h en large a liquots o f the sam ple e<tract w ere injected w h en determ ining aflatoxin in the 0 .1- 1.0 /xg/kg range. The chromatogram of a sam ple o f Cochin ginger contam inated w ith all 4 aflatoxins is sh ow n in Figure 2.Recovery o i Aflatoxins
Tables 1 ,2 , and 3 show the results obtained for th e recovery o f aflatoxins added at 2 d ifferent le v e ls to aflatoxin-free g in ger, red pepper, and w h ite pepper, respectively. A formal study was n ot perform ed on nutm eg, but recoveries w ere about 80% for all aflatoxins in th is spice. The 5, 10, 1, and 2 /xg/kg lev e ls o f Bj, G i, B2, and G2, respectively , produced sim ilar peak h eigh ts for all aflatoxins. This relative sen sitiv ity am ong aflatoxins is som ew hat d ifferent from that obtained by Pons (11).
1 382 AWE & SCHRANZ: J. ASSOC. OFF. ANAL. CHEM. (VOL. 64 . NO. 6, 1981)
Table 4 lists the number and type of spices analyzed in this study, and the number of samples w ith positive aflatoxin results. Table 5 lists the concentrations of the ind iv idua l aflatoxins found in the positive samples. As expected, the incidence of aflatoxin contamination was highest in red pepper and ginger. The w hite pepper sample containing 0.3 jtg B j /kg is the first positive result reported for aflatoxin in this spice.
AcknowledgmentThe authors thank Fred W . Breitbeil, III, De-
Paul U n iversity , Chicago, IL for his assistance in the literature search.
References(1) Suzuki, J. I., Dainius, B., & Kilbuck, J. H. (1973) l.Food Sci. 38,949-950(2) Scott, P. M., & Kennedy, B. P. C. (1973) /. Assoc. Off.
Anal. Cliem. 56,1452-1457(3) Beljaars, P. R„ Schumans, J„ & Koken, P. J. (1975)
/. Assoc. Off. Anal. Chem. 58, 263-271
(4) Stoloff, L„ & Trucksess, M. W. (1980) /. Assoc. Off. Anal. Chem. 63,1052-1054
(5) Flannigan, B., & Hui. S. C. (1976) J. Appl. Bacterial. 41,411-418
(6) Seenappa, M„ & Kempton, A. G. (1980) J. Environ. Sci. Health 3,219-231
(7) Pons, W. A., Jr (1976) J. Assoc. Off. Anal. Chem. 59, 101-105
(8) Takahashi, D. M. (1977) J. Assoc. Off. Anal. C h e m .
60,799-804(9) Panalaks, T., & Scott, P. M. (1977) J. Assoc. Off. Anal.
Chem. 60,583-589(10) Pons, W. A., Jr, & Franz, A. O., Jr (1978) /. Assoc.
Off. Anal. Chem. 61,793-800(11) Pons, W. A., Jr (1979) /. Assoc. Off. Anal. Chem. 62,
586-594(12) Pons, W. A., Jr, Cucullu, A.F., & Lee, L. S. (1971)
in Proceedings of SOS/70, G. F. Stewart & C. L. Wiley (Eds), Institute of Food Technologists, Chicago, IL, pp. 705-711
(13) Official Methods of Analysis (1980) 13th Ed., AOAC, Arlington, VA
(14) Pons, W. A., Jr, & Franz, A. O., Jr (1977) J. Assoc. Off. Anal. Chem. 60, 89-95
(15) Seitz, L. M. (1975) /. Chromatogr. 104,81-89
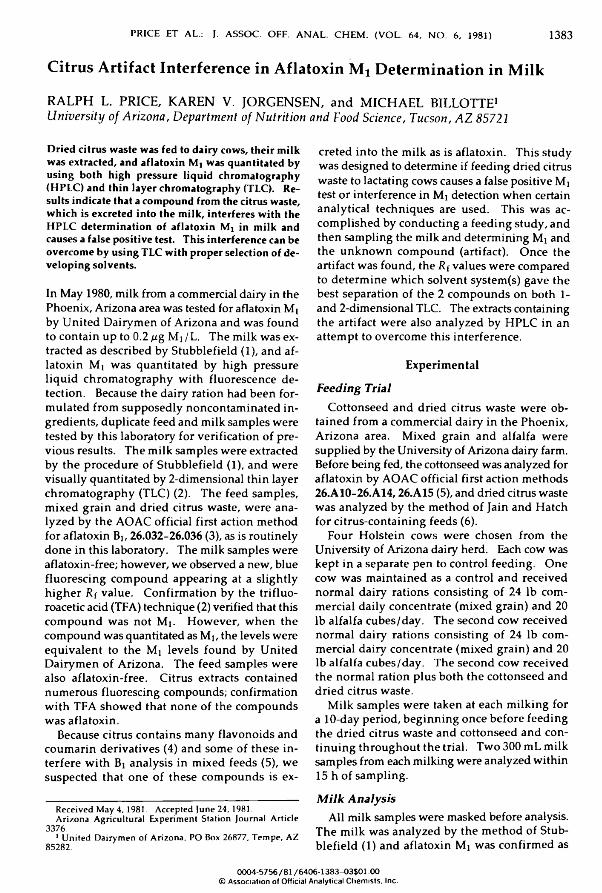
PRICE ET AL.: J. ASSOC. OFF. ANAL. CHEM. (VOL. 64, NO. 6, 1981) 1383
Citrus Artifact Interference in Aflatoxin M! Determination in MilkRALPH L. PRICE, KAREN V. JORGENSEN, and MICHAEL BILLOTTE* 1University of Arizona, Department of Nutrition and Food Science, Tucson, AZ 85721D ried c itru s w a ste w a s fed to d a iry co w s, th e ir m ilk w a s extracted , and a fla to x in M i w as q u an tita ted by u s in g b o th h ig h pressure liq u id ch rom atograph y (H PLC ) and th in la y er ch rom atograph y (TLC). R esu lts in d ica te that a com p ou n d from the citrus w aste , w h ic h is excreted in to th e m ilk , in terferes w ith th e H PLC d eterm in a tio n o f a fla to x in M i in m ilk and ca u ses a fa lse p o s it iv e test. T h is in terferen ce can be o v e rc o m e b y u s in g TLC w ith proper se le c t io n o f d e v e lo p in g so lv e n ts .
In May 1980, m ilk from a commercial dairy in the Phoenix, Arizona area was tested for aflatoxin Mi by U n ited D airym en o f A rizona and w as found to contain up to 0.2 jig M i/L . The m ilk w as extracted as described by Stubblefield (1), and aflatoxin M i w as quantitated by h igh pressure liq u id chrom atography w ith fluorescence d etection . Because the dairy ration had b een form ulated from supposed ly noncontam inated in gredients, duplicate feed and m ilk sam ples were tested by th is laboratory for verification o f prev io u s results. The m ilk sam ples w ere extracted b y th e procedure o f S tubblefield (1), and w ere visually quantitated by 2-dim ensional thin layer chrom atography (TLC) (2). The feed sam ples, m ixed grain and dried citrus w aste, w ere analy zed by th e AO AC official first action m ethod for aflatoxin Bj, 26.032-26.036 (3), as is routinely d on e in this laboratory. The m ilk sam ples were aflatoxin-free; how ever, w e observed a new , blue flu oresc in g com pound appearing at a s ligh tly h ig h er R f value. C onfirm ation by the trifluo- roacetic acid (TFA) technique (2) verified that this com p ound w as not Mi- H ow ever, w h en the com pound was quantitated as M i, the levels were eq u iva len t to the M i lev e ls fou n d by U n ited D airym en o f Arizona. The feed sam ples w ere also aflatoxin-free. Citrus extracts contained num erous fluorescing compounds; confirmation w ith TFA sh ow ed that n on e o f the com pounds w as aflatoxin.
Because citrus contains m any flavon oids and coum arin derivatives (4) and som e o f these in terfere w ith Bi analysis in m ixed feeds (5), w e su sp ected that on e o f these com pounds is ex
Received May 4,1981. Accepted June 24,1981.A rizona A gricultural Experim ent Station Journal Article
3376.1 U nited Dairym en of Arizona, PO Box 26877, Tem pe, AZ 85282.
creted in to the m ilk as is aflatoxin . T his study was designed to determ ine if feeding dried citrus w aste to lactating cow s causes a false positive Mi test or interference in M t detection w h en certain analytical techn iques are used. This w as accom p lish ed by conducting a feed in g study, and then sam pling the m ilk and determ ining M i and th e u n k n ow n com pound (artifact). O nce the artifact w as found, the R f values w ere compared to determ ine w h ich so lven t system (s) gave the best separation o f the 2 com pounds on both 1- and 2-dim ensional TLC. The extracts containing th e artifact w ere also analyzed by HPLC in an attem pt to overcom e this interference.
ExperimentalFeeding Trial
C ottonseed and dried citrus w aste w ere obtained from a com m ercial dairy in the P hoen ix, A rizona area. M ixed grain and alfalfa w ere supplied by the University o f Arizona dairy farm. Before bein g fed, the cottonseed was analyzed for aflatoxin by AOAC official first action m ethods 26.A10-26.A14,26.A15 (5), and dried citrus waste w as analyzed by the m ethod o f Jain and H atch for citrus-contain ing feeds (6).
Four H olstein cow s w ere ch osen from the University of Arizona dairy herd. Each cow was kept in a separate p en to control feed in g . O ne cow w as m aintained as a control and received norm al dairy rations consisting o f 24 lb com m ercial daily concentrate (m ixed grain) and 20 lb alfalfa cu b es/d ay . The second cow received norm al dairy rations con sistin g o f 24 lb com m ercial dairy concentrate (m ixed grain) and 20 lb alfalfa cu b es/d ay . The secon d cow received the norm al ration p lus both the cottonseed and dried citrus waste.
M ilk sam ples w ere taken at each m ilk in g for a 10-day period, b eg in n in g once before feed in g th e dried citrus w aste and cottonseed and contin u in g throu ghout the trial. T w o 300 mL m ilk sam ples from each m ilking were analyzed w ith in 15 h o f sam pling.Milk Analysis
A ll m ilk sam ples were masked before analysis. T he m ilk w as analyzed by the m ethod o f Stubb le fie ld (1) and aflatoxin M i w as confirm ed as
0004-5756/81 /6406-1383-03$01.00 © A s s o c i a t io n o f O f f i c ia l A n a l y t i c a l C h e m i s t s , I n c .
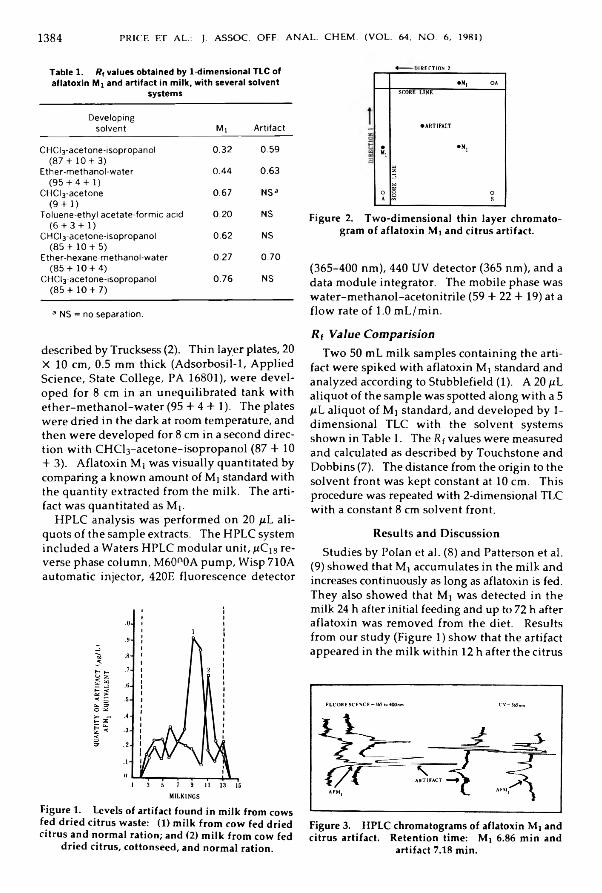
1384 PRICE ET AL.: J. ASSOC. OFF. ANAL. CHEM. (VOL. 64, NO. 6, 1981)
Table 1. Rf values obtained by 1-dimensional TLC of aflatoxin Mi and artifact in milk, with several solvent
systems
Developingsolvent Mi Artifact
CHCl3 -acetone-lsopropanol (87+ 10 + 3)
0.32 0.59
Ether-methanol-water (95 + 4 + 1 )
0.44 0.63
CHCl3 -acetone(9 + 1 )
0.67 NSa
Toluene-ethyl acetate-formic acid (6 + 3 + 1 )
0.20 NS
CHCL-acetone-isopropanol (85+ 10 + 5)
0.62 NS
Ether-hexane-methanol-water (85+ 10 + 4)
0.27 0.70
CHCl3 -acetone-lsopropanol (8 5 + 1 0 + 7)
0.76 NS
a NS = no separation.
described by Trucksess (2). T h in layer plates, 20 X 10 cm, 0.5 mm thick (Adsorbosil-1, Applied Science, State College, PA 16801), were developed for 8 cm in an unequilibrated tank w ith ether-m ethanol-water (95 + 4 + 1 ) . The plates were dried in the dark at room temperature, and then were developed for 8 cm in a second direction w ith C H C l3-acetone-isopropanol (87 + 10 + 3). A flatoxin M i was v isu a lly quantitated by comparing a known amount of M i standard w ith the quantity extracted from the m ilk . The artifact was quantitated as M i.
H P L C analysis was performed on 20 p L a liquots of the sample extracts. The H P L C system included a Waters H P L C modular un it, ftC is reverse phase colum n, M 60°0A pump, Wisp 710A automatic injector, 420E fluorescence detector
Figure 1. Levels of artifact found in milk from cows fed dried citrus waste: (1) milk from cow fed dried citrus and normal ration; and (2) milk from cow fed
dried citrus, cottonseed, and normal ration.
♦ DIRECTION 2
Figure 2. Two-dimensional thin layer chromatogram of aflatoxin Mi and citrus artifact.
(365-400 nm ), 440 U V detector (365 nm ), and a data module integrator. The mobile phase was water-m ethanol-acetonitrile (59 + 22 + 19) at a flo w rate of 1.0 m L/m in .
R f V a l u e C o m p a r i s i o nTw o 50 m L m ilk samples containing the arti
fact were spiked w ith aflatoxin M i standard and analyzed according to Stubblefield (1). A 20 qL aliquot of the sample was spotted along w ith a 5 juL aliquot of M i standard, and developed by 1- dim ensional T L C w ith the solvent systems shown in Table 1. The Rf values were measured and calculated as described by Touchstone and Dobbins (7). The distance from the origin to the solvent front was kept constant at 10 cm. Th is procedure was repeated w ith 2-dimensional T LC w ith a constant 8 cm solvent front.
R esu lts and D iscu ssionStudies by Polan et al. (8 ) and Patterson et al.
(9) showed that M i accumulates in the m ilk and increases continuously as long as aflatoxin is fed. They also showed that M i was detected in the m ilk 24 h after in itial feeding and up to 72 h after aflatoxin was removed from the diet. Results from our study (Figure 1) show that the artifact appeared in the m ilk w ith in 12 h after the citrus
Figure 3. HPLC chromatograms of aflatoxin Mj and citrus artifact. Retention time: Mi 6.86 min and
artifact 7.18 min.

PRICE ET AL.: J. ASSOC. OFF. ANAL. CHEM. (VOL. 64. NO. 6, 1981) 1385
Table 2. Effect of eluant on column chromatographic separation of aflatoxin and artifact *
Eluant* 6 Mx ArtifactHexanec - -Ethyl ether - -CHCl3-acetone + +(9 + 1)CHCI3-acetone + +(1+4)CHCl3-methanol + +(97 + 3)Methanol + +Benzene-acetic acid-methanol (90 + 5 + 5)Acetonitrile-ether-hexane (4+1 + 5)Benzene-hexane 0 + 1)
a (+) = eluted from column; (—) = no effect.6 Eluant volume 25 mL except as noted. c Eluant volume 50 mL.
waste was first fed and continued as long as it was fed. A lthough these results show that the artifact was excreted into the m ilk , levels did not increase continuously as does M j but fluctuated considerably. They also show that the artifact was not detected in the first m ilk samples taken after the citrus waste was removed from the diet (12 h). These results corroborate the previous findings of United Dairymen of Arizona that the levels of the supposed aflatoxin M i found in the m ilk were inconsistent. No unusual fluorescent compounds were detected in m ilk from cows not fed dried citrus waste.
The results of comparison of R ( values are shown in Table 1. The solvent systems that gave the best separation for 1-dimensional T L C were CHCh-acetone-isopropanol (87 + 10 + 3); ether-m ethanol-water (95 + 4 + 1); and ether- hexane-methanol-water (85 + 10 + 4 + 1). In the other solvent systems, streaking made it d ifficult to d istinguish the artifact from M i.
Figure 2 shows the results obtained for 2- dim ensional T L C . The solvent systems consisted of ether-m ethanol-water (95 + 4 + 1) in the first direction and C H C l3-acetone-isopro- panol (87 + 1 0 + 3) in the second direction. These solvent systems clearly separated the 2 compounds. The results from both the 1- and2-dimensional T L C comparisons showed an obvious separation of aflatoxin M j and the artifact. Because it takes less time, our laboratory prefers to use 1-dimensional T LC .
Figure 3 is a comparison of the H P L C chro
matograms for 2 m ilk extracts, one containing the artifact and one containing M j. The fluorescence detector showed both the M i and the artifact peaking at the same position. The U V detector gave a positive response for M i but gave a negative response for the artifact. We attempted to determine the presence of the artifact by establishing a UV/fluorescence response factor ratio but this was effective o n ly i f the artifact appeared alone and in large quantities. I f the m ilk contained both the artifact and M i, H P L C indicated a much h igher level o f M i than was actually present. Derivatization w ith T FA by the method of Beebe and Takahashi (10) did not produce enough sh ift for d ifferentiation of the 2 compounds by H P LC .
Because of the problems encountered w ith H P L C quantitation when either the artifact or both were present, attempts were made to separate the 2 by varying conditions during the column chromatographic step of the Stubblefield method (1). D ifferent eluants were used as additional washes (Table 2), and eluates were examined by T LC to determine w hich compound(s) was removed. The moisture content of the silica gel was also varied (0, 2, 3, 4, and 5% water). None of the modifications was effective.
Th is experience again emphasizes the need for confirm ation of analytical procedures for afla- toxins by methods other than cochromatography. T h is w il l aid in avoiding the im position of penalties on producers of noncontaminated commodities.
References(1) Stubblefield, R. D. (1979) /. Am. Oil Chem. Soc. 56,
800-802(2) Trucksess, M. W. (1976) /. Assoc. Off. Anal. Chem.
59,722-723(3) Official Methods of Analysis (1980) 13th Ed., AOAC,
Arlington, VA(4) Kefford, J. F., & Chandler, B. V. (1970) The Chemical Constituents of Citrus Fruits, Academic Press, New
York, NY, Chaps. 12 and 13(5) "Changes in Methods" (1980) /. Assoc. Off. Anal. Chem. 63,394-395(6) Jain, A. V., & Hatch, R. C. (1980) /. Assoc. Off. Anal. Chem. 63,626-630(7) Touchstone, J. C. & Dobbins, M. F. (1978) Practice of Thin Layer Chromatography, John Wiley and
Sons, New York, NY, Chap, i(8) Polan, C. E„ Hayes, J. R„ & Campbell, T. C. (1974) J. Agric. Food Chem. 22,635-638(9) Patterson, D. S. P., Glancy, E. M., & Roberts, B. A.
(1980) Food Cosmet. Toxicol. 18, 35-37(10) Beebe, R. M., & Takahashi, D. M. (1980) J. Agric. Food Chem. 28,481-482

1386 MALANOSKI ET AL.: J. ASSOC. OFF. ANAL. CHEM. (VOL. 64, NO. 6, 1981)
D R U G R E S ID U E S IN A N IM A L T IS S U E S
C o m p a r i s o n o f T h r e e M e t h o d s f o r D e t e r m i n a t i o n o f S u l f a m e t h a z i n e i n S w i n e T i s s u e s : C o l l a b o r a t i v e S t u d y
ANTHONY J. MALANOSKI, CHARLIE J. BARNES,* 1 and THOMAS FAZIO1 U.S. Department of Agriculture, Food Safety and Quality Service, Division of Chemistry, Washington, DC 20750Collaborators: D. Andrzejewski; R. G. Burkepile; D. Goodspeed; J. D. Jackson; J. Jones; A. Manuel; J. Matusik; W. J. Morris; R. K. Munns; G. J. Nandrea; J. Nandrea;M. Poeppel; J. Shafer; R. Simpson; S. Stout; F. Suhre; R. R. WiseAn interlaboratory study of 3 methods for the determination of sulfamethazine in swine muscle and liver tissue was conducted. A gas chromatographic (GC), a combined gas chromatographic-mass spec- trometric (GC/MS), and a colorimetric method were evaluated. Four fortified and 2 incurred levels of sulfamethazine ranging from 0.00 to 0.45 ppm were studied. The study revealed that the GC/MS procedure provides the most reliable data and that the GC method provides acceptable data with the incorporation of appropriate controls. The recoveries for the GC/MS method typically ranged from 90 to 100% for swine liver and muscle. The GC and GC/MS methods have been adopted official first action.
Sulfonam ides have been approved for use in food-producing anim als for approxim ately 40 years. T ish ler's (colorim etric) m odification (1) of the Bratton-Marshall procedure (2) in 1968 was a great step forward in the ab ility to determine sulfonamide residues in anim al tissues. Since 1968 the procedures or modifications of this system, such as the Fellig-W estheim er method(3), have been most w id e ly used in sulfonamide analyses.
For some time, the Food and Drug A dm in istration (FD A ) and the Food Safety and Q uality Service (FSQS) have been concerned about deficiencies in methodology based on the Bratton-Marshall reaction for determ ining sulfonamides. Background interferences from control tissues are frequently 50% or more of the 0.1 ppm tolerance. Recoveries are sometimes low and variable. The Bratton-Marshall types of methods generally do not d istinguish one sulfonamide from another or from other compounds that react in a sim ilar manner.
In 1978, h igh rates of v io lative sulfonamide residues were occurring in sw ine live r. As a
Received M arch 4,1981. Accepted June 19,1981.1 Food and Drug Administration, Division of Chemistry and Physics, W ashington, DC 20204
result, major aspects of the sulfonam ide m onitoring program were scrutinized, includ ing the analytical methodology, and FSQS and FD A evaluated and standardized their application of the T ish ler procedure. Because of the problems and lim itation of the T ish le r procedure, a decision was made to develop a suitable replacement. The outcome of these investigations was the development of (a) a combined gas chromatography-m ass spectrometry (G C/M S) method for sulfamethazine by FSQS (4) and (b) a s lig h tly modified version of the M anuel-Steller (G C ) (5) sulfonamide method by FD A . The GC and G C/M S procedures, together w ith Option A of the T ish le r procedure, were subjected to in terlaboratory study.
Sam plesA nim als for this study were received as gifts
from the Science Education Adm inistration, U .S. Department of Agriculture. These animals were fed and dosed by Low ell Frobiak of the Non- Rum inant N utrition Laboratory, Agricu ltu re Research Center, Beltsv ille , M D.
Tissues from the slaughtered anim als were screened by a TLC-fluorescence procedure before the start of the study. In this pre-assay screening procedure, tissue was blended w ith acetone and the resulting m ixture was centrifuged; the acetone layer was filtered , 5N HC1 was added, and the solution was buffered to adjust the pH to 6.2. The acid solution of the residues was extracted w ith m ethylene chloride. A concentrated m ethylene chloride extract of the residues was subjected to T LC . Sulfam ethazine and other sulfonamides present were made v is ib le by a Bratton-M arshall type of color reaction.
The recom m endation was approved by the G eneral Referee and Com mittee G and was adopted by the Association. See /. Assoc. Off. Anal. Chern. 65, M arch issue (1982) for detailed reports.
0004-5756/81/6406-1386-06$01.00 © Association of Official Analytical Chemists. Inc.

MALANOSKI ET AL.: J. ASSOC. OFF. ANAL. CHEM. (VOL. 64, NO. 6, 1981) 1387
In brief, the protocol called for the analyses of b lind replicates of 3 levels of fortified samples, blank tissue samples, and 2 levels of incurred residue samples, each in both sw ine live r and muscle. (Incurred residues are the parent drug and metabolites that rem ain in the anim al as a result of anim al dosing.) Coded weighed samples and matching v ia ls for fo rtify ing these tissues were distributed to each analyst along w ith a schedule for doing the analyses. Each sample was fortified w ith 1 m L of the contents of a designated v ia l just before sample analyses. V ia ls for blanks and incurred samples contained methanol but no sulfamethazine. Samples were generally analyzed at the rate of 4 per day in a specific random order for 3 days per week. Th is provided an opportunity to make up for contingencies.
T ish ler A C olorim etric M eth od (1)Extract 50 g tissue 3 times w ith 100 m L chlo
roform-acetone (1 + 1). F ilte r and rotary- evaporate at 50°C ; dissolve residue in hexane- acetone (50 + 1). Extract 4 times w ith I N HC1. F ilte r IN HC1 extract and adjust to pH 14. Wash basic extract w ith C H C I3, adjust to pH 1.0, and diazotize w ith sodium n itrite . Destroy excess N a N C >3 w ith N H 4OSO 2N H 2, and filte r through fine fritted funnel. For color, add N -(l-naph- thyljethylenediam ine.HCl. Read complex at 545 nm.
Gas C h rom atographic-M ass Spectrom etric M eth od (4)
Add 13C-sulfam ethazine to 50 g tissue, and proceed as in co lorim etric method above, through "W ash basic extract w ith CHC13." Buffer acid extract and adjust to pH 5.6. Extract residues into C H 2C I2 and evaporate. D issolve in MeOH and methylate w ith diazomethane. By G C /E I/M S , monitor m /z 227, 228, 233, 234, 92, and the absence of m /z 74. Quantitate by use of the ratio of 227 to 233.
M an u el-S te ller GC M eth od (5)Extract 15 g tissue w ith 150 m L chloroform -
acetone (1 + 1), filte r , and collect 100 m L. Add 10 m L I N HC1, and rotary-evaporate at 32°C to remove extraction solvent. Add 50 m L hexane, shake, and remove IN HC1 layer. Extract tw ice more w ith 5 m L I N HC1. Buffer I N HC1, adjust to pH 5.6, and extract w ith C H 2C I2. Rotary- evaporate, dissolve residue in acetone, and methylate w ith diazomethane. Quantitate by electron capture G LC .
R esults and D iscu ssio nThe 3 methods under study have s im ila r ex
traction and cleanup steps and d iffer p rincipally in the procedures used for detection and quantitation. The G C/M S method uses a 13C-sulfa- methazine internal standard, the extraction and cleanup of the T ish ler-A , and quantitation by combined G C/M S. The GC method uses many
Table 1. GC recovery of sulfamethazine from swine muscle (ppm)
Animal No.
Sample description Participating laboratory
Treatment Pre-test assay3 1 2 3 4 5
5703 5 blanks (fortified 0.00 ppm by Manuel- 0.00 0.00 0.00 0.00 0.0112 at zero sulfa- Steller plusTLC/ 0.00 0.00 0.00 0.00 0.0017 methazine level) fluorescence screen — — — — —
5703 6 fortified 0.05 ppm 0.05 — 0.05 0.06 0.0711 none 0.05 0.03 0.05 0.01 0.0314 — 0.07 — — —
5703 3 fortified 0.11 ppm 0.11 0.06 0.09 0.11 0.0810 none 0.10 0.07 0.10 0.05 0.07
570316
8 fortified 0.22 ppm 0.21 0.22 — 0.24 0.189 none 0.21 — 0.22 0.25 0.22
13 — — 0.23 0.20 —5704 2 incurred 0.22 ppm by TLC/ 0.18 0.23 0.21 0.25 0.13
4 fluorescence screen 0.24 — 0.25 0.26 0.2318 — 0.48 — — —
5706 1 incurred 0.45 ppm by TLC/ 0.53 0.45 loss 0.16 0.257 fluorescence screen 0.40 discard 0.53 0.52 0.36
15 — — —
a Performed on blanks and incurred samples only.
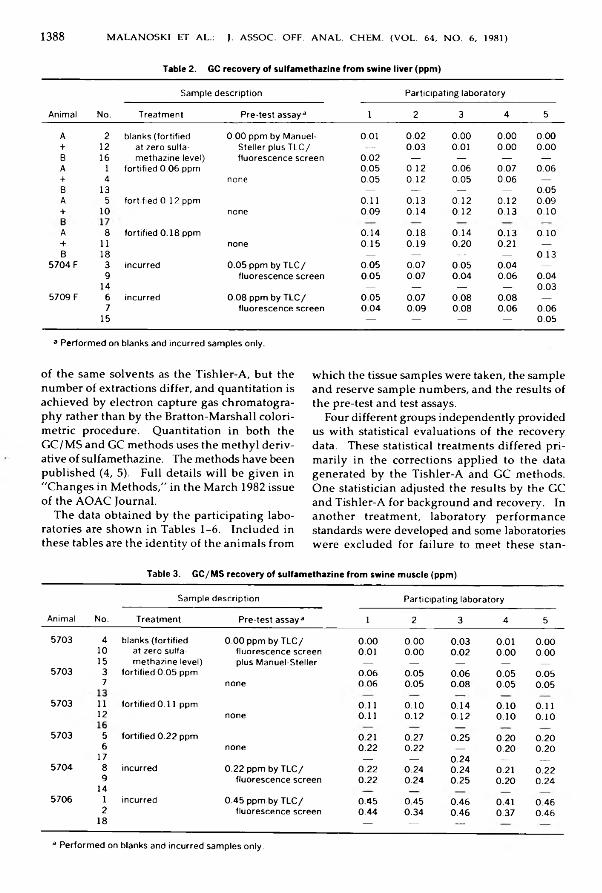
1388 MALANOSKI ET AL.: J. ASSOC. OFF. ANAL. CHEM. (VOL. 64, NO. 6, 1981)
Table 2. GC recovery of sulfamethazine from swine liver (ppm)
Animal No.
Sample description Participating laboratory
Treatment Pre-test assay3 i 2 3 4 5
A 2 blanks (fortified 0.00 ppm by Manuel- 0.01 0.02 0.00 0.00 0.00+ 12 at zero sulfa- Steller plus TLC/ — 0.03 0.01 0.00 0.00B 16 methazine level) fluorescence screen 0.02 — — — —A 1 fortified 0.06 ppm 0.05 0.12 0.06 0.07 0.06+ 4 none 0.05 0.12 0.05 0.06 —B 13 — — — — 0.05A 5 fortified 0.12 ppm 0.11 0.13 0.12 0.12 0.09+ 10 none 0.09 0.14 0.12 0.13 0.10
A 8 fortified 0.18 ppm 0.14 0.18 0.14 0.13 0.10+ 11 none 0.15 0.19 0.20 0.21 —B 18 — — — — 0.13
5704 F 3 incurred 0.05 ppm by TLC/ 0.05 0.07 0.05 0.04 —9 fluorescence screen 0.05 0.07 0.04 0.06 0.04
14 — — — — 0.035709 F 6 incurred 0.08 ppm by TLC/ 0.05 0.07 0.08 0.08 —
7 fluorescence screen 0.04 0.09 0.08 0.06 0.0615 — — — — 0.05
3 Performed on blanks and incurred samples only.
of the same solvents as the T ish ler-A , but the number of extractions d iffer, and quantitation is achieved by electron capture gas chromatography rather than by the Bratton-M arshall co lorimetric procedure. Quantitation in both the G C/M S and GC methods uses the m ethyl de rivative of sulfamethazine. The methods have been published (4, 5). Fu ll details w il l be g iven in "Changes in M ethods," in the March 1982 issue of the A O A C Journal.
The data obtained by the participating laboratories are shown in Tables 1-6. Included in these tables are the identity of the anim als from
w hich the tissue samples were taken, the sample and reserve sample numbers, and the results of the pre-test and test assays.
Four different groups independently provided us w ith statistical evaluations of the recovery data. These statistical treatments d iffered p rim arily in the corrections applied to the data generated by the T ish ler-A and G C methods. One statistician adjusted the results by the G C and T ish ler-A for background and recovery. In another treatment, laboratory perform ance standards were developed and some laboratories were excluded for failure to meet these stan-
Table 3. GC/MS recovery of sulfamethazine from swine muscle (ppm)
Animal No.
Sample description Participating laboratory
Treatment Pre-test assay3 i 2 3 4 5
5703 4 blanks (fortified 0.00 ppm by TLC/ 0.00 0.00 0.03 0.01 0.0010 at zero sulfa- fluorescence screen 0.01 0.00 0.02 0.00 0.0015 methazine level) plus Manuel-Steller — — ___ ___ ___
5703 3 fortified 0.05 ppm 0.06 0.05 0.06 0.05 0.057 none 0.06 0.05 0.08 0.05 0.05
5703 h fortified 0.11 ppm 0.11 0.10 0.14 0.10 0.1112 none 0.11 0.12 0.12 0.10 0.10
5703 5 fortified 0.22 ppm 0.21 0.27 0.25 0.20 0.206 none 0.22 0.22 — 0.20 0.20
17 — — 0.24 — ___
5704 8 incurred 0.22 ppm by TLC/ 0.22 0.24 0.24 0.21 0.229
L4fluorescence screen 0.22 0.24 0.25 0.20 0.24
5706 i incurred 0.45 ppm by TLC/ 0.45 0.45 0.46 0.41 0.462 fluorescence screen 0.44 0.34 0.46 0.37 0.46
18 — — —
3 Performed on blanks and incurred samples only.

MALANOSKI ET AL.: J. ASSOC. OFF. ANAL. CHEM. (VOL. 64, NO. 6, 1981) 1389
Table 4. GC/MS recovery of sulfamethazine from swine liver (ppm)
Sample description Participating laboratoryAnimal No. Treatment Pre-test assay3 * 1 2 3 4 5
1 4 blanks (fortified+ 11 at zero sulfa3 17 methazine level)1 1 fortified 0.06 ppm+ 83 181 5 fortified 0.12 ppm+ 103 151 2 fortified 0.18 ppm+ 73 165701 F 6 incurred12145702 F 3 incurred913
0.00 ppm by TLC/ 0.00fluorescence screen 0.000.06none 0.060.12none 0.120.18none 0.18
0.14 ppm by TLC/ 0.14fluorescence screen 0.140.07 ppm by TLC/ 0.06fluorescence screen 0.07
0.00 0.01 0.00 0.000.00 0.02 0.00 0.010.05 0.06 0.06 0.050.06 0.06 0.06 0.060.13 0.13 0.11 0.130.11 0.14 0.11 0.100.18 0.18 0.16 0.180.16 0.19 0.17 0.180.18 0.15 0.13 0.140.15 0.16 0.13 0.150.06 0.07 0.06 0.050.07 0.06 0.05 0.06
3 Performed on blanks and incurred samples only.
dards. In 2 of the treatments, various tests were used to elim inate the outlier values. One statistician applied a recently published concept (6) to determ ine the lowest lim it of reliab le measurement (Lm ). Lm is defined as that level w hich gives a response above the expected blank value greater than or equal to 0.75 times the spread of the 99% confidence lim its on a single assay response measured parallel to the observed assay response axis. For a fu ll explanation and a diagram of this concept, the reference should be consulted.
A lthough independently evaluated by 4 d ifferent groups, the final conclusions drawn were essentially the same. The major discrepancies in the data were those for muscle (se e values 33 and 40, A for G LC and B for Tishler-A in Table 7). The method providing the most reliable data was the G C /M S method; the G C was second and T ish ler-A was last. A summation of the data derived from the 4 statistical reports (A , B, C , D) is shown in Table 7.
Considering the statistical data and the operational characteristics of each method, our as-
Table 5. Tishler-A recovery of sulfamethazine from swine muscle (ppm)
Animal No.Sample description Participating laboratory6
T reatment Pre-test assay3 1 2 4 55703 3 blanks (fortified 0.00 ppm by TLC/ 0.03 0.01 0.03 0.03
12 at zero sulfa- fluorescence screen 0.01 — 0.01 0.0218 methazine level) plus Manuel-Steller — 0.02 — —
5703 1 fortified 0.05 ppm 0.04 0.05 0.03 0.047 none 0.04 0.04 0.14 0.05
5703 4 fortified 0.11 ppm 0.05 0.08 0.07 0.07u none 0.04 — 0.15 0.0717 — 0.06 — —
5703 5 fortified 0.22 ppm 0.16 0.13 0.14 0.1610 none 0.18 — 0.17 0.1716 — 0.14 — —
5704 2 incurred 0.22 ppm by TLC/ 0.16 0.17 0.15 0.179 fluorescence screen 0.20 0.16 0.07 0.18
5706 6 incurred 0.45 ppm by TLC/ 0.42 0.28 0.30 0.338 fluorescence screen 0.30 0.27 0.20 0.32
14 — —3 Performed on blanks and incurred samples only.b Laboratory 3 did not have time to complete the analyses.

1390 MALANOSKI ET AL.: J. ASSOC. OFF. ANAL. CHEM. (VOL. 64, NO. 6, 1981)
Table 6. Tishler-A recovery of sulfamethazine from swime liver (ppm)
Animal No.Sample description Participating laboratory6
Treatment Pre-test assay3 1 2 4 5Bi ,B 4 9
•blanks (fortified 0.04, 0.07, 0.08, 0.04 0.11 0.07 0.07 0.09Bs. B6 10 at zero sulfa- ppm by Tishler-A 0.12 0.07 0.06 0.13
16 methazine level) — — — —Bi, B4 4 fortified 0.06 ppm 0.12 0.09 0.08 0.14Bs, Be 5 none 0.14 0.10 0.09 0.12Bi, B4 2 fortified 0.12 ppm 0.16 0.16 0.12 0.16Bs. B6 12 none 0.17 0.15 0.11 0.17Bi, B4 7 fortified 0.18 ppm 0.17 0.16 0.24 0.19Bs. Be 11 none 0.19 0.18 0.17 0.21
5705 M 1 incurred 0.06 ppm by TLC/ 0.12 0.08 0.11 0.136 fluorescence screen 0.14 0.08 0.09 0.19
5702 M 3 incurred 0.13 ppm by TLC/ — 0.25 0.26 0.308 fluorescence screen 0.27 0.23 0.19 0.3313 0.28 — — —
3 Performed on blanks and incurred samples only.6 Laboratory 3 did not have time to complete the analyses.
sessments of the 3 methods are as fo llows:The G C /M S has a degree of specificity, preci
sion, and accuracy and is relatively unaffected by tissue background interferences. The high precision and accuracy of the method are probably due to the use of the internal standard. Potential lim itations of the G C/M S method are that it requires a 13C-labeled sulfam ethazine for use as the internal standard, a mass spectrometer, and a residue chemist trained in the use of the G C/M S instrum ent.
W ith respect to lim it of reliable measurement, specific ity , and freedom from background in terferences the G C method is not as good as the G C/M S method but is better than the T ish ler-A method. Data generated in this study show that w ith respect to repeatability and reproducibility this method was less satisfactory than the T ish ler-A method. H ow ever, the Lm in both sw ine live r and muscle is lower for the GC than for the T ish ler-A method. The h igher Lm for the T ish ler-A method possibly reflects the problem
Table 7. Summation of statistical evaluations
Liver MuscleEvaluation C V3 c v 6 Lm CV3 c v 6 Lm
GC/MSA 9 9 0.034 8 12 0.058B 8 9 7 13C 9 12D 9 10 10 13
GLCA 15 22 0.096 33 33 0.074B 14 16 15 19C 20 20D 13 22 21 21
Tishler-AA 11 19 0.174 13 16 0.100B 25 27 38 40C 17 14D 8 17 13 14
3 Coefficient of variation of repeatability (within laboratories). b Coefficient of variation of reproducibility (between laboratories).
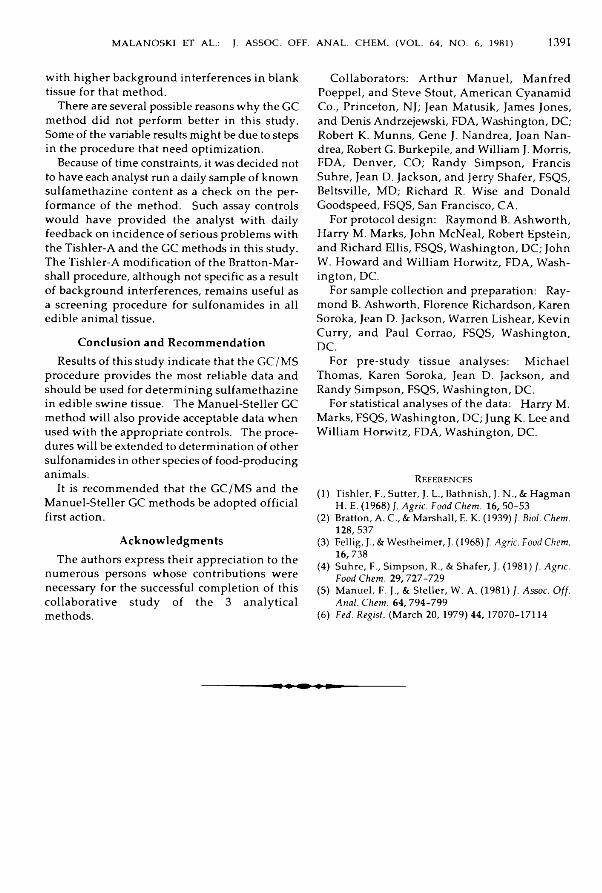
MALANOSKI ET AL.: J. ASSOC. OFF. ANAL. CHEM. (VOL. 64, NO. 6, 1981) 1391
w ith h igher background interferences in blank tissue for that method.
There are several possible reasons w h y the GC method did not perform better in this study. Some of the variable results might be due to steps in the procedure that need optim ization.
Because of time constraints, it was decided not to have each analyst run a daily sample of known sulfam ethazine content as a check on the performance of the method. Such assay controls w ould have provided the analyst w ith daily feedback on incidence of serious problems w ith the T ish ler-A and the G C methods in this study. The T ish ler-A m odification of the Bratton-Mar- shall procedure, although not specific as a result of background interferences, rem ains useful as a screening procedure for sulfonam ides in a ll edible anim al tissue.
C on clu sion and R ecom m en d ationResults of th is study indicate that the G C/M S
procedure provides the most reliable data and should be used for determ ining sulfam ethazine in edible sw ine tissue. The M anuel-Steller GC method w il l also provide acceptable data w hen used w ith the appropriate controls. The procedures w il l be extended to determination of other sulfonamides in other species of food-producing anim als.
It is recommended that the G C /M S and the M anuel-Steller G C methods be adopted o ffic ia l first action.
A ck n o w led gm en tsThe authors express their appreciation to the
numerous persons whose contributions were necessary for the successful completion of th is co llaborative study of the 3 ana ly tica l methods.
Collaborators: A rth u r M anuel, M anfred Poeppel, and Steve Stout, Am erican Cyanam id Co., Princeton, N J; Jean M atusik, James Jones, and Denis Andrzejewski, FD A , Washington, D C ; Robert K . M unns, Gene J. Nandrea, Joan Nan- drea, Robert G. Burkepile, and W illiam J. M orris, FD A , Denver, CO ; Randy Sim pson, Francis Suhre, Jean D . Jackson, and Jerry Shafer, FSQS, Beltsv ille , M D ; R ichard R. Wise and Donald Goodspeed, FSQ S, San Francisco, C A .
For protocol design: Raymond B. A shw orth , H arry M . M arks, John M cNeal, Robert Epstein, and Richard E llis , FSQS, W ashington, D C ; John W. Howard and W illiam H o rw itz , FD A , Washington, DC.
For sample collection and preparation: Raymond B. Ashworth, Florence Richardson, Karen Soroka, Jean D . Jackson, W arren Lishear, K ev in C u rry , and Paul Corrao, FSQ S, W ashington, DC .
For pre-study tissue analyses: M ichaelThomas, Karen Soroka, Jean D . Jackson, and Randy Simpson, FSQ S, W ashington, DC .
For statistical analyses of the data: H a rry M. M arks, FSQS, W ashington, D C ; Jung K . Lee and W illiam H orw itz , FD A , W ashington, DC .
References(1) Tishler, F„ Sutter, J. L., Bathnish, J. N., & Hagman
H. E. (1968) /. Agrie. Food Chem. 16,50-53(2) Bratton, A. C , & Marshall, E. K. (1939) /. Biol. Chem.
128, 537(3) Fellig, J., & Westheimer, J. (1968) J. Agrie. Food Chem.
16, 738(4) Suhre, F„ Simpson, R., & Shafer, J. (1981) /. Agrie. Food Chem. 29,727-729(5) Manuel, F. J., & Steller, W. A. (1981) /. Assoc. Off. Anal. Chem. 64,794-799(6) Fed. Regist. (March 20,1979) 44,17070-17114

1392 BJARNO: J. ASSOC. OFF. ANAL. CHEM. (VOL. 64, NO. 6, 1981)
M E A T A N D M E A T P R O D U C T S
Multicomponent Analysis of Meat ProductsOLE-CHRISTIAN BJARNÇ)A /S N. Foss Electric, 69, Slangerupgade, Hillenpd DK-3400, DenmarkA new method for rapid multicomponent analysis of meat products is reported. The sample is homogenized, and then dispersed by treatment with an alkaline aqueous solution combined with mechanical subdivision. Constituents are determined by infrared transmission spectrophotometry in the fundamental 1R absorption bands. It is possible to measure protein, fat, and carbohydrate in about 5 min with an accuracy and precision comparable to that of well established standard methods, and no expensive or dangerous chemicals are used.There is a great demand for quantitatively determ in ing fat and protein in foodstuffs and an imal feeds and their raw materials. U n til a few years ago, the principal method for protein determ ination was the K jeldahl method, in a modified automated form (1). Color-binding (2) and the biuret reaction (3) had gained a certain acceptance, but on ly for determ ining dissolved proteins, for example, protein in m ilk and serum(4) .
L ikew ise , the principal method for fat determ ination has been extraction w ith organic solvents, and determination, on the clear extract, of a physical property indicative of fat content, e.g., d ie lectric constant, refractive index, or density, as w ith the Foss-Let automated instrumentation(5 ) . For special purposes, such as fat determ ination in m ilk , measurements by light scattering have been w id e ly used (6).
Both of the principal methods (K je ldahl and extraction) suffer from the disadvantages that they are d ifficult to perform, use toxic chemicals, and y ie ld toxic waste flu ids. Both biuret and color-binding suffer from the disadvantage that the calibration strongly depends on the product to be determined.
It was a technological advance when Goulden(7) showed that it was possible to quantitatively measure protein and fat in m ilk by infrared (IR ) spectrophotometry. U n til then, th is had been considered impossible because of the strong water bands; when Goulden published his work, spectrophotometry technology had been developed so far that it was possible to compensate
Received O ctober 24, 1980. Accepted Feburary 26,1981.
e ffic ien tly for interferences. Goulden's work formed the basis of several IR transmission in struments for routine analysis of m ilk (8-10).
The use of infrared technology for solid products has also been introduced (11,12). The determ inative step in this case is lim ited to the measurement of reflected light from the surface of a fine ly ground sample. A lso , it is necessary to operate in the near IR range to obtain sufficient energy, which necessitates the use of the less sharp overtones of the fundamental IR bands for protein and fat. Th is fact, in connection w ith the high sensitivity of the technique to variations in the sample surface, resulted in a less than satisfactory accuracy and precision (12), but the method is re lative ly fast and does not use toxic chemicals.
The near IR reflection method has also been applied to meat products (13, 14). H ow ever, there exists a great demand for a p re c ise and a c c u r a te method for determ ining fat, protein, carbohydrate, water, and ash in meat products. The evaluation of such a method is discussed in this report.
ExperimentalThe infrared analysis of m ilk products is a w ell
established technique w h ich norm ally w orks w ith an accuracy about 1.5% relative on a ll 3 parameters: fat, protein, and lactose according to the A O A C interim officia l first action method (16.079 (15); o ffic ia l first action (16)). To apply this technique and its high accuracy to analyzing meat, it is necessary to convert the meat sample to a m ilk-like emulsion.
Meat w ill give stable emulsions under appropriate mechanical treatment. In addition, alkaline solutions m arkedly enhance solubilization of meat protein (17). To convert the meat sample to a m ilk-like emulsion, we mixed 11 g meat w ith 100 m L 0.1M sodium hydroxide. The sample size of 11 g corresponds to about 5 g mean dry matter. The maximum content of dry matter that can be em ulsified and give stable emulsions is about 10 g. To accommodate normal variations and to ensure a margin of safety, 11 g is adequate. The mechanical treatment is performed by using
0004-5756/81/6406-1392-05$01.00 © Association of Official Analytical Chemists, Inc.

BJARNO: J. ASSOC. OFF. ANAL. CHEM. (VOL. 64, NO. 6, 1981) 1393
a Foss-Let reactor (5) in w h ich the m ixture is subjected to treatment by a reciprocating cy lin drical hammer in a closed chamber. To establish a more stable emulsion ca 0.1% of a m ixture of d ifferent em ulsifiers is added to the alkaline reaction solution. No chemical reactions take place. H ow ever, during the mechanical subdivision , carbohydrates are solubilized in the water phase; fat is melted and em ulsified. Other laboratory homogenizers have been investigated, inc lud ing the U ltra Turrax, but the former treatment is more efficient.
The sample is once more homogenized by a built-in homogenizer and then transferred to the ce ll fo r IR measurements. The absorption wavelengths used are the carbon-oxygen double bond (5.73 pm) for fat, the nitrogen-hydrogen bond (6.5 pm ) for protein, and the carbon-oxygen bond attached to the hydroxyl groups (9.5 pm ) for carbohydrates, all wavelengths at w hich w ater absorbs. Th is water interference can be elim inated by m easuring a ll components at 2 d ifferent wavelengths: one w here the compound in question has an absorption maximum, and another adjacent w avelength, where the compound does not absorb energy. The necessary wavelengths are selected by means of d ielectric interference filters placed on a filte r w heel. The rest of the optical system is almost identical to other spectrophotometers.
The signal from each channel, w h ich is the ratio between the signals from the sample and reference filters, is corrected w ith ca 5% of the signals from the other 2 channels. These corrections are necessary because of (2) Spectral influences: Components also absorb in otherchannels. (2) W ater displacem ent effects: W hen a component in one of the 2 other channels is varied , it gives a variation in the water background. Because of incomplete compensation by the reference w avelength, th is variation generates variation in the actual measuring channel. (3) Density changes: A variation in any component w ill be reflected in the other two because density of the em ulsion is changed.
Standard methods used in meat analysis d iffer from IR measurement because the form er measures a weight-fraction and the latter measures mole-fraction. Therefore, results w il l be in fluenced by density variations. O n ly w hen the m olecular w eight is constant from sample to sample for the component in question w il l the IR measurement give a constant accuracy vs the standard method.
Calculations on pig fat show that on ly m inor variation in mean molecular w eight w ould be
expected, although a considerable variation exists in the fatty acid composition.
The mean molecular weight is also a source of error in K je ldahl determ ination of protein because of the varying K jeldahl factor (the conversion factor between percent nitrogen and percent protein). N orm ally , 6.25 is used as the conversion factor but the fo llow ing factors have been calculated based on biochemical data (18):
Muscle protein 5.94Collagen (connective tissue) 4.94Hem oglobin (blood) 5.65
Samples w ith h igh and varying content of collagen must have the K je ldahl protein determi- natin corrected. For meat proteins, ve ry little variation other than collagen is present.
The molweight of carbohydrates varies, but is generally compensated by variation in number of carbon-oxygen bonds. For example, glucose has a m olweight of 180.17 and 6 carbon-oxygen bonds, and sucrose has a molweight of 342.70 and 11 carbon-oxygen bonds. Thus, for a certain weight-fraction of sucrose, the same weight- fraction of glucose w il l measure about 3.5% higher relative. Th is difference w ill be reduced in actual products w here the variation between monosaccharides and disaccharides is more lim ited .
Resu ltsF irst, a spectrum of a meat emulsion was re
corded to investigate the absorption frequencies of the components. A n emulsion was established by reacting 12 and 6 g beef in 100 m L 0.5M N aO H in a Foss-Let reactor for 4 m in. The em ulsion was transferred to a 30 /¿m cell and a difference spectrum was recorded w ith a Per- k in -E lm er infrared spectrophotometer 580 w ith 0.5M N aO H in the reference ce ll. Figure 1 shows the fat absorption at 1740 cm-1 and protein absorption at 1560 cm-1, w h ich are the frequencies used for in frared m ilk measurements. Furtherm ore, it is seen that the ratio between sample wavelength and reference wavelength roughly estimates the content of the specific components.
Next, a Milko-Scan 104, a standard instrument for m ilk measurements, was used (9). T h irty sample m ixtures were prepared so that the most common meat constituents were randomized; on ly sm all intercorrelations of the constituents should be present. The standard methods applied in analyzing the m ixtures were Kjel-Foss automated for protein determ ination (A O A C 24.037) and Foss-Let (A O A C 24.008) for fat de-
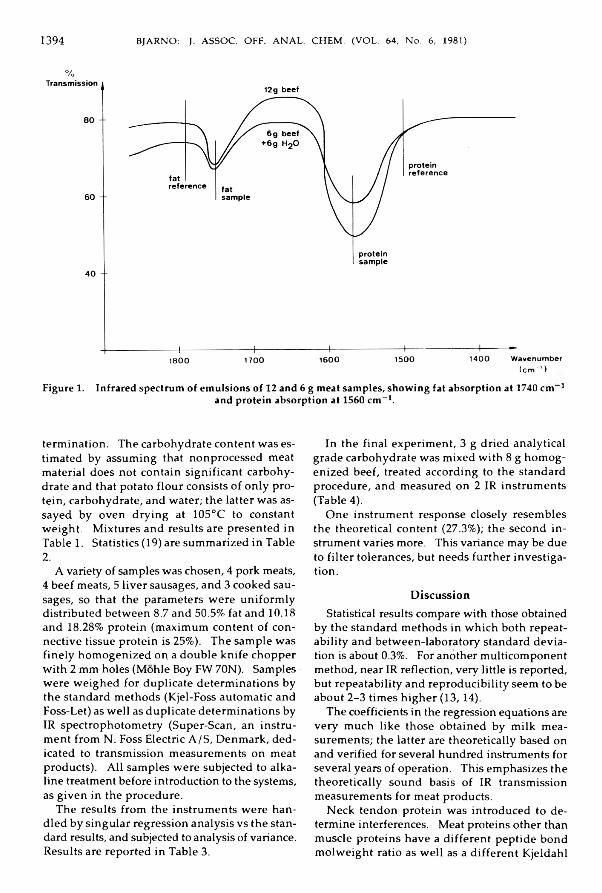
1394 BJARNO: J. ASSOC. OFF. ANAL. CHEM. (VOL. 64, No. 6, 1981)
%
1800 1700 1600 1500 1400 Wavenumber(cm ■' )
Figure 1. Infrared spectrum of emulsions of 12 and 6 g meat samples, showing fat absorption at 1740 cm 1and protein absorption at 1560 cm-1.
term ination. The carbohydrate content was estimated by assuming that nonprocessed meat material does not contain significant carbohydrate and that potato flour consists of only protein, carbohydrate, and water; the latter was assayed by oven drying at 105°C to constant weight. M ixtures and results are presented in Table 1. Statistics (19) are summarized in Table2.
A variety of samples was chosen, 4 pork meats, 4 beef meats, 5 live r sausages, and 3 cooked sausages, so that the parameters were un ifo rm ly distributed between 8.7 and 50.5% fat and 10.18 and 18.28% protein (maximum content of connective tissue protein is 25%). The sample was fin e ly homogenized on a double knife chopper w ith 2 mm holes (Mohle Boy FW 70N). Samples were weighed for duplicate determ inations by the standard methods (Kjel-Foss automatic and Foss-Let) as w e ll as duplicate determ inations by IR spectrophotometry (Super-Scan, an instrument from N . Foss Electric A /S , Denm ark, dedicated to transmission measurements on meat products). A ll samples were subjected to alkaline treatment before introduction to the systems, as g iven in the procedure.
The results from the instrum ents were handled by singular regression analysis vs the standard results, and subjected to analysis of variance. Results are reported in Table 3.
In the fina l experim ent, 3 g dried analytical grade carbohydrate was m ixed w ith 8 g homogenized beef, treated according to the standard procedure, and measured on 2 IR instrum ents (Table 4).
One instrum ent response closely resembles the theoretical content (27.3%); the second in strument varies more. This variance may be due to filte r tolerances, but needs fu rther investigation.
D iscu ssionStatistical results compare w ith those obtained
by the standard methods in w h ich both repeatab ility and between-laboratory standard deviation is about 0.3%. For another multicomponent method, near IR reflection, very little is reported, but repeatability and reproducib ility seem to be about 2-3 times h igher (13,14).
The coefficients in the regression equations are very much like those obtained by m ilk measurements; the latter are theoretically based on and verified for several hundred instruments for several years of operation. Th is emphasizes the theoretically sound basis of IR transmission measurements for meat products.
Neck tendon protein was introduced to determine interferences. Meat proteins other than muscle proteins have a different peptide bond m olweight ratio as w e ll as a d ifferent K jeldahl
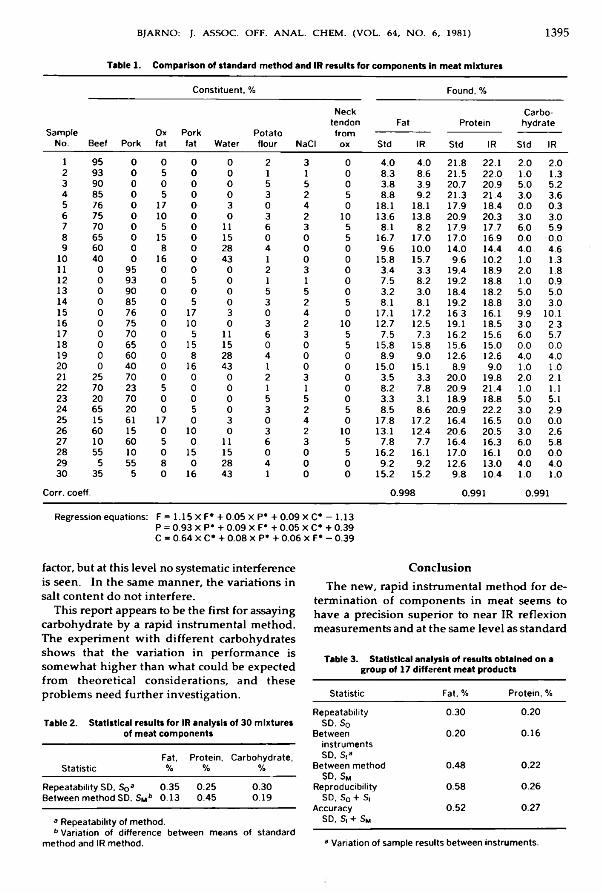
BJARNO: J. ASSOC. OFF. ANAL. CHEM. (VOL. 64, NO. 6, 1981) 1395
Table 1. Comparison of standard method and IR results for components in meat mixtures
SampleNo.
Constituent, % Found.%
Beef Pork Oxfat Porkfat Water Potatoflour NaCI
NecktendonfromoxFat Protein Carbohydrate
Std IR Std IR Std IR1 95 0 0 0 0 2 3 0 4.0 4.0 21.8 22.1 2.0 2.02 93 0 5 0 0 1 1 0 8.3 8.6 21.5 22.0 1.0 1.33 90 0 0 0 0 5 5 0 3.8 3.9 20.7 20.9 5.0 5.24 85 0 5 0 0 3 2 5 8.8 9.2 21.3 21.4 3.0 3.65 76 0 17 0 3 0 4 0 18.1 18.1 17.9 18.4 0.0 0.36 75 0 10 0 0 3 2 10 13.6 13.8 20.9 20.3 3.0 3.07 70 0 5 0 11 6 3 5 8.1 8.2 17.9 17.7 6.0 5.98 65 0 15 0 15 0 0 5 16.7 17.0 17.0 16.9 0.0 0.09 60 0 8 0 28 4 0 0 9.6 10.0 14.0 14.4 4.0 4.610 40 0 16 0 43 1 0 0 15.8 15.7 9.6 10.2 1.0 1.311 0 95 0 0 0 2 3 0 3.4 3.3 19.4 18.9 2.0 1.812 0 93 0 5 0 1 1 0 7.5 8.2 19.2 18.8 1.0 0.913 0 90 0 0 0 5 5 0 3.2 3.0 18.4 18.2 5.0 5.014 0 85 0 5 0 3 2 5 8.1 8.1 19.2 18.8 3.0 3.015 0 76 0 17 3 0 4 0 17.1 17.2 16.3 16.1 9.9 10.116 0 75 0 10 0 3 2 10 12.7 12.5 19.1 18.5 3.0 2.317 0 70 0 5 11 6 3 5 7.5 7.3 16.2 15.6 6.0 5.718 0 65 0 15 15 0 0 5 15.8 15.8 15.6 15.0 0.0 0.019 0 60 0 8 28 4 0 0 8.9 9.0 12.6 12.6 4.0 4.020 0 40 0 16 43 1 0 0 15.0 15.1 8.9 9.0 1.0 1.021 25 70 0 0 0 2 3 0 3.5 3.3 20.0 19.8 2.0 2.122 70 23 5 0 0 1 1 0 8.2 7.8 20.9 21.4 1.0 1.123 20 70 0 0 0 5 5 0 3.3 3.1 18.9 18.8 5.0 5.124 65 20 0 5 0 3 2 5 8.5 8.6 20.9 22.2 3.0 2.925 15 61 17 0 3 0 4 0 17.8 17.2 16.4 16.5 0.0 0.026 60 15 0 10 0 3 2 10 13.1 12.4 20.6 20.5 3.0 2.627 10 60 5 0 11 6 3 5 7.8 7.7 16.4 16.3 6.0 5.828 55 10 0 15 15 0 0 5 16.2 16.1 17.0 16.1 0.0 0.029 5 55 8 0 28 4 0 0 9.2 9.2 12.6 13.0 4.0 4.030 35 5 0 16 43 1 0 0 15.2 15.2 9.8 10.4 1.0 1.0
Corr. coeff. 0.998 0.991 0.991Regression equations: F = 1.15 X F* + 0.05 x P* + 0.09 X C* — 1.13 P = 0.93 XP* + 0.09 X F* + 0.05 X C* + 0.39 C = 0.64 X C* + 0.08 X P* + 0.06 X F* - 0.39
factor, but at this level no systematic interference is seen. In the same m anner, the variations in salt content do not interfere .
Th is report appears to be the first for assaying carbohydrate by a rapid instrum ental method. The experim ent w ith d ifferent carbohydrates shows that the variation in performance is somewhat h igher than w hat could be expected from theoretical considerations, and these problems need fu rther investigation.
Tabic 2. Statistical results for IR analysis of 30 mixtures of meat components
Fat, Protein, Carbohydrate,Statistic % % %Repeatability SD, So3 * * 0.35 0.25 0.30Between method SD, Sm6 0.13 0.45 0.19
3 Repeatability of method.b Variation of difference between means of standardmethod and IR method.
C o n clu sionThe new , rapid instrum ental method for de
term ination of components in meat seems to have a precision superior to near IR reflexion measurements and at the same leve l as standard
Table 3. Statistical analysis of results obtained on a group of 17 different meat products
Statistic Fat, % Protein, %Repeatability SD. S0
0.30 0.20Between instruments SD, S,a
0.20 0.16
Between method SD. SM
0.48 0.22Reproducibility SD, So + S| 0.58 0.26Accuracy SD, S| + Sm
0.52 0.27
3 Variation of sample results between instruments.

1396 BJARNO: J. ASSOC. OFF. ANAL. CHEM. (VOL. 64, No. 6, 1981)
Table 4. Instrument performance for carbohydrates
Carbohydrate Instrument 1, % Instrument 2, %D-Glucose 27.80 28.70D-Galactose 27.17 25.93Lactose 27.00 27.05
methods. Th is new method w il l be fu rther in vestigated through collaborative studies.
A ck n ow led gm en tThe author expresses appreciation to Benthe
Rasmussen for excellent technical assistance, to Steen Christoffersen, H en rik Rastrup Andersen, and Sten Andersen Nex$ for helpful discussions, and to Ebbe Johansen for encouragements.
References(1) Egidius, P. E. (1976) U.S. Patent 3,964,869(2) The Bakers Digest (December 1974) pp. 28-30(3) Pinckney, A. J. (1949) Cereal Chem. 26,439(4) Kingsley, G. R. (1939) J. Biol. Chem. 131,197
(5) Egidius, P. E. (1974) U.S. Patent 3,815,424(6) Egidius, P. E. (1970) U.S. Patent 3,442,623(7) Goulden, J. D. S. (1959) J. Sci. Food Agric. 7, 609-
613(8) Shields, J. (1975) Thesis submitted for Degree of
Bachelor of Philosophy, University of York, UK(9) Nex$, S. A., & Frandsen, A. S. (1980) U.S. Patent
No. 4,236,075(10) Nexp, S. A., & Andersen, H. R. (1981) U.S. Patent
No. 4,247,773(11) Webster, D. R„ & Gansell, E. R. (1973) U.S. Patent
No. 3,765,775(12) Zepp, R. (1979) Starch 31,57-63(13) Hauser, E., & Weber, V. (1978) Die Fleischzvirtschaft
58,452-459(14) Hauser, E., & Weber, V. (1980) Fleisclnuirtschaft 60,
482-485(15) Official Methods of Analysis (1980) 13th Ed., AOAC,
Arlington, VA(16) “Changes in Methods" (1980) ]. Assoc. Off. Anal. Chem. 63, 384(17) Hermann, C., Thoma, H., & Kotter, L. (1976) Fleischwirtschaft 56, 87-88(18) Lehninger, A. L. (1972) Biochemistry, Worth Pub
lishers Inc., New York, NY, p. 94(19) Youden, W. J., & Steiner, E. H. (1975) Statistical Manual of the AOAC, AOAC, Arlington, VA

FOX ET AL.: J. ASSOC. OFF. ANAL. CHEM. (VOL. 64, NO. 6, 1981) 1397
I n t e r a c t i o n B e t w e e n S a m p l e P r e p a r a t io n T e c h n i q u e s a n d C o l o r i m e t r i c R e a g e n t s i n N i t r i t e A n a l y s i s i n M e a t
J A Y B . F O X , T A T IA N A E . Z E L L , an d A A R O N E . W A S S E R M A NU.S. Department of Agriculture, Agricultural Research, Eastern Regional Research Center,Philadelphia, PA 19118The amount of nitrite measured in model and meat systems was a function of the interactions of the chloride and ascorbate concentrations with the method of sample preparation and the combination of Griess reagents used for colorimetric determination. Ascorbate caused loss of nitrite in the samples when heated and interfered in the Griess reaction, increasing the concentration of pigment formed from any given concentration of nitrite if sulfanilic acid and iV-(l-naphthyl)-ethylenediamine were used, and decreasing the amount if sulfanilamide and 1-naph- thylamine were used. The interference was elim inated by both the AOAC procedure and mercuric chloride addition, although the former were less effective at higher ascorbate concentrations. Chloride increased the amount of pigment formed from a given amount of nitrite with sulfanilic acid but had no effect on the amount of sulfanilamide pigment.
Although sample preparation for the analysis of n itrite in meat products varies w ith respect to degree of d ilu tion , temperature of heating, al- kalin ization , or addition of various precipitating agents, the most common method of analysis is the spectrophotometric measurement of a diazo pigm ent formed from some combination of Griess reagents (1-8). The amount of pigment formed is affected by the presence of ascorbate (1, 2) and chloride (3). Ascorbate reduces the formation of carcinogenic nitrosamines in cured meat products (9) but the addition of large amounts of ascorbate interferes in the Griess reaction. Lo w yie lds of pigment, therefore, could be due either to a real loss of n itrite in the meats or to the ascorbate interference. U ntil now there has been no way of distinguishing these 2 effects, but it has been reported recently that ascorbate w il l either enhance or decrease the amount of pigment formed, depending on the combination of Griess reagents used (10).
The purpose of th is study was to determ ine if th is d ifferentia l effect can be used to detect residual ascorbate in cured meats and to determine the effectiveness of sample preparation procedures on rem oval of ascorbate. We used the specific combinations of su lfan ilic acid (SA A ) w ith N -(l-naphthyl)-ethylenediam ine (N ED )
Received A pril 2, 1981. Accepted June 30, 1981.
and sulfanilam ide (SA N ) w ith 1-naphthylamine (1-N A), because these 2 combinations showed the greatest differences between the amount of pigm ent produced from any g iven amount of n itrite in the presence of ascorbate. For brevity, we shall refer to the firs t combination as SA A , and the second as SAN .
E xperim entalM o d e l S y s t e m
Four model stock solutions were prepared in ionic strength T /2 = 0.03 acetate buffer, pH 5.5, each containing 2 mM nitrite and either 0, 3, 6, or 12 mM ascorbate. H a lf of each solution was made 1M in N aC l by addition of the appropriate amount of solid salt. A l l solutions were analyzed for n itrite , and then heated 1 h at 70°C in a ir. We chose pH 5.5 as the low er end of the range of meat pH values, to ensure an appreciable n itrite loss.
M e a t S y s t e mA slu rry was prepared by b lending pork sem-
itendinosus muscle w ith an equal volum e (w /v ) of 6 mM sodium n itrite . A liquots of the s lu rry were combined w ith h a lf their volum es of solutions containing 0, 9, 18, or 36 m M sodium ascorbate, respectively. Each of these slurries was then divided into 3 aliquots and N aCl was added so that samples at every level of sodium ascorbate contained 0 ,0 .5 , or 1.0M N aC l. H a lf (10 m L) of each of the 12 samples was placed in a controlled water bath 1 h at 70°C . A l l of the 24 (12 raw and 12 cooked) samples were analyzed for n itrite as soon as prepared. The pH was 5.62.
N i t r i t e A n a l y s e sD ir e c t a n a ly s is . —Aliquots of the slurries were
centrifuged 20 m in at 48 200 g. The clear su- pernates were carefully removed w ith a syringe fitted w ith a 28 gauge needle. One-tenth m L was added to 1.0 m L of each appropriate Griess reagent solution in a 10 m L volum etric flask and diluted to volum e. Turb id ities of the pigm ent solutions were determ ined at 600 nm but were not of practical significance.
M e r c u r ic c h lo r id e a d d it io n .— A saturated mer-
0004-5756/81 /6406-1397-06$01.00 © Association of Official Analytical Chemists, Inc.
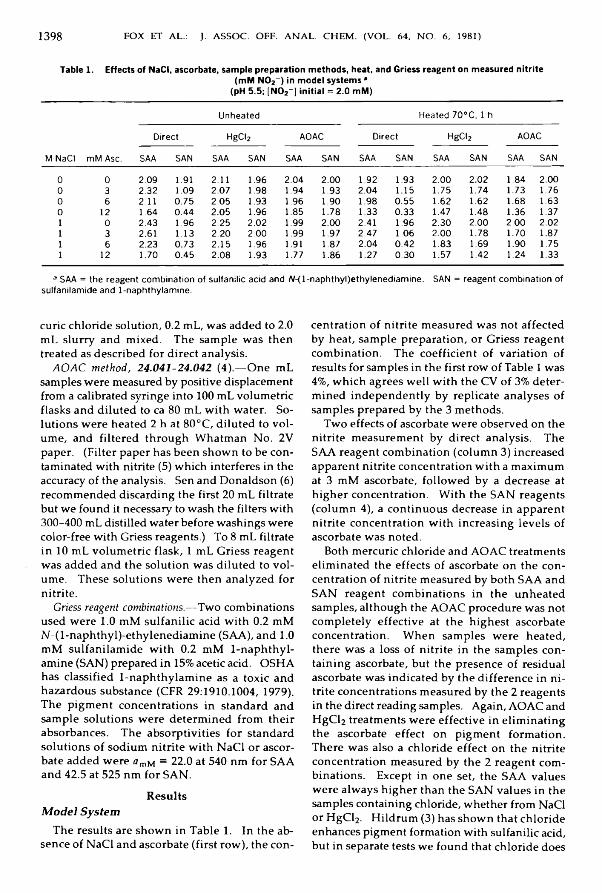
1398 FOX ET AL.: J. ASSOC. OFF. ANAL. CHEM. (VOL. 64, NO. 6, 1981)
Table 1. Effects of NaCI, ascorbate, sample preparation methods, heat, and Griess reagent on measured nitrite(mM N02_) in model systems *
(pH 5.5; [INI02~] initial = 2.0 mM)
M NaCI mM Asc.
Unheated Heated 70°C, 1 hDirect HgCI2 AOAC Direct HgCI2 AOAC
SAA SAN SAA SAN SAA SAN SAA SAN SAA SAN SAA SAN0 0 2.09 1.91 2.11 1.96 2.04 2.00 1.92 1.93 2.00 2.02 1.84 2.000 3 2.32 1.09 2.07 1.98 1.94 1.93 2.04 1.15 1.75 1.74 1.73 1.760 6 2.11 0.75 2.05 1.93 1.96 1.90 1.98 0.55 1.62 1.62 1.68 1.630 12 1.64 0.44 2.05 1.96 1.85 1.78 1.33 0.33 1.47 1.48 1.36 1.371 0 2.43 1.96 2.25 2.02 1.99 2.00 2.41 1.96 2.30 2.00 2.00 2.021 3 2.61 1.13 2.20 2.00 1.99 1.97 2.47 1.06 2.00 1.78 1.70 1.871 6 2.23 0.73 2.15 1.96 1.91 1.87 2.04 0.42 1.83 1.69 1.90 1.751 12 1.70 0.45 2.08 1.93 1.77 1.86 1.27 0.30 1.57 1.42 1.24 1.33
a SAA = the reagent combination of sulfanilic acid and N-(l-naphthyl)ethylenediamine. SAN = reagent combination of sulfanilamide and 1-naphthylamine.
curie chloride solution, 0.2 m L, was added to 2.0 m L s lu rry and mixed. The sample was then treated as described for direct analysis.
A O A C m e th o d , 2 4 .0 4 1 - 2 4 .0 4 2 (4 ).— One m L samples were measured by positive displacement from a calibrated syringe into 100 m L volumetric flasks and diluted to ca 80 m L w ith water. Solutions were heated 2 h at 80 °C , diluted to vo lume, and filtered through Whatman No. 2V paper. (F ilte r paper has been shown to be contaminated w ith nitrite (5) which interferes in the accuracy of the analysis. Sen and Donaldson (6 ) recommended discarding the first 20 m L filtrate but we found it necessary to wash the filters w ith 300-400 m L distilled water before washings were color-free w ith Griess reagents.) To 8 m L filtrate in 10 m L volum etric flask , 1 m L Griess reagent was added and the solution was diluted to vo lume. These solutions were then analyzed for n itrite .
G riess rea g en t co m b in a tio n s .—Two combinations used were 1.0 mM su lfan ilic acid w ith 0.2 mM N-(l-naphthyl)-ethylenediam ine (SA A ), and 1.0 mM sulfanilam ide w ith 0.2 mM 1-naphthyl- amine (SAN ) prepared in 15% acetic acid. O SH A has classified 1-naphthylam ine as a toxic and hazardous substance (C FR 29:1910.1004, 1979). The pigment concentrations in standard and sample solutions were determ ined from their absorbances. The absorptivities for standard solutions of sodium n itrite w ith N aCI or ascorbate added were amM = 22.0 at 540 nm for SA A and 42.5 at 525 nm for SA N .
R esultsM o d e l S y s t e m
The results are shown in Table 1. In the absence of N aCI and ascorbate (first row ), the con
centration of n itrite measured was not affected by heat, sample preparation, or Griess reagent combination. The coefficient of variation of results for samples in the first row of Table 1 was 4%, w h ich agrees w ell w ith the C V of 3% determined independently by replicate analyses of samples prepared by the 3 methods.
Two effects of ascorbate were observed on the n itrite measurement by direct analysis. The SA A reagent combination (column 3) increased apparent n itrite concentration w ith a maximum at 3 mM ascorbate, followed by a decrease at higher concentration. W ith the SAN reagents (column 4), a continuous decrease in apparent n itrite concentration w ith increasing levels of ascorbate was noted.
Both mercuric chloride and A O A C treatments elim inated the effects of ascorbate on the concentration of n itrite measured by both SA A and SA N reagent combinations in the unheated samples, although the A O A C procedure was not completely effective at the highest ascorbate concentration. W hen samples were heated, there was a loss of n itrite in the samples contain ing ascorbate, but the presence of residual ascorbate was indicated by the difference in n itrite concentrations measured by the 2 reagents in the direct reading samples. Again, A O A C and H g C l2 treatments were effective in elim inating the ascorbate effect on pigm ent form ation. There was also a chloride effect on the n itrite concentration measured by the 2 reagent combinations. Except in one set, the S A A values were always h igher than the SAN values in the samples containing chloride, whether from NaCI or H g C l2. H ild rum (3) has shown that chloride enhances pigment formation w ith sulfanilic acid, but in separate tests we found that chloride does

FOX ET AL.: J. ASSOC. OFF. ANAL. CHEM. (VOL. 64, NO. 6, 1981) 1399
Table 2. Effects of NaCI, ascorbate, sample preparation methods, heat, and Griess reagents on measured nitrite(mill NO2-) in meat slurry 3
(pH 5.6; [NO2- ] initial = 2.1 mM (145 ppm))
Raw CookedDirect HgCl2 AOAC Direct HgCl2 AOAC
M NaCI mM Asc. SAA3 SAN SAA SAN SAA SAN SAA SAN SAA SAN SAA SAN0 0 2.23 2.15 1.79 1.70 2.07 1.90 1.85 1.87 1.64 1.37 2.01 1.910 3 2.79 1.64 1.76 1.65 2.21 1.83 2.09 1.38 1.36 1.27 2.00 1.760 6 2.63 1.27 1.72 1.63 2.62 1.61 1.98 1.01 1.33 1.20 2.04 1.540 12 2.29 0.81 1.77 1.67 2.70 1.28 1.58 0.66 1.22 1.13 1.91 1.160.5 0 2.33 2.40 2.29 2.07 1.82 1.73 2.09 1.79 2.02 1.76 1.98 1.910.5 3 2.72 1.61 2.07 1.97 1.86 1.63 1.84 1.19 1.60 1.39 1.45 1.430.5 6 2.72 1.24 2.00 1.90 2.14 1.56 1.58 0.87 1.45 1.28 1.45 1.240.5 12 2.33 0.81 2.00 1.93 2.37 1.26 1.35 0.53 1.31 1.18 1.45 0.931 0 2.45 1.91 2.16 1.97 2.01 1.85 2.20 1.83 2.03 1.71 1.84 1.761 3 2.42 1.62 2.08 1.91 2.08 1.78 1.98 1.17 1.71 1.30 1.54 1.371 6 2.44 1.20 2.03 1.84 2.50 1.29 1.49 0.71 1.36 1.07 1.30 1.021 12 1.84 0.81 2.18 1.87 2.20 1.27 0.93 0.39 1.03 0.86 1.09 0.733 SAA = reagent combination of sulfanilic acid and N-(l-naphthyl)ethylenediamine. SAN = sulfanilamide and 1-naphthyl- amine.
not affect the amount of pigm ent formed from sulfanilam ide. The difference is therefore due to the d ifferentia l effect of chloride on the ni- trosation of the 2 reagents.
M e a t S l u r r yHeat caused a loss of n itrite in a ll but 3 of the
meat s lu rry samples (Table 2). The loss in the samples w ith no added reductant (first row) was about 10% (sign ificant at P = 0 .02 from paired variate f-test) and was due to reaction w ith endogenous compounds in meat. A n examination of a ll data, especially from the ascorbate-containing samples, shows that the measured nitrite was not uniform for any one of the factors studied , but was the result of interactions w ith the other experim ental conditions. A n analysis of variance (Table 3) showed that the variations could be accounted for by 4 three-factor in teractions. Since the mean values for the 3-way combinations most c learly illustrate the more salient features of the corresponding 3-factor interactions, they are shown graphically in F ig ures 1-4.
H e a t P ro cess in g X S a lt X A s c o r b a te .— The mean
Table 3. Significant 3-factor interactions from analysis of variance of data of Table 2
Interaction Fratio Significance, pProcessing x salt x ascorbate 3.42 0.033Processing X preparation x reagent 20.3 0.0001Processing X reagent x ascorbate 10.9 0.0010Prepartion X reagent x ascorbate 22.9 0.0001
values (n = 6 ) for the first combination in Table 3 are shown in Figure 1. Measured n itrite decreases in both raw and cooked samples w ith both salt and ascorbate. Because the raw samples were analyzed for nitrite immediately after being prepared, there was little time for n itrite to react w ith tissue components or added ascorbate, and the observed regression is due to ascorbate in terference in the Griess reaction. A lthough chloride has no effect on the measured concentration of n itrite in the raw samples, the loss of n itrite in the cooked samples due to ascorbate was enhanced by increasing chloride concentration. Assum ing nitrite loss on heating to be
Figure 1. Mean values (n = 6) illustrating 3-factor interaction of heat, salt, and ascorbate concentration effects on measured nitrite in pork slurry. □ , 0 salt; O, 0.5M NaCI; A, 1.0M NaCI. Solid symbols, un
heated; open symbols, heated.

1400 FOX ET AL.: J. ASSOC. OFF. ANAL. CHEM. (VOL. 64, NO. 6, 1981)
24 -
20 -
1.6 -
R - 1.67 1.40 1.07 1.56 1.19 1.16|d-UNHEATED-î>] | o - HEATED —H
Figure 2. Mean values (n = 12) illustrating 3-factor interaction of heat, preparation method, and reagent on measured nitrite. First bar in pair SAA, second SAN. Figure below reagent pair is ratio of SAA to
SAN values.
Figure 3. Mean values (n = 9) illustrating 3-factor interaction of heat, reagent, and ascorbate concentration on measured nitrite. □ , SAA; O, SAN. Solid
symbols, unheated; open symbols, heated.
related to the reactivity of the nitrosating species, th is chloride enhancement may be attributed to the formation of nitrosylchloride (NOC1), a more reactive nitrosating species than N 2O 3, the species formed from n itrite alone (11). O n the basis of the observation that loss of n itrite was not proportional to chloride level in the model system, it may be attributable to NOC1 being more reactive than N 2O 3 w ith meat tissue components.
H e a t P ro c e ss in g X P re p a r a tio n X R e a g e n t .—The difference in measured n itrite by the 2 co lorimetric reagents (Table 2) was a function of both processing and method of preparation (second interaction, Table 3). The mean values (n = 12) are plotted in Figure 2. In addition to the decrease in measured nitrite after heating, the d ifference between the 2 colorimetric reagents was less in the cooked than in the raw samples for both the direct and AO A C preparation methods. As was observed in the model system, the reagent difference is due to residual ascorbate, w h ich was on ly partia lly destroyed in the meat slurries by the heating process. The difference was m inim al in the H g C h samples because ascorbate was removed by precipitation w ith m ercuric ion, but the chloride effect was s till present.
H e a t P r o c e ss in g X R e a g e n t X A s c o r b a te .—Table 2 shows that, although the nitrite concentrations in the unheated samples measured by S A A were re la tive ly constant, there was a regression w ith ascorbate in the heated/SAA samples and in a ll the SAN samples. Th is 3-factor interaction was
significant (P = 0.0001); the mean values (n = 9) are shown in Figure 3. In the unheated samples the ascorbate enhancement of pigment formation from the SA A reagent is observed, as w e ll as the decrease in the pigment formed from the SA N reagent. In the heated samples, the SA A values were uniform ly higher than the SAN values, due to both the ascorbate and chloride enhancement of S A A pigment form ation, but there was a sign ificant regression of measured nitrite w ith ascorbate in the SA A samples. The coincidence of the SAA/heated and SAN /unheated data is happenstance and has no significance.
P rep a ra tio n X R ea g en t X A sco rb a te .—The fourth3-factor interaction in Table 3 is the most relevant to the intent of th is study in that it shows the effect of the sample preparation techniques on the ascorbate interaction w ith the 2 colorimetric reagents. The mean values (n = 6 ) for this in teraction are shown in Figure 4. The regressions of measured nitrite w ith ascorbate concentration are not linear because nitrite loss is a function of the square root of the ascorbate concentration ( 12 , 13). The differential effects of both chloride and ascorbate on pigment production are observed in the curves of the direct and AO A C procedures, but only the d ifferentia l chloride effect on p igment production from the 2 reagent combinations in the H gC l2 procedure. The in itia l values d iffe r because of the chloride effect, but the d irect and A O A C curves diverge w ith increasing ascorbate, indicating residual ascorbate. Because the A O A C procedure was effective in rem oving ascorbate in the model systems, it is evident that the ascorbate in the slurries was protected against
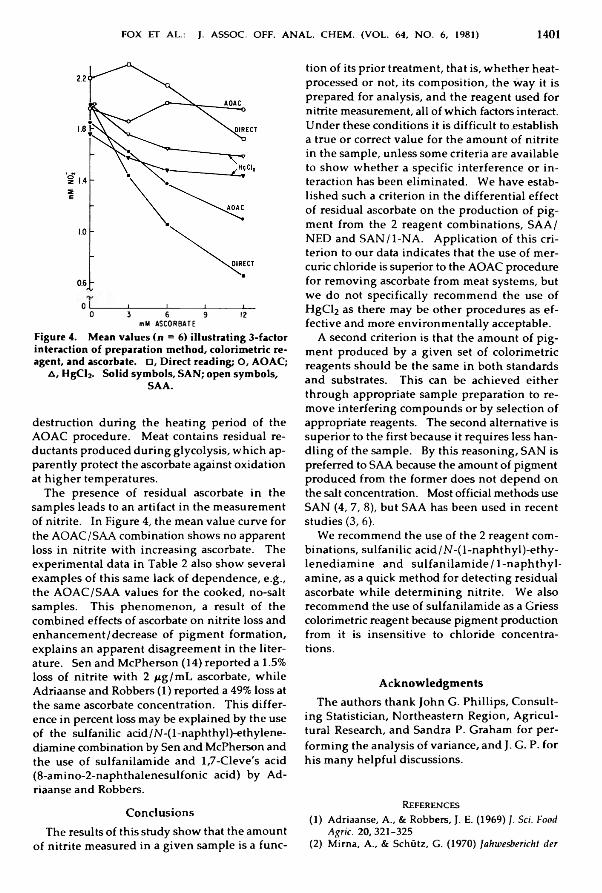
FOX ET AL.: J. ASSOC. OFF. ANAL. CHEM. (VOL. 64. NO. 6, 1981) 1401
0 I_____ i______I______i_____ i 0 3 6 9 12mM ASCORBATEFigure 4. Mean values (n = 6) illustrating 3-factor interaction of preparation method, colorimetric reagent, and ascorbate. O, Direct reading; O, AOAC;
A, HgCh- Solid symbols, SAN; open symbols, SAA.
destruction during the heating period of the A O A C procedure. Meat contains residual re- ductants produced during g lyco lysis, w h ich apparently protect the ascorbate against oxidation at h igher temperatures.
The presence of residual ascorbate in the samples leads to an artifact in the measurement of n itrite . In Figure 4, the mean value curve for the A O A C /SA A combination shows no apparent loss in n itrite w ith increasing ascorbate. The experim ental data in Table 2 also show several examples of th is same lack of dependence, e.g., the A O A C /S A A values for the cooked, no-salt samples. T h is phenomenon, a result of the combined effects of ascorbate on n itrite loss and enhancement/decrease of pigm ent form ation, explains an apparent disagreement in the lite rature. Sen and McPherson (14) reported a 1.5% loss of n itrite w ith 2 fig /m L ascorbate, w h ile Adriaanse and Robbers (1) reported a 49% loss at the same ascorbate concentration. T h is d iffe rence in percent loss may be explained by the use of the sulfanilic acid/N-(l-naphthyl)-ethylene- diamine combination by Sen and McPherson and the use of sulfanilam ide and 1,7-Cleve's acid (8-amino-2-naphthalenesulfonic acid) by Adriaanse and Robbers.
C o n clu sio n sThe results of this study show that the amount
of n itrite measured in a g iven sample is a func
tion of its p rio r treatment, that is, w hether heat- processed or not, its composition, the w ay it is prepared for analysis, and the reagent used for nitrite measurement, a ll of w hich factors interact. Under these conditions it is d ifficu lt to establish a true or correct value for the amount of n itrite in the sample, unless some criteria are available to show whether a specific interference or in teraction has been elim inated. We have established such a criterion in the d ifferentia l effect of residual ascorbate on the production of p igment from the 2 reagent combinations, SA A / N ED and S A N / l-N A . Application of this c riterion to our data indicates that the use of m ercuric chloride is superior to the AO A C procedure for rem oving ascorbate from meat systems, but we do not specifically recommend the use of H g C l2 as there may be other procedures as effective and more environm entally acceptable.
A second criterion is that the amount of p igm ent produced by a g iven set of colorim etric reagents should be the same in both standards and substrates. Th is can be achieved either through appropriate sample preparation to remove interfering compounds or by selection of appropriate reagents. The second alternative is superior to the first because it requires less hand ling of the sample. By th is reasoning, SA N is preferred to SA A because the amount of pigment produced from the form er does not depend on the salt concentration. Most official methods use SA N (4, 7, 8), but SA A has been used in recent studies (3, 6).
We recommend the use of the 2 reagent combinations, su lfan ilic acid/N -(l-naphthyl)-ethy- lened iam ine and su lfan ilam id e /I-n ap h th y l- am ine, as a quick method for detecting residual ascorbate w h ile determ ining n itrite . We also recommend the use of sulfanilam ide as a Griess colorimetric reagent because pigment production from it is insensitive to chloride concentrations.
A ck n o w led g m en tsThe authors thank John G. P h illip s , Consult
ing Statistician, Northeastern Region, A g ricu ltural Research, and Sandra P. Graham for perform ing the analysis of variance, and J. G . P . for h is many help fu l discussions.
References(1) Adriaanse, A., & Robbers, J. E. (1969) J. Sei. Food
Agric. 20,321-325(2) Mirna, A., & Schütz, G. (1970) Jahwesbericht der

1402 FOX ET AL.: J. ASSOC. OFF. ANAL. CHEM. (VOL. 64, NO. 6, 1981)
Bundesanstalt fur Fleischforschung. G83-4(3) Hildrum, K. I. (1979) J. Assoc. Off. Anal. Chem. 62,
956-958(4) Official Methods of Analysis (1980) 13th Ed., AOAC,
Arlington, VA, secs 24.041-24.042(5) Fiddler, R. N. (1977) /. Assoc. Off. Anal. Chem. 60,
594-599(6) Sen, N. P., & Donaldson, B. (1978) /. Assoc. Off.
Anal. Chem. 61,1389-1394(7) International Organization for Standardization
(1975) IS02918-1975(E), Meat and Meat Products, ISO, Geneva, Switzerland
(8) Nordisk Metodik—Komite for Levnedsmidler
(1963) UDC 546.173, Nr49, NMKL, Copenhagen, Denmark
(9) Fiddler, W., Pensabene, J. W., Piotrowski, E. G., Doerr, R. C., & Wasserman, A. E. (1973) J. Food Sci. 38, 1084
(10) Fox, J. B„ Jr, (1979) Anal. Chem. 51,1493-1502(11) Austin, A. T. (1961) Sci. Progr. 49,619-640(12) Fox, J. B., Jr, & Thomson, J. S. (1963) Biochemistry
2,465-470(13) Fox, J. B„ Jr, & Nicholas, R. A. (1974) J. Agric. Food
Chem. 22, 302-306(14) Sen, N. P., & McPherson, M. (1978) /. Food Safety
1,247-255

PAYNE & BENNER: J. ASSOC. OFF. ANAL. CHEM. (VOL. 64, NO. 6, 1981) 1403
I N D U S T R I A L C H E M I C A L S
L i q u i d a n d G a s C h r o m a t o g r a p h i c A n a l y s i s o f D i e t h y l P h t h a l a t e i n W a t e r a n d S e d i m e n tWILLIAM R. PAYNE, Jr, and JACQUELYN E. BENNEREnvironmental Protection Agency, Environmental Research Laboratory, Athens, GA 30613
Diethyl phthalate was determined in water and sediment by high performance liquid chromatography (HPLC) and in water by gas-liquid chromatography with electron capture detection (GLC-ECD). Water samples were extracted with hexane, using a high-speed homogenizer-ultrasonic apparatus and a test tube mixer. Sediments were Soxhlet-extracted using acetonitrile. For HPLC, diethyl phthalate was determined in normal phase mode using a Zorbax-CN column, a 2% isopropanol-hexane solvent system, and a UV variable wavelength detector. For GLC-ECD, a 3% SE-30 Gas-Chrom Q column with a 63Ni electron capture detection system was used. Recoveries from fortified samples ranged from 93.9 to 98.0% for water at 0.01-0.50 ppm, and from 90.0 to 93.6% for sediment at 0.2-2.0 ppm.
The Expo su re A n a lys is M odeling System (EX A M S), a computerized system for analyzing the fate of toxic substances in aquatic environments, is currently under development by the Environm ental Protection Agency (L . Burns and M . C line , EP A , Athens, G A ). Tests to compare predictions from EXAM S w ith experimental data from controlled laboratory ecosystems required an analytical method for diethyl phthalate (DEP) in water and sediment. The research dictated that the method be applicable to large numbers of samples w ith emphasis on reducing the time between sam pling and extraction procedures.
D EP is w id e ly used as an insect repellent, for p lasticizing cellulose esters, in propellant formulations, and in the manufacture of fragrances. The production of phthalate esters in the United States has increased at a steady rate from 300 m illio n pounds in 1960 to over 1 b illio n pounds in 1975. The annual production is expected to increase to approxim ately 10 b illio n pounds by the turn of the century (1).
Peakall (2) reviewed the occurrence, biological activity, toxicology, and accumulation factors for phthalates in the environm ent. The review pointed out that data are lacking to adequately assess the environm ental risk and to predict the
M ention of trade nam es or commercial products does not constitute endorsem ent o r recom m endation for use by the U.S. Environm ental Protection Agency.
Received M arch 31,1981. Accepted June 18,1981.
point of occurrence of m axim um residue levels.
Several authors have addressed the analytical procedures and problems in the analysis of phthalates. Fishbein and A lbron (3) reviewed the analytica l methods, biological properties, stab ility, and episodes of phthalate occurrence in the enviornment. Giam et al. (4-6) and Ishida et al. (7) considered the problem of background contamination from phthalates present in comm ercial laboratory reagents, glassware, and equipment.
The use of h igh performance liqu id chromatography (H P LC ) was proposed by M ori (8) for the determ ination of phthalates in r ive r water and by Persiani and Cukor (9) for the determ ination of phthalates in industrial effluents and biological samples.
Corcoran (10), Thomas (11), and N orw itz and Apatoff (12) proposed gas chromatographic (G LC ) methods using the electron capture detector (ECD) for phthalates. The detector, which responds to many classes of compounds w ith an a ffin ity for electrons, usually exhibits high background because of interference from coextractives in environm ental samples w ith in adequate or no cleanup. Tim e-consum ing cleanup and isolation techniques cannot be omitted in many samples, especially sediments, i f the electron capture detector is to be used for determ ination. The problem of background interferences can be lessened by the use of H P LC . Less sample preparation and cleanup is required by taking advantage of the w ide selection of column types, mobile phases, and detectors available, such as the variable wavelength U V detector. For example, the molar absorption coefficient at 224 nm , the maximum absorption wavelength for D EP , is approxim ately 10 times that of the standard fixed wavelength, 254 nm, thus providing some degree of selectivity for this detector.
M E T H O D
A p p a r a t u s a n d R e a g e n t s(a) High performance liquid chromatograph .—
Tracor Model 900-78S chromatograph w ith a
0004-5756/81/6406-1403-05$01.00 © Association of Official Analytical Chemists, Inc.

1404 PAYNE & BENNER: J. ASSOC. OFF. ANAL. CHEM. (VOL. 64, NO. 6, 1981)
970A variable wavelength U V detector and Valeo U C L I closed loop injection system. Column was Zorbax-CN (E. I. du Pont de Nemours & Co., Inc., W ilm ington , D E), 25 cm X 4.6 mm id, w ith WJiatman CoiPell PAC guard column and mobile phase of 2% isopropanol-hexane at 1.0 m L/m in and 350-400 psi.
(b) G a s - l iq u id c h r o m a to g r a p h .—Tracor Model 222Q chromatograph w ith 63N i electron capture detector operated in the D C mode. Colum n was borosilicate glass, 8 ft X V4 in . od cut for off-col- umn injection and packed w ith 3% SE-30 on 80-100 mesh Gas-Chrom Q. Operating conditions: nitrogen flow rate, column 50 m L/m in , purge 30 m L/m in ; temperatures (°C )—colum n, 200; detector, 275; injection port, 240; transfer lin e , 275; Westronics MT-22 recorder 30 in ./h .
(c) H o m o g e n iz e r .—Brinkm ann Polytron PT- 10-35 w ith PT-20ST probe generator.
(d) T e s t tu b e m ix e r .—Vortex Genie K-550-G.(e) S o x h le t a p p a r a tu s .— Pyrex 3840.(f) S o lv e n t s .—Acetonitrile , hexane, isooctane,
isopropanol—distilled in glass, a ll solvents H P L C grade (Burdick & Jackson Laboratories, In c ., M uskegon, M I).
(g) D ie th y l p h th a la te .—(A ldrich Chem ical Co., M ilw aukee, W I). Weigh 50 mg and place into 100 m L volum etric J flask and dilute to volum e w ith fina l extracting solvent. Stock standards are stable i f stoppered tightly , sealed, and protected from light under refrigeration.
H P L C D e t e r m i n a t i o n(a) W a te r .—Transfer 300.0 m L sample to 500
m L reagent bottle that contains 100 m L hexane. Extract samples, using Polytron homogenizer 2 m in at 25 000 rpm. Transport bottles to laboratory for fo llo w in g add itional extractions: Transfer contents of bottles to 1 L separatory funnels w ith hexane, allow phase separation, and transfer water layer to second 1 L separatory funnel. Collect hexane from first extraction in 400 m L beaker. Extract water in 1 L separatory funnel two more times, using homogenizer and 100 m L and 50 m L portions of hexane. Add these extracts to first extract in 400 m L beaker and concentrate combined hexane extracts on water bath to ca 5-8 m L. Transfer quantitatively w ith hexane to graduated (calibrated) 15 m L conical test tubes and seal w ith T stoppers.
(b) S e d im e n t .—Clean glass wool and filte r papers (Whatman No. 42,15 cm) by placing them in large Soxhlets and extracting 4 h w ith hexane. Transfer glass wool and filte r papers to beakers and place on steam bath under hood to evaporate hexane. Spread filte r papers on acetone-rinsed
alum inum fo il and dry 1 h in 120°C oven. Place in desiccator, cool 5 m in , remove one at a time, number, and record tare weight. Place Büchner filtering funnel (127 mm od) on side-arm filte ring flask w ith filter-vac disc. Prewet filter paper and shape into Büchner funnel, leaving sm all rim of filte r paper turned up around sides of funnel. Seat paper w ith low vacuum , add wet sediment, and rinse w ith ca 10 m L distilled water to form sediment pad. Release vacuum, remove pad and filte r , and gently fo ld in fluted form. Place sediment and filte r into Soxhlet extractor containing small plug of glass wool at the bottom and add small plug of glass wool to top of sample. Extract 4 h w ith acetonitrile. Siphon over any acetonitrile rem aining in upper Soxhlet after extraction and rinse and siphon several times, collecting siphonings in beaker. Remove top glass wool plug, place pad in sm all beaker, and dry overnight in 120°C oven. Remove from oven to desiccator, cool for 30 m in , w eigh pad, and subtract tare of filter paper to obtain total net dry weight.
Q uantitatively transfer acetonitrile extract to beaker containing previous rinses and concentrate to ca 100 m L. Transfer quantitative ly to 2 L separatory funnel containing a 10X d ilution of d istilled water. Extract 3 times w ith 100, 100, and 50 m L portions of hexane, collecting a ll extracts in 400 m L beaker. Concentrate combined extracts on water bath to 5-8 m L, transfer quantitatively to 15 m L graduated (calibrated) conical test tube, and seal w ith J stopper. Record volum e in graduated tubes for water and sediment extracts. M ix thoroughly and, using 50 p L syringe, inject into 20 p L H P L C sample loop. D EP concentration is determined by peak height comparison of sample and D EP reference standard.
G L C - E C D D e t e r m i n a t i o n f o r W a t e rTransfer 2.0 m L sample to 15 m L T conical test
tube and add 1.0 m L isooctane. Experim ental data on 6 sample:solvent ratios show that sample size may be varied w ith good toxicant recovery i f the sample:solvent ratio is 2:1. Extract by m ixing stoppered sample tubes 2 m in on vortex mixer at 1000-1200 rpm. Let solvent-water layer separate and inject 3-8 p L of top isooctane layer into gas chromatograph. D EP concentration is determined by comparing peak heights of sample w ith D EP standard.
R esults and D iscu ssio nFortified ecosystem w ater samples were
chromatographed on a Zorbax-ODS m ethanol-
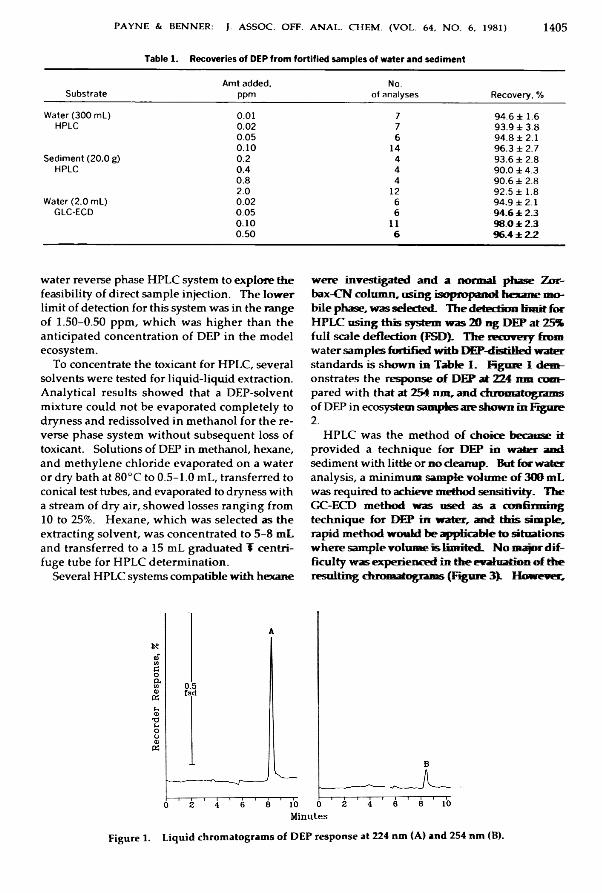
PAYNE & BENNER: J. ASSOC. OFF. ANAL. CHEM. (VOL. 64, NO. 6, 1981) 1405
Table 1. Recoveries of DEP from fortified samples of water and sediment
Substrate Amt added, ppm No.of analyses Recovery, %Water (300 mL) 0.01 7 94.6 ± 1.6HPLC 0.02 7 93.9 ± 3.80.05 6 94.8 ±2.10.10 14 96.3 ± 2.7Sediment (20.0 g) 0.2 4 93.6 ± 2.8HPLC 0.4 4 90.0 ± 4.30.8 4 90.6 ± 2.82.0 12 92.5 ± 1.8Water (2.0 mL) 0.02 6 94.9 ±2.1GLC-ECD 0.05 6 94.6 ±2.30.10 11 98.0 ± 2.30.50 6 9 6 .4 ± 2 ^
water reverse phase HPLC system to exp lore th e feasibility o f direct sam ple injection. The low er lim it o f detection for this system w as in the range o f 1.50-0.50 ppm , w h ich w as h igh er than th e anticipated concentration o f DEP in th e m odel ecosystem .
To concentrate th e toxicant for HPLC, several solven ts w ere tested for liquid-liquid extraction. A nalytical results sh ow ed that a D EP-solvent m ixture cou ld not be evaporated com p letely to dryness and red issolved in m ethanol for th e reverse phase system w ith ou t subsequent loss o f toxicant. Solutions o f DEP in m ethanol, hexane, and m eth y len e ch lorid e evaporated on a w ater or dry bath at 80°C to 0 .5-1 .0 mL, transferred to conical test tubes, and evaporated to dryness w ith a stream o f dry air, sh ow ed losses ranging from 10 to 25%. H exane, w h ich w as selected as th e extracting so lven t, w as concentrated to 5 -8 mL and transferred to a 15 mL graduated T centrifu ge tube for HPLC determ ination .
Several HPLC system s compatible w ith hexane
w ere in vestigated an d a norm al p h ase Zor- bax-CN co lu m n , u sin g isopropano l h ex an e m ob ile phase, w as selected . T h e detection lim it for HPLC u sin g th is system w a s 2 0 n g DEP a t 25% fu ll sca le deflection (FSD). T h e recovery from w ater sam ples fortified w ith DEP-distilled w ater standards is sh o w n i s Table I . F igure 1 dem onstrates the response o f DEP a t 224 itm com pared w ith that at 254 n m , an d chrom atogram s o f DEP in ecosystem sam ples are sh ow n in F igure 2.
HPLC w as the m ethod o f ch o ice because i t p rovided a tech n iq u e fo r DEP in w ater a n d sedim ent w ith little or n o cleanup. But for water analysis, a m in im um sam ple v o lu m e o f 3 0 0 mL w as required to achieve m ethod sensitiv ity . T he GC-ECD m eth od w a s u sed as a con firm in g tech n iq u e for DEP in w ater, a n d th is s im p le , rapid m eth od w o u ld b e applicab le to situ ation s w h ere sam p le v o lu m e s lim ited . N o major d ifficu lty w a s ex p erienced in th e ev a lu ation o f th e resu lting chrom atogram s (Figure 3). H ow ever,
Figure 1. Liquid chromatograms of DEP response at 224 nm (A) and 254 nm (B).
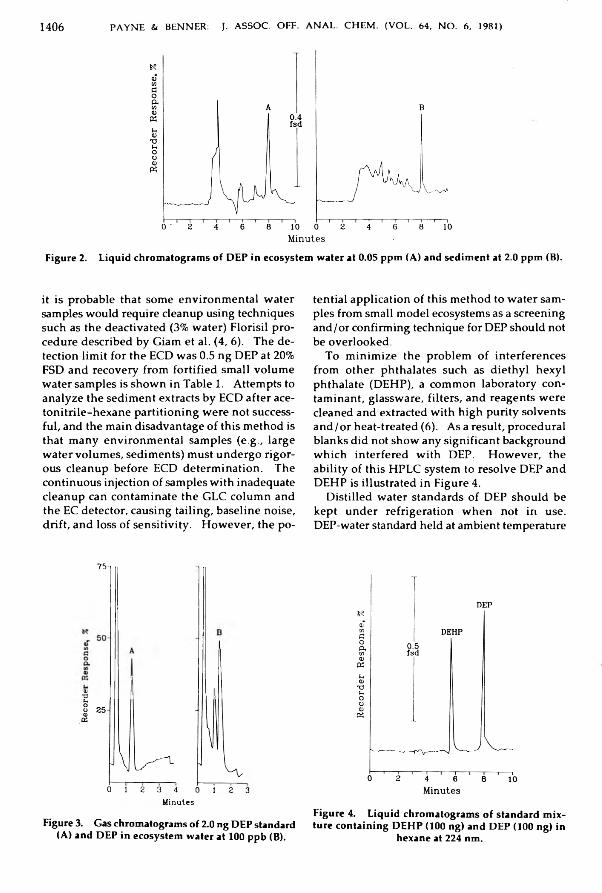
1406 PAYNE & BENNER: J. ASSOC. OFF. ANAL. CHEM. (VOL. 64, NO. 6, 1981)
Figure 2. Liquid chromatograms of DEP in ecosystem water at 0.05 ppm (A) and sediment at 2.0 ppm (B).
it is probable that som e environm ental w ater sam ples w ould require cleanup using techniques such as the deactivated (3% water) Florisil procedure described by Giam et al. (4, 6). The detection lim it for the ECD w as 0.5 n g DEP at 20% FSD and recovery from fortified sm all volu m e water sam ples is sh ow n in Table 1. Attem pts to analyze the sed im ent extracts by ECD after aceton itrile-h exan e partition ing w ere not successful, and the m ain disadvantage o f this m ethod is that m any environm ental sam ples (e.g ., large w ater volu m es, sed im ents) m ust undergo rigorous cleanup before ECD determ ination. The continuous injection o f sam ples w ith inadequate cleanup can contam inate the GLC colum n and the EC detector, causing ta iling, baseline noise, drift, and loss o f sensitiv ity . H ow ever, the po-
75
Q>•a
0 1 2 3 4 0 1 2 3Minutes
Figure 3. Gas chromatograms of 2.0 ng DEP standard (A) and DEP in ecosystem water at 100 ppb (B).
tential application o f this m ethod to w ater sam ples from sm all m odel ecosystem s as a screening and/or confirm ing technique for DEP should not be overlooked.
To m in im ize the problem o f interferences from other phthalates such as d ieth y l hexyl phthalate (DEHP), a com m on laboratory con tam inant, glassw are, filters, and reagents w ere cleaned and extracted w ith h igh purity solven ts a n d /o r heat-treated (6). As a result, procedural blanks did not sh ow any significant background w h ich interfered w ith DEP. H ow ever, the ability o f this HPLC system to resolve DEP and DEHP is illustrated in Figure 4.
D istilled w ater standards o f DEP sh ou ld be kept under refrigeration w h en not in use. DEP-water standard held at am bient temperature
Figure 4. Liquid chromatograms of standard mixture containing DEHP (100 ng) and DEP (100 ng) in
hexane at 224 nm.
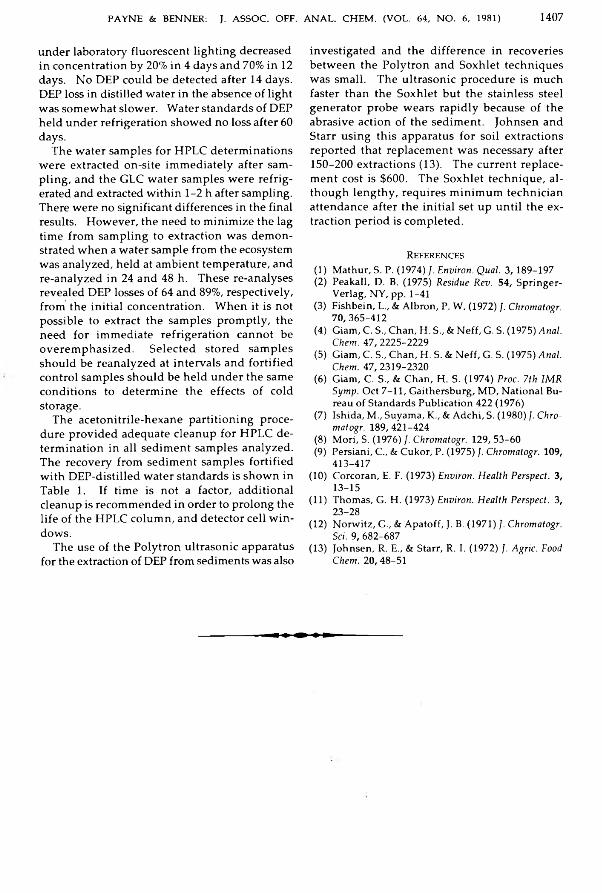
PAYNE & BENNER: J. ASSOC. OFF. ANAL. CHEM. (VOL. 64, NO. 6, 1981) 1407
under laboratory fluorescent lighting decreased in concentration by 20% in 4 days and 70% in 12 days. No DEP could be detected after 14 days. DEP loss in distilled water in the absence of light was somewhat slower. Water standards of DEP held under refrigeration showed no loss after 60 days.
The water samples for HPLC determinations were extracted on-site immediately after sampling, and the GLC water samples were refrigerated and extracted within 1 - 2 h after sampling. There were no significant differences in the final results. However, the need to minimize the lag time from sampling to extraction was demonstrated when a water sample from the ecosystem was analyzed, held at ambient temperature, and re-analyzed in 24 and 48 h. These re-analyses revealed DEP losses of 64 and 89%, respectively, from the initial concentration. When it is not possible to extract the samples promptly, the need for immediate refrigeration cannot be overemphasized. Selected stored samples should be reanalyzed at intervals and fortified control samples should be held under the same conditions to determine the effects of cold storage.
The acetonitrile-hexane partitioning procedure provided adequate cleanup for HPLC determination in all sediment samples analyzed. The recovery from sediment samples fortified with DEP-distilled water standards is shown in Table 1. If time is not a factor, additional cleanup is recommended in order to prolong the life of the HPLC column, and detector cell windows.
The use of the Polytron ultrasonic apparatus for the extraction of DEP from sediments was also
investigated and the difference in recoveries between the Polytron and Soxhlet techniques was small. The ultrasonic procedure is much faster than the Soxhlet but the stainless steel generator probe wears rapidly because of the abrasive action of the sediment. Johnsen and Starr using this apparatus for soil extractions reported that replacement was necessary after 150-200 extractions (13). The current replacement cost is $600. The Soxhlet technique, although lengthy, requires minimum technician attendance after the initial set up until the extraction period is completed.
References(1) M a th u r , S. P. (1974) J. Environ. Qual. 3 ,1 8 9 -1 9 7(2) P ea k a ll, D . B. (1975) Residue Rev. 54, S p r in g e r-
V erlag , N Y , p p . 1-41(3) F ish b e in , L„ & A lb ro n , P. W. (1972) J. Chromatogr.
7 0 ,3 6 5 -4 1 2(4) G iam , C. S„ C h a n , H . S., & N eff, G. S. (1975) Anal
Chem. 4 7 ,22 25 -2 2 29(5) G iam , C. S„ C h a n , H . S. & N eff, G. S. (1975) Anal.
Chem. 4 7 ,23 19 -2 3 20(6) G iam , C. S„ & C h a n , H . S. (1974) Proc. 7th I MR
Symp. O c t 7 -1 1 , G a ith e rsb u rg , M D , N a tio n a l Bure a u o f S ta n d a rd s P u b lic a tio n 422 (1976)
(7) Ish id a , M „ S uy am a, K „ & A d c h i, S. (1980) J. Chromatogr. 189, 421-424
(8) M o ri, S. (1976) /. Chromatogr. 129, 5 3 -60(9) P ersian i, C , & C u k o r, P. (1975) ]. Chromatogr. 109,
413-417(10) C o rco ra n , E. F. (1973) Environ. Health Perspect. 3,
13-15(11) T ho m as, G. H . (1973) Environ. Health Perspect. 3,
23-28(12) N o rw itz , G., & A p a to ff , J. B. (1971) J. Chromatogr.
Sci. 9 , 682-687(13) Jo h n se n , R. E., & S ta rr, R. I. (1972) ]. Agric. Food
Chem. 2 0 ,4 8 -5 1
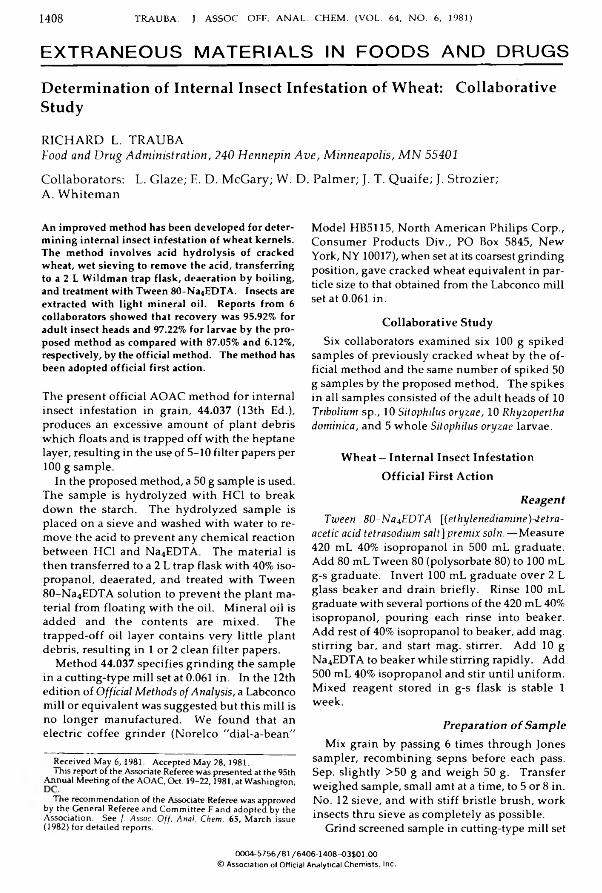
1408 TRAUBA: J. ASSOC. OFF. ANAL. CHEM. (VOL. 64, NO. 6, 1981)
E X T R A N E O U S M A T E R I A L S IN F O O D S A N D D R U G S
D e t e r m i n a t i o n o f I n t e r n a l I n s e c t I n f e s t a t i o n o f W h e a t : C o l l a b o r a t i v e S t u d y
RICHARD L. TRAUBAFood and Drug Administration, 240 Hennepin Ave, Minneapolis, M N 55401Collaborators: L. Glaze; E. D. McGary; W. D. Palmer; J. T. Quaife; J. Strozier;A. WhitemanA n im p ro v e d m e th o d h a s b e e n d e v e lo p e d fo r d e te r m in in g in te rn a l in se c t in f e s ta t io n o f w h e a t k e rn e ls . T h e m e th o d in v o lv e s ac id h y d ro ly s is o f c ra c k e d w h e a t , w e t s ie v in g to re m o v e th e ac id , t r a n s f e r r in g to a 2 L W ild m a n tr a p f la s k , d e a e ra tio n b y b o i l in g , a n d tre a tm e n t w ith T w een 80-N a4E D T A . In sec ts are e x tra c te d w i th l ig h t m in e ra l o il. R e p o r ts f ro m 6 c o lla b o ra to rs sh o w e d th a t re c o v e ry w a s 95.92% fo r a d u l t in se c t h e a d s a n d 97.22% fo r la rv a e b y th e p ro p o se d m e th o d as c o m p a re d w i th 87.05% a n d 6.12%, re sp ec tiv e ly , b y th e o ffic ia l m e th o d . T h e m e th o d has b e e n a d o p te d o ff ic ia l f i r s t a c tio n .
The present official AOAC method for internal insect infestation in grain, 44.037 (13th Ed.), produces an excessive amount of plant debris which floats and is trapped off with the heptane layer, resulting in the use of 5-10 filter papers per 1 0 0 g sample.
In the proposed method, a 50 g sample is used. The sample is hydrolyzed with HC1 to break down the starch. The hydrolyzed sample is placed on a sieve and washed with water to remove the acid to prevent any chemical reaction between HC1 and Na4EDTA. The material is then transferred to a 2 L trap flask with 40% isopropanol, deaerated, and treated with Tween 80-Na4EDTA solution to prevent the plant material from floating with the oil. Mineral oil is added and the contents are mixed. The trapped-off oil layer contains very little plant debris, resulting in 1 or 2 clean filter papers.
Method 44.037 specifies grinding the sample in a cutting-type mill set at 0.061 in. In the 12th edition of O ffic ia l M e th o d s o f A n a ly s is , a Labconco mill or equivalent was suggested but this mill is no longer manufactured. We found that an electric coffee grinder (Norelco "dial-a-bean"
R eceivedM ay6,1981. Accepted May 28, 1981.This report of the Associate Referee was presented at the 95th
Annual Meeting of the AOAC, Oct. 19-22,1981, at W ashington,The recommendation of the Associate Referee was approved
by the G eneral Referee and Com m ittee F and adopted by the Association. See /. Assoc. Of f . Anal. Chem. 65, M arch issue (1982) for detailed reports.
Model HB5115, North American Philips Corp., Consumer Products Div., PO Box 5845, New York, NY 10017), when set at its coarsest grinding position, gave cracked wheat equivalent in particle size to that obtained from the Labconco mill set at 0.061 in.
Collaborative StudySix collaborators examined six 100 g spiked
samples of previously cracked wheat by the official method and the same number of spiked 50 g samples by the proposed method. The spikes in all samples consisted of the adult heads of 10
T ribo liu m sp., 10 S ito p h ilu s o r y z a e , 10 R h y z o p e r th a d o m in ic a , and 5 whole S ito p h ilu s o r y z a e larvae.
Wheat —Internal Insect Infestation Official First Action
R e a g e n tT w e en 8 0 -N a n E D T A [(e th y le n e d ia m in e ) - fe tr a -
a c e tic a c id te tra so d iu m s a l t] p re m ix so ln . —Measure 420 mL 40% isopropanol in 500 mL graduate. Add 80 mL Tween 80 (polysorbate 80) to 100 mL g-s graduate. Invert 100 mL graduate over 2 L glass beaker and drain briefly. Rinse 100 mL graduate with several portions of the 420 mL 40% isopropanol, pouring each rinse into beaker. Add rest of 40% isopropanol to beaker, add mag. stirring bar, and start mag. stirrer. Add 10 g Na4EDTA to beaker while stirring rapidly. Add 500 mL 40% isopropanol and stir until uniform. Mixed reagent stored in g-s flask is stable 1 week.
P r e p a r a t i o n o f S a m p l eMix grain by passing 6 times through Jones
sampler, recombining sepns before each pass. Sep. slightly >50 g and weigh 50 g. Transfer weighed sample, small amt at a time, to 5 or 8 in. No. 12 sieve, and with stiff bristle brush, work insects thru sieve as completely as possible.
Grind screened sample in cutting-type mill set0004-5756/81/6406T408-03$01.00
© Association of Official Analytical Chemists, Inc.

TRAUBA: J. ASSOC. OFF. ANAL. CHEM. (VOL. 64, NO. 6, 1981) 1409
Table 1. Collaborative results for recovery of adult Insect heads (30 added) from wheat kernels by official and proposedmethodsOfficial Proposed
Coll. A B C D E F A B C D E F1 26 27 27 28 27 26 30 24 30 30 30 302 28 29 27 27 29 29 29 24 27 30 30 253 23 25 22 20 24 22 30 30 28 30 30 304 27 30 29 29 29 29 29 30 29 30 30 295 23 24 27 26 27 27 28 29 20 30 26 226 22 26 25 26 25 23 30 29 29 30 29 30
Av„ % 87.05 95.92SDRepeatability 1.374 1.987Reproducibility 2.634 2.071CV, %Repeatability 5.26 6.87Reproducibility 10.09 7.20
at 0.061 in. (An electric coffee grinder, Norelco "dial-a-bean" Model HB5115, North American Philips Corp., or equiv., using coarsest grinding position, can be used.) Dry damp or tempered grain in forced-draft oven 1 h at 70-80° or 2 h in oven without draft.
I s o l a t i o nTransfer cracked grain, including any residue
in mill, to 2 L glass beaker contg mag. stirring bar, 44.002(p), and mixt. of 600 mL H20 + 50 mL HC1. Stir g e n t l y while boiling 15 min on hot plate.
Transfer sample to No. 100 sieve, 44.002(u), with gentle stream of hot tap H 20 . Wash material on sieve with v e r y g e n tle stream of hot (55-70°) tap H20 until washings show no acidity when tested with blue litmus paper.
Add mag. stirring bar, 44.002(p), to 2 L trap flask, 44.002(i)(3). Place wide-stern funnel in flask opening and quant, transfer residue on sieve to flask with 40% isopropanol. Add 40% isopropanol to total vol. of 800 mL.
Clamp stirring rod so stopper or wafer is above liq. in flask. (Trap flask may stand overnight at this point.) Stir g e n t ly while boiling 7 min ± 10 s on mag. stirring hot plate. Remove flask from hot plate and wash down sides with min. of 40% isopropanol and immediately add 100 mL Tween 80-Na4EDTA soln slowly down rod. Hand-stir g e n t l y 1 min and let stand 3 min.
Add 50 mL mineral oil, 44.003(y), down stirring rod. Stir mag., 44.004(b), 5 min on cool mag. stirrer, and let stand 3 min.
Fill flask with 40% isopropanol, added slowly down stirring rod to avoid mixing or agitation of flask contents, and let stand 2 0 min u n d is tu rb ed .
Trap off, rinsing neck of flask with 40% isopropanol, and add rinse to trappings in beaker.
Add 35 mL mineral oil to flask and hand-stir 1 min. Clamp stirring rod so stopper or wafer is at midpoint of flask. Let stand 5 min, spin stirring rod to free settlings from stopper or wafer, and adjust oil level with 40% isopropanol to ca 1 cm above fully raised stopper. Let stand u n d is tu rb e d 15 min. Trap off, and combine trappings in beaker. Rinse neck of flask well with isopropanol, adding rinsings to beaker. Transfer trappings to ruled filter paper, rinsing beaker well with isopropanol. Examine papers at 15X, counting only whole insects, insect heads, cast skins, and head capsules.
Results and DiscussionTables 1 and 2 show the recoveries of the
spiked elements. Average recoveries of adult insect heads by the proposed and the official methods were 95.92 and 87.05%, respectively, for adult insect heads and 97.22 and 6.12% for larvae. The 2 methods give comparable average recoveries and precision for adult insect heads, but the proposed method gives better results for the recovery of larvae.
The number of needed extraction papers averaged 6 .2 /sample for the official method, and1.5/sample by the proposed method. The average time required for analysis was 218 m in/ sample by the official method and 162 m in/ sample by the proposed method.
All collaborators preferred the proposed method to the official method, and reported that the extraction papers produced were cleaner and easier to read.

1410 TRAUBA: J. ASSOC. OFF. ANAL. CHEM. (VOL. 64, NO. 6, 1981)Table 2. Collaborative results for recovery of larvae (5 added) from wheat kernels by official and proposed methods
Official ProposedColl. A B C D E F A B C D E F
1 0 0 0 0 0 0 5 5 5 5 5 52 1 0 1 2 1 1 5 5 4 5 5 53 0 1 0 1 0 0 5 4 5 5 5 54 0 1 1 0 0 0 5 5 5 5 5 55 0 0 0 0 1 0 4 5 5 5 5 56 0 0 0 0 0 1 5 4 4 5 5 5
Av„ % SD 6.12 97.22Repeatability 0.428 0.358Reprfiducibility CV, % 0.539 0.358Repeatability 139.87 7.37Reproducibility 176.14 7.37T-
RecommendationsThe proposed method for the determination
of internal insect infestation of wheat kernels is recommended for adoption as official first action. The proposed method produces high recoveries for both adult and larval whole or equivalent insects, and clean extraction papers. No toxic solvents, which need special precautions, are used.
AcknowledgmentsThe author expresses his appreciation to the
following collaborators, all of the Food and Drug Administration, for their work and comments: Larry Glaze, Washington, DC; Eddie D. McGary, Kansas City, MO; Wayne D. Palmer, Minneapolis, MN; John T. Quaife, Minneapolis, MN; Jennifer Strozier, Atlanta, GA; A1 Whiteman, Chicago, IL; and to Foster D. McClure, FDA, Washington, DC, who did the statistical study.

HURST ET AL.: J. ASSOC. OFF. ANAL. CHEM. (VOL. 64, NO. 6, 1981) 1411
F L A V O R S A N D N O N A L C O H O L I C B E V E R A G E S
I o n P a i r i n g H i g h P r e s s u r e L i q u i d C h r o m a t o g r a p h i e D e t e r m i n a t i o n o f A m a r a n t h i n L i c o r i c e P r o d u c t s
WILLIAM J. HURST, JAMES M. McKIM, and ROBERT A. MARTIN, JrHershey Foods Technical Center, 1025 Reese Ave, Hershey, PA 17033A h ig h p re s s u re l i q u id c h ro m a to g ra p h ic m e th o d is d e sc r ib e d fo r th e d e te rm in a t io n o f a m a ra n th (FD & C R e d N o . 2; R e d N o . 2) in l ic o r ic e p ro d u c ts . T h e R ed N o . 2 is ex trac ted w ith a b asic b u f fe r s o lu tio n , c leaned u p o n a S e p -P a k c o lu m n , c h ro m a to g ra p h e d o n a re v e rs e p h a s e c o lu m n in th e io n p a i r in g m o d e , a n d d e te c ted a t 254 n m . T h e p ro c e d u re is tim e -c o n se rv a tiv e w i th a c c u ra te a n d p re c is e re su lts . R e c o v e ry d a ta ra n g e d f ro m 93 to 104%, a n d c o e ffic ie n ts o f v a r ia t io n w e re le ss th a n 4% fo r s ta n d a rd s a n d sa m p le s .
Amaranth was one of 7 dyes permitted for use in foods by the Food and Drug Act of 1906. Amaranth (FD&C Red No. 2; Red No. 2) was used for many years, but in the early 1970s several studies were conducted which resulted in the delisting of Red No. 2 in the United States by 1976 and then termination of listing by 1980 (1). This color, although delisted in the United States, is allowable in Canada, Sweden, West Germany, Japan, and 9 countries of the European Economic Community (2).
FD&C dyes are water-soluble compounds consisting of 4 classes (3): azo dyes, triphenyl- methane dyes, fluorescein types, and sulfonated indigo. FD&C Red No. 2 is an azo dye. Compounds in this class have good water solubility due to the sulfonic acid groups, which also reduce oil solubility.
FD&C dyes in food have traditionally been determined by extraction of the dyes followed by column chromatography and spectrophotometric determination (4). Other techniques such as thin layer chromatography and differential pulse polarography have either supplemented or complemented the column chromatographic method (5-8). High pressure liquid chromatography (HPLC) has been used to separate dyes for determining uncombined intermediates (4)
Received M arch 4,1981. Accepted May 28,1981.
and has recently been used to analyze dyes in many matrixes (9-14).
In this method, the determination of FD&C Red No. 2 in a licorice matrix is outlined.
Experimental H P L C A p p a r a t u s
The HPLC system used in this study included the M6000A solvent delivery system (Waters Associates) and a Model 440 absorbance detector at 254 nm (Waters Associates). The HPLC column was pBondapak C18, 4.0 X 30 cm (Waters Associates), and the HPLC injection valve was a Model 7120 HPLC injector (Rheodyne). Data were quantitated using a digital integrator, ITG-4A (Shimadzu Scientific).R e a g e n t s
The 5 jug/mL Red No. 2 standard was diluted to final concentration with LC grade water. The HPLC mobile phase was a 1 + 6 mixture of isopropanol (Baker HPLC grade) and 0.005M tet- rabutylammonium hydrogen sulfate (Sigma Chemical Co.), pH = 7. Other reagents used were boric acid buffer (0.5M), 1% a-amylase, 10% NaOH, IN HC1, and Sep-Pak elution solvent water-methanol-NH4OH (50 + 50 + 7).S a m p l e P r e p a r a t i o n
All samples were ground or grated to a uniform size in a Mouli grater.P r o c e d u r e
Five g sample was weighed into a 50 mL Sor- vall blender cup with 30 mL boiling LC water. This was blended 3 min at high speed, using the Sorvall blender. The suspension was quantitatively transferred to a 250 mL beaker, 1 mL of 1% a-amylase was added, and the resulting mixture was incubated 0.5 h at 37°C. The mixture was cooled to room temperature, 10 mL boric acid buffer was added, and pH of solution was adjusted to 10 ± 0.1 with 10% NaOH. The solution was quantitatively transferred to a 100 mL volumetric flask and diluted to volume with water.
0004-5756/81/6406-1411-03$01.00 © Association of Official Analytical Chemists, Inc.
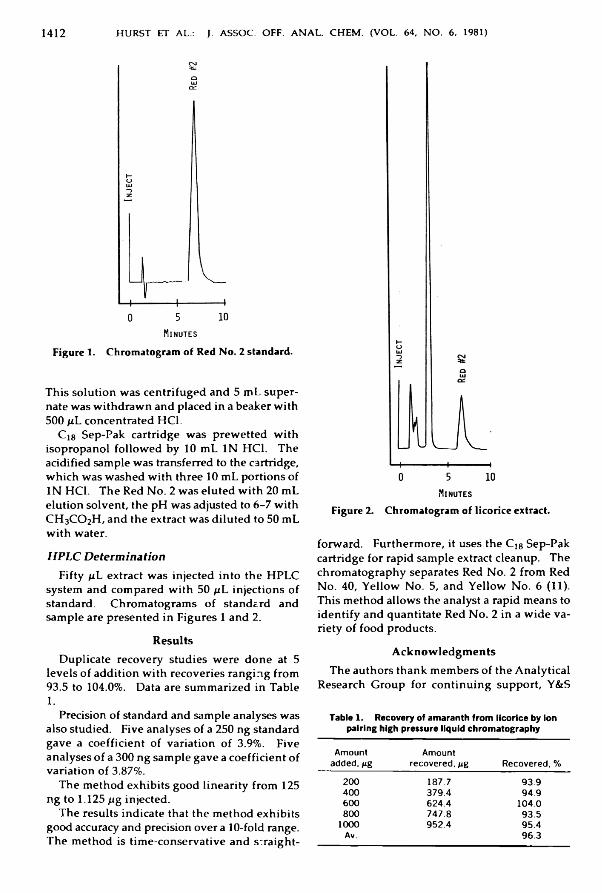
1412 HURST ET AL.: J. ASSOC. OFF. ANAL. CHEM. (VOL. 64, NO. 6, 1981)
Figure 1. Chromatogram of Red No. 2 standard.
This solution was centrifuged and 5 mL super- nate was withdrawn and placed in a beaker with 500 iiL concentrated HC1.
Cj8 Sep-Pak cartridge was prewetted with isopropanol followed by 10 mL IN HC1. The acidified sample was transferred to the cartridge, which was washed with three 10 mL portions of IN HC1. The Red No. 2 was eluted with 20 mL elution solvent, the pH was adjusted to 6-7 with CH3CO2H, and the extract was diluted to 50 mL with water.H P L C D e t e r m i n a t i o n
Fifty f iL extract was injected into the HPLC system and compared with 50 /J.L injections of standard. Chromatograms of standard and sample are presented in Figures 1 and 2.
ResultsDuplicate recovery studies were done at 5
levels of addition with recoveries ranging from93.5 to 104.0%. Data are summarized in Table1.
Precision of standard and sample analyses was also studied. Five analyses of a 250 ng standard gave a coefficient of variation of 3.9%. Five analyses of a 300 ng sample gave a coefficient of variation of 3.87%.
The method exhibits good linearity from 125 ng to 1.125 f ig injected.
T h e r e s u l t s i n d i c a t e t h a t t h e m e t h o d e x h ib i t s g o o d a c c u ra c y a n d p re c is io n o v e r a 1 0 -fo ld r a n g e . T h e m e t h o d is t i m e - c o n s e r v a t iv e a n d S t r a ig h t -
Figure 2. Chromatogram of licorice extract.
forward. Furthermore, it uses the C18 Sep-Pak cartridge for rapid sample extract cleanup. The chromatography separates Red No. 2 from Red No. 40, Yellow No. 5, and Yellow No. 6 (11). This method allows the analyst a rapid means to identify and quantitate Red No. 2 in a wide variety of food products.
AcknowledgmentsThe authors thank members of the Analytical
Research Group for continuing support, Y&S
Table 1. Recovery of amaranth from licorice by ion pairing high pressure liquid chromatographyAmount added, ¿ig Amount recovered, pg Recovered, %
200 187.7 93.9400 379.4 94.9600 624.4 104.0800 747.8 93.51000 952.4 95.4Av. 96.3

HURST ET AL.: J. ASSOC. OFF. ANAL. CHEM. (VOL. 64, N O . 6, 1981) 1413
Candies of Canada for licorice samples, and Hershey Foods Corp. for the opportunity to publish this research.
References(1) Food a n d D ru g A d m in is tra tio n (1980) FD&C R ed
N o . 2. D e n ia l o f p e ti t io n fo r p e rm a n e n t lis tin g . F in a l D ec is io n . Fed. Regist. J a n u a ry 25, p . 6257
(2) C a n a d ia n P o s itio n o n th e F oo d C o lo r A m a ra n th (1976) N e w s R elease , H e a lth P ro te c tio n B ranch , H e a lth a n d W e lfa re C an ad a , F e b ru a ry 2
(3) A b rah art, E. N . (1968) Dyes and Their Intermediates, P e rg a m o n P ress, O x fo rd , U K , p p . 139-140
(4) V e n k a ta ra m a n , K. (Ed.) (1972) The Analytical Chemistry of Synthetic Dyes, W iley -In te rsc ien ce , N ew Y ork, N Y , p p . 9 3 -13 5 , 469, 484-486
(5) T ild e n , D. H . (1953) J. Assoc. Off. Agric. Chem. 36, 802 -810
(6) G ra ich en , C „ & M o lito r , J. C. (1963) ]. Assoc. Off. Agric. Chem. 4 6 ,1 0 2 2 -1 0 2 9
(7) M a rtin , G. E„ & F ig e r t, D. M . (1974) ]. Assoc. Off. Anal. Chem. 57, 217 -218
(8) Z og g , A. G „ & Y oo, K. S. (1979) Analyst 104, 723-729
(9) G ra ich en , C. (1975) J. Assoc. Off. Anal. Chem. 58, 278 -282
(10) M artin , G. E., T en en b au m , M ., A lfonso , F„ & D yer, R. H . (1978) J. Assoc. Off. Anal. Chem. 61, 908 - 910
(11) M cK one, H . T., & Iv ie , K. (1980) J. Chem. Educ. 57, 321-322
(12) P u ttem an s, M. L., D ryon , L„ & M assart, D. L. (1981) J. Assoc. Off. Anal. Chem. 6 4 ,1 -7
(13) B ailey , J. E. (1980) J. Assoc. Off. Anal. Chem. 63, 565-571
(14) B oley, N . P., e t al. (1980) Analyst 1 0 5 ,5 8 8 -5 9 9
1414 CHEN ET AL.: J. ASSOC. OFF. ANAL. CHEM. (VOL. 64, NO. 6, 1981)
D A I R Y P R O D U C T S
Estimation of Lactose Hydrolysis by Freezing Point Measurement in Milk and Whey Substrates Treated with Lactases from Various MicroorganismsSHIH-LING YEH CHEN, JOSEPH F. FRANK, and MORRISON LOEWENSTEIN University of Georgia, Animal and Dairy Science Department, Athens, GA 30602j3 -G a lac to sid ase c o n c e n tra te s o b ta in e d fro m s e v e ra l m ic ro o rg a n ism s w e re u se d to h y d ro ly z e s k im m ilk , lo w fa t (2%) m ilk , sw e e t w h e y , ac id w h e y , ac id w h e y p e rm e a te , a n d ac id w h e y c o n c e n tra te . A m o n g ac id s u b s tra te s , th e f re e z in g p o in t d e p re s s io n fo r each 1% la c to se h y d ro ly z e d w a s th e g re a te s t w i th th e la c ta se fro m Aspergillus niger (0 .0501°H ); a m o n g n e u tra l s u b s tra te s , th e d e p re s s io n w as g re a te r in s w e e t w h e y (0.0495°H ) a n d le sser in lo w fa t m ilk (0.0445°H ). A ll d a ta w e re s ta t is t ic a lly s ig n if ic a n t. T h e a v e ra g e f r e e z in g p o in t d e p re s s io n fo r each 1% la c to se h y d ro ly z e d w a s 0 .0468°H (ra n g e 0 .0436-0 .0501°H ). O lig o sa c c h a rid e s fo rm e d in th e la c to se h y d ro ly s is , in c o n s is te n t f re e z in g p o in t re a d in g s o f th e c ryo sco pe a t th e lo w f re e z in g p o in t s m e a su re d , a n d p ro te a se c o n ta m in a t io n in so m e la c ta ses m ay a f fe c t th e p r e c is io n o f f re e z in g p o in t d e te rm in a t io n . H y d ra t io n a n d v o lu m e o f n o n -p ro te in c o m p o n e n ts in c o m m e rc ia l e n z y m e s , u n s ta b le c o lo r c o m p le x fo rm e d b y lactose in m e th y la m in e so lu tio n , a n d d iff ic u lty in th e u se o f m e th y la m in e s o lu t io n m ig h t ca u se v a r ia t io n s in d e te rm in a t io n o f la c to se b y th e a n a ly t ic a l p ro c e d u re . T h e se fa c to rs can b e e l im in a te d o r m in im iz e d . T h is m e th o d is th e s im p le s t a n d q u ic k e s t e s tim a tio n o f lac tose h y d ro ly s is , a n d i t o ffe rs g re a t accu racy a n d c o n s is te n c y .
When lactose is hydrolyzed by /3-galactosidase, it is split into galactose and glucose. The increase in the molarity of the soluble compounds lowers the freezing point of the solution. Lactose and chlorides contribute nearly 77% to the freezing point depression in cow's milk (1); therefore, depression in the freezing point caused by lactose splitting can be correlated to the degree of lactose hydrolysis.
Baer et al. (2) introduced the cryoscopic method to determine lactose hydrolysis in neutralized acid whey and lactose solution treated with /3-galactosidase from S a c ch a ro m yc e s lac tis; Zarb and Hourigan (3) determined lactose hydrolysis in reconstituted whey (0-5% lactose) and /3-galactosidase from E sch erich ia co li.
Baer et al. (2) reported that there was a directReceived May 4,1981. Accepted June 30, 1981.This research was supported by Federal and State funds al
located to the Georgia A gricultural Experim ent Station.
relationship between freezing point depression and lactose hydrolysis: For each 1% lactose hydrolyzed, the freezing point was lowered approximately 0.050 °H in neutralized acid whey and lactose solution treated with /3-galactosidase from S. la c tis . This method may offer a simple, quick, and accurate estimation of lactose hydrolysis in dairy products and whey substrates. In this study, /3-galactosidase concentrates obtained from different microorganisms were used to treat different substrates to determine if a linear relationship exists between freezing point depression and lactose hydrolysis, and if the freezing point is lowered approximately 0.050°H for each 1 % lactose hydrolyzed in all those substrates treated with different enzymes.
ExperimentalM a t e r i a l s
(a) E n z y m e s .—/3-Galactosidase concentrates provided by 5 different companies were used. The source and properties of these enzymes (4-7) are listed in Table 1.
(b) M ilk .—Milk and skim milk (SM) were obtained from the University of Georgia creamery. Low fat milk (LFM) was prepared by mixing 1200 mL milk with 800 mL skim milk.
(c) W h e y .—Acid whey (AW) from cottage cheese was obtained from the University of Georgia dairy manufacturing plant. Acid whey concentrate (AWC) and permeate (AWP) were prepared by processing acid whey of the same batch through the ultrafiltration system (Abcor5-HFM-180-S-S-W tubular polysulfonate membrane system). Approximately 60 gal. whey was ultrafiltered to obtain 15 gal. whey concentrate. Sweet whey (SW) was prepared by rennet precipitation of whole milk; precipitated protein and entrapped solids were removed by decantation of the clear whey. Whey samples were stored at —20°C after preparation or collection.M e t h o d s
C o m p o sitio n .—All substrates (AW, AWP, AWC, SW, SM, LFM) were analyzed for the following
0004-5756/81 /6406-1414-06$01.00 © Association of Official Analytical Chemists, Inc.
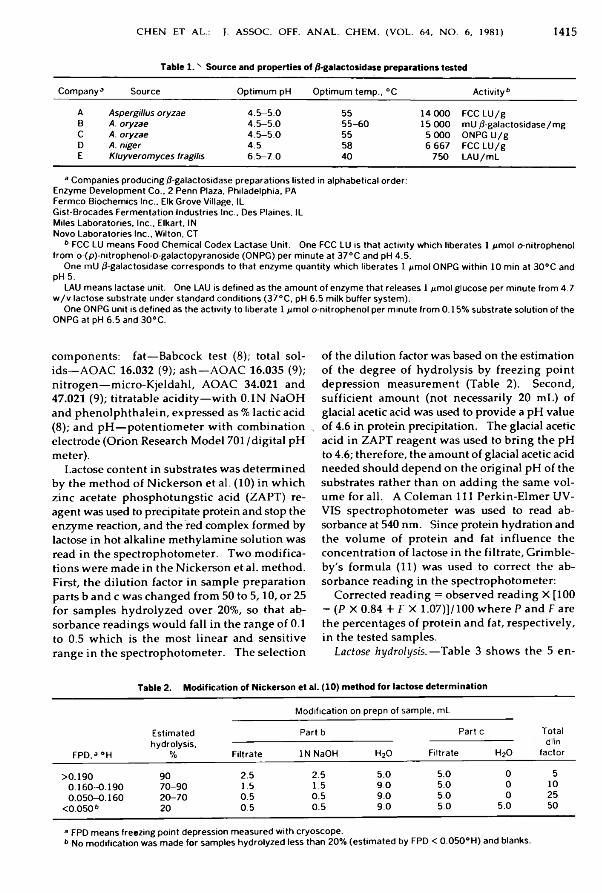
CHEN ET AL.: J. ASSOC. OFF. ANAL. CHEM. (VOL. 64, NO. 6, 1981) 1415
Table 1.x Source and properties of /S-galactosidase preparations testedCompany3 Source Optimum pH Optimum temp., °C Activity6
A Aspergillus oryzae 4.5—5.0 55 14 000 FCC LU/gB A. oryzae 4.5—5.0 55-60 15 000 mU /Fgalactosidase/mgC A. oryzae 4.5—5.0 55 5 000 ONPG U/gD A. niger 4.5 58 6 667 FCC LU/gE Kluyverom yces fragilis 6.5—7.0 40 750 LAU/mL3 Companies producing (J-galactosidase preparations listed in alphabetical order:Enzyme Development Co., 2 Penn Plaza, Philadelphia, PA Fermco Biochemics Inc.. Elk Grove Village, IL Gist-Brocades Fermentation Industries Inc., Des Plaines, IL Miles Laboratories, Inc., Elkart, IN Novo Laboratories Inc., Wilton, CT6 FCC LU means Food Chemical Codex Lactase Unit. One FCC LU is that activity which liberates 1 /imol o-nitrophenol from o-(p)-nitrophenol-D-galactopyranoside (ONPG) per minute at 37°C and pH 4.5.One mU /J-galactosidase corresponds to that enzyme quantity which liberates 1 pmol ONPG within 10 min at 30°C and pH 5.LAU means lactase unit. One LAU is defined as the amount of enzyme that releases 1 pmol glucose per minute from 4.7 w/v lactose substrate under standard conditions (37°C, pH 6.5 milk buffer system).One ONPG unit is defined as the activity to liberate 1 pmol o-nitrophenol per minute from 0.15% substrate solution of the ONPG at pH 6.5 and 30°C.
components: fat—Babcock test (8 ); total solids—AOAC 16.032 (9); ash—AOAC 16.035 (9); nitrogen—micro-Kjeldahl, AOAC 34.021 and 47.021 (9); titratable acidity—with 0.1N NaOH and phenolphthalein, expressed as % lactic acid(8 ); and pH—potentiometer with combination _ electrode (Orion Research Model 701/digital pH meter).
Lactose content in substrates was determined by the method of Nickerson et al. (10) in which zinc acetate phosphotungstic acid (ZAPT) reagent was used to precipitate protein and stop the enzyme reaction, and the red complex formed by lactose in hot alkaline methylamine solution was read in the spectrophotometer. Two modifications were made in the Nickerson et al. method. First, the dilution factor in sample preparation parts b and c was changed from 50 to 5,10, or 25 for samples hydrolyzed over 2 0 %, so that absorbance readings would fall in the range of 0 .1
to 0.5 which is the most linear and sensitive range in the spectrophotometer. The selection
of the dilution factor was based on the estimation of the degree of hydrolysis by freezing point depression measurement (Table 2). Second, sufficient amount (not necessarily 20 mL) of glacial acetic acid was used to provide a pH value of 4.6 in protein precipitation. The glacial acetic acid in ZAPT reagent was used to bring the pH to 4.6; therefore, the amount of glacial acetic acid needed should depend on the original pH of the substrates rather than on adding the same volume for all. A Coleman 111 Perkin-Elmer UV- VIS spectrophotometer was used to read absorbance at 540 nm. Since protein hydration and the volume of protein and fat influence the concentration of lactose in the filtrate, Grimble- by's formula (1 1 ) was used to correct the absorbance reading in the spectrophotometer:
Corrected reading = observed reading X [100 — (P X 0.84 + F X 1.07)]/100 where P and F are the percentages of protein and fat, respectively, in the tested samples.
L a c to se h y d r o ly s is .—Table 3 shows the 5 en-
Table 2. Modification of Nickerson et al. (10) method for lactose determinationModification on prepn of sample, mL
Estimated Part b Parte TotalFPD, 3 °H hydrolysis,% Filtrate IN NaOH H20 Filtrate H20 dimfactor
>0.190 90 2.5 2.5 5.0 5.0 0 50.160-0.190 70-90 1.5 1.5 9.0 5.0 0 100.050-0.160 20-70 0.5 0.5 9.0 5.0 0 25
<0.0506 20 0.5 0.5 9.0 5.0 5.0 50a FPD means freezing point depression measured with cryoscope.6 No modification was made for samples hydrolyzed less than 20% (estimated by FPD < 0.050°H) and blanks.
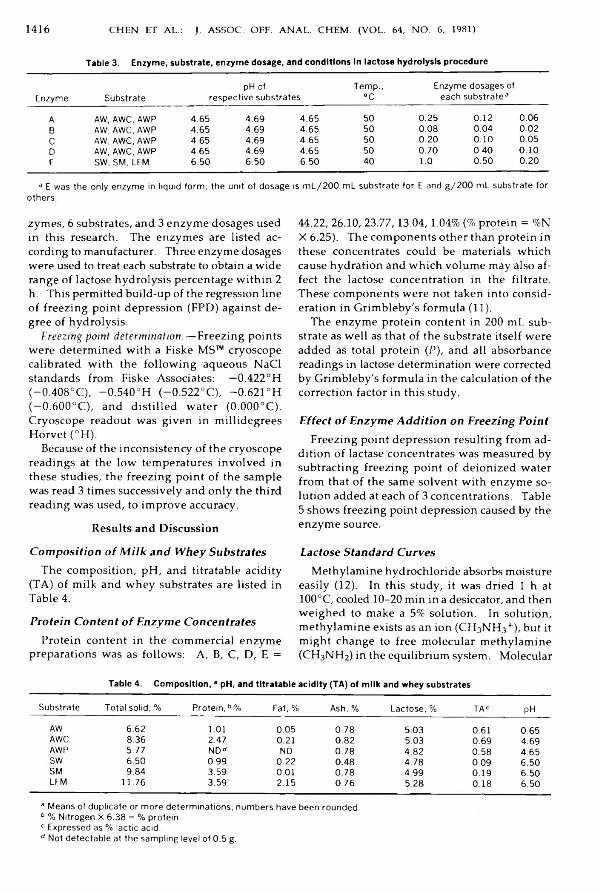
1416 CHEN ET AL.: J. ASSOC. OFF. ANAL. CHEM. (VOL. 64, NO. 6, 1981)Table 3. Enzyme, substrate, enzyme dosage, and conditions in lactose hydrolysis procedure
Enzyme Substrate pH ofrespective substrates Temp.,°C Enzyme dosages of each substrate®A AW, AWC, AWP 4.65 4.69 4.65 50 0.25 0.12 0.06B AW, AWC, AWP 4.65 4.69 4.65 50 0.08 0.04 0.02C AW, AWC, AWP 4.65 4.69 4.65 50 0.20 0.10 0.05D AW, AWC, AWP 4.65 4.69 4.65 50 0.70 0.40 0.10E SW, SM, LEM 6.50 6.50 6.50 40 1.0 0.50 0.20
a E was the only enzyme in liquid form; the unit of dosage is mL/200 mL substrate for E and g/200 mL substrate for others.zymes, 6 substrates, and 3 enzyme dosages used in this research. The enzymes are listed according to manufacturer. Three enzyme dosages were used to treat each substrate to obtain a wide range of lactose hydrolysis percentage within 2
h. This permitted build-up of the regression line of freezing point depression (FPD) against degree of hydrolysis.
F re ez in g p o in t d e te r m in a tio n .— Freezing points were determined with a Fiske MS™ cryoscope calibrated with the following aqueous NaCl standards from Fiske Associates: —0.422°H(—0.408°C), —0.540°H (-0.522°C), -0.621°H (—0.600°C), and distilled water (0.000°C). Cryoscope readout was given in millidegrees Horvet (°H).
Because of the inconsistency of the cryoscope readings at the low temperatures involved in these studies, the freezing point of the sample was read 3 times successively and only the third reading was used, to improve accuracy.
Results and DiscussionC o m p o s i t i o n o f M i l k a n d W h e y S u b s t r a t e s
The composition, pH, and titratable acidity (TA) of milk and whey substrates are listed in Table 4.P r o t e i n C o n t e n t o f E n z y m e C o n c e n t r a t e s
Protein content in the commercial enzyme preparations was as follows: A, B, C, D, E =
44.22, 26.10, 23.77,13.04,1.04% (% protein = %N X 6.25). The components other than protein in these concentrates could be materials which cause hydration and which volume may also affect the lactose concentration in the filtrate. These components were not taken into consideration in Grimbleby's formula (11).
The enzyme protein content in 200 mL substrate as well as that of the substrate itself were added as total protein (P), and all absorbance readings in lactose determination were corrected by Grimbleby's formula in the calculation of the correction factor in this study.E f f e c t o f E n z y m e A d d i t i o n o n F r e e z i n g P o i n t
Freezing point depression resulting from addition of lactase concentrates was measured by subtracting freezing point of deionized water from that of the same solvent with enzyme solution added at each of 3 concentrations. Table 5 shows freezing point depression caused by the enzyme source.L a c t o s e S t a n d a r d C u r v e s
Methylamine hydrochloride absorbs moisture easily (12). In this study, it was dried 1 h at 1 0 0 °C, cooled 1 0 - 2 0 min in a desiccator, and then weighed to make a 5% solution. In solution, methylamine exists as an ion (CH3NH3+), but it might change to free molecular methylamine (CH3NH2) in the equilibrium system. Molecular
Table 4. Composition, ’ pH, and titratable acidity (TA) of milk and whey substratesSubstrate Total solid, % Protein," % Fat, % Ash, % Lactose, % TAC PH
AW 6.62 1.01 0.05 0.78 5.03 0.61 0.65AWC 8.36 2.47 0.21 0.82 5.03 0.69 4.69AWP 5.77 NDd ND 0.78 4.82 0.58 4.65SW 6.50 0.99 0.22 0.48 4.78 0.09 6.50SM 9.84 3.59 0.01 0.78 4.99 0.19 6.50LFM 11.76 3.59 2.15 0.76 5.28 0.18 6.50a Means of duplicate or more determinations; numbers have been rounded. 6 % Nitrogen X 6.38 = % protein. c Expressed as % lactic acid. d Not detectable at the sampling level of 0.5 g.

CHEN ET AL.: J. ASSQC. OFF. ANAL. CHEM. (VOL. 64, NO. 6, 1981) 1417
Table 5. Freezing point depressed (°H) by enzyme additionEnzyme 1st dosage 2nd dosage 3rd dosage3
A -0.013 -0.005 - 0.002B -0.005 -0.003 - 0.002C -0.015 -0.008 -0.004D - 0.020 -0.013 -0.004E -0.089 -0.045 -0.018a 1st dosage means the largest dosage used; and 3rd, the least.
methylamine is a gas. Although K b (basicity constant) of CH3NH3+ is larger than that of H20 , and only a very small amount of CH3NH 2 gas is formed in the equilibrium system, methylamine concentration can be decreased gradually through any situation causing the escape of the methylamine gas. To prevent this, the solution was kept in a tightly closed container and stored at 5°C. New stock solution was prepared every 2 weeks and the working solution was discarded after its container had been opened 6 times, to improve the consistency of the lactose standard curve.
Although Nickerson et al. (10) used sodium sulfite as the color stabilizer and recommended reading the absorbance in 10 min to obtain consistent data, the color still faded quickly. In this study, 4 tubes (one blank and 3 samples) per batch were used in the color developing procedure (65°C, 25 min) and the absorbances were read in a spectrophotometer within 2 min. The absorbance changed only at the third decimal reading when the first tube was checked again after all 4 tubes were read in the spectrophotometer; there was a difference in the second decimal reading after 5 min delay.
Figure 1 shows standard curves obtained under different conditions. Although all correlation coefficients are above 0.99, there are significant differences in the slope of the regression lines, which means they differ not only in sensitivity but also in the dimension of error caused by the sequence of the samples measured, because of unstable color.E f f e c t o f L a c t o s e H y d r o l y s i s o n F r e e z i n g P o i n t D e p r e s s i o n
Table 6 shows the regression line, correlation coefficient, and freezing point depression for each 1 % lactose hydrolyzed in all substrates treated with different enzymes. From these regression lines, the degree of lactose hydrolysis ranging from 50 to 75% in respect to freezing point depression was calculated (Table 7).
F ig ure 1. S ta n d a rd cu rv es u n d e r d if fe re n t tr e a tm e n t c o n d itio n s .
I D rie d m e th y la m in e HC1, re a d 4 tu b e s in 2 m in .II D rie d m e th y la m in e HC1, re a d 8 tu b e s in 5 m in .III D ried m e th y la m in e HC1, re a d 15 tu b e s in 10
m in .IV D rie d m e th y la m in e HC1, b u t so lu tio n w as
s to re d > 3 w ee k s in re frig e ra to r.V U n d r ie d m e th y la m in e HC1.
Most of the lactases used in this research did coagulate milk protein at 42°C within 2 h, indicating some protease contamination in these lactases. Amino acids or other small molecules liberated through the action of protease influenced the freezing point depression measurement.Analysis of Variance and Duncan's M ultiple Range Test on Freezing Point Depression
Freezing point depression data for each 1% lactose hydrolyzed were analyzed using analysis of variance followed by Duncan's multiple range test (13). Two-way analysis of variance showed significant differences at the 5% level among fungal enzymes but not among acid substrates. Duncan's multiple range test indicated that there were significant differences in the data between enzyme D and others. Enzyme D was the only fungal lactase from A s p e r g illu s n ig e r . One-way analysis of variance and Duncan's test showed significant differences between freezing point depression data of any 2 of the 3 neutral substrates.
SummaryA direct linear relationship was indicated be
tween freezing point depression and lactose

1418 CHEN ET AL.: J. ASSOC. OFF. ANAL. CHEM. (VOL. 64, NO. 6, 1981)
Table 6. Regression lines of freezing point depression (FPD) against lactose hydrolysis and FPD values for each 1%lactose hydrolyzedFPD for each 1%Substrate Enzyme Regression line3 Correlation coeff. lactose hydrolyzed6
AW A Y = 421.36X + 2.27 0.9897 0.0459AW B Y - 406.14X + 5.63 0.9896 0.0457AW C Y = 419.87X + 6.68 0.9804 0.0444AW D Y = 415.43X — 0.36 0.9875 0.0477AWC A Y = 434.00X + 4.35 0.9852 0.0436AWC B Y = 398.07X + 9.29 0.9763 0.0447AWC C Y = 399.00X + 6.68 0.9826 0.0461AWC D Y = 409.51X-2.19 0.9841 0.0497AWP A Y = 408.92X + 5.99 0.9799 0.0480AWP B Y = 390.44X + 7.78 0.9721 0.0487AWP C Y = 418.77X + 4.85 0.9896 0.0466AWP D Y = 448.07X-8.15 0.9640 0.0501SW E Y = 431.22X- 1.55 0.9949 0.0494SM E Y = 434.15X- 2.00 0.9924 0.0471LFM E Y = 422.66X + 0.24 0.9938 0.0447Mean 0.0468Range 0.0436 0 0501
3Y = FPD, X = hydrolysis, %. All data are means of duplicate or triplicate trials.b FPD for each 1% lactose hydrolyzed = FPD of 90% hydrolysis calculated from regression line/lactose % in blank X 90%.
hydrolysis in various substrates hydrolyzed with lactase from several microorganisms. Conditions causing variations in the data for each 1 % lactose hydrolyzed were: (a) oligosaccharides formed in the lactose hydrolysis; (b) inconsistent freezing point readings of the cryoscope at the low freezing points measured; (c) protease contamination in lactase concentrates; (d) hydration and volume of the non-protein components in the commercial enzymes; (e) unstable color complex formed by lactose in methylamine solution; and (f) difficulty in the use of methyl- amine solution.
The accuracy of this estimation depends on the accuracy of both the Nickerson et al. method for lactose determination and the cryoscopic method for freezing point measurement. Nickerson's method requires very careful attention to detail; if great care is taken, factors e and f can be minimized or eliminated and this method can recover99.08 ± 2.58% of the theoretical lactose value (10). The cryoscopic method of freezing point measurement can detect 0.05% lactose addition in the range of lactose concentration of 1.0-3.5% and 0.1% addition in the 3.0-5.0% range, because the cryoscope gave precise data for freezing points
Table 7. Degree of lactose hydrolysis (%) ranging from 50 to 75% in respect to freezing point depression 3Degree of lactose hydrolysis in respect to FPD, “H
Enzyme Substrate 0 .110 0.120 0.130 0.140 0.150 0.160 0.170 0.180A AW 46.12 50.46 54.81 59.16 63.51 67.86 72.20 76.56A AWC 43.69 47.51 51.33 55.15 58.97 62.79 66.62 70.45A AWP 42.24 46.56 50.88 55.20 59.51 63.83 68.15 72.47B AW 49.88 54.12 58.36 62.59 66.83 71.07 75.30 79.54B AWC 52.97 56.94 60.90 64.90 68.88 72.85 76.83 80.81B AWP 49.14 53.27 57.40 61.53 65.66 69.79 73.92 78.05C AW 48.44 52.65 56.86 61.07 65.29 69.50 73.71 77.92C AWC 49.86 54.13 58.41 62.69 66.97 71.24 75.52 79.80C AWP 49.52 54.00 58.42 62.87 67.31 71.76 76.21 80.66D AW 51.57 55.88 60.20 64.52 68.83 73.15 77.46 81.78D AWC 51.73 55.77 59.80 63.84 57.88 71.91 75.95 79.98D AWP 49.89 54.15 58.41 62.67 66.93 71.19 75.45 79.71E SW 46.92 51.15 55.38 59 60 63.83 68.06 72.28 76.51E SM 45.28 49.64 53.99 58.35 62.71 67.06 71.42 75.78E LFM 46.23 50.52 54.82 59.11 63.40 67.70 71.99 76.28
3 Calculated from regression line of middle level of enzyme dosage.

CHEN ET AL.: J. ASSOC. OFF. ANAL. CHEM. (VOL. 64, NO. 6, 1981) 1419
greater than — 0.621 °H as reported by Zarb and Hourigan. In this research, the freezing point of the sample was read 3 times successively and only the third reading was used, to improve accuracy and eliminate factor b. Factor d needs to be corrected by a modified Grimbleby's formula; this is beyond the scope of the present research. Factors a and c need further study too, but their effect can be eliminated if the estimation is based on the regression line of the same substrate treated with the same lactase.
Generally, there are 5 methods for lactose determination in hydrolyzed substrates, i.e., gas- liquid chromatographic, high pressure liquid chromatographic, enzymatic, colorimetric, and cryoscopic methods. The cryoscopic method is the simplest and quickest method among these, and it offers great accuracy and consistency.
The cryoscopic method reported by Zarb and Hourigan required 1 h incubation of the lactose-containing solution at 37°C to determine the content of lactose, while in the Baer et al. method, the degree of lactose hydrolysis was estimated in 2-3 min once the freezing point depression against hydrolysis regression line was established. This study expanded the application of the method of Baer et al. (2).
References(1) D h a ra m ara ja n , C. S., R ao, R. V., M e n o n , M . N ., &
D as tu r, N . N . (1950) Indian J. Vet. Sei. 2 0 ,3 5 -4 0(2) B aer, R. J., F ran k , J. F., & L o e w e n s te in , M . (1980)
/. Assoc. Off. Anal. Chem. 63, 587-590(3) Z arb , J. M ., & H o u rig a n , J. A. (1979) Aust. J. Dairy
Technol. 3 4 ,1 8 4 -1 8 6(4) Enzeco Fungal Lactase Tech. Bull. (1978) E n zy m e
D e v e lo p m e n t C orp ., 2 P e n n P laza , P h i la d e lp h ia , PA
(5) Lactase Preparation EL 58-79, Tech. Bull. (1980) F erm co B iochem ies, Inc., E lk G ro ve V illag e , IL
(6) L astase N , Spec, sh e e t a n d te ch , d a ta s h e e t (1980) GB F e rm e n ta tio n In d u s tr ie s , In c ., D es P la in es , IL
(7) L actozym 750L, Novo Enzyme Information, N o v o L ab ora to ries , In c ., W ilto n , CT
(8) A th e r to n , H . V ., & N e w la n d e r , J. A. (1977) Chemistry and Testing of Dairy Products, 4 th Ed., AVI P u b lish in g Co., In c ., W e stp o rt, CT, p p . 38, 71, 250
(9) Official Methods of Analysis (1975) 12th Ed., A OAC, A rlin g to n , VA
(10) N ic k e rso n , T. A ., V ujicic, I. F., & L in , A. V. (1976)f. Dairy Sei. 5 9 ,3 8 6 -3 9 0
(11) G rim b le b y , F. H . (1956) J. Dairy Res. 23, 229-237(12) Merck Index (1976) 9 th Ed., M erck & Co., Inc.,
R ah w ay , N J, p . 786(13) O tt, L. (1977) Introduction to Statistical Methods and
Data Analysis, D u x b u ry P ress , N o r th S citu ate , M A

1420 ALVAREZ-NAZARIO: J. ASSOC. OFF. ANAL. CHEM. (VOL. 64, NO. 6, 1981)
A L C O H O L I C B E V E R A G E S
W e s t p h a l P lu m m e t D e t e r m i n a t i o n o f A l c o h o l i n D i s t i l l a t e s
FABIÂN ALVAREZ-NAZARIOTreasury Department of Puerto Rico, Bureau of Alcoholic Beverages Taxes, San Juan, Puerto Rico 00905
A new table gives the percent alcohol by volume in distillates from density values obtained at room temperature by using a Westphal plummet.Direct determination of the density of an alcohol-water mixture at room temperature, using a Westphal plummet, affords a rapid and convenient method for determination of alcohol content. If a table can be devised for the necessary temperature corrections, the method combines the convenience of alcohol hydrometers with the accuracy of pycnometers. The principle of such a method has existed since Archimedes; data for preparing a table were fairly well advanced by the 19th century. A necessary table has been calculated here to give accurate results for room temperatures about 20-30°C. The basic data used are wholly contained in the Bureau of Standards Circular No. 19 (1) which also contains the data needed to modify the table to cover other temperature ranges, i.e., from 15 to 25°C.
Derivation of the MethodA 2-pan analytical balance is used as a working
instrument in the following derivation. A Westphal plummet is hung from the scale hook in a pan, so that it can be weighed in air or immersed in liquid. The sample container stands on a support resting on the floor of the balance and is so constructed that it does not disturb the free movement of the pan or the pan arrester.
The following terminology is adopted:M = mass of plummet V = volume of plummet Wa = recorded weight of plummet in air W h 2o = recorded weight of plummet in dis
tilled waterWs = recorded weight of plummet in liquid
sampleDa = density of air Dh2o = density of water Ds = density of sample8.5 = density of brass weights
Received M arch 4,1981. Accepted May 28, 1981.
If the plummet is immersed in the liquid sample, the following relation holds:
M - V D S = Ws —(Ws/8.5)Da M — V D S = Ws(l — Da/8.5) (1)
For the plummet immersed in distilled water:M - V D H2o = WH2o (1 - D J 8.5) (2 )
For the plummet weighed in air:M — V D a = Wa(l — Da/8.5) (3)
Subtracting Equation 2 from Equations 1 and 3, and dividing the first result by the second:Ds = Dh2o ~ (Dh2o ~ Da)
X (Ws - WH2o)/(Wa - WH2o)Dividing by the density of water:Dt/t = 1 — (1 — Da/DH2o)
X(Ws - W H2o)/(Wa - W H2o)Taking the density of air as 0.00118 g/mL, the values of the term (1 — D3/D h2o) are: 20°C,0.998818; 25°C, 0.998817; and 30°C, 0.998815. Therefore, without serious error, we may assume as constant the value at 25°C so that the final operating equation is:Dt/t = 1 - 0.998817
X (Ws - WH2o)/(Wa - WH2o) (4)where Dt/t is the vacuum density of the sample relative to the vacuum density of distilled water at the same temperature.
All we have to do is to weigh the plummet immersed in the liquid sample at room temperature, record the temperature of the liquid to 0.1 °C, compute Dt/t from Equation 4 , and look up the alcohol percent from the specially prepared table. As with pycnometers, some preliminary calibration must be done, i.e., the weight of the plummet in air and its weight in distilled water at various temperatures. The weight of the plummet in water varies linearly with temperature, so that subsequently it can be found from a prepared graph or table of Wh2o vs temperature. Westphal plummets are rather small, ca 5
0004-5756/81 / 6406-1420-04$01.00 © Association of Official Analytical Chemists, Inc.
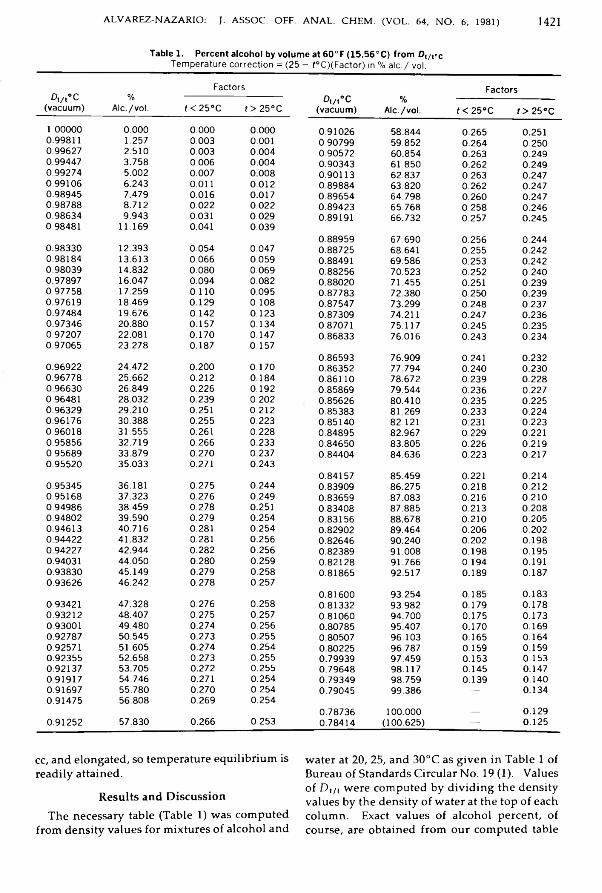
ALVAREZ-NAZARIO: J. ASSOC. OFF. ANAL. CHEM. (VOL. 64, NO. 6, 1981) 1421Table 1. Percent alcohol by volume at 60°F (15.56°C) from Dt/t°cTemperature correction = (25 - f°C)(Factor) in % ale./ vol.
Factors FactorsD,/t°C(vacuum) %Ale./vol. t < 25°C t > 25°C A/.°C(vacuum) %Alc./vol. f < 25°C f>25°C1.00000 0.000 0.000 0.000 0.91026 58.844 0.265 0.2510.99811 1.257 0.003 0.001 0.90799 59.852 0.264 0.2500.99627 2.510 0.003 0.004 0.90572 60.854 0.263 0.2490.99447 3.758 0.006 0.004 0.90343 61.850 0.262 0.2490.99274 5.002 0.007 0.008 0.90113 62.837 0.263 0.2470.99106 6.243 0.011 0.012 0.89884 63.820 0.262 0.2470.98945 7.479 0.016 0.017 0.89654 64.798 0.260 0.2470.98788 8.712 0.022 0.022 0.89423 65.768 0.258 0.2460.98634 9.943 0.031 0.029 0.89191 66.732 0.257 0.2450.98481 11.169 0.041 0.039 0.88959 67.690 0.256 0.2440.98330 12.393 0.054 0.047 0.88725 68.641 0.255 0.2420.98184 13.613 0.066 0.059 0.88491 69.586 0.253 0.2420.98039 14.832 0.080 0.069 0.88256 70.523 0.252 0.2400.97897 16.047 0.094 0.082 0.88020 71.455 0.251 0.2390.97758 17.259 0.110 0.095 0.87783 72.380 0.250 0.2390.97619 18.469 0.129 0.108 0.87547 73.299 0.248 0.2370.97484 19.676 0.142 0.123 0.87309 74.211 0.247 0.2360.97346 20.880 0.157 0.134 0.87071 75.117 0.245 0.2350.97207 22.081 0.170 0.147 0.86833 76.016 0.243 0.2340.97065 23.278 0.187 0.157 0.86593 76.909 0.241 0.2320.96922 24.472 0.200 0.170 0.86352 77.794 0.240 0.2300.96778 25.662 0.212 0.184 0.86110 78.672 0.239 0.2280.96630 26.849 0.226 0.192 0.85869 79.544 0.236 0.2270.96481 28.032 0.239 0.202 0.85626 80.410 0.235 0.2250.96329 29.210 0.251 0.212 0.85383 81.269 0.233 0.2240.96176 30.388 0.255 0.223 0.85140 82.121 0.231 0.2230.96018 31.555 0.261 0.228 0.84895 82.967 0.229 0.2210.95856 32.719 0.266 0.233 0.84650 83.805 0.226 0.2190.95689 33.879 0.270 0.237 0.84404 84.636 0.223 0.2170.95520 35.033 0.271 0.243 0.84157 85.459 0.221 0.2140.95345 36.181 0.275 0.244 0.83909 86.275 0.218 0.2120.95168 37.323 0.276 0.249 0.83659 87.083 0.216 0.2100.94986 38.459 0.278 0.251 0.83408 87.885 0.213 0.2080.94802 39.590 0.279 0.254 0.83156 88.678 0.210 0.2050.94613 40.716 0.281 0.254 0.82902 89.464 0.206 0.2020.94422 41.832 0.281 0.256 0.82646 90.240 0.202 0.1980.94227 42.944 0.282 0.256 0.82389 91.008 0.198 0.1950.94031 44.050 0.280 0.259 0.82128 91.766 0.194 0.1910.93830 45.149 0.279 0.258 0.81865 92.517 0.189 0.1870.93626 46.242 0.278 0.257 0.81600 93.254 0.185 0.1830.93421 47.328 0.276 0.258 0.81332 93.982 0.179 0.1780.93212 48.407 0.275 0.257 0.81060 94.700 0.175 0.1730.93001 49.480 0.274 0.256 0.80785 95.407 0.170 0.1690.92787 50.545 0.273 0.255 0.80507 96.103 0.165 0.1640.92571 51.605 0.274 0.254 0.80225 96.787 0.159 0.1590.92355 52.658 0.273 0.255 0.79939 97.459 0.153 0.1530.92137 53.705 0.272 0.255 0.79648 98.117 0.145 0.1470.91917 54.746 0.271 0.254 0.79349 98.759 0.139 0.1400.91697 55.780 0.270 0.254 0.79045 99.386 — 0.1340.91475 56.808 0.269 0.254 0.78736 100.000 — 0.1290.91252 57.830 0.266 0.253 0.78414 (100.625) — 0.125
cc, and elongated, so temperature equilibrium is readily attained.
Results and DiscussionThe necessary table (Table 1) was computed
from density values for mixtures of alcohol and
water at 20, 25, and 30°C as given in Table 1 of Bureau of Standards Circular No. 19 (1). Values of Dt/t were computed by dividing the density values by the density of water at the top of each column. Exact values of alcohol percent, of course, are obtained from our computed table

1422 ALVAREZ-NAZARIO: J. ASSOC. OFF. ANAL. CHEM. (VOL. 64, NO. 6, 1981)
Table 2. Check of reliability of Table 1% Alc./vol. (60° F) D22.5/22.5 Table 1 A D275/275 Table 1 A
6.128 0.99125 6.131 +0.003 0.99118 6.124 -0.00412.373 0.98349 12.369 -0.004 0.98319 12.365 -0.00823.424 0.97100 23.441 +0.017 0.96998 23.429 +0.00527.935 0.96565 27.945 - 0.010 0.96427 27.935 0.00036.280 0.95433 36.286 +0.006 0.95233 36.286 +0.00647.315 0.93554 47.315 0.000 0.93298 47.321 +0.00657.790 0.91405 57.799 +0.009 0.91120 57.792 +0.00267.667 0.89120 67.665 - 0.002 0.88815 67.667 0.00076.920 0.86752 76.922 +0.002 0.86434 76.915 -0.00585.488 0.84315 85.488 0.000 0.83986 85.490 +0.00293.281 0.81759 93.280 - 0.001 0.81425 93.279 - 0.00299.947 0.78931 99.943 -0.004 0.78601 99.944 -0.003
only at 20, 2 5 , or 30°C, but a check of the practicability of the table was made using D t / t values at 22.5°C and 27.5°C. To do this, we used the original data in the work of Osborne et al. (2). They measured the thermal expansion of 12 mixtures of alcohol and water to obtain the equation:Dt/4 = D25/4 + a ( t - 25 ) + P it - 25)2 + y ( t - 25 )3
They give the composition by weight of the 12 mixtures and the respective values of a , f t , and7 . Thus D22.5/4 and D27.5/4 can be calculated and changed to D t / t , using the Chapuis values for the density of water as given in Table 32 of Bureau of Standards Circular No. 19. Alcohol percent by weight is converted to alcohol percent by volume at 15.56°C by using Table No. 5 of that circular.
Table 2 presents a test of the accuracy of Table 1 and shows that it can be used for the temperature range 20-30°C.
The whole procedure is equivalent to using a very small hydrometer, nearly perfectly calibrated, capable of high precision readings, and covering the complete alcoholic range. If a test tube is used as the "hydrometer jar," only 25 mL of an alcoholic beverage sample need be distilled for an alcohol determination.
Table 1 is a condensed alcoholimetric table valid for any intermediate temperature, fractional or otherwise, between 20 and 30°C. Its correct use, however, requires full interpolation to 3 decimal places as shown in the example below:
Determined Dt/t = 0.97012 at 26.2°CInterpolation (Table 1)0.97065 23.278 0.1570.96922 24.472 0.170
-143 +1.194 +0.013-5 3 +(0.443) +(0.005)
Uncorrected percent alcohol: 23.278+ 0.443 = 23.721
Correction factor: 0.157 + 0.005 = 0.162
Temperature correction: (25 — 26.2)(0.162)= -0.194
Corrected percent alcohol: 23.721 — 0.194= 23.527 or 23.53% by volume.
The apparent specific gravities at 20, 25, and 30°C used to find the alcohol percent from the AOAC alcoholimetric tables (3) are actually Dt/t values in air. They can be changed to Dt/t (vacuum) by the relationship:
D t/ t (vac.) = D t /t (air)(l - D a / D H2o )+ Da/D H2o (5)
If the obtained Dt/t (vac.) is checked in Table 1 , the same results will be obtained.
The method has been tried successfully during the past 2 years as an independent check on the alcohol content of beverages through the distillation of a 50 mL sample. Standard equipment accompanying a Westphal balance (i.e., the plummet and the glass cylinder) was used. Thermometers built in the plummet are not accurate enough, and the temperatures were determined to 0.1 °C using precision thermometers. A support for the small glass jar was glued together from thin masonite board. It has the form of a miniature bench beneath which the pan of the balance can move freely.
With the exception of the analytical balance and the precision thermometer, all other parts,

ALVAREZ-NAZARIO: J. ASSOC. OFF. ANAL. CHEM. (VOL. 64, NO. 6, 1981) 1423
including the plummet, can be improvised. If the procedures described in the AO AC methods for measuring the sample, distilling, and diluting to volume are followed, any laboratory can make alcohol determinations using readily available equipment.
References(1) S ta n d a rd D e n s ity a n d V o lu m e tric T ab les (1924)
Natl. Bur. Stds US. Circ. N o . 19, W a sh in g to n , DC(2) O sb o rn e , N . S., M cK elvey , E. C., & B earce, N . W.
(1913) Bull. Natl. Bur. Stds 9, 327 -4 74(3) Official Methods of Analysis (1965) 10 th Ed., A O A C ,
A rlin g to n , VA, sec. 43.023
S p r i n g
c W o r k s h o p
1 9 8 2 April 13-15
N EW ORLEANS, LOUISIANAPlan now to attend. Contact
NICOLE F. HARDIN U.S. Food & Drug Administration
4298 Elysian Fields Ave New Orleans, LA 70122
(504/589-2471)
HERSHEL MORRIS Louisiana Dept of Agriculture
PO Box 16390-A, University Station Baton Rouge, LA 70893
(504/388-2755) & O A C ^

O s c i l l a t i n g U - T u b e D e n s i t y M e t e r D e t e r m i n a t i o n o f A l c o h o l i c S t r e n g t h : A n a l y s i s o f P a r a m e t e r E r r o r s
JAN KOVARRevenue Canada, Customs and Excise, Laboratory and Scientific Services Division, Ottawa, Ontario, Canada K1A 0L5
1424 KOVAR: J. ASSOC. OFF. ANAL. CHEM. (VOL. 64, NO. 6, 1981)
D e te rm in a tio n o f d e n s i ty b y u s in g th e d e n s i ty m e te r w a s s u p e r io r to p y c n o m e try a n d h y d ro m e try in p r e c is io n , ac cu ra cy , in s e n s i t iv i ty to o p e ra to r , te m p e ra tu re c o n tro l , sp e e d , a n d a d a p ta b i l i ty to a u to m a t io n . T h e l in e a r ity b e tw e e n o sc illa tio n p e r io d a n d d e n s i ty in th e ra n g e o f e th a n o l- w a te r s o lu t io n s is m o re th a n a d e q u a te . T h e m e th o d is p ra c tic a l ly in s e n s i t iv e to c h a n g e s in a i r p re s su re ; th e s in g le m o s t im p o r ta n t in f lu e n c e o n th e e r ro r in re su lts is te m p e ra tu re re a d in g e r ro rs . I t is re c o m m e n d e d th a t th e O rg a n is a t io n In te rn a t io n a le d e M é tro lo g ie L ég ale C e n e ra i F o rm u la b e u se d to c o rre la te d e n s itie s w ith a lco h o lic s t re n g th .
The determination of density, a crucial procedure in many analyses such as the analysis of spirits for ethanol, is traditionally performed using hydrometers, pycnometers, or hydrostatic balances. The first procedure is simple but requires rather large quantities of samples if instruments of sufficient accuracy are to be used. The necessary 500-1000 mL volume may be impractical, particularly if a sample has to be pretreated such as by distillation, and, moreover, carries implicitly the increased difficulty of maintaining homogeneity and constant temperature during the measurement; the instruments must be calibrated in a procedure available only to a specialized institution. Nevertheless, this procedure is often chosen as a regulatory method because of its technical simplicity. The other 2 methods do not suffer from the drawbacks mentioned above but both require a precise volume determination of an irregularly shaped vessel (pycnometer or sinker). The procedure is available to any laboratory equipped with an analytical balance but is rather time consuming and, admittedly (1 ), operator-sensitive; a good deal of training is expected before reliable and accurate values can be obtained (2 ).
The traditional approach to density determinations is currently undergoing a revolution with the advent of density meters, instruments based on measuring the frequency of oscillation of a hollow tube filled with the sample. The frequency (or its reciprocal, the oscillation peri-
Received M arch 11,1981. Accepted June 24, 1981
od) has a theoretically definable linear relation to density; therefore, the procedure does not require mass or volume measurement. Other published studies (2-4; agree on the superiority of density meters over hydrometry or pycnometry in respect to precision, sample amount requirements, ease of operation, temperature and homogeneity control, and speed of performance. The theoretically required linearity of the oscillation period (squared) with the density has been challenged on occasion (2,4), making the accuracy of determinations suspect unless more than 2-point calibration is made. In theory, 2 determinations exactly and sufficiently describe a calibration line for the full range; the instrument manual (5) recommends calibration on water and air as the 2 standards (points) and this is generally done. Deviations described for concentrated sugar solutions (4) could be expected because they are outside the density range limited by the 2 standards used. Deviations within the range, such as for alcohol-water solutions (3), are difficult to explain and accept. They were not experienced in a later investigation (2 ).
Because of our involvement in alcohol analysis we decided to investigate more closely the linearity of the period-density relationship and the influence of variations of individual parameters on the results of density meter measurements.
ExperimentalA p p a r a t u s a n d R e a g e n t s
(a) D e n s ity m e te r .—Paar DMA 55 calculating precision density meter with manual injection.
(b) C o n s ta n t te m p e r a tu re b a th .—Haake F3-C circulating ultratherm ostat equipped with NBS-calibrated precision thermometer, —1 to 50°C range graduated in 0.1°. Temperature of circulating liquid was also monitored in flow of water leaving cell compartment. The 2 readings coincided within limits of accuracy of temperature measurement.
(c) S ta n d a rd s . —(1) Distilled water or water for HPLC (Baker Analyzed), both freshly degassed by boiling; no difference in density was observed. (2) Ambient air (pressure of the day,
0004-5756/81 /6406-1424-07Î01.00 © Association of Official Analytical Chemists, Inc.

KOVÄR: J. ASSOC. OFF. ANAL. CHEM. (VOL. 64, NO. 6, 1981) 1425
Table 1. Densities and oscillation periods of samples
SampleNominalalcoholstrength 720
P20Densitybottlep20
Densitymeter1 air 4.15746 1.200 1.202 95% 5.49610 811.63 811.553a 94% 5.49990 814.27 814.163b 94% 5.49991 814.27 814.174 60% 5.63312 907.19 907.175a 40% 5.60078 948.128 948.125b 40% 5.69082 948.128 948.126 40% 5.69060 947.96 942.977 20% 5.72654 973.68 973.698a water 5.76056 998.202 998.208b water 5.76052 998.202 998.208c water 5.76054 998.202 998.208d water 5.76053 998.202 998.20
temperature of the cell, relative humidity 30- 50%). (3) Ethanol, ca 95% volume (unmatured spirits), chromatographically pure (GC); mixtures with water, strength determ ined by pyc- nometry.
(d) D e n s ity b o t t le s .—Two bottles of 40 and 45 mL nominal volume, respectively, with closely fitting plastic stoppers and calibration graduations in narrow neck. Volumes were determined as average values of 7 determinations (RSD 0.011 and 0.006%, respectively). Densities of samples were determined twice in each bottle and average values were taken (RSD 0.01% or better). Pycnometers with samples are thermally equilibrated in the same Haake Ultra- thermostat used for density meter, by immersing >30 min. Density in air (d20) was recalculated to true densities ( p 20) by standard procedure using nominal values (6 ) for density of air and density of weights (1 .2 and 8000 kg/cu. m, respectively) as recommended by Organisation Internationale de Métrologie Légale (6 ):S t a n d a r d i z a t i o n o f M e t e r
Performed as described in the manual (5) and elsewhere (2 ), using water and air as standards. Instrument constants were calculated by the equations:
A = (T 5 ,-T 2ir)/(Pw-Pair) (1)B = r 2ir - A X p air = T i - A X pw (2)
where T = observed oscillation periods, and p = tabulated densities (5) of water (w) and air (air).
Calibration was performed daily when measurements were undertaken and checked after each run by repeating density measurement of water. No calibration shifts during a run were
observed. Variations of calibration constants from day to day are minor, but noticeable.
M e a s u r e m e n t o f S a m p l e sThe clean, dry cell was rinsed 2 or 3 times with
sample and filled using a plastic syringe (5 mL); filling was monitored visually for absence of bubbles. After not less than 3 min, several successive readings of density were recorded; reading remained constant within 1 digit in the last place for an extended period. At the same time, readings of oscillation periods were recorded. Each sample was injected 2 or 3 times; readings of the first injection sometimes deviated slightly from the second and third, which generally agreed within 0 .0 0 0 0 1 g/cc, particularly if the prerinse was omitted. Between samples, cell was rinsed with methanol and dried with air to attain density value of air used in calibration of the day. Measurements were done predominantly at 20.00°C, with a few at 25.00°C.
Results and DiscussionResults of measurements on samples ranging
from 0 to 95% volume ethanol are summarized in Table 1, showing densities of samples as determined using density bottles and meter. Corresponding oscillation periods observed are also included.
Values of densities agree well, generally within 0 .0 1 - 0 .0 2 kg/cu. m (corresponding roughly to 0.005-0.01% volume); the largest discrepancies were encountered for samples of higher strength, viz. 0.11 kg/cu. m at 95%. In this range the deviation represents only 0.03% volume, in fact, making the congruence better than that at low strengths. While the standard

1426 KOVÁR: J. ASSOC. OFF. ANAL. CHEM. (VOL. 64, NO. 6, 1981)
Table 2. Instrument constants and corresponding densities of Sample 2 using sample and air as standardsDensity meter Pycnometer
Sample A B „20P95 A B n20 P 9512 15.946 988 17.265 337 811.550 15.945 414 17.265 339 811.6303a 15.947 189 17.265 337 811.540 15.945 031 17.265 340 811.6493b 15.947 128 17.265 337 811.543 15.945 166 17.265 339 811.6434 15.947 070 17.265 357 811.546 15.946 718 17.265 338 811.5645a 15.946 968 17.265 337 811.551 15.946 834 17.265 337 811.5585b 15.947 449 17.265 337 811.527 15.947 314 17.265 337 811.5336 15.947 331 17.265 337 811.533 15.947 500 17.265 337 811.5247 15.947 503 17.265 337 811.524 15.947 667 17.265 336 811.5168 15.947 388 17.265 337 811.530 15.947 388 17.265 337 811.5309 15.946 926 17.265 337 811.553 15.946 926 17.265 337 811.553
10 15.947 157 17.265 337 811.541 15.947 157 17.265 337 811.54111 15.947 041 17.265 337 811.547 15.947 041 17.265 337 811.547
Mean 15.947 178 17 265 330 811.540 15.946 680 17.265 338 811.500SD 0.000 198 0.000 000 0.010 0.000 935 0.000 001 0.047
errors of the means1 of our pycnometry determinations2 are about 0.04-0.08 kg/cu. m, it seems reasonable to assume that most discrepancies, even so small, are due to the pycnometry determinations, with the density meter contributing only occasionally and with less than 0.04 kg/cu. m (0.005% of the value) to the overall discrepancy.L i n e a r i t y o f P e r i o d - D e n s i t y R e l a t i o n
Although the results in Table 1, based on the assumption of a linear relationship between the differences of squared periods and the differences in densities (as expressed, e.g., by Equation 1 ), themselves show a good linear relation between the 2 parameters, we decided to investigate the dependence further. To this end, the instrument constants A and B were calculated using, in turn, each of the solutions as one standard and air or water as the other, and applying Equations 1 and 2; in each series of calculations, we used alternately the density of the sample as determined by pycnometry and by density meter. For density of water or air, the tabulated values were used (0.998202 and 0.001200, respectively).
Results of calculations are given in Tables 2 and 3, with mean values and standard deviations included. For each pair of instrument constants the density of one selected sample (No. 2), the 95% volume spirit (labeled p f s ), was also calculated, using the formula of the processor; viz.
1 Standard error of mean = (SD/Vn) X 1.96 (95% confidence limit).2 In pycnometry, deviations of 0.1 kg/cu. m are generally encountered, if recorded.
p = | ( T 2 - B ) (3)Awhere T is the oscillation period of that sample as shown in Table 1. The expected day-to-day variations in A and B were calculated from the 4 water and air calculation runs, giving (standard deviation included): A = 15.947 128 ± 0.000 198; B = 17.265 337 ± 0.000 000; p f 5 = 811.543 ± 0.000 010. The RSD in the density and in the constant A are the same, 0.0012%, reflecting changes in calibration. Density determinations made over the course of a day would therefore have no measurable variation.
When instrument constants A and B were calculated using sample and air as standards, with densities of samples determined by density meter (c.f., Table 2), the same standard deviation was obtained as for water-air calibrations alone in the whole set. This indicates no significant difference in the instrument constants and the results in the density range of alcohol-water solutions in calibrating with water-air and sample-air pairs, contrary to an earlier observation (3).
If densities determined by pycnometry are used in calculating constants and sample density, larger variations are observed (Table 2). The F values for A and p H are 22.30 and 22.09, respectively, compared with the tabulated value of F (0.01; 12,11) = 4.40, indicating a significant difference in variability of results. The added variability must be attributed to the single change in the calculation, i.e., to the method of density determination: Pycnometry has a larger variability than does the density meter procedure. The SD of the densities calculated in this procedure for the 95% sample (0.05 kg/cu. m) is
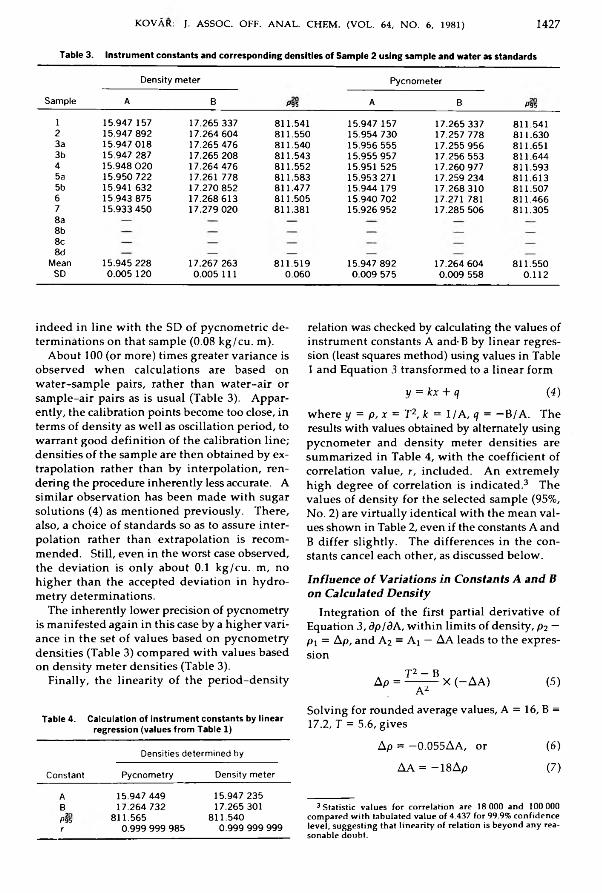
KOVÁR: J. ASSOC. OFF. ANAL. CHEM. (VOL. 64, NO. 6, 1981) 1427
Table 3. Instrument constants and corresponding densities of Sample 2 using sample and water as standards
SampleDensity meter
P95Pycnometer
P95A B A B1 15.947 157 17.265 337 811.541 15.947 157 17.265 337 811.5412 15.947 892 17.264 604 811.550 15.954 730 17.257 778 811.6303a 15.947 018 17.265 476 811.540 15.956 555 17.255 956 811.6513b 15.947 287 17.265 208 811.543 15.955 957 17.256 553 811.6444 15.948 02 0 17.264 476 811.552 15.951 525 17.260 977 811.5935a 15.950 722 17.261 778 811.583 15.953 271 17.259 234 811.6135b 15.941 632 17.270 852 811.477 15.944 179 17.268 310 811.5076 15.943 875 17.268 613 811.505 15.940 702 17.271 781 811.46678a8b
15.933 450 17.279 020 811.381 15.926 952 17.285 506 811.305
8c8dMean 15.945 228 17.267 263 811.519 15.947 892 17.264 604 811.550SD 0.005 120 0.005 111 0.060 0.009 575 0.009 558 0.112
indeed in line with the SD of pycnometric de- relation was checked by calculating the values of terminations on that sample (0.08 kg/cu. m). instrument constants A and-B by linear regres-
About 100 (or more) times greater variance is sion (least squares method) using values in Table observed when calculations are based on 1 and Equation 3 transformed to a linear formwater-sample pairs, rather than water-air or sample-air pairs as is usual (Table 3). Appar- y = k x + q (4)ently, the calibration points become too close, in terms of density as well as oscillation period, to warrant good definition of the calibration line; densities of the sample are then obtained by extrapolation rather than by interpolation, rendering the procedure inherently less accurate. A similar observation has been made with sugar solutions (4) as mentioned previously. There, also, a choice of standards so as to assure interpolation rather than extrapolation is recommended. Still, even in the worst case observed, the deviation is only about 0 .1 kg/cu. m, no higher than the accepted deviation in hydro- metry determinations.
The inherently lower precision of pycnometry is manifested again in this case by a higher variance in the set of values based on pycnometry densities (Table 3) compared with values based on density meter densities (Table 3).
Finally, the linearity of the period-density
where y = p, x = T2, k = 1/A, q = —B/A. The results with values obtained by alternately using pycnometer and density meter densities are summarized in Table 4, with the coefficient of correlation value, r, included. An extremely high degree of correlation is indicated .3 The values of density for the selected sample (95%, No. 2) are virtually identical with the mean values shown in Table 2, even if the constants A and B differ slightly. The differences in the constants cancel each other, as discussed below.I n f l u e n c e o f V a r i a t i o n s i n C o n s t a n t s A a n d B o n C a l c u l a t e d D e n s i t y
Integration of the first partial derivative of Equation 3, d p I d A, within limits of density, P 2 — Pi = Ap, and A2 = Ai — AA leads to the expression
T 2 - BAp = — — X (-A A ) (5)A 2
Table 4. Calculation of instrument constants by linear regression (values from Table 1)
ConstantDensities determined by
Pycnometry Density meterA 15.947 449 15.947 235B 17.264 732 17.265 301pis 811.565 811.540r 0.999 999 985 0.999 999 999
Solving for rounded average values, A = 16, B =17.2, T = 5.6, gives
Ap = —0.055AA, or (6 )AA = — 18Ap (7)
3 Statistic values for correlation are 18 000 and 100 000 compared with tabulated value of 4.437 for 99.9% confidence level, suggesting that linearity of relation is beyond any reasonable doubt.

1428 KOVÂR: J. ASSOC. OFF. ANAL. CHEM. (VOL. 64, NO. 6, 1981)
that is, a change in density of 0 .0 1 kg/cu. m (one unit in the last place of the meter display) is equivalent to a change in A of 0.000 18 of opposite sign. The range of T values on our instrument (and likely on other instruments of the same series) for 0-95% spirits is 5.5-5.76 and corresponds to a change of 0 .0 0 0 2 0 to 0 .0 0 0 16 in A per 0.01 kg/cu. m. Or, change in A of 0.000 10 is just barely visible in the displayed density value, corresponding to 0.005-0.006 kg/cu. m.
Similarly, integration of dp/3B within the same limits leads to the expression
A p = -A B /A (8 )which, for the approximate value of A = 16, gives
16Ap = -AB (9)That is, a change in B exerts virtually the same influence on the resulting density as does a similar change in A, viz. 0.01 kg/cu. m corresponds to —0.000 16 in B and 0.000 10 change in B is just barely noticeable in the density reading on our instrument, corresponding to 0.0006 kg/cu. m.
Consequently, in the calculation of density by Equation 3 as performed automatically in the processor, or manually, an increase (positive error) in one constant (e.g., A) is effectively cancelled by a decrease of similar magnitude (negative error) in the other constant (e.g., B). With one constant held unchanged, the change in the other will have direct influence on the density reading predictable by Equation 7 or 9. The relationships hold for display in specific gravity as well.I n f l u e n c e o f V a r i a t i o n s i n A i r D e n s i t y o n M e a s u r e m e n t
Substituting Equations 1 and 2 in 3 leads to the basic ratio relation
P ~ Pair T2 ~ Ta2,rPw Pair Tw Tair (30)
Defining the ratio of squared period differences for simplicity as K and rearranging gives, for the same value of air density at calibration and at measurement,
p = K p w + (1 - K)Apair (33)Integrating the partial derivative of Equation 33, dp/dpair, within limits (Ap) gives
in Table 1, and is equal to 0.82 for 95% alcohol and increases to 1 with strength decreasing to zero. Thereby the value of (1 — K ) in Equation 32 becomes 0.18 at most, and decreases to zero, and the equation can be written as
max. Ap = 0.18Apair (33)A change in density of air is made evident in the displayed density of sample at most to 0 .2 (or 20%) of its value. A change in air pressure of 10 mm Hg corresponds to about 0.015 kg/cu. m change in density of air (5) and would be manifested by a change of 0.003 kg/cu. m in the final reading at worst, and a change in atmospheric pressure of 33 mm Hg would be necessary to bring about a change in density of 1 unit in the last place of the meter display (0 .0 1 kg/cu. m). The influence of atmospheric conditions on the result (density displayed) can be neglected.I n f l u e n c e o f V a r i a t i o n s i n V a l u e o f D e n s i t y o f A i r u s e d i n C a l i b r a t i o n
Expressing Equation 3 for 2 different values of density of air (pai, Pa2) as a ratio and keeping all other values constant gives
A i /A 2 = (pw - Pa2)/(Pw - Pai) (14)Defining A y - A 2 = AA and pA1 - pA2 = A pair, the equation is simplified:
AA/A — Apair/(pw — pa ir) (35)Solving for rounded values of A = 16 and pw — Pair = 1 gives
AA = 16Apair (36)A change (error) in density of air (used in the calibration) of 0 .0 1 kg/cu. m would change the constant A by 0.000 16, which is roughly equivalent to 0 .0 1 kg/cu. m in the displayed density reading. Or, an error in air density at the time of calibration would cause an error in density reading of about the same magnitude.
If, however, the values for air (density and oscillation period) are used to calculate the constant B, a simultaneous change in B occurs: Solving the equation derived from Equation 2, viz.
AB = - A Apair (37)for A = 16 gives
B = - 16 Apair (38)Ap = (1 - iC)Apair The same error in density of air, e.g., 0.01 kg/cu.
m, will cause a change in B by approximately the same amount as in A, i.e., 0.000 16, but in theThe value of K can be obtained from values of T
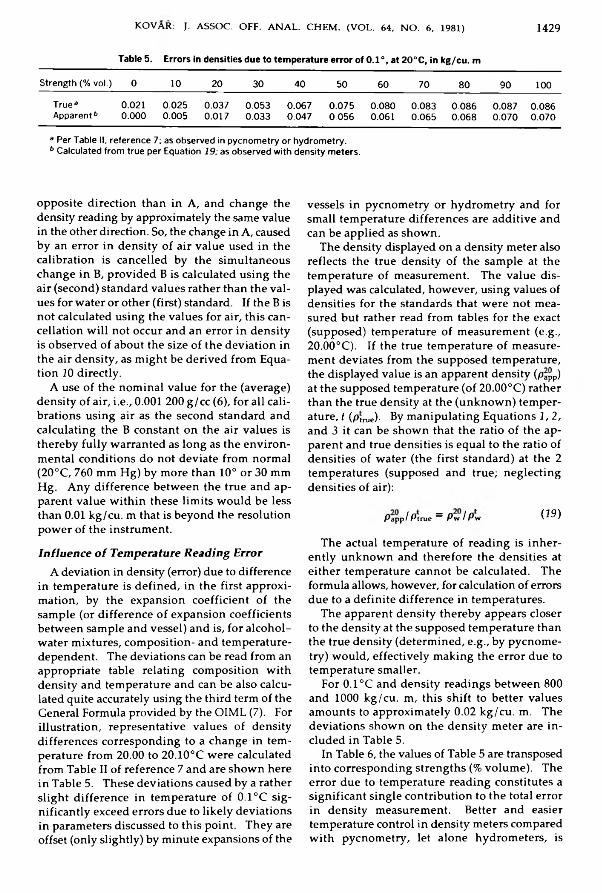
KOVAR: J. ASSOC. OFF. ANAL. CHEM. (VOL. 64, NO. 6, 1981) 1429
Table 5. Errors in densities due to temperature error of 0.1°, at 20°C, in kg/cu. mStrength (% vol.) 0 10 20 30 40 50 60 70 80 90 100
True3Apparent6 0.0210.000
0.0250.005 0.0370.017 0.0530.033 0.0670.047 0.0750.056 0.0800.061 0.0830.065 0.0860.068 0.0870.070 0.0860.070a Per Table II, reference 7; as observed in pycnometry or hydrometry.6 Calculated from true per Equation 19; as observed with density meters.
opposite direction than in A, and change the density reading by approximately the same value in the other direction. So, the change in A, caused by an error in density of air value used in the calibration is cancelled by the simultaneous change in B, provided B is calculated using the air (second) standard values rather than the values for water or other (first) standard. If the B is not calculated using the values for air, this cancellation will not occur and an error in density is observed of about the size of the deviation in the air density, as might be derived from Equation 10 directly.
A use of the nominal value for the (average) density of air, i.e., 0 .0 0 1 2 0 0 g/cc (6 ), for all calibrations using air as the second standard and calculating the B constant on the air values is thereby fully warranted as long as the environmental conditions do not deviate from normal (20°C, 760 mm Hg) by more than 10° or 30 mm Hg. Any difference between the true and apparent value within these limits would be less than 0 .0 1 kg/cu. m that is beyond the resolution power of the instrument.I n f l u e n c e o f T e m p e r a t u r e R e a d i n g E r r o r
A deviation in density (error) due to difference in temperature is defined, in the first approximation, by the expansion coefficient of the sample (or difference of expansion coefficients between sample and vessel) and is, for alcohol- water mixtures, composition- and temperature- dependent. The deviations can be read from an appropriate table relating composition with density and temperature and can be also calculated quite accurately using the third term of the General Formula provided by the OIML (7). For illustration, representative values of density differences corresponding to a change in temperature from 20.00 to 20.10°C were calculated from Table II of reference 7 and are shown here in Table 5. These deviations caused by a rather slight difference in temperature of 0.1°C significantly exceed errors due to likely deviations in parameters discussed to this point. They are offset (only slightly) by minute expansions of the
vessels in pycnometry or hydrometry and for small temperature differences are additive and can be applied as shown.
The density displayed on a density meter also reflects the true density of the sample at the temperature of measurement. The value displayed was calculated, however, using values of densities for the standards that were not measured but rather read from tables for the exact (supposed) temperature of measurement (e.g., 20.00°C). If the true temperature of measurement deviates from the supposed temperature, the displayed value is an apparent density (Papp) at the supposed temperature (of 20.00°C) rather than the true density at the (unknown) temperature, f (Ptrue)- By manipulating Equations 1, 2, and 3 it can be shown that the ratio of the apparent and true densities is equal to the ratio of densities of water (the first standard) at the 2
temperatures (supposed and true; neglecting densities of air):
Papp/Ptrue = Pvt I Pvt ( « )The actual temperature of reading is inher
ently unknown and therefore the densities at either temperature cannot be calculated. The formula allows, however, for calculation of errors due to a definite difference in temperatures.
The apparent density thereby appears closer to the density at the supposed temperature than the true density (determined, e.g., by pycnometry) would, effectively making the error due to temperature smaller.
For 0.1 °C and density readings between 800 and 1 0 0 0 kg/cu. m, this shift to better values amounts to approximately 0.02 kg/cu. m. The deviations shown on the density meter are included in Table 5.
In Table 6, the values of Table 5 are transposed into corresponding strengths (% volume). The error due to temperature reading constitutes a significant single contribution to the total error in density measurement. Better and easier temperature control in density meters compared with pycnometry, let alone hydrometers, is

1430 K O V Â R : J. A S S O C . OFF. A N A L . C H E M . (VOL. 64, N O . 6, 1981)
Table 6. Errors in strengths due to temperature error of 0 .1°, at 20°C, in % volumeStrength (% vol.) 0 10 20 30 40 50 60 70 80 90 100
True3 0.014 0.012 0.034 0.044 0.039 0.039 0.036 0.033 0.031 0.026 0.020Apparent6 0.000 0.004 0.015 0.028 0.028 0.029 0.028 0.026 0.024 0.021 0.017
a b See Table 5. Values recalculated using Table IVa, reference 7.
therefore an important factor in favor of the meter.
The DMA 55 cannot directly display the alcoholic strength rather than the density without an optional circuit board (processor modifcation) because the 2 parameters are not linearly related. A 3-term formula for recalculation of specific gravities to strengths was suggested (3) with lim ited documentation. We feel that the extremely w ell experimentally founded OIML General Formula (7) would be better suitable if a circuit board (program) were to be designed, particularly for countries using the metric system of measurement.
We have developed a program numerically solving the general formula for any combination of parameters and used it to produce the tables for the Canadian System of Alcoholometry. A simplified version, for 20 °C measurements only, which can be easily implemented on a relatively small programmable calculator is also available, and is used in connection with the high accuracy density determinations of the meter.
The superiority of the density meter may be expected to lead, in those applications where cost is not the deciding factor, to the replacement of hydrometry and pycnometry in practice by oscillating tube density meters.
References(1) Research C om m ittee on th e A n alysis o f P otable
Spirits (1979) Methods for the Analysis of Potable Spirits, Laboratory o f th e G overnm ent C hem ist, L ondon, UK
(2) Mark, F. C , & Vaughn, T. E. (1980) /. Assoc. Off. Anal. Chem. 6 3 ,9 7 0 -9 7 2(3) Strunk, D. H ., H am m an, J. W., & Tirnm el, B. M.
(1979) /. Assoc. Off. Anal. Chem. 62, 653 -658(4) H effe lfin g er , G. P. (1977) Food Prod. Dev. 11, 28(5) Kratky, O ., L eopold, H ., & Stabinger, H ., C alculat
in g Precision D en sity M eter DM A 55, Instruction M anual. A. Paar, Graz.
(6 ) O rganisation Internationale de M étrologie Légale (1973) International R ecom m endation N o. 33
(7) O rganisation Internationale de M étrologie Légale (1973) R ecom m endation International N o . 22, Bull. Org. Intern. Metrol. Legale. N os. 51, 52

W A L L & C L A R K : J. A S S O C . OFF. A N A L . C H E M . (VOL. 64, N O . 6, 1981) 1431
DRUGSLiquid Chromatographic Separation of SomeAlkylaminocyclohexanecarbonitriles from Phenylcyclohexylamines Related to PhencyclidineG EO RG E M . W A LL * 1 and C . R A N D A LL C LA R K 2Auburn University, School of Pharmacy, Department of Pharmacal Sciences, Division of Medicinal Chemistry, Auburn University, AL 36849T h e sy n th e s is o f f iv e 1 -a m in ocyc lo h ex an eca rb on i- tr ile s and th e co rresp on d in g 1 -p h e n y lc y c lo h e x y l- a m in es re la ted to p h e n c y c lid in e is reported . T he co m p ou n d s are separated b y reverse p h ase liq u id chrom atography in an acidic m eth an o l-w a ter so lv en t system .
Phencyclidine (PCP), I, has been a popular drug of abuse in recent years. Some samples of the drug involved in adverse reactions have been shown to be contaminated with a toxic synthetic precursor, an organic cyanide, 1-piperidinocy- clohexanecarbonitrile (PCC), II (1). The LD 50 reported for PCC is 2.5 times lower than that for PCP (2). In combination, PCC effectively lowers the LD50 of PCP (2).
The release of hydrogen cyanide in vivo has been suggested as a possible mechanism for the toxic effects of PCC (2-4). The decomposition of a-aminonitriles such as II to yield an enamine and hydrogen cyanide occurs in the presence of heat (1, 4), moisture, and active silica gel (5). This decomposition has made some instrumental analyses of the a-aminonitriles d ifficult. Hel- isten and Shulgin (5) observed the degradation of PCC to the corresponding enamine and further decomposition to piperidine and cyclohexanone when they attempted thin layer chromatographic procedures on silica gel plates. Gas chromatographic (GC) analysis of 1-cyano- cycloalkylamines has resulted in degradation (5,6) in some cases. However, Ballinger and
Received February 25, 1981. Accepted May 28,1981.1 Present address: U niversity of M ississippi, School of
Pharm acy, D epartm ent of M edicinal C hem istry, U niversity , MS 38677.2 Address correspondence to th is author.
Marshman (1) recently reported an accurate GC procedure for determining PCC.
The sim ilar chemical properties of the 1-phe- nyl-l-cyclohexylamines and the 1-aminocyclo- hexanecarbonitriles suggest that these compounds would not be easily separable in a synthetic mixture. Indeed, the observation of PCP samples contaminated with various amounts of PCC lends support to this assumption (1). Controls on the availability of piperidine are tightening; therefore, other amines are being used for the clandestine synthesis of arylcyclo- hexylamines sim ilar to PCP. In this study, a series of 5 alkylaminocyclohexanecarbonitriles and their respective 1-phenylcyclohexylamines were synthesized and separated by liquid chromatography.
Exp erim en ta l
S y n t h e s i s o f C o m p o u n d sA ll amines and other chemical precursors were
reagent grade unless otherwise specified. Alk- ylaminocyclohexanecarbonitriles from piperidine, pyrrolidine, morpholine, methylamine, and ethylamine were synthesized as described by Kalir et al. (7). Potassium cyanide was added to an aqueous acidic solution of cyclohexanone and amine and the resulting solution was stirred (without cooling) for at least 2 h. Products were purified by distillation and/or recrystallization.
The 1-phenylcyclohexylamines were also prepared according to Ka lir et al. (7). Tertiary amine products derived from piperidine, pyrrolidine, and morpholine were prepared from the carbonitrile intermediates by treatment with a molar excess of phenylmagnesium bromide in ether solution. Secondary amine products were obtained by treating the imine formed from cyclohexanone and the primary amine (methyl or ethylamine) w ith a molar excess of phenylli- thium in ether solution.
0004-5756/81 /6406-1431-04$01.00© Association of Official Analytical Chemists. Inc.
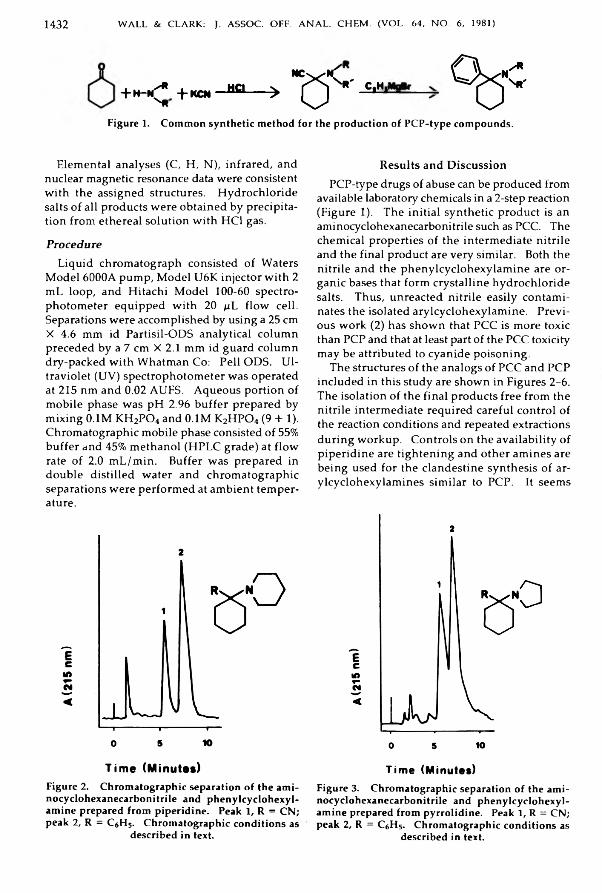
1432 W A L L & C L A R K : J. A S S O C . OFF. A N A L . C H E M . (VOL. 64, N O . 6, 1981)
+ H -N ^ +KCN —110---->M Cv-»
0 <N r _Çiüü
Figure 1. C om m on sy n th etic m eth od for th e p ro d u ction o f P C P -typ e co m p ou n d s.
Elemental analyses (C, H , N ), infrared, and nuclear magnetic resonance data were consistent with the assigned structures. Hydrochloride salts of all products were obtained by precipitation from ethereal solution with HC1 gas.
P r o c e d u r eLiquid chromatograph consisted of Waters
Model 6000A pump, Model U6K injector with 2 mL loop, and Hitachi Model 100-60 spectrophotometer equipped with 20 /rL flow cell. Separations were accomplished by using a 25 cm X 4.6 mm id Partisil-ODS analytical column preceded by a 7 cm X 2.1 mm id guard column dry-packed with Whatman Co: Pell ODS. U ltraviolet (UV) spectrophotometer was operated at 215 nm and 0.02 AUFS. Aqueous portion of mobile phase was pH 2.96 buffer prepared by mixing 0.1M KH 2PO4 and 0.1M K 2HPO4 (9 + 1). Chromatographic mobile phase consisted of 55% buffer and 45% methanol (HPLC grade) at flow rate of 2.0 mL/min. Buffer was prepared in double distilled water and chromatographic separations were performed at ambient temperature.
Tim e (M inutes)F igure 2 . C hrom atographic sep aration o f th e am i- n o cy c lo h ex a n eca rb o n itr ile and p h e n y lc y c lo h e x y l- a m in e prepared from p ip er id in e . Peak 1, R = CN; p eak 2 , R = C sH 5. C h rom atograp hic c o n d itio n s as
d escr ib ed in text.
R esu lts and D iscussio nPCP-type drugs of abuse can be produced from
available laboratory chemicals in a 2-step reaction (Figure 1). The initial synthetic product is an aminocyclohexanecarbonitrile such as PCC. The chemical properties of the intermediate n itrile and the final product are very sim ilar. Both the nitrile and the phenylcyclohexylamine are organic bases that form crystalline hydrochloride salts. Thus, unreacted nitrile easily contaminates the isolated arylcyclohexylamine. Previous work (2) has shown that PCC is more toxic than PCP and that at least part of the PCC toxicity may be attributed to cyanide poisoning.
The structures of the analogs of PCC and PCP included in this study are shown in Figures 2-6. The isolation of the final products free from the nitrile intermediate required careful control of the reaction conditions and repeated extractions during workup. Controls on the availability of piperidine are tightening and other amines are being used for the clandestine synthesis of ar- ylcyclohexylamines sim ilar to PCP. It seems
Tim e (M inutes)F igure 3. C hrom atographic sep aration o f th e a m in ocyc lo h ex an eca rb o n itr ile and p h e n y lc y c lo h e x y la m in e prepared from p y rro lid in e . Peak 1, R = CN; p eak 2, R = C iH s. C hrom atographic c o n d itio n s as
d escrib ed in text.
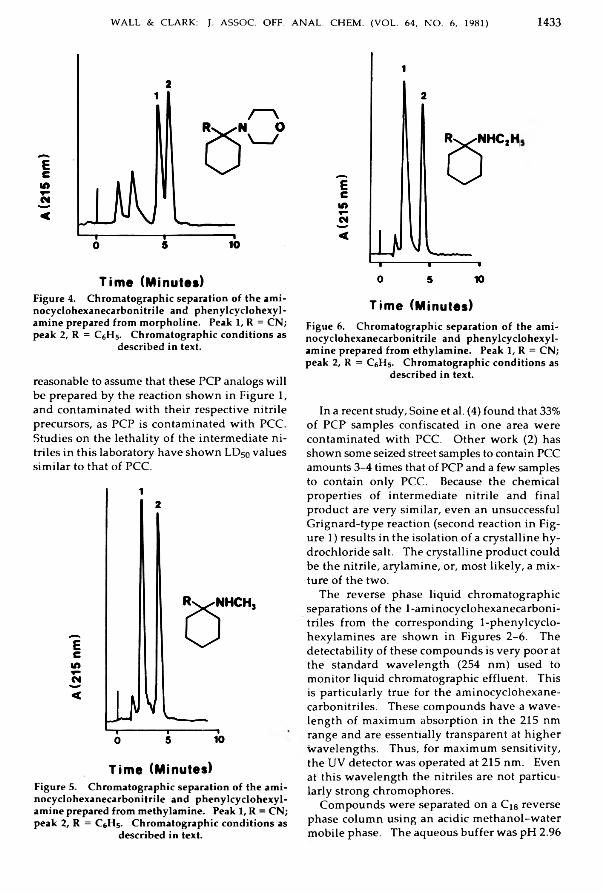
W A L L & C L A R K : J. A S S O C . OFF. A N A L . C H E M . (VOL. 64, N O . 6, 1981) 1433
T im e (M in u te s)F igure 4. C h rom atograp h ic sep aration o f th e am i- n o cy c lo h ex a n eca rb o n itr ile and p h e n y lc y c lo h e x y l- a m in e prepared from m o rp h o lin e . P eak 1, R = CN; p eak 2, R = C sH 5. C hrom atographic c o n d itio n s as
d escr ib ed in text.
reasonable to assume that these PCP analogs w ill be prepared by the reaction shown in Figure 1, and contaminated with their respective n itrile precursors, as PCP is contaminated w ith PCC. Studies on the lethality of the intermediate n itriles in this laboratory have shown LD50 values sim ilar to that of PCC.
T im e (M in u te s)F igure 5. C h rom atograp h ic sep aration o f th e a m i- n o cy c lo h ex a n eca rb o n itr ile and p h e n y lc y c lo h e x y l- a m in e prepared from m eth y la m in e . P eak 1, R = CN; p ea k 2 , R = CeHs. C h rom atograp h ic c o n d itio n s as
d escr ib ed in text.
T im e (M in u te s)F igue 6 . C hrom atographic sep aration o f th e a m i- n ocyc lo h ex an eca rb o n itr ile and p h e n y lc y c lo h e x y l- a m in e prepared from eth y la m in e . P eak 1, R = CN; p eak 2 , R = C6H 5. C hrom atographic c o n d itio n s as
d escrib ed in text.
In a recent study, Soine et al. (4) found that 33% of PCP samples confiscated in one area were contaminated w ith PCC. Other work (2) has shown some seized street samples to contain PCC amounts 3-4 times that of PCP and a few samples to contain only PCC. Because the chemical properties of intermediate n itrile and final product are very sim ilar, even an unsuccessful Grignard-type reaction (second reaction in Figure 1) results in the isolation of a crystalline hydrochloride salt. The crystalline product could be the n itrile , arylamine, or, most like ly , a mixture of the two.
The reverse phase liquid chromatographic separations of the 1-aminocyclohexanecarboni- triles from the corresponding 1-phenylcyclo- hexylamines are shown in Figures 2-6. The detectability of these compounds is very poor at the standard wavelength (254 nm) used to monitor liquid chromatographic effluent. This is particularly true for the aminocyclohexane- carbonitriles. These compounds have a wavelength of maximum absorption in the 215 nm range and are essentially transparent at higher wavelengths. Thus, for maximum sensitivity, the UV detector was operated at 215 nm. Even at this wavelength the nitriles are not particularly strong chromophores.
Compounds were separated on a C js reverse phase column using an acidic methanol-water mobile phase. The aqueous buffer was pFl 2.96

1434 W A L L & C L A R K : J. A S S O C . OFF. A N A L . C H E M . (VOL. 64, N O . 6, 1981)
and this acidic medium should be sufficient to shift the equilibrium between protonated amine and its corresponding free base heavily toward the protonated amine. Thus, the species being chromatographed is the protonated amine or the hydrophilic protonated amine phosphate ion- pair. Attempts at separations at higher pH levels resulted in poor resolution and peak shape, especially for the aminocyclohexanecarboni- triles. This may indicate that the n itrile compounds are undergoing decomposition reactions during the separation process under neutral or basic conditions. The formation of hydrophobic ion-pairs by adding 1-heptanesulfonic acid to the mobile phase did not enhance resolution. Normal phase separations were equally unsuccessful. The chromatograms in Figures 2-6 show that the nitrile precursor elutes ahead of the arylcyclohexylamine in this reverse phase system. Resolution was adequate in these examples; however, peak tailing remains a problem in some cases. Detection lim its were in the range of 1 X 10⁻⁷ mole/injection for the nitriles and arylcyclohexylamines. An injection of this amount of sample produced a peak of 5:1 sig
nal-to-noise ratio or greater for a ll compounds studied.
The results of this work indicate that liquid chromatography is a useful technique for the separation of 1-aminocyclohexanecarbonitriles from the corresponding 1-arylcyclohexylamines and that maximum sensitivity by UV spectrophotometry requires monitoring at 215 nm. This procedure allows for the analysis of mixtures of 1-aminocyclohexanecarbonitriles in the presence of the corresponding arylcyclohexylamine.
References(1) B allinger, J. R., & M arshm an, J. (1979) J. Anal. Toxicol. 3 ,1 58 -1 61(2) Davis, W. M„ Borne, R. F., Hackett, R. B., & Waters,
I. W. (1980) Life Sci. 26, 2105-2111(3) Bailey, K„ C how , A. Y. K., D o w n ie , R. H ., & Pike,
R. K. (1976) ]. Pharm. Pharmacol. 2 8 ,7 1 3 -7 1 4(4) Soine, W. H„ V incek , S. C., & A gee, D . T. (1979) N. Engl. J. Med. 301 ,4 38(5) H elisten , C. & S h u lg in , A. T. (1976) J. Chromatogr.
1 17 ,2 3 2 -2 3 5(6 ) G agné, D. R„ & Pike, R. K. (1977) ]. Assoc. Off. Anal. Chem. 60, 32-47(7) Kalir, A ., Edery, H ., P elah, Z., Balderm an, D ., &
Porath, G. (1969) J. Med. Chem. 1 2 ,4 7 3 -4 7 7

M A Y & SIH: J. A S S O C . OFF. A N A L . C H E M . (VOL. 64, N O . 6, 1981) 1435
Protein Nitrogen Unit Precipitation Procedure for Allergenic Extracts: Collaborative StudyJO A N C . M A Y and JEN N Y T . C . S IHF o o d a n d D r u g A d m i n i s t r a t i o n , B u r e a u o f B i o l o g i e s , 8 8 0 0 R o c k v i l l e P i k e , R o c k v i l l e , M D 2 0 2 0 5
Collaborators: A lle rg y Laboratories, J. Best, G . Douglas, J. M . Rancour, H . R . Renker,F . Sp ingola, L . Van D aele, and S . Zudeck
P ro te in n itro g en u n it (P N U ) d eterm in a tio n is o n e o f th e m eth o d s u sed to te st and la b e l th e co n cen tra tion o f a lle rg en ic extracts. T h is re ce n tly stan d ard ized m eth o d is a p p lica b le to a ll a lle rg en ic extracts. O n e P N U /m L is e q u iv a le n t to 1 X 10 - 5 m g n itro g en d e term ined to b e in th e m aterial precip itated from 1 m l a lle rg en ic extract b y p h o sp h o tu n g stic acid (PT A ), a p ro te in p recip ita n t. T h e n itro g en is q u an tita ted b y th e K jeldahl m eth od or anoth er ana ly tica l m eth od o f e q u iv a le n t accuracy and p rec is io n . A co lla b o ra tiv e s tu d y o f th e o p tim ized P N U p recip ita tion m eth od in w h ic h 6 sam p les w ere a n a ly zed in d u p lica te b y 6
lab oratories u sin g th e K jeld ah l m eth o d fo r th e d eterm ination o f n itrogen y ie ld ed a m ean o f 0.1358 m g N /m L , a rep ea ta b ility standard d ev ia tio n and co e ff ic ie n t o f var ia tio n o f 0.0071 m g N /m L and 5.23%, respectively , and a reproducib ility standard dev ia tion and c o e ff ic ie n t o f var ia tio n o f 0.0188 m g N /m L and 13.84%, re sp e c tiv e ly . T h e m eth od has b een adop ted o ff ic ia l firs t action .
The methodology for the protein nitrogen unit (PNU) precipitation has been standardized recently (1) by establishing optimum conditions for protein precipitation in allergenic extracts by phosphotungstic acid (PTA). PTA is preferred over other protein précipitants for allergenic extracts because it appears to be more specific for the precipitation of allergenically active material(2). This paper describes a collaborative study of the optimized precipitation method. The PNU methodology is one of the procedures (3) used to test and label the concentration of allergenic extracts; it is applicable to all allergenic extracts. One PNU/mL is equivalent to 1 X 10~5 mg nitrogen (10 ng N) determined to be in the material precipitated from 1 mL allergenic extract by phosphotungstic acid (PTA), a protein precipitant. The nitrogen is quantitated by the Kjeldahl method or another analytical method of equivalent accuracy and precision. The in-
Received August 28, 1980. Accepted May 28,1981.This report of the Associate Referee, Joan C. May, was presented at the 95th Annual Meeting of the AOAC, Oct. 19-22, 1981, at Washington, DC.The recommendation of the Associate Referee was approved by the General Referee and Committee B and adopted by the Association. See /. Assoc. Off. Anal. Chem. 65, March issue (1982) for detailed reports.
troduction of this optimized PNU methodology will improve the standardization of licensed allergenic extracts with respect to their concentration and labeling, which heretofore has been inconsistent. A consistently determined and labeled PNU value will aid the physician in assessing the equivalence of competitive extracts and in preparing a standardized patient dose.
Other units and methodologies for the chemical standardization of allergens are in use. However, those methods in current use and those potentially applicable are fraught with inaccuracies in practice (3). These include the Noon-unit (1 g pollen is equivalent to 106 Noon-units) and expressing extract potency on w e ig h t to v o lu m e basis (grams of dry allergenic material per volume of extracting solvent). Standardization of allergenic extracts by their amino acid composition has not been feasible, because acid hydrolysis in the presence of carbohydrate-rich allergens leads to heavy losses of amino acids and poor recoveries. The possibilities for standardization of allergenic extracts by taking advantage of absorption or fluorescence spectra have not yet been fully explored. However, because allergenic extracts usually contain nonallergenic proteins with similar physicochemical properties, these proposed methods are not likely to be highly specific for allergenically active proteins.
The PNU precipitation method for allergenic extracts was collaboratively studied as described below.
Collaborative StudyThe collaborators were provided with samples,
a copy of the PTA precipitation method, and sample preparation information. For consistency in the evaluation of the PTA precipitation method, collaborators were requested to determine the nitrogen in the precipitate by the Kjeldahl method of Rabat and Mayer (4) with methyl red-bromocresol green (5) as the titration end point indicator. The details of this Kjeldahl method were provided. Two laboratories volunteered to follow the prescribed PNU precipi
0004-5756/81/6406-1435-04$01.00© Association of Official Analytical Chemists. Inc.
1436 M A Y & SIH: J. A S S O C . OFF. A N A L . C H E M . (VOL. 64, N O . 6, 1981)
tation but to determine the nitrogen content in the precipitate by AutoAnalyzer methods. It is valuable to have such comparative data, because some allergenic manufacturers use AutoAnalyzer methodology in their PNU tests. However, because this collaborative study is limited to results obtained by the Kjeldahl method and 2 laboratories do not provide enough data to yield valid statistical conclusions about the AutoAnalyzer method itself, the AutoAnalyzer results are included here for information only.
For the collaborative study, 10 samples were sent to 9 laboratories to be analyzed in duplicate. The collaborative study design was that of Steiner (6); the statistical analysis was aimed at the calculation of the errors associated with the reproducibility and repeatability of the PNU precipitation. The sample labeled PNU 4 was Bureau of Biologies Nitrogen Reference No. 3, a solution of bovine albumin in water. The other samples were various types of allergenic extracts as listed below:PNU 1—Alum-precipitated A ltern a ría ten u is ex
tractPNU 2—Glycerinated honey bee extract PNU 3—Alum-precipitated house dust extract PNU 5—Freeze-dried BoB Reference Short
Ragweed Pollen Extract No. 1 PNU 6—Aqueous A ltern a ría extract PNU 7—Aqueous A ltern a ría extract PNU 8—Aqueous A ltern a ría extract PNU 9—Glycerinated A ltern a ría extract PNU 10—Aqueous A ltern a ría extract The allergenic extracts used in this study were purchased from various U.S. manufacturers. The extracts were suitable for release and clinical use.
A practice sample was distributed with the collaborative samples. The collaborators were given the nitrogen content of this sample so that they could validate their PNU precipitation and their method for the determination of nitrogen. The practice sample was the National Bureau of Standards (NBS) Standard Reference Material (SRM) No. 927 Bovine Serum Albumin—7% Solution (Department of Commerce, Washington, DC).
A lle rg e n ic Extracts — P ro te in N itrogen U n it P rec ip ita tio n M ethod O ffic ia l F irs t A ctio n
P r i n c i p l eProtein is pptd from allergenic ext by phos-
photungstic acid, and N in ppt is detd by appro
priate Kjeldahl procedure. Protein nitrogen unit (PNU) is equiv. to 1 X 10⁻⁵ mg N.
R e a g e n tP h o sph o tu n g stic acid (P T A ) p rec ip ita tin g solu
tio n .—Dissolve 15.0 g PTA in ca 70 mL H 2O. Add 22.2 mL HC1 and dil. to 100 mL with H20 .
D e t e r m i n a t i o nCombine vol. of allergenic ext indicated below
with 0.25 mL HC1 in 12 mL conical centrf. tube. Use 2 mL sample when approx. PNU value of ext is not known. When approx. PNU value of ext is known, analyze following vols:
Allergenic ext, P N U /m L Vol., mL>35 500 1
15 500-35 500 2<15 500 3
Add 1 mL PTA pptg soln. Mix thoroly. Let stand 1 h at room temp. (22 ± 3°).
Centrf. mixt. at room temp, at 2700 rpm (rotor radius = 10.80 cm) for 10-15 min (rel. centrifugal force measured to tip of sample tube = g = 880).
Test for completeness of pptn by adding 5 drops PTA soln. Check visually for turbidity in supernate. If turbidity develops, add addnl 0.5 mL PTA soln. Let mixt. stand 1 h at room temp. Recentrf. at 2700 rpm for 10-15 min (room temp.).
Poor off supernate. Invert centrf. tube to drain ppt. Do n ot wash ppt.
Dissolve ppt in 10 mL 2% NaOH by first adding 3 mL 2% NaOH with vol. pipet. Use vortex mixer to loosen ppt. Add 7 mL 2% NaOH (vol. pipet). Mix thoroly. Det. N by appropriate Kjeldahl method. ?NU/m L = 10s X mg N/mL.
N itrogen D eterm inatio nR e a g e n t s
(a ) S ulfuric a c id .—Sp. gr. 1.84, N-free.(b) C o p p e r s u l f a te .—CUSO4.5H 2O, N-free.
Prepare saturated aqueous solution.(c) A cid so lu tio n .—Add ca 40 mL saturated
aqueous CUSO4 to 9 lb bottle of H 2SO4 in 10 mL portions with thorough mixing. After several days, excess anhydrous CUSO4 crystallizes and the supernatant acid is ready to use.
(d ) P otassium s u lfa te .—N-free.(e ) Sodium h yd ro x id e so lu tio n .—50% NaOH.(f) Boric acid so lu tio n .— 2%.(g) In d ic a to r so lu tio n .—Methyl red-bromo-
cresol green solution. Mix 1 part 0.1% alcoholic

M A Y & SIH: J. A S S O C . OFF. A N A L . C H E M . (VOL. 64, N O . 6, 1981) 1437
methyl red solution with 5 parts 0.1% alcoholic bromocresol green solution.
(h ) H yd ro c h lo r ic a c id .—0.01N. Prepare as in 50.011 and standardize as in 50.015 or 50.017, or use 0.01000N standard HC1 (purchased as standard).
A p p a r a t u sSee 47.022.
D e t e r m i n a t i o nPipet 9 mL prepared sample into 30 mL di
gestion flask. Add ca 500 mg K 2S04, 3 boiling stones, and 2 mL CUSO4-H2SO4 solution. Place flask in digestion rack. Heat carefully and digest sample until solution turns colorless. Continue digestion for additional V2 h. Cool and place thin film of petroleum jelly 0n rim of flask. Transfer digest and boiling chips to distillation apparatus and rinse flask 5 or 6 times with 1-2 mL portions of water. Place 125 mL Erlenmeyer flask containing 5 mL 2% H3BO3 solution and 5 drops of indicator under condenser with tip extending below surface of solution. Add ca 6 mL NaOH (50% w /w ) to still. If distillation apparatus uses steam distillation, d istill at rate of 5 m L/m in and collect about 50 mL. If apparatus does not introduce steam into distilling flask, collect 10-15 mL distillate and dilute to ca 50 mL w ith water. Titrate distillate with 0.1N HC1 to end point (pinkish purple). Perform blank determination in same manner, using water in place of sample.
C a l c u l a t i o n smg N/m L = [(mL HC1 - mL HC1 blank) X
normality X 14.007 X 10/9]/mL sample
R esu lts and D iscussio nUseful results were obtained from 6 of the 7
laboratories that used the Kjeldahl method for the determination of nitrogen. The seventh laboratory (Laboratory G) reported results that differed greatly from the other collaborators' results. The results for 3 of this laboratory's samples were outliers by Dixon's test (7). Laboratory G's results were not included in the data analysis.
Two laboratories (Laboratories H and I) used AutoAnalyzer methods (not the Kjeldahl nitrogen method) to determine the nitrogen content of the PTA precipitate. The results for these 2 laboratories were not included in the statistical analysis of the data with those of the 6 laboratories that used the Kjeldahl nitrogen method.
Of the original 10 samples procured for this
collaborative study, 2 samples (PNU 2 and PNU 9) were found after analysis to be below the detection lim it for this method. These samples were eliminated from the collaborative study. O riginally PNU 2, PNU 9, and PNU 6 were ordered with the intent of including samples in the collaborative study which were situated at the lower end of the analytical range encountered. Of these 3 samples, only PNU 6 had an acceptable PNU level. Two other samples (PNU 5 and PNU 7) were also eliminated from the study because several laboratories deviated from the prescribed PNU collaborative precipitation in their treatment of these samples.
Table 1 lists the collaborative results. For convenience, the units mg N/m L are used (1 PNU/m L = 1 X 1(T5 mg N/m L).
PNU 4 was an aqueous solution of bovine albumin (BoB Nitrogen Reference No. 3) that has been used as a control sample for PNU determinations at the Bureau of Biologies. The average value of 109 Kjeldahl determinations on the PTA precipitate of BoB Nitrogen Reference No. 3 was 0.149 ± 0.005 mg N/mL with a relative standard deviation of 3.6%. The mean of the 12 collaborative results for PNU 4 was 0.143 ± 0.011 mg N/mL with a relative standard deviation of 7.4%. The relative error of this result from the BoB average was 4.03%. In terms of recovery, the average of the results of the 6 collaborators for this sample was 96% of the known mg N/m L or PNU/m L value. This is an indication of adequate accuracy and precision on the part of the collaborators. The error inherent in the Kjeldahl nitrogen method is usually quoted as ±0.01 mg N/m L (4). The error associated with the PTA precipitation has not been assigned a value. The collaborators' average value was 0.006 mg N/mL lower than the BoB average value for PNU 4. This error is well w ithin the ±0.01 mg N/m L usually associated with the Kjeldahl nitrogen determination.
The valid data in Table 1 were examined statistically by using the method of Steiner (6). The resulting statistical data for repeatability (variation w ithin laboratory) and reproducibility (variation among laboratories) are considered to be acceptable: mean, 0.1358 mg N / mL; repeatability SD, 0.0071 mg N/m L; reproducibility SD, 0.0188 mg N /m L; repeatability CV, 5.23%; reproducibility CV, 13.84% (results based on 72 determinations by 6 laboratories: Collaborators A , B, C, D, E, and F). The repeatability coefficient of variation is less than 10%. The reproducibility coefficient of variation is greater than 10% (13.84%), which is considered adequate be-

1438 M A Y & SIH: J. A S S O C . OFF. A N A L . C H E M . (VOL. 64, N O . 6, 1981)
Table 1. Collaborator results for the determination of PNUs in allergenic extracts (1 PNU/mL = 1 x 10~5 mg N/mL)Sample, mg N/m L
Coll.at,c PNU 1 PNU 3 PNU 4 PNU 6 PNU 8 PNU 10
A 0.109 0.176 0.142 0.019 0.168 0.1810.113 0.180 0.145 0.018 0.165 0.159
B 0.103 0.149 0.133 0.030 0.144 0.1550.100 0.155 0.133 0.015 0.144 0.155
C 0.117 0.175 0.145 0.016 0.175 0.1830.117 0.171 0.148 0.023 0.206 0.183
D 0.105 0.179 0.142 0.028 0.182 0.1840.104 0.182 0.148 0.023 0.172 0.182
E 0.131 0.201 0.168 0.037 0.197 0.1840.146 0.205 0.148 0.054 0.193 0.205
F 0.100 0.159 0.129 0.032 0.162 0.2430.098 0.151 0.132 0.033 0.155 0.235
G 0.133d 0.178d 0.189d 0.004* 0.360« 0.062«0.134 0.178 0.189 0.003 0.358 0.061
H 0.130d 0.170d 0.140d 0.020 d 0.150d 0.170d0.120 0.170 0.140 0.020 0.170 0.150
1 0.109d 0.183d 0.142d 0.017d __ __0.109 0.173 0.140 0.012 __ __
Mean 0.1119 0.1736 0.1428 0.027 0.1719 0.1874
« Duplicate pairs.6 Collaborators A, B, C, D, E, F, and G used the Kjeldahl method to determine the nitrogen content of the PTA precipi
tate.c Collaborators H and I used AutoAnalyzer methods to determine the nitrogen content of the PTA precipitate. d Deleted from analysis.« Outlier by Dixon's test. Deleted from analysis.
cause the sample types chosen were those most difficult to assay by this method (1), for example, aqueous A ltern a ría allergenic extract.
Limited data from 2 laboratories that determined nitrogen in the PNU method by AutoAnalyzer methods indicated that, although there were insufficient data to be considered as valid collaborative evidence, this AutoAnalyzer method could be the subject of a successful future collaborative study. The results are in good agreement with the results obtained by the Kjeldahl method.
Recom m endationsOn the basis of the results reported here it is
recommended that the protein nitrogen unit precipitation method be adopted official first action for the determination of the PNU concentration of allergenic extracts.
Acknow ledgm entsThe authors thank the following collaborators:
A llergy Laboratories of Ohio, Inc., Columbus, OH; J. Best, Children's Hospital, Washington, DC; G. Douglas, Greer Laboratories, Inc., Lenoir,
NC; J. M. Rancour, Hollister-Stier Laboratories, Spokane, WA; H. R. Renker, Miles Laboratories, Inc., West Haven, CT; F. Spingola, Nelco Laboratories, Inc., Deer Park, N Y; L . Van Daele, Parke-Davis and Company, Detroit, M I; and S. Zudeck, Center Laboratories, Inc., Port Washington, NY.
We also thank Foster McClure, D ivision of Mathematics, Bureau of Foods, FDA, for the statistical analysis of the collaborative data.
References(1) M ay, J. C., S ih , J. T. C., M iller, R. S., & S eligm an n ,
E. B. (1979) /. Allergy Clin. Immunol. 6 3 ,8 7 -9 7(2) V ersie, R. (1965) Acta Allergol. 2 0 ,1 5 -3 7(3) Berrens, L. (1971) The Chemistry of Atopic Allergens,
S. Karger AG, Basel, Sw itzerland , pp. 7, 8 , 203, 206
(4) Kabat, E. A ., & M ayer, M. M. (1961) Experimental Immunochemistry, Charles C T hom as, S p rin gfie ld , IL, pp. 476-479
(5) Official M ethods of Analysis (1980) 13th Ed., AOAC, A rlin gton , VA, p. 858
(6 ) Y ouden , W. J., & Steiner, E. H . (1975) Statistical M anual of the A O A C , A O AC, A rlin gton , VA
(7) D ixon , W. J. (1953) Biometrics 9 ,7 4 -8 9
Polarographie Analytical Study of OxyphenbutazoneMOUSTAFA M. ELLAITHY, M. FAYEZ EL-TARRAS, and SAWSAN M. AMER Cairo University, Analytical Chemistry Department, Faculty of Pharmacy, Cairo, Egypt
E L L A I T H Y E T AL.: J. A S S O C . OFF. A N A L . C H E M . (VOL. 64, N O . 6, 1981) 1439
T h e p olarog ra p h ic b eh a v io r o f th e w id e ly u sed a n ti-in fla m m a to r y a g en t, o x y p h e n b u ta z o n e , w as stu d ied . It is d eterm in ed p o larog ra p h ica lly b y co n versio n to th e n itroso d er iv a tiv e characterized b y a ca th od ic , irreversib le , d iffu s io n -c o n tr o lle d w av e . T h e m eth od is a p p lied to th e d eterm in ation o f 2 .5 -10 m g / 1 0 0 m l o f oxy p h en b u tazon e, w ith an accuracy o f99.9 ± 1.38%. By d iffer en tia l p u lse p olarograp h ic a n a ly sis , as l i t t le as 1 0 p p m ox y p h e n b u ta z o n e can be determ in ed w ith an accuracy o f 99.70 ± 0.99% in pure p o w d er and in so m e p h arm aceu tica l fo rm u la tio n s .
Only limited polarographic analytical studies have been reported for the widely used antiinflammatory drug oxyphenbutazone, 4-butyl- 2-(4-hydroxyphenyl) 1-phenylpyrazolidine-3.5- dione monohydrate. The B ritish P h a rm a c o p o e ia (1) identification test for oxyphenbutazone has been adapted to the determination of oxyphenbutazone and phenylbutazone by differential pulse polarography (2), but the procedure does not distinguish these 2 compounds. Adam and Joslin (3) studied the electrochemical oxidation of pyrazolone derivatives in alkaline medium, and others studied the oscillopolaro- graphic behavior of phenazone and phenylbutazone (4).
Pelinard et al. (5) studied the electrochemical behavior of the anti-inflammatory derivatives of pyrazolones. They reported that pyrazolidine-3.5- dione and other pyrazolone derivatives, having a labile hydrogen atom at the 4-position, show some electrochemical activity in a neutral medium composed of 0.2M lithium perchlorate in ethanol, while phenazone derivatives show activity only after diazotization. We report here the further study of the polarographic behavior, together with a differential pulse polarographic determination of oxyphenbutazone.
Experimental
A p p a r a t u sCurrent potential curves were recorded using
a Radelkis polarograph OH-102. A Model 384-1 polarographic analyzer system (EG & G Princeton Applied Research) was used for recording differential pulse polarographic curves.
Received December 2,1980. Accepted April 7,1981.
The solution to be investigated was placed either in a usual Kalousek cell or, where the solution was highly colored, in a Heyrovsky vessel w ith a separate reference saturated calomel electrode.
The rate of mercury flow through the capillary used for DC polarographic measurements, at a mercury height of 45 cm, was 1.8 mg/s and the drop time was 3.0 s (in distilled water). Except when the effect of mercury height was studied, a 45 cm mercury head was maintained.
A dropping mercury electrode assembly, Model 303 SMDE (Princeton Applied Research), was used for differential pulse polarographic measurements.
R e a g e n t s(a) O x y p h e n b u ta zo n e s to c k s ta n d a r d s o lu tio n .—1
mg/mL. Prepare in ethanol.(b) W o rk in g s ta n d a r d s f o r d ir e c t p o la ro g ra p h ic
m ea su rem en ts .—Prepare by suitable dilution with appropriate supporting electrolytes, such as HC1, KC1, L iC l, and NaOH solutions.
(c) F or in d ire c t D C p o la ro g ra p h ic d e te r m in a t io n s .—Mix 25 mL (equivalent to 25 mg) etha- nolic stock standard oxyphenbutazone solution w ith 25 mL IN HC1 in 100 mL volumetric flask. Add 25 mL IN sodium nitrite solution and mix thoroughly. Let reaction proceed for 10 min with occasional shaking. Stop reaction by diluting to mark with 20% KOH solution. Dilute various aliquots of obtained solution with 15 mL water-ethanol (1 + 1) mixture to obtain desired different concentrations.
(d) F or d if fe r e n tia l p u lse p o la ro g ra p h ic d e te r m in a t io n .—Dilute 10 mL (equivalent to 10 mg) ethanolic stock standard oxyphenbutazone solution to 50 mL w ith water. M ix 25 mL of obtained solution with 25 mL IN HC1 in 100 mL volumetric flask. Add 25 mL IN sodium nitrite solution and mix thoroughly. Let reaction proceed as above. Before polarographic measurements, remove oxygen from solution by bubbling stream of pure nitrogen through ca 3 min.
P r o c e d u r e(a) T a b le ts .—Use 20 tablets to calculate average
weight of each. Accurately weigh an amount of tablet powder containing ca 100 mg oxyphen-
0004-5756/81/6406-1439-03$01.00© Association of Official Analytical Chemists. Inc.

1440 ELLAITHY ET AL.: J. ASSOC. OFF. ANAL. CHEM . (VOL. 64, N O . 6, 1981)
Table 1. DC polarographic determination in alkaline medium of oxyphenbutazone product with nitrous acid
Taken, m g /100 mL
Found, m g /100 mL
Recovery,%
2.50 2.45 98.04.17 4.10 98.35.00 5.10 102.05.83 5.80 99.57.50 7.60 101.38.33 8.30 99.6
10.83 10.90 100.6Mean (P = 0.05) 99.9
±1.38SD 1.49
butazone into 100 mL volumetric flask, and extract w ith and dilute to volume with ethanol. Pipet 25 mL clear supernate into 100 mL volumetric flask and treat as standard solution, beginning "Add 25 mL sodium nitrite solution
(b ) C ap su les .—Use contents of 10 capsules to calculate average weight of each. Accurately weigh an amount of mixed contents equivalent to ca 100 mg oxyphenbutazone into 100 mL volumetric flask, and extract and dilute to volume w ith ethanol. Pipet 25 mL clear supernate into 100 mL volumetric flask and proceed as in (a).
(c) S u pp osito ries .—Allow 5 suppositories to melt by gentle warming in 50°C water bath. Mix thoroughly, let solidify, weigh, and calculate average weight of each. Accurately weigh an amount of mixed suppositories equivalent to ca 100 mg oxyphenbutazone into 100 mL volumetric flask, and extract and dilute to volume with ethanol. Transfer 25 mL clear supernate to 100 mL volumetric flask and proceed as in (a).
R esu lts and D iscussio nOxyphenbutazone has been proved to be po-
larographically inactive under our experimental conditions and in different supporting electrolytes. An uncertain, ill-defined reduction wave was reported (5) only in an ethanolic neutral solution of 0.2M lithium perchlorate. Attempts to improve the wave for quantitative measurements, by using different solvents and supporting electrolytes, were unsuccessful.
Oxyphenbutazone, however, being a phenolic compound with a vacant ortho position, was expected to convert to a polarographically active nitroso derivative when treated with nitrous acid(6). The most reproducible, well defined cathodic wave was obtained when the reaction between oxyphenbutazone and nitrous acid was stopped by the addition of 20% KOH solution,
Table 2. Differential pulse polarographic determination of oxyphenbutazone standard by proposed procedureTaken, ppm Found, ppm Recovery, %
10 9.97 99.720 19.89 99.530 30.14 100.540 39.60 98.850 50.55 101.1
100 98.7 98.7Mean (P = 0.05) 99.7
±0.99SD 0.94
and the polarogram was recorded in the alkaline KOH solution as a supporting electrolyte.
Stopping the reaction with sulfamic acid (to decompose the excess nitrite in the solution), or using acidic or neutral Britton-Robinson buffer as a supporting electrolyte gave ill-defined waves.
The single cathodic wave of oxyphenbutazone obtained in distinctly alkaline solution, after treatment with nitrous acid, showed an £1/2 of about —0.92 V vs SCE.
Effect of mercury height (h) on current (i) was studied. A linear relationship was obtained between recorded current and square root of mercury height. The log i-log h plot also shows a linear relationship, with a slope near 0.5, indicating the diffusion-controlled character of the wave. The obtained current was directly proportional to the concentration of the depolarizer over a wide range of concentration. Thus, this reduction diffusion-controlled wave is suitable for quantitative polarographic determination of oxyphenbutazone.
The logarithmic analysis plot of the wave obtained under these experimental conditions shows a linear relationship, w ith an exceptionally high slope value significantly different from the theoretical value corresponding to reversible system, 59 mV for a fast electrochemical mo- noelectronic reaction. The electrode reaction is, therefore, irreversible.
The suggested derivatization procedure for oxyphenbutazone has been applied to different concentrations (Table 1). The suggested polarographic method can determine 2.5-10.83 mg oxyphenbutazone/100 mL after derivatization, with an accuracy of 99.9% and a confidence lim it of ±1.38%.
The highly sensitive differential pulse polarographic (DPP) technique has been used for the determination of oxyphenbutazone through the obtained peak current, using the suggested
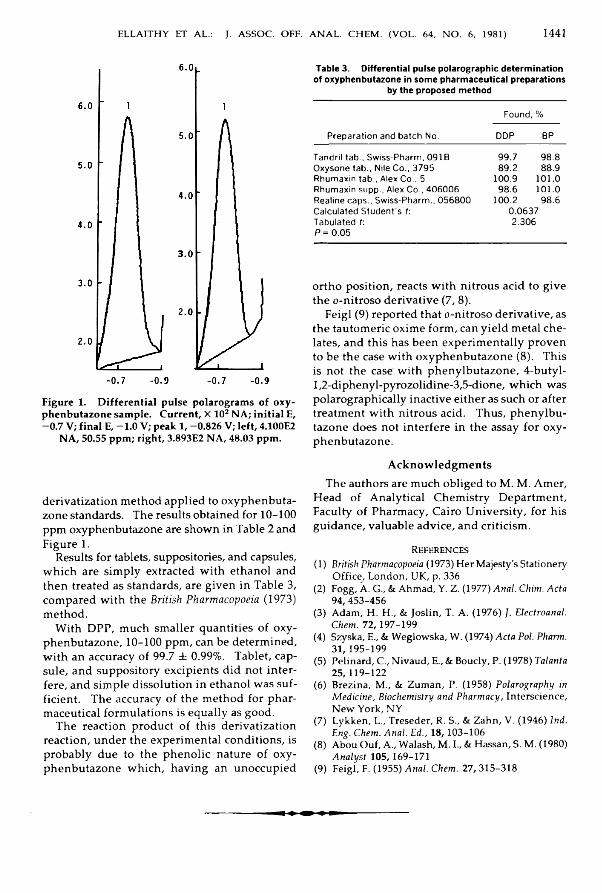
ELLAITHY ET AL.: J. ASSOC. OFF. ANAL. CH EM . (VOL. 64, N O . 6, 1981) 1441
F igure 1. D if fe r e n tia l p u lse p olarogram s o f o x y - p h en b u ta z o n e sam p le . C urrent, X 102 N A ; in it ia l E, - 0 .7 V; fin a l E, - 1 .0 V; peak 1, -0 .8 2 6 V; le ft , 4.100E2
N A , 50.55 ppm ; r igh t, 3.893E2 N A , 48.03 ppm .
derivatization method applied to oxyphenbuta- zone standards. The results obtained for 10-100 ppm oxyphenbutazone are shown in Table 2 and Figure 1.
Results for tablets, suppositories, and capsules, which are simply extracted w ith ethanol and then treated as standards, are given in Table 3, compared with the B ritish P harm acopoeia (1973) method.
With DPP, much smaller quantities of oxyphenbutazone, 10-100 ppm, can be determined, w ith an accuracy of 99.7 ± 0.99%. Tablet, capsule, and suppository excipients did not interfere, and simple dissolution in ethanol was sufficient. The accuracy of the method for pharmaceutical formulations is equally as good.
The reaction product of this derivatization reaction, under the experimental conditions, is probably due to the phenolic nature of oxyphenbutazone which, having an unoccupied
Table 3. Differential pulse polarographic determination of oxyphenbutazone in som e pharmaceutical preparations
by the proposed methodFound,%
Preparation and batch No. DDP BP
Tandril tab., Swiss-Pharm, 091B 99.7 98.8Oxysone tab., Nile Co., 3795 89.2 88.9Rhumaxin tab., Alex Co., 5 100.9 101.0Rhumaxin supp., Alex Co., 406006 98.6 101.0Realine caps., Swiss-Pharm., 056800 100.2 98.6Calculated Student’s t: 0.0637Tabulated t: 2.306P = 0.05
ortho position, reacts w ith nitrous acid to give the o-nitroso derivative (7, 8).
Feigl (9) reported that o-nitroso derivative, as the tautomeric oxime form, can yield metal chelates, and this has been experimentally proven to be the case with oxyphenbutazone (8). This is not the case w ith phenylbutazone, 4-butyl- l,2-diphenyl-pyrozolidine-3,5-dione, which was polarographically inactive either as such or after treatment w ith nitrous acid. Thus, phenylbutazone does not interfere in the assay for oxyphenbutazone.
Acknow ledgm entsThe authors are much obliged to M. M. Amer,
Head of Analytical Chemistry Department, Faculty of Pharmacy, Cairo University, for his guidance, valuable advice, and criticism .
References(1) British Pharmacopoeia (1973) H er Majesty's Stationery
O ffice , L ondon, UK, p. 336(2) Fogg, A. G„ & A hm ad, Y. Z. (1977) Anal. Chim. Acta
9 4 ,4 5 3 -4 5 6(3) A dam , H . H ., & Joslin , T. A. (1976) J. Electroanal. Chem. 7 2 ,1 9 7 -1 9 9(4) Szyska, E., & W eglow ska, W. (1974) Acta Pol. Pharm.
3 1 ,1 9 5 -1 9 9(5) Pelinard, C., N ivau d , E., & Boucly, P. (1978) Talanta
2 5 ,1 1 9 -1 2 2(6 ) Brezina, M ., & Zum an, P. (1958) Polarography in Medicine, Biochemistry and Pharmacy, Interscience,
N e w York, NY(7) Lykken, L., Treseder, R. S., & Z ahn, V. (1946) lnd. Eng. Chem. Anal. Ed., 1 8 ,1 0 3 -1 0 6(8 ) A bou O uf, A., W alash, M. I., & H assan, S. M. (1980) Analyst 1 0 5 ,1 69 -1 7 1(9) F eig l, F. (1955) Anal. Chem. 2 7 ,3 1 5 -3 1 8

1442 HASSAN ET AL.: J. ASSOC. OFF. ANAL. CHEM . (VOL. 64, N O . 6, 1981)
Colorimetric Determination of Certain Phenol Derivatives in Pharmaceutical PreparationsSA YED M . H A SSA N , M O H AM M ED I . W A LA SH , SA N A A M . EL-SA Y ED , and A B D EL M A LE K ABO U O UFMansoura University, Pharmaceutical Chemistry Department, Faculty of Pharmacy, Mansoura, EgyptS im p le co lo rim etric m eth od s are reported for d eterm in in g b o th a cetam in op h en and o x y p h en b u ta zo n e . T h ese m eth od s are b ased on c o u p lin g b e tw e e n th e p h e n o lic co m p ou n d and th e d ia zo n iu m sa lts o f b oth su lfa n ilic acid and p -n itr o a n ilin e ; th e o p tim u m co n d itio n s for the reaction s w er e ca refu lly s tu d ied . For a ce tam in op h en , the reaction p rod ucts w ith d ia - z o su lfa n ilic acid and d ia z o -p -n itr o a n ilin e sh o w m axim um absorbance at 480 and 425 nm , respectively . T he m ean percentage recoveries for authentic sam ples w ere 99.5 ± 1.1 and 100.6 ± 0.66, re sp e c tiv e ly ( P =0.05). For o x y p h e n b u ta z o n e , th e o b ta in ed co lors sh o w ed m axim a at 385 nm w ith d ia z o su lfa n ilic acid and 490 nm w ith d ia zo -p -n itro an ilin e reactions. T he m ean p ercentage recover ies fo r a u th en tic sam p les w ere 99.8 ± 0.27 and 100.1 ± 0.57, re sp e c tiv e ly (P =0.05). T h e p rop osed m eth o d s w ere su c ce ss fu lly app lie d to th e a n a ly sis o f com m ercial p reparations; resu lts w ere sta tistica lly com pared w ith th o se o f other m eth od s.
In view of the importance of acetaminophen as w ell as oxyphenbutazone as analgesic, antipyretic, and anti-inflammatory drugs, several colorimetric methods were reported for their determination. The majority of the published methods for acetaminophen depend on hydrolysis of the compound to p-aminophenol. The latter can then be estimated through its amino group either by diazotization and coupling (1, 2), condensation with certain aldehydes (3-6), n itration (7, 8), or oxidation (9). Other methods based on the phenolic nature of the drug depend on color reactions with Folin-Ciocalteu reagent(10) and nitrous acid (11-13). The reported color reactions for oxyphenbutazone depend either on hydrolysis followed by condensation with some aldehydes (14) or on direct reaction w ith 4-ami- noantipyrine (15) or nitrous acid (16). Svatek and Hardkova (17) reported a direct method using reaction of oxyphenbutazone with diazo- tized sulfanilic acid, but the reported procedure was not reproducible in our laboratory.
The present communication describes direct color reactions in which the phenolic drugs are coupled w ith diazosulfanilic acid or diazo-p-
Received A ugust 15,1980. Accepted June 30, 1981.
nitroaniline. The procedure is simple, accurate, applicable to dosage forms, and suitable for routine analysis.
Experim ental
A p p a r a t u s a n d R e a g e n t s(a) S p e c tro p h o to m ete r .—Unicam SP1800 sup
plied with 1 cm glass cells.(b) R e a g e n ts .—Methanol, chemically pure (Prolabo); IN NaOH; 0.5% sodium nitrite in water; 0.2% sulfanilic acid in IN phosphoric acid; 0.2% p-nitroaniline in IN phosphoric acid.
A ll chemicals including acetaminophen and oxyphenbutazone are pure and pass BP (1973) requirements.
S a m p l e P r e p a r a t i o nTransfer aliquot of crushed tablets, melted
suppositories, syrups, or drops corresponding to ca 100 mg phenolic compound to 100 mL volumetric flask. Add 50 mL water, shake thoroughly (warm slightly for suppositories), and dilute to volume with water. Filter, if necessary, transfer 10 mL to 100 mL volumetric flask, and dilute to volume with water.
P r o c e d u r eTransfer 1 mL amine reagent (sulfanilic acid
or p-nitroaniline) to 25 mL volumetric flask and add 0.5 mL sodium nitrite reagent. Mix thoroughly, and let stand at room temperature 10 min. Add 1 mL methanol and mix w ell to eliminate excess nitrous acid. Add 3 mL aqueous solution of phenolic compounds (equivalent to ca 0.3 mg), followed by 3 mL IN NaOH. Concomitantly, prepare blank in which phenol is replaced by 3 mL distilled water. Dilute both solutions to volume with water and let stand at room temperature additional 20 min. Measure absorbance at maximum wavelength indicated below. Calculate concentration of sample from calibration graph sim ilarly prepared by using known amounts of phenol tested.
0004-57 56 / 81 /6406-1442-04$0.100© Association of Official Analytical Chemists, Inc.
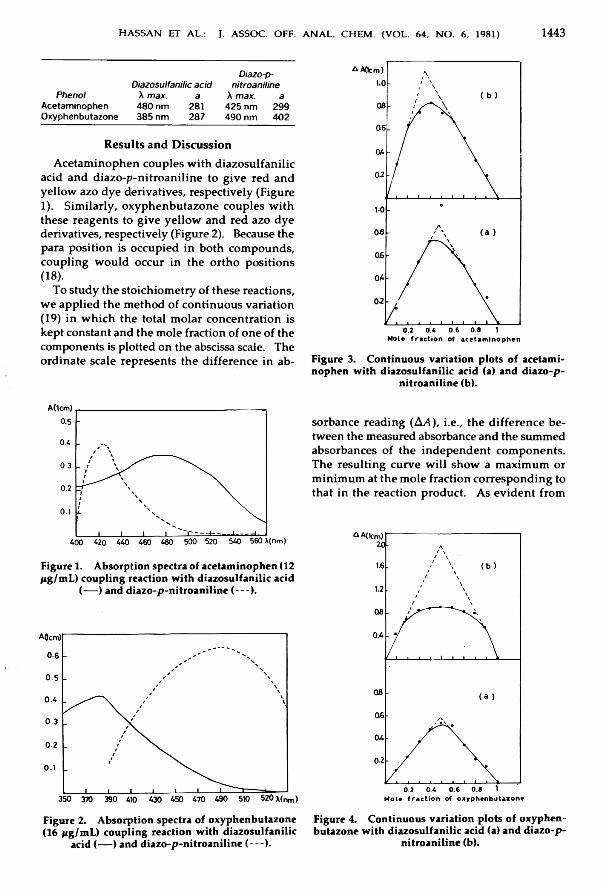
H A S S A N E T AL.: J. A S S O C . OFF. A N A L . C H E M . (VOL. 64, N O . 6, 1981) 1 4 4 3
Diazo-p-Diazosulfanilic acid nitroanilinePhenol A max. a A max. aAcetaminophen 480 nm 281 425 nm 299Oxyphenbutazone 385 nm 287 490 nm 402
Results and DiscussionAcetam inophen couples w ith d iazo su lfan ilic
acid and d iazo-p -n itroan iline to g ive red and ye llo w azo dye derivatives, respectively (Figure1). S im ila rly , oxyphenbutazone couples w ith these reagents to g ive ye llo w and red azo dye derivatives, respectively (Figure 2). Because the para position is occupied in both com pounds, coupling w ou ld occur in the ortho positions(18).
To study the sto ichiom etry o f these reactions, w e app lied the m ethod o f continuous varia tio n(19) in w h ich the total m olar concentration is kept constant and the mole fraction o f one o f the components is plotted on the abscissa scale. The ord inate scale represents the d ifference in ab-
F igure 1. A b so rp tion spectra o f a ce tam in op h en (12 f ig /m L ) co u p lin g reaction w ith d ia z o su lfa n ilic acid
(— ) and d ia z o -p -n itr o a n ilin e ( — ).
F igure 2. A b so rp tion spectra o f o x y p h en b u ta zo n e (16 p g /m L ) c o u p lin g reaction w ith d ia z o su lfa n ilic
acid (— ) and d ia zo -p -n itr o a n ilin e ( - - - ) .
F igure 3. C o n tin u o u s v ar ia tio n p lo ts o f acetam in o p h en w ith d ia z o su lfa n ilic acid (a) and d ia z o -p -
n itr o a n ilin e (b).
sorbance reading (A A ), i.e ., the d ifference between the measured absorbance and the summed absorbances o f the independent com ponents. The resu ltin g curve w ill show a m axim um or m inim um at the m ole fraction corresponding to that in the reaction product. A s eviden t from
F igure 4. C o n tin u o u s v ar ia tio n p lo ts o f o x y p h e n b u ta zo n e w ith d ia z o su lfa n ilic acid (a) and d ia z o -p -
n itr o a n ilin e (b).
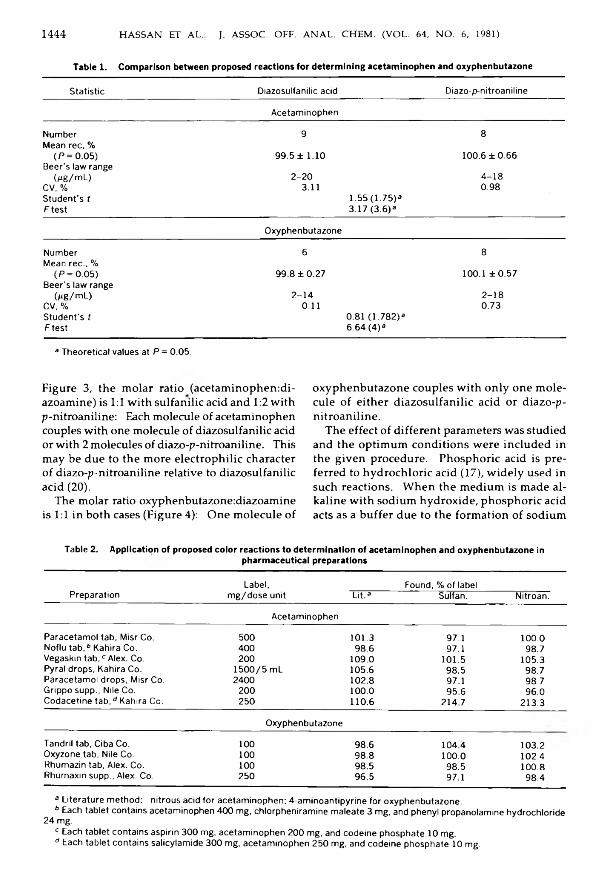
1444 HASSAN ET AL.: J. ASSOC. OFF. ANAL. CHEM . (VOL. 64, N O . 6, 1981)
Table 1. Comparison between proposed reactions for determining acetaminophen and oxyphenbutazoneStatistic Diazosulfanilic acid Diazo-p-nitroaniline
Acetaminophen
Number Mean rec, %
(P = 0.05) Beer's law range
(fig/m L)CV, %Student's t F test
9
99.5 ± 1.10
2-203.11
1.55(1.75)»3.17(3.6)»
8
100.6 ±0.66
4-180.98
Oxyphenbutazone
Number 6 8Mean rec., %
(P = 0.05) 99.8 ±0.27 100.1 ±0.57Beer's law range
(pg/mL) 2-14 2-18CV, % 0.11 0.73Student's t 0.81 (1.782)»F test 6.64 (4)»
» Theoretical values at P = 0.05.
Figure 3, the m olar ratio (acetam inophen:di- azoam ine) is 1:1 w ith su lfa n ilic acid and 1:2 w ith p-n itroan iline: Each m olecule of acetaminophen couples w ith one m olecule of d iazosu lfan ilic acid or w ith 2 m olecules of diazo-p-nitroaniline. Th is m ay be due to the more e lectro p h ilic character of diazo-p-nitroaniline relative to d iazosu lfan ilic acid (20).
The m olar ratio oxyphenbutazone:diazoam ine is 1:1 in both cases (F igu re 4): One m olecule of
oxyphenbutazone couples w ith o n ly one m olecule of e ither d iazo su lfan ilic acid or diazo-p- n itro an ilin e .
The effect of d ifferen t parameters was studied and the optim um conditions w ere included in the g iven procedure. Phosphoric acid is preferred to hyd ro ch lo ric acid (17), w id e ly used in such reactions. W hen the m edium is made a lka lin e w ith sodium hydroxide , phosphoric acid acts as a b u ffer due to the form ation of sodium
Table 2. Application of proposed color reactions to determination of acetaminophen and oxyphenbutazone inpharmaceutical preparations
PreparationLabel,
mg/dose unit Lit.»Found, % of label
Sulfan. Nitroan.
Acetaminophen
Paracetamol tab, Misr Co. 500 101.3 97.1 100.0Noflu tab,» Kahira Co. 400 98.6 97.1 98.7Vegaskin tab,» Alex. Co. 200 109.0 101.5 105.3Pyral drops, Kahira Co. 1500/5 mL 105.6 98.5 98.7Paracetamol drops, Misr Co. 2400 102.8 97.1 98.7Grippo supp., Nile Co. 200 100.0 95.6 96.0Codacetine tab, d Kahira Co. 250 110.6 214.7 213.3
Oxyphenbutazone
Tandril tab, Ciba Co. 100 98.6 104.4 103.2Oxyzone tab, Nile Co. 100 98.8 100.0 102.4Rhumazin tab, Alex. Co. 100 98.5 98.5 100.8Rhumaxin supp., Alex. Co. 250 96.5 97.1 98.4
a Literature method: nitrous acid for acetaminophen; 4-aminoantipyrine for oxyphenbutazone.b Each tablet contains acetaminophen 400 mg, chlorpheniramine maleate 3 mg, and phenyl propanolamine hydrochloride
24 mg.c Each tablet contains aspirin 300 mg, acetaminophen 200 mg, and codeine phosphate 10 mg. d Each tablet contains salicylamide 300 mg, acetaminophen 250 mg, and codeine phosphate 10 mg.

H A S S A N E T AL.: J. A S S O C . OFF. A N A L . C H E M . (VOL. 64, N O . 6, 1981) 1445
phosphate and enhances reproducible results of the pH -sensitive coupling reactions. The developed colors are stable fo r several hours.
A s evident from ab so rp tivity values (a ), reactions are o f equal se n s itiv ity w ith respect to acetaminophen determ ination. Results in Table 1 show that both reactions have com parable accuracy and precision according to calculated t values and F tests. O n the other hand, the p - n itro an ilin e reaction is about 1.5 tim es more sensitive than the su lfa n ilic acid fo r oxyphen- butazone but less precise.
The proposed m ethod w as app lied to the analysis o f com m ercial preparations (Tab le 2). S tatistica l com parison o f the resu lts of the proposed method w ith the n itrous acid method (13) fo r the determ ination o f acetam inophen, using the paired test (21), show ed a nonsig n ifican t d ifference. The excep tionally h igh resu lts fo r Codacetine tablets are due to interference from salicylam ide content. The d ifference between the results fo r oxyphenbutazone by the proposed method and the 4-am inoantipyrine method (15) is also n o n sig n ifican t. H ow ever, the present m ethod is m ore sensitive than those p revio usly reported.
References(1) Inam dar, M. C., Gore, M . A . & B hide, R. V. (1974) Indian J. Pharm., 3 6 ,7 -9(2) Kos, J. (1966) Farm. Glas. 22, 51-53; Anal. Abstr.
(1 9 6 7 )1 4 ,3 5 2 9
(3) V aughan, J. B. (1969) ]. Pharm. Sei. 58, 469 -470(4) Plakogiannis, F. M„ & Saad, A. M. (1975) J. Pharm. Sei., 6 4 ,1 5 4 7 -1 5 4 9(5) Inoue, T., Tatsuzaw a, M ., Lee, S -C , & Ish ii, T.
(1975) J. Flyg. Chem., 21, 313-317; Anal. Abstr.(1976) 3 1 ,1È29
(6 ) D 'Souza, A. A ., & S h en oy , K. C. (1968) Can. ]. Pharm. Sei., 3, 90 -92(7) Bröckelt, G. (1965) Pharmazie, 20, 136-140(8 ) Girard, A. (1924) Bull. Soc. Chim., 3 5 ,7 7 2 -7 7 9(9) Basu, A. P. (1968) Indian /. Pharm., 30, 280
(10) Dedicoat, H., & Sym onds, D. C. (1972) f. Assoc. Publ. Anal. 1 0 ,1 4 -1 7 ; Anal. Abstr. (1972) 2 3 ,3 4 6 5(11) C hafetz, L., Daly, R. E., Schriftm an, H ., & Lom ner,
J. J. (1971) J. Pharm. Sei. 6 0 ,4 6 3 -4 6 6(12) Inam dar, M. C., & Kaji, N. N. (1969) Indian J. Pharm., 31, 79-81(13) A bou O uf, A ., W alash, M. I., H assan, S. M ., & El-
Sayed , S. M. (1978) Arch. Pharm. Chem. Sei. Ed., 6 , 164-166
(14) San gh avi, N . M„ Jivani, N . G., & M u lye, P. D.(1977) Indian J. Pharm. 3 9 ,8 7 -8 8
(15) A bou O uf, A ., W alash, M. I., H assan, S. M ., & El- Sayed , S. M. (1980) Analyst, 1 0 5 ,1 6 9 -1 7 3
(16) W ahbi, A. A ., A b din e, H ., K orany, M ., & A bdel H ay, H. M. (1978) J. Assoc. Off. Anal. Chem., 61, 1113-1117
(17) Svatek, E., & H ardkova, A . (1966) Cesk. Farm., 15, 76-80; Chem. Abstr. (1966) 6 5 ,4245e
(18) W hitlock , L. R., S iggia , S., & Sm ola, J. E. (1972) Anal. Chem., 44, 532-536(19) Job, P. (1928) Ann. Chim. 9 ,1 1 3 -2 0 3 ; Chem. Abstr.
(1 9 28 )2 2 ,21 2 0 .(20) Lee, W„ & T urnbull, J. H. (1960) Talanta, 3 , 3 18 -
323(21) H inchen , J. D. (1966) Practical Statistics for Chemical Research, M eth uen , L ondon, UK, p. 22
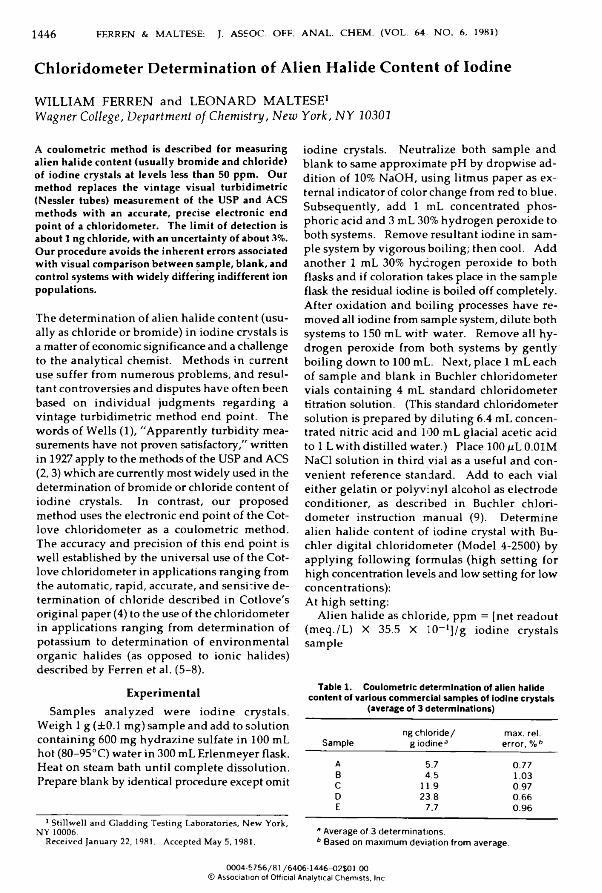
Chloridometer Determination of Alien Halide Content of IodineWILLIAM FERREN and LEONARD MALTESE1 * Wagner College, Department of Chemistry, New York, N Y 10301
1446 F E R R E N & M A L T E S E : J. A S S O C . OFF. A N A L . C H E M . (VOL. 64, N O . 6, 1981)
A co u lo m etr ic m eth od is d escr ib ed for m easu rin g a lien h a lid e co n ten t (u su a lly b ro m id e and ch lor id e) o f io d in e crysta ls at le v e ls le ss th an 50 p p m . O ur m eth od rep laces th e v in ta g e v isu a l tu rb id im etric (N ess ler tu b es) m easurem ent o f th e U SP and ACS m eth od s w ith an accurate, p recise e lec tro n ic en d p o in t o f a ch lor id om eter . T he l im it o f d etectio n is about 1 n g ch lor id e, w ith an u n certa in ty o f about 3%. O ur procedure a vo id s th e in h er en t errors a ssocia ted w ith v isu a l com p arison b e tw e e n sam p le , b la n k , and control system s w ith w id e ly d iffer in g in d ifferen t ion p o p u la tio n s.
The determination of alien halide content (usually as chloride or bromide) in iodine crystals is a matter of economic significance and a challenge to the analytical chemist. Methods in current use suffer from numerous problems, and resultant controversies and disputes have often been based on individual judgments regarding a vintage turbidimetric method end point. The words of Wells (1), "Apparently turbidity measurements have not proven satisfactory," written in 1927 apply to the methods of the USP and ACS (2,3) which are currently most widely used in the determination of bromide or chloride content of iodine crystals. In contrast, our proposed method uses the electronic end point of the Cot- love chloridometer as a coulometric method. The accuracy and precision of this end point is well established by the universal use of the Cot- love chloridometer in applications ranging from the automatic, rapid, accurate, and sensitive determination of chloride described in Cotlove's original paper (4) to the use of the chloridometer in applications ranging from determination of potassium to determination of environmental organic halides (as opposed to ionic halides) described by Ferren et al. (5-8).
ExperimentalSamples analyzed were iodine crystals.
Weigh 1 g (±0.1 mg) sample and add to solution containing 600 mg hydrazine sulfate in 100 mL hot (80-95°C) water in 300 mL Erlenmeyer flask. Heat on steam bath until complete dissolution. Prepare blank by identical procedure except omit
1 Stillwell and Gladding Testing Laboratories, New York,NY 10006.Received January 22,1981. Accepted May 5,1981.
iodine crystals. Neutralize both sample and blank to same approximate pH by dropwise addition of 10% NaOH, using litmus paper as external indicator of color change from red to blue. Subsequently, add 1 mL concentrated phosphoric acid and 3 mL 30% hydrogen peroxide to both systems. Remove resultant iodine in sample system by vigorous boiling; then cool. Add another 1 mL 30% hydrogen peroxide to both flasks and if coloration takes place in the sample flask the residual iodine is boiled off completely. After oxidation and boiling processes have removed all iodine from sample system, dilute both systems to 150 mL with water. Remove a ll hydrogen peroxide from both systems by gently boiling down to 100 mL. Next, place 1 mL each of sample and blank in Buchler chloridometer vials containing 4 mL standard chloridometer titration solution. (This standard chloridometer solution is prepared by diluting 6.4 mL concentrated nitric acid and 100 mL glacial acetic acid to 1 L with distilled water.) Place 100 pL 0.01M NaCl solution in third vial as a useful and convenient reference standard. Add to each vial either gelatin or polyvinyl alcohol as electrode conditioner, as described in Buchler chloridometer instruction manual (9). Determine alien halide content of iodine crystal w ith Buchler digital chloridometer (Model 4-2500) by applying following formulas (high setting for high concentration levels and low setting for low concentrations):At high setting:
Alien halide as chloride, ppm = [net readout (meq./L) X 35.5 X 10_1]/g iodine crystals sample
Table 1. Coulometric determination of alien halide content of various commercial samples of iodine crystals
(average of 3 determinations)
Sampleng chloride/
g iodine3max. rei. error, % b
A 5.7 0.77B 4.5 1.03C 11.9 0.970 23.8 0.66E 7.7 0.96
* Average of 3 determinations. b Based on maximum deviation from average.
0004-5756/81/6406-1446-02$01.00© Association of Official Analytical Chemists, Inc.
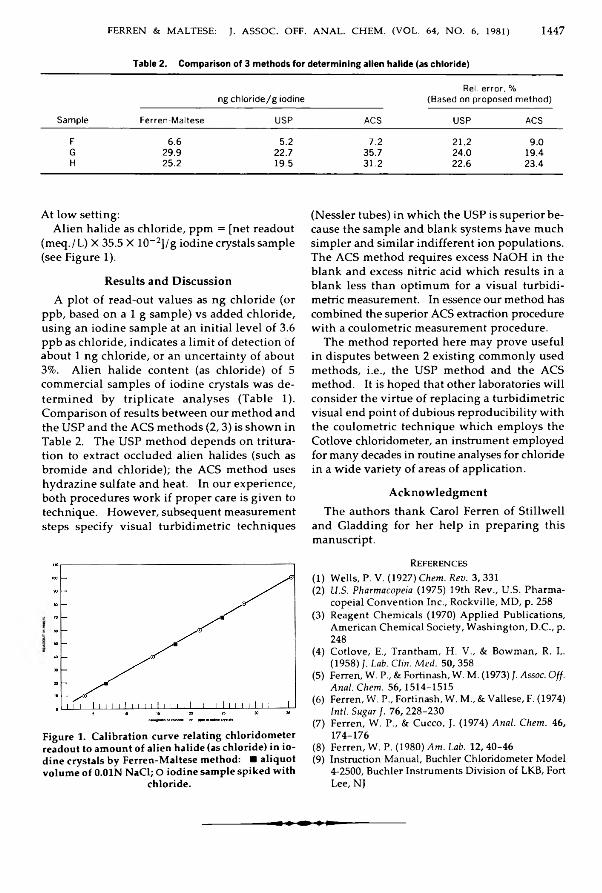
F E R R E N & M A L T E S E : J. A S S O C . OFF. A N A L . C H E M . (VOL. 64, N O . 6, 1981) 1447
Table 2. Comparison of 3 methods for determining alien halide (as chloride)
Sample
ng chloride/g iodineRei. error, %
(Based on proposed method)
Ferren-Maltese USP ACS USP ACS
F 6 .6 5.2 7.2 2 1 .2 9.0G 29.9 22.7 35.7 24.0 19.4H 25.2 19.5 31.2 2 2 .6 23.4
At low setting:Alien halide as chloride, ppm = [net readout
(meq./L) X 35.5 X 10_2]/g iodine crystals sample (see Figure 1).
Results and DiscussionA plot of read-out values as ng chloride (or
ppb, based on a 1 g sample) vs added chloride, using an iodine sample at an in itia l level of 3.6 ppb as chloride, indicates a lim it of detection of about 1 ng chloride, or an uncertainty of about 3%. Alien halide content (as chloride) of 5 commercial samples of iodine crystals was determined by triplicate analyses (Table 1). Comparison of results between our method and the USP and the ACS methods (2 ,3) is shown in Table 2. The USP method depends on trituration to extract occluded alien halides (such as bromide and chloride); the ACS method uses hydrazine sulfate and heat. In our experience, both procedures work if proper care is given to technique. However, subsequent measurement steps specify visual turbidimetric techniques
F igure 1. C alib ra tion curve re la tin g ch lor id om eter readout to a m ou n t o f a lie n h a lid e (as ch lor id e) in io d in e crysta ls b y F erren -M altese m ethod: ■ a liq u o t v o lu m e o f 0 .01N N aC l; O io d in e sa m p le sp ik e d w ith
ch lor id e .
(Nessler tubes) in which the USP is superior because the sample and blank systems have much simpler and sim ilar indifferent ion populations. The ACS method requires excess NaOH in the blank and excess nitric acid which results in a blank less than optimum for a visual turbidimetric measurement. In essence our method has combined the superior ACS extraction procedure with a coulometric measurement procedure.
The method reported here may prove useful in disputes between 2 existing commonly used methods, i.e ., the USP method and the ACS method. It is hoped that other laboratories w ill consider the virtue of replacing a turbidimetric visual end point of dubious reproducibility with the coulometric technique which employs the Cotlove chloridometer, an instrument employed for many decades in routine analyses for chloride in a wide variety of areas of application.
AcknowledgmentThe authors thank Carol Ferren of Stillw ell
and Gladding for her help in preparing this manuscript.
References(1) W ells, P. V. (1927) Chem. Rev. 3 ,3 3 1(2) U.S. Pharmacopeia (1975) 19th R ev., U .S. Pharma-
cop eial C on v en tion Inc., R ockville , M D , p. 258(3) R eagent C hem icals (1970) A p p lied P ub lications,
A m erican C hem ical S ociety , W ash in gton , D .C ., p. 248
(4) C otlove, E., Trantham , H. V., & B ow m an, R. L. (1958) J. Lab. Clin. Med. 5 0 ,35 8
(5) Ferren, W. P., & Fortinash, W. M. (1973) J. Assoc. Off. Anal. Chem. 5 6 ,1 5 1 4 -1 5 1 5(6 ) Ferren, W. P„ Fortinash, W. M ., & V allese, F. (1974) Inti. Sugar J. 7 6 ,2 2 8 -2 3 0(7) Ferren, W. P., & C ucco, J. (1974) Anal. Chem. 46,
174-176(8 ) Ferren, W. P. (1980) Am. Lab. 1 2 ,4 0 -4 6(9) Instruction M anual, Buchler Chloridom eter M odel
4-2500, Buchler Instrum ents D iv is io n o f LKB, Fort Lee, NJ

1448 ITO ET AL.: J. ASSOC. OFF. ANAL. CHEM . (VOL, 64, N O . 6 1981)
F O O D A D D I T I V E S
Improved 4-Aminoantipyrine Colorimetry for Detection of Residual Hydrogen Peroxide in Noodles, Fish Paste, Dried Fish, and Herring RoeY O S H IO IT O , Y A S U H ID E T O N O G A I, H ID E Y O S U Z U K I, S H U N JIR O O G A W A , T S U Y O S H I Y O K O Y A M A ,1 T A K A S H I H A S H IZ U M E ,1 H ID E Y U K I S A N T O ,1 K E I- IC H I T A N A K A ,2 K IK U Y O N IS H IG A K I,2 an d M A S A H IR O IW A ID ANatiojial Institute of Hygienic Sciences, Osaka Branch, 1-1-43, Hoenzaka, Higashi-ku,Osaka 540, JapanIm proved 4-am inoantipyrine (4-A A ) colorim etry w as d ev e lo p ed for th e d etectio n o f m in u te q u a n titie s of resid ua l h yd rogen peroxide in severa l k in d s o f food . H ydrogen peroxide in the sam ple w as stab ilized w ith potassium brom ate and extracted w ith cold m ethanol. T he m eth an o l extract w as d ilu ted w ith p h osp h a te b u ffer, protein w as elim in a ted w ith z in c su lfa te , and the extract w as reacted w ith p h e n o l, 4 -A A , and p ero x idase to th e stab le q u in o n e im in e d ye . T h e w eak co lo r so lu tio n w as p u rified w ith F lorisil co lu m n ch rom atograph y , con cen tra ted , and d eterm in ed b y colorim etry . R ecoveries o f h yd rogen peroxide from sam p les fo r t ified at 0.5, 2, and 10 ppm ranged from 70.7 ± 8.9 to 98.5 ± 1.2%. C olor d e v e lo p m e n t w as lin ea r w ith am ou n t o f H 2O 2 from 0.5 to 20 p g , corresp o n d in g to 0 .0 5 -2 ppm in sam p les.
Hydrogen peroxide has been used in Japan for a long time as a food additive for its antiseptic and bleaching properties. Because of the reported carcinogenicity to mice, the government of Japan made a partial amendment of the "Notification Regarding the Standards and Specifications of Food, Food Additives, etc." (M inistry of Health and Welfare Notification No. 370, December 28, 1959) to provide notification that hydrogen peroxide must he either decomposed or removed from final products (1). Residues must not exceed 0.1 ppm under the new regulation in effect since October 1,1980. Accordingly, it became necessary to develop a sensitive method for the detection of residual hydrogen peroxide in foods.
A variety of methods have been reported (2-5); these methods, however, measure tens of parts per m illion hydrogen peroxide in foods, the lowest detection lim it being between 5 and 10 ppm. We reported a 4-aminoantipyrine (4-AA)
1 Wakayama Prefectural Institute of Public Health, Suna- yama 3-chome, Wakayama, Japan.2 University of Kobe Gakuin, Faculty of Nutrition, Ikawa- dani, Tarumi-ku, Kobe, Japan.Received April 1,1981. Accepted June 10, 1981
method (4) in which hydrogen peroxide was reacted with phenol, 4-AA, and peroxidase to produce the stable quinoneimine dye. We undertook to improve the 4-AA method so that it may be used to detect sub-ppm levels of residual hydrogen peroxide in foods.
M ETHOD
A p p a r a t u s(a) R o ta ry ev a p o ra to r .—Model N -l (Tokyo Ri-
kakikai Co. Ltd, Tokyo, Japan), with T 15/25 rotatory joint and Pyrex condenser.
(b) S p e c tro p h o to m e te r .—Bausch & Lomb Spec- tronic 20 (Shimadzu Seisakusho Ltd, Kyoto, Japan).
(c) C h rom atograph ic co lu m n .—Glass, 1.5 cm id X 30 cm long, packed with 60-100 mesh Florisil (Katayama Kagaku Kogyo Ltd, Osaka, Japan) to height of 8 cm and washed with water until el- uate is clear.
(d) B uchner fu n n e l.—Set filter paper (No. 5C, Toyo Roshi Kaisha Ltd, Tokyo, Japan) on 5 cm id Buchner funnel, pour slurry of 5 g Celite 545 to make 5 mm layer, and wash with water.R e a g e n t s
(a ) M e th a n o l.—Add ca 20 g KBrOs to 2 L methanol, shake 1 min, and keep in a refrigerator.
(b) Z in c s u lfa te s o lu t io n .—Dissolve 10 g ZnS04-7H20 in 100 mL water.
(c) P henol so lu tio n .—Dissolve 2.0 g phenol in 100 mL water. Prepare fresh before use.
(d) 4 -A A so lu tio n .—Dissolve 400 mg 4-AA in 100 mL water.
(e) P eroxidase so lu tio n .—Dissolve 10 mg peroxidase (P-L Biochemicals, Inc., Milwaukee, WI, ca 200 units/mg) in 100 mL water. Prepare fresh before use.
(f) P hosph a te b u ffe r .— 0.5M, pH 7.3. Dissolve 68 g KH 2P 0 4 in 1 L water; adjust pH to 7.3 with
0004-5756/81 /6406-1448-05$01.00© Association of Official Analytical Chemists, Inc.
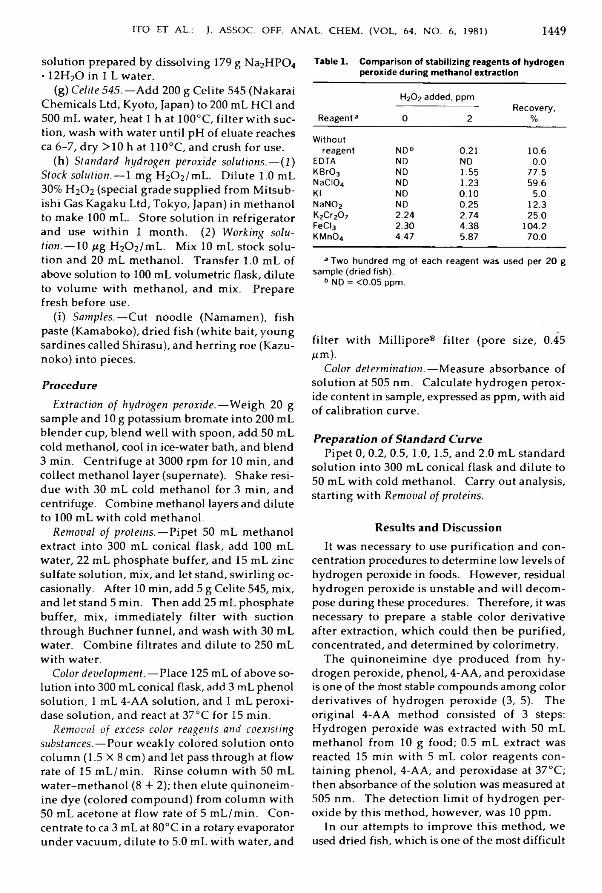
ITO ET AL.: J. ASSOC. OFF. ANAL. CHEM . (VOL, 64, N O . 6, 1981) 1449
solution prepared by dissolving 179 g Na2H P04 ■ 12H20 in 1 L water.
(g) C elite 545 . —Add 200 g Celite 545 (Nakarai Chemicals Ltd, Kyoto, Japan) to 200 mL HC1 and 500 mL water, heat 1 h at 100°C, filter with suction, wash with water until pH of eluate reaches ca 6-7, dry >10 h at 110°C, and crush for use.
(h) S ta n d a rd h yd ro g en perox id e so lu tio n s .—(1) Stock so lu tio n .—1 mg H20 2/mL. Dilute 1.0 mL 30% H 20 2 (special grade supplied from Mitsubishi Gas Kagaku Ltd, Tokyo, Japan) in methanol to make 100 mL. Store solution in refrigerator and use w ithin 1 month. (2) W ork in g so lu tio n .—10 p g H20 2/mL. Mix 10 mL stock solution and 20 mL methanol. Transfer 1.0 mL of above solution to 100 mL volumetric flask, dilute to volume with methanol, and mix. Prepare fresh before use.
(i) S a m p le s .—Cut noodle (Namamen), fish paste (Kamaboko), dried fish (white bait, young sardines called Shirasu), and herring roe (Kazu- noko) into pieces.
P r o c e d u r eE xtraction o f h yd ro g en p e ro x id e .—Weigh 20 g
sample and 10 g potassium brómate into 200 mL blender cup, blend well w ith spoon, add 50 mL cold methanol, cool in ice-water bath, and blend 3 min. Centrifuge at 3000 rpm for 10 min, and collect methanol layer (supernate). Shake residue w ith 30 mL cold methanol for 3 m in, and centrifuge. Combine methanol layers and dilute to 100 mL with cold methanol.
R em o va l o f p ro te in s .—Pipet 50 mL methanol extract into 300 mL conical flask, add 100 mL water, 22 mL phosphate buffer, and 15 mL zinc sulfate solution, mix, and let stand, sw irling occasionally. After 10 min, add 5 g Celite 545, mix, and let stand 5 min. Then add 25 mL phosphate buffer, m ix, immediately filter with suction through Buchner funnel, and wash with 30 mL water. Combine filtrates and dilute to 250 mL w ith water.
C olor d ev e lo p m en t. —Place 125 mL of above solution into 300 mL conical flask, add 3 mL phenol solution, 1 mL 4-AA solution, and 1 mL peroxidase solution, and react at 37°C for 15 min.
R em o va l o f excess color rea gen ts and coex isting su b sta n ces .—Pour weakly colored solution onto column (1.5 X 8 cm) and let pass through at flow rate of 15 m L/m in. Rinse column with 50 mL water-methanol (8 + 2); then elute quinoneim- ine dye (colored compound) from column with 50 mL acetone at flow rate of 5 m L/m in. Concentrate to ca 3 mL at 80°C in a rotary evaporator under vacuum, dilute to 5.0 mL with water, and
Table 1. Comparison of stabilizing reagents of hydrogen peroxide during methanol extraction
Reagent3
H20 2 added, ppm
0 2Recovery,
%
Withoutreagent ND6 0.21 10.6
EDTA ND ND 0.0KBr03 ND 1.55 77.5NaCI04 ND 1.23 59.6Kl ND 0.10 5.0NaN02 ND 0.25 12.3K2Cr20 7 2.24 2.74 25.0FeCI3 2.30 4.38 104.2KMn04 4.47 5.87 70.0
3 Two hundred mg of each reagent was used per 20 g sample (dried fish).
6 ND = <0.05 ppm.
filter with Millipore® filter (pore size, 0.45 pm).
C olor d e te rm in a tio n .—Measure absorbance of solution at 505 nm. Calculate hydrogen peroxide content in sample, expressed as ppm, with aid of calibration curve.
P r e p a r a t i o n o f S t a n d a r d C u r v ePipet 0, 0.2, 0.5, 1.0,1.5, and 2.0 mL standard
solution into 300 mL conical flask and dilute to 50 mL with cold methanol. Carry out analysis, starting with R em o va l o f pro te in s.
Results and DiscussionIt was necessary to use purification and con
centration procedures to determine low levels of hydrogen peroxide in foods. However, residual hydrogen peroxide is unstable and w ill decompose during these procedures. Therefore, it was necessary to prepare a stable color derivative after extraction, which could then be purified, concentrated, and determined by colorimetry.
The quinoneimine dye produced from hydrogen peroxide, phenol, 4-AA, and peroxidase is one of the fnost stable compounds among color derivatives of hydrogen peroxide (3, 5). The original 4-AA method consisted of 3 steps: Hydrogen peroxide was extracted w ith 50 mL methanol from 10 g food; 0.5 mL extract was reacted 15 min w ith 5 mL color reagents containing phenol, 4-AA, and peroxidase at 37°C; then absorbance of the solution was measured at 505 nm. The detection lim it of hydrogen peroxide by this method, however, was 10 ppm.
In our attempts to improve this method, we used dried fish, which is one of the most difficult
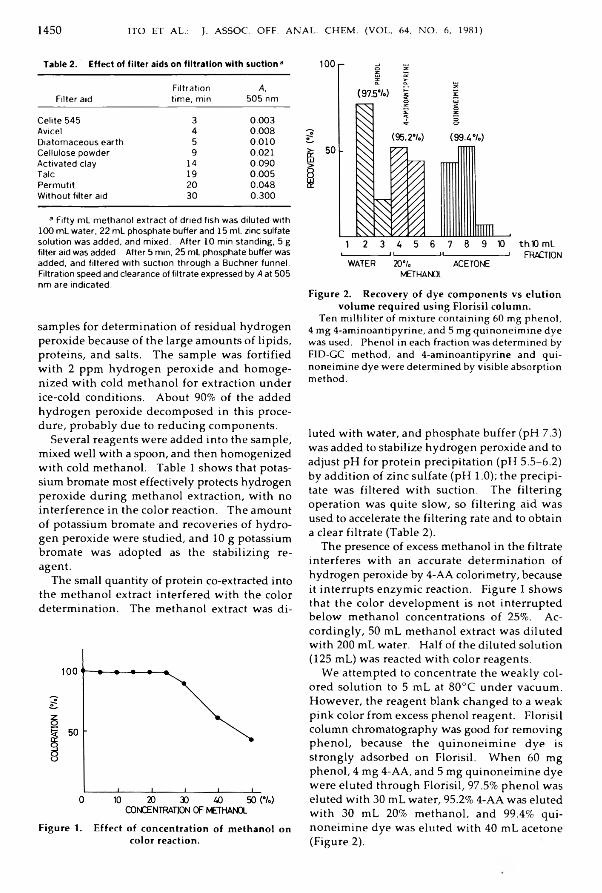
1450 ITO ET AL.: J. ASSOC. OFF. ANAL. CHEM . (VOL, 64, NO. 6, 1981)
Table 2. Effect of filter aids on filtration with suction3
Filter aidFiltration time, min
A,505 nm
Celite 545 3 0.003Avicel 4 0.008Diatomaceous earth 5 0.010Cellulose powder 9 0.021Activated clay 14 0.090Talc 19 0.005Permutit 20 0.048Without filter aid 30 0.300
a Fifty mL methanol extract of dried fish was diluted with 100 mL water, 22 mL phosphate buffer and 15 mL zinc sulfate solution was added, and mixed. After 10 min standing, 5 g filter aid was added. After 5 min, 25 mL phosphate buffer was added, and filtered with suction through a Buchner funnel. Filtration speed and clearance of filtrate expressed by A at 505 nm are indicated.
samples for determination of residual hydrogen peroxide because of the large amounts of lipids, proteins, and salts. The sample was fortified with 2 ppm hydrogen peroxide and homogenized with cold methanol for extraction under ice-cold conditions. About 90% of the added hydrogen peroxide decomposed in this procedure, probably due to reducing components.
Several reagents were added into the sample, mixed well with a spoon, and then homogenized with cold methanol. Table 1 shows that potassium bromate most effectively protects hydrogen peroxide during methanol extraction, w ith no interference in the color reaction. The amount of potassium bromate and recoveries of hydrogen peroxide were studied, and 10 g potassium bromate was adopted as the stabilizing reagent.
The small quantity of protein co-extracted into the methanol extract interfered w ith the color determination. The methanol extract was di-
F igure 1. E ffect o f co n cen tra tion o f m eth an o l on co lor reaction .
'--------------- " ---------------»--------------------- ' FRACTIONWATER 207. ACETONE
METHANOL
F igure 2. R ecovery o f d ye co m p o n en ts v s e lu tio n v o lu m e required u sin g F lo ris il co lu m n .
Ten m illiliter of mixture containing 60 mg phenol, 4 mg 4-aminoantipyrine, and 5 mg quinoneim ine dye was used. Phenol in each fraction was determ ined by FID-GC method, and 4-aminoantipyrine and quinoneimine dye were determined by visible absorption method.
luted with water, and phosphate buffer (pH 7.3) was added to stabilize hydrogen peroxide and to adjust pH for protein precipitation (pH 5.5-6.2) by addition of zinc sulfate (pH 1.0); the precipitate was filtered with suction. The filtering operation was quite slow, so filtering aid was used to accelerate the filtering rate and to obtain a clear filtrate (Table 2).
The presence of excess methanol in the filtrate interferes with an accurate determination of hydrogen peroxide by 4-AA colorimetry, because it interrupts enzymic reaction. Figure 1 shows that the color development is not interrupted below methanol concentrations of 25%. Accordingly, 50 mL methanol extract was diluted with 200 mL water. Half of the diluted solution (125 mL) was reacted with color reagents.
We attempted to concentrate the weakly colored solution to 5 mL at 80°C under vacuum. However, the reagent blank changed to a weak pink color from excess phenol reagent. Flo risil column chromatography was good for removing phenol, because the quinoneimine dye is strongly adsorbed on Florisil. When 60 mg phenol, 4 mg 4-AA, and 5 mg quinoneimine dye were eluted through Flo risil, 97.5% phenol was eluted with 30 mL water, 95.2% 4-AA was eluted with 30 mL 20% methanol, and 99.4% quinoneimine dye was eluted with 40 mL acetone (Figure 2).
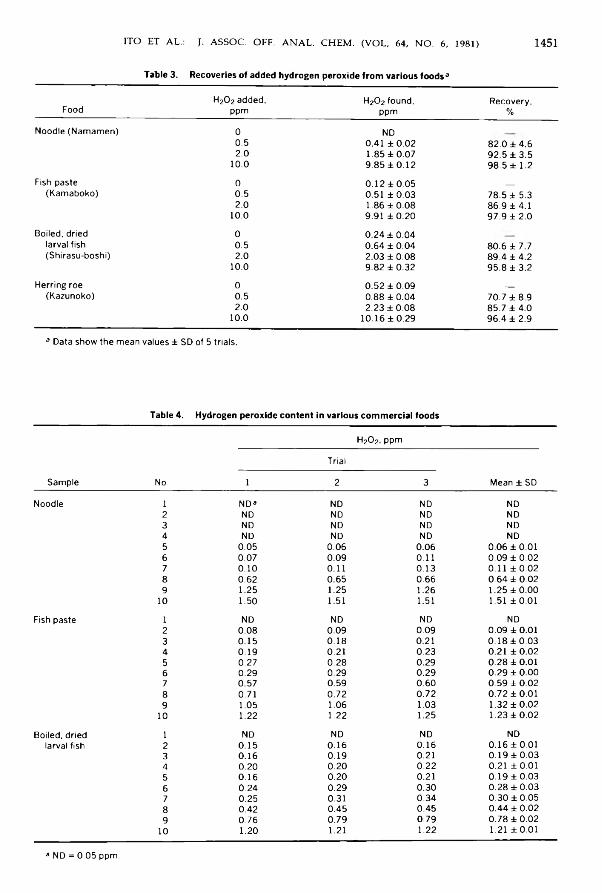
ITO ET AL.: J. ASSOC. OFF. ANAL. CHEM . (VOL, 64, NO. 6, 1981) 1451
Table 3. Recoveries of added hydrogen peroxide from various foods3
FoodH2C>2 added,
ppmH2C>2 found,
ppmRecovery,
%
Noodle (Namamen) 0 ND0.5 0.41 ± 0.02 82.0 ±4.62.0 1.85 ±0.07 92.5 ±3 .5
10.0 9.85 ±0.12 98.5 ± 1.2
Fish paste 0 0.12 ±0.05 _(Kamaboko) 0.5 0.51 ±0.03 78.5 ± 5.3
2.0 1.86 ±0.08 86.9 ±4.110.0 9.91 ±0.20 97.9 ±2 .0
Boiled, dried 0 0.24 ±0.04larval fish 0.5 0.64 ± 0.04 80.6 ± 7.7(Shirasu-boshi) 2.0 2.03 ± 0.08 89.4 ±4.2
10.0 9.82 ± 0.32 95.8 ±3.2
Herring roe 0 0.52 ± 0.09 __(Kazunoko) 0.5 0.88 ± 0.04 70.7 ±8.9
2.0 2.23 ± 0.08 85.7 ± 4.010.0 10.16 ±0.29 96.4 ± 2 .9
a Data show the mean values ± SD of 5 trials.
Table 4. Hydrogen peroxide content in various commercial foods
Sample No.
H2 O2 , ppm
1
Trial
2 3 Mean ± SD
Noodle i ND3 ND ND ND2 ND ND ND ND3 ND ND ND ND4 ND ND ND ND5 0.05 0.06 0.06 0.06 ± 0.016 0.07 0.09 0.11 0.09 ±0.027 0.10 0.11 0.13 0.11 ±0.028 0.62 0.65 0.66 0.64 ±0.029 1.25 1.25 1.26 1.25 ±0.00
10 1.50 1.51 1.51 1.51 ±0.01
Fish paste 1 ND ND ND ND2 0.08 0.09 0.09 0.09 ± 0.013 0.15 0.18 0.21 0.18 ±0.034 0.19 0.21 0.23 0.21 ± 0.025 0.27 0.28 0.29 0.28 ± 0.016 0.29 0.29 0.29 0.29 ± 0.007 0.57 0.59 0.60 0.59 ± 0.028 0.71 0.72 0.72 0.72 ±0.019 1.05 1.06 1.03 1.32 ±0.02
10 1.22 1.22 1.25 1.23 ±0.02
Boiled, dried 1 ND ND ND NDlarval fish 2 0.15 0.16 0.16 0.16 ±0.01
3 0.16 0.19 0.21 0.19 ±0.034 0.20 0.20 0.22 0.21 ±0.015 0.16 0.20 0.21 0.19 ±0.036 0.24 0.29 0.30 0.28 ±0.037 0.25 0.31 0.34 0.30 ±0.058 0.42 0.45 0.45 0.44 ± 0.029 0.76 0.79 0.79 0.78 ±0.02
10 1.20 1.21 1.22 1.21 ±0.01
3 ND = 0.05 ppm.
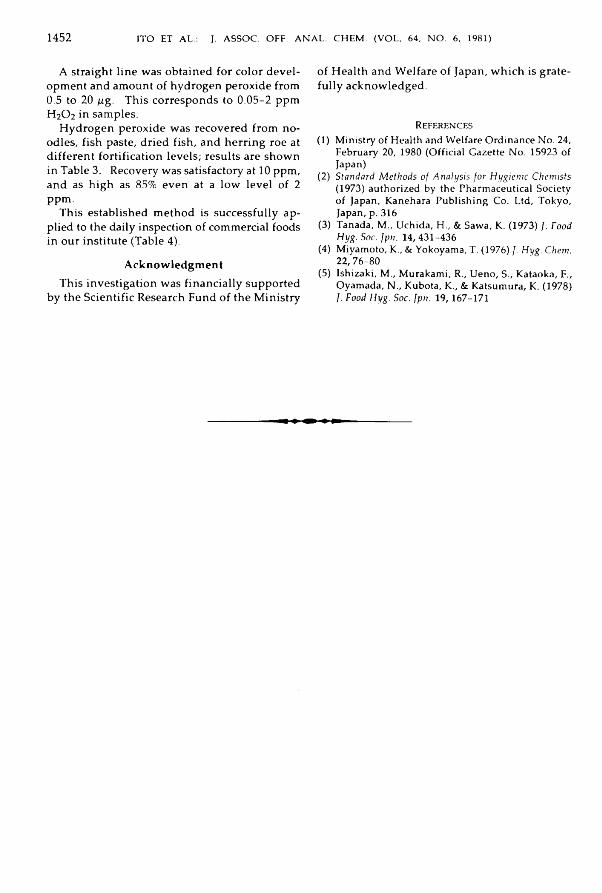
1452 ITO ET AL.: J. ASSOC. OFF. ANAL. CHEM . (VOL, 64, N O . 6, 1981)
A straight line was obtained for color development and amount of hydrogen peroxide from 0.5 to 20 pg. This corresponds to 0.05-2 ppm H2O2 in samples.
Hydrogen peroxide was recovered from noodles, fish paste, dried fish, and herring roe at different fortification levels; results are shown in Table 3. Recovery was satisfactory at 10 ppm, and as high as 85% even at a low level of 2 ppm.
This established method is successfully applied to the daily inspection of commercial foods in our institute (Table 4).
AcknowledgmentThis investigation was financially supported
by the Scientific Research Fund of the M inistry
of Health and Welfare of Japan, which is gratefu lly acknowledged.
References(1) Ministry of Health and Welfare Ordinance No. 24,
February 20, 1980 (Official Gazette No. 15923 of Japan)
(2) Standard Methods of Analysis for Hygienic Chemists (1973) authorized by the Pharmaceutical Society of Japan, Kanehara Publishing Co. Ltd, Tokyo, Japan, p. 316
(3) Tanada, M„ Uchida, H„ & Sawa, K. (1973) /. Food Hyg. Soc. Jpn. 14, 431-436
(4) Miyamoto, K„ & Yokoyama, T. (1976) J. Hyg. Chem. 22, 76-80
(5) Ishizaki, M., Murakami, R., Ueno, S., Kataoka, F., Oyamada, N., Kubota, K., & Katsumura, K. (1978) /. Food Hyg. Soc. ]pn. 19,167-171
E n j o y Y o u r O w n C o p y o f t h eJournal of the Association of Official Analytical Chemists
U .S . Outside U .S .1 year - 1982 □ $ 62 □ $62 + $8 postage & handling = US $702 years - 19 8 2-83 □ $118 □ $118 + $16 p ostage & handling = US $134Single copy(ies) □ $ 12 □ $13 issue(s)Airmail outside U .S. □ $37/year additional
A ssociation of Official Analytical C hem ists 1111 N 19th S t., Suite 210-J A rlington, VA 22209, U .S .A .Please enter m y subscription to the JOURNAL OF THE AO AC as checked above. I h ave enclosedpaym ent of $ -------------------- - (Subscriptions are on calendar basis, 6 issues: Jan., M ar., M ay, July,S ep t., Nov. )Send to: Attention:
(Please print)
Street Address:City _____State (C o u n try )_________
Payment must accompanv order.Z ip _____________10/81
Join the AOAC, the Methods ProfessionalsFew organizations are d evoted primarily to testing and validating analytical m ethods through
interlaboratory collaborative stu d ies—as is the A ssociation of Official Analytical C hem ists.As a m em ber of AO AC, you will have the opportunity to participate in the m ethods validation
process. Participation often brings professional advancem ent, peer recognition, and publication of work.
A O A C 's m onth ly bulletin , The Referee, w ith im portant m eth od o logy inform ation, an nou n cem en ts, m eeting inform ation, and m ore . . . com es free w ith m em bership.
All for U S $10.00 per year.10/81
Application for AOAC Membership(Please Print)
N a m e ________________________________________________________________________________________O r g a n iz a t io n _________________________________________________________________________________A d d r e s s _______________________________________________________________________________ ______________________________________________________________ P h on e N u m b e r ...................................... ........Is this a governm ent a g e n c y ? ------------------------------------------------------------------------------------------------Area of e x p e r t i s e ---------------------------------------------------------------------------------------------------------------------Present p o s i t i o n _____________________________________________________________________________Brief review of previous professional positions and experience.
To becom e a m em ber, sen d this com p leted application and a check for $10.00 to: AO AC, 1111 N 19th St., Suite 210-J, Arlington, VA 22209

Join the AOAC, the Methods ProfessionalsFew organizations are d evoted primarily to testing and validating analytical m ethods through
interlaboratory collaborative s tu d ies—as is the A ssociation of Official Analytical C hem ists.As a m em ber of AO AC, you will have the opportunity to participate in the m ethods validation
process. Participation often brings professional advancem ent, peer recognition, and publication of work.
A O A C 's m onthly bulletin , The Referee, with im portant m eth od o logv inform ation, an n oun cem en ts, m eeting inform ation, and m ore . . . com es free w ith m em bership.
All for U S $10.CXI per year.Hi.SI
Application for AOAC Membership(Please Print)
N a m e _________________________________________________________________________________________O r g a n iz a t io n __________________________________________________________________________________A d d r e s s ______________________________________________________________________________________________________________________________________________ P hone N u m b e r _______________________Is this a governm ent a g e n c y ? _________________________ ______________________________________Area of e x p e r t i s e _____________________________________________________________________________Present p o s i t i o n _____________________________________________________________________________Brief review of previous professional positions and experience.
To becom e a m em ber, send this com p leted application and a check for $10.00 to: A O A C , 1111 N 19th St., Suite 210-J, Arlington, VA 22209
E n j o y Y o u r O w n C o p y o f t h eJournal of the Association of Official Analytical Chemists
1 year - 1982 □U .S.$ b2
O utside U .S .G $62 + $8 p ostage & handling = US $70
2 years - 19 8 2-83 □ $118 G $118 + $16 postage & handling = US $134Single copv(ies) Airmail outside U .S.
G $ 12 G $13 issue(s)G $37/year additional
A ssociation of Official Analytical C hem ists 1111 N 19th S t., Suite 210-J A rlington, VA 22209, U .S .A .P lease enter my subscription to the JOURNAL OF THE AO AC as checked above. 1 have enclosedpaym ent of $ -------------------- . (Subscriptions are on calendar basis, 6 issues: Jan., Mar., M ay, July,S ep t., Nov. )Send to: Attention:
(Please print)
Street Address:Ci tv _____State (C o u n try )_________
Payment must accompany order.Zip
Ill'S 1

PERFETTI ET AL.: J. ASSOC. OFF. ANAL. CH EM . (VOL. 64, N O . 6, 1981) 1 4 5 3
High Pressure Liquid Chromatographic Determination of Ethoxyquin in Paprika and Chili PowderGRACIA A. PERFETTI, CHARLES R. WARNER, and THOMAS FAZIOFood and Drug Administration, Division of Chemistry and Physics, Washington, DC 20204
A method is described for the determination o f ethoxyquin (l,2-dihydro-6-ethoxy-2,2,4-trimethylqui- noline) in paprika and chili powder. Ethoxyquin is extracted from the spice with hexane and partitioned into 0.3N HC1. After adjusting the solution to pH13-14, ethoxyquin is extracted into hexane, and the hexane layer is evaporated to dryness. An acetonitrile solution of the residue is then analyzed by reverse phase high pressure liquid chromatography with detection at 254 nm. The mobile phase is water-acetonitrile with ammonium acetate buffer. Recoveries from samples fortified at 50,100, and 200 ppm averaged 92% with a coefficient of variation of 2.3%. The method was applied to a number of commercial samples of paprika and chili powder. Ethoxyquin was found in paprika samples at levels up to 63 ppm and in chili powder samples at levels up to 20 ppm.
E th oxyq u in ( l,2 -d ih y d ro -6 -eth o x y-2 ,2 ,4 -tr i- m eth y lq u in o lin e) is used as an antioxidant to retard decom position o f som e p igm en ts and fat-soluble vitam ins in certain foods and anim al feeds. In the U n ited States, ethoxyquin is perm itted at lev e ls up to 150 ppm in anim al feeds and dehydrated forage crops, and up to 100 ppm in paprika and chili powder. Tolerances are also specified for ethoxyquin residues in m ilk, eggs, and anim al tissues.
N o m ethods could be fou n d in the literature for the determ ination o f ethoxyq u in in spices, but several w ere fou n d for determ in in g eth oxyquin in feeds and anim al tissues. M ost of these m ethods are based on either fluorescence or ultraviolet (UV) spectroscopy. The official AO AC m ethods for determ in in g ethoxyq u in in anim al feeds (1) and in ch icken tissues and eggs(2) are both based on the fluorescent nature o f ethoxyquin . F luorescence m ethods have also been em ployed by Bickoff et al. (3) and Witt et al.(4). C hoy et al. (5) u sed UV spectrom etry to d eterm ine ethoxyquin . A ll o f these m ethods lack speed and specificity . D ahle and Skaare (6) d eterm ined ethoxyquin in fish and fish m eal by gas-liq u id chrom atography. W hile the m ethod possessed a degree o f specificity, recoveries were unacceptably low , probably due at least in part to therm al decom position o f ethoxyquin .
Received May 26,1981. Accepted June 23,1981.
H igh pressure liquid chromatography (H PLC ) is a logical alternative to the methods used prev iously for the determ ination of ethoxyquin. Th is h ig h ly selective technique may be carried out at ambient temperature, so that the therm al instab ility of ethoxyquin is not a problem . In addition, ethoxyquin is easily detected by conventional LC detectors. Th is paper describes an H P L C method for the determ ination of ethoxyquin in paprika and ch ili powder. The antioxidant is extracted from the spice w ith hexane, partitioned into acidic solution, and then partitioned back into hexane fo llow ing pH adjustment. The hexane solution is evaporated to dryness, and the residue is dissolved in acetonitrile . The resulting solution is analyzed by reverse phase H P L C w ith detection at 254 nm.
M ETH O DApparatus
(a) Liquid c h r o m a to g r a p h .— Spectra-Physics Model 3500B operated at ambient temperature and flow rate of 1.2 m L/m in (Spectra-Physics, Piscataway, NJ 08854).
(b) In je c to r .—Valeo 7000 psig sample injection va lve fitted w ith 10 /¿L sample loop (Valeo In struments Co ., Inc ., Houston, T X 77055).
(c) C o lu m n .—4.6 mm id X 250 mm stainless steel colum n packed w ith Zorbax O DS (E .I . du Pont de Nemours & Co., W ilm ington , D E 19898).(d) D e te c to r .—Schoeffel Model 770 variable wavelength U V detector (Kratos, Inc., Westwood, N J 07675). Sensitiv ity range 0.01-2 absorbance units fu ll scale (A U FS ); 8 ¿iL flow cell. W avelength set at 254 nm , time constant set at zero. Chromatograms were recorded on 10 m V strip chart recorder.
(e) F lash e v a p o r a to r .—Used w ith 35°C water bath (Buchler Instrum ent, In c ., Fort Lee , NJ 07024).
(f) S a m p le f i l t r a t io n a p p a ra tu s . —S w in n y type, used w ith 1 |im Fluoropore filters (M illipo re Corp ., Bedford, M A 01730).
(g) C e n tr ifu g e .— Sorvall RC-3 (du Pont Co.) or centrifuge capable of relative centrifugal force of 65.
0004-5756/81 /6406-I453-04$01,00© Association of Official Analytical Chemists, Inc.

1 4 5 4 PERFETTI ET AL.: J. ASSOC. OFF. ANAL. CHEM . (VOL. 64, N O . 6, 1981)
Reagents(a) S olven ts.— D istilled in glass acetonitrile
(UV) and hexane (non-spectro) (Burdick & Jack- son Laboratories, Inc., M uskegon, MI 49442).
(b) W a ter .—O btained from M illi-Q purification system (M illipore Corp.).
(c) E thoxy quin .—Technical grade, 90% (Pfaltz & Bauer, Inc., Stam ford, CT 06902).(d) A m m onium acetate so lu tion .—0.01N . D isso lv e 0.77 g in 1 L water (pH 7).
(e) M obile phase.—30% (by volum e) am m onium acetate so lu tion in acetonitrile.
(f) Standard so lu tions.— Stock solution I.— 2.5 m g/m L. Accurately w eigh 0.1 g ethoxyquin and transfer to 50 mL volum etric flask; d isso lve and dilute to volum e w ith acetonitrile. Stock solutionII.— 250 Mg/mL. Pipet 5 mL stock solution I into 50 mL volum etric flask and dilute to volum e w ith acetonitrile. W orking solu tions.—5,15, 25, and 35 Mg/mL. P ipet 1, 3, 5, and 7 mL stock so lu tion II in to separate 50 mL volum etric flasks and dilute to vo lu m e w ith acetonitrile.
DeterminationExtraction.—Accurately w eigh 2 g spice into 15
mL capped centrifuge tube. Extract w ith three 10 mL portions of hexane. Centrifuge at 500 rpm 5 m in after each extraction to settle particulates. D ecant and com bine extracts in 125 mL separatory fu n n el, add 15 mL 0.3N HC1, and shake g e n tly 1 m in. Let layers separate com p letely; then transfer aqueous (low er) layer to 60 mL separatory funnel. Extract hexane solution w ith another 15 mL 0.3N HC1, and transfer aqueous layer to 60 mL funnel. Add 2 mL 4.8N N aO H to 60 mL funnel and im m ediately extract w ith 10 mL hexane. Draw o ff aqueous (low er) layer and discard. Drain hexane layer in to 100 mL round-bottom flask. R inse 60 mL separatory fu n n el w ith 5 mL hexane and add to flask. Add 5 mL acetonitrile to flask (to aid in rem oval of residual water) and evaporate to dryness on flash evaporator, usin g 35°C water bath. D isso lve residue in 10 mL acetonitrile. Filter through 1 jam Fluoropore filter.
C h rom atography.—Set detector range to 0.1 AUFS. Inject 10 mL sam ple solu tion and 4 w orking solutions. If sam ple peak is larger than peak for most concentrated standard, accurately dilute sam ple solution. If sam ple peak is smaller than peak for least concentrated standard, prepare 2.5 /xg/mL standard and inject 10 mL aliquot. If sam ple peak is sm aller than this, prepare another sam ple as above, but d isso lve residue in sm aller am ount acetonitrile (m inim um 2 mL).
CalculationD eterm ine peak h eigh ts for sam ple and stan
dards. Plot peak h eigh ts vs concentration for standards and determ ine slope (S) and intercept (I) o f lin e by perform ing linear least squares analysis. Calculate concentration of ethoxyquin in sam ple as follow s;
Ethoxyquin, ppm = ((H — /) /S ) X (V /W ) X Dw h ere H = peak h eig h t o f sam ple; V = vo lu m e of sam ple solu tion , mL; W = w e ig h t o f sam ple, g; and D = d ilu tion factor if sam ple solu tion is diluted .
R esu lts and D iscu ssionInitial attem pts to chromatograph ethoxyquin
by reverse phase HPLC resulted in broad, asym m etric peaks w ith lon g and variable retention tim es. Such behavior has been observed previously for am ines in general, and has been attributed to interactions betw een the am ine functional group and non-bonded silanol groups on the packing material. These interactions may be elim inated by adding an acidic buffer con taining either an alkyl am m onium com pound (7) or an alkyl am ine (8) to the m obile phase. We found am m onium acetate solu tion to be just as effective for this purpose, and sim pler to prepare. Figure 1 sh ow s chrom atogram s o f ethoxyquin w ith and w ith ou t am m onium acetate in the m obile phase.
Ethoxyquin absorbs UV lig h t and fluoresces; thus it is easily detected by 2 con ven tion a l LC detectors. S ince the tolerance lev el for ethoxyquin in paprika and ch ili pow der is h ig h (100 ppm ), w e chose to use the less sen sitiv e UV d etector. At 254 nm, w ith the conditions specified above, the n oise lev el o f the detector w as about 2 X 10~4 AU. The least concentrated ethoxyquin w orking solution (2.5 Mg/mL) gave a response of about 4 X 10⁻³ AU, or 20 tim es n oise level. A lthough higher sensitiv ity can be obtained at the absorption maximum of 230 nm , w e used 254 nm to enh ance specificity. A spice sam ple conta in in g 2.5 ppm ethoxyquin w o u ld g iv e rise to a sam ple solution with a concentration of about 2.5 Mg/mL (assum ing a final vo lu m e o f 2 mL). T herefore, in the absence of any chrom atographic interferences, the m ethod can be applied to spice sam ples conta in ing as little as 2.5 ppm ethoxyquin.
A lm ost any organic so lven t can be used to quantitatively rem ove ethoxyquin from paprika and chili pow der. H ow ever, these extracts contain m any UV -absorbing m aterials, m aking
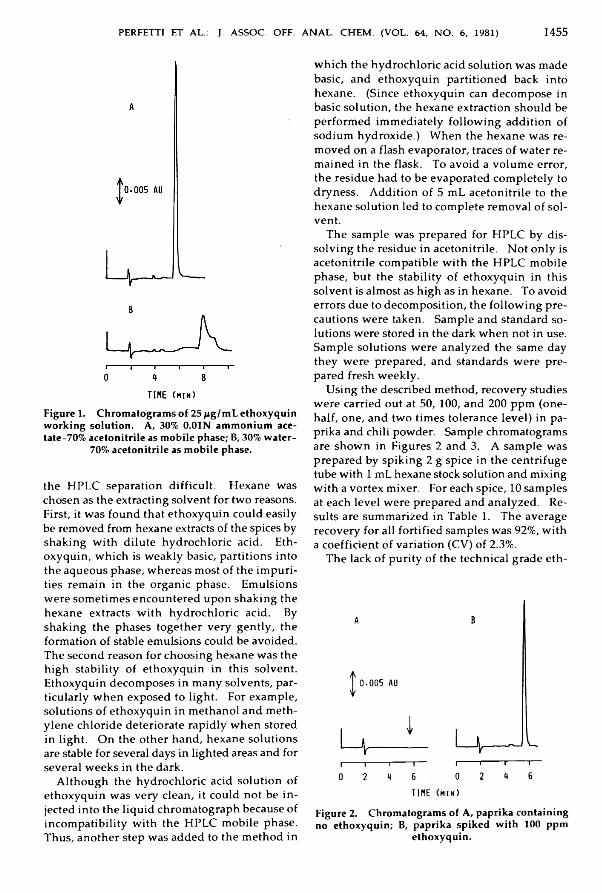
PERFETTI ET AL.: J. ASSOC. OFF. ANAL. CH EM . (VOL. 64, N O . 6, 1981) 1 4 5 5
B
Figure 1. Chromatograms of 25 /tg/mL ethoxyquin working solution. A, 30% 0.01N ammonium ace- tate-70% acetonitrile as mobile phase; B, 30% water-
70% acetonitrile as mobile phase.
the HPLC separation d ifficu lt. H exane was chosen as the extracting solven t for tw o reasons. First, it w as found that eth oxyq u in could easily be rem oved from hexane extracts o f the spices by shaking w ith d ilu te hydrochloric acid. Ethoxyquin , w h ich is w eak ly basic, partitions into the aqueous phase, w hereas m ost o f the im purities rem ain in the organic phase. E m ulsions w ere som etim es encountered upon shaking the hexane extracts w ith hydrochloric acid. By shaking the phases together very gen tly , the form ation o f stable em ulsions could be avoided. The secon d reason for ch oosin g hexane w as the h igh stability o f ethoxyquin in th is so lven t. E thoxyquin d ecom poses in m any so lven ts, particularly w h en exposed to ligh t. For exam ple, so lu tion s o f ethoxyq u in in m ethanol and m ethy len e ch loride deteriorate rapidly w h en stored in ligh t. O n the other hand , hexane so lu tion s are stable for several days in lighted areas and for several w eek s in the dark.
A lth ou gh the hydrochloric acid so lu tion of ethoxyq u in w as very clean , it could not be in jected in to the liqu id chrom atograph because of incom patib ility w ith the HPLC m obile phase. Thus, another step w as added to the m ethod in
w h ich th e hydrochloric acid so lu tion w as m ade basic, and ethoxyquin partitioned back in to hexane. (Since ethoxyquin can d ecom pose in basic so lu tion , the hexane extraction sh ou ld be perform ed im m ediately fo llo w in g addition o f sodium hydroxide.) W hen the hexane w as rem oved on a flash evaporator, traces o f w ater rem ained in th e flask. To avoid a v o lu m e error, the residue had to be evaporated co m p lete ly to dryness. A d dition o f 5 mL aceton itrile to the hexane solu tion led to com p lete rem oval o f so lvent.
The sam ple w as prepared for HPLC by d isso lv in g the residue in acetonitrile. N o t o n ly is acetonitrile com patible w ith th e HPLC m obile phase, but the stability o f ethoxyquin in this so lven t is alm ost as h igh as in hexane. To avoid errors due to decom position , the fo llo w in g precautions w ere taken. Sam ple and standard solutions w ere stored in the dark w h en not in use. Sam ple so lu tion s w ere analyzed the sam e day th ey w ere prepared, and standards w ere prepared fresh w eek ly .
U sin g the described m ethod, recovery studies w ere carried out at 50, 100, and 200 ppm (one- half, on e, and tw o tim es tolerance lev e l) in paprika and chili powder. Sam ple chromatograms are sh ow n in Figures 2 and 3. A sam ple w as prepared by sp ik in g 2 g spice in th e centrifuge tube w ith 1 mL hexane stock solution and m ixing w ith a vortex m ixer. For each sp ice, 10 sam ples at each lev e l w ere prepared and analyzed . Results are sum m arized in Table 1. The average recovery for all fortified sam ples w as 92%, w ith a coeffic ien t o f variation (CV) o f 2.3%.
The lack o f purity o f the technical grade eth-
A
| 0-005 AU
I i M ------------i i i i0 2 A 6
TIME
B
i----- 1----- 1----- r0 2 A 6
in)Figure 2. Chromatograms of A, paprika containing no ethoxyquin; B, paprika spiked with 100 ppm
ethoxyquin.
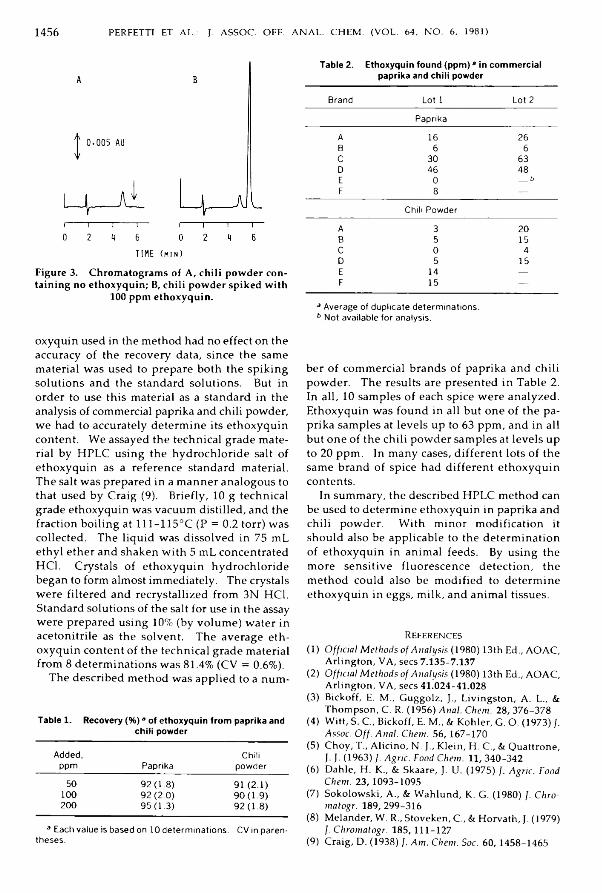
1 4 5 6 PERFETTI ET AL.: J. ASSOC. OFF. ANAL. CHEM . (VOL. 64, N O . 6, 1981)
A
M 0-005 AU V
i—(__ajLi----- i---- 1------ i—0 2 A 6
TIME (m in )
Figure 3. Chromatograms of A, chili powder containing no ethoxyquin; B, chili powder spiked with
TOO ppm ethoxyquin.
oxyquin used in the m ethod had no effect on the accuracy o f the recovery data, since the same m aterial w as used to prepare both the sp ik ing so lu tion s and the standard solu tions. But in order to use th is material as a standard in the analysis of commercial paprika and chili powder, w e had to accurately determ ine its ethoxyquin content. W e assayed th e technical grade m aterial by HPLC usin g the hydroch loride salt of ethoxyquin as a reference standard material. The salt w as prepared in a m anner analogous to that used by Craig (9). Briefly, 10 g technical grade ethoxyquin was vacuum distilled , and the fraction b o ilin g at 111-115°C (P = 0.2 torr) was collected. The liqu id w as d isso lved in 75 mL ethyl ether and shaken w ith 5 mL concentrated HC1. Crystals o f ethoxyquin hydrochloride began to form alm ost im m ediately. The crystals w ere filtered and recrystallized from 3N HC1. Standard solutions o f the salt for use in the assay w ere prepared usin g 10% (by volu m e) w ater in acetonitrile as the solven t. The average eth oxyquin content o f the technical grade material from 8 determ inations w as 81.4% (CV = 0.6%).
The described m ethod w as applied to a num -
Table 1. Recovery (%)3 of ethoxyquin from paprika and chili powderAdded,
ppm PaprikaChili
powder50 92(1.8) 91 (2.1)
100 92 (2.0) 90(1.9)200 95(1.3) 92(1.8)a Each value is based on 10 determinations. CV in paren
theses.
Table 2. Ethoxyquin found (ppm) * in commercial paprika and chili powderBrand Lot 1 Lot 2
PaprikaA 16 26B 6 6c 30 63D 46 48E 0 __bF 8 —
Chili PowderA 3 20B 5 15C 0 4D 5 15E 14 —F 15 —
3 Average of duplicate determinations. 6 Not available for analysis.
ber o f com m ercial brands o f paprika and ch ili pow der. The results are presented in Table 2. In all, 10 sam ples o f each sp ice w ere analyzed . Ethoxyquin w as fou n d in all but on e o f the paprika sam ples at lev els up to 63 ppm , and in all but on e o f the ch ili pow der sam ples at lev e ls up to 20 ppm . In m any cases, d ifferen t lots o f the sam e brand of spice had d ifferent ethoxyquin contents.
In summary, the described HPLC m ethod can be used to determ ine ethoxyquin in paprika and ch ili pow der. W ith m inor m odification it should also be applicable to the determ ination of ethoxyquin in anim al feeds. By u sin g the m ore sen sitiv e fluorescen ce d etection , the m ethod could also be m odified to determ ine ethoxyquin in eggs, m ilk, and anim al tissues.
References(1) Official Methods of Analysis (1980) 13th Ed., AOAC,
Arlington, VA, secs 7.135-7.137(2) Official Methods of Analysis (1980) 13th Ed., AOAC,
Arlington, VA, secs 41.024-41.028(3) Bickoff, E. M., Guggolz, J., Livingston, A. L„ &
Thompson, C. R. (1956) Anal. Chem. 28, 376-378(4) Witt, S. C , Bickoff, E. M„ & Kohler, G. O. (1973) /.
Assoc. Off. Anal. Chem. 56,167-170(5) Choy, T„ Alicino, N. J., Klein, H. C., & Quattrone,
J. J. (1963) J. Agrie. Food Chem. 11, 340-342(6 ) Dahle, H. K„ & Skaare, J. U. (1975) J. Agrie. Food
Chem. 23,1093-1095(7) Sokolowski, A., & W ahlund, K. G. (1980) J. Chro-
matogr. 189, 299-316(8 ) Melander, W. R., Stoveken, C., & Horvath, J. (1979)
]■ Chromatogr. 185, 111-127(9) Craig, D. (1938) ]. Am. Chem. Soc. 60,1458-1465
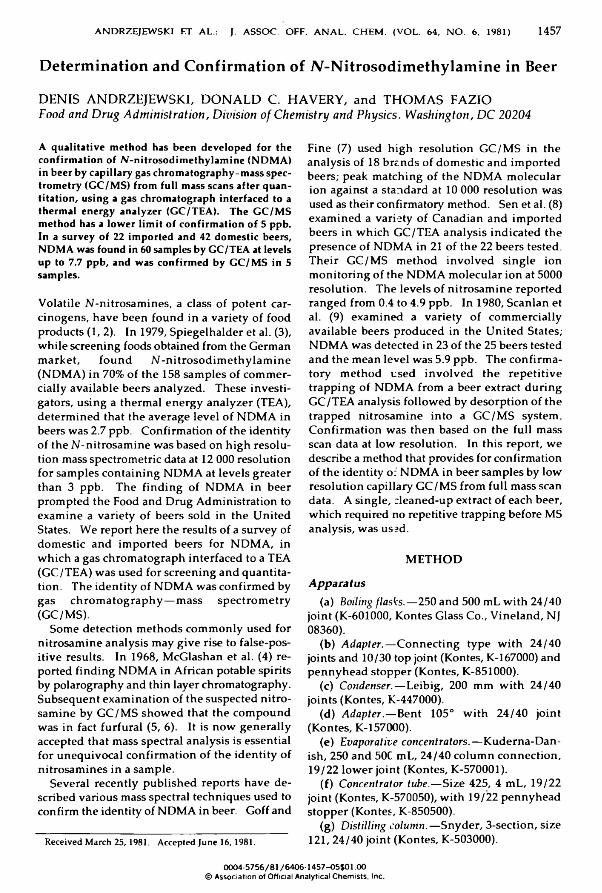
ANDRZEJEWSKI ET AL.: J. ASSOC. OFF. ANAL. CHEM . (VOL. 64, N O . 6. 1981) 1 4 57
Determination and Confirmation of AT-Nitrosodimethylamine in BeerDENIS ANDRZEJEWSKI, DONALD C. HAVERY, and THOMAS FAZIO Food and Drug Administration, Division of Chemistry and Physics. Washington, DC 20204
A qualitative method has been developed for the confirmation of N-nitrosodimethylamine (NDMA) in beer by capillary gas chromatography-mass spectrometry (GC/MS) from full mass scans after quantitation, using a gas chromatograph interfaced to a thermal energy analyzer (GC/TEA). The GC/MS method has a lower lim it of confirmation of 5 ppb. In a survey of 22 imported and 42 domestic beers, NDMA was found in 60 samples by GC/TEA at levels up to 7.7 ppb, and was confirmed by GC/MS in 5 samples.
V olatile N -nitrosam ines, a class o f poten t carc in ogen s, have b een fou n d in a variety o f food products (1, 2). In 1979, Spiegelhalder et al. (3), w h ile screening foods obtained from the German m arket, fou n d N -n itro so d im eth y la m in e (N D M A ) in 70% o f the 158 sam ples o f com m ercia lly available beers analyzed . T hese in vestigators, usin g a therm al en ergy analyzer (TEA), determ ined that the average lev e l o f N D M A in beers w as 2.7 ppb. Confirm ation o f the identity o f the N -n itrosam ine w as based on h igh resolution mass spectrom etric data at 12 000 resolution for sam ples con ta in in g N D M A at lev e ls greater than 3 ppb. The fin d in g o f N D M A in beer prom pted the Food and Drug Adm inistration to exam ine a variety o f beers sold in the U n ited States. We report here the results o f a survey of dom estic and im ported beers for N D M A , in w h ich a gas chrom atograph interfaced to a TEA (GC/TEA) w as used for screen ing and quantitation. The iden tity o f N D M A w as confirm ed by gas ch rom atograp h y— m ass sp ectrom etry (GC/M S).
Som e detection m ethods com m only used for nitrosam ine analysis m ay g iv e rise to false-positive results. In 1968, M cGlashan et al. (4) reported fin d in g N D M A in African potable spirits by polarography and thin layer chromatography. Subsequent exam ination o f the suspected nitrosam ine by G C /M S sh ow ed that the com p ound w as in fact furfural (5, 6). It is n ow genera lly accepted that m ass spectral analysis is essential for unequivocal confirm ation o f the id en tity o f nitrosam ines in a sam ple.
Several recently p u b lish ed reports have d escribed various mass spectral techn iques used to confirm the identity of ND M A in beer. G off and
Received M arch 25,1981. Accepted June 16,1981.
Fine (7) used h igh resolu tion G C /M S in the analysis o f 18 brands o f dom estic and im ported beers; peak m atching o f the N D M A m olecular ion against a standard at 10 000 resolu tion w as used as their confirmatory m ethod. Sen et al. (8) exam ined a variety o f Canadian and im ported beers in w h ich GC/TEA analysis indicated the presence o f N D M A in 21 o f th e 22 beers tested. Their G C /M S m ethod in vo lved s in g le ion m onitoring o f the N D M A m olecular ion at 5000 resolu tion . The lev e ls o f n itrosam ine reported ranged from 0.4 to 4.9 ppb. In 1980, Scanlan et al. (9) exam ined a variety o f com m ercially available beers produced in the U n ited States; N D M A w as detected in 23 o f the 25 beers tested and the m ean lev e l w as 5.9 ppb. The confirm atory m eth od u sed in v o lv ed th e rep etitiv e trapping o f N D M A from a beer extract during GC/TEA analysis fo llow ed by desorption o f th e trapped n itrosam ine in to a G C /M S system . Confirm ation w as then based on the fu ll mass scan data at low resolu tion. In th is report, w e describe a m ethod that provides for confirm ation of the identity of N D M A in beer sam ples by low resolu tion capillary G C /M S from fu ll m ass scan data. A sin g le , cleaned-up extract o f each beer, w h ich required no repetitive trapping before MS analysis, w as used.
M ETH O DApparatus
(a) Boiling flasks. —250 and 500 mL w ith 24 /40 joint (K-601000, K ontes Glass Co., V in eland , NJ 08360).(b) A d a p te r .—C onnecting type w ith 2 4 /4 0 joints and 10/30 top joint (Kontes, K-167000) and pen n yh ead stopper (K ontes, K-851000).
(c) C ondenser.—L eibig, 200 mm w ith 2 4 /4 0 joints (K ontes, K-447000).
(d) A d a p te r .—Bent 105° w ith 2 4 /4 0 joint (K ontes, K-157000).
(e) E vaporative con cen tra tors.— K uderna-Dan- ish , 250 and 50C mL, 2 4 /4 0 co lum n con n ection , 19 /2 2 low er joint (K ontes, K-570001).
(f) C oncentrator tube.— Size 425, 4 mL, 19 /22 joint (Kontes, K-570050), w ith 19 /22 pennyhead stopper (K ontes, K-850500).
(g) D istilling co lu m n.—Snyder, 3-section , s ize 121, 24 /4 0 joint (K ontes, K-503000).
0004-5756/81 /6406-1457-05$01.00© Association of Official Analytical Chemists. Inc.
1 4 5 8 ANDRZEJEWSKI ET AL.: J. ASSOC. OFF. ANAL. CHEM . (VOL. 64, N O . 6, 1981)
(h) Funnel.— Buchner, 60 mL, w ith coarse p orosity disk (Kontes, K-955000).(i) Chromatographic column.—Chrom oflex, size 241, 22 mm id X 300 mm (K ontes, K-420530).
(j) Sam ple tube.— C h rom oflex, 10 /1 8 joint (K ontes, K-422560), w ith stopper.
(k) Gas ch rom atograph -th erm al en ergy analy ze r .— F isher/V ictoreen (Fisher Scientific Co., Pittsburgh, PA 15219) series 4400 w ith M odel 4006-14 auto programmer, M odel FS01W6D strip chart recorder (0.5 in ./m in chart speed), M odel 4002-12 oven , and M odel 4020-1 tem perature/ indicator control, interfaced to M odel 502L thermal energy analyzer (Thermo Electron Corp., W altham, MA 02154). O perating conditions:2.7 m X 4 mm id coiled glass colum n packed w ith 10% Carbowax 1540 + 5% potassium hydroxide on 100-120 m esh Chrom osorb WHP; carrier gas (argon), 40 m L/m in; temperatures, injection port 200°C, colum n isotherm al 150°C, TEA furnace 450°C; pressure 1.2 torr; liquid n itrogen cold trap.
(l) Gas ch ro m a to g ra p h -m a ss sp ec tro m e ter .— H ewlett-Packard M odel 5992A (Palo A lto, CA 94304) quadrupole mass spectrom eter w ith H P 5700A series gas chrom atograph and H P18947A capillary colum n interface. Operatin g conditions: 40 m X 0.5 mm id Carbowax 20M capillary SCOT colum n; tem peratures, in jection port 200°C, oven 60 to 180°C at 12° / m in fo llow in g initial hold at 60°C for 8 m in; carrier gas, h eliu m , 3 m L /m in . H ewlett-Packard m agnetic tape softw are program (05992-10015, Peakfinder for N orm alized Spectra) was used to calibrate and autotune the mass spectrom eter in the electron im pact m ode at 70 eV. Full mass scans w ere acquired over the mass range m /z 25 to 150; scan rate 200 am u/s. Data w ere acquired and stored on the cartridge tape unit.
Reagents(a) D ich lorom eth an e (D C M ).— D istilled -in -
Glass (Burdick and Jackson Laboratories, M uskegon , MI 49442).
(b) C elite 545.— N o. C-212, not acid w ashed (Fisher). Heat contents of each bottle overnight at 700°C before use.
(c) n-Pentane.— Redistill before use (J.T. Baker, Phillipsburg, NJ 08865).
(d) N -N itro so d im e th y la m in e (N D M A ) .— Serially d ilute stock solution (1 m g/m L ) to w orking standard (0.5 p g/m L ) w ith DCM. Caution: N D M A is potent animal carcinogen and m ust be hand led appropriately.
Each lot o f reagent m ust be checked for inter
ferences by perform ing blank analyses, substituting 25 g d istilled w ater for sam ple.Procedure
W eigh 25 g beer in to 250 mL round-bottom flask conta in ing 4 g barium hydroxide and b oilin g chips. D istill s low ly (variable transformer 60%), collecting ca 24 mL distillate in 125 mL separatory fun n el. Add 0.2 g anhydrous sodium carbonate. Extract d istillate w ith four 10 mL portions of DCM, shaking each 1 m in. Pass p oo led extracts through 30 g anhydrous N a2S0 4 (h eld in 60 mL fritted glass fu n n el and prew etted w ith DCM) into 250 mL Kuderna- Danish evaporative concentrator (KD) w ith 4 mL concentrator tube attached. Wash N a2S0 4 w ith 15 mL DCM into KD. Add carborundum grains, attach 3-section Snyder colum n and carefully concentrate (rate ca 1 m L /m in ) to 4 mL in 60°C water bath. Rem ove KD from bath and let drain for 15 m in. R em ove concentrator tube and further concentrate to 1.0 mL under gen tle stream of n itrogen (ultra h ig h purity). Inject 8 pL into GC/TEA system and quantitate any peak w ith retention tim e corresponding to that o f N D M A external standard. Calculate N D M A con cen tration on basis o f peak heights.
For those sam ples containing m ore than 5 ppb ND M A , a larger sam ple is prepared as follow s: W eigh 300 g beer into 500 mL round-bottom flask conta in ing 48 g barium hydroxide and b oilin g chips. D istill in to 500 mL separatory fun n el, co llectin g 290 mL. A dd 100 mL 5 N N aO H , m ix, and let stand overn igh t. Extract distillate w ith three 100 mL portions o f DCM , shaking each 1 m in. Pass p oo led extracts through 30 g anhydrous N a2S 0 4 (h eld in 60 mL sintered glass funnel and prew etted w ith DCM) into 500 mL KD w ith 4 mL concentrator tube attached. W ash N a2S 0 4 w ith 25 mL DCM into KD. Concentrate to 1 mL as p reviously d escribed. Stopper and retain for colum n chrom atographic cleanup.
Add 10 mL 6 N HC1 in sm all increm ents to 6 g Celite w ith vigorous stirring (mixture w ill appear ligh t and fluffy). Pack m ixture in chrom atographic colum n on top o f glass w o o l p lug, com pressing to ca 2 in. Place sm all glass w o o l p lug on top o f packing. A dd 50 mL n-pentane to colum n and drain. Transfer 1 mL sam ple extract to colum n w ith 20 mL n-pentane in four 5 mL increments. Drain colum n. Wash colum n w ith 200 mL 5% DCM in n-pentane and discard. Elute N D M A from colum n w ith 50 mL DCM and co llect in 250 mL KD w ith 4 mL concentrator tube attached. Concentrate to 1.0 mL as p reviously

ANDRZEJEWSKI ET AL.: J. ASSOC. OFF. ANAL. CHEM . (VOL. 64, N O . 6, 1981) 1459
Table 1. N-Nitrosodimethylamine (ppb) in beer
Type of beerNo. of
samples Range A v.Imported Beer 17 0.4—3.6 1.9
Ale 2 3 .3 -3 4 3.4Dark, strong 1 NDa NDMalt liquor 2 1.0 1.0
Domestic Beer 37 ND-7.7 3.3Malt liquor 5 0.9—6.4 3.5
Total 64 ND-7.7 2.8
a None detected.
described. Transfer to Chrom oflex sam ple tube and carefully concentrate to 0.1 mL under gen tle stream o f n itrogen . Stopper and retain for G C /M S analysis.
R esu lts and D iscu ssionA total of 55 sam ples of beer, ale, and m alt li
quors w ere purchased at local retail markets in the W ashington, DC area and 9 beers w ere obtained from the w estern coast o f the U n ited States. The results o f the analysis o f these sam ples are sh ow n in Table 1. O f the 64 sam ples analyzed by GC/TEA for N D M A , 42 w ere d omestic and 22 were imported beers. ND M A was found in 39 dom estic sam ples at lev els ranging from 0.6 to 7.7 ppb w ith an average o f 3.6 ppb. In 21 im ported beers, N D M A ranged from 0.4 to3.6 ppb w ith an average o f 1.9 ppb. N D M A was not detectable by GC/TEA analysis in 1 imported and 3 dom estic beer sam ples. The d etection lim it o f the GC/TEA system for N D M A w as 0.4 ppb, based on a signal-to-n oise ratio o f 5:1. O f the 64 beers surveyed, 5 conta ined lev e ls o f N D M A greater than 5 ppb and w ere subjected to GC/M S confirmation. Recovery data for ND M A in beer by the GC/TEA detection and quantitation m ethod have b een p reviou sly reported(10).
Preliminary studies conducted to establish the retention tim e o f N D M A and lim its o f detection of the capillary G C /M S system indicated that approxim ately 100 ng N D M A w as necessary to obtain a representative full mass spectrum. This lev el o f n itrosam ine standard w as necessary b ecause o f the lim ited storage capability o f the data system used. Extraction o f a beer sam ple larger than 25 g w as thus required for the G C /M S confirm ation to obtain a final concentration that w o u ld provide 100 ng N D M A in a 2 or 3 ¿iL in jection.
The in itia l attem pt to confirm N D M A by G C /M S in v o lv ed d istilla tion o f an alkaline solu tion o f 300 g beer, extraction o f the d istillate
w ith m eth y len e ch loride, and elu tion o f the extract from an acid C elite colum n. This cleaned- up beer extract w as then concentrated to 300 ¿uL, and several m icroliters w ere w ithdraw n and analyzed by capillary G C /M S to determ ine the efficien cy o f the cleanup procedure near the retention time o f NDM A. Examination o f the total ion trace from this injection sh ow ed no in terferences at exactly the sam e retention tim e as NDM A; how ever, a major com p onent elu tin g just before this tim e w as detected. Based on GC/TEA quantitation, a 10-fold concentration of the 300 /tL extract w ould be required to bring the nitrosam ine concentration w ith in the detection range o f the GC / MS system . At th is concentration the lev e l o f the com p onent e lu tin g before N D M A w o u ld preclude the confirm ation o f the nitrosam ine. Identification and rem oval o f this interference was therefore essential to the con firm atory m ethod.
Exam ination of the mass spectrum of the in terference show ed a h igh mass ion at m /z 88 and 2 fragment ions at m /z 45 (base peak) and m /z 43. Characterization o f th is com pound as 3-hy- droxy-2-butanone from the mass spectrum was later verified by comparing its full mass spectrum w ith that o f a standard. The m ethod w as then m odified to rem ove th is com pound by reacting the alkaline beer distillate overnight w ith 100 mL 5N NaO H as previously described (10), fo llow ed by extraction w ith m eth y len e ch loride and elu-
1
oT>c3-Q<
• M M ■L"- |-----* - i-----------------T— *----1---------T~15 16 17 18 19 20Minutes
Figure 1. GC/MS total ion chromatogram of beer sample after analytical cleanup: 1, residual 3-hy-
droxy-2-butanone; 2, response for NDMA.
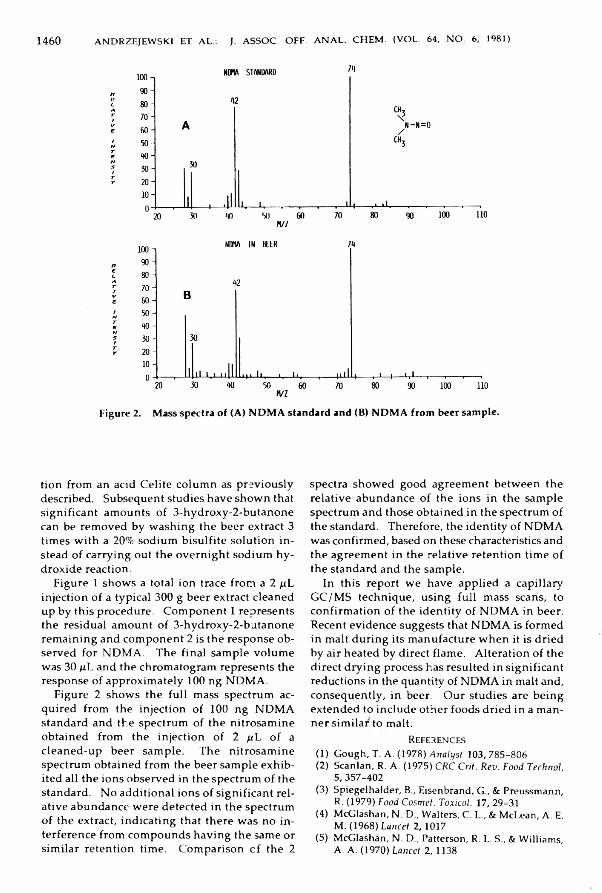
1 4 6 0 ANDRZEJEWSKI ET AL.: J. ASSOC. OFF. ANAL. CHEM . (VOL. 64, N O . 6, 1981)
Figure 2. Mass spectra of (A) NDMA standard and (B) NDM A from beer sample.
tion from an acid C elite colum n as previously described. Subsequent studies have sh ow n that sign ifican t am ounts o f 3-hydroxy-2-butanone can be rem oved by w a sh in g the beer extract 3 tim es w ith a 20% sodium b isu lfite so lu tion in stead o f carrying out the overn igh t sodium h y droxide reaction.
Figure 1 sh ow s a total ion trace from a 2 ) iL injection o f a typical 300 g beer extract cleaned up by th is procedure. C om ponent 1 represents the residual am ount o f 3-hydroxy-2-butanone rem aining and com p onent 2 is the response observed for N D M A . The final sam ple volu m e was 30 f iL and the chromatogram represents the response o f approxim ately 100 ng ND M A .
Figure 2 sh ow s the full mass spectrum acquired from the injection o f 100 n g ND M A standard and the spectrum of th e n itrosam ine obtained from the injection o f 2 pL o f a clean ed -u p beer sam ple. The n itrosam ine spectrum obtained from the beer sam ple exh ib ited all the ion s observed in the spectrum of the standard. N o additional ions o f sign ifican t relative abundance w ere detected in the spectrum o f the extract, ind icating that there w as no in terference from com pounds having the same or sim ilar retention tim e. Com parison c f the 2
spectra sh ow ed good agreem ent b etw een the relative abundance o f the ions in the sam ple spectrum and those obtained in the spectrum of the standard. Therefore, the iden tity o f ND M A was confirm ed, based on these characteristics and the agreem ent in the relative retention tim e of the standard and the sam ple.
In this report w e have applied a capillary G C/M S technique, usin g fu ll mass scans, to confirm ation o f the iden tity o f N D M A in beer. Recent ev idence suggests that N D M A is form ed in malt during its m anufacture w h en it is dried by air heated by direct flam e. A lteration o f the direct drying process has resulted in sign ifican t reductions in the quantity of N D M A in malt and, consequently , in beer. Our studies are b ein g extended to inclu de other foods dried in a m anner sim ilar to malt.
References(1) Gough, T. A. (1978) Analyst 103, 785-806(2) Scanlan, R. A. (1975) CRC Crit. Rev. Food Technol.
5,357-402(3) Spiegelhalder, B., Eisenbrand, G„ & Preussmann,
R. (1979) Food Cosmet. Toxicol. 17, 29-31(4) McGlashan, N. D., Walters, C. L„ & McLean, A. E.
M. (1968) Lancet 2, 1017(5) McGlashan, N. D., Patterson, R. L. S., & Williams,
A. A. (1970) Lancet 2, 1138

ANDRZEJEWSKI ET AL.: J. ASSOC. OFF. ANAL. CHEM . (VOL. 64, N O . 6 , 1981) 1461
(6) Williams, A. A., Timberlake, C. F., Tucknott, O. G., & Patterson, R. L. S. (1971) ]. Sci. Food Agrie. 22, 431-434
(7) Goff, E. U„ & Fine, D. H. (1978) Food Cosmet. Fox- icol. 17,569-573
(8) Sen, N. P., Seaman, S., & McPhearson, M. (1980)
/. Food Safety 2, 13-18(9) Scanlan, R. A., Barbour, J. F., Hotchkiss, J. H., &
Libbey, L. M. (1980) Food Cosmet. Toxicol. 18, 27-29
(10) Havery, D. C„ Hotchkiss, J. H„ & Fazio, T. (1981) /. Food Sci. 46, 501-505

1 4 6 2 LAWRENCE ET AL.: J. ASSOC. OFF. ANAL. CHEM . (VOL. 64, N O . 6, 1981)
Gravimetric Determination of Ethoxylated Mono- and Diglycerides in BreadJA M E S F . L A W R E N C E , J A G A N N A T H R . IY E N G A R , an d H A R R Y B . S . C O N A C H E RH e a lth a n d W e lfa re C a n a d a , H e a l th P r o te c tio n B ra n ch , F ood D ir e c to r a te , F ood R e sea rch D iv is io n , T u n n e y 's P a s tu r e , O t ta w a , O n ta r io , C a n a d a K 1 A 0L 2
A gravimetric method is described for the quantitative determination of ethoxylated mono- and diglycerides (EMGs) in bread at levels as low 0.42% (dry sample). The air-dried pulverized samples are Soxhlet-extracted 22 h with an azeotropic mixture of n-propanol-water. The contents are evaporated to dryness, and then treated with 5% HC1 in methanol to trans-esterify the fatty acids present which are then removed by petroleum ether extraction. The EMGs are subsequently precipitated from aqueous solution with phosphomolybdic acid in the presence of barium ions. The precipitate is weighed and compared with known amounts of standard carried through the same procedure.
Ethoxylated m ono- and d iglycerides (EMGs) are n on -ion ic surface-active ingred ien ts perm itted under the food additive regulations in the United States for use as dough conditioners (emulsifiers) in yeast-leavened bakery products, in clu d in g bread, up to a lev el o f 0.5% in the dry baking form ula (1). There are no perm itted food uses of EMGs in Canada (2); thus, m eth od ology is required to m onitor their presence in food products, particularly bread. A num ber o f m ethods are available for the determ ination o f non-ion ic em ulsifiers, in clu d in g p o lyoxyeth y len e esters (3-6) and p o ly oxyeth y len e g lyco l (7). M ethodology for these and other classes o f em ulsifiers has b een rev iew ed (8-10). The p h osp h om olybdic acid barium com plexation reaction was originally used by Shaffer and Critchfield (7) for the colorim etric determ ination o f p o ly eth y len e glycols, and was later used in a gravim etric procedure (11). Since then, this approach has been applied w ith m odifications to polysorbate 60 (12, 13) and polysorbate 80 (14,15). It is also the basis o f the m ethod adopted by the U.S. Food and Drug A dm inistration for EMG.
In our experience, the m ethod used by the U.S. Food and Drug A dm inistration (1) has not been entire ly satisfactory, m ainly because the technique is tedious and tim e-consum ing, requiring a num ber o f extractions, transfers, and evaporations. This report describes a gravim etric m ethod based on phosphom olybdic acid barium
Received February 25, 1981. Accepted May 28, 1981.
precipitation (14) that m akes use o f a very d ifferent extraction procedure in w h ich th e analyst's actual w ork ing tim e is s ign ifican tly reduced and on ly 3 transfer steps are required from b eg in n in g to end.
E xperim entalReagents
(a) S o lven ts .— G lass-distilled.(b) H ydrochloric a c id .—Gaseous.(c) Barium chloride, d ih yd ra te .—10% aqueous
solution .(d) P hosphom olybdic ac id .— 10% aqueous so lu
tion.(e) Trans-esterification so lu tion .— 5% HC1 in
m ethanol. Pass HC1 gas through m ethanol previously dried over N a2S0 4 (anhydrous), until 5% w eig h t increase occurs.
(f) E thoxylated mono- and dig lyceride (E M G ) sta n d ards .— D isso lve 5 g standard in 50 mL m ethanol. D ilu te 10 mL aliquot 10-fold for sp ik ing purposes (i.e., 1 mL solu tion = 10 m g EMG) w ith m ethanol.Sample Analysis
W eigh 10 g dried, fresh ly ground bread in Soxhlet thim ble. Extract 22 h w ith azeotropic mixture of 1-propanol-water (72 + 28). Remove round-bottom flask and evaporate so lu tion to thorough dryness w ith a rotary flash evaporator at 60°C. Residual water may be rem oved azeo- tropically by addin g ca 100 mL m ethanol and repeating evaporation. Extract residue in the flask w ith four 20 mL portions o f CHCI3 by gently sw irling and decanting into clean 250 mL round-bottom flask. Evaporate so lu tion to dryness w ith flash evaporator and add 25 mL trans-esterification solu tion . Reflux 1 h; then evaporate to dryness. Extract residue w ith three 20 mL portions o f petroleum ether and discard ether. D isso lve rem aining residue in ca 50 mL water, transfer to 400 mL beaker, d ilu te to 250 mL, and heat to boiling . Add, in order, 2 mL 3N HC1, 4 mL 10% barium chloride solu tion , and 4 mL 10% p hosphom olybdic solution . Let stand overn igh t, covered w ith watch glass. Filter so-
0004-5756/81/6406-1462-03$01.00© Association of Official Analytical Chemists, Inc.
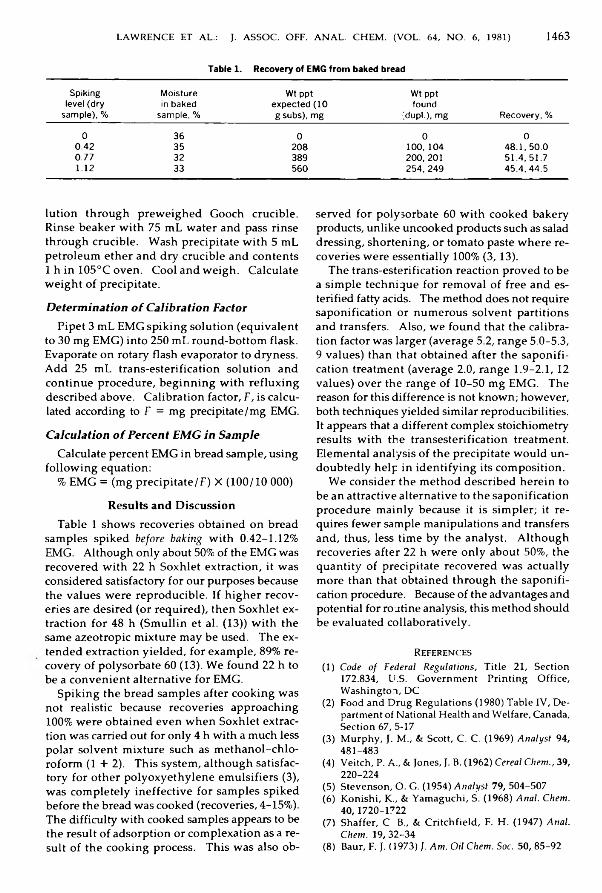
LAW RENCE ET AL.: J. ASSOC. OFF. ANAL. CHEM . (VOL. 64, N O . 6, 1981) 1 4 63
Table 1. Recovery of EMG from baked breadSpiking
level(drysample), %
Moisture in baked
sample, %Wt ppt
expected(10 g subs), mg
Wt ppt found
(dupl.), mg Recovery, %0 36 0 0 0
0.42 35 208 100, 104 48.1, 50.00.77 32 389 200, 201 51.4,51.71.12 33 560 254, 249 45.4, 44.5
lu tion throu gh p rew eigh ed Gooch crucible. R inse beaker w ith 75 mL w ater and pass rinse through crucible. W ash precipitate w ith 5 mL petroleum ether and dry crucible and contents 1 h in 105°C oven . C ool and w e ig h . Calculate w eig h t o f precipitate.Determination of Calibration Factor
Pipet 3 mL EMG sp ik in g so lu tion (equ ivalent to 30 m g EMG) into 250 mL round-bottom flask. Evaporate on rotary flash evaporator to dryness. A dd 25 mL trans-esterification so lu tion and con tin u e procedure, b eg in n in g w ith refluxing described above. Calibration factor, F, is calculated according to F = m g precipitate/m g EMG.Calculation of Percent EMG in Sample
Calculate percent EMG in bread sam ple, using fo llo w in g equation:
% EMG = (m g p recip itate/F ) X (100 /10 000)Resu lts and D iscussion
Table 1 sh ow s recoveries obtained on bread sam ples sp iked before baking w ith 0.42-1.12% EMG. A lthough only about 50% of the EMG was recovered w ith 22 h Soxhlet extraction, it w as considered satisfactory for our purposes because th e va lu es w ere reproducible. If h igh er recoveries are desired (or required), then Soxh let extraction for 48 h (Sm ullin et al. (13)) w ith the sam e azeotropic m ixture m ay be used. The exten d ed extraction y ie ld ed , for exam ple, 89% recovery o f polysorbate 60 (13). W e fou n d 22 h to be a co n v en ien t alternative for EMG.
Spik in g the bread sam ples after cook ing w as not realistic because recoveries approaching 100% w ere obtained ev en w h en Soxhlet extraction was carried out for on ly 4 h w ith a m uch less polar so lv en t m ixture such as m eth a n o l-ch lo roform (1 + 2). This system , a lth ou gh satisfactory for other p o ly oxyeth y len e em ulsifiers (3), w as com p letely in effective for sam ples sp iked before the bread w as cooked (recoveries, 4-15%). The difficulty w ith cooked sam ples appears to be the result o f adsorption or com plexation as a resu lt o f th e cooking process. This w as also ob
served for polysorbate 60 w ith cooked bakery products, unlike uncooked products such as salad dressing, shorten in g , or tom ato paste w h ere recoveries w ere essen tia lly 100% (3 ,13).
The trans-esterification reaction proved to be a sim ple technique for rem oval o f free and es- terified fatty acids. The m ethod does not require saponification or num erous so lv en t partitions and transfers. A lso, w e fou n d that the calibration factor was larger (average 5.2, range 5.0-5.3, 9 values) than that obtained after the saponification treatm ent (average 2.0, range 1.9-2.1, 12 values) over the range o f 10-50 m g EMG. The reason for this difference is not know n; how ever, both techniques yielded similar reproducibilities. It appears that a different com plex stoichiom etry results w ith th e transesterification treatm ent. Elem ental analysis o f the precipitate w o u ld u n d oub ted ly help in id en tify in g its com position .
W e consider the m ethod described herein to be an attractive alternative to the saponification procedure m ainly because it is sim pler; it requires few er sam ple m anipulations and transfers and, thus, less tim e by the analyst. A lth ou gh recoveries after 22 h w ere on ly about 50%, the quantity o f precipitate recovered w as actually m ore than that obtained through the saponification procedure. Because of the advantages and potential for routine analysis, this m ethod should be evaluated collaboratively.
References(1) Code of Federal Regulations, Title 21, Section
172.834, U.S. Government Printing Office, Washington, DC
(2) Food and Drug Regulations (1980) Table IV, Department of National Health and Welfare, Canada, Section 67, 5-17
(3) Murphy, J. M., & Scott, C. C. (1969) Analyst 94, 481-483
(4) Veitch, P. A., & Jones, J. B. (1962) Cereal Chem., 39, 220-224
(5) Stevenson, O. G. (1954) Analyst 79, 504-507(6) Konishi, K., & Yamaguchi, S. (1968) Anal. Chem.
40,1720-1722(7) Shaffer, C B., & Critchfield, F. H. (1947) Anal.
Chem. 19, 32-34(8) Baur, F. J. (1973) J. Am. Oil Chem. Soc. 50, 85-92

1 4 6 4 LAW RENCE ET AL.: J. ASSOC. OFF. ANAL. CHEM . (VOL. 64, N O . 6, 1981)
(9) Murphy, J. M., & Hibbert, H. R. (1969) /. Food Technol. 4, 227-234
(10) Kortland, C., & Dämmers, H. F. (1954) /. Am. Oil Chem. Soc. 32, 58-64
(11) Oliver, J., & Preston, C. (1949) Nature 164, 242- 243
(12) Smullin, C. F„ Wetterau, F. P„ & Olsanski, V. L.
(1965) /. Assoc. Off. Anal. Chem. 48,46-48(13) Smullin, C. F., Wetterau, F. P., & Olsanski, V. L.
(1970) J. Am. Oil Chem. Soc. 48, 18-20(14) Hall, M. J. (1964) /. Assoc. Off. Anal. Chem. 47,
685-688(15) Garrison, R. A., Harwood, V., & Chapman, R. A.
(1957) /. Assoc. Off. Anal. Chem. 40,1085-1093
S p r i n g
c W o r k ^ h o p
1 9 8 2 April 13-15
NEW ORLEANS, LOUISIANAPlan now to attend. Contact
NICOLE F. HARDINU.S. Food & Drug Administration
4298 Elysian Fields Ave New Orleans, LA 70122
(504/589-2471)
HERSHEL MORRISLouisiana Dept of Agriculture
PO Box 16390-A, University Station Baton Rouge, LA 70893
(504/388-2755) o f l O A C

ZIPKES ET AL.: J. ASSOC. OFF. ANAL. CHEM . (VOL. 64, N O . 6, 1981) 1 4 65
A N A L Y T I C A L M Y C O L O G Y O F F O O D S A N D D R U G S
Comparison of Yeast and Mold Counts by Spiral, Pour, and Streak Plate MethodsM A R IL Y N R . Z IP K E S , JA M E S E . G IL C H R IS T ,1 an d JA M E S T . P E E L E R 1F ood a n d D r u g A d m in is tr a t io n , D iv is io n o f M ic r o b io lo g y , 1141 C e n tr a l P a r k w a y , C in c in n a ti ,O H 4 5 2 0 2
Foods with naturally occurring yeast and mold were used in a comparative study of 4 plating techniques. Oats, green beans, and cheese were incubated for 3 and 5 days at 25°C. Although 3 days of incubation would be sufficient for yeast, 5 days were necessary for the mold count. The percent recovery of yeasts and molds by the spiral and streak methods ranged from 200 to 357% compared with the pour plating method described in the Bacteriological Analytical Manual (BAM). The spiral method had the highest overall recovery and the lowest replicate plating error.
Counts of yeasts and m olds are based on standard pour plate m ethods (1-3). A lth ou gh streak plates are used to id en tify m olds, num erical results are obtained by counting pour plates. Most research on yeast and m old procedures has been directed toward se lectin g and im provin g the productivity o f m edia (4-7). Current m ethods have sh ow n that various foods, such as w heat flour, corn m eal, brow n rice, sp lit peas, pecans, w alnuts, soybeans, and dried beans (8), contain toxigenic m old species. Because of the potential health hazards o f m old-contam inated food, m eth od ology for recovery and id en tification of viab le yeasts and m olds m ust be im proved. In reports (9-11) w h ich compared surface and pour plate counts for bacteria, the latter 2 studies referenced presented a procedure for autom ated surface plate count for bacteria, w h ich gave equ ivalent recovery and saved tim e as w e ll as m oney. Later studies (12, 13) tested the variability o f this spiral plate count (SPLC) procedure am on g several laboratories. Because th is m ethod is n ow an AOAC official m ethod (2) for bacteria, its applicability to yeast and m old analysis w as tested.
This study compared the SPLC procedure w ith the current pour plate m ethod (3). Our prelim inary tests sh ow ed that the percentage recovery of yeasts and m olds by the SPLC m ethod was
1 1090 Tusculum Ave, C incinnati, OH 45226. Received M arch 9, 1981. Accepted May 28,1981.
h igh er than tha: for pour plating. A pure cu lture of Staphylococcus aureus w as used to verify that the SPLC and pour plating m ethods gave the sam e concentrations.
Because streak plate procedures (14) are used in Europe to count yeasts and m olds, a streak plate procedure w as inclu ded in this study. A com parison w ith the SPLC sh ow ed that surface plating gave h igh er recoveries o f yeasts and m olds. The streak p latin g m ethod for isolation and enum eration o f S. aureus in food , sec. 46.075-46.076, w ith m odifications for agar and incubation, w as adapted for enum eration of yeasts and m olds. F ive-day counts w ere m ade on plates that had been counted at 3 days to d eterm ine w hether m oving the plates w ould cause m old spores to spread and result in h igh er counts. It w as observed that pouring the agar im m ediately after p ip etin g the d ilu ted sam ple onto a petri d ish gave better recovery and less duplicate plate variance. This m odified pouring procedure was also incorporated into the tests of m ethods for yeast and m old enum eration.
M ETH O DApparatus
(a) Spiral p la te r .— For use w ith 150 X 15 mm petri d ishes and adjusted to deliver total volum e of 0.035 m L /plate, secs 46.110-46.111 (Spiral System s M arketing, Bethesda, M D 20014).
(b) T ransparent v iew in g g r id .— For use in counting plates and calibrating spiral plater, secs 46.113 and 46.116.Media
(a) A ntibiotic stock so lu tion .—D isso lve 500 m g chlortetracycline HC1 in 50 mL sterile water. A ntib iotic N o 100235 (ICN Pharm aceuticals, Inc., Irvine, CA 92715) is satisfactory. Filter solution w ith 0.45 qm plain m em brane disposable filter unit. Filter N o. 245-0045 (N alge Sybron Corp., Rochester, NY 14602) is satisfactory.
(b) A g a r.— Potato dextrose agar (PDA, D ifco) is satisfactory. Suspend 200 g potato in fu sion , 20 g dextrose, and 15 g agar in 1 L water. Heat
0004-5756/81/6406-1465-05Î01.00© Association of Official Analytical Chemists, Inc,
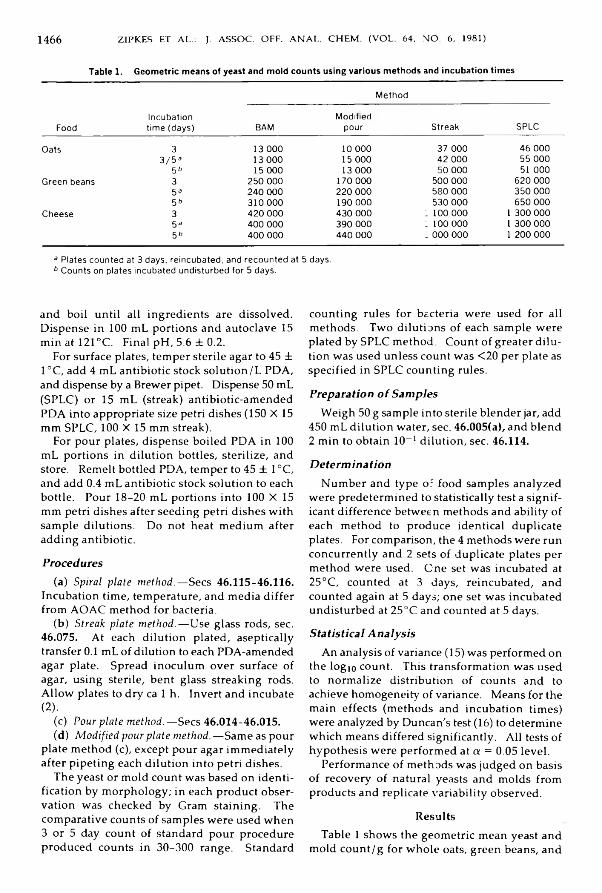
1 4 6 6 ZIPKES ET AL.: J. ASSOC. OFF. ANAL. CHEM . (VOL. 64, NO. 6, 1981)
Table 1. Geometric means of yeast and mold counts using various methods and incubation timesMethod
FoodIncubation time (days) BAM
Modifiedpour Streak SPLC
Oats 3 13 000 10 000 37 000 46 0003 /5 a 13 000 15 000 42 000 55 000
56 15 000 13 000 50 000 51 000Green beans 3 250 000 170 000 500 000 620 000
5a 240 000 220 000 580 000 350 0005 " 310 000 190 000 530 000 650 000
Cheese 3 420 000 430 000 : ioo ooo 1 300 0005a 400 000 390 000 : iooooo 1 300 0005 b 400 000 440 000 : ooo ooo 1 200 000
a Plates counted at 3 days, reincubated, and recounted at 5 days. b Counts on plates incubated undisturbed for 5 days.
and boil until all ingred ien ts are d isso lved . D isp en se in 100 mL portions and autoclave 15 m in a t l2 1 ° C . Final pH , 5.6 ± 0.2.
For surface plates, tem per sterile agar to 45 ± 1°C, add 4 mL antibiotic stock so lu tion /L PDA, and dispense by a Brewer pipet. D ispense 50 mL (SPLC) or 15 mL (streak) antibiotic-am ended PDA into appropriate size petri dishes (150 X 15 mm SPLC, 100 X 15 mm streak).
For pour plates, d ispense b oiled PDA in 100 mL portions in d ilu tion bottles, sterilize , and store. Rem elt bottled PDA, tem per to 45 ± 1 °C, and add 0.4 mL antibiotic stock solu tion to each bottle. Pour 18-20 mL portions into 100 X 15 mm petri d ishes after seed in g petri d ish es w ith sam ple d ilu tions. Do not heat m edium after addin g antibiotic.Procedures
(a) Spiral p la te m eth od .—Secs 46.115-46.116. Incubation tim e, tem perature, and m edia differ from AO AC m ethod for bacteria.
(b) Streak p la te m eth od .— U se glass rods, sec. 46.075. At each d ilu tion plated, aseptically transfer 0.1 mL of dilution to each PDA-am ended agar plate. Spread inocu lum over surface o f agar, u sin g sterile, bent glass streaking rods. A llo w plates to dry ca 1 h. Invert and incubate (2).
(c) Pour p la te m eth od .—Secs 46.014-46.015.(d) M odified pour p la te m ethod. —Same as pour
plate m ethod (c), except pour agar im m ediately after p ipetin g each d ilu tion in to petri dishes.
The yeast or m old count w as based on id en tification by m orphology; in each product observation w as checked by Gram stain ing. The com parative counts of sam ples w ere used w h en 3 or 5 day count of standard pour procedure produced counts in 30-300 range. Standard
counting rules for bacteria w ere used for all m ethods. Two d ilu tions o f each sam ple w ere plated by SPLC m ethod. Count o f greater d ilu tion was used u n less count w as <20 per plate as sp ecified in SPLC counting rules.Preparation of Samples
W eigh 50 g sam ple into sterile b lender jar, add 450 mL d ilu tion water, sec. 46.005(a), and b len d 2 m in to obtain 10_I d ilu tion , sec. 46.114.Determination
N um ber and type o f food sam ples analyzed w ere predeterm ined to statistically test a s ig n ificant d ifference betw een m ethods and ability of each m ethod to produce identical duplicate plates. For comparison, the 4 m ethods w ere run concurrently and 2 sets of duplicate plates per m ethod w ere used. C n e set w as incubated at 25°C, counted at 3 days, reincubated, and counted again at 5 days; on e set w as incubated undisturbed at 25°C and counted at 5 days.Statistical Analysis
An analysis o f variance (15) was perform ed on the logio count. This transform ation w as used to norm alize distribution o f counts and to achieve hom ogeneity of variance. M eans for the m ain effects (m ethods and incubation tim es) were analyzed by Duncan's test (16) to determ ine w h ich m eans differed significantly. A ll tests of h yp oth esis w ere perform ed at a = 0.05 level.
Perform ance o f m ethods w as judged on basis of recovery o f natural yeasts and m olds from products and replicate variability observed.
ResultsTable 1 sh ow s the geom etric m ean yeast and
m old co u n t/g for w h o le oats, green beans, and
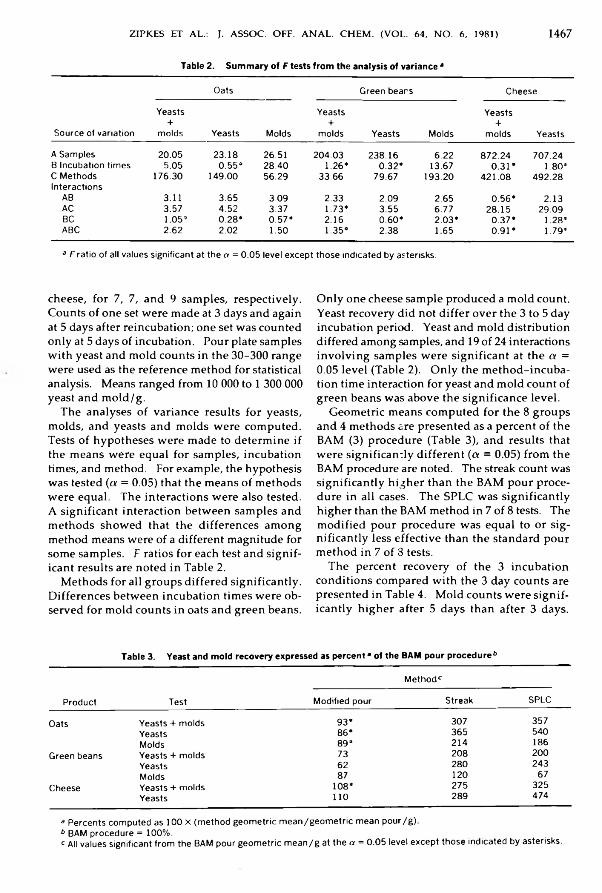
ZIPKES ET AL.: J. ASSOC. OFF. ANAL. CH EM . (VOL. 64, N O . 6, 1981) 1 4 6 7
Table 2. Summary of F tests from the analysis of variance *Oats Green bears Cheese
Source of variationYeasts
+molds Yeasts Molds
Yeasts+
molds Yeasts MoldsYeasts
+molds Yeasts
A Samples 20.05 23.18 26.51 204.03 238.16 6.22 872.24 707.24B Incubation times 5.05 0.55* 28.40 1.26* 0.32* 13.67 0.31* 1.80*C Methods 176.30 149.00 56.29 33.66 79.67 193.20 421.08 492.28Interactions
AB 3.11 3.65 3.09 2.33 2.09 2.65 0.56* 2.13AC 3.57 4.52 3.37 1.73* 3.55 6.77 28.15 29.09BC 1.05* 0.28* 0.57* 2.16 0.60* 2.03* 0.37* 1.28*ABC 2.62 2.02 1.50 1.35* 2.38 1.65 0.91* 1.79»3 F ratio of all values significant at the a = 0.05 level except those indicated by asterisks.
cheese, for 7, 7, and 9 sam ples, respectively . Counts o f on e set w ere m ade at 3 days and again at 5 days after reincubation; one set w as counted on ly at 5 days o f incubation. Pour plate sam ples w ith yeast and m old counts in the 30-300 range w ere used as the reference m ethod for statistical analysis. M eans ranged from 10 000 to 1 300 000 yeast and m o ld /g .
The analyses o f variance results for yeasts, m olds, and yeasts and m olds w ere com puted. Tests o f hyp oth eses w ere m ade to determ ine if the m eans w ere equal for sam ples, incubation times, and m ethod. For example, the hypothesis w as tested ( a = 0.05) that the m eans o f m ethods w ere equal. The interactions w ere also tested. A sign ifican t interaction b etw een sam ples and m ethods sh ow ed that the d ifferences am ong m ethod means were of a different m agnitude for som e sam ples. F ratios for each test and s ig n ificant results are noted in Table 2.
M ethods for all groups d iffered sign ificantly . D ifferences b etw een incubation tim es w ere observed for m old counts in oats and green beans.
O nly on e cheese sam ple produced a m old count. Yeast recovery did not d iffer over the 3 to 5 day incubation period. Yeast and m old distribution differed am ong samples, and 19 of 24 interactions in v o lv in g sam ples w ere sign ifican t at the a = 0.05 lev el (Table 2). O nly the m eth od -in cu b ation tim e interaction for yeast and m old count of green beans w as above the s ign ifican ce level.
G eom etric m eans com puted for the 8 groups and 4 m ethods are presented as a percent o f the BAM (3) procedure (Table 3), and results that w ere sign ifican tly d ifferent ( a = 0.05) from the BAM procedure are noted. The streak count was sign ifican tly h igh er than the BAM pour procedure in all cases. The SPLC w as sign ifican tly higher than the BAM m ethod in 7 o f 8 tests. The m odified pour procedure w as equal to or s ig n ifican tly less effective than the standard pour m ethod in 7 o f 8 tests.
The percent recovery of the 3 incubation conditions com pared w ith the 3 day counts are presented in Table 4. M old counts w ere s ig n ificantly h igh er after 5 days than after 3 days.
Table 3. Yeast and mold recovery expressed as percent3 of the BAM pour procedure6Method6
Product Test Modified pour Streak SPLC
Oats Yeasts + molds 93* 307 357Yeasts 86* 365 540Molds 89* 214 186
Green beans Yeasts + molds 73 208 200Yeasts 62 280 243Molds 87 120 67
Cheese Yeasts + molds 108* 275 325Yeasts 110 289 474
3 Percents computed as 100 x (method geometric mean/geometric mean pour/g).6 BAM procedure = 100%.c All values significant from the BAM pour geometric mean/g at the a = 0.05 level except those indicated by asterisks.

1 4 6 8 ZIPKES ET AL.: J. ASSOC. OFF. ANAL. CHEM . (VOL. 64, N O . 6, 1981)
Table 4. Yeast and mold counts expressed as a percent of 3-day incubation geometric means/g *Incubation time (days)
Product Test 3 / 5 b 5 cOats Yeasts + molds 118d 123d
Yeasts 108 108Molds 157d 157d
Green beans Yeasts + molds 94 112Yeasts 106 112Molds 143d 150d
Cheese Yeasts + molds 100 99Yeasts 101 107
a Counts at 3 days = 100%.6 Plates counted at 3 days, reincubated, and recounted at 5 days. c Counts on plates incubated undisturbed 5 days.d Significant from the BAM 3-day geometric mean/g at the a = 0.05 level.
There w as no sign ificant change in yeast counts b etw een 3 and 5 day incubation data.
Both surface plate procedures w ere superior to the pour plate in recovery and in replicate variation. Table 5 sh ow s the replicate error for the 4 procedures and 3 products. The SPLC m ethod had the low est variance expressed in logio counts. O verall estim ates o f variance for the pour, m odified pour, and streak procedures w ere 4.5, 6.1, and 2.8, respectively , tim es the SPLC estim ate; som e o f the variation, how ever, w as due to spreading m old colonies. Variations o f 55% o f oat counts and 35% of green bean counts were due to molds. Duplicate plates were uncountable because o f spreaders in 3.4, 5.3, 2.4, and 4.8% of the values for pour, m odified pour, streak, and SPLC, respectively .
DiscussionThe com parison o f 4 m ethods sh ow ed that
both surface plate techniques gave higher counts than pour m ethods. Recoveries by streak plates w ere 2 -3 tim es h igh er than by the BAM (3) procedure. Recovery values ranged from 2 to 3.7 tim es h igh er than the BAM (3) for the SPLC. A lthough a prelim inary study indicated that the
m odified pour plate procedure w ou ld increase the recovery, presented data sh ow the o p p osite.
The spreading characteristics of yeasts and particularly m olds m ade the co lon ies o f these m icroorganism s m ore d ifficu lt to count than bacterial colonies. The variances show n in Table 5 correspond to the am ounts o f m old fou n d in the products. There w ere m ore m olds and a larger variance in oats than in green beans. C heese w ith no m old had the low est variance. The variance valu es for SPLC w ere less than those o f other m ethods in all cases (0.00795; 69 degrees o f freedom ). This low er variance w as probably due to the m echanically controlled dep osition o f the inoculum , w h ich resulted in a decreasing density o f co lonies from the center o f the agar plate. Thus, on each plate the area counted was the low er d en sity area w ith m ore w id ely separated colonies. A lthough spreaders w ere a problem , the in cid ence o f uncountable plates did not differ for the sam ples and m ethods exam ined in this study.
The present study confirm s previous work on incubation tim es. If m olds are suspected in a sam ple, a 5 day count is desirable u n less the
Table 5. Estimates of replicate yeast and mold error for 3 foods and 4 proceduresProcedure
FoodBAMpour Modified
pour Streak SPLCOats 0.02698 (21)a 0.02808(21) 0.02949 (21) 0.00962(21)Green beans 0.07855(21) 0.12004(21) 0.02840(21) 0.01118(21)Cheese 0.00975 (27) 0.00894 (27) 0.01269 (27) 0.00415(27)Pooled variance
for procedures0.03593 (69) 0.04858 (69) 0.02258 (69) 0.00795 (69)
Numbers in parentheses = degrees of freedom.
ZIPKES ET AL.: J. ASSOC. OFF. ANAL. CHEM . (VOL. 64, N O . 6, 1981) 14 69
plates are overgrow n. Products that contain o n ly yeast cou ld be incubated for just 3 days.
The spiral p latin g m ethod w as the m ethod of choice for recovery and enum eration o f yeasts and molds. The recovery was 2-3.7 tim es that of the BAM (3) procedure and the variance w as 22% that o f the BAM (3). W ith th e streak m ethod, sam ple distribution on th e plates w as ev en , but yeast and m old grow th w as denser a lon g the edges of the petri dishes, and plates were difficult to count. The spiral plater dispensed decreasing am ounts o f sam ple on the plates, visual id en tification w as im proved, and selection o f co lonies for further testin g w as easier.
References(1) Standard Methods for the Examination of Dairy
Products (1978) 14th Ed., American Public Health Association, Washington, DC
(2) Official Methods of Analysis (1980) 13th Ed., AOAC, Arlington, VA, secs 46.005,46.014-46.015,46.075, 46.110-46.111,46.113-46.116
(3) Bacteriological Analytical Manual (1978) 5th Ed., AOAC, Arlington, VA, Chap. XVIII Parts A, C2 and 3; Chap. XVII pp. 1-3; Appendix p. A-42, medium A65
(4) Shadwick, G. W„ Jr (1938) Food Res. 3, 287-298(5) Mossel, D. A. A., Kleynen-Semmeling, A. M. C.,
Vincentie, H. M„ Beereus, H., & Catsaras, M. (1970) J. Appi. Bacteriol. 33, 454-457
(6) Mislivec, P. B., & Bruce, V. R. (1976) J. Assoc. Off. Anal. Chem. 59, 720-721
(7) Blaser, P. (1978) Zentralbl. Bakteriol. I. Orig. B. 167, 146-164
(8) Mislivec, P. B., Bruce, V. R., & Andrews, W. H. (1979) Appi. Environ. Microbiol. 37, 567-571
(9) Sharpe, A. N., & Jackson, A. K. (1972) J. Appi. Bacteriol. 35, 681-684
(10) Gilchrist, J. E., Campbell, J. E., Donnelly, C. B., Peeler, J. T., & Delaney, J. M. (1973) Appi. Microbiol. 25,244-252
(11) Kramer, J. M„ Kendall, M„ & Gilbert, R. J. (1979) Eur. J. Appi. Microbiol. Biotechnol. 6, 289-299
(12) Gilchrist, J. E., Donnelly, C. B., Peeler, J. T., & Campbell, J. E. (1977) J. Assoc. Off. Anal. Chem. 60, 807-812
(13) Peeler, J. T., Gilchrist, J. E., Donnelly, C. B., & Campbell, J. E. (1977) J. Food Prot. 40, 462-464
(14) Thatcher, F. A. (Ed.) (1974) Microorganisms in Foods: Sampling for Microbiological Analysis 2, University of Toronto Press, Toronto, Canada
(15) Ostie, B., & Mansing, R. W. (1975) Statistics in Research, 3rd Ed., Iowa State University Press, Ames, IA
(16) Duncan, D. B. (1955) Biometrics 11,1-42
1 4 7 0 HA CH É ET AL.: J. ASSOC. OFF. ANAL. CHEM . (VOL. 64, N O . 6, 1981)
T E C H N I C A L C O M M U N I C A T I O N S
Fast Cleanup of Difficult Substrates for Determination of Fenitrothion and Some DerivativesPATRICK HACHÉ, RENÉ MARQUETTE, GILLES VOLPÉ, and VICTORIN N. MALLET1Université de Moncton, Chemistry Department, Moncton, New Brunswick, Canada E1A 3E9
A simple method is described for the fast recovery of fenitrothion, an organophosphorus insecticide, from soil, chicken liver, urine, clams, and pine needles. The substrate is homogenized with acetonitrile or methanol, diluted with water, and passed through a column containing Amberlite XAD-7. Fenitrothion is recovered quantitatively by eluting with 4 portions of 25 m l ethyl acetate. After evaporation, the compound is determined quantitatively by gas-liquid chromatography with a flame photometric detector. The procedure is also suitable for some derivatives of fenitrothion, namely, fenitrooxon and S-methyl- fenitrothion. As low as 0.05 ppm of the parent compound may be determined.
The chem ical insecticide fen itroth ion [ 0 ,0 - d im eth y l - O - (3 -m eth y l- 4 - n itro p h en o l)p h o s- phorothioate] has been used on an almost annual basis to control spruce budw orm (Choristoneura fum iferana C lem ens) ep id em ics in eastern Canada. A s a result, the chem ical has been detected in several environm ental substrates such as soil, p in e n eed les, and so ftsh ell clam s (1). T oxicologists studying its degradation in rats have had to analyze urine and liver specim ens (2).
The d evelop m en t of the flam e photom etric detector (FPD) has greatly sim p lified the task of an alyzin g phosphorus-contain ing pesticides by requiring less rigorous cleanup procedures prior to gas-liquid chrom atography (GLC). N everth eless , w h en d ifficu lt substrates are in vo lved , cleanup still rem ains tedious and tim e-consum in g . For instance, in on e particular m ethod (3) for the quantitative determ ination o f fen itroth ion in p in e n eed les or sh ellfish , the substrate (about 10 g) is macerated w ith eth y l acetate and centrifuged, and the supernate is extracted w ith hexane in the presence o f acetonitrile. The extract is then purified by passage through a co lum n contain ing activated Florisil, and the eluate is evaporated to a suitable vo lu m e before injection in to a gas-liquid chrom atograph. In an
1 A ddress correspondence to th is author.Received Decem ber 23,1980. Accepted May 28,1981.
other procedure (4), the substrate is m ixed w ith acetonitrile, fo llow ed successively by extraction w ith hexane and charcoal colum n cleanup. W ith each m ethod, an average o f 2 sam ples per day can norm ally be processed.
T his paper describes a m ethod for recovering fen itroth ion and som e degradation products from difficult substrates, using Am berlite XAD-7 resin . The proposed m ethod considerably shortens the com plexity of the cleanup step, and the tim e required for a com plete analysis is less than 2 h.
M ETH O DReagents and Apparatus
(a) P esticide standards. —Prepare standard solu tion s and d ilu tion s in m eth ylen e chloride (pesticide grade): fen itroth ion (Forest Protection Ltd, Fredericton, NB, Canada), fen itrooxon (Chem agro Ltd, Kansas City, MO), S-m ethyl- fenitrothion and am inofenitrothion (synthesized according to literature (5)).
(b) A m b erlite X A D res in s .— British D rug H ou ses, Toronto, Canada. Prepare co lum ns according to literature (6).
(c) Gas chrom atograph.—Perkin-Elm er M odel 3920 equ ipped w ith flam e ion ization detector (FID) and flam e photom etric detector (FPD). U se glass colum n, 183 X 0.64 cm (id) conta in ing 3.6% OV-101 + 5% OV-210. Instrument settings, for fenitrothion only: colum n, 210°C; injection port, 250°C; interface, 250°C; n itrogen carrier gas, 60 m L/m in. For separating fenitrothion and derivatives, set colum n tem perature at 190°C.Extraction and Concentration
Macerate 100 g clams (obtained locally), using 'P o ly tron m ixer (Brinkm ann Instru m ents, Rexdale, Canada). H om ogenize 10 g subsam ple w ith 150 mL acetonitrile in W aring B lendor 5 m in, filter through Whatman N o. 202 paper, and rinse w ith acetonitrile. Dilute filtrate to 2 L w ith d istilled water and pass through XAD-7 colum n at 130 m L /m in . Wash colum n w ith 1 L d istilled
0004-5756/ 8 1 / 6406-1470-04$01.00© Association of Official Analytical Chemists, Inc.

H A C H E ET AL.: J. ASSOC. OFF. ANAL. CHEM . (VOL. 64, N O . 6, 1981) 1471
Table 1. Recovery (%) of fenitrothion from difficult substrates by using acetonitrile and Amberlite XAD-7
Substrate3Concn,ppm6
Recovery,%
Soil 0.5 99, 93, 100Chicken liver 5.0 106, 101, 100, 112Male human urine3 0.5 100,98, 102, 100Softshell clams 5.0 100, 102, 107Pine needles 5.0 100, 100, 100. 102, 100, 102,
100
3 Final concentrate was light gold; up to 5 peaks were detected with FID (pine needles), while only one extraneous peak was detected with FPD.
6 Final volume was 50 mL.c Initial volume was 100 mL, diluted to 2 L.
water; then elute w ith four 25 mL portions of eth y l acetate at sam e flow rate. Concentrate el- uate to desired volu m e (50 or 5 mL) for GLC.Fortification Procedure
Fortify substrates w ith appropriate standards at desired concentration prior to h om ogen izin g step.Gas Chromatography and Quantitative Analysis
Inject 5 pL aliquots o f appropriate standard solutions in GLC system and establish calibration curve. Inject 5 pL aliquot o f final concentrated extract. Inject standard corresponding to approxim ate relative concentration. Calculate concentration d irectly from peak heights.
R esu lts and D iscu ssionThe in ten tion in this study w as to d evelop a
fast and effic ien t procedure for the quantitative recovery o f fen itroth ion (and som e derivatives) from d ifficu lt substrates, usin g A m berlite XAD resins. Previous stu d ies (7) had revealed that fen itroth ion could be recovered quantitatively from w ater by usin g an XAD-4 colum n. It was reasoned that if a d ifficu lt substrate could be transform ed into a suitable "aqueous extract," then rapid colum n cleanup w ou ld be possible. This was achieved by diluting the original extract to 2 L w ith w ater to m in im ize the so lven t effect on the solu te percolating d ow n the colum n.
The first step in v o lv ed choosing a suitable extraction solvent, preferably one m iscible w ith water. The fo llo w in g so lven ts w ere tested; acetone, aceton itrile , m eth an ol, 2-propanol, water, eth y l acetate, ethanol. For com parison purposes, p in e n eed les w ere used, th e initial extract w as d ilu ted to 2 L w ith water, and the aqueous so lu tion w as passed through an XAD-4
Figure 1. GLC chromatograms of fenitrothion in extract of pine needles with FID and FPD, respec
tively (F = fenitrothion).
colum n w h ich was then eluted w ith three 30 mL portions o f ethyl acetate. The initial extract was cleaner w ith acetonitrile or m ethanol (as determ ined by GLC w ith FID) and the form er w as used for all extractions at the 5 ppm level, but, as shall be discussed later, m ethanol w as more suitable at very low concentrations.
The second step w as to choose a proper resin. In previous studies (8) XAD-2, XAD-4, and XAD-7 had been prom ising. A m berlite XAD-7 w as chosen because o f better cleanup (as determ ined by FID) and increased recovery. Finally, a proper elu tion so lven t had to be selected . Ethyl acetate had been used successfu lly before but other solvents, nam ely, toluene, chloroform , m eth ylen e ch loride, and b en zen e w ere tested. Ethyl acetate w as fin a lly chosen because o f reproducible recoveries, a lthough goo d results w ere also obtained w ith m eth y len e ch loride or chloroform . The latter so lven t g iv es m ore com p lete recoveries but its use w as abandoned because o f the potential health hazard.
O ther experim ental con d ition s w ere optim ized. In general, reproducibility w as better w ith a 12 cm XAD colum n, a lth ou gh a shorter colum n could be used w ith less d ifficu lt sub-

1 4 7 2 H A C H É ET AL.: J. ASSOC. OFF. ANAL. CHEM . (VOL. 64, N O . 6, 1981)
Table 2. Simultaneous recovery of fenitrothion and derivatives (%) from various substrates by using acetonitrile andAmberlite XAD-7Fenitrothion, Fenitrooxon, S-Methyl-fenitrothion, Aminofenitrothion,
Substrate 5 ppm 50 ppm 50 ppm 10 ppmSoftshell clams3 94 89 102 0
107 83 102 .0Pine needles3 79 67 75 0
83 70 84 05 ppb 50 ppb 50 ppb 10 ppb
Waterb 94 100 98 9693 97 95 94
3 Final volume 50 mL.6 One liter passed directly through column.
strates such as urine and water. Initial d ilu tion to 2 L w as preferred because o f im proved recovery. W ashing w ith 1 L w ater did im prove cleanup of the final sample. Additional cleanup such as hexane an d /o r Florisil treatm ent (a Flo- risil colum n cleanup before the XAD colum n) w as an im provem ent but at the expense of time.
O verall, m ore than 100 experim ents w ere perform ed before the extraction procedure d escribed herein w as finally accepted. W ith this procedure, excellent recoveries were obtained for fenitrothion in soil, softshell clams, chicken liver, urine, and pine needles (Table 1). An idea of the reproducibility o f the technique can also be obtained from the data in Table 1. For instance, w ith p in e n eed les a standard d eviation of on ly ±1.08 may be calculated.
The degree of clean lin ess o f the final extract can be better appreciated by look in g at the GLC chromatograms presented in Figure 1. U sing the FID, on ly a few peaks appear w ith a sam ple of
Table 3. Recovery (%) of fenitrothion from difficult substrates by using methanol and Amberlite XAD-7
SubstrateConcn, ppm
0.5
a
0.05Soil 95 99
100 95100Pine needles 96 8899 86Male human urine 95 94
103 90Softshell clams 92 8998 92Chicken liver 85 7088 75
3 Final volume 5 mL.
pine needles. Similar results w ere obtained w ith the other substrates. W ith FPD, the chrom atogram sh ow s on ly the peak for fen itroth ion (see Figure 1) w ith ou t interference from co-extractives. The colum n temperature was set at 210°C to speed the separation.
The m ethod is also acceptable for a m ixture of fenitrothion and derivatives such as fenitrooxon and S-m ethylfenitrothion in pine needles, water, and so ftsh ell clams although recoveries for fen itrothion in p in e n eed les w ere som ew hat low er
Figure 2. GLC chromatograms of fenitrothion and 3 derivatives extracted from water. AM = amino- fenitrothion; F = fenitrothion; FO = fenitrooxon;
SMF = S-methylfenitrothion.
H A C H E ET AL.: J. ASSOC. OFF. ANAL. CHEM . (VOL. 64, N O . 6, 1981) 1 4 73
than anticipated. A m inofenitroth ion could not be extracted from either so ftsh ell clam s or p in e n eed les (Table 2) for reasons unkn ow n. Typical GLC chrom atogram s sh o w in g fen itroth ion and th e 3 derivatives extracted from w ater and soft- shell clams are depicted in Figure 2. The colum n tem perature w as low ered at 190°C to im prove resolution. The chromatograms dem onstrate the absence o f interfering co-extractives and good resolu tion o f the peaks. The separation o f fen itrothion by GLC, from k n ow n derivatives, has b een reported in the literature (9).
Som e o f the experim ents w ere in itially carried ou t at h igh er concentrations (0.5 or 5.0 ppm ) to estab lish optim um experim enta l con d ition s w ithout fear of not detecting the solute. Further experim ents at low er concentrations confirm that th e m eth od is acceptable (Table 3). M ethanol instead o f acetonitrile w as used as extraction solven t because of better overall recoveries at the 0.05 ppm level.
The entire procedure from extraction o f a substrate to injection in to the chrom atograph requires approxim ately 1 lU h , w h ich is con sid ered to be an im portant im provem en t in tim esaving.
AcknowledgmentThe authors thank Environm ent Canada and
the Conseil de Recherches de l'U n iversité de Moncton for financia l support.
References(1) Varty, I. W. (1989) Environmental Surveillance in Neiv
Brunswick (1978-1979), Department of Forest Resources, University of New Brunswick, Fredericton, NB, Canada
(2) Trottier, B„ Fraser, A. R„ Planet, J., & Ecobichon, D.J. (1980) Toxicology 17,29-38
(3) Grift, N., & Lockhart, W. L. (1974) /. Assoc. Off. Anal. Chem. 57,1282-1284
(4) Sundaram, K. M. S. (1974) "Distribution and Persistence of Fenitrothion Residues in Foliage, Soil and Water in Larose Forest," Chemical Control Research Institute, Report No. CCX64, Ottawa, Ontario, Canada
(5) Kovacicova, ]., Batra, V., & Truchlik, S. (1973) Pestic. Sci. 4, 759-764
(6) Mallet, V. N., Brun, G. L„ MacDonald, R. N., & Berkane, K. (1978) J. Chromatogr. 160,81-88
(7) Mallet, V. N., Francoeur, J. M„ & Volpé, G. (1979) J. Chromatogr. 172,388-393
(8) Volpé, G., & Mallet, V. N. (1979) /. Chromatogr. 177, 385-389
(9) Volpé, G., & Mallet, V. N. (1980) Intern. J. Environ. Anal. Chem. 8, 291-301
1474 BLACK ET AL.: J. ASSOC. OFF. ANAL. CHEM (VOL. 64, NO. 6. 1981)
Gas-Liquid Chromatographic-Thermal Energy Analyzer Method for N-Nitrosodiethanolamine in CosmeticsDONALD B. BLACK, ROBERT C. LAWRENCE, EDWARD G. LOVERING, and JAMES R. WATSON1Health and Welfare Canada, Bureau of Drug Research, Health Protection Branch,Tunney's Pasture, Ottawa, Ontario, Canada K1A 0L2A gas-liquid chromatography-thermal energy analyzer (GLC-TEA) method has been developed for the quantitation of N-nitrosodiethanolamine (NDELA) in a variety of cosmetic products. Samples are cleaned up by a preliminary shakeout of an aqueous mixture of the cosmetic with ethylene dichloride, followed by removal of other polar and nonpolar constituents from the aqueous layer with commercial extraction columns, separation cartridges, and selected solvents. Common transnitrosating 1,3-diol preservatives sometimes found in cosmetics were eliminated after conversion to less polar cyclic bo- ronates. The isolated NDELA fraction was tri- methylsilylated at room temperature and the product was subjected to GLC-TEA, with N,N'-dinitrosopi- perazine (DNPiz) used as the internal standard. Recoveries of NDELA from spiked samples usually ranged from 60 to 90%. The limit of detectability was about 5-10 ppb. The identity of NDELA was confirmed by GLC-mass spectrometry.
Since the d iscovery by Fan et al. (1) o f the carcin ogen ic com pound N -n itrosod ieth an olam in e (NDELA) (2) in som e cosm etic products form ulated w ith di- a n d /o r triethanolam ine, several investigations have been carried out to establish the nature and source o f the nitrosating agent. R ecent studies (3) have sh ow n that the antim icrobial agent 2-brom o-2-n itro-l,3-propanediol (BNPD) can nitrosate both di- and triethanolam ine in alkaline media, presumably by liberating nitrite ion w h ich then attacks ethan olam ine to form NDELA. Sim ilar results and conclusions w ere reached by O ng and Rutherford (4). Fan et al. (1) exam ined a total o f 31 cosm etics, hand and body lotions, and hair sham poos for NDELA and found lev e ls w h ich varied from 1 to 48 000 ppb, the latter in a facial cosm etic. Later studies conducted at the U.S. Food and Drug A d m in istration (5) sh ow ed that, of 317 cosm etic products analyzed for NDELA contam ination, 22 exh ibited lev els above 2000 ppb; the h igh est values w ere fou n d for preparations that conta ined di- or triethanolam ine or a derivative thereof and
1 Address correspondence to th is author.Received M arch 23, 1981. Accepted June 10,1981.
the preservative BNPD. These data coupled w ith the dem onstrated absorption o f NDELA across the skin and d etection in the urine (6) in dicate the need for a sen sitive, specific, and robust m ethod for the detection and quantitation of NDELA in a w id e variety o f cosm etic m atrices.
This paper presents a gas-liquid chrom atographic-therm al energy analyzer (GLC-TEA) m ethod w h ich involves a relatively rapid sam ple cleanup sequence, fo llo w ed by elu tion o f the ND ELA as the tr im eth y ls ily l d er iv a tiv e (NDELA-TMS), and quantitation to the low ppb level w ith reference to N ,N '-dinitrosopiperazine (D N P iz) as internal standard. GLC-m ass sp ectroscopy (MS) is used for NDELA id en tity con firm ation as required.
M E T H O DApparatus
(a) G as-liquid ch rom atograph -th erm al en ergy an a lyzer (G L C -T E A ).— H ewlett-Packard M odel 5840 A recording gas chrom atograph interfaced to Therm o Electron Corp. M odel 502 therm al energy analyzer. GLC system was equ ipped w ith a 3.05 m (10 ft) X 4.0 mm id glass colum n packed w ith 3% OV-225 on 80-100 m esh Chro- m osorb WHP. D etector en d o f co lum n w as connected w ith a short len g th o f nick el 200 tubin g (1.6 m m od X 0.5 mm id , ca 10 cm) to in let side o f a sta in less steel, gas-lin ed heated co llection ven t (H ew lett Packard option C-68). T em perature o f co llection v en t w as controlled by GLC keyboard through an auxiliary heating circuit card (H ew lett Packard part 18858-B). Exit port o f ven t assem bly w as interfaced to TEA system w ith 4 cm length o f nickel 200 tubing (2.0 mm id) wrapped w ith heating tape and kept at tem perature su ffic ien t to m aintain optim um peak shape and TEA response. TEA output s ig nal w as m atched to inp u t o f data processor by m eans o f a 10 V to 1 V resistive attenuator and an A /D converter un it (H ew lett Packard part 18871-A). TEA attenuation w as 2048.
O perating conditions: argon carrier gas 20 m L /m in; injector 240°C; co llection v en t 240°C;
0004-5756/81 /6406-1474-05$01.00© Association of Official Analytical Chemists, Inc.
BLACK ET AL.: J. ASSOC. OFF. ANAL. CH EM (VOL. 54, N O . 6, 1981) 1475
column programmed from 180°C for 6.5 min to 240°C at 7° / min, held for 2.5 min; TEA pyrolyzer 475°C; attenuation on data processor X8. TEA stainless steel cold trap was immersed in a 1 L cryogenic stainless steel Dewar flask (Fisher Scientific Ltd) half-filled with liquid nitrogen (—195°C).
(b) R o ta ry ev a p o ra to r .— Buchi Rotavapor-R (Fisher Scientific Co. Ltd, Montreal, Quebec, Canada).
(c) Centrifuge.—Clinical centrifuge, IEC Model 428, 3300 rpm maximum (Central Scientific Co. of Canada Ltd, Mississauga, Ontario, Canada).Reagents
(a) M e th y l e th y l keton e.—Distilled in glass (Burdick & Jackson Laboratories, Inc., Muskegon, MI).
(b) E th ylen e d ich lo rid e .—Distilled in glass (Burdick & Jackson Laboratories, Inc.).
(c) A ceto n itr ile .—Distilled in glass (Caledon Laboratories Ltd, Georgetown, Ontario, Canada).
(d) Sodium -L-ascorbate.—Sigma Chemical Co., St. Louis, Mo.
(e) 1-Butaneboronic a c id .—Aldrich Chemical Co., Montreal, Quebec, Canada.
(f) S ily la tin g a g e n t.—N,0-Bis(trimethyl- silyl)-acetamide (BSA) (Chromatographic Specialties, Brockville, Ontario, Canada).
(g) D isposable extraction colu m ns.—20 mL Clin Elut, manufactured by Analytichem International, Harbor City, CA (Fisher Scientific Co., Ltd, Ottawa, Ontario, Canada) or Preptube Cartridges, type 117 (Thermo Electron Corp., Waltham, MA).
(h) Silica cartridges.—Sep-Pak (Waters Scientific Ltd, Mississauga, Ontario, Canada).Solutions
(a) Stock nitrosam ine solu tions.—NDELA in ethanol (100 p g /m L ) and DNPiz in acetone (100 p g / m h ) (Thermo Electron Corp.). These materials are reported to be carcinogenic.
(b) Internal stan dard so lu tion .—DNPiz in acetonitrile (1.00 jtig/mL) prepared by diluting stock solution. Keep in septum-sealed vial protected from light.
(c) Spiking so lu tion .—NDELA in ethylene dichloride (1.00 p g l mL) prepared by diluting stock solution. Keep in septum-sealed vial protected from light.
(d) Calibration solu tion.—Dispense exactly 1.00 mL (1.00 p g NDELA) spiking solution by syringe into 50 mL round-bottom flask and remove solvent by rotary evaporation (bath at 40°C). Treat
residue w ith 0.3 mL BSA and 1.00 mL internal standard solution. Let react at room temperature 15 m in w ith frequent agitation. Prepare fresh daily and protect from light.G L C -T E A S y s t e m a n d L in e a r i t y C h e c k
U sing m ethod described above for preparation of calibration solu tion , make 5 standard so lu tions, using exactly measured volum es of spiking so lu tion equ ivalent to about 0 .5 ,1 ,3 , 5, and 7 p g NDELA. Inject 8 p L of each silylated solution in duplicate in to GLC-TEA system and com pute m ean relative response factor, relative to internal standard, and its relative standard deviation . Latter va lu e sh ou ld n ot exceed ±2.5%. U nder tem perature program con d ition s stated, reten tion tim es for NDELA and internal standard sh ou ld be ca 4.4 and 12.5 m in, respectively . A ll peaks sh ou ld be sharp and off-scale (except for NDELA in the 0.5 p g standard so lu tion ) and baseline should exhibit no significant rise during17.6 m in run.P r o c e d u r e
Accurately w e ig h ca 2 g cosm etic product and ca 50 m g sodium ascorbate into 25 mL screw-cap tube (125 X 20 mm). P ipet 3.0 mL w ater (d eion ized and residue-free) in to tube. A dd ca 1 g NaCl and 0.1 mL glacial acetic acid to aqueous m ixture and shake vigorously by hand for 3 m in w ith 15 mL eth y len e d ich loride. C entrifuge m ixture 10 m in. If upper aqueous layer is not clear or not w e ll separated, add additional 0.2 mL acetic acid, shake, and recentrifuge.
W ith Pasteur p ipet, carefully transfer entire upper aqueous layer to C lin Elut colum n and let soak in 5 m in. Elute NDELA from colum n by passing fiv e 20 mL portions o f m eth y l e th y l keton e through colum n, w a itin g at least 4 m in betw een additions. S low ly pass com bined eluates through silica Sep-Pak cartridge, fitted to 50 mL Luer-Lok glass syringe, in to round-bottom flask. Pass additional 10 mL m eth yl eth y l keton e throu gh Sep-Pak in to round-bottom flask.
Evaporate m eth yl eth y l k eton e so lu tion to ca 20 mL on rotary evaporator (water bath m aintained at 40°C). A dd ca 25 m g 1-butaneboronic acid, let m ixture react 15 m in at 40°C and evaporate solu tion to dryness on rotary evaporator. D isso lve residue in 50 mL eth y len e d ich loride w ith vigorous shaking and pass solution through fresh silica Sep-Pak cartridge; discard eluate. Elute trapped NDELA from cartridge w ith 15 mL anhydrous ethan ol in to 50 mL round-bottom flask and rem ove solven t on rotary evaporator at 40 °C.

1476 BLACK ET AL.: J. ASSOC. OFF. ANAL. CH EM (VOL. 64, N O . 6, 1981)
React residue in flask w ith 0.3 mL BSA and 1.00 mL internal standard so lu tion at room tem perature for 15 m in. Inject 8 pL calibration solu tion and sily lated sam ple so lu tion into GLC-TEA system . C om pute NDELA lev el in n g /g (ppb) in cosm etic w ith reference to calibration so lu tion.R e c o v e r y E f f ic ie n c y D e te r m in a t io n
Spike a secon d accurately w e ig h ed portion of cosm etic w ith am ount (in ppb) o f NDELA similar to that fou n d in itia lly . If n o NDELA or o n ly a trace (< 1 5 ppb) is detected , sp ike w ith ca 0 .25-0.50 f ig (ca 125-250 ppb). Adjust total volum e of eth y len e d ich loride in extraction tube to 15 mL. A n alyze sp ike sam ple and calculate recovery efficien cy , u sin g fo llo w in g equation:R ecovery effic ien cy , % = [(C j — Ci) X 100]/C s
w h ere CT, Ci, and Cs = ppb NDELA total, initial, and sp iked , respectively .
Results and DiscussionPrelim inary cleanup o f th e cosm etic w as car
ried out by extraction w ith e th y len e dich loride. U nder the present experim ental conditions, this so lv en t rem oved m ost o f the nonpolar com ponen ts but extracted less than 5% o f the NDELA p resent in the water. Sodium ascorbate w as added to the m ixture in the extraction tube to in h ib it in situ nitrosation (1 ,7 ,8 ) and NaCl w as used to p revent form ation o f em u lsion s (9). A sm all quantity o f acetic acid en h anced th e so lu b iliza tion o f NDELA into th e aqueous layer (>95%) (9) and prom oted a cleaner phase separation on centrifugation. The entire aqueous extract rather than a representative portion w as transferred to the extraction co lu m n because cosm etics (particularly sham poos) are formulated w ith varyin g am ounts o f w ater and th e exact vo lu m e o f the total aqueous layer from a g iv en sam ple is uncertain. The error associated w ith transfer o f the entire aqueous layer was estimated to be less than 5%. In m ost cases, the separation o f layers w as clear-cut.
NDELA w as isolated from w ater and m ost other polar cosm etic ingred ien ts by passing m eth yl eth y l keton e through a com m ercial h y drop h ilic extraction colum n conta in ing the aqueous sam ple extract and then through a silica separation cartridge. The elu tion o f NDELA from th e co lum n w ith fiv e 20 mL portions o f m ethyl ethyl ketone was verified experim entally to afford recoveries o f about 85% for am ounts in the range 0 .5 -50 fig . A parallel study indicated that elu tion o f NDELA from the Sep-Pak car
tridge w as close to 100% w ith 100 mL m ethyl ethyl ketone; other more polar materials w ere at least partially retained as indicated by the larger am ount o f residue w h en no cartridge w as used. R em aining less polar com pounds w ere rem oved on a second cartridge w ith 50 mL eth y len e d ich loride w ash , lea v in g the NDELA trapped on the cartridge. To quantitatively rem ove the trapped NDELA a m ore polar so lven t such as eth an ol w as required. O nly 10 mL w as n eed ed to com p letely elu te as m uch as 75 f ig NDELA.
M any cosm etic preparations contain (usually at concentrations <0.1%) the preservative 2- b rom o-2-n itro-l,3-propanediol (BNPD) w h ich is pyrolyzed (underivatized or in the s ily l form ) in the TEA furnace at 475°C to g iv e products w h ose sign als cou ld interfere w ith accurate quantitation of the NDELA peak. 1,3-Diols such as BNPD and propylene glycol w h ich is also used as a cosm etic in gred ien t can be easily converted at room temperature in m ethyl ethyl ketone w ith1-butaneboronic acid to less polar 6-m em bered cyclic boronate derivatives (10 ,11) w h ich can be separated on a silica cartridge from th e h ig h ly polar NDELA. A n investigation o f m ixtures o f BNPD (10-15 m g) and NDELA (0 .5 -50 jig) sh ow ed that 100 mL eth y len e d ich loride elu ted virtually all BNPD boronate but m ore than 96% NDELA w as retained. A n oth er antibacterial agent, 5-brom o-5-n itro-l,3-d ioxane (BNDX), a cyclic derivative o f BNPD, exh ib ited elu tion characteristics sim ilar to those o f BNPD boronate.
Solutions for injection were prepared by rotary evaporation o f the solven t (eth ylen e dichloride, m eth yl ethyl ketone, ethanol) fo llow ed by treatm ent o f the residues w ith BSA and internal standard so lu tion . C om parison o f several NDELA so lu tion s prepared in th is m anner w ith so lu tion s o f the sam e concentration m ade by direct d ilu tion o f NDELA and internal standard stock so lu tion s w ith acetonitrile before the sily - lation step dem onstrated that no loss o f NDELA occurred on rotary evaporation o f the so lv en t w h en the heating bath w as m aintained at 40 °C.
W hile it has been reported (6) that NDELA can be chrom atographed w ith ou t prior derivatiza- tion on an O V-225 co lum n, sen sitiv ity and peak shape were im proved w h en the hydroxyl groups w ere sily lated (12) to g iv e the corresponding ether (NDELA-TMS). BSA effected th is conversion rapidly at room tem perature. To preclude the possibility o f adsorption or breakdown of NDELA-TMS on the surface of m etallic carrier gas lin es, n ick el tubing w h ich is claim ed to

BLACK ET AL.: J. ASSOC OFF. ANAL. CHEM (VOL. 54, N O . 6, 1981) 1477
Figure 1. GLC-TEA chromatograms showing NDELA-TMS (retention time: 4.4 min) and internal standard (retention time: 12.5 min), a, calibration solution; b, cosmetic extract, no NDELA detected; c, same cosmetic
spiked with 245 ppb NDELA, 159 ppb recovered.
com bine the strength o f sta in less steel w ith the inertness o f glass w as used to interface the co lum n to the TEA system . Since slush baths are cum bersom e to prepare and are subject to fairly rapid changes in com p osition and tem perature over a period o f hours, the TEA cold trap w as im m ersed in liqu id n itrogen (—195°C), w h ich w as m ore co n ven ien t to handle. There w as no appreciable difference in peak size w h en the trap w as m aintained at th is tem perature or at isop en ta n e-liq u id n itrogen or e th an o l-liq u id n itrogen slush temperatures (—160°C and —130°C, respectively). The m oderate f lo w o f heated argon gas through th e trap w as, in this work, su ffic ien t to prevent the " freezing out" o f the nitrosyl radical, a lthough in v iew o f th is contin gen cy , constant m onitoring for a su d d en d ecrease in NDELA response w as advisable.
A system linearity study o f several sily lated solutions ranging in NDELA content from 0.5 to7.0 q g /1 .3 mL gave a m ean relative response factor (NDELA to D N Piz: area ra tio /w eig h tratio) o f 0.491 w ith an RSD of ±1.7%. The response value w hich varied on ly slightly from day to day w as about w h at w as expected theoretically, the N D E L A /D N P iz ratio o f nitroso groups for equal w e igh ts b ein g approxim ately 1 to 1.9. The m inim um detectability lim it was about 5-10 ppb 60-120 pg injected) calculated as NDELA but elu ted as NDELA-TMS.
Sam ple chrom atogram s o f the calibration solution, an unspiked sam ple w ith a non-detectable NDELA level, and the same cosm etic spiked w ith 245 ppb (159 ppb recovered) are presented in Figure 1. G enerally, no d ifficu lty w as en cou n
tered in obtain in g a clear aqueous layer during the in itial extraction o f the cosm etic in the screw-cap tube, a lthough , in a few cases, particu late matter tended to gather at the phase in terface. N everth eless, alm ost all (>96% ) o f the w ater layer w as usually available for transfer to the Clin Elut colum n. The colum n adsorbed the water, d yes, and m ost other polar m aterials to y ie ld a co lorless m eth yl eth y l k eton e eluate w h en a w aitin g period o f about 4 m in b etw een each so lv en t addition w as observed. W hen the ethan ol so lu tion w as evaporated before silyla- tion , little or no resdiue was n oted for cream s or lo tion s, but a soapy m aterial w as present w ith sham poo preparations, perhaps d u e to sodium lauryl sulfate.
Because cosm etics contain a m u ltip licity of ingredients w hich differ w id ely in their physical and chemical properties, the partition o f NDELA in to the aqueous phase w ill vary (1) d ep en d in g on the polarity and so lu b ility o f these in gred ients. It was therefore im portant to determ ine the recovery efficiency for each cosm etic product studied. The sp ik in g so lu tion o f NDELA was prepared in ethylene dichloride to sim ulate more closely the practical situation in that w ater must extract the n itrosam ine from an im m iscib le m edium or matrix The sp ik ing so lu tion w as d ispensed directly on the cosmetic, and shaken w ell before adding the other in gred ien ts for the shakeout step. Recovery effic ien cies w ere d eterm ined on 150 cosm etic products (cream s, lo tions, m akeups, sham poos) by calculating the fraction (%) o f sp iked am ount recovered. Of these recovery efficiency values, 123 w ere in the
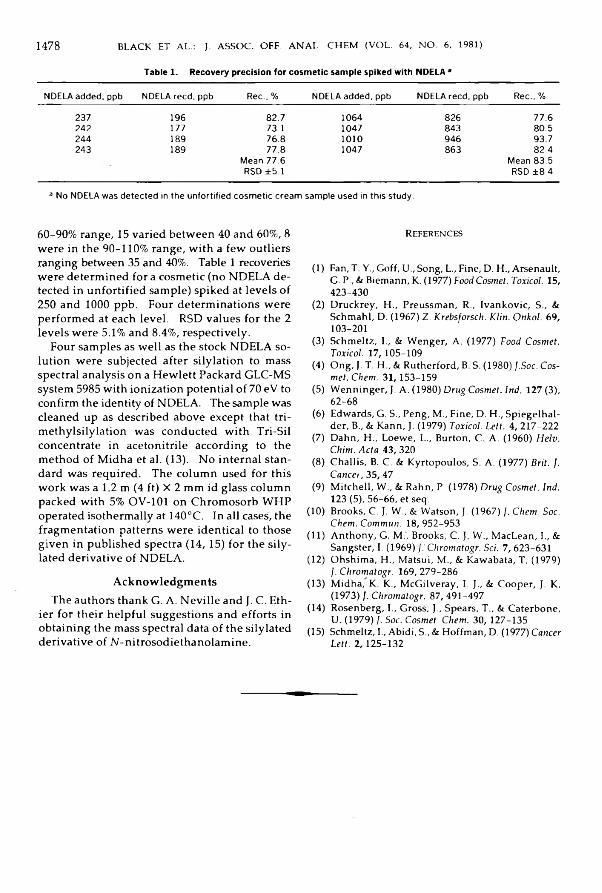
1478 BLACK ET AL.: J. ASSOC. OFF. ANAL. CH EM (VOL. 64, N O . 6, 1981)
Table 1. Recovery precision for cosmetic sample spiked with NDELA *NDELA added, ppb NDELA reed, ppb Rec., % NDELA added, ppb NDELA reed, ppb Rec., %
237 196 82.7 1064 826 77.6242 177 73.1 1047 843 80.5244 189 76.8 1010 946 93.7243 189 77.8 1047 863 82.4Mean 77.6 Mean 83.5RSD ±5.1 RSD ±8.43 No NDELA was detected in the unfortified cosmetic cream sample used in this study.
60-90% range, 15 varied b etw een 40 and 60%, 8 w ere in the 90-110% range, w ith a few outliers ranging betw een 35 and 40%. Table 1 recoveries w ere determ ined for a cosm etic (no NDELA d etected in unfortified sam ple) sp iked at lev e ls o f 250 and 1000 ppb. Four determ inations w ere perform ed at each level. RSD valu es for the 2 lev e ls w ere 5.1% and 8.4%, respectively .
Four sam ples as w e ll as the stock NDELA solu tion w ere subjected after sily lation to mass spectral analysis on a H ew lett Packard GLC-MS system 5985 w ith ionization potential o f 70 eV to confirm the identity of NDELA. The sam ple was cleaned up as described above except that tri- m eth ylsily lation was conducted w ith Tri-Sil concentrate in acetonitrile according to the m ethod o f M idha et al. (13). N o internal standard w as required. The colum n used for this work w as a 1.2 m (4 ft) X 2 mm id glass colum n packed w ith 5% OV-101 on Chrom osorb WHP operated isotherm ally at 140°C. In all cases, the fragm entation patterns w ere identical to those g iv en in p u blished spectra (14, 15) for the sily- lated derivative o f NDELA.
AcknowledgmentsThe authors thank G. A. N e v ille and J. C. Eth-
ier for their help fu l su ggestion s and efforts in obtain in g the mass spectral data o f the sily lated derivative o f N -n itrosod iethanolam in e.
References
(1) Fan, T. Y., Goff, U„ Song, L., Fine, D. H., Arsenault,G. P., & Biemann, K. (1977) Food Cosmet. Toxicol. 15, 423-430
(2) Druckrey, H., Preussman, R., Ivankovic, S., & Schmahl, D. (1967) Z. Krebsforsch. Klin. Onkol. 69, 103-201
(3) Schmeltz, I., & Wenger, A. (1977) Food Cosmet. Toxicol. 17, 105-109
(4) Ong, J. T. H„ & Rutherford, B. S. (1980) J.Soc. Cosmet. Chem. 31,153-159
(5) Wenninger, J. A. (1980) Drug Cosmet. Ind. 127 (3), 62-68
(6 ) Edwards, G. S., Peng, M., Fine, D. H., Spiegelhal- der, B„ & Kann, J. (1979) Toxicol. Lett. 4, 217-222
(7) Dahn, H., Loewe, L., Burton, C. A. (1960) Helv. Chim. Acta 43, 320
(8 ) Challis, B. C. & Kyrtopoulos, S. A. (1977) Brit. J. Cancer, 35,47
(9) Mitchell, W., & Rahn, P. (1978) Drug Cosmet. Ind. 123 (5), 56-66, et seq.
(10) Brooks, C. J. W„ & Watson, J. (1967) ]. Chem. Soc. Chem. Commun. 18, 952-953
(11) Anthony, G. M.', Brooks, C. J. W., MacLean, I., & Sangster, I. (1969) /.' Chromatogr. Sei. 7, 623-631
(12) Ohshima, H., Matsui, M., & Kawabata, T. (1979) /. Chromatogr. 169, 279-286
(13) Midha, K. K., McGilveray, I. J., & Cooper, J. K. (1973) J. Chromatogr. 87, 491-497
(14) Rosenberg, I., Gross, J., Spears, T„ & Caterbone, U. (1979) ]. Soc. Cosmet. Chem. 30, 127-135
(15) Schmeltz, I., Abidi, S., & Hoffman, D. (1977) Cancer Lett. 2,125-132
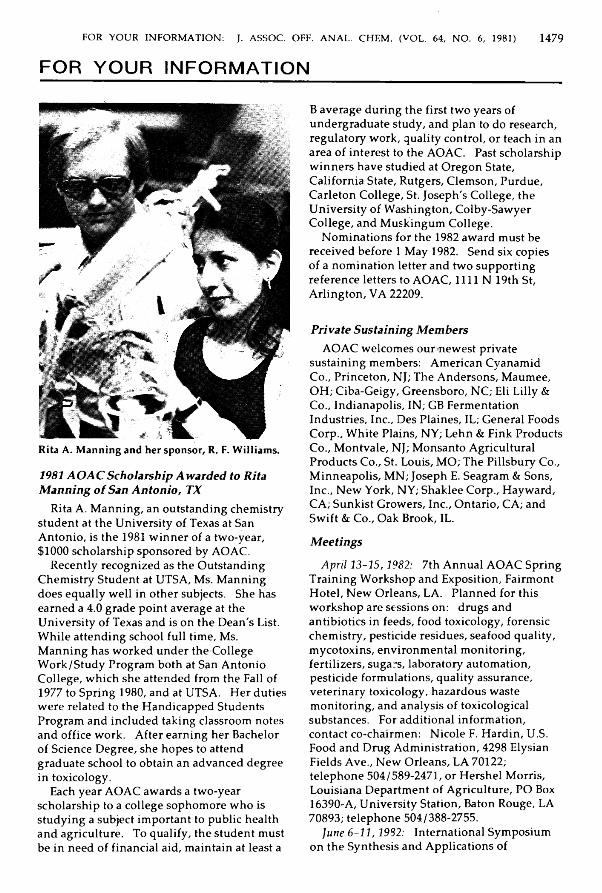
FOR YOUR IN FORM ATION: J. ASSOC. OFF. ANAL. CHEM . (VOL. 64, NO. 6, 1981) 1479
F O R Y O U R IN F O R M A T IO N
Rita A. M ann ing and her sponsor, R. F. W illiam s.
1981A O A C S cholarsh ip A w arded to Rita M anning o f San A n ton io , TX
Rita A. M anning, an outstanding chem istry stu d en t at th e U n iversity o f Texas at San A n ton io , is the 1981 w in n er o f a two-year, $1000 scholarship sponsored by AOAC.
R ecently recogn ized as the O utstanding C hem istry Student at UTSA, Ms. M anning does equ ally w e ll in other subjects. She has earned a 4.0 grade p o in t average at the U n iversity o f Texas and is on th e D ean's List. W h ile attend ing school fu ll tim e, Ms. M anning has w orked under the C ollege W ork/Study Program both at San A n ton io C o llege, w h ich sh e attended from the Fall of 1977 to Spring 1980, and at UTSA. H er duties w ere related to the H andicapped Students Program and inclu d ed taking classroom notes and office work. After earning her Bachelor of Science D egree, she h op es to attend graduate school to obtain an advanced degree in toxico logy.
Each year AO AC awards a tw o-year scholarsh ip to a co llege sophom ore w h o is stu d y in g a subject im portant to public health and agriculture. To qualify, th e stu d en t m ust be in n eed o f financial aid, m aintain at least a
B average during th e first tw o years o f undergraduate study, and plan to do research, regulatory w ork, quality control, or teach in an area o f interest to the AOAC. Past scholarship w in n ers have studied at O regon State, California State, Rutgers, C lem son, Purdue, Carleton C ollege, St. Joseph's C ollege, the U n iversity o f W ashington, Colby-Saw yer C ollege, and M uskingum C ollege.
N o m in ation s for the 1982 award m ust be received before 1 M ay 1982. Send six copies o f a nom ination letter and tw o supporting reference letters to AOAC, 1111 N 19th St, A rlin gton , VA 22209.
Private Sustaining M em bersAO AC w elcom es our n ew est private
susta in in g members: Am erican Cyanam id Co., Princeton, NJ; The A ndersons, M aum ee, OH; Ciba-G eigy, G reensboro, NC; Eli L illy & Co., Indianapolis, IN; GB Ferm entation Industries, Inc., D es P laines, IL; G eneral Foods Corp., W hite Plains, NY; L ehn & Fink Products Co., M ontvale, NJ; M onsanto Agricultural Products Co., St. Louis, MO; The Pillsbury Co., M inneapolis, M N; Joseph E. Seagram & Sons, Inc., N e w York, NY; Shaklee Corp., H ayward, CA; Sunkist G rowers, Inc., O ntario, CA; and S w ift & Co., Oak Brook, IL.M eetings
A p ril 1 3 -1 5 ,1 9 8 2 : 7th A nnual AO AC Spring T raining W orkshop and Exposition, Fairmont H otel, N ew O rleans, LA. P lanned for this w orkshop are session s on: drugs and antib iotics in feeds, food toxico logy, forensic chem istry , pesticide residues, seafood quality, m ycotoxins, environm ental m onitoring, fertilizers, sugars, laboratory autom ation, p esticide form ulations, quality assurance, veterinary toxico logy, hazardous w aste m onitoring, and analysis o f toxicological substances. For additional inform ation, contact co-chairm en: N ico le F. H ardin, U.S. Food and Drug A dm inistration , 4298 Elysian Fields A ve., N ew O rleans, LA 70122; te lep h o n e 504/589-2471, or H ersh el M orris, Louisiana D epartm ent o f A griculture, PO Box 16390-A, U n iversity Station, Baton Rouge, LA 70893; te lep h on e 504/388-2755.
June 6 -1 1 , 1982: International Sym posium on th e Synthesis and A pplications of
1480 FOR YOUR INFORM ATION: J. ASSOC. OFF. ANAL. CHEM . (VOL. 64, N O . 6, 1981)
Isotop ically Labeled C om pounds, Hyatt- R egency H otel, Kansas City, MO. The objective o f the sym posium is to provide a forum for the exchange o f inform ation b etw een lead ing scientists in vo lved in the syn th esis and applications o f isotopically (radio-active and stable) labeled com pounds. The sym posium w ill inclu de a scientific exhib it. Topics w ill encom pass synthesis, analysis, purification and storage of isotop ically labeled com pounds, and their applications in biom edical, clin ical, and environ m en ta l studies, as w e ll as m etabolism , pharm acokinetics, and toxicology. For further inform ation regarding subm ission o f papers and registration, contact A lexander Susan, S cientific Secretary o f the Sym posium , c /o M idw est Research Institute, 425 V olker Blvd, Kansas City, MO 64110; te lep h on e 816/753- 7600, ex tension 268.
Septem ber 20-23, 1982: Sym posium on Food Research and Data A nalysis, Vokenasen H otel, O slo, N orw ay. O rganized by the N orw egian Food Research Institute; sponsored by the International U n ion o f Food Science and T ech n ology , IUFoST. This sym posium is in ten d ed to provide an interdisciplinary m eetin g ground for scientists interested in the d ev elop m en t and use o f com puter-aided analysis o f m ultivariate food research data. A gronom ists, m icrobiologists, chem ists, tech n ologists, statisticians, m arketing peop le, and p sycho logists w ith som e experience in data analysis w ill be able to study the potential o f m ore advanced analytical tools. Specialists in the fie ld s o f chem om etrics, qualim etrics, and psychom etrics w ill have an opportunity to “shake hands." The oral contributions w ill be g iv en so that food scientists w ith ou t advanced k n o w led g e in m athem atics or com puter scien ce can understand. Registration fee;N.K r 1800 («U S$360). Final registration;June 1,1982 . For m ore inform ation, contact Sym posium Secretariate: N orw egian Food Research Institute, Bji^rn Eldstuen, PO Box 50, N -1432 Aas-NLH , Norway.
O ctober 2 5 -2 8 , 1982: 96th A nnual AOAC
M eetin g w ill be held at its n ew and larger "hom e", the Shoreham H otel, W ashington,DC. For m ore inform ation, contact K athleen Fom inaya, AOAC, 1111 N 19th St, A rlington , VA 22209; te lep h on e 703/522-3032.
Course O fferedThe M odern Practice o f Thin Layer
C h rom atography and in situ Q uantita tion Including H PTLC and RPTLC .—K ontes Scientific G lassw are/Instrum ents is offering an in ten sive 2-day w orkshop in Thin Layer Chrom atography (TLC) in W ashington , DC, Decem ber 1-2, 1981. The course is d esign ed to teach sam ple application techn iques, plate and so lven t selection , v isualization , and quantitation w ith the K ontes Scanner. A pplications and the latest TLC d ev elop m en ts w ill be discussed. Registration fee is $250 for 2 days. Fee inclu des course m anual w ith experim ents and applications data, a kit conta in ing materials for spottin g and d evelop in g a chrom atogram , co ffee breaks, and lunches. To register, contact T echnical Director, Kontes, Spruce St, V in eland , NJ 08360.
A bou t Your SubscriptionH ow to know when you r subscription w ill end.
Printed on the label attached to the front cover is inform ation about w h en your subscription w ill end. It's in abbreviated form — 12/81 , for exam ple, m eans that your last issue w ill be Decem ber 1981.
W h y renew al notices are sen t out in advance. Producing a journal takes a great deal of advance p lann ing. U n less w e get your renew al notice w e ll in advance w e m ay not alw ays be able to con tin u e your subscription w ith ou t interruption.
If you renew ea rly , w ill you g e t tw o copies o f the sam e issue? N o , all Journal o f the A ssociation of O fficial A n a lytica l Chem ists subscriptions run concurrent w ith the calendar year, i.e. all beg in w ith the January issue and en d w ith the N ovem ber issue (6 issues per year).

NEW PUBLICATIONS: J. ASSOC. OFF. CHEM . (VOL. 64, N O . 6, 1981) 1481
N E W P U B L IC A T IO N S
Chemical Derivatization in Gas Chromatography. B y J. D r o zd . P u b lish e d b y E lse v ie r S c ie n t if ic P u b lis h in g C o ., PO B ox 2 1 1 , 1000 A E A m sterd a m , T h e N e th e r la n d s ; a lso a v a ila b le fro m E lse v ier N o r th -H o lla n d , In c., 5 2 V a n d e r b ilt A v e , N e w Y ork , N Y 1 0 0 1 7 ,1 9 8 1 . 2 4 4 p p . P rice U S $ 5 8 .5 0 /D fl. 120.00. ISBN 0-444-41917-9.
T h e f iv e c h a p ters c o m p r is in g th is b o o k d is c u s s r e a so n s fo r u s in g c h e m ic a l d e r iv a t iv e s in g a s ch r o m a to g r a p h y ; s o m e p ra ctica l a sp ec ts o f s a m p le p rep a ra tio n a n d a n a ly s is o f v a r io u s d e r iv a tiv e s ; p r o b le m s o f id e n tif ic a t io n a n d q u a n tita t iv e a n a ly sis ; th e m o st fr e q u e n t ly u se d d e r iv a t iv e s c la ss if ie d a c c o r d in g to fu n c tio n a l g r o u p s o f th e c o m p o u n d u n d e r a n a ly sis ; a n d th e d e r iv a t iz a t io n a n d a n a ly s is o f p articu lar g r o u p s o f c o m p o u n d s . T h e b o o k s h o u ld b e o f u s e to th e n o v ic e a n d th e p r o fic ie n t w o rk er .
Impact of Toxicology on Food Processing.E d ited b y J. C. A y r e s a n d J. C. K irsch m an . P u b lis h e d b y A V I P u b lis h in g C o ., In c ., P O B ox 8 3 1 — 2 5 0 P o st R d , East W estp o r t, CT0 6 8 8 1 ,1 9 8 1 . A p p ro x . 500 p p . P r ices ap p rox .: U .S . & C an. $4 5 .0 0 , o th e r c o u n tr ie s $ 4 9 .5 0 . IS B N 0-8 7 0 5 5 -3 8 7 -9 .
A n o v e r v ie w o f to x ic ity in r e la t io n to fo o d , fo o d in g r e d ie n ts , a d d it iv e s , a n d p r o c e sse s is p r o v id e d b y th is b o o k w h ic h r e su lte d fro m th e In st itu te o f F o o d T e c h n o lo g y B asic S y m p o sia S er ie s . M ajor to p ic s in c lu d e th e sa fe ty a n d r e g u la to r y a sp e c ts o f a d d it iv e to x ic ity , u n d e s ir a b le b io lo g ic a l su b sta n c e s in fo o d s , a n d to x in s in r e la t io n to p r o c e ss in g . D is c u s s io n s e x a m in e c o lo r s , f la v o r s , sp ic e s , b u lk in g a g e n ts a n d f il le r s , v ita m in s , a n tio x id a n ts , sa fe ty o f irra d ia ted fo o d s , c y a n o g e n ic g ly c o s id e s , a f la to x in s a n d o th e r m y c o to x in s , a n d a n tib io t ic s . T h is is a r e fe r e n c e b o o k fo r fo o d t e c h n o lo g is t s , c h e m ists , m ic r o b io lo g is ts , a n d n u tr it io n is ts in v o lv e d in fo o d sa fe ty , p ro d u ct d e v e lo p m e n t , a n d im p le m e n ta tio n o f fo o d r e g u la tio n s .
Prescott & Dunn's Industrial Microbiology,4th Ed. E d ited b y G . R eed . P u b lis h e d b y A V I P u b lis h in g C o , In c ., P O B ox 8 3 1 — 2 5 0 P o st R d , East W e stp o r t, CT 0 6 8 8 1 , 1981. A p p ro x . 106 0 p p . P r ices app rox .: U .S . &
C a n . $ 5 9 , o th e r c o u n tr ie s $ 6 5 .0 0 . IS B N 0- 8 7 0 5 5 -3 7 4 -7 .
B eca u se th e f ie ld o f in d u str ia l m ic r o b io lo g y h a s g r o w n im m e n s e ly s in c e th e la st e d it io n o f Prescott and Dunn 2 0 y ea rs a g o , th e 4 th e d it io n fo c u s e s o n th e in d u str ia l t e c h n o lo g y a n d a p p lic a t io n s in v o lv e d in th e m ic r o b io lo g y o f fo o d s a n d fo o d in g r e d ie n ts . In it ia l ch a p ters o u t l in e fu n d a m e n ta ls in c lu d in g m icro b ia l ta x o n o m y , m e ta b o lism , a n d g e n e tic s ; yeasts; a n d p u r e cu ltu r e m e th o d s . T h e r e m a in in g ch a p te r s in c lu d e c o v e r a g e o f m icro b ia l p r o c e sse s a n d fu n c t io n s in in d u str ia l p r o d u c t io n o f c h e e s e s , ca b b a g e , cu cu m b er , o l iv e p ro d u cts , w in e a n d b ra n d y , b ee r , b a k ery fo o d s , a n d d is t i l le d b e v e r a g e s . T h is is a g u id e a n d r e fe r e n c e for fo o d te c h n o lo g is t s , m ic r o b io lo g is ts , d a iry c h e m ists , cerea l c h e m is ts , fe r m e n ta tio n te c h n o lo g is t s , b io e n g in e e r s , fo o d p r o d u c tio n p e r s o n n e l, a n d th o s e in re sea rch a n d d e v e lo p m e n t o f fo o d p r o d u c ts a n d b y -p r o d u cts .
Protein Quality in Humans: Assessment and in vitro Estimation. B y C. E. B o d w e ll, J. S. A d k in s , a n d D T. H o p k in s . P u b lis h e d b y A V I P u b lis h in g C o ., In c ., P O B ox 8 3 1 — 250 P o st R d, East W estp o r t, CT 0 6 8 8 1 ,1 9 8 1 . A p p ro x . 1060 p p . P r ices approx.: U .S . & C an. $59 , o th e r c o u n tr ie s $65 . ISB N 0- 8 7 0 5 5 -3 7 4 -7 .
T h is b o o k d e sc r ib e s th e cu r ren t s ta tu s a n d p o te n tia l a p p lic a t io n s o f in v itr o e v a lu a t io n o f n u tr it io n a l q u a lity o f p r o te in s fo r h u m a n c o n su m p tio n . T h e p r e c is io n a n d accu ra cy a v a ila b le in e s t im a te s o f p r o te in n u tr it io n a l v a lu e in h u m a n s tu d ie s a n d th r o u g h u s e o f in v itr o p r o c e d u r e s is a sse ssed . T o p ics d is c u s se d in c lu d e im p o r ta n c e o f p r o te in q u a lity , a s s e ss m e n t o f p r o te in n u tr it iv e v a lu e in h u m a n s , in v itrc m e th o d s fo r a s s e s s in g p r o te in n u tr it io n a l v a lu e , a n d e v a lu a t io n o f th e v a l id ity a n d p o te n tia l o f in v itr o a ssa y s fo r p r e d ic t in g th e q u a lity o f p r o te in s fo r h u m a n c o n su m p tio n .
Source Book of Flavors. B y H . B. H e a th . P u b lis h e d b y A V I P u b lis h in g C o ., In c ., PO B ox 8 3 1 — 2 5 0 P o st R d, East W estp o r t, CT0 6 8 8 1 ,1 9 8 1 . A p p ro x . 8 5 0 p p . P r ices

1482 NEW PUBLICATIONS: J. ASSOC. OFF. ANAL. CHEM . (VOL. 64, NO. 6, 1981)
approx.: U.S. & Can. $79.50, other countries $87.50.Source Book of F lavors covers such areas as
flavor chem istry, colorants, quality assurance, tox ico logy , and labeling. It inclu des data on natural flavoring m aterials, 325 plant m aterials, principal essential o ils and organic chem icals used in flavorings, synthetic flavorin g m aterials, aromatic chem icals, flavorin g classified as GRAS by FEMA, and 350 flavorin g form ulations. The book is docu m en ted w ith over 3000 references.T rend s in A n aly tica l C h em istry . P ublished
by Elsevier Scientific P ublish in g Co., PO
Box 211, Am sterdam , The N etherlands; also available from Elsevier N orth-H olland Inc., 52 Vanderbilt A ve, N e w York, NY 10017. V olum e 1, 16 issues, March 1981 and m on th ly O ctober 1981 to D ecem ber 1982. Prices: personal ed ition US $42.50, £20.00(UK), 91.50 D utch gu ilders (Europe) and 95.50 Dutch guilders (elsew here); library ed ition (V olum e 1 p lus a com pendium volu m e o f archival m aterial, hardbound, and indexed) US $133.25, 260 D utch guilders w orldw id e.Trends in A n a ly tica l C h em istry is a n ew
international publication o f short critical review s, articles, and n ew s on trends and d evelop m en ts in analytical chem istry.
C O R R E C T IO N
/. Assoc. Off. A nal. Chem. (1981) 64 ,311 -3 18 , "Paper Chrom atographic D eterm ination of Total C apsaicinoids in Capsicum s and Their O leoresins w ith Precision, Reproducibility, and V alidation T hrough Correlation w ith
P u n gen cy in Scoville U nits," by N . C. Rajpoot and V. S. Govindarajan, p. 315, right colum n, first lin e
C hange (P < 0.05) to (P > 0.05)

A U TH O R INDEX: J. ASSOC. OFF. ANAL. CHEM . (VOL. 64, N O . 6, 1981) 1483
A U T H O R IN D E X
A b din e, H., see Wahbi, A.-A. M.A bou O uf, A . M ., see Hassan, S. M.A dam s, M ., see Ellefson, W. C.A dam s, W. S.
report on preservatives and artificial sweeteners, 390
A icken , J. C., see Strunk, D. H.A lexander, T. G.
report on drugs, nonalkaloid organic nitrogenous bases, 364
A lfon so , F. C., see Martin, G. E.A llegrin i, M ., Boyer, K. W., & Tanner, J. T.
NAA of Total Diet food composites for iodine, 1111A llen , L. M ., see Briggle, T. V.Alvarez, R.
report on reference materials and standard solutions, 358
A lvarez-N azario, F. rapid check on proof of rums, 792 Westphal plummet determination of alcohol in
distillates, 1420Am brus, A ., Lantos, J., Visi, E., Csatlos, I„ & Sarvari,
L.general method for determination of pesticide
residues in samples of plant origin, soil, and water. I. extraction and cleanup, 733
A m brus, A ., Hargitai, E., Karoly, G., Fulop, A., & Lantos, J.general method for determination of pesticide
residues in samples of plant origin, soil, and water. II. TLC determination, 743
A m brus, A ., Visi, E., Zakar, F., Hargitai, E., Szabo, L., & Papa, A.general method for determination of pesticide
residues in samples of plant origin, soil, and water. III. GC analysis and confirmation, 749
A m er, S. M ., see Ellaithy, M. M.A nderson, P. K., see Skelly, N. E.Andreasen, A. A ., see Byrne, K. J.; Strunk, D. H.A ndrew s, W. H., see Poelma, P. L.A ndrew s, W. H., Poelma, P. L„ & Wilson, C. R.
comparative efficiency of brilliant green, bismuth sulfite, Salmonella-Shigella, Hektoen enteric, and xylose lysine desoxycholate agars for the recovery of Salmonella from foods: collaborative study, 899
Andrews, W. H., Wilson, C. R., Poelma, P. L., Bullock, L. K., McClure, F. D., & Gentile, D. E. interlaboratory evaluation of the AOAC method
and the A-l procedure for recovery of fecal coliforms from foods, 1116
A ndrzejew ski, D ., Havery, D. C., & Fazio, T. determination and confirmation of N-
nitrosodimethylamine in beer, 1457
A w e, M . J. & Schranz, J. L.HPLC determination of aflatoxins in spices, 1377
Bachman, W. J.HPLC determination of antihistamine-adrenergic
combination products: collaborative study, 564 Backer, L. F., see Casper, H. H.B aillies, N . T ., see Ellefson, W. C.Baker, D .
report on cereal foods, 387 Bandler, R. & Cichowicz, S. M.
particle size and concentration adjustments of tomato products for Howard mold count, 570
Barary, M ., see Wahbi, A.-A. M.Bardalaye, P. C., see Guinivan, R. A.Barkate, J. A., see Mueller-Brennecke, D.Barnes, C. J., see Malanoski, A. J.
report on drug residues in animal tissues, 415 Baur, F. J.
report of the long-range planning committee, 465 Bedair, M ., see Wahbi, A.-A. M.Belal, S., see Wahbi, A.-A. M.B eloian , A ., see Wehr, M.B enjam in, C. R., see Mitchell, J. D.Benner, J. E., see Payne, W. R. Jr B ennett, B. R., see Kane, P. F.B ennett, S. C., see Chu, F. S.B enoit, F. M ., see LeBel, G. L.; Williams, D. T. B enson, M . E., see Casper, H. H.Bibb, A . E., see Cox, D. H.B iehl, E. R., see Hansen, L. B.B illedeau, S. M ., see Blakemore, W. M.B illo tte , M ., see Price, R. L.B irkel, T. J., see Daniels, D. H.Bjarno, O .-C.
multicomponent analysis of meat products, 1392 Black, D . B., Lawrence, R. C., Lovering, E. G., &
Watson, J. R.GLC-thermal energy analyzer method for N-
nitrosodiethanolamine in cosmetics, 1474 B lakem ore, W. M . & Billedeau, S. M.
analysis of laboratory animal feed for toxic and essential elements by AAS and inductively coupled argon plasma emission spectrometry, 1284
Bland, P. D.GLC determination of pirimicarb in formulations:
collaborative study, 1315Boland, F. E., Lin, R. C., Mulvaney, T. R., McClure, F.
D., & Johnston, M. R.pH determination in acidified foods: collaborative
study, 332 Boland, F. E.
report on fruits and fruit products, 388
1484 A UTHOR INDEX: J. ASSOC. OFF. ANAL. CHEM . (VOL. 64, N O . 6, 1981)
Bond, J. F., see Staruszkiewicz, W. F„ Jr B ontoyan, W. R., see Duffy, S. L.
report of the twenty-fourth annual meeting of CIPAC, 455
report on pesticide formulations: herbicides, fungicides, and miscellaneous, 355
Booth, G. D ., see Mathewson, P. R.Borsje, B., see De Vries, E. J.; Mulder, F. J.Bosshardt, H. P., see Meier, J.B othw ell, M. L., see Kan, G. Y. P.Boy, V. M., see Corominas, L. F.Boy, V. M. & Guijosa, M.
ammonia-selective electrode determination of nitrogen in fertilizers, 1096
Boyer, K. W., see Allegrini, M.; Suddendorf, R. F.report on metals and other elements, 396
Bram m ell, W. S.report on eggs and egg products, 367 spectrophotometric determination of phosphorus
in certifiable straight color additives: collaborative study, 808
Breder, C. V ., see McNeal, T.; Snyder, R. C.; Varner, S. L.
Brickenkam p, C. S., see Jones, F. E.Brickey, P. M., Jr, see Wehr, M.Briggle, T. V ., Allen, L. M., Duncan, R. C„ &
Pfaffenberger, C. D.HPLC determination of cvanuric acid in human
urine and pool water, 1222 B runelle, R. L., see Goleb, J. A.Brusick, D . J., book review, 1271 Bueno, M. P., see Iverson, J. L.Bulhack, P., see Goleb, J. A.B ullock , L. K., see Andrews, W. H.Burg, W. R., see Shotwell, O. L.Burggraff, J. M., see Martin, G. E.Burke, J. A ., see Helrich, K.Burkett, M. L., see Llewellyn, G. C.Burns, B. G., Musial, C. J., & Uthe, J. F.
novel cleanup method for quantitative GC determination of trace amounts of di-2- ethylhexyl phthalate in fish lipid, 282
Burse, V. W., see Needham, L. L.Buscemi, P. C., see Martin, G. E.Butler, S. W., see Helrich, K.Byrne, K. J., Reazin, G. H„ & Andreasen, A. A.
HPLC determination of /3-sitosterol and /3-sitosterol-D-glucoside in whisky, 181
Cail, R. S., see Simonaitis, R. A.C alvey, R. J., Goldberg, A. L., & Madigan, E. A.
HPLC determination of intermediates and side reaction products in FD&C Yellow No. 5, 665
C am pbell, A. D ., see Willett, D. N.Carasea, A. M., see Easley, D. M.Carson, L. J.
modified Storherr method for determination of organophosphorus pesticides in nonfatty food Total Diet composites, 714
Carter, G. G., see Goleb, J. A.Casper, H. H ., Benson, M. E., & Kunerth, W.
spectrophotometric determination of dicumarol in sweet clover, 689
Casper, H. H ., Backer, L. F., & Kunerth, W. survey of North Dakota sunflower seeds for
aflatoxin, 228C astillo , G. D ., see Hansen, L. B.C halifoux, C., see Meranger, J. C.Cham bers, T. L. & Staruszkiewicz, W. F., Jr
HPLC method for indole in shrimp: development of method and collaborative study, 592
UV detection procedure for LC determination of indole in shrimp, 603
Chandra, J. P., see Duve, R. N.Chao, J.-M.
report on forensic sciences, 417 Chawla, R. P., see Kapoor, S. K.C hen, S.-L. Y., Frank, J. F., & Loewenstein, M.
estimation of lactose hydrolysis by freezing point measurement in milk and whey substrates treated with lactases from various microorganisms, 1414
C heuk, W. L. & Finne, G.modified colorimetric method for determining
indole in shrimp, 783 Chi, R. K„ see Goleb, J. A.Chu, F. S., see El-Nakib, O.; Lau, H. P.; Lee, S.;
Pestka, J. J.Chu, F. S. & Bennett, S. C.
HPLC preparation of alternariol, alternariol methyl ether, and altenuene, 950
C ichow icz, S. M ., see Bandler, R.report on analytical mycology of foods and drugs,
406Clark, C. C.
mass spectral quantitation of cocaine HC1 in powders, 884
report on drugs, narcotic and dangerous, 363 Clark, C. R„ see Wall, G. M.Cochrane, W. P. & Lanouette, M.
HPLC determination of aldicarb, aldicarb sulfoxide, and aldicarb sulfone in potatoes, 724
C offin , D . E., see Willett, D. N.report of the committee on the constitution, 459
Cohen, H. & Lapointe, M.HPLC determination and fluorescence detection
of aflatoxins in corn and dairy feeds, 1372 Colarusso, M ., see Winkler, V. W.C ollier, R. H., see Moore, H. P.Conacher, H. B. S., see Lawrence, J. F.C ook, D. W.
automatic incubator for use with modified A-l test for enumerating fecal coliform bacteria in shellfish growing waters, 771
C om eliu ssen , P. E.report on multiresidue methods (interlaboratory
studies), 398
A U TH O R INDEX: J. ASSOC. OFF. ANAL. CHEM . (VOL. 64, N O . 6, 1981) 1 4 8 5
C orom inas, L. F., Boy, V. M., & Rojas, P.comparison of methods for determining sodium in
fertilizers, 704Coutts, R. T., see Hargesheimer, E. E.Cox, D. H . & Bibb, A. E.
hydrogen selenide evolution-electrothermal AAS method for determining nanogram levels of total selenium, 265
Cox, E. A. & Reed, G. F.HPLC determination of intermediates and two
reaction by-products in FD&C Red No. 40: collaborative study, 324
Craddick, R. C. & Hatfield, L.examination of the use of glass filter paper in
asbestos-free fiber determination, 1275 Csatlos, I., see Ambrus, A.C unningham , H. M ., book review, 1032 C ysew sk i, S. J., see Phillips, T. D.
D abeka, R. W. & McKenzie, A. D.AAS determination of tin in canned foods using
nitric acid-hydrochloric acid digestion and nitrous oxide-acetylene flame, 1297
microdiffusion and fluoride-specific electrode determination of fluoride in infant foods: collaborative study, 1021
D an iels, D. H., Warner, C. R., & Birkel, T. J. use of closed-system vacuum distillation for
isolation of moderately volatile compounds, 769 D avis, N . D ., Guy, M. L., & Diener, U. L.
improved fluorometric-iodine method for determination of aflatoxin in corn, 1074
D ay, E. W. Jr, see West, S. D.D ekeyser, D . A ., see Van Peteghem, C. H.D en t, R. G.
extraction of thrips and other whole or equivalent insects from frozen blackberries and raspberries: collaborative study, 194
D eSiena, A ., Jacobs, E., & Romagnoli, R.determination of trace amounts of nitrites in
fabricated nonmeat products, 226 D eStefano, J. J., book review, 1032 D eutsch , M. J.
report on vitamins and other nutrients, 392 D evani, M. B., Shishoo, C. J., Doshi, K. J., & Shah, A.
K.spectrophotometric determination of
chloramphenicol and its esters in complex drug mixtures, 557
D e V ries, E. J., see Mulder, F. J.D e V ries, E. J., Mulder, F. J., & Borsje, B.
analysis of fat-soluble vitamins. XXV. HPLC determination of vitamin D in multivitamin preparations: collaborative study, 61
D ick , R. H.report on coffee and tea, 365
D iener, U. L., see Davis, N. D.
D iller , T., see Shotwell, O. L.D oner, L. W. & Phillips, J. G.
detection of high fructose corn syrup in apple juice by MS 13C /I2C analysis: collaborative study, 85
D oose, G. M ., see Luke, M. A.D osh i, K. J., see Devani, M. B.D ryon, L., see Puttemans, M. L.D u ffy , S. L. & Bontoyan, W. R., book review, 348 Duncan, R. C., see Briggle, T. V.D u ve, R. N ., Chandra, J. P., & Singh, S. B.
open digestion modification of AOAC method for determination of mercury in fish, 1027
D yer, R. H ., see Martin, G. E. book review, 779 report on alcoholic beverages, 386
Eadie, T ., see Llewellyn, G. C.Easley, D . M ., Kleopfer, R. D„ & Carasea, A. M.
GC-MS determination of volatile organic compounds in fish, 653
E delstein , R. L., see Wheeler, W. B.El-Ahraf, A ., Willis, W. V., & Vinjamoori, D. V.
sodium hypophosphite as reducing agent for determination of submicrogram quantities of mercury in animal feeds and manures, 9
E ldesouki, M. H ., see Hassan, S. S. M.E llaithy, M . M ., El-Tarras, M. F„ & Amer, S. M.
polarographic analytical study of oxyphenbutazone, 1439
E llefson , W. C., Richter, E., Adams, M„ & Baillies, N.T.evaluation of ion exchange resins and various
enzymes in thiamine analysis, 1336 E llis, R. L.
report on meat and meat products, 371 E l-N akib , O., Pestka, J. J., & Chu, F. S.
determination of aflatoxin Bj in corn, wheat, and peanut butter by enzyme-linked immunosorbent assay and solid phase radioimmunoassay, 1077
Elsayed, M . A -H ., Obiakara, A. C., & Uzodinma, S.U.bromination methods for determination of
phenylephrine hydrochloride in nose drops, salicylamide in tablets, and tetracycline hydrochloride in capsules, 860
El-Sayed, S. M ., see Hassan, S. M.El-Tarras, M. F., see Ellaithy, M. M.Engler, R.
report on disinfectants, 407
Fahrenholz, C. H ., see Mathewson, P. R.Fan, S. L., see Lau, H. P.Farnworth, E. R., see Trenholm, H. L.Fazio, T., see Andrzejewski, D.; Hotchkiss, J. H.; Joe,
F. L., Jr; Malanoski, A. J.; Perfetti, G. A. report on food additives, 369

1 4 8 6 A UTHOR INDEX: J. ASSOC. OFF. ANAL. CHEM . (VOL. 64, N O . 6, 1981)
Ferren, W. & Maltese, L.chloridometer determination of alien halide
content of iodine, 1446 Field, R. A ., see Kruggel, W. G.Figert, D . M ., see Martin, G. E.Fink, D. W.
LC method for determination of arprinocid in feed: collaborative study, 973
Finne, G., see Cheuk, W. L.Firestone, D.
report on oils and fats, 380 Fischer, P. W. F. & L'Abbe, M. R.
acid digestion determination of iodine in foods, 71 Fitzgerald, J. W.
report on drugs, acidic and neutral nitrogenous organics, 360
Forrette, J. E.IR spectrophotometric method for methazole
formulations: collaborative study, 1185 Fox, J. B., Zell, T. E., & Wasserman, A. E.
interaction between sample preparation techniques and colorimetric reagents in nitrite analysis in meat, 1397
Frahm, L. J., see George, G. M.Frank, J. F., see Chen, S.-L. Y.Freeman, C. C.
brine saturation technique for extraction of light filth from rubbed and ground sage: intralaboratory study, 773
new brine saturation method for extraction of light filth from corn meal: collaborative study, 191
Froberg, J. E., see Luke, M. A.Fuller, G.
report on nuts and nut products, 389 Fulop, A., see Ambrus, A.
Gardner, A. M.template for marking TLC plates for 2-
dimensional development, 1264 Gecan, J. S., see Thrasher, J. J.
report on extraneous materials in foods and drugs, 407
G ehrke, C. W., see Wall, L. L„ Sr.G entile , D. E., see Andrews, W. H.George, E., Jr, see Quackenbush, F. W.
report of committee on recommendations for official methods, 418
G eorge, G. M ., Frahm, L. J., & McDonnell, J. P.HPLC determination of nifursol in finished feeds,
969G ershm an, L. L.
report on fish and other marine products, 367 G ilchrist, J. E., see Peeler, J. T.; Zipkes, M. R. G iuliany , B. E.
simplified automated system for determination of vitamin A in milk, 225
G lancy, E. M., see Roberts, B. A.G locker, E. M ., see Moore, H. P.G oldberg, A. L., see Calvey, R. J.G oleb, J. A ., Midkiff, V. C„ Brunelle, R. L„ Bulhack,
P„ Carter, G. G„ & Chi, R. K.report of committee G on recommendations for
official methods, 442 Goras, J. T.
HPLC method for pyrantel tartrate in swine feeds and supplements, 1291
Govindarajan, V. S., see Rajpoot, N. C.G oyan, J. E.
banquet address, 1980, Dr. Harvey Wiley's brainchild, 75 years later, 256
Greenberg, R. S.GLC method for determining oxamyl in peppers,
tomatoes, and cucumbers, 1216 Gregory, J. F., I l l & Manley, D.
HPLC determination of aflatoxins in animal tissues and products, 144
Grift, N . P., see Muir, D. C. G.Guijosa, M ., see Boy, V. M.G uin ivan , R. A., Thompson, N. P., & Bardalaye, P. C.
simultaneous EC detection of chlorpyrifos and its major metabolite, 3,5,6-trichloro-2-pyridinol, after GPC, 1201
G ulik , S., see Kane, P. F.Guy, M . L., see Davis, N. D.
H ache, P., Marquette, R., Volpe, G., & Mallet, V. N.fast cleanup of difficult substrates for
determination of fenitrothion and some derivatives, 1470
H ailey, D. M. & Lea, A. R.HPLC analysis of hydrocortisone acetate
ointments: interlaboratory study, 870 H all, G., see Winterlin, W.H allm ark, M. R., see Shaikh, B.Ham man, J. W., see Strunk, D. H.H anks, A. R., see Moore, H. P.H ansen, L. B., Castillo, G. D., & Biehl, E. R.
GC-MS characterization of an alteration product of malathion detected in stored rice, 1232
Harder, W. O., see Pestka, J. J.Hargesheimer, E. E., Coutts, R. T„ & Pasutto, F. M.
GLC determination of aniline metabolites of substituted urea and carbamate herbicides in aqueous solution, 833
H argitai, E., see Ambrus, A.H ashizum e, T., see Ito, Y.H assan, S. M ., Walash, M. L, El-Sayed, S. M., & Abou
Ouf, A. M.colorimetric determination of certain phenol
derivatives in pharmaceutical preparations, 1442 H assan, S. S. M.
manual and semiautomated spectrophotometric determination of vitamin K3 by reactions with piperidine and malononitrile, 611
A U TH O R INDEX: J. ASSOC. OFF. ANAL. CH EM . (VOL. 64, N O . 6, 1981) 1487
H assan, S. S. M . & Eldesouki, M. H.potentiometric and AAS determination of
sulfonamides in pharmaceutical preparations, 1158
H atfield , L., see Craddick, R. C.H avery, D . C., see Andrzejewski, D.; Hotchkiss, J. H. H ayes, A. W ., see Phillips, T. D.H eckm an, M. M. & Lane, S. A.
comparison of dietary fiber methods for foods, 1339
H eidelbaugh , N . D ., see Phillips, T. D.H ein e, K. S.
report on color additives, 414 H elrich , K., Burke, J. A., Malanoski, A. J., Puma, B. J.,
& Butler, S. W.report of committee E on recommendations for
official methods, 432 H enriet, J., see Sanchez Rasero, F.H enry, K. W.
NMR determination of methoxyflurane, 1154 Herr, A. A., see Olson, O. E.H o, J. L., Wisneski, H. H., & Yates, R. L.
HPLC-thermal energy determination of N- nitrosodiethanolamine in cosmetics, 800
H oladay, C. E., see Shotwell, O. L.rapid screening method for aflatoxin Mi in milk,
1064H older, J. W., see Rains, D. M.H o lley , R. A. & Millard, G. E.
ultraviolet spectrometric determination of sorbic acid in dry fermented sausage, (Corr.), 349
H oogerheide, J. G., Strusiak, S. H., Taddei, C. R., Townley, E. R., & Wyka, B. E.HPLC determination of clotrimazole in
pharmaceutical formulations, 864 H oogm artens, J. H ., see Roets, E. E.H oogm artens, J. H ., Roets, E. E., & Vanderhaeghe,
H.J.identification of cephalosporins. II. color reactions
and TLC, 173H oover, W. L., see Melton, J. R.H oover, W. L. & Melton, J. R.
jack bean meal as source of urease in determination of urea, 1256
H opes, T. M.report on drugs, miscellaneous, 362
H opper, M . L.gel permeation system for removal of fats during
analysis of foods for residues of pesticides and herbicides, 720
H orton, K. M ., see Kruggel, W. G.H orw itz, W., book review, 348
book review, 777analytical methods for sulfonamides in foods and
feeds. I. review of methodology, 104 review of analytical methods for sulfonamides in
foods and feeds. II. performance characteristics of sulfonamide methods, 814
H otch k iss, J. H.analytical methodology for sample preparation,
detection, quantitation, and confirmation of N- nitrosamines in foods: review paper, 1037
H otch k iss, J. H ., Havery, D. C., & Fazio, T. rapid method for estimation of N-
nitrosodimethylamine in malt beverages, 929 H o w ell, M . V. & Taylor, P. W.
determination of aflatoxins, ochratoxin A, and zearalenone in mixed feeds, with detection by TLC or HPLC, 1356
H unt, D . A ., Lucas, J. P., McClure, F. D., Springer, J., & Newell, R.comparison of modified A-l method with
standard EC test for recovery of fecal coliform bacteria for shellfish, 607
H unter, G. B., Woodis, T. C., Jr, & Johnson, F. J. simultaneous determination of aluminum, iron,
calcium, and magnesium in wet-process phosphoric acid by dc argon plasma emission spectrometry, 25
H unter, J. S.calibration and the straight line: current statistical
practices, 574H urst, W. J., McKirn, J. M„ & Martin, R. A. Jr
ion pairing HPLC determination of amaranth in licorice products, 1411
Ibe, A ., see Kamimura, H.Inoue, T ., Iwaida, M., Ito, Y., & Tonogai, Y.
GLC detection and determination of diacetyl tartaric acid ester of diglyceride in dairy and nondairy coffee cream powders, 276
Issh ik i, K., Tsumura, S., & Watanabe, T.GC determination of propionic acid in bread and
cake, 280Ito, Y., see Inoue, T.Ito, Y., Tonogai, Y., Suzuki, H., Ogawa, S.,
Yokoyama, T., Hashizume, T„ Santo, H., Tanaka,K.-I., Nishigaki, K., & Iwaida, M. improved 4-aminoantipyrine colorimetry for
detection of residual hydrogen peroxide in noodle, fish paste, dried fish, and herring roe, 1448
Iverson, J. L. & Bueno, M. P.evaluation of HPLC and GLC for quantitative
determination of sugars in foods, 139 Ivie , G. W ., see Phillips, T. D.Iw aida, M ., see Inoue, T.; Ito, Y.Iw ashim a, K., see Taguchi, M.Iyengar, J. R., see Lawrence, J. F.
Jackson, E. R., book review, 1270 report on pesticide formulations:
organophosphorus pesticides, 356 Jacobs, E., see DeSiena, A.Januszanis, M ., see Winkler, V. W.
14 88 A UTHOR INDEX: J. ASSOC. OFF. ANAL. CHEM . (VOL. 64, N O . 6, 1981)
Jensen, D. J., see Skelly, N . E.Joe, F. L., Jr, Roseboro, E. L., & Fazio, T.
HPLC method for determination of polynuclear aromatic hydrocarbons in beer, 641
Johnson, A. R., see Willett, D. N.report on sugars and sugar products, 391
Johnson, F. J., see Hunter, G. B.Johnson, R. N ., see Lyman, G. W.Johnston, M. R., see Boland, F. E.Jones, C. E.
report on feeds, 351 Jones, F. E. & Brickenkamp, C. S.
automatic Karl Fischer titration of moisture in grain, 1277
Jorgensen, K. V ., see Price, R. L.Jung, P. D.
report on pesticide formulations: carbamate and substituted urea insecticides, 353
Kalra, R. L., see Kapoor, S. K.Kamat, S. S., see Sane, R. T.Kamimura, H., Nishijima, M., Yasuda, K., Saito, K.,
Ibe, A., Nagayama, T., Ushiyama, H., & Naoi, Y. simultaneous detection of several Fusarium
mycotoxins in cereals, grains, and foodstuffs, 1067
Kan, G. Y. P., Mah, F. T. S., Wade, N. L., & Bothwell,M.L.determination of 2,4-D butoxyethanol ether ester
and its degradation products 2,4- dichlorophenoxyacetic acid and 2,4- dichlorophenol in sediment, 1305
K ane, P. F., Bennett, B. R., & Gulik, S.data handler-controller system for phosphorus
pentoxide and potassium oxide in fertilizers, 1322
Kanhere, S. R., see Scott, P. M.Kapoor, S. K., Chawla, R. P., & Kalra, R. L.
simplified method for estimation of DDT and hexachlorocyclohexane residues in milk, 14
Karoly, G., see Ambrus, A.Katz, S.
report on antibiotics, 412 Kawashim a, R., see Tobioka, H.K elly , P. C.
correction of bias in collaborative check sample series reporting, 1344
K ho, B. T., see Lyman, G. W.K issinger, J. C., see Quackenbush, F. W.K leopfer, R. D ., see Easley, D. M.K olbe, E., see Reichel, W. L.K oles, J. E., book review, 1271 K ottem ann, J. B., see Romano, A., Jr K ountourellis, J. E., see Owen, J. T. R.Kovar, J.
oscillating U-tube density meter determination of alcoholic strength: analysis of parameter errors, 1424
K ozlosk i, R. P.novel TLC techniques for aflatoxin analysis, 1263
Krause, R. T., see Wheeler, W. B.K rinitz, B., see Quackenbush, F. W.K rinitz, B. & Tepedino, N.
lead in preserved duck eggs: field screening test and confirmation and quantitation by AAS and ASV, 1014
K ruggel, W. G., Field, R. A., Riley, M. L„ Radloff, H.D„ & Horton, K. M.near-IR reflectance determination of fat, protein,
and moisture in fresh meat, 692 K rzynow ek, J. & Wiggin, K.
generic identification of cooked and frozen crabmeat by thin layer polyacrylamide gel isoelectric focusing: collaborative study, 670
K ubena, L. F., see Phillips, T. D.K unerth, W ., see Casper, H. H.K venberg, J. E.
comparison of larval stored product beetle mandibles by light microscope and scanning electron microscope, 199
L'Abbe, M. R., see Fischer, P. W. F.Lane, S. A ., see Heckman, M. M.Lanouette, M ., see Cochrane, W. P.Lantos, J., see Ambrus, A.Lao, C. S., see Romano, A., Jr Lapointe, M ., see Cohen, H.Larry, D.
report on flavors and nonalcoholic beverages, 388 Larsen, B.
report of the Treasurer and the finance committee, 451
Lau, H. P., Fan, S. L., & Chu, F. S.preparation and characterization of aflatoxin Q]-
hemisuccinate, 681 Lau, P.-Y., see Scott, P. M.Launer, J. E., see Van Rossum, B.
report on pesticide formulations: halogenated and other insecticides, 354
Lawrence, J. F., Iyengar, J. R., & Conacher, H. B. S.gravimetric determination of ethoxylated mono-
and diglycerides in bread, 1462 Lawrence, R. C., see Black, D. B.Lea, A. R., see Hailey, D. M.LeBel, G. L., see Williams, D. T.LeBel, G. L., Williams, D. T., & Benoit, F. M.
GC determination of trialkyl and triaryl phosphates in drinking water, following isolation using macroreticular resin, 991, (Corr.), 1269
Lee, S. & Chu, F. S.radioimmunoassay of T-2 toxin in biological
fluids, 684radioimmunoassay of T-2 toxin in corn and wheat,
156
A U TH O R INDEX: J. ASSOC. OFF. ANAL. CHEM . (VOL. 64, N O . 6, 1981) 1 4 89
Li, Y., see Pestka, J. J.Libbey, L. M. & Scanlan, R. A.
anomalies in the mass spectrum of N- nitrosopyrrolidine, 1255
Lim , F. F.extraction of light filth from tea: collaborative
study, 287Lin, R. C., see Boland, F. E.L lew ellyn , G. C., Burkett, M. L., & Eadie, T.
potential mold growth, aflatoxin production, and antimycotic activity of selected natural spices and herbs, 955
L lorente, M . A ., see West, L. G.L oew enstein , M ., see Chen, S.-L. Y.L osiew icz, E. H.
report of the committee on safety, 466 Lovering, E. G., see Black, D. B.Lucas, J. P., see Hunt, D. A.Luke, M. A ., Froberg, J. E., Doose, G. M., &
Masumoto, H. T.improved multiresidue GC determination of
organophosphorus, organonitrogen, and organohalogen pesticides in produce, using flame photometric and electrolytic conductivity detectors, 1187
Lundstrom , R. C.fish species identification by isoelectric focusing:
sarcoplasmic protein polymorphism in monkfish (Lophius americanus), 32
rapid fish species identification by agarose gel isoelectric focusing of sarcoplasmic proteins, 38
Lyman, G. W., Johnson, R. N., & Kho, B. T.GSC determination of oxygen in various
pharmaceutical products, 177
MacLean, D . B.report of the Executive Director, 446
M adigan, E. A ., see Calvey, R. J.M ah, F. T. S., see Kan, G. Y. P.M ah, R. A ., see Margler, L. W.M aienthal, M ., book review, 1272 M alanoski, A. J., see Helrich, K.M alanoski, A. J., Barnes, C. J., & Fazio, T.
comparison of 3 methods for determination of sulfamethazine in swine tissues: collaborative study, 1386
M allet, V . N ., see Hache, P.M altese, L., see Ferren, W.M anley, D ., see Gregory, J. F., Ill M anuel, A. J. & Steller, W. A.
GLC determination of sulfamethazine in swine and cattle tissues, 794
M argler, L. W. & Mah, R. A.TLC and AAS determination of methyl mercury,
1017M arquette, R., see Hache, P.M artijn, A ., see Van Rossum, B.
M artin, G. E., Burggraff, J. M., Dyer, R. H., & Buscemi, P. C.GLC determination of congeners in alcoholic
products with confirmation by GC-MS, 186 M artin, G. E., Noakes, J. E., Alfonso, F. C , & Figert,
D.M.liquid scintillation counting of 14C for
differentiation of synthetic ethanol from ethanol of fermentation, 1142
M artin, G. E., Alfonso, F. C , Figert, D. M., & Burggraff, J. M.stable isotope ratio determination of the origin of
vanillin in vanilla extracts and its relationship to vanillin/potassium ratios, 1149
M artin, R. A. Jr, see Hurst, W. J.Massart, D . L., see Puttemans, M. L.M asum oto, H. T., see Luke, M. A.M ath ew son , P. R., Fahrenholz, C. H„ Booth, G. D.,
Miller, B. S., & Pomeranz, Y. colorimetric alpha-amylase, falling number, and
amylograph assays of sprouted wheat: collaborative study, 1243
M ay, J. C. & Sih, J. T C.protein nitrogen unit precipitation procedure for
allergenic extracts: collaborative study, 1435 M cClure, F. D ., see Andrews, W. H.; Boland, F. E.;
Hunt, D. A.; Wehr, M.M cC ully, K.
report of the committee on laboratory quality assurance, 464
M cC ully, K. A.report on organophosphorus pesticides, 401
M cD on n ell, J. P., see George, G. M.M cG ill, D . L.
comparison of automated method and improved AOAC Kjeldahl method for determination of protein in meat and meat products, 29
M cK enzie, A. D ., see Dabeka, R. W.M cKim , J. M ., see Hurst, W. J.M cK inley , W. P.
president's address, 1980, the challenges of independence, 237
M cK inney, J. D .evaluation of laboratory performance with
aflatoxin methods by means of the AOCS Smalley Check Sample Program, 939
M cM ahon, B. M.report on organochlorine pesticides, 400
M cN eal, T. & Breder, C. V.headspace sampling and GSC determination of
residual acrylonitrile in acrylonitrile copolymer solutions, 270
M eier, J., Nowak, K., Suter, R., Tomann, A., & Bosshardt, H. P.GLC determination of terbuthylazine technical
and its formulations: collaborative study, 825 M elton , J. R., see Hoover, W. L.M elton , J. R. & Hoover, W. L.
microwave oven drying in the gravimetric phosphorus method, 1319

1 4 90 A U TH O R INDEX: J. ASSOC. OFF. ANAL. CHEM . (VOL. 64, N O . 6, 1981)
M eranger, J. C., Subramanian, K. S., & Chalifoux, C. survey for Cd, Co, Cr, Cu, Ni, Pb, Zn, Ca, and Mg
in Canadian drinking water supplies, 44 M id k iff, V. C., see Goleb, J. A.M illar, J. F., see Roman, R.M illard, G. E., see Holley, R. A.M iller, B. S., see Mathewson, P. R.M inyard, J. P., Jr
report of the editorial board, 452 M isk iew icz, M. A., see Prager, M. J.M itch ell, H. L.
report on plants, 358 M itch ell, J. D . & Benjamin, C. R.
automated thermal conductivity determination of carbon dioxide in wine, 547
M oore, H. P., Hanks, A. R., Zweig, G., Collier, R. H., & Glocker, E. M.report of committee A on recommendations for
official methods, 419 M oore, H. P.
report of the committee on state and provincial participation, 466
M ourer, C., see Winterlin, W.M ueller-B rennecke, D ., Reed, S. J., & Barkate, J. A.
turbidimetric assay for virginiamycin in feeds and premixes, 319
M uir, D . C. G., Grift, N. P., & Solomon, J. extraction and cleanup of fish, sediment, and
water for determination of triaryl phosphates by GLC, 79
M ulder, F. J., see De Vries, E. J.M ulder, F. J., De Vries, E. J., & Borsje, B.
analysis of fat-soluble vitamins. XXIV. HPLC determination of vitamin D in vitamin D resin containing powders: collaborative study, 58
M ulvaney, T. R., see Boland, F. E.report on processed vegetable products, 384
M urthy, G. K. & Peeler, J. T.determination of alkaline phosphatase in casein:
collaborative study, 623 M usial, C. J., see Burns, B. G.M usser, J. C.
report on cacao products, 387
Nagayam a, T., see Kamimura, H.Nanda Kumar, N . V ., see Prameela Devi, Y.; Udaya
Bhaskar, S.Nanda Kumar, N. V. & Prameela Devi, Y.
paper and micro TLC methods for determination of mercuric chloride and detection of copper sulfate, 729
portable and sensitive detector strips for rapid detection of organophosphorus, mercury, copper, cadmium, and silver compounds, 841, (Corr.), 1269
N anda Kumar, N .V . & Ramasundari, M. colorimetric determination of methyl parathion
and oxygen analog, (Corr.), 233
N aoi, Y., see Kamimura, H.N eedham , L. L., Burse, V. W., & Price, H. A.
temperature-programmed GC determination of PCBs and PBBs in serum, 1131
N elson , J.NMR spectroscopic method for determination of
penicillamine in capsules, 1174 N ew ell, R., see Hunt, D. A.N ew k irk , D. R. & Sheppard, A. J.
HPLC determination of cholesterol in foods, 54 N ew som e, W. H.
report on fungicides, herbicides, and plant growth regulators, 394
N ish igak i, K., see Ito, Y.N ishijim a, M ., see Kamimura, H.N oakes, J. E., see Martin, G. E.N oel, R. J.
report on drugs in feeds, 416 N ow ak , K., see Meier, J.N ow ick i, H . G.
application of azulene as visual aid to monitor column chromatographic fractionation of samples for pesticide and PCB determination, 16
Obiakara, A. C., see Elsayed, M. A-H.O 'D on nell, M . W., see Willett, D. N.O gawa, S., see Ito, Y.O lsen, A. R.
distinguishing common food-contaminating bat hairs from certain feather barbules, 786
O lson, O. E., Herr, A. A., & Palmer, I. S.effect of bentonites on fluorometric selenium
determination, 1088 O'Rangers, J.
report on biochemical methods, 413 O w en, J. T. R., Kountourellis, J. E„ & Underwood, F.
A.X-ray powder diffraction data for 9 medicinal 2-
imidazolines, 1164
Palm er, I. S., see Olson, O. E.Pandit, A. D ., see Sane, R. T.Papa, A ., see Ambrus, A.Park, C., see Wehr, M.Pasutto, F. M ., see Hargesheimer, E. E.Patel, J. R., see Winkler, V. W.Patterson, D. S. P., see Roberts, B. A.Payne, W. R. Jr & Benner, J. E.
liquid and GC analysis of diethyl phthalate in water and sediment, 1403
Peeler, J. T., see Murthy, G. K.; Zipkes, M. R.Peeler, J. T. & Gilchrist, J. E., book review, 1270 P erfetti, G. A ., Warner, C. R„ & Fazio, T.
HPLC determination of ethoxyquin in paprika and chili powder, 1453
HPLC determination of methyl and propyl p- hydroxybenzoates in comminuted meats, 844
A U TH O R INDEX: J. ASSOC. OFF. ANAL. CHEM . (VOL. 64, N O . 6, 1981) 1491
Pestka, J. J., see El-Nakib, O.Pestka, J. J., Li, Y„ Harder, W. O., & Chu, F. S.
comparison of radioimmunoassay and enzyme- linked immunosorbent assay for determining aflatoxin Mi in milk, 294
P faffenberger, C. D ., see Briggle, T. V.Phillips, J. G., see Doner, L. W.Phillips, T. D ., Ivie, G. W„ Heidelbaugh, N. D.,
Kubena, L. F., Cysewski, S. J., Hayes, A. W„ & Witzel, D. A.confirmation of penicillic acid by HPLC and GLC,
162Poelm a, P. L., see Andrews, W. H.Poelm a, P. L., Andrews, W. H., & Wilson, C. R.
pre-enrichment broths for recovery of Salmonella from milk chocolate and edible casein: collaborative study, 893
Pom eranz, Y., see Mathewson, P. R.Wiley Award address, 1980, field-laboratory
interactions to advance grain research, 240 Post, L. O., see Ray, A. C.Prager, M. J. & Miskiewicz, M. A.
GC-MS analysis, identification, and detection of adulteration of perfumery products from bitter orange trees, 131
Prameela D ev i, Y., see Nanda Kumar, N. V. Prameela D ev i, Y. & Nanda Kumar, N. V.
simple paper and micro TLC method for separation and detection of mercuric chloride, copper sulfate, cadmium sulfate, and silver nitrate in fresh water, 1301
Price, H . A ., see Needham, L. L.Price, R. L., Jorgensen, K. V., & Billotte, M.
citrus artifact interference in aflatoxin Mj determination in milk, 1383
Pum a, B. J., see Helrich, K.Puttem ans, M. L., Dryon, L„ & Massart, D. L.
ion-pair HPLC of synthetic water-soluble acid dyes, 1
Q uackenbush, F. W., Kissinger, J. C., George, E., Jr, Krinitz, B„ & Ruggles, D.report of committee D on recommendations for
official methods, 429
Rabel, F. M.care of reverse phase HPLC columns when
injecting extracts of fat- or oil-based preparations, 1258
Radloff, H. D., see Kruggel, W. G.Ragelis, E. P.
report on seafood toxins, 384 Ragheb, H. S.
bacitracin determination in feeds: evaluation of methods, 980
Rains, D . M. & Holder, J. W. ethylene dibromide residues in biscuits and
commercial flour, 1252
Rajpoot, N . C. & Govindarajan, V. S.paper chromatographic determination of total
capsaicinoids in capsicums and their oleoresins with precision, reproducibility, and validation through correlation with pungency in Scoville Units, 311, (Corr.), 1482
Ram asundari, M ., see Nanda Kumar, N.V.Rao, D . M . R.
improved cleanup technique for estimation of endosulfan residues from fish tissues under tropical conditions, 340
Ray, A. C., Post, L. O., & Reagor, J. C.HPLC determination of sodium fluoroacetate
(compound 1083) in canine gastric content, 19 Reagor, J. C., see Ray, A. C.R eazin, G. H ., see Byrne, K. J.R eed, G. F., see Cox. E. A.R eed, S. J., see Mueller-Brennecke, D.R eichel, W. L., Kolte, E„ & Stafford, C. J.
GLC and GLC-MS determination of fenvalerate and permethrir residues in grasshoppers and duck tissue samples, 1196
R ichter, E., see Ellefson, W. C.R iley , M. L., see Kruggel, W. G.Roberts, B. A., Glancy, E. M., & Patterson, D. S. P.
rapid, economical method for determination of aflatoxin and ochratoxin in animal feedstuffs, 961
R oets, E. E., see Hoogmartens, J. H.R oets, E. E., Hoogmartens, J. H., & Vanderhaeghe,
H.J.identification of cephalosporins. I. spectroscopic
methods, 166Rojas, P., see Corominas, L. F.R om agnoli, R., see DeSiena, A.Rom an, R., Yates, C. H., Millar, J. F„ &
Vandenheuvel, W. J. A.GC-MS study of isoequilin A, 1259
Rom ano, A ., Jr, Sarnoff, E., Thom, J. V., Kottemann,J. B„ & Lao, C. S.report of committee B on recommendations for
official methods, 423 R oos, R. W.
HPLC determination of sulfisoxazole in pharmaceuticals and separation patterns of other sulfonamides, 851
R oseboro, E. L., see Joe, F. L., Jr R ossi, L.
4th interlaboratory study of methods for determining tctal migration of plastic materials in liquids simulating fatty foodstuffs, 697
R ow e, N . W ., see Smallidge, R. L.R oybal, J. E.
HPLC determination of melengestrol acetate in dry feed supplements, 661
R uggles, D ., see Quackenbush, F. W.Rund, R. C.report on fertilizers and agricultural liming
materials, 352
1 4 9 2 A U TH O R INDEX: J. ASSOC. OFF. ANAL. CH EM . (VOL. 64, N O . 6, 1981)
Saito, K., see Kamimura, H.Saltzm an, B. E.
report of intersociety committee on methods for air sampling and analysis, 462
Sanchez Rasero, F.AAS method for determination of water-soluble
copper in water-insoluble copper fungicides: CIPAC collaborative study, comparison with bathocuproine method, 75
Sanchez Rasero, F. & Henriet, J.bathocuproine method for determining water-
soluble copper in water-insoluble copper fungicides: CIPAC collaborative study, (Corr.), 233
Sanders, A. C.report on microbiological methods, 408
Sane, R. T., Kamat, S. S., & Pandit, A. D.colorimetric method for determination of ethanol
in presence of methanol, 1145 Santo, H ., see Ito, Y.Sarnoff, E., see Romano, A., Jr Sarvari, L., see Ambrus, A.Scanlan, R. A ., see Libbey, L. M.Schall, E. D.
report of the committee on collaborative studies, 458
Schiem ann, D. A., see Wehr, M.Schneider, L. C., see Wainer, I. W.Schranz, J. L., see Awe, M. J.Scott, P. M., Lau, P.-Y., & Kanhere, S. R.
determination of deoxynivalenol in wheat and other grains by GC with electron capture and MS detection, 1364
Scott, P. M.report of the joint committee on mycotoxins, 462
Seam an, S., see Sen, N. P.Sen , N. P. & Seaman, S.
GLC-thermal energy analyzer determination of N-nitrosodimethylamine in beer at low parts per billion level, 933
volatile N-nitrosamines in dried foods, 1238 Shah, A. K., see Devani, M. B.Shaikh, B. & Hallmark, M. R.
HPLC determination of methapyrilenehydrochloride in feed and sleep aid tablets, 889
Shallenberger, R. S., see Wrolstad, R. E.Shantha, T. & Sreenivasa Murthy, V.
use of sunlight to partially detoxify groundnut (peanut) cake flour and casein contaminated with aflatoxin Bi, 291
Sheppard, A. J., see Newkirk, D. R.Shishoo, C. J., see Devani, M. B.S h otw ell, O. L., see Stubblefield, R. D.S h otw ell, O. L. & Holaday, C. E.
minicolumn detection methods for aflatoxin in raw peanuts: collaborative study, 674
S h otw ell, O. L., Burg, W. R„ & Diller, T.TLC determination of aflatoxin in corn dust, 1060
S ih , J. T. C., see May,J.C.Sim onaitis, R. A., Cail, R. S., & Zehner, J. M.
rapid cleanup procedure for GLC determination of chlorpyrifos-methyl residues in cat food, 1227
Sim p son , R. E.report on radioactivity, 405
Singh, S. B., see Duve, R. N.S k elly , N . E., Jensen, D. J., & Anderson, P. K.
HPLC analysis of chlorpyrifos-containing insecticidal formulations: collaborative study, 628, (Corr.), 1269
Sm allidge, R. L., Rowe, N. W., Wadgaonkar, N. D., & Stringham, R. W.HPLC determination of furazolidone in feed and
feed premixes, 1100 Sm ith , B.
report of the committee on international cooperation, 461
Sm ith , E.report on drugs, alkaloids, 361
Snyder, R. C. & Breder, C. V.high performance size exclusion chromatograph
with computerized data reduction for analysis of polyethylene and oligomers, 999
molecular weight characterization of food grade polyethylenes and extractables by size exclusion chromatography, 1008
Solim an, A .-G. M.comparison of manual and benzenesulfonyl
chloride-semiautomated thiochrome methods for determination of thiamine in foods, 616
S olom on , J., see Muir, D. C. G.Soni, S. K. & Van Gelder, D.
separation and characterization of standard propoxyphene diastereomers and their determination in pharmaceutical and illicit preparations, 875
S p om s, P.HPLC determination of phenol in honey, 337
Springer, J., see Hunt, D. A.Sreenivasa M urthy, V ., see Shantha, T.Stafford, C. J., see Reichel, W. L.S taruszk iew icz, W . F., Jr, see Chambers, T. L. S taruszk iew icz, W. F., Jr & Bond, J. F.
GC determination of cadaverine, putrescine, and histamine in foods, 584
S taruszk iew icz, W. F., Jrreport on decomposition and filth in foods
(chemical methods), 366 Steller, W. A., see Manuel, A. J.S to lo ff, L., see Trucksess, M. W.S to lo ff, L. & Trucksess, M. W.
effect of boiling, frying, and baking on recovery of aflatoxin from naturally contaminated corn grits or cornmeal, 678
S to lo ff, L.report on mycotoxins, 373
Storherr, R. W.report on carbamate pesticides, fumigants, and
miscellaneous, 393
A UTHOR INDEX: J. ASSOC. OFF. ANAL. CHEM . (VOL. 64, N O . 6, 1981) 1 4 9 3
Stringham , R. W ., see Smallidge, R. L.Strunk, D . H ., Hamman, J. W., Aicken, J. C., &
Andreasen, A. A.density meter determination of proof of alcoholic
beverages: collaborative study, 550 Strunk, D. H ., Timmel, B. M., Hamman, J. W., &
Andreasen, A. A.determination of color intensity of whisky and
other alcoholic products, 541 Strusiak, S. H ., see Hoogerheide, J. G.S tu b b lefie ld , R. D ., see Van Egmond, H. P. S tu b b lefie ld , R. D . & Shotwell, O. L.
determination of aflatoxins in animal tissues, 964 Subram anian, K. S., see Meranger, J. C.Suddendorf, R. F., Wright, S. K„ & Boyer, K. W.
sampling procedure and determination of lead in canned foods, 657
Suddendorf, R. F., Watts, J. O., & Boyer, K. W.simplified apparatus for determination of mercury
by AAS and inductively coupled plasma emission spectroscopy, 1105
Suter, R., see Meier, J.Suzuki, H ., see Ito, Y.Szabo, L., see Ambrus, A.
Taddei, C. R., see Hoogerheide, J. G.T aguchi, M ., Takagi, H., Iwashima, K., & Yamagata,
N.metal content of shark muscle powder biological
reference material, 260 Takagi, H ., see Taguchi, M.Tanaka, K .-I., see Ito, Y.Tanner, J. T ., see Allegrini, M.T aylor, P. W., see Howell, M. V.T epedino , N-, see Krinitz, B.T hom , J. V ., see Romano, A., Jr
book review, 776T hom pson , N . P., see Guinivan, R. A.; Wheeler, W.
B.Thrasher, J. J. & Gecan, J. S.
chemical test for mammalian feces: collaborative study, 196
T im m el, B. M ., see Strunk, D. H.T obioka, H . & Kawashima, R.
GLC determination of hexestrol residues in adipose tissue, 709
Tom ann, A., see Meier, J.Tonogai, Y., see Inoue, T.; Ito, Y.T ow n ley , E. R., see Hoogerheide, J. G.Trauba, R. L.
determination of internal insect infestation of wheat: collaborative study, 1408
T renholm , H. L., Warner, R. M., & Farnworth, E. R. HPLC method using fluorescence detection for
quantitative analysis of zearalenone and a-zearalenol in blood plasma, 302
T rucksess, M . W., see Stoloff, L.
T rucksess, M. W. & Stoloff, L.HPLC determination of aflatoxicol in milk, blood,
and liver, 1083thin layer chromatographic determination of
aflatoxins in dry ginger root and ginger oleoresin, (Corr.), 349
Tsum ura, S., see Isshiki, K.Tuinstra-Lauwaars, M.
report of the European representative, 460Udaya Bhaskar, S. fa Nanda Kumar, N. V.
TLC determination of methyl parathion as paraoxon by cholinesterase inhibition, 1312
U nderw ood , F. A., see Owen, J. T. R.U shiyam a, H ., see Kamimura, H.U the, J. F., see Burns, B. G.U zodinm a, S. U., see Elsayed, M. A-H.V an d en h eu vel, W. J. A ., see Roman, R. V anderhaeghe, H. J., see Hoogmartens, J. H.; Roets,
E. E.Van Egm ond, H. P. & Stubblefield, R. D.
improved method for confirmation of identity of aflatoxins Bi and Mj in dairy products and animal tissue extracts, 152
Van G elder, D ., see Soni, S. K.Van P eteghem , C. H. & Dekeyser, D. A.
systematic identification of antioxidants in lards, shortenings, and vegetable oils by TLC, 1331
Van R ossum , B., Martijn, A., & Launer, J. E.GLC determination of tetradifon technical and
formulations: collaborative study, 829 Varner, S. L. & Breder, C. V.
headspace sampling and GC determination of styrene migration from food-contact polystyrene cups into beverages and food simulants, 1122
LC determination of residual styrene in polystyrene food packaging, 647
V injam oori, D . V ., see El-Ahraf, A.V isi, E., see Ambrus, A.V olp e, G ., see Hache, P.
W ade, N . L„ see Kan, G. Y. P.W adgaonkar, N . D., see Smallidge, R. L.W ahbi, A .-A . M . & Bararj, M.
spectrophotometric delermination of atropine sulfate in the presence of phenylmercury (II) acetate, 855
W ahbi, A .-A. M ., Belal, S., Bedair, M., & Abdine, H. spectrophotometric determination of procaine
hydrochloride in presence of 4-aminobenzoic acid, using a combined polynomial method, 1179
W ainer, I. W., Schneider, L. C., & Weber, J. D. application of chiral lanthanide NMR shift
reagents to pharmaceutical analysis. II. determination of dextro- and levoamphetamine mixtures, 848

1 4 9 4 A UTHOR INDEX: J. ASSOC. OFF. ANAL. CHEM . (VOL. 64, N O . 6, 1981)
W alash, M. I., see Hassan, S. M.W all, G. M. & Clark, C. R.
LC separation of some alkylaminocyclohexanecarbonitriles from phenylcyclohexylamines related to phencyclidine, 1431
W all, L. L„ Sr. & Gehrke, C. W.automated determination of urea and ammoniacal
nitrogen (NPN) in animal feeds, 1092 W all, L. L„ Sr
report of the committee on automated methods, 455
W altking, A. E. & Wessels, H.chromatographic separation of polar and nonpolar
components of frying fats, 1329 Warner, C. R., see Daniels, D. H.; Perfetti, G. A. Warner, R. M., see Trenholm, H. L.W asserman, A. E., see Fox, J. B.W atanabe, T., see Isshiki, K.W atson, J. R., see Black, D. B.W atts, J. O ., see Suddendorf, R. F.Weber, J. D., see Wainer, I. W.
book review, 776W ehr, M., Schiemann, D. A., Beloian, A., Park, C.,
Brickey, P. M., Jr, & McClure, F. D. report of committee F on recommendations for
official methods, 440 W eik, R. W.
report on dairy products, 365 W essels, H., see Waltking, A E.W est, D. B.
analysis and evaluation of barley used in malt beverage industry, 1138
W est, L. G. & Llorente, M. A.HPLC determination of lactose in milk, 805
W est, S. D. & Day, E. W. Jrextraction of aquatic herbicide fluridone from
water and determination by HPLC, 1205 W heeler, W. B., Thompson, N. P., Edelstein, R. L., &
Krause, R. T.degradation of methomyl residues in frozen
strawberries, 1211 W iggin , K., see Krzynowek, J.W ilkes, P. S.
GLC-MS confirmation of endosulfan and endosulfan sulfate in apples and carrots, 1208
W illett, D. N ., Campbell, A. D., Coffin, D. E., Johnson, A. R„ & O'Donnell, M. W.
report of committee C on recommendations for official methods, 425
W illiam s, D. T., see LeBel, G. L.W illiam s, D. T., LeBel, G. L., & Benoit, F. M.
identification of trialkyl and triaryl phosphates in distilled and Super-Q water, 635
W illis, W. V ., see El-Ahraf, A.W ilson , C. R., see Andrews, W. H.; Poelma, P. L. W inbush, J. S.
report of the committee on statistics, 467 W inkler, V. W., Patel, J. R., Januszanis, M., &
Colarusso, M.determination of norflurazon residues in mixed
crop matrices, 1309 W interlin , W ., Hall, G., & Mourer, C.
ultra trace determination of furazolidone in turkey tissues by liquid partitioning and HPLC, 1055
W isnesk i, H . H ., see Ho, J. L.W itzel, D . A., see Phillips, T. D.W ojtow icz, E. J.
colorimetric determination of disulfiram in tablets: collaborative study, 554
W oodis, T. C., Jr, see Hunter, G. B.W right, S. K., see Suddendorf, R. F.W rolstad, R. E. & Shallenberger, R. S.
free sugars and sorbitol in fruits: a compilation from the literature, 91, (Corr.), 1035
W yer, G. D ., book review, 778 W yka, B. E., see Hoogerheide, J. G.
Yamagata, N ., see Taguchi, M. Yasuda, K., see Kamimura, H. Yates, C. H., see Roman, R. Yates, R. L., see Ho, J. L.
report on cosmetics, 415 Y okoyam a, T., see Ito, Y.
Zakar, F., see Ambrus, A.Zehner, J. M ., see Simonaitis, R. A.Z ell, T. E„ see Fox, J. B.Z ipkes, M. R., Gilchrist, J. E., & Peeler, J. T.
comparisons of yeast and mold counts by spiral, pour, and streak plate methods, 1465
Z w eig, G., see Moore, H. P.

SUBJECT INDEX: J. ASSOC. OFF. ANAL. CH EM . (VOL. 64, N O . 6, 1981) 1495
S U B J E C T IN D E X
A cetam inophencolorimetric determination of certain phenol
derivatives in pharmaceutical preparations, 1442 A crylon itrile
headspace sampling and GSC determination of residual acrylonitrile in acrylonitrile copolymer solutions, 270
A flatox icolHPLC determination of aflatoxicol in milk, blood,
and liver, 1083 A flatoxins
citrus artifact interference in aflatoxin Mi determination in milk, 1383
comparison of radioimmunoassay and enzyme- linked immunosorbent assay for determining aflatoxin Mi in milk, 294
determination of aflatoxin Bi in corn, wheat, and peanut butter by enzyme-linked immunosorbent assay and solid phase radioimmunoassay, 1077
determination of aflatoxins in animal tissues, 964 determination of aflatoxins, ochratoxin A, and
zearalenone in mixed feeds, with detection by TLC or HPLC, 1356
effect of boiling, frying, and baking on recovery of aflatoxin from naturally contaminated corn grits or cornmeal, 678
evaluation of laboratory performance with aflatoxin methods by means of the AOCS Smalley Check Sample Program, 939
HPLC determination and fluorescence detection of aflatoxins in corn and dairy feeds, 1372
HPLC determination of aflatoxicol in milk, blood, and liver, 1083
HPLC determination of aflatoxins in animal tissues and products, 144
HPLC determination of aflatoxins in spices, 1377 improved fluorometric-iodine method for
determination of aflatoxin in corn, 1074 improved method for confirmation of identity of
aflatoxins Bj and M: in dairy products and animal tissue extracts, 152
minicolumn detection methods for aflatoxin in raw peanuts: collaborative study, 674
novel TLC techniques for aflatoxin analysis, 1263 potential mold growth, aflatoxin production, and
antimycotic activity of selected natural spices and herbs, 955
preparation and characterization of aflatoxin Q r hemisuccinate, 681
rapid, economical method for determination of aflatoxin and ochratoxin in animal feedstuffs, 961
rapid screening method for aflatoxin Mi in milk, 1064
survey of North Dakota sunflower seeds for aflatoxin, 228
thin layer chromatographic determination of aflatoxins in dry ginger root and ginger oleoresin, (Corr.), 349
TLC determination of aflatoxin in corn dust, 1060 use of sunlight to partially detoxify groundnut
(peanut) cake flour and casein contaminated with aflatoxin Bj, 291
A gricultural lim in g m aterials See Fertilizers and agricultural liming materials
A ir sam p ling and analysis committee report, 462
A lcoh o lic beverages Changes in Methods, 505 Committee D report, 429 referee report, 386analysis and evaluation of barley used in malt
beverage industry, 1138automated thermal conductivity determination of
carbon dioxide in wine, 547 colorimetric method for determination of ethanol
in presence of methanol, 1145 density meter determination of proof of alcoholic
beverages: collaborative study, 550 determination and confirmation of N-
nitrosodimethylamine in beer, 1457 determination of color intensity of whisky and
other alcoholic products, 541 GLC determination of congeners in alcoholic
products with confirmation by GC-MS, 186 GLC-thermal energy analyzer determination of
N-nitrosodimethylamine in beer at low parts per billion level, 933
HPLC determination of /3-sitosterol and /3-sitosterol- n-glucoside in whisky, 181
HPLC method for determination of polynuclear aromatic hydrocarbons in beer, 641
liquid scintillation counting of 14C for differentiation of synthetic ethanol from ethanol of fermentation, 1142
oscillating U-tube density meter determination of alcoholic strength: analysis of parameter errors, 1424
rapid check on proof of rums, 792 rapid method for estimation of N-
nitrosodimethylamine in malt beverages, 929 Westphal plummet determination of alcohol in
distillates, 1420 Aldicarb
HPLC determination of aldicarb, aldicarb sulfoxide, and aldicarb sulfone in potatoes, 724
A lk a lin e phosphatasedetermination of alkaline phosphatase in casein:
collaborative study, 623
1 4 9 6 SUBJECT INDEX: J. ASSOC. OFF. ANAL. CHEM . (VOL. 64, N O . 6, 1981)
A lkalo id drugsChanges in Methods, no changes Committee B report, 423 referee report, 361spectrophotometric determination of atropine
sulfate in the presence of phenylmercury (II) acetate, 855
A llergen ic extractsprotein nitrogen unit precipitation procedure for allergenic extracts: collaborative study, 1435
A ltenueneHPLC preparation of alternariol, alternariol
methyl ether, and altenuene, 950 A lternariol
HPLC preparation of alternariol, alternariol methyl ether, and altenuene, 950
A m phetam inesapplication of chiral lanthanide NMR shift
reagents to pharmaceutical analysis. II. determination of dextro- and levoamphetamine mixtures, 848
a-A m ylasecolorimetric alpha-amylase, falling number, and
amyiograph assays of sprouted wheat: collaborative study, 1243
A nalytical m ycology o f foods and drugsChanges in Methods, no changes Committee F report, 440 referee report, 406comparisons of yeast and mold counts by spiral,
pour, and streak plate methods, 1465 A n ilines
GLC determination of aniline metabolites of substituted urea and carbamate herbicides in aqueous solution, 833
A n tib ioticsChanges in Methods, 519 Committee G report, 442 referee report, 412bacitracin determination in feeds: evaluation of
methods, 980bromination methods for determination of
phenylephrine hydrochloride in nose drops, salicylamide in tablets, and tetracycline hydrochloride in capsules, 860
identification of cephalosporins. II. color reactions and TLC, 173
identification of cephalosporins. I. spectroscopic methods, 166
spectrophotometric determination of chloramphenicol and its esters in complex drug mixtures, 557
turbidimetric assay for virginiamycin in feeds and premixes, 319
A ntioxidantssystematic identification of antioxidants in lards,
shortenings, and vegetable oils by TLC, 1331 AOAC
air sampling and analysis committee, report, 462 Associate Referee of the Year, 1980, 344 automated methods committee, report, 455
banquet address, 1980, Dr. Harvey Wiley's brainchild, 75 years later, 256
Changes in Methods, 501 CIPAC, 24th annual meeting, report, 455 collaborative studies committee, report, 458 constitution committee, report, 459 editorial board report, 452 European representative's report, 460 Executive Director's report, 446 Fellows, 1980, (Corr.), 233 Fellows, 1981, 1266 finance committee, report, 451 interim official methods, 1268 international cooperation committee, report, 461 laboratory quality assurance committee, report,
464liaison representatives, 1981, 470 long-range planning committee, report, 465 meeting, 1980, 343mycotoxins, joint committee, report, 462 officers, 1981, 468Official Methods of Analysis, errata and
emendations, 530 president, 1981, 231president's address, 1980, the challenges of
independence, 237recommendations for official methods, committee
report, 418reviewers of JAOAC manuscripts, 345 safety committee, report, 466 scholarship winner, 1981,1479 standing committees, 1981, 468 state and provincial participation committee,
report, 466statistics committee, report, 467 transactions, 1980, 418 Treasurer's report, 451Wiley Award address, 1980, field-laboratory
interactions to advance grain research, 240 Wiley Award winner, 1981, 1266
Argon plasm a em ission spectrom etryanalysis of laboratory animal feed for toxic and
essential elements by AAS and inductively coupled argon plasma emission spectrometry, 1284
simultaneous determination of aluminum, iron, calcium, and magnesium in wet-process phosphoric acid by dc argon plasma emission spectrometry, 25
ArprinocidLC method for determination of arprinocid in
feed: collaborative study, 973 A rtificia l sw eeteners
See Preservatives and artificial sweeteners A tom ic absorption spectrophotom etry
AAS determination of tin in canned foods using nitric acid-hydrochloric acid digestion and nitrous oxide-acetylene flame, 1297
AAS method for determination of water-soluble copper in water-insoluble copper fungicides:
SUBJECT INDEX: J. ASSOC. OFF. ANAL. CHEM. (VOL. 64, NO. 6, 1981) 1497
CIPAC collaborative study, comparison with bathocuproine method, 75
analysis of laboratory animal feed for toxic and essential elements by AAS and inductively coupled argon plasma emission spectrometry, 1284
hydrogen selenide evolution-electrothermal AAS method for determining nanogram levels of total selenium, 265
potentiometric and AAS determination of sulfonamides in pharmaceutical preparations, 1158
sodium hypophosphite as reducing agent for determination of submicrogram quantities of mercury in animal feeds and manures, 9
survey for Cd, Co, Cr, Cu, Ni, Pb, Zn, Ca, and Mg in Canadian drinking water supplies, 44
TLC and AAS determination of methyl mercury, 1017
Atropine sulfatespectrophotometric determination of atropine
sulfate in the presence of phenylmercury (II) acetate, 855
Automated methods committee report, 455
Azuleneapplication of azulene as visual aid to monitor
column chromatographic fractionation of samples for pesticide and PCB determination, 16
Bacitracinbacitracin determination in feeds: evaluation of
methods, 980 Bactericides
HPLC determination of cyanuric acid in human urine and pool water, 1222
Bakery productsethylene dibromide residues in biscuits and
commercial flour, 1252GC determination of propionic acid in bread and
cake, 280gravimetric determination of ethoxylated mono-
and diglycerides in bread, 1462 Baking powders and baking chemicals
Changes in Methods, no changes Benzoates
HPLC determination of methyl and propyl p- hydroxybenzoates in comminuted meats, 844
Biochemical methodsChanges in Methods, no changes Committee G report, 443 referee report, 413comparison of radioimmunoassay and enzyme-
linked immunosorbent assay for determining aflatoxin Mi in milk, 294
Biological samplescolorimetric method for determination of ethanol
in presence of methanol, 1145 GLC and GLC-MS determination of fenvalerate
and permethrin residues in grasshoppers and duck tissue samples, 1196
HPLC determination of aflatoxicol in milk, blood, and liver, 1083
HPLC determination of cyanuric acid in human urine and pool water, 1222
HPLC determination of sodium fluoroacetate (compound 1080) in canine gastric content, 19
HPLC method using fluorescence detection for quantitative analysis of zearalenone and «-zearalenol ir. blood plasma, 302
radioimmunoassay of T-2 toxin in biological fluids, 684
sodium hypophosphite as reducing agent for determination of submicrogram quantities of mercury in animal feeds and manures, 9
temperature-programmed GC determination of PCBs and PBBs in serum, 1131
BloodSee Biological samples
Book reviewsColorimetric Chemical Analytical Methods. 9th
Ed., 1032Environmental Carcinogens. Selected Methods of
Analysis. Vol. Ill—Analysis of Polycyclic Aromatic Hydrocarbons in Environmental Samples, 348
Food Microbiology. A Framework for the Future, 1270
Herbicide Handbook, Fourth Ed., 348 An Introduction to Synthesis Using Organocopper
Reagents, 1272Methods for Analysis of Musts and Wines, 779 Midland Macromolecular Monographs, Volume 7,
Silylated Surfaces, 1032 Molecular and Cellular Aspects of Carcinogen
Screening Tests, 1271 Nitrogen-15 Nuclear Magnetic Resonance
Spectroscopy, 776The Particle Atlas, Edition Two. Vol. V. Light
Microscopy Atlas and Techniques. Vol. VI. Electron Optical Atlas and Techniques, 1271
The Pesticide Manual: A World Compendium, 6 th Ed., 1270
Safe Handling of Chemical Carcinogens, Mutagens, Teratogens and Highly Toxic Substances. Vols 1 and 2, 778
Statistical Theory in Methodology of Trace Analysis, 777
USP Revision and the Fifteenth NF Revision, 776 Bread
See Bakery products
Cacao productsChanges in Methods, 505 Committee D report, 430 referee report, 387pre-enrichment broths for recovery of Salmonella
from milk chocolate and edible casein: collaborative study, 893

1498 SUBJECT INDEX: J. ASSOC. OFF. ANAL. CHEM. (VOL. 64, NO. 6, 1981)
CadaverineGC determination of cadaverine, putrescine, and
histamine in foods, 584 Canned foods
AAS determination of tin in canned foods using nitric acid-hydrochloric acid digestion and nitrous oxide-acetylene flame, 1297
sampling procedure and determination of lead in canned foods, 657
Capsicumspaper chromatographic determination of total
capsaicinoids in capsicums and their oleoresins with precision, reproducibility, and validation through correlation with pungency in Scoville Units, 311, (Corr.), 1482
Carbamate pesticides, fumigants, and miscellaneous Changes in Methods, 511 Committee E report, 432 referee report, 393degradation of methomyl residues in frozen
strawberries, 1211ethylene dibromide residues in biscuits and
commercial flour, 1252GLC and GLC-MS determination of fenvalerate
and permethrin residues in grasshoppers and duck tissue samples, 1196
GLC method for determining oxamyl in peppers, tomatoes, and cucumbers, 1216
HPLC determination of aldicarb, aldicarb sulfoxide, and aldicarb sulfone in potatoes, 724
HPLC determination of sodium fluoroacetate (compound 1080) in canine gastric content, 19
Carbohydratemulticomponent analysis of meat products, 1392
Carbon dioxideautomated thermal conductivity determination of
carbon dioxide in wine, 547 Carbon ratio mass spectrometry
detection of high fructose corn syrup in apple juice by MS 13C /12C analysis: collaborative study, 85
stable isotope ratio determination of the origin of vanillin in vanilla extracts and its relationship to vanillin/potassium ratios, 1149
Cephalosporinsidentification of cephalosporins. II. color reactions
and TLC, 173identification of cephalosporins. I. spectroscopic
methods, 166 Cereal foods
See also Grains Changes in Methods, 505 Committee D report, 430 referee report, 387
Changes in Methods, 501 index, 532
Check Sample Programscorrection of bias in collaborative check sample
series reporting, 1344
evaluation of laboratory performance with aflatoxin methods by means of the AOCS Smalley Check Sample Program, 939
Chloramphenicolspectrophotometric determination of
chloramphenicol and its esters in complex drug mixtures, 557
Chlorpheniramine maleateHPLC determination of antihistamine-adrenergic
combination products: collaborative study, 564 Chlorpyrifos
HPLC analysis of chlorpyrifos-containing insecticidal formulations: collaborative study, 628, (Corr.), 1269
rapid cleanup procedure for GLC determination of chlorpyrifos-methyl residues in cat food, 1227
simultaneous EC detection of chlorpyrifos and its major metabolite, 3,5,6-trichloro-2-pyridinol, after GPC, 1201
CholesterolHPLC determination of cholesterol in foods, 54
CIPACAAS method for determination of water-soluble
copper in water-insoluble copper fungicides: CIPAC collaborative study, comparison with bathocuproine method, 75
24th annual meeting report, 455 Clotrimazole
HPLC determination of clotrimazole in pharmaceutical formulations, 864
Cocainemass spectral quantitation of cocaine HC1 in
powders, 884 Coffee and tea
Changes in Methods, no changes Committee C report, 425 referee report, 365extraction of light filth from tea: collaborative
study, 287Collaborative International Pesticides Analytical
CouncilSee CIPAC
Collaborative studiescommittee report, 458
Color additivesChanges in Methods, 514 Committee G report, 443 referee report, 414HPLC determination of intermediates and side
reaction products in FD&C Yellow No. 5, 665 HPLC determination of intermediates and two
reaction by-products in FD&C Red No. 40: collaborative study, 324
ion-pair HPLC of synthetic water-soluble acid dyes, 1
ion pairing HPLC determination of amaranth in licorice products, 1411
spectrophotometric determination of phosphorus in certifiable straight color additives: collaborative study, 808
SUBJECT INDEX: J. ASSOC. OFF. ANAL. CHEM. (VOL. 6^, NO. 6, 1981) 1499
Colorimetrydetermination of color intensity of whisky and
other alcoholic products, 541 Column chromatography
application of azulene as visual aid to monitor column chromatographic fractionation of samples for pesticide and PCB determination, 16
HPLC determination of melengestrol acetate in dry feed supplements, 661
novel cleanup method for quantitative GC determination of trace amounts of di-2- ethylhexyl phthalate in fish lipid, 282
rapid cleanup procedure for GLC determination of chlorpyrifos-methyl residues in cat food, 1227
Compound 1080HPLC determination of sodium fluoroacetate
(compound 1080) in canine gastric content, 19 Constitution
committee report, 459 Copper
AAS method for determination of water-soluble copper in water-insoluble copper fungicides: CIPAC collaborative study, comparison with bathocuproine method, 75
Copper sulfatepaper and micro TLC methods for determination
of mercuric chloride and detection of copper sulfate, 729
Corn mealnew brine saturation method for extraction of
light filth from corn meal: collaborative study, 191
Corrections, 233,349,1035,1269,1482 Cosmetics
Changes in Methods, no changes Committee G report, 444 referee report, 415GC-MS analysis, identification, and detection of
adulteration of perfumery products from bitter orange trees, 131
GLC-thermal energy analyzer method for N- nitrosodiethanolamine in cosmetics, 1474
HPLC-thermal energy determination of N- nitrosodiethanolamine in cosmetics, 800
Cyanuric acidHPLC determination of cyanuric acid in human
urine and pool water, 1222
Dairy productsChanges in Methods, 505 Committee C report, 425 referee report, 365acid digestion determination of iodine in foods, 71 citrus artifact interference in aflatoxin Mi
determination in milk, 1383 comparison of radioimmunoassay and enzyme-
linked immunosorbent assay for determining aflatoxin Mi in milk, 294
determination of alkaline phosphatase in casein: collaborative study, 623
estimation of lactose hydrolysis by freezing point measurement in milk and whey substrates treated with lactases from various microorganisms, 1414
GC determination of cadaverine, putrescine, and histamine in foods, 584
GLC detection and determination of diacetyl tartaric acid ester of diglyceride in dairy and nondairy coffee cream powders, 276
HPLC determination of aflatoxicol in milk, blood, and liver, 1083
HPLC determination of aflatoxins in animal tissues and products, 144
HPLC determination of lactose in milk, 805 improved method for confirmation of identity of
aflatoxins Bi and Mi in dairy products and animal tissue extracts, 152
pre-enrichment broths for recovery of Salmonella from milk chocolate and edible casein: collaborative study, 893
rapid screening method for aflatoxin Mi in milk, 1064
simplified automated system for determination of vitamin A in milk, 225
simplified method for estimation of DDT and hexachlorocyclohexane residues in milk, 14
2,4-D butoxyethanol ether esterdetermination of 2,4-D butoxyethanol ether ester
and its degradation products 2,4- dichlorophenoxyacetic acid and 2,4- dichlorophenol in sediment, 1305
DDTsimplified method for estimation of DDT and
hexachlorocyclohexane residues in milk, 14 Decomposition and filth in foods (chemical
methods)Changes in Methods, 506 Committee C report, 426 referee report, 366GC determination of cadaverine, putrescine, and
histamine in foods, 584HPLC method for indole in shrimp: development
of method and collaborative study, 592 modified colorimetric method for determining
indole in shrimp, 783UV detection procedure for LC determination of
indole in shrimp, 603 Deoxynivalenol
determination of deoxynivalenol in wheat and other grains by GC with electron capture and MS detection, 1364
Derivatization proceduresconfirmation of penicillic acid by HPLC and GLC,
162GLC determination of aniline metabolites of
substituted urea and carbamate herbicides in aqueous solution, 833
GLC determination of sulfamethazine in swine and cattle tissues, 794
HPLC determination of sodium fluoroacetate (compound 1080) in canine gastric content, 19
1500 SUBJECT INDEX: J. ASSOC. OFF. ANAL. CHEM. (VOL. 64, NO. 6, 1981)
preparation and characterization of aflatoxin Qi- hemisuccinate, 681
Diastatic poweranalysis and evaluation of barley used in malt
beverage industry, 11382.4- Dichlorophenol
determination of 2,4-D butoxyethanol ether ester and its degradation products 2,4- dichlorophenoxyacetic acid and 2,4- dichlorophenol in sediment, 1305
2.4- Dichlorophenoxyacetic acid determination of 2,4-D butoxyethanol ether ester
and its degradation products 2,4- dichlorophenoxyacetic acid and 2,4- dichlorophenol in sediment, 1305
Dicumarolspectrophotometric determination of dicumarol in
sweet clover, 689 Disinfectants
Changes in Methods, no changes Committee F report, 440 referee report, 407
Disulfiramcolorimetric determination of disulfiram in
tablets: collaborative study, 554 Drug residues in animal tissues
Changes in Methods, no changes Committee G report, 444 referee report, 415analytical methods for sulfonamides in foods and
feeds. I. review of methodology, 104 comparison of 3 methods for determination of
sulfamethazine in swine tissues: collaborative study, 1386
GLC determination of hexestrol residues in adipose tissue, 709
GLC determination of sulfamethazine in swine and cattle tissues, 794
review of analytical methods for sulfonamides in foods and feeds. II. performance characteristics of sulfonamide methods, 814
ultra trace determination of furazolidone in turkey tissues by liquid partitioning and HPLC, 1055
DrugsSee also Alkaloid drugs See also AntibioticsSee also Drug residues in animal tissues See also Drugs, acidic and neutral nitrogenous
organicsSee also Drugs, miscellaneous See also Drugs, nonalkaloid organic nitrogenous
basesSee also Narcotic and dangerous drugs See also Steroid and terpinoid drugs chloridometer determination of alien halide
content of iodine, 1446 GSC determination of oxygen in various
pharmaceutical products, 177
Drugs, acidic and neutral nitrogenous organicsChanges in Methods, no changes Committee B report, 423 referee report, 360bromination methods for determination of
phenylephrine hydrochloride in nose drops, salicylamide in tablets, and tetracycline hydrochloride in capsules, 860
colorimetric determination of certain phenol derivatives in pharmaceutical preparations, 1442
HPLC determination of sulfisoxazole in pharmaceuticals and separation patterns of other sulfonamides, 851
polarographic analytical study of oxyphenbutazone, 1439
potentiometric and AAS determination of sulfonamides in pharmaceutical preparations, 1158
Drugs, alkaloidSee Alkaloid drugs
Drugs in feedsSee also Antibiotics Changes in Methods, 519 Committee G report, 444 referee report, 416analytical methods for sulfonamides in foods and
feeds. I. review of methodology, 104 HPLC determination of furazolidone in feed and
feed premixes, 1100HPLC determination of melengestrol acetate in
dry feed supplements, 661 HPLC determination of nifursol in finished feeds,
969HPLC method for pyrantel tartrate in swine feeds
and supplements, 1291LC method for determination of arprinocid in
feed: collaborative study, 973 Drugs, miscellaneous
Changes in Methods, 517 Committee B report, 424 referee report, 362colorimetric determination of disulfiram in
tablets: collaborative study, 554 NMR determination of methoxyflurane, 1154 protein nitrogen unit precipitation procedure for
allergenic extracts: collaborative study, 1435 Drugs, narcotic and dangerous
See Narcotic and dangerous drugs Drugs, nonalkaloid organic nitrogenous bases
Changes in Methods, 518 Committee B report, 424 referee report, 364bromination methods for determination of
phenylephrine hydrochloride in nose drops, salicylamide in tablets, and tetracycline hydrochloride in capsules, 860
HPLC determination of antihistamine-adrenergic combination products: collaborative study, 564
HPLC determination of clotrimazole in pharmaceutical formulations, 864
SUBJECT INDEX: J. ASSOC. OFF. ANAL. CHEM. (VOL. 64, NO. 6, 1981) 1501
HPLC determination of methapyrilene hydrochloride in feed and sleep aid tablets, 889
NMR spectroscopic method for determination of penicillamine in capsules, 1174
spectrophotometric determination of procaine hydrochloride in presence of 4-aminobenzoic acid, using a combined polynomial method, 1179
X-ray powder diffraction data for 9 medicinal 2- imidazolines, 1164
Drugs, steroids and terpinoids See Steroid and terpinoid drugs
Editorial boardannual report, 452
Eggs and egg products Changes in Methods, 506 Committee C report, 426 referee report, 367HPLC determination of aflatoxins in animal
tissues and products, 144 lead in preserved duck eggs: field screening test
and confirmation and quantitation by AAS and ASV, 1014
EndosulfanGLC-MS confirmation of endosulfan and
endosulfan sulfate in apples and carrots, 1208 improved cleanup technique for estimation of
endosulfan residues from fish tissues under tropical conditions, 340
Enzyme inhibition methods paper and micro TLC methods for determination
of mercuric chloride and detection of copper sulfate, 729
portable and sensitive detector strips for rapid detection of organophosphorus, mercury, copper, cadmium, and silver compounds, 841, (Corr.), 1269
simple paper and micro TLC method for separation and detection of mercuric chloride, copper sulfate, cadmium sulfate, and silver nitrate in fresh water, 1301
TLC determination of methyl parathion as paraoxon by cholinesterase inhibition, 1312
EnzymesChanges in Methods, no changes Committee C report, 426
Escherichia colicomparison of modified A-l method with
standard EC test for recovery of fecal coliform bacteria for shellfish, 607
Ethanolcolorimetric method for determination of ethanol
in presence of methanol, 1145 liquid scintillation counting of I4C for
differentiation of synthetic ethanol from ethanol of fermentation, 1142
EthoxyquinHPLC determination of ethoxyquin in paprika
and chili powder, 1453 Ethylene dibromide
ethylene dibromide residues in biscuits and commercial flour, 1252
European representative annual report, 460
Executive Director annual report, 446
Extractanalysis and evaluation of barley used in malt
beverage industry, 1138 Extraneous materials in foods and drugs
Changes in Methods, 525 Committee F report, 440 referee report, 407brine saturation technique for extraction of light
filth from rubbed and ground sage: intralaboratory study, 773
chemical test for mammalian feces: collaborative study, 196
comparison of larval stored product beetle mandibles by light microscope and scanning electron microscope, 199
determination of internal insect infestation of wheat: collaborative study, 1408
distinguishing common food-contaminating bat hairs from certain feather barbules, 786
extraction of light filth from tea: collaborative study, 287
extraction of thrips and other whole or equivalent insects from frozen blackberries and raspberries: collaborative study, 194
new brine saturation method for extraction of light filth from corn meal: collaborative study, 191
particle size and concentration adjustments of tomato products for Howard mold count, 570
FatsSee Oils and fats
FD&C Red No. 2ion pairing HPLC determination of amaranth in
licorice products, 1411 FD&C Red No. 40
HPLC determination of intermediates and two reaction by-products in FD&C Red No. 40: collaborative study, 324
FD&C Yellow No. 5HPLC determination of intermediates and side
reaction products in FD&C Yellow No. 5, 665 Fecal coliforms
automatic incubator for use with modified A-l test for enumerating fecal coliform bacteria in shellfish growing waters, 771
comparison of modified A-l method with standard EC test for recovery of fecal coliform bacteria for shellfish, 607 ,
interlaboratory evaluation of the AOAC method

1502 SUBJECT INDEX: J. ASSOC. OFF. ANAL. CHEM. (VOL. 64. NO. 6, 1981)
and the A-l procedure for recovery of fecal coliforms from foods, 1116
FeedsSee also Drugs in feeds Changes in Methods, no changes Committee A report, 419 referee report, 351analysis of laboratory animal feed for toxic and
essential elements by AAS and inductively coupled argon plasma emission spectrometry, 1284
automated determination of urea and ammoniacal nitrogen (NPN) in animal feeds, 1092
determination of aflatoxins, ochratoxin A, and zearalenone in mixed feeds, with detection by TLCorHPLC, 1356
effect of bentonites on fluorometric selenium determination, 1088
examination of the use of glass filter paper in asbestos-free fiber determination, 1275
HPLC determination and fluorescence detection of aflatoxins in corn and dairy feeds, 1372
HPLC determination of methapyrilene hydrochloride in feed and sleep aid tablets, 889
jack bean meal as source of urease in determination of urea, 1256
rapid, economical method for determination of aflatoxin and ochratoxin in animal feedstuffs, 961
review of analytical methods for sulfonamides in foods and feeds. II. performance characteristics of sulfonamide methods, 814
sodium hypophosphite as reducing agent for determination of submicrogram quantities of mercury in animal feeds and manures, 9
Fenitrothionfast cleanup of difficult substrates for
determination of fenitrothion and some derivatives, 1470
FenvalerateGLC and GLC-MS determination of fenvalerate
and permethrin residues in grasshoppers and duck tissue samples, 1196
Fertilizerscomparison of methods for determining sodium in
fertilizers, 704data handler-controller system for phosphorus
pentoxide and potassium oxide in fertilizers, 1322
microwave oven drying in the gravimetric phosphorus method, 1319
Fertilizers and agricultural lim ing materialsChanges in Methods, 501 Committee A report, 419 referee report, 352ammonia-selective electrode determination of
nitrogen in fertilizers, 1096 simultaneous determination of aluminum, iron,
calcium, and magnesium in wet-process phosphoric acid by dc argon plasma emission spectrometry, 25
Fibercomparison of dietary fiber methods for foods,
1339examination of the use of glass filter paper in
asbestos-free fiber determination, 1275 Filth
See Extraneous materials in foods and drugs Finance committee
annual report, 451 Fish and other marine products
See also Seafood toxins Changes in Methods, 506 Committee C report, 426 referee report, 367automatic incubator for use with modified A-l test
for enumerating fecal coliform bacteria in shellfish growing waters, 771
comparison of modified A-l method with standard EC test for recovery of fecal coliform bacteria for shellfish, 607
extraction and cleanup of fish, sediment, and water for determination of triaryl phosphates by GLC, 79
fish species identification by isoelectric focusing: sarcoplasmic protein polymorphism in monkfish (Lophius americanus), 32
GC determination of cadaverine, putrescine, and histamine in foods, 584
GC-MS determination of volatile organic compounds in fish, 653
generic identification of cooked and frozen crabmeat by thin layer polyacrylamide gel isoelectric focusing: collaborative study, 670
HPLC method for indole in shrimp: development of method and collaborative study, 592
improved 4-aminoantipyrine colorimetry for detection of residual hydrogen peroxide in noodle, fish paste, dried fish, and herring roe, 1448
improved cleanup technique for estimation of endosulfan residues from fish tissues under tropical conditions, 340
modified colorimetric method for determining indole in shrimp, 783
novel cleanup method for quantitative GC determination of trace amounts of di-2- ethylhexyl phthalate in fish lipid, 282
open digestion modification of AOAC method for determination of mercury in fish, 1027
rapid fish species identification by agarose gel isoelectric focusing of sarcoplasmic proteins, 38
UV detection procedure for LC determination of indole in shrimp, 603
Flavors and nonalcoholic beverages Changes in Methods, no changes Committee D report, 430 referee report, 388GLC determination of congeners in alcoholic
products with confirmation by GC-MS, 186 paper chromatographic determination of total
SUBJECT INDEX: J. ASSOC. OFF. ANAL. CHEM. (VOL. 64, NO. 6, 1981) 1503
capsaicinoids in capsicums and their oleoresins with precision, reproducibility, and validation through correlation with pungency in Scoville Units, 311, (Corr.), 1482
stable isotope ratio determination of the origin of vanillin in vanilla extracts and its relationship to vanillin/potassium ratibs, 1149
Fluoridemicrodiffusion and fluoride-specific electrode
determination of fluoride in infant foods: collaborative study, 1021
Fluridoneextraction of aquatic herbicide fluridone from
water and determination by HPLC, 1205 Food additives
Changes in Methods, 508 Committee C report, 427 referee report, 369analytical methodology for sample preparation,
detection, quantitation, and confirmation of N- nitrosamines in foods: review paper, 1037
determination and confirmation of N- nitrosodimethylamine in beer, 1457
GC determination of propionic acid in bread and cake, 280
GLC detection and determination of diacetyl tartaric acid ester of diglyceride in dairy and nondairy coffee cream powders, 276
GLC-thermal energy analyzer determination of N-nitrosodimethylamine in beer at low parts per billion level, 933
gravimetric determination of ethoxylated mono- and diglycerides in bread, 1462
headspace sampling and GSC determination of residual acrylonitrile in acrylonitrile copolymer solutions, 270
HPLC determination of ethoxyquin in paprika and chili powder, 1453
HPLC method for determination of polynuclear aromatic hydrocarbons in beer, 641
improved 4-aminoantipyrine colorimetry for detection of residual hydrogen peroxide in noodle, fish paste, dried fish, and herring roe, 1448
interaction between sample preparation techniques and colorimetric reagents in nitrite analysis in meat, 1397
ion-pair HPLC of synthetic water-soluble acid dyes, 1
rapid method for estimation of N- nitrosodimethylamine in malt beverages, 929
systematic identification of antioxidants in lards, shortenings, and vegetable oils by TLC, 1331
use of closed-system vacuum distillation for isolation of moderately volatile compounds, 769
volatile N-nitrosamines in dried foods, 1238 Food and Drug Administration
banquet address, 1980, Dr. Harvey Wiley's brainchild, 75 years later, 256
Food packagingheadspace sampling and GSC determination of
residual acrylonitrile in acrylonitrile copolymer solutions, 270
high performance size exclusion chromatograph with computerized data reduction for analysis of polyethylene and oligomers, 999
LC determination of residual styrene in polystyrene food packaging, 647
molecular weight characterization of food grade polyethylenes and extractables by size exclusion chromatography, 1008
4th interlaboratory study of methods for determining total migration of plastic materials in liquids simulating fatty foodstuffs, 697
Forensic sciencesChanges in Methods, 528 Committee G report, 445 referee report, 417
For Your Information, 231, 343, 775, 1030,1266,1479
Fruits and fruit productsChanges in Methods, 509 Committee D report, 431 referee report, 388degradation of methomyl residues in frozen
strawberries, 1211detection of high fructose corn syrup in apple
juice by MS 13C /I2C analysis: collaborative study, 85
extraction of thrips and other whole or equivalent insects from frozen blackberries and raspberries: collaborative s:udy, 194
free sugars and sorbitol in fruits: a compilation from the literature, 91, (Corr.), 1035
FumigantsSee Carbamate pesticides, fumigants, and
miscellaneous Fungicides
See Pesticide formulations: herbicides, fungicides, and miscellaneous
Fungicides, herbicides, and plant growth regulatorsChanges in Methods, 511 Committee E report, 433 referee report, 394determination of 2,4-D butoxyethanol ether ester
and its degradation products 2,4- dichlorophenoxyacetic acid and 2,4- dichlorophenol in sediment, 1305
determination of norflurazon residues in mixed crop matrices, 1309
extraction of aquatic herbicide fluridone from water and determination by HPLC, 1205
gel permeation system for removal of fats during analysis of foods for residues of pesticides and herbicides, 723
GLC determination of aniline metabolites of substituted urea and carbamate herbicides in aqueous solution, 833
1504 SUBJECT INDEX: J. ASSOC. OFF. ANAL. CHEM. (VOL. 64, NO. 6, 1981)
HPLC determination of cyanuric acid in human urine and pool water, 1222
FurazolidoneHPLC determination of furazolidone in feed and
feed premixes, 1100ultra trace determination of furazolidone in
turkey tissues by liquid partitioning and HPLC, 1055
Gas chromatography-mass spectrometryGC-MS characterization of an alteration product
of malathion detected in stored rice, 1232 GLC determination of congeners in alcoholic
products with confirmation by GC-MS, 186 GLC-MS confirmation of endosulfan and
endosulfan sulfate in apples and carrots, 1208 identification of trialkyl and triaryl phosphates in
distilled and Super-Q water, 635 Gas-liquid chromatography
evaluation of HPLC and GLC for quantitative determination of sugars in foods, 139
extraction and cleanup of fish, sediment, and water for determination of triaryl phosphates by GLC, 79
GC determination of cadaverine, putrescine, and histamine in foods, 584
general method for determination of pesticide residues in samples of plant origin, soil, and water. III. GC analysis and confirmation, 749
GLC detection and determination of diacetyl tartaric acid ester of diglyceride in dairy and nondairy coffee cream powders, 276
GLC determination of aniline metabolites of substituted urea and carbamate herbicides in aqueous solution, 833
GLC determination of congeners in alcoholic products with confirmation by GC-MS, 186
GLC method for determining oxamyl in peppers, tomatoes, and cucumbers, 1216
radioimmunoassay of T-2 toxin in corn and wheat, 156
Gas-solid chromatographyGSC determination of oxygen in various
pharmaceutical products, 177 headspace sampling and GSC determination of
residual acrylonitrile in acrylonitrile copolymer solutions, 270
Gelatin, dessert preparations, and mixesChanges in Methods, no changes Committee C report, 427
Gel permeation chromatographygel permeation system for removal of fats during
analysis of foods for residues of pesticides and herbicides, 720
GLC and GLC-MS determination of fenvalerate and permethrin residues in grasshoppers and duck tissue samples, 1196
novel cleanup method for quantitative GC determination of trace amounts of di-2- ethylhexyl phthalate in fish lipid, 282
simultaneous EC detection of chlorpyrifos and its major metabolite, 3,5.6-trichloro-2-pyridinol, after GPC, 1201
Generic identificationgeneric identification cf cooked and frozen
crabmeat by thin layer polyacrylamide gel isoelectric focusing: collaborative study, 670
Grainsanalysis and evaluation of barley used in malt
beverage industry, 1138 automatic Karl Fischer titration of moisture in
grain, 1277colorimetric alpha-amylase, falling number, and
amylograph assays of sprouted wheat: collaborative study, 1243
determination of deoxynivalenol in wheat and other grains by GC with electron capture and MS detection, 1364
determination of internal insect infestation of wheat: collaborative study, 1408
effect of boiling, frying, and baking on recovery of aflatoxin from naturally contaminated corn grits or cornmeal, 678
GC-MS characterization of an alteration product of malathion detected in stored rice, 1232
HPLC determination and fluorescence detection of aflatoxins in corn and dairy feeds, 1372
improved fluorometric-iodine method for determination of aflatoxin in corn, 1074
radioimmunoassay of T-2 toxin in corn and wheat, 156
simultaneous detection of several Fusarium mycotoxins in cereals, grains, and foodstuffs, 1067
TLC determination of aflatoxin in corn dust, 1060 Wiley Award address, 1980, field-laboratory
interactions to advance grain research, 240
Hazardous substancesChanges in Methods, no changes Committee A report, 420
Headspace samplingheadspace sampling and GC determination of
styrene migration frcm food-contact polystyrene cups into beverages and food simulants, 1122
headspace sampling and GSC determination of residual acrylonitrile in acrylonitrile copolymer solutions, 270
HerbicidesSee Fungicides, herbicides, and plant growth
regulatorsHexachlorocyclohexane
simplified method for estimation of DDT and hexachlorocyclohexane residues in milk, 14
HexestrolGLC determination of hexestrol residues in
adipose tissue, 709

SUBJECT INDEX: J. ASSOC. OFF. ANAL. CHEM. (VOL. 64, NO. 6, 1981) 1505
High pressure liquid chromatographyanalysis of fat-soluble vitamins. XXIV. HPLC
determination of vitamin D in vitamin D resin containing powders: collaborative study, 58
analysis of fat-soluble vitamins. XXV. HPLC determination of vitamin D in multivitamin preparations: collaborative study, 61
care of reverse phase HPLC columns when injecting extracts of fat- or oil-based preparations, 1258
determination of aflatoxins, ochratoxin A, and zearalenone in mixed feeds, with detection by TLC or HPLC, 1356
evaluation of HPLC and GLC for quantitative determination of sugars in foods, 139
HPLC analysis of chlorpyrifos-containing insecticidal formulations: collaborative study, 628, (Corr.), 1269
HPLC determination of aflatoxicol in milk, blood, and liver, 1083
HPLC determination of aflatoxins in animal tissues and products, 144
HPLC determination of aflatoxins in spices, 1377 HPLC determination of aldicarb, aldicarb
sulfoxide, and aldicarb sulfone in potatoes, 724 HPLC determination of antihistamine-adrenergic
combination products: collaborative study, 564 HPLC determination of cholesterol in foods, 54 HPLC determination of clotrimazole in
pharmaceutical formulations, 864 HPLC determination of intermediates and side
reaction products in FD&C Yellow No. 5, 665 HPLC determination of intermediates and two
reaction by-products in FD&C Red No. 40: collaborative study, 324
HPLC determination of lactose in milk, 805 HPLC determination of phenol in honey, 337 HPLC determination of /8 -sitosterol and
/S-sitosterol-D-glucoside in whisky, 181 HPLC determination of sodium fluoroacetate
(compound 1080) in canine gastric content, 19 HPLC determination of sulfisoxazole in
pharmaceuticals and separation patterns of other sulfonamides, 851
HPLC method for determination of polynuclear aromatic hydrocarbons in beer, 641
HPLC method for indole in shrimp: development of method and collaborative study, 592
HPLC method for pyrantel tartrate in swine feeds and supplements, 1291
HPLC method using fluorescence detection for quantitative analysis of zearalenone and a-zearalenol in blood plasma, 302
HPLC preparation of alternariol, alternariol methyl ether, and altenuene, 950
ion-pair HPLC of synthetic water-soluble acid dyes, 1
LC determination of residual styrene in polystyrene food packaging, 647
LC method for determination of arprinocid in feed: collaborative study, 973
LC separation of some alkylaminocyclohexanecarbonitriles from phenylcyclohexylamines related to phencyclidine. 1431
separation and characterization of standard propoxyphene diastereomers and their determination in pharmaceutical and illicit preparations, 875
ultra trace determination of furazolidone in turkey tissues by liquid partitioning and HPLC, 1055
UV detection procedure for LC determination of indole in shrimp, 603
HistamineGC determination of cadaverine, putrescine, and
histamine in foods, 584 Honey
HPLC determination of phenol in honey, 337 Hydride generation
hydrogen selenide evolution-electrothermal AAS method for determining nanogram levels of total selenium, 265
HydrocortisoneHPLC analysis of hydrocortisone acetate
ointments: interlaboratory study, 870 Hydrogen peroxide
improved 4-aminoantipyrine colorimetry for detection of residual hydrogen peroxide in noodle, fish paste, dried fish, and herring roe, 1448
ImidazolinesX-ray powder diffraction data for 9 medicinal 2-
imidazolines, 1164 Immunoassays
determination of aflatoxin Bi in corn, wheat, and peanut butter by enzyme-linked immunosorbent assay and solid phase radioimmunoassay, 1077
IndoleHPLC method for indole in shrimp: development
of method and collaborative study, 592modified colorimetric method for determining
indole in shrimp, 783UV detection procedure for LC determination of
indole in shrimp, 603 Industrial chemicals
See also Polychlorinated biphenylsextraction and cleanup of fish, sediment, and
water for determination of triaryl phosphates by GLC, 79
GC determination of trialkyl and triaryl phosphates in drinking water, following isolation using macroreticular resin, 991, (Corr.), 1269
GC-MS determination of volatile organic compounds in fish, 653
gel permeation system for removal of fats during analysis of foods for residues of pesticides and herbicides, 720
1506 SUBJECT INDEX: J. ASSOC. OFF. ANAL. CHEM. (VOL. 64, NO. 6, 1981)
headspace sampling and GC determination of styrene migration from food-contact polystyrene cups into beverages and food simulants, 1122
high performance size exclusion chromatograph with computerized data reduction for analysis of polyethylene and oligomers, 999
HPLC method for determination of polynuclear aromatic hydrocarbons in beer, 641
identification of trialkyl and triaryl phosphates in distilled and Super-Q water, 635
LC determination of residual styrene in polystyrene food packaging, 647
liquid and GC analysis of diethyl phthalate in water and sediment, 1403
molecular weight characterization of food grade polyethylenes and extractables by size exclusion chromatography, 1008
novel cleanup method for quantitative GC determination of trace amounts of di-2- ethylhexyl phthalate in fish lipid, 282
temperature-programmed GC determination of PCBs and PBBs in serum, 1131
Infant foodsacid digestion determination of iodine in foods, 71 microdiffusion and fluoride-specific electrode
determination of fluoride in infant foods: collaborative study, 1021
Infrared spectroscopyidentification of cephalosporins. I. spectroscopic
methods, 166IR spectrophotometric method for methazole
formulations: collaborative study, 1185 multicomponent analysis of meat products, 1392
InsectsSee Extraneous materials in foods and drugs
Interim official methods, 1031,1268 International cooperation
committee report, 461 Iodine
acid digestion determination of iodine in foods, 71 chloridometer determination of alien halide
content of iodine, 1446NAA of Total Diet food composites for iodine,
1111Ion-pair chromatography
ion-pair HPLC of synthetic water-soluble acid dyes, 1Ion-specific electrode
microdiffusion and fluoride-specific electrode determination of fluoride in infant foods: collaborative study, 1021
Isoelectric focusingfish species identification by isoelectric focusing:
sarcoplasmic protein polymorphism in monkfish (Lophius americanus), 32
generic identification of cooked and frozen crabmeat by thin layer polyacrylamide gel isoelectric focusing: collaborative study, 670
rapid fish species identification by agarose gel isoelectric focusing of sarcoplasmic proteins, 38
Isoequilin AGC-MS study of isoequilin A, 1259
Karl Fischer titrationautomatic Karl Fischer titration of moisture in
grain, 1277Laboratory quality assurance
committee report, 464 Lactose
HPLC determination of lactose in milk, 805 Lactose hydrolysis
estimation of lactose hydrolysis by freezing point measurement in milk and whey substrates treated with lactases from various microorganisms, 1414
Leadlead in preserved duck eggs: field screening test
and confirmation and quantitation by AAS and ASV, 1014
sampling procedure and determination of lead in canned foods, 657
Liaison representatives1981,470
Liquid scintillation countingdegradation of methomyl residues in frozen
strawberries, 1211liquid scintillation counting of 14C for
differentiation of synthetic ethanol from ethanol of fermentation, 1142
Long-range planning committee report, 465
MalathionGC-MS characterization of an alteration product
of malathion detected in stored rice, 1232 Mass spectrometry
See also Gas chromatography-mass spectrometry anomalies in the mass spectrum of N-
nitrosopyrrolidine, 1255 detection of high fructose corn syrup in apple
juice by MS !3C /12C analysis: collaborative study, 85
GLC determination of aniline metabolites of substituted urea and carbamate herbicides in aqueous solution, 833
mass spectral quantitation of cocaine HC1 in powders, 884
Meat analogsdetermination of trace amounts of nitrites in
fabricated nonmeat products, 226 Meat and meat products
Changes in Methods, 509 Committee C report, 427 referee report, 371comparison of automated method and improved
AOAC Kjeldahl method for determination of protein in meat and meat products, 29
determination of aflatoxins in animal tissues, 964

SUBJECT INDEX: J. ASSOC. OFF. ANAL. CHEM. (VOL. 64, NO. 6, 1981) 1507
HPLC determination of aflatoxins in animal tissues and products, 144
HPLC determination of methyl and propyl p- hydroxybenzoates in comminuted meats, 844
improved method for confirmation of identity of aflatoxins Bj and Mj in dairy products and animal tissue extracts, 152
interaction between sample preparationtechniques and colorimetric reagents in nitrite analysis in meat, 1397
multicomponent analysis of meat products, 1392 near-IR reflectance determination of fat, protein,
and moisture in fresh meat, 692 ultraviolet spectrometric determination of sorbic
acid in dry fermented sausage, (Corr.), 349 Melengestrol acetate
HPLC determination of melengestrol acetate in dry feed supplements, 661
Mercuric chloridepaper and micro TLC methods for determination
of mercuric chloride and detection of copper sulfate, 729
Mercuryopen digestion modification of AOAC method for
determination of mercury in fish, 1027 simplified apparatus for determination of mercury
by AAS and inductively coupled plasma emission spectroscopy, 1105
sodium hypophosphite as reducing agent for determination of submicrogram quantities of mercury in animal feeds and manures, 9
TLC and AAS determination of methyl mercury, 1017
Metals and other elementsChanges in Methods, 510 Committee E report, 435 referee report, 396AAS determination of tin in canned foods using
nitric acid-hydrochloric acid digestion and nitrous oxide-acetylene flame, 1297
AAS method for determination of water-soluble copper in water-insoluble copper fungicides: CIPAC collaborative study, comparison with bathocuproine method, 75
analysis of laboratory animal feed for toxic and essential elements by AAS and inductively coupled argon plasma emission spectrometry, 1284
effect of bentonites on fluorometric selenium determination, 1088
hydrogen selenide evolution-electrothermal AAS method for determining nanogram levels of total selenium, 265
lead in preserved duck eggs: field screening test and confirmation and quantitation by AAS and ASV, 1014
metal content of shark muscle powder biological reference material, 260
microdiffusion and fluoride-specific electrode determination of fluoride in infant foods: collaborative study, 1021
NAA of Total Diet food composites for iodine, 1111
open digestion modification of AOAC method for determination of mercury in fish, 1027
portable and sensitive detector strips for rapid detection of organophosphorus, mercury, copper, cadmium, and silver compounds, 841, (Corr.), 1269
sampling procedure and determination of lead in canned foods, 657
simple paper and micro TLC method for separation and detection of mercuric chloride, copper sulfate, cadmium sulfate, and silver nitrate in fresh water, 1301
simplified apparatus for determination of mercury by AAS and inductively coupled plasma emission spectroscopy, 1105
simultaneous determination of aluminum, iron, calcium, and magnesium in wet-process phosphoric acid by dc argon plasma emission spectrometry, 25
sodium hypophosphite as reducing agent for determination of submicrogram quantities of mercury in animal feeds and manures, 9
survey for Cd, Co, Cr, Cu, Ni, Pb, Zn, Ca, and Mg in Canadian drinking water supplies, 44
TLC and AAS determination of methyl mercury, 1017
Methapyrilene hydrochlorideHPLC determination of methapyrilene
hydrochloride in feed and sleep aid tablets, 889 Methazole
IR spectrophotometric method for methazole formulations: collaborative study, 1185
Methomyldegradation of methomyl residues in frozen
strawberries, 1211 Methoxyflurane
NMR determination of methoxyflurane, 1154 Methyl parathion
TLC determination of methyl parathion as paraoxon by cholinesterase inhibition, 1312
Microbial mutagenicity testing Changes in Methods, no changes Committee G report, 445
Microbiological methods Changes in Metnods, 528 Committee F report, 441 referee report, 408automatic incubator for use with modified A-l test
for enumerating fecal coliform bacteria in shellfish growing waters, 771
bacitracin determination in feeds: evaluation of methods, 980
comparative efficiency of brilliant green, bismuth sulfite, Salmonella-Shigella, Hektoen enteric, and xylose lysine desoxycholate agars for the recovery of Salmonella from foods: collaborative study, 899
comparison of modified A-l method with

1508 SUBJECT INDEX: J. ASSOC. OFF. ANAL. CHEM. (VOL. 64, NO. 6, 1981)
standard EC test for recovery of fecal coliform bacteria for shellfish, 607
comparisons of yeast and mold counts by spiral, pour, and streak plate methods, 1465
determination of aflatoxin Bj in corn, wheat, and peanut butter by enzyme-linked immunosorbent assay and solid phase radioimmunoassay, 1077
interlaboratory evaluation of the AOAC method and the A-l procedure for recovery of fecal coliforms from foods, 1116
pre-enrichment broths for recovery of Salmonella from milk chocolate and edible casein: collaborative study, 893
turbidimetric assay for virginiamycin in feeds and premixes, 319
Microchemical methodsChanges in Methods, no changes Committee C report, 427
Microscopycomparison of larval stored product beetle
mandibles by light microscope and scanning electron microscope, 199
distinguishing common food-contaminating bat hairs from certain feather barbules, 786
separation and characterization of standard propoxyphene diastereomers and their determination in pharmaceutical and illicit preparations, 875
Microwave oven methodmicrowave oven drying in the gravimetric
phosphorus method, 1319 Minicolumn chromatography
rapid screening method for aflatoxin Mi in milk, 1064
Moistureanalysis and evaluation of barley used in malt
beverage industry, 1138 automatic Karl Fischer titration of moisture in
grain, 1277near-IR reflectance determination of fat, protein,
and moisture in fresh meat, 692 Molds
See Extraneous materials in foods and drugs; Microbiological methods
Multiresidue methods (interlaboratory studies)Changes in Methods, no changes Committee E report, 436 referee report, 398improved multiresidue GC determination of
organophosphorus, organonitrogen, and organohalogen pesticides in produce, using flame photometric and electrolytic conductivity detectors, 1187
MycologySee Analytical mycology of foods and drugs
Mycotoxins See also Aflatoxins Changes in Methods, 510 Committee C report, 428 referee report, 373
confirmation of penicillic acid by HPLC and GLC, 162
determination of aflatoxins, ochratoxin A, and zearalenone in mixed feeds, with detection by TLC or HPLC, 1356
determination of deoxynivalenol in wheat and other grains by GC with electron capture and MS detection, 1364
HPLC method using fluorescence detection for quantitative analysis of zearalenone and a-zearalenol in blood plasma, 302
HPLC preparation of alternariol, alternariol methyl ether, and altenuene, 950
joint committee report, 462 radioimmunoassay of T-2 toxin in biological
fluids, 684radioimmunoassay of T-2 toxin in corn and wheat,
156rapid, economical method for determination of
aflatoxin and ochratoxin in animal feedstuffs, 961
simultaneous detection of several Fusarium mycotoxins in cereals, grains, and foodstuffs, 1067
Narcotic and dangerous drugsChanges in Methods, no changes Committee B report, 424 referee report, 363application of chiral lanthanide NMR shift
reagents to pharmaceutical analysis. II. determination of dextro- and levoamphetamine mixtures, 848
LC separation of some alkylaminocyclohexanecarbonitriles from phenylcyclohexylamines related to phencyclidine, 1431
mass spectral quantitation of cocaine HC1 in powders, 884
separation and characterization of standard propoxyphene diastereomers and their determination in pharmaceutical and illicit preparations, 875
Near-infrared reflectancenear-IR reflectance determination of fat, protein,
and moisture in fresh meat, 692 Neutron activation analysis
NAA of Total Diet food composites for iodine, 1111
New publications, 234, 350, 780, 1033, 1273, 1481 Nifursol
HPLC determination of nifursol in finished feeds, 969
Nitritesdetermination of trace amounts of nitrites in
fabricated nonmeat products, 226 interaction between sample preparation
techniques and colorimetric reagents in nitrite analysis in meat, 1397
SUBJECT INDEX: J. ASSOC. OFF. ANAL. CHEM. (VOL. 64, NO. 6, 1981) 1509
Nitrogenammonia-selective electrode determination of
nitrogen in fertilizers, 1096 automated determination of urea and ammoniacal
nitrogen (NPN) in animal feeds, 1092 Nitrosamines
analytical methodology for sample preparation, detection, quantitation, and confirmation of N- nitrosamines in foods: review paper, 1037
anomalies in the mass spectrum of N- nitrosopyrrolidine, 1255
determination and confirmation of N- nitrosodimethylamine in beer, 1457
GLC-thermal energy analyzer determination of N-nitrosodimethylamine in beer at low parts per billion level, 933
GLC-thermal energy analyzer method for N- nitrosodiethanolamine in cosmetics, 1474
HPLC-thermal energy determination of N- nitrosodiethanolamine in cosmetics, 800
rapid method for estimation of N- nitrosodimethylamine in malt beverages, 929
volatile N-nitrosamines in dried foods, 1238 Norflurazon
determination of norflurazon residues in mixed crop matrices, 1309
Nuclear magnetic resonance spectroscopyapplication of chiral lanthanide NMR shift
reagents to pharmaceutical analysis. II. determination of dextro- and levoamphetamine mixtures, 848
NMR determination of methoxyflurane, 1154 NMR spectroscopic method for determination of
penicillamine in capsules, 1174 Nuts and nut products
Changes in Methods, no changes Committee D report, 428 referee report, 389minicolumn detection methods for aflatoxin in
raw peanuts: collaborative study, 674Ochratoxin
determination of aflatoxins, ochratoxin A, and zearalenone in mixed feeds, with detection by TLC or HPLC, 1356
rapid, economical method for determination of aflatoxin and ochratoxin in animal feedstuffs, 961
Officers 2981,468
Official M ethods o f Analysis errata and emendations, 530 Oils and fats
Changes in Methods, 510 Committee C report, 428 referee report, 380care of reverse phase HPLC columns when
injecting extracts of fat- or oil-based preparations, 1258
chromatographic separation of polar and nonpolar components of frying fats, 1329
HPLC determination of cholesterol in foods, 54 multicomponent analysis of meat products, 1392 near-IR reflectance determination of fat, protein,
and moisture in fresh meat, 692 survey of North Dakota sunflower seeds for
aflatoxin, 228systematic identification of antioxidants in lards,
shortenings, and vegetable oils by TLC, 1331 4th interlaboratory study of methods for
determining total migration of plastic materials in liquids simulating fatty foodstuffs, 697
Organochlorine pesticides See also Pesticide formulations: halogenated
insecticidesChanges in Methods, no changes Committee E report, 436 referee report, 400GLC-MS confirmation of endosulfan and
endosulfan sulfate in apples and carrots, 1208 improved cleanup technique for estimation of
endosulfan residues from fish tissues under tropical condi tons, 340
simplified method for estimation of DDT and hexachlorocyclohexane residues in milk, 14
Organophosphorus pesticides Changes in Methods, no changes Committee E report, 438 referee report, 4C1colorimetric determination of methyl parathion
and oxygen analog, (Corr.), 233 fast cleanup of difficult substrates for
determination of fenitrothion and some derivatives, 1470
GC-MS characterization of an alteration product of malathion detected in stored rice, 1232
modified Storherr method for determination of organophosphorus pesticides in nonfatty food Total Diet composites, 714
portable and sensitive detector strips for rapid detection of organophosphorus, mercury, copper, cadmium, and silver compounds, 841, (Corr.), 1269
rapid cleanup procedure for GLC determination of chlorpyrifos-methyl residues in cat food, 1227
simultaneous EC detection of chlorpyrifos and its major metabolite, 3,5,6-trichloro-2-pyridinol, after GPC, 1201
TLC determination of methyl parathion as paraoxon by cholinesterase inhibition, 1312
OxamylGLC method for determining oxamyl in peppers,
tomatoes, and cucumbers, 1216 Oxygen
GSC determination of oxygen in various pharmaceutical products, 177
Oxyphenbutazonecolorimetric determination of certain phenol
derivatives in pharmaceutical preparations, 1442 polarographic analytical study of
oxyphenbutazone, 1439
1510 SUBJECT INDEX: J. ASSOC. OFF. ANAL. CHEM. (VOL. 64, NO. 6, 1981)
Paper chromatographypaper and micro TLC methods for determination
of mercuric chloride and detection of copper sulfate, 729
paper chromatographic determination of total capsaicinoids in capsicums and their oleoresins with precision, reproducibility, and validation through correlation with pungency in Scoville Units, 311, (Corr.), 1482
PCBsSee Polychlorinated biphenyls Penicillamine
NMR spectroscopic method for determination of penicillamine in capsules, 1174
Penicillic acidconfirmation of penicillic acid by HPLC and GLC,
162Permethrin
GLC and GLC-MS determination of fenvalerate and permethrin residues in grasshoppers and duck tissue samples, 1196
Pesticide formulationsSee also Pesticide formulations: carbamate and
substituted urea insecticides See also Pesticide formulations: halogenated and
other insecticidesSee also Pesticide formulations: herbicides,
fungicides, and miscellaneous See also Pesticide formulations:
organophosphorus pesticides Pesticide formulations: carbamate and substituted
urea insecticides Changes in Methods, no changes Committee A report, 420 referee report, 353GLC determination of pirimicarb in formulations:
collaborative study, 1315 Pesticide formulations: halogenated and other
insecticidesChanges in Methods, 501, 502 Committee A report, 420 referee report, 354GLC determination of tetradifon technical and
formulations: collaborative study, 829 Pesticide formulations: herbicides, fungicides, and
miscellaneousChanges in Methods, 501, 504 Committee A report, 421 referee report, 355AAS method for determination of water-soluble
copper in water-insoluble copper fungicides: CIPAC collaborative study, comparison with bathocuproine method, 75
bathocuproine method for determining water- soluble copper in water-insoluble copper fungicides: CIPAC collaborative study, (Corr.), 233
GLC determination of terbuthylazine technical and its formulations: collaborative study, 825
IR spectrophotometric method for methazole formulations: collaborative study, 1185
Pesticide formulations: organophosphorus pesticidesChanges in Methods, 501, 503 Committee A report, 422 referee report, 356HPLC analysis of chlorpyrifos-containing
insecticidal formulations: collaborative study, 628, (Corr.), 1269
Pesticide residuesSee also Carbamate pesticides, fumigants, and
miscellaneousSee also Fungicides, herbicides, and plant growth
regulatorsSee also Multiresidue methods (interlaboratory
studies)See also Organochlorine pesticides See also Organophosphorus pesticides application of azulene as visual aid to monitor
column chromatographic fractionation of samples for pesticide and PCB determination, 16
gel permeation system for removal of fats during analysis of foods for residues of pesticides and herbicides, 720
general method for determination of pesticide residues in samples of plant origin, soil, and water. I. extraction and cleanup, 733
general method for determination of pesticide residues in samples of plant origin, soil, and water. II. TLC determination, 743
general method for determination of pesticide residues in samples of plant origin, soil, and water. III. GC analysis and confirmation, 749
Pet foodsrapid cleanup procedure for GLC determination of
chlorpyrifos-methyl residues in cat food, 1227 pH Determination
pH determination in acidified foods: collaborative study, 332
PhencyclidineLC separation of some
alkylaminocyclohexanecarbonitriles from phenylcyclohexylamines related to phencyclidine, 1431
PhenolHPLC determination of phenol in honey, 337
Phenylephrinebromination methods for determination of
phenylephrine hydrochloride in nose drops, salicylamide in tablets, and tetracycline hydrochloride in capsules, 860
Phosphorusmicrowave oven drying in the gravimetric
phosphorus method, 1319 spectrophotometric determination of phosphorus
in certifiable straight color additives: collaborative study, 808
Phthalatesliquid and GC analysis of diethyl phthalate in
water and sediment, 1403 novel cleanup method for quantitative GC

SUBJECT INDEX: J. ASSOC. OFF. ANAL. CHEM. (VOL. 64, NO. 6, 1981) 1511
determination of trace amounts of di-2 - ethylhexyl phthalate in fish lipid, 282
PirimicarbGLC determination of pirimicarb in formulations:
collaborative study, 1315 Plant growth regulators
See Fungicides, herbicides, and plant growth regulators
PlantsChanges in Methods, no changes Committee A report, 422 referee report, 358general method for determination of pesticide
residues in samples of plant origin, soil, and water. I. extraction and cleanup, 733
general method for determination of pesticide residues in samples of plant origin, soil, and water. II. TLC determination, 743
general method for determination of pesticide residues in samples of plant origin, soil, and water. III. GC analysis and confirmation, 749
spectrophotometric determination of dicumarol in sweet clover, 689
Polybrominated biphenyls temperature-programmed GC determination of
PCBs and PBBs in serum, 1131 Polychlorinated biphenyls
application of azulene as visual aid to monitor column chromatographic fractionation of samples for pesticide and PCB determination, 16
temperature-programmed GC determination of PCBs and PBBs in serum, 1131
Polynuclear aromatic hydrocarbonsHPLC method for determination of polynuclear
aromatic hydrocarbons in beer, 641 Potentiometric methods
potentiometric and AAS determination of sulfonamides in pharmaceutical preparations, 1158
Preservatives and artificial sweetenersChanges in Methods, 508 Committee D report, 431 referee report, 390GC determination of propionic acid in bread and
cake, 280HPLC determination of methyl and propyl p-
hydroxybenzoates in comminuted meats, 844 President's address
1980, 237Procaine hydrochloride
spectrophotometric determination of procaine hydrochloride in presence of 4-aminobenzoic acid, using a combined polynomial method,1179
Processed vegetable productsChanges in Methods, 512 Committee C report, 429 referee report, 384particle size and concentration adjustments of
tomato products for Howard mold count, 570
pH determination in acidified foods: collaborative study, 332
sampling procedure and determination of lead in canned foods, 657
Proofdensity meter determination of proof of alcoholic
beverages: collaborative study, 550 rapid check on proof of rums, 792
Propionic acidGC determination of propionic acid in bread and
cake,280 Propoxyphene
separation and characterization of standard propoxyphene diastereomers and their determination in pharmaceutical and illicit preparations, 875
Proteincomparison of automated method and improved
AOAC Kjeldahl method for determination of protein in meat and meat products, 29
multicomponent analysis of meat products, 1392 near-IR reflectance determination of fat, protein,
and moisture in fresh meat, 692 Protein nitrogen units
protein nitrogen unit precipitation procedure for allergenic extracts: collaborative study, 1435
Proton magnetic resonance spectroscopyidentification of cephalosporins. I. spectroscopic
methods, 166 Pseudoephedrine HC1
HPLC determination of antihistamine-adrenergic combination products: collaborative study, 564
PutrescineGC determination of cadaverine, putrescine, and
histamine in foods, 584 Pyrantel tartrate
HPLC method for pyrantel tartrate in swine feeds and supplements, 1291
RadioactivityChanges in Methods, no changes Committee E report, 438 referee report, 405
Radioimmunoassayscomparison of radioimmunoassay and enzyme-
linked immunosorbent assay for determining aflatoxin Mi in milk, 294
determination of aflatoxin Bi in corn, wheat, and peanut butter by enzyme-linked immunosorbent assay and solid phase radioimmunoassay, 1077
radioimmunoassay of T-2 toxin in biological fluids, 684
radioimmunoassay of T-2 toxin in corn and wheat, 156
Radiotracer techniquesextraction and cleanup of fish, sediment, and
water for determination of triaryl phosphates by GLC, 79
1512 SUBJECT INDEX: J. ASSOC. OFF. ANAL. CHEM. (VOL. 64, NO. 6, 1981)
Recommendations for official methodscommittee report, 418
Reference materials and standard solutionsChanges in Methods, no changes Committee A report, 423 referee report, 358metal content of shark muscle powder biological
reference material, 260 Reference tables
Changes in Methods, no changes Reviewers
of JAOAC manuscripts, 345 Review papers
analytical methodology for sample preparation, detection, quantitation, and confirmation of N- nitrosamines in foods: review paper, 1037
analytical methods for sulfonamides in foods and feeds. I. review of methodology, 104
review of analytical methods for sulfonamides in foods and feeds. II. performance characteristics of sulfonamide methods, 814
SafetyChanges in Methods, no changes committee report, 466
Salicylamidebromination methods for determination of
phenylephrine hydrochloride in nose drops, salicylamide in tablets, and tetracycline hydrochloride in capsules, 860
Salmonellacomparative efficiency of brilliant green, bismuth
sulfite, Salmonella-Shigella, Hektoen enteric, and xylose lysine desoxycholate agars for the recovery of Salmonella from foods: collaborative study, 899
pre-enrichment broths for recovery of Salmonella from milk chocolate and edible casein: collaborative study, 893
Seafood toxinsChanges in Methods, no changes Committee C report, 429 referee report, 384
Sedimentdetermination of 2,4-D butoxyethanol ether ester
and its degradation products 2,4- dichlorophenoxyacetic acid and 2,4- dichlorophenol in sediment, 1305
extraction and cleanup of fish, sediment, and water for determination of triaryl phosphates by GLC, 79
liquid and GC analysis of diethyl phthalate in water and sediment, 1403
Seleniumeffect of bentonites on fluorometric selenium
determination, 1088hydrogen selenide evolution-electrothermal AAS
method for determining nanogram levels of total selenium, 265
Size exclusion chromatographyhigh performance size exclusion chromatograph
with computerized data reduction for analysis of polyethylene and oligomers, 999
molecular weight characterization of food grade polyethylenes and extractables by size exclusion chromatography, 1008
Sodiumcomparison of methods for determining sodium in
fertilizers, 704 Sodium fluoroacetate
HPLC determination of sodium fluoroacetate (compound 1080) in canine gastric content, 19
Soilgeneral method for determination of pesticide
residues in samples of plant origin, soil, and water. I. extraction and cleanup, 733
general method for determination of pesticide residues in samples of plant origin, soil, and water. II. TLC determination, 743
general method for determination of pesticide residues in samples of plant origin, soil, and water. III. GC analysis and confirmation, 749
Sorbitolfree sugars and sorbitol in fruits: a compilation
from the literature, 91, (Corr.), 1035 Species identification
fish species identification by isoelectric focusing: sarcoplasmic protein polymorphism in monkfish (Lophius americanus), 32
rapid fish species identification by agarose gel isoelectric focusing of sarcoplasmic proteins, 38
Spectrofluorometrycomparison of manual and benzenesulfonyl
chloride-semiautomated thiochrome methods for determination of thiamine in foods, 616
HPLC method for indole in shrimp: development of method and collaborative study, 592
Spectrophotometric methodsmanual and semiautomated spectrophotometric
determination of vitamin K3 by reactions with piperidine and malononitrile, 611
modified colorimetric method for determining indole in shrimp, 783
spectrophotometric determination of phosphorus in certifiable straight color additives: collaborative study, 808
spectrophotometric determination of procaine hydrochloride in presence of 4-aminobenzoic acid, using a combined polynomial method, 1179
Spectrophotometryspectrophotometric determination of atropine
sulfate in the presence of phenylmercury (II) acetate, 855
Spectroscopic methodsChanges in Methods, no changes
Spices and other condimentsChanges in Methods, no changesbrine saturation technique for extraction of light
SUBJECT INDEX: J. ASSOC. OFF. ANAL. CHEM. (VOL. 64. NO. 6, 1981) 1513
filth from rubbed and ground sage: intralaboratory study, 773
HPLC determination of aflatoxins in spices, 1377 HPLC determination of ethoxyquin in paprika
and chili powder, 1453paper chromatographic determination of total
capsaicinoids in capsicums and their oleoresins with precision, reproducibility, and validation through correlation with pungency in Scoville Units, 311, (Corr.), 1482
potential mold growth, aflatoxin production, and antimycotic activity of selected natural spices and herbs, 955
Standing committees 1981, 468
State and provincial participation committee report, 466
Statistical techniquescalibration and the straight line: current statistical
practices, 574correction of bias in collaborative check sample
series reporting, 1344 Statistics
committee report, 467 Steroid and terpinoid drugs
Changes in Methods, no changes Committee B report, 425 GC-MS study of isoequilin A, 1259 HPLC analysis of hydrocortisone acetate
ointments: interlaboratory study, 870 Steroids
HPLC determination of /3-sitosterol and /J-sitosterol-D-glucoside in whisky, 181
Styreneheadspace sampling and GC determination of
styrene migration from food-contact polystyrene cups into beverages and food simulants, 1122
LC determination of residual styrene in polystyrene food packaging, 647
Sugars and sugar products Changes in Methods, 512 Committee D report, 431 referee report, 391detection of high fructose corn syrup in apple
juice by MS 13C /12C analysis: collaborative study, 85
evaluation of HPLC and GLC for quantitative determination of sugars in foods, 139
free sugars and sorbitol in fruits: a compilation from the literature, 91, (Corr.), 1035
HPLC determination of phenol in honey, 337 Sulfonamides
analytical methods for sulfonamides in foods and feeds. I. review of methodology, 104
comparison of 3 methods for determination of sulfamethazine in swine tissues: collaborative study, 1386
GLC determination of sulfamethazine in swine and cattle tissues, 794
HPLC determination of sulfisoxazole in pharmaceuticals and separation patterns of other sulfonamides, 851
potentiometric and AAS determination of sulfonamides in pharmaceutical preparations, 1158
review of analytical methods for sulfonamides in foods and feeds. II. performance characteristics of sulfonamide methods, 814
Teaextraction of light filth from tea: collaborative
study, 287 Terbuthylazine
GLC determination of terbuthylazine technical and its formulations: collaborative study, 825
Tetracyclinebromination methods for determination of
phenylephrine hydrochloride in nose drops, salicylamide in tablets, and tetracycline hydrochloride in capsules, 860
TetradifonGLC determination of tetradifon technical and
formulations: collaborative study, 829 Thermal energy analyzer-GLC methods
GLC-thermal energy analyzer determination of N-nitrosodimethylamine in beer at low parts per billion level, 933
GLC-thermal energy analyzer method for N- nitrosodiethanclamine in cosmetics, 1474
Thermal energy analyzer-HPLC methods HPLC-thermal energy determination of N-
nitrosodiethanolamine in cosmetics, 800 Thin layer chromatography
determination of aflatoxins, ochratoxin A, and zearalenone in mixed feeds, with detection by TLC or HPLC, 1356
general method for determination of pesticide residues in samples of plant origin, soil, and water. II. TLC determination, 743
identification of cephalosporins. II. color reactions and TLC, 173
improved method for confirmation of identity of aflatoxins Bj ar d Mi in daily products and animal tissue extracts, 152
novel TLC techniques for aflatoxin analysis, 1263 paper and micro TLC methods for determination
of mercuric chloride and detection of copper sulfate, 729
simultaneous detection of several Fusurium mycotoxins in cereals, grains, and foodstuffs, 1067
systematic identification of antioxidants in lards, shortenings, and vegetable oils by TLC, 1331
template for marking TLC plates for 2- dimensional development, 1264
TLC determination of aflatoxin in corn dust, 1060

1514 SUBJECT INDEX: J. ASSOC. OFF. ANAL. CHEM. (VOL. 64, NO. 6, 1981)
TinAAS determination of tin in canned foods using
nitric acid-hydrochloric acid digestion and nitrous oxide-acetylene flame, 1297
Total Diet compositesmodified Storherr method for determination of
organophosphorus pesticides in nonfatty food Total Diet composites, 714
Toxicological testsChanges in Methods, no changes Committee G report, 445
Transactions 1980,418
Treasurerannual report, 451
Trialkyl and triaryl phosphatesextraction and cleanup of fish, sediment, and
water for determination of triaryl phosphates by GLC, 79
GC determination of trialkyl and triaryl phosphates in drinking water, following isolation using macroreticular resin, 991, (Corr.), 1269
identification of trialkyl and triaryl phosphates in distilled and Super-Q water, 635
Trichothecenes See Mycotoxins
Triprolidine HC1HPLC determination of antihistamine-adrenergic
combination products: collaborative study, 564 T-2 toxin
radioimmunoassay of T-2 toxin in biological fluids, 684
radioimmunoassay of T-2 toxin in corn and wheat, 156
Ultraviolet spectroscopyidentification of cephalosporins. I. spectroscopic
methods, 166 Urea
automated determination of urea and ammoniacal nitrogen (NPN) in animal feeds, 1092
jack bean meal as source of urease in determination of urea, 1256
Vanillinstable isotope ratio determination of the origin of
vanillin in vanilla extracts and its relationship to vanillin/potassium ratios, 1149
Vegetable products, processed See Processed vegetable products
Virginiamycinturbidimetric assay for virginiamycin in feeds and
premixes, 319Vitamins and other nutrients
See also Protein Changes in Methods, 520 Committee D report, 432 referee report, 392acid digestion determination of iodine in foods, 71
analysis of fat-soluble vitamins. XXIV. HPLC determination of vitamin D in vitamin D resin containing powders: collaborative study, 58
analysis of fat-soluble vitamins. XXV. HPLC determination of vitamin D in multivitamin preparations: collaborative study, 61
analysis of laboratory animal feed for toxic and essential elements by AAS and inductively coupled argon plasma emission spectrometry, 1284
comparison of dietary fiber methods for foods,1339
comparison of manual and benzenesulfonyl chloride-semiautomated thiochrome methods for determination of thiamine in foods, 616
evaluation of ion exchange resins and various enzymes in thiamine analysis, 1336
manual and semiautomated spectrophotometric determination of vitamin K3 by reactions with piperidine and malononitrile, 611
NAA of Total Diet food composites for iodine,1111
simplified automated system for determination of vitamin A in milk, 225
WaterSee also MoistureChanges in Methods, no changesCommittee E report, 439automatic incubator for use with modified A-l test
for enumerating fecal coliform bacteria in shellfish growing waters, 771
extraction and cleanup of fish, sediment, and water for determination of triaryl phosphates by GLC, 79
extraction of aquatic herbicide fluridone from water and determination by HPLC, 1205
GC determination of trialkyl and triaryl phosphates in drinking water, following isolation using macroreticular resin, 991, (Corr.), 1269
general method for determination of pesticide residues in samples of plant origin, soil, and water. I. extraction and cleanup, 733
general method for determination of pesticide residues in samples of plant origin, soil, and water. II. TLC determination, 743
general method for determination of pesticide residues in samples of plant origin, soil, and water. 111. GC analysis and confirmation, 749
HPLC determination of cyanuric acid in human urine and pool water, 1222
identification of trialkyl and triaryl phosphates in distilled and Super-Q water, 635
liquid and GC analysis of diethyl phthalate in water and sediment, 1403
paper and micro TLC methods for determination of mercuric chloride and detection of copper sulfate, 729
simple paper and micro TLC method for
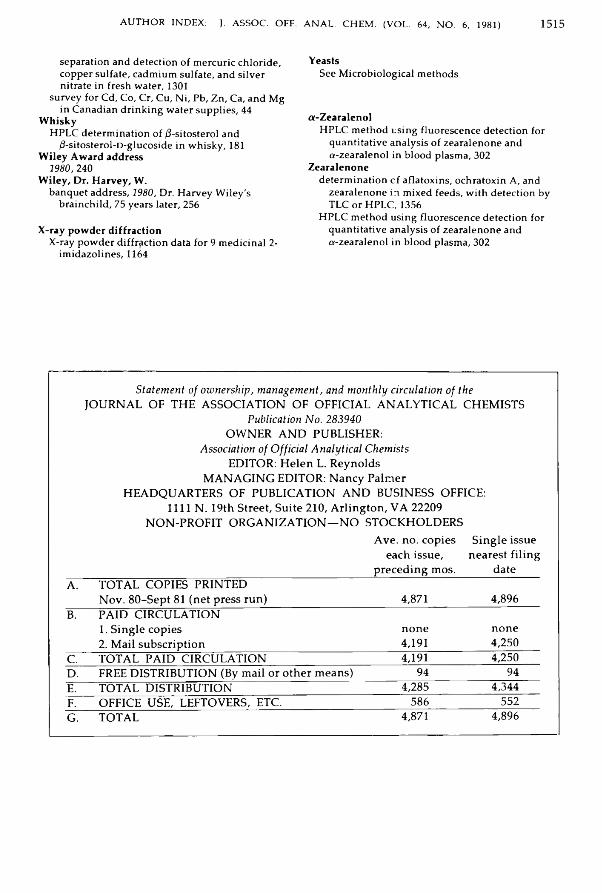
AUTHOR INDEX: J. ASSOC. OFF. ANAL. CHEM. (VOL. 64, NO. 6, 1981) 1515
separation and detection of mercuric chloride, copper sulfate, cadmium sulfate, and silver nitrate in fresh water, 1301
survey for Cd, Co, Cr, Cu, Ni, Pb, Zn, Ca, and Mg in Canadian drinking water supplies, 44 Whisky
HPLC determination of (3-sitosterol and /S-sitosterol-D-glucoside in whisky, 181
Wiley Award address1980, 240
Wiley, Dr. Harvey, W.banquet address, 1980, Dr. Harvey Wiley's
brainchild, 75 years later, 256X-ray powder diffraction
X-ray powder diffraction data for 9 medicinal 2- imidazolines, 1164
YeastsSee Microbiological methods
a-ZearalenolHPLC method using fluorescence detection for
quantitative analysis of zearalenone and a-zearalenol in blood plasma, 302
Zearalenonedetermination cf aflatoxins, ochratoxin A, and
zearalenone in mixed feeds, with detection by TLC or HPLC, 1356
HPLC method using fluorescence detection for quantitative analysis of zearalenone and a-zearalenol in blood plasma, 302
S ta tem en t o f ow nersh ip, m anagem en t, and m on th ly circulation of theJOURNAL OF THE ASSOCIATION OF OFFICIAL ANALYTICAL CHEMISTS
Publication N o. 283940OWNER A N D PUBLISHER:
Association of O fficia l A n a ly tica l C hem ists EDITOR: H elen L. R eynolds
M ANA G ING EDITOR: N ancy Palm er HEADQUARTERS OF PUBLICATION A N D BUSINESS OFFICE:
1111 N . 19th Street, Suite 210, A rlin gton , VA 22209 NON-PROFIT O RGANIZATION— N O STOCKHOLDERS
A ve. no. cop ies S in g le issue each issue , nearest filin g
preced ing m os. dateA. TOTAL COPIES PRINTED
N ov. 80-S ep t 81 (net press run) 4,871 4,896B. PAID CIRCULATION
1. S in gle copies2. M ail subscription
n on e4,191
n on e4,250
C. TOTAL PAID CIRCULATION 4,191 4,250D. FREE DISTRIBUTION (By m ail or other m eans) 94 94E. TOTAL DISTRIBUTION 4,285 4,344F. OFFICE USE, LEFTOVERS, ETC. 586 552G. TOTAL 4,871 4,896

5 th EditionH r--:
■ 4 f f ’ H IFDA Bacteriological Analytical Manual
.. ..... ■ . ... .... ■ ' . : ., .
Completely revised and expanded in 1978, includes 1979 and 1980 supplements and an attractive plastic binder
Qualitative and quantitative detection of microorganisms in foods and cosmetics
Y e rs in ia e n te ro co litica , parasites in foods, antibiotics in milk, viruses, and cosmetics microbiology
Sampling, metal container integrity, methods for isolating and counting microorganisms, preparation of media and reagents
New chapter on V ib rio ch o le ra e and an expansion of cosmetics microbiology chapter
Up-dated material on aerobic plate count and on B a c i l lu s ce reu s
1978, 448 pp., ISBN 0-935584-12-9 $25 + $2 book post & handling in U.S.A., $25 + $5 outside U.S.A. Please enclose remittance with order.
Association of Official Analytical Chemists1111 N 19th St, Suite 210-JArlington, VA 22209. Telephone 703/522-3032.

rnvm nsi'a
O f f ic ia l ____ — ,o f A n a l ?0-8ft23S o f th e A s s o c ia A n a ly tu13th Editi<
Edited by W illiam H o r Bureau of Fc Food and Di Washington,
Official M ethi !to as “the bibl isearch and rejscientists with reliable methods of analysis for determining the composition of commodities subject to legal control. The reliability of each method adopted by AO AC has been demonstrated by an interlaboratory collaborative study, showing its reproducibility in the hands of professional analysts.
A s a n a l y t i c a l n e e d s c h a n g e a n d a s k n o w le d g e a n d t e c h n iq u e s a d v a n c e , n e w a n d r e v i s e d m e th o d s a re v a l id a t e d b y A O A C . T h e s e a re in c o r p o r a t e d in t o a n n u a l u p d a te s w h i c h a re in c lu d e d in th e p u r c h a s e p r i c e .
1980, 1038 pp., 55 illus., index, hardbound, Price: $75 + $3 for book post and handling within U .S., $75 + $6 outsideU.S., includes 4 yearly updates. ISBN 0-935584-14-5
To o b ta in th is b o o k , p l e a s e s e n d o rd e r a n d c h e c k toAOAC, 1111 N. 19th St.. Suite 2 1 0 -J, Arlington. VA 2 2 2 0 9 .
____JTENTSiltural Limingerialscereectantsnous Substances Ide Formulations ll Feedk Powders and jng Chemicals jges: Distilled (ore|ges: Malt BeveragesBrewing Materialsjges: Winesjges: NonalcoholicConcentratesSean and Its Products¡Foodsland Teaproductsad Egg Productsid Other Marinepetsjdditives: Direct dditives: Indirect ind Fruit Products ¡, Dessert^rations, and Mixes id Meat Products
Metals and Other Elements as Residues in Foods
Natural Poisons Nuts and Nut Products Oils and Fats Pesticide Residues Spices and Other
CondimentsSugars and Sugar Products Vegetable Products,
Processed Waters; and Salt Color Additives Cosmetics Drugs: General Drugs: Acidic Drugs: Alkaloid and
Related Bases Drugs: Neutral Drugs: IllicitDrugs and Feed Additives
in Animal Tissues Drugs in Feeds Vitamins and Other
NutrientsExtraneous Materials:
Isolation Forensic Sciences Microbiological Methods Microchemical Methods Radioactivity Spectroscopic Methods Standard Solutions and
Materials Laboratory Safety
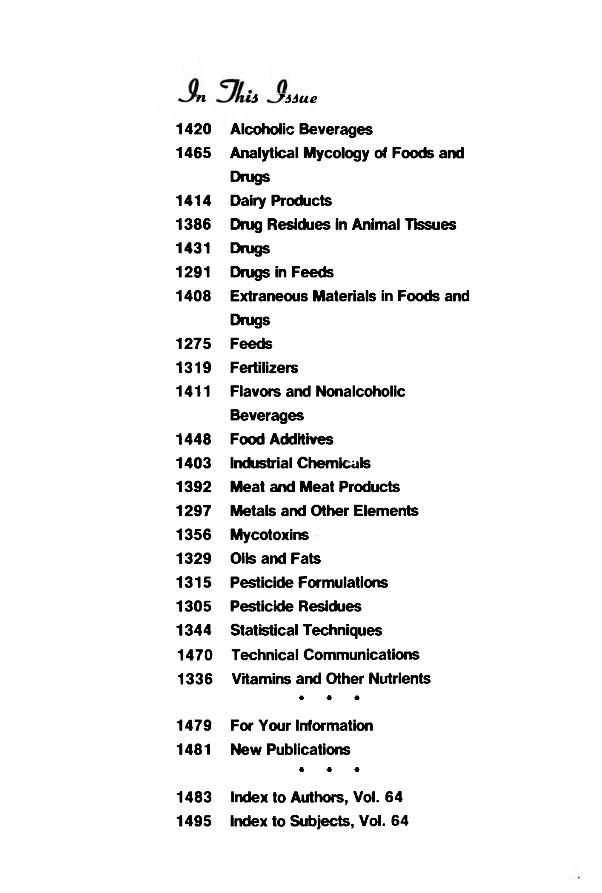
n 16 7 6 6 u e
1 420 Alcoholic Beverages
1 46 5 A nalytical M ycology of Foods and
Drugs
1 41 4 Dairy Products
1 386 Drug Residues in Anim al Tissues
1431 Drugs
1291 Drugs in Feeds
1 408 Extraneous M aterials in Foods and
Drugs
1 27 5 Feeds
1 31 9 Fertilizers
1411 Flavors and Nonalcoholic
Beverages
1 44 8 Food Additives
1 40 3 Industrial Chem icals
1 39 2 M eat and M eat Products
1 29 7 M etals and Other Elem ents
1 35 6 M y cotoxins
1 329 Oils and Fats
1 31 5 Pesticide Form ulations
1 305 Pesticide Residues
1 34 4 Statistical Techniques
1 470 Technical Com m unications
1 336 Vitam ins and Other Nutrients * * *
1 479 For Your Inform ation
1481 N ew Publications • * *
1 483 Index to Authors, Vol. 64
1 495 Index to Subjects, Vol. 64